Embed Size (px)
Citation preview
ARTICLE IN PRESS
Journal of Financial Economics 77 (2005) 3–55
0304-405X/$
doi:10.1016/j
$We app
Kaminsky, H
Schwert (Edi
Chicago, Ge
Washington
California at
in Lisbon, P
Fund, the L
meetings in A
Management
para Americ
Meetings in B
Conference,�Correspo
Tel.: +1919
E-mail ad
www.elsevier.com/locate/econbase
Does financial liberalization spur growth?$
Geert Bekaerta,b, Campbell R. Harveyb,c,�, Christian Lundbladd
aColumbia University, New York, NY 10027, USAbNational Bureau of Economic Research, Cambridge, MA 02138, USA
cFuqua School of Business, Duke University, Durham, NC 27708-0120, USAdIndiana University, Bloomington, IN 47405, USA
Received 3 February 2003; received in revised form 27 October 2003; accepted 24 May 2004
Available online 20 January 2005
Abstract
We show that equity market liberalizations, on average, lead to a 1% increase in annual real
economic growth. The effect is robust to alternative definitions of liberalization and does not
reflect variation in the world business cycle. The effect also remains intact when an exogenous
measure of growth opportunities is included in the regression. We find that capital account
liberalization also plays a role in future economic growth, but, importantly, it does not
subsume the contribution of equity market liberalizations. Other simultaneous reforms only
- see front matter r 2004 Elsevier B.V. All rights reserved.
.jfineco.2004.05.007
reciate the helpful comments of Wayne Ferson, Peter Henry, Ross Levine, Graciela
an Kim, Luc Laeven, Michael Pagano, Vicente Pons, Tano Santos, Sergio Schmukler, Bill
tor), Andrei Shleifer, Rene Stulz, Jeffrey Wurgler, seminar participants at the University of
orgetown University, Ohio State University, University of Michigan, Boston College,
University in St. Louis, Missouri, the World Bank, Princeton University, University of
Los Angeles, Fordham University, Instituto Superior de Ciencias do Trabalho e da Empresa
ortugal, University of Porto, Cass Business School – London, the International Monetary
ondon School of Economics, and the participants at the American Finance Association
tlanta, Georgia, the Conference on Financial Systems and Crises at the Yale School of
, the Western Finance Association meetings in Tuscon, Arizona, the Conferencia Regional
a Latina y el Caribe meetings in Monterrey, Mexico, the European Finance Association
arcelona, Spain, and the Atlanta Federal Reserve Bank/Inter-American Development Bank
and especially those of an anonymous referee.
nding author. Fuqua School of Business, Duke University, Durham, NC 27708-0120, USA.
660 7768; fax: +1 919 660 8030.
dress: [email protected] (C.R. Harvey).

ARTICLE IN PRESS
G. Bekaert et al. / Journal of Financial Economics 77 (2005) 3–554
partially account for the equity market liberalization effect. Finally, the largest growth
response occurs in countries with high-quality institutions.
r 2004 Elsevier B.V. All rights reserved.
JEL classification: E32; F30; F36; F43; G15; G18; G28
Keywords: Equity market liberalization; Financial development; Capital account openness; Quality of
institutions; GDP growth
1. Introduction
The last 25 years have witnessed the financial liberalization of equity marketsacross the world. Equity market liberalizations give foreign investors theopportunity to invest in domestic equity securities and domestic investors the rightto transact in foreign equity securities. We find that equity market liberalizationsincrease subsequent average annual real economic growth by about 1%, even aftercontrolling for other variables that are commonly used in the economic growthliterature.From a neoclassical perspective, our results are to be expected. Improved risk
sharing post-liberalization should decrease the cost of equity capital (see, forexample, Bekaert and Harvey, 2000) and increase investment. When markets areimperfect, equity market liberalization could have strong effects as well. Financingconstraints (see, e.g., Hubbard, 1997, and Gilchrist and Himmelberg, 1999), makeexternal finance more costly than internal finance and cause investment to besensitive to cash flows. Equity market liberalization directly reduces financingconstraints in the sense that more foreign capital becomes available, and foreigninvestors could insist on better corporate governance, which indirectly reduces thecost of internal and external finance. Hence, the cost of capital could go downbecause of improved risk sharing or because of the reduction in financing constraintsor both. Moreover, better corporate governance and investor protection shouldpromote financial development (La Porta et al., 1997) and hence growth (King andLevine, 1993, for example).From at least two alternative perspectives, our results may be more surprising.
First, alternative theories do not imply positive growth effects after financialliberalization, for example, because of reduced precautionary savings (Devereux andSmith, 1994) or because informational asymmetries prevent foreign capital to beprofitably invested (Stiglitz, 2000). Second, a rapidly growing literature on thegrowth effects of capital account liberalization finds mixed results (see Eichengreen,2002, for a survey).We conduct a number of empirical exercises that instill confidence in our results.
�
Our results survive an extensive number of econometric robustness experiments,including controlling for world business cycle variation.
ARTICLE IN PRESS
G. Bekaert et al. / Journal of Financial Economics 77 (2005) 3–55 5
�
Our results are robust to alternative measurements of the liberalization variable.The use of a homogeneous measure of international openness, focusing on equitymarkets, could explain why our results are so different from the capital accountopenness literature. We confirm that the standard International Monetary Fund(IMF) measure of whether the capital account is free of restrictions (see Rodrik,1998, and Kraay, 1998) does not give rise to a robust growth effect. When capitalaccount restrictions are more finely measured, as in Quinn (1997) and Edwards(2001), there is a significant growth effect. However, the growth effect from equitymarket liberalization remains important even after controlling for a more finelymeasured capital account liberalization indicator.�
We take seriously the possibility that liberalization could be a strategic decisioncorrelated with growth opportunities. However, when we control for growthopportunities, the liberalization effect remains intact.�
Our growth effect is large which likely cannot be fully ascribed to equity marketliberalization. Most importantly, equity market liberalization could coincide withother reforms that improve the growth prospects of the country. We closelyinvestigate several possibilities such as macro reforms, financial reforms, legalreforms (including reforms regarding insider trading), and the coincidence ofequity market liberalizations with post-banking crisis reforms.�
It is unlikely that the liberalization effect is the same in all liberalizing countries.We relate the heterogeneity of the growth effect to the comprehensiveness ofreforms, the legal environment, the quality of institutions, the investmentconditions, and the degree of financial development.The paper is organized as follows. Section 2 describes our data, the summarystatistics and the econometric framework. Section 3 examines the role of equitymarket liberalization as a determinant of economic growth. Section 4 exploreswhether the equity market liberalization effect can be accounted for bymacroeconomic and other regulatory reforms. Section 5 sheds light on why thegrowth response to financial liberalization differs across countries. Some concludingremarks are offered in Section 6.
2. Data and preliminary analysis
This section introduces the key data that we use throughout the paper. Section 2.1introduces our measures of equity market liberalization. Section 2.2 provides anunconditional analysis, i.e., not controlling for other factors, of how equity marketliberalization impacts the key variables in our research.
2.1. Equity market liberalizations
Our tests involve regressions of real per capita gross domestic product (GDP)growth on an equity market liberalization indicator using panel data. Table 1contains the descriptions and sources of all the variables used in the paper.

ARTICLE IN PRESS
Table 1
Description of the variables
All data are employed at the annual frequency.
Variable Description
Dating equity market liberalization
Official equity market
liberalization indicator
(Official Liberalization)
Corresponding to a date of formal regulatory change after which foreign
investors officially have the opportunity to invest in domestic equity
securities. Official Liberalization dates, presented in Table 2, are based on
Bekaert and Harvey (2002) A Chronology of Important Financial,
Economic and Political Events in Emerging Markets, http://
www.duke.edu/�charvey/chronology.htm. This chronology is based on
over 50 different source materials. A condensed version of the
chronology, along with the selection of dates for a number of countries
appears in Bekaert and Harvey (2000). We have extended their official
liberalization dates to include Japan, New Zealand, and Spain. For the
liberalizing countries, the associated Official Liberalization indicator
takes a value of one when the equity market is officially liberalized and
thereafter, and zero otherwise. For the remaining countries, fully
segmented countries are assumed to have an indicator value of zero, and
fully liberalized countries are assumed to have an indicator value of one.
These dates appear in Appendix A.
First sign equity market
liberalization indicator
(First Sign)
‘‘First Sign’’ equity market liberalization dates denote the year associated
with the earliest of three dates: Official Liberalization, first American
Depositary Receipt (ADR) announcement and first country fund launch.
The First Sign indicator takes a value of one on and after the First Sign
year, and zero otherwise. As with the Official Liberalization indicator,
fully segmented countries are assumed to have an indicator value of zero,
and fully liberalized countries are assumed to have an indicator value of
one. These dates are reported in Appendix A.
Intensity equity market
liberalization indicator
(Liberalization
Intensity)
Following Bekaert (1995) and Edison and Warnock (2003), the
Liberalization Intensity measure is based on the ratio of the market
capitalization of the constituent firms comprising the IFC Investable
index to those that comprise the IFC Global index for each country. The
IFC Global index, subject to some exclusion restrictions, is designed to
represent the overall market portfolio for each country, whereas the IFC
Investable index is designed to represent a portfolio of domestic equities
that are available to foreign investors. A ratio of one means that all of the
stocks are available to foreign investors. We denote this measure:
Liberalization Intensity. We also explore a related measure, Alternative
Intensity, by calculating the ratio of the number of firms in the investable
and global indices for each country. In both cases, fully segmented
countries have an intensity measure of zero, and fully liberalized countries
have an intensity measure of one.
Other important dates
IMF capital account
openness indicator
We measure capital account openness by employing the IMF’s Annual
Report on Exchange Arrangements and Exchange Restrictions
(AREAER). This publication reports six categories of information. The
G. Bekaert et al. / Journal of Financial Economics 77 (2005) 3–556

ARTICLE IN PRESS
Table 1 (continued )
Variable Description
capital account openness indicator takes on value of zero if the country
has at least one restriction in the ‘‘restrictions on payments for the capital
account transaction’’ category. These dates are reported in Appendix A.
Quinn Capital account
openness indicator
Quinn’s (1997) capital account openness measure is also created from the
text of the annual volume published by the International Monetary Fund
(IMF), Exchange Arrangements and Exchange Restrictions. Rather than
the indicator constructed by the IMF that takes a 1 if any restriction is in
place, Quinn’s openness measure is scored 0–4, in half integer units, with
4 representing a fully open economy. The measure hence facilitates a
more nuanced view of capital account openness, and is available for 76
countries in our study. We transform each measure into a 0 to 1 scale.
Banking sector crisis
indicator
Caprio and Klingebiel (2001) document systemic and borderline banking
sector crises. We construct banking crisis indicators that take a value of
one when (a) a country is undergoing a systemic banking sector crisis or
(b) when a country is undergoing either a systemic or borderline banking
sector crisis. We also construct post-banking crisis indicators that take a
value of one in the last year and each subsequent year following (a) a
systemic banking sector crisis or (b) either a systemic or borderline
banking sector crisis.
Insider trading law
indicator
Bhattacharya and Daouk (2002) document the enactment of insider
trading laws and the first prosecution of these laws. We construct two
indicator variables. The first takes the value of one following the
introduction of an insider trading law. The second takes the value of one
after the law’s first prosecution.
Macroeconomic and demographic measures
Gross domestic product
(GDP) growth
Growth of real per capita gross domestic product. Available for all
countries from 1980 through 1997. Source: World Bank Development
Indicators CD-ROM.
Initial GDP Logarithm of real per capita gross domestic product in 1980. Available
for all countries. Source: World Bank Development Indicators CD-ROM.
Government
consumption/GDP
Government consumption divided by gross domestic product. General
government final consumption expenditure includes all government
current expenditures for purchases of goods and services (including
compensation of employees). It also includes most expenditures on
national defense and security, but excludes government military
expenditures that are part of government capital formation. Available for
all countries from 1980 through 1997. Source: World Bank Development
Indicators CD-ROM.
Secondary school
enrollment
Secondary school enrollment ratio is the ratio of total enrollment,
regardless of age, to the population of the age group that officially
corresponds to the secondary level of education. Accordingly, the
reported value can exceed (or average) more than 100%. Available for all
G. Bekaert et al. / Journal of Financial Economics 77 (2005) 3–55 7

ARTICLE IN PRESS
Table 1 (continued )
Variable Description
countries from 1980 through 1997. Source: World Bank Development
Indicators CD-ROM.
Populationgrowth Growth rate of total population which counts all residents regardless of
legal status or citizenship. Available for all countries from 1980 through
1997. Source: World Bank Development Indicators CD-ROM.
Log life expectancy Life expectancy at birth indicates the number of years a newborn infant
would live if prevailing patterns of mortality at the time of its birth were
to stay the same throughout its life. Available for all countries from 1980
through 1997. Source: World Bank Development Indicators CD-ROM.
OECD GDP growth Growth of real per capita gross domestic product for high-income OECD
members. High-income economies are those in which 1998 GNP per
capita was $9,361 or more. Source: World Bank Development Indicators
CD-ROM.
World real interest rate Constructed from each country’s real interest rates. The GDP weighted
real interest rate for the G-7 countries, where the real rate for each
country is the lending interest rate adjusted for inflation as measured by
the GDP deflator. Source: World Bank Development Indicators
CD-ROM.
Macroeconomic reforms
Trade/GDP The trade dependency ratio is the sum of exports and imports of goods
and services measured as a share of gross domestic product. Available for
all countries from 1980 through 1997. Source: World Bank Development
Indicators CD-ROM.
Inflation Inflation as measured by the log annual growth rate of the gross domestic
product implicit deflator. We use the CPI if the GDP-deflator is not
available. Available for all countries from 1980 through 1997. Source:
World Bank Development Indicators CD-ROM.
Black market premium The black market premium is defined as (parallel
FXrate=officialFXrate� 1Þ � 100; where parallel FXrate is the blackmarket rate. The variable measures the premium market participants
must pay, relative to the official exchange rate, to exchange the domestic
currency for dollars in the black market. Available for all countries from
1980 through 1997. Source: Easterly (2001).
Fiscal deficit The overall budget deficit is total expenditure and lending minus
repayments less current and capital revenue and official grants received;
shown as a percentage of GDP. Data are available for central
governments only. Available for 28 countries from 1980 through 1997.
Source: World Bank Development Indicators CD-ROM.
Growth Opportunities An implied measure of country-specific growth opportunities that reflects
the growth prospects for each industry (at the global level) weighted by
G. Bekaert et al. / Journal of Financial Economics 77 (2005) 3–558

ARTICLE IN PRESS
Table 1 (continued )
Variable Description
the industrial composition for each country. We construct an annual
measure of the 3-digit SIC industry composition for each country by their
output shares according to UNIDO Industrial Statistics Database. For
each SIC code, we also measure price-earnings (PE) ratios for that
industry at the global level, from which we construct an implied measure
of growth opportunities for each country by weighting each global
industry PE ratio by its relative share for that country. We subtract from
this measure the overall world market PE ratio to remove the world
discount rate effect (and we remove a 5-year moving average), and call
the difference ‘‘growth opportunities’’ (GO). Available for 92 countries
from 1980 through 1997. Source: Bekaert et al. (2004b).
Financial development
Private credit/GDP Private credit divided by gross domestic product. Credit to private sector
refers to financial resources provided to the private sector, such as
through loans, purchases of non-equity securities, and trade credits and
other accounts receivable that establish a claim for repayment. Available
for all countries from 1980 through 1997. Source: World Bank
Development Indicators CD-ROM.
Equity market turnover The ratio of equity market value traded to the market capitalization. The
data are available for 50 countries from 1980 through 1997. Source:
Standard and Poor’s/International Finance Corporation’s Emerging
Stock Markets Factbook.
Legal environment
Legal origin Identifies the legal origin of the company law or commercial code of each
country (English, French, Socialist, German, Scandinavian). We
construct three indicators that take the value of one when the legal origin
is Anglo-Saxon (English Law), French (French Law), or other (Law
Other), and zero otherwise; legal origin is available for all countries. This
variable is purely cross-sectional, and available for all countries. Source:
La Porta et al. (1999) .
Judicial Efficiency Assessment of the ‘‘efficiency and integrity of the legal environment as it
affects business, particularly foreign firms’’ produced by the country risk
rating agency Business International Corp. It may be taken to ‘‘represent
investors’ assessments of conditions in the country in question.’’ Average
between 1980 and 1983. Scale from 0 to 10, with lower scores, lower
efficiency levels. This variable is purely cross-sectional, and available for
47 countries. Source: La Porta et al. (1998).
Speed of Judicial
Process
The total estimated speed in calendar days of the procedure (to evict a
tenant for nonpayment of rent or to collect a bounced check) under the
factual and procedural assumptions provided. It equals the sum of (i)
duration until completion of service of process, (ii) duration of trial, and
(iii) duration of enforcement. This variable is purely cross-sectional, and
available for 69 countries. Source: Djankov et al. (2003).
G. Bekaert et al. / Journal of Financial Economics 77 (2005) 3–55 9

ARTICLE IN PRESS
Table 1 (continued )
Variable Description
Quality of Institutions
Quality of Institutions The sum of the International Country Risk Guide (ICRG) Political Risk
(ICRGP) subcomponents: Corruption, Law and Order, and Bureaucratic
Quality.
Corruption ICRGP quality of institutions sub-component. This is a measure of
corruption within the political system. Such corruption: distorts the
economic and financial environment, reduces the efficiency of
government and business by enabling people to assume positions of
power through patronage rather than ability, and introduces an inherent
instability into the political process. The most common form of
corruption met directly by business is financial corruption in the form of
demands for special payments and bribes connected with import and
export licenses, exchange controls, tax assessments, police protection, or
loans. Although the PRS measure takes such corruption into account, it
is more concerned with actual or potential corruption in the form of
excessive patronage, nepotism, job reservations, ‘‘favor-for-favors,’’
secret party funding, andsuspiciously close ties between politics and
business. In PRS’s view these sorts of corruption create risk to foreign
business, potentially leading to popular discontent, unrealistic and
inefficient controls on the state economy, and encourage the development
of the black market.
Law and Order ICRGP quality of institutions sub-component. PRS assesses Law and
Order separately, with each sub-component comprising zero to three
points. The Law sub-component is an assessment of the strength and
impartiality of the legal system, while the Order sub-component is an
assessment of popular observance of the law. Thus, a country can enjoy a
high rating (3.0) in terms of its judicial system, but a low rating (1.0) if the
law is ignored for a political aim.
Bureaucratic Quality ICRGP quality of institutions sub-component. The institutional strength
and quality of the bureaucracy can act as a shock absorber that tends to
minimize revisions of policy when governments change. Therefore, high
points are given to countries where the bureaucracy has the strength and
expertise to govern without drastic changes in policy or interruptions in
government services. In these low-risk countries, the bureaucracy tends to
be somewhat autonomous from political pressure and to have an
established mechanism for recruitment and training. Countries that lack
the cushioning effect of a strong bureaucracy receive low points because a
change in government tends to be traumatic in terms of policy
formulation and day-to-day administrative functions.
Investment environment
Economic risk rating ICRG Economic Risk indicator (which ranges between 0 and 50). The
risk rating is a combination of 5 subcomponents: GDP levels and growth,
respectively, inflation, balanced budgets, and the current account. The
minimum number of points for each component is zero, while the
G. Bekaert et al. / Journal of Financial Economics 77 (2005) 3–5510

ARTICLE IN PRESS
Table 1 (continued )
Variable Description
maximum number of points depends on the fixed weight that component
is given in the overall economics risk assessment.
Anti-director rights An index aggregating different shareholder rights. The index is formed by
adding 1 when: (1) the country allows shareholders to mail their proxy
vote to the firm; (2) shareholders are not required to deposit their shares
prior to the General Shareholders’ Meeting; (3) cumulative voting or
proportional representation of minorities in the board of directors is
allowed; (4) an oppressed minorities mechanism is in place; (5) the
minimum percentage of share capital that entitles a shareholder to call for
an Extraordinary Shareholders’ Meeting is less than or equal to 10
percent (the sample median); or (6) shareholders have preemptive rights
that can only be waved by a shareholders’ vote. The index ranges from 0
to 6. This variable is purely cross-sectional, and available for 47 countries.
Source: La Porta et al. (1998).
Investment Profile ICRG Political Risk (ICRGP) sub-component (12% weight in overall
ICRGP index). This is a measure of the government’s attitude to inward
investment. The investment profile is determined by PRS’s assessment of
three sub-components: (i) risk of expropriation or contract viability; (ii)
payment delays; and (iii) repatriation of profits. Each sub-component is
scored on a scale from zero [very high risk] to four [very low risk].
Creditor rights An index aggregating different creditor rights. The index is formed by
adding 1 when (1) the country imposes restrictions, such as
creditors’consent or minimum dividends to file for reorganizations; (2)
secured creditors are able to gain possession of their security once the
reorganization petition has been approved (no automatic stay); (3)
secured creditors are ranked first in the distribution of the proceeds that
results from the disposition of the assets of a bankrupt firm; and (4) the
debtor does not retain the administration of its property pending the
resolution of the reorganization. The index ranges from 0 to 4. This
variable is purely cross-sectional, and available for 45 countries. Source:
La Porta et al. (1998).
Accounting Standards Index created by examining and rating companies’ 1990 annual reports
on their inclusion or omission of 90 items. These items fall into seven
categories (general information, income statements, balance sheets, funds
flow statements, accounting standards, stock data, and special items). A
minimum of three companies in each country were studied. The
companies represent a cross section of various industry groups; industrial
companies represented 70 percent, and financial companies represented
the remaining 30 percent. This variable is purely cross-sectional, and
available for 39 countries. Source: La Porta et al. (1998).
G. Bekaert et al. / Journal of Financial Economics 77 (2005) 3–55 11
Perhaps the most important variable in our paper is the indicator variable, OfficialLiberalization. This variable is based on the Bekaert and Harvey (2002) detailedchronology of important financial, economic, and political events in many

ARTICLE IN PRESS
G. Bekaert et al. / Journal of Financial Economics 77 (2005) 3–5512
developing countries. The variable takes the value of one when foreign portfolioinvestors can own the equity of a particular market and zero otherwise. We augmentthis analysis with liberalization dates for five developed countries: Iceland, Japan,Malta, New Zealand, and Spain (see Appendix A).We investigate the robustness of the liberalization effect to an alternative measure
of financial liberalization: First Sign. This measure is based on the earliest of threepossibilities: a launching of a country fund, an American Depositary Receipt (ADR)announcement, and an Official Liberalization. It might be possible for a foreigninvestor to access the market through a country fund well before foreigners areallowed to directly transact in the local equity market. For example, consider the caseof Thailand. Bekaert and Harvey (2002) date the Official Liberalization in September1987. This was the first month of operation of the Thai Alien Board, which allowedforeigners to directly transact in Thai securities. However, foreigners could indirectlyaccess the Thai market earlier. In July 1985, the Bangkok Fund Ltd. was launched onthe London Stock Exchange, and in December 1986, Morgan Stanley launched theThailand Fund. Thailand announced its first ADR in January 1991. So, for ouranalysis, the Official Liberalization is dated in 1987, and the First Sign date is 1985.We also consider an alternative continuous measure of liberalization. Bekaert
(1995) and Edison and Warnock (2003) propose a measure of equity marketopenness based on the ratio of the capitalization of the International FinanceCorporation (IFC) investable to the global stocks in each country. The IFC’s globalstock index seeks to represent the local stock market, and the investable indexcorrects market capitalization for foreign ownership restrictions. A ratio of onemeans that all of the stocks are available to foreign investors. In Table 3, we call thismeasure Liberalization Intensity.1 Table 1 has more details on the construction ofthis variable.Finally, we contrast equity market liberalization with capital account liberal-
ization and two measures of capital account openness; one based on IMFinformation and the other proposed by Quinn (1997) and Quinn and Toyoda(2003). The various liberalization measures are presented in Appendix A. All otherdata are discussed when they are introduced in the analysis.Our regression analysis uses four different country samples, which are determined by
data availability. Economic growth rates, the basic control variables, and the OfficialLiberalization indicator are available for all samples. Our largest samples cover 95 and75 countries, respectively, and employ primarily macroeconomic and demographicdata. Our smallest samples, cover 50 and 28 countries, respectively, and employ, inaddition to the macroeconomic and demographic information, data describing the stateof banking and equity market development in each country. We report results based onthe largest overall sample (95 countries, Sample I) and the largest sample that includesfinancial information (50 countries, Sample II). We sometimes refer to the results forthe two alternative samples which are available on request.
1We also explore a related measure by calculating the ratio of the number of firms in the investable and
global indices for each country (Alternative Intensity). Given the high volatility of emerging market equity
returns, this measure could be less noisy. These results are similar and are available on request.

ARTICLE IN PRESS
G. Bekaert et al. / Journal of Financial Economics 77 (2005) 3–55 13
2.2. Unconditional effects of liberalization
Tables 2 and 3 present a summary analysis of some of the main variables inour study. We analyze the data from two perspectives. First, in Table 2, we considermeans of the variables five years before and after equity market liberalizations.However, for real GDP growth, we also examine three- and seven-year intervals. We
Table 2
Summary statistics. We explore the three, five, and seven-year averages of the growth rate of real per
capita gross domestic product (GDP) and the five-year averages of the other variables employed in the
paper (and summarized in Table 1) before and after the equity market liberalization (including the
liberalization year in the after period). For some countries, we do not have a full three, five, or seven years
available given the timing of the liberalization, so we simply take the available years in the average. For all
variables, unless otherwise stated, the summary statistics reflect data for 95 countries from 1980 to 1997.
Official Liberalization means that the equity market is liberalized. Fully liberalized denotes countries that
are fully liberalized throughout our sample. Never liberalized denotes countries that never undergo
financial liberalization. ICRG is the International Country Risk Guide. Statistical significance is denoted
by * for 10%, ** for 5%, and *** for 1%. NA denotes variables for which the test is not available.
Variable Pre-
liberalization
Post-
liberalization
Never
liberalized
Fully
liberalized
Real GDP growth (three-year) 0.0160 0.0265** �0.0016 0.0201***
Real GDP growth (five-year) 0.0159 0.0276***
Real GDP growth (seven-year) 0.0153 0.0264***
Government/GDP 0.1379 0.1328 0.1581 0.1885***
Enrollment 0.5573 0.6115** 0.3439 0.9974***
Population growth 0.0203 0.0169** 0.0255 0.0060***
Life expectancy 65.7 67.7** 56.9 75.7***
Growth opportunity �0.0301 0.0076*** �0.0012 �0.0016
Trade/GDP 0.6229 0.6383 0.6970 0.8429***
Logð1þ inflationÞ (Latin) 0.1890 0.1411 0.0596 NA
Logð1þ inflationÞ (not Latin) 0.0993 0.0857 0.0934 0.0411***
Logð1þ black market premiumÞ 0.1499 0.0724*** 0.2211 0.0007***
Fiscal Deficit (28 countries) 0.0606 0.0333*** NA 0.0307
Private credit/GDP 0.3831 0.4263 0.2286 0.8095***
Turnover (50 countries) 0.1814 0.2664 NA 0.4938
Banking crisis (systematic) 0.3243 0.2941 0.3300 0.1131***
Banking crisis (systematic and
borderline)
0.5243 0.5784 0.4190 0.3891
Law and order (75 countries) 0.4875 0.6065*** 0.4472 0.9510***
Insider trading law 0.4205 0.7241*** 0.0836 0.6540***
Insider trading prosecution 0.0667 0.1149* NA 0.4325
Judicial efficiency (47 countries) NA 0.9456
Speed of process (checksþ eviction)
(69 countries)
363.4 408.3
Quality of institutions (75 countries) 0.5273 0.6033*** 0.4158 0.9333***
ICRG economic index (75 countries) 0.5895 0.6765*** 0.5909 0.7845
Investment profile (75 countries) 0.4660 0.5312*** 0.4680 0.6494***
Anti-director rights (47 countries) NA 0.4902
Creditor rights (45 countries) NA 0.4853
Accounting standards (39 countries) NA 0.6950

ARTICLE IN PRESS
Table 3
Preliminary analysis of the impact of liberalization. For all estimates, the dependent variable is the one-
year average growth rate of real per capita gross domestic product (GDP). Regressions include time
effects, fixed effects, or both, as indicated (not reported in the interest of space); no other controls are
included. In Panel A, we focus on equity market liberalization across the 40 countries that liberalize in our
sample. The Official Liberalization variable takes a value of one when the equity market is liberalized, and
zero otherwise. We consider an additional regression that includes China (41 countries). The First Sign
liberalization indicator takes the value of one after the first of the following events: the Official
Liberalization date, the introduction of American Depository Receipts, or the introduction of a country
fund. The Liberalization Intensity measure is the ratio of the market capitalizations for the International
Finance Corporation’s investables to global indices.
In Panel B, we consider more general measures of capital account openness. The International
Monetary Fund capital account openness indicator takes on value of zero if the country has at least one
reported capital account restriction. The Quinn capital account liberalization indicator takes a value
between one and zero depending upon the intensity of the reported capital account liberalization or
openness; these regressions include 76 countries. For both measures, we perform regressions for the same
40 liberalizing countries for comparison, as well as for the full set of countries for which the measures are
available.
Estimate Standard
ErrorAdjusted R2
Panel A: Equity market liberalization
Official Liberalization indicator (40 countries)
Fixed effects 0.0124 0.0032 0.208
Time effects 0.0202 0.0048 0.052
Fixed and time effects 0.0105 0.0053 0.229
Official Liberalization indicator plus China (41)
Fixed effects 0.0128 0.0031 0.251
Time effects 0.0210 0.0049 0.048
Fixed and time effects 0.0117 0.0053 0.270
First Sign indicator (40)
Fixed effects 0.0129 0.0033 0.208
Time effects 0.0185 0.0041 0.055
Fixed and time effects 0.0080 0.0050 0.228
Liberalization Intensity (40)
Fixed effects 0.0205 0.0051 0.209
Time effects 0.0137 0.0064 0.033
Fixed and time effects 0.0151 0.0064 0.231
Panel B: Capital account liberalization
IMF capital account openness indicator (40)
Fixed effects 0.0036 0.0065 0.190
Time effects 0.0057 0.0043 0.029
Fixed and time effects 0.0017 0.0065 0.224
IMF capital account openness indicator (95)
Fixed effects 0.0041 0.0051 0.110
Time effects 0.0071 0.0029 0.024
Fixed and time effects �0.0017 0.0053 0.133
Quinn capital account openness indicator (37)
Fixed effects 0.0154 0.0192 0.169
Time effects 0.0218 0.0086 0.030
Fixed and time effects �0.0016 0.0203 0.196
G. Bekaert et al. / Journal of Financial Economics 77 (2005) 3–5514

ARTICLE IN PRESS
Table 3 (continued )
Estimate Standard
ErrorAdjusted R2
Quinn capital account openness indicator (76)
Fixed effects 0.0122 0.0123 0.143
Time effects 0.0193 0.0047 0.033
Fixed and time effects 0.0019 0.0129 0.167
G. Bekaert et al. / Journal of Financial Economics 77 (2005) 3–55 15
look at the difference in means between countries that are fully liberalized andcountries that were never liberalized (segmented countries). Second, in Table 3, weconduct regression analysis.Using a sample of liberalizing countries, Table 2 shows that the real annual GDP
growth rate is more than 1% higher in the post-liberalization period for all intervals.A much sharper difference in growth exists between fully liberalized countries andthose that did not experience a liberalization, of approximately 2.2%.The next group of variables serves as control variables in the growth regressions.
In the neoclassical growth model, they can be viewed as determinants of steady-stateGDP. The control variables experience changes after liberalization that wouldtypically indicate a higher steady state GDP. The most striking and statisticallysignificant differences occur for the fully liberalized and segmented countries. Thenever-liberalized countries have: lower secondary school enrollment, lower lifeexpectancy, and higher population growth.Table 3 presents a complementary analysis to Table 2. Here we estimate an
ordinary least squares (OLS) regression of one-year GDP growth rates on thedifferent measures of liberalization. We estimate these regressions with fixed effects,time effects, and both fixed and time effects and, therefore, focus only on liberalizingcountries. Essentially, the regression identifies average GDP growth post- versus pre-liberalization controlling for country-specific time-invariant growth circumstancesand global business cycle effects. Panel A focuses on our measures of equity marketliberalization, and Panel B considers various measures of capital account liberal-ization. We discuss Panel B in Section 3.3.The first and third parts of Panel A consider the impact of the Official
Liberalization indicator and the First Sign indicator. Even with both fixed and timeeffects, the impact of the equity market liberalization variables is positive andaround 1%. The second subpanel adds China to the analysis with a liberalizationdate of 1991. Unfortunately, we do not have enough data coverage to add China tothe analysis in the other tables. The addition of this country in the analysis hereincreases both the size and the significance of the liberalization coefficient. In thefourth part of this table, we consider a measure of liberalization intensity. Thisvariable provides the strongest and most significant impact, about 1.5% per year,but this number must be interpreted as the effect of a full, comprehensiveliberalization.

ARTICLE IN PRESS
G. Bekaert et al. / Journal of Financial Economics 77 (2005) 3–5516
The differences in means reported in Table 2 and the fixed effects regressions inTable 3 suggest liberalization is associated with increased growth.
3. Liberalization and economic growth
This section contains the main results. We start by outlining the econometricframework we employ in Section 3.1, and report the main results in Section 3.2.Section 3.3 contrasts capital account with equity market liberalization, andSection 3.4 considers several robustness exercises. Section 3.5 explicitly discussesthe possibility of endogeneity bias.
3.1. Econometric framework
Define the logarithmic growth in real GDP per capita for country i between t andt þ k as:
yi;tþk;k ¼1
k
Xk
j¼1
yi;tþj i ¼ 1; . . . ;N; (1)
where
yi;t ¼ lnGDPi;t
POPi;t
�GDPi;t�1
POPi;t�1
� �
and N is the number of countries in our sample. Denote the initial level of log GDPper capita as Qit and the country’s long-run (steady state) per capita GDP as Q�
i :Taking a first-order approximation to the neoclassical growth model (see, e.g.,Mankiw, 1995), we can derive yi;tþk;k ¼ �l½Qit � Q�
i ; where l is a positiveconditional convergence parameter. The literature often implicitly models Q�
i as alinear function of a number of structural variables such as the initial level of humancapital. Hence a prototypical growth regression can be specified as
yi;tþk;k ¼ �lQi;t þ g0Xit þ �i;tþk;k; (2)
where Xit are the variables controlling for different levels of long-run per capitaGDP across countries. Our main addition to the literature is to examine theeffect of adding an equity market liberalization variable, Libi;t; to the growthregression
yi;tþk;t ¼ bQi;1980 þ g0Xi;t þ aLibi;t þ �i;tþk;k; (3)
where Qi;1980 represents the logarithm of per capita real GDP in 1980 and servesas an initial GDP proxy. Because it is critical to capture the temporal dimensionof the liberalization process, we combine time-series with cross-sectionalinformation.We estimate Eq. (3) with two approaches. First, we consider an OLS regression on
non-overlapping five-year intervals. We consider both a homoskedastic, diagonal
ARTICLE IN PRESS
G. Bekaert et al. / Journal of Financial Economics 77 (2005) 3–55 17
and a seemingly unrelated regression (SUR) error structure for these regressions.While this approach does not capture all of the information in the data, it has theadvantage of being transparent and providing a baseline estimate for our moregeneral procedure. Second, we identify the parameters using a generalized method ofmoments (GMM) estimator described and analyzed in Bekaert et al. (2001). Theestimator maximizes the time-series content in our regression by making use ofoverlapping data. We adjust the standard errors for the resulting moving averagecomponent in the residuals using a cross-sectional extension to Hansen and Hodrick(1980). Our regressors are all predetermined. While the GMM estimator looks likean instrumental variable estimator, it reduces to pooled OLS under simplifyingassumptions on the weighting matrix.Our GMM framework raises four issues: the construction of the weighting matrix,
the choice of k, the specification of the control variables, and the construction of theliberalization indicator.First, growth regressions have been criticized for being contaminated by
multicollinearity (see Mankiw, 1995). In a pure cross-sectional regression, theregressors could be highly correlated (highly developed countries score well on allproxies for long-run growth), the data could be measured with error, and everycountry’s observation is implicitly viewed as an independent draw. Therefore,standard errors likely underestimate the true sampling error. In our panelapproach, we can accommodate heteroskedasticity both across countries and acrosstime and correlation between country residuals by choosing the appropriateweighting matrix. In the tables, we report results using the method thataccommodates overlapping observations and groupwise heteroskedasticity butdoes not allow for temporal heteroskedasticity or SUR effects. We reportrobustness checks later. Also, the growth effect survives the inclusion of fixedeffects (see Table 3).Second, because our sample is relatively short, starting only in 1980, and because
many liberalizations only occurred in the 1990s, we use k ¼ 5; instead of k ¼ 10;which is typical in the literature. However, Islam (1995) and Caselli et al. (1996)find similar results using k ¼ 5 versus k ¼ 10; and we check the robustness tothe alternative k’s and the introduction of variables controlling for the worldbusiness cycle.Third, Levine and Renelt (1992) find that most of the independent variables in
standard growth regressions are, in a particular sense, fragile. We are primarilyinterested in the robustness of any effect the liberalization dummy could have ongrowth. We minimize the data mining biases for the other regressors by closelymimicking the regression in Barro (1997b). In addition, given the documentedfragility of some of these variables, our initial analysis adds the control variables oneby one to the growth regression.Fourth, perhaps the main methodological issue regarding our sample is the
construction of the equity market liberalization indicator variable. Although timingcapital market reforms is prone to errors, the use of annual data reduces the impactof small timing errors. Nevertheless, we conduct several robustness experiments withrespect to the definition of the liberalization variable.
ARTICLE IN PRESS
G. Bekaert et al. / Journal of Financial Economics 77 (2005) 3–5518
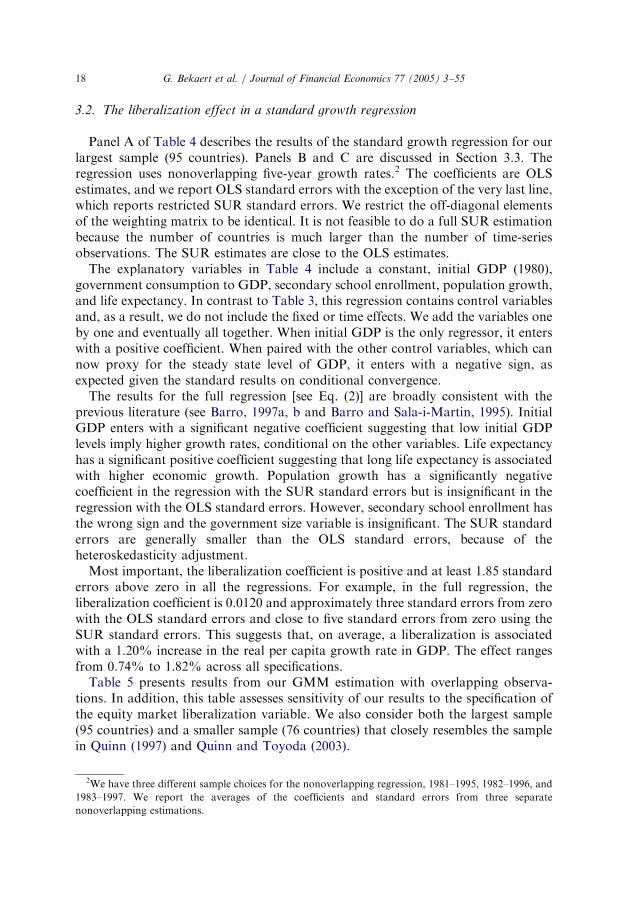
3.2. The liberalization effect in a standard growth regression
Panel A of Table 4 describes the results of the standard growth regression for ourlargest sample (95 countries). Panels B and C are discussed in Section 3.3. Theregression uses nonoverlapping five-year growth rates.2 The coefficients are OLSestimates, and we report OLS standard errors with the exception of the very last line,which reports restricted SUR standard errors. We restrict the off-diagonal elementsof the weighting matrix to be identical. It is not feasible to do a full SUR estimationbecause the number of countries is much larger than the number of time-seriesobservations. The SUR estimates are close to the OLS estimates.The explanatory variables in Table 4 include a constant, initial GDP (1980),
government consumption to GDP, secondary school enrollment, population growth,and life expectancy. In contrast to Table 3, this regression contains control variablesand, as a result, we do not include the fixed or time effects. We add the variables oneby one and eventually all together. When initial GDP is the only regressor, it enterswith a positive coefficient. When paired with the other control variables, which cannow proxy for the steady state level of GDP, it enters with a negative sign, asexpected given the standard results on conditional convergence.The results for the full regression [see Eq. (2)] are broadly consistent with the
previous literature (see Barro, 1997a, b and Barro and Sala-i-Martin, 1995). InitialGDP enters with a significant negative coefficient suggesting that low initial GDPlevels imply higher growth rates, conditional on the other variables. Life expectancyhas a significant positive coefficient suggesting that long life expectancy is associatedwith higher economic growth. Population growth has a significantly negativecoefficient in the regression with the SUR standard errors but is insignificant in theregression with the OLS standard errors. However, secondary school enrollment hasthe wrong sign and the government size variable is insignificant. The SUR standarderrors are generally smaller than the OLS standard errors, because of theheteroskedasticity adjustment.Most important, the liberalization coefficient is positive and at least 1.85 standard
errors above zero in all the regressions. For example, in the full regression, theliberalization coefficient is 0.0120 and approximately three standard errors from zerowith the OLS standard errors and close to five standard errors from zero using theSUR standard errors. This suggests that, on average, a liberalization is associatedwith a 1.20% increase in the real per capita growth rate in GDP. The effect rangesfrom 0.74% to 1.82% across all specifications.Table 5 presents results from our GMM estimation with overlapping observa-
tions. In addition, this table assesses sensitivity of our results to the specification ofthe equity market liberalization variable. We also consider both the largest sample(95 countries) and a smaller sample (76 countries) that closely resembles the samplein Quinn (1997) and Quinn and Toyoda (2003).
2We have three different sample choices for the nonoverlapping regression, 1981–1995, 1982–1996, and
1983–1997. We report the averages of the coefficients and standard errors from three separate
nonoverlapping estimations.

ARTIC
LEIN
PRES
S
Table 4
The impact of liberalization in pooled ordinary least squares (OLS) growth regressions. For all estimates, the dependent variable is the five-year
nonoverlapping average growth rate of real per capita gross domestic product (GDP). Log(GDP) is the log real per capita GDP level in 1980. Govt/GDP is the
ratio of government consumption to GDP; enrollment is the secondary school enrollment ratio; population growth is the growth rate of total population;
Log(life) is the log life expectancy of the total population. In Panel A, the Official Liberalization variable takes a value of one when the equity market is
liberalized, and zero otherwise; these regressions cover 95 countries.
In Panel B, the International Monetary Fund (IMF) capital account openness indicator takes on value of zero if the country has at least one reported capital
account restriction; these regressions cover 95 countries. In Panel C, the Quinn capital account liberalization indicator takes a value between one and zero
depending upon the intensity of the reported capital account liberalization or openness; these regressions include 76 countries. We first consider each control
variable separately, then all together. For each case, we report the simple average of three coefficients (with standard errors and adjusted R2’s) associated with
separate pooled OLS regressions (over 1981–1995, 1982–1996, and 1983–1997) for which the dependent variable is three nonoverlapping five-year GDP
average growth rates. That is, each pooled OLS regression has three time-series observations with no overlap; we conduct each regression separately and then
average the resulting coefficients. OLS standard errors are below each estimate in parentheses; for the last entry of each panel, we also include restricted
seemingly unrelated regression (SUR) standard errors (all off-diagonal elements are assumed to be equal) as a robustness check.
Constant Initial
log(GDP)
Gov/GDP Secondary
school
enrollment
Population
growth
Log(life) Official
Liberalization
indicator
IMF capital
account
openness
Quinn capital
account
openness
Adjusted R2
Panel A: Official Liberalization (95 countries)
0.0048 0.0181 0.082
(0.0021) (0.0029)
0.0020 0.0004 0.0173 0.079
(0.0104) (0.0015) (0.0048)
0.0072 �0.0152 0.0182 0.081
(0.0052) (0.0332) (0.0030)
�0.0011 0.0145 0.0119 0.094
(0.0035) (0.0073) (0.0048)
0.0135 �0.3568 0.0127 0.106
(0.0041) (0.1479) (0.0038)
G.
Bek
aert
eta
l./
Jo
urn
al
of
Fin
an
cial
Eco
no
mics
77
(2
00
5)
3–
55
19

ARTIC
LEIN
PRES
S
Table 4
(continued )
Constant Initial
log(GDP)
Gov/GDP Secondary
school
enrollment
Population
growth
Log(life) Official
Liberalization
indicator
IMF capital
account
openness
Quinn capital
account
openness
Adjusted R2
�0.1939 0.0488 0.0074 0.149
(0.0415) (0.0103) (0.0039)
�0.3093 �0.0084 �0.0007 �0.0029 �0.2616 0.0935 0.0120 0.217
OLS standard errors
(0.0606) (0.0024) (0.0318) (0.0138) (0.1947) (0.0159) (0.0044)
Restricted SUR standard errors
(0.0337) (0.0012) (0.0159) (0.0061) (0.1129) (0.0089) (0.0025)
Panel B: IMF capital account liberalization (95 countries)
�0.3081 �0.0079 �0.0060 0.0023 �0.3540 0.0929 0.0033 0.197
(0.0585) (0.0021) (0.0252) (0.0109) (0.1447) (0.0159) (0.0042)
�0.3085 �0.0085 �0.0004 �0.0028 �0.2667 0.0935 0.0117 0.0010 0.214
OLS standard errors
(0.0606) (0.0025) (0.0321) (0.0138) (0.2020) (0.0159) (0.0043) (0.0044)
Restricted SUR standard errors
(0.0339) (0.0012) (0.0163) (0.0062) (0.1165) (0.0090) (0.0026) (0.0020)
Panel C: Quinn sample (76 countries)
�0.2875 �0.0121 �0.0267 0.0107 �0.4709 0.0929 0.0247 0.266
(0.0645) (0.0023) (0.0332) (0.0122) (0.2366) (0.0171) (0.0078)
�0.2805 �0.0121 �0.0248 0.0065 �0.3759 0.0913 0.0102 0.0185 0.279
OLS standard errors
(0.0643) (0.0023) (0.0332) (0.0127) (0.2311) (0.0171) (0.0047) (0.0081)
Restricted SUR standard errors
(0.0395) (0.0013) (0.0192) (0.0066) (0.1467) (0.0102) (0.0028) (0.0048)
G.
Bek
aert
eta
l./
Jo
urn
al
of
Fin
an
cial
Eco
no
mics
77
(2
00
5)
3–
55
20

ARTICLE IN PRESS
Table 5
Equity market and capital account liberalization. The dependent variable is the overlapping five-year
average growth rate of real per capita gross domestic product (GDP). In addition to the control variables,
we report the coefficient on the official Liberalization Indicator that takes a value of one when the equity
market is liberalized, and zero otherwise. The First Sign liberalization indicator takes the value of one after
the first of the following events: the Official Liberalization date, the introduction of an American
Depository Receipt, or the introduction of a country fund. The Liberalization Intensity is the ratio of the
market capitalizations for the International Finance Corporation’s investables and global indices. The
International Monetary Fund (IMF) capital account liberalization indicator takes on a value of zero if the
country has at least one reported capital account restriction; these regressions cover 95 countries. In Panel
B, the Quinn capital account liberalization indicator takes a value between one and zero depending upon
the intensity of the reported capital account liberalization or openness; these regressions cover 76
countries. All standard errors (in parentheses) provide a correction for cross-sectional heteroskedasticity
and account for the overlapping nature of the data.
(1) (2) (3) (4)
Panel A: Full sample (95 countries)
Constant �0.3277 �0.3240 �0.3370 �0.3267
(0.0286) (0.0278) (0.0288) (0.0287)
Initial log(GDP) �0.0082 �0.0082 �0.0086 �0.0083
(0.0010) (0.0010) (0.0011) (0.0011)
Gov/GDP �0.0144 �0.0102 �0.0135 �0.0142
(0.0131) (0.0122) (0.0131) (0.0133)
Secondary school enrollment 0.0004 �0.0019 �0.0003 0.0006
(0.0048) (0.0048) (0.0049) (0.0049)
Population growth �0.1911 �0.1874 �0.1923 �0.1935
(0.0774) (0.0753) (0.0776) (0.0783)
Log(life) 0.0975 0.0966 0.1007 0.0974
(0.0076) (0.0074) (0.0078) (0.0077)
Official Liberalization indicator 0.0097 0.0094
(0.0020) (0.0021)
First Sign liberalization indicator 0.0122
(0.0020)
Liberalization Intensity 0.0107
(0.0023)
IMF capital account openness 0.0010
indicator (0.0017)
Adjusted R2 0.207 0.215 0.206 0.207
(1) (2) (3) (4) (5)
Panel B: Quinn sample (76 countries)
Constant �0.2962 �0.2908 �0.3072 �0.2947 �0.2997
(0.0350) (0.0341) (0.0344) (0.0349) (0.0334)
Initial log(GDP) �0.0101 �0.0101 �0.0110 �0.0104 �0.0117
(0.0011) (0.0011) (0.0011) (0.0012) (0.0011)
G. Bekaert et al. / Journal of Financial Economics 77 (2005) 3–55 21

ARTICLE IN PRESS
Table 5 (continued )
(1) (2) (3) (4) (5)
Gov/GDP �0.0352 �0.0305 �0.0320 �0.0334 �0.0377
(0.0162) (0.0155) (0.0160) (0.0165) (0.0161)
Secondary school enrollment 0.0026 �0.0007 0.0008 0.0024 0.0037
(0.0050) (0.0049) (0.0050) (0.0052) (0.0054)
Population growth �0.4241 �0.4241 �0.4313 �0.4424 �0.4530
(0.1056) (0.1036) (0.1053) (0.1088) (0.1107)
Log(life) 0.0947 0.0933 0.0991 0.0948 0.0966
(0.0089) (0.0087) (0.0088) (0.0089) (0.0085)
Official Liberalization indicator 0.0120 0.0115 0.0077
(0.0022) (0.0022) (0.0023)
First Sign liberalization indicator 0.0149
(0.0021)
Liberalization Intensity 0.0147
(0.0025)
IMF capital account openness indicator 0.0020
(0.0017)
Quinn capital account openness indicator 0.0179
(0.0040)
Adjusted R2 0.270 0.286 0.271 0.270 0.284
G. Bekaert et al. / Journal of Financial Economics 77 (2005) 3–5522
The first two sets of estimates in Panels A and B in Table 5 show the results for theOfficial Liberalization and the First Sign indicator variables, respectively. The OLSresults in Table 3 were suggestive that these two specifications of the liberalizationvariable would produce similar results. This is confirmed in Table 5. In the sample of95 countries, the coefficient on the First Sign indicator is 1.22% compared with0.97% for the Official Liberalization indicator. In the smaller sample (76 countries),the First Sign coefficient is 1.49% compared with 1.20% for the OfficialLiberalization coefficient. The third set of estimates shows the results for theLiberalization Intensity variable. The magnitude and significance of this variable issimilar to the other two liberalization proxies. Indeed, in all six regressions, theliberalization coefficients are always significant with T-ratios exceeding 4.5. With theexception of the insignificant secondary school enrollment coefficient, the signs andmagnitudes of the coefficients on the control variables are stable across these threedefinitions of equity market liberalization.
3.3. Capital account versus equity market liberalization
The effect of capital account openness on economic growth is the topic ofconsiderable debate. Grilli and Milesi-Ferretti (1995), Kraay (1998), Rodrik (1998),and Edison et al. (2002a) claim that no correlation exists between capital account

ARTICLE IN PRESS
G. Bekaert et al. / Journal of Financial Economics 77 (2005) 3–55 23
liberalization and growth prospects. In contrast, Quinn (1997), Klein and Olivei(1999), and Quinn and Toyoda (2003) find a positive relation between capitalaccount liberalization and growth. Many papers, such as Edison et al. (2002b),Chandra (2003), and Arteta et al. (2003) find that the effect is mixed or fragile.Edwards (2001) finds a positive effect that is driven by the higher income countries inhis sample. Klein (2003) finds an inverted U-shaped effect: Capital accountliberalization has no impact on the poorest and the richest countries but asubstantial impact on the middle-income countries.We consider two measures of capital account openness in Tables 3–5: one from
IMF’s Annual Report on Exchange Arrangements and Exchange Restrictions
(AREAER) (see also Grilli and Milesi-Ferretti, 1995) and one following Quinn(1997) and Quinn and Toyoda (2003). The IMF publication reports several categoriesof information, mostly on current account restrictions. The capital account opennessdummy variable takes on a value of zero if the country has at least one restriction inthe ‘‘restrictions on payments for the capital account transactions’’ category.3
The Quinn (1997) and Quinn and Toyoda (2003) capital account opennessmeasure is also created from the annual volume published by the IMF’s AREAER.In contrast to the IMF indicator that takes a value of zero if any restriction is inplace, Quinn’s openness measure is scored from 0 to 4, in half integer units, with 4representing a fully open economy. The measure facilitates a more nuanced view ofcapital account openness and is available for 76 countries in our study. Wetransformed each measure into a 0 to 1 scale. [See Eichengreen (2002) for a review ofthis and other measures.] Some summary statistics for both the IMF and Quinnvariables are presented in Appendix A.We begin with the fixed and time effects regressions in Table 3. In Panel B of Table
3, we find the coefficient on IMF capital account liberalization measure to beinsignificantly different from zero in the 40-country sample. The coefficient on theQuinn measure is large in both the fixed and time effects regressions (when estimatedseparately). However, in the regression that combines the fixed and time effects, theimpact is diminished.The last two parts of Table 3 consider larger samples. With our full set of 95
countries, capital account openness according to the IMF measure has no significanteffect on growth. When measured using the Quinn measure (76 countries), themagnitude of the coefficients is large when fixed and time effects are consideredseparately, but small and insignificant when the effects are combined.4 The evidencesuggests that measuring capital account openness at a finer level as Quinn (1997)does leads to stronger growth effects than using the standard measure but the growtheffect does not survive the inclusion of fixed and time effects. Clearly, the effects ofequity market liberalization are less fragile.
3The IMF changed the reporting procedures in 1996 and included subcategories for capital account
restrictions (see the discussion in Miniane, 2004), but we follow the bulk of the literature in using the 0/1
variable.4We also estimated a regression with the IMF capital account liberalization measure in the identical
76-country sample as the Quinn measure. The results for this sample are similar to the 95 country results.
ARTICLE IN PRESS
G. Bekaert et al. / Journal of Financial Economics 77 (2005) 3–5524
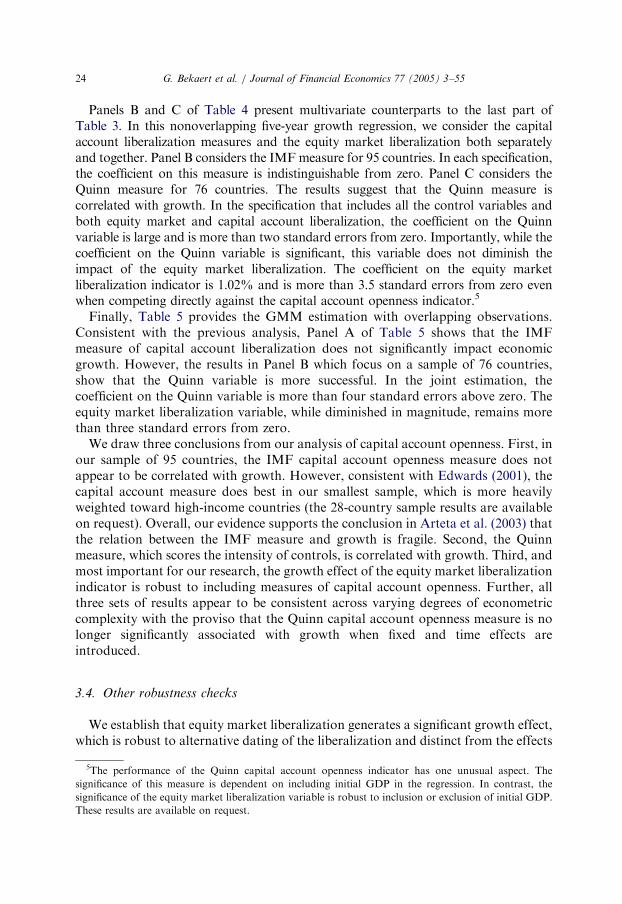
Panels B and C of Table 4 present multivariate counterparts to the last part ofTable 3. In this nonoverlapping five-year growth regression, we consider the capitalaccount liberalization measures and the equity market liberalization both separatelyand together. Panel B considers the IMFmeasure for 95 countries. In each specification,the coefficient on this measure is indistinguishable from zero. Panel C considers theQuinn measure for 76 countries. The results suggest that the Quinn measure iscorrelated with growth. In the specification that includes all the control variables andboth equity market and capital account liberalization, the coefficient on the Quinnvariable is large and is more than two standard errors from zero. Importantly, while thecoefficient on the Quinn variable is significant, this variable does not diminish theimpact of the equity market liberalization. The coefficient on the equity marketliberalization indicator is 1.02% and is more than 3.5 standard errors from zero evenwhen competing directly against the capital account openness indicator.5
Finally, Table 5 provides the GMM estimation with overlapping observations.Consistent with the previous analysis, Panel A of Table 5 shows that the IMFmeasure of capital account liberalization does not significantly impact economicgrowth. However, the results in Panel B which focus on a sample of 76 countries,show that the Quinn variable is more successful. In the joint estimation, thecoefficient on the Quinn variable is more than four standard errors above zero. Theequity market liberalization variable, while diminished in magnitude, remains morethan three standard errors from zero.We draw three conclusions from our analysis of capital account openness. First, in
our sample of 95 countries, the IMF capital account openness measure does notappear to be correlated with growth. However, consistent with Edwards (2001), thecapital account measure does best in our smallest sample, which is more heavilyweighted toward high-income countries (the 28-country sample results are availableon request). Overall, our evidence supports the conclusion in Arteta et al. (2003) thatthe relation between the IMF measure and growth is fragile. Second, the Quinnmeasure, which scores the intensity of controls, is correlated with growth. Third, andmost important for our research, the growth effect of the equity market liberalizationindicator is robust to including measures of capital account openness. Further, allthree sets of results appear to be consistent across varying degrees of econometriccomplexity with the proviso that the Quinn capital account openness measure is nolonger significantly associated with growth when fixed and time effects areintroduced.
3.4. Other robustness checks
We establish that equity market liberalization generates a significant growth effect,which is robust to alternative dating of the liberalization and distinct from the effects
5The performance of the Quinn capital account openness indicator has one unusual aspect. The
significance of this measure is dependent on including initial GDP in the regression. In contrast, the
significance of the equity market liberalization variable is robust to inclusion or exclusion of initial GDP.
These results are available on request.
ARTICLE IN PRESS
G. Bekaert et al. / Journal of Financial Economics 77 (2005) 3–55 25
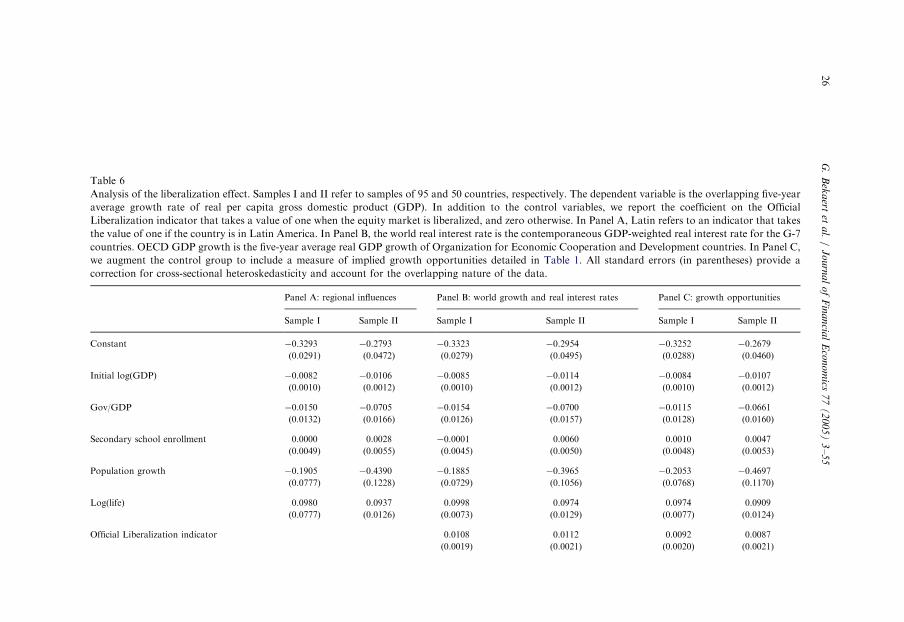
of capital account liberalization. Here, we conduct seven additional robustnesschecks. First, we compare Latin American liberalizations to non-Latin Americanliberalizations. The results in Panel A of Table 6 suggest that the Latin Americanregion is not driving the growth effect. Second, we control for variation in the worldbusiness cycle and interest rates. Panel B of Table 6 shows that, Organization forEconomic Cooperation and Development (OECD) economic growth exerts a strongpositive influence in our growth regression, but the liberalization effect is notdiminished by the inclusion of the business cycle variables. In each of our samples,the growth effect from liberalization increases once we add these variables. Third,consistent with our analysis in Table 3, we include time effects variables in the mainregression in Table 5, and no discernable impact is evident on the liberalizationcoefficients. Fourth, we estimate the regressions with three alternative growthhorizons: three, seven, and ten years. While the liberalization effect is present at allhorizons, this analysis suggests that most of the impact occurs in the first five yearsafter liberalization which is consistent with the convergence literature. (The seven-year horizon regressions suggest that 88% of the growth impact of a liberalizationtakes place in the first five years.) Fifth, we test the sensitivity of our results to settinginitial GDP at 1980 levels. As alternatives, we reset GDP to 1990 levels and alsoconsider using the initial GDP at the time when a country liberalizes. Again, theinference did not change. Sixth, we alter our assumptions about the weightingmatrix. In particular, we consider an estimation with restricted SUR effects and anestimation that imposed homoskedasticity with no SUR effects. The liberalizationresult is resilient to such changes.6
Finally, we conduct a Monte Carlo analysis of the liberalization effect. For eachreplication, we draw 95 uniform random numbers and randomly assign one of theexisting liberalization dummies to each country. We re-run the growth regressionwith the same control variables but with purely random liberalization events. Werepeat this experiment one thousand times. The 97.5th percentile of the distributionshows a coefficient of 0.0057 and a T-statistic of 3.25 as reported in Appendix B.This is well below our estimated coefficient of 0.0097 and T-statistic of 4.8 reportedin Table 5. Hence, the empirical P-value is less than 0.001. The Monte Carloevidence shows that the impact of the liberalization indicator is not a statisticalartifact and not simply associated with the clustering of liberalizations in the late1980s and early 1990s. It also shows that a standard T-test could slightly over-rejectat asymptotic critical values, which we should take into account in our inference.
3.5. Endogeneity
As with the effect of financial development on growth, endogeneity issues loomlarge. Is the liberalization decision an exogenous political decision, or do countriesliberalize when they expect improved growth opportunities? These concerns arehighly relevant for countries that join a free market area, such as Spain and Portugalin the European Union, in which membership simultaneously requires relaxing
6A full record of the results of the robustness checks is available on request.
ARTIC
LEIN
PRES
S
Table 6
Analysis of the liberalization effect. Samples I and II refer to samples of 95 and 50 countries, respectively. The dependent variable is the overlapping five-year
average growth rate of real per capita gross domestic product (GDP). In addition to the control variables, we report the coefficient on the Official
Liberalization indicator that takes a value of one when the equity market is liberalized, and zero otherwise. In Panel A, Latin refers to an indicator that takes
the value of one if the country is in Latin America. In Panel B, the world real interest rate is the contemporaneous GDP-weighted real interest rate for the G-7
countries. OECD GDP growth is the five-year average real GDP growth of Organization for Economic Cooperation and Development countries. In Panel C,
we augment the control group to include a measure of implied growth opportunities detailed in Table 1. All standard errors (in parentheses) provide a
correction for cross-sectional heteroskedasticity and account for the overlapping nature of the data.
Panel A: regional influences Panel B: world growth and real interest rates Panel C: growth opportunities
Sample I Sample II Sample I Sample II Sample I Sample II
Constant �0.3293 �0.2793 �0.3323 �0.2954 �0.3252 �0.2679
(0.0291) (0.0472) (0.0279) (0.0495) (0.0288) (0.0460)
Initial log(GDP) �0.0082 �0.0106 �0.0085 �0.0114 �0.0084 �0.0107
(0.0010) (0.0012) (0.0010) (0.0012) (0.0010) (0.0012)
Gov/GDP �0.0150 �0.0705 �0.0154 �0.0700 �0.0115 �0.0661
(0.0132) (0.0166) (0.0126) (0.0157) (0.0128) (0.0160)
Secondary school enrollment 0.0000 0.0028 �0.0001 0.0060 0.0010 0.0047
(0.0049) (0.0055) (0.0045) (0.0050) (0.0048) (0.0053)
Population growth �0.1905 �0.4390 �0.1885 �0.3965 �0.2053 �0.4697
(0.0777) (0.1228) (0.0729) (0.1056) (0.0768) (0.1170)
Log(life) 0.0980 0.0937 0.0998 0.0974 0.0974 0.0909
(0.0777) (0.0126) (0.0073) (0.0129) (0.0077) (0.0124)
Official Liberalization indicator 0.0108 0.0112 0.0092 0.0087
(0.0019) (0.0021) (0.0020) (0.0021)
G.
Bek
aert
eta
l./
Jo
urn
al
of
Fin
an
cial
Eco
no
mics
77
(2
00
5)
3–
55
26

ARTIC
LEIN
PRES
S
Official Liberalization indicator (Latin) 0.0065 0.0052
(0.0041) (0.0051)
Official Liberalization indicator (not Latin) 0.0100 0.0098
(0.0022) (0.0022)
OECD GDP growth (contemporaneous) 0.5049 0.6552
(0.0846) (0.0942)
World real interest rate (contemporaneous) �0.2240 �0.1734
(0.0670) (0.0735)
Growth opportunities 0.0106 0.0122
(0.0038) (0.0039)
Adjusted R2 0.207 0.225 0.216 0.221 0.211 0.209
G.
Bek
aert
eta
l./
Jo
urn
al
of
Fin
an
cial
Eco
no
mics
77
(2
00
5)
3–
55
27

ARTICLE IN PRESS
G. Bekaert et al. / Journal of Financial Economics 77 (2005) 3–5528
capital controls and favorable growth conditions. However, such liberalizations arerare in our sample.Addressing endogeneity concerns in this context is difficult because finding a
suitable instrument for liberalization is nearly impossible. Instead, we try to directlycontrol for growth opportunities. However, this is a formidable task. Any localvariable that is correlated with growth opportunities could indicate an increase ingrowth opportunities because of the planned equity market liberalization. Hence,including the growth opportunity variable into the regression is not informative.Following Bekaert et al. (2004b), our approach is to look for exogenous growthopportunities.More specifically, we view each country as composed of a set of industries with
time-varying growth opportunities and assume that these growth prospects arereflected in the price to earnings (PE) ratios of global industry portfolios. We thencreate an implied measure of country-specific growth opportunities that reflects thegrowth prospects for each industry (at the global level) weighted by the industrialcomposition for each country. We construct an annual measure of the three-digitStandard Industrial Classification (SIC) industry composition for each country by itsoutput shares according to the United National Industrial Development Organiza-tion (UNIDO) Industrial Statistics Database. For each SIC code, we also measureprice-earnings ratios for that industry at the global level, from which we construct animplied measure of growth opportunities for each country by weighting each globalindustry PE ratio by its relative share for that country. We divide this measure by theoverall world market PE ratio to remove the world discount rate effect, and we alsomeasure this variable relative to its past five-year moving average. We call thedifference ‘‘growth opportunities’’ (GO).
GOi;t ¼ ‘nIPEt � w0
i;t
WDPEt
� ��
1
60
Xt�1s¼t�60
‘nIPEs � w0
i;s
WDPEs
� �; (4)
where IPEt is a vector of global industry price-earning ratios,7 wi;t is a vector ofcountry-specific industry weights, and WDPEt is the price-earning ratio of the worldmarket.When we introduce this variable into a growth regression, Panel C of Table 6
shows that it predicts growth but does not drive out the liberalization effect. The factthat the GO measure is significant in the regressions indicates that it is a goodmeasure of growth opportunities. Comparing the growth effect of liberalization inthis regression (0.92%) with the original effect in Table 5 (0.97%), both thecoefficient and its statistical significance are essentially unchanged. Whereas thisanalysis perhaps does not completely resolve the endogeneity problem, it does giveus more confidence that our results are not being driven by an endogeneity issue.
7All price-earnings ratios are taken from Datastream. We use the December value for our annual
measures. The Datastream world market is the value-weighted sum of the global industry portfolios.

ARTICLE IN PRESS
G. Bekaert et al. / Journal of Financial Economics 77 (2005) 3–55 29
4. Accounting for the liberalization effect
Our growth effect is surprisingly large. One potential interpretation is that reformsare multifaceted. Countries could liberalize equity markets at the same time as theyremove restrictions on foreign exchange, deregulate the banking system, andundertake steps to develop the equity market. In this section, we introduce proxiesfor other contemporaneous reforms into the main regressions.We investigate three types of reforms: macro-reforms, financial reforms, and legal
reforms. We do not have sufficient information to determine the exact time lines ofreforms for all our countries in most instances. Consequently, we follow an indirectapproach by inserting as control variables into our growth regression continuousvariables that measure the direct effect of the reforms. An example would be the levelof inflation for macro-reforms. The third bloc of variables examined in Table 2 ismade up of the variables used in this section. Table 2 shows that, in most instances,these variables change in the required direction after an equity liberalization and thatliberalized economies score better on measures of macroeconomic stability, financialdevelopment and rule of law. This is an indication of the potential simultaneity ofreforms directly affecting these variables, on the one hand, and equity marketliberalization, on the other hand, or perhaps equity market liberalization contributesto a better macroeconomic environment, promotes financial development, orinstigates legal reforms that improve the legal environment. In fact, Rajan andZingales (2003) point out that financial development may be blocked by groups(incumbents) interested in maintaining their monopoly position (in goods andcapital markets). They argue that this is less likely to be the case if the country hasopen trade and free capital flows and hence financial openness may instigate otherreforms.If there are simultaneous reforms, the introduction of these continuous variables
into our regression is likely to drive out the liberalization effect, which is a coarsemeasurement of the extent and quality of the reforms. We do have detailed time-lineinformation on one type of reform: the introduction of insider trading rules and theirenforcement. We examine whether these reforms impact growth. Finally, weconjecture that a big reform package is likely after a major financial crisis, such as abanking crisis, and use information on the timing of banking crises to create anothercontrol for reform simultaneity effects.
4.1. Macroeconomic reforms
Mathieson and Rojaz-Suarez (1993) and Henry (2000) discuss how policy reforms,including equity market liberalization, in developing countries typically involvedomestic macro-reforms. We consider three variables that proxy for macroeconomicreforms: trade openness, the level of inflation, and the black market foreign exchangepremium.Our measure of trade openness is the ratio of exports plus imports to GDP. The
effect of trade integration and trade liberalization on growth is the subject of a largeliterature. Dollar (1992), Lee (1993), Edwards (1998), Sachs and Warner (1995), and

ARTICLE IN PRESS
G. Bekaert et al. / Journal of Financial Economics 77 (2005) 3–5530
Wacziarg (2001) establish that lower barriers to trade induce higher growth.Rodriguez and Rodrik (2001) criticize these studies on many grounds. However,Rodriguez and Rodrik primarily question whether trade policy instead of tradevolume has affected growth. In our study, we are interested in the effect of financialmarket liberalization not in testing the impact of trade policy. The results in Table 7,Panel A, show that, in both samples (95 and 50 countries, respectively), thecoefficient on trade openness is highly significant and positive, suggesting countriesthat are open have higher growth than countries that are relatively closed.Barro (1997a, b) finds a significant negative relation between inflation and
economic growth and concludes that the result primarily stems from a strongnegative relation between very high inflation rates (over 15%) and economic growth.We use the natural logarithm of one plus the inflation rate to diminish the impact ofsome outlier observations. Given that the extreme skewness in inflation primarilyresults from inflation in Latin American countries, we also introduce a dummy forLatin America.The results in Table 7 for the inflation variable are mixed. We find that three of the
four coefficients on inflation are not significantly different from zero. Inflation isnever significant for the Latin American countries. In one of the non-Latin Americansamples, the sign is positive and significant for Sample I. We also estimate aregression without the Latin American indicator. The coefficient on the singleinflation variable is not significantly different from zero. We also consider aregression with dummies for Brazil and Argentina only, the largest outliers ininflation data. Here, we find negative but insignificant coefficients, whereas the effectfor Argentina and Brazil is negative and significant.8
We also examine the effect of introducing black market foreign exchangepremiums. The black market premium is taken from Easterly (2001). This variablemeasures the premium market participants must pay, relative to the official exchangerate, to exchange the domestic currency for dollars in the parallel market. The blackmarket premium is often used as an indicator of macroeconomic imbalances andwould consequently be sensitive to macro-reforms. It is also a direct indicator of theexistence of foreign exchange restrictions, and it should therefore not be surprisingthat it is closely correlated with market integration and equity market liberalization(see, for instance, Bekaert, 1995). Hence the black market premium could also be aninverse indicator of the quality and comprehensiveness of the equity marketliberalization. Table 2 shows that the black market premium substantially decreasesfrom a pre-liberalization level of 0.150 to a post-liberalization premium of 0.072. Aswith the inflation indicator, we use the natural logarithm of one plus the blackmarket premium to dampen the influence of outliers. The results in Table 7 showthat the premium has a strong negative relation to economic growth in our samples.The regression reported in Panel A of Table 7 shows that the liberalization
coefficient decreases by about 25 basis points but remains significantly different fromzero. For example, in Sample I, the coefficient is reduced from 0.97% (Table 5) to0.74% but remains significantly different from zero. Hence, our results indicate that
8These results are available on request.

ARTIC
LEIN
PRES
S
Table 7
The influence of the reform environment on liberalization. Samples I and II refer to samples of 95 and 50 countries, respectively. We report analysis from a
regression that has the overlapping five-year average growth rate of real per capita gross domestic product (GDP) as the dependent variable. In addition to the
control variables, we report the coefficients for the Official Liberalization indicator, which takes a value of one when the equity market is liberalized, and zero
otherwise. In Panel A, we augment the control group to include the openness of the trade sector measured by the sum of exports plus imports divided by GDP,
the log of one plus the level of inflation and the log of one plus the level of the black market premium for foreign exchange. In Panel B, we consider financial
development variables: the ratio of private credit to GDP, which is a banking development indicator, and the value of trading scaled by market capitalization.
In Panel C, we consider law and order (higher values denoting improvements, rescaled to fall between zero and one) taken from the International Country
Risk Guide (ICRG), and in Panel D, insider trading law and insider trading prosecution, which are indicators representing either the introduction of laws
prohibiting insider trading or actual prosecutions, respectively. For law and order, the * by Sample I denotes that this variable is available for only 75
countries. In Panel E, we include two indicators of banking crises: systemic and systemic and borderline. In the first case, we introduce a dummy variable that
is set to one during a banking crisis contemporaneously with the left-hand side variable. In the second case, we add a variable that takes on a value of one after
a banking crisis. All standard errors (in parentheses) provide a correction for cross-sectional heteroskedasticity and account for the overlapping nature of the
data.
Panel A: macroeconomic
reforms
Panel B: financial
development
Panel C: law and order Panel D: insider trading
Sample I Sample II Sample I Sample II Sample I� Sample II Sample I Sample II Sample I Sample II
Constant �0.3262 �0.1957 �0.3155 �0.2273 �0.3177 �0.2714 �0.3189 �0.2524 �0.3265 �0.2594
(0.0279) (0.0504) (0.0282) (0.0426) (0.0343) (0.0413) (0.0288) (0.0453) (0.0281) (0.0461)
Initial log(GDP) �0.0084 �0.0104 �0.0093 �0.0120 �0.0070 �0.0124 �0.0080 �0.0104 �0.0084 �0.0112
(0.0010) (0.0013) (0.0011) (0.0011) (0.0013) (0.0013) (0.0010) (0.0013) (0.0010) (0.0012)
Gov/GDP �0.0289 �0.0801 �0.0166 �0.0559 �0.0374 �0.0679 �0.0143 �0.0636 �0.0144 �0.0656
(0.0124) (0.0176) (0.0131) (0.0157) (0.0151) (0.0161) (0.0129) (0.0165) (0.0129) (0.0163)
Secondary school enrollment �0.0006 0.0050 �0.0005 0.0007 0.0019 0.0055 �0.0003 0.0026 0.0008 0.0051
(0.0051) (0.0058) (0.0049) (0.0051) (0.0051) (0.0056) (0.0049) (0.0056) (0.0047) (0.0050)
Population growth �0.1979 �0.6259 �0.1994 �0.6066 �0.2009 �0.4611 �0.1952 �0.5118 �0.1936 �0.5149
(0.0722) (0.1194) (0.0765) (0.1246) (0.0820) (0.1193) (0.0770) (0.1250) (0.0757) (0.1217)
G.
Bek
aert
eta
l./
Jo
urn
al
of
Fin
an
cial
Eco
no
mics
77
(2
00
5)
3–
55
31

ARTIC
LEIN
PRES
S
Table 7 (continued )
Panel A: macroeconomic
reforms
Panel B: financial
development
Panel C: law and order Panel D: insider trading
Sample I Sample II Sample I Sample II Sample I� Sample II Sample I Sample II Sample I Sample II
Log(life) 0.0970 0.0730 0.0957 0.0828 0.0937 0.0933 0.0950 0.0867 0.0976 0.0899
(0.0075) (0.0131) (0.0076) (0.0113) (0.0090) (0.0111) (0.0077) (0.0121) (0.0075) (0.0123)
Official Liberalization indicator 0.0074 0.0066 0.0077 0.0069 0.0090 0.0070 0.0087 0.0080 0.0088 0.0077
(0.0019) (0.0021) (0.0020) (0.0019) (0.0022) (0.0020) (0.0020) (0.0021) (0.0020) (0.0021)
Trade 0.0106 0.0100
(0.0014) (0.0017)
Logð1þ inflationÞ (Latin) �0.0006 0.0008
(0.0023) (0.0027)
Logð1þ inflationÞ (not Latin) 0.0092 0.0127
(0.0042) (0.0078)
Logð1þ black market premiumÞ �0.0092 �0.0067
(0.0018) (0.0032)
Private credit 0.0125 0.0084
(0.0031) (0.0032)
Turnover 0.0152
(0.0026)
ICRG law and order �0.0001 0.0020
(0.0007) (0.0008)
Insider trading law 0.0003 �0.0003
(0.0014) (0.0015)
Insidertrading prosecution 0.0032 0.0033
(0.0024) (0.0024)
Adjusted R2 0.265 0.276 0.207 0.262 0.209 0.228 0.209 0.231 0.209 0.235
G.
Bek
aert
eta
l./
Jo
urn
al
of
Fin
an
cial
Eco
no
mics
77
(2
00
5)
3–
55
32

ARTIC
LEIN
PRES
S
Panel E: banking crises
Sample I Sample II Sample I Sample II Sample I Sample II Sample I Sample II
Constant �0.3047 �0.2602 �0.3057 �0.2852 �0.3170 �0.2621 �0.3168 �0.2471
(0.0281) (0.0444) (0.0285) (0.0495) (0.0291) (0.0470) (0.0286) (0.0455)
Initial log(GDP) �0.0080 �0.0105 �0.0080 �0.0107 �0.0078 �0.0104 �0.0080 �0.0107
(0.0010) (0.0010) (0.0010) (0.0011) (0.0010) (0.0012) (0.0010) (0.0012)
Gov/GDP �0.0211 �0.0745 �0.0178 �0.0652 �0.0128 �0.0648 �0.0127 �0.0611
(0.0129) (0.0150) (0.0133) (0.0161) (0.0124) (0.0160) (0.0125) (0.0156)
Secondary school enrollment 0.0010 0.0022 0.0012 0.0011 0.0007 0.0041 0.0010 0.0040
(0.0049) (0.0054) (0.0049) (0.0057) (0.0047) (0.0053) (0.0046) (0.0050)
Population growth �0.1896 �0.4666 �0.1854 �0.4516 �0.1855 �0.4804 �0.1926 �0.5805
(0.0774) (0.1161) (0.0754) (0.1157) (0.0747) (0.1201) (0.0743) (0.1149)
Log(life) 0.0925 0.0901 0.0929 0.0971 0.0939 0.0891 0.0943 0.0861
(0.0075) (0.0118) (0.0077) (0.0132) (0.0078) (0.0126) (0.0077) (0.0122)
Official Liberalization indicator 0.0094 0.0084 0.0101 0.0081 0.0097 0.0087 0.0091 0.0076
(0.0021) (0.0020) (0.0019) (0.0021) (0.0020) (0.0021) (0.0020) (0.0021)
During systemic crisis �0.0072 �0.0085
(0.0014) (0.0015)
During systemic and borderline crisis �0.0081 �0.0126
(0.0011) (0.0013)
Post systemic crisis 0.0058 0.0022
(0.0019) (0.0027)
Post systemic and borderline crisis 0.0056 0.0062
(0.0014) (0.0017)
AdjustedR2 0.218 0.246 0.225 0.295 0.211 0.223 0.212 0.233
G.
Bek
aert
eta
l./
Jo
urn
al
of
Fin
an
cial
Eco
no
mics
77
(2
00
5)
3–
55
33

ARTICLE IN PRESS
G. Bekaert et al. / Journal of Financial Economics 77 (2005) 3–5534
part of the equity market liberalization effect is accounted for by these four differentproxies for macro-reforms.9
4.2. Financial reforms
Regulatory changes furthering financial development could occur simultaneouslywith the equity market liberalization. A significant literature studies the relationbetween financial development and growth with contributions as early as McKinnon(1973) and Patrick (1966). Rousseau and Sylla (1999, 2003) show that early U.S.growth in the 1815–1840 period and early growth in other countries was finance led.We examine two financial development indicators: the size of the banking sector andstock exchange trading activity.King and Levine (1993) study the impact of banking sector development on
growth prospects.10 Kaminsky and Schmukler (2002) study the timing and impact ofequity market, capital account, and banking reforms. Panel B of Table 7 examinesthe role of the banking sector by adding private credit to GDP to the growthregression. Private credit to GDP enters significantly in both samples.Atje and Jovanovic (1989), Demirguc--Kunt and Levine (1996), Demirguc- -Kunt
and Maksimovic (1996), and Levine and Zervos (1996, 1998a) examine the effect ofstock market development on economic growth. In Panel B, we also add, as anindependent variable, equity turnover (a measure of trading activity).11 Thisfinancial variable is available only for the 50-country sample. The results in Panel Bof Table 7 show that the coefficient on the turnover variable is positive andsignificant. This implies a positive relation between stock market development andeconomic growth, consistent with previous studies.In both samples, the liberalization effect is somewhat diminished. However, the
liberalization coefficient continues to be significantly different from zero. Clearly,equity market liberalization is more than just another aspect of more generalfinancial development, not deserving of special attention.
4.3. Legal environment
In a series of influential papers, La Porta et al. (1997, 1998, 1999, 2000) andDjankov et al. (2003) stress the cross-country differences in the legal environment
9We also considered a fourth policy variable, the size of the country’s fiscal deficit. Unfortunately, these
data were available only for the smallest of our samples. Edwards (1987) argues that financial openness
can be beneficial only when countries first have government finances under control. The coefficient on the
deficit variable is significant and negatively influences growth prospects. The coefficient on the equity
market liberalization remains significantly different from zero.10Jayaratne and Strahan (1996) find that banking deregulation led to higher regional economic growth
within the United States whereas Beck et al. (2000) and Levine et al. (2000) measure the growth effect of
the exogenous component of banking development.11We do not consider market capitalization to GDP because this variable is hard to interpret. Having a
measure of overall equity values in the numerator, it could simply be a forward-looking indicator of future
growth or it could be related to the cost of capital. In addition, Rousseau and Wachtel (2000) find market
capitalization to GDP to have a weaker impact than value traded in their cross-country analysis of growth.

ARTICLE IN PRESS
G. Bekaert et al. / Journal of Financial Economics 77 (2005) 3–55 35
(either laws or their enforcement) in general and the legal environment regardinginvestor protection in particular. Reforms improving investor protection couldpromote financial development (see La Porta et al. (1997) for a direct test) and hencegrowth. The recent literature on financing constraints suggests a concrete channelthrough which this could occur. If capital markets are imperfect, external capital islikely to be more costly than internal capital and a shortage of internal capital wouldreduce investment below first-best levels. Recent empirical work shows that financialdevelopment (see Rajan and Zingales, 1998; Love, 2003) and the liberalization of thebanking sector (Laeven, 2003) could help relax these financing constraints andincrease investment. Financial liberalization would make available more foreigncapital, but this does not necessarily resolve the market imperfections that lead to awedge between the internal and external finance cost of capital. Reforms improvingcorporate governance and reducing the ability of insiders to extract resources fromthe firm could directly affect the external cost of capital. More generally, a betterlegal environment could increase steady state GDP. While the presence of foreigninvestors could promote financial reforms that help reduce financing constraints andthe external finance cost of capital premium, reforms improving the legalenvironment and investor protection perhaps are the real source of the improvedgrowth prospects.To examine this issue, we follow La Porta et al. (1997) and use a variable that
measures the rule of law in general, which is the rule of law subcomponent of theInternational Country Risk Guide (ICRG) political risk rating. Table 2 indicatesthat this variable significantly increases post-liberalization. When we add thismeasure to the growth regression (see Panel C of Table 7), the growth effect of equitymarket liberalization slightly increases for Sample I, but decreases 18 basis points inSample II. In Sample II, law and order generates small but significant growth effects.Second, we use the insider trading law dummies created by Bhattacharya and
Daouk (2002). They argue that the enforcement of insider trading laws makesdeveloping markets more attractive to international investors. They present evidencethat associates insider trading laws with a lower cost of capital in a sample of 95countries. Bhattacharya and Daouk distinguish between the enactment of insidertrading laws and the enforcement of these laws.Insider trading laws, and especially their enforcement, could be closely related to
the corporate governance problems that lead to the external finance premium.Enforcement of insider trading laws could be a good instrument for reduced externalfinancing constraints. It is possible that the enactment of such rules are particularlyvalued and perhaps demanded by foreigners before they risk investing in emergingmarkets. The enforcement of insider trading laws could proxy for a more generalstate of law enforcement that could be correlated with policy reforms introducingequity market liberalization.Panel D of Table 7 examines the relation between the enactment and enforcement
of insider trading laws and economic growth. The existence of these laws has nosignificant relation to economic growth, as evidenced in the first set of results. Whilethe coefficients on insider trading prosecutions are also not significantly differentfrom zero, the coefficients are positive in both samples. Importantly, the equity
ARTICLE IN PRESS
G. Bekaert et al. / Journal of Financial Economics 77 (2005) 3–5536
market liberalization remains significantly different from zero in the presence of theinsider trading variable and drops by at most 11 basis points.12
4.4. Banking crises
A major crisis of an economic nature could induce a plethora of reforms, one ofwhich being an equity market liberalization.13 If this is the case, a crisis indicatorcould be a useful control for the policy simultaneity problem. Caprio and Klingebiel(2001) provide the necessary information to create such an indicator. They surveyand date banking crises for about 90 countries, differentiating between systemic andnonsystemic banking crises. A banking crisis can bias our regressions in two distinctways.First, if policy reforms are clustered right after a crisis, the presence of a crisis
negatively affects growth just before the reforms take place – biasing the growtheffect upward. We use a contemporaneous banking crisis dummy to control for thiseffect. Panel E of Table 7 shows that, in both samples and across the two definitions,growth is significantly lower during crisis times. However, the introduction of thecrisis dummy does not affect the magnitude of the equity market liberalization effect.Second, we control for policy simultaneity by adding a dummy variable for the
post-crisis period. The variable takes the value of one in the last year of the crisis andeach year afterward. In most samples, there is significantly higher economic growthin the post crisis period (either systemic or systemic/borderline). This is particularlytrue for the broader definition of crisis. The equity market liberalization effect,however, is largely unaffected by the inclusion of the post-banking crisis variable.Intuition would suggest that some of the increment to economic growth resulting
from an equity market liberalization could be attributed to simultaneous policyreforms. While the incremental growth resulting from a liberalization is smaller inthe presence of proxies for reforms, they do not subsume the equity marketliberalization effect.
5. Why do countries respond differently to liberalizations?
Equity market liberalization, or the more general reforms it could proxy for, likelydoes not have the same impact in every country. The growth effect should depend ontwo factors: how much additional investment the reforms generate (e.g., because thecost of capital goes down) and the efficiency of new investments. Countries with arelatively high physical and human capital stock, relatively efficient financialmarkets, good legal institutions, and so on, might see highly efficient investment and
12Bhattacharya and Daouk (2002) examine the differential impact of insider trading laws and financial
liberalizations on the cost of capital. While they find that both factors are important, the liberalization
effect is more prominent.13For example, Drazen and Easterly (2001) find that reforms are more likely to occur when inflation and
black market premiums are at extreme values. Kaminsky and Reinhart (1999) examine the interrelation
between banking and currency crises and financial liberalizations.
ARTICLE IN PRESS
G. Bekaert et al. / Journal of Financial Economics 77 (2005) 3–55 37
a large growth response. From a broad historical perspective, Acemoglu et al. (2003)argue that the quality of political institutions played an important role in howEuropean countries took advantage of Atlantic trade and were propelled to highergrowth. But one could also make the case that countries with relatively badinstitutions, an inefficient legal system, and serious corporate governance problemscould experience the largest drop in the cost of capital and generate larger investmentincreases. Overall, the signs of interaction effects between liberalization and domesticfactors are ex ante unclear.First, we provide an exploratory analysis of what differentiates the liberalization
effects across countries. Next, we follow La Porta et al. (1997, 1998, 1999, 2000) andconsider institutional factors that measure the quality of the legal environment bothoverall and specifically for equity investors.
5.1. Financial development
We explore the differences across countries in the equity market liberalizationeffect by breaking up the indicator variable into three pieces:
yi;tþk;t ¼ bQi;1980 þ g0Xi;t þ aLibFulli;t þ aLLibLowi;t
þ aHLibHighi;t þ dChari;t þ �i;tþk;k; ð5Þ
where LibFulli;t represents an indicator for countries that are fully liberalizedthroughout our sample; LibLowi;t denotes the countries that liberalize but have acharacteristic, such as financial development, that falls below the median of theliberalizing countries; and LibHighi;t is the analogous definition for countries with ahigher than median value of the characteristic. The regression also includes theown-effect of the characteristic, which is denoted by Chari;t: We report thecoefficients on the high and low characteristic indicators as well as a Wald testof whether the coefficients are significantly different. We also report the coefficienton the own effect.14
Table 2 suggests that financial development indicators substantially improve postequity market liberalizations. Table 8 shows that countries with a higher thanmedian private credit to GDP ratio experience significantly higher growth afterliberalization (1.05% for higher than average private credit to GDP and 0.48% forlow level of private credit to GDP). The results suggest that a strong banking systemprovides the foundation whereby a country can have a larger increment to growthfollowing an equity market liberalization. Table 8 shows similar results for our proxyfor the development of equity markets: turnover. If a country has less thanaverage turnover, then the effect of an equity market liberalization is a modest0.17%. Countries with more than median turnover experience an average 0.94%boost in growth.
14We also estimate, but do not report, a more complex specification whereby the characteristics are
interacted with the liberalization variables. Given that the results are similar, we elect to report the more
intuitive analysis.

ARTIC
LEIN
PRES
S
Table 8
Why does the growth effect from liberalizations differ across countries? For each interaction variable, we separately conduct regressions that have the five-year
average growth rate of real per capita gross domestic product (GDP) as the dependent variable. We include in the regressions the same control variables as
presented in Table 4. We also separate the liberalization effect for fully liberalized and liberalizing countries. For liberalizing countries, we estimate interaction
effects with the financial development, legal, and investment condition variables. We report the associated impact on GDP growth for a liberalizing country for
a low level (below the median of the associated interaction variable for liberalizing countries) and for a liberalizing country at a high level (above the median of
the associated interaction variable for liberalizing countries).
We provide the significance of a Wald test, for which the null hypothesis is that the high-low effects are equivalent. We also report the statistical significance
of the interaction coefficient; statistical significance is denoted by a * for 10%, ** for 5%, and *** for 1%. Significance levels are based on standard errors that
correct for cross-sectional heteroskedasticity and account for the overlapping nature of the data.
The financial development variables are the ratio of private credit to GDP and equity market turnover. The legal environment variables are legal origin
(English, French, or other), judicial efficiency, and the combined speed of the process to resolve a bounced check or tenant eviction (longer duration implies a
lower speed). The International Country Risk Guide (ICRG) political risk quality of institutions subcomponent is the sum of the following ICRG
subcomponents: corruption, law and order, and bureaucratic quality, detailed in Table 1. For all interaction indices, larger values denote improvements.
ICRGE is the ICRG economic risk indicator. The investment conditions variables are a measure of economic risk, the investment profile, anti-director
(minority shareholders) rights, creditor rights, and accounting standards. The number of countries for which the interaction variable is available is also
provided. Finally, some of the variables are available as time series, while others are only available in the cross section; we denote this in the time-series
available column.
Impact on growth resulting from
liberalization
Fully
liberalized
From low level of
variable
From high level
of variable
Direct effect of
interaction variable
Number of
countries
Time-series
available
Financial development
Private credit 0:0084�� 0.0048 0:0105��� 0:0116�� 95 Yes
Turnover 0:0134��� 0.0017 0:0094��� 0:0152��� 50 Yes
Legal environment
French versus English law 0:0072�� 0.0068 0:0124�� 95 No
Other versus English law 0:0072�� 0.0097 0.0124 95 No
Judicial efficiency 0:0105�� 0.0069 0.0099 0.0057 47 No
Speed of process (combined) 0.0065 0.0029 0.0084 �0.0002 69 No
Quality of institutions
ICRGP quality of institutions 0:0098�� 0.0045 0:0129�� �0.0003 75 Yes
Investment conditions or protection
ICRGE 0.0049 0.0071 0.0075 0:0696��� 75 Yes
Investment profile 0.0060 0.0019 0:0085��� 0:0210��� 75 Yes
Anti-director rights 0:0117�� 0.0018 0:0089�� 0:0084��� 47 No
Creditor rights 0:0102�� 0.0035 0.0089 0:0190��� 45 No
Accounting standards 0:0094�� 0.0004 0:0110��� 0.0058 39 No
G.
Bek
aert
eta
l./
Jo
urn
al
of
Fin
an
cial
Eco
no
mics
77
(2
00
5)
3–
55
38

ARTICLE IN PRESS
G. Bekaert et al. / Journal of Financial Economics 77 (2005) 3–55 39
The financial development results provide the following two insights. First, equitymarket liberalization adds something over and above the impact of a change in avariable that proxies for financial development (Table 7). Second, the level offinancial development matters. Liberalizations have a greater effect on economicgrowth if the country starts with above average financial development (Table 8).
5.2. Legal, investment and institutional environment
We look at a number of variables that proxy for the legal environment. We startwith the classification of legal systems based on their origins, in La Porta et al.(1997): English, French, and other. They argue that the type of legal regime is a goodproxy for the degree of investor protection. We use a measure of judicial efficiencyfrom La Porta et al. (1998), which is based on Business International Corporation’sassessment of the ‘‘efficiency and integrity of the legal environment as it affectsbusiness, particular foreign firms.’’ We also consider the Djankov et al. (2003)measure of the duration of the legal process, both for collection of bad checks andtenant eviction. They argue that this measure is a good instrument for judicialformalism, which is inversely related to court quality. One disadvantage of thesevariables is that they are purely cross-sectional. Liberalization and the presence offoreign investors might affect the legal system. Alternatively, foreign investors couldbe reluctant to invest in countries with poorly developed legal systems. We find someevidence in favor of the latter interpretation in that all the interaction effects arepositive.For example, according to the results in Table 8 the growth impact of a
liberalization is significantly greater for countries with English versus French legalorigins (1.24% versus 0.68%). Although English legal origins are associated withhigher growth than other legal origins, the difference is not statistically significant. Ahigher growth effect is associated with countries with a speedier judicial processes(0.84% for speedy and 0.29% for slow judicial processes), but the difference is notsignificant (the P-value is 0.14).The legal environment is only one aspect of the quality of institutions. Acemoglu
et al. (2002) argue that an institutional environment encouraging investment is moreimportant than geographic factors in explaining economic development. Toinvestigate the role of institutions, we construct a quality of institutions measureusing three sub-components of the ICRG political risk rating (see Table 1). Ourresults support Acemoglu, Johnson, and Robinson’s thesis. The growth prospectsfrom a liberalization are almost three times higher for countries with a higher thanmedian level of the quality of institutions index (1.29% versus 0.45%).Finally, we examine the state of the investment environment. First, using the
ICRG economic risk rating (which includes current level of GDP per capita,inflation, and current account and budget balances), we find that the current state ofthe economy has an insignificant impact on the heterogeneity of the growth effect.Second, we investigate the investment profile subcategory in the ICRG political riskratings (which includes contract viability, profit repatriation, and payment delays).We find a highly significant difference when sorting by this characteristic. Countries

ARTICLE IN PRESS
G. Bekaert et al. / Journal of Financial Economics 77 (2005) 3–5540
with better than average investment profiles experience a 0.85% increment in growthwhereas a lower than average profile shows only a 0.19% increase.We also use, following La Porta et al. (1997), direct proxies for investor
protection: anti-director rights, creditor rights and accounting standards. Countrieswith better shareholder rights or creditor rights or accounting standardsexperience higher economic growth. However, the effect for creditor rights is notsignificant at conventional levels. Some of these effects are striking. For example,the growth increment for countries with higher than average-rated accountingstandards is 1.1%; it is only 0.04% for countries with below average accountingstandards.Table 8 also includes information on the own effect of each characteristic.
Both of the financial development indicators have a positive effect in the regression,which is not surprising given the results in Table 7. The own effect for the speed ofthe judicial process is not significant at conventional significance levels. The currentstate of the economy has a strongly significant own effect along with the investmentprofile. Finally, all three of the investor protection variables have positiveown effects. However, the accounting standards effect is not significantly differentfrom zero.Our analysis of heterogeneity of the growth effect has a simple message. First,
not all countries experience the same increment to growth after equity marketliberalizations. Second, the countries that benefit the most in terms ofgrowth are those with higher than average financial development, Englishinstead of French or other legal origins, good institutions, a favorable investmentprofile for foreign direct and portfolio investors, and higher than average investorprotection.
6. Conclusions
Although substantial research has been conducted on the relation betweenfinancial development and economic growth, both the finance and developmentliterature lacks a comprehensive analysis of the effects of the equity marketliberalization process on economic growth.Our research demonstrates that equity market liberalization (allowing foreign
investors to transact in local securities and vice versa) did increase economic growth.We augment the standard set of variables used in economic growth research with anindicator variable for equity market liberalization. We find that equity marketliberalization leads to an approximate 1% increase in annual real per capita GDPgrowth and find this increase to be statistically significant. This result is robust to awide variety of experiments, including an alternative set of liberalization dates,different groupings of countries, regional indicator variables, business cycle effects,different weighting matrices for the calculation of standard errors, and four differenttime-horizons for measuring economic growth.The approximately 1% increment in real growth following an equity market
liberalization is surprisingly large. It is reasonable to expect that equity market

ARTICLE IN PRESS
G. Bekaert et al. / Journal of Financial Economics 77 (2005) 3–55 41
liberalizations are intertwined with both macroeconomic reforms and financialdevelopment. Our evidence to some degree supports this point of view. Importantly,after controlling for either macro-reforms, financial development, banking crises,legal reforms, or the ability of a country to enforce its laws, we still find a statisticallysignificant impact on economic growth from equity market liberalizations.Most of our specifications, by construction, force a common coefficient relating
liberalizations to growth in every country. It makes sense that there are country-specific deviations from the average. It is of great interest to investigate what mightmake a country have a greater (or lesser) response to a financial liberalization. In hisbook on trade openness, Rodrik (1999) argues that openness perhaps is not suitablefor all countries. Likewise financial liberalization perhaps does not bring theanticipated benefits depending on the strength of the domestic institutions and otherfactors. Whereas, in recent work, Edwards (2001) and Quinn and Toyoda (2003)suggest that the benefits of capital account liberalization are restricted to moredeveloped countries, we do not find the growth effect to depend positively ondevelopment levels. We do find that countries that are further along in terms offinancial development experience a larger than average boost from equity marketliberalization. In addition, countries with better legal systems, good institutions,favorable conditions for foreign investment, and investor protection generate largergrowth effects.Although our regressions are predictive, they reveal association not
causality. While our analysis describes a number of plausible channels throughwhich the liberalization effect could have occurred, the answer to the question‘‘Does’’ (not ‘‘Did’’) financial liberalization affect economic growth? remainsdifficult to answer definitively. Our broad cross-country growth results appearconsistent with scattered micro-evidence and event studies. Levine and Zervos(1998b) find that stock markets become more liquid following stock marketliberalizations in a study of 16 countries. Karolyi (1998) surveys a richADR literature, which shows that ADRs, which can be viewed as investmentliberalizations, lead to reduced costs of capital. Chari and Henry (2004) showthat individual firms experience reductions in the costs of capital post-equitymarket liberalization. Lins et al. (2005) show that firms from emerging marketslisting in the United States are able to relax financing constraints. Galindo et al.(2001) show that financial liberalization improves the efficiency of capital allocationfor firms in 12 developing countries. Gupta and Yuan (2003) show that industriesdepending more on external finance experience significantly higher growth followingliberalization and grow faster through the creation of new plants (instead ofinvesting in existing ones).Finally, we measure an average growth effect. There are potential costs.
For example, the distribution of the welfare gain is an important social issue.Das and Mohapatra (2003) show that the income share of the highest quintilerises at the cost of the middle income quintiles post liberalization. Many arguethat the cost of financial liberalization is increased economic growthvolatility. However, the empirical evidence in Bekaert et al. (2004a) casts doubt onthis view.

ARTIC
LEIN
PRES
S
Appendix A
Dating financial liberalization. The Official Liberalization dates, date of the first American Depository Receipt (ADR) issuance, and first country fund are based on Bekaert and
Harvey (2000), augmented to include ten additional emerging markets, plus Iceland, Japan, Malta, New Zealand, and Spain. The ADR announcement dates are from Miller (1999).
For South Africa, the first ADR introduction date is associated with the post-apartheid period. We ignore many ADRs from the early 1980s. All other countries are considered fully
liberalized (industrialized) with a * or fully segmented (less developed) with no entry from 1980 to 1997. Liberalization Intensity is the ratio of International Finance Corporation
(IFC) investable to global market capitalization. The numbers presented here are time-series averages for each country. International Monetary Fund (IMF) and Quinn capital
account openness measures are discussed in Table 1. The numbers presented here for the Quinn data are time-series averages for each country.
Country Official
Liberalization
First
ADR
First
country
fund
Liberalization
Intensity
(average)
IMF capital
account
openness
Quinn capital
account
openness
(average)
Reason for Official Liberalization dating
Algeria 0.000 0.132
Argentina 1989 1991 1991 0.508 1993– 0.361 Free repatriation of capital and remittance of
dividends and capital gains (November).
Australia * 1.000 * 0.694
Austria * 1.000 1993– 0.813
Bangladesh 1991 0.000 Purchases of Bangladesh shares and securities by
nonresidents, including nonresident Bangladeshis, in
stock exchange in Bangladesh were allowed, subject to
meeting procedural requirements (June).
Belgium * 1.000 * 0.847
Barbados 0.000 0.306
Benin 0.000
Botswana 1990 0.000 0.632
Brazil 1991 1992 1992 0.315 0.382 Foreign investment law changed. Resolution 1832
Annex IV stipulates that foreign institutions can now
own up to 49 of voting stock and 100% of nonvoting
stock. Economy ministers approved rules allowing
direct foreign investments; 15% tax on distributed
earnings and dividends but no tax on capital gains.
Foreign investment capital must remain in country for
six years as opposed to 12 years under previous law.
Bank debt restructuring agreement (May).
Burkina Faso 0.000
Cameroon 0.000
Canada * 1.000 * 0.910
G.
Bek
aert
eta
l./
Jo
urn
al
of
Fin
an
cial
Eco
no
mics
77
(2
00
5)
3–
55
42
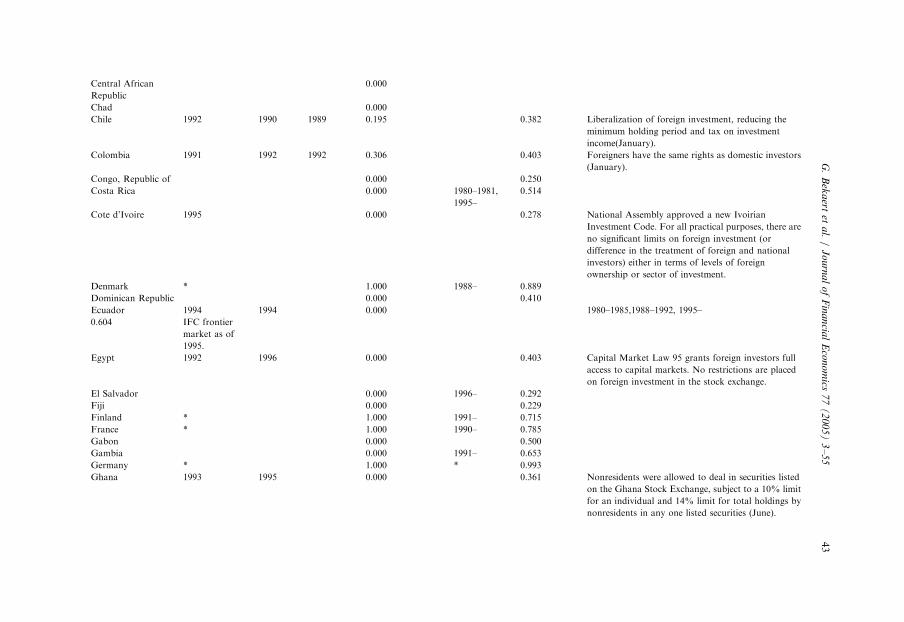
ARTIC
LEIN
PRES
S
Central African
Republic
0.000
Chad 0.000
Chile 1992 1990 1989 0.195 0.382 Liberalization of foreign investment, reducing the
minimum holding period and tax on investment
income(January).
Colombia 1991 1992 1992 0.306 0.403 Foreigners have the same rights as domestic investors
(January).
Congo, Republic of 0.000 0.250
Costa Rica 0.000 1980–1981,
1995–
0.514
Cote d’Ivoire 1995 0.000 0.278 National Assembly approved a new Ivoirian
Investment Code. For all practical purposes, there are
no significant limits on foreign investment (or
difference in the treatment of foreign and national
investors) either in terms of levels of foreign
ownership or sector of investment.
Denmark * 1.000 1988– 0.889
Dominican Republic 0.000 0.410
Ecuador 1994 1994 0.000 1980–1985,1988–1992, 1995–
0.604 IFC frontier
market as of
1995.
Egypt 1992 1996 0.000 0.403 Capital Market Law 95 grants foreign investors full
access to capital markets. No restrictions are placed
on foreign investment in the stock exchange.
El Salvador 0.000 1996– 0.292
Fiji 0.000 0.229
Finland * 1.000 1991– 0.715
France * 1.000 1990– 0.785
Gabon 0.000 0.500
Gambia 0.000 1991– 0.653
Germany * 1.000 * 0.993
Ghana 1993 1995 0.000 0.361 Nonresidents were allowed to deal in securities listed
on the Ghana Stock Exchange, subject to a 10% limit
for an individual and 14% limit for total holdings by
nonresidents in any one listed securities (June).
G.
Bek
aert
eta
l./
Jo
urn
al
of
Fin
an
cial
Eco
no
mics
77
(2
00
5)
3–
55
43

ARTIC
LEIN
PRES
S
Greece 1987 1988 1988 0.502 1996– 0.674 Liberalization of currency controls allowed foreigners
to participate in the equity market and to repatriate
their capital gains.
Guatemala 0.000 1989– 0.833
Guyana 0.000
Haiti 0.000 0.278
Honduras 0.000 1993–1995 0.563
Iceland 1991 0.389 0.285 First shares trade on the Iceland Stock Exchange.
India 1992 1992 1986 0.079 0.278 Government announces that foreign portfolio
investors will be able to invest directly in listed Indian
securities (September).
Indonesia 1989 1991 1989 0.228 1980–1995 0.632 Minister of finance allows foreigners to purchase up to
49% of all companies listing shares on the domestic
exchange excluding financial firms (September).
Iran 0.000 0.375
Ireland * 1.000 1992– 0.813
Israel 1993 1987 1992 0.000 1996– 0.438 Nonresidents allowed to deposit into nonresident
accounts all incomes receive from Israeli securities and
real estate even if these were purchased from sources
other than nonresident accounts (November).
Italy * 1.000 1990– 0.868
Jamaica 1991 1993 0.000 1996– 0.396 All inward and outward capital transfers were
permitted, except that financial institutions must
match their Jamaica dollar liabilities to their clients
with Jamaica dollar assets (September).
Japan 1983 * 0.944 * 0.667 Finance Ministry announces easing restrictions on
investments by stocks by foreigners (September).
Jordan 1995 1997 0.051 0.382 Foreign investment bylaws passed allowing foreign
investors to purchase shareswithout government
approval (December).
Appendix A (continued)
Country Official
Liberalization
First
ADR
First
country
fund
Liberalization
Intensity
(average)
IMF capital
account
openness
Quinn capital
account
openness
(average)
Reason for Official Liberalization
dating
G.
Bek
aert
eta
l./
Jo
urn
al
of
Fin
an
cial
Eco
no
mics
77
(2
00
5)
3–
55
44

ARTIC
LEIN
PRES
S
Kenya 1995 0.000 1996– 0.278 Restrictions on investment by foreigners in shares and
government securities were removed. The Capital
Market Authority Act was amended to allow foreign
equity participation of up to 40% of listed companies,
while individuals are allowed to own up to 5% of
listed companies (January).
Korea, Republic of 1992 1990 1984 0.067 0.479 Partial opening of the stock market to foreigners.
Foreigners can now own up to 10% of domestically
listed firms. Five hundred sixty-five foreign investors
registered with the Securities Supervisory Board
(January).
Kuwait 0.000
Lesotho 0.000
Madagascar 0.000
Malawi 0.000
Malaysia 1988 1992 1987 0.432 1980–1995 0.597 Budget calls for liberalization of foreign ownership
policies to attract more foreign investors (October).
Mali 0.000
Malta 1992 1998 0.333 Malta Stock Exchange was established by an act of
Parliament in 1990.
Mauritius 1994 0.000 1996– 0.535 The stock market was opened to foreign investors
following the lifting of exchange control. Foreign
investors do not need approval to trade shares, unless
investment is for the purpose of legal or management
control of a Mauritian company or for the holding of
more than 15% in a sugar company. Foreign investors
benefit from numerous incentives such as revenue on
sale of shares can be freely repatriated and dividends
and capital gains are tax-free.
Mexico 1989 1989 1981 0.462 1980–1981 0.479 Restrictions on foreign capital participation in new
direct foreign investments were liberalized
substantially.
Morocco 1988 1996 0.000 0.132 The repatriation of capital and income from the
investments into Morocco was granted (June).
Nepal 0.000 0.375
Netherlands * 1.000 * 0.958
New Zealand 1987 1983 0.611 1983– 0.826 Major reforms initiated in 1986.
Nicaragua 0.000 1996– 0.382
Niger 0.000 1995–
G.
Bek
aert
eta
l./
Jo
urn
al
of
Fin
an
cial
Eco
no
mics
77
(2
00
5)
3–
55
45

ARTIC
LEIN
PRES
S
Nigeria 1995 1998 0.000 0.389 Nigerian market was open to foreign portfolio
investment.
Norway 1.000 1995– 0.778
Oman 1999 0.000 * A stand-alone global index for Oman was added to
the Standard & Poor’s Emerging Market Indices,
which has a base date of December 31, 1998. S & P
tracks both global and investable indices for Oman.
Pakistan 1991 1994 1991 0.206 0.319 No restriction on foreigners or nonresident Pakistanis
purchasing shares of a listed company or subscribing
to public offerings of shares subject to some approvals
(November).
Paraguay 0.000 1982–1983,
1996–
0.438
Peru 1992 1994 0.300 1980–1983,
1993–
0.271 A Decree on the Private Sector Investment Guarantee
Regime was enacted, under which the rights and
guarantees that are accorded to domestic investors
would be extended to foreign investors (December).
Philippines 1991 1991 1987 0.292 0.278 Foreign Investment Act is signed into law. The Act
removes, over a period of three years, all restrictions
on foreign investments (June).
Portugal 1986 1990 1987 0.519 1993– 0.646 All restrictions on foreign investment removed except
for arms sector investments (July).
Rwanda 0.000 0.271
Saudi Arabia 1999 1997 0.000 * 0.750 The Ministry of Finance announced the
groundbreaking decision to allow non-Saudi investors
to own shares in the local market through mutual
funds (October).
Senegal 0.000 0.507
Sierra Leone 0.000 0.264
Singapore * 1.000 * 0.972
Appendix A (continued)
Country Official
Liberalization
First
ADR
First
country
fund
Liberalization
Intensity
(average)
IMF capital
account
openness
Quinn capital
account
openness
(average)
Reason for Official Liberalization
dating
G.
Bek
aert
eta
l./
Jo
urn
al
of
Fin
an
cial
Eco
no
mics
77
(2
00
5)
3–
55
46

ARTIC
LEIN
PRES
S
South Africa 1996 1994 1994 0.333 0.354 Restrictions on foreign membership in the
Johannesburgh Stock Exchange lifted.
Spain 1985 1988 0.722 1994– 0.681 Joins the European Economic Community, which
attracts an influx of foreign capital.
Sri Lanka 1991 1994 0.333 0.146 Companies incorporated abroad were permitted to
invest in securities traded at the Colombo Stock
Exchange, subject to the same terms and conditions as
those applicable to such investments by approved
national funds, approved regional funds, and
nonresident individuals (May).
Swaziland 0.000
Sweden * 1.000 1993– 0.806
Switzerland * 1.000 * 1.000
Syria 0.000 0.521
Thailand 1987 1991 1985 0.180 0.375 Inauguration of the Alien Board on Thailand’s Stock
Exchange. The Alien Board allows foreigners to trade
stocks of those companies that have reached their
foreign investment limits (September).
Togo 0.000
Trinidad and Tobago 1997 0.000 1994– 0.285 Under the Companies Ordinance and the Foreign
Investment Act, a foreign investor could purchase
shares in a local corporation. However, foreign
investors currently must obtain a license before they
can legally acquire more than 30% of a publicly held
company (April).
Tunisia 1995 1998 0.000 0.382 Inward portfolio investment was partially liberalized
(June).
Turkey 1989 1990 1989 0.675 0.333 Foreign investors were permitted to trade in listed
securities with no restrictions at all and pay no
withholding or capital gains tax provided they are
registered with the Capital Markets Board and the
Treasury (August).
United Kingdom * 1.000 * 1.000
United States * 1.000 * 1.000
Uruguay 0.000 1980–1992,
1996–
0.896
Venezuela 1990 1991 0.297 1980–1983,
1996–
0.639 Decree 727 opened foreign direct investment for all
stocks except bank stocks (January).
Zambia 0.000 1996–
Zimbabwe 1993 0.058 Zimbabwe Stock Exchange was open to foreign
portfolio investment subject to certain conditions
(June).
G.
Bek
aert
eta
l./
Jo
urn
al
of
Fin
an
cial
Eco
no
mics
77
(2
00
5)
3–
55
47

ARTICLE IN PRESS
G. Bekaert et al. / Journal of Financial Economics 77 (2005) 3–5548
Appendix B
Monte Carlo analysis of the liberalization effect. This table presents evidence from aMonte Carlo procedure (with one thousand replications) that mimics the generalizedmethod of moments (GMM) estimation presented in Table 2, for our largest sample of95 countries. The dependent variable is the five-year average growth rate of real percapita gross domestic product. The independent variables are the ones used in Table2, but the liberalization variable is randomized using the procedure documented in thetext. The weighting matrix we employ in our GMM estimation provides a correctionfor cross-sectional heteroskedasticity. We present the 2.5, 5.0, 50, 95, and 97.5 per-centile for the estimated coefficients and t-statistics on the liberalization coefficient.
R
andomized liberalization indicatorC
oefficient t -statisticMean
0.0000 0.03 Median 0.0002 0.16 2.50% � 0.0059 � 3.23 5.00% � 0.0052 � 2.95 95.00% 0.0048 2.94 97.50% 0.0057 3.25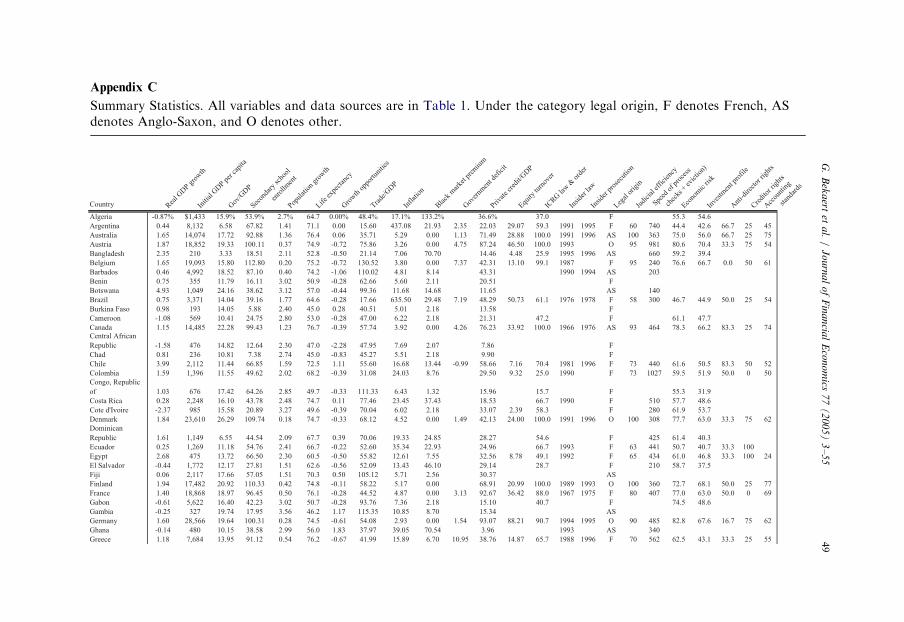
ARTIC
LEIN
PRES
S
Appendix C
Summary S gory legal origin, F denotes French, ASdenotes An
Country
law
& o
rder
Insi
der l
awIn
side
r pro
secu
tion
Legal
orig
inJu
dici
al e
ffic
ienc
y
Speed
of p
roce
ss
chec
ks +
evi
ctio
n)
Econo
mic
risk
Inve
stmen
t pro
file
Ant
i-dire
ctor
righ
ts
Cre
dito
r rig
hts
Acc
ount
ing
stan
dard
s
Algeria F 55.3 54.6
Argentina 1991 1995 F 60 740 44.4 42.6 66.7 25 45
Australia 1991 1996 AS 100 363 75.0 56.0 66.7 25 75
Austria 1993 O 95 981 80.6 70.4 33.3 75 54
Bangladesh 1995 1996 AS 660 59.2 39.4
Belgium 1987 F 95 240 76.6 66.7 0.0 50 61
Barbados 1990 1994 AS 203
Benin F
Botswana AS 140
Brazil 1976 1978 F 58 300 46.7 44.9 50.0 25 54
Burkina Faso F
Cameroon F 61.1 47.7
Canada 1966 1976 AS 93 464 78.3 66.2 83.3 25 74Central African
Republic F
Chad F
Chile 1981 1996 F 73 440 61.6 50.5 83.3 50 52
Colombia 1990 F 73 1027 59.5 51.9 50.0 0 50
Congo, Republic
of F 55.3 31.9
Costa Rica 1990 F 510 57.7 48.6
Cote d'Ivoire F 280 61.9 53.7
Denmark 1991 1996 O 100 308 77.7 63.0 33.3 75 62
Dominican
Republic F 425 61.4 40.3
Ecuador 1993 F 63 441 50.7 40.7 33.3 100
Egypt 1992 F 65 434 61.0 46.8 33.3 100 24
El Salvador F 210 58.7 37.5
Fiji AS
Finland 1989 1993 O 100 360 72.7 68.1 50.0 25 77
France 1967 1975 F 80 407 77.0 63.0 50.0 0 69
Gabon F 74.5 48.6
Gambia AS
Germany 1994 1995 O 90 485 82.8 67.6 16.7 75 62
Ghana 1993 AS 340
Greece 1988 1996 F 70 562 62.5 43.1 33.3 25 55
G.
Bek
aert
eta
l./
Jo
urn
al
of
Fin
an
cial
Eco
no
mics
77
(2
00
5)
3–
55
49
tatistics. All variables and data sources are in Table 1. Under the categlo-Saxon, and O denotes other.
Rea
l GD
P gro
wth
Initi
al G
DP p
er c
apita
Gov
/GD
PSec
onda
ry sc
hool
enro
llmen
tPop
ulat
ion
grow
thLife
exp
ecta
ncy
Gro
wth
opp
ortu
nitie
s
Trade
/GD
P
Infla
tion
Bla
ck m
arke
t pre
miu
m
Gov
ernm
ent d
efic
it
Privat
e cr
edit/
GD
P
Equity
turn
over
ICR
G
-0.87% $1,433 15.9% 53.9% 2.7% 64.7 0.00% 48.4% 17.1% 133.2% 36.6% 37.0
0.44 8,132 6.58 67.82 1.41 71.1 0.00 15.60 437.08 21.93 2.35 22.03 29.07 59.3
1.65 14,074 17.72 92.88 1.36 76.4 0.06 35.71 5.29 0.00 1.13 71.49 28.88 100.0
1.87 18,852 19.33 100.11 0.37 74.9 -0.72 75.86 3.26 0.00 4.75 87.24 46.50 100.0
2.35 210 3.33 18.51 2.11 52.8 -0.50 21.14 7.06 70.70 14.46 4.48 25.9
1.65 19,093 15.80 112.80 0.20 75.2 -0.72 130.52 3.80 0.00 7.37 42.31 13.10 99.1
0.46 4,992 18.52 87.10 0.40 74.2 -1.06 110.02 4.81 8.14 43.31
0.75 355 11.79 16.11 3.02 50.9 -0.28 62.66 5.60 2.11 20.51
4.93 1,049 24.16 38.62 3.12 57.0 -0.44 99.36 11.68 14.68 11.65
0.75 3,371 14.04 39.16 1.77 64.6 -0.28 17.66 635.50 29.48 7.19 48.29 50.73 61.1
0.98 193 14.05 5.88 2.40 45.0 0.28 40.51 5.01 2.18 13.58
-1.08 569 10.41 24.75 2.80 53.0 -0.28 47.00 6.22 2.18 21.31 47.2
1.15 14,485 22.28 99.43 1.23 76.7 -0.39 57.74 3.92 0.00 4.26 76.23 33.92 100.0
-1.58 476 14.82 12.64 2.30 47.0 -2.28 47.95 7.69 2.07 7.86
0.81 236 10.81 7.38 2.74 45.0 -0.83 45.27 5.51 2.18 9.90
3.99 2,112 11.44 66.85 1.59 72.5 1.11 55.60 16.68 13.44 -0.99 58.66 7.16 70.4
1.59 1,396 11.55 49.62 2.02 68.2 -0.39 31.08 24.03 8.76 29.50 9.32 25.0
1.03 676 17.42 64.26 2.85 49.7 -0.33 111.33 6.43 1.32 15.96 15.7
0.28 2,248 16.10 43.78 2.48 74.7 0.11 77.46 23.45 37.43 18.53 66.7
-2.37 985 15.58 20.89 3.27 49.6 -0.39 70.04 6.02 2.18 33.07 2.39 58.3
1.84 23,610 26.29 109.74 0.18 74.7 -0.33 68.12 4.52 0.00 1.49 42.13 24.00 100.0
1.61 1,149 6.55 44.54 2.09 67.7 0.39 70.06 19.33 24.85 28.27 54.6
0.25 1,269 11.18 54.76 2.41 66.7 -0.22 52.60 35.34 22.93 24.96 66.7
2.68 475 13.72 66.50 2.30 60.5 -0.50 55.82 12.61 7.55 32.56 8.78 49.1
-0.44 1,772 12.17 27.81 1.51 62.6 -0.56 52.09 13.43 46.10 29.14 28.7
0.06 2,117 17.66 57.05 1.51 70.3 0.50 105.12 5.71 2.56 30.37
1.94 17,482 20.92 110.33 0.42 74.8 -0.11 58.22 5.17 0.00 68.91 20.99 100.0
1.40 18,868 18.97 96.45 0.50 76.1 -0.28 44.52 4.87 0.00 3.13 92.67 36.42 88.0
-0.61 5,622 16.40 42.23 3.02 50.7 -0.28 93.76 7.36 2.18 15.10 40.7
-0.25 327 19.74 17.95 3.56 46.2 1.17 115.35 10.85 8.70 15.34
1.60 28,566 19.64 100.31 0.28 74.5 -0.61 54.08 2.93 0.00 1.54 93.07 88.21 90.7
-0.14 480 10.15 38.58 2.99 56.0 1.83 37.97 39.05 70.54 3.96
1.18 7,684 13.95 91.12 0.54 76.2 -0.67 41.99 15.89 6.70 10.95 38.76 14.87 65.7

Guatemala -0.30% $1,381 6.8% 21.8% 2.5% 60.2 0.06% 38.5% 14.4% 17.0% 16.8% 25.9 1996 F 500 60.7 42.6
Guyana 0.07 800 20.22 75.79 0.66 62.2 155.21 32.84 104.17 30.30 AS
13.49 F
30.40 33.3 1988 F 300 55.2 45.8
42.18 100.0 1989 O 315 65.4 52.3
28.07 41.83 43.5 1992 1996 AS 80 318 60.9 52.3 83.3 100 57
33.21 26.39 46.3 1991 1996 F 25 450 66.4 56.0 33.3 100
30.93 45.4 F 56.8 42.1
51.77 51.86 78.7 1990 AS 88 251 76.8 62.5 66.7 25
64.61 60.22 50.9 1981 1989 AS 100 725 64.4 48.1 50.0 100 64
52.66 31.94 86.1 1991 1996 F 68 1275 72.9 60.2 16.7 50 62
32.00 8.44 38.9 1993 AS 307 56.1 45.8
178.26 45.77 88.9 1988 1990 O 100 423 85.7 72.2 66.7 50 65
67.57 14.84 48.1 F 87 284 70.1 49.5 16.7
31.42 2.49 58.3 1989 AS 58 510 55.3 50.0 50.0 100
62.56 105.25 56.5 O 60 378 75.3 64.4 33.3 75 62
65.42 59.3 F 450 82.1 58.8
17.64 AS
16.63 F
13.40 40.7 AS 143 53.1 49.5
91.46 33.13 74.1 1973 1996 AS 90 360 78.8 57.4 66.7 100 76
15.12 F
69.44 1990 F 1275
33.04 1988 F
20.21 52.06 54.6 1975 F 60 463 56.1 56.0 16.7 0 60
31.20 8.26 51.9 1993 F 937 63.1 47.7
13.59 AS
89.93 40.75 100.0 1991 F 100 91 84.1 66.7 33.3 50 64
50.51 17.49 100.0 1988 AS 100 140 72.0 65.3 66.7 75 70
35.69 36.1 F 28.4 33.8
12.78 F
12.34 0.93 28.7 1979 AS 73 607 54.5 44.4 50.0 100 59
69.00 36.37 100.0 1985 1990 O 100 452 85.2 65.7 66.7 50 74
22.61 63.0 1989 1999 F 73.2 58.8
ARTIC
LEIN
PRES
S
G.
Bek
aert
eta
l./
Jo
urn
al
of
Fin
an
cial
Eco
no
mics
77
(2
00
5)
3–
55
50
Haiti -2.51 521 8.82 19.14 1.96 52.4 39.09 14.68 54.60
Honduras -0.35 626 13.38 33.57 3.06 64.7 0.11 67.52 12.54 21.68
Iceland 1.53 17,574 18.92 95.89 1.02 77.7 0.72 69.34 23.10 2.43
India 3.61 192 10.86 40.99 2.00 58.2 -0.33 19.11 8.76 10.52 6.42
Indonesia 4.89 371 9.37 43.00 1.79 59.6 0.11 49.90 10.07 6.13
Iran -0.43 1,986 14.33 53.98 2.65 64.3 -0.56 30.93 23.41 189.55
Ireland 4.25 8,245 16.47 102.06 0.46 74.3 0.17 115.84 5.50 0.00 6.01
Israel 2.08 10,482 32.70 82.81 2.40 75.4 -0.50 87.18 77.25 5.82
Italy 1.73 12,305 16.71 80.47 0.12 76.1 -0.56 43.66 8.90 0.00 10.49
Jamaica 0.01 1,849 15.87 63.70 1.08 72.5 0.78 111.29 23.84 20.26
Japan 2.52 22,962 9.53 96.54 0.47 78.3 -0.33 21.34 1.63 0.50 3.19
Jordan 0.04 1,002 25.92 52.26 4.16 67.1 -0.83 124.47 5.10 3.77
Kenya 0.05 310 17.32 23.12 3.25 56.2 0.44 58.89 11.64 18.46
Korea, Republic of 6.22 2,578 10.54 90.64 1.13 69.3 -0.56 67.58 7.46 1.59 0.70
Kuwait 0.60 25,246 29.91 74.49 1.85 73.9 -0.83 100.75 2.00 0.47
Lesotho 2.50 261 21.73 24.68 2.38 56.1 0.61 149.49 11.92 6.54
Madagascar -2.18 369 8.79 22.56 2.73 53.5 -0.78 39.88 19.20 17.65
Malawi -0.21 151 17.10 8.29 3.00 44.6 -0.11 57.51 21.69 35.03
Malaysia 4.15 1,777 14.53 55.11 2.65 69.6 0.72 140.04 3.24 1.04
Mali -0.34 214 11.81 7.82 2.60 46.0 52.18 6.75 3.12
Malta 4.06 2,564 18.56 82.04 0.22 75.0 -1.28 176.38 3.43 3.03
Mauritius 3.52 1,539 12.36 53.38 1.04 68.5 0.83 119.04 9.37 5.22
Mexico 0.45 2,766 9.54 55.62 1.99 69.3 -0.33 36.56 46.92 8.95 4.54
Morocco 1.33 876 16.68 34.90 2.03 62.0 -1.17 55.01 5.95 4.41
Nepal 1.81 151 8.78 30.22 2.54 52.0 1.67 39.26 10.28 23.44
Netherlands 1.62 18,729 15.44 116.95 0.59 76.7 -0.11 103.27 2.20 0.00 3.90
New Zealand 1.06 14,487 16.27 91.85 1.06 74.8 0.33 58.85 7.13 0.00
Nicaragua -0.40 1,040 24.85 41.17 2.79 62.7 0.22 66.23 1615.88 145.55
Niger -2.92 315 13.19 5.95 3.31 44.3 -2.78 44.61 5.03 2.24
Nigeria -0.95 329 13.55 30.19 2.98 48.5 -0.61 58.79 26.38 80.40
Norway 2.64 18,362 20.14 103.64 0.43 76.7 0.33 73.61 4.97 0.00 0.15
Oman 2.73 2,945 30.21 39.09 4.28 66.6 -0.33 88.54 1.81 1.65

Pakistan 2.86% $271 12.7% 20.3% 2.6% 58.0 -0.17% 35.0% 8.9% 11.0% 27.6% 21.7% 36.1 1995 AS 50 730 63.4 45.4 83.3 100 Paraguay 0.54 1,254 7.56 32.86 2.90 67.8 0.00 48.31 20.63 30.41 19.09 44.4 1999 F 424 59.1 62.0
14.28 26.9 1991 1994 F 68 687 50.4 43.5 50.0 0 3834.60 24.47 32.4 1982 F 48 328 59.4 38.4 50.0 0 6563.99 18.25 86.1 1986 F 55 750 74.3 50.0 50.0 25 367.18 O
61.59 70.4 1990 AS 74.9 59.3 29.64 36.1 F 490 61.3 53.2 3.75 49.1 AS 48.0 30.1
98.93 33.84 87.0 1973 1978 AS 100 106 82.2 66.7 66.7 100 7891.67 6.53 42.6 1989 AS 60 293 69.1 55.6 83.3 75 7075.57 38.36 76.9 1994 1998 F 63 330 73.3 66.7 66.7 50 6421.32 5.69 24.1 AS 70 1170 59.3 48.6 50.0 75 21.31 AS 80 95.85 33.16 100.0 1971 1990 O 100 350 76.8 62.5 50.0 50 83150.62 50.59 100.0 1988 1995 O 100 490 86.2 75.5 33.3 25 68
8.29 47.2 F 54.2 42.182.00 55.42 64.8 1984 1993 AS 33 840 74.4 56.5 33.3 75 6423.39 F
45.32 9.01 66.7 1981 AS 386 65.8 53.260.19 6.34 47.2 1994 F 40 64.8 48.118.47 46.01 54.6 1981 1996 F 40 405 56.4 50.9 33.3 50 5184.54 33.64 85.2 1980 1981 AS 100 216 71.8 63.4 83.3 100 7894.96 57.92 100.0 1934 1961 AS 100 103 76.8 71.8 83.3 25 7139.63 50.0 1996 F 65 690 62.3 53.7 33.3 50 3135.78 12.91 66.7 1998 F 65 720 63.2 44.9 16.7 4014.59 39.8 1993 AS 299 44.1 41.224.40 7.92 38.9 AS 75 394 51.7 43.1 50.0 100
ARTIC
LEIN
PRES
S
G.
Bek
aert
eta
l./
Jo
urn
al
of
Fin
an
cial
Eco
no
mics
77
(2
00
5)
3–
55
51
Peru -0.21 2,822 9.01 64.50 2.04 64.2 0.17 29.93 603.64 28.96Philippines -0.05 947 9.53 70.94 2.45 64.1 0.28 62.22 12.47 6.23Portugal 2.70 6,542 15.59 69.63 0.16 73.4 -0.67 68.49 13.49 5.10Rwanda -2.10 246 11.83 7.59 2.54 42.4 0.17 31.77 10.43 38.67Saudi Arabia -3.01 9,180 31.02 43.28 4.54 66.3 -0.83 83.78 0.65 1.10Senegal -0.23 584 15.48 14.60 2.72 48.3 -0.22 66.11 6.28 2.18Sierra Leone -3.95 317 11.58 17.49 2.24 35.4 0.78 35.88 50.35 59.54Singapore 5.63 9,045 10.32 65.29 1.86 73.7 0.44 370.31 3.40 1.22 -7.29South Africa -0.57 3,967 18.19 71.13 2.28 60.5 -0.56 50.83 12.94 1.96 4.80Spain 2.09 10,089 15.36 103.16 0.32 76.5 -0.39 40.97 7.80 2.73 4.79Sri Lanka 3.21 365 9.52 67.72 1.38 70.5 -0.17 71.42 11.92 12.74Swaziland 2.11 970 20.53 44.16 3.11 55.2 0.78 160.41 11.40 11.35Sweden 1.10 20,712 27.53 101.64 0.36 77.2 0.06 64.72 6.05 0.00 5.75Switzerland 0.84 38,763 13.71 97.86 0.61 77.2 -0.22 69.96 3.01 0.00 0.63Syria 0.99 784 17.28 51.00 3.17 65.0 -1.83 53.59 13.26 122.72Thailand 5.47 845 11.10 35.02 1.57 67.0 -1.00 67.11 5.10 0.23 0.60Togo -0.93 411 15.20 24.80 2.98 50.2 -1.56 85.85 6.85 2.18Trinidad and Tobago -0.08 3,154 16.12 77.87 1.14 70.2 -0.11 78.68 6.13 27.25Tunisia 1.89 1,309 16.39 43.41 2.19 65.4 -0.94 84.17 7.17 6.44Turkey 2.32 1,798 10.25 45.71 2.12 64.7 -0.28 34.07 61.16 5.51United Kingdom 1.76 13,028 21.33 97.75 0.27 75.2 -0.56 53.23 5.86 0.00 3.02United States 1.57 19,688 17.18 96.04 0.96 75.0 -0.33 20.76 4.54 0.00 3.44Uruguay 1.16 4,066 13.61 75.55 0.67 72.0 -0.39 42.67 56.00 9.15Venezuela -1.08 4,225 9.58 30.82 2.46 70.3 -0.06 49.13 34.13 34.42Zambia -1.73 682 20.40 22.08 2.95 49.5 -0.39 72.61 56.34 58.16Zimbabwe 0.98 721 19.09 40.17 2.91 55.7 -0.22 53.42 16.47 39.88 6.83

ARTICLE IN PRESS
G. Bekaert et al. / Journal of Financial Economics 77 (2005) 3–5552
References
Acemoglu, D., Johnson, S., Robinson, J., 2002. Reversal of fortune: geography and institutions
in the making of the modern world income distribution. Quarterly Journal of Economics 117,
1231–1294.
Acemoglu, D., Johnson, S., Robinson, J., 2003. The rise of Europe: Atlantic trade, institutional change,
and economic growth. Unpublished working paper, Massachusetts Institute of Technology,
Cambridge, MA.
Arteta, C.O., Eichengreen, B., Wyplosz, C., 2003. On the growth effects of capital account liberalization.
In: Helpman, E., Sadka, E. (Eds.), Economic Policy in the International Economy: Essays in Honor of
Assaf Razin. Cambridge University Press, Cambridge.
Atje, R., Jovanovic, B., 1989. Stock markets and development. European Economic Review 37, 632–640.
Barro, R.J., 1997a. Determinants of Economic Growth. MIT Press, Cambridge, MA.
Barro, R.J., 1997b. Determinants of economic growth: a cross-country empirical study. Discussion paper
579. Harvard Institute for International Development.
Barro, R., Sala-i-Martin, X., 1995. Economic Growth. McGraw-Hill, New York.
Beck, T., Levine, R., Loayza, N., 2000. Finance and sources of growth. Journal of Financial Economics
58, 261–300.
Bekaert, G., 1995. Market integration and investment barriers in emerging equity markets. World Bank
Economic Review 9, 75–107.
Bekaert, G., Harvey, C.R., 2000. Foreign speculators and emerging equity markets. Journal of Finance 55,
565–614.
Bekaert, G., Harvey, C.R., 2002. Chronology of important financial, economic and political events in
emerging markets. http://www.duke.edu/�charvey/chronology.htm.
Bekaert, G., Harvey, C.R., Lundblad, C., 2001. Emerging equity markets and economic development.
Journal of Development Economics 66, 465–504.
Bekaert, G., Harvey, C.R., Lundblad, C., 2004a. Growth volatility and financial liberalization.
Unpublished working paper, Duke University, Durham, North Carolina.
Bekaert, G., Harvey, C.R., Lundblad, C., Siegel, S., 2004b. Growth opportunities and market integration.
Unpublished working paper, Columbia University, New York.
Bhattacharya, U., Daouk, H., 2002. The world price of insider trading. Journal of Finance 57, 75–108.
Caprio Jr., G., Klingebiel, D., 2001. Bank insolvencies: cross-country experience. Unpublished Working
Paper 1620, World Bank, Washington, DC.
Caselli, F., Esquivel, G., Lefort, F., 1996. Reopening the convergence debate: a new look at cross-country
growth empirics. Journal of Economic Growth 1, 363–389.
Chandra, A., 2003. The influence of capital controls on long-run growth: where and how much?
Unpublished working paper, North Carolina State University, Raleigh, NC.
Chari, A., Henry, P.B., 2004. Risk sharing and asset prices: evidence from a natural experiment. Journal of
Finance 59, 1295–1324.
Das, M., Mohapatra, S., 2003. Income inequality: the aftermath of stock market liberalization in emerging
markets. Journal of Empirical Finance 10, 217–248.
Demirguc--Kunt, A., Levine, R., 1996. Stock market development and financial intermediaries: stylized
facts. World Bank Economic Review 10, 291–322.
Demirguc--Kunt, A., Maksimovic, V., 1996. Stock market development and financing choices of firms.
World Bank Economic Review 10, 341–370.
Devereux, M.B., Smith, G.W., 1994. International risk sharing and economic growth. International
Economic Review 35, 535–551.
Djankov, S., La Porta, R., Lopez-de-Silanes, F., Shleifer, A., 2003. Courts. Quarterly Journal of
Economics 118, 453–518.
Dollar, D., 1992. Outward-oriented developing countries really do grow more rapidly: evidence from 95
LDCs, 1976-85. Economic Development and Cultural Change 40, 523–544.
Drazen, A., Easterly, W., 2001. Do crises induce reform? Simple empirical tests of conventional wisdom.
Economics and Politics 13, 129–158.

ARTICLE IN PRESS
G. Bekaert et al. / Journal of Financial Economics 77 (2005) 3–55 53
Easterly, W., 2001. The lost decades: developing countries’ stagnation in spite of policy reform 1980–1998.
Journal of Economic Growth 6, 135–157.
Edison, H., Warnock, F., 2003. A simple measure of the intensity of capital controls. Journal of Empirical
Finance 10, 81–104.
Edison, H., Levine, R., Ricci, L.A., Slok, T.M., 2002a. International financial integration and economic
growth. Journal of International Money and Finance 21, 749–776.
Edison, H., Klein, M.W., Ricci, L.A., Slok, T.M., 2002b. Capital account liberalization and economic
performance: survey and synthesis. Unpublished Working Paper 9100, National Bureau of Economic
Research, Cambridge, MA.
Edwards, S., 1987. Sequencing of economic liberalization in developing countries. Finance and
Development 24, 26–29.
Edwards, S., 1998. Openness, productivity, and growth: what do we really know? Economic Journal 108,
383–398.
Edwards, S., 2001. Capital mobility and economic performance: are emerging economies different. In:
Siebert, H. (Ed.), The World’s New Financial Landscape: Challenges for Economic Policy. Springer,
Berlin, pp. 219–244.
Eichengreen, B., 2002. Capital account liberalization: what do the cross-country studies tell us? World
Bank Economic Review 15, 341–366.
Galindo, A., Schiantarelli, F., Weiss, A., 2001. Does financial liberalization improve the allocation of
investment. Unpublished working paper, Boston College, Boston, MA.
Gilchrist, S., Himmelberg, C., 1999. Investment, fundamentals and finance. In: Bernanke, B.S.,
Rotemberg, J. (Eds.), NBER Macroeconomics Annual 1998. National Bureau of Economic Research,
Cambridge, MA, pp. 223–274.
Grilli, V., Milesi-Ferretti, G.M., 1995. Economic effects and structural determinants of capital controls.
IMF Staff Papers 42, 517–551.
Gupta, N., Yuan, K., 2003. Financial dependence and growth: evidence from stock market liberalizations.
Unpublished working paper, University of Michigan, Ann Arbor, MI.
Hansen, L.P., Hodrick, R., 1980. Forward exchange rates as optimal predictors of future spot rates: an
econometric analysis. Journal of Political Economy 88, 829–853.
Henry, P.B., 2000. Stock market liberalization, economic reform, and emerging market equity prices.
Journal of Finance 55, 529–564.
Hubbard, G., 1997. Capital market imperfections and investment. Journal of Economic Literature 36,
193–225.
Islam, N., 1995. Growth empirics: a panel data approach. Quarterly Journal of Economics 107,
1127–1170.
Jayaratne, J., Strahan, P.E., 1996. The finance-growth nexus: evidence from bank branch deregulation.
Quarterly Journal of Economics 111, 639–670.
Kaminsky, G.L., Reinhart, C., 1999. The twin crises: the causes of banking and balance of payments
problems. American Economic Review 89, 473–500.
Kaminsky, G.L., Schmukler, S.L., 2002. Short-run pain, long-run gain: the effects of financial
liberalization. Unpublished working paper, George Washington University, Washington, DC.
Karolyi, A., 1998. Why do companies list their shares abroad? (A survey of the evidence and its
managerial implications), Salomon Brothers Monograph Series 7. New York University, New York.
King, R.G., Levine, R., 1993. Finance, entrepreneurship, and growth. Journal of Monetary Economics 32,
513–542.
Klein, M.W., 2003. Capital account openness and the varieties of growth experience. Unpublished
Working Paper 9500, National Bureau of Economic Research, Cambridge, MA.
Klein, M.W., Olivei, G., 1999. Capital account liberalization, financial depth and economic growth.
Unpublished Working Paper 7384, National Bureau of Economic Research, Cambridge, MA.
Kraay, A., 1998. In search of the macroeconomic effects of capital account liberalizations. Unpublished
working paper, World Bank, Washington, DC.
La Porta, R., Lopez-de-Silanes, F., Shleifer, A., Vishny, R.W., 1997. Legal determinants of external
finance. Journal of Finance 52, 1131–1150.

ARTICLE IN PRESS
G. Bekaert et al. / Journal of Financial Economics 77 (2005) 3–5554
La Porta, R., Lopez-de-Silanes, F., Shleifer, A., Vishny, R.W., 1998. Law and finance. Journal of Political
Economy 106, 1113–1155.
La Porta, R., Lopez-de-Silanes, F., Shleifer, A., Vishny, R.W., 1999. The quality of government. Journal
of Law, Economics, and Organization 15, 222–279.
La Porta, R., Lopez-de-Silanes, F., Shleifer, A., Vishny, R.W., 2000. Investor protection and corporate
governance. Journal of Financial Economics 58, 3–28.
Laeven, L., 2003. Does financial liberalization reduce financing constraints. Financial Management 32,
1–12.
Lee, J.W., 1993. International trade, distortions, and long-run economic growth. IMF Staff Papers 40,
299–328.
Levine, R., Renelt, D., 1992. A sensitivity analysis of cross-country growth regressions. American
Economic Review 82, 942–963.
Levine, R., Zervos, S., 1996. Stock market development and economic growth. World Bank Economic
Review 10, 323–340.
Levine, R., Zervos, S., 1998a. Stock markets, banks, and economic growth. American Economic Review
88, 537–558.
Levine, R., Zervos, S., 1998b. Capital control liberalization and stock market development. World
Development, 1169–1183.
Levine, R., Loayza, N., Beck, T., 2000. Financial intermediation and growth: causality and causes.
Journal of Monetary Economics 46, 31–77.
Lins, K., Strickland, D., Zenner, M., 2005. Do non-U.S. firms issue equity on U.S. exchanges to relax
capital constraints? Journal of Financial and Quantitative Analysis, forthcoming.
Love, I., 2003. Financial development and financing constraints: international evidence from the structural
investment model. Review of Financial Studies 16, 765–791.
Mankiw, N.G., 1995. The growth of nations. Brookings Papers on Economic Activity 1, 275–310.
Mathieson, D., Rojaz-Suarez, L., 1993. Liberalization of the capital account: experiences and issues.
Occasional paper 103. International Monetary Fund, Washington, DC.
McKinnon, R.I., 1973. Money and Capital in Economic Development. Brookings Institution,
Washington, DC.
Miller, D., 1999. The market reaction to international cross listings: evidence from depositary receipts.
Journal of Financial Economics 51, 103–123.
Miniane, J., 2004. A new set of measures on capital account restrictions. IMF Staff Papers 51, 276–308.
Patrick, H., 1966. Financial development and economic growth in underdeveloped countries. Economic
Development Cultural Change 14, 174–189.
Quinn, D., 1997. The correlates of changes in international financial regulation. American Political Science
Review 91, 531–551.
Quinn, D., Toyoda, A.M., 2003. Does capital account liberalization lead to economic growth? an
empirical investigation. Unpublished working paper, Georgetown University, Washington, DC.
Rajan, R.G., Zingales, L., 1998. Financial dependence and growth. American Economic Review 88,
559–586.
Rajan, R.G., Zingales, L., 2003. The great reversals: the politics of financial development in the 20th
century. Journal of Financial Economics 69, 5–50.
Rodriguez, F., Rodrik, D., 2001. Trade policy and economic growth: a skeptic’s guide to the cross-
national evidence. In: Bernanke, B.S., Rogoff, K.S. (Eds.), NBERMacroeconomics Annual 2000. MIT
Press, Cambridge, MA.
Rodrik, D., 1998. Who needs capital account convertibility? Princeton Essays in International Finance
207, 1–10.
Rodrik, D., 1999. Determinants of Economic Growth. Overseas Development Council, Washington, DC.
Rousseau, P.L., Sylla, R., 1999. Emerging financial markets and early U.S. growth. Unpublished Working
Paper 7448, National Bureau of Economic Research, Cambridge, MA.
Rousseau, P.L., Sylla, R., 2003. Financial systems economic growth and globalization. In: Bordo, M.D.,
Taylor, A.M., Williamson, J.G. (Eds.), Globalization in Historical Perspective. University of Chicago
Press, Chicago, IL, pp. 373–413.

ARTICLE IN PRESS
G. Bekaert et al. / Journal of Financial Economics 77 (2005) 3–55 55
Rousseau, P.L., Wachtel, P., 2000. Equity markets and growth: cross-country evidence on timing and
outcomes, 1980–1995. Journal of Banking and Finance 24, 1933–1958.
Sachs, J.D., Warner, A.M., 1995. Economic reform and the process of global integration. Brookings
Papers on Economic Activity, 1–118.
Stiglitz, J.E., 2000. Capital market liberalization, economic growth, and instability. World Development
25, 1075–1086.
Wacziarg, R., 2001. Measuring the dynamic gains from trade. World Bank Economic Review 15, 393–429.


![Market Structure and the Cost of Capital · (integration zero) and perfect integration [Bekaert and Harvey (1995), Carrieri et al. (2007) and Arouri et al. (2010,2012)]. Therefore,](https://img.pdfslide.us/doc/110x75/6134076adfd10f4dd73b7869/market-structure-and-the-cost-of-capital-integration-zero-and-perfect-integration.jpg)