Embed Size (px)
Citation preview
Bekaert: Financial review
Financial Review Bekaert Annual Report 2012 2
Table of contents
Consolidated financial statements ...................................................... 4
Consolidated income statement .......................................................................................................................... 4 Consolidated statement of comprehensive income ........................................................................................... 5 Consolidated balance sheet ................................................................................................................................. 6 Consolidated statement of changes in equity .................................................................................................... 7 Consolidated cash flow statement ....................................................................................................................... 8
Notes to the consolidated financial statements ................................. 9
1. General information .................................................................................................................................... 9
2. Summary of principal accounting policies ............................................................................................... 9 2.1. Statement of compliance ............................................................................................................................... 9
- New and amended standards and interpretations .................................................................................... 9 2.2. General principles ....................................................................................................................................... 10
- Basis of preparation ................................................................................................................................ 10 - Principles of consolidation ...................................................................................................................... 11 - Foreign currency translation ................................................................................................................... 11
2.3. Balance sheet items .................................................................................................................................... 12 - Intangible assets ..................................................................................................................................... 12 - Goodwill and business combinations ...................................................................................................... 12 - Property, plant and equipment ................................................................................................................ 13 - Leases .................................................................................................................................................... 13 - Government grants ................................................................................................................................. 14 - Financial assets ...................................................................................................................................... 14 - Inventories .............................................................................................................................................. 14 - Share capital ........................................................................................................................................... 15 - Non-controlling interests ......................................................................................................................... 15 - Provisions ............................................................................................................................................... 15 - Employee benefit obligations .................................................................................................................. 15 - Interest-bearing debt ............................................................................................................................... 16 - Trade payables and other current liabilities ............................................................................................ 16 - Income taxes .......................................................................................................................................... 16 - Derivatives, hedging and hedging reserves ............................................................................................ 16 - Impairment of assets .............................................................................................................................. 17
2.4. Income statement items .............................................................................................................................. 17 - Revenue recognition ............................................................................................................................... 17 - Non-recurring items ................................................................................................................................ 18
2.5. Statement of comprehensive income and statement of changes in equity .................................................. 18 2.6. Miscellaneous.............................................................................................................................................. 18
- Non-current assets held for sale and discontinued operations ............................................................... 18 - Contingencies ......................................................................................................................................... 18 - Events after the balance sheet date ....................................................................................................... 18
3. Critical accounting judgments and key sources of estimation uncertainty ........................................ 19 3.1. Critical judgments in applying the entity’s accounting policies .................................................................... 19 3.2. Key sources of estimation uncertainty ......................................................................................................... 20
4. Segment reporting .................................................................................................................................... 21
5. Income statement items and other comprehensive income ................................................................. 25 5.1. Operating result (EBIT) by function ............................................................................................................. 25 5.2. Operating result (EBIT) by nature ................................................................................................................ 27 5.3. Interest income and expense ...................................................................................................................... 28
Bekaert Annual Report 2012 Financial Review 3
Be
ka
ert: F
inan
cia
l revie
w
5.4. Other financial income and expenses ......................................................................................................... 28 5.5. Income taxes ............................................................................................................................................... 29 5.6. Share in the results of joint ventures and associates .................................................................................. 29 5.7. Earnings per share ...................................................................................................................................... 30 5.8. Total comprehensive income ...................................................................................................................... 31
6. Balance sheet items .................................................................................................................................. 32 6.1. Intangible assets ......................................................................................................................................... 32 6.2. Goodwill ...................................................................................................................................................... 33 6.3. Property, plant and equipment .................................................................................................................... 36 6.4. Investments in joint ventures and associates .............................................................................................. 37 6.5. Other non-current assets ............................................................................................................................. 39 6.6. Deferred tax assets and liabilities ................................................................................................................ 40 6.7. Operating working capital ............................................................................................................................ 42 6.8. Other receivables ........................................................................................................................................ 43 6.9. Cash & cash equivalents and short-term deposits ...................................................................................... 44 6.10. Other current assets .................................................................................................................................... 44 6.11. Assets classified as held for sale and liabilities associated with those assets ............................................. 44 6.12. Ordinary shares, treasury shares, subscription rights and share options .................................................... 45 6.13. Retained earnings and other Group reserves ............................................................................................. 49 6.14. Non-controlling interests .............................................................................................................................. 51 6.15. Employee benefit obligations ...................................................................................................................... 52 6.16. Provisions .................................................................................................................................................... 57 6.17. Interest-bearing debt ................................................................................................................................... 57 6.18. Other non-current liabilities ......................................................................................................................... 58 6.19. Other current liabilities ................................................................................................................................. 58
7. Miscellaneous items ................................................................................................................................. 59 7.1. Notes to the cash flow statement ................................................................................................................ 59 7.2. Effect of new business combinations and business disposals .................................................................... 61 7.3. Financial risk management and financial derivatives .................................................................................. 66 7.4. Off-balance-sheet commitments.................................................................................................................. 80 7.5. Related parties ............................................................................................................................................ 81 7.6. Events after the balance sheet date ............................................................................................................ 81 7.7. Services provided by the statutory auditor and related persons .................................................................. 82 7.8. Subsidiaries, joint ventures and associates ................................................................................................. 83
Parent company information .............................................................. 87
Annual report of the Board of Directors and financial statements of NV Bekaert SA ................................... 87 Proposed appropriation of NV Bekaert SA 2012 result .................................................................................... 89 Appointments pursuant to the Articles of Association .................................................................................... 89
Auditor’s report ................................................................................... 90
Financial Review Bekaert Annual Report 2012 4
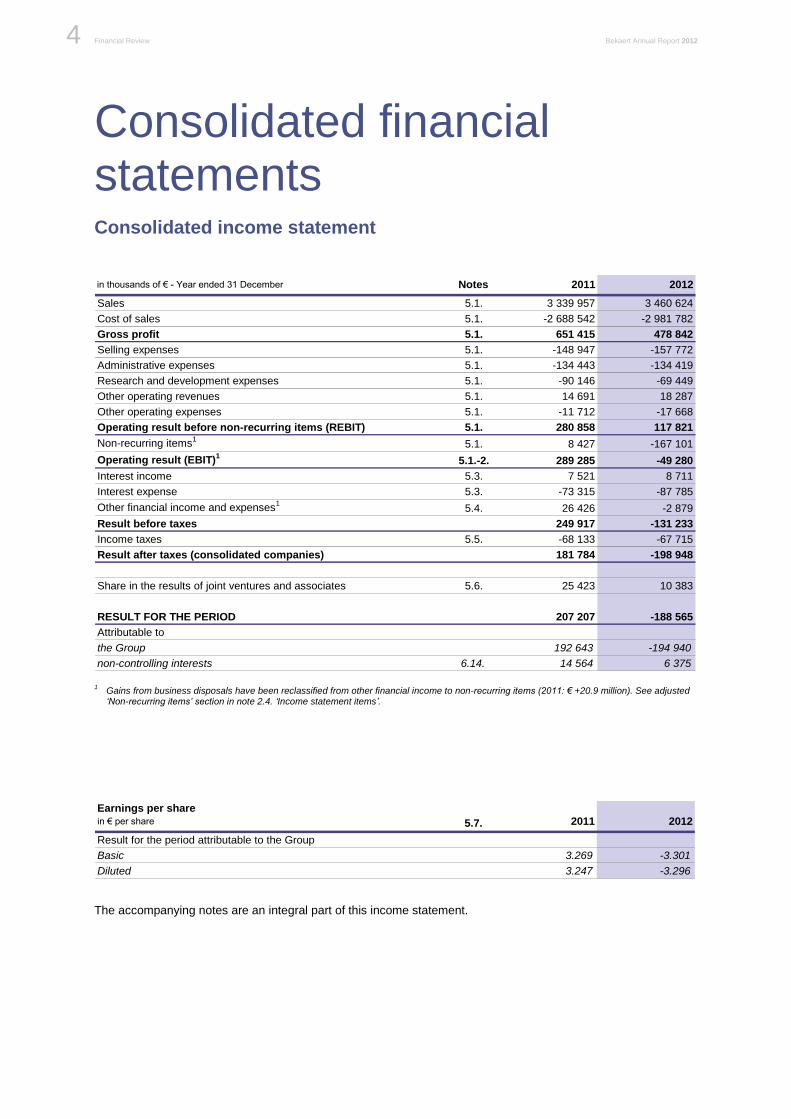
Consolidated financial statements Consolidated income statement
in thousands of € - Year ended 31 December Notes 2011 2012
Sales 5.1. 3 339 957 3 460 624
Cost of sales 5.1. -2 688 542 -2 981 782
Gross profit 5.1. 651 415 478 842
Selling expenses 5.1. -148 947 -157 772
Administrative expenses 5.1. -134 443 -134 419
Research and development expenses 5.1. -90 146 -69 449
Other operating revenues 5.1. 14 691 18 287
Other operating expenses 5.1. -11 712 -17 668
Operating result before non-recurring items (REBIT) 5.1. 280 858 117 821
Non-recurring items1
5.1. 8 427 -167 101
Operating result (EBIT)1
5.1.-2. 289 285 -49 280
Interest income 5.3. 7 521 8 711
Interest expense 5.3. -73 315 -87 785
Other financial income and expenses1
5.4. 26 426 -2 879
Result before taxes 249 917 -131 233
Income taxes 5.5. -68 133 -67 715
Result after taxes (consolidated companies) 181 784 -198 948
Share in the results of joint ventures and associates 5.6. 25 423 10 383
RESULT FOR THE PERIOD 207 207 -188 565
Attributable to
the Group 192 643 -194 940
non-controlling interests 6.14. 14 564 6 375 1
Gains from business disposals have been reclassified from other financial income to non-recurring items (2011: € +20.9 million). See adjusted ‘Non-recurring items’ section in note 2.4. ‘Income statement items’.
Earnings per share
in € per share 5.7. 2011 2012
Result for the period attributable to the Group
Basic 3.269 -3.301
Diluted 3.247 -3.296
The accompanying notes are an integral part of this income statement.
Bekaert Annual Report 2012 Financial Review 5
Be
ka
ert: F
inan
cia
l revie
w
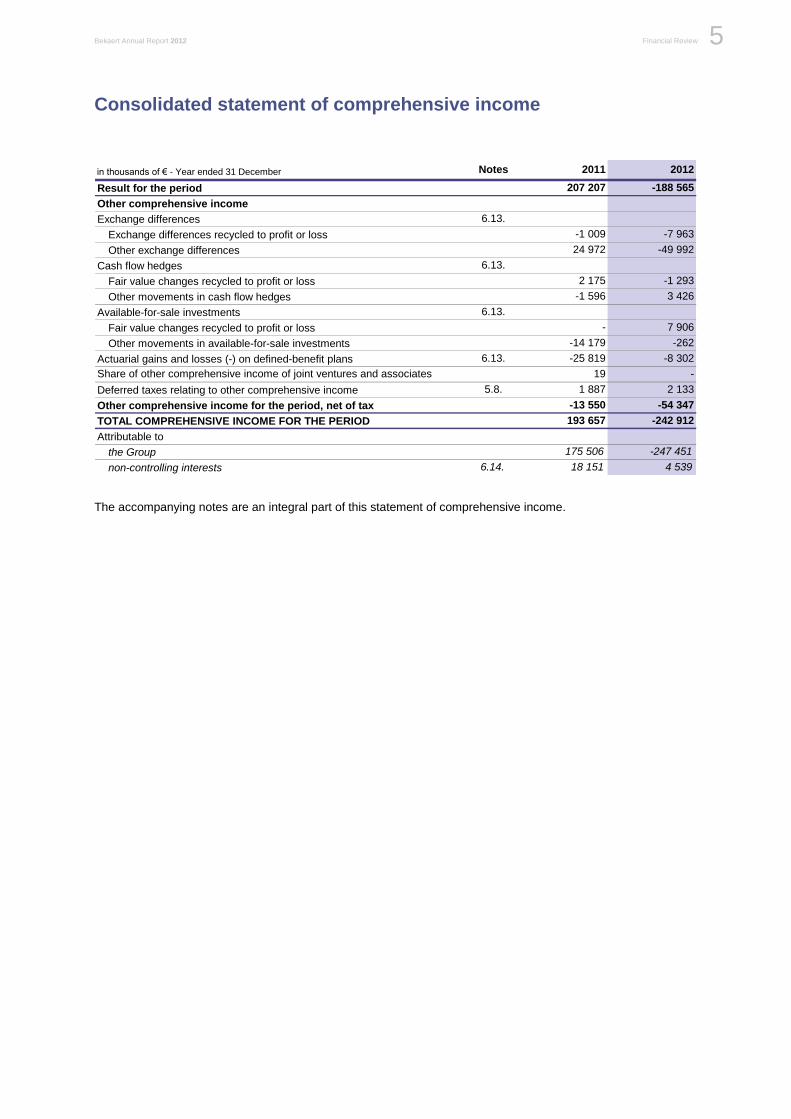
Consolidated statement of comprehensive income
in thousands of € - Year ended 31 December Notes 2011 2012
Result for the period 207 207 -188 565
Other comprehensive income
Exchange differences 6.13.
Exchange differences recycled to profit or loss -1 009 -7 963
Other exchange differences 24 972 -49 992
Cash flow hedges 6.13.
Fair value changes recycled to profit or loss 2 175 -1 293
Other movements in cash flow hedges -1 596 3 426
Available-for-sale investments 6.13.
Fair value changes recycled to profit or loss - 7 906
Other movements in available-for-sale investments -14 179 -262
Actuarial gains and losses (-) on defined-benefit plans 6.13. -25 819 -8 302
Share of other comprehensive income of joint ventures and associates 19 -
Deferred taxes relating to other comprehensive income 5.8. 1 887 2 133
Other comprehensive income for the period, net of tax -13 550 -54 347
TOTAL COMPREHENSIVE INCOME FOR THE PERIOD 193 657 -242 912
Attributable to
the Group 175 506 -247 451
non-controlling interests 6.14. 18 151 4 539
The accompanying notes are an integral part of this statement of comprehensive income.
Financial Review Bekaert Annual Report 2012 6
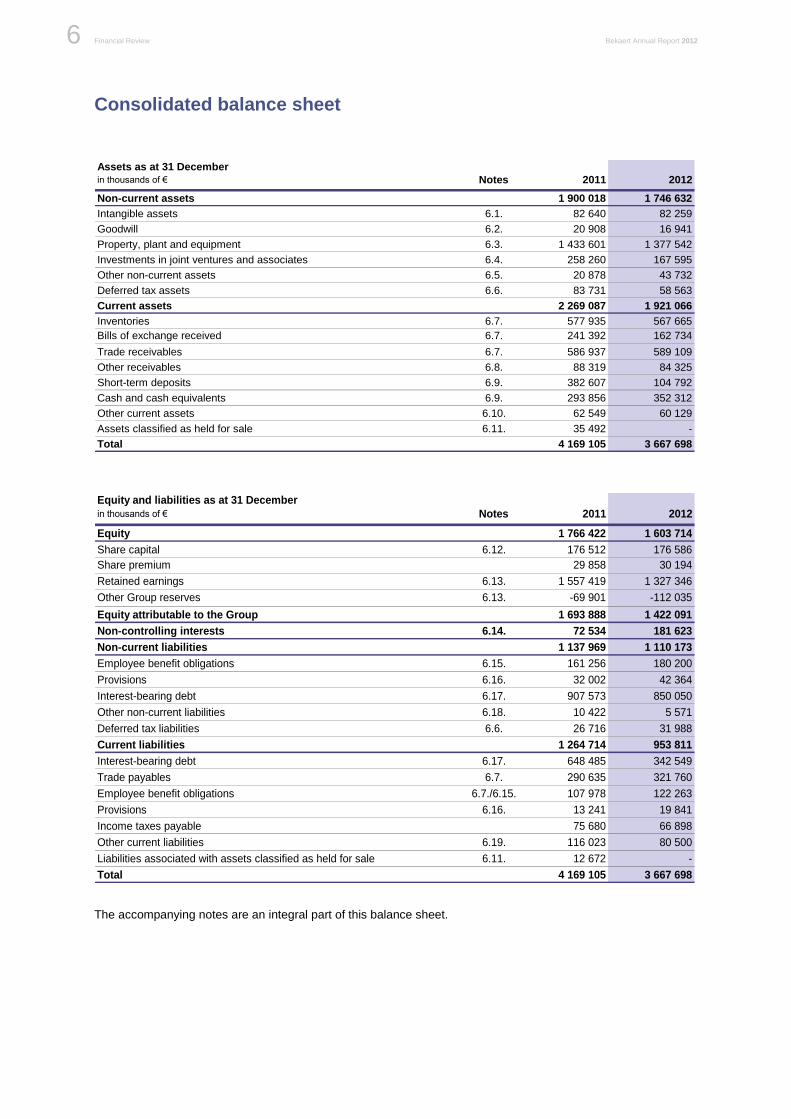
Consolidated balance sheet
Assets as at 31 December
in thousands of € Notes 2011 2012
Non-current assets 1 900 018 1 746 632
Intangible assets 6.1. 82 640 82 259
Goodwill 6.2. 20 908 16 941
Property, plant and equipment 6.3. 1 433 601 1 377 542
Investments in joint ventures and associates 6.4. 258 260 167 595
Other non-current assets 6.5. 20 878 43 732
Deferred tax assets 6.6. 83 731 58 563
Current assets 2 269 087 1 921 066
Inventories 6.7. 577 935 567 665
Bills of exchange received 6.7. 241 392 162 734
Trade receivables 6.7. 586 937 589 109
Other receivables 6.8. 88 319 84 325
Short-term deposits 6.9. 382 607 104 792
Cash and cash equivalents 6.9. 293 856 352 312
Other current assets 6.10. 62 549 60 129
Assets classified as held for sale 6.11. 35 492 -
Total 4 169 105 3 667 698
Equity and liabilities as at 31 December
in thousands of € Notes 2011 2012
Equity 1 766 422 1 603 714
Share capital 6.12. 176 512 176 586
Share premium 29 858 30 194
Retained earnings 6.13. 1 557 419 1 327 346
Other Group reserves 6.13. -69 901 -112 035
Equity attributable to the Group 1 693 888 1 422 091
Non-controlling interests 6.14. 72 534 181 623
Non-current liabilities 1 137 969 1 110 173
Employee benefit obligations 6.15. 161 256 180 200
Provisions 6.16. 32 002 42 364
Interest-bearing debt 6.17. 907 573 850 050
Other non-current liabilities 6.18. 10 422 5 571
Deferred tax liabilities 6.6. 26 716 31 988
Current liabilities 1 264 714 953 811
Interest-bearing debt 6.17. 648 485 342 549
Trade payables 6.7. 290 635 321 760
Employee benefit obligations 6.7./6.15. 107 978 122 263
Provisions 6.16. 13 241 19 841
Income taxes payable 75 680 66 898
Other current liabilities 6.19. 116 023 80 500
Liabilities associated with assets classified as held for sale 6.11. 12 672 -
Total 4 169 105 3 667 698
The accompanying notes are an integral part of this balance sheet.
Bekaert Annual Report 2012 Financial Review 7
Be
ka
ert: F
inan
cia
l revie
w
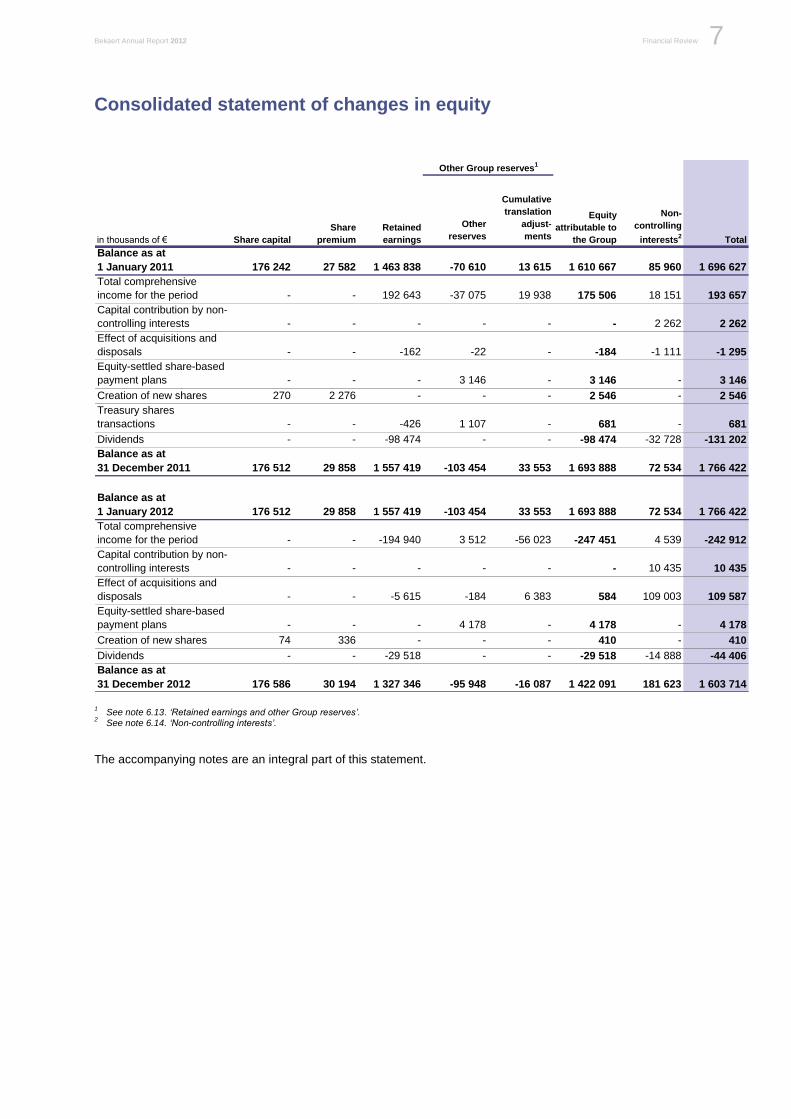
Consolidated statement of changes in equity
Other
reserves
Cumulative
translation
adjust-
ments
Balance as at
1 January 2011 176 242 27 582 1 463 838 -70 610 13 615 1 610 667 85 960 1 696 627
Total comprehensive
income for the period - - 192 643 -37 075 19 938 175 506 18 151 193 657
Capital contribution by non-
controlling interests - - - - - - 2 262 2 262
Effect of acquisitions and
disposals - - -162 -22 - -184 -1 111 -1 295
Equity-settled share-based
payment plans - - - 3 146 - 3 146 - 3 146
Creation of new shares 270 2 276 - - - 2 546 - 2 546
Treasury shares
transactions - - -426 1 107 - 681 - 681
Dividends - - -98 474 - - -98 474 -32 728 -131 202
Balance as at
31 December 2011 176 512 29 858 1 557 419 -103 454 33 553 1 693 888 72 534 1 766 422
Balance as at
1 January 2012 176 512 29 858 1 557 419 -103 454 33 553 1 693 888 72 534 1 766 422
Total comprehensive
income for the period - - -194 940 3 512 -56 023 -247 451 4 539 -242 912
Capital contribution by non-
controlling interests - - - - - - 10 435 10 435
Effect of acquisitions and
disposals - - -5 615 -184 6 383 584 109 003 109 587
Equity-settled share-based
payment plans - - - 4 178 - 4 178 - 4 178
Creation of new shares 74 336 - - - 410 - 410
Dividends - - -29 518 - - -29 518 -14 888 -44 406
Balance as at
31 December 2012 176 586 30 194 1 327 346 -95 948 -16 087 1 422 091 181 623 1 603 714
Totalin thousands of €
Retained
earningsShare capital
Equity
attributable to
the Group
Non-
controlling
interests2
Other Group reserves1
Share
premium
1 See note 6.13. ‘Retained earnings and other Group reserves’.
2 See note 6.14. ‘Non-controlling interests’.
The accompanying notes are an integral part of this statement.
Financial Review Bekaert Annual Report 2012 8
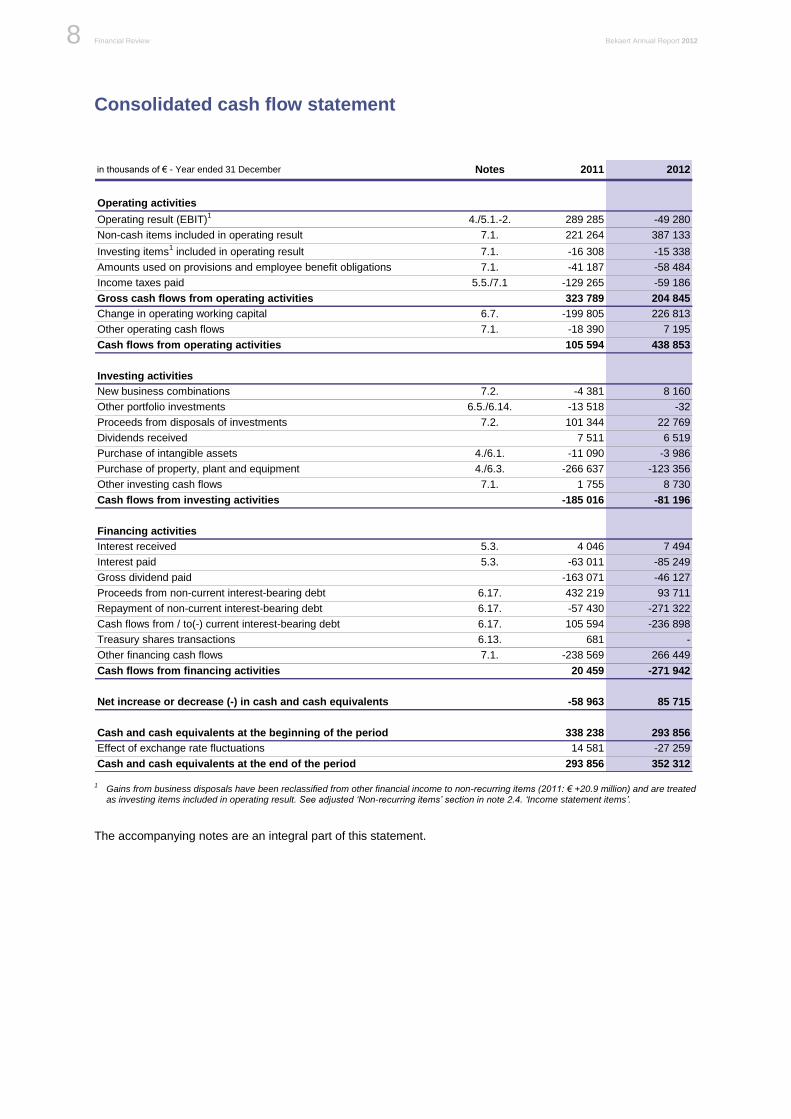
Consolidated cash flow statement
in thousands of € - Year ended 31 December Notes 2011 2012
Operating activities
Operating result (EBIT)1
4./5.1.-2. 289 285 -49 280
Non-cash items included in operating result 7.1. 221 264 387 133
Investing items1 included in operating result 7.1. -16 308 -15 338
Amounts used on provisions and employee benefit obligations 7.1. -41 187 -58 484
Income taxes paid 5.5./7.1 -129 265 -59 186
Gross cash flows from operating activities 323 789 204 845
Change in operating working capital 6.7. -199 805 226 813
Other operating cash flows 7.1. -18 390 7 195
Cash flows from operating activities 105 594 438 853
Investing activities
New business combinations 7.2. -4 381 8 160
Other portfolio investments 6.5./6.14. -13 518 -32
Proceeds from disposals of investments 7.2. 101 344 22 769
Dividends received 7 511 6 519
Purchase of intangible assets 4./6.1. -11 090 -3 986
Purchase of property, plant and equipment 4./6.3. -266 637 -123 356
Other investing cash flows 7.1. 1 755 8 730
Cash flows from investing activities -185 016 -81 196
Financing activities
Interest received 5.3. 4 046 7 494
Interest paid 5.3. -63 011 -85 249
Gross dividend paid -163 071 -46 127
Proceeds from non-current interest-bearing debt 6.17. 432 219 93 711
Repayment of non-current interest-bearing debt 6.17. -57 430 -271 322
Cash flows from / to(-) current interest-bearing debt 6.17. 105 594 -236 898
Treasury shares transactions 6.13. 681 -
Other financing cash flows 7.1. -238 569 266 449
Cash flows from financing activities 20 459 -271 942
Net increase or decrease (-) in cash and cash equivalents -58 963 85 715
Cash and cash equivalents at the beginning of the period 338 238 293 856
Effect of exchange rate fluctuations 14 581 -27 259
Cash and cash equivalents at the end of the period 293 856 352 312
1 Gains from business disposals have been reclassified from other financial income to non-recurring items (2011: € +20.9 million) and are treated as investing items included in operating result. See adjusted ‘Non-recurring items’ section in note 2.4. ‘Income statement items’.
The accompanying notes are an integral part of this statement.
Bekaert Annual Report 2012 Financial Review 9
Be
ka
ert: F
inan
cia
l revie
w
Notes to the consolidated financial statements 1. General information
NV Bekaert SA (the ‘Company’) is a company domiciled in Belgium. The Company’s consolidated financial statements include those of the Company and its subsidiaries (together referred to as the ‘Group’ or ‘Bekaert’) and the Group’s interest in joint ventures and associates accounted for using the equity method. The consolidated financial statements were authorized for issue by the Board of Directors of the Company on 26 March 2013.
2. Summary of principal accounting policies
2.1. Statement of compliance
The consolidated financial statements have been prepared in accordance with the International Financial Reporting Standards (IFRSs) which have been endorsed by the European Union. These financial statements are also in compliance with the IFRSs as issued by the IASB.
New and amended standards and interpretations
Standards, interpretations and amendments
effective in 2012
No new and revised standards and interpretations adopted in the current period have affected the amounts reported in these financial statements.
The following revised standards have also been adopted in these financial statements. Their adoption has not had any impact on the amounts reported in these financial statements but may impact the accounting for future transactions or arrangements.
- IFRS 7 (Amendment), Financial Instruments: Disclosures (effective 1 January 2012), relating to Transfers of Financial Assets, published in October 2010. This amendment intends to improve the quality of the information about financial assets (i) that have been ‘transferred’ but are still (partially) recognized by the entity or (ii) that are no longer recognized by the entity, but with which the entity continues to have some involvement.
- IAS 12 (Amendment), Income Taxes (effective 1 January 2012), relating to Deferred Tax: Recovery of Underlying Assets, more specifically when investment properties are measured using the fair value model under IAS 40, Investment Property. Since the Group does not apply this model, the amendment is deemed irrelevant.
- IFRS 1 (Amendment), First-time Adoption of International Financial Reporting Standards (effective 1 July 2011), published in December 2010. This amendment replaces references to a fixed date of ‘1 January 2004’ with the ‘date of transition to IFRSs’, thus eliminating the need for first-time adopters to restate derecognition transactions that occurred before the date of transition to IFRSs. It also provides guidance on how an entity should resume presenting financial statements in accordance with IFRSs after a period when the entity was unable to comply with IFRSs because its functional currency was subject to severe hyperinflation.
Standards, amendments and interpretations that
are not yet effective in 2012 and have not been
early adopted
The Group did not elect for early application of the following new or amended standards, which could have an impact when applied:
- IFRS 7 (Amendment), Financial Instruments: Disclosures (effective 1 January 2013), relating to Offsetting financial assets and financial liabilities, published in December 2011. The amendment requires disclosure of information about recognized financial instruments subject to enforceable master netting arrangements and similar agreements in order to evaluate the effect or potential effect of netting arrangements on the entity's financial position.
- IFRS 9, Financial Instruments and related amendments (effective date 1 January 2015 but not yet endorsed). The present version of IFRS 9 (also known as Phase I) mainly simplifies the classification and measurement of financial assets and financial liabilities. Other phases are still not finalized.
- IFRS 10, Consolidated Financial Statements (effective from 1 January 2013 ). IFRS 10
Financial Review Bekaert Annual Report 2012 10
replaces the parts of IAS 27, Consolidated and Separate Financial Statements, that deal with consolidated financial statements. SIC 12, Consolidation – Special Purpose Entities, has been withdrawn upon the issuance of IFRS 10. Under IFRS 10, the only basis for consolidation is control. A new definition of control is introduced which contains three elements (a) power over an investee, (b) exposure, or rights, to variable returns from its involvement with the investee, and (c) the ability to use its power over the investee to affect the amount of the investor’s returns.
- IFRS 11, Joint Arrangements (effective from 1 January 2013). IFRS 11 replaces IAS 31, Interests in Joint Ventures. It deals with how a joint arrangement of which two or more parties have joint control should be classified. SIC 13, Jointly Controlled Entities – Non-monetary Contributions by Venturers, has been withdrawn upon the issuance of IFRS 11. Under IFRS 11, joint arrangements are classified as joint operations or joint ventures, whereas IAS 31 provided three types of joint arrangements: jointly controlled entities, jointly controlled assets and jointly controlled operations. In addition, joint ventures under IFRS 11 are required to be accounted for using the equity method. Since Bekaert already accounts for its joint ventures using the equity method, the latter requirement will not have an effect on its consolidated financial statements.
- IFRS 12, Disclosures of Interests in Other Entities (effective from 1 January 2013). This standard requires more extensive disclosures, including summarized financial information for each joint venture or subsidiary with non-controlling interests that is material to the Group.
- IFRS 13, Fair Value Measurement (effective from 1 January 2013). IFRS 13 defines fair value, establishes a framework for measuring fair value, and requires disclosures about fair value measurements.
- IAS 1 (Amendment), Presentation of Financial Statements – Presentation of Items of Other Comprehensive Income (effective from 1 January 2013). The amendments require additional disclosures to be made in the other comprehensive income section such that items of other comprehensive income are grouped into two categories: (a) items that will not be reclassified subsequently to profit or loss; and (b) items that will be reclassified subsequently to profit or loss when specific conditions are met. Income tax on items of other comprehensive income is required to be allocated on the same basis. The presentation of items of other comprehensive income will be modified accordingly when the amendments are applied in future accounting periods.
- IAS 19 (Revised 2011), Employee Benefits (effective from 1 January 2013). The amendments change the accounting for defined-benefit plans and termination benefits. The most significant change relates to the accounting for changes in defined-benefit obligations and plan assets. Under the new amendments, which eliminate the corridor approach and accelerate the recognition of past service costs, such changes should be recognized when they occur. Furthermore, when determining the net benefit expense of a defined-benefit plan, the interest cost and expected return on plan assets are replaced by a net interest on the net defined-benefit liability/asset which is based on a single discount rate.
- IAS 28 (Amendment), Investments in Associates and Joint Ventures (effective from 1 January 2013). The amendment mainly relates to the accounting treatment of joint ventures in accordance with the equity method.
- IAS 32 (Amendment), Financial Instruments: Presentation – Offsetting Financial Assets and Financial Liabilities (effective from 1 January 2014). This amendment provides clarifications on the application of the offsetting rules on financial assets and financial liabilities.
- The Improvements to IFRSs (effective 1 January 2013 but not yet endorsed), published in May 2012. These improvements relate to IFRS 1, First-time Adoption of International Financial Reporting Standards, permitting the repeated application of IFRS 1, borrowing costs on certain qualifying assets; IAS 1, Presentation of Financial Statements, clarifying the requirements for comparative information; IAS 16, Property, Plant and Equipment, clarifying the classification of servicing equipment; IAS 32, Financial Instruments: Presentation, clarifying that any tax effect of a distribution to holders of equity instruments should be accounted for in accordance with IAS 12, Income Taxes; IAS 34, Interim Financial Reporting, clarifying interim reporting of segment information for total assets in order to enhance consistency with the requirements in IFRS 8, Operating Segments.
At this stage, the Group does not expect first adoption of any other amendments to standards and new interpretations to have a material impact on the financial statements.
2.2. General principles
Basis of preparation
The consolidated financial statements are presented in thousands of euros, under the historical cost convention, except for investments held for trading and available for sale, which are stated at their fair value. Financial assets which do not have a quoted price in an active market and the fair value of which cannot be reliably measured are carried at cost.
Bekaert Annual Report 2012 Financial Review 11
Be
ka
ert: F
inan
cia
l revie
w
Unless explicitly stated, the accounting policies are applied consistently with the previous year.
Principles of consolidation
Subsidiaries
Subsidiaries are entities over which NV Bekaert SA exercises control, which generally means that NV Bekaert SA, directly or indirectly, holds more than 50% of the voting rights attaching to the entity's share capital and is able to govern its financial and operating policies so as to obtain benefits from its activities. The financial statements of subsidiaries are included in the consolidated financial statements from the date when the Group acquires control until the date when control is relinquished. All intercompany transactions, balances with and unrealized gains on transactions between Group companies are eliminated; unrealized losses are also eliminated unless the impairment is permanent. Equity and net result attributable to non-controlling shareholders are shown separately in the balance sheet and income statement, respectively. Changes in the Group's ownership interests in subsidiaries that do not result in the Group losing control over the subsidiaries are accounted for as equity transactions. The carrying amounts of the Group's interests and the non-controlling interests are adjusted to reflect the changes in their relative interests in the subsidiaries. Any difference between the amount by which the non-controlling interests are adjusted and the fair value of the consideration paid or received is recognized directly in equity. When the Group loses control of a subsidiary, the profit or loss on disposal is calculated as the difference between: - the aggregate of the fair value of the
consideration received and the fair value of any retained interest; and
- the carrying amount of the assets (including goodwill), liabilities and any non-controlling interests of the subsidiary before its disposal.
Joint ventures and associates
A joint venture is a contractual arrangement whereby NV Bekaert SA and other parties undertake, directly or indirectly, an economic activity that is subject to joint control, i.e. where the strategic, financial and operating policy decisions require the unanimous consent of the parties sharing control. Associates are companies in which NV Bekaert SA, directly or indirectly, has a significant influence and which are neither subsidiaries nor joint ventures. This is presumed if the Group holds at least 20% of the voting rights attaching to the shares. The financial information included for these companies is prepared using the accounting policies of the Group. When the Group has acquired joint control in a joint venture or significant influence in an associate, the share in the acquired assets, liabilities and contingent liabilities is initially remeasured to fair value at the acquisition date and accounted for using the equity method. Any excess of the purchase price over the fair value of the share in the assets, liabilities and contingent
liabilities acquired is recognized as goodwill. When the goodwill is negative, it is immediately recognized in profit or loss. Subsequently, the consolidated financial statements include the Group's share of the results of joint ventures and associates accounted for using the equity method until the date when joint control or significant influence ceases. If the Group’s share of the losses of a joint venture or associate exceeds the carrying amount of the investment, the investment is carried at nil value and recognition of additional losses is limited to the extent of the Group’s commitment. Unrealized gains arising from transactions with joint ventures and associates are set against the investment in the joint venture or associate concerned to the extent of the Group’s interest. The carrying amounts of investments in joint ventures and associates are reassessed if there are indications that the asset has been impaired or that impairment losses recognized in prior years have ceased to apply. The investments in joint ventures and associates in the balance sheet include the carrying amount of any related goodwill.
Foreign currency translation
Items included in the financial statements of each of the Group’s entities are measured using the currency of the primary economic environment in which the entity operates (‘the functional currency’). The consolidated financial statements are presented in euro, which is the Company’s functional and the Group’s presentation currency. Financial statements of foreign entities are translated as follows:
- assets and liabilities are translated at the closing exchange rate of the European Central Bank or, in the case of the Venezuelan bolivar fuerte, at the corresponding economic rate that is deemed representative for dividend repatriations at the balance sheet date;
- income, expenses and cash flows are translated at the average exchange rate for the year;
- shareholders’ equity is translated at historical exchange rates.
Exchange differences arising from the translation of the net investment in foreign subsidiaries, joint ventures and associates at the closing exchange rates are included in shareholders’ equity under ‘cumulative translation adjustments’. On disposal of foreign entities, cumulative translation adjustments are recognized in the income statement as part of the gain or loss on the sale. In the financial statements of the parent company and its subsidiaries, monetary assets and liabilities denominated in foreign currency are translated at the exchange rate at the balance sheet date, thus giving rise to unrealized exchange results. Unrealized and realized foreign-exchange gains and losses are recognized in the income statement, except when deferred in equity as qualifying cash flow hedges and qualifying net investment hedges. Goodwill is treated as an asset of the acquiree and is accordingly accounted for in the acquiree’s currency and translated at the closing rate.
Financial Review Bekaert Annual Report 2012 12
2.3. Balance sheet items
Intangible assets
Intangible assets acquired in a business combination are initially measured at fair value; intangible assets acquired separately are initially measured at cost. After initial recognition, intangible assets are measured at cost or fair value less accumulated amortization and any accumulated impairment losses. Intangible assets are amortized on a straight-line basis over the best estimate of their useful lives. The amortization period and method are reviewed at each financial year-end. A change in the useful life of an intangible asset is accounted for prospectively as a change in estimate. Under the provisions of IAS 38, intangible assets may have indefinite useful lives. If the useful life of an intangible asset is deemed indefinite, no amortization is recognized and the asset is reviewed at least annually for impairment.
Licenses, patents and similar rights
Expenditure on acquired licenses, patents, trademarks and similar rights is capitalized and amortized on a straight-line basis over the contractual period, if any, or the estimated useful life, which is normally considered to be not longer than ten years.
Computer software
Generally, costs associated with the acquisition, development or maintenance of computer software are recognized as an expense when they are incurred, but external costs directly associated with the acquisition and implementation of acquired ERP software are recognized as intangible assets and amortized over five years on a straight-line basis.
Rights to use land
Rights to use land are recognized as intangible assets and are amortized over the contractual period on a straight-line basis.
Research and development
Expenditure on research activities undertaken with the prospect of gaining new scientific or technological knowledge and understanding is recognized in the income statement as an expense when it is incurred.
Expenditure on development activities where research findings are applied to a plan or design for the production of new or substantially improved products and processes prior to commercial production or use is capitalized if, and only if, all of the recognition criteria set out below are met: - the product or process is clearly defined and
costs are separately identified and reliably measured;
- the technical feasibility of the product is demonstrated;
- the product or process is to be sold or used in house;
- the assets are expected to generate future economic benefits (e.g. a potential market exists for the product or, if for internal use, its usefulness is demonstrated); and
- adequate technical, financial and other resources required for completion of the project are available.
In most cases, these recognition criteria are not met. Capitalized development costs are amortized from the commencement of commercial production of the product on a straight-line basis over the period during which benefits are expected to accrue. The period of amortization does not normally exceed ten years. An in-process research and development project acquired in a business combination is recognized as an asset separately from goodwill if its fair value can be measured reliably.
Emission rights
In the absence of any IASB standard or interpretation regulating the accounting treatment of CO2 emission rights, the Group has applied the ‘net approach’, according to which: - the allowances are recognized as intangible
assets and measured at cost (the cost of allowances issued free of charge being therefore zero); and
- any short position is recognized as a liability at the fair value of the allowances required to cover the shortfall at the balance sheet date.
Other intangible assets
Other intangible assets mainly include customer lists and other intangible commercial assets, such as brand names, acquired separately or in a business combination. These are amortized on a straight-line basis over their estimated useful life.
Goodwill and business combinations
Acquisitions of businesses are accounted for using the acquisition method. The consideration transferred in a business combination is measured at fair value, which is calculated as the sum of the acquisition-date fair values of the assets transferred by the Group, liabilities incurred by the Group to the former owners of the acquiree and the equity interests issued by the Group in exchange for control of the acquiree. Acquisition-related costs are recognized in profit or loss as incurred. The identifiable assets acquired and the liabilities assumed are recognized at their fair value at the acquisition date. Goodwill is measured as the difference between: (i) the sum of the following elements: - consideration transferred; - amount of any non-controlling interests in the
acquiree; - fair value of the Group's previously held equity
interest in the acquiree (if any); and
Bekaert Annual Report 2012 Financial Review 13
Be
ka
ert: F
inan
cia
l revie
w
(ii) the net of the acquisition-date amounts of the identifiable assets acquired and the liabilities assumed. If, after reassessment, this difference is negative (“negative goodwill”), it is recognized immediately in profit or loss as a bargain purchase gain.
Non-controlling interests are initially measured either at fair value or at the non-controlling interests' proportionate share of the recognized amounts of the acquiree's identifiable net assets. The choice of measurement basis is made on a transaction-by-transaction basis. When the consideration transferred by the Group in a business combination includes assets or liabilities resulting from a contingent consideration arrangement, the contingent consideration is measured at its acquisition-date fair value and included as part of the consideration transferred in a business combination. Subsequent changes in the fair value of the contingent consideration are recognized in profit or loss. When a business combination is achieved in stages, the Group's previously held equity interest in the acquiree is remeasured to fair value at the acquisition date (i.e. the date when the Group obtains control) and the resulting gain or loss, if any, is recognized in profit or loss. Amounts arising from interests in the acquiree prior to the acquisition date that have previously been recognized in other comprehensive income are reclassified to profit or loss where such treatment would be appropriate if that interest were disposed of.
Impairment of goodwill
For the purpose of impairment testing, goodwill is allocated to each of the Group’s cash-generating units that are expected to benefit from the synergies of the combination. Cash-generating units to which goodwill has been allocated are tested for impairment annually, or more frequently when there is an indication that the unit’s value may be impaired. If the recoverable amount of the cash-generating unit is less than the carrying amount of the unit, the impairment loss is allocated first to reduce the carrying amount of any goodwill allocated to the unit and then to the other assets of the unit in proportion to the carrying amount of each asset in the unit. An impairment loss recognized for goodwill is not reversed in a subsequent period.
Property, plant and equipment
The Group has opted for the historical cost model and not for the revaluation model. Property, plant and equipment acquired separately is initially measured at cost. Property, plant and equipment acquired in a business combination is initially measured at fair value, which thus becomes its deemed cost. After initial recognition, property, plant and equipment is measured at cost less accumulated depreciation and accumulated impairment losses. Cost includes all direct costs and all expenditure incurred to bring the asset to its working condition and location for its intended use.
Borrowing costs directly attributable to the acquisition, construction or production of a qualifying asset are capitalized as part of the cost of that asset. Depreciation is provided over the estimated useful lives of the various classes of property, plant and equipment on a straight-line basis.
The useful life and depreciation method are reviewed at least at each financial year-end. Unless revised due to specific changes in the estimated economic useful life, annual depreciation rates are as follows: - land 0% - buildings 5% - plant, machinery
and equipment 8%-25% - R&D testing equipment 16.7%-25% - furniture and vehicles 20% - computer hardware 25%
Assets held under finance leases are depreciated over their expected useful lives on the same basis as owned assets or, where shorter, the term of the relevant lease. Where the carrying amount of an asset is greater than its estimated recoverable amount, it is written down immediately to its recoverable amount (see section on ‘Impairment of assets’ below). Gains and losses on disposal are included in the operating result.
Leases
Finance leases
Leases under which the Group assumes substantially all the risks and rewards of ownership are classified as finance leases. Items of property, plant and equipment acquired by way of finance lease are stated at the lower of their fair value and the present value of the minimum lease payments at inception of the lease, less accumulated depreciation and impairment losses. In calculating the present value of the minimum lease payments, the discount factor used is the interest rate implicit in the lease, when it is practicable to determine it; otherwise the Company’s incremental borrowing rate is used. Initial direct costs are included as part of the asset. Lease payments are apportioned between the finance charge and the reduction of the outstanding liability. The finance charge is allocated to periods during the lease term so as to produce a constant periodic rate of interest on the remaining balance of the liability for each period. A finance lease gives rise to a depreciation expense for the asset as well as a finance expense for each accounting period. The depreciation policy for leased assets is consistent with that for owned depreciable assets.
Operating leases
Leases under which substantially all the risks and rewards of ownership are effectively retained by the lessor are classified as operating leases. Lease payments under an operating lease are recognized as an expense on a straight-line basis over the
Financial Review Bekaert Annual Report 2012 14
lease term. The aggregate benefit of incentives provided by the lessor is recognized, on a straight-line basis, as a reduction of rental expense over the lease term. Improvements to buildings held under operating leases are depreciated over their expected useful lives, or, where shorter, the term of the relevant lease.
Government grants
Government grants relating to the purchase of property, plant and equipment are deducted from the cost of those assets. They are recognized in the balance sheet at their expected value at the time of initial government approval and corrected, if necessary, after final approval. The grant is amortized over the depreciation period of the underlying assets.
Financial assets
The Group classifies its financial assets in the following categories: at fair value through profit or loss, loans and receivables and available for sale. The classification depends on the purpose for which the financial assets were acquired. Management determines the classification of its financial assets at initial recognition.
Financial assets at fair value through profit or
loss (FVTPL)
Financial assets are classified as at fair value through profit or loss if they are held for trading. Financial assets at FVTPL are stated at fair value, with any resultant gains or losses recognized in profit or loss. A financial asset is classified in this category if acquired principally for the purpose of selling in the short term. Derivatives are also categorized as at FVTPL unless they are designated and effective as hedges.
Loans and receivables
Loans and receivables are non-derivative financial assets with fixed or determinable payments which are not quoted in an active market. The Group’s loans and receivables category comprises, unless stated otherwise, trade and other receivables, bills of exchange received, short-term deposits and cash and cash equivalents in the balance sheet. Loans and receivables are measured at amortized cost using the effective interest method, less any impairment.
Bills of exchange received
Payment by means of bills of exchange (bank acceptance drafts) is a widespread practice in China. Bills of exchange received are either settled at maturity date, discounted before the maturity date or transferred to a creditor to settle a liability. Discounting is done either with recourse or without recourse. With recourse means that the discounting bank can claim reimbursement of the amount paid in case the issuer defaults. When a bill is discounted
with recourse, the amount received is not deducted from the outstanding bills of exchange received, but a liability is recognized in ‘current interest-bearing debt’ until the maturity date of that bill.
Cash & cash equivalents and short-term
deposits
Cash equivalents and short-term deposits are short-term investments that are readily convertible to known amounts of cash. They are subject to insignificant risk of change in value. Cash equivalents are highly liquid and have original maturities of three months or less, while short-term deposits have original maturities of more than three months and less than one year.
Available-for-sale financial assets
Non-current available-for-sale assets include investments in entities which were not acquired principally for the purpose of selling in the short term, and which are neither consolidated nor accounted for using the equity method. Assets classified in this category are stated at fair value, with any resultant gains or losses recognized directly in equity. In the case of an impairment loss, the accumulated loss is recycled from equity to the income statement. However, they are stated at cost if they do not have a quoted price in an active market and their fair value cannot be reliably measured by alternative valuation methods.
Impairment of financial assets
Financial assets, other than those at FVTPL, are tested for impairment when there is objective evidence that they could be impaired. A significant or prolonged decline in the fair value of an investment in an equity instrument below its cost provides objective evidence of impairment. The Group defines a significant decline as exceeding 30% of the cost and a prolonged decline as continuing for more than one year. When a decline in the fair value of an available-for-sale financial asset has been recognized in other comprehensive income and there is objective evidence that the asset is impaired, the cumulative loss that had been recognized in other comprehensive income is reclassified from equity to the income statement as an impairment loss. For trade receivables and bills of exchange received, amounts deemed uncollectible are written off against the corresponding allowance account at each balance sheet date. Additions to and recoveries from this allowance account are reported under ‘selling expenses’ in the income statement.
Inventories
Inventories are valued at the lower of cost and net realizable value. Cost is determined by the first-in, first-out (FIFO) method. For processed inventories, cost means full cost including all direct and indirect production costs required to bring the inventory items to the stage of completion at the balance
Bekaert Annual Report 2012 Financial Review 15
Be
ka
ert: F
inan
cia
l revie
w
sheet date. Net realizable value is the estimated selling price in the ordinary course of business, less the costs of completion and costs necessary to make the sale.
Share capital
When shares are repurchased, the amount of the consideration paid, including directly attributable costs, is recognized as a change in equity. Repurchased shares (treasury shares) are presented in the balance sheet as a deduction from equity. The result on the disposal of treasury shares sold or cancelled is recognized in retained earnings.
Non-controlling interests
Non-controlling interests represent the shares of minority or non-controlling shareholders in the equity of subsidiaries which are not fully owned by the Group. At the acquisition date, the item is either measured at its fair value or at the non-controlling shareholders’ proportion of the fair values of net assets recognized on acquisition of a subsidiary (business combination). Subsequently, it is adjusted for the appropriate proportion of subsequent profits and losses. The losses attributable to non-controlling shareholders in a consolidated subsidiary may exceed their interest in the equity of the subsidiary. A proportional share of total comprehensive income is attributed to the non-controlling interests even if this results in the non-controlling interests having a deficit balance.
Provisions
Provisions are recognized in the balance sheet when the Group has a present obligation (legal or constructive) as a result of a past event, which is expected to result in an outflow of resources embodying economic benefits which can be reliably estimated. Each provision is based on the best estimate of the expenditure required to settle the present obligation at the balance sheet date. When appropriate, provisions are measured on a discounted basis.
Restructuring
A provision for restructuring is only recognized when the Group has approved a detailed and formal restructuring plan, and the restructuring has either commenced or has been announced publicly before the balance sheet date. Restructuring provisions include only the direct expenditure arising from the restructuring which is necessarily incurred on the restructuring and is not associated with the ongoing activities of the entity.
Site remediation
A provision for site remediation in respect of contaminated land is recognized in accordance with the Group's published environmental policy and applicable legal requirements.
Employee benefit obligations
The parent company and several of its subsidiaries have pension, death benefit and health care benefit plans covering a substantial part of their workforce.
Defined-benefit plans
Most pension plans are defined-benefit plans with benefits based on years of service and level of remuneration. For defined-benefit plans, the amount recognized in the balance sheet (net liability) is the present value of the defined-benefit obligation less the fair value of any plan assets and any past service costs not yet recognized. The present value of the defined-benefit obligation is the present value, without deducting any plan assets, of expected future payments required to settle the obligation resulting from employee service in the current and prior periods. The present value of the defined-benefit obligation and the related current and past service costs are calculated using the projected unit credit method. The discount rate used is the yield at balance sheet date on high-quality corporate bonds with remaining terms to maturity approximating those of the Group's obligations. Actuarial gains and losses comprise experience adjustments (the effects of differences between the previous actuarial assumptions and what has actually occurred) and the effects of changes in actuarial assumptions. The Group has elected to recognize all actuarial gains and losses through equity as from its 2007 annual report, whereas the former policy was to defer recognition in accordance with the corridor approach.
Past service cost is the increase in the present value of the defined-benefit obligation for employee service in prior periods and resulting in the current period from the introduction of, or changes to, post-employment benefits or other long-term employee benefits. Past service costs are recognized as an expense on a straight-line basis over the average period to vesting. To the extent that the benefits are already vested following the introduction of, or changes to, a defined-benefit plan, past service costs are expensed immediately. Where the calculated amount to be recognized in the balance sheet is negative, an asset is only recognized if it does not exceed the net total of any unrecognized past service costs and the present value of any future refunds from the plan or reductions in future contributions to the plan (the asset ceiling principle). Past service costs are also recognized immediately if their deferred recognition would result under the asset ceiling principle in a gain being recognized solely as a result of a past service cost in the current period. The amount charged to the income statement consists of the aggregate of current service cost, recognized past service cost, interest cost, expected return on plan assets and impact of the change in asset ceiling. In the income statement, current and past service costs are included in the operating result and all other elements are included in interest expense. Pre-retirement pensions in Belgium and plans for
Financial Review Bekaert Annual Report 2012 16
medical care in the United States are also treated as defined-benefit plans.
Defined-contribution plans
Obligations in respect of contributions to defined-contribution pension plans are recognized as an expense in the income statement as they fall due. Death and disability benefits granted to employees of the parent company and its Belgian subsidiaries are covered by independent pension funds. Death and disability benefits granted to the staff of other Group companies are mainly covered by external insurance policies where premiums are paid annually and charged to the income statement. Although supplementary pension plans in Belgium are legally subject to a minimum guaranteed return, the Belgian supplementary pension plans are accounted for as defined-contribution plans, since the legally required return is basically guaranteed by the insurance company. The Belgian supplementary pension plan for managers was accounted for as a defined-benefit plan until 2010, because the beneficiaries were offered a limited investment choice.
Other long-term employee benefits
Other long-term employee benefits, such as service awards, are accounted for using the projected unit credit method. However, the accounting method differs from the method applied for post-employment benefits, as actuarial gains and losses and past service cost are recognized immediately.
Share-based payment plans
The Group issues equity-settled and cash-settled share-based payments to certain employees. Stock option plans which allow Group employees to acquire shares of NV Bekaert SA are of the equity-settled type.
Share appreciation rights plans and phantom stocks plans are of the cash-settled type, as they entitle Group employees to receive payment of cash bonuses, the amount of which is based on the price of the Bekaert share on the Euronext stock exchange.
Equity-settled share-based payments are recognized at fair value (excluding the effect of non-market-based vesting conditions) at the date of grant. The fair value determined at the grant date of the equity-settled share-based payments is expensed, with a corresponding increase in equity (retained earnings), on a straight-line basis over the vesting period, based on the Group’s estimate of the stock options that will eventually vest and adjusted for the effect of non-market-based vesting conditions.
Cash-settled share-based payments are recognized as liabilities at fair value, which is remeasured at each reporting date and at the date of settlement. Changes in fair value are recognized in the income statement. The Group uses a binomial model to
determine the fair value of the share-based payment plans.
Interest-bearing debt
Interest-bearing debt includes loans and borrowings which are initially recognized at the fair value of the consideration received net of transaction costs incurred. In subsequent periods, they are carried at amortized cost using the effective interest-rate method, any difference between the proceeds (net of transaction costs) and the redemption value being recognized in the income statement over the period of the liability. If financial liabilities are hedged using derivatives qualifying as a fair value hedge, the hedging instruments are carried at fair value and the hedged items are remeasured for fair value changes due to the hedged risk (see accounting policies for derivatives and hedging).
Trade payables and other current liabilities
Trade payables and other current liabilities, except derivatives, are stated at cost, which is the fair value of the consideration payable.
Income taxes
Income taxes are classified as either current or deferred taxes. Current income taxes include expected tax charges based on the accounting profit for the current year and adjustments to tax charges of prior years. Deferred taxes are calculated, using the liability method, on temporary differences arising between the tax bases of assets and liabilities and their carrying amounts. The principal temporary differences arise from depreciation of property, plant and equipment, provisions for pensions, pre-pensions and other postretirement benefits, undistributed earnings and tax losses carried forward. Deferred taxes are measured using the tax rates expected to apply to taxable income in the years in which those temporary differences are expected to be realized or settled, based on tax rates enacted or substantively enacted at the balance sheet date. Deferred tax assets are recognized to the extent that it is probable that future taxable profit will be available against which the temporary differences can be utilized; this criterion is reassessed at each balance sheet date. Deferred tax on temporary differences arising on investments in subsidiaries, associates and joint ventures is provided for, except where the Group is able to control the timing of the reversal of the temporary difference and it is probable that the temporary difference will not be reversed in the foreseeable future.
Derivatives, hedging and hedging reserves
The Group uses derivatives to hedge its exposure to foreign-exchange and interest-rate risks arising from operating, financing and investing activities. The net exposure of all subsidiaries is managed on a
Bekaert Annual Report 2012 Financial Review 17
Be
ka
ert: F
inan
cia
l revie
w
centralized basis by Group Treasury in accordance with the aims and principles laid down by general management. As a policy, the Group does not engage in speculative or leveraged transactions.
Derivatives are initially and subsequently measured and carried at fair value. The fair value of traded derivatives is equal to their market value. If no market value is available, the fair value is calculated using standard financial valuation models, based upon the relevant market rates at the reporting date.
The Group applies hedge accounting in accordance with IAS 39 to reduce income statement volatility. Depending on the nature of the hedged risk, a distinction is made between fair value hedges, cash flow hedges and hedges of a net investment in a foreign entity.
Fair value hedges are hedges of the exposure to variability in the fair value of recognized assets and liabilities. The derivatives classified as fair value hedges are carried at fair value and the related hedged items (assets or liabilities) are remeasured for fair value changes due to the hedged risk. The corresponding changes in fair value are recognized in the income statement. When a hedge ceases to be highly effective, hedge accounting is discontinued and the adjustment to the carrying amount of a hedged interest-bearing financial instrument is recognized as income or expense and will be fully amortized over the remaining period to maturity of the hedged item.
Cash flow hedges are hedges of the exposure to variability in future cash flows related to recognized assets or liabilities, highly probable forecast transactions or currency risk on unrecognized firm commitments. Changes in the fair value of a hedging instrument that qualifies as a highly effective cash flow hedge are recognized directly in shareholders’ equity (hedging reserve). The ineffective portion is recognized immediately in the income statement. If the hedged cash flow results in the recognition of a non-financial asset or liability, all gains and losses previously recognized directly in equity are transferred from equity and included in the initial measurement of the cost or carrying amount of the asset or liability. For all other cash flow hedges, gains and losses initially recognized in equity are transferred from the hedging reserve to the income statement when the hedged firm commitment or forecast transaction results in the recognition of a profit or loss. When the hedge ceases to be highly effective, hedge accounting is discontinued prospectively and the accumulated gain or loss is retained in equity until the committed or forecast transaction occurs. If the forecast transaction is no longer expected to occur, any net cumulative gain or loss previously reported in equity is transferred to the income statement.
If a net investment in a foreign entity is hedged, all gains or losses on the effective portion of the hedging instrument, together with any gains or losses on the foreign-currency translation of the
hedged investment, are taken directly to equity. Any gains or losses on the ineffective portion are recognized immediately in the income statement. The cumulative remeasurement gains and losses on the hedging instrument, that had previously been recognized directly in equity, and the gains and losses on the currency translation of the hedged item are recognized in the income statement only on disposal of the investment.
In order to comply with the requirements of IAS 39 regarding the use of hedge accounting, the strategy and purpose of the hedge, the relationship between the financial instrument used as the hedging instrument and the hedged item and the estimated (prospective) effectiveness are documented by the Group at the inception of the hedge. The effectiveness of existing hedges is monitored on a quarterly basis. Hedge accounting for ineffective hedges is discontinued immediately.
The Group also uses derivatives that do not satisfy the hedge accounting criteria of IAS 39 but provide effective economic hedges under the Group's risk management policies. Changes in the fair value of any such derivatives are recognized immediately in the income statement.
Impairment of assets
Goodwill and intangible assets with an indefinite useful life or not yet available for use are reviewed for impairment at least annually; other tangible and intangible fixed assets are reviewed for impairment whenever events or changes in circumstances indicate that their carrying amount may not be recoverable. An impairment loss is recognized in the income statement as and when the carrying amount of an asset exceeds its recoverable amount (being the higher of its fair value less costs to sell and its value in use). The fair value less costs to sell is the amount obtainable from the sale of an asset in an arm’s length transaction less the costs to sell, while value in use is the present value of the future cash flows expected to be derived from an asset. Recoverable amounts are estimated for individual assets or, if this is not possible, for the cash-generating unit to which the assets belong. Reversal of impairment losses recognized in prior years is included as income when there is an indication that the impairment losses recognized for the asset are no longer needed or the need has decreased, except for impairment losses on goodwill, which are never reversed.
2.4. Income statement items
Revenue recognition
Revenue is recognized when it is probable that the economic benefits associated with a transaction will flow to the entity and the amount of the revenue can be measured reliably. Sales are recognized net of sales taxes and discounts. Revenue from the sale of goods is recognized when delivery takes place and
Financial Review Bekaert Annual Report 2012 18
the transfer of risks and rewards is completed. When it can be measured reliably, revenue from construction contracts is recognized by reference to the stage of completion. When the outcome of a construction contract cannot be estimated reliably, contract revenue is recognized only to the extent of the contract costs incurred that are likely to be recoverable. In the period in which it is determined that a loss will result from the performance of a contract, the entire amount of the estimated ultimate loss is charged against income. No revenue is recognized on barter transactions involving the exchange of similar goods or services. Interest is recognized on a time-proportional basis that reflects the effective yield on the asset. Royalties are recognized on an accrual basis in accordance with the terms of agreements. Dividends are recognized when the shareholder's right to receive payment is established.
Non-recurring items
Operating income and expenses that are related to restructuring programs, impairment losses, business combinations, business disposals, environmental provisions or other events and transactions that have a one-time effect are presented on the face of the income statement as non-recurring items. Restructuring programs mainly include lay-off costs, gains and losses on disposal, and impairment losses of assets involved in a shut-down, major reorganization or relocation of operations. When not related to restructuring programs, only impairment losses resulting either from testing Cash-Generating Units or from intragroup transfers qualify as non-recurring items. Non-recurring items from business combinations mainly include: negative goodwill, gains and losses on step acquisition, and recycling of CTA on the interest previously held. Non-recurring items from business disposals include gains and losses on the sale of businesses that do not qualify as discontinued operations. These disposed businesses may consist of integral, or parts (disposal groups) of, subsidiaries, joint-ventures and associates. Besides environmental provisions, other events or transactions that have a one-time effect mainly include sales of investment property and significant litigations. Bekaert believes that the separate presentation of non-recurring items is essential for the readers of its financial statements who want to analyze comparable figures.
2.5. Statement of comprehensive income and statement of changes in equity
The statement of comprehensive income presents an overview of all income and expenses recognized both in the income statement and in equity. In accordance with IAS 1 Presentation of Financial Statements, an entity can elect to present either a single statement of comprehensive income or two statements, i.e. an income statement immediately
followed by a comprehensive income statement. The Group elected to do the latter. A further consequence of presenting a statement of comprehensive income is that the content of the statement of changes in equity is confined to owner-related changes only.
2.6. Miscellaneous
Non-current assets held for sale and
discontinued operations
A non-current asset or disposal group is classified as held for sale if its carrying amount will be recovered principally through a sale transaction rather than through continuing use. This condition is regarded as met only when the sale is highly probable and the asset (or disposal group) is available for immediate sale in its present condition. A discontinued operation is a component of an entity which the entity has disposed of or which is classified as held for sale, which represents a separate major line of business or geographical area of operations and which can be distinguished operationally and for financial reporting purposes.
For a sale to be highly probable, the entity should be committed to a plan to sell the asset (or disposal group), an active program to locate a buyer and complete the plan should be initiated, and the asset (or disposal group) should be actively marketed at a price which is reasonable in relation to its current fair value, and the sale should be expected to be completed within one year from the date of classification. Assets classified as held for sale are measured at the lower of their carrying amount and fair value less costs necessary to make the sale. Any excess of the carrying amount over the fair value less costs to sell is included as an impairment loss. Depreciation of such assets is discontinued as from their classification as held for sale. Comparative balance sheet information for prior periods is not restated to reflect the new classification in the balance sheet.
Contingencies
Contingent assets are not recognized in the financial statements. They are disclosed if the inflow of economic benefits is probable. Contingent liabilities are not recognized in the financial statements, except if they arise from a business combination. They are disclosed unless the possibility of a loss is remote.
Events after the balance sheet date
Events after the balance sheet date which provide additional information about the company’s position as at the balance sheet date (adjusting events) are reflected in the financial statements. Events after the balance sheet date which are not adjusting events are disclosed in the notes if material.
Bekaert Annual Report 2012 Financial Review 19
Be
ka
ert: F
inan
cia
l revie
w
3. Critical accounting judgments and key sources of estimation uncertainty
In the application of the Group’s accounting policies, management is required to make judgments, estimates and assumptions about the carrying amounts of assets and liabilities that are not readily apparent from other sources. These judgments, estimates and assumptions are reviewed on an ongoing basis.
3.1. Critical judgments in applying the entity’s accounting policies
The following are the critical judgments made by management, apart from those involving estimations (see note 3.2. below), that have a significant effect on the amounts reported in the consolidated financial statements.
- Management assessed that a constructive obligation exists to provide pre-retirement schemes for employees as from the first day of service (see note 6.15. ‘Employee benefit obligations’) and therefore these pre-retirement schemes are treated as defined-benefit plans using the projected unit credit method.
- Management concluded that the criteria for capitalizing development expenditure were not met (see note 6.1. ‘Intangible assets’).
- Management concluded that the functional currency of Bekaert Izmit Celik Kord Sanayi ve Ticaret AS (Turkey) is the euro, consistent with the current economic substance of the transactions relevant to that entity.
- Management concluded, based on an assessment of recent significant changes in the economic environment, that the functional currency of Vicson SA (Venezuela) at the balance sheet date is the bolivar fuerte (VEF) instead of
the US dollar. The ever increasing monetary restrictions on USD transactions have led to a de facto dominance of the VEF in the company’s day-to-day transactions. The transition date is established at 31 December 2012. Consequently, since the Venezuelan economy is generally recognized as hyperinflationary, Vicson SA will also apply IAS 29, Financial Reporting in Hyperinflationary Economies, prospectively as from the transition date. Moreover, in view of the restrictions on dividend repatriation for overseas investors introduced in 2009, and given the dramatic decline in the corresponding economic rate during 2012 (from 8.6 to 17.2 VEF/USD vs. the SITME rate of 5.4 VEF/USD which remained constant), management decided to use the
corresponding economic rate for translating the VEF financial statements to the reporting currency for consolidation. Management deems this to be the best choice for providing a true and fair view of the contribution of the Venezuelan operations to the consolidated financial statements. When accounting for foreign currency transactions in its single entity financial statements, Vicson SA has used the SITME rate (5.4 VEF/USD) as long as it was a viable alternative for the official rate (4.3 VEF/USD) and has recognized a realized exchange result when a transaction was settled at another rate. However, on 13 February 2013, the authorities announced both a devaluation of the VEF from 4.3 to 6.3 VEF/USD and the abolishment of the SITME system. Since that date, Vicson SA uses the only remaining official rate (6.3 VEF/USD) to account for foreign currency transactions.
- Management concluded that Bekaert, given its non-controlling interest of 13.0% at year-end 2012, has no significant influence in Shougang Concord Century Holdings Ltd and therefore the investment is a financial asset available for sale accounted for at fair value through equity. As any significant or prolonged decline in fair value provides objective evidence for impairment, management agreed to consider any decline in fair value (a) exceeding 30% of the cost as significant and b) continuing for more than one year as prolonged. Consequently, management assessed that the investment was impaired at 30 June 2012.
- Given its global presence, Bekaert is exposed to tax risks in many jurisdictions. Tax authorities in those jurisdictions conduct regular tax audits which may reveal potential tax issues. While the outcome of such tax audits is not certain, management is convinced that Bekaert, based on an overall evaluation of potential tax liabilities, has recorded adequate tax liabilities in its consolidated financial statements.
- Management concluded that the Company has control over Bekaert Ansteel Tire Cord (Chongqing) Co Ltd and accordingly consolidates this entity.
- Although the guaranteed return on defined contribution plans in Belgium has recently been lowered by the insurance companies and now falls short of the legal threshold (3.25%), management concluded that there is no material risk at the balance sheet date. Hence, these plans are still accounted for as defined contribution plans and not as defined benefit plans.
Financial Review Bekaert Annual Report 2012 20
3.2. Key sources of estimation uncertainty
The following are the key assumptions concerning the future, and the other key sources of estimation uncertainty at the end of the reporting period that have a significant risk of causing material adjustments to the carrying amounts of assets and liabilities within the next financial year.
- Management concluded that the collapse of the solar industry is a decisive impairment indicator for the Group’s sawing wire business. The sawing wire activities in EMEA and North America were stopped, and an impairment test was conducted on the remaining cash-generating unit (CGU) in Asia Pacific. In its cash flow projections, management assumed that prices and margins are not going to recover from their present levels and used a discount rate of 10.4% (in line with the WACC for the CNY region, see note 6.2. ‘Goodwill’). Consequently, the recoverable amount of the CGU was based on the fair value less costs to sell, using following assumptions:
- Land and buildings are likely to be redeployed for other activities and are not impaired.
- The fair value of plant, machinery and equipment that is likely to be redeployed for other activities is based on the Group’s transfer pricing policy.
- All other plant, machinery and equipment is fully impaired.
- Deferred tax assets are recognized for the carry-forward of unused tax losses and unused tax credits to the extent that it is probable that future taxable profit will be available against which the unused tax losses and unused tax credits can be utilized. In making its judgment, management takes into account elements such as long-term business strategy and tax planning opportunities (see note 6.6. ‘Deferred tax assets and liabilities’).
- Based on the expected economic life of specific product lines, which is expected to be significantly shorter than average, higher depreciation rates are applied to dedicated assets which are not expected to be reallocated to another product line. Consequently, depreciation percentages ranging from 10% to 25% are used instead of 8% for plant, machinery and equipment. R&D testing equipment dedicated to specific product lines is also depreciated at 25% p.a. Other R&D testing equipment is depreciated at 16.7% p.a.
- Credit risk related to customers: management closely reviews the outstanding trade receivables, also considering ageing, payment history and credit risk coverage. Specific and general bad debt allowances recognized are based on management’s best estimates at the balance sheet date (see note 6.7. ‘Operating working capital’).
- Employee benefit obligations: the defined-benefit obligations are based on actuarial assumptions
such as discount rate and expected rate of return on plan assets, which are extensively detailed in note 6.15. ‘Employee benefit obligations’.
- Provisions for environmental issues: at each year-end an estimate is made of future expenses in respect of soil pollution, based on the advice of an external expert (see note 6.16. ‘Provisions’).
- Impairment: the Group performs annual impairment tests on goodwill and on cash-generating units for which there are indicators that the carrying amount might be higher than the recoverable amount. This analysis is based upon assumptions such as market evolution, market share, margin evolution and discount rates (see note 6.2. ‘Goodwill’).
- According to Chinese tax legislation and regulation, certain entities of the Group which enjoy preferential treatment in the form of a reduced income tax rate are granted a gradual transition to the statutory tax rate over a five year period ending in 2012. Based on current practice, management judges that part of the investments comply with the conditions for this tax incentive. Should the tax regulation or practice change in this area, the Company may be required to update its tax liabilities or provisions.
- Tax receivable (ICMS) in Brazil: recovery of the tax receivables of Belgo Bekaert Arames Ltda and BMB-Belgo Mineira Bekaert Artefatos de Arame Ltda is deemed highly probable as several action plans have already been successfully implemented. Other tax claims in Brazil, including claims relating to the taxability of ICMS incentives received by Belgo Bekaert Nordeste (before its merger within Belgo Bekaert Arames Ltda), have not been provided for, supported by legal advice (see note 6.4. ‘Investments in joint ventures and associates’).
- Fair value adjustments for business combinations: in accordance with IFRS 3, Business Combinations (revised 2008), Bekaert remeasures the assets, liabilities and contingent liabilities acquired through a business combination to fair value. Similarly, consideration (including consideration in shares), contingent consideration and any stake in the acquiree held prior to the business combination are also measured at fair value. When significant influence is acquired in an associate, or joint control is acquired in a joint venture, Bekaert also remeasures its share in the assets, liabilities and contingent liabilities in that associate or joint venture to its acquisition-date fair value. Where possible, fair value adjustments are based on external appraisals or valuation models, e.g. for contingent liabilities and intangible assets which were not recognized by the acquiree. Internal benchmarks are often used for valuing specific production equipment. All of these valuation methods rely on various assumptions such as estimated future cash flows, remaining useful
economic life etc.
Bekaert Annual Report 2012 Financial Review 21
Be
ka
ert: F
inan
cia
l revie
w
4. Segment reporting
The Group uses a geographical segmentation since it is the best enabler to evaluate the nature and financial effects of the business and to make stakeholders understand our business as a whole in a transparent way. Key in this approach has been the increasing importance of the regions following from the Company’s growth strategy, with a clear focus on the emerging markets.
The Company’s regional businesses are typically characterized by common cost drivers, a product portfolio that is tailored to regional industry requirements, and specific distribution channels. They distinguish themselves in terms of political, economic and currency risks and growth drivers of the business. Adding to the relevance of the segmentation is the fact that the Company sells approximately 90% of its products in the region where they are produced. According to IFRS 8, four reporting segments have been defined, reflecting the company’s presence in four main regions:
1) EMEA – Europe, Middle-East and Africa (2012: 30% of consolidated sales) 2) North America (2012: 19% of consolidated sales) 3) Latin America (2012: 24% of consolidated sales) 4) Asia Pacific (2012: 27% of consolidated sales)
Key data by reporting segment
Only capital employed elements (intangible assets, goodwill, property, plant and equipment and the elements of the operating working capital) are allocated to the various segments. All other assets and liabilities are reported as unallocated corporate assets or liabilities. ‘Group & Business support’ mainly consists of the functional unit technology and unallocated expenses for group management and services; it does not constitute a reportable segment in itself. The geographical segmentation is based on the location of the Bekaert entities rather than on the location of its customers. Since it is Bekaert’s strategy to produce as close as possible to the customers, most customers are serviced by Bekaert entities in their own region. Any sales between segments are transacted at
prices which reflect the arm’s length principle.
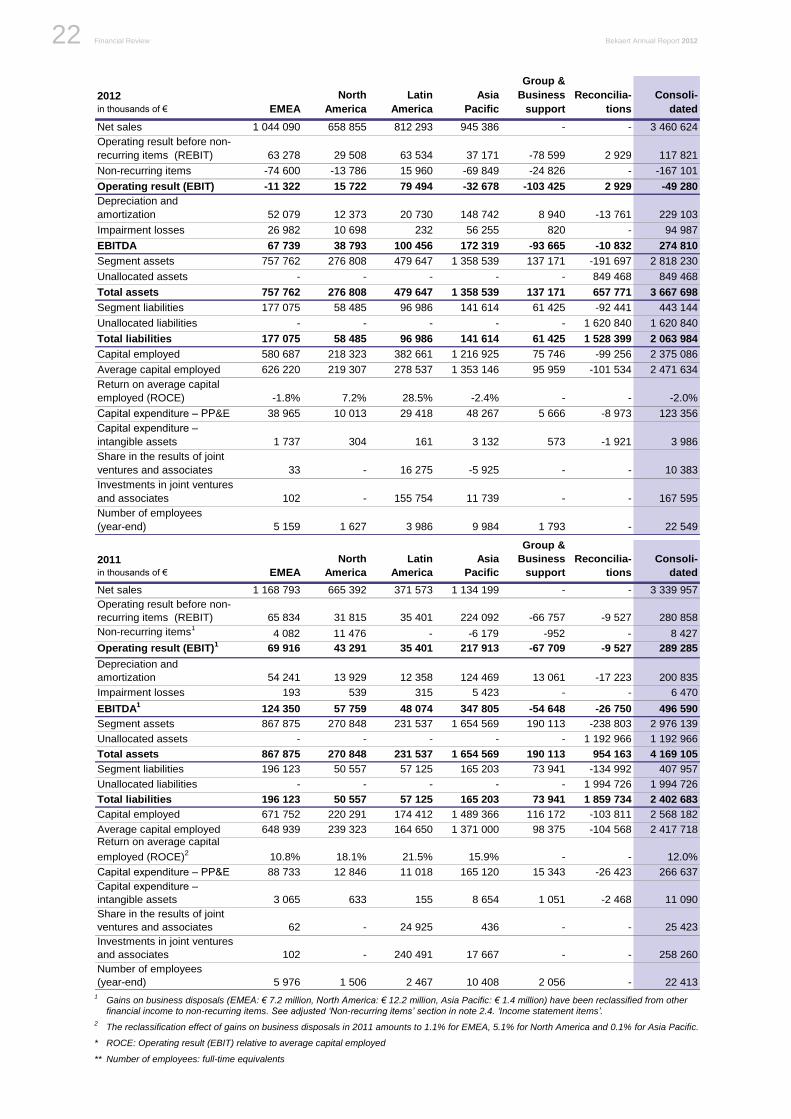
Financial Review Bekaert Annual Report 2012 22
2012
in thousands of € EMEA
North
America
Latin
America
Asia
Pacific
Group &
Business
support
Reconcilia-
tions
Consoli-
dated
Net sales 1 044 090 658 855 812 293 945 386 - - 3 460 624
Operating result before non-
recurring items (REBIT) 63 278 29 508 63 534 37 171 -78 599 2 929 117 821
Non-recurring items -74 600 -13 786 15 960 -69 849 -24 826 - -167 101
Operating result (EBIT) -11 322 15 722 79 494 -32 678 -103 425 2 929 -49 280
Depreciation and
amortization 52 079 12 373 20 730 148 742 8 940 -13 761 229 103
Impairment losses 26 982 10 698 232 56 255 820 - 94 987
EBITDA 67 739 38 793 100 456 172 319 -93 665 -10 832 274 810
Segment assets 757 762 276 808 479 647 1 358 539 137 171 -191 697 2 818 230
Unallocated assets - - - - - 849 468 849 468
Total assets 757 762 276 808 479 647 1 358 539 137 171 657 771 3 667 698
Segment liabilities 177 075 58 485 96 986 141 614 61 425 -92 441 443 144
Unallocated liabilities - - - - - 1 620 840 1 620 840
Total liabilities 177 075 58 485 96 986 141 614 61 425 1 528 399 2 063 984
Capital employed 580 687 218 323 382 661 1 216 925 75 746 -99 256 2 375 086
Average capital employed 626 220 219 307 278 537 1 353 146 95 959 -101 534 2 471 634
Return on average capital
employed (ROCE) -1.8% 7.2% 28.5% -2.4% - - -2.0%
Capital expenditure – PP&E 38 965 10 013 29 418 48 267 5 666 -8 973 123 356
Capital expenditure –
intangible assets 1 737 304 161 3 132 573 -1 921 3 986
Share in the results of joint
ventures and associates 33 - 16 275 -5 925 - - 10 383
Investments in joint ventures
and associates 102 - 155 754 11 739 - - 167 595
Number of employees
(year-end) 5 159 1 627 3 986 9 984 1 793 - 22 549
2011
in thousands of € EMEA
North
America
Latin
America
Asia
Pacific
Group &
Business
support
Reconcilia-
tions
Consoli-
dated
Net sales 1 168 793 665 392 371 573 1 134 199 - - 3 339 957
Operating result before non-
recurring items (REBIT) 65 834 31 815 35 401 224 092 -66 757 -9 527 280 858
Non-recurring items1
4 082 11 476 - -6 179 -952 - 8 427
Operating result (EBIT)1
69 916 43 291 35 401 217 913 -67 709 -9 527 289 285
Depreciation and
amortization 54 241 13 929 12 358 124 469 13 061 -17 223 200 835
Impairment losses 193 539 315 5 423 - - 6 470
EBITDA1
124 350 57 759 48 074 347 805 -54 648 -26 750 496 590
Segment assets 867 875 270 848 231 537 1 654 569 190 113 -238 803 2 976 139
Unallocated assets - - - - - 1 192 966 1 192 966
Total assets 867 875 270 848 231 537 1 654 569 190 113 954 163 4 169 105
Segment liabilities 196 123 50 557 57 125 165 203 73 941 -134 992 407 957
Unallocated liabilities - - - - - 1 994 726 1 994 726
Total liabilities 196 123 50 557 57 125 165 203 73 941 1 859 734 2 402 683
Capital employed 671 752 220 291 174 412 1 489 366 116 172 -103 811 2 568 182
Average capital employed 648 939 239 323 164 650 1 371 000 98 375 -104 568 2 417 718
Return on average capital
employed (ROCE)2
10.8% 18.1% 21.5% 15.9% - - 12.0%
Capital expenditure – PP&E 88 733 12 846 11 018 165 120 15 343 -26 423 266 637
Capital expenditure –
intangible assets 3 065 633 155 8 654 1 051 -2 468 11 090
Share in the results of joint
ventures and associates 62 - 24 925 436 - - 25 423
Investments in joint ventures
and associates 102 - 240 491 17 667 - - 258 260
Number of employees
(year-end) 5 976 1 506 2 467 10 408 2 056 - 22 413
1 Gains on business disposals (EMEA: € 7.2 million, North America: € 12.2 million, Asia Pacific: € 1.4 million) have been reclassified from other
financial income to non-recurring items. See adjusted ‘Non-recurring items’ section in note 2.4. ‘Income statement items’.
2 The reclassification effect of gains on business disposals in 2011 amounts to 1.1% for EMEA, 5.1% for North America and 0.1% for Asia Pacific.
* ROCE: Operating result (EBIT) relative to average capital employed
** Number of employees: full-time equivalents
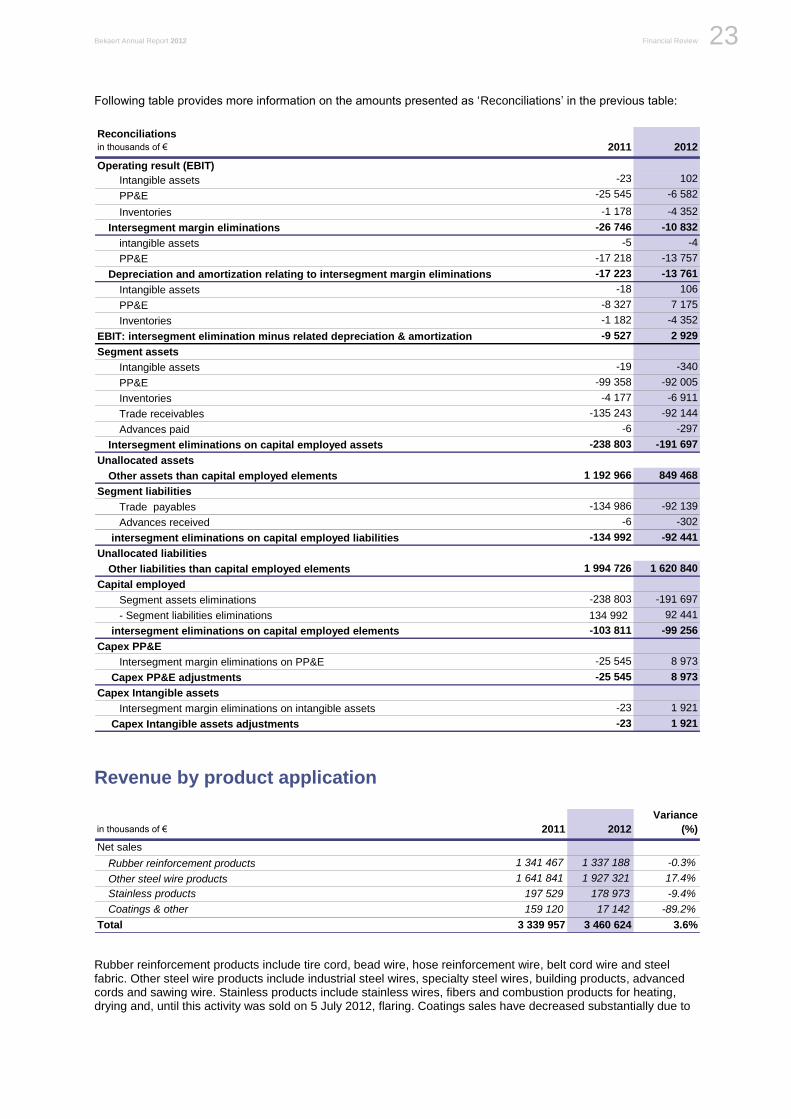
Bekaert Annual Report 2012 Financial Review 23
Be
ka
ert: F
inan
cia
l revie
w
Following table provides more information on the amounts presented as ‘Reconciliations’ in the previous table:
Reconciliations
in thousands of € 2011 2012
Operating result (EBIT)
Intangible assets -23 102
PP&E -25 545 -6 582
Inventories -1 178 -4 352
Intersegment margin eliminations -26 746 -10 832
intangible assets -5 -4
PP&E -17 218 -13 757
Depreciation and amortization relating to intersegment margin eliminations -17 223 -13 761
Intangible assets -18 106
PP&E -8 327 7 175
Inventories -1 182 -4 352
EBIT: intersegment elimination minus related depreciation & amortization -9 527 2 929
Segment assets
Intangible assets -19 -340
PP&E -99 358 -92 005
Inventories -4 177 -6 911
Trade receivables -135 243 -92 144
Advances paid -6 -297
Intersegment eliminations on capital employed assets -238 803 -191 697
Unallocated assets
Other assets than capital employed elements 1 192 966 849 468
Segment liabilities
Trade payables -134 986 -92 139
Advances received -6 -302
intersegment eliminations on capital employed liabilities -134 992 -92 441
Unallocated liabilities
Other liabilities than capital employed elements 1 994 726 1 620 840
Capital employed
Segment assets eliminations -238 803 -191 697
- Segment liabilities eliminations 134 992 92 441
intersegment eliminations on capital employed elements -103 811 -99 256
Capex PP&E
Intersegment margin eliminations on PP&E -25 545 8 973
Capex PP&E adjustments -25 545 8 973
Capex Intangible assets
Intersegment margin eliminations on intangible assets -23 1 921
Capex Intangible assets adjustments -23 1 921
Revenue by product application
in thousands of € 2011 2012
Variance
(%)
Net sales
Rubber reinforcement products 1 341 467 1 337 188 -0.3%
Other steel wire products 1 641 841 1 927 321 17.4%
Stainless products 197 529 178 973 -9.4%
Coatings & other 159 120 17 142 -89.2%
Total 3 339 957 3 460 624 3.6%
Rubber reinforcement products include tire cord, bead wire, hose reinforcement wire, belt cord wire and steel fabric. Other steel wire products include industrial steel wires, specialty steel wires, building products, advanced cords and sawing wire. Stainless products include stainless wires, fibers and combustion products for heating, drying and, until this activity was sold on 5 July 2012, flaring. Coatings sales have decreased substantially due to
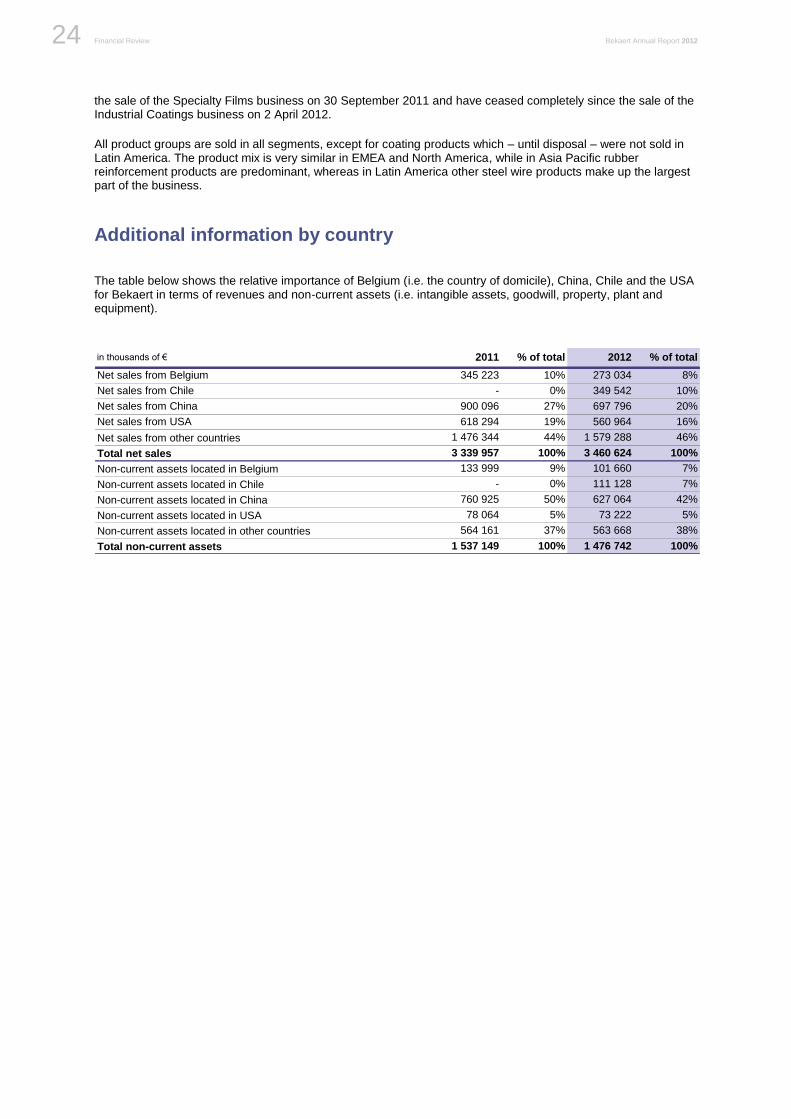
Financial Review Bekaert Annual Report 2012 24
the sale of the Specialty Films business on 30 September 2011 and have ceased completely since the sale of the Industrial Coatings business on 2 April 2012.
All product groups are sold in all segments, except for coating products which – until disposal – were not sold in Latin America. The product mix is very similar in EMEA and North America, while in Asia Pacific rubber reinforcement products are predominant, whereas in Latin America other steel wire products make up the largest part of the business.
Additional information by country
The table below shows the relative importance of Belgium (i.e. the country of domicile), China, Chile and the USA for Bekaert in terms of revenues and non-current assets (i.e. intangible assets, goodwill, property, plant and equipment).
in thousands of € 2011 % of total 2012 % of total
Net sales from Belgium 345 223 10% 273 034 8%
Net sales from Chile - 0% 349 542 10%
Net sales from China 900 096 27% 697 796 20%
Net sales from USA 618 294 19% 560 964 16%
Net sales from other countries 1 476 344 44% 1 579 288 46%
Total net sales 3 339 957 100% 3 460 624 100%
Non-current assets located in Belgium 133 999 9% 101 660 7%
Non-current assets located in Chile - 0% 111 128 7%
Non-current assets located in China 760 925 50% 627 064 42%
Non-current assets located in USA 78 064 5% 73 222 5%
Non-current assets located in other countries 564 161 37% 563 668 38%
Total non-current assets 1 537 149 100% 1 476 742 100%
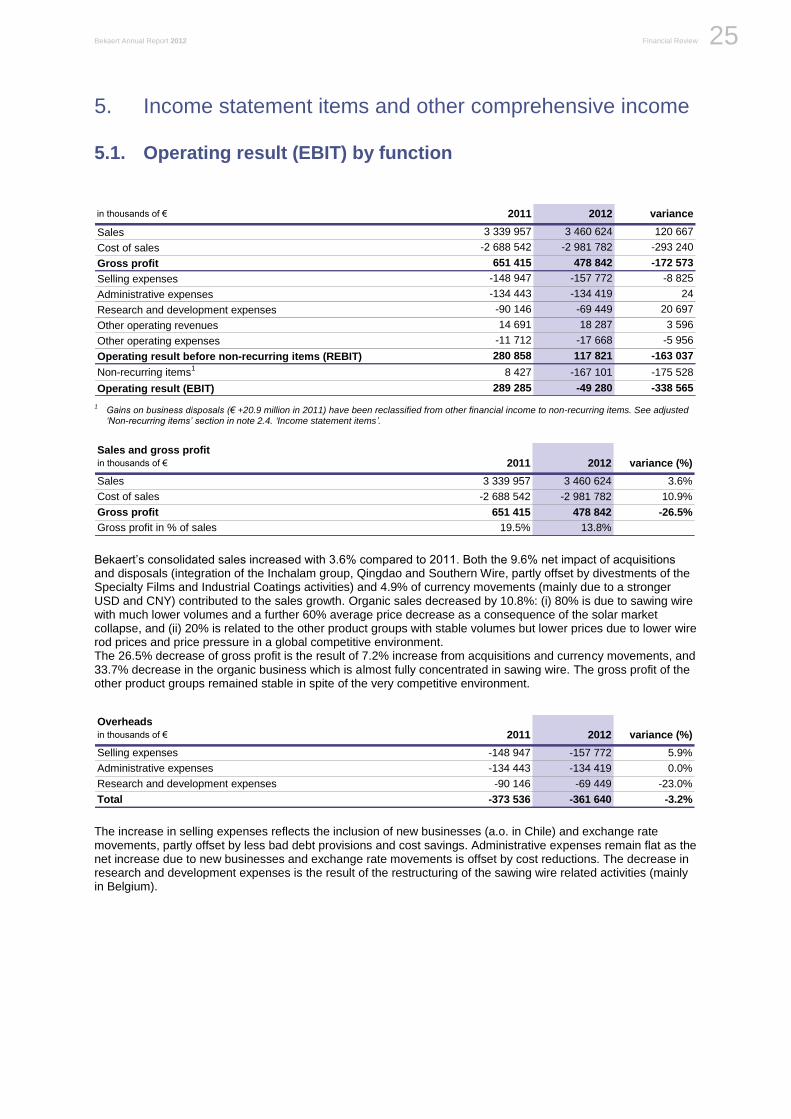
Bekaert Annual Report 2012 Financial Review 25
Be
ka
ert: F
inan
cia
l revie
w
5. Income statement items and other comprehensive income
5.1. Operating result (EBIT) by function
in thousands of € 2011 2012 variance
Sales 3 339 957 3 460 624 120 667
Cost of sales -2 688 542 -2 981 782 -293 240
Gross profit 651 415 478 842 -172 573
Selling expenses -148 947 -157 772 -8 825
Administrative expenses -134 443 -134 419 24
Research and development expenses -90 146 -69 449 20 697
Other operating revenues 14 691 18 287 3 596
Other operating expenses -11 712 -17 668 -5 956
Operating result before non-recurring items (REBIT) 280 858 117 821 -163 037
Non-recurring items1
8 427 -167 101 -175 528
Operating result (EBIT) 289 285 -49 280 -338 565
1 Gains on business disposals (€ +20.9 million in 2011) have been reclassified from other financial income to non-recurring items. See adjusted
‘Non-recurring items’ section in note 2.4. ‘Income statement items’.
Sales and gross profit
in thousands of € 2011 2012 variance (%)
Sales 3 339 957 3 460 624 3.6%
Cost of sales -2 688 542 -2 981 782 10.9%
Gross profit 651 415 478 842 -26.5%
Gross profit in % of sales 19.5% 13.8%
Bekaert’s consolidated sales increased with 3.6% compared to 2011. Both the 9.6% net impact of acquisitions and disposals (integration of the Inchalam group, Qingdao and Southern Wire, partly offset by divestments of the Specialty Films and Industrial Coatings activities) and 4.9% of currency movements (mainly due to a stronger USD and CNY) contributed to the sales growth. Organic sales decreased by 10.8%: (i) 80% is due to sawing wire with much lower volumes and a further 60% average price decrease as a consequence of the solar market collapse, and (ii) 20% is related to the other product groups with stable volumes but lower prices due to lower wire rod prices and price pressure in a global competitive environment. The 26.5% decrease of gross profit is the result of 7.2% increase from acquisitions and currency movements, and 33.7% decrease in the organic business which is almost fully concentrated in sawing wire. The gross profit of the other product groups remained stable in spite of the very competitive environment.
Overheads
in thousands of € 2011 2012 variance (%)
Selling expenses -148 947 -157 772 5.9%
Administrative expenses -134 443 -134 419 0.0%
Research and development expenses -90 146 -69 449 -23.0%
Total -373 536 -361 640 -3.2%
The increase in selling expenses reflects the inclusion of new businesses (a.o. in Chile) and exchange rate movements, partly offset by less bad debt provisions and cost savings. Administrative expenses remain flat as the net increase due to new businesses and exchange rate movements is offset by cost reductions. The decrease in research and development expenses is the result of the restructuring of the sawing wire related activities (mainly in Belgium).
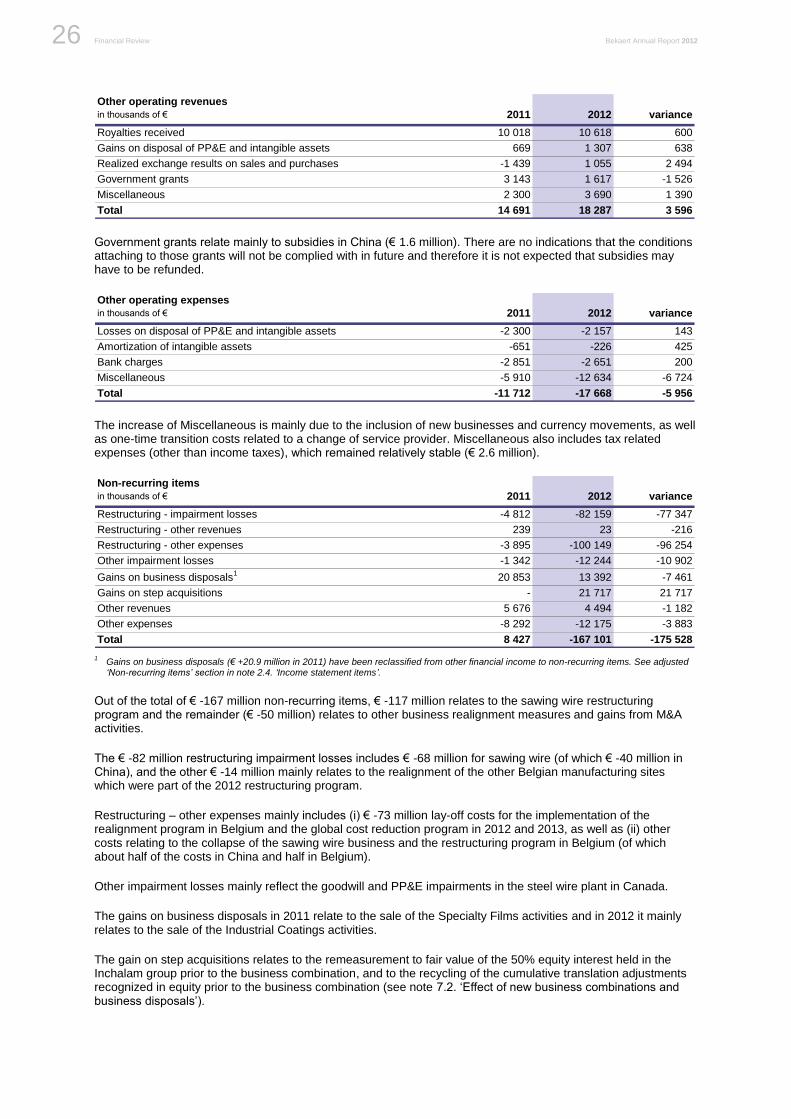
Financial Review Bekaert Annual Report 2012 26
Other operating revenues
in thousands of € 2011 2012 variance
Royalties received 10 018 10 618 600
Gains on disposal of PP&E and intangible assets 669 1 307 638
Realized exchange results on sales and purchases -1 439 1 055 2 494
Government grants 3 143 1 617 -1 526
Miscellaneous 2 300 3 690 1 390
Total 14 691 18 287 3 596
Government grants relate mainly to subsidies in China (€ 1.6 million). There are no indications that the conditions attaching to those grants will not be complied with in future and therefore it is not expected that subsidies may have to be refunded.
Other operating expenses
in thousands of € 2011 2012 variance
Losses on disposal of PP&E and intangible assets -2 300 -2 157 143
Amortization of intangible assets -651 -226 425
Bank charges -2 851 -2 651 200
Miscellaneous -5 910 -12 634 -6 724
Total -11 712 -17 668 -5 956
The increase of Miscellaneous is mainly due to the inclusion of new businesses and currency movements, as well as one-time transition costs related to a change of service provider. Miscellaneous also includes tax related expenses (other than income taxes), which remained relatively stable (€ 2.6 million).
Non-recurring items
in thousands of € 2011 2012 variance
Restructuring - impairment losses -4 812 -82 159 -77 347
Restructuring - other revenues 239 23 -216
Restructuring - other expenses -3 895 -100 149 -96 254
Other impairment losses -1 342 -12 244 -10 902
Gains on business disposals1
20 853 13 392 -7 461
Gains on step acquisitions - 21 717 21 717
Other revenues 5 676 4 494 -1 182
Other expenses -8 292 -12 175 -3 883
Total 8 427 -167 101 -175 528 1 Gains on business disposals (€ +20.9 million in 2011) have been reclassified from other financial income to non-recurring items. See adjusted
‘Non-recurring items’ section in note 2.4. ‘Income statement items’.
Out of the total of € -167 million non-recurring items, € -117 million relates to the sawing wire restructuring program and the remainder (€ -50 million) relates to other business realignment measures and gains from M&A activities.
The € -82 million restructuring impairment losses includes € -68 million for sawing wire (of which € -40 million in China), and the other € -14 million mainly relates to the realignment of the other Belgian manufacturing sites which were part of the 2012 restructuring program.
Restructuring – other expenses mainly includes (i) € -73 million lay-off costs for the implementation of the realignment program in Belgium and the global cost reduction program in 2012 and 2013, as well as (ii) other costs relating to the collapse of the sawing wire business and the restructuring program in Belgium (of which about half of the costs in China and half in Belgium).
Other impairment losses mainly reflect the goodwill and PP&E impairments in the steel wire plant in Canada.
The gains on business disposals in 2011 relate to the sale of the Specialty Films activities and in 2012 it mainly relates to the sale of the Industrial Coatings activities.
The gain on step acquisitions relates to the remeasurement to fair value of the 50% equity interest held in the Inchalam group prior to the business combination, and to the recycling of the cumulative translation adjustments recognized in equity prior to the business combination (see note 7.2. ‘Effect of new business combinations and business disposals’).
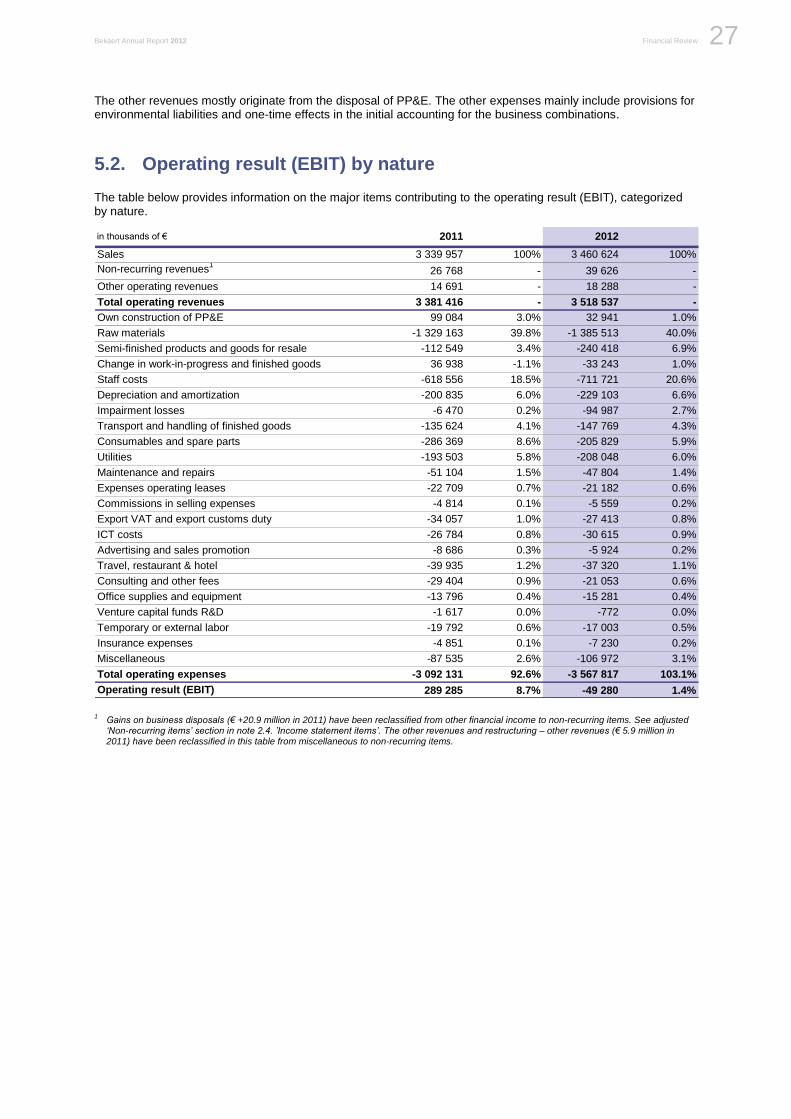
Bekaert Annual Report 2012 Financial Review 27
Be
ka
ert: F
inan
cia
l revie
w
The other revenues mostly originate from the disposal of PP&E. The other expenses mainly include provisions for environmental liabilities and one-time effects in the initial accounting for the business combinations.
5.2. Operating result (EBIT) by nature
The table below provides information on the major items contributing to the operating result (EBIT), categorized by nature.
in thousands of € 2011 2012
Sales 3 339 957 100% 3 460 624 100%
Non-recurring revenues1
26 768 - 39 626 -
Other operating revenues 14 691 - 18 288 -
Total operating revenues 3 381 416 - 3 518 537 -
Own construction of PP&E 99 084 3.0% 32 941 1.0%
Raw materials -1 329 163 39.8% -1 385 513 40.0%
Semi-finished products and goods for resale -112 549 3.4% -240 418 6.9%
Change in work-in-progress and finished goods 36 938 -1.1% -33 243 1.0%
Staff costs -618 556 18.5% -711 721 20.6%
Depreciation and amortization -200 835 6.0% -229 103 6.6%
Impairment losses -6 470 0.2% -94 987 2.7%
Transport and handling of finished goods -135 624 4.1% -147 769 4.3%
Consumables and spare parts -286 369 8.6% -205 829 5.9%
Utilities -193 503 5.8% -208 048 6.0%
Maintenance and repairs -51 104 1.5% -47 804 1.4%
Expenses operating leases -22 709 0.7% -21 182 0.6%
Commissions in selling expenses -4 814 0.1% -5 559 0.2%
Export VAT and export customs duty -34 057 1.0% -27 413 0.8%
ICT costs -26 784 0.8% -30 615 0.9%
Advertising and sales promotion -8 686 0.3% -5 924 0.2%
Travel, restaurant & hotel -39 935 1.2% -37 320 1.1%
Consulting and other fees -29 404 0.9% -21 053 0.6%
Office supplies and equipment -13 796 0.4% -15 281 0.4%
Venture capital funds R&D -1 617 0.0% -772 0.0%
Temporary or external labor -19 792 0.6% -17 003 0.5%
Insurance expenses -4 851 0.1% -7 230 0.2%
Miscellaneous -87 535 2.6% -106 972 3.1%
Total operating expenses -3 092 131 92.6% -3 567 817 103.1%
Operating result (EBIT) 289 285 8.7% -49 280 1.4%
1 Gains on business disposals (€ +20.9 million in 2011) have been reclassified from other financial income to non-recurring items. See adjusted ‘Non-recurring items’ section in note 2.4. ’Income statement items’. The other revenues and restructuring – other revenues (€ 5.9 million in 2011) have been reclassified in this table from miscellaneous to non-recurring items.
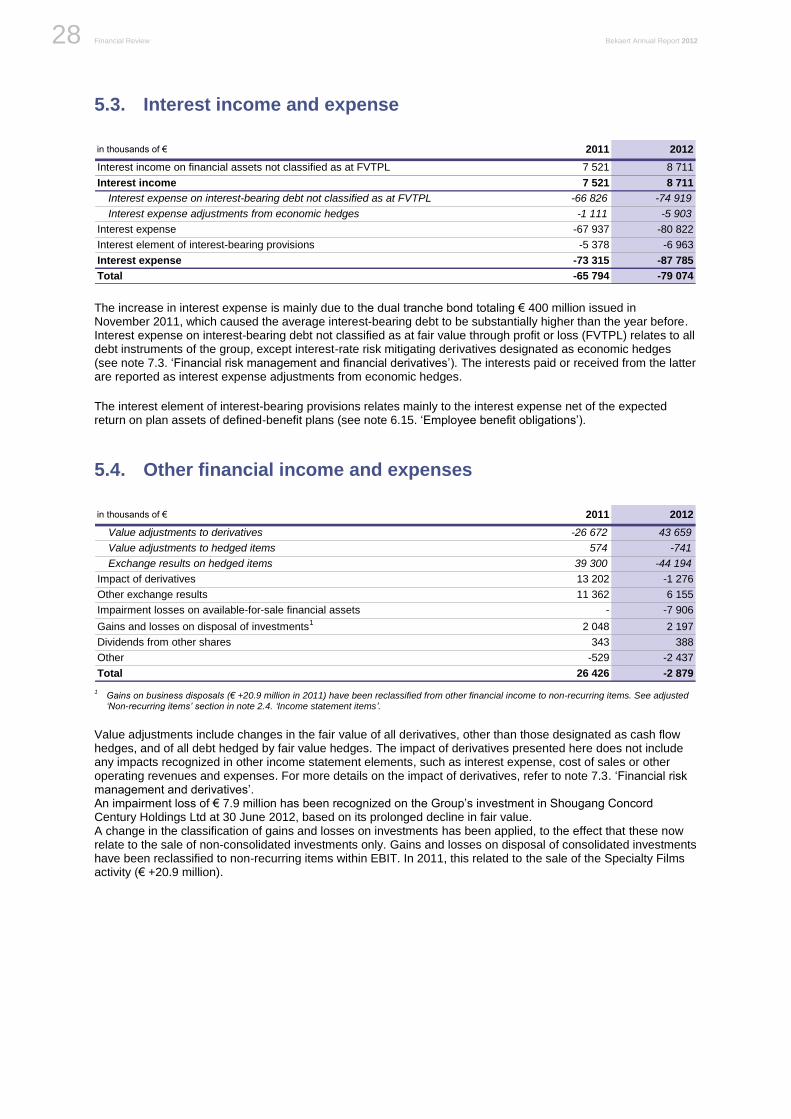
Financial Review Bekaert Annual Report 2012 28
5.3. Interest income and expense
in thousands of € 2011 2012
Interest income on financial assets not classified as at FVTPL 7 521 8 711
Interest income 7 521 8 711
Interest expense on interest-bearing debt not classified as at FVTPL -66 826 -74 919
Interest expense adjustments from economic hedges -1 111 -5 903
Interest expense -67 937 -80 822
Interest element of interest-bearing provisions -5 378 -6 963
Interest expense -73 315 -87 785
Total -65 794 -79 074
The increase in interest expense is mainly due to the dual tranche bond totaling € 400 million issued in November 2011, which caused the average interest-bearing debt to be substantially higher than the year before. Interest expense on interest-bearing debt not classified as at fair value through profit or loss (FVTPL) relates to all debt instruments of the group, except interest-rate risk mitigating derivatives designated as economic hedges (see note 7.3. ‘Financial risk management and financial derivatives’). The interests paid or received from the latter are reported as interest expense adjustments from economic hedges.
The interest element of interest-bearing provisions relates mainly to the interest expense net of the expected return on plan assets of defined-benefit plans (see note 6.15. ‘Employee benefit obligations’).
5.4. Other financial income and expenses
in thousands of € 2011 2012
Value adjustments to derivatives -26 672 43 659
Value adjustments to hedged items 574 -741
Exchange results on hedged items 39 300 -44 194
Impact of derivatives 13 202 -1 276
Other exchange results 11 362 6 155
Impairment losses on available-for-sale financial assets - -7 906
Gains and losses on disposal of investments1
2 048 2 197
Dividends from other shares 343 388
Other -529 -2 437
Total 26 426 -2 879 1 Gains on business disposals (€ +20.9 million in 2011) have been reclassified from other financial income to non-recurring items. See adjusted
‘Non-recurring items’ section in note 2.4. ‘Income statement items’.
Value adjustments include changes in the fair value of all derivatives, other than those designated as cash flow hedges, and of all debt hedged by fair value hedges. The impact of derivatives presented here does not include any impacts recognized in other income statement elements, such as interest expense, cost of sales or other operating revenues and expenses. For more details on the impact of derivatives, refer to note 7.3. ‘Financial risk management and derivatives’. An impairment loss of € 7.9 million has been recognized on the Group’s investment in Shougang Concord Century Holdings Ltd at 30 June 2012, based on its prolonged decline in fair value. A change in the classification of gains and losses on investments has been applied, to the effect that these now relate to the sale of non-consolidated investments only. Gains and losses on disposal of consolidated investments have been reclassified to non-recurring items within EBIT. In 2011, this related to the sale of the Specialty Films activity (€ +20.9 million).
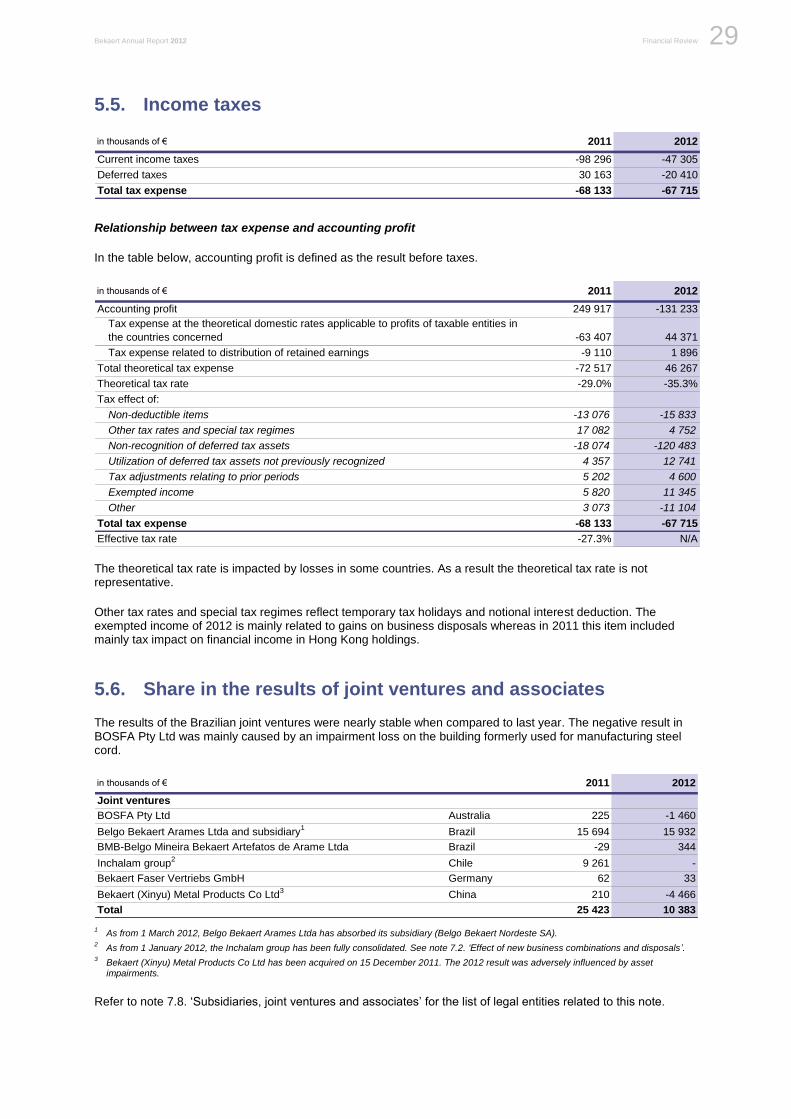
Bekaert Annual Report 2012 Financial Review 29
Be
ka
ert: F
inan
cia
l revie
w
5.5. Income taxes
in thousands of € 2011 2012
Current income taxes -98 296 -47 305
Deferred taxes 30 163 -20 410
Total tax expense -68 133 -67 715
Relationship between tax expense and accounting profit
In the table below, accounting profit is defined as the result before taxes.
in thousands of € 2011 2012
Accounting profit 249 917 -131 233
Tax expense at the theoretical domestic rates applicable to profits of taxable entities in
the countries concerned -63 407 44 371
Tax expense related to distribution of retained earnings -9 110 1 896
Total theoretical tax expense -72 517 46 267
Theoretical tax rate -29.0% -35.3%
Tax effect of:
Non-deductible items -13 076 -15 833
Other tax rates and special tax regimes 17 082 4 752
Non-recognition of deferred tax assets -18 074 -120 483
Utilization of deferred tax assets not previously recognized 4 357 12 741
Tax adjustments relating to prior periods 5 202 4 600
Exempted income 5 820 11 345
Other 3 073 -11 104
Total tax expense -68 133 -67 715
Effective tax rate -27.3% N/A
The theoretical tax rate is impacted by losses in some countries. As a result the theoretical tax rate is not representative.
Other tax rates and special tax regimes reflect temporary tax holidays and notional interest deduction. The exempted income of 2012 is mainly related to gains on business disposals whereas in 2011 this item included mainly tax impact on financial income in Hong Kong holdings.
5.6. Share in the results of joint ventures and associates
The results of the Brazilian joint ventures were nearly stable when compared to last year. The negative result in BOSFA Pty Ltd was mainly caused by an impairment loss on the building formerly used for manufacturing steel cord.
in thousands of € 2011 2012
Joint ventures
BOSFA Pty Ltd Australia 225 -1 460
Belgo Bekaert Arames Ltda and subsidiary1
Brazil 15 694 15 932
BMB-Belgo Mineira Bekaert Artefatos de Arame Ltda Brazil -29 344
Inchalam group2
Chile 9 261 -
Bekaert Faser Vertriebs GmbH Germany 62 33
Bekaert (Xinyu) Metal Products Co Ltd3
China 210 -4 466
Total 25 423 10 383
1 As from 1 March 2012, Belgo Bekaert Arames Ltda has absorbed its subsidiary (Belgo Bekaert Nordeste SA).
2 As from 1 January 2012, the Inchalam group has been fully consolidated. See note 7.2. ‘Effect of new business combinations and disposals’.
3 Bekaert (Xinyu) Metal Products Co Ltd has been acquired on 15 December 2011. The 2012 result was adversely influenced by asset
impairments.
Refer to note 7.8. ‘Subsidiaries, joint ventures and associates’ for the list of legal entities related to this note.
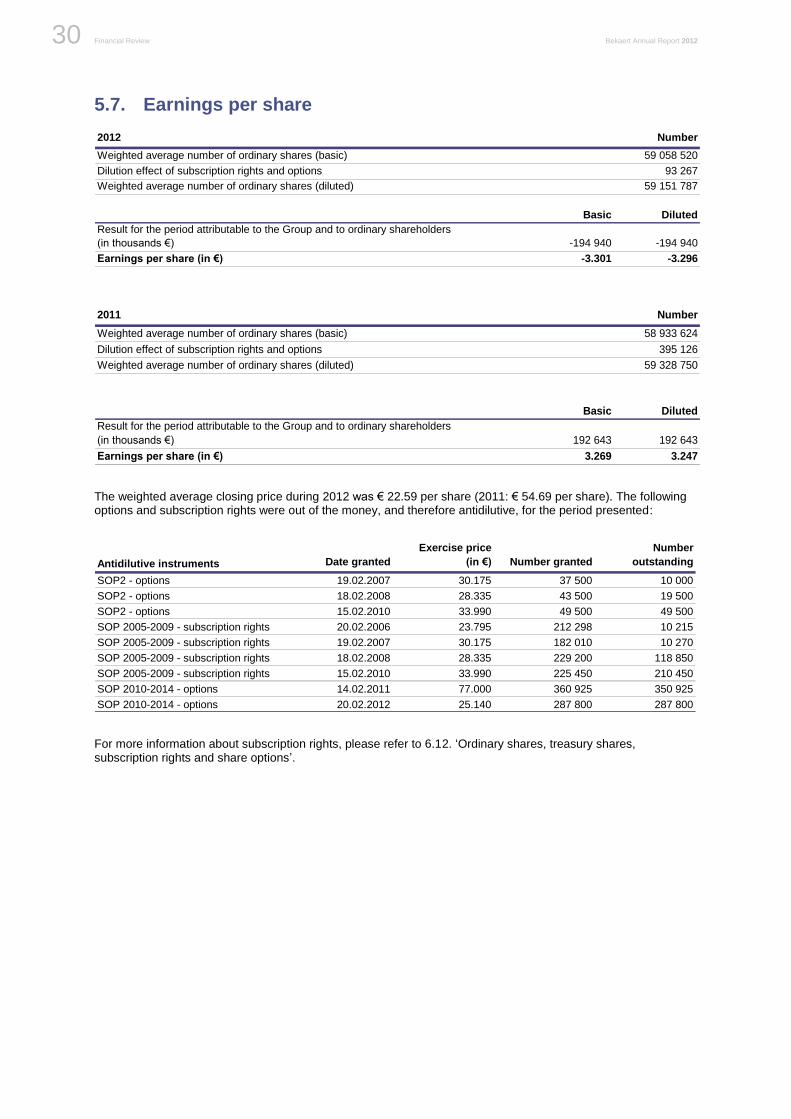
Financial Review Bekaert Annual Report 2012 30
5.7. Earnings per share
2012 Number
Weighted average number of ordinary shares (basic) 59 058 520
Dilution effect of subscription rights and options 93 267
Weighted average number of ordinary shares (diluted) 59 151 787
Basic Diluted
Result for the period attributable to the Group and to ordinary shareholders
(in thousands €) -194 940 -194 940
Earnings per share (in €) -3.301 -3.296
2011 Number
Weighted average number of ordinary shares (basic) 58 933 624
Dilution effect of subscription rights and options 395 126
Weighted average number of ordinary shares (diluted) 59 328 750
Basic Diluted
Result for the period attributable to the Group and to ordinary shareholders
(in thousands €) 192 643 192 643
Earnings per share (in €) 3.269 3.247
The weighted average closing price during 2012 was € 22.59 per share (2011: € 54.69 per share). The following options and subscription rights were out of the money, and therefore antidilutive, for the period presented:
Antidilutive instruments Date granted
Exercise price
(in €) Number granted
Number
outstanding
SOP2 - options 19.02.2007 30.175 37 500 10 000
SOP2 - options 18.02.2008 28.335 43 500 19 500
SOP2 - options 15.02.2010 33.990 49 500 49 500
SOP 2005-2009 - subscription rights 20.02.2006 23.795 212 298 10 215
SOP 2005-2009 - subscription rights 19.02.2007 30.175 182 010 10 270
SOP 2005-2009 - subscription rights 18.02.2008 28.335 229 200 118 850
SOP 2005-2009 - subscription rights 15.02.2010 33.990 225 450 210 450
SOP 2010-2014 - options 14.02.2011 77.000 360 925 350 925
SOP 2010-2014 - options 20.02.2012 25.140 287 800 287 800
For more information about subscription rights, please refer to 6.12. ‘Ordinary shares, treasury shares, subscription rights and share options’.
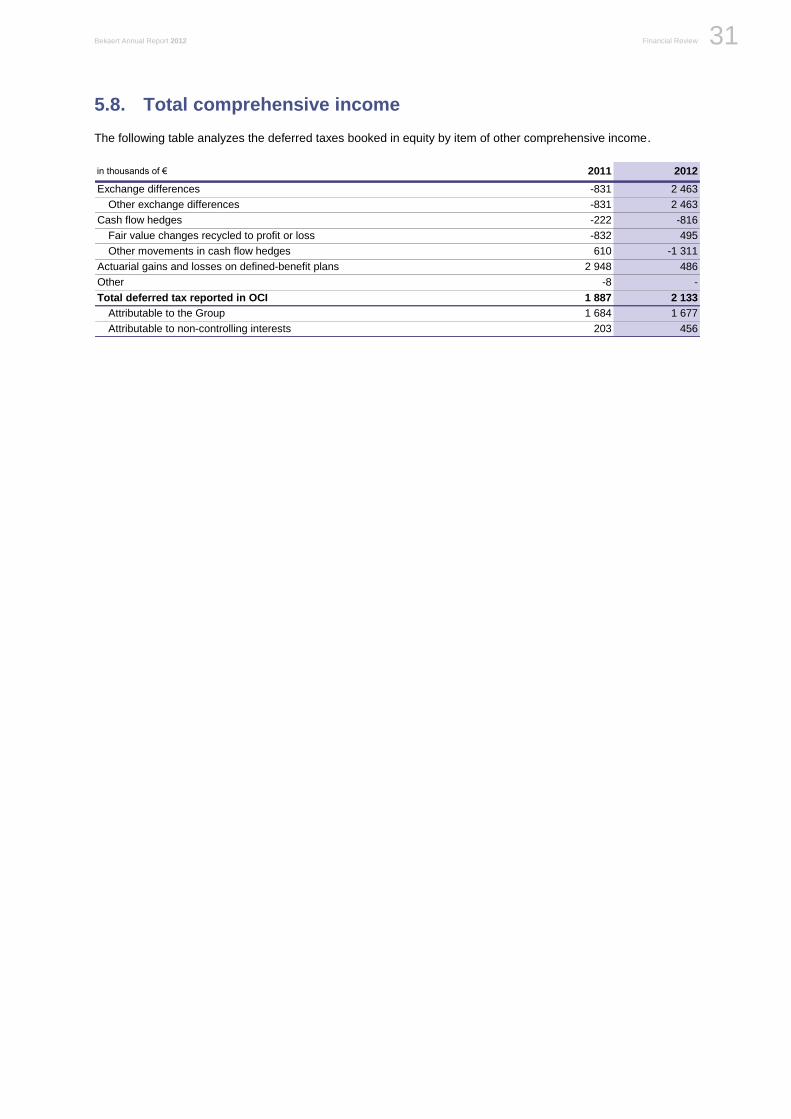
Bekaert Annual Report 2012 Financial Review 31
Be
ka
ert: F
inan
cia
l revie
w
5.8. Total comprehensive income
The following table analyzes the deferred taxes booked in equity by item of other comprehensive income.
in thousands of € 2011 2012
Exchange differences -831 2 463
Other exchange differences -831 2 463
Cash flow hedges -222 -816
Fair value changes recycled to profit or loss -832 495
Other movements in cash flow hedges 610 -1 311
Actuarial gains and losses on defined-benefit plans 2 948 486
Other -8 -
Total deferred tax reported in OCI 1 887 2 133
Attributable to the Group 1 684 1 677
Attributable to non-controlling interests 203 456
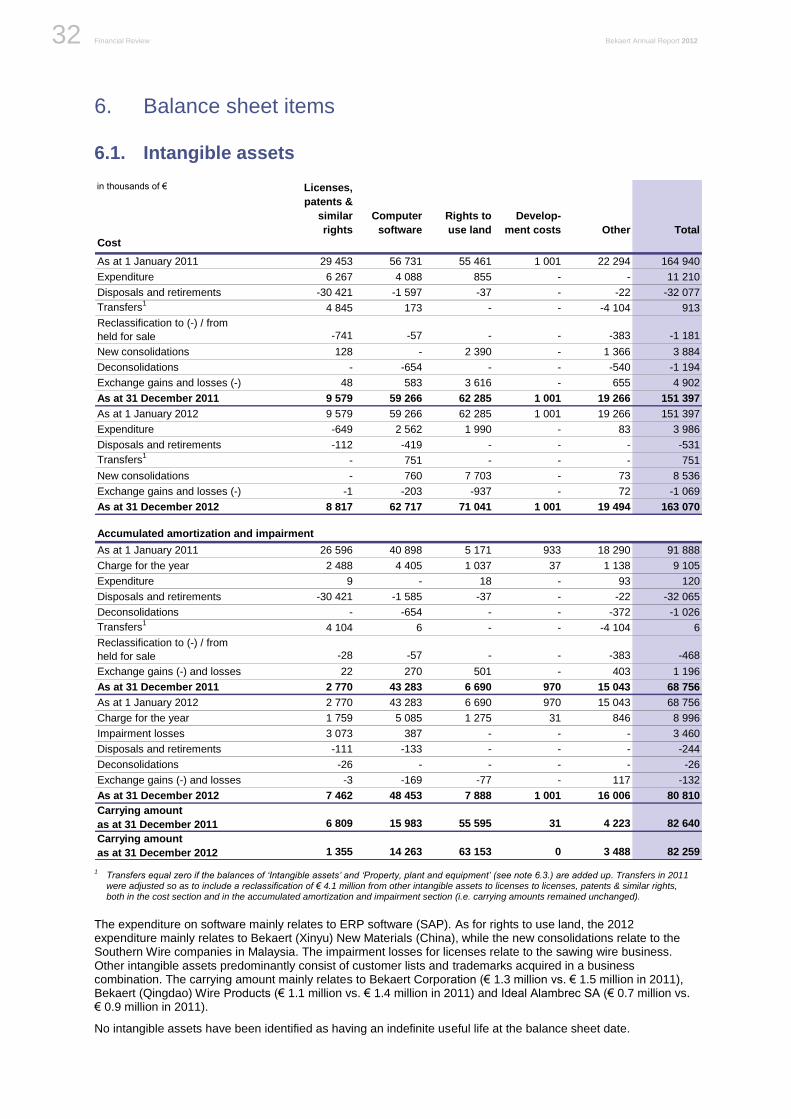
Financial Review Bekaert Annual Report 2012 32
6. Balance sheet items
6.1. Intangible assets
in thousands of € Licenses,
patents &
similar
rights
Computer
software
Rights to
use land
Develop-
ment costs Other Total
Cost
As at 1 January 2011 29 453 56 731 55 461 1 001 22 294 164 940
Expenditure 6 267 4 088 855 - - 11 210
Disposals and retirements -30 421 -1 597 -37 - -22 -32 077
Transfers1
4 845 173 - - -4 104 913
Reclassification to (-) / from
held for sale -741 -57 - - -383 -1 181
New consolidations 128 - 2 390 - 1 366 3 884
Deconsolidations - -654 - - -540 -1 194
Exchange gains and losses (-) 48 583 3 616 - 655 4 902
As at 31 December 2011 9 579 59 266 62 285 1 001 19 266 151 397
As at 1 January 2012 9 579 59 266 62 285 1 001 19 266 151 397
Expenditure -649 2 562 1 990 - 83 3 986
Disposals and retirements -112 -419 - - - -531
Transfers1
- 751 - - - 751
New consolidations - 760 7 703 - 73 8 536
Exchange gains and losses (-) -1 -203 -937 - 72 -1 069
As at 31 December 2012 8 817 62 717 71 041 1 001 19 494 163 070
Accumulated amortization and impairment
As at 1 January 2011 26 596 40 898 5 171 933 18 290 91 888
Charge for the year 2 488 4 405 1 037 37 1 138 9 105
Expenditure 9 - 18 - 93 120
Disposals and retirements -30 421 -1 585 -37 - -22 -32 065
Deconsolidations - -654 - - -372 -1 026
Transfers1
4 104 6 - - -4 104 6
Reclassification to (-) / from
held for sale -28 -57 - - -383 -468
Exchange gains (-) and losses 22 270 501 - 403 1 196
As at 31 December 2011 2 770 43 283 6 690 970 15 043 68 756
As at 1 January 2012 2 770 43 283 6 690 970 15 043 68 756
Charge for the year 1 759 5 085 1 275 31 846 8 996
Impairment losses 3 073 387 - - - 3 460
Disposals and retirements -111 -133 - - - -244
Deconsolidations -26 - - - - -26
Exchange gains (-) and losses -3 -169 -77 - 117 -132
As at 31 December 2012 7 462 48 453 7 888 1 001 16 006 80 810
Carrying amount
as at 31 December 2011 6 809 15 983 55 595 31 4 223 82 640
Carrying amount
as at 31 December 2012 1 355 14 263 63 153 0 3 488 82 259 1
Transfers equal zero if the balances of ‘Intangible assets’ and ‘Property, plant and equipment’ (see note 6.3.) are added up. Transfers in 2011 were adjusted so as to include a reclassification of € 4.1 million from other intangible assets to licenses to licenses, patents & similar rights, both in the cost section and in the accumulated amortization and impairment section (i.e. carrying amounts remained unchanged).
The expenditure on software mainly relates to ERP software (SAP). As for rights to use land, the 2012 expenditure mainly relates to Bekaert (Xinyu) New Materials (China), while the new consolidations relate to the Southern Wire companies in Malaysia. The impairment losses for licenses relate to the sawing wire business. Other intangible assets predominantly consist of customer lists and trademarks acquired in a business combination. The carrying amount mainly relates to Bekaert Corporation (€ 1.3 million vs. € 1.5 million in 2011), Bekaert (Qingdao) Wire Products (€ 1.1 million vs. € 1.4 million in 2011) and Ideal Alambrec SA (€ 0.7 million vs. € 0.9 million in 2011).
No intangible assets have been identified as having an indefinite useful life at the balance sheet date.
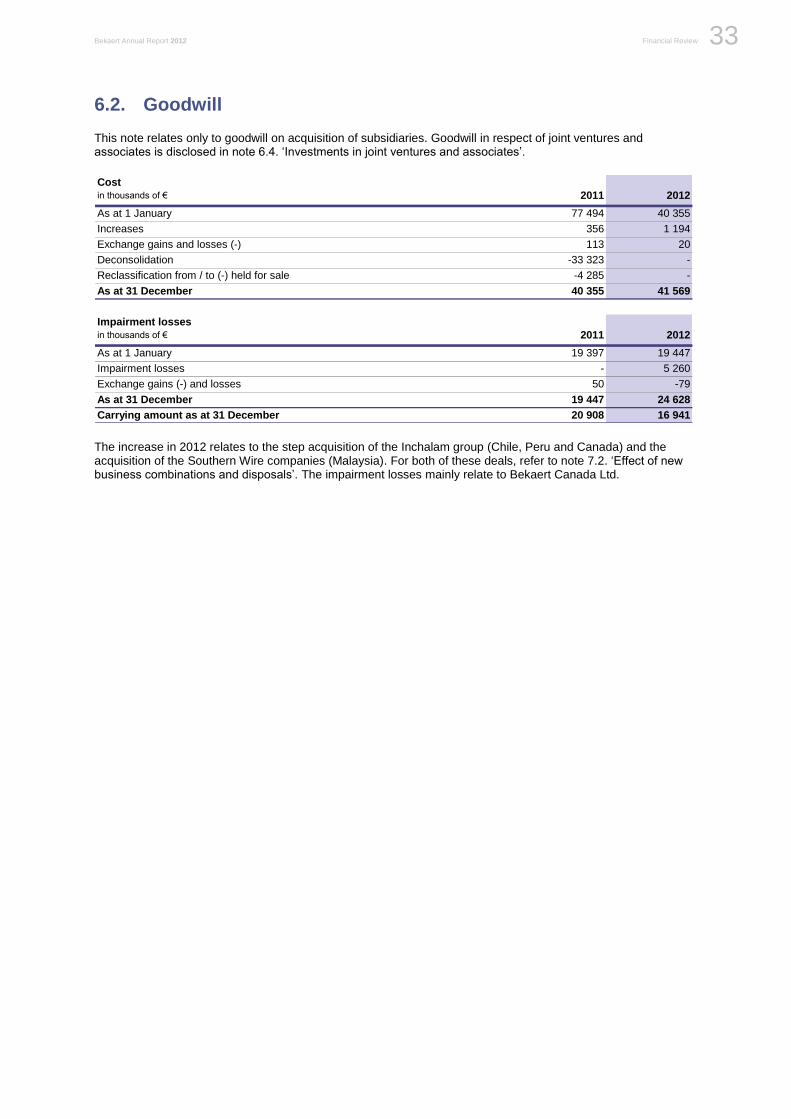
Bekaert Annual Report 2012 Financial Review 33
Be
ka
ert: F
inan
cia
l revie
w
6.2. Goodwill
This note relates only to goodwill on acquisition of subsidiaries. Goodwill in respect of joint ventures and associates is disclosed in note 6.4. ‘Investments in joint ventures and associates’.
Cost
in thousands of € 2011 2012
As at 1 January 77 494 40 355
Increases 356 1 194
Exchange gains and losses (-) 113 20
Deconsolidation -33 323 -
Reclassification from / to (-) held for sale -4 285 -
As at 31 December 40 355 41 569
Impairment losses
in thousands of € 2011 2012
As at 1 January 19 397 19 447
Impairment losses - 5 260
Exchange gains (-) and losses 50 -79
As at 31 December 19 447 24 628
Carrying amount as at 31 December 20 908 16 941
The increase in 2012 relates to the step acquisition of the Inchalam group (Chile, Peru and Canada) and the acquisition of the Southern Wire companies (Malaysia). For both of these deals, refer to note 7.2. ‘Effect of new business combinations and disposals’. The impairment losses mainly relate to Bekaert Canada Ltd.

Financial Review Bekaert Annual Report 2012 34
Goodwill by cash-generating unit (CGU)
Goodwill acquired in a business combination is allocated on acquisition to the cash-generating units (CGU) that are expected to benefit from that business combination.
The carrying amount of goodwill and related impairment have been allocated as follows:
Segment
in thousands of €
Group of cash-generating
units
Carrying
amount
31 Dec 2010
Impairment
2011
Carrying
amount
31 Dec 2011
Impairment
2012
Carrying
amount
31 Dec 2012
Subsidiaries
EMEA Cold Drawn Products Ltd 2 600 - 2 680 - 2 743
EMEA Combustion - heating EMEA 3 027 - 3 027 - 3 027
EMEA Industrial coatings EMEA1
4 285 - - - -
North America Bekaert Canada Ltd2
4 821 - 4 860 -4 999 -
North America Orrville plant (USA) 8 779 - 9 065 - 8 890
North America Specialty films North America3
33 697 - - - -
Latin America Inchalam group4
- - - - 1 005
Latin America Bekaert Ideal SL companies 844 - 844 - 844
Asia Pacific Bekaert Southern Wire
companies5
- - - -261 -
Asia Pacific Bekaert (Qingdao) Wire
Products Co Ltd - - 385 - 385
Asia Pacific Bekaert-Jiangyin Wire
Products Co Ltd 44 - 47 - 47
Subtotal 58 097 - 20 908 -5 260 16 941
Joint ventures and associates
Latin America Belgo Bekaert Arames Ltda 6 777 - 6 221 - 5 559
Subtotal 6 777 - 6 221 - 5 559
Total 64 874 - 27 129 -5 260 22 500
1
This cash-generating unit was classified as held for sale at 31 December 2011 (refer to note 6.10. ‘Assets classified as held for sale and liabilities associated with those assets’) and has been sold in 2012 (refer to note 7.2. ‘Effect of new business combinations and business disposals’).
2 This cash-generating unit has now been identified separately, whereas it was previously defined in combination with the Van Buren plant (USA). The main reason is that, while both entities have been managed as one business for a long time, they are operating more and more
independently from each other. 3
The Specialty Films activity was sold to Saint-Gobain on 30 September 2011. 4
The Inchalam group was acquired from the Chilean partners as from 1 January 2012 (refer to note 7.2. ‘Effect of new business combinations and business disposals’).
5 The Southern Wire companies were acquired from Southern Steel as from 30 August 2012 (refer to note 7.2. ‘Effect of new business combinations and business disposals’). The resulting goodwill was rather immaterial (€ 0.3 million) and was impaired at year-end.
Cash-generating units to which goodwill has been allocated are tested for impairment at least annually on the basis of their value in use, applying the following assumptions:
- The time horizon is normally 12 years (average lifetime of equipment) but can differ case by case.
- The future free cash flows are based on the latest budgeting/planning exercises for the coming 3 years. In the budgeting exercise the key assumptions relate to sales forecasts which mainly reflect regional industrial GDP evolution, and margin evolutions taking into account agreed action plans. All cash flows thereafter are extrapolations made by the management of the cash-generating unit. Given the uncertain outlook in the midterm, the Group takes a conservative approach on extrapolations (no increase in sales and sales margins). No cost structure improvements are taken into account unless they can be substantiated.
- The future cash flows are based on the assets in their current condition and do not include future restructuring not yet committed or future capital expenditures improving or enhancing the assets in excess of their originally assessed standard of performance. Only that capital expenditure required to maintain the assets in good working order is included. The cash outflows relating to working capital are calculated as a percentage of incremental sales based on the past performance of the specific cash-generating unit.
- The discount factor is based on a (long-term) pre-tax cost of capital, the risks being implicit in the cash flows. A weighted average cost of capital (WACC) is determined for euro, US dollar and Chinese renminbi regions. For countries with a higher perceived risk, the WACC is raised with 1% - 8%. The WACC is pre-tax based,
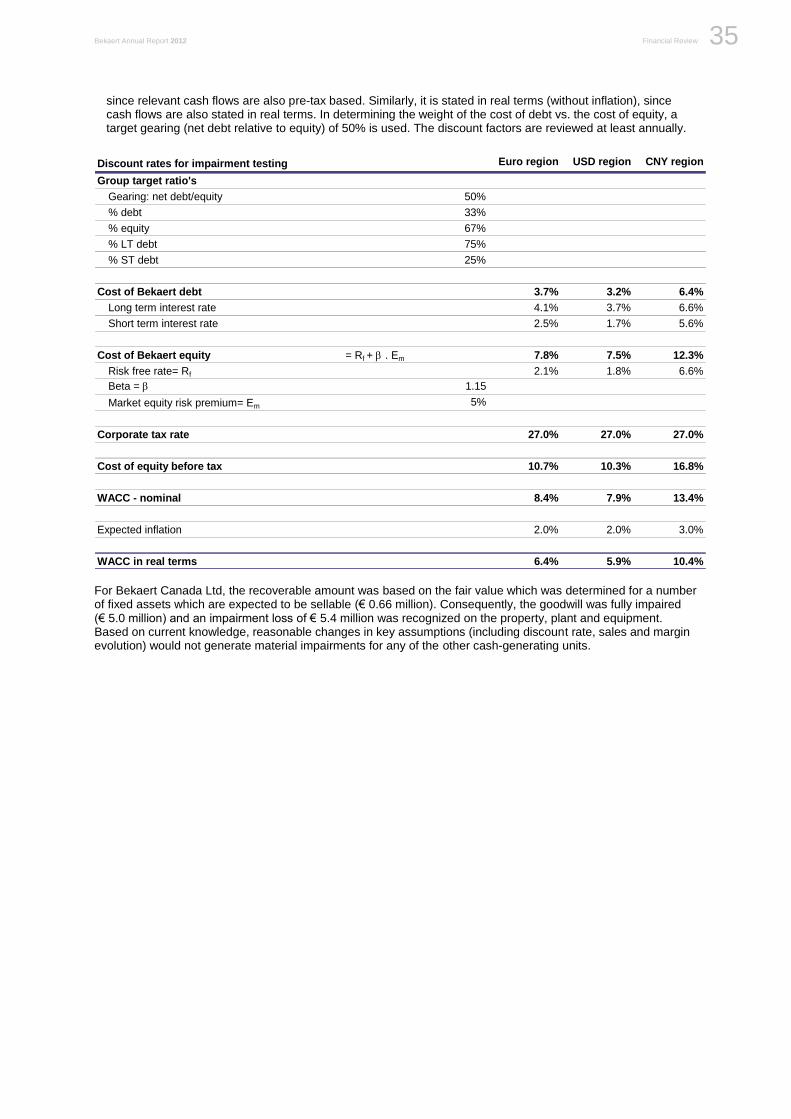
Bekaert Annual Report 2012 Financial Review 35
Be
ka
ert: F
inan
cia
l revie
w
since relevant cash flows are also pre-tax based. Similarly, it is stated in real terms (without inflation), since cash flows are also stated in real terms. In determining the weight of the cost of debt vs. the cost of equity, a target gearing (net debt relative to equity) of 50% is used. The discount factors are reviewed at least annually.
Discount rates for impairment testing Euro region USD region CNY region
Group target ratio's
Gearing: net debt/equity 50%
% debt 33%
% equity 67%
% LT debt 75%
% ST debt 25%
Cost of Bekaert debt 3.7% 3.2% 6.4%
Long term interest rate 4.1% 3.7% 6.6%
Short term interest rate 2.5% 1.7% 5.6%
Cost of Bekaert equity = Rf + b . Em 7.8% 7.5% 12.3%
Risk free rate= Rf 2.1% 1.8% 6.6%
Beta = b 1.15
Market equity risk premium= Em 5%
Corporate tax rate 27.0% 27.0% 27.0%
Cost of equity before tax 10.7% 10.3% 16.8%
WACC - nominal 8.4% 7.9% 13.4%
Expected inflation 2.0% 2.0% 3.0%
WACC in real terms 6.4% 5.9% 10.4% For Bekaert Canada Ltd, the recoverable amount was based on the fair value which was determined for a number of fixed assets which are expected to be sellable (€ 0.66 million). Consequently, the goodwill was fully impaired (€ 5.0 million) and an impairment loss of € 5.4 million was recognized on the property, plant and equipment. Based on current knowledge, reasonable changes in key assumptions (including discount rate, sales and margin evolution) would not generate material impairments for any of the other cash-generating units.
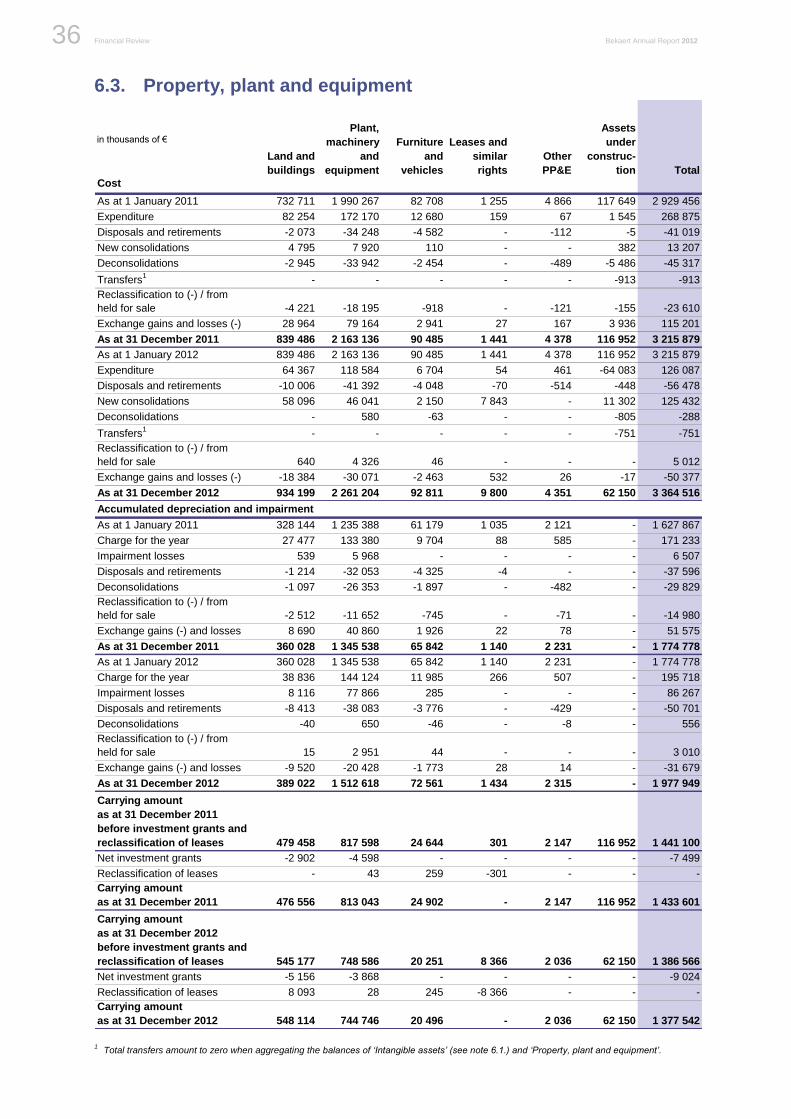
Financial Review Bekaert Annual Report 2012 36
6.3. Property, plant and equipment
in thousands of €
Land and
buildings
Plant,
machinery
and
equipment
Furniture
and
vehicles
Leases and
similar
rights
Other
PP&E
Assets
under
construc-
tion Total
Cost
As at 1 January 2011 732 711 1 990 267 82 708 1 255 4 866 117 649 2 929 456
Expenditure 82 254 172 170 12 680 159 67 1 545 268 875
Disposals and retirements -2 073 -34 248 -4 582 - -112 -5 -41 019
New consolidations 4 795 7 920 110 - - 382 13 207
Deconsolidations -2 945 -33 942 -2 454 - -489 -5 486 -45 317
Transfers1
- - - - - -913 -913
Reclassification to (-) / from
held for sale -4 221 -18 195 -918 - -121 -155 -23 610
Exchange gains and losses (-) 28 964 79 164 2 941 27 167 3 936 115 201
As at 31 December 2011 839 486 2 163 136 90 485 1 441 4 378 116 952 3 215 879
As at 1 January 2012 839 486 2 163 136 90 485 1 441 4 378 116 952 3 215 879
Expenditure 64 367 118 584 6 704 54 461 -64 083 126 087
Disposals and retirements -10 006 -41 392 -4 048 -70 -514 -448 -56 478
New consolidations 58 096 46 041 2 150 7 843 - 11 302 125 432
Deconsolidations - 580 -63 - - -805 -288
Transfers1
- - - - - -751 -751
Reclassification to (-) / from
held for sale 640 4 326 46 - - - 5 012
Exchange gains and losses (-) -18 384 -30 071 -2 463 532 26 -17 -50 377
As at 31 December 2012 934 199 2 261 204 92 811 9 800 4 351 62 150 3 364 516
Accumulated depreciation and impairment
As at 1 January 2011 328 144 1 235 388 61 179 1 035 2 121 - 1 627 867
Charge for the year 27 477 133 380 9 704 88 585 - 171 233
Impairment losses 539 5 968 - - - - 6 507
Disposals and retirements -1 214 -32 053 -4 325 -4 - - -37 596
Deconsolidations -1 097 -26 353 -1 897 - -482 - -29 829
Reclassification to (-) / from
held for sale -2 512 -11 652 -745 - -71 - -14 980
Exchange gains (-) and losses 8 690 40 860 1 926 22 78 - 51 575
As at 31 December 2011 360 028 1 345 538 65 842 1 140 2 231 - 1 774 778
As at 1 January 2012 360 028 1 345 538 65 842 1 140 2 231 - 1 774 778
Charge for the year 38 836 144 124 11 985 266 507 - 195 718
Impairment losses 8 116 77 866 285 - - - 86 267
Disposals and retirements -8 413 -38 083 -3 776 - -429 - -50 701
Deconsolidations -40 650 -46 - -8 - 556
Reclassification to (-) / from
held for sale 15 2 951 44 - - - 3 010
Exchange gains (-) and losses -9 520 -20 428 -1 773 28 14 - -31 679
As at 31 December 2012 389 022 1 512 618 72 561 1 434 2 315 - 1 977 949
Carrying amount
as at 31 December 2011
before investment grants and
reclassification of leases 479 458 817 598 24 644 301 2 147 116 952 1 441 100
Net investment grants -2 902 -4 598 - - - - -7 499
Reclassification of leases - 43 259 -301 - - -
Carrying amount
as at 31 December 2011 476 556 813 043 24 902 - 2 147 116 952 1 433 601
Carrying amount
as at 31 December 2012
before investment grants and
reclassification of leases 545 177 748 586 20 251 8 366 2 036 62 150 1 386 566
Net investment grants -5 156 -3 868 - - - - -9 024
Reclassification of leases 8 093 28 245 -8 366 - - -
Carrying amount
as at 31 December 2012 548 114 744 746 20 496 - 2 036 62 150 1 377 542
1 Total transfers amount to zero when aggregating the balances of ‘Intangible assets’ (see note 6.1.) and ‘Property, plant and equipment’.
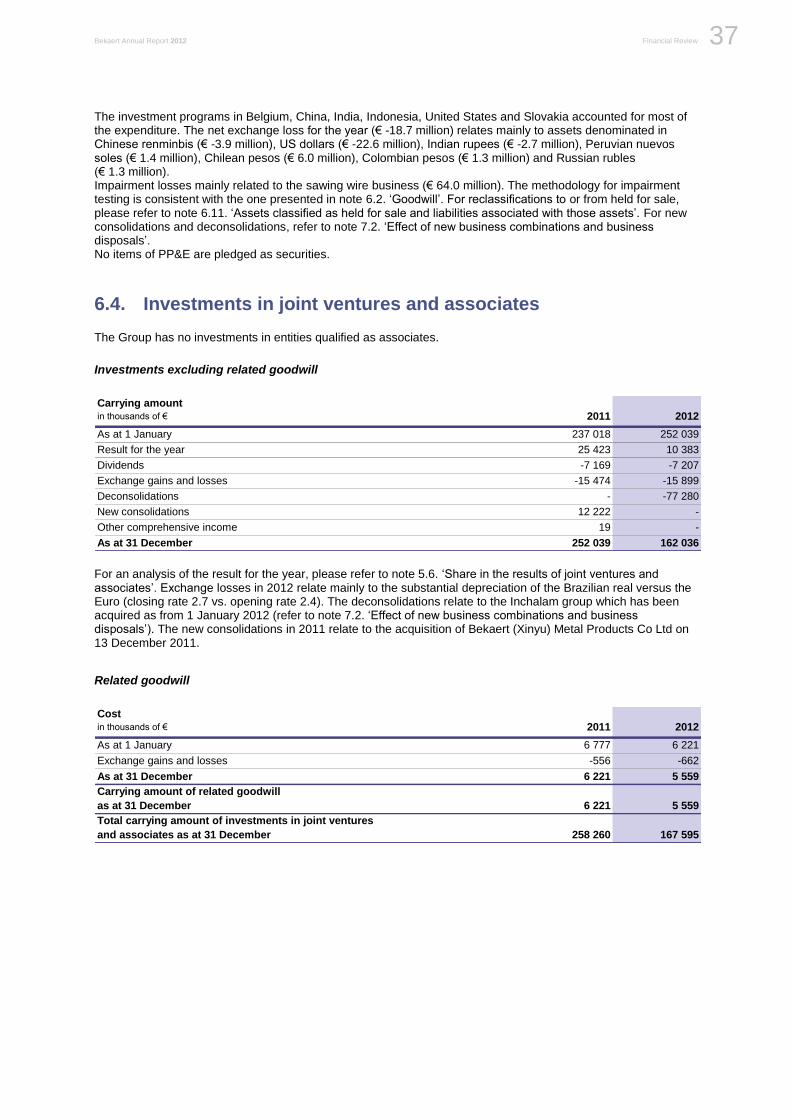
Bekaert Annual Report 2012 Financial Review 37
Be
ka
ert: F
inan
cia
l revie
w
The investment programs in Belgium, China, India, Indonesia, United States and Slovakia accounted for most of the expenditure. The net exchange loss for the year (€ -18.7 million) relates mainly to assets denominated in Chinese renminbis (€ -3.9 million), US dollars (€ -22.6 million), Indian rupees (€ -2.7 million), Peruvian nuevos soles (€ 1.4 million), Chilean pesos (€ 6.0 million), Colombian pesos (€ 1.3 million) and Russian rubles (€ 1.3 million). Impairment losses mainly related to the sawing wire business (€ 64.0 million). The methodology for impairment testing is consistent with the one presented in note 6.2. ‘Goodwill’. For reclassifications to or from held for sale, please refer to note 6.11. ‘Assets classified as held for sale and liabilities associated with those assets’. For new consolidations and deconsolidations, refer to note 7.2. ‘Effect of new business combinations and business disposals’. No items of PP&E are pledged as securities.
6.4. Investments in joint ventures and associates
The Group has no investments in entities qualified as associates.
Investments excluding related goodwill
Carrying amount
in thousands of € 2011 2012
As at 1 January 237 018 252 039
Result for the year 25 423 10 383
Dividends -7 169 -7 207
Exchange gains and losses -15 474 -15 899
Deconsolidations - -77 280
New consolidations 12 222 -
Other comprehensive income 19 -
As at 31 December 252 039 162 036
For an analysis of the result for the year, please refer to note 5.6. ‘Share in the results of joint ventures and associates’. Exchange losses in 2012 relate mainly to the substantial depreciation of the Brazilian real versus the Euro (closing rate 2.7 vs. opening rate 2.4). The deconsolidations relate to the Inchalam group which has been acquired as from 1 January 2012 (refer to note 7.2. ‘Effect of new business combinations and business disposals’). The new consolidations in 2011 relate to the acquisition of Bekaert (Xinyu) Metal Products Co Ltd on 13 December 2011.
Related goodwill
Cost
in thousands of € 2011 2012
As at 1 January 6 777 6 221
Exchange gains and losses -556 -662
As at 31 December 6 221 5 559
Carrying amount of related goodwill
as at 31 December 6 221 5 559
Total carrying amount of investments in joint ventures
and associates as at 31 December 258 260 167 595
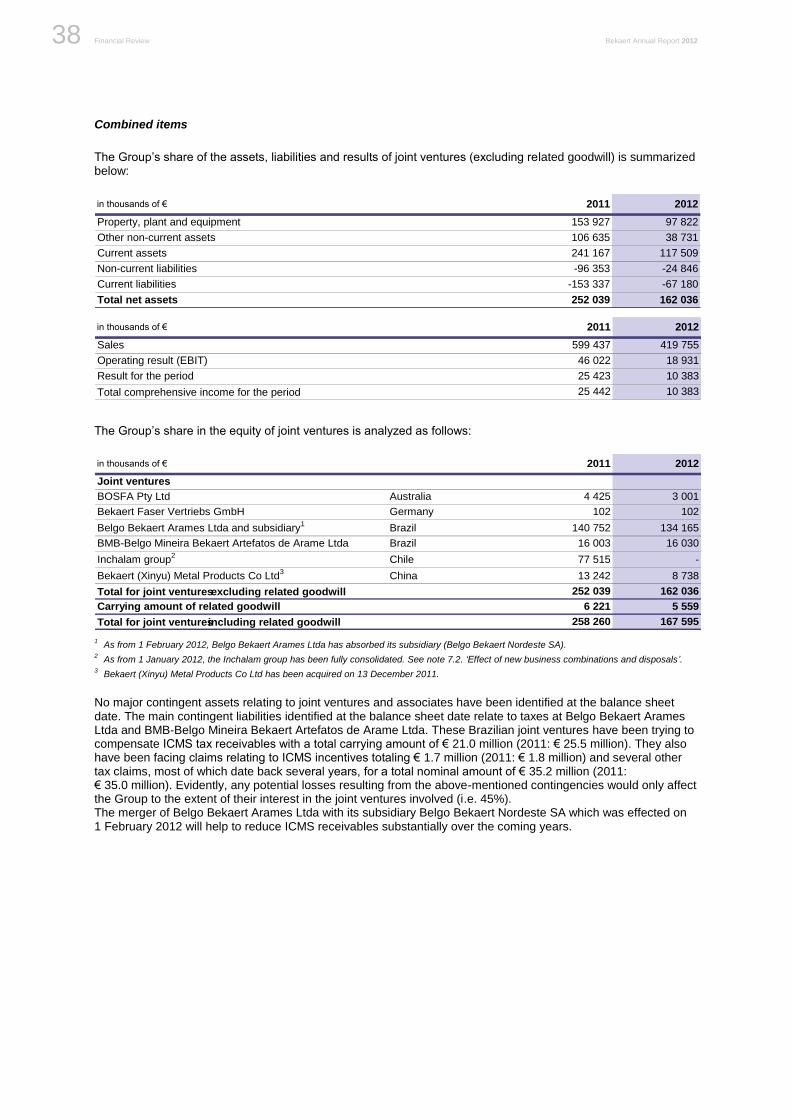
Financial Review Bekaert Annual Report 2012 38
Combined items
The Group’s share of the assets, liabilities and results of joint ventures (excluding related goodwill) is summarized below:
in thousands of € 2011 2012
Property, plant and equipment 153 927 97 822
Other non-current assets 106 635 38 731
Current assets 241 167 117 509
Non-current liabilities -96 353 -24 846
Current liabilities -153 337 -67 180
Total net assets 252 039 162 036
in thousands of € 2011 2012
Sales 599 437 419 755
Operating result (EBIT) 46 022 18 931
Result for the period 25 423 10 383
Total comprehensive income for the period 25 442 10 383
The Group’s share in the equity of joint ventures is analyzed as follows:
in thousands of € 2011 2012
Joint ventures
BOSFA Pty Ltd Australia 4 425 3 001
Bekaert Faser Vertriebs GmbH Germany 102 102
Belgo Bekaert Arames Ltda and subsidiary1
Brazil 140 752 134 165
BMB-Belgo Mineira Bekaert Artefatos de Arame Ltda Brazil 16 003 16 030
Inchalam group2
Chile 77 515 -
Bekaert (Xinyu) Metal Products Co Ltd3
China 13 242 8 738
Total for joint ventures excluding related goodwill 252 039 162 036
Carrying amount of related goodwill 6 221 5 559
Total for joint ventures including related goodwill 258 260 167 595
1 As from 1 February 2012, Belgo Bekaert Arames Ltda has absorbed its subsidiary (Belgo Bekaert Nordeste SA).
2 As from 1 January 2012, the Inchalam group has been fully consolidated. See note 7.2. ‘Effect of new business combinations and disposals’.
3 Bekaert (Xinyu) Metal Products Co Ltd has been acquired on 13 December 2011.
No major contingent assets relating to joint ventures and associates have been identified at the balance sheet date. The main contingent liabilities identified at the balance sheet date relate to taxes at Belgo Bekaert Arames Ltda and BMB-Belgo Mineira Bekaert Artefatos de Arame Ltda. These Brazilian joint ventures have been trying to compensate ICMS tax receivables with a total carrying amount of € 21.0 million (2011: € 25.5 million). They also have been facing claims relating to ICMS incentives totaling € 1.7 million (2011: € 1.8 million) and several other tax claims, most of which date back several years, for a total nominal amount of € 35.2 million (2011: € 35.0 million). Evidently, any potential losses resulting from the above-mentioned contingencies would only affect the Group to the extent of their interest in the joint ventures involved (i.e. 45%). The merger of Belgo Bekaert Arames Ltda with its subsidiary Belgo Bekaert Nordeste SA which was effected on 1 February 2012 will help to reduce ICMS receivables substantially over the coming years.
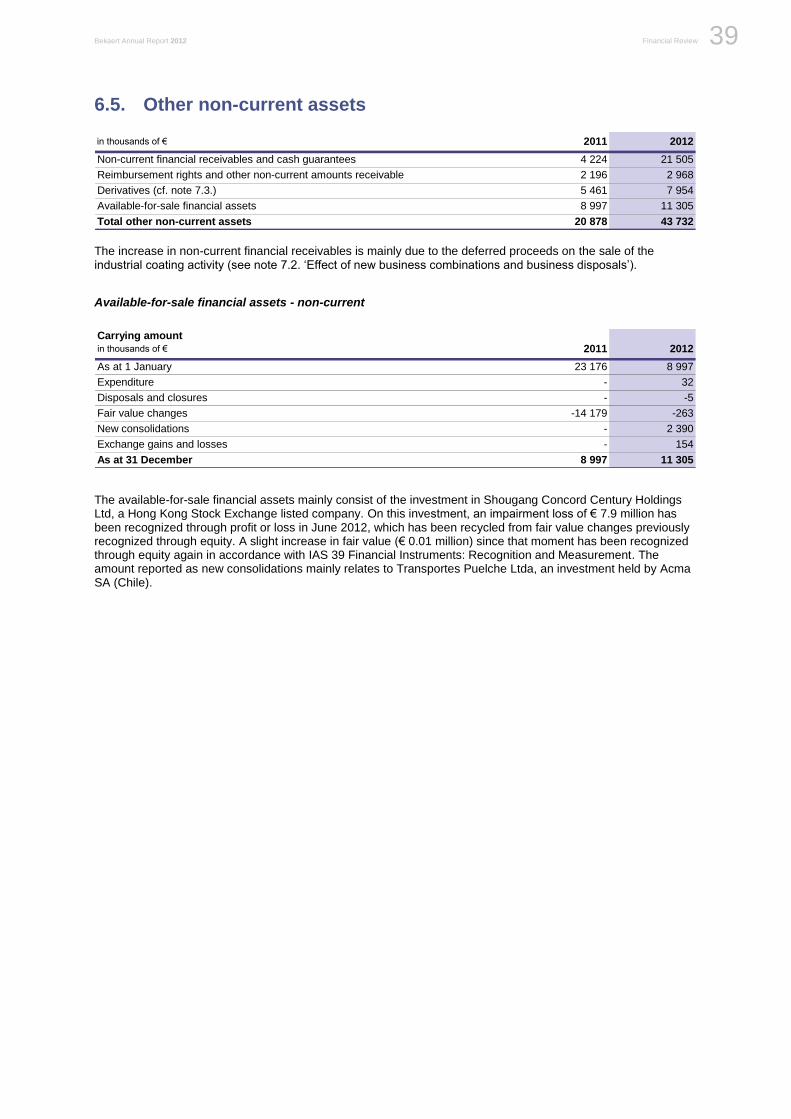
Bekaert Annual Report 2012 Financial Review 39
Be
ka
ert: F
inan
cia
l revie
w
6.5. Other non-current assets
in thousands of € 2011 2012
Non-current financial receivables and cash guarantees 4 224 21 505
Reimbursement rights and other non-current amounts receivable 2 196 2 968
Derivatives (cf. note 7.3.) 5 461 7 954
Available-for-sale financial assets 8 997 11 305
Total other non-current assets 20 878 43 732 The increase in non-current financial receivables is mainly due to the deferred proceeds on the sale of the industrial coating activity (see note 7.2. ‘Effect of new business combinations and business disposals’).
Available-for-sale financial assets - non-current
Carrying amount
in thousands of € 2011 2012
As at 1 January 23 176 8 997
Expenditure - 32
Disposals and closures - -5
Fair value changes -14 179 -263
New consolidations - 2 390
Exchange gains and losses - 154
As at 31 December 8 997 11 305
The available-for-sale financial assets mainly consist of the investment in Shougang Concord Century Holdings Ltd, a Hong Kong Stock Exchange listed company. On this investment, an impairment loss of € 7.9 million has been recognized through profit or loss in June 2012, which has been recycled from fair value changes previously recognized through equity. A slight increase in fair value (€ 0.01 million) since that moment has been recognized through equity again in accordance with IAS 39 Financial Instruments: Recognition and Measurement. The amount reported as new consolidations mainly relates to Transportes Puelche Ltda, an investment held by Acma SA (Chile).
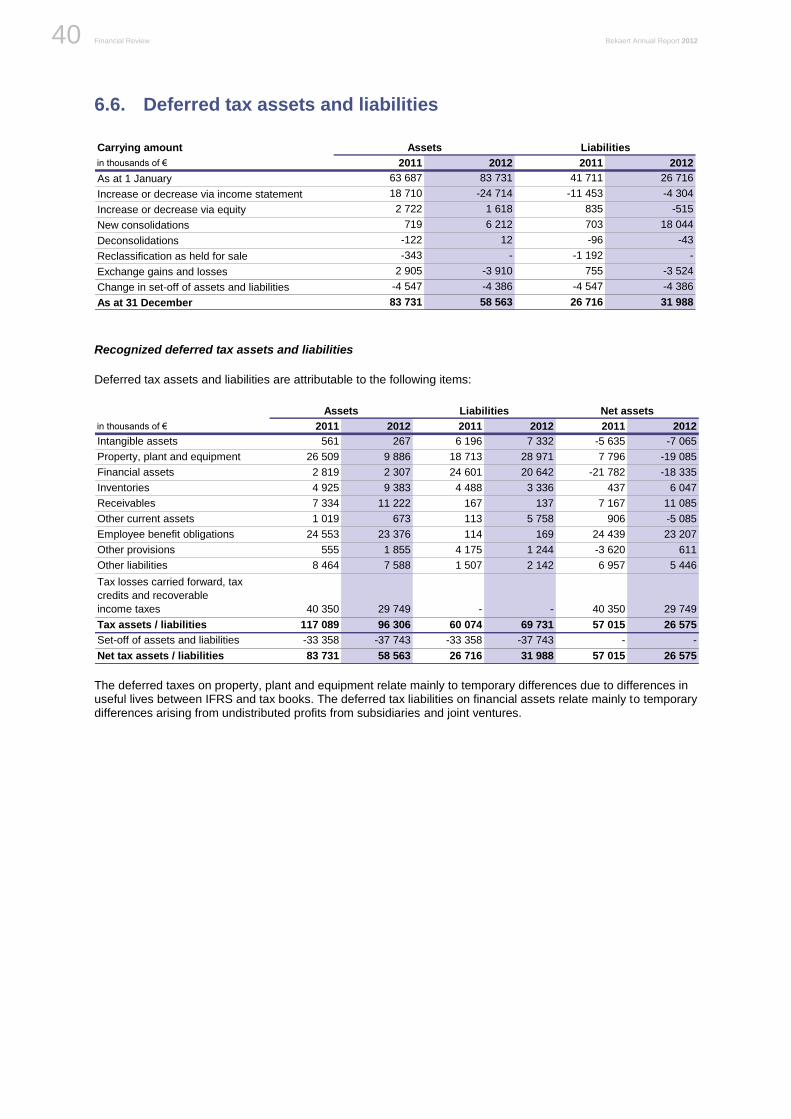
Financial Review Bekaert Annual Report 2012 40
6.6. Deferred tax assets and liabilities
Carrying amount
in thousands of € 2011 2012 2011 2012
As at 1 January 63 687 83 731 41 711 26 716
Increase or decrease via income statement 18 710 -24 714 -11 453 -4 304
2 722 1 618 835 -515
New consolidations 719 6 212 703 18 044
Deconsolidations -122 12 -96 -43
Reclassification as held for sale -343 - -1 192 -
Exchange gains and losses 2 905 -3 910 755 -3 524
Change in set-off of assets and liabilities -4 547 -4 386 -4 547 -4 386
As at 31 December 83 731 58 563 26 716 31 988
Increase or decrease via equity
Assets Liabilities
Recognized deferred tax assets and liabilities
Deferred tax assets and liabilities are attributable to the following items:
in thousands of € 2011 2012 2011 2012 2011 2012
Intangible assets 561 267 6 196 7 332 -5 635 -7 065
Property, plant and equipment 26 509 9 886 18 713 28 971 7 796 -19 085
Financial assets 2 819 2 307 24 601 20 642 -21 782 -18 335
Inventories 4 925 9 383 4 488 3 336 437 6 047
Receivables 7 334 11 222 167 137 7 167 11 085
Other current assets 1 019 673 113 5 758 906 -5 085
Employee benefit obligations 24 553 23 376 114 169 24 439 23 207
Other provisions 555 1 855 4 175 1 244 -3 620 611
Other liabilities 8 464 7 588 1 507 2 142 6 957 5 446
Tax losses carried forward, tax
credits and recoverable
income taxes 40 350 29 749 - - 40 350 29 749
Tax assets / liabilities 117 089 96 306 60 074 69 731 57 015 26 575
Set-off of assets and liabilities -33 358 -37 743 -33 358 -37 743 - -
Net tax assets / liabilities 83 731 58 563 26 716 31 988 57 015 26 575
Assets Liabilities Net assets
The deferred taxes on property, plant and equipment relate mainly to temporary differences due to differences in useful lives between IFRS and tax books. The deferred tax liabilities on financial assets relate mainly to temporary differences arising from undistributed profits from subsidiaries and joint ventures.
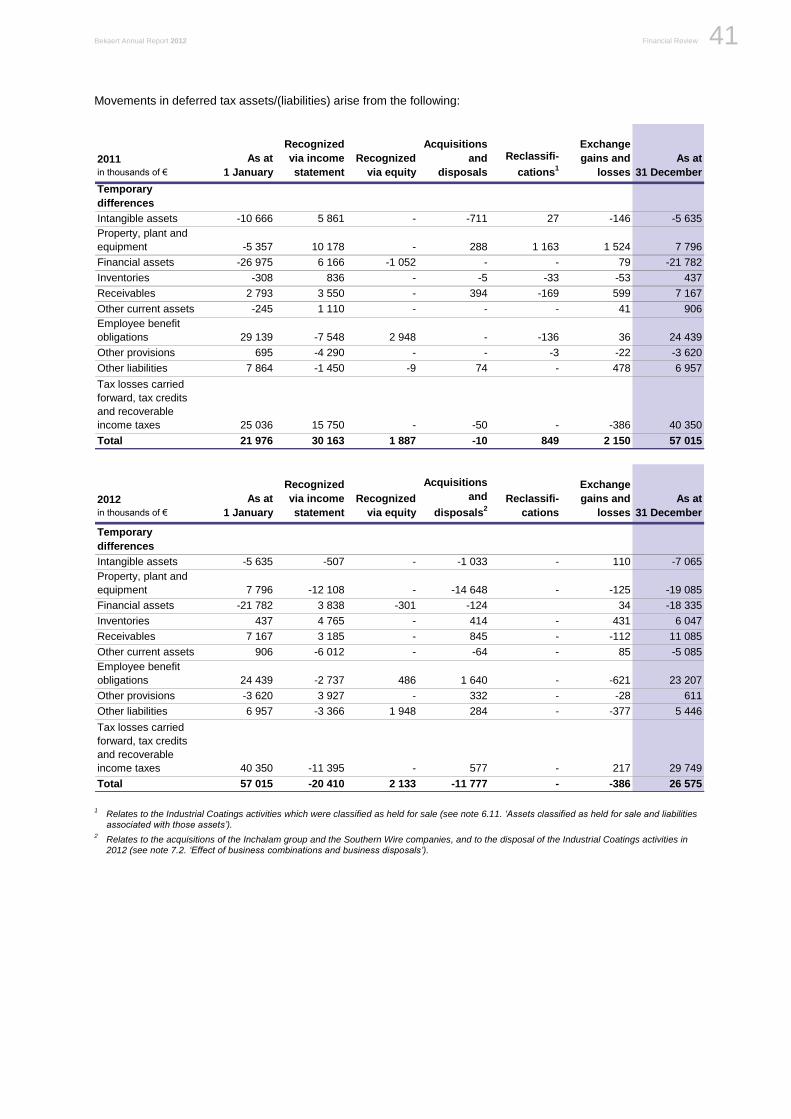
Bekaert Annual Report 2012 Financial Review 41
Be
ka
ert: F
inan
cia
l revie
w
Movements in deferred tax assets/(liabilities) arise from the following:
2011
in thousands of €
As at
1 January
Recognized
via income
statement
Recognized
via equity
Acquisitions
and
disposals
Reclassifi-
cations1
Exchange
gains and
losses
As at
31 December
Temporary
differences
Intangible assets -10 666 5 861 - -711 27 -146 -5 635
Property, plant and
equipment -5 357 10 178 - 288 1 163 1 524 7 796
Financial assets -26 975 6 166 -1 052 - - 79 -21 782
Inventories -308 836 - -5 -33 -53 437
Receivables 2 793 3 550 - 394 -169 599 7 167
Other current assets -245 1 110 - - - 41 906
Employee benefit
obligations 29 139 -7 548 2 948 - -136 36 24 439
Other provisions 695 -4 290 - - -3 -22 -3 620
Other liabilities 7 864 -1 450 -9 74 - 478 6 957
Tax losses carried
forward, tax credits
and recoverable
income taxes 25 036 15 750 - -50 - -386 40 350
Total 21 976 30 163 1 887 -10 849 2 150 57 015
2012
in thousands of €
As at
1 January
Recognized
via income
statement
Recognized
via equity
Acquisitions
and
disposals2
Reclassifi-
cations
Exchange
gains and
losses
As at
31 December
Temporary
differences
Intangible assets -5 635 -507 - -1 033 - 110 -7 065
Property, plant and
equipment 7 796 -12 108 - -14 648 - -125 -19 085
Financial assets -21 782 3 838 -301 -124 34 -18 335
Inventories 437 4 765 - 414 - 431 6 047
Receivables 7 167 3 185 - 845 - -112 11 085
Other current assets 906 -6 012 - -64 - 85 -5 085
Employee benefit
obligations 24 439 -2 737 486 1 640 - -621 23 207
Other provisions -3 620 3 927 - 332 - -28 611
Other liabilities 6 957 -3 366 1 948 284 - -377 5 446
Tax losses carried
forward, tax credits
and recoverable
income taxes 40 350 -11 395 - 577 - 217 29 749
Total 57 015 -20 410 2 133 -11 777 - -386 26 575
1 Relates to the Industrial Coatings activities which were classified as held for sale (see note 6.11. ‘Assets classified as held for sale and liabilities
associated with those assets’). 2 Relates to the acquisitions of the Inchalam group and the Southern Wire companies, and to the disposal of the Industrial Coatings activities in
2012 (see note 7.2. ‘Effect of business combinations and business disposals’).
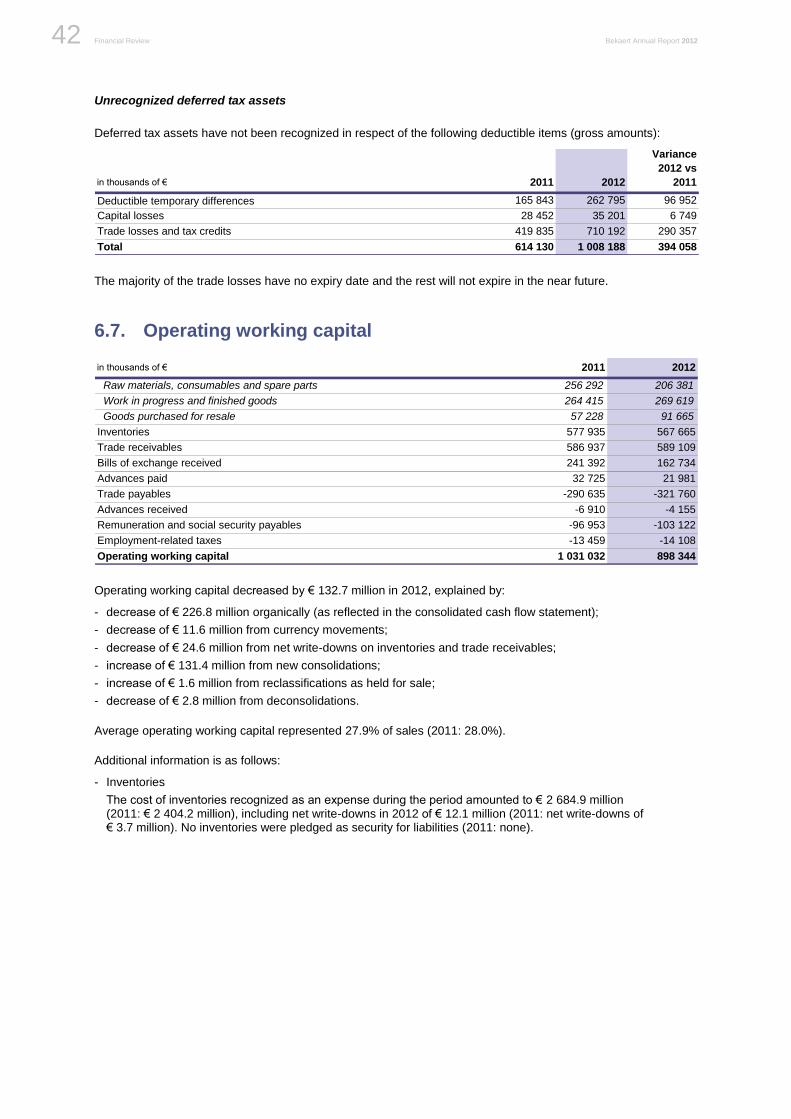
Financial Review Bekaert Annual Report 2012 42
Unrecognized deferred tax assets
Deferred tax assets have not been recognized in respect of the following deductible items (gross amounts):
in thousands of € 2011 2012
Variance
2012 vs
2011
Deductible temporary differences 165 843 262 795 96 952
Capital losses 28 452 35 201 6 749
Trade losses and tax credits 419 835 710 192 290 357
Total 614 130 1 008 188 394 058
The majority of the trade losses have no expiry date and the rest will not expire in the near future.
6.7. Operating working capital
in thousands of € 2011 2012
Raw materials, consumables and spare parts 256 292 206 381
Work in progress and finished goods 264 415 269 619
Goods purchased for resale 57 228 91 665
Inventories 577 935 567 665
Trade receivables 586 937 589 109
Bills of exchange received 241 392 162 734
Advances paid 32 725 21 981
Trade payables -290 635 -321 760
Advances received -6 910 -4 155
Remuneration and social security payables -96 953 -103 122
Employment-related taxes -13 459 -14 108
Operating working capital 1 031 032 898 344
Operating working capital decreased by € 132.7 million in 2012, explained by:
- decrease of € 226.8 million organically (as reflected in the consolidated cash flow statement);
- decrease of € 11.6 million from currency movements;
- decrease of € 24.6 million from net write-downs on inventories and trade receivables;
- increase of € 131.4 million from new consolidations;
- increase of € 1.6 million from reclassifications as held for sale;
- decrease of € 2.8 million from deconsolidations.
Average operating working capital represented 27.9% of sales (2011: 28.0%).
Additional information is as follows:
- Inventories
The cost of inventories recognized as an expense during the period amounted to € 2 684.9 million (2011: € 2 404.2 million), including net write-downs in 2012 of € 12.1 million (2011: net write-downs of € 3.7 million). No inventories were pledged as security for liabilities (2011: none).
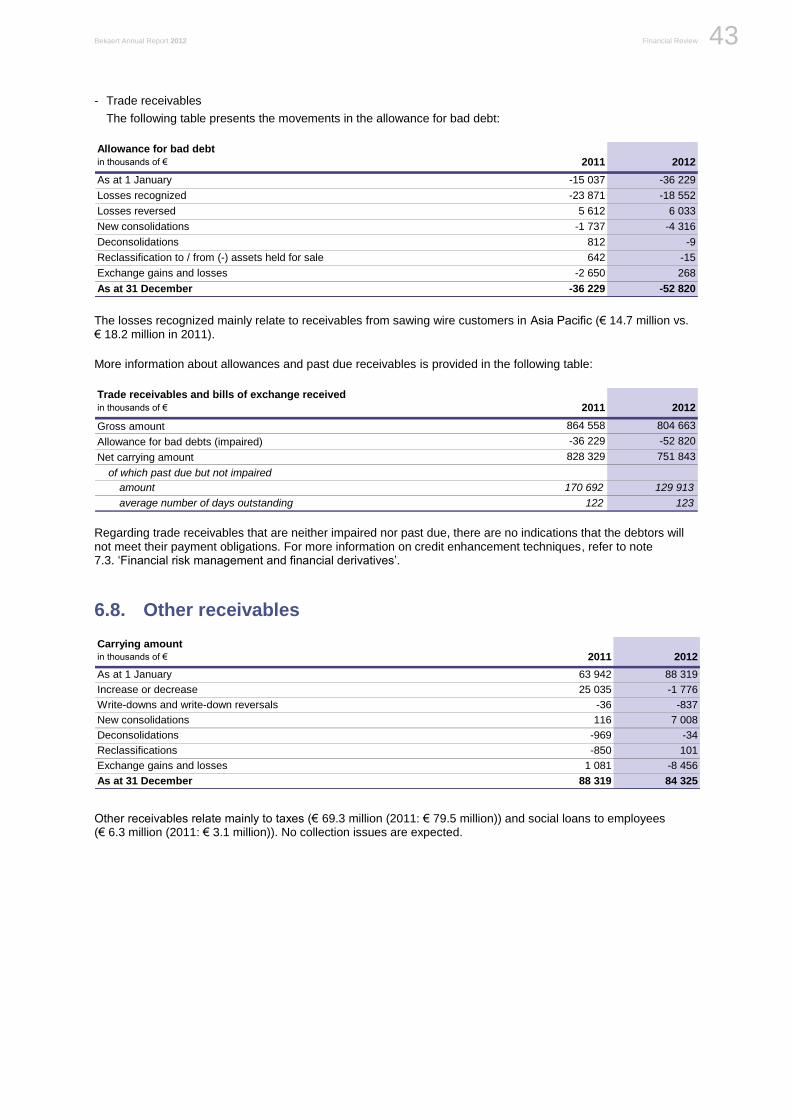
Bekaert Annual Report 2012 Financial Review 43
Be
ka
ert: F
inan
cia
l revie
w
- Trade receivables
The following table presents the movements in the allowance for bad debt:
Allowance for bad debt
in thousands of € 2011 2012
As at 1 January -15 037 -36 229
Losses recognized -23 871 -18 552
Losses reversed 5 612 6 033
New consolidations -1 737 -4 316
Deconsolidations 812 -9
Reclassification to / from (-) assets held for sale 642 -15
Exchange gains and losses -2 650 268
As at 31 December -36 229 -52 820
The losses recognized mainly relate to receivables from sawing wire customers in Asia Pacific (€ 14.7 million vs. € 18.2 million in 2011).
More information about allowances and past due receivables is provided in the following table:
Trade receivables and bills of exchange received
in thousands of € 2011 2012
Gross amount 864 558 804 663
Allowance for bad debts (impaired) -36 229 -52 820
Net carrying amount 828 329 751 843
of which past due but not impaired
amount 170 692 129 913
average number of days outstanding 122 123
Regarding trade receivables that are neither impaired nor past due, there are no indications that the debtors will not meet their payment obligations. For more information on credit enhancement techniques, refer to note 7.3. ‘Financial risk management and financial derivatives’.
6.8. Other receivables
Carrying amount
in thousands of € 2011 2012
As at 1 January 63 942 88 319
Increase or decrease 25 035 -1 776
Write-downs and write-down reversals -36 -837
New consolidations 116 7 008
Deconsolidations -969 -34
Reclassifications -850 101
Exchange gains and losses 1 081 -8 456
As at 31 December 88 319 84 325
Other receivables relate mainly to taxes (€ 69.3 million (2011: € 79.5 million)) and social loans to employees (€ 6.3 million (2011: € 3.1 million)). No collection issues are expected.
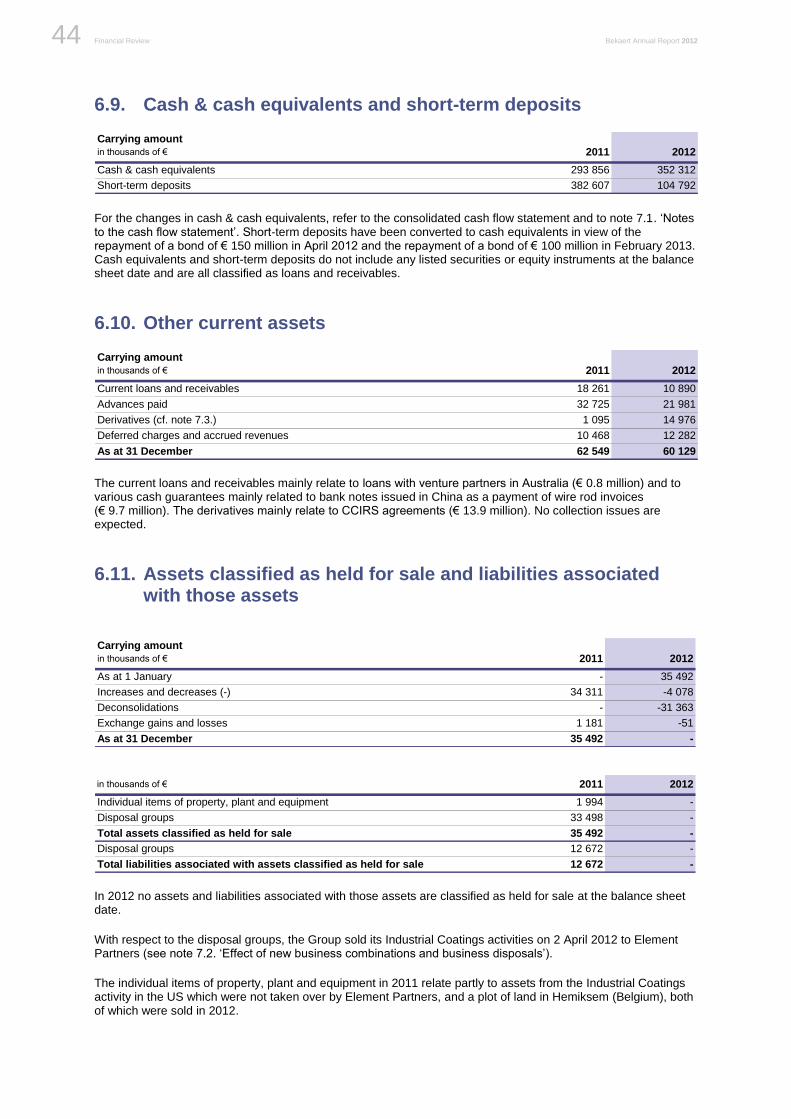
Financial Review Bekaert Annual Report 2012 44
6.9. Cash & cash equivalents and short-term deposits
Carrying amount
in thousands of € 2011 2012
Cash & cash equivalents 293 856 352 312
Short-term deposits 382 607 104 792
For the changes in cash & cash equivalents, refer to the consolidated cash flow statement and to note 7.1. ‘Notes to the cash flow statement’. Short-term deposits have been converted to cash equivalents in view of the repayment of a bond of € 150 million in April 2012 and the repayment of a bond of € 100 million in February 2013. Cash equivalents and short-term deposits do not include any listed securities or equity instruments at the balance sheet date and are all classified as loans and receivables.
6.10. Other current assets
Carrying amount
in thousands of € 2011 2012
Current loans and receivables 18 261 10 890
Advances paid 32 725 21 981
Derivatives (cf. note 7.3.) 1 095 14 976
Deferred charges and accrued revenues 10 468 12 282
As at 31 December 62 549 60 129
The current loans and receivables mainly relate to loans with venture partners in Australia (€ 0.8 million) and to various cash guarantees mainly related to bank notes issued in China as a payment of wire rod invoices (€ 9.7 million). The derivatives mainly relate to CCIRS agreements (€ 13.9 million). No collection issues are expected.
6.11. Assets classified as held for sale and liabilities associated with those assets
Carrying amount
in thousands of € 2011 2012
As at 1 January - 35 492
Increases and decreases (-) 34 311 -4 078
Deconsolidations - -31 363
Exchange gains and losses 1 181 -51
As at 31 December 35 492 -
in thousands of € 2011 2012
Individual items of property, plant and equipment 1 994 -
Disposal groups 33 498 -
Total assets classified as held for sale 35 492 -
Disposal groups 12 672 -
Total liabilities associated with assets classified as held for sale 12 672 -
In 2012 no assets and liabilities associated with those assets are classified as held for sale at the balance sheet date.
With respect to the disposal groups, the Group sold its Industrial Coatings activities on 2 April 2012 to Element Partners (see note 7.2. ‘Effect of new business combinations and business disposals’).
The individual items of property, plant and equipment in 2011 relate partly to assets from the Industrial Coatings activity in the US which were not taken over by Element Partners, and a plot of land in Hemiksem (Belgium), both of which were sold in 2012.
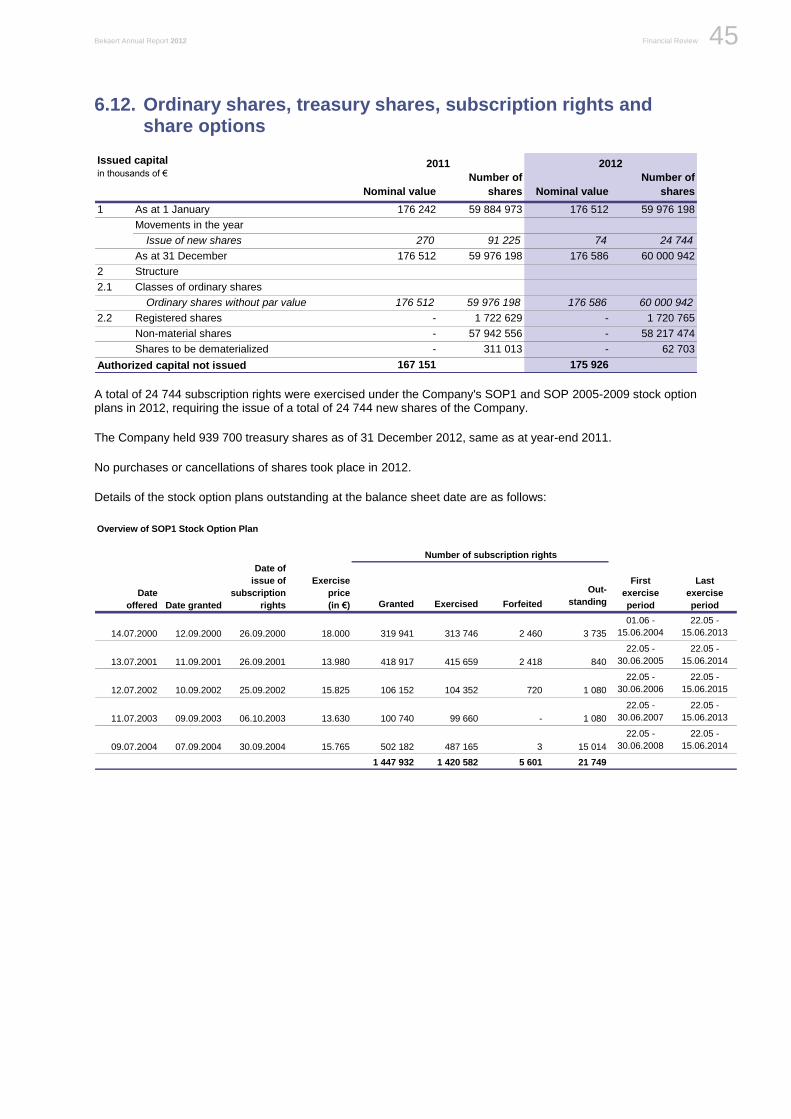
Bekaert Annual Report 2012 Financial Review 45
Be
ka
ert: F
inan
cia
l revie
w
6.12. Ordinary shares, treasury shares, subscription rights and share options
Nominal value
Number of
shares Nominal value
Number of
shares
1 As at 1 January 176 242 59 884 973 176 512 59 976 198
Movements in the year
Issue of new shares 270 91 225 74 24 744
As at 31 December 176 512 59 976 198 176 586 60 000 942
2 Structure
2.1 Classes of ordinary shares
Ordinary shares without par value 176 512 59 976 198 176 586 60 000 942
2.2 Registered shares - 1 722 629 - 1 720 765
Non-material shares - 57 942 556 - 58 217 474
Shares to be dematerialized - 311 013 - 62 703
167 151 175 926Authorized capital not issued
2011 2012Issued capital
in thousands of €
A total of 24 744 subscription rights were exercised under the Company's SOP1 and SOP 2005-2009 stock option plans in 2012, requiring the issue of a total of 24 744 new shares of the Company.
The Company held 939 700 treasury shares as of 31 December 2012, same as at year-end 2011.
No purchases or cancellations of shares took place in 2012.
Details of the stock option plans outstanding at the balance sheet date are as follows:
Overview of SOP1 Stock Option Plan
Granted Exercised Forfeited
Out-
standing
14.07.2000 12.09.2000 26.09.2000 18.000 319 941 313 746 2 460 3 735
01.06 -
15.06.2004
22.05 -
15.06.2013
13.07.2001 11.09.2001 26.09.2001 13.980 418 917 415 659 2 418 840
22.05 -
30.06.2005
22.05 -
15.06.2014
12.07.2002 10.09.2002 25.09.2002 15.825 106 152 104 352 720 1 080
22.05 -
30.06.2006
22.05 -
15.06.2015
11.07.2003 09.09.2003 06.10.2003 13.630 100 740 99 660 - 1 080
22.05 -
30.06.2007
22.05 -
15.06.2013
09.07.2004 07.09.2004 30.09.2004 15.765 502 182 487 165 3 15 014
22.05 -
30.06.2008
22.05 -
15.06.2014
1 447 932 1 420 582 5 601 21 749
Last
exercise
period
Date
offered
Date of
issue of
subscription
rights
First
exercise
period
Exercise
price
(in €)
Number of subscription rights
Date granted
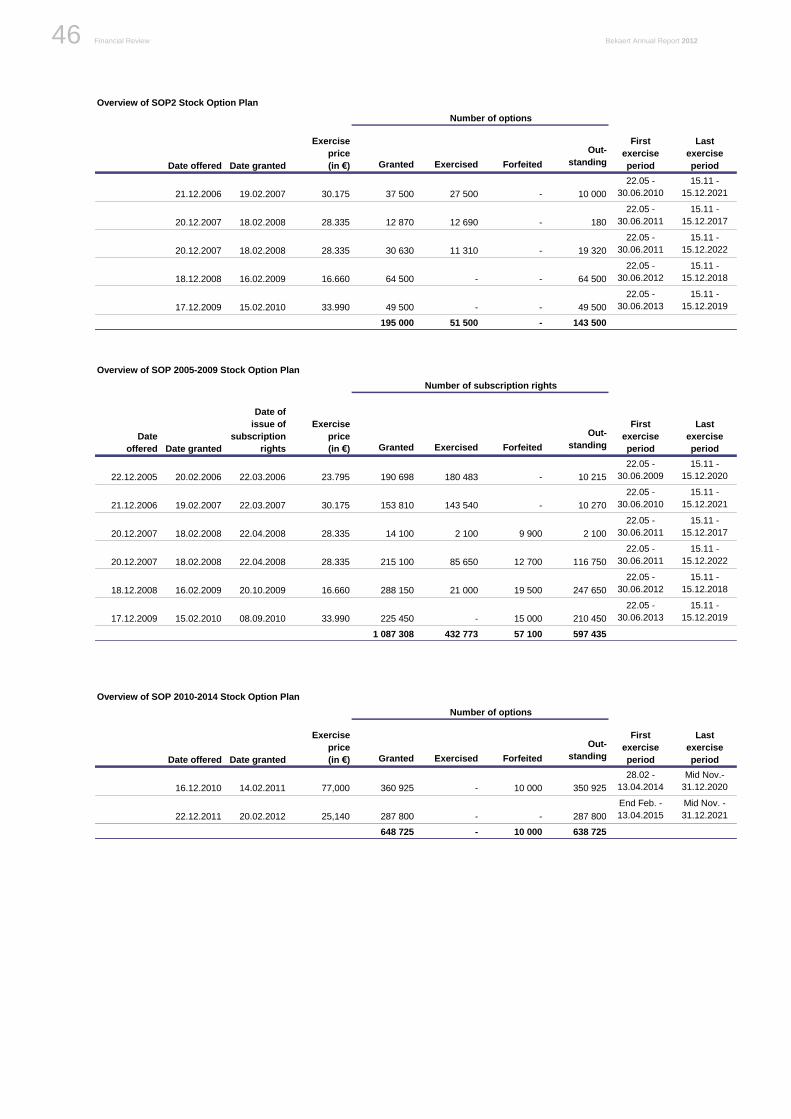
Financial Review Bekaert Annual Report 2012 46
Overview of SOP2 Stock Option Plan
Granted Exercised Forfeited
Out-
standing
19.02.2007 30.175 37 500 27 500 - 10 000
22.05 -
30.06.2010
15.11 -
15.12.2021
18.02.2008 28.335 12 870 12 690 - 180
22.05 -
30.06.2011
15.11 -
15.12.2017
18.02.2008 28.335 30 630 11 310 - 19 320
22.05 -
30.06.2011
15.11 -
15.12.2022
16.02.2009 16.660 64 500 - - 64 500
22.05 -
30.06.2012
15.11 -
15.12.2018
15.02.2010 33.990 49 500 - - 49 500
22.05 -
30.06.2013
15.11 -
15.12.2019
195 000 51 500 - 143 500
20.12.2007
17.12.2009
20.12.2007
18.12.2008
21.12.2006
Last
exercise
periodDate offered
First
exercise
period
Exercise
price
(in €)
Number of options
Date granted
Overview of SOP 2005-2009 Stock Option Plan
Granted Exercised Forfeited
Out-
standing
22.12.2005 20.02.2006 22.03.2006 23.795 190 698 180 483 - 10 215
22.05 -
30.06.2009
15.11 -
15.12.2020
21.12.2006 19.02.2007 22.03.2007 30.175 153 810 143 540 - 10 270
22.05 -
30.06.2010
15.11 -
15.12.2021
20.12.2007 18.02.2008 22.04.2008 28.335 14 100 2 100 9 900 2 100
22.05 -
30.06.2011
15.11 -
15.12.2017
20.12.2007 18.02.2008 22.04.2008 28.335 215 100 85 650 12 700 116 750
22.05 -
30.06.2011
15.11 -
15.12.2022
18.12.2008 16.02.2009 20.10.2009 16.660 288 150 21 000 19 500 247 650
22.05 -
30.06.2012
15.11 -
15.12.2018
17.12.2009 15.02.2010 08.09.2010 33.990 225 450 - 15 000 210 450
22.05 -
30.06.2013
15.11 -
15.12.2019
1 087 308 432 773 57 100 597 435
Last
exercise
period
Date
offered Date granted
Date of
issue of
subscription
rights
Exercise
price
(in €)
Number of subscription rights
First
exercise
period
Overview of SOP 2010-2014 Stock Option Plan
Granted Exercised Forfeited
Out-
standing
16.12.2010 14.02.2011 77,000 360 925 - 10 000 350 925
28.02 -
13.04.2014
Mid Nov.-
31.12.2020
22.12.2011 20.02.2012 25,140 287 800 - - 287 800
End Feb. -
13.04.2015
Mid Nov. -
31.12.2021
648 725 - 10 000 638 725
Date offered
Last
exercise
periodDate granted
Exercise
price
(in €)
Number of options
First
exercise
period
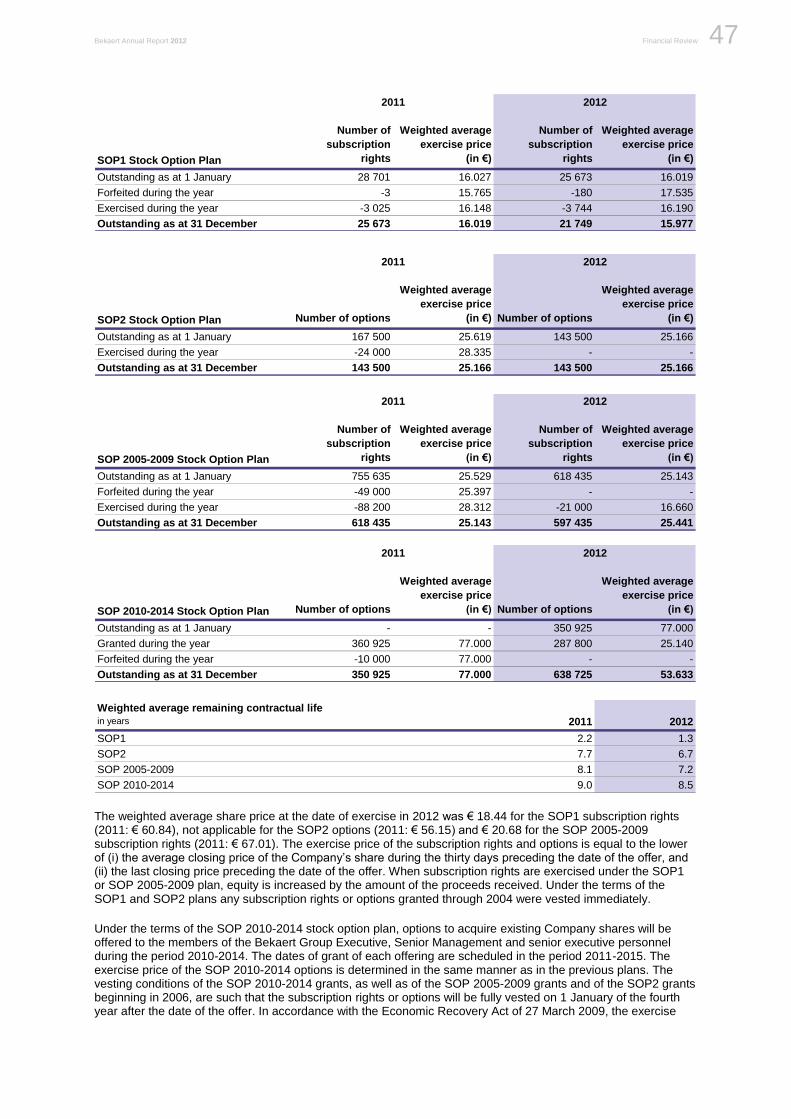
Bekaert Annual Report 2012 Financial Review 47
Be
ka
ert: F
inan
cia
l revie
w
SOP1 Stock Option Plan
Number of
subscription
rights
Weighted average
exercise price
(in €)
Number of
subscription
rights
Weighted average
exercise price
(in €)
Outstanding as at 1 January 28 701 16.027 25 673 16.019
Forfeited during the year -3 15.765 -180 17.535
Exercised during the year -3 025 16.148 -3 744 16.190
Outstanding as at 31 December 25 673 16.019 21 749 15.977
2011 2012
SOP2 Stock Option Plan Number of options
Weighted average
exercise price
(in €) Number of options
Weighted average
exercise price
(in €)
Outstanding as at 1 January 167 500 25.619 143 500 25.166
Exercised during the year -24 000 28.335 - -
Outstanding as at 31 December 143 500 25.166 143 500 25.166
2011 2012
SOP 2005-2009 Stock Option Plan
Number of
subscription
rights
Weighted average
exercise price
(in €)
Number of
subscription
rights
Weighted average
exercise price
(in €)
Outstanding as at 1 January 755 635 25.529 618 435 25.143
Forfeited during the year -49 000 25.397 - -
Exercised during the year -88 200 28.312 -21 000 16.660
Outstanding as at 31 December 618 435 25.143 597 435 25.441
2011 2012
SOP 2010-2014 Stock Option Plan Number of options
Weighted average
exercise price
(in €) Number of options
Weighted average
exercise price
(in €)
Outstanding as at 1 January - - 350 925 77.000
Granted during the year 360 925 77.000 287 800 25.140
Forfeited during the year -10 000 77.000 - -
Outstanding as at 31 December 350 925 77.000 638 725 53.633
2011 2012
2011 2012
SOP1 2.2 1.3
SOP2 7.7 6.7
SOP 2005-2009 8.1 7.2
SOP 2010-2014 9.0 8.5
Weighted average remaining contractual life
in years
The weighted average share price at the date of exercise in 2012 was € 18.44 for the SOP1 subscription rights (2011: € 60.84), not applicable for the SOP2 options (2011: € 56.15) and € 20.68 for the SOP 2005-2009 subscription rights (2011: € 67.01). The exercise price of the subscription rights and options is equal to the lower of (i) the average closing price of the Company’s share during the thirty days preceding the date of the offer, and (ii) the last closing price preceding the date of the offer. When subscription rights are exercised under the SOP1 or SOP 2005-2009 plan, equity is increased by the amount of the proceeds received. Under the terms of the SOP1 and SOP2 plans any subscription rights or options granted through 2004 were vested immediately.
Under the terms of the SOP 2010-2014 stock option plan, options to acquire existing Company shares will be offered to the members of the Bekaert Group Executive, Senior Management and senior executive personnel during the period 2010-2014. The dates of grant of each offering are scheduled in the period 2011-2015. The exercise price of the SOP 2010-2014 options is determined in the same manner as in the previous plans. The vesting conditions of the SOP 2010-2014 grants, as well as of the SOP 2005-2009 grants and of the SOP2 grants beginning in 2006, are such that the subscription rights or options will be fully vested on 1 January of the fourth year after the date of the offer. In accordance with the Economic Recovery Act of 27 March 2009, the exercise

Financial Review Bekaert Annual Report 2012 48
period of the SOP2 options and SOP 2005-2009 subscription rights granted in 2006, 2007 and 2008 was extended by five years in favor of the persons who were plan beneficiaries and subject to Belgian income tax at the time such extension was offered. The incremental fair value granted as a result of this amounts to € 0.3 million.
The options granted under SOP2 and SOP 2010-2014 and the subscription rights granted under SOP 2005-2009 are recognized at their fair value at grant date in accordance with IFRS 2 (see note 6.13. ‘Retained earnings and other Group reserves’). During 2012, 287 800 options (2011: 360 925) were granted under SOP 2010-2014 at a weighted average fair value per unit of € 13.68 (2011: € 17.85). The Group has recorded an expense against equity of € 4.2 million (2011: € 3.1 million) based on a straight-line amortization over the vesting period of the fair value of options and subscription rights granted over the past three years. The fair value of the options is determined using a binomial pricing model. The inputs to the model are: share price of € 32.10 at grant date (2011: € 78.42), exercise price of € 25.14 (2011: € 77.00), expected volatility of 39% (2011: 38%), expected dividend yield of 2.5% (2011: 2.5%), vesting period of 3 years, contractual life of 10 years, employee exit rate of 3% (2011: 2%) and a risk-free interest rate of 4.0%: (2011: 4.0%). To allow for the effects of early exercise, it was assumed that the employees would exercise the options and the subscription rights after the vesting date when the share price was 1.30 (2011: 1.25) times the exercise price.
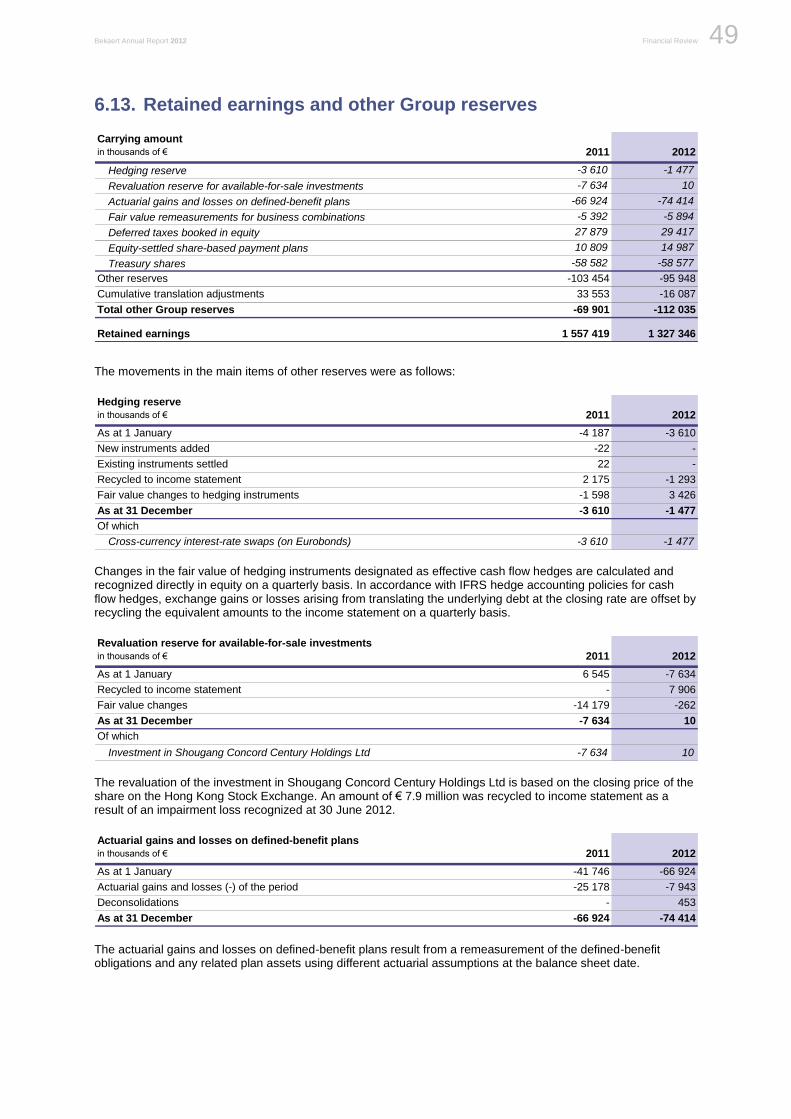
Bekaert Annual Report 2012 Financial Review 49
Be
ka
ert: F
inan
cia
l revie
w
6.13. Retained earnings and other Group reserves
Carrying amount
in thousands of € 2011 2012
Hedging reserve -3 610 -1 477
Revaluation reserve for available-for-sale investments -7 634 10
Actuarial gains and losses on defined-benefit plans -66 924 -74 414
Fair value remeasurements for business combinations -5 392 -5 894
Deferred taxes booked in equity 27 879 29 417
Equity-settled share-based payment plans 10 809 14 987
Treasury shares -58 582 -58 577
Other reserves -103 454 -95 948
Cumulative translation adjustments 33 553 -16 087
Total other Group reserves -69 901 -112 035
Retained earnings 1 557 419 1 327 346
The movements in the main items of other reserves were as follows:
Hedging reserve
in thousands of € 2011 2012
As at 1 January -4 187 -3 610
New instruments added -22 -
Existing instruments settled 22 -
Recycled to income statement 2 175 -1 293
Fair value changes to hedging instruments -1 598 3 426
As at 31 December -3 610 -1 477
Of which
Cross-currency interest-rate swaps (on Eurobonds) -3 610 -1 477
Changes in the fair value of hedging instruments designated as effective cash flow hedges are calculated and recognized directly in equity on a quarterly basis. In accordance with IFRS hedge accounting policies for cash flow hedges, exchange gains or losses arising from translating the underlying debt at the closing rate are offset by recycling the equivalent amounts to the income statement on a quarterly basis.
Revaluation reserve for available-for-sale investments
in thousands of € 2011 2012
As at 1 January 6 545 -7 634
Recycled to income statement - 7 906
Fair value changes -14 179 -262
As at 31 December -7 634 10
Of which
Investment in Shougang Concord Century Holdings Ltd -7 634 10
The revaluation of the investment in Shougang Concord Century Holdings Ltd is based on the closing price of the share on the Hong Kong Stock Exchange. An amount of € 7.9 million was recycled to income statement as a result of an impairment loss recognized at 30 June 2012.
Actuarial gains and losses on defined-benefit plans
in thousands of € 2011 2012
As at 1 January -41 746 -66 924
Actuarial gains and losses (-) of the period -25 178 -7 943
Deconsolidations - 453
As at 31 December -66 924 -74 414 The actuarial gains and losses on defined-benefit plans result from a remeasurement of the defined-benefit obligations and any related plan assets using different actuarial assumptions at the balance sheet date.
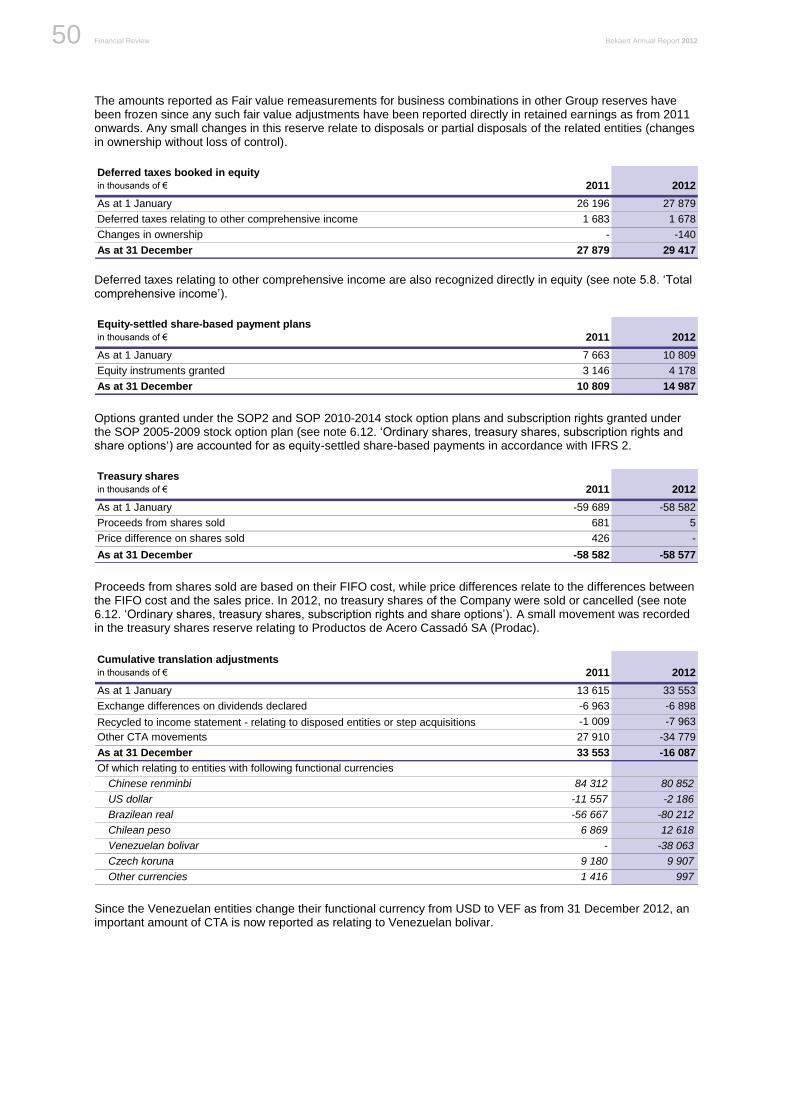
Financial Review Bekaert Annual Report 2012 50
The amounts reported as Fair value remeasurements for business combinations in other Group reserves have been frozen since any such fair value adjustments have been reported directly in retained earnings as from 2011 onwards. Any small changes in this reserve relate to disposals or partial disposals of the related entities (changes in ownership without loss of control).
Deferred taxes booked in equity
in thousands of € 2011 2012
As at 1 January 26 196 27 879
Deferred taxes relating to other comprehensive income 1 683 1 678
Changes in ownership - -140
As at 31 December 27 879 29 417
Deferred taxes relating to other comprehensive income are also recognized directly in equity (see note 5.8. ‘Total comprehensive income’).
Equity-settled share-based payment plans
in thousands of € 2011 2012
As at 1 January 7 663 10 809
Equity instruments granted 3 146 4 178
As at 31 December 10 809 14 987
Options granted under the SOP2 and SOP 2010-2014 stock option plans and subscription rights granted under the SOP 2005-2009 stock option plan (see note 6.12. ‘Ordinary shares, treasury shares, subscription rights and share options‘) are accounted for as equity-settled share-based payments in accordance with IFRS 2.
Treasury shares
in thousands of € 2011 2012
As at 1 January -59 689 -58 582
Proceeds from shares sold 681 5
Price difference on shares sold 426 -
As at 31 December -58 582 -58 577
Proceeds from shares sold are based on their FIFO cost, while price differences relate to the differences between the FIFO cost and the sales price. In 2012, no treasury shares of the Company were sold or cancelled (see note 6.12. ‘Ordinary shares, treasury shares, subscription rights and share options’). A small movement was recorded in the treasury shares reserve relating to Productos de Acero Cassadó SA (Prodac).
Cumulative translation adjustments
in thousands of € 2011 2012
As at 1 January 13 615 33 553
Exchange differences on dividends declared -6 963 -6 898
Recycled to income statement - relating to disposed entities or step acquisitions -1 009 -7 963
Other CTA movements 27 910 -34 779
As at 31 December 33 553 -16 087
Of which relating to entities with following functional currencies
Chinese renminbi 84 312 80 852
US dollar -11 557 -2 186
Brazilean real -56 667 -80 212
Chilean peso 6 869 12 618
Venezuelan bolivar - -38 063
Czech koruna 9 180 9 907
Other currencies 1 416 997
Since the Venezuelan entities change their functional currency from USD to VEF as from 31 December 2012, an important amount of CTA is now reported as relating to Venezuelan bolivar.
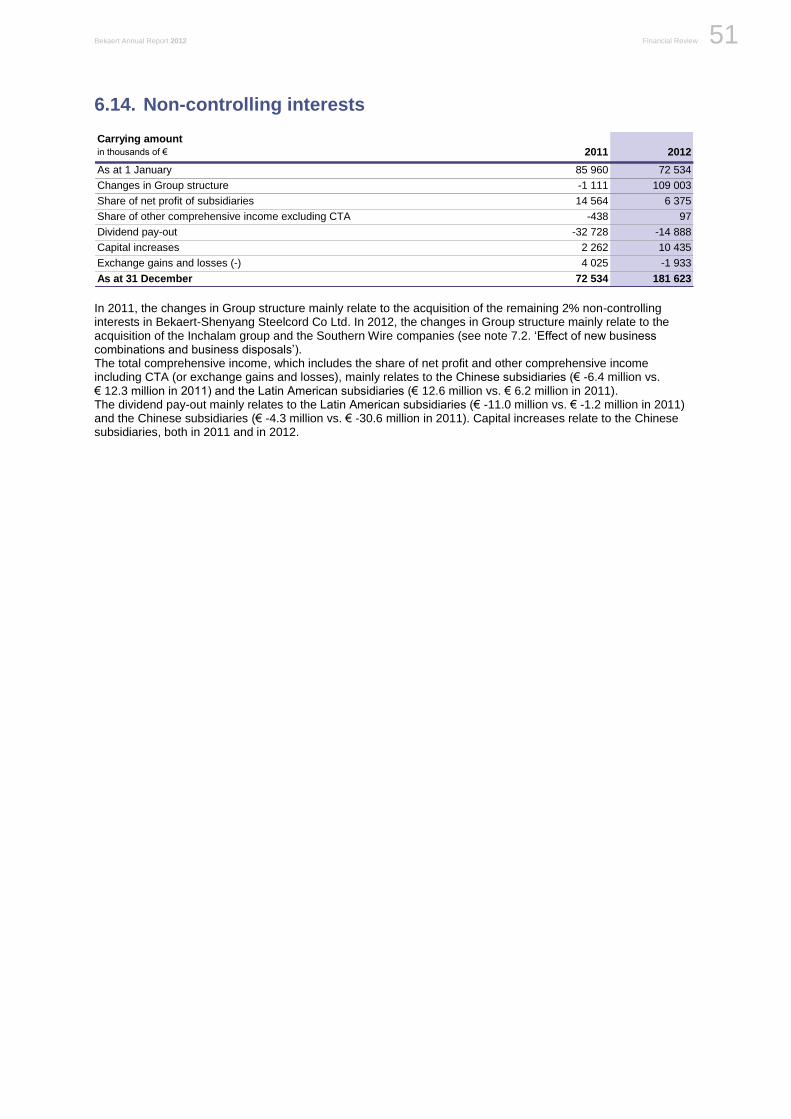
Bekaert Annual Report 2012 Financial Review 51
Be
ka
ert: F
inan
cia
l revie
w
6.14. Non-controlling interests
Carrying amount
in thousands of € 2011 2012
As at 1 January 85 960 72 534
Changes in Group structure -1 111 109 003
Share of net profit of subsidiaries 14 564 6 375
Share of other comprehensive income excluding CTA -438 97
Dividend pay-out -32 728 -14 888
Capital increases 2 262 10 435
Exchange gains and losses (-) 4 025 -1 933
As at 31 December 72 534 181 623 In 2011, the changes in Group structure mainly relate to the acquisition of the remaining 2% non-controlling interests in Bekaert-Shenyang Steelcord Co Ltd. In 2012, the changes in Group structure mainly relate to the acquisition of the Inchalam group and the Southern Wire companies (see note 7.2. ‘Effect of new business combinations and business disposals’). The total comprehensive income, which includes the share of net profit and other comprehensive income including CTA (or exchange gains and losses), mainly relates to the Chinese subsidiaries (€ -6.4 million vs. € 12.3 million in 2011) and the Latin American subsidiaries (€ 12.6 million vs. € 6.2 million in 2011). The dividend pay-out mainly relates to the Latin American subsidiaries (€ -11.0 million vs. € -1.2 million in 2011) and the Chinese subsidiaries (€ -4.3 million vs. € -30.6 million in 2011). Capital increases relate to the Chinese subsidiaries, both in 2011 and in 2012.
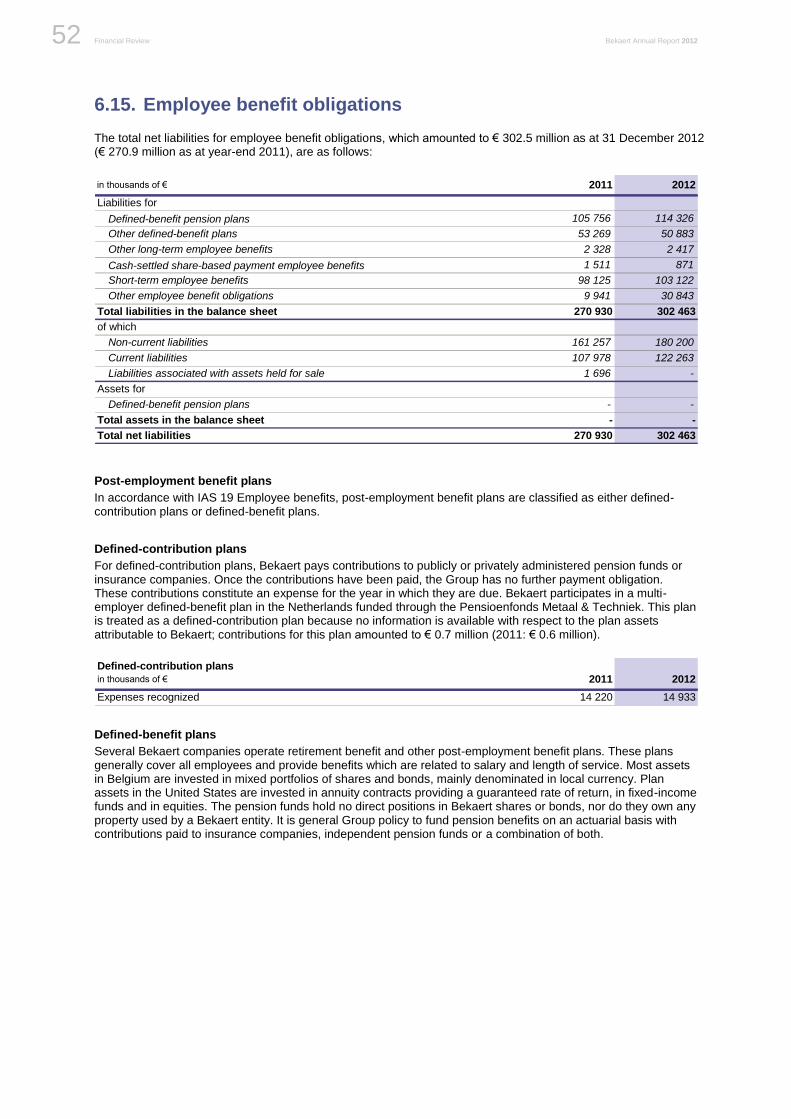
Financial Review Bekaert Annual Report 2012 52
6.15. Employee benefit obligations
The total net liabilities for employee benefit obligations, which amounted to € 302.5 million as at 31 December 2012 (€ 270.9 million as at year-end 2011), are as follows:
in thousands of € 2011 2012
Liabilities for
Defined-benefit pension plans 105 756 114 326
Other defined-benefit plans 53 269 50 883
Other long-term employee benefits 2 328 2 417
1 511 871
Short-term employee benefits 98 125 103 122
Other employee benefit obligations 9 941 30 843
Total liabilities in the balance sheet 270 930 302 463
of which
Non-current liabilities 161 257 180 200
Current liabilities 107 978 122 263
Liabilities associated with assets held for sale 1 696 -
Assets for
Defined-benefit pension plans - -
Total assets in the balance sheet - -
Total net liabilities 270 930 302 463
Cash-settled share-based payment employee benefits
Post-employment benefit plans
In accordance with IAS 19 Employee benefits, post-employment benefit plans are classified as either defined-contribution plans or defined-benefit plans.
Defined-contribution plans
For defined-contribution plans, Bekaert pays contributions to publicly or privately administered pension funds or insurance companies. Once the contributions have been paid, the Group has no further payment obligation. These contributions constitute an expense for the year in which they are due. Bekaert participates in a multi-employer defined-benefit plan in the Netherlands funded through the Pensioenfonds Metaal & Techniek. This plan is treated as a defined-contribution plan because no information is available with respect to the plan assets attributable to Bekaert; contributions for this plan amounted to € 0.7 million (2011: € 0.6 million).
Defined-contribution plans
in thousands of € 2011 2012
Expenses recognized 14 220 14 933
Defined-benefit plans
Several Bekaert companies operate retirement benefit and other post-employment benefit plans. These plans generally cover all employees and provide benefits which are related to salary and length of service. Most assets in Belgium are invested in mixed portfolios of shares and bonds, mainly denominated in local currency. Plan assets in the United States are invested in annuity contracts providing a guaranteed rate of return, in fixed-income funds and in equities. The pension funds hold no direct positions in Bekaert shares or bonds, nor do they own any property used by a Bekaert entity. It is general Group policy to fund pension benefits on an actuarial basis with contributions paid to insurance companies, independent pension funds or a combination of both.
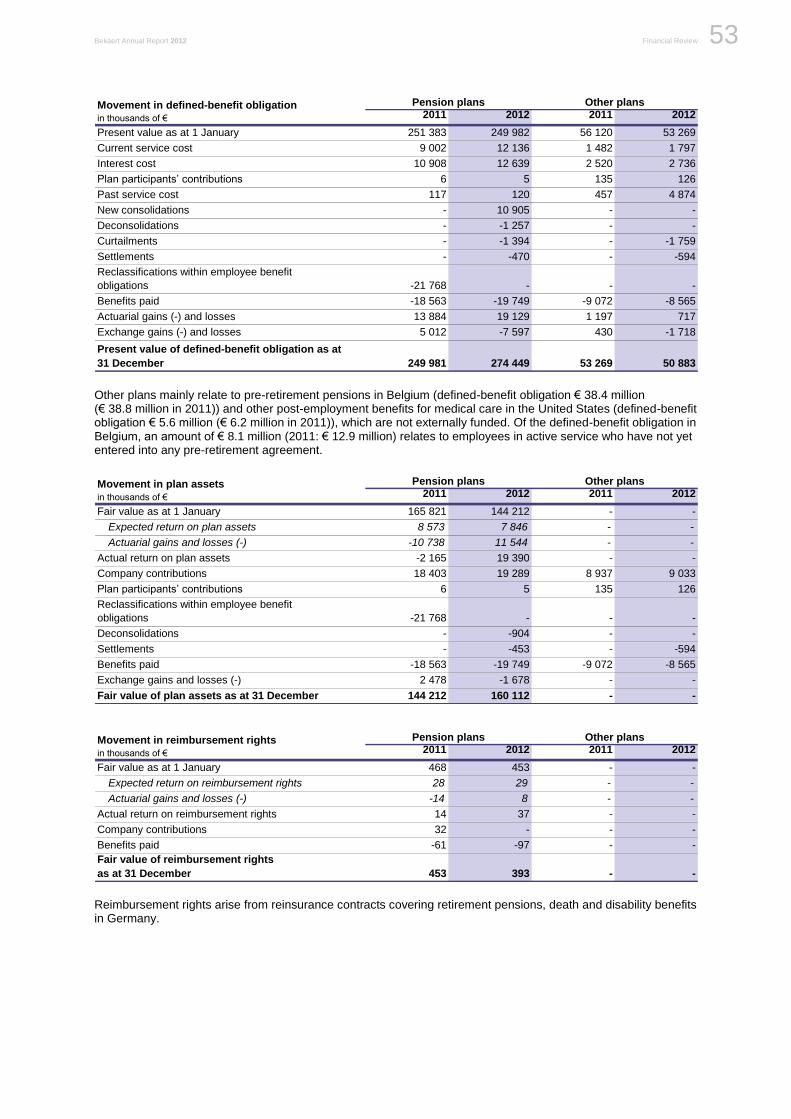
Bekaert Annual Report 2012 Financial Review 53
Be
ka
ert: F
inan
cia
l revie
w
2011 2012 2011 2012
Present value as at 1 January 251 383 249 982 56 120 53 269
Current service cost 9 002 12 136 1 482 1 797
Interest cost 10 908 12 639 2 520 2 736
Plan participants’ contributions 6 5 135 126
Past service cost 117 120 457 4 874
New consolidations - 10 905 - -
Deconsolidations - -1 257 - -
Curtailments - -1 394 - -1 759
Settlements - -470 - -594
Reclassifications within employee benefit
obligations -21 768 - - -
Benefits paid -18 563 -19 749 -9 072 -8 565
Actuarial gains (-) and losses 13 884 19 129 1 197 717
Exchange gains (-) and losses 5 012 -7 597 430 -1 718
Present value of defined-benefit obligation as at
31 December 249 981 274 449 53 269 50 883
Pension plans Other plansMovement in defined-benefit obligation
in thousands of €
Other plans mainly relate to pre-retirement pensions in Belgium (defined-benefit obligation € 38.4 million (€ 38.8 million in 2011)) and other post-employment benefits for medical care in the United States (defined-benefit obligation € 5.6 million (€ 6.2 million in 2011)), which are not externally funded. Of the defined-benefit obligation in Belgium, an amount of € 8.1 million (2011: € 12.9 million) relates to employees in active service who have not yet entered into any pre-retirement agreement.
2011 2012 2011 2012
Fair value as at 1 January 165 821 144 212 - -
Expected return on plan assets 8 573 7 846 - -
Actuarial gains and losses (-) -10 738 11 544 - -
Actual return on plan assets -2 165 19 390 - -
Company contributions 18 403 19 289 8 937 9 033
Plan participants’ contributions 6 5 135 126
Reclassifications within employee benefit
obligations -21 768 - - -
Deconsolidations - -904 - -
Settlements - -453 - -594
Benefits paid -18 563 -19 749 -9 072 -8 565
Exchange gains and losses (-) 2 478 -1 678 - -
Fair value of plan assets as at 31 December 144 212 160 112 - -
Pension plans Other plansMovement in plan assets
in thousands of €
2011 2012 2011 2012
Fair value as at 1 January 468 453 - -
Expected return on reimbursement rights 28 29 - -
Actuarial gains and losses (-) -14 8 - -
Actual return on reimbursement rights 14 37 - -
Company contributions 32 - - -
Benefits paid -61 -97 - -
Fair value of reimbursement rights
as at 31 December 453 393 - -
Pension plans Other plansMovement in reimbursement rights
in thousands of €
Reimbursement rights arise from reinsurance contracts covering retirement pensions, death and disability benefits in Germany.
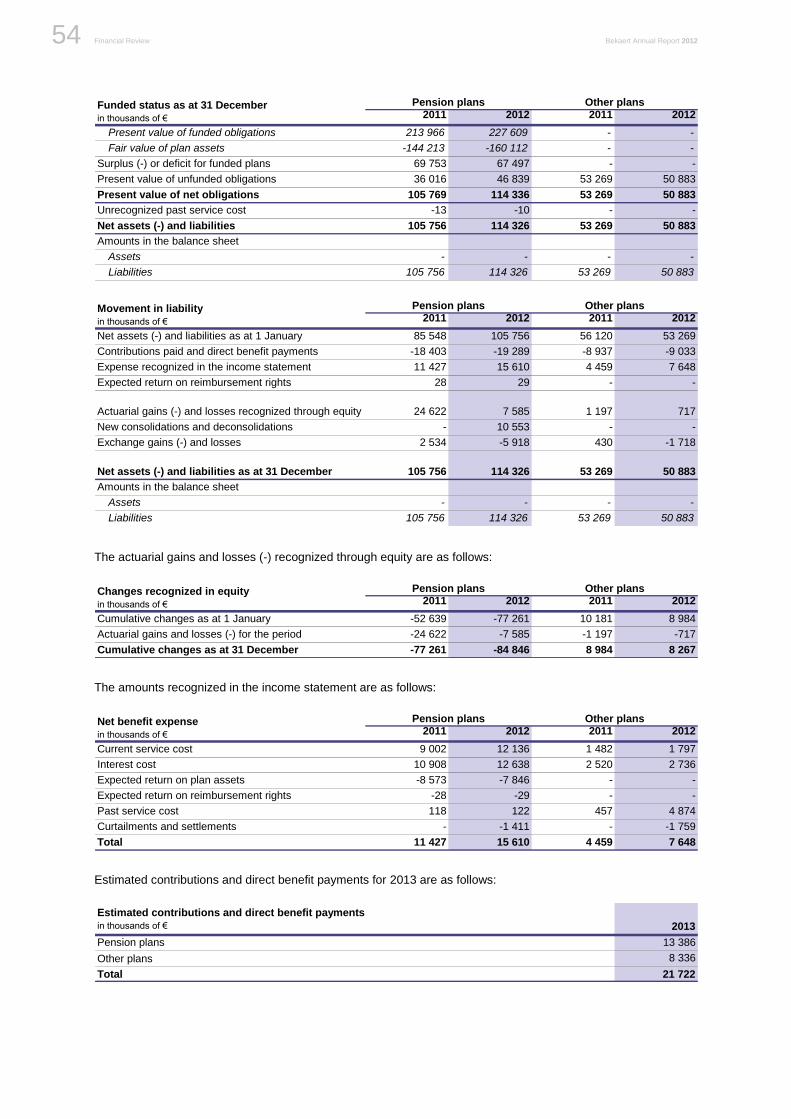
Financial Review Bekaert Annual Report 2012 54
2011 2012 2011 2012
Present value of funded obligations 213 966 227 609 - -
Fair value of plan assets -144 213 -160 112 - -
Surplus (-) or deficit for funded plans 69 753 67 497 - -
Present value of unfunded obligations 36 016 46 839 53 269 50 883
Present value of net obligations 105 769 114 336 53 269 50 883
Unrecognized past service cost -13 -10 - -
Net assets (-) and liabilities 105 756 114 326 53 269 50 883
Amounts in the balance sheet
Assets - - - -
Liabilities 105 756 114 326 53 269 50 883
Pension plans Other plansFunded status as at 31 December
in thousands of €
2011 2012 2011 2012
Net assets (-) and liabilities as at 1 January 85 548 105 756 56 120 53 269
Contributions paid and direct benefit payments -18 403 -19 289 -8 937 -9 033
Expense recognized in the income statement 11 427 15 610 4 459 7 648
Expected return on reimbursement rights 28 29 - -
Actuarial gains (-) and losses recognized through equity 24 622 7 585 1 197 717
New consolidations and deconsolidations - 10 553 - -
Exchange gains (-) and losses 2 534 -5 918 430 -1 718
Net assets (-) and liabilities as at 31 December 105 756 114 326 53 269 50 883
Amounts in the balance sheet
Assets - - - -
Liabilities 105 756 114 326 53 269 50 883
Pension plans Other plansMovement in liability
in thousands of €
The actuarial gains and losses (-) recognized through equity are as follows:
2011 2012 2011 2012
Cumulative changes as at 1 January -52 639 -77 261 10 181 8 984
Actuarial gains and losses (-) for the period -24 622 -7 585 -1 197 -717
Cumulative changes as at 31 December -77 261 -84 846 8 984 8 267
Pension plans Other plansChanges recognized in equity
in thousands of €
The amounts recognized in the income statement are as follows:
2011 2012 2011 2012
Current service cost 9 002 12 136 1 482 1 797
Interest cost 10 908 12 638 2 520 2 736
Expected return on plan assets -8 573 -7 846 - -
Expected return on reimbursement rights -28 -29 - -
Past service cost 118 122 457 4 874
Curtailments and settlements - -1 411 - -1 759
Total 11 427 15 610 4 459 7 648
Pension plans Other plansNet benefit expense
in thousands of €
Estimated contributions and direct benefit payments for 2013 are as follows:
2013
Pension plans 13 386
Other plans 8 336
Total 21 722
Estimated contributions and direct benefit payments
in thousands of €

Bekaert Annual Report 2012 Financial Review 55
Be
ka
ert: F
inan
cia
l revie
w
Fair values of plan assets at 31 December were as follows:
Fair value of plan assets by type
in thousands of € 2011 2012
Equity instruments 65 843 60 843
Debt instruments 49 353 99 269
Insurance contracts 29 016 -
Total plan assets 144 212 160 112
Equity instruments (%) 46% 38%
Debt instruments (%) 34% 62%
Insurance contracts (%) 20% 0%
Total plan assets (%) 100% 100%
Financial market-related parameters are derived from recent market information and determined in agreement with the contracted actuaries. The discount rate is based on the yields for AA corporate bonds with maturities approximating to those of the benefit obligations. The expected rate of return on plan assets is a weighted return based on the target asset allocation by plan. The risk premium may vary between parts of the world and for different types of equity instrument. The target mix is dependent on the investment strategy of each fund and may vary from 0% to 51% equity instruments. The principal actuarial assumptions on the balance sheet date (weighted averages) were:
Actuarial assumptions 2011 2012 2011 2012
Discount rate1
5.1% 3.8% 5.6% 3.7%
Expected return on plan assets2
6.3% 5.5% - -
Future salary increases 4.0% 3.6% 3.8% 3.2%
Health care cost increases (initial) - - 7.3% 7.0%
Health care cost increases (ultimate) - - 5.0% 5.0%
Health care (years to ultimate rate) - - 9 8
Underlying inflation rate 3.0% 2.8% 3.0% 2.6%
Life expectancy of a man aged 65 (years)
at balance sheet date 19.0 19.1 18.9 19.2
Life expectancy of a man aged 65 (years)
ten years from the balance sheet date 20.6 19.9 20.6 19.9
Pension plans Other plans
1 The discount rate is a weighted average based on outstanding DBO:
31/12/2011: for the pension plans: 4.5% in the United States, 4.7% in Belgium; for other plans: 4.1% in the United States, 4.7% in Belgium, 31/12/2012: for the pension plans: 3.9% in the United States, 3.0% in Belgium; for other plans: 3.5% in the United States, 3.0% in Belgium; other countries have higher discount rates which result in a higher average discount rate (Venezuela, Ecuador, Chili). Differences in duration also have an effect on the discount rates used.
2 Preceding year.
Sensitivity analyses on discount rate and health care cost assumptions show the following effects:
Sensitivity analysis on discount rate
in thousands of €
0.25%
increase
0.25%
decrease
0.25%
increase
0.25%
decrease
Defined-benefit obligation -8 042 8 358 -787 823
Sensitivity analysis on health care cost
in thousands of € 1% increase 1% decrease
Service cost and interest cost 98 -82
Defined-benefit obligation 525 -455
Pension plans Other plans
The above analyses were done on a mutually exclusive basis, and holding all other assumptions constant.
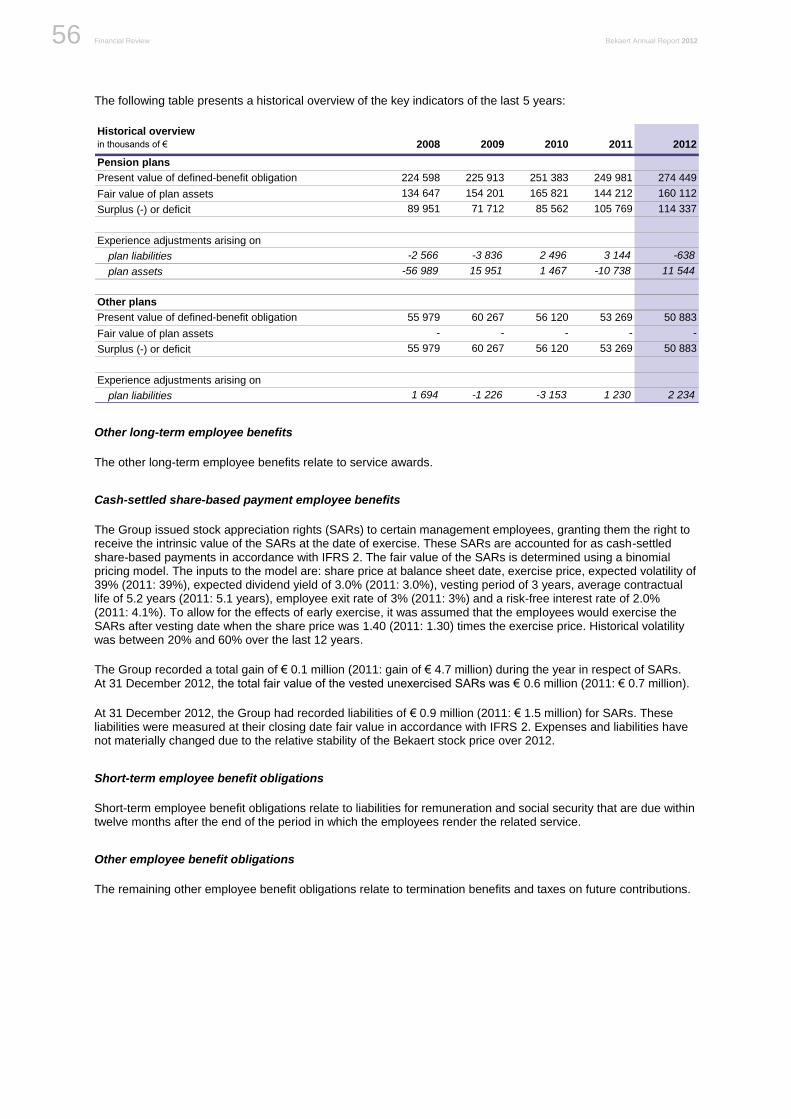
Financial Review Bekaert Annual Report 2012 56
The following table presents a historical overview of the key indicators of the last 5 years:
Historical overview
in thousands of € 2008 2009 2010 2011 2012
Pension plans
Present value of defined-benefit obligation 224 598 225 913 251 383 249 981 274 449
Fair value of plan assets 134 647 154 201 165 821 144 212 160 112
Surplus (-) or deficit 89 951 71 712 85 562 105 769 114 337
Experience adjustments arising on
plan liabilities -2 566 -3 836 2 496 3 144 -638
plan assets -56 989 15 951 1 467 -10 738 11 544
Other plans
Present value of defined-benefit obligation 55 979 60 267 56 120 53 269 50 883
Fair value of plan assets - - - - -
Surplus (-) or deficit 55 979 60 267 56 120 53 269 50 883
Experience adjustments arising on
plan liabilities 1 694 -1 226 -3 153 1 230 2 234
Other long-term employee benefits
The other long-term employee benefits relate to service awards.
Cash-settled share-based payment employee benefits
The Group issued stock appreciation rights (SARs) to certain management employees, granting them the right to receive the intrinsic value of the SARs at the date of exercise. These SARs are accounted for as cash-settled share-based payments in accordance with IFRS 2. The fair value of the SARs is determined using a binomial pricing model. The inputs to the model are: share price at balance sheet date, exercise price, expected volatility of 39% (2011: 39%), expected dividend yield of 3.0% (2011: 3.0%), vesting period of 3 years, average contractual life of 5.2 years (2011: 5.1 years), employee exit rate of 3% (2011: 3%) and a risk-free interest rate of 2.0% (2011: 4.1%). To allow for the effects of early exercise, it was assumed that the employees would exercise the SARs after vesting date when the share price was 1.40 (2011: 1.30) times the exercise price. Historical volatility was between 20% and 60% over the last 12 years.
The Group recorded a total gain of € 0.1 million (2011: gain of € 4.7 million) during the year in respect of SARs. At 31 December 2012, the total fair value of the vested unexercised SARs was € 0.6 million (2011: € 0.7 million).
At 31 December 2012, the Group had recorded liabilities of € 0.9 million (2011: € 1.5 million) for SARs. These liabilities were measured at their closing date fair value in accordance with IFRS 2. Expenses and liabilities have not materially changed due to the relative stability of the Bekaert stock price over 2012.
Short-term employee benefit obligations
Short-term employee benefit obligations relate to liabilities for remuneration and social security that are due within twelve months after the end of the period in which the employees render the related service.
Other employee benefit obligations
The remaining other employee benefit obligations relate to termination benefits and taxes on future contributions.
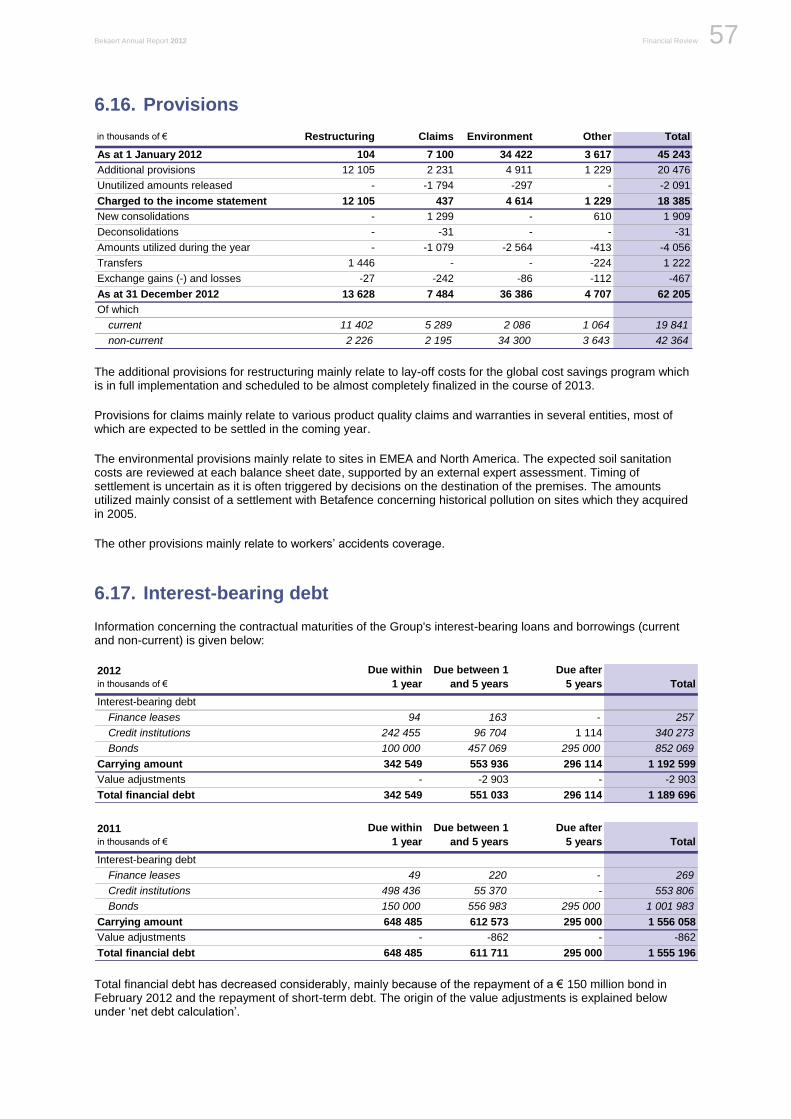
Bekaert Annual Report 2012 Financial Review 57
Be
ka
ert: F
inan
cia
l revie
w
6.16. Provisions
in thousands of € Restructuring Claims Environment Other Total
As at 1 January 2012 104 7 100 34 422 3 617 45 243
Additional provisions 12 105 2 231 4 911 1 229 20 476
Unutilized amounts released - -1 794 -297 - -2 091
Charged to the income statement 12 105 437 4 614 1 229 18 385
New consolidations - 1 299 - 610 1 909
Deconsolidations - -31 - - -31
Amounts utilized during the year - -1 079 -2 564 -413 -4 056
Transfers 1 446 - - -224 1 222
Exchange gains (-) and losses -27 -242 -86 -112 -467
As at 31 December 2012 13 628 7 484 36 386 4 707 62 205
Of which
current 11 402 5 289 2 086 1 064 19 841
non-current 2 226 2 195 34 300 3 643 42 364 The additional provisions for restructuring mainly relate to lay-off costs for the global cost savings program which is in full implementation and scheduled to be almost completely finalized in the course of 2013.
Provisions for claims mainly relate to various product quality claims and warranties in several entities, most of which are expected to be settled in the coming year.
The environmental provisions mainly relate to sites in EMEA and North America. The expected soil sanitation costs are reviewed at each balance sheet date, supported by an external expert assessment. Timing of settlement is uncertain as it is often triggered by decisions on the destination of the premises. The amounts utilized mainly consist of a settlement with Betafence concerning historical pollution on sites which they acquired in 2005.
The other provisions mainly relate to workers’ accidents coverage.
6.17. Interest-bearing debt
Information concerning the contractual maturities of the Group's interest-bearing loans and borrowings (current and non-current) is given below:
2012
in thousands of €
Due within
1 year
Due between 1
and 5 years
Due after
5 years Total
Interest-bearing debt
Finance leases 94 163 - 257
Credit institutions 242 455 96 704 1 114 340 273
Bonds 100 000 457 069 295 000 852 069
Carrying amount 342 549 553 936 296 114 1 192 599
Value adjustments - -2 903 - -2 903
Total financial debt 342 549 551 033 296 114 1 189 696
2011
in thousands of €
Due within
1 year
Due between 1
and 5 years
Due after
5 years Total
Interest-bearing debt
Finance leases 49 220 - 269
Credit institutions 498 436 55 370 - 553 806
Bonds 150 000 556 983 295 000 1 001 983
Carrying amount 648 485 612 573 295 000 1 556 058
Value adjustments - -862 - -862
Total financial debt 648 485 611 711 295 000 1 555 196
Total financial debt has decreased considerably, mainly because of the repayment of a € 150 million bond in February 2012 and the repayment of short-term debt. The origin of the value adjustments is explained below under ‘net debt calculation’.
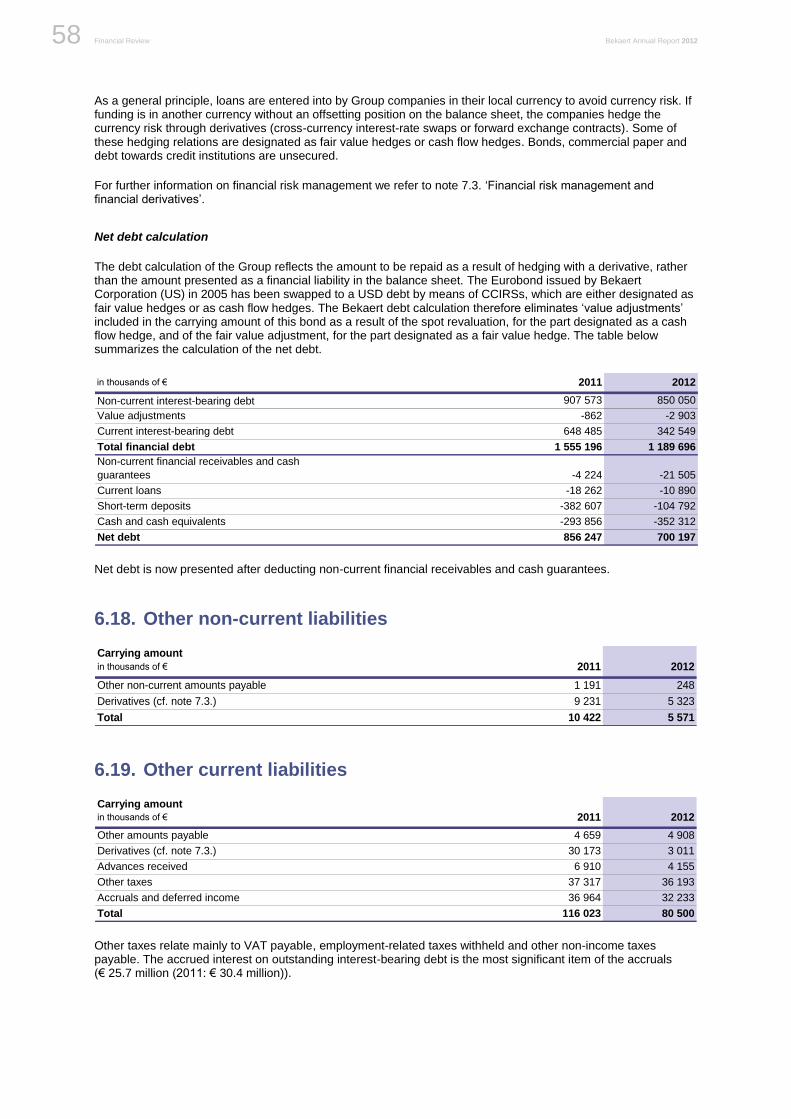
Financial Review Bekaert Annual Report 2012 58
As a general principle, loans are entered into by Group companies in their local currency to avoid currency risk. If funding is in another currency without an offsetting position on the balance sheet, the companies hedge the currency risk through derivatives (cross-currency interest-rate swaps or forward exchange contracts). Some of these hedging relations are designated as fair value hedges or cash flow hedges. Bonds, commercial paper and debt towards credit institutions are unsecured.
For further information on financial risk management we refer to note 7.3. ‘Financial risk management and financial derivatives’.
Net debt calculation
The debt calculation of the Group reflects the amount to be repaid as a result of hedging with a derivative, rather than the amount presented as a financial liability in the balance sheet. The Eurobond issued by Bekaert Corporation (US) in 2005 has been swapped to a USD debt by means of CCIRSs, which are either designated as fair value hedges or as cash flow hedges. The Bekaert debt calculation therefore eliminates ‘value adjustments’ included in the carrying amount of this bond as a result of the spot revaluation, for the part designated as a cash flow hedge, and of the fair value adjustment, for the part designated as a fair value hedge. The table below summarizes the calculation of the net debt.
in thousands of € 2011 2012
907 573 850 050
Value adjustments -862 -2 903
Current interest-bearing debt 648 485 342 549
Total financial debt 1 555 196 1 189 696
Non-current financial receivables and cash
guarantees -4 224 -21 505
Current loans -18 262 -10 890
Short-term deposits -382 607 -104 792
Cash and cash equivalents -293 856 -352 312
Net debt 856 247 700 197
Non-current interest-bearing debt
Net debt is now presented after deducting non-current financial receivables and cash guarantees.
6.18. Other non-current liabilities
Carrying amount
in thousands of € 2011 2012
Other non-current amounts payable 1 191 248
Derivatives (cf. note 7.3.) 9 231 5 323
Total 10 422 5 571
6.19. Other current liabilities
Carrying amount
in thousands of € 2011 2012
Other amounts payable 4 659 4 908
Derivatives (cf. note 7.3.) 30 173 3 011
Advances received 6 910 4 155
Other taxes 37 317 36 193
Accruals and deferred income 36 964 32 233
Total 116 023 80 500
Other taxes relate mainly to VAT payable, employment-related taxes withheld and other non-income taxes payable. The accrued interest on outstanding interest-bearing debt is the most significant item of the accruals (€ 25.7 million (2011: € 30.4 million)).
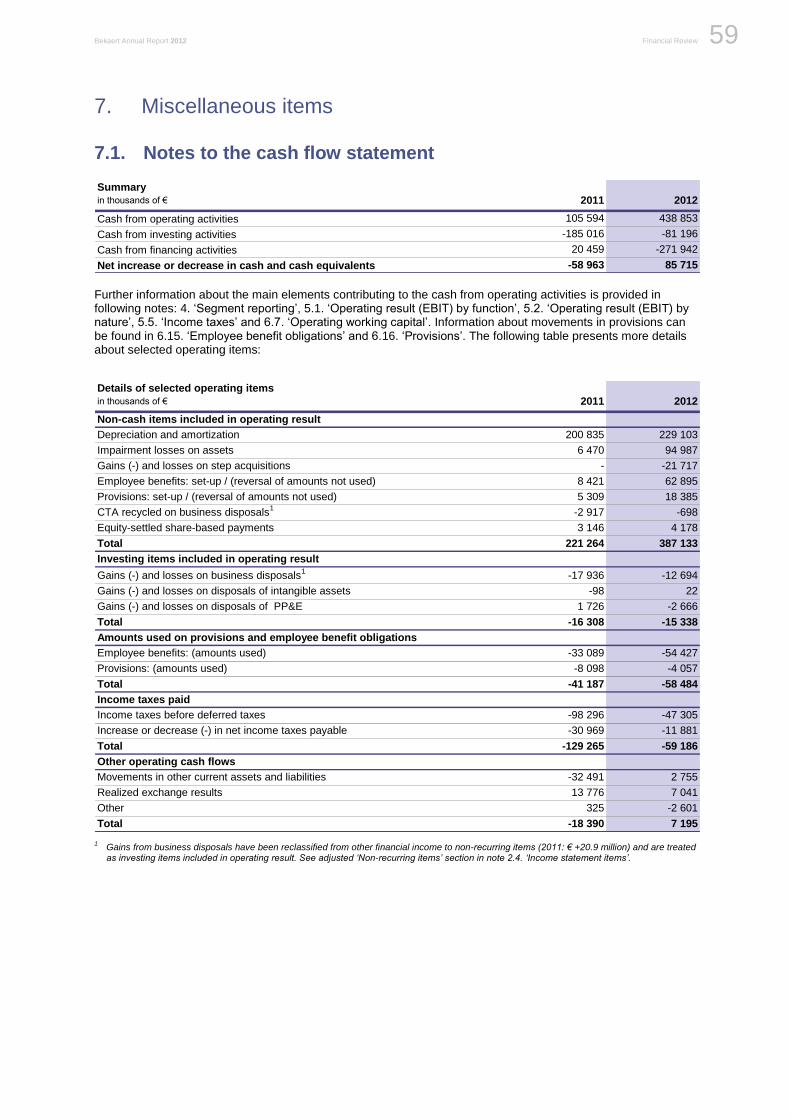
Bekaert Annual Report 2012 Financial Review 59
Be
ka
ert: F
inan
cia
l revie
w
7. Miscellaneous items
7.1. Notes to the cash flow statement
Summary
in thousands of € 2011 2012
Cash from operating activities 105 594 438 853
Cash from investing activities -185 016 -81 196
Cash from financing activities 20 459 -271 942
Net increase or decrease in cash and cash equivalents -58 963 85 715
Further information about the main elements contributing to the cash from operating activities is provided in following notes: 4. ‘Segment reporting’, 5.1. ‘Operating result (EBIT) by function’, 5.2. ‘Operating result (EBIT) by nature’, 5.5. ‘Income taxes’ and 6.7. ‘Operating working capital’. Information about movements in provisions can be found in 6.15. ‘Employee benefit obligations’ and 6.16. ‘Provisions’. The following table presents more details about selected operating items:
Details of selected operating items
in thousands of € 2011 2012
Non-cash items included in operating result
Depreciation and amortization 200 835 229 103
Impairment losses on assets 6 470 94 987
Gains (-) and losses on step acquisitions - -21 717
Employee benefits: set-up / (reversal of amounts not used) 8 421 62 895
Provisions: set-up / (reversal of amounts not used) 5 309 18 385
CTA recycled on business disposals1
-2 917 -698
Equity-settled share-based payments 3 146 4 178
Total 221 264 387 133
Investing items included in operating result
Gains (-) and losses on business disposals1
-17 936 -12 694
Gains (-) and losses on disposals of intangible assets -98 22
Gains (-) and losses on disposals of PP&E 1 726 -2 666
Total -16 308 -15 338
Amounts used on provisions and employee benefit obligations
Employee benefits: (amounts used) -33 089 -54 427
Provisions: (amounts used) -8 098 -4 057
Total -41 187 -58 484
Income taxes paid
Income taxes before deferred taxes -98 296 -47 305
Increase or decrease (-) in net income taxes payable -30 969 -11 881
Total -129 265 -59 186
Other operating cash flows
Movements in other current assets and liabilities -32 491 2 755
Realized exchange results 13 776 7 041
Other 325 -2 601
Total -18 390 7 195
1
Gains from business disposals have been reclassified from other financial income to non-recurring items (2011: € +20.9 million) and are treated as investing items included in operating result. See adjusted ‘Non-recurring items’ section in note 2.4. ‘Income statement items’.
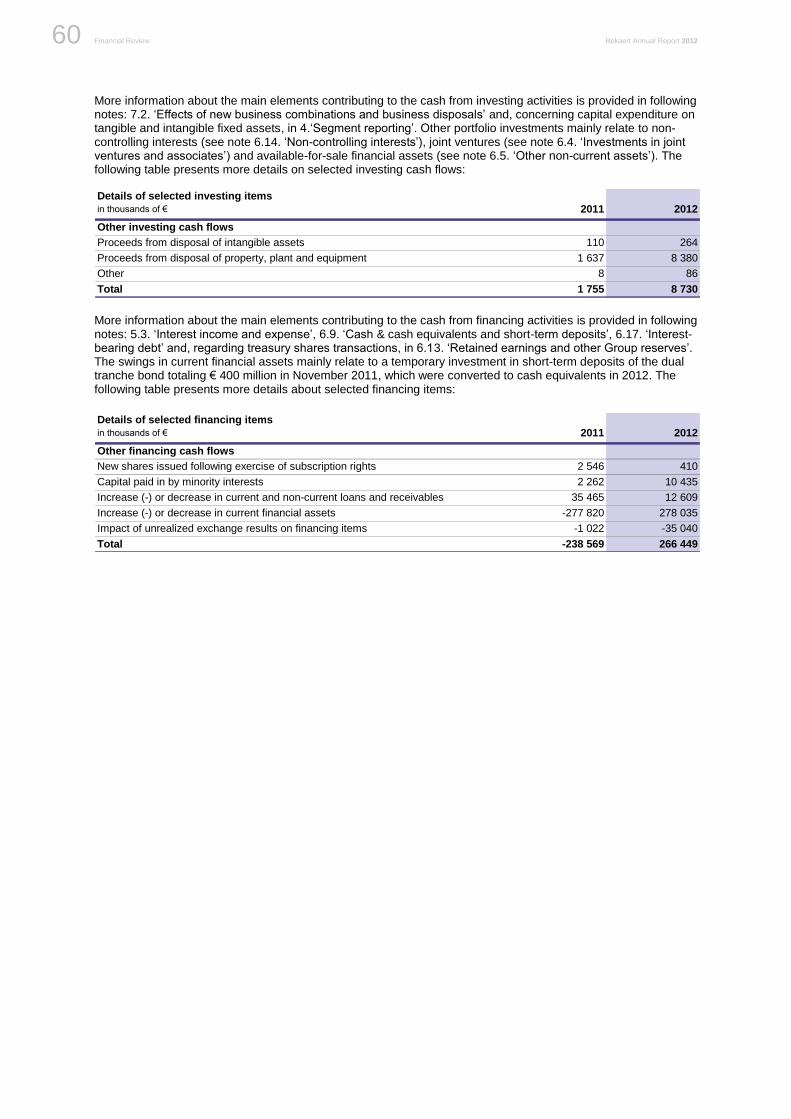
Financial Review Bekaert Annual Report 2012 60
More information about the main elements contributing to the cash from investing activities is provided in following notes: 7.2. ‘Effects of new business combinations and business disposals’ and, concerning capital expenditure on tangible and intangible fixed assets, in 4.‘Segment reporting’. Other portfolio investments mainly relate to non-controlling interests (see note 6.14. ‘Non-controlling interests’), joint ventures (see note 6.4. ‘Investments in joint ventures and associates’) and available-for-sale financial assets (see note 6.5. ‘Other non-current assets’). The following table presents more details on selected investing cash flows:
Details of selected investing items
in thousands of € 2011 2012
Other investing cash flows
Proceeds from disposal of intangible assets 110 264
Proceeds from disposal of property, plant and equipment 1 637 8 380
Other 8 86
Total 1 755 8 730
More information about the main elements contributing to the cash from financing activities is provided in following notes: 5.3. ‘Interest income and expense’, 6.9. ‘Cash & cash equivalents and short-term deposits’, 6.17. ‘Interest-bearing debt’ and, regarding treasury shares transactions, in 6.13. ‘Retained earnings and other Group reserves’. The swings in current financial assets mainly relate to a temporary investment in short-term deposits of the dual tranche bond totaling € 400 million in November 2011, which were converted to cash equivalents in 2012. The following table presents more details about selected financing items:
Details of selected financing items
in thousands of € 2011 2012
Other financing cash flows
New shares issued following exercise of subscription rights 2 546 410
Capital paid in by minority interests 2 262 10 435
Increase (-) or decrease in current and non-current loans and receivables 35 465 12 609
Increase (-) or decrease in current financial assets -277 820 278 035
Impact of unrealized exchange results on financing items -1 022 -35 040
Total -238 569 266 449
Bekaert Annual Report 2012 Financial Review 61
Be
ka
ert: F
inan
cia
l revie
w
7.2. Effect of new business combinations and business disposals
Business combinations (1): the Inchalam group (step) acquisition
On 22 December 2011, Bekaert announced the signing of an agreement with its Chilean partners to restructure the shareholding of their joint venture operations in Chile, Peru and Canada. The deal was finalized on 13 March 2012, but came into effect as from 1 January 2012. As a consequence, Bekaert became the principal shareholder (52%) in the Inchalam Group and acquires control in all of the following entities:
Industrias Chilenas de Alambre – Inchalam SA in Talcahuano, Chile;
Acma Inversiones SA in Talcahuano, Chile;
Industrias Acmanet Ltda in Talcahuano, Chile;
Prodalam SA in Santiago, Chile;
Acma SA in Santiago, Chile;
Acmanet SA in Santiago, Chile;
Productos de Acero SA – Prodinsa in Maipú, Chile;
Prodinsa Ingeniería y Proyectos SA in Santiago, Chile;
Wire Rope Industries Ltd in Pointe-Claire, Canada;
Procables SA in Callao, Peru;
Impala SA in Panama, Panama.
By this strategic transaction, Bekaert strengthens its position in the steel wire business in Chile and the ropes business in Chile, Peru and Canada. Bekaert announced that it will further pursue the business strategy and approach in place and capitalize on synergies and future growth in the countries and businesses concerned.
The deal also involved Productos de Acero Cassadó SA (Prodac) in Callao, Peru, a subsidiary of the Bekaert Group. Prior to the deal, Bekaert owned 32% in Prodac via a Spanish holding, Bekaert Ideal SL, and 20% via the Inchalam group. In this transaction, Bekaert contributed its 32% interests in Prodac through Bekaert Ideal SL to the Inchalam group in exchange of 2% additional interests in the latter. The fair value of the interests in Prodac given up was determined at USD 7.0 million (€ 5.5 million), using a discounted cash flow approach. Consequently, Bekaert received new shares in Inchalam SA and Prodalam SA for an aggregate nominal value of USD 7.0 million (€ 5.5 million).
In accordance with IFRS 3 (revised 2008), when a business combination is achieved in stages, also known as a step acquisition, the Group’s previously held equity interest in the acquiree is remeasured to fair value at the acquisition date, and any resulting gain or loss is recognized in profit or loss. In this case, the fair value of the Group’s previously held 50% interest in the Inchalam Group was extrapolated from the USD 7.0 million purchase consideration of the 2% interest acquired, after deducting a control premium valued at USD 2.3 million. This extrapolation established the fair value at € 92.0 million. The carrying amount of the Group’s interest in the Inchalam group at the acquisition date amounted to € 77.5 million. This resulted in a gain on step acquisition of € 14.5 million, which is presented in ‘non-recurring items’ in the income statement.
In accordance with IFRS 3, any amounts arising from interests in the acquiree prior to the acquisition date that have been recognized in the Group’s other comprehensive income are reclassified to profit or loss, where such treatment would be appropriate if the interests were disposed of. This resulted in an additional gain of € 7.3 million from a reclassification of cumulative translation adjustments, which is also presented in ‘non-recurring items’ in the income statement.
Goodwill is measured as the difference between:
(i) The sum of the following elements:
a. Consideration transferred;
b. Amount of any non-controlling interests in the acquiree;
c. Fair value of the Group’s previously held equity interest in the acquiree; and
(ii) The net balance of the fair value of the identifiable assets acquired and the liabilities assumed.
Since the purchase consideration consisted of the Prodac shares, its cost is equivalent to the non-controlling interest disposed.
The initial accounting for the business combination resulted in a slightly positive goodwill (€ 0.9 million), after reviewing the provisional figures disclosed in the Group’s interim report of the 1rst semester 2012.
The table below presents the net assets acquired by balance sheet caption, showing the effect of fair value adjustments applied in accordance with IFRS 3 Business Combinations and the goodwill calculation. Together
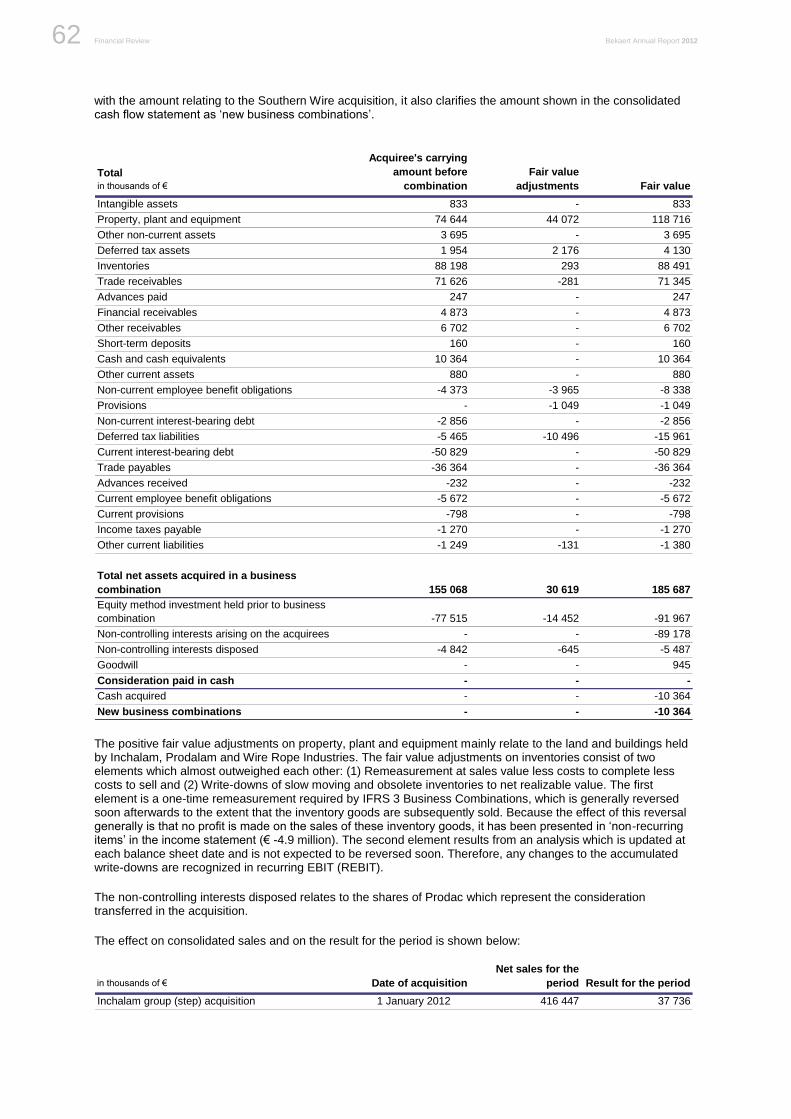
Financial Review Bekaert Annual Report 2012 62
with the amount relating to the Southern Wire acquisition, it also clarifies the amount shown in the consolidated cash flow statement as ‘new business combinations’.
Total
in thousands of €
Acquiree's carrying
amount before
combination
Fair value
adjustments Fair value
Intangible assets 833 - 833
Property, plant and equipment 74 644 44 072 118 716
Other non-current assets 3 695 - 3 695
Deferred tax assets 1 954 2 176 4 130
Inventories 88 198 293 88 491
Trade receivables 71 626 -281 71 345
Advances paid 247 - 247
Financial receivables 4 873 - 4 873
Other receivables 6 702 - 6 702
Short-term deposits 160 - 160
Cash and cash equivalents 10 364 - 10 364
Other current assets 880 - 880
Non-current employee benefit obligations -4 373 -3 965 -8 338
Provisions - -1 049 -1 049
Non-current interest-bearing debt -2 856 - -2 856
Deferred tax liabilities -5 465 -10 496 -15 961
Current interest-bearing debt -50 829 - -50 829
Trade payables -36 364 - -36 364
Advances received -232 - -232
Current employee benefit obligations -5 672 - -5 672
Current provisions -798 - -798
Income taxes payable -1 270 - -1 270
Other current liabilities -1 249 -131 -1 380
Total net assets acquired in a business
combination 155 068 30 619 185 687
Equity method investment held prior to business
combination -77 515 -14 452 -91 967
Non-controlling interests arising on the acquirees - - -89 178
Non-controlling interests disposed -4 842 -645 -5 487
Goodwill - - 945
Consideration paid in cash - - -
Cash acquired - - -10 364
New business combinations - - -10 364
The positive fair value adjustments on property, plant and equipment mainly relate to the land and buildings held by Inchalam, Prodalam and Wire Rope Industries. The fair value adjustments on inventories consist of two elements which almost outweighed each other: (1) Remeasurement at sales value less costs to complete less costs to sell and (2) Write-downs of slow moving and obsolete inventories to net realizable value. The first element is a one-time remeasurement required by IFRS 3 Business Combinations, which is generally reversed soon afterwards to the extent that the inventory goods are subsequently sold. Because the effect of this reversal generally is that no profit is made on the sales of these inventory goods, it has been presented in ‘non-recurring items’ in the income statement (€ -4.9 million). The second element results from an analysis which is updated at each balance sheet date and is not expected to be reversed soon. Therefore, any changes to the accumulated write-downs are recognized in recurring EBIT (REBIT).
The non-controlling interests disposed relates to the shares of Prodac which represent the consideration transferred in the acquisition.
The effect on consolidated sales and on the result for the period is shown below:
in thousands of € Date of acquisition
Net sales for the
period Result for the period
Inchalam group (step) acquisition 1 January 2012 416 447 37 736
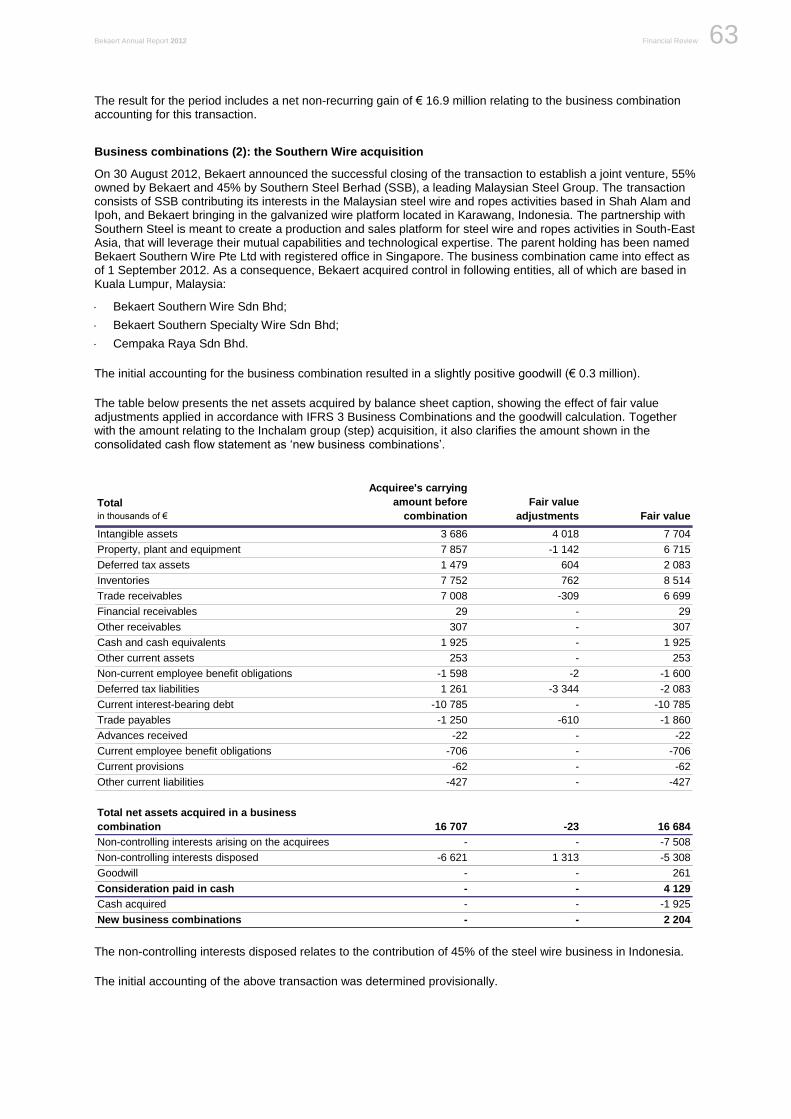
Bekaert Annual Report 2012 Financial Review 63
Be
ka
ert: F
inan
cia
l revie
w
The result for the period includes a net non-recurring gain of € 16.9 million relating to the business combination accounting for this transaction.
Business combinations (2): the Southern Wire acquisition
On 30 August 2012, Bekaert announced the successful closing of the transaction to establish a joint venture, 55% owned by Bekaert and 45% by Southern Steel Berhad (SSB), a leading Malaysian Steel Group. The transaction consists of SSB contributing its interests in the Malaysian steel wire and ropes activities based in Shah Alam and Ipoh, and Bekaert bringing in the galvanized wire platform located in Karawang, Indonesia. The partnership with Southern Steel is meant to create a production and sales platform for steel wire and ropes activities in South-East Asia, that will leverage their mutual capabilities and technological expertise. The parent holding has been named Bekaert Southern Wire Pte Ltd with registered office in Singapore. The business combination came into effect as of 1 September 2012. As a consequence, Bekaert acquired control in following entities, all of which are based in Kuala Lumpur, Malaysia:
Bekaert Southern Wire Sdn Bhd;
Bekaert Southern Specialty Wire Sdn Bhd;
Cempaka Raya Sdn Bhd.
The initial accounting for the business combination resulted in a slightly positive goodwill (€ 0.3 million).
The table below presents the net assets acquired by balance sheet caption, showing the effect of fair value adjustments applied in accordance with IFRS 3 Business Combinations and the goodwill calculation. Together with the amount relating to the Inchalam group (step) acquisition, it also clarifies the amount shown in the consolidated cash flow statement as ‘new business combinations’.
Total
in thousands of €
Acquiree's carrying
amount before
combination
Fair value
adjustments Fair value
Intangible assets 3 686 4 018 7 704
Property, plant and equipment 7 857 -1 142 6 715
Deferred tax assets 1 479 604 2 083
Inventories 7 752 762 8 514
Trade receivables 7 008 -309 6 699
Financial receivables 29 - 29
Other receivables 307 - 307
Cash and cash equivalents 1 925 - 1 925
Other current assets 253 - 253
Non-current employee benefit obligations -1 598 -2 -1 600
Deferred tax liabilities 1 261 -3 344 -2 083
Current interest-bearing debt -10 785 - -10 785
Trade payables -1 250 -610 -1 860
Advances received -22 - -22
Current employee benefit obligations -706 - -706
Current provisions -62 - -62
Other current liabilities -427 - -427
Total net assets acquired in a business
combination 16 707 -23 16 684
Non-controlling interests arising on the acquirees - - -7 508
Non-controlling interests disposed -6 621 1 313 -5 308
Goodwill - - 261
Consideration paid in cash - - 4 129
Cash acquired - - -1 925
New business combinations - - 2 204
The non-controlling interests disposed relates to the contribution of 45% of the steel wire business in Indonesia.
The initial accounting of the above transaction was determined provisionally.

Financial Review Bekaert Annual Report 2012 64
The effect on consolidated sales and on the result for the period is shown below:
in thousands of € Date of acquisition
Net sales for the
period Result for the period
Southern Wire (Malaysian entities) 1 September 2012 16 952 -3 689
The result for the period includes a net non-recurring loss of € 1.9 million relating to the business combination accounting for this transaction. The main part of this relates to the reversal of the one-time remeasurement of inventories at sales value less costs to complete less costs to sell, which is required by IFRS 3 Business Combinations.
It is impracticable to recalculate the consolidated sales and results for the period as if the acquisition date were 1 January, mainly because this would cause undue effort and cost in view of its limited relevance.
Business disposals
On 2 April 2012, Bekaert sold its Industrial Coatings activities to Element Partners, a Pennsylvania, US-based equity fund. The transaction covered the production facilities in Deinze (Belgium) and Jiangyin (Jiangsu province, China), and the respective sales organization.
The table below presents the net assets disposed by balance sheet caption. It also clarifies the amount shown in the consolidated cash flow statement as ‘Proceeds from disposal of investments’.
in thousands of €
Industrial Coatings
activities Other disposals Total disposals
Intangible assets -26 - -26
Property, plant and equipment 591 253 844
Investments - 5 5
Deferred tax assets -12 - -12
Inventories 1 357 - 1 357
Trade receivables 1 206 - 1 206
Advances paid 22 - 22
Other receivables 11 18 29
Cash and cash equivalents -35 - -35
Assets held for sale 31 363 - 31 363
Other current assets -9 - -9
Non-current employee benefit obligations 8 - 8
Provisions 5 - 5
Deferred tax liabilities -43 - -43
Current financial liabilities -729 - -729
Trade payables -1 199 - -1 199
Advances received 1 370 - 1 370
Current employee benefit obligations 19 - 19
Current provisions -35 - -35
Income taxes payable -183 - -183
Liabilities associated with assets held for sale -12 197 - -12 197
Other current liabilities 1 582 - 1 582
Total net assets disposed 23 066 276 23 342
Gain or loss (-) on business disposals 11 174 2 218 13 392
CTA recycled on disposal (non-cash) -386 -312 -698
Cash disposed 35 - 35
Gain or loss (-) on non-consolidated investments - 2 198 2 198
Proceeds from NCI disposal recognized in equity - 1 379 1 379
Deferred proceeds -16 101 -778 -16 879
Proceeds from disposals of investments 17 788 4 981 22 769
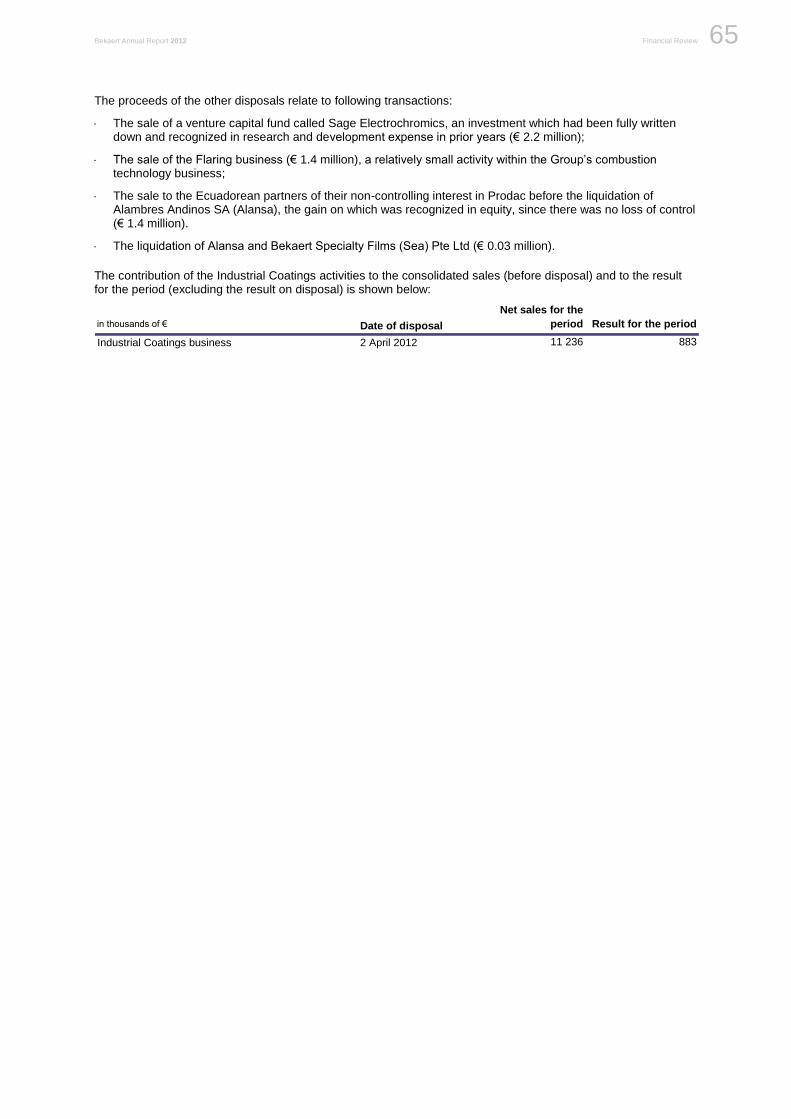
Bekaert Annual Report 2012 Financial Review 65
Be
ka
ert: F
inan
cia
l revie
w
The proceeds of the other disposals relate to following transactions:
The sale of a venture capital fund called Sage Electrochromics, an investment which had been fully written down and recognized in research and development expense in prior years (€ 2.2 million);
The sale of the Flaring business (€ 1.4 million), a relatively small activity within the Group’s combustion technology business;
The sale to the Ecuadorean partners of their non-controlling interest in Prodac before the liquidation of Alambres Andinos SA (Alansa), the gain on which was recognized in equity, since there was no loss of control (€ 1.4 million).
The liquidation of Alansa and Bekaert Specialty Films (Sea) Pte Ltd (€ 0.03 million).
The contribution of the Industrial Coatings activities to the consolidated sales (before disposal) and to the result for the period (excluding the result on disposal) is shown below:
in thousands of € Date of disposal
Net sales for the
period Result for the period
Industrial Coatings business 2 April 2012 11 236 883
Financial Review Bekaert Annual Report 2012 66
7.3. Financial risk management and financial derivatives
Principles of financial risk management
The Group is exposed to risks from movements in exchange rates, interest rates and market prices that affect its assets and liabilities. Financial risk management within the Group aims at reducing the impact of these market risks through ongoing operational and financing activities. Selected derivative hedging instruments are used depending on the assessment of risk involved. The Group mainly hedges the risks that affect the Group’s cash flows. Derivatives are used exclusively as hedging instruments and not for trading or other speculative purposes. To reduce the credit risk, hedging transactions are generally only concluded with financial institutions whose credit rating is at least A.
The guidelines and principles of the Bekaert financial risk policy are defined by the Audit and Finance Committee and overseen by the Board of the Group. Group Treasury is responsible for implementing the financial risk policy. This encompasses defining appropriate policies and setting up effective control and reporting procedures. The Audit and Finance Committee is regularly kept informed as to the currency and interest-rate exposure.
Currency risk
The Group’s currency risk can be split into two categories: translational and transactional currency risk.
Translational currency risk
A translation risk arises when the financial data of foreign subsidiaries are converted into the Group’s presentation currency, the euro. The main currencies are Chinese renminbi, US dollar, Czech koruna, Brazilian real, the Chilean peso and the Venezuelan bolivar. Since there is no impact on the cash flows, the Group usually does not hedge against such risk.
Transactional currency risk
The Group is exposed to transactional currency risks resulting from its investing, financing and operating activities.
Foreign currency risk in the area of investment results from the acquisition and disposal of investments in foreign companies, but also from dividends receivable from foreign investments. Transactional currency risks typically arise from administrative delay in the settlement of dividend payments from Chinese subsidiaries. The group enters into non-deliverable forward contracts (NDFs) with various financial institutions to hedge these risks. These NDFs typically are not elected for hedge accounting.
Foreign currency risk in the financing area results from financial liabilities in foreign currencies. In line with its policy, Group Treasury hedges these risks. Cross-currency interest-rate swaps and forward exchange contracts are used to convert financial obligations denominated in foreign currencies into the entity’s functional currency. At the reporting date, the foreign currency liabilities for which currency risks were hedged mainly consisted of Eurobonds and intercompany loans mainly in euro and US dollar.
Foreign currency risk in the area of operating activities arises from commercial activities with sales and purchases in foreign currencies, as well as payments and receipts of royalties. The Group uses forward exchange contracts to hedge the forecasted cash inflows and outflows for the coming three months. Significant exposures and firm commitments beyond that time frame may also be covered.
Currency sensitivity analysis
Currency sensitivity relating to the operating activities
The table below summarizes the Group’s net foreign currency positions of trade receivables and trade payables at the reporting date for the most important currency pairs. The net currency positions are presented before intercompany eliminations. Positive amounts indicate that the Group has a net future cash inflow in the first currency. In the table, the ‘Total exposure’ column represents the position on the balance sheet, while the ‘Total derivatives’ column includes all financial derivatives hedging those balance sheet positions as well as forecasted transactions. The annualized volatility is based on the daily movement of the exchange rate of the reported year, with a 95% confidence interval.
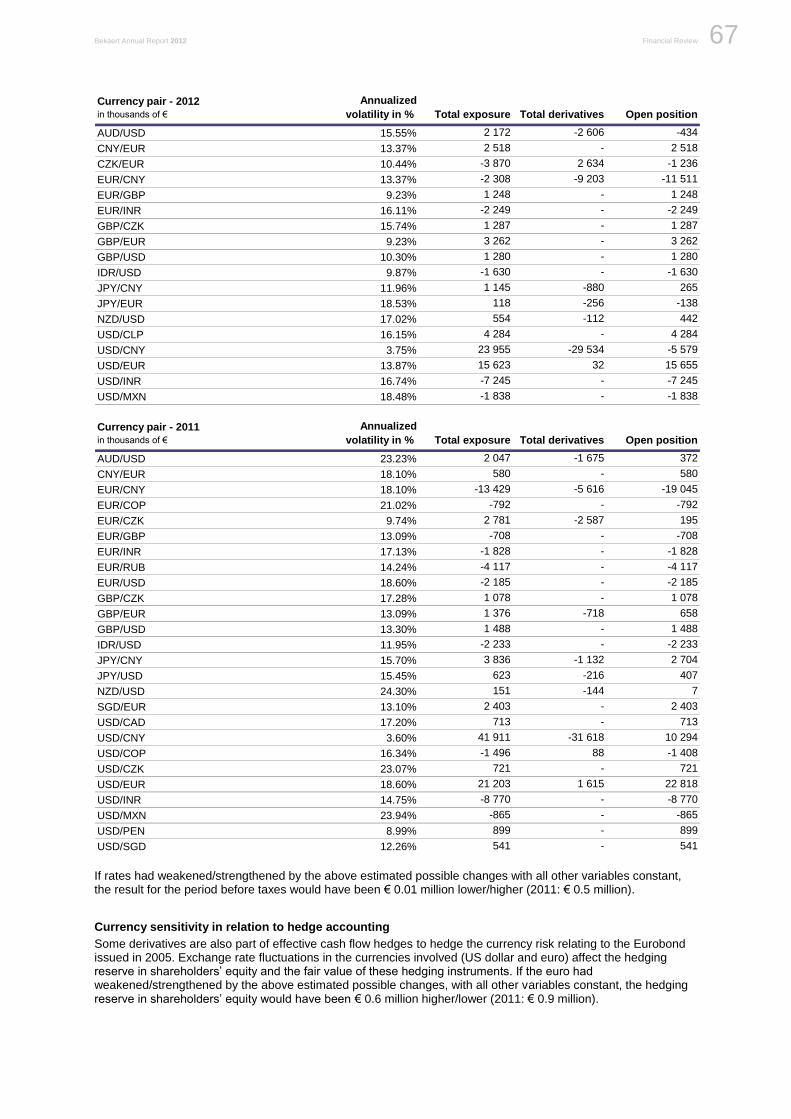
Bekaert Annual Report 2012 Financial Review 67
Be
ka
ert: F
inan
cia
l revie
w
Currency pair - 2012
in thousands of €
Annualized
volatility in % Total exposure Total derivatives Open position
AUD/USD 15.55% 2 172 -2 606 -434
CNY/EUR 13.37% 2 518 - 2 518
CZK/EUR 10.44% -3 870 2 634 -1 236
EUR/CNY 13.37% -2 308 -9 203 -11 511
EUR/GBP 9.23% 1 248 - 1 248
EUR/INR 16.11% -2 249 - -2 249
GBP/CZK 15.74% 1 287 - 1 287
GBP/EUR 9.23% 3 262 - 3 262
GBP/USD 10.30% 1 280 - 1 280
IDR/USD 9.87% -1 630 - -1 630
JPY/CNY 11.96% 1 145 -880 265
JPY/EUR 18.53% 118 -256 -138
NZD/USD 17.02% 554 -112 442
USD/CLP 16.15% 4 284 - 4 284
USD/CNY 3.75% 23 955 -29 534 -5 579
USD/EUR 13.87% 15 623 32 15 655
USD/INR 16.74% -7 245 - -7 245
USD/MXN 18.48% -1 838 - -1 838
Currency pair - 2011
in thousands of €
Annualized
volatility in % Total exposure Total derivatives Open position
AUD/USD 23.23% 2 047 -1 675 372
CNY/EUR 18.10% 580 - 580
EUR/CNY 18.10% -13 429 -5 616 -19 045
EUR/COP 21.02% -792 - -792
EUR/CZK 9.74% 2 781 -2 587 195
EUR/GBP 13.09% -708 - -708
EUR/INR 17.13% -1 828 - -1 828
EUR/RUB 14.24% -4 117 - -4 117
EUR/USD 18.60% -2 185 - -2 185
GBP/CZK 17.28% 1 078 - 1 078
GBP/EUR 13.09% 1 376 -718 658
GBP/USD 13.30% 1 488 - 1 488
IDR/USD 11.95% -2 233 - -2 233
JPY/CNY 15.70% 3 836 -1 132 2 704
JPY/USD 15.45% 623 -216 407
NZD/USD 24.30% 151 -144 7
SGD/EUR 13.10% 2 403 - 2 403
USD/CAD 17.20% 713 - 713
USD/CNY 3.60% 41 911 -31 618 10 294
USD/COP 16.34% -1 496 88 -1 408
USD/CZK 23.07% 721 - 721
USD/EUR 18.60% 21 203 1 615 22 818
USD/INR 14.75% -8 770 - -8 770
USD/MXN 23.94% -865 - -865
USD/PEN 8.99% 899 - 899
USD/SGD 12.26% 541 - 541
If rates had weakened/strengthened by the above estimated possible changes with all other variables constant, the result for the period before taxes would have been € 0.01 million lower/higher (2011: € 0.5 million).
Currency sensitivity in relation to hedge accounting
Some derivatives are also part of effective cash flow hedges to hedge the currency risk relating to the Eurobond issued in 2005. Exchange rate fluctuations in the currencies involved (US dollar and euro) affect the hedging reserve in shareholders’ equity and the fair value of these hedging instruments. If the euro had weakened/strengthened by the above estimated possible changes, with all other variables constant, the hedging reserve in shareholders’ equity would have been € 0.6 million higher/lower (2011: € 0.9 million).
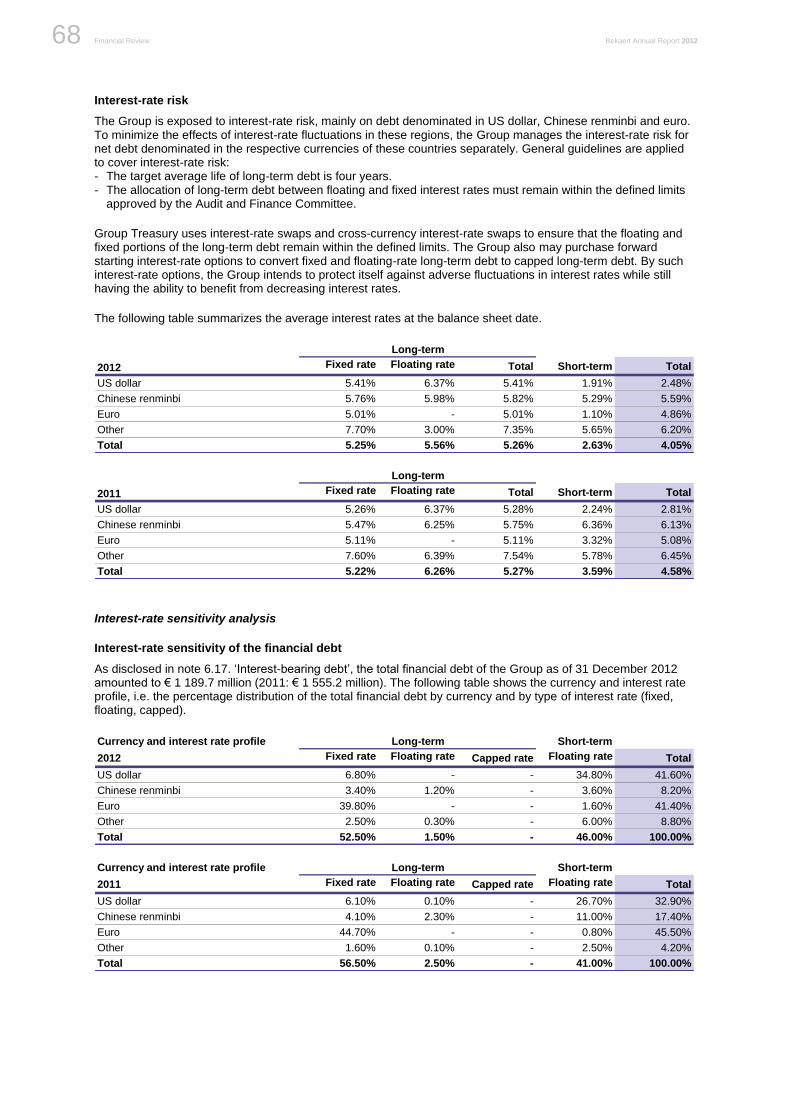
Financial Review Bekaert Annual Report 2012 68
Interest-rate risk
The Group is exposed to interest-rate risk, mainly on debt denominated in US dollar, Chinese renminbi and euro. To minimize the effects of interest-rate fluctuations in these regions, the Group manages the interest-rate risk for net debt denominated in the respective currencies of these countries separately. General guidelines are applied to cover interest-rate risk: - The target average life of long-term debt is four years. - The allocation of long-term debt between floating and fixed interest rates must remain within the defined limits
approved by the Audit and Finance Committee.
Group Treasury uses interest-rate swaps and cross-currency interest-rate swaps to ensure that the floating and fixed portions of the long-term debt remain within the defined limits. The Group also may purchase forward starting interest-rate options to convert fixed and floating-rate long-term debt to capped long-term debt. By such interest-rate options, the Group intends to protect itself against adverse fluctuations in interest rates while still having the ability to benefit from decreasing interest rates.
The following table summarizes the average interest rates at the balance sheet date.
Fixed rate Floating rate Total Short-term Total
US dollar 5.41% 6.37% 5.41% 1.91% 2.48%
Chinese renminbi 5.76% 5.98% 5.82% 5.29% 5.59%
Euro 5.01% - 5.01% 1.10% 4.86%
Other 7.70% 3.00% 7.35% 5.65% 6.20%
Total 5.25% 5.56% 5.26% 2.63% 4.05%
2012
Long-term
Fixed rate Floating rate Total Short-term Total
US dollar 5.26% 6.37% 5.28% 2.24% 2.81%
Chinese renminbi 5.47% 6.25% 5.75% 6.36% 6.13%
Euro 5.11% - 5.11% 3.32% 5.08%
Other 7.60% 6.39% 7.54% 5.78% 6.45%
Total 5.22% 6.26% 5.27% 3.59% 4.58%
2011
Long-term
Interest-rate sensitivity analysis
Interest-rate sensitivity of the financial debt
As disclosed in note 6.17. ‘Interest-bearing debt’, the total financial debt of the Group as of 31 December 2012 amounted to € 1 189.7 million (2011: € 1 555.2 million). The following table shows the currency and interest rate profile, i.e. the percentage distribution of the total financial debt by currency and by type of interest rate (fixed, floating, capped).
Currency and interest rate profile Short-term
2012 Fixed rate Floating rate Capped rate Floating rate Total
US dollar 6.80% - - 34.80% 41.60%
Chinese renminbi 3.40% 1.20% - 3.60% 8.20%
Euro 39.80% - - 1.60% 41.40%
Other 2.50% 0.30% - 6.00% 8.80%
Total 52.50% 1.50% - 46.00% 100.00%
Long-term
Currency and interest rate profile Short-term
2011 Fixed rate Floating rate Capped rate Floating rate Total
US dollar 6.10% 0.10% - 26.70% 32.90%
Chinese renminbi 4.10% 2.30% - 11.00% 17.40%
Euro 44.70% - - 0.80% 45.50%
Other 1.60% 0.10% - 2.50% 4.20%
Total 56.50% 2.50% - 41.00% 100.00%
Long-term
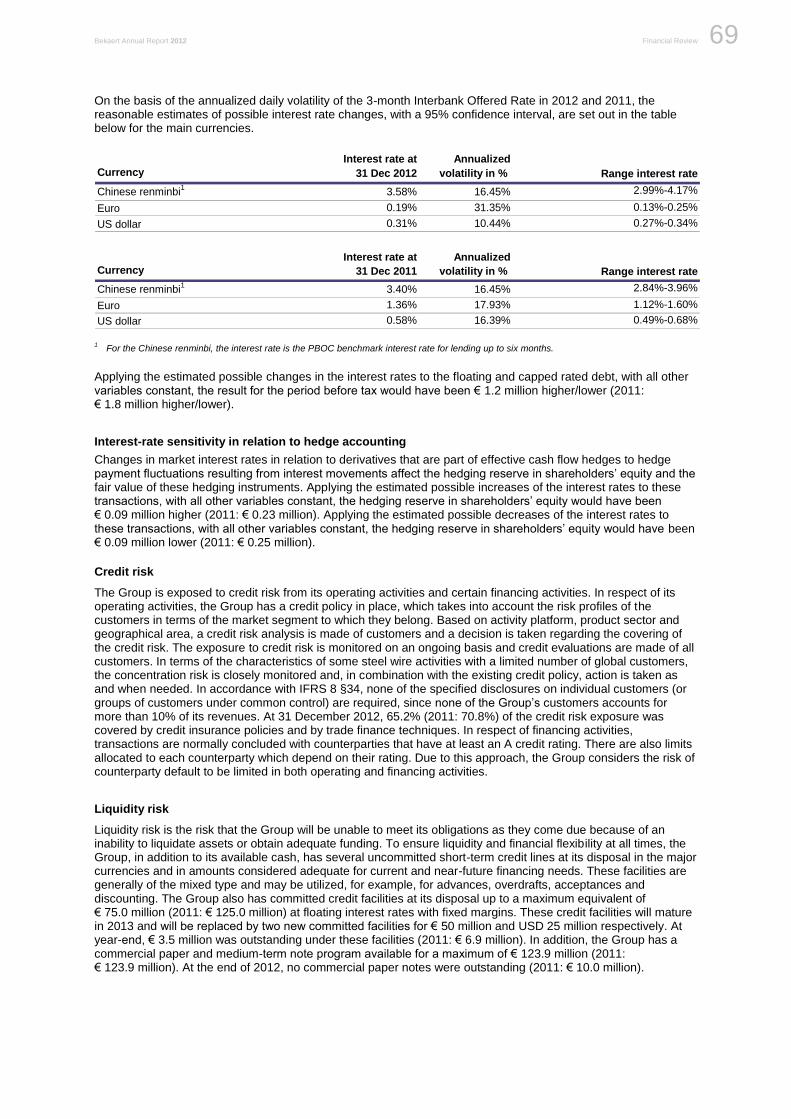
Bekaert Annual Report 2012 Financial Review 69
Be
ka
ert: F
inan
cia
l revie
w
On the basis of the annualized daily volatility of the 3-month Interbank Offered Rate in 2012 and 2011, the reasonable estimates of possible interest rate changes, with a 95% confidence interval, are set out in the table below for the main currencies.
Currency
Interest rate at
31 Dec 2012
Annualized
volatility in %
Chinese renminbi1
3.58% 16.45% 2.99%-4.17%
Euro 0.19% 31.35% 0.13%-0.25%
US dollar 0.31% 10.44% 0.27%-0.34%
Range interest rate
Currency
Interest rate at
31 Dec 2011
Annualized
volatility in %
Chinese renminbi1
3.40% 16.45%
Euro 1.36% 17.93%
US dollar 0.58% 16.39% 0.49%-0.68%
Range interest rate
2.84%-3.96%
1.12%-1.60%
1 For the Chinese renminbi, the interest rate is the PBOC benchmark interest rate for lending up to six months.
Applying the estimated possible changes in the interest rates to the floating and capped rated debt, with all other variables constant, the result for the period before tax would have been € 1.2 million higher/lower (2011: € 1.8 million higher/lower).
Interest-rate sensitivity in relation to hedge accounting
Changes in market interest rates in relation to derivatives that are part of effective cash flow hedges to hedge payment fluctuations resulting from interest movements affect the hedging reserve in shareholders’ equity and the fair value of these hedging instruments. Applying the estimated possible increases of the interest rates to these transactions, with all other variables constant, the hedging reserve in shareholders’ equity would have been € 0.09 million higher (2011: € 0.23 million). Applying the estimated possible decreases of the interest rates to these transactions, with all other variables constant, the hedging reserve in shareholders’ equity would have been € 0.09 million lower (2011: € 0.25 million).
Credit risk
The Group is exposed to credit risk from its operating activities and certain financing activities. In respect of its operating activities, the Group has a credit policy in place, which takes into account the risk profiles of the customers in terms of the market segment to which they belong. Based on activity platform, product sector and geographical area, a credit risk analysis is made of customers and a decision is taken regarding the covering of the credit risk. The exposure to credit risk is monitored on an ongoing basis and credit evaluations are made of all customers. In terms of the characteristics of some steel wire activities with a limited number of global customers, the concentration risk is closely monitored and, in combination with the existing credit policy, action is taken as and when needed. In accordance with IFRS 8 §34, none of the specified disclosures on individual customers (or groups of customers under common control) are required, since none of the Group’s customers accounts for more than 10% of its revenues. At 31 December 2012, 65.2% (2011: 70.8%) of the credit risk exposure was covered by credit insurance policies and by trade finance techniques. In respect of financing activities, transactions are normally concluded with counterparties that have at least an A credit rating. There are also limits allocated to each counterparty which depend on their rating. Due to this approach, the Group considers the risk of counterparty default to be limited in both operating and financing activities.
Liquidity risk
Liquidity risk is the risk that the Group will be unable to meet its obligations as they come due because of an inability to liquidate assets or obtain adequate funding. To ensure liquidity and financial flexibility at all times, the Group, in addition to its available cash, has several uncommitted short-term credit lines at its disposal in the major currencies and in amounts considered adequate for current and near-future financing needs. These facilities are generally of the mixed type and may be utilized, for example, for advances, overdrafts, acceptances and discounting. The Group also has committed credit facilities at its disposal up to a maximum equivalent of € 75.0 million (2011: € 125.0 million) at floating interest rates with fixed margins. These credit facilities will mature in 2013 and will be replaced by two new committed facilities for € 50 million and USD 25 million respectively. At year-end, € 3.5 million was outstanding under these facilities (2011: € 6.9 million). In addition, the Group has a commercial paper and medium-term note program available for a maximum of € 123.9 million (2011: € 123.9 million). At the end of 2012, no commercial paper notes were outstanding (2011: € 10.0 million).
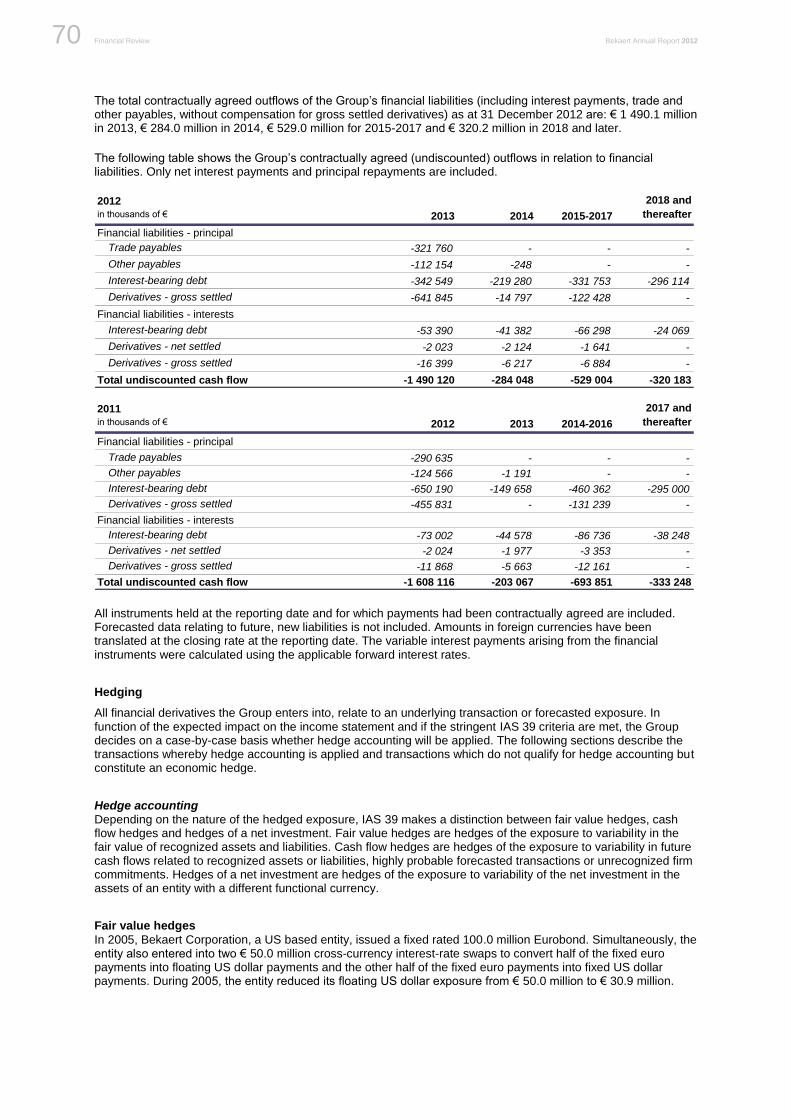
Financial Review Bekaert Annual Report 2012 70
The total contractually agreed outflows of the Group’s financial liabilities (including interest payments, trade and other payables, without compensation for gross settled derivatives) as at 31 December 2012 are: € 1 490.1 million in 2013, € 284.0 million in 2014, € 529.0 million for 2015-2017 and € 320.2 million in 2018 and later.
The following table shows the Group’s contractually agreed (undiscounted) outflows in relation to financial liabilities. Only net interest payments and principal repayments are included.
2012
in thousands of € 2013 2014 2015-2017
2018 and
thereafter
Financial liabilities - principal
Trade payables -321 760 - - -
Other payables -112 154 -248 - -
Interest-bearing debt -342 549 -219 280 -331 753 -296 114
Derivatives - gross settled -641 845 -14 797 -122 428 -
Financial liabilities - interests
Interest-bearing debt -53 390 -41 382 -66 298 -24 069
Derivatives - net settled -2 023 -2 124 -1 641 -
Derivatives - gross settled -16 399 -6 217 -6 884 -
Total undiscounted cash flow -1 490 120 -284 048 -529 004 -320 183 2011
in thousands of € 2012 2013 2014-2016
2017 and
thereafter
Financial liabilities - principal
Trade payables -290 635 - - -
Other payables -124 566 -1 191 - -
Interest-bearing debt -650 190 -149 658 -460 362 -295 000
Derivatives - gross settled -455 831 - -131 239 -
Financial liabilities - interests
Interest-bearing debt -73 002 -44 578 -86 736 -38 248
Derivatives - net settled -2 024 -1 977 -3 353 -
Derivatives - gross settled -11 868 -5 663 -12 161 -
Total undiscounted cash flow -1 608 116 -203 067 -693 851 -333 248
All instruments held at the reporting date and for which payments had been contractually agreed are included. Forecasted data relating to future, new liabilities is not included. Amounts in foreign currencies have been translated at the closing rate at the reporting date. The variable interest payments arising from the financial instruments were calculated using the applicable forward interest rates.
Hedging
All financial derivatives the Group enters into, relate to an underlying transaction or forecasted exposure. In function of the expected impact on the income statement and if the stringent IAS 39 criteria are met, the Group decides on a case-by-case basis whether hedge accounting will be applied. The following sections describe the transactions whereby hedge accounting is applied and transactions which do not qualify for hedge accounting but constitute an economic hedge.
Hedge accounting Depending on the nature of the hedged exposure, IAS 39 makes a distinction between fair value hedges, cash flow hedges and hedges of a net investment. Fair value hedges are hedges of the exposure to variability in the fair value of recognized assets and liabilities. Cash flow hedges are hedges of the exposure to variability in future cash flows related to recognized assets or liabilities, highly probable forecasted transactions or unrecognized firm commitments. Hedges of a net investment are hedges of the exposure to variability of the net investment in the assets of an entity with a different functional currency.
Fair value hedges
In 2005, Bekaert Corporation, a US based entity, issued a fixed rated 100.0 million Eurobond. Simultaneously, the entity also entered into two € 50.0 million cross-currency interest-rate swaps to convert half of the fixed euro payments into floating US dollar payments and the other half of the fixed euro payments into fixed US dollar payments. During 2005, the entity reduced its floating US dollar exposure from € 50.0 million to € 30.9 million.
Bekaert Annual Report 2012 Financial Review 71
Be
ka
ert: F
inan
cia
l revie
w
The Group has designated the portion of € 30.9 million from the 2005 Eurobond as a hedged item in a fair value hedge (the remaining € 69.1 million is treated as a hedged item in a cash flow hedge – see next section). The changes in the fair values of the hedged items resulting from changes in the spot rate USD/EUR are offset against the changes in the value of the cross-currency interest-rate swaps. Credit risks are not addressed or covered by this hedging.
The Group has designated cross-currency interest-rate swaps with an aggregate notional amount of € 30.9 million (2011: € 30.9 million) as fair value hedges as at 31 December 2012, the fair value amounting to € 2.3 million (2011: € 1.6 million). The change in fair value of the hedging instruments during 2012 resulted in a gain of € 0.7 million (2011: € 0.6 million loss) which was recognized in other financial income and expenses. The remeasurement of the hedged items resulted in a loss of € 0.7 million (2011: € 0.6 million gain), which was also recognized in other financial income and expenses. Interest expense adjustments arising from fair value hedges amounted to a gain of € 0.8 million (2011: gain of € 0.9 million).
Cash flow hedges
The currency risk resulting from the remaining € 69.1 million of the 2005 Eurobond (see previous section on fair value hedges) has been hedged using a cross-currency interest-rate swap for € 50.0 million and a combination of a cross-currency interest-rate swap and an interest-rate swap for € 19.1 million. These financial derivatives convert fixed euro payments into fixed US dollar payments. The Group has designated the related portion of the Eurobond as a hedged item. The objective of the hedge is to eliminate the risk from payment fluctuations as a result of changes in the exchange and interest rates. Credit risks are not addressed or covered by this hedging.
As at 31 December 2012, the Group has designated cross-currency interest-rate swaps and interest-rate swaps with notional amounts totaling € 88.2 million (2011: € 88.2 million) as cash flow hedges, the fair value amounting to € -1.0 million (2011: € -4.5 million). During 2012, gains totaling € 3.5 million (2011: € 1.6 million losses) resulting from the change in fair values of cross-currency and interest-rate swaps were taken directly to equity (hedging reserve). These changes represent the effective portion of the hedge relationship. A total amount of € 1.3 million was debited to equity (hedging reserve) against other financial income and expenses to offset the unrealized exchange losses (2011: gains of € 2.1 million) recognized on the remeasurement of the Eurobond at closing rate. Interest expense adjustments arising from cash flow hedges amounted to a loss of € 0.9 million (2011: a loss of € 0.6 million).
Hedges of a net investment
Throughout 2012 and 2011, the Group has not concluded or settled any net investment hedges.
Economic hedging
The Group also uses financial instruments that represent an economic hedge but for which no hedge accounting is applied, either because the criteria to qualify for hedge accounting defined in IAS 39 ‘Financial Instruments: Recognition and Measurement’ are not met or because the Group has elected not to apply hedge accounting. These derivatives are treated as free-standing instruments held for trading.
- The Group uses cross-currency interest-rate swaps and forward exchange contracts to hedge the currency risk on intercompany loans involving two entities with different functional currencies. Until now, the Group has elected not to apply hedge accounting as defined in IAS 39 since nearly all cross-currency interest-rate swaps are floating-to-floating and, hence, the fair value gain or loss on the financial instruments is expected to offset the foreign-exchange result arising from the remeasurement of the intercompany loans. The Group has entered into cross-currency interest-rate swaps with notional amounts totaling € 679.6 million (2011: € 490.7 million), the fair value amounting to € 15.8 million (2011: € -18.1 million). The major currencies involved are US dollars, Canadian dollars and Russian rubles. Foreign-exchange contracts represented a notional amount of € 95.6 million (2011: € 67.9 million) with a fair value of € 0.3 million (2011: € -3.5 million). During 2012, a gain of € 36.8 million (2011: loss of € 21.7 million) resulting from changes in the fair values of cross-currency interest-rate swaps and forward exchange contracts was recognized under other financial income and expenses. A loss of € 40.8 million (2011: gain of € 22.2 million) has been recognized under unrealized exchange results arising on the remeasurement of the intercompany loans at spot rate. Realized exchange gains on hedged intercompany loans amounting to € 5.0 million (2011: € 2.0 million losses) have been recognized in other financial income and expenses. Interest expense adjustments arising from cross-currency interest-rate swaps used as economic hedges for currency risk amounted to a loss of € 4.5 million.
- To manage its interest-rate exposure, the Group uses interest-rate swaps, forward rate agreements and interest-rate options to convert its floating-rate debt to a fixed and/or capped rate debt. Except for an interest-rate swap for USD 25.0 million, none of these interest-rate derivatives were designated as hedges as defined in IAS 39. As at 31 December 2012, the interest-rate exposure of debt was hedged using interest-rate swaps for a total gross amount of € 30.3 million (2011: € 30.9 million). No forward rate agreements and no interest rate options were outstanding at 31 December 2012 (2011: none). The fair value at year-end of the interest-rate
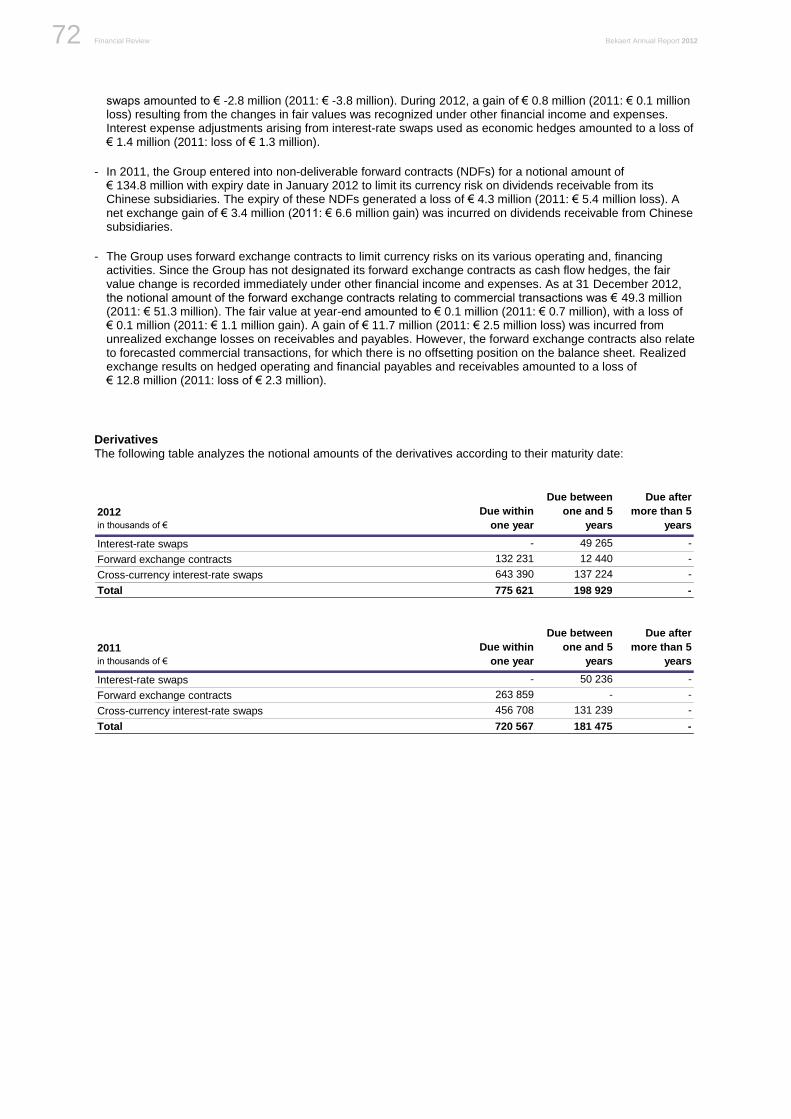
Financial Review Bekaert Annual Report 2012 72
swaps amounted to € -2.8 million (2011: € -3.8 million). During 2012, a gain of € 0.8 million (2011: € 0.1 million loss) resulting from the changes in fair values was recognized under other financial income and expenses. Interest expense adjustments arising from interest-rate swaps used as economic hedges amounted to a loss of € 1.4 million (2011: loss of € 1.3 million).
- In 2011, the Group entered into non-deliverable forward contracts (NDFs) for a notional amount of € 134.8 million with expiry date in January 2012 to limit its currency risk on dividends receivable from its Chinese subsidiaries. The expiry of these NDFs generated a loss of € 4.3 million (2011: € 5.4 million loss). A net exchange gain of € 3.4 million (2011: € 6.6 million gain) was incurred on dividends receivable from Chinese subsidiaries.
- The Group uses forward exchange contracts to limit currency risks on its various operating and, financing activities. Since the Group has not designated its forward exchange contracts as cash flow hedges, the fair value change is recorded immediately under other financial income and expenses. As at 31 December 2012, the notional amount of the forward exchange contracts relating to commercial transactions was € 49.3 million (2011: € 51.3 million). The fair value at year-end amounted to € 0.1 million (2011: € 0.7 million), with a loss of € 0.1 million (2011: € 1.1 million gain). A gain of € 11.7 million (2011: € 2.5 million loss) was incurred from unrealized exchange losses on receivables and payables. However, the forward exchange contracts also relate to forecasted commercial transactions, for which there is no offsetting position on the balance sheet. Realized exchange results on hedged operating and financial payables and receivables amounted to a loss of € 12.8 million (2011: loss of € 2.3 million).
Derivatives
The following table analyzes the notional amounts of the derivatives according to their maturity date:
2012
in thousands of €
Due within
one year
Due between
one and 5
years
Due after
more than 5
years
Interest-rate swaps - 49 265 -
Forward exchange contracts 132 231 12 440 -
Cross-currency interest-rate swaps 643 390 137 224 -
Total 775 621 198 929 -
2011
in thousands of €
Due within
one year
Due between
one and 5
years
Due after
more than 5
years
Interest-rate swaps - 50 236 -
Forward exchange contracts 263 859 - -
Cross-currency interest-rate swaps 456 708 131 239 -
Total 720 567 181 475 -
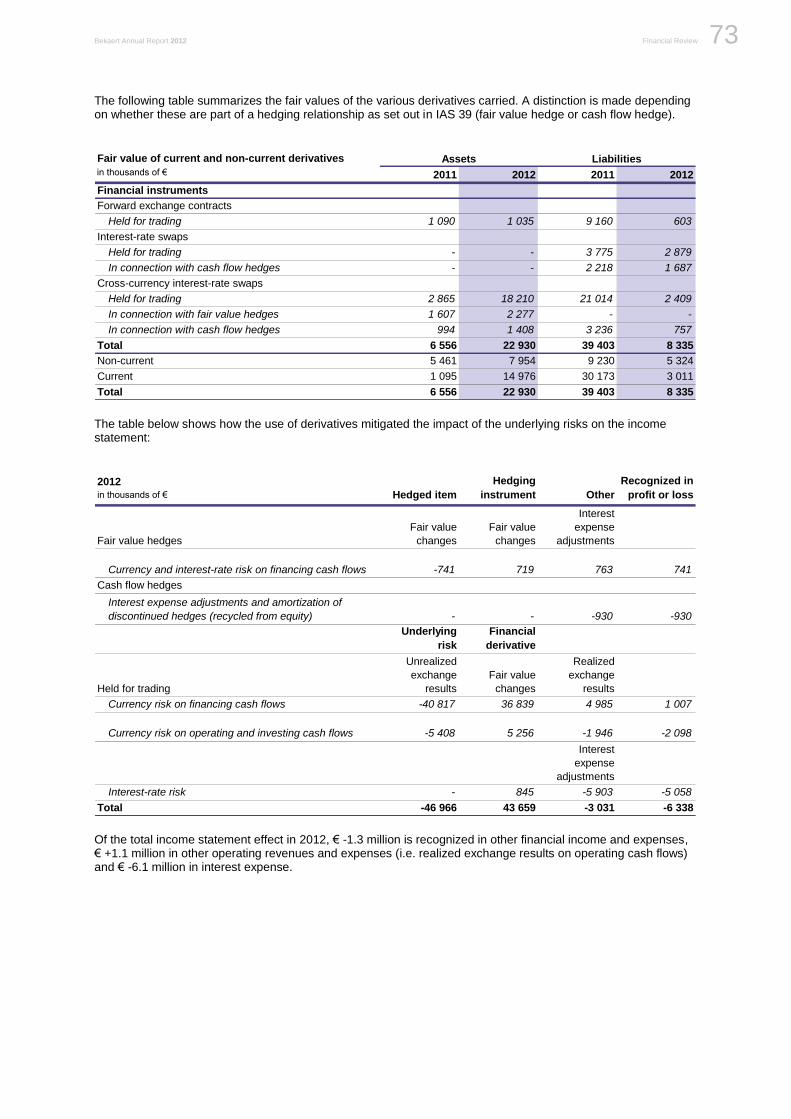
Bekaert Annual Report 2012 Financial Review 73
Be
ka
ert: F
inan
cia
l revie
w
The following table summarizes the fair values of the various derivatives carried. A distinction is made depending on whether these are part of a hedging relationship as set out in IAS 39 (fair value hedge or cash flow hedge).
Fair value of current and non-current derivatives
in thousands of € 2011 2012 2011 2012
Financial instruments
Forward exchange contracts
Held for trading 1 090 1 035 9 160 603
Interest-rate swaps
Held for trading - - 3 775 2 879
In connection with cash flow hedges - - 2 218 1 687
Cross-currency interest-rate swaps
Held for trading 2 865 18 210 21 014 2 409
In connection with fair value hedges 1 607 2 277 - -
In connection with cash flow hedges 994 1 408 3 236 757
Total 6 556 22 930 39 403 8 335
Non-current 5 461 7 954 9 230 5 324
Current 1 095 14 976 30 173 3 011
Total 6 556 22 930 39 403 8 335
Assets Liabilities
The table below shows how the use of derivatives mitigated the impact of the underlying risks on the income statement:
2012
in thousands of € Hedged item
Hedging
instrument Other
Recognized in
profit or loss
Fair value hedges
Fair value
changes
Fair value
changes
Interest
expense
adjustments
Currency and interest-rate risk on financing cash flows -741 719 763 741
Cash flow hedges
Interest expense adjustments and amortization of
discontinued hedges (recycled from equity) - - -930 -930
Underlying
risk
Financial
derivative
Held for trading
Unrealized
exchange
results
Fair value
changes
Realized
exchange
results
Currency risk on financing cash flows -40 817 36 839 4 985 1 007
Currency risk on operating and investing cash flows -5 408 5 256 -1 946 -2 098
Interest
expense
adjustments
Interest-rate risk - 845 -5 903 -5 058
Total -46 966 43 659 -3 031 -6 338
Of the total income statement effect in 2012, € -1.3 million is recognized in other financial income and expenses, € +1.1 million in other operating revenues and expenses (i.e. realized exchange results on operating cash flows) and € -6.1 million in interest expense.
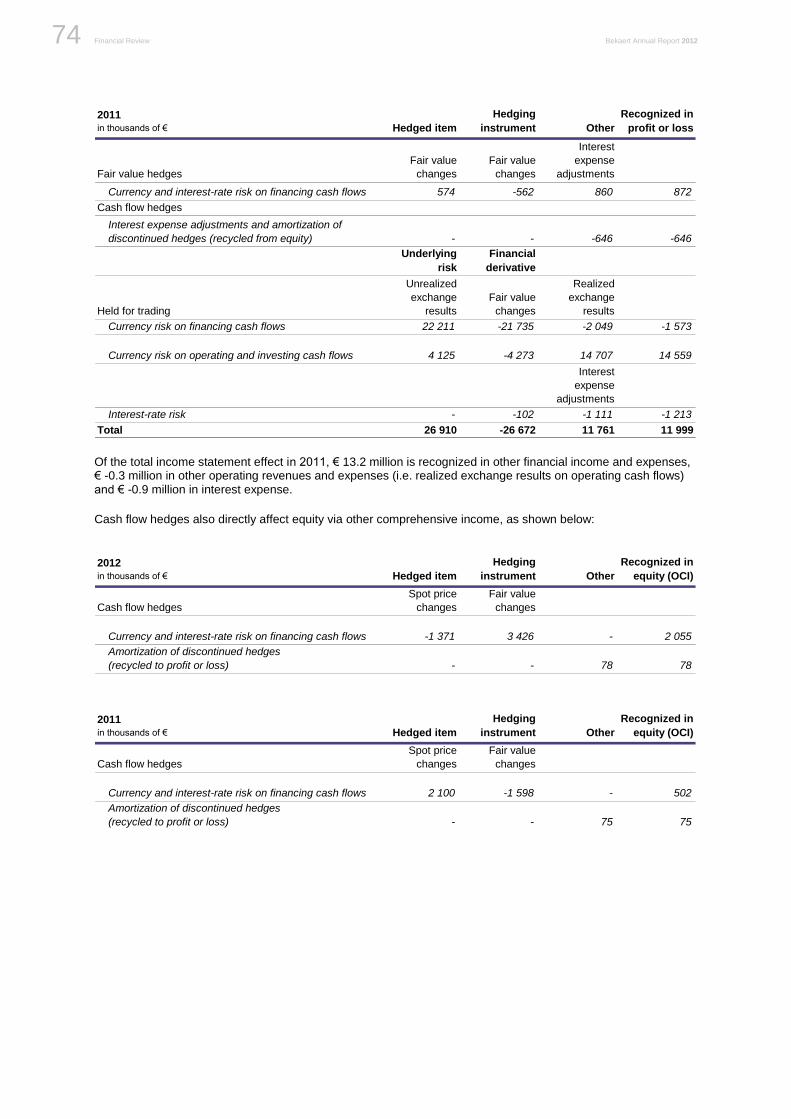
Financial Review Bekaert Annual Report 2012 74
2011
in thousands of € Hedged item
Hedging
instrument Other
Recognized in
profit or loss
Fair value hedges
Fair value
changes
Fair value
changes
Interest
expense
adjustments
Currency and interest-rate risk on financing cash flows 574 -562 860 872
Cash flow hedges
Interest expense adjustments and amortization of
discontinued hedges (recycled from equity) - - -646 -646
Underlying
risk
Financial
derivative
Held for trading
Unrealized
exchange
results
Fair value
changes
Realized
exchange
results
Currency risk on financing cash flows 22 211 -21 735 -2 049 -1 573
Currency risk on operating and investing cash flows 4 125 -4 273 14 707 14 559
Interest
expense
adjustments
Interest-rate risk - -102 -1 111 -1 213
Total 26 910 -26 672 11 761 11 999
Of the total income statement effect in 2011, € 13.2 million is recognized in other financial income and expenses, € -0.3 million in other operating revenues and expenses (i.e. realized exchange results on operating cash flows) and € -0.9 million in interest expense.
Cash flow hedges also directly affect equity via other comprehensive income, as shown below:
2012
in thousands of € Hedged item
Hedging
instrument Other
Recognized in
equity (OCI)
Cash flow hedges
Spot price
changes
Fair value
changes
Currency and interest-rate risk on financing cash flows -1 371 3 426 - 2 055
Amortization of discontinued hedges
(recycled to profit or loss) - - 78 78
2011
in thousands of € Hedged item
Hedging
instrument Other
Recognized in
equity (OCI)
Cash flow hedges
Spot price
changes
Fair value
changes
Currency and interest-rate risk on financing cash flows 2 100 -1 598 - 502
Amortization of discontinued hedges
(recycled to profit or loss) - - 75 75
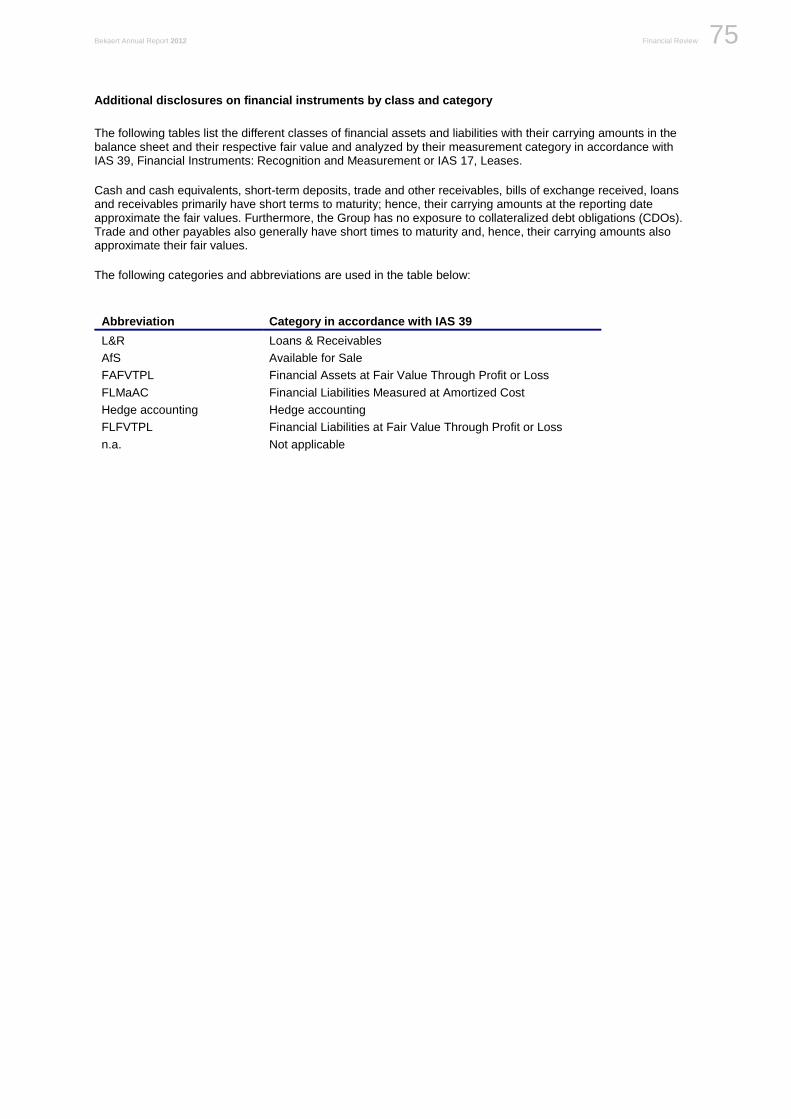
Bekaert Annual Report 2012 Financial Review 75
Be
ka
ert: F
inan
cia
l revie
w
Additional disclosures on financial instruments by class and category
The following tables list the different classes of financial assets and liabilities with their carrying amounts in the balance sheet and their respective fair value and analyzed by their measurement category in accordance with IAS 39, Financial Instruments: Recognition and Measurement or IAS 17, Leases.
Cash and cash equivalents, short-term deposits, trade and other receivables, bills of exchange received, loans and receivables primarily have short terms to maturity; hence, their carrying amounts at the reporting date approximate the fair values. Furthermore, the Group has no exposure to collateralized debt obligations (CDOs). Trade and other payables also generally have short times to maturity and, hence, their carrying amounts also approximate their fair values.
The following categories and abbreviations are used in the table below:
Abbreviation Category in accordance with IAS 39
L&R Loans & Receivables
AfS Available for Sale
FAFVTPL Financial Assets at Fair Value Through Profit or Loss
FLMaAC Financial Liabilities Measured at Amortized Cost
Hedge accounting Hedge accounting
FLFVTPL Financial Liabilities at Fair Value Through Profit or Loss
n.a. Not applicable
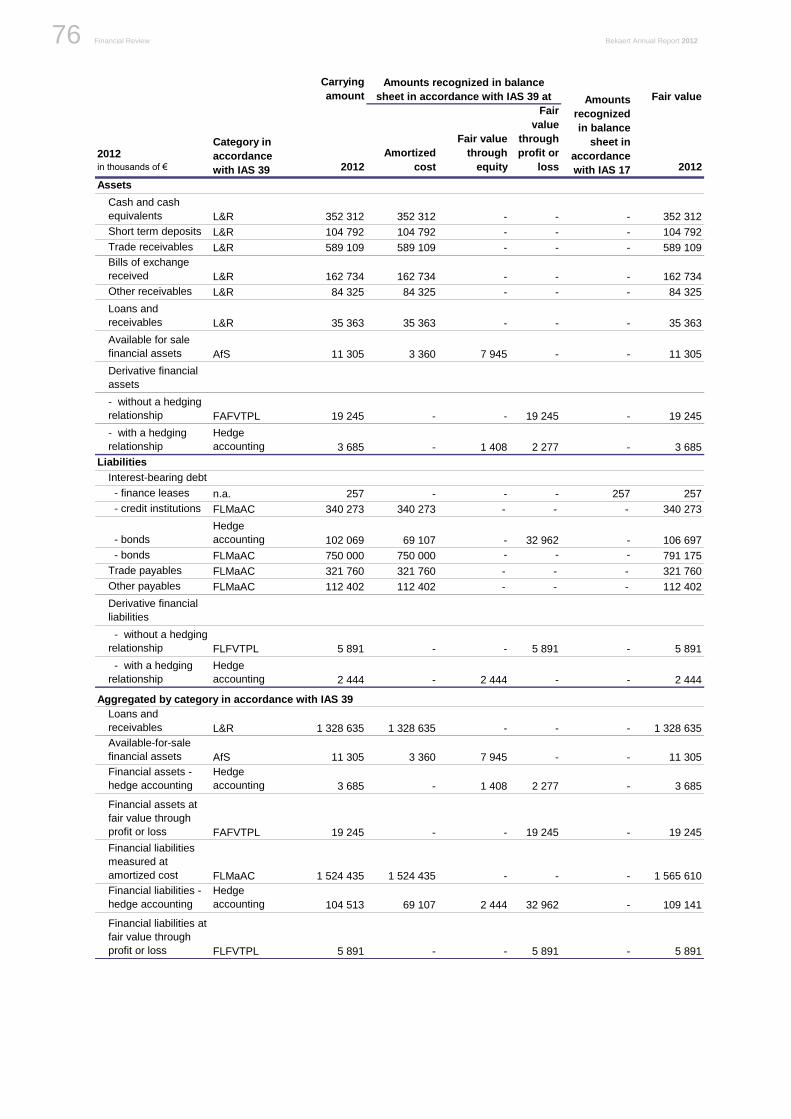
Financial Review Bekaert Annual Report 2012 76
Carrying
amount Fair value
2012
in thousands of € 2012
Amortized
cost
Fair value
through
equity
Fair
value
through
profit or
loss 2012
Assets
Cash and cash
equivalents L&R 352 312 352 312 - - - 352 312
Short term deposits L&R 104 792 104 792 - - - 104 792
Trade receivables L&R 589 109 589 109 - - - 589 109
Bills of exchange
received L&R 162 734 162 734 - - - 162 734
Other receivables L&R 84 325 84 325 - - - 84 325
Loans and
receivables L&R 35 363 35 363 - - - 35 363
Available for sale
financial assets AfS 11 305 3 360 7 945 - - 11 305
Derivative financial
assets
- without a hedging
relationship FAFVTPL 19 245 - - 19 245 - 19 245
- with a hedging
relationship
Hedge
accounting 3 685 - 1 408 2 277 - 3 685
Liabilities
Interest-bearing debt
- finance leases n.a. 257 - - - 257 257
- credit institutions FLMaAC 340 273 340 273 - - - 340 273
- bonds
Hedge
accounting 102 069 69 107 - 32 962 - 106 697
- bonds FLMaAC 750 000 750 000 - - - 791 175
Trade payables FLMaAC 321 760 321 760 - - - 321 760
Other payables FLMaAC 112 402 112 402 - - - 112 402
Derivative financial
liabilities
- without a hedging
relationship FLFVTPL 5 891 - - 5 891 - 5 891
- with a hedging
relationship
Hedge
accounting 2 444 - 2 444 - - 2 444
Category in
accordance
with IAS 39
Amounts recognized in balance
sheet in accordance with IAS 39 at Amounts
recognized
in balance
sheet in
accordance
with IAS 17
Aggregated by category in accordance with IAS 39
Loans and
receivables L&R 1 328 635 1 328 635 - - - 1 328 635
Available-for-sale
financial assets AfS 11 305 3 360 7 945 - - 11 305
Financial assets -
hedge accounting
Hedge
accounting 3 685 - 1 408 2 277 - 3 685
Financial assets at
fair value through
profit or loss FAFVTPL 19 245 - - 19 245 - 19 245
Financial liabilities
measured at
amortized cost FLMaAC 1 524 435 1 524 435 - - - 1 565 610
Financial liabilities -
hedge accounting
Hedge
accounting 104 513 69 107 2 444 32 962 - 109 141
Financial liabilities at
fair value through
profit or loss FLFVTPL 5 891 - - 5 891 - 5 891
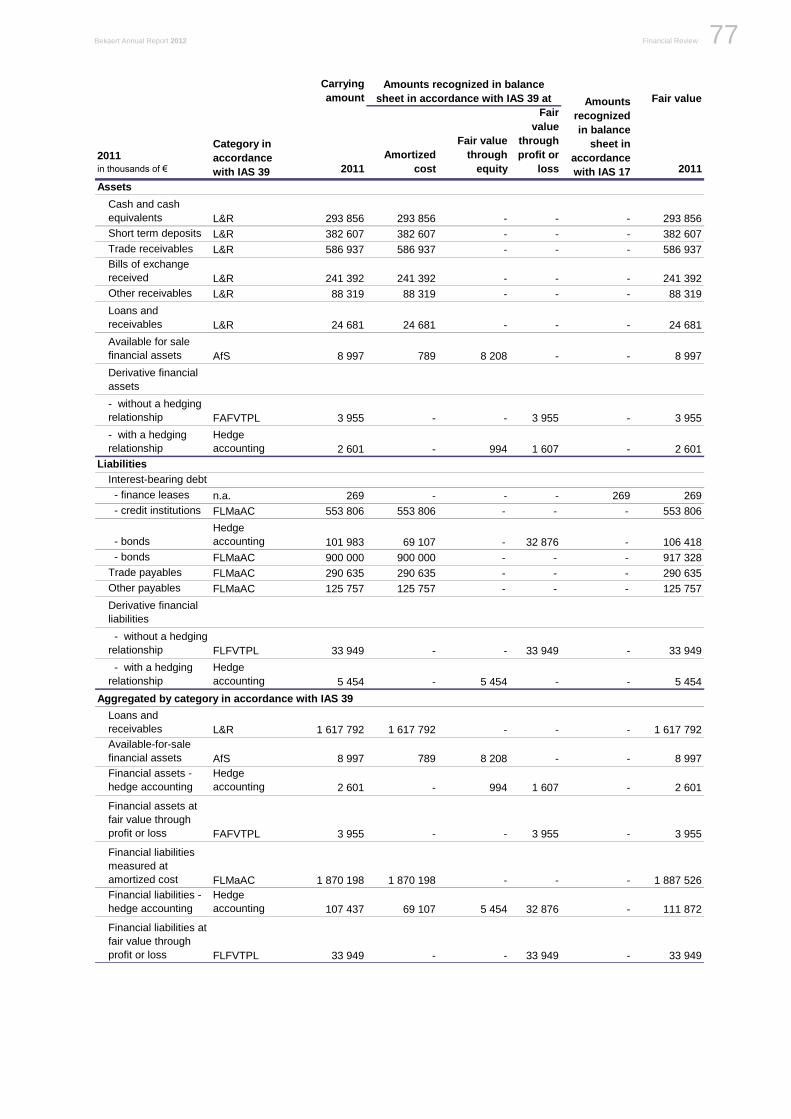
Bekaert Annual Report 2012 Financial Review 77
Be
ka
ert: F
inan
cia
l revie
w
Carrying
amount Fair value
2011
in thousands of € 2011
Amortized
cost
Fair value
through
equity
Fair
value
through
profit or
loss 2011
Assets
Cash and cash
equivalents L&R 293 856 293 856 - - - 293 856
Short term deposits L&R 382 607 382 607 - - - 382 607
Trade receivables L&R 586 937 586 937 - - - 586 937
Bills of exchange
received L&R 241 392 241 392 - - - 241 392
Other receivables L&R 88 319 88 319 - - - 88 319
Loans and
receivables L&R 24 681 24 681 - - - 24 681
Available for sale
financial assets AfS 8 997 789 8 208 - - 8 997
Derivative financial
assets
- without a hedging
relationship FAFVTPL 3 955 - - 3 955 - 3 955
- with a hedging
relationship
Hedge
accounting 2 601 - 994 1 607 - 2 601
Liabilities
Interest-bearing debt
- finance leases n.a. 269 - - - 269 269
- credit institutions FLMaAC 553 806 553 806 - - - 553 806
- bonds
Hedge
accounting 101 983 69 107 - 32 876 - 106 418
- bonds FLMaAC 900 000 900 000 - - - 917 328
Trade payables FLMaAC 290 635 290 635 - - - 290 635
Other payables FLMaAC 125 757 125 757 - - - 125 757
Derivative financial
liabilities
- without a hedging
relationship FLFVTPL 33 949 - - 33 949 - 33 949
- with a hedging
relationship
Hedge
accounting 5 454 - 5 454 - - 5 454
Category in
accordance
with IAS 39
Amounts recognized in balance
sheet in accordance with IAS 39 at Amounts
recognized
in balance
sheet in
accordance
with IAS 17
Aggregated by category in accordance with IAS 39
Loans and
receivables L&R 1 617 792 1 617 792 - - - 1 617 792
Available-for-sale
financial assets AfS 8 997 789 8 208 - - 8 997
Financial assets -
hedge accounting
Hedge
accounting 2 601 - 994 1 607 - 2 601
Financial assets at
fair value through
profit or loss FAFVTPL 3 955 - - 3 955 - 3 955
Financial liabilities
measured at
amortized cost FLMaAC 1 870 198 1 870 198 - - - 1 887 526
Financial liabilities -
hedge accounting
Hedge
accounting 107 437 69 107 5 454 32 876 - 111 872
Financial liabilities at
fair value through
profit or loss FLFVTPL 33 949 - - 33 949 - 33 949
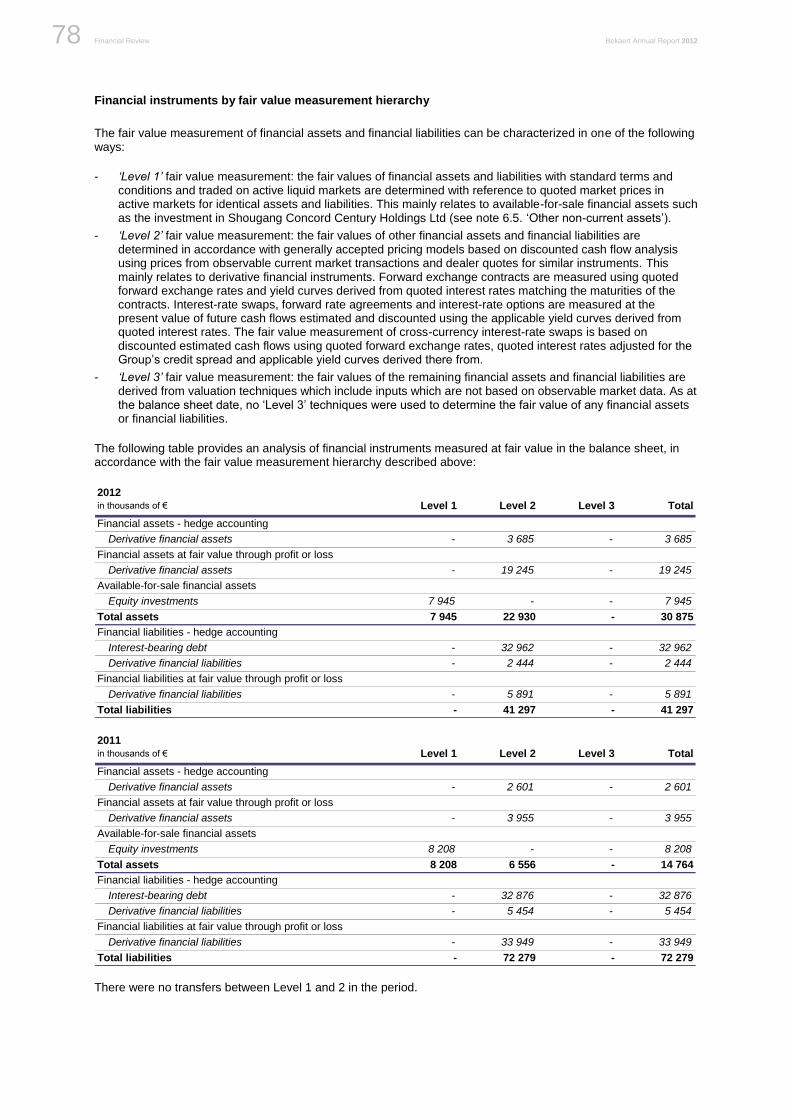
Financial Review Bekaert Annual Report 2012 78
Financial instruments by fair value measurement hierarchy
The fair value measurement of financial assets and financial liabilities can be characterized in one of the following ways:
- ‘Level 1’ fair value measurement: the fair values of financial assets and liabilities with standard terms and conditions and traded on active liquid markets are determined with reference to quoted market prices in active markets for identical assets and liabilities. This mainly relates to available-for-sale financial assets such as the investment in Shougang Concord Century Holdings Ltd (see note 6.5. ‘Other non-current assets’).
- ‘Level 2’ fair value measurement: the fair values of other financial assets and financial liabilities are determined in accordance with generally accepted pricing models based on discounted cash flow analysis using prices from observable current market transactions and dealer quotes for similar instruments. This mainly relates to derivative financial instruments. Forward exchange contracts are measured using quoted forward exchange rates and yield curves derived from quoted interest rates matching the maturities of the contracts. Interest-rate swaps, forward rate agreements and interest-rate options are measured at the present value of future cash flows estimated and discounted using the applicable yield curves derived from quoted interest rates. The fair value measurement of cross-currency interest-rate swaps is based on discounted estimated cash flows using quoted forward exchange rates, quoted interest rates adjusted for the Group’s credit spread and applicable yield curves derived there from.
- ‘Level 3’ fair value measurement: the fair values of the remaining financial assets and financial liabilities are derived from valuation techniques which include inputs which are not based on observable market data. As at the balance sheet date, no ‘Level 3’ techniques were used to determine the fair value of any financial assets or financial liabilities.
The following table provides an analysis of financial instruments measured at fair value in the balance sheet, in accordance with the fair value measurement hierarchy described above:
2012
in thousands of € Level 1 Level 2 Level 3 Total
Financial assets - hedge accounting
Derivative financial assets - 3 685 - 3 685
Financial assets at fair value through profit or loss
Derivative financial assets - 19 245 - 19 245
Available-for-sale financial assets
Equity investments 7 945 - - 7 945
Total assets 7 945 22 930 - 30 875
Financial liabilities - hedge accounting
Interest-bearing debt - 32 962 - 32 962
Derivative financial liabilities - 2 444 - 2 444
Financial liabilities at fair value through profit or loss
Derivative financial liabilities - 5 891 - 5 891
Total liabilities - 41 297 - 41 297
2011
in thousands of € Level 1 Level 2 Level 3 Total
Financial assets - hedge accounting
Derivative financial assets - 2 601 - 2 601
Financial assets at fair value through profit or loss
Derivative financial assets - 3 955 - 3 955
Available-for-sale financial assets
Equity investments 8 208 - - 8 208
Total assets 8 208 6 556 - 14 764
Financial liabilities - hedge accounting
Interest-bearing debt - 32 876 - 32 876
Derivative financial liabilities - 5 454 - 5 454
Financial liabilities at fair value through profit or loss
Derivative financial liabilities - 33 949 - 33 949
Total liabilities - 72 279 - 72 279 There were no transfers between Level 1 and 2 in the period.
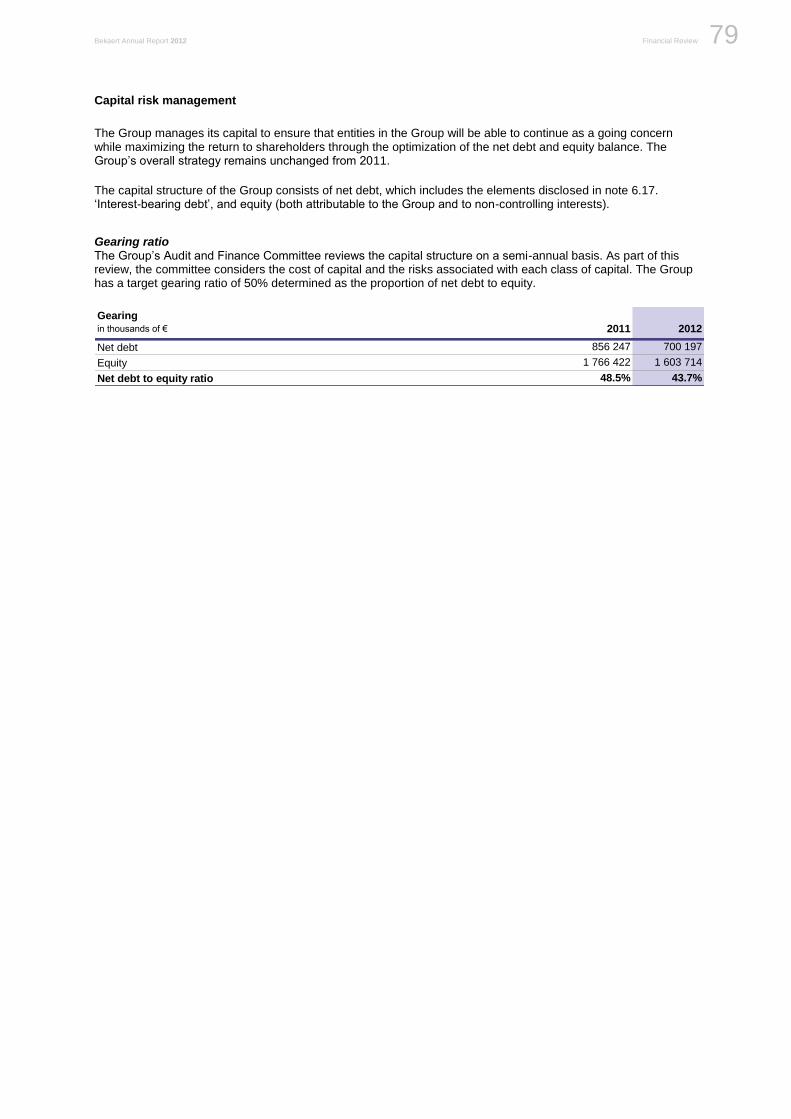
Bekaert Annual Report 2012 Financial Review 79
Be
ka
ert: F
inan
cia
l revie
w
Capital risk management
The Group manages its capital to ensure that entities in the Group will be able to continue as a going concern while maximizing the return to shareholders through the optimization of the net debt and equity balance. The Group’s overall strategy remains unchanged from 2011.
The capital structure of the Group consists of net debt, which includes the elements disclosed in note 6.17. ‘Interest-bearing debt’, and equity (both attributable to the Group and to non-controlling interests).
Gearing ratio The Group’s Audit and Finance Committee reviews the capital structure on a semi-annual basis. As part of this review, the committee considers the cost of capital and the risks associated with each class of capital. The Group has a target gearing ratio of 50% determined as the proportion of net debt to equity.
Gearing
in thousands of € 2011 2012
Net debt 856 247 700 197
Equity 1 766 422 1 603 714
Net debt to equity ratio 48.5% 43.7%
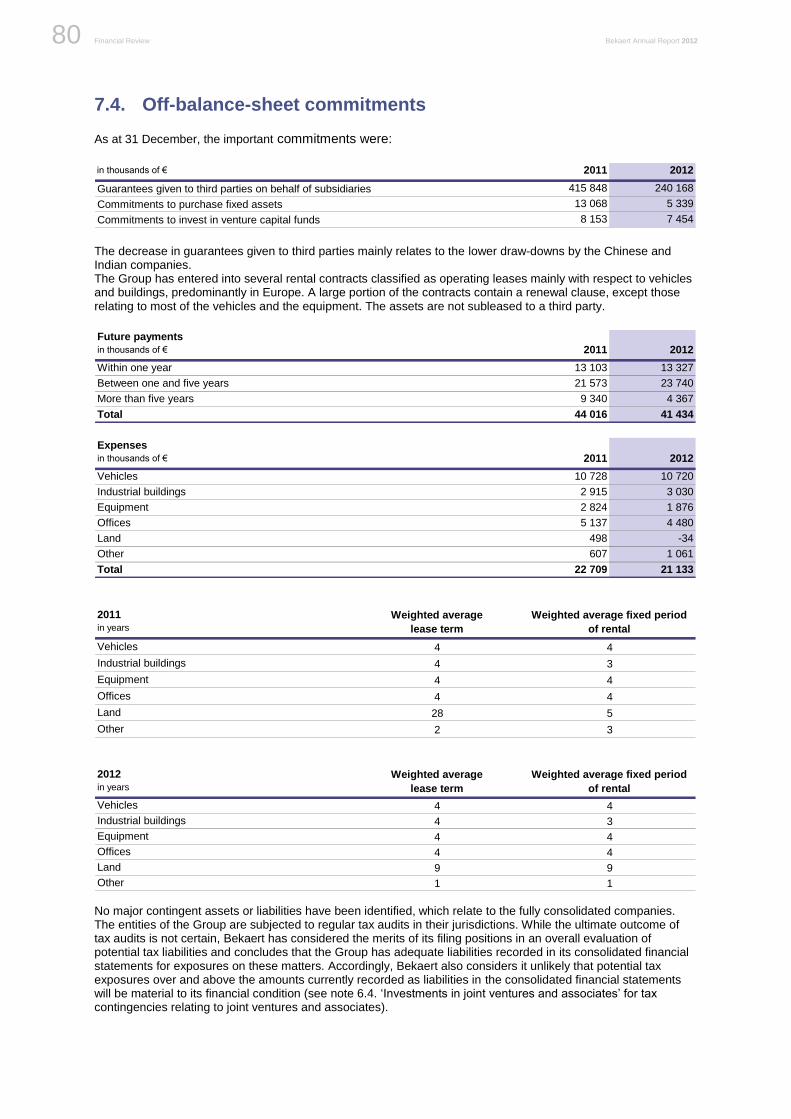
Financial Review Bekaert Annual Report 2012 80
7.4. Off-balance-sheet commitments
As at 31 December, the important commitments were:
in thousands of € 2011 2012
Guarantees given to third parties on behalf of subsidiaries 415 848 240 168
Commitments to purchase fixed assets 13 068 5 339
Commitments to invest in venture capital funds 8 153 7 454
The decrease in guarantees given to third parties mainly relates to the lower draw-downs by the Chinese and Indian companies. The Group has entered into several rental contracts classified as operating leases mainly with respect to vehicles and buildings, predominantly in Europe. A large portion of the contracts contain a renewal clause, except those relating to most of the vehicles and the equipment. The assets are not subleased to a third party.
Future payments
in thousands of € 2011 2012
Within one year 13 103 13 327
Between one and five years 21 573 23 740
More than five years 9 340 4 367
Total 44 016 41 434
Expenses
in thousands of € 2011 2012
Vehicles 10 728 10 720
Industrial buildings 2 915 3 030
Equipment 2 824 1 876
Offices 5 137 4 480
Land 498 -34
Other 607 1 061
Total 22 709 21 133
2011
in years
Vehicles
Industrial buildings
Equipment
Offices
Land
Other
Weighted average
lease term
Weighted average fixed period
of rental
4 4
4
4
4
2
3
4
4
3
528
2012
in years
Vehicles
Industrial buildings
Equipment
Offices
Land
Other
Weighted average
lease term
Weighted average fixed period
of rental
4 4
4 4
1 1
4 3
4 4
9 9
No major contingent assets or liabilities have been identified, which relate to the fully consolidated companies. The entities of the Group are subjected to regular tax audits in their jurisdictions. While the ultimate outcome of tax audits is not certain, Bekaert has considered the merits of its filing positions in an overall evaluation of potential tax liabilities and concludes that the Group has adequate liabilities recorded in its consolidated financial statements for exposures on these matters. Accordingly, Bekaert also considers it unlikely that potential tax exposures over and above the amounts currently recorded as liabilities in the consolidated financial statements will be material to its financial condition (see note 6.4. ‘Investments in joint ventures and associates’ for tax contingencies relating to joint ventures and associates).
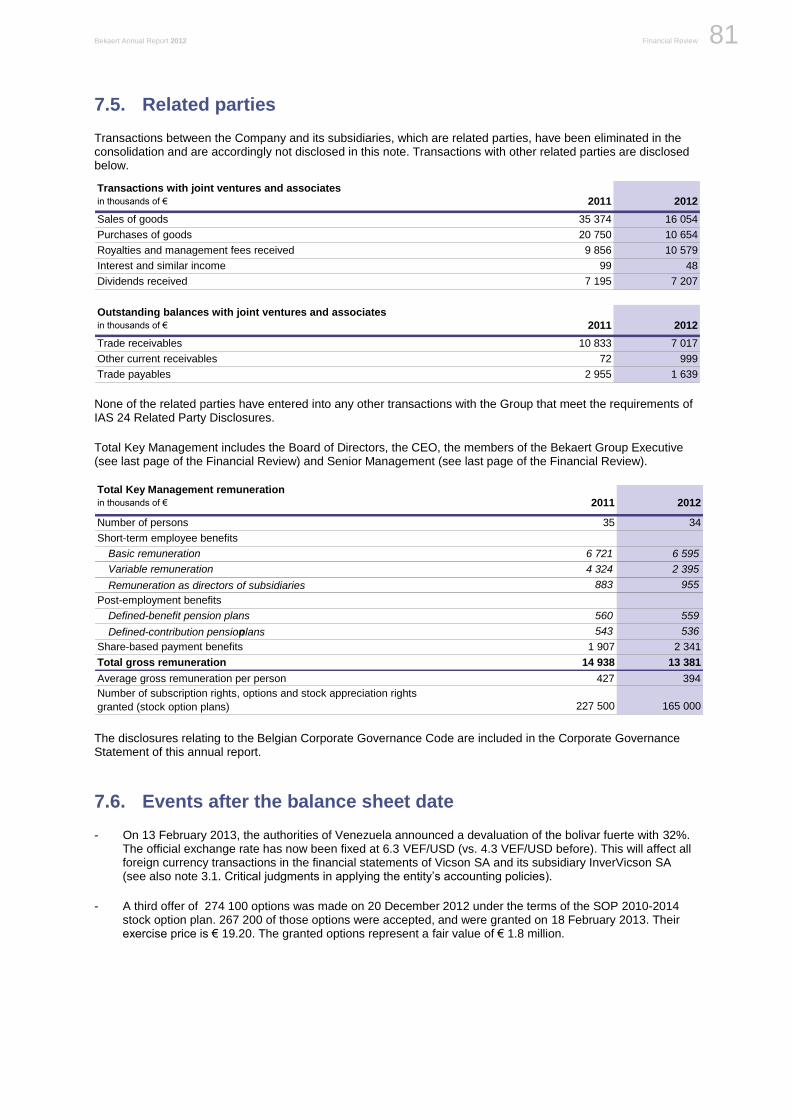
Bekaert Annual Report 2012 Financial Review 81
Be
ka
ert: F
inan
cia
l revie
w
7.5. Related parties
Transactions between the Company and its subsidiaries, which are related parties, have been eliminated in the consolidation and are accordingly not disclosed in this note. Transactions with other related parties are disclosed below.
Transactions with joint ventures and associates
in thousands of € 2011 2012
Sales of goods 35 374 16 054
Purchases of goods 20 750 10 654
Royalties and management fees received 9 856 10 579
Interest and similar income 99 48
Dividends received 7 195 7 207
Outstanding balances with joint ventures and associates
in thousands of € 2011 2012
Trade receivables 10 833 7 017
Other current receivables 72 999
Trade payables 2 955 1 639
None of the related parties have entered into any other transactions with the Group that meet the requirements of IAS 24 Related Party Disclosures.
Total Key Management includes the Board of Directors, the CEO, the members of the Bekaert Group Executive (see last page of the Financial Review) and Senior Management (see last page of the Financial Review).
Total Key Management remuneration
in thousands of € 2011 2012
Number of persons 35 34
Short-term employee benefits
Basic remuneration 6 721 6 595
Variable remuneration 4 324 2 395
Remuneration as directors of subsidiaries 883 955
Post-employment benefits
Defined-benefit pension plans 560 559
Defined-contribution pension plans 543 536
Share-based payment benefits 1 907 2 341
Total gross remuneration 14 938 13 381
Average gross remuneration per person 427 394
227 500 165 000
Number of subscription rights, options and stock appreciation rights
granted (stock option plans)
The disclosures relating to the Belgian Corporate Governance Code are included in the Corporate Governance Statement of this annual report.
7.6. Events after the balance sheet date
- On 13 February 2013, the authorities of Venezuela announced a devaluation of the bolivar fuerte with 32%. The official exchange rate has now been fixed at 6.3 VEF/USD (vs. 4.3 VEF/USD before). This will affect all foreign currency transactions in the financial statements of Vicson SA and its subsidiary InverVicson SA (see also note 3.1. Critical judgments in applying the entity’s accounting policies).
- A third offer of 274 100 options was made on 20 December 2012 under the terms of the SOP 2010-2014 stock option plan. 267 200 of those options were accepted, and were granted on 18 February 2013. Their exercise price is € 19.20. The granted options represent a fair value of € 1.8 million.
Financial Review Bekaert Annual Report 2012 82
7.7. Services provided by the statutory auditor and related persons
During 2012, the statutory auditor and persons professionally related to him performed additional services for fees amounting to € 1 189 433.
These fees relate essentially to further assurance services (€ 90 694), tax advisory services (€ 1 094 950) and other non-audit services (€ 3 789).
The additional services were approved by the Audit and Finance Committee.
The audit fees for NV Bekaert SA and its subsidiaries amounted to € 1 785 527.
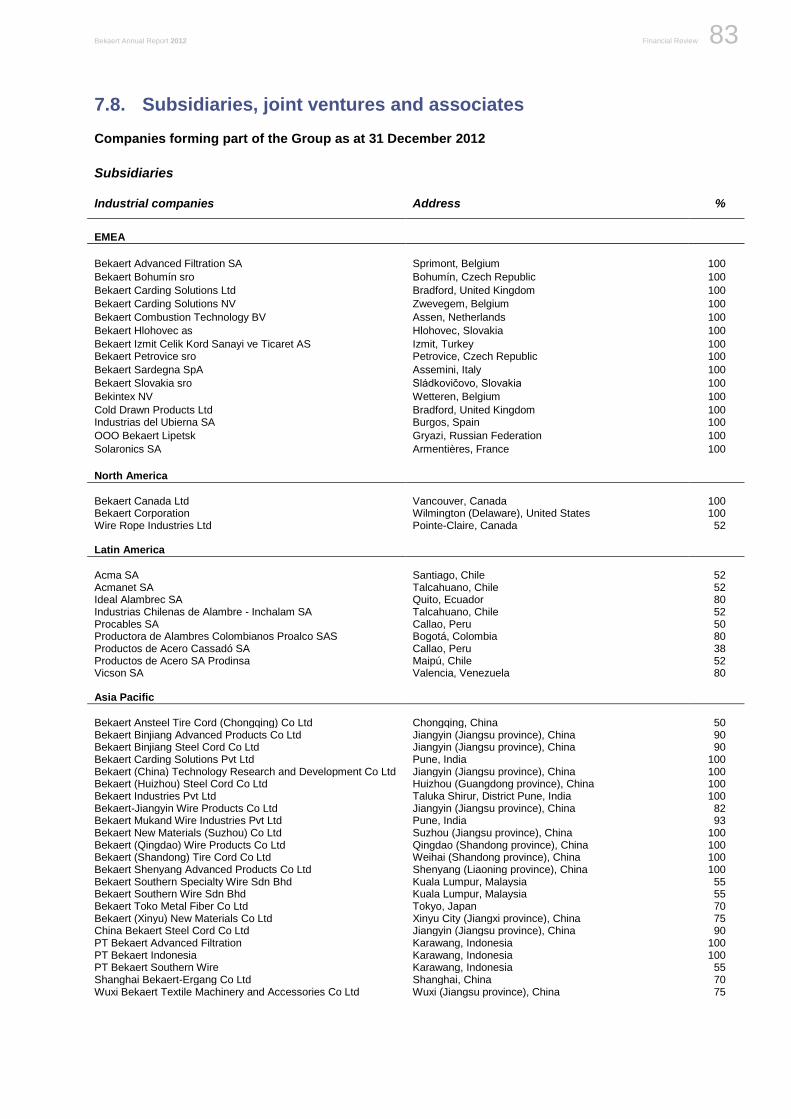
Bekaert Annual Report 2012 Financial Review 83
Be
ka
ert: F
inan
cia
l revie
w
7.8. Subsidiaries, joint ventures and associates
Companies forming part of the Group as at 31 December 2012
Subsidiaries
Industrial companies Address %
EMEA
Bekaert Advanced Filtration SA Sprimont, Belgium 100
Bekaert Bohumín sro Bohumín, Czech Republic 100
Bekaert Carding Solutions Ltd Bradford, United Kingdom 100
Bekaert Carding Solutions NV Zwevegem, Belgium 100
Bekaert Combustion Technology BV Assen, Netherlands 100
Bekaert Hlohovec as Hlohovec, Slovakia 100
Bekaert Izmit Celik Kord Sanayi ve Ticaret AS Izmit, Turkey 100 Bekaert Petrovice sro Petrovice, Czech Republic 100
Bekaert Sardegna SpA Assemini, Italy 100
Bekaert Slovakia sro Sládkovičovo, Slovakia 100
Bekintex NV Wetteren, Belgium 100
Cold Drawn Products Ltd Bradford, United Kingdom 100 Industrias del Ubierna SA Burgos, Spain 100
OOO Bekaert Lipetsk Gryazi, Russian Federation 100
Solaronics SA Armentières, France 100
North America
Bekaert Canada Ltd Vancouver, Canada 100 Bekaert Corporation Wilmington (Delaware), United States 100 Wire Rope Industries Ltd Pointe-Claire, Canada 52 Latin America
Acma SA Santiago, Chile 52 Acmanet SA Talcahuano, Chile 52 Ideal Alambrec SA Quito, Ecuador 80 Industrias Chilenas de Alambre - Inchalam SA Talcahuano, Chile 52 Procables SA Callao, Peru 50 Productora de Alambres Colombianos Proalco SAS Bogotá, Colombia 80 Productos de Acero Cassadó SA Callao, Peru 38 Productos de Acero SA Prodinsa Maipú, Chile 52 Vicson SA Valencia, Venezuela 80 Asia Pacific
Bekaert Ansteel Tire Cord (Chongqing) Co Ltd Chongqing, China 50 Bekaert Binjiang Advanced Products Co Ltd Jiangyin (Jiangsu province), China 90 Bekaert Binjiang Steel Cord Co Ltd Jiangyin (Jiangsu province), China 90 Bekaert Carding Solutions Pvt Ltd Pune, India 100 Bekaert (China) Technology Research and Development Co Ltd Jiangyin (Jiangsu province), China 100 Bekaert (Huizhou) Steel Cord Co Ltd Huizhou (Guangdong province), China 100 Bekaert Industries Pvt Ltd Taluka Shirur, District Pune, India 100 Bekaert-Jiangyin Wire Products Co Ltd Jiangyin (Jiangsu province), China 82 Bekaert Mukand Wire Industries Pvt Ltd Pune, India 93 Bekaert New Materials (Suzhou) Co Ltd Suzhou (Jiangsu province), China 100 Bekaert (Qingdao) Wire Products Co Ltd Qingdao (Shandong province), China 100 Bekaert (Shandong) Tire Cord Co Ltd Weihai (Shandong province), China 100 Bekaert Shenyang Advanced Products Co Ltd Shenyang (Liaoning province), China 100 Bekaert Southern Specialty Wire Sdn Bhd Kuala Lumpur, Malaysia 55 Bekaert Southern Wire Sdn Bhd Kuala Lumpur, Malaysia 55 Bekaert Toko Metal Fiber Co Ltd Tokyo, Japan 70 Bekaert (Xinyu) New Materials Co Ltd Xinyu City (Jiangxi province), China 75 China Bekaert Steel Cord Co Ltd Jiangyin (Jiangsu province), China 90 PT Bekaert Advanced Filtration Karawang, Indonesia 100 PT Bekaert Indonesia Karawang, Indonesia 100 PT Bekaert Southern Wire Karawang, Indonesia 55 Shanghai Bekaert-Ergang Co Ltd Shanghai, China 70 Wuxi Bekaert Textile Machinery and Accessories Co Ltd Wuxi (Jiangsu province), China 75
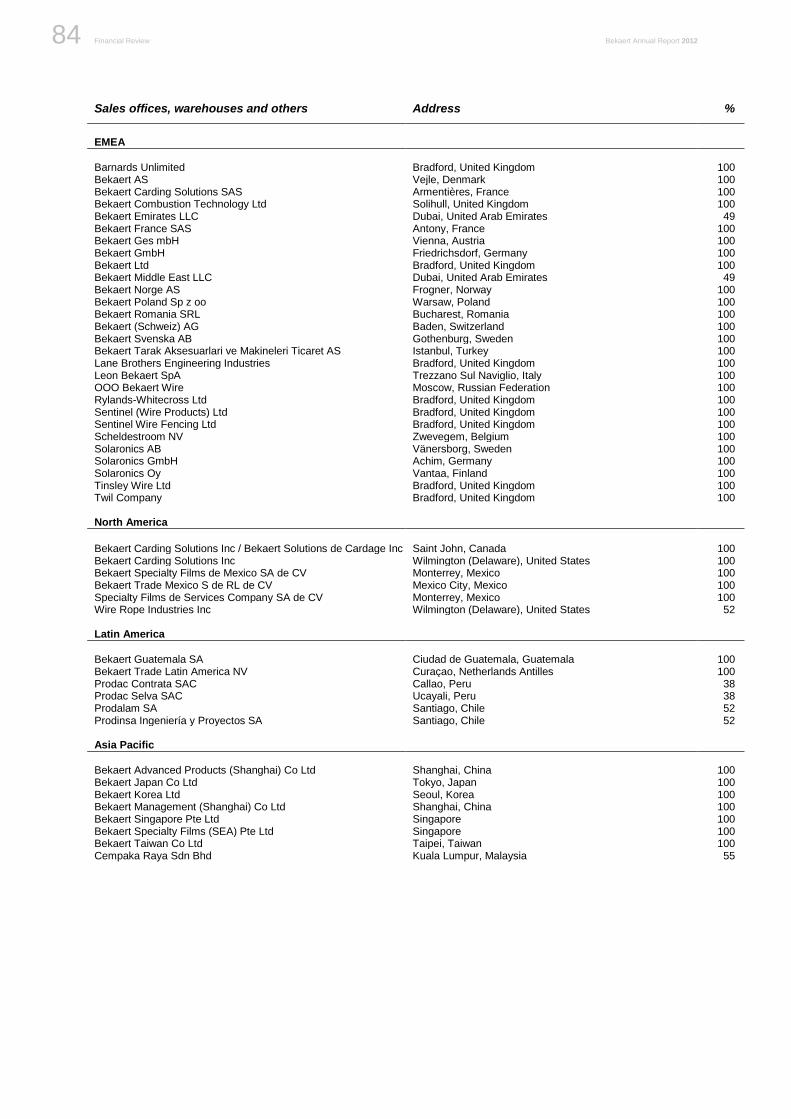
Financial Review Bekaert Annual Report 2012 84
Sales offices, warehouses and others Address %
EMEA
Barnards Unlimited Bradford, United Kingdom 100 Bekaert AS Vejle, Denmark 100 Bekaert Carding Solutions SAS Armentières, France 100 Bekaert Combustion Technology Ltd Solihull, United Kingdom 100 Bekaert Emirates LLC Dubai, United Arab Emirates 49 Bekaert France SAS Antony, France 100 Bekaert Ges mbH Vienna, Austria 100 Bekaert GmbH Friedrichsdorf, Germany 100 Bekaert Ltd Bradford, United Kingdom 100 Bekaert Middle East LLC Dubai, United Arab Emirates 49 Bekaert Norge AS Frogner, Norway 100 Bekaert Poland Sp z oo Warsaw, Poland 100 Bekaert Romania SRL Bucharest, Romania 100 Bekaert (Schweiz) AG Baden, Switzerland 100 Bekaert Svenska AB Gothenburg, Sweden 100 Bekaert Tarak Aksesuarlari ve Makineleri Ticaret AS Istanbul, Turkey 100 Lane Brothers Engineering Industries Bradford, United Kingdom 100 Leon Bekaert SpA Trezzano Sul Naviglio, Italy 100 OOO Bekaert Wire Moscow, Russian Federation 100 Rylands-Whitecross Ltd Bradford, United Kingdom 100 Sentinel (Wire Products) Ltd Bradford, United Kingdom 100 Sentinel Wire Fencing Ltd Bradford, United Kingdom 100 Scheldestroom NV Zwevegem, Belgium 100 Solaronics AB Vänersborg, Sweden 100 Solaronics GmbH Achim, Germany 100 Solaronics Oy Vantaa, Finland 100 Tinsley Wire Ltd Bradford, United Kingdom 100 Twil Company Bradford, United Kingdom 100 North America
Bekaert Carding Solutions Inc / Bekaert Solutions de Cardage Inc Saint John, Canada 100 Bekaert Carding Solutions Inc Wilmington (Delaware), United States 100 Bekaert Specialty Films de Mexico SA de CV Monterrey, Mexico 100 Bekaert Trade Mexico S de RL de CV Mexico City, Mexico 100 Specialty Films de Services Company SA de CV Monterrey, Mexico 100 Wire Rope Industries Inc Wilmington (Delaware), United States 52 Latin America
Bekaert Guatemala SA Ciudad de Guatemala, Guatemala 100 Bekaert Trade Latin America NV Curaçao, Netherlands Antilles 100 Prodac Contrata SAC Callao, Peru 38 Prodac Selva SAC Ucayali, Peru 38 Prodalam SA Santiago, Chile 52 Prodinsa Ingeniería y Proyectos SA Santiago, Chile 52 Asia Pacific
Bekaert Advanced Products (Shanghai) Co Ltd Shanghai, China 100 Bekaert Japan Co Ltd Tokyo, Japan 100 Bekaert Korea Ltd Seoul, Korea 100 Bekaert Management (Shanghai) Co Ltd Shanghai, China 100 Bekaert Singapore Pte Ltd Singapore 100 Bekaert Specialty Films (SEA) Pte Ltd Singapore 100 Bekaert Taiwan Co Ltd Taipei, Taiwan 100 Cempaka Raya Sdn Bhd Kuala Lumpur, Malaysia 55
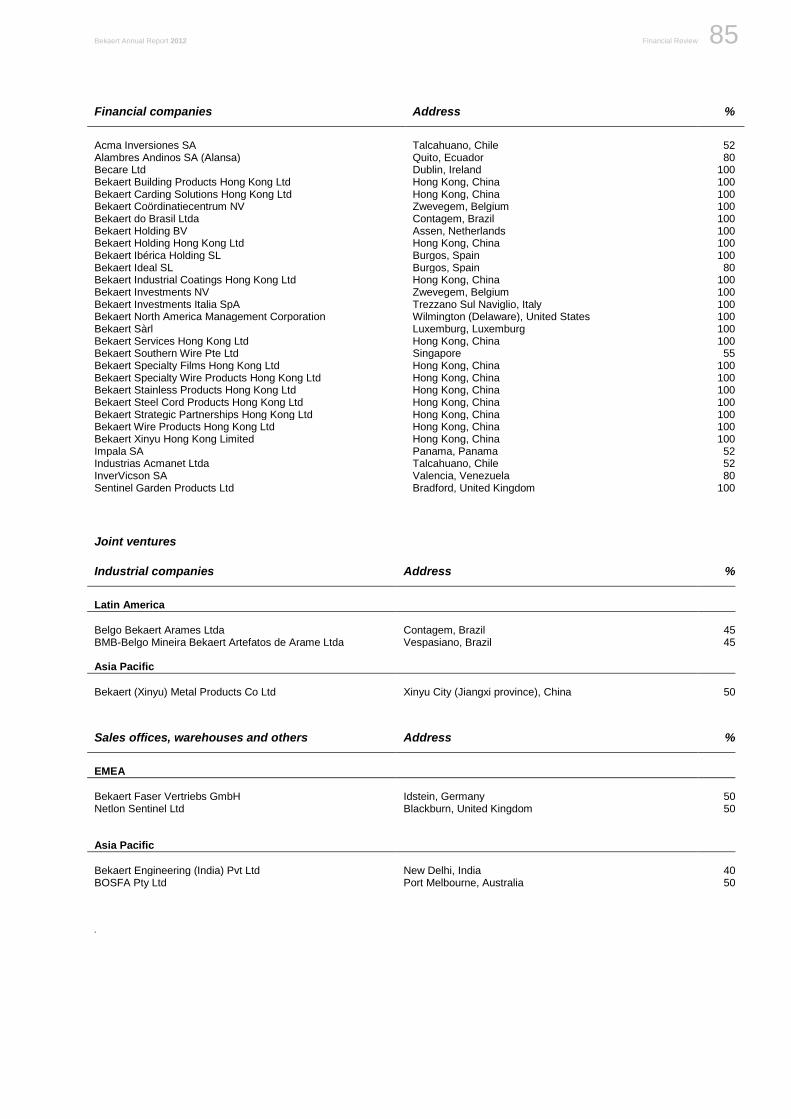
Bekaert Annual Report 2012 Financial Review 85
Be
ka
ert: F
inan
cia
l revie
w
Financial companies Address %
Acma Inversiones SA Talcahuano, Chile 52 Alambres Andinos SA (Alansa) Quito, Ecuador 80 Becare Ltd Dublin, Ireland 100 Bekaert Building Products Hong Kong Ltd Hong Kong, China 100 Bekaert Carding Solutions Hong Kong Ltd Hong Kong, China 100 Bekaert Coördinatiecentrum NV Zwevegem, Belgium 100 Bekaert do Brasil Ltda Contagem, Brazil 100 Bekaert Holding BV Assen, Netherlands 100 Bekaert Holding Hong Kong Ltd Hong Kong, China 100 Bekaert Ibérica Holding SL Burgos, Spain 100 Bekaert Ideal SL Burgos, Spain 80 Bekaert Industrial Coatings Hong Kong Ltd Hong Kong, China 100 Bekaert Investments NV Zwevegem, Belgium 100 Bekaert Investments Italia SpA Trezzano Sul Naviglio, Italy 100 Bekaert North America Management Corporation Wilmington (Delaware), United States 100 Bekaert Sàrl Luxemburg, Luxemburg 100 Bekaert Services Hong Kong Ltd Hong Kong, China 100 Bekaert Southern Wire Pte Ltd Singapore 55 Bekaert Specialty Films Hong Kong Ltd Hong Kong, China 100 Bekaert Specialty Wire Products Hong Kong Ltd Hong Kong, China 100 Bekaert Stainless Products Hong Kong Ltd Hong Kong, China 100 Bekaert Steel Cord Products Hong Kong Ltd Hong Kong, China 100 Bekaert Strategic Partnerships Hong Kong Ltd Hong Kong, China 100 Bekaert Wire Products Hong Kong Ltd Hong Kong, China 100 Bekaert Xinyu Hong Kong Limited Hong Kong, China 100 Impala SA Panama, Panama 52 Industrias Acmanet Ltda Talcahuano, Chile 52 InverVicson SA Valencia, Venezuela 80 Sentinel Garden Products Ltd Bradford, United Kingdom 100
Joint ventures
Industrial companies Address %
Latin America
Belgo Bekaert Arames Ltda Contagem, Brazil 45 BMB-Belgo Mineira Bekaert Artefatos de Arame Ltda Vespasiano, Brazil 45 Asia Pacific
Bekaert (Xinyu) Metal Products Co Ltd Xinyu City (Jiangxi province), China 50
Sales offices, warehouses and others Address %
EMEA
Bekaert Faser Vertriebs GmbH Idstein, Germany 50 Netlon Sentinel Ltd Blackburn, United Kingdom 50 Asia Pacific
Bekaert Engineering (India) Pvt Ltd New Delhi, India 40 BOSFA Pty Ltd Port Melbourne, Australia 50
.
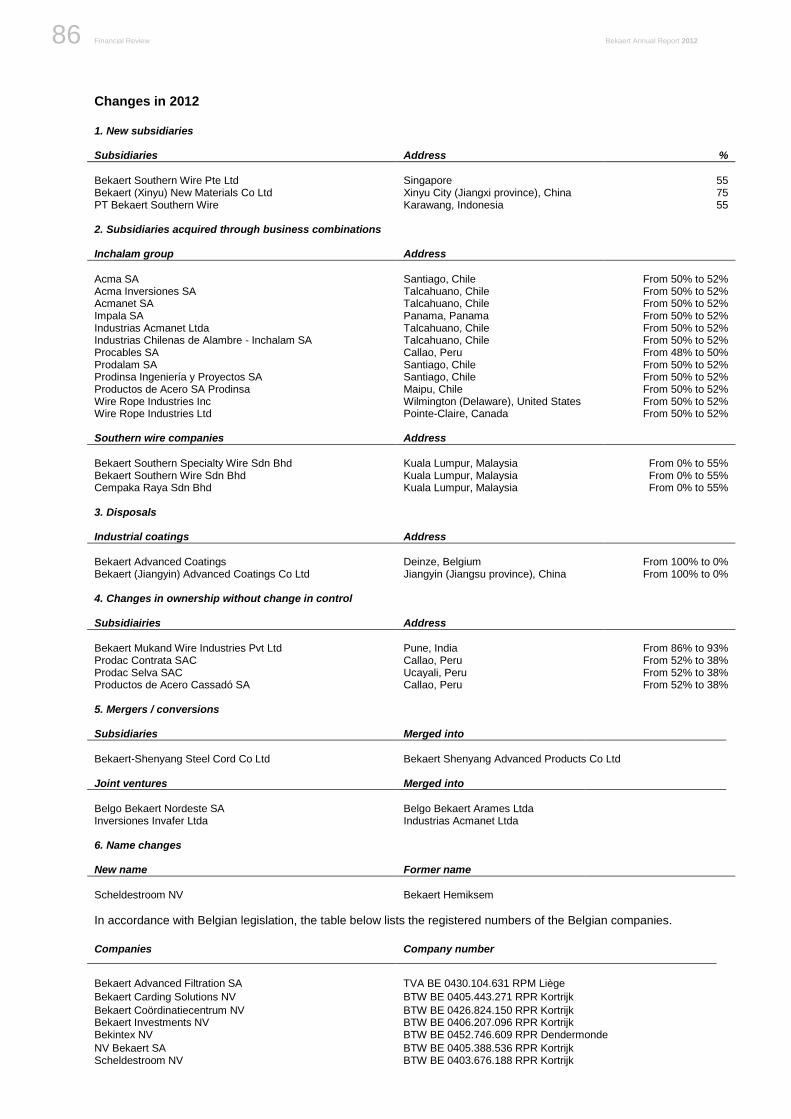
Financial Review Bekaert Annual Report 2012 86
Changes in 2012
1. New subsidiaries Subsidiaries Address %
Bekaert Southern Wire Pte Ltd Singapore 55 Bekaert (Xinyu) New Materials Co Ltd Xinyu City (Jiangxi province), China 75 PT Bekaert Southern Wire Karawang, Indonesia 55 2. Subsidiaries acquired through business combinations Inchalam group Address
Acma SA Santiago, Chile From 50% to 52% Acma Inversiones SA Talcahuano, Chile From 50% to 52% Acmanet SA Talcahuano, Chile From 50% to 52% Impala SA Panama, Panama From 50% to 52% Industrias Acmanet Ltda Talcahuano, Chile From 50% to 52% Industrias Chilenas de Alambre - Inchalam SA Talcahuano, Chile From 50% to 52% Procables SA Callao, Peru From 48% to 50% Prodalam SA Santiago, Chile From 50% to 52% Prodinsa Ingeniería y Proyectos SA Santiago, Chile From 50% to 52% Productos de Acero SA Prodinsa Maipu, Chile From 50% to 52% Wire Rope Industries Inc Wilmington (Delaware), United States From 50% to 52% Wire Rope Industries Ltd Pointe-Claire, Canada From 50% to 52% Southern wire companies Address
Bekaert Southern Specialty Wire Sdn Bhd Kuala Lumpur, Malaysia From 0% to 55% Bekaert Southern Wire Sdn Bhd Kuala Lumpur, Malaysia From 0% to 55% Cempaka Raya Sdn Bhd Kuala Lumpur, Malaysia From 0% to 55% 3. Disposals
Industrial coatings Address
Bekaert Advanced Coatings Deinze, Belgium From 100% to 0% Bekaert (Jiangyin) Advanced Coatings Co Ltd Jiangyin (Jiangsu province), China From 100% to 0% 4. Changes in ownership without change in control
Subsidiairies Address
Bekaert Mukand Wire Industries Pvt Ltd Pune, India From 86% to 93% Prodac Contrata SAC Callao, Peru From 52% to 38% Prodac Selva SAC Ucayali, Peru From 52% to 38% Productos de Acero Cassadó SA Callao, Peru From 52% to 38% 5. Mergers / conversions
Subsidiaries Merged into
Bekaert-Shenyang Steel Cord Co Ltd Bekaert Shenyang Advanced Products Co Ltd Joint ventures Merged into
Belgo Bekaert Nordeste SA Belgo Bekaert Arames Ltda Inversiones Invafer Ltda Industrias Acmanet Ltda 6. Name changes
New name Former name
Scheldestroom NV Bekaert Hemiksem
In accordance with Belgian legislation, the table below lists the registered numbers of the Belgian companies.
Companies Company number
Bekaert Advanced Filtration SA TVA BE 0430.104.631 RPM Liège
Bekaert Carding Solutions NV BTW BE 0405.443.271 RPR Kortrijk
Bekaert Coördinatiecentrum NV BTW BE 0426.824.150 RPR Kortrijk Bekaert Investments NV BTW BE 0406.207.096 RPR Kortrijk Bekintex NV BTW BE 0452.746.609 RPR Dendermonde
NV Bekaert SA BTW BE 0405.388.536 RPR Kortrijk Scheldestroom NV BTW BE 0403.676.188 RPR Kortrijk
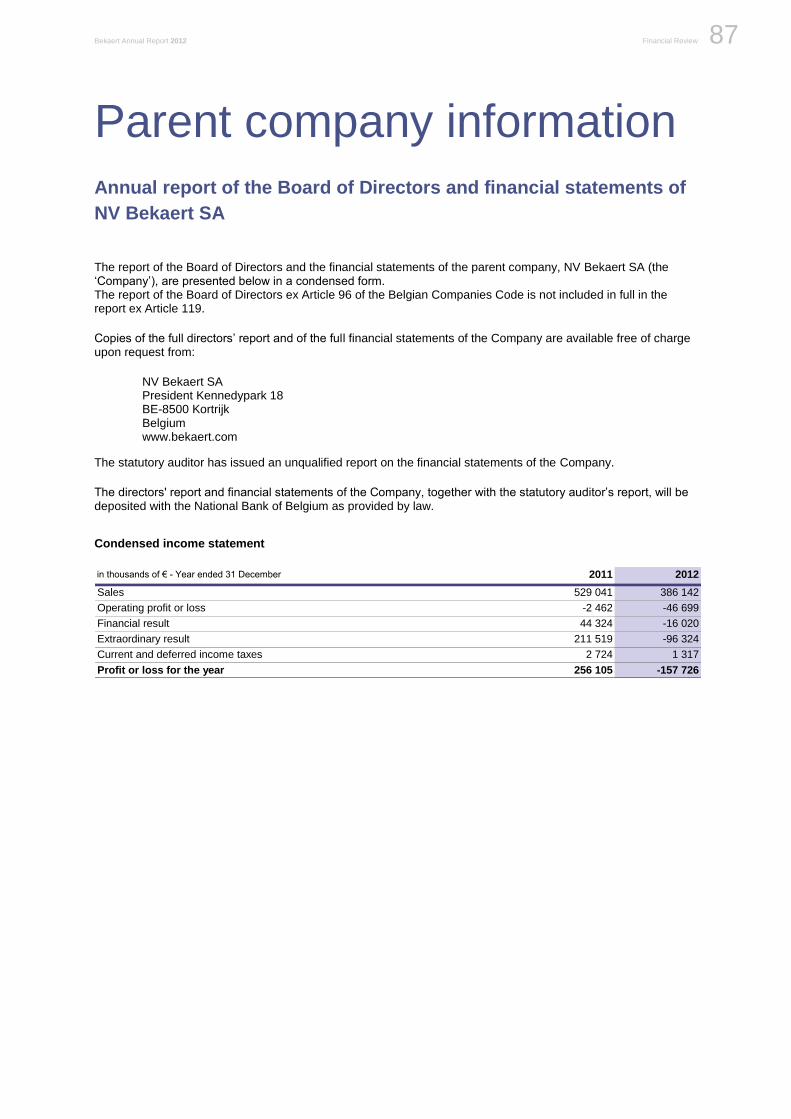
Bekaert Annual Report 2012 Financial Review 87
Be
ka
ert: F
inan
cia
l revie
w
Parent company information
Annual report of the Board of Directors and financial statements of
NV Bekaert SA
The report of the Board of Directors and the financial statements of the parent company, NV Bekaert SA (the ‘Company’), are presented below in a condensed form. The report of the Board of Directors ex Article 96 of the Belgian Companies Code is not included in full in the report ex Article 119.
Copies of the full directors’ report and of the full financial statements of the Company are available free of charge upon request from:
NV Bekaert SA President Kennedypark 18 BE-8500 Kortrijk Belgium www.bekaert.com
The statutory auditor has issued an unqualified report on the financial statements of the Company.
The directors' report and financial statements of the Company, together with the statutory auditor’s report, will be deposited with the National Bank of Belgium as provided by law.
Condensed income statement
in thousands of € - Year ended 31 December 2011 2012
Sales 529 041 386 142
Operating profit or loss -2 462 -46 699
Financial result 44 324 -16 020
Extraordinary result 211 519 -96 324
Current and deferred income taxes 2 724 1 317
Profit or loss for the year 256 105 -157 726
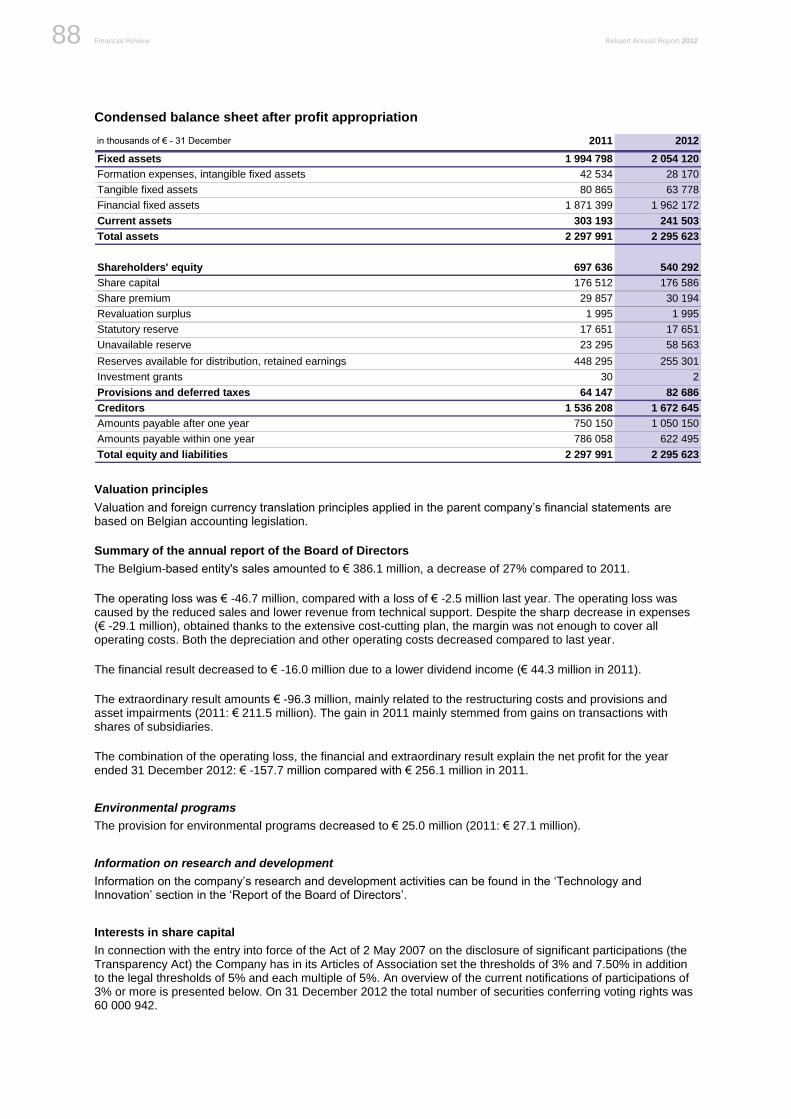
Financial Review Bekaert Annual Report 2012 88
Condensed balance sheet after profit appropriation
in thousands of € - 31 December 2011 2012
Fixed assets 1 994 798 2 054 120
Formation expenses, intangible fixed assets 42 534 28 170
Tangible fixed assets 80 865 63 778
Financial fixed assets 1 871 399 1 962 172
Current assets 303 193 241 503
Total assets 2 297 991 2 295 623
Shareholders' equity 697 636 540 292
Share capital 176 512 176 586
Share premium 29 857 30 194
Revaluation surplus 1 995 1 995
Statutory reserve 17 651 17 651
Unavailable reserve 23 295 58 563
Reserves available for distribution, retained earnings 448 295 255 301
Investment grants 30 2
Provisions and deferred taxes 64 147 82 686
Creditors 1 536 208 1 672 645
Amounts payable after one year 750 150 1 050 150
Amounts payable within one year 786 058 622 495
Total equity and liabilities 2 297 991 2 295 623
Valuation principles
Valuation and foreign currency translation principles applied in the parent company’s financial statements are based on Belgian accounting legislation.
Summary of the annual report of the Board of Directors
The Belgium-based entity's sales amounted to € 386.1 million, a decrease of 27% compared to 2011.
The operating loss was € -46.7 million, compared with a loss of € -2.5 million last year. The operating loss was caused by the reduced sales and lower revenue from technical support. Despite the sharp decrease in expenses (€ -29.1 million), obtained thanks to the extensive cost-cutting plan, the margin was not enough to cover all operating costs. Both the depreciation and other operating costs decreased compared to last year.
The financial result decreased to € -16.0 million due to a lower dividend income (€ 44.3 million in 2011).
The extraordinary result amounts € -96.3 million, mainly related to the restructuring costs and provisions and asset impairments (2011: € 211.5 million). The gain in 2011 mainly stemmed from gains on transactions with shares of subsidiaries.
The combination of the operating loss, the financial and extraordinary result explain the net profit for the year ended 31 December 2012: € -157.7 million compared with € 256.1 million in 2011.
Environmental programs
The provision for environmental programs decreased to € 25.0 million (2011: € 27.1 million).
Information on research and development
Information on the company’s research and development activities can be found in the ‘Technology and Innovation’ section in the ‘Report of the Board of Directors’.
Interests in share capital
In connection with the entry into force of the Act of 2 May 2007 on the disclosure of significant participations (the Transparency Act) the Company has in its Articles of Association set the thresholds of 3% and 7.50% in addition to the legal thresholds of 5% and each multiple of 5%. An overview of the current notifications of participations of 3% or more is presented below. On 31 December 2012 the total number of securities conferring voting rights was 60 000 942.
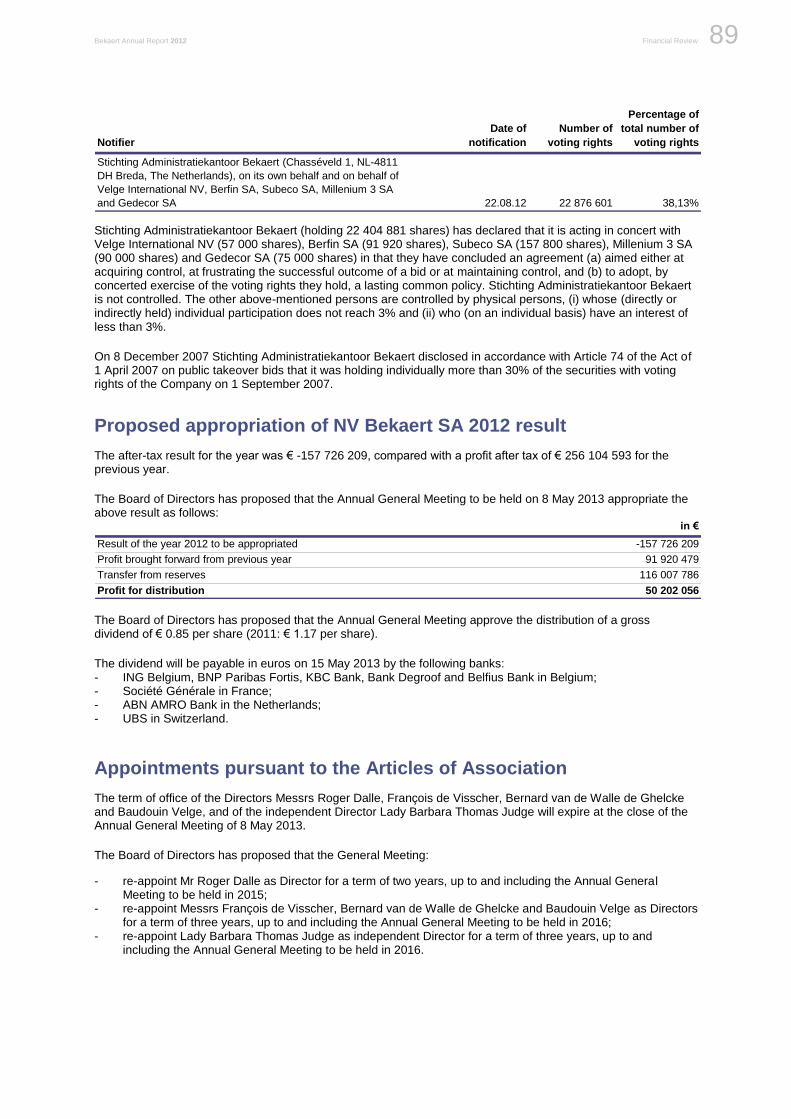
Bekaert Annual Report 2012 Financial Review
89
Be
ka
ert: F
inan
cia
l revie
w
Notifier
Date of
notification
Number of
voting rights
Percentage of
total number of
voting rights
Stichting Administratiekantoor Bekaert (Chasséveld 1, NL-4811
DH Breda, The Netherlands), on its own behalf and on behalf of
Velge International NV, Berfin SA, Subeco SA, Millenium 3 SA
and Gedecor SA 22.08.12 22 876 601 38,13%
Stichting Administratiekantoor Bekaert (holding 22 404 881 shares) has declared that it is acting in concert with Velge International NV (57 000 shares), Berfin SA (91 920 shares), Subeco SA (157 800 shares), Millenium 3 SA (90 000 shares) and Gedecor SA (75 000 shares) in that they have concluded an agreement (a) aimed either at acquiring control, at frustrating the successful outcome of a bid or at maintaining control, and (b) to adopt, by concerted exercise of the voting rights they hold, a lasting common policy. Stichting Administratiekantoor Bekaert is not controlled. The other above-mentioned persons are controlled by physical persons, (i) whose (directly or indirectly held) individual participation does not reach 3% and (ii) who (on an individual basis) have an interest of less than 3%.
On 8 December 2007 Stichting Administratiekantoor Bekaert disclosed in accordance with Article 74 of the Act of 1 April 2007 on public takeover bids that it was holding individually more than 30% of the securities with voting rights of the Company on 1 September 2007.
Proposed appropriation of NV Bekaert SA 2012 result
The after-tax result for the year was € -157 726 209, compared with a profit after tax of € 256 104 593 for the previous year.
The Board of Directors has proposed that the Annual General Meeting to be held on 8 May 2013 appropriate the above result as follows:
in €
Result of the year 2012 to be appropriated -157 726 209
Profit brought forward from previous year 91 920 479
Transfer from reserves 116 007 786
Profit for distribution 50 202 056
The Board of Directors has proposed that the Annual General Meeting approve the distribution of a gross dividend of € 0.85 per share (2011: € 1.17 per share).
The dividend will be payable in euros on 15 May 2013 by the following banks: - ING Belgium, BNP Paribas Fortis, KBC Bank, Bank Degroof and Belfius Bank in Belgium; - Société Générale in France; - ABN AMRO Bank in the Netherlands; - UBS in Switzerland.
Appointments pursuant to the Articles of Association
The term of office of the Directors Messrs Roger Dalle, François de Visscher, Bernard van de Walle de Ghelcke and Baudouin Velge, and of the independent Director Lady Barbara Thomas Judge will expire at the close of the Annual General Meeting of 8 May 2013.
The Board of Directors has proposed that the General Meeting:
- re-appoint Mr Roger Dalle as Director for a term of two years, up to and including the Annual General Meeting to be held in 2015;
- re-appoint Messrs François de Visscher, Bernard van de Walle de Ghelcke and Baudouin Velge as Directors for a term of three years, up to and including the Annual General Meeting to be held in 2016;
- re-appoint Lady Barbara Thomas Judge as independent Director for a term of three years, up to and including the Annual General Meeting to be held in 2016.
Financial Review Bekaert Annual Report 2012
Deloitte Bedrijfsrevisoren / Reviseurs d’Entreprises Burgerlijke vennootschap onder de vorm van een coöperatieve vennootschap met beperkte aansprakelijkheid / Société civile sous forme d’une société coopérative à responsabilité limitée Registered Office: Berkenlaan 8b, B-1831 Diegem VAT BE 0429.053.863 – RPR Brussel/RM Bruxelles – IBAN BE 17 2300 0465 6121 – BIC GEBABEBB
90
Auditor’s report
NV Bekaert SA Statutory auditor's report
on the consolidated financial statements for the year ended 31 December 2012
to the shareholders’ meeting
To the shareholders
As required by law, we report to you on the performance of our mandate of statutory auditor. This report includes our report on the consolidated financial statements as defined below together with our report on other legal and regulatory requirements.
Report on the consolidated financial statements – Unqualified opinion
We have audited the accompanying consolidated financial statements of NV Bekaert SA (“the company”) and its subsidiaries (jointly “the group”), prepared in accordance with International Financial Reporting Standards as adopted by the European Union and with the legal and regulatory requirements applicable in Belgium. These consolidated financial statements comprise the consolidated balance sheet as at 31 December 2012, the consolidated income statement, the consolidated statement of comprehensive income, the consolidated statement of changes in equity and the consolidated statement of cash flows for the year then ended, as well as the summary of significant accounting policies and other explanatory notes. The consolidated balance sheet shows total assets of 3.667.698 (000) EUR and the consolidated income statement shows a consolidated loss (group share) for the year then ended of 194.940 (000) EUR.
Responsibility of the board of directors for the preparation of the consolidated financial statements
The board of directors is responsible for the preparation and fair presentation of consolidated financial statements in accordance with International Financial Reporting Standards as adopted by the European Union and with the legal and regulatory requirements applicable in Belgium, and for such internal control as the board of directors determines is necessary to enable the preparation of consolidated financial statements that are free from material misstatement, whether due to fraud or error.
Statutory auditor’s responsibility
Our responsibility is to express an opinion on these consolidated financial statements based on our audit. We conducted our audit in accordance with International Standards on Auditing. Those standards require that we comply with ethical requirements and plan and perform the audit to obtain reasonable assurance about whether the consolidated financial statements are free from material misstatement.
An audit involves performing procedures to obtain audit evidence about the amounts and disclosures in the consolidated financial statements. The procedures selected depend on the statutory auditor’s judgment, including the assessment of the risks of material misstatement of the consolidated financial statements, whether due to fraud or error. In making those risk assessments, the auditor considers internal control relevant to the group’s preparation and fair presentation of the consolidated financial statements in order to design audit procedures that are appropriate in the circumstances, but not for the purpose of expressing an opinion on the effectiveness of the group’s internal control. An audit also includes evaluating the appropriateness of accounting policies used and the reasonableness of accounting estimates made by the board of directors, as well as evaluating the overall presentation of the consolidated financial statements. We have obtained from the company’s officials and the board of directors the explanations and information necessary for performing our audit.
Bedrijfsrevisoren / Reviseurs d’Entreprises Berkenlaan 8b B-1831 Diegem Tel.: +32 2 800 20 00 Fax: +32 2 800 20 01 http://www.deloitte.be
Bekaert Annual Report 2012 Financial Review
Member of Deloitte Touche Tohmatsu
91
Be
ka
ert: F
inan
cia
l revie
w
We believe that the audit evidence we have obtained is sufficient and appropriate to provide a basis for our opinion.
Unqualified opinion
In our opinion, the consolidated financial statements of NV Bekaert SA give a true and fair view of the group’s net equity and financial position as of 31 December 2012, and of its results and its cash flows for the year then ended, in accordance with International Financial Reporting Standards as adopted by the European Union and with the legal and regulatory requirements applicable in Belgium.
Report on other legal and regulatory requirements
The board of directors is responsible for the preparation and the content of the directors’ report on the consolidated financial statements.
In the framework of our mandate, our responsibility is to verify, for all significant aspects, the compliance with some legal and regulatory requirements. On this basis, we provide the following additional comment which does not modify the scope of our audit opinion on the consolidated financial statements:
• The directors’ report on the consolidated financial statements includes the information required by law, is, for all significant aspects, in agreement with the consolidated financial statements and is not in obvious contradiction with any information obtained in the performance of our mandate.
Diegem, 26 March 2013
The statutory auditor
DELOITTE Bedrijfsrevisoren / Reviseurs d’Entreprises BV o.v.v.e. CVBA / SC s.f.d. SCRL Represented by
Joël Brehmen

Financial Review Bekaert Annual Report 2012
92
Bekaert Group Executive
Bert De Graeve Chief Executive Officer
Bruno Humblet Chief Financial Officer & Executive Vice President Regional Operations Latin America
Dominique Neerinck Chief Technology Officer & Executive Vice President
Curd Vandekerckhove Executive Vice President Regional Operations North Asia and South East Asia
Henri Jean Velge Executive Vice President Business Platforms & Head of Global Commercial Excellence, Operational Excellence, Quality and Innovation
Frank Vromant Executive Vice President Regional Operations Europe, North America and South Asia
Bart Wille Chief Human Resources Officer & Executive Vice President
Senior Vice Presidents (as per year-end 2012)
Philippe Armengaud Chief Purchasing Officer & General Manager Group Business Development
Danny Chambaere Senior Vice President Building Products
Bruno Cluydts Senior Vice President Stainless Technologies
Patrick De Keyzer Senior Vice President Applied Technology and Industrial Projects & Head of Global Commercial and Operational Excellence
Marc de Sauvage General Manager Corporate Projects
Lieven Larmuseau Senior Vice President Rubber Reinforcement
Rick McWhirt Senior Vice President - President of Bekaert Corporation & Head of Rubber Reinforcement North America
Alejandro Sananez Senior Vice President Latin America
Geert Van Haver Senior Vice President Industrial Steel Wire & Head of Global Quality
Piet Van Riet Senior Vice President Brazil
Michel Vandevelde Senior Vice President Special Steel Wire
Geert Voet Senior Vice President Ropes
Zhong Zhang Senior Vice President Sawing Wire & Head of Rubber Reinforcement North Asia
Company Secretary
Pierre Schaubroeck
Auditors
Deloitte Bedrijfsrevisoren
Investor relations Communications Documentation
Jérôme Lebecque Katelijn Bohez www.bekaert.com
T +32 56 23 05 72 T +32 56 23 05 71 [email protected] F +32 56 22 85 57 F +32 56 23 05 48 [email protected] [email protected]
The annual report for the 2012 financial year is available in English and Dutch on annualreport.bekaert.com
Editor & Coordination: Katelijn Bohez, Chief Communications Officer
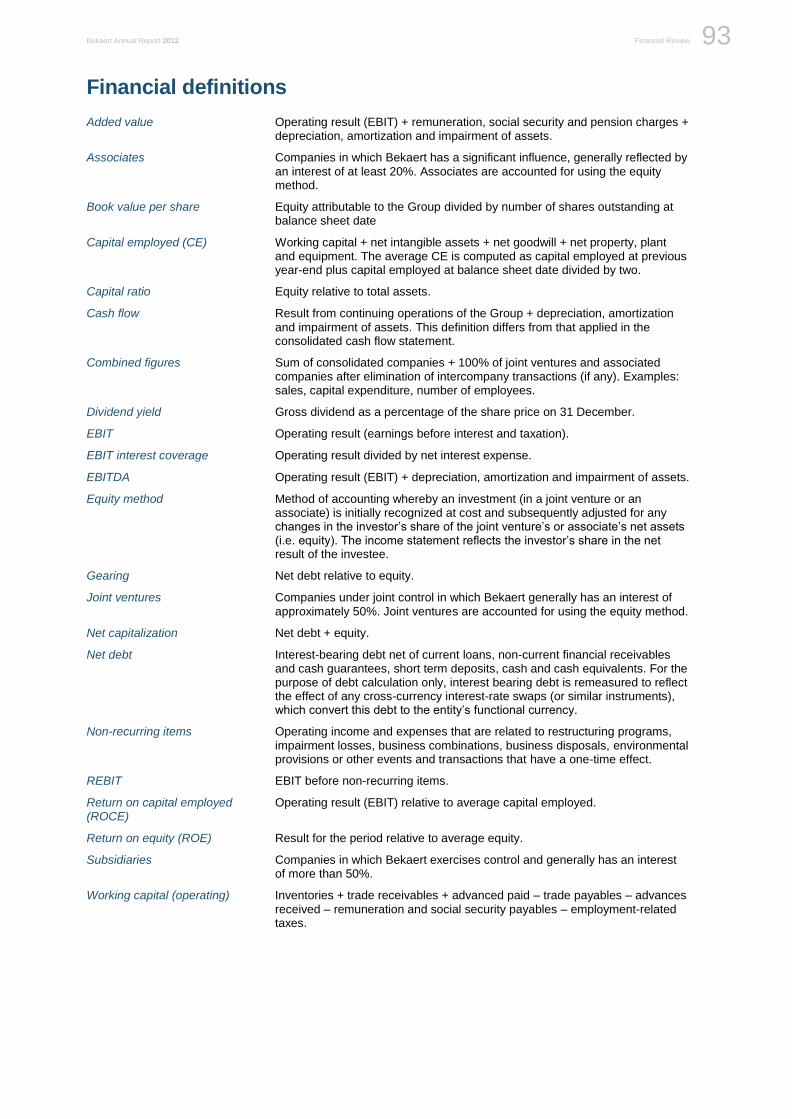
Bekaert Annual Report 2012 Financial Review
93
Be
ka
ert: F
inan
cia
l revie
w
Financial definitions
Added value Operating result (EBIT) + remuneration, social security and pension charges + depreciation, amortization and impairment of assets.
Associates Companies in which Bekaert has a significant influence, generally reflected by
an interest of at least 20%. Associates are accounted for using the equity method.
Book value per share Equity attributable to the Group divided by number of shares outstanding at balance sheet date
Capital employed (CE) Working capital + net intangible assets + net goodwill + net property, plant and equipment. The average CE is computed as capital employed at previous year-end plus capital employed at balance sheet date divided by two.
Capital ratio Equity relative to total assets.
Cash flow Result from continuing operations of the Group + depreciation, amortization
and impairment of assets. This definition differs from that applied in the consolidated cash flow statement.
Combined figures Sum of consolidated companies + 100% of joint ventures and associated companies after elimination of intercompany transactions (if any). Examples: sales, capital expenditure, number of employees.
Dividend yield Gross dividend as a percentage of the share price on 31 December.
EBIT Operating result (earnings before interest and taxation).
EBIT interest coverage Operating result divided by net interest expense.
EBITDA Operating result (EBIT) + depreciation, amortization and impairment of assets.
Equity method Method of accounting whereby an investment (in a joint venture or an associate) is initially recognized at cost and subsequently adjusted for any changes in the investor’s share of the joint venture’s or associate’s net assets (i.e. equity). The income statement reflects the investor’s share in the net result of the investee.
Gearing Net debt relative to equity.
Joint ventures Companies under joint control in which Bekaert generally has an interest of
approximately 50%. Joint ventures are accounted for using the equity method.
Net capitalization Net debt + equity.
Net debt Interest-bearing debt net of current loans, non-current financial receivables and cash guarantees, short term deposits, cash and cash equivalents. For the purpose of debt calculation only, interest bearing debt is remeasured to reflect the effect of any cross-currency interest-rate swaps (or similar instruments), which convert this debt to the entity’s functional currency.
Non-recurring items Operating income and expenses that are related to restructuring programs,
impairment losses, business combinations, business disposals, environmental provisions or other events and transactions that have a one-time effect.
REBIT EBIT before non-recurring items.
Return on capital employed Operating result (EBIT) relative to average capital employed. (ROCE)
Return on equity (ROE) Result for the period relative to average equity.
Subsidiaries Companies in which Bekaert exercises control and generally has an interest of more than 50%.
Working capital (operating) Inventories + trade receivables + advanced paid – trade payables – advances
received – remuneration and social security payables – employment-related taxes.
�������������� � ����������������������
�
�
�
�
�
�,
�
)�������������������������� ����������
�'��� ���$� ��������������'��)�����'���������'��� ���� $D��� �'�������� �� ������������������������@�� ��������� ���������� ������������&��1������"���'��
�������� ��������� �������'��'�(�����������������������������$����� �� �)��� �$���������� �������������'��������� �����������)���������������������� ������������'��'�������'��������������� �����'�������� �����H��� �
�� �'������������������'�������� �� ��������������������$�������������������'� ��������� ��'������������'����������� �����'��������������'��'�������'��������������� �����'�������� �����)������������� ��������������'�������������� ���� ���������������� ��%��'���
�9���'��������'����� ����1�������D�
�
����
����1�!��� ��������%���
5'���.0�����9������ 5'�����������'����� ����1��������
�
0�� �����
�'��� ��������%��������� ������ ���� ��$��������������'���������� ������ �'�������������������$�����$�� ��$� ���������)��� ������ ������� ��� ����� ��� �)��������������� ���'�� �������� �'�����%���������������������������������%� ��������������%�������������)����������������'������0���� ��������� ��%����'������� ���� ��$������������ ����������� ��$��'�����������������'����������������'��� ����� � ��������� ��� � ��%� ����$������ ��� �� ��� ��%� ������ ���� ��$� ��������� ������� � ��� �'��� ������ ��� ��$'�� ��� ��������������)� ���������������'������� ���� �����������%���������%���������������� ����������' ��%��'�� �������� �� � ��� ������ ��� � ��%�����$������ ��� ������� ���������� ���)� �����������)� ������������������������������' ��%��'�� �����������������������'��������%���'������������������������� ��%�� �����
��
����� ��� ������
������*��������� ��$��� ����"�&� 3�4�%��"�&�
!���������$�����'��'�� ��� 3�4�%��"�&�
1�� � �0� ��� �"�4�%��"�&�
1�� � ���%���� �-�4�%��"�&�
�"�&�'����%���������� �/�E��%��"�&�
�'�� �*��������� ��$��� ����"�&� �,��������"�&�
�"�&�������� �3�������%��"�,�
�"�&��������������������������'���� �3�4���'��"�,�
������*��������� ��$��� ����"�,� �,�4�%��"�,�
!���������$�����'��'�� ��� �,�4�%��"�,�
1�� � �0� ��� �/�4�%��"�,�
1�� � ���%���� ���4�%��"�,�
�"�,�'����%���������� ����$�����"�,�
�'�� �*��������� ��$��� ����"�,� �,��������"�,

What would you like to know about Bekaert?
www.bekaert.com
More detailed financial figures are available in the
Shareholders’ Guide 2012, available on bekaert.com
(investor’s datacenter)

NV Bekaert SA
President Kennedypark 18
BE-8500 Kortrijk
Belgium
T +32 56 23 05 11
F +32 56 23 05 48
www.bekaert.com
© Bekaert 2012