Embed Size (px)
Citation preview

DOES WEATHER AFFECT STOCK RETURNS ACROSS EMERGING
MARKETS?
by
Olha Zadorozhna

Abstract
DOES WEATHER AFFECT STOCK RETURNS ACROSS
EMERGING MARKETS
by Olha Zadorozhna
This paper tests the relationship between stock market variables (indices returns,
individual stocks’ returns, spreads and trading volumes) and the weather in
transition countries of Central and Eastern Europe and CIS. Weather is
considered to be a proxy for the mood factors that affect decisions of investors
and traders. It is hypothesized that they tend to be more optimistic about the
market prospects if the weather is warm and sunny and are more pessimistic if it
is rainy and cloudy. Hence, market players are more predisposed to buy stocks
when the weather if fine and sell them when the weather is bad. While some
significant effects are found, the overall impression the results give is that there is
little evidence of a systematic effect of weather on stock markets in Eastern
Europe, and hence, that it is unlikely one could make money on the stock market
from accurate weather forecasts.

TABLE OF CONTENTS
List of Tables .................................................................................................................................. ii
List of Figures ................................................................................................................................. iii
Glossary ........................................................................................................................................... iv
1. Introduction .......................................................................................................................... 6
2. Literature Review ................................................................................................................. 9
3. Data Description .................................................................................................................. 15
4. Methodology ......................................................................................................................... 18
5. Results .................................................................................................................................... 23
6. Conclusions ........................................................................................................................... 36
Bibliography .................................................................................................................................... 39
Appendices ...................................................................................................................................... 43

ii
LIST OF TABLES
Number Page
Table 1. Returns data general description ................................................................ 16
Table 2. Results of tests for stationarity and a unit root ......................................... 24
Table 3. OLS results ...................................................................................................... 27
Table 4. GARCH results .............................................................................................. 28

iii
LIST OF FIGURES
Number Page
Figure 1. Time series of PFTS stock returns ........................................................... 23

iv
GLOSSARY
Bid-Ask Spread – difference between bid and ask prices; indicator of liquidity of an asset.
CEE - Central and Eastern Europe.
CIS – Commonwealth of Independent States.
NY – New-York.

5
C h a p t e r 1
INTRODUCTION
The most common assumption in economic models is that markets are
driven by rational individuals who make inferences and rational choices based
on available information. However, is this really so? People often tend to be
driven by their mood in their deeds and behaviour. Many psychological
studies confirm the fact that depending on the mood individuals are more
predisposed to either pessimistic or optimistic expectations (Arkes et al.,
1988; Etzioni, 1988; Romer, 2000). Therefore, economic agents including
investors and stock market traders also should be influenced by subjective
stances (e. g. mood, feelings etc) when making their decisions. Moreover,
weather influences people’s mood in such a way that sunny days are
associated with positive perception of the world and information while rainy
or cloudy days are often associated with depressed mood and pessimism
(Cunningham, 1979; Howarth et al., 1984). The psychological literature argues
that people feel happier during sunny days while lack of sunshine has an
opposite effect (Schwarz et al., 1983; Eagles, 1994). This is mainly due to
perception of bright colours and sunlight as irritants that influence and evoke
positive feelings while grey sky and darkness are connected with negative
emotions. There is even a special sunlight treatment method that claims to
cure depression, apathy and melancholy (McAndrew, 1993). Hence, weather
can affect stock market players like any other people in their decisions
through psychological channels of mood and perception. This in turn might
impact stock returns as investors are more willing to buy stocks during sunny
weather and are more predisposed to sell if there are bad weather conditions.
This is known as deficient market hypothesis theory that predicts movements
of the stock market based on psychological factors.

6
The paper aims at investigating whether there is any significant impact of
weather on daily stock returns in the following transition countries: Ukraine
(PFTS Index), Poland (WIG Index), Russia (RTS Index), Hungary (BUX,
RAX Indices), Czech Republic (PX Index), Romania (BET Index), Croatia
(CROBEX Index), Slovenia (SBITOP Index), Bulgaria (SOFIX Index),
Slovakia (SAX Index), Estonia (TALSE Index), Latvia (RIGSE Index),
Lithuania (VILSE Index). It is to be tested whether there is a relationship
between stock returns and the following weather indicators: temperature,
cloud cover, atmospheric pressure, wind, precipitation, humidity, and
visibility. Also the impact of weather variables on individual stock returns,
their spreads and daily trading volumes of Blue Chip stocks of Central and
Eastern European (CEE) countries is to be estimated.
The impact of weather on stock returns has not been researched yet for
Ukraine, Romania, Croatia, Slovenia, Bulgaria, Slovakia, and Baltic States. It is
the first time that someone tries to test how weather related variables affect
Russian RTS Index, polish WIG Index, Hungarian BUX Index, and Czech
PX Index. Jacobsen et al. (2008) used data for these and other emerging
markets in the investigation of weather impact on MSCI (Morgan Stanley
Capital International) Indices returns1 but not on the RTS, WIG, BUX, PX
Indices this research is looking at. It is especially interesting to compare
results for CEE stock exchanges with those for Ukraine as it might give a
deeper understanding of the reasoning behind certain investors’ sentiments in
the neighbouring markets. Financial markets in these countries grow very fast
and promise great returns in the future. However, they have not been studied
yet as much as other countries’. Moreover, the weather impact on stock
1 MSCI Indices are developed by Mogran Stanley to track performance of most liquid and attractable for
investment purposes equities within almost 100 markets worldwide. They differ from national indices by basket composition, weights assigned to each stock within the basket and calculation techniques. www.mscibarra.com/products/indices/equity/index.jsp

7
market is investigated in only dozen of papers so far in the world and none of
them studies CEE and CIS states. Results of these studies find a significant
impact of weather on stock returns for some countries and none for others.
Thus, this paper is to check if transition countries in the consideration are
weather sensitive. The investigation of a degree to which market players in
transition economies make their business decisions based on weather related
mood factors is challenging and very interesting from the academic point of
view as psychological factors are likely to impact investors more in countries
with less developed financial markets like CEE and CIS states, where the
uncertainty is greater.
The rest of this paper consists of five parts. First, a review of relevant
academic literature on the impact of weather on stock returns is presented.
Second, the data on weather variables and stock market data is described.
Next there is a detailed explanation of the methodology used to evaluate the
effect of weather on stock returns, trading volumes and spreads. Fourth, a
regression analysis is performed the results of which are discussed. Finally,
conclusions and suggestions for future research are made.
8
C h a p t e r 2
LITERATURE REVIEW
There exists a sizable academic literature on the effect of weather on stock
returns. Researchers argue that good weather impacts investors’ mood and
they, in turn, might wrongly attribute positive feelings as such that indicate
about favourable prospects of financial markets (even though it is just a good
weather effect). The opposite reasoning holds for bad weather conditions.
Some researchers have found a significant negative relationship between
cloud cover and returns on stocks (Saunders, 1993; Hirshleifer and Shumway,
2003; Chang, Shao-Chi et al., 2008; Chang, Tsangyao et al. 2006; Dowling et
al., 2005; etc). Others, however, argue that there is no such a relationship and
find it to be insignificant (Loughran et al., 2004; Jacobsen et al., 2008; Krämer
et al., 1997; etc).
Investors in countries of transition could be influenced more by
psychological factors than those in developed economies due to a lower level
of development of financial markets. Iarina (2008) finds that subjective
perception of a current situation has the greatest influence on formation of
positive expectations in developing economies and not that great in
developed ones. Hence, market players in developing economies could be
driven by mood and subjective stances with a higher probability than those in
the developed ones. Therefore, the impact of weather on investors and
traders might be higher in Ukraine and its neighbouring countries under
consideration than in European and North American nations being
researched so far.

9
From here, we will first focus on psychological studies about the impact of
weather on human behaviour, then proceed with the overview of the existing
literature about the influence of weather on stock returns, and finally,
conclude with a discussion of empirical methods used by researchers.
The efficient market hypothesis is a theory claiming that given rational
behaviour of all investors, current market prices reflect the discounted future
cash flows (Fama, 1970). That is market players account for all possible
events in their decision making and set prices accordingly. However,
Hirshleifer (2001) argues that investors are irrational and their decisions are
affected by different subjective factors. This theory is often referred to as
Deficient Market Hypothesis. The main idea of it is that wrong decisions by
market participants cause securities to be priced incorrectly. In this research
we are interested in factors that influence investors’ choices such as climate
and weather; and emotions through which these two operate.
In their research Lo et al. (2001) concentrated on the role of emotions in
stock market traders’ behaviour and decision-making. They find a significant
correlation between psychological stances and the way markets move (e.g.
upward/downward) and claim that emotions improve traders’ performance
and ability to adjust to volatile environment. Another research conducted by
Ashbury at al. (1999) also suggests that people in a good mood perform
better as they tend to superimpose current positive outlook on an assignment
being carried out at the moment.
Environmental psychology tries to explain how surroundings affect human
behaviour. Weather is one of the main factors that influence a person’s mood
and the way one feels. Experiments of Bell et al. (2003) have shown that cold
makes people be more predisposed to sadness and melancholy but its
influence is slight and almost insignificant. Scientists (Bell et al., 2003) argue

10
that heat, on the other hand, has a strong negative impact on human
behaviour and claim that violence increases rapidly during the high-
temperature periods of a year.
Psychologists also say that people become more optimistic during sunny
weather and more pessimistic during rainy or cloudy days (Eagles, 1994; Rind,
1996). Good mood and positive outlook in turn positively affect the
perception of reality and future. (Herren et al., 1988). Such a positive feeling
affects people’s decisions that are usually made in accord with their mood
(Schwarz, 1990). Thus, investors that are in a good mood are inclined to
invest in riskier projects as they believe in a success of their ventures (Herren
et al., 1988).
The pioneer in the field of exploring the impact of weather on stock returns
was Saunders (1993) who investigated how local weather affects New-York
City Exchange indices. The author found a strong negative relationship
between cloud cover and returns on stocks. Later on Hirshleifer and
Shumway (2003) have repeated Saunder’s research but using data on stock
indices of 26 countries. They have confirmed previous developments and
found that sunshine has a significant positive correlation with stock returns.
However, they have concluded that using weather as a determinant of a
pattern of stock trades is efficient only for low transaction costs investors.
Similar results are obtained for the Irish Stock Market by Dowling and Lucey
(2005). These authors have found that a ‘rain’ variable is significant while
estimating the model of weather effects on stock returns.
The impact of weather on trading volume is studies by Loughran et al. (2004)
who have found a negative relationship between the amount of blizzard
strokes and trading volumes. Chang et al. (2008) research the extent to which

11
cloud cover influenced spread measures of New-York Stock Exchange
during 1994-2004 and conclude that there is little correlation between these
variables.
A critical view on Saunder’s findings is expressed by Krämer and Runde
(1997). They used German stock index data and found that local weather
does not affect short-term stock returns. Also Loughran and Schultz (2004)
argue that it is better to use data on local weather in home-cities of investors
listed on New-York City Exchanges in Saunder’s study. That is due to the
fact that many investors are located in different parts of the USA even
though they trade on New-York Stock Market. Loughran and Schultz (2004)
have found no significant relationship between the local weather in the home-
city of a company and stock returns. Pardo et al. (2003) confirmed the above
argument and found no effect of weather variables (sunshine and humidity)
on stock returns for Madrid Stock Exchange. Worthington (2006) came to
the same conclusion using Australian stock market data as well as Tufan
(2004) using data for the Istanbul Stock Exchange.
It is argued by Chang et al. (2008) that it is the intraday weather pattern that
influences investors’ behaviour. They have found that cloud cover affects the
returns on stocks only at the beginning of the trading day, specifically, only
during the first 12-15 minutes of the working day. They explain this finding
by the fact that traders and investors are impacted by the weather conditions
only on their way to work and, then, while at the office they do not really feel
the weather influence due to the presence of air-conditioners and lack of
windows (as is most probably the case). Hence, the effect of cloud cover
declines very quickly.
Locke et al. (2007) suggest that traders’ afternoon behaviour is influenced by
morning weather more than by the weather during other parts of the day. In
12
this research authors found that wind causes the effective bid-ask spread to
widen. They explain this conclusion claiming that ion imbalance caused by
the wind affects the mood of market players and, as a consequence, market
quotes.
Whether there is any effect of temperature on stock returns was examined by
Cao and Wei (2005). Researchers argue that aggressive behaviour is often a
result of low temperature while both apathy and aggression can be
consequences of high temperature. Therefore, they have hypothesised
negative relationship between stock returns and temperature and have
actually found it to be significant.
Using Taiwanese stock market data Chang et al. (2006) have confirmed an
existence of a significant relationship between temperature, cloud cover and
stock returns. They included temperature as an explanatory variable into their
model and found that stock returns are higher when the temperature is within
normal bounds; though, they tend to be lower when it is extremely hot or
cold and when the cloud cover is heavier.
The most recent paper of Jacobsen et al. (2008) argue there is no negative
effect of temperature on stock returns, though authors do not reject that
there is a strong seasonal anomaly: stock returns appear to be lower in
summer and autumn and higher in winter and spring months. Thus,
seasonality issue is closely related to our debate about the weather impact on
stock returns. One has to account for so-called calendar effects that are
thought by some researchers to have a significant impact on financial
markets. In general winter and spring months are associated with higher stock
market returns than summer and autumn months (Bouman et al., 2002).
Saunders (1993) argues that market usually shows an upward movement in
January as investors’ activity increases due to holiday rush. Others explain the

13
significance of January effect by the fact that at the end of a tax year
(December) prices tend to decrease, but then rise again during the first month
of a new year (Al-Khazali et al., 2008). Scientists explain existence of calendar
anomalies due to errors in data and methods used to evaluate the impact, as
well as due to micro-market and information flow effects (Pettengill, 2003).
As for the estimation techniques, linear models are mostly used to trace the
effect of weather on stock returns (Saunders, 1993; Hirshleifer and Shumway,
2003 Dowling et al., 2005 Krämer et al., 1997). Some researchers use
GARCH technique (Chang et al., 2006).
The literature examined above can be divided into two categories: the one
that finds that weather affects stock returns, and the other that argues that
there is no such an effect. However, none of them studies CEE and CIS
states. Thus, the paper aims at checking if transition countries in the
consideration fall under the category of weather sensitive or weather proof
ones. An effect of weather on stock market variables is expected to be found,
because psychological factors are expected to impact investors more in
countries with less developed financial markets like those of the CEE and
CIS states.
14
C h a p t e r 3
DATA DESCRIPTION
The present research considers 13 CIS and CEE countries that are situated in
close proximity with each other, have integrated markets and are culturally
and historically interconnected. Daily weather data for home cities of stock
exchanges (all capitals) of the specified above countries is used and is
available from GisMeteo2 and RussianWeather3 historical archives that
contain countries’ weather stations datasets. Only capitals are considered in
the analysis as traders outside a capital city are usually small players and their
trading volumes do not have significant influence on stock prices and returns.
This is true for emerging markets considered in the present research, though
not necessarily so for developed economies. Available sample periods differ
across countries, but are not less than 6 years (see table 1 below). The reason
why sample periods differ is because different countries have introduced their
indices at different times, as well as different stocks have gone public at
different times. Stock market daily data (historical values of indices,
individual stock prices, and trading volumes) is available from Bloomberg
database and from the corresponding exchange web-sites.
2 http://www.gismeteo.ru/salist.htm
3 http://meteo.infospace.ru/koi/wcarch/html/r_index.sht
15
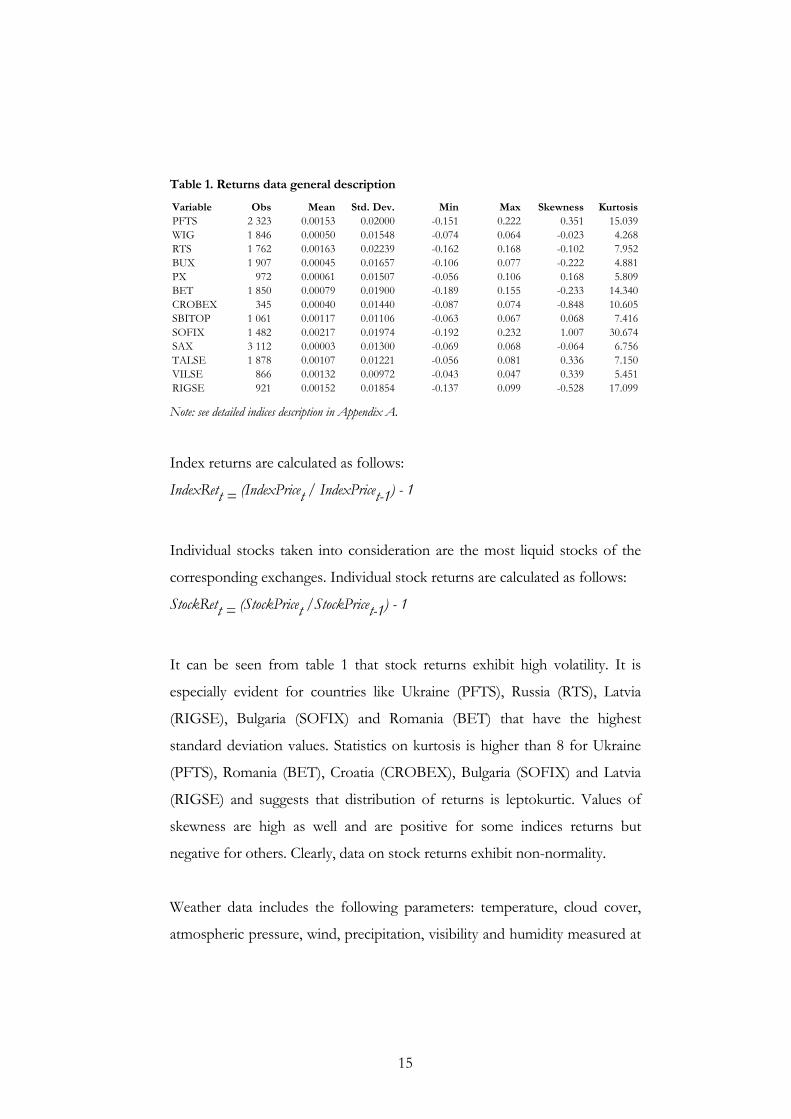
Table 1. Returns data general description
Variable Obs Mean Std. Dev. Min Max Skewness KurtosisPFTS 2 323 0.00153 0.02000 -0.151 0.222 0.351 15.039WIG 1 846 0.00050 0.01548 -0.074 0.064 -0.023 4.268RTS 1 762 0.00163 0.02239 -0.162 0.168 -0.102 7.952BUX 1 907 0.00045 0.01657 -0.106 0.077 -0.222 4.881PX 972 0.00061 0.01507 -0.056 0.106 0.168 5.809BET 1 850 0.00079 0.01900 -0.189 0.155 -0.233 14.340CROBEX 345 0.00040 0.01440 -0.087 0.074 -0.848 10.605SBITOP 1 061 0.00117 0.01106 -0.063 0.067 0.068 7.416SOFIX 1 482 0.00217 0.01974 -0.192 0.232 1.007 30.674SAX 3 112 0.00003 0.01300 -0.069 0.068 -0.064 6.756TALSE 1 878 0.00107 0.01221 -0.056 0.081 0.336 7.150VILSE 866 0.00132 0.00972 -0.043 0.047 0.339 5.451RIGSE 921 0.00152 0.01854 -0.137 0.099 -0.528 17.099 Note: see detailed indices description in Appendix A.
Index returns are calculated as follows:
IndexRett = (IndexPricet / IndexPricet-1) - 1
Individual stocks taken into consideration are the most liquid stocks of the
corresponding exchanges. Individual stock returns are calculated as follows:
StockRett = (StockPricet /StockPricet-1) - 1
It can be seen from table 1 that stock returns exhibit high volatility. It is
especially evident for countries like Ukraine (PFTS), Russia (RTS), Latvia
(RIGSE), Bulgaria (SOFIX) and Romania (BET) that have the highest
standard deviation values. Statistics on kurtosis is higher than 8 for Ukraine
(PFTS), Romania (BET), Croatia (CROBEX), Bulgaria (SOFIX) and Latvia
(RIGSE) and suggests that distribution of returns is leptokurtic. Values of
skewness are high as well and are positive for some indices returns but
negative for others. Clearly, data on stock returns exhibit non-normality.
Weather data includes the following parameters: temperature, cloud cover,
atmospheric pressure, wind, precipitation, visibility and humidity measured at

16
12 pm daily. Sample periods and number of observations are matched with
those for the indices and individual stocks. Wind variable ranges from 0 to 33
where 0 is no wind level. Cloud Cover ranges from zero (clear skies) to 3000
(heavy clouds). Precipitation is measured from zero (dry weather) and above in
mm. There are fewer observations on precipitation than on other weather
variables for most of the countries due to data unavailability. Visibility is the
distance away at which a target can be seen regardless of weather conditions.
Its values range from 0 (objects not visible at 20 miles distance) to 60 (objects
are not visible at above 50 yards distance). Descriptive statistics of weather
variables can be found in Appendix B.
17
C h a p t e r 4
METHODOLOGY
Linear models (OLS) are used to test the relationship between stock returns,
spreads and trading volumes and weather variables. However, it is argued by
Chang et al. (2006) that a GARCH model may be a better tool for estimation
as stock market data exhibits heteroscedasticity (see Appendix D for results
of a heteroscedasticity test). Also stock returns are characterized by the so-
called “volatility clustering” when observations are high during some periods
of time and low during others causing time variability of amplitude of returns
(Engle, 2001). Hence, GARCH technique is used along with OLS. Threshold
estimation is implemented to test if weather variables higher (or lower) than a
threshold value have more significant effect on human behaviour, hence,
stock returns. It is hypothesized that extreme weather conditions (like much
higher than normal temperature or much stronger than normal wind level
etc) are more likely to impact people’s mood. Therefore, threshold values are
calculated to account for the effect of large deviations from normal weather
conditions. Threshold values are found following Chang et al. (2006) and
Chan (1993). First, observations are sorted in the ascending order and then
5% of the highest and 5% of the lowest values are deleted. Remaining
observations are used to determine threshold values which minimize the
residual sum of squares4. Threshold values are estimated in such a way
because there is no priory knowledge about them, and the method described
above gives consistent estimates as proven by Chan (1993). Threshold values
for each country can be found in Appendix E. First, models without a
threshold are evaluated and then threshold estimation is performed. Only
4 The value that minimizes RSS is found using macros programming (loop function) in Excel.

18
OLS is used in case if β1 = β2 and Wup =Wdown =1, where Wup is a dummy
variable equal to 1 if vt > τ (threshold); Wdown is a dummy variable equal to 1
if vt < τ (threshold). vt is the vector of weather variables that includes
temperature, atmospheric pressure, humidity, cloud cover, wind, visibility and precipitation.
No threshold models are:
OLS
IndexRett = β0 + β1 vt + ut
GARCH
IndexRett = β0 + β1 vt + ut
σ2t = α0 + α1 σ2t-1 + α2IndexRet 2t-1
Threshold models are:
OLS
IndexRett = β0 + β1 Wupvt + β2 Wdownvt + ut
GARCH
IndexRett = β0 + β1 Wupvt + β2 Wdownvt + ut
σ2t = α0 + α1 σ2t-1 + α2IndexRet 2t-1
where σ2t is a conditional time dependent variance.
The essence of GARCH model is that it uses heteroscedastic errors to model
variance. “The GARCH updating formula takes the weighted average of the
unconditional variance, the squared residual for the first observation and the
starting variance and estimates the variance of the second observation. This is
input into the forecast of the third variance, and so forth. Eventually, an
entire time series of variance forecasts is constructed” (Engle, 2001). Hence,

19
GARCH uses heteroscedasticity to produce robust variance estimators that
are used in computation of t-statistics.
Also, the impact of weather variables on individual companies’ stock returns,
bid-ask spreads and trading volumes is to be estimated. GARCH is not used
in estimation of the impact of weather on individual stocks’ returns, spreads
and trading volumes as number of observations are sometimes too small for
some of the companies and volatility of data is not large (while GARCH
assumes volatility clustering discussed above). Hence, it is hard for Stata (or
other statistical packages) to find an uphill direction where a maximum of the
loglikelihood function can be found to obtain regression results.
No threshold models are:
OLS
StockRett = β0 + β1 vt + ut
Spreadt = β0 + β1 vt + ut
TrVolt = β0 + β1 vt + ut
Threshold models are:
OLS
StockRett = β0 + β1 Wupvt + β2 W
downvt + ut
Spreadt = β0 + β1 Wupvt + β2 Wdownvt + ut
TrVolt = β0 + β1 Wupvt + β2 Wdownvt + ut
where Spreadt = 1 – (BidPricet / AskPricet )
Bid-ask spread is an indicator of liquidity of an asset: the smaller the spread,
the more liquid the stock is.
20
Seasonal dummies (like Winter, Spring, Autumn, January, December) are included
into the regressions to control for seasonality. January and December dummies
are needed (following Saunders, 1993) to account for the so-called “Holidays
effect” when stock market shows upward movements in stock prices due to
increased investor activity (possibly connected with holiday rush).
It is also tried to include New-York (NY) weather variables and S&P 500
Index returns into the regressions to control for exogenous effects. If the
majority of investors that trade stocks of Ukraine and other countries being
analyzed are located in New-York, the main financial centre of the world,
then it is reasonable to conclude that NY’s weather affects stock markets in
these countries. Statistics on the amount of portfolio investment from USA
to analyzed countries can be found in Appendix F. According to it, significant
share of investment indeed comes from USA for almost all of the countries.
First, only NY weather variables are included into the regressions. Then S&P
500 Index returns are added to account for external shocks to national
economies.
It should be stressed that all weather variables represent exogenous influence
on stock returns; hence, the model avoids endogeneity problems as stock
indices obviously can not be expected to influence the weather. The analysis
tries to reveal possible relationship between the returns on stocks/indices and
psychological factors having weather variables as proxies for the mood of the
stock market players. Also based on the assumption that weather variables are
not correlated with other possible factors that affect stock returns, omitted
variable bias is not an issue.
In general if the relationship is present, it is expected that wind, cloud cover,
precipitation affect stock market variables negatively, while visibility and
temperature, on the other hand, positively as is the case in studies conducted

21
by Saunders (1993), Hirshleifer and Shumway (2003), Chang, Shao-Chi et al.
(2008), Chang, Tsangyao et al. (2006), and Dowling et al. (2005), Loughran et
al. (2004), Jacobsen et al. (2008), Krämer et al. (1997). In case a relationship
between the specified variables is found, it would mean that investors in
transition countries are influenced by their mood and the weather in the
decision-making process. Therefore, asset pricing models used for companies
in emerging markets should account for this impact.
Finally, low R-squared value is expected as variation in weather variables can
not encompass all variation in stock returns.
22
C h a p t e r 5
RESULTS
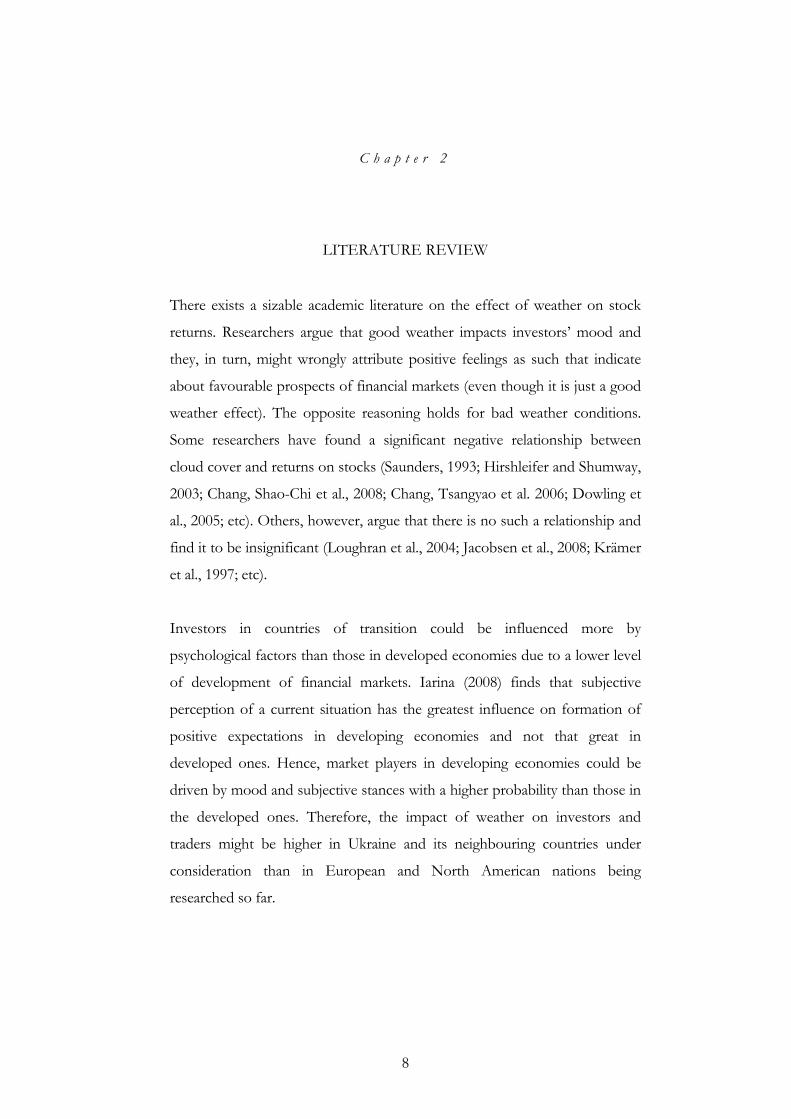
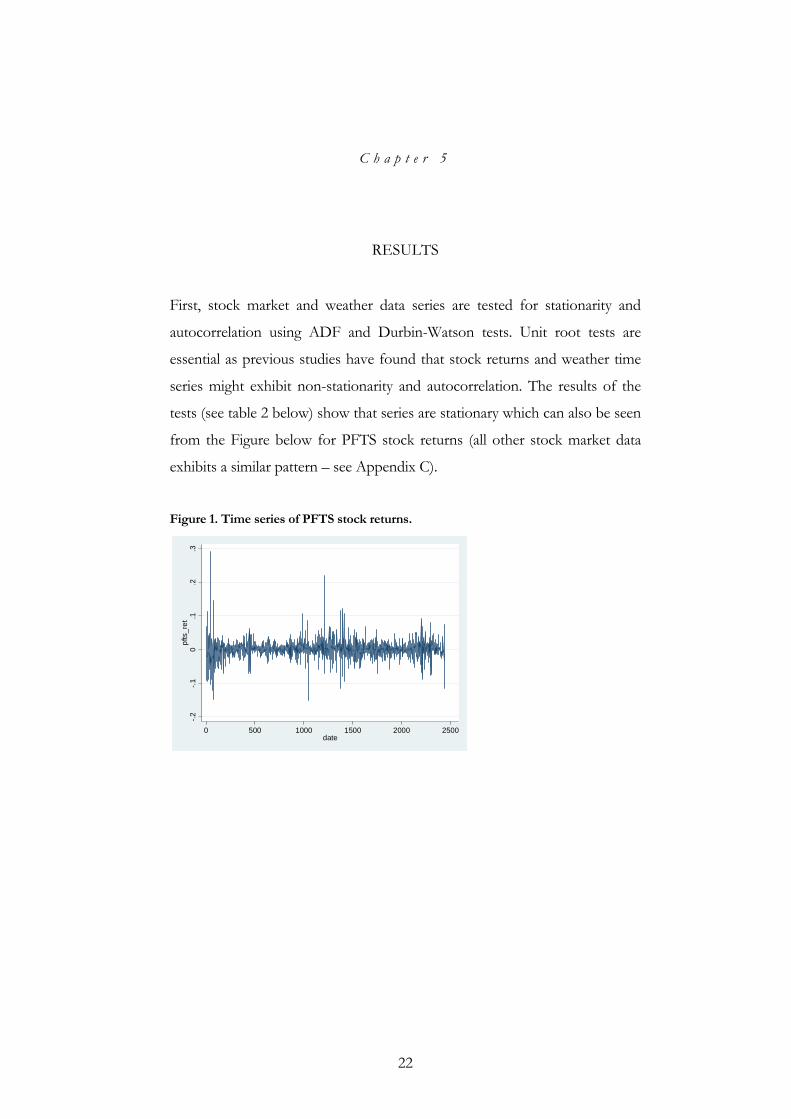
First, stock market and weather data series are tested for stationarity and
autocorrelation using ADF and Durbin-Watson tests. Unit root tests are
essential as previous studies have found that stock returns and weather time
series might exhibit non-stationarity and autocorrelation. The results of the
tests (see table 2 below) show that series are stationary which can also be seen
from the Figure below for PFTS stock returns (all other stock market data
exhibits a similar pattern – see Appendix C).
Figure 1. Time series of PFTS stock returns.
-.2-.1
0.1
.2.3
pfts
_ret
0 500 1000 1500 2000 2500date
23
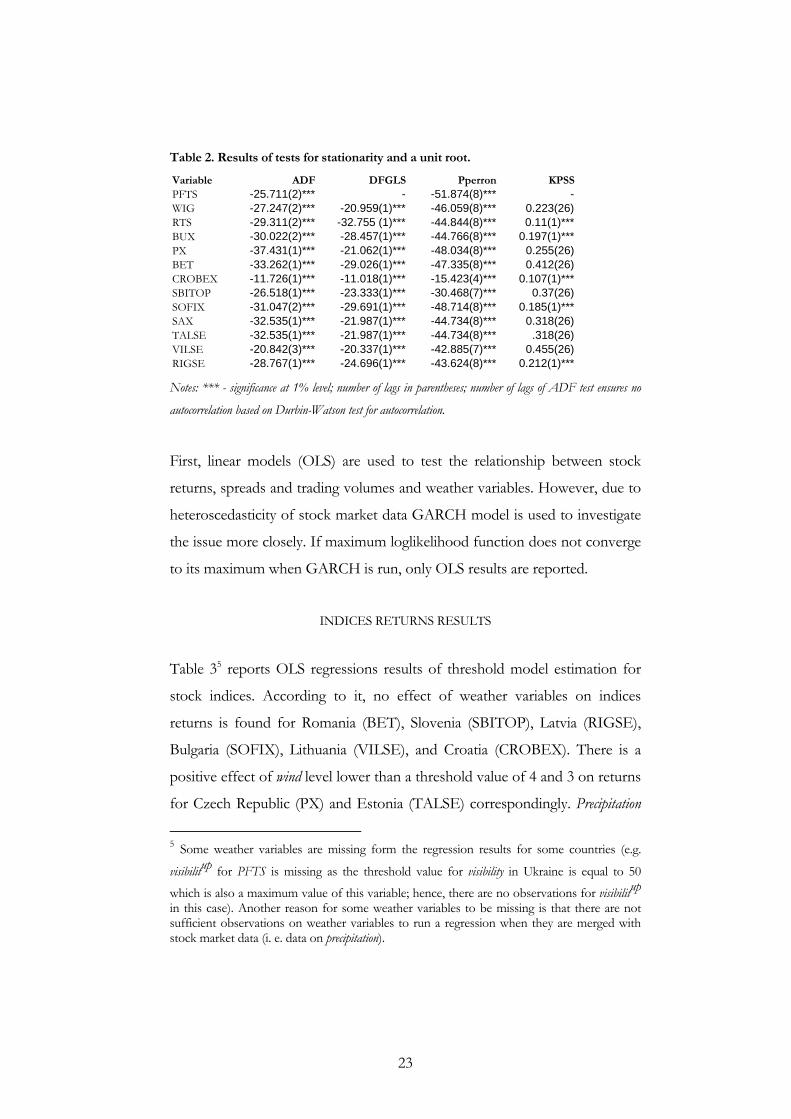
Table 2. Results of tests for stationarity and a unit root.
Variable ADF DFGLS Pperron KPSSPFTS -25.711(2)*** - -51.874(8)*** -WIG -27.247(2)*** -20.959(1)*** -46.059(8)*** 0.223(26)RTS -29.311(2)*** -32.755 (1)*** -44.844(8)*** 0.11(1)***BUX -30.022(2)*** -28.457(1)*** -44.766(8)*** 0.197(1)***PX -37.431(1)*** -21.062(1)*** -48.034(8)*** 0.255(26)BET -33.262(1)*** -29.026(1)*** -47.335(8)*** 0.412(26)CROBEX -11.726(1)*** -11.018(1)*** -15.423(4)*** 0.107(1)***SBITOP -26.518(1)*** -23.333(1)*** -30.468(7)*** 0.37(26)SOFIX -31.047(2)*** -29.691(1)*** -48.714(8)*** 0.185(1)***SAX -32.535(1)*** -21.987(1)*** -44.734(8)*** 0.318(26)TALSE -32.535(1)*** -21.987(1)*** -44.734(8)*** .318(26)VILSE -20.842(3)*** -20.337(1)*** -42.885(7)*** 0.455(26)RIGSE -28.767(1)*** -24.696(1)*** -43.624(8)*** 0.212(1)*** Notes: *** - significance at 1% level; number of lags in parentheses; number of lags of ADF test ensures no
autocorrelation based on Durbin-Watson test for autocorrelation.
First, linear models (OLS) are used to test the relationship between stock
returns, spreads and trading volumes and weather variables. However, due to
heteroscedasticity of stock market data GARCH model is used to investigate
the issue more closely. If maximum loglikelihood function does not converge
to its maximum when GARCH is run, only OLS results are reported.
INDICES RETURNS RESULTS
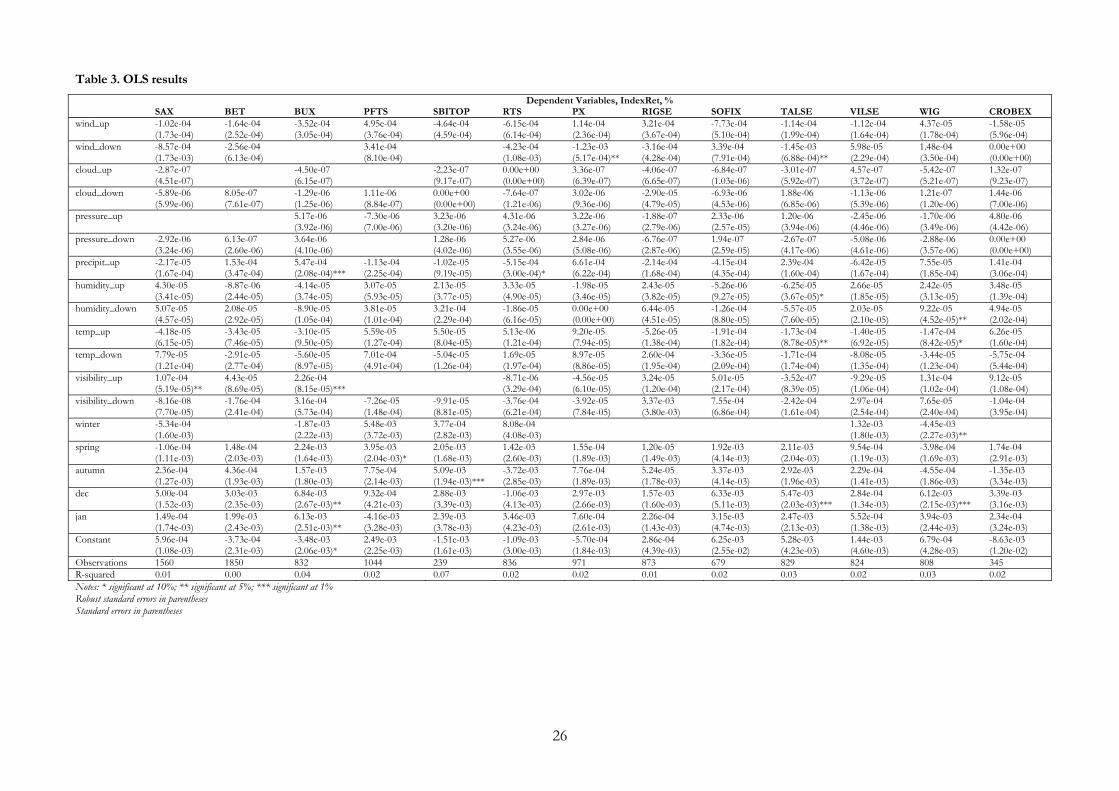
Table 35 reports OLS regressions results of threshold model estimation for
stock indices. According to it, no effect of weather variables on indices
returns is found for Romania (BET), Slovenia (SBITOP), Latvia (RIGSE),
Bulgaria (SOFIX), Lithuania (VILSE), and Croatia (CROBEX). There is a
positive effect of wind level lower than a threshold value of 4 and 3 on returns
for Czech Republic (PX) and Estonia (TALSE) correspondingly. Precipitation
5 Some weather variables are missing form the regression results for some countries (e.g.
visibilitup for PFTS is missing as the threshold value for visibility in Ukraine is equal to 50
which is also a maximum value of this variable; hence, there are no observations for visibilitup in this case). Another reason for some weather variables to be missing is that there are not sufficient observations on weather variables to run a regression when they are merged with stock market data (i. e. data on precipitation).
24
above a threshold affects returns on BUX (Hungary) positively while returns
on RTS (Russia) negatively. Returns on TALSE (Estonia) fall as humidity
above a threshold rises, however returns on WIG (Poland) fall as humidity
below a threshold decreases. Temperature above a threshold has a negative
effect on Estonian (TALSE) and Polish (WIG) indices. The higher the
visibility (above a threshold), the higher the returns on SAX (Slovakia) and
BUX (Hungary) indices. OLS results suggest that TALSE is affected by the
largest number of weather variables while PFTS is impacted by none (no
weather variable is significant).
A test for heteroscedastcity (hettest) is applied after OLS regressions to check
if this problem is present in the model. The results can be found in Appendix
D. They suggest that heteroscedasticity is indeed present for most of the
indices returns; hence, OLS regressions with robust standard errors are run.
However, their results are practically the same as in the case of simple OLS.
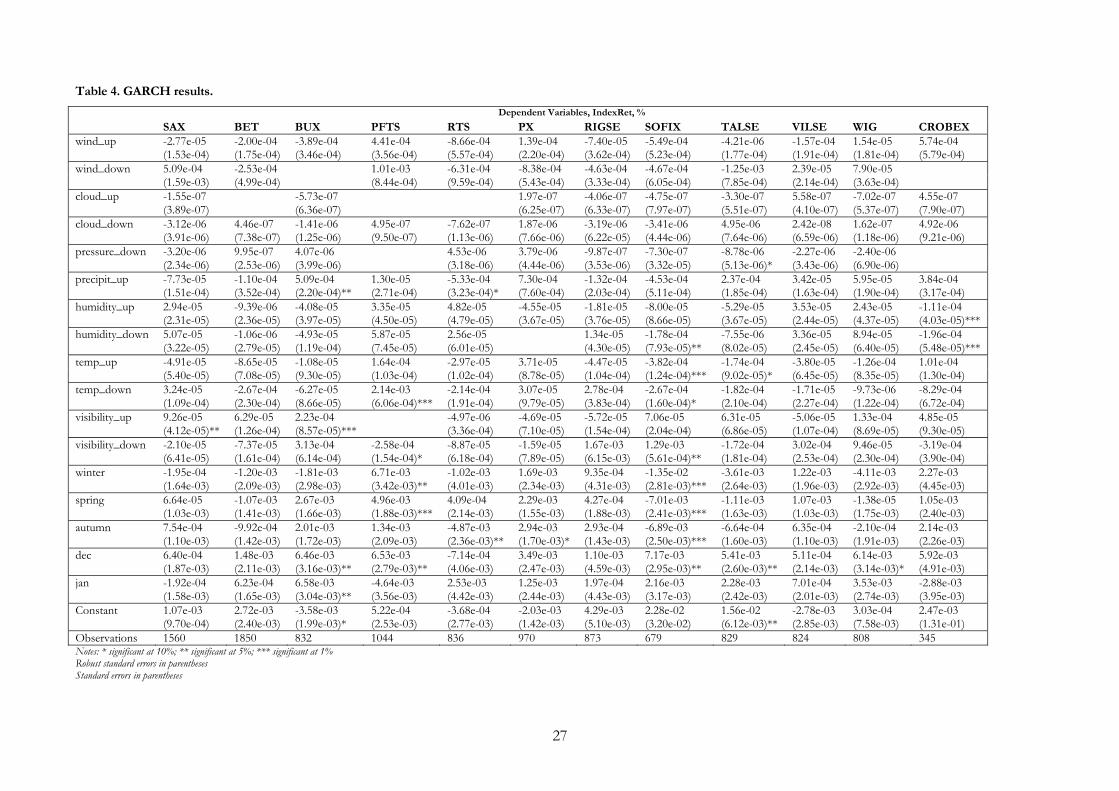
Table 4 gives results of GARCH estimation. According to it, there is no
effect of weather variables on indices returns of Romania (BET), Czech
Republic (PX), Latvia (RIGSE), Lithuania (VILSE), and Poland (WIG). Now
wind higher than a threshold negatively affects RTS (Russia) returns; and
pressure lower than a threshold negatively affects TALSE (Estonia) returns. As
in the case of OLS estimation, precipitation higher than a threshold affects
Hungarian index returns (BUX) positively while Russian RTS - negatively.
Higher humidity levels make CROBEX (Croatia) returns fall while SOFIX
(Bulgaria) returns decrease only if humidity lower than a threshold increases.
Temperature higher than a threshold has a negative impact on SOFIX and
TALSE returns. Visibility positively affects returns on SAX (Slovakia), BUX
(Hungary) and SOFIX (Bulgaria). According to GARCH regression results
Bulgarian index is the most sensitive to weather variables variation.

25
The size of the effect of weather variables is very small as the dependant
variable (returns on indices) is pretty small itself. For example, in case of
Ukrainian PFTS Index returns (based on GARCH threshold model
estimation), PFTS returns decrease by 2.14e-03 when temperature falls by 1oC
below the threshold which is equal to 5 oC. Hence, returns on Ukrainian
Index tend to be lower when it is “extremely” cold: PFTS average daily
returns (equal to 1.53e-03) experience almost 140% decrease if temperature
falls below the threshold by 1oC.
Results of no threshold models estimation (where wind variable is used instead
of windup and winddown, the same applies to all other weather variables) can
be found in Appendix H. Results are practically the same as those of
threshold models.
26
Table 3. OLS results
Dependent Variables, IndexRet, % SAX BET BUX PFTS SBITOP RTS PX RIGSE SOFIX TALSE VILSE WIG CROBEX wind_up -1.02e-04 -1.64e-04 -3.52e-04 4.95e-04 -4.64e-04 -6.15e-04 1.14e-04 3.21e-04 -7.73e-04 -1.14e-04 -1.12e-04 4.37e-05 -1.58e-05 (1.73e-04) (2.52e-04) (3.05e-04) (3.76e-04) (4.59e-04) (6.14e-04) (2.36e-04) (3.67e-04) (5.10e-04) (1.99e-04) (1.64e-04) (1.78e-04) (5.96e-04) wind_down -8.57e-04 -2.56e-04 3.41e-04 -4.23e-04 -1.23e-03 -3.16e-04 3.39e-04 -1.45e-03 5.98e-05 1.48e-04 0.00e+00 (1.73e-03) (6.13e-04) (8.10e-04) (1.08e-03) (5.17e-04)** (4.28e-04) (7.91e-04) (6.88e-04)** (2.29e-04) (3.50e-04) (0.00e+00) cloud_up -2.87e-07 -4.50e-07 -2.23e-07 0.00e+00 3.36e-07 -4.06e-07 -6.84e-07 -3.01e-07 4.57e-07 -5.42e-07 1.32e-07 (4.51e-07) (6.15e-07) (9.17e-07) (0.00e+00) (6.39e-07) (6.65e-07) (1.03e-06) (5.92e-07) (3.72e-07) (5.21e-07) (9.23e-07) cloud_down -5.89e-06 8.05e-07 -1.29e-06 1.11e-06 0.00e+00 -7.64e-07 3.02e-06 -2.90e-05 -6.93e-06 1.88e-06 -1.13e-06 1.21e-07 1.44e-06 (5.99e-06) (7.61e-07) (1.25e-06) (8.84e-07) (0.00e+00) (1.21e-06) (9.36e-06) (4.79e-05) (4.53e-06) (6.85e-06) (5.39e-06) (1.20e-06) (7.00e-06) pressure_up 5.17e-06 -7.30e-06 3.23e-06 4.31e-06 3.22e-06 -1.88e-07 2.33e-06 1.20e-06 -2.45e-06 -1.70e-06 4.80e-06 (3.92e-06) (7.00e-06) (3.20e-06) (3.24e-06) (3.27e-06) (2.79e-06) (2.57e-05) (3.94e-06) (4.46e-06) (3.49e-06) (4.42e-06) pressure_down -2.92e-06 6.13e-07 3.64e-06 1.28e-06 5.27e-06 2.84e-06 -6.76e-07 1.94e-07 -2.67e-07 -5.08e-06 -2.88e-06 0.00e+00 (3.24e-06) (2.60e-06) (4.10e-06) (4.02e-06) (3.55e-06) (5.08e-06) (2.87e-06) (2.59e-05) (4.17e-06) (4.61e-06) (3.57e-06) (0.00e+00) precipit_up -2.17e-05 1.53e-04 5.47e-04 -1.13e-04 -1.02e-05 -5.15e-04 6.61e-04 -2.14e-04 -4.15e-04 2.39e-04 -6.42e-05 7.55e-05 1.41e-04 (1.67e-04) (3.47e-04) (2.08e-04)*** (2.25e-04) (9.19e-05) (3.00e-04)* (6.22e-04) (1.68e-04) (4.35e-04) (1.60e-04) (1.67e-04) (1.85e-04) (3.06e-04) humidity_up 4.30e-05 -8.87e-06 -4.14e-05 3.07e-05 2.13e-05 3.33e-05 -1.98e-05 2.43e-05 -5.26e-06 -6.25e-05 2.66e-05 2.42e-05 3.48e-05 (3.41e-05) (2.44e-05) (3.74e-05) (5.93e-05) (3.77e-05) (4.90e-05) (3.46e-05) (3.82e-05) (9.27e-05) (3.67e-05)* (1.85e-05) (3.13e-05) (1.39e-04) humidity_down 5.07e-05 2.08e-05 -8.90e-05 3.81e-05 3.21e-04 -1.86e-05 0.00e+00 6.44e-05 -1.26e-04 -5.57e-05 2.03e-05 9.22e-05 4.94e-05 (4.57e-05) (2.92e-05) (1.05e-04) (1.01e-04) (2.29e-04) (6.16e-05) (0.00e+00) (4.51e-05) (8.80e-05) (7.60e-05) (2.10e-05) (4.52e-05)** (2.02e-04) temp_up -4.18e-05 -3.43e-05 -3.10e-05 5.59e-05 5.50e-05 5.13e-06 9.20e-05 -5.26e-05 -1.91e-04 -1.73e-04 -1.40e-05 -1.47e-04 6.26e-05 (6.15e-05) (7.46e-05) (9.50e-05) (1.27e-04) (8.04e-05) (1.21e-04) (7.94e-05) (1.38e-04) (1.82e-04) (8.78e-05)** (6.92e-05) (8.42e-05)* (1.60e-04) temp_down 7.79e-05 -2.91e-05 -5.60e-05 7.01e-04 -5.04e-05 1.69e-05 8.97e-05 2.60e-04 -3.36e-05 -1.71e-04 -8.08e-05 -3.44e-05 -5.75e-04 (1.21e-04) (2.77e-04) (8.97e-05) (4.91e-04) (1.26e-04) (1.97e-04) (8.86e-05) (1.95e-04) (2.09e-04) (1.74e-04) (1.35e-04) (1.23e-04) (5.44e-04) visibility_up 1.07e-04 4.43e-05 2.26e-04 -8.71e-06 -4.56e-05 3.24e-05 5.01e-05 -3.52e-07 -9.29e-05 1.31e-04 9.12e-05 (5.19e-05)** (8.69e-05) (8.15e-05)*** (3.29e-04) (6.10e-05) (1.20e-04) (2.17e-04) (8.39e-05) (1.06e-04) (1.02e-04) (1.08e-04) visibility_down -8.16e-08 -1.76e-04 3.16e-04 -7.26e-05 -9.91e-05 -3.76e-04 -3.92e-05 3.37e-03 7.55e-04 -2.42e-04 2.97e-04 7.65e-05 -1.04e-04 (7.70e-05) (2.41e-04) (5.73e-04) (1.48e-04) (8.81e-05) (6.21e-04) (7.84e-05) (3.80e-03) (6.86e-04) (1.61e-04) (2.54e-04) (2.40e-04) (3.95e-04) winter -5.34e-04 -1.87e-03 5.48e-03 3.77e-04 8.08e-04 1.32e-03 -4.45e-03 (1.60e-03) (2.22e-03) (3.72e-03) (2.82e-03) (4.08e-03) (1.80e-03) (2.27e-03)** spring -1.06e-04 1.48e-04 2.24e-03 3.95e-03 2.05e-03 1.42e-03 1.55e-04 1.20e-05 1.92e-03 2.11e-03 9.54e-04 -3.98e-04 1.74e-04 (1.11e-03) (2.03e-03) (1.64e-03) (2.04e-03)* (1.68e-03) (2.60e-03) (1.89e-03) (1.49e-03) (4.14e-03) (2.04e-03) (1.19e-03) (1.69e-03) (2.91e-03) autumn 2.36e-04 4.36e-04 1.57e-03 7.75e-04 5.09e-03 -3.72e-03 7.76e-04 5.24e-05 3.37e-03 2.92e-03 2.29e-04 -4.55e-04 -1.35e-03 (1.27e-03) (1.93e-03) (1.80e-03) (2.14e-03) (1.94e-03)*** (2.85e-03) (1.89e-03) (1.78e-03) (4.14e-03) (1.96e-03) (1.41e-03) (1.86e-03) (3.34e-03) dec 5.00e-04 3.03e-03 6.84e-03 9.32e-04 2.88e-03 -1.06e-03 2.97e-03 1.57e-03 6.33e-03 5.47e-03 2.84e-04 6.12e-03 3.39e-03 (1.52e-03) (2.35e-03) (2.67e-03)** (4.21e-03) (3.39e-03) (4.13e-03) (2.66e-03) (1.60e-03) (5.11e-03) (2.03e-03)*** (1.34e-03) (2.15e-03)*** (3.16e-03) jan 1.49e-04 1.99e-03 6.13e-03 -4.16e-03 2.39e-03 3.46e-03 7.60e-04 2.26e-04 3.15e-03 2.47e-03 5.52e-04 3.94e-03 2.34e-04 (1.74e-03) (2.43e-03) (2.51e-03)** (3.28e-03) (3.78e-03) (4.23e-03) (2.61e-03) (1.43e-03) (4.74e-03) (2.13e-03) (1.38e-03) (2.44e-03) (3.24e-03) Constant 5.96e-04 -3.73e-04 -3.48e-03 2.49e-03 -1.51e-03 -1.09e-03 -5.70e-04 2.86e-04 6.25e-03 5.28e-03 1.44e-03 6.79e-04 -8.63e-03 (1.08e-03) (2.31e-03) (2.06e-03)* (2.25e-03) (1.61e-03) (3.00e-03) (1.84e-03) (4.39e-03) (2.55e-02) (4.23e-03) (4.60e-03) (4.28e-03) (1.20e-02) Observations 1560 1850 832 1044 239 836 971 873 679 829 824 808 345 R-squared 0.01 0.00 0.04 0.02 0.07 0.02 0.02 0.01 0.02 0.03 0.02 0.03 0.02 Notes: * significant at 10%; ** significant at 5%; *** significant at 1% Robust standard errors in parentheses Standard errors in parentheses
27
Table 4. GARCH results.
Dependent Variables, IndexRet, % SAX BET BUX PFTS RTS PX RIGSE SOFIX TALSE VILSE WIG CROBEX wind_up -2.77e-05 -2.00e-04 -3.89e-04 4.41e-04 -8.66e-04 1.39e-04 -7.40e-05 -5.49e-04 -4.21e-06 -1.57e-04 1.54e-05 5.74e-04 (1.53e-04) (1.75e-04) (3.46e-04) (3.56e-04) (5.57e-04) (2.20e-04) (3.62e-04) (5.23e-04) (1.77e-04) (1.91e-04) (1.81e-04) (5.79e-04) wind_down 5.09e-04 -2.53e-04 1.01e-03 -6.31e-04 -8.38e-04 -4.63e-04 -4.67e-04 -1.25e-03 2.39e-05 7.90e-05 (1.59e-03) (4.99e-04) (8.44e-04) (9.59e-04) (5.43e-04) (3.33e-04) (6.05e-04) (7.85e-04) (2.14e-04) (3.63e-04) cloud_up -1.55e-07 -5.73e-07 1.97e-07 -4.06e-07 -4.75e-07 -3.30e-07 5.58e-07 -7.02e-07 4.55e-07 (3.89e-07) (6.36e-07) (6.25e-07) (6.33e-07) (7.97e-07) (5.51e-07) (4.10e-07) (5.37e-07) (7.90e-07) cloud_down -3.12e-06 4.46e-07 -1.41e-06 4.95e-07 -7.62e-07 1.87e-06 -3.19e-06 -3.41e-06 4.95e-06 2.42e-08 1.62e-07 4.92e-06 (3.91e-06) (7.38e-07) (1.25e-06) (9.50e-07) (1.13e-06) (7.66e-06) (6.22e-05) (4.44e-06) (7.64e-06) (6.59e-06) (1.18e-06) (9.21e-06) pressure_down -3.20e-06 9.95e-07 4.07e-06 4.53e-06 3.79e-06 -9.87e-07 -7.30e-07 -8.78e-06 -2.27e-06 -2.40e-06 (2.34e-06) (2.53e-06) (3.99e-06) (3.18e-06) (4.44e-06) (3.53e-06) (3.32e-05) (5.13e-06)* (3.43e-06) (6.90e-06) precipit_up -7.73e-05 -1.10e-04 5.09e-04 1.30e-05 -5.33e-04 7.30e-04 -1.32e-04 -4.53e-04 2.37e-04 3.42e-05 5.95e-05 3.84e-04 (1.51e-04) (3.52e-04) (2.20e-04)** (2.71e-04) (3.23e-04)* (7.60e-04) (2.03e-04) (5.11e-04) (1.85e-04) (1.63e-04) (1.90e-04) (3.17e-04) humidity_up 2.94e-05 -9.39e-06 -4.08e-05 3.35e-05 4.82e-05 -4.55e-05 -1.81e-05 -8.00e-05 -5.29e-05 3.53e-05 2.43e-05 -1.11e-04 (2.31e-05) (2.36e-05) (3.97e-05) (4.50e-05) (4.79e-05) (3.67e-05) (3.76e-05) (8.66e-05) (3.67e-05) (2.44e-05) (4.37e-05) (4.03e-05)***humidity_down 5.07e-05 -1.06e-06 -4.93e-05 5.87e-05 2.56e-05 1.34e-05 -1.78e-04 -7.55e-06 3.36e-05 8.94e-05 -1.96e-04 (3.22e-05) (2.79e-05) (1.19e-04) (7.45e-05) (6.01e-05) (4.30e-05) (7.93e-05)** (8.02e-05) (2.45e-05) (6.40e-05) (5.48e-05)***temp_up -4.91e-05 -8.65e-05 -1.08e-05 1.64e-04 -2.97e-05 3.71e-05 -4.47e-05 -3.82e-04 -1.74e-04 -3.80e-05 -1.26e-04 1.01e-04 (5.40e-05) (7.08e-05) (9.30e-05) (1.03e-04) (1.02e-04) (8.78e-05) (1.04e-04) (1.24e-04)*** (9.02e-05)* (6.45e-05) (8.35e-05) (1.30e-04) temp_down 3.24e-05 -2.67e-04 -6.27e-05 2.14e-03 -2.14e-04 3.07e-05 2.78e-04 -2.67e-04 -1.82e-04 -1.71e-05 -9.73e-06 -8.29e-04 (1.09e-04) (2.30e-04) (8.66e-05) (6.06e-04)*** (1.91e-04) (9.79e-05) (3.83e-04) (1.60e-04)* (2.10e-04) (2.27e-04) (1.22e-04) (6.72e-04) visibility_up 9.26e-05 6.29e-05 2.23e-04 -4.97e-06 -4.69e-05 -5.72e-05 7.06e-05 6.31e-05 -5.06e-05 1.33e-04 4.85e-05 (4.12e-05)** (1.26e-04) (8.57e-05)*** (3.36e-04) (7.10e-05) (1.54e-04) (2.04e-04) (6.86e-05) (1.07e-04) (8.69e-05) (9.30e-05) visibility_down -2.10e-05 -7.37e-05 3.13e-04 -2.58e-04 -8.87e-05 -1.59e-05 1.67e-03 1.29e-03 -1.72e-04 3.02e-04 9.46e-05 -3.19e-04 (6.41e-05) (1.61e-04) (6.14e-04) (1.54e-04)* (6.18e-04) (7.89e-05) (6.15e-03) (5.61e-04)** (1.81e-04) (2.53e-04) (2.30e-04) (3.90e-04) winter -1.95e-04 -1.20e-03 -1.81e-03 6.71e-03 -1.02e-03 1.69e-03 9.35e-04 -1.35e-02 -3.61e-03 1.22e-03 -4.11e-03 2.27e-03 (1.64e-03) (2.09e-03) (2.98e-03) (3.42e-03)** (4.01e-03) (2.34e-03) (4.31e-03) (2.81e-03)*** (2.64e-03) (1.96e-03) (2.92e-03) (4.45e-03) spring 6.64e-05 -1.07e-03 2.67e-03 4.96e-03 4.09e-04 2.29e-03 4.27e-04 -7.01e-03 -1.11e-03 1.07e-03 -1.38e-05 1.05e-03 (1.03e-03) (1.41e-03) (1.66e-03) (1.88e-03)*** (2.14e-03) (1.55e-03) (1.88e-03) (2.41e-03)*** (1.63e-03) (1.03e-03) (1.75e-03) (2.40e-03) autumn 7.54e-04 -9.92e-04 2.01e-03 1.34e-03 -4.87e-03 2.94e-03 2.93e-04 -6.89e-03 -6.64e-04 6.35e-04 -2.10e-04 2.14e-03 (1.10e-03) (1.42e-03) (1.72e-03) (2.09e-03) (2.36e-03)** (1.70e-03)* (1.43e-03) (2.50e-03)*** (1.60e-03) (1.10e-03) (1.91e-03) (2.26e-03) dec 6.40e-04 1.48e-03 6.46e-03 6.53e-03 -7.14e-04 3.49e-03 1.10e-03 7.17e-03 5.41e-03 5.11e-04 6.14e-03 5.92e-03 (1.87e-03) (2.11e-03) (3.16e-03)** (2.79e-03)** (4.06e-03) (2.47e-03) (4.59e-03) (2.95e-03)** (2.60e-03)** (2.14e-03) (3.14e-03)* (4.91e-03) jan -1.92e-04 6.23e-04 6.58e-03 -4.64e-03 2.53e-03 1.25e-03 1.97e-04 2.16e-03 2.28e-03 7.01e-04 3.53e-03 -2.88e-03 (1.58e-03) (1.65e-03) (3.04e-03)** (3.56e-03) (4.42e-03) (2.44e-03) (4.43e-03) (3.17e-03) (2.42e-03) (2.01e-03) (2.74e-03) (3.95e-03) Constant 1.07e-03 2.72e-03 -3.58e-03 5.22e-04 -3.68e-04 -2.03e-03 4.29e-03 2.28e-02 1.56e-02 -2.78e-03 3.03e-04 2.47e-03 (9.70e-04) (2.40e-03) (1.99e-03)* (2.53e-03) (2.77e-03) (1.42e-03) (5.10e-03) (3.20e-02) (6.12e-03)** (2.85e-03) (7.58e-03) (1.31e-01) Observations 1560 1850 832 1044 836 970 873 679 829 824 808 345 Notes: * significant at 10%; ** significant at 5%; *** significant at 1% Robust standard errors in parentheses Standard errors in parentheses
28
A “Holidays effect” is found in Hungary, Estonia, Poland (OLS, GARCH),
Ukraine and Bulgaria (GARCH).
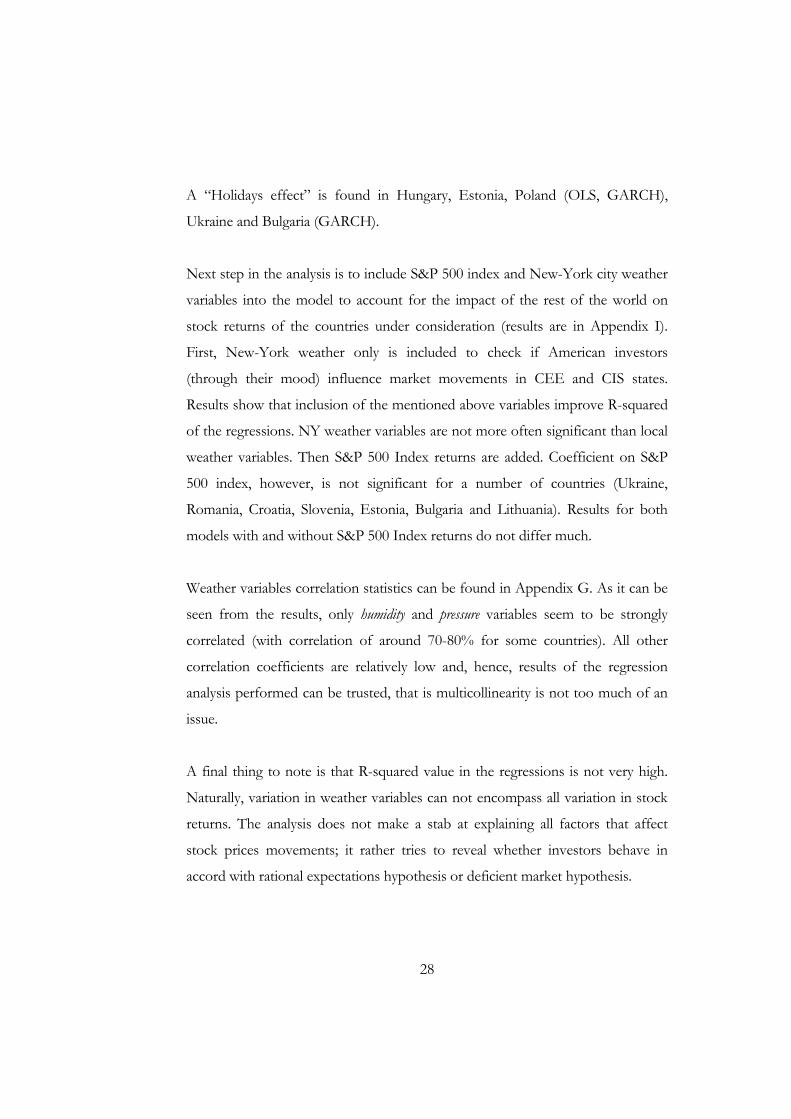
Next step in the analysis is to include S&P 500 index and New-York city weather
variables into the model to account for the impact of the rest of the world on
stock returns of the countries under consideration (results are in Appendix I).
First, New-York weather only is included to check if American investors
(through their mood) influence market movements in CEE and CIS states.
Results show that inclusion of the mentioned above variables improve R-squared
of the regressions. NY weather variables are not more often significant than local
weather variables. Then S&P 500 Index returns are added. Coefficient on S&P
500 index, however, is not significant for a number of countries (Ukraine,
Romania, Croatia, Slovenia, Estonia, Bulgaria and Lithuania). Results for both
models with and without S&P 500 Index returns do not differ much.
Weather variables correlation statistics can be found in Appendix G. As it can be
seen from the results, only humidity and pressure variables seem to be strongly
correlated (with correlation of around 70-80% for some countries). All other
correlation coefficients are relatively low and, hence, results of the regression
analysis performed can be trusted, that is multicollinearity is not too much of an
issue.
A final thing to note is that R-squared value in the regressions is not very high.
Naturally, variation in weather variables can not encompass all variation in stock
returns. The analysis does not make a stab at explaining all factors that affect
stock prices movements; it rather tries to reveal whether investors behave in
accord with rational expectations hypothesis or deficient market hypothesis.
29
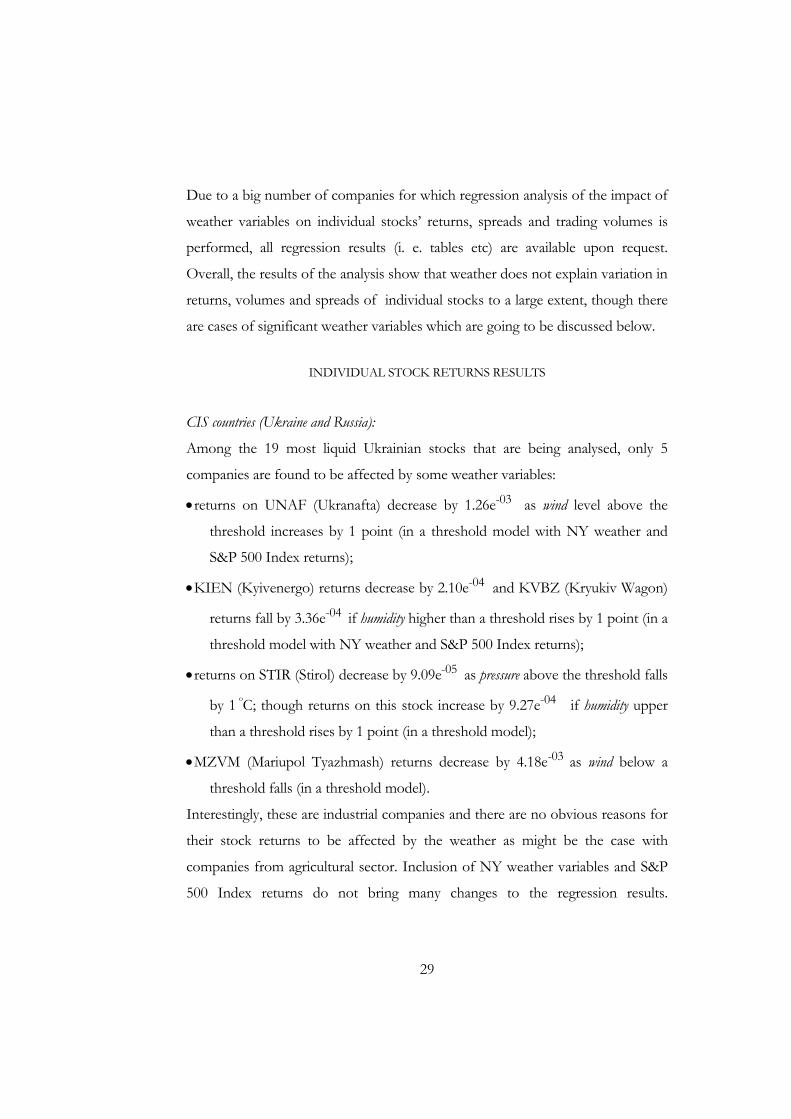
Due to a big number of companies for which regression analysis of the impact of
weather variables on individual stocks’ returns, spreads and trading volumes is
performed, all regression results (i. e. tables etc) are available upon request.
Overall, the results of the analysis show that weather does not explain variation in
returns, volumes and spreads of individual stocks to a large extent, though there
are cases of significant weather variables which are going to be discussed below.
INDIVIDUAL STOCK RETURNS RESULTS
CIS countries (Ukraine and Russia):
Among the 19 most liquid Ukrainian stocks that are being analysed, only 5
companies are found to be affected by some weather variables:
• returns on UNAF (Ukranafta) decrease by 1.26e-03 as wind level above the
threshold increases by 1 point (in a threshold model with NY weather and
S&P 500 Index returns);
• KIEN (Kyivenergo) returns decrease by 2.10e-04 and KVBZ (Kryukiv Wagon)
returns fall by 3.36e-04 if humidity higher than a threshold rises by 1 point (in a
threshold model with NY weather and S&P 500 Index returns);
• returns on STIR (Stirol) decrease by 9.09e-05 as pressure above the threshold falls
by 1 oC; though returns on this stock increase by 9.27e-04 if humidity upper
than a threshold rises by 1 point (in a threshold model);
• MZVM (Mariupol Tyazhmash) returns decrease by 4.18e-03 as wind below a
threshold falls (in a threshold model).
Interestingly, these are industrial companies and there are no obvious reasons for
their stock returns to be affected by the weather as might be the case with
companies from agricultural sector. Inclusion of NY weather variables and S&P
500 Index returns do not bring many changes to the regression results.
30
Coefficient on S&P 500 Index returns is not significant for most of the
companies.
The same story can be found for Russian data. The model that includes NY
weather and S&P 500 Index returns do not have higher R-squared than other
models for most of Russian companies. The Index is not significant for most
companies. The only weather variable that is being significant in both no
threshold and threshold models is pressure. According to the regression results, it
affects most stock returns of Russian companies positively.
Central European companies (Poland, Czech Republic, Slovakia and Hungary):
No effect of weather variables on individual stock returns is found in Slovakia.
Humidity (negatively) and cloud cover (negatively) influence Polish stock returns;
stock returns of Hungarian companies increase with visibility above the threshold;
and returns of Czech companies rise as temperature rises to the value of the
threshold (20 oC).
Threshold model and a model with NY S&P 500 Index returns give almost the
same results concerning significance and signs of the coefficients on weather
variables.
Baltic region companies (Estonia, Latvia and Lithuania):
Temperature higher than corresponding threshold values (3-4 oC) is significant in all
three countries’ regressions. It affects companies’ returns negatively – the hotter it
becomes, the lower returns companies face. This sign of the coefficients can be
explained in the following way: an average yearly temperature in Baltic States is 7-
8 oC; hence, it can be assumed that as temperature increases way above the
threshold, people try to take advantage of the warm weather period and prefer
spending time on the beach than in the office. Hence, “lazy” mood of
31
traders/investors affect stock returns negatively. Precipitation also affects stock
markets of Latvia and Lithuania negatively. The higher the precipitation levels,
the lower the returns of individual stocks in these countries.
Southern European States (Bulgaria, Slovenia and Romania):
Again, as in the case of Baltic countries Southern European States are not
significantly affected by the American market. Probably, stock returns of these
countries are more sensitive to the impact of their EU counterparts. As for the
weather variables influence, the higher the visibility in Bucharest, the higher the
returns on individual stocks are. Slovenian stock market is affected negatively by
the temperature. It is significant for some companies even at 1% level. However, no
effect of weather on stock returns or very small one (for some companies pressure
is marginally significant) is found in Bulgaria.
INDIVIDUAL STOCK SPREADS RESULTS
CIS countries (Ukraine and Russia):
According to regression results, spreads are more sensitive to weather than
returns. Almost all Ukrainian companies under consideration are affected by
certain weather variables as evident from the no threshold model estimation.
Threshold model, however, gives a bit different results: MZVM has the most
weather sensitive spread (it is affected negatively by pressure and humidity, and
positively by temperature); and temperature influences spreads of 7 out of 19
companies being analyzed. As temperature increases by 1 oC, spreads of the
following stocks increase: DNEN (Dniproenergo) by 1.36e-03; PGOK (Poltava
Ore Mining and Processing Plant) by 1.24e-03; USCB (Ukrsotsbank) by 3.99e-02;
and ZAEN (Zahidenergo) by 5.39e-04. As temperature below the threshold falls by
1 oC, spread of MZVM decreases by 2.22e-03; AVDK (Avdiivka Cokery Plant) by
32
2.76e-01; and SMASH (Sumy Frunze Machine Building Plant) by 8.38e-01. A 1 oC
increase in temperature level above the threshold causes spread of PGOK to rise
by 1.10e-03. The largest effect is found for SMASH, AVDK and USCB.
“Holidays effect” has also been detected – dummies on January and December are
significant for the majority of companies in all three models. As in the case with
individual stock returns, S&P 500 Index returns are not significant in case of
spreads regressions. However, NY weather variables impact Ukrainian stock
spreads significantly: temperature and visibility – positively, while pressure and humidity
– negatively.
Russian stock spreads are mostly affected by cloud cover (positively). S&P 500
Index returns are not significant if included while NY weather variables are:
ny_temperature affects Russian companies’ spreads positively and ny_preassure –
negatively. There is a strong evidence of “holidays effect” as well.
Central European companies (Poland, Czech Republic, Slovakia and Hungary):
Hungarian stock spreads are mostly affected negatively by temperature lower than
the threshold being 27 oC. Precipitation impacts spreads of Czech and Slovak
companies positively – the higher the precipitation level, the less liquid companies
become as signalled by the increasing spreads. Visibility affects spreads of Polish
companies negatively.
Baltic region companies (Estonia, Latvia and Lithuania):
Spreads of Estonian companies are affected negatively by visibility in all three
models. New-York weather variables are highly significant: temperature and humidity
both below and above the threshold are significant at 1% level and impact Baltic
33
stock spreads. Baltic States have the same result concerning the “holidays effect”
and S&P 500 Index returns as Central European countries.
Southern European States (Bulgaria, Slovenia, and Romania):
Spreads of Slovenian companies are positively affected by temperature and visibility.
The higher the wind, the lower the spread levels of Romanian companies.
“Holidays effect” has been detected in Romania only. S&P 500 Index returns are
not significant if included.
INDIVIDUAL STOCK TRADING VOLUMES RESULTS
CIS countries (Ukraine and Russia):
In general, results for individual stock trading volumes are very close to those for
returns and spreads. Most weather sensitive Ukrainian companies are MZVM,
STIR, UTEL. Temperature above the threshold affect trading volumes of
Ukrainian companies positively according to the threshold model: trading
volumes of MMKI (Ilyich Iron and Steel Works) rise by 4.87e+03 with a 1 oC
increase in temperature above the threshold, and of USCB by 4.45e+03 (model with
a threshold estimation). Cloud cover below the threshold impacts trading volumes
of Ukrainian stocks negatively according to the model with NY and S&P 500
Index returns; and wind – negatively based on the results of no threshold model.
As for the trading volumes of Russian companies, they are affected negatively by
humidity. Also there is a positive impact of New-York city visibility on Russian
trading volumes.
Central European companies (Poland, Czech Republic, Slovakia and Hungary):
There is a very small effect of weather on trading volumes of Polish and Slovak
companies, no general trend is detected. Both precipitation and cloud cover impact

34
trading volumes of Czech companies negatively; while temperature has a positive
influence on Hungarian trading volumes.
Baltic region companies (Estonia, Latvia and Lithuania):
Trading volumes of Latvian companies seem to be not affected by the weather.
However, in Estonia and Lithuania visibility impacts trading volumes of local
stocks greatly: the better the visibility, the higher the trading volumes.
Southern European States (Bulgaria, Slovenia, and Romania):
It seems to be that trading volumes of Slovenian companies are the most weather
sensitive among other Southern European countries. Precipitation impacts them
negatively while visibility – positively. “Holidays effect” is present as well. In
Romania, trading volumes are affected negatively by both wind and precipitation.
Trading volumes of Bulgarian companies are influenced by the weather slightly
and no general trend can be distinguished.

35
C h a p t e r 6
CONCLUSIONS
This paper tests the relationship between stock market variables (indices returns,
individual stocks’ returns, spreads and trading volumes) and the weather in
transition countries of Central and Eastern Europe and CIS. Weather is
considered to be a proxy for the mood factors that affect decisions of investors
and traders. It is hypothesized that they tend to be more optimistic about the
market prospects if the weather is warm and sunny and are more pessimistic if it
is rainy and cloudy. Hence, market players are more predisposed to buy stocks
when the weather if fine and sell them when the weather is bad.
Three models are implemented to test the relationship under consideration: a
threshold model where there are two values for each weather variable included
into the regression – one contains values of a given variable above the threshold
and the other one includes all values that are below the threshold; no threshold
model; and a threshold model that includes New-York weather variables and
S&P 500 Index returns to test the impact of the rest of the world on stock
markets of transition countries. All three models are estimated using OLS, OLS
with robust option and GARCH techniques.
No effect of weather variables on indices returns is found for Romania, Latvia,
Lithuania (OLS, GARCH); Slovenia, Bulgaria and Croatia (OLS); Czech Republic
and Poland (GARCH). According to OLS estimation, Estonia has the most
weather sensitive stock market; while it is Bulgaria based on GARCH results.
Ukraine, on the contrary, seems to be a weather proof country: only temperature
36
lower than a threshold influences PFTS returns if estimated by GARCH. The size
of this effect is very small: as temperature below the threshold falls by 1 oC, PFTS
returns decrease by 2.14e-03.
Results for individual stocks’ returns, spreads and trading volumes are very
similar. UNAF (Ukranafta), STIR (Stirol), and MZVM (Mariupol Tyazhmash) are
the most weather sensitive stocks in Ukraine. Temperature positively affects not
only PFTS Index returns but also spreads and trading volumes of individual
stocks. The largest effects among those estimated for spreads of Ukrainian
companies are found for AVDK (coefficient on temperature below the threshold is
2.76e-01) and SMASH (coefficient on temperature below the threshold is 8.38e-01).
As temperature above the threshold increases by 1 oC, trading volumes of MMKI
rise by 4.87e+03 and of USCB by 4.45e+03. The difference in the sizes of the
effects for spreads and trading volumes comes from the sizes of dependent
variables themselves: average trading volume of MMKI, for example, is USD
430 567, while AVDK average spread is equal to 0.2.
Temperature affects returns of Czech (positively), Latvian, Lithuanian and
Estonian, and Slovenian (negatively) companies; spreads of Hungarian
(negatively) companies. Cloud cover impacts negatively returns of Polish
companies, spreads of Russian stocks, and trading volumes of Czech firms.
Visibility has a positive influence on stock returns in Hungary and Romania, on
spreads in Ukraine, Poland, Estonia and Slovenia, and on trading volumes in
Estonia, Lithuania and Slovenia. The higher the precipitation, the lower the returns
in Latvia and Lithuania, spreads in Czech Republic and Slovakia, trading volumes
in Czech Republic and Romania. Wind also has a negative effect on returns and
spreads of Ukrainian companies, spreads and trading volumes of Romanian

37
stocks. Trading volumes of Russian firms as well as returns and spreads of
Ukrainian companies are impacted negatively by the increase in humidity levels.
To summarize, while we find some significant effects, the overall impression our
results give is that there is little evidence of a systematic effect of weather on
stock markets in Eastern Europe, and hence, that it is unlikely one could make
money on the stock market from accurate weather forecasts.

38
BIBLIOGRAPHY
O. Al-Khazali, E. Koumanakos, and C. Soo Pyun. 2008. Calendar Anomaly in the Greek stock market: stochastic dominance analysis. International Review Financial Analysis 17: 461-474.
H. Arkes, T. L. Herren, and A. M.
Isen. 1988. The role of potential loss in the influence of effect on risk-taking behaviour. Organisational Behaviour and Human Decision Making Processes. № 42: 181-193.
G. Ashbury, A. Isen, and A. Turken.
1999. A neuropsychological theory of positive effect and its influence on cognition. Psycological Review 106. No. 3: 529-550.
P. A. Bell, T. Greene, J. Fisher, and
A. Baum. 2003. Environmental Psychology. Publisher Belmont, Wadsworth.
S. Bouman, and B. Jacobsen. 2002.
The Halloween indicator, Sell in May and go away: Another puzzle. American Economic Review. Vol. 92 (5): 1618–1635.
M. Cao, and J. Wei. 2005. Stock
Market Returns: A note on temperature anomaly. Journal of Banking and Finance. No. 29: 1559-1573.
K.S. Chan. 1993. Consistency and limiting distribution of the least squares estimator of a threshold autoregressive model, Ann. Stat. 21: 520–533.
S.-C. Chang, S.-S. Chen, R. K. Chou,
and Y.-H. Lin. 2008. Weather and intraday patterns in stock returns and trading activity. Journal of Banking and Finance. Doi: 10.1016/j.jbankfin.2007.12.007.
T. Chang, C.-C. Nieh, M. J. Yang,
and T.-Y. Yang. 2006. Are stock market returns related to the weather effects? Empirical evidence from Taiwan. Physica A. 364: 343-354.
C. Chukwuogor-Ndu. 2006. Stock
Market Returns Analysis, Day-of-the-Week Effect, Volatility of Returns: Evidence from European Financial Markets 1997-2004. International Research Journal of Finance and Economics. Vol. 1.
M. Cunningham. 1979. Weather,
mood and helping behaviour: Quasi-experiment with a sunshine samaritan. Journal of Personality and Social Psychology. No. 37: 1947-1956.
39
M. Dowling, and B. M. Lucey. 2005. Weather, biorhythms, beliefs and stock returns – some preliminary Irish evidence. International Review of Financial Analysis. No. 14: 337-355.
J. M. Eagles. 1994. The relationship
between mood and daily hours of sun light in rapid cycling bipolar illness. Biological Psychiatry 36: 422-424.
R. Engle. 2001. GARCH 101: The
Use of ARCH/GARCH Models in applied Econometrics. Journal of Economic Perspectives. Vol. 15: 157-168.
A. Etzioni. 1988. Normative-affective
factors: Towards a new decision-making model. Journal of Economic Psychology. No. 9(2): 125-150.
E. Fama. 1970. Efficient Capital
Markets: A review of theory and empirical work. Journal of Finance, # 25: 383.
J. Fleming, C. Kirby, and B. Ostdiek.
2004. Information, trading and volatility: evidence from weather-sensitive markets. Working Paper Series. Available at SSRN: http://ssrn.com/abstract=610543.
K. French. 1980. Stock returns and
the weekend effect. Journal of Financial Economics. Vol. 8: 55-70.
L. Herren, H. Arkes, and A. Isen. 1988. The role of potential loss in the influence of affect on risk-taking behaviour. Organisational behaviour and Human Decision Making Processes. No. 42: 181-193.
D. Hirshleifer. 2001. Investor Psychology and Asset Pricing. Journal of Finance, #56: 1533.
D. Hirshleifer, and T. Shumway.
2003. Good Day Sunshine: Stock Returns and the Weather. The Journal of Finance. Vol. LVIII, No. 3: 1009-1032.
E. Howarth, and M. Hoffman. 1984.
A multidimensional approach to the relationship between mood and weather. British Journal of Psychology. No. 75: 15-23.
B. Jacobsen, and W. Marquering.
2008. Is it the weather? Journal of Banking and Finance. No. 32: 526-540.
M. J. Kamstra, L. A. Kramer, and M.
D. Levi. 2003. Winter blues: A sad stock market cycle. American Economic Review. No. 93(1): 324-343.
W. Krämer, and R. Runde. 1997.
Stocks and the weather: An Exercise in Data Mining or Yet Another Capital Market Anomaly? Empirical Economics. No. 22: 637-641.

40
H. Lean, R. Smyth, and W.-K. Wong. 2007. Revisiting calendar anomalies in Asian stock markets using a stochastic dominance approach. Journal of Multinational Financial Management. Vol. 17: 125-141.
A. Lo, and D. Repin. 2001. The
psychology of real-time risk processing. NBER Working Paper Series # 8508.
P. Locke, P. Limpaphayom, and P.
Sarajoti. 2007. Gone with the wind: Chicago’s weather and futures trading. Review of Futures Markets, 16(1).
T. Loughran, and P. Schultz. 2004.
Weather, Stock Returns, and the Impact of Localized Trading Behaviour. Journal of Financial and Quantitative Analysis. Vol. 39, No. 2: 343-364.
T. Mills, C. Siriopoulos, R. Markellos,
and D. Harizanis. 2000. Seasonality in the Athens Stock Exchange. Applied Economics Letters, Vol. 10: 137−142.
F. T. McAndrew. 1993. Environmental
Psychology. A Division of International Thompson Publishing Inc, Brooks/Cole.
A. Pardo, and E. Valor. 2003. Spanish Stock Returns: Rational or Weather-Influenced? Working Papers Series. Available at SSRN: http://ssrn.com/abstract=329140 or DOI: 10.2139/ssrn.329140.
G. Pettengill. 2003. A survey of the
Monday effect literature. Quarterly Journal of Business and Economics, Vol. 42: 3–37.
B. Rind. 1996. Effect of beliefs about
weather conditions on tipping. Journal of Applied Social Psychology. No 26: 137-147.
P. Romer. 2000. Thinking and
Feeling. American Economic review. No. 90(2): 439-443.
E. M. Saunders. 1993. Stock Prices
and Wall Street Weather. The American Economic Review. Vol. 83, No. 5: 1337-1345.
N. Schwarz. 1990. Feelings as
information: informational and motivational functions of affective states. In Higgins and Sorrentino, Handbook of Motivation and Cognition. Vol. 2: 527-561. New-York, Guildford Press.
N. Schwarz, and G. L. Clore. 1983.
Mood, misattribution and judgements of well-being: indirect functions of affective states. Journal of Personality and Social Psychology. Vol 45: 513-523.

41
E. Tufan. 2006. Do cloudy days affect stock exchange returns: evidence from Istanbul Stock Exchange. Journal of Naval Science and Engineering, vol. 2, No. 1: 117-126.
A. Worthington. 2006. Whether the
weather: A comprehensive assessment of climate effects in the Australian stock market. Faculty of Commerce Papers. Available at:
http://works.bepress.com/acworthington/19.
42
APPENDICES
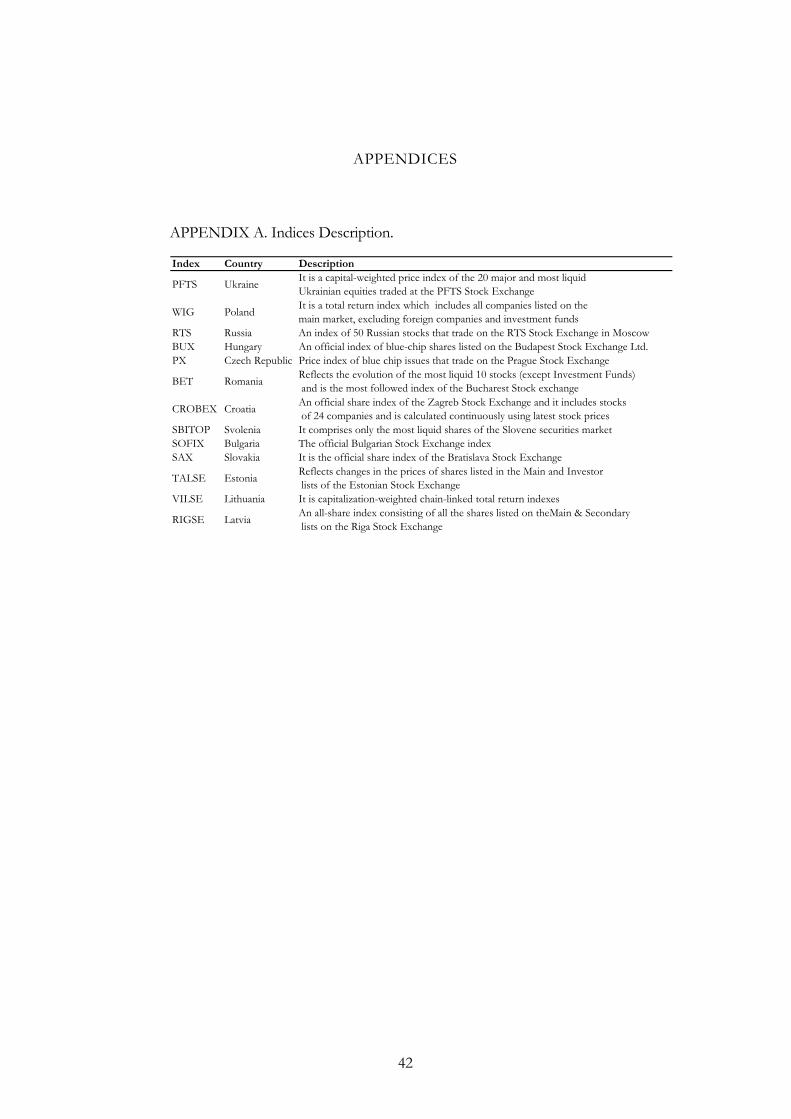
APPENDIX A. Indices Description. Index Country Description
PFTS Ukraine It is a capital-weighted price index of the 20 major and most liquid Ukrainian equities traded at the PFTS Stock Exchange
WIG Poland It is a total return index which includes all companies listed on the main market, excluding foreign companies and investment funds
RTS Russia An index of 50 Russian stocks that trade on the RTS Stock Exchange in MoscowBUX Hungary An official index of blue-chip shares listed on the Budapest Stock Exchange Ltd.PX Czech Republic Price index of blue chip issues that trade on the Prague Stock Exchange
BET Romania Reflects the evolution of the most liquid 10 stocks (except Investment Funds) and is the most followed index of the Bucharest Stock exchange
CROBEX Croatia An official share index of the Zagreb Stock Exchange and it includes stocks of 24 companies and is calculated continuously using latest stock prices
SBITOP Svolenia It comprises only the most liquid shares of the Slovene securities marketSOFIX Bulgaria The official Bulgarian Stock Exchange indexSAX Slovakia It is the official share index of the Bratislava Stock Exchange
TALSE Estonia Reflects changes in the prices of shares listed in the Main and Investor lists of the Estonian Stock Exchange
VILSE Lithuania It is capitalization-weighted chain-linked total return indexes
RIGSE Latvia An all-share index consisting of all the shares listed on theMain & Secondary lists on the Riga Stock Exchange
43
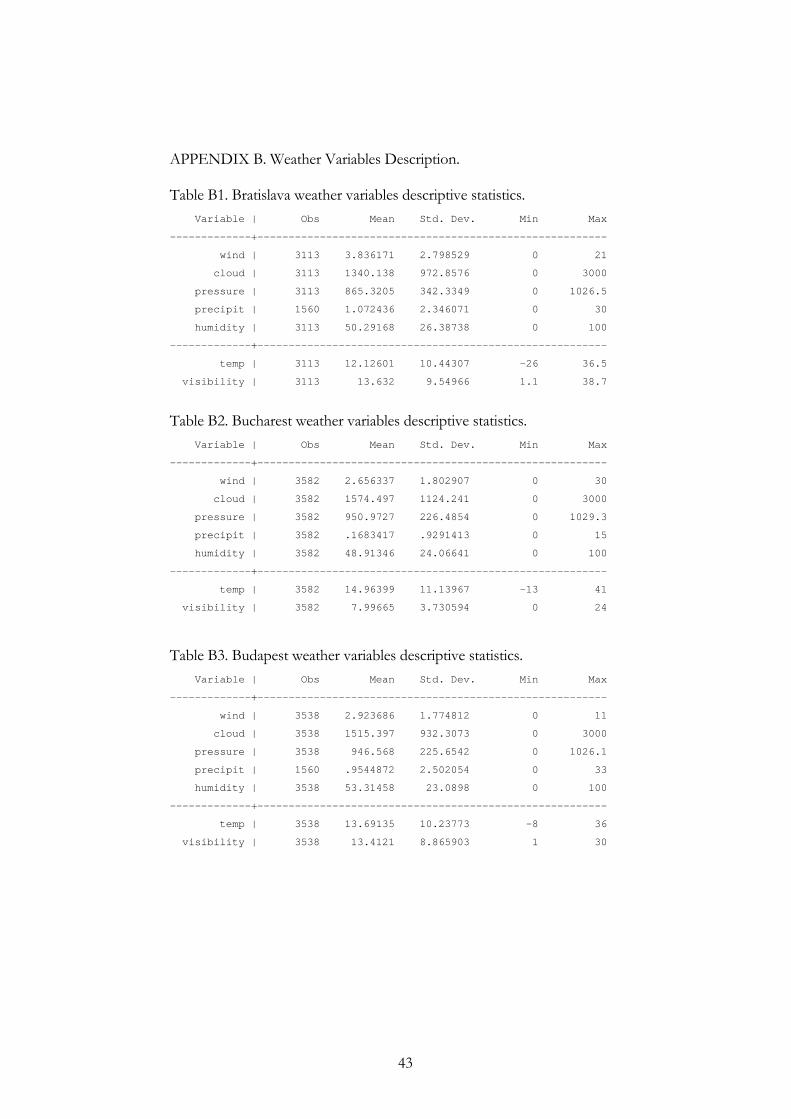
APPENDIX B. Weather Variables Description. Table B1. Bratislava weather variables descriptive statistics. Variable | Obs Mean Std. Dev. Min Max
-------------+--------------------------------------------------------
wind | 3113 3.836171 2.798529 0 21
cloud | 3113 1340.138 972.8576 0 3000
pressure | 3113 865.3205 342.3349 0 1026.5
precipit | 1560 1.072436 2.346071 0 30
humidity | 3113 50.29168 26.38738 0 100
-------------+--------------------------------------------------------
temp | 3113 12.12601 10.44307 -26 36.5
visibility | 3113 13.632 9.54966 1.1 38.7
Table B2. Bucharest weather variables descriptive statistics. Variable | Obs Mean Std. Dev. Min Max
-------------+--------------------------------------------------------
wind | 3582 2.656337 1.802907 0 30
cloud | 3582 1574.497 1124.241 0 3000
pressure | 3582 950.9727 226.4854 0 1029.3
precipit | 3582 .1683417 .9291413 0 15
humidity | 3582 48.91346 24.06641 0 100
-------------+--------------------------------------------------------
temp | 3582 14.96399 11.13967 -13 41
visibility | 3582 7.99665 3.730594 0 24
Table B3. Budapest weather variables descriptive statistics. Variable | Obs Mean Std. Dev. Min Max
-------------+--------------------------------------------------------
wind | 3538 2.923686 1.774812 0 11
cloud | 3538 1515.397 932.3073 0 3000
pressure | 3538 946.568 225.6542 0 1026.1
precipit | 1560 .9544872 2.502054 0 33
humidity | 3538 53.31458 23.0898 0 100
-------------+--------------------------------------------------------
temp | 3538 13.69135 10.23773 -8 36
visibility | 3538 13.4121 8.865903 1 30
44
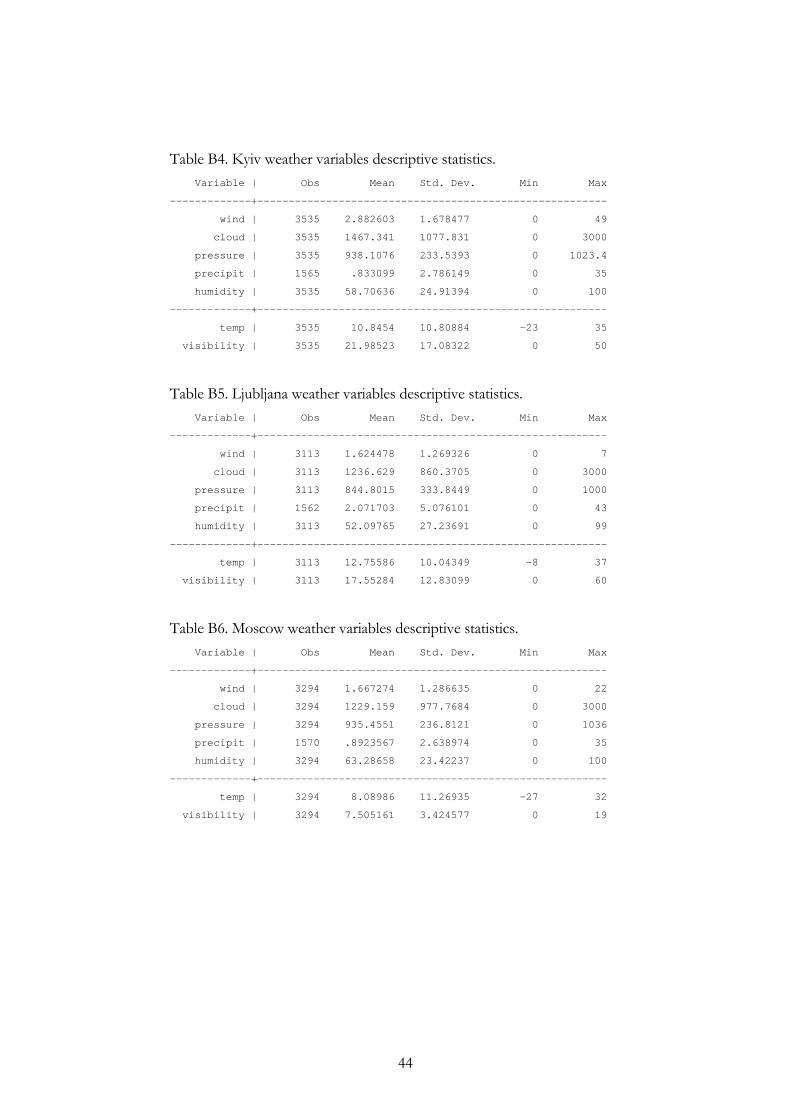
Table B4. Kyiv weather variables descriptive statistics. Variable | Obs Mean Std. Dev. Min Max
-------------+--------------------------------------------------------
wind | 3535 2.882603 1.678477 0 49
cloud | 3535 1467.341 1077.831 0 3000
pressure | 3535 938.1076 233.5393 0 1023.4
precipit | 1565 .833099 2.786149 0 35
humidity | 3535 58.70636 24.91394 0 100
-------------+--------------------------------------------------------
temp | 3535 10.8454 10.80884 -23 35
visibility | 3535 21.98523 17.08322 0 50
Table B5. Ljubljana weather variables descriptive statistics. Variable | Obs Mean Std. Dev. Min Max
-------------+--------------------------------------------------------
wind | 3113 1.624478 1.269326 0 7
cloud | 3113 1236.629 860.3705 0 3000
pressure | 3113 844.8015 333.8449 0 1000
precipit | 1562 2.071703 5.076101 0 43
humidity | 3113 52.09765 27.23691 0 99
-------------+--------------------------------------------------------
temp | 3113 12.75586 10.04349 -8 37
visibility | 3113 17.55284 12.83099 0 60
Table B6. Moscow weather variables descriptive statistics. Variable | Obs Mean Std. Dev. Min Max
-------------+--------------------------------------------------------
wind | 3294 1.667274 1.286635 0 22
cloud | 3294 1229.159 977.7684 0 3000
pressure | 3294 935.4551 236.8121 0 1036
precipit | 1570 .8923567 2.638974 0 35
humidity | 3294 63.28658 23.42237 0 100
-------------+--------------------------------------------------------
temp | 3294 8.08986 11.26935 -27 32
visibility | 3294 7.505161 3.424577 0 19
45
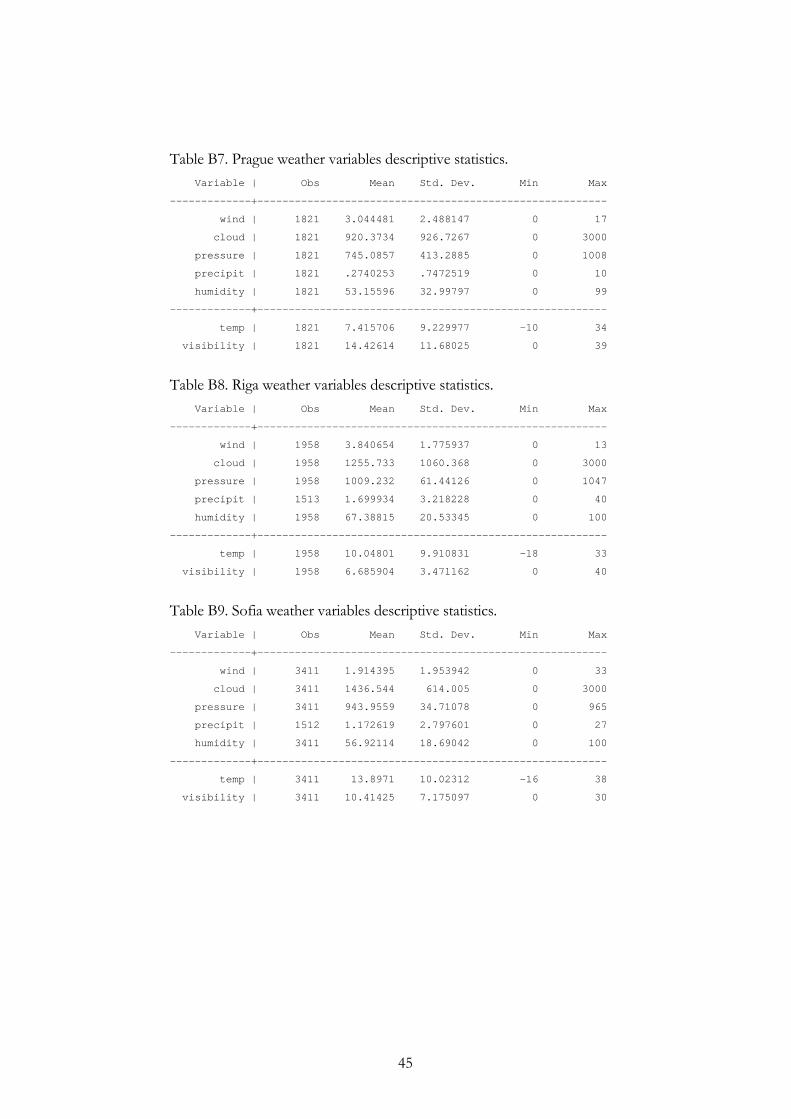
Table B7. Prague weather variables descriptive statistics. Variable | Obs Mean Std. Dev. Min Max
-------------+--------------------------------------------------------
wind | 1821 3.044481 2.488147 0 17
cloud | 1821 920.3734 926.7267 0 3000
pressure | 1821 745.0857 413.2885 0 1008
precipit | 1821 .2740253 .7472519 0 10
humidity | 1821 53.15596 32.99797 0 99
-------------+--------------------------------------------------------
temp | 1821 7.415706 9.229977 -10 34
visibility | 1821 14.42614 11.68025 0 39
Table B8. Riga weather variables descriptive statistics. Variable | Obs Mean Std. Dev. Min Max
-------------+--------------------------------------------------------
wind | 1958 3.840654 1.775937 0 13
cloud | 1958 1255.733 1060.368 0 3000
pressure | 1958 1009.232 61.44126 0 1047
precipit | 1513 1.699934 3.218228 0 40
humidity | 1958 67.38815 20.53345 0 100
-------------+--------------------------------------------------------
temp | 1958 10.04801 9.910831 -18 33
visibility | 1958 6.685904 3.471162 0 40
Table B9. Sofia weather variables descriptive statistics. Variable | Obs Mean Std. Dev. Min Max
-------------+--------------------------------------------------------
wind | 3411 1.914395 1.953942 0 33
cloud | 3411 1436.544 614.005 0 3000
pressure | 3411 943.9559 34.71078 0 965
precipit | 1512 1.172619 2.797601 0 27
humidity | 3411 56.92114 18.69042 0 100
-------------+--------------------------------------------------------
temp | 3411 13.8971 10.02312 -16 38
visibility | 3411 10.41425 7.175097 0 30
46
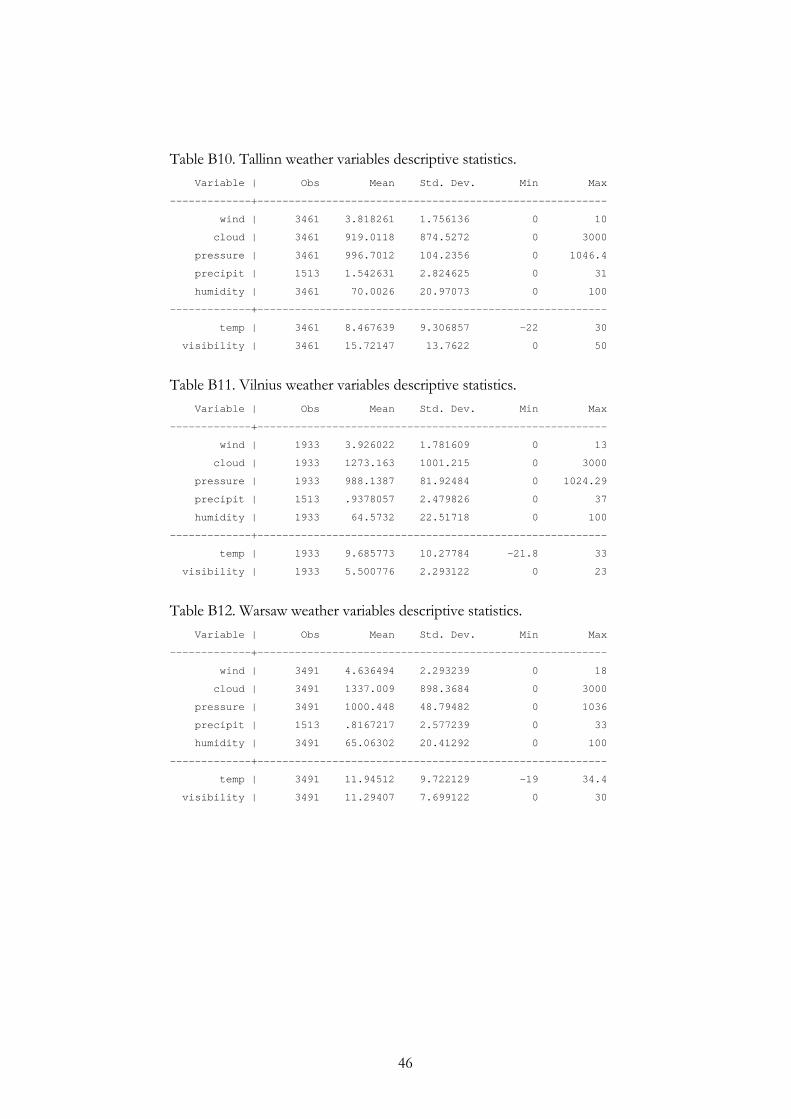
Table B10. Tallinn weather variables descriptive statistics. Variable | Obs Mean Std. Dev. Min Max
-------------+--------------------------------------------------------
wind | 3461 3.818261 1.756136 0 10
cloud | 3461 919.0118 874.5272 0 3000
pressure | 3461 996.7012 104.2356 0 1046.4
precipit | 1513 1.542631 2.824625 0 31
humidity | 3461 70.0026 20.97073 0 100
-------------+--------------------------------------------------------
temp | 3461 8.467639 9.306857 -22 30
visibility | 3461 15.72147 13.7622 0 50
Table B11. Vilnius weather variables descriptive statistics. Variable | Obs Mean Std. Dev. Min Max
-------------+--------------------------------------------------------
wind | 1933 3.926022 1.781609 0 13
cloud | 1933 1273.163 1001.215 0 3000
pressure | 1933 988.1387 81.92484 0 1024.29
precipit | 1513 .9378057 2.479826 0 37
humidity | 1933 64.5732 22.51718 0 100
-------------+--------------------------------------------------------
temp | 1933 9.685773 10.27784 -21.8 33
visibility | 1933 5.500776 2.293122 0 23
Table B12. Warsaw weather variables descriptive statistics. Variable | Obs Mean Std. Dev. Min Max
-------------+--------------------------------------------------------
wind | 3491 4.636494 2.293239 0 18
cloud | 3491 1337.009 898.3684 0 3000
pressure | 3491 1000.448 48.79482 0 1036
precipit | 1513 .8167217 2.577239 0 33
humidity | 3491 65.06302 20.41292 0 100
-------------+--------------------------------------------------------
temp | 3491 11.94512 9.722129 -19 34.4
visibility | 3491 11.29407 7.699122 0 30
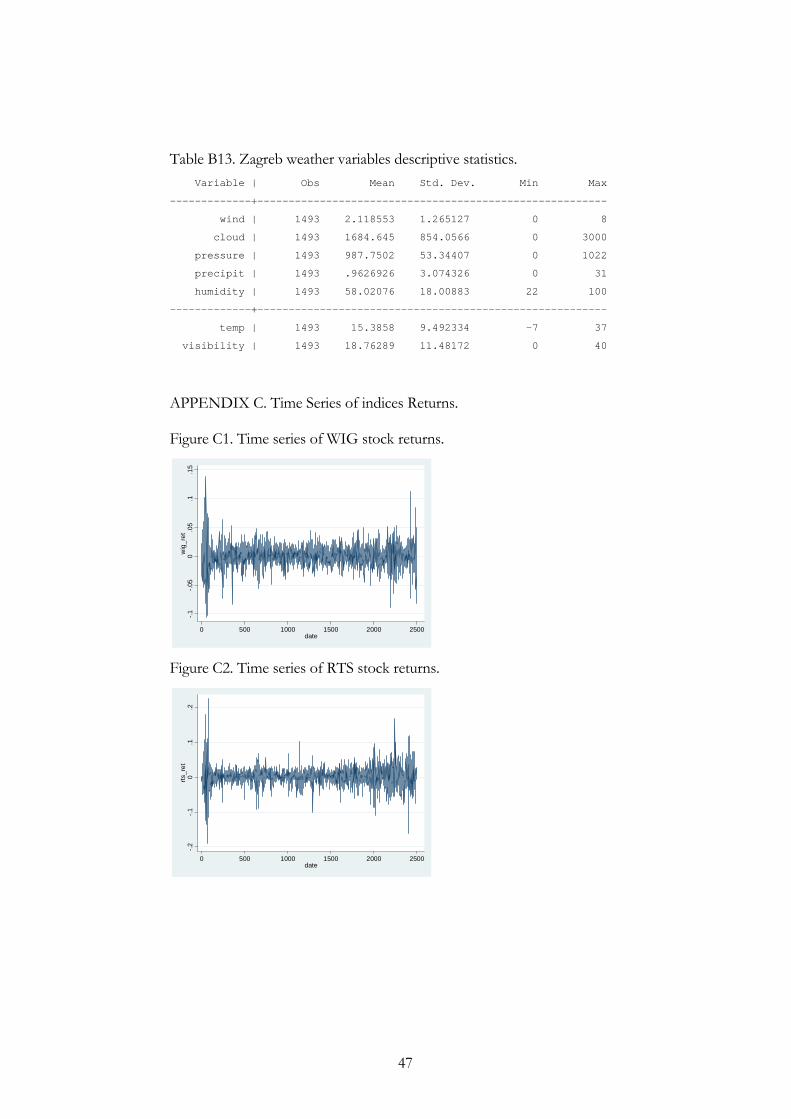
47
Table B13. Zagreb weather variables descriptive statistics. Variable | Obs Mean Std. Dev. Min Max
-------------+--------------------------------------------------------
wind | 1493 2.118553 1.265127 0 8
cloud | 1493 1684.645 854.0566 0 3000
pressure | 1493 987.7502 53.34407 0 1022
precipit | 1493 .9626926 3.074326 0 31
humidity | 1493 58.02076 18.00883 22 100
-------------+--------------------------------------------------------
temp | 1493 15.3858 9.492334 -7 37
visibility | 1493 18.76289 11.48172 0 40
APPENDIX C. Time Series of indices Returns. Figure C1. Time series of WIG stock returns.
-.1-.0
50
.05
.1.1
5w
ig_r
et
0 500 1000 1500 2000 2500date
Figure C2. Time series of RTS stock returns.
-.2-.1
0.1
.2rts
_ret
0 500 1000 1500 2000 2500date
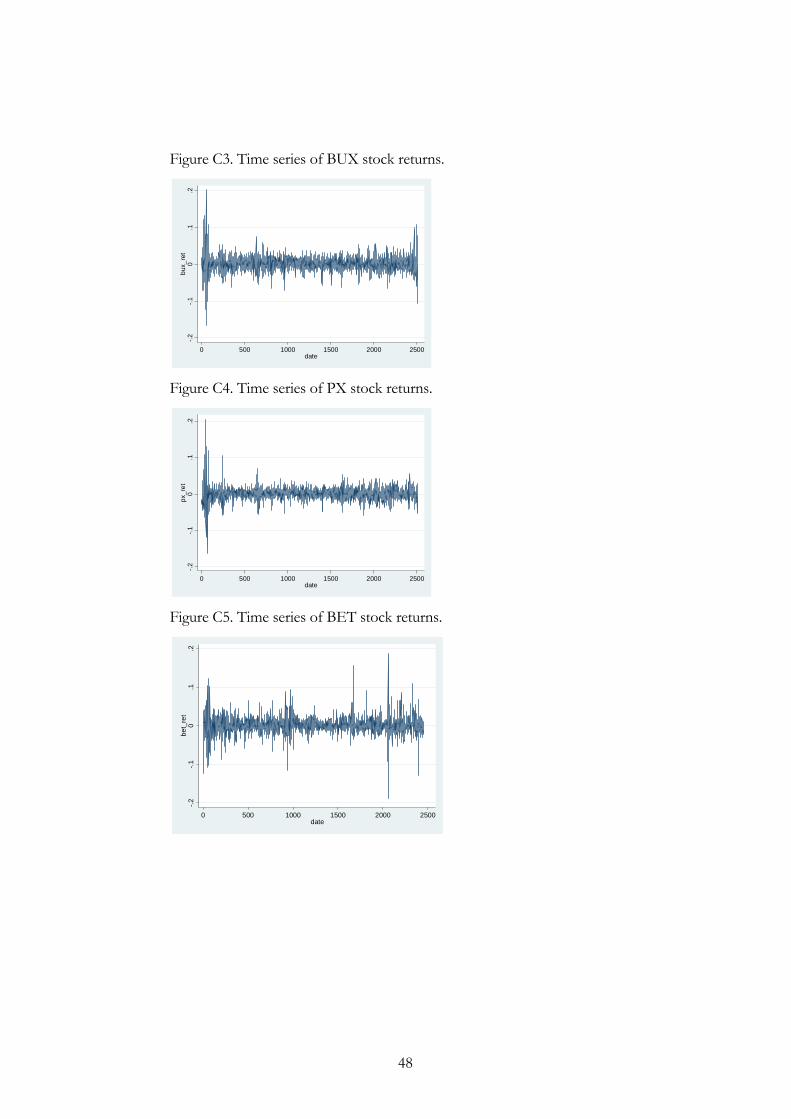
48
Figure C3. Time series of BUX stock returns.
-.2-.1
0.1
.2bu
x_re
t
0 500 1000 1500 2000 2500date
Figure C4. Time series of PX stock returns.
-.2-.1
0.1
.2px
_ret
0 500 1000 1500 2000 2500date
Figure C5. Time series of BET stock returns.
-.2-.1
0.1
.2be
t_re
t
0 500 1000 1500 2000 2500date
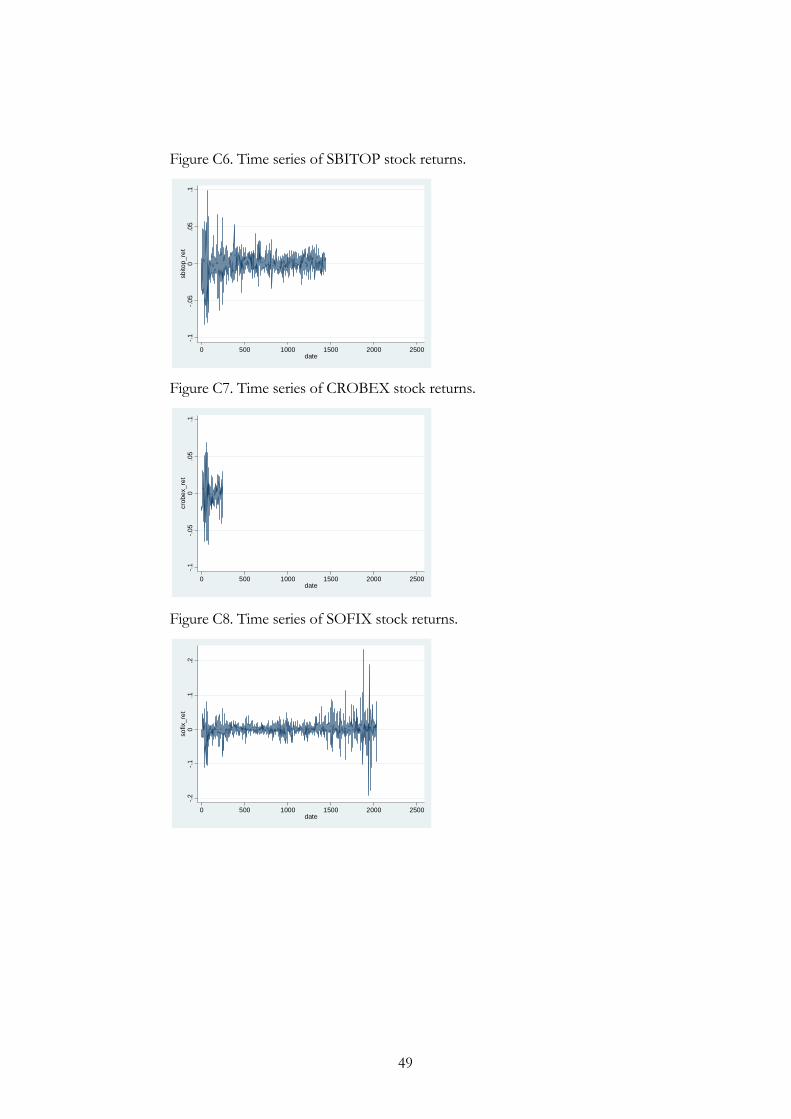
49
Figure C6. Time series of SBITOP stock returns.
-.1-.0
50
.05
.1sb
itop_
ret
0 500 1000 1500 2000 2500date
Figure C7. Time series of CROBEX stock returns.
-.1-.0
50
.05
.1cr
obex
_ret
0 500 1000 1500 2000 2500date
Figure C8. Time series of SOFIX stock returns.
-.2-.1
0.1
.2so
fix_r
et
0 500 1000 1500 2000 2500date
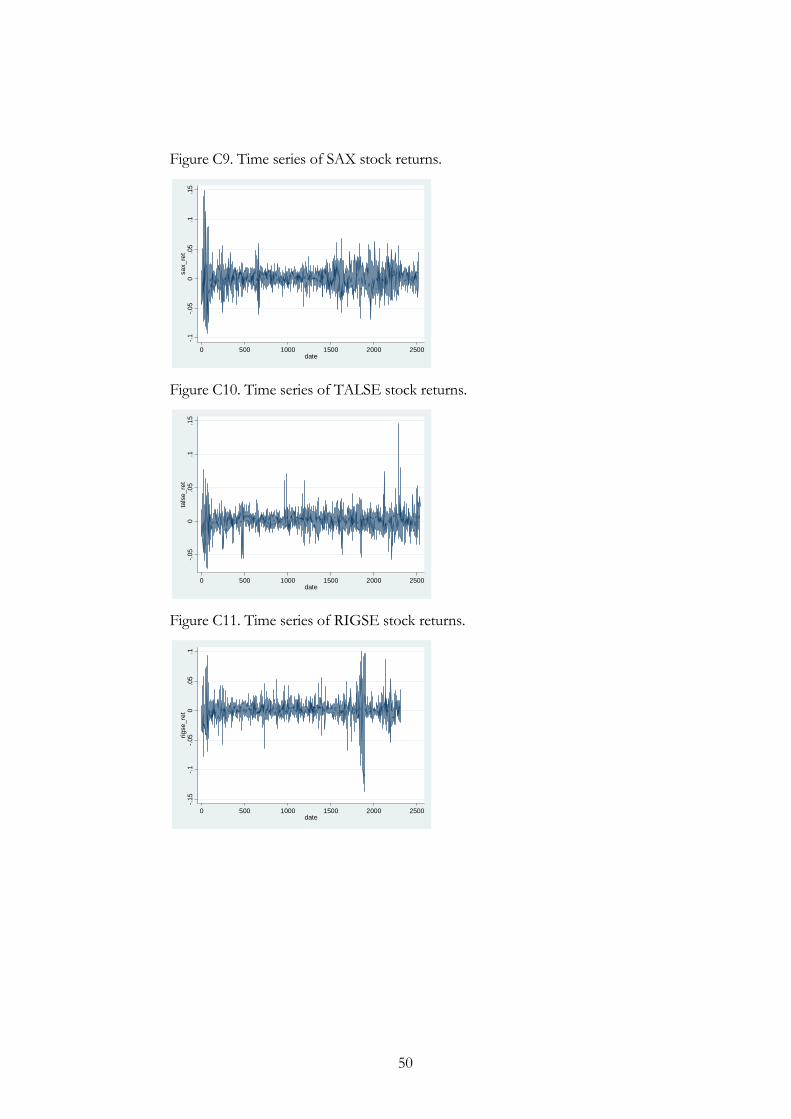
50
Figure C9. Time series of SAX stock returns.
-.1-.0
50
.05
.1.1
5sa
x_re
t
0 500 1000 1500 2000 2500date
Figure C10. Time series of TALSE stock returns.
-.05
0.0
5.1
.15
tals
e_re
t
0 500 1000 1500 2000 2500date
Figure C11. Time series of RIGSE stock returns.
-.15
-.1-.0
50
.05
.1rig
se_r
et
0 500 1000 1500 2000 2500date
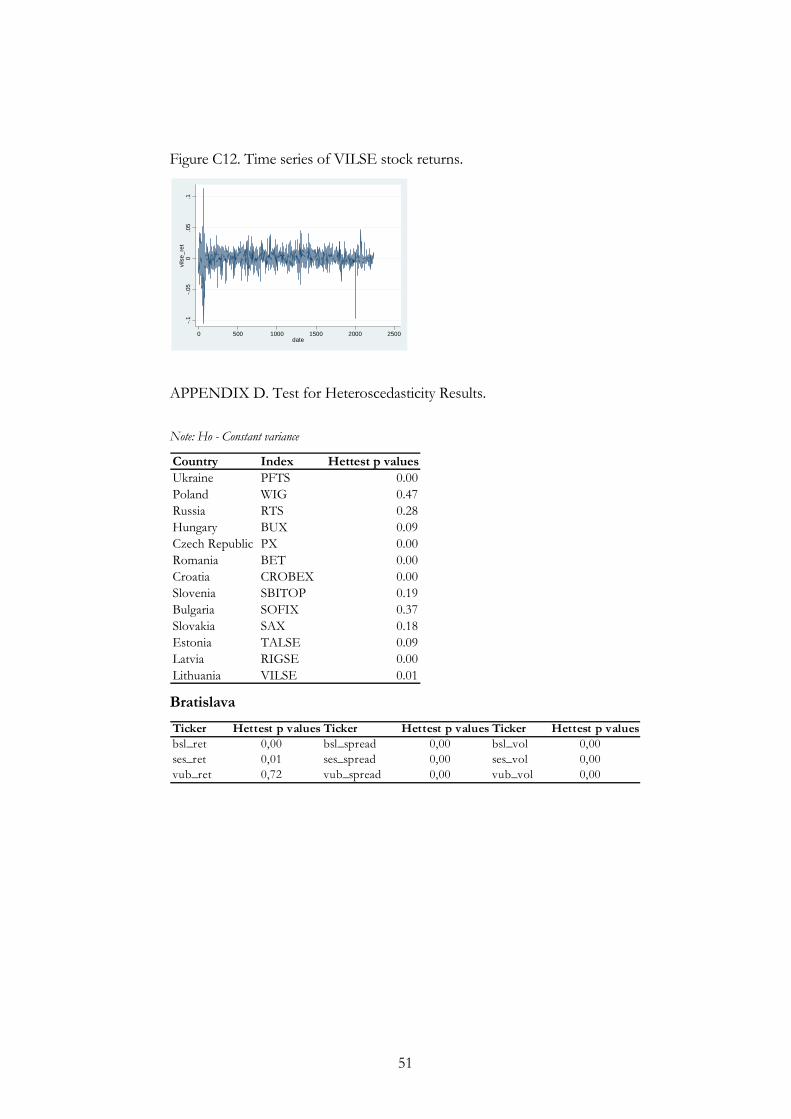
51
Figure C12. Time series of VILSE stock returns. -.1
-.05
0.0
5.1
vils
e_re
t
0 500 1000 1500 2000 2500date
APPENDIX D. Test for Heteroscedasticity Results.
Note: Ho - Constant variance
Country Index Hettest p valuesUkraine PFTS 0.00Poland WIG 0.47Russia RTS 0.28Hungary BUX 0.09Czech Republic PX 0.00Romania BET 0.00Croatia CROBEX 0.00Slovenia SBITOP 0.19Bulgaria SOFIX 0.37Slovakia SAX 0.18Estonia TALSE 0.09Latvia RIGSE 0.00Lithuania VILSE 0.01 Bratislava
Ticker Hettest p values Ticker Hettest p values Ticker Hettest p valuesbsl_ret 0,00 bsl_spread 0,00 bsl_vol 0,00ses_ret 0,01 ses_spread 0,00 ses_vol 0,00vub_ret 0,72 vub_spread 0,00 vub_vol 0,00
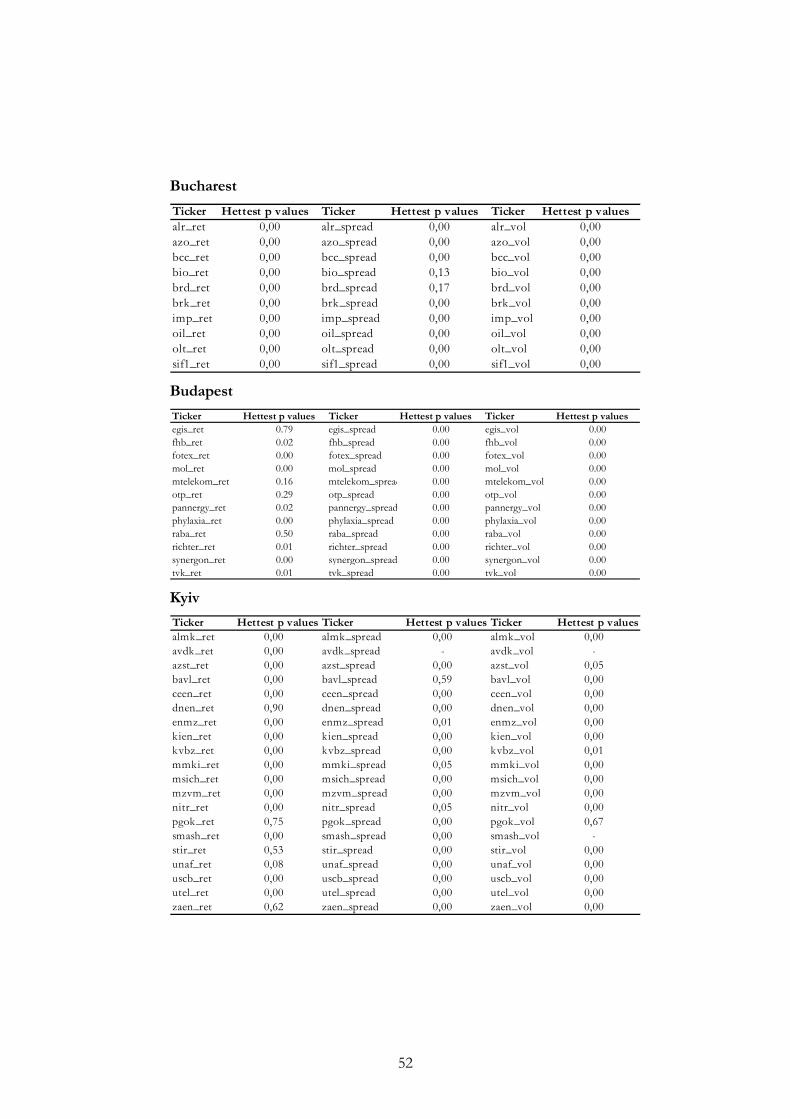
52
Bucharest
Ticker Hettest p values Ticker Hettest p values Ticker Hettest p valuesalr_ret 0,00 alr_spread 0,00 alr_vol 0,00azo_ret 0,00 azo_spread 0,00 azo_vol 0,00bcc_ret 0,00 bcc_spread 0,00 bcc_vol 0,00bio_ret 0,00 bio_spread 0,13 bio_vol 0,00brd_ret 0,00 brd_spread 0,17 brd_vol 0,00brk_ret 0,00 brk_spread 0,00 brk_vol 0,00imp_ret 0,00 imp_spread 0,00 imp_vol 0,00oil_ret 0,00 oil_spread 0,00 oil_vol 0,00olt_ret 0,00 olt_spread 0,00 olt_vol 0,00sif1_ret 0,00 sif1_spread 0,00 sif1_vol 0,00
Budapest
Ticker Hettest p values Ticker Hettest p values Ticker Hettest p valuesegis_ret 0.79 egis_spread 0.00 egis_vol 0.00fhb_ret 0.02 fhb_spread 0.00 fhb_vol 0.00fotex_ret 0.00 fotex_spread 0.00 fotex_vol 0.00mol_ret 0.00 mol_spread 0.00 mol_vol 0.00mtelekom_ret 0.16 mtelekom_spread 0.00 mtelekom_vol 0.00otp_ret 0.29 otp_spread 0.00 otp_vol 0.00pannergy_ret 0.02 pannergy_spread 0.00 pannergy_vol 0.00phylaxia_ret 0.00 phylaxia_spread 0.00 phylaxia_vol 0.00raba_ret 0.50 raba_spread 0.00 raba_vol 0.00richter_ret 0.01 richter_spread 0.00 richter_vol 0.00synergon_ret 0.00 synergon_spread 0.00 synergon_vol 0.00tvk_ret 0.01 tvk_spread 0.00 tvk_vol 0.00 Kyiv
Ticker Hettest p values Ticker Hettest p values Ticker Hettest p valuesalmk_ret 0,00 almk_spread 0,00 almk_vol 0,00avdk_ret 0,00 avdk_spread - avdk_vol -azst_ret 0,00 azst_spread 0,00 azst_vol 0,05bavl_ret 0,00 bavl_spread 0,59 bavl_vol 0,00ceen_ret 0,00 ceen_spread 0,00 ceen_vol 0,00dnen_ret 0,90 dnen_spread 0,00 dnen_vol 0,00enmz_ret 0,00 enmz_spread 0,01 enmz_vol 0,00kien_ret 0,00 kien_spread 0,00 kien_vol 0,00kvbz_ret 0,00 kvbz_spread 0,00 kvbz_vol 0,01mmki_ret 0,00 mmki_spread 0,05 mmki_vol 0,00msich_ret 0,00 msich_spread 0,00 msich_vol 0,00mzvm_ret 0,00 mzvm_spread 0,00 mzvm_vol 0,00nitr_ret 0,00 nitr_spread 0,05 nitr_vol 0,00pgok_ret 0,75 pgok_spread 0,00 pgok_vol 0,67smash_ret 0,00 smash_spread 0,00 smash_vol -stir_ret 0,53 stir_spread 0,00 stir_vol 0,00unaf_ret 0,08 unaf_spread 0,00 unaf_vol 0,00uscb_ret 0,00 uscb_spread 0,00 uscb_vol 0,00utel_ret 0,00 utel_spread 0,00 utel_vol 0,00zaen_ret 0,62 zaen_spread 0,00 zaen_vol 0,00
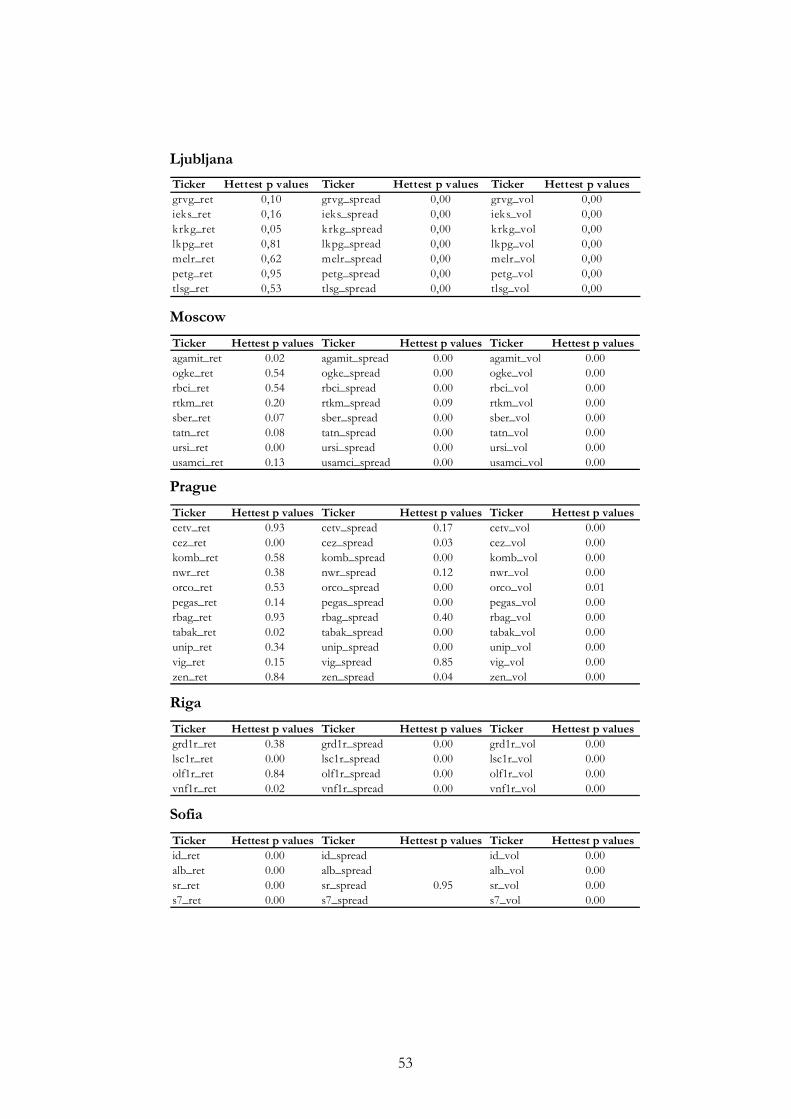
53
Ljubljana
Ticker Hettest p values Ticker Hettest p values Ticker Hettest p valuesgrvg_ret 0,10 grvg_spread 0,00 grvg_vol 0,00ieks_ret 0,16 ieks_spread 0,00 ieks_vol 0,00krkg_ret 0,05 krkg_spread 0,00 krkg_vol 0,00lkpg_ret 0,81 lkpg_spread 0,00 lkpg_vol 0,00melr_ret 0,62 melr_spread 0,00 melr_vol 0,00petg_ret 0,95 petg_spread 0,00 petg_vol 0,00tlsg_ret 0,53 tlsg_spread 0,00 tlsg_vol 0,00 Moscow
Ticker Hettest p values Ticker Hettest p values Ticker Hettest p valuesagamit_ret 0.02 agamit_spread 0.00 agamit_vol 0.00ogke_ret 0.54 ogke_spread 0.00 ogke_vol 0.00rbci_ret 0.54 rbci_spread 0.00 rbci_vol 0.00rtkm_ret 0.20 rtkm_spread 0.09 rtkm_vol 0.00sber_ret 0.07 sber_spread 0.00 sber_vol 0.00tatn_ret 0.08 tatn_spread 0.00 tatn_vol 0.00ursi_ret 0.00 ursi_spread 0.00 ursi_vol 0.00usamci_ret 0.13 usamci_spread 0.00 usamci_vol 0.00
Prague
Ticker Hettest p values Ticker Hettest p values Ticker Hettest p valuescetv_ret 0.93 cetv_spread 0.17 cetv_vol 0.00cez_ret 0.00 cez_spread 0.03 cez_vol 0.00komb_ret 0.58 komb_spread 0.00 komb_vol 0.00nwr_ret 0.38 nwr_spread 0.12 nwr_vol 0.00orco_ret 0.53 orco_spread 0.00 orco_vol 0.01pegas_ret 0.14 pegas_spread 0.00 pegas_vol 0.00rbag_ret 0.93 rbag_spread 0.40 rbag_vol 0.00tabak_ret 0.02 tabak_spread 0.00 tabak_vol 0.00unip_ret 0.34 unip_spread 0.00 unip_vol 0.00vig_ret 0.15 vig_spread 0.85 vig_vol 0.00zen_ret 0.84 zen_spread 0.04 zen_vol 0.00
Riga
Ticker Hettest p values Ticker Hettest p values Ticker Hettest p valuesgrd1r_ret 0.38 grd1r_spread 0.00 grd1r_vol 0.00lsc1r_ret 0.00 lsc1r_spread 0.00 lsc1r_vol 0.00olf1r_ret 0.84 olf1r_spread 0.00 olf1r_vol 0.00vnf1r_ret 0.02 vnf1r_spread 0.00 vnf1r_vol 0.00
Sofia
Ticker Hettest p values Ticker Hettest p values Ticker Hettest p valuesid_ret 0.00 id_spread id_vol 0.00alb_ret 0.00 alb_spread alb_vol 0.00sr_ret 0.00 sr_spread 0.95 sr_vol 0.00s7_ret 0.00 s7_spread s7_vol 0.00
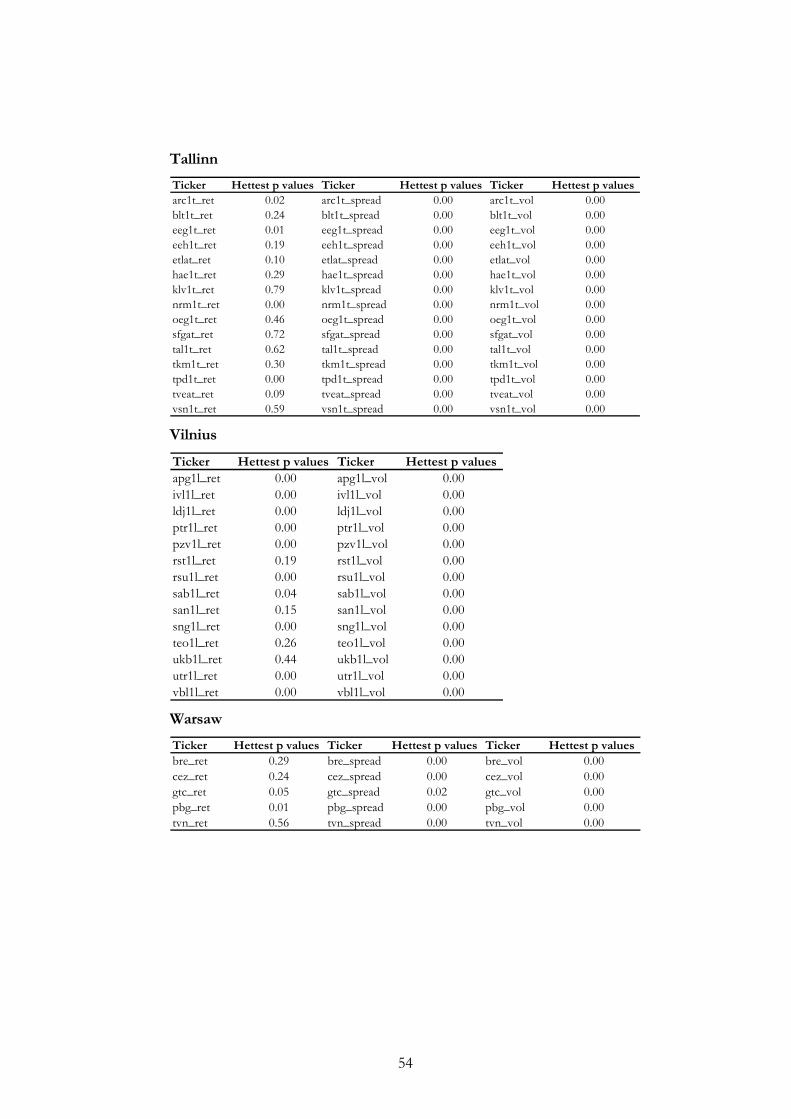
54
Tallinn
Ticker Hettest p values Ticker Hettest p values Ticker Hettest p valuesarc1t_ret 0.02 arc1t_spread 0.00 arc1t_vol 0.00blt1t_ret 0.24 blt1t_spread 0.00 blt1t_vol 0.00eeg1t_ret 0.01 eeg1t_spread 0.00 eeg1t_vol 0.00eeh1t_ret 0.19 eeh1t_spread 0.00 eeh1t_vol 0.00etlat_ret 0.10 etlat_spread 0.00 etlat_vol 0.00hae1t_ret 0.29 hae1t_spread 0.00 hae1t_vol 0.00klv1t_ret 0.79 klv1t_spread 0.00 klv1t_vol 0.00nrm1t_ret 0.00 nrm1t_spread 0.00 nrm1t_vol 0.00oeg1t_ret 0.46 oeg1t_spread 0.00 oeg1t_vol 0.00sfgat_ret 0.72 sfgat_spread 0.00 sfgat_vol 0.00tal1t_ret 0.62 tal1t_spread 0.00 tal1t_vol 0.00tkm1t_ret 0.30 tkm1t_spread 0.00 tkm1t_vol 0.00tpd1t_ret 0.00 tpd1t_spread 0.00 tpd1t_vol 0.00tveat_ret 0.09 tveat_spread 0.00 tveat_vol 0.00vsn1t_ret 0.59 vsn1t_spread 0.00 vsn1t_vol 0.00
Vilnius
Ticker Hettest p values Ticker Hettest p valuesapg1l_ret 0.00 apg1l_vol 0.00ivl1l_ret 0.00 ivl1l_vol 0.00ldj1l_ret 0.00 ldj1l_vol 0.00ptr1l_ret 0.00 ptr1l_vol 0.00pzv1l_ret 0.00 pzv1l_vol 0.00rst1l_ret 0.19 rst1l_vol 0.00rsu1l_ret 0.00 rsu1l_vol 0.00sab1l_ret 0.04 sab1l_vol 0.00san1l_ret 0.15 san1l_vol 0.00sng1l_ret 0.00 sng1l_vol 0.00teo1l_ret 0.26 teo1l_vol 0.00ukb1l_ret 0.44 ukb1l_vol 0.00utr1l_ret 0.00 utr1l_vol 0.00vbl1l_ret 0.00 vbl1l_vol 0.00
Warsaw
Ticker Hettest p values Ticker Hettest p values Ticker Hettest p valuesbre_ret 0.29 bre_spread 0.00 bre_vol 0.00cez_ret 0.24 cez_spread 0.00 cez_vol 0.00gtc_ret 0.05 gtc_spread 0.02 gtc_vol 0.00pbg_ret 0.01 pbg_spread 0.00 pbg_vol 0.00tvn_ret 0.56 tvn_spread 0.00 tvn_vol 0.00
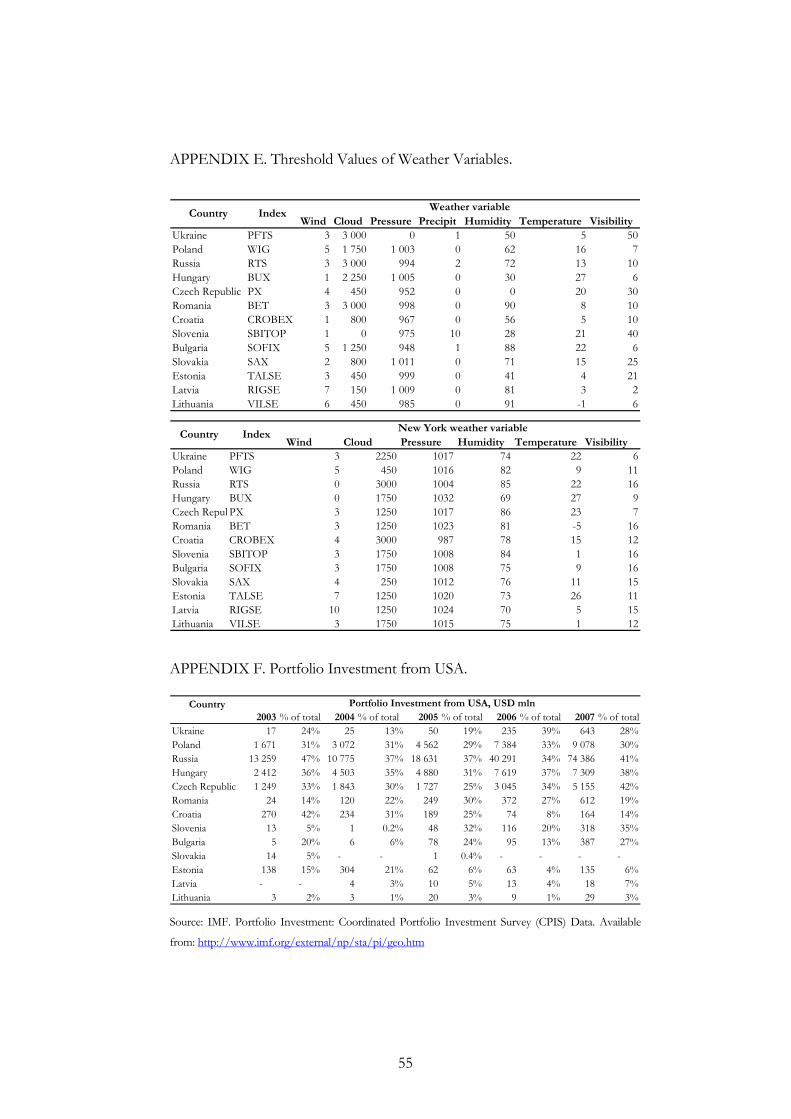
55
APPENDIX E. Threshold Values of Weather Variables.
Wind Cloud Pressure Precipit Humidity Temperature VisibilityUkraine PFTS 3 3 000 0 1 50 5 50Poland WIG 5 1 750 1 003 0 62 16 7Russia RTS 3 3 000 994 2 72 13 10Hungary BUX 1 2 250 1 005 0 30 27 6Czech Republic PX 4 450 952 0 0 20 30Romania BET 3 3 000 998 0 90 8 10Croatia CROBEX 1 800 967 0 56 5 10Slovenia SBITOP 1 0 975 10 28 21 40Bulgaria SOFIX 5 1 250 948 1 88 22 6Slovakia SAX 2 800 1 011 0 71 15 25Estonia TALSE 3 450 999 0 41 4 21Latvia RIGSE 7 150 1 009 0 81 3 2Lithuania VILSE 6 450 985 0 91 -1 6
IndexCountryWeather variable
Wind Cloud Pressure Humidity Temperature VisibilityUkraine PFTS 3 2250 1017 74 22 6Poland WIG 5 450 1016 82 9 11Russia RTS 0 3000 1004 85 22 16Hungary BUX 0 1750 1032 69 27 9Czech RepubPX 3 1250 1017 86 23 7Romania BET 3 1250 1023 81 -5 16Croatia CROBEX 4 3000 987 78 15 12Slovenia SBITOP 3 1750 1008 84 1 16Bulgaria SOFIX 3 1750 1008 75 9 16Slovakia SAX 4 250 1012 76 11 15Estonia TALSE 7 1250 1020 73 26 11Latvia RIGSE 10 1250 1024 70 5 15Lithuania VILSE 3 1750 1015 75 1 12
Country IndexNew York weather variable
APPENDIX F. Portfolio Investment from USA.
2003 % of total 2004 % of total 2005 % of total 2006 % of total 2007 % of totalUkraine 17 24% 25 13% 50 19% 235 39% 643 28%Poland 1 671 31% 3 072 31% 4 562 29% 7 384 33% 9 078 30%Russia 13 259 47% 10 775 37% 18 631 37% 40 291 34% 74 386 41%Hungary 2 412 36% 4 503 35% 4 880 31% 7 619 37% 7 309 38%Czech Republic 1 249 33% 1 843 30% 1 727 25% 3 045 34% 5 155 42%Romania 24 14% 120 22% 249 30% 372 27% 612 19%Croatia 270 42% 234 31% 189 25% 74 8% 164 14%Slovenia 13 5% 1 0.2% 48 32% 116 20% 318 35%Bulgaria 5 20% 6 6% 78 24% 95 13% 387 27%Slovakia 14 5% - - 1 0.4% - - - -Estonia 138 15% 304 21% 62 6% 63 4% 135 6%Latvia - - 4 3% 10 5% 13 4% 18 7%Lithuania 3 2% 3 1% 20 3% 9 1% 29 3%
Country Portfolio Investment from USA, USD mln
Source: IMF. Portfolio Investment: Coordinated Portfolio Investment Survey (CPIS) Data. Available
from: http://www.imf.org/external/np/sta/pi/geo.htm
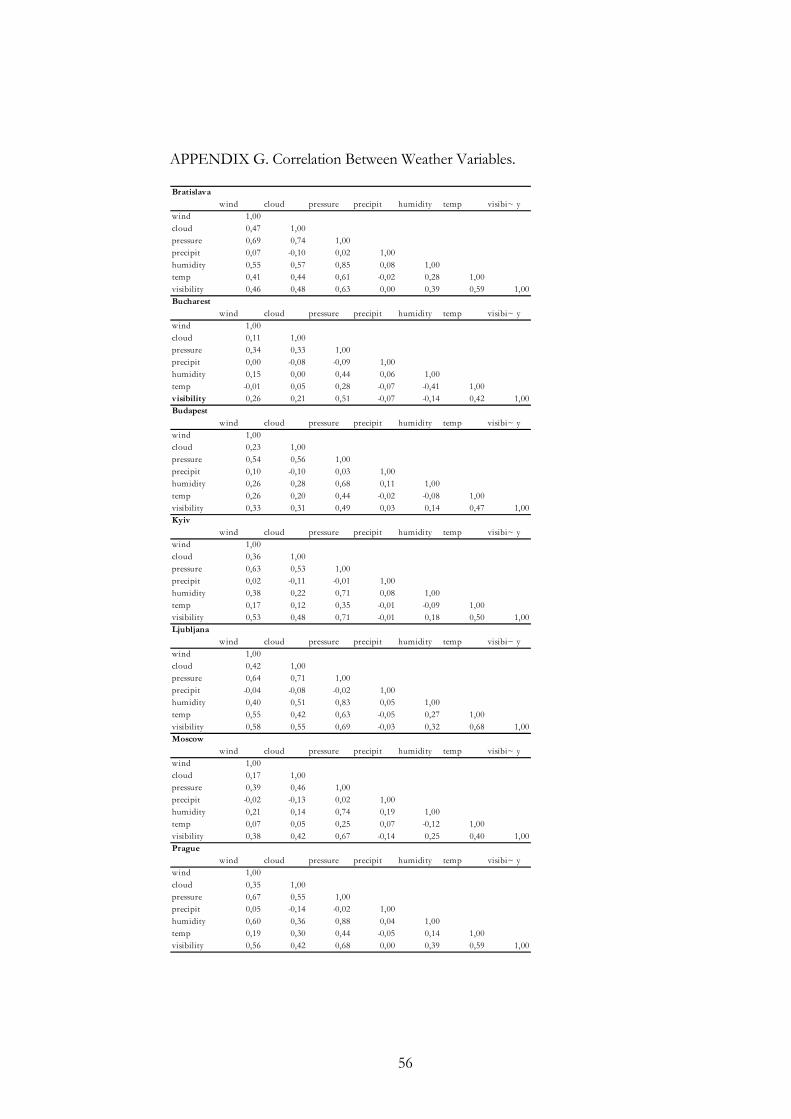
56
APPENDIX G. Correlation Between Weather Variables. Bratislava
wind cloud pressure precipit humidity temp visibi~ ywind 1,00cloud 0,47 1,00pressure 0,69 0,74 1,00precipit 0,07 -0,10 0,02 1,00humidity 0,55 0,57 0,85 0,08 1,00temp 0,41 0,44 0,61 -0,02 0,28 1,00visibility 0,46 0,48 0,63 0,00 0,39 0,59 1,00Bucharest
wind cloud pressure precipit humidity temp visibi~ ywind 1,00cloud 0,11 1,00pressure 0,34 0,33 1,00precipit 0,00 -0,08 -0,09 1,00humidity 0,15 0,00 0,44 0,06 1,00temp -0,01 0,05 0,28 -0,07 -0,41 1,00visibility 0,26 0,21 0,51 -0,07 -0,14 0,42 1,00Budapest
wind cloud pressure precipit humidity temp visibi~ ywind 1,00cloud 0,23 1,00pressure 0,54 0,56 1,00precipit 0,10 -0,10 0,03 1,00humidity 0,26 0,28 0,68 0,11 1,00temp 0,26 0,20 0,44 -0,02 -0,08 1,00visibility 0,33 0,31 0,49 0,03 0,14 0,47 1,00Kyiv
wind cloud pressure precipit humidity temp visibi~ ywind 1,00cloud 0,36 1,00pressure 0,63 0,53 1,00precipit 0,02 -0,11 -0,01 1,00humidity 0,38 0,22 0,71 0,08 1,00temp 0,17 0,12 0,35 -0,01 -0,09 1,00visibility 0,53 0,48 0,71 -0,01 0,18 0,50 1,00Ljubljana
wind cloud pressure precipit humidity temp visibi~ ywind 1,00cloud 0,42 1,00pressure 0,64 0,71 1,00precipit -0,04 -0,08 -0,02 1,00humidity 0,40 0,51 0,83 0,05 1,00temp 0,55 0,42 0,63 -0,05 0,27 1,00visibility 0,58 0,55 0,69 -0,03 0,32 0,68 1,00Moscow
wind cloud pressure precipit humidity temp visibi~ ywind 1,00cloud 0,17 1,00pressure 0,39 0,46 1,00precipit -0,02 -0,13 0,02 1,00humidity 0,21 0,14 0,74 0,19 1,00temp 0,07 0,05 0,25 0,07 -0,12 1,00visibility 0,38 0,42 0,67 -0,14 0,25 0,40 1,00Prague
wind cloud pressure precipit humidity temp visibi~ ywind 1,00cloud 0,35 1,00pressure 0,67 0,55 1,00precipit 0,05 -0,14 -0,02 1,00humidity 0,60 0,36 0,88 0,04 1,00temp 0,19 0,30 0,44 -0,05 0,14 1,00visibility 0,56 0,42 0,68 0,00 0,39 0,59 1,00
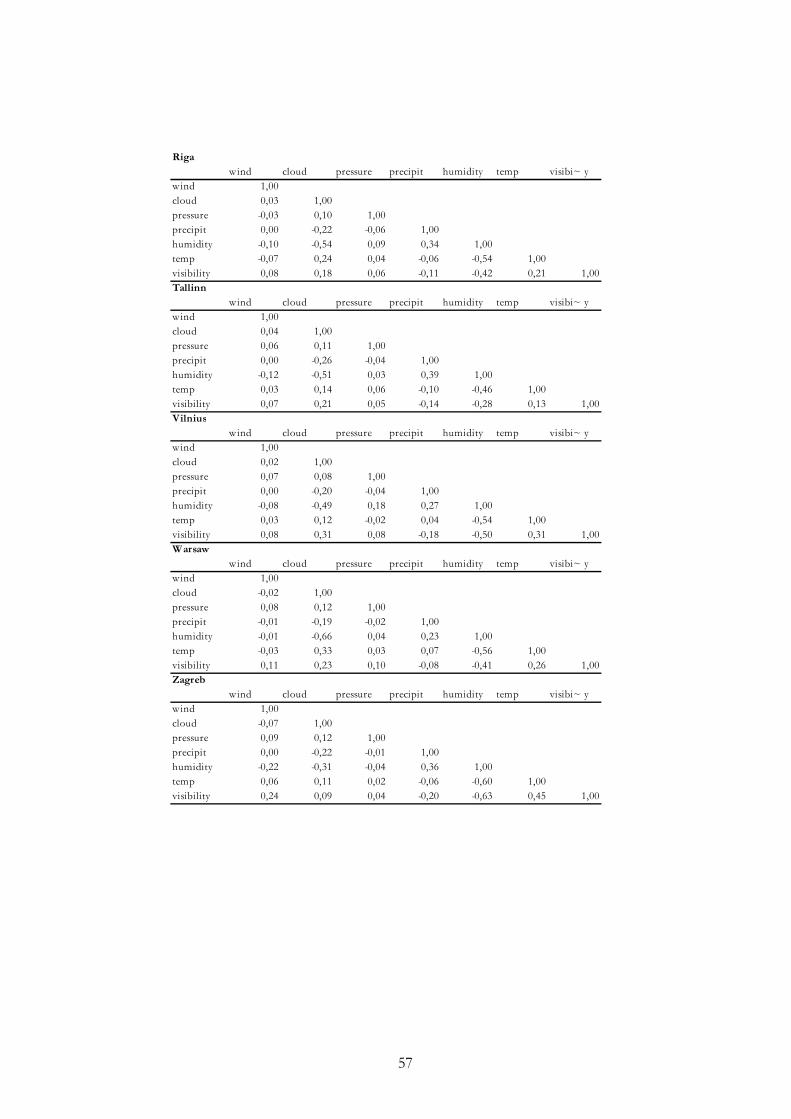
57
Rigawind cloud pressure precipit humidity temp visibi~ y
wind 1,00cloud 0,03 1,00pressure -0,03 0,10 1,00precipit 0,00 -0,22 -0,06 1,00humidity -0,10 -0,54 0,09 0,34 1,00temp -0,07 0,24 0,04 -0,06 -0,54 1,00visibility 0,08 0,18 0,06 -0,11 -0,42 0,21 1,00Tallinn
wind cloud pressure precipit humidity temp visibi~ ywind 1,00cloud 0,04 1,00pressure 0,06 0,11 1,00precipit 0,00 -0,26 -0,04 1,00humidity -0,12 -0,51 0,03 0,39 1,00temp 0,03 0,14 0,06 -0,10 -0,46 1,00visibility 0,07 0,21 0,05 -0,14 -0,28 0,13 1,00Vilnius
wind cloud pressure precipit humidity temp visibi~ ywind 1,00cloud 0,02 1,00pressure 0,07 0,08 1,00precipit 0,00 -0,20 -0,04 1,00humidity -0,08 -0,49 0,18 0,27 1,00temp 0,03 0,12 -0,02 0,04 -0,54 1,00visibility 0,08 0,31 0,08 -0,18 -0,50 0,31 1,00Warsaw
wind cloud pressure precipit humidity temp visibi~ ywind 1,00cloud -0,02 1,00pressure 0,08 0,12 1,00precipit -0,01 -0,19 -0,02 1,00humidity -0,01 -0,66 0,04 0,23 1,00temp -0,03 0,33 0,03 0,07 -0,56 1,00visibility 0,11 0,23 0,10 -0,08 -0,41 0,26 1,00Zagreb
wind cloud pressure precipit humidity temp visibi~ ywind 1,00cloud -0,07 1,00pressure 0,09 0,12 1,00precipit 0,00 -0,22 -0,01 1,00humidity -0,22 -0,31 -0,04 0,36 1,00temp 0,06 0,11 0,02 -0,06 -0,60 1,00visibility 0,24 0,09 0,04 -0,20 -0,63 0,45 1,00
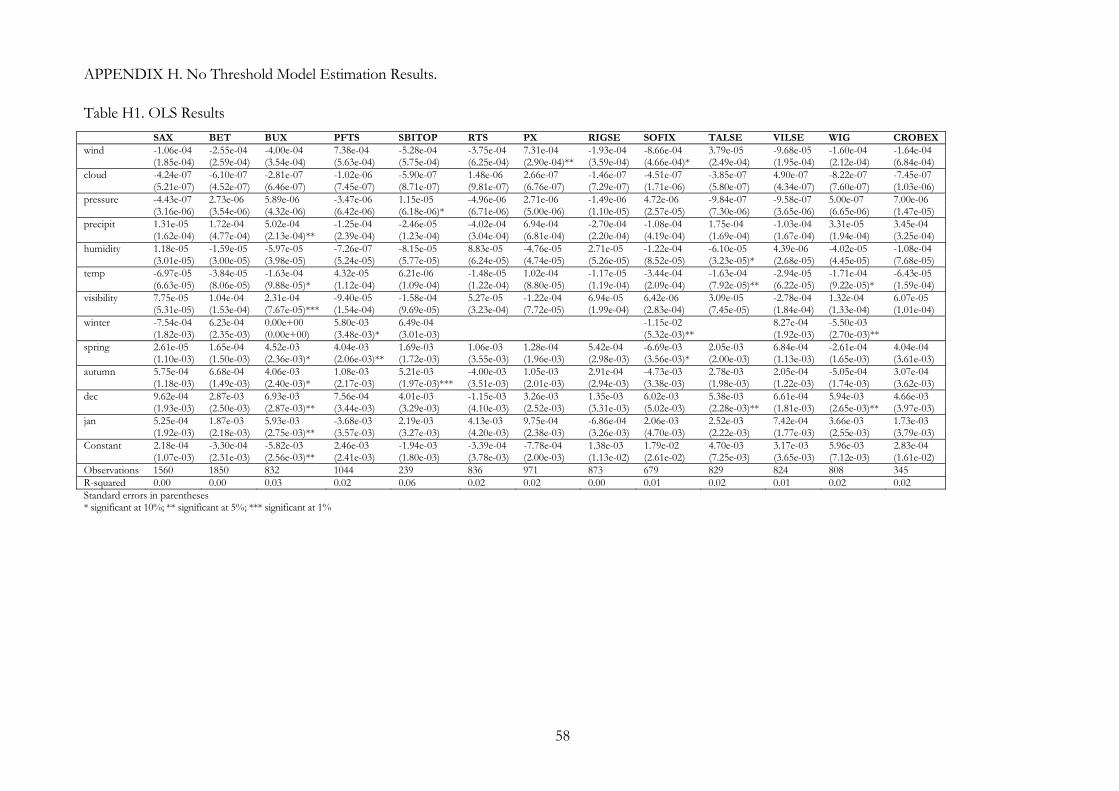
58
APPENDIX H. No Threshold Model Estimation Results. Table H1. OLS Results SAX BET BUX PFTS SBITOP RTS PX RIGSE SOFIX TALSE VILSE WIG CROBEXwind -1.06e-04 -2.55e-04 -4.00e-04 7.38e-04 -5.28e-04 -3.75e-04 7.31e-04 -1.93e-04 -8.66e-04 3.79e-05 -9.68e-05 -1.60e-04 -1.64e-04 (1.85e-04) (2.59e-04) (3.54e-04) (5.63e-04) (5.75e-04) (6.25e-04) (2.90e-04)** (3.59e-04) (4.66e-04)* (2.49e-04) (1.95e-04) (2.12e-04) (6.84e-04) cloud -4.24e-07 -6.10e-07 -2.81e-07 -1.02e-06 -5.90e-07 1.48e-06 2.66e-07 -1.46e-07 -4.51e-07 -3.85e-07 4.90e-07 -8.22e-07 -7.45e-07 (5.21e-07) (4.52e-07) (6.46e-07) (7.45e-07) (8.71e-07) (9.81e-07) (6.76e-07) (7.29e-07) (1.71e-06) (5.80e-07) (4.34e-07) (7.60e-07) (1.03e-06) pressure -4.43e-07 2.73e-06 5.89e-06 -3.47e-06 1.15e-05 -4.96e-06 2.71e-06 -1.49e-06 4.72e-06 -9.84e-07 -9.58e-07 5.00e-07 7.00e-06 (3.16e-06) (3.54e-06) (4.32e-06) (6.42e-06) (6.18e-06)* (6.71e-06) (5.00e-06) (1.10e-05) (2.57e-05) (7.30e-06) (3.65e-06) (6.65e-06) (1.47e-05) precipit 1.31e-05 1.72e-04 5.02e-04 -1.25e-04 -2.46e-05 -4.02e-04 6.94e-04 -2.70e-04 -1.08e-04 1.75e-04 -1.03e-04 3.31e-05 3.45e-04 (1.62e-04) (4.77e-04) (2.13e-04)** (2.39e-04) (1.23e-04) (3.04e-04) (6.81e-04) (2.20e-04) (4.19e-04) (1.69e-04) (1.67e-04) (1.94e-04) (3.25e-04) humidity 1.18e-05 -1.59e-05 -5.97e-05 -7.26e-07 -8.15e-05 8.83e-05 -4.76e-05 2.71e-05 -1.22e-04 -6.10e-05 4.39e-06 -4.02e-05 -1.08e-04 (3.01e-05) (3.00e-05) (3.98e-05) (5.24e-05) (5.77e-05) (6.24e-05) (4.74e-05) (5.26e-05) (8.52e-05) (3.23e-05)* (2.68e-05) (4.45e-05) (7.68e-05) temp -6.97e-05 -3.84e-05 -1.63e-04 4.32e-05 6.21e-06 -1.48e-05 1.02e-04 -1.17e-05 -3.44e-04 -1.63e-04 -2.94e-05 -1.71e-04 -6.43e-05 (6.63e-05) (8.06e-05) (9.88e-05)* (1.12e-04) (1.09e-04) (1.22e-04) (8.80e-05) (1.19e-04) (2.09e-04) (7.92e-05)** (6.22e-05) (9.22e-05)* (1.59e-04) visibility 7.75e-05 1.04e-04 2.31e-04 -9.40e-05 -1.58e-04 5.27e-05 -1.22e-04 6.94e-05 6.42e-06 3.09e-05 -2.78e-04 1.32e-04 6.07e-05 (5.31e-05) (1.53e-04) (7.67e-05)*** (1.54e-04) (9.69e-05) (3.23e-04) (7.72e-05) (1.99e-04) (2.83e-04) (7.45e-05) (1.84e-04) (1.33e-04) (1.01e-04) winter -7.54e-04 6.23e-04 0.00e+00 5.80e-03 6.49e-04 -1.15e-02 8.27e-04 -5.50e-03 (1.82e-03) (2.35e-03) (0.00e+00) (3.48e-03)* (3.01e-03) (5.32e-03)** (1.92e-03) (2.70e-03)** spring 2.61e-05 1.65e-04 4.52e-03 4.04e-03 1.69e-03 1.06e-03 1.28e-04 5.42e-04 -6.69e-03 2.05e-03 6.84e-04 -2.61e-04 4.04e-04 (1.10e-03) (1.50e-03) (2.36e-03)* (2.06e-03)** (1.72e-03) (3.55e-03) (1.96e-03) (2.98e-03) (3.56e-03)* (2.00e-03) (1.13e-03) (1.65e-03) (3.61e-03) autumn 5.75e-04 6.68e-04 4.06e-03 1.08e-03 5.21e-03 -4.00e-03 1.05e-03 2.91e-04 -4.73e-03 2.78e-03 2.05e-04 -5.05e-04 3.07e-04 (1.18e-03) (1.49e-03) (2.40e-03)* (2.17e-03) (1.97e-03)*** (3.51e-03) (2.01e-03) (2.94e-03) (3.38e-03) (1.98e-03) (1.22e-03) (1.74e-03) (3.62e-03) dec 9.62e-04 2.87e-03 6.93e-03 7.56e-04 4.01e-03 -1.15e-03 3.26e-03 1.35e-03 6.02e-03 5.38e-03 6.61e-04 5.94e-03 4.66e-03 (1.93e-03) (2.50e-03) (2.87e-03)** (3.44e-03) (3.29e-03) (4.10e-03) (2.52e-03) (3.31e-03) (5.02e-03) (2.28e-03)** (1.81e-03) (2.65e-03)** (3.97e-03) jan 5.25e-04 1.87e-03 5.93e-03 -3.68e-03 2.19e-03 4.13e-03 9.75e-04 -6.86e-04 2.06e-03 2.52e-03 7.42e-04 3.66e-03 1.73e-03 (1.92e-03) (2.18e-03) (2.75e-03)** (3.57e-03) (3.27e-03) (4.20e-03) (2.38e-03) (3.26e-03) (4.70e-03) (2.22e-03) (1.77e-03) (2.55e-03) (3.79e-03) Constant 2.18e-04 -3.30e-04 -5.82e-03 2.46e-03 -1.94e-03 -3.39e-04 -7.78e-04 1.38e-03 1.79e-02 4.70e-03 3.17e-03 5.96e-03 2.83e-04 (1.07e-03) (2.31e-03) (2.56e-03)** (2.41e-03) (1.80e-03) (3.78e-03) (2.00e-03) (1.13e-02) (2.61e-02) (7.25e-03) (3.65e-03) (7.12e-03) (1.61e-02) Observations 1560 1850 832 1044 239 836 971 873 679 829 824 808 345 R-squared 0.00 0.00 0.03 0.02 0.06 0.02 0.02 0.00 0.01 0.02 0.01 0.02 0.02 Standard errors in parentheses * significant at 10%; ** significant at 5%; *** significant at 1%
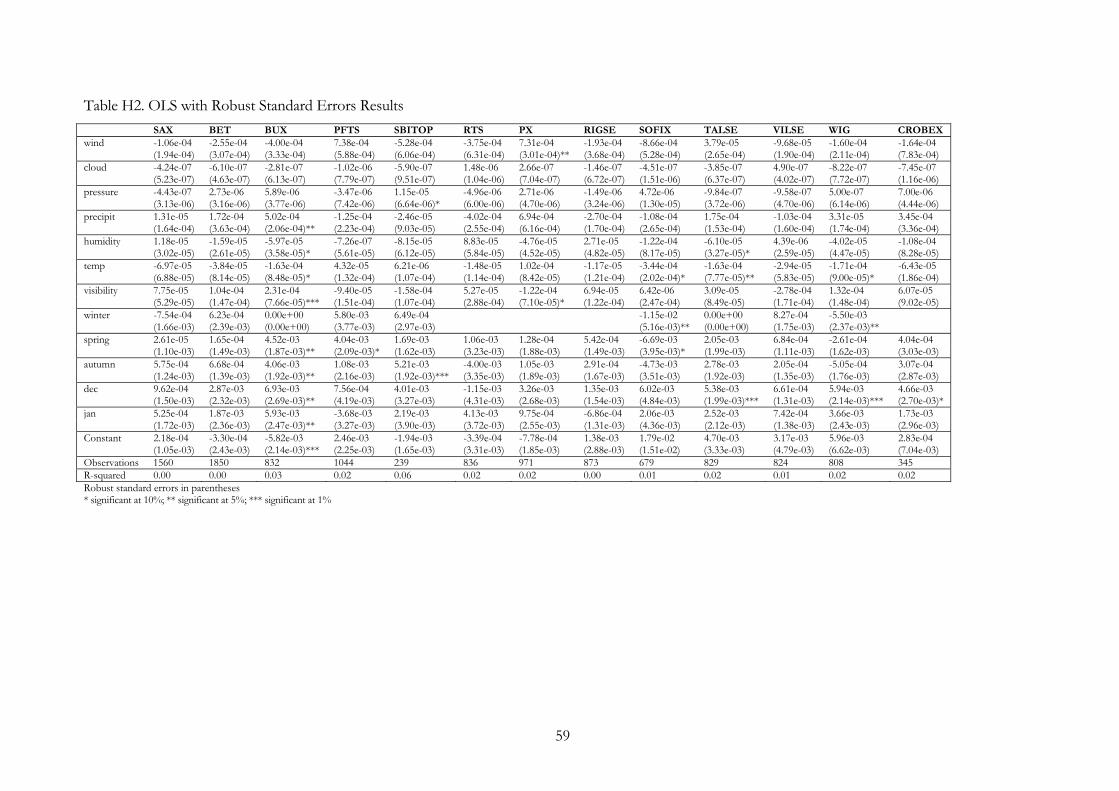
59
Table H2. OLS with Robust Standard Errors Results SAX BET BUX PFTS SBITOP RTS PX RIGSE SOFIX TALSE VILSE WIG CROBEX wind -1.06e-04 -2.55e-04 -4.00e-04 7.38e-04 -5.28e-04 -3.75e-04 7.31e-04 -1.93e-04 -8.66e-04 3.79e-05 -9.68e-05 -1.60e-04 -1.64e-04 (1.94e-04) (3.07e-04) (3.33e-04) (5.88e-04) (6.06e-04) (6.31e-04) (3.01e-04)** (3.68e-04) (5.28e-04) (2.65e-04) (1.90e-04) (2.11e-04) (7.83e-04) cloud -4.24e-07 -6.10e-07 -2.81e-07 -1.02e-06 -5.90e-07 1.48e-06 2.66e-07 -1.46e-07 -4.51e-07 -3.85e-07 4.90e-07 -8.22e-07 -7.45e-07 (5.23e-07) (4.63e-07) (6.13e-07) (7.79e-07) (9.51e-07) (1.04e-06) (7.04e-07) (6.72e-07) (1.51e-06) (6.37e-07) (4.02e-07) (7.72e-07) (1.16e-06) pressure -4.43e-07 2.73e-06 5.89e-06 -3.47e-06 1.15e-05 -4.96e-06 2.71e-06 -1.49e-06 4.72e-06 -9.84e-07 -9.58e-07 5.00e-07 7.00e-06 (3.13e-06) (3.16e-06) (3.77e-06) (7.42e-06) (6.64e-06)* (6.00e-06) (4.70e-06) (3.24e-06) (1.30e-05) (3.72e-06) (4.70e-06) (6.14e-06) (4.44e-06) precipit 1.31e-05 1.72e-04 5.02e-04 -1.25e-04 -2.46e-05 -4.02e-04 6.94e-04 -2.70e-04 -1.08e-04 1.75e-04 -1.03e-04 3.31e-05 3.45e-04 (1.64e-04) (3.63e-04) (2.06e-04)** (2.23e-04) (9.03e-05) (2.55e-04) (6.16e-04) (1.70e-04) (2.65e-04) (1.53e-04) (1.60e-04) (1.74e-04) (3.36e-04) humidity 1.18e-05 -1.59e-05 -5.97e-05 -7.26e-07 -8.15e-05 8.83e-05 -4.76e-05 2.71e-05 -1.22e-04 -6.10e-05 4.39e-06 -4.02e-05 -1.08e-04 (3.02e-05) (2.61e-05) (3.58e-05)* (5.61e-05) (6.12e-05) (5.84e-05) (4.52e-05) (4.82e-05) (8.17e-05) (3.27e-05)* (2.59e-05) (4.47e-05) (8.28e-05) temp -6.97e-05 -3.84e-05 -1.63e-04 4.32e-05 6.21e-06 -1.48e-05 1.02e-04 -1.17e-05 -3.44e-04 -1.63e-04 -2.94e-05 -1.71e-04 -6.43e-05 (6.88e-05) (8.14e-05) (8.48e-05)* (1.32e-04) (1.07e-04) (1.14e-04) (8.42e-05) (1.21e-04) (2.02e-04)* (7.77e-05)** (5.83e-05) (9.00e-05)* (1.86e-04) visibility 7.75e-05 1.04e-04 2.31e-04 -9.40e-05 -1.58e-04 5.27e-05 -1.22e-04 6.94e-05 6.42e-06 3.09e-05 -2.78e-04 1.32e-04 6.07e-05 (5.29e-05) (1.47e-04) (7.66e-05)*** (1.51e-04) (1.07e-04) (2.88e-04) (7.10e-05)* (1.22e-04) (2.47e-04) (8.49e-05) (1.71e-04) (1.48e-04) (9.02e-05) winter -7.54e-04 6.23e-04 0.00e+00 5.80e-03 6.49e-04 -1.15e-02 0.00e+00 8.27e-04 -5.50e-03 (1.66e-03) (2.39e-03) (0.00e+00) (3.77e-03) (2.97e-03) (5.16e-03)** (0.00e+00) (1.75e-03) (2.37e-03)** spring 2.61e-05 1.65e-04 4.52e-03 4.04e-03 1.69e-03 1.06e-03 1.28e-04 5.42e-04 -6.69e-03 2.05e-03 6.84e-04 -2.61e-04 4.04e-04 (1.10e-03) (1.49e-03) (1.87e-03)** (2.09e-03)* (1.62e-03) (3.23e-03) (1.88e-03) (1.49e-03) (3.95e-03)* (1.99e-03) (1.11e-03) (1.62e-03) (3.03e-03) autumn 5.75e-04 6.68e-04 4.06e-03 1.08e-03 5.21e-03 -4.00e-03 1.05e-03 2.91e-04 -4.73e-03 2.78e-03 2.05e-04 -5.05e-04 3.07e-04 (1.24e-03) (1.39e-03) (1.92e-03)** (2.16e-03) (1.92e-03)*** (3.35e-03) (1.89e-03) (1.67e-03) (3.51e-03) (1.92e-03) (1.35e-03) (1.76e-03) (2.87e-03) dec 9.62e-04 2.87e-03 6.93e-03 7.56e-04 4.01e-03 -1.15e-03 3.26e-03 1.35e-03 6.02e-03 5.38e-03 6.61e-04 5.94e-03 4.66e-03 (1.50e-03) (2.32e-03) (2.69e-03)** (4.19e-03) (3.27e-03) (4.31e-03) (2.68e-03) (1.54e-03) (4.84e-03) (1.99e-03)*** (1.31e-03) (2.14e-03)*** (2.70e-03)*jan 5.25e-04 1.87e-03 5.93e-03 -3.68e-03 2.19e-03 4.13e-03 9.75e-04 -6.86e-04 2.06e-03 2.52e-03 7.42e-04 3.66e-03 1.73e-03 (1.72e-03) (2.36e-03) (2.47e-03)** (3.27e-03) (3.90e-03) (3.72e-03) (2.55e-03) (1.31e-03) (4.36e-03) (2.12e-03) (1.38e-03) (2.43e-03) (2.96e-03) Constant 2.18e-04 -3.30e-04 -5.82e-03 2.46e-03 -1.94e-03 -3.39e-04 -7.78e-04 1.38e-03 1.79e-02 4.70e-03 3.17e-03 5.96e-03 2.83e-04 (1.05e-03) (2.43e-03) (2.14e-03)*** (2.25e-03) (1.65e-03) (3.31e-03) (1.85e-03) (2.88e-03) (1.51e-02) (3.33e-03) (4.79e-03) (6.62e-03) (7.04e-03) Observations 1560 1850 832 1044 239 836 971 873 679 829 824 808 345 R-squared 0.00 0.00 0.03 0.02 0.06 0.02 0.02 0.00 0.01 0.02 0.01 0.02 0.02 Robust standard errors in parentheses * significant at 10%; ** significant at 5%; *** significant at 1%
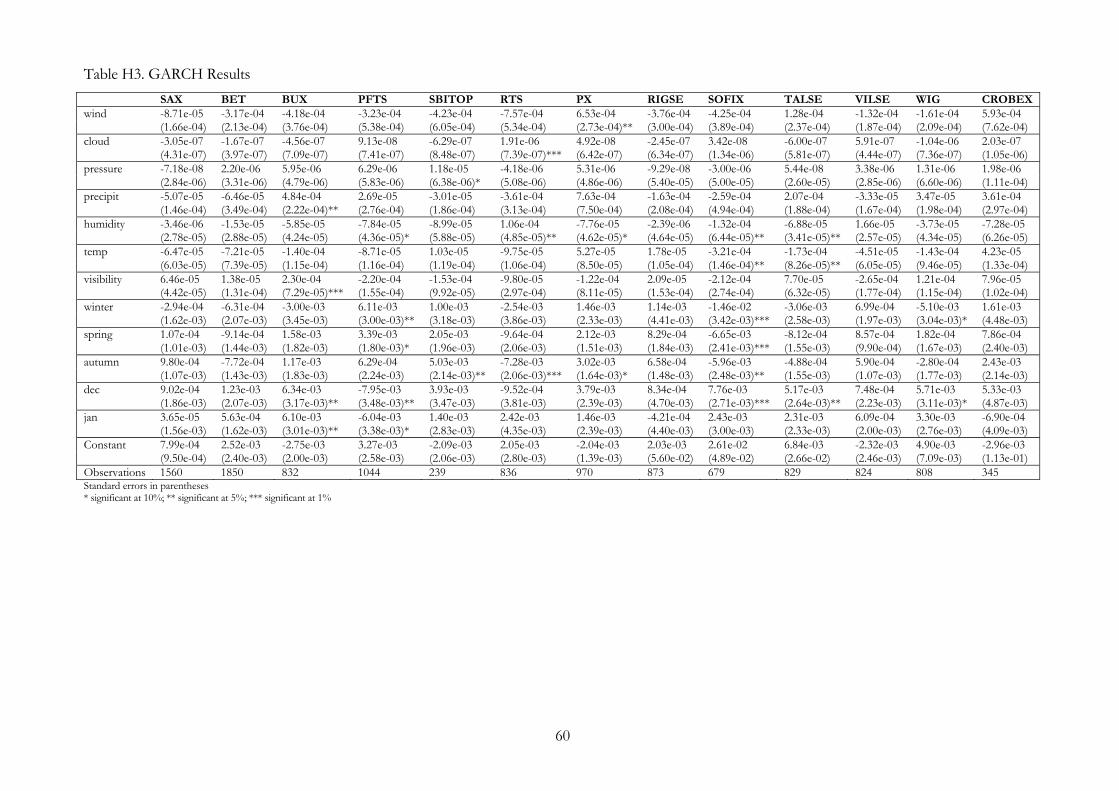
60
Table H3. GARCH Results SAX BET BUX PFTS SBITOP RTS PX RIGSE SOFIX TALSE VILSE WIG CROBEX wind -8.71e-05 -3.17e-04 -4.18e-04 -3.23e-04 -4.23e-04 -7.57e-04 6.53e-04 -3.76e-04 -4.25e-04 1.28e-04 -1.32e-04 -1.61e-04 5.93e-04 (1.66e-04) (2.13e-04) (3.76e-04) (5.38e-04) (6.05e-04) (5.34e-04) (2.73e-04)** (3.00e-04) (3.89e-04) (2.37e-04) (1.87e-04) (2.09e-04) (7.62e-04) cloud -3.05e-07 -1.67e-07 -4.56e-07 9.13e-08 -6.29e-07 1.91e-06 4.92e-08 -2.45e-07 3.42e-08 -6.00e-07 5.91e-07 -1.04e-06 2.03e-07 (4.31e-07) (3.97e-07) (7.09e-07) (7.41e-07) (8.48e-07) (7.39e-07)*** (6.42e-07) (6.34e-07) (1.34e-06) (5.81e-07) (4.44e-07) (7.36e-07) (1.05e-06) pressure -7.18e-08 2.20e-06 5.95e-06 6.29e-06 1.18e-05 -4.18e-06 5.31e-06 -9.29e-08 -3.00e-06 5.44e-08 3.38e-06 1.31e-06 1.98e-06 (2.84e-06) (3.31e-06) (4.79e-06) (5.83e-06) (6.38e-06)* (5.08e-06) (4.86e-06) (5.40e-05) (5.00e-05) (2.60e-05) (2.85e-06) (6.60e-06) (1.11e-04) precipit -5.07e-05 -6.46e-05 4.84e-04 2.69e-05 -3.01e-05 -3.61e-04 7.63e-04 -1.63e-04 -2.59e-04 2.07e-04 -3.33e-05 3.47e-05 3.61e-04 (1.46e-04) (3.49e-04) (2.22e-04)** (2.76e-04) (1.86e-04) (3.13e-04) (7.50e-04) (2.08e-04) (4.94e-04) (1.88e-04) (1.67e-04) (1.98e-04) (2.97e-04) humidity -3.46e-06 -1.53e-05 -5.85e-05 -7.84e-05 -8.99e-05 1.06e-04 -7.76e-05 -2.39e-06 -1.32e-04 -6.88e-05 1.66e-05 -3.73e-05 -7.28e-05 (2.78e-05) (2.88e-05) (4.24e-05) (4.36e-05)* (5.88e-05) (4.85e-05)** (4.62e-05)* (4.64e-05) (6.44e-05)** (3.41e-05)** (2.57e-05) (4.34e-05) (6.26e-05) temp -6.47e-05 -7.21e-05 -1.40e-04 -8.71e-05 1.03e-05 -9.75e-05 5.27e-05 1.78e-05 -3.21e-04 -1.73e-04 -4.51e-05 -1.43e-04 4.23e-05 (6.03e-05) (7.39e-05) (1.15e-04) (1.16e-04) (1.19e-04) (1.06e-04) (8.50e-05) (1.05e-04) (1.46e-04)** (8.26e-05)** (6.05e-05) (9.46e-05) (1.33e-04) visibility 6.46e-05 1.38e-05 2.30e-04 -2.20e-04 -1.53e-04 -9.80e-05 -1.22e-04 2.09e-05 -2.12e-04 7.70e-05 -2.65e-04 1.21e-04 7.96e-05 (4.42e-05) (1.31e-04) (7.29e-05)*** (1.55e-04) (9.92e-05) (2.97e-04) (8.11e-05) (1.53e-04) (2.74e-04) (6.32e-05) (1.77e-04) (1.15e-04) (1.02e-04) winter -2.94e-04 -6.31e-04 -3.00e-03 6.11e-03 1.00e-03 -2.54e-03 1.46e-03 1.14e-03 -1.46e-02 -3.06e-03 6.99e-04 -5.10e-03 1.61e-03 (1.62e-03) (2.07e-03) (3.45e-03) (3.00e-03)** (3.18e-03) (3.86e-03) (2.33e-03) (4.41e-03) (3.42e-03)*** (2.58e-03) (1.97e-03) (3.04e-03)* (4.48e-03) spring 1.07e-04 -9.14e-04 1.58e-03 3.39e-03 2.05e-03 -9.64e-04 2.12e-03 8.29e-04 -6.65e-03 -8.12e-04 8.57e-04 1.82e-04 7.86e-04 (1.01e-03) (1.44e-03) (1.82e-03) (1.80e-03)* (1.96e-03) (2.06e-03) (1.51e-03) (1.84e-03) (2.41e-03)*** (1.55e-03) (9.90e-04) (1.67e-03) (2.40e-03) autumn 9.80e-04 -7.72e-04 1.17e-03 6.29e-04 5.03e-03 -7.28e-03 3.02e-03 6.58e-04 -5.96e-03 -4.88e-04 5.90e-04 -2.80e-04 2.43e-03 (1.07e-03) (1.43e-03) (1.83e-03) (2.24e-03) (2.14e-03)** (2.06e-03)*** (1.64e-03)* (1.48e-03) (2.48e-03)** (1.55e-03) (1.07e-03) (1.77e-03) (2.14e-03) dec 9.02e-04 1.23e-03 6.34e-03 -7.95e-03 3.93e-03 -9.52e-04 3.79e-03 8.34e-04 7.76e-03 5.17e-03 7.48e-04 5.71e-03 5.33e-03 (1.86e-03) (2.07e-03) (3.17e-03)** (3.48e-03)** (3.47e-03) (3.81e-03) (2.39e-03) (4.70e-03) (2.71e-03)*** (2.64e-03)** (2.23e-03) (3.11e-03)* (4.87e-03) jan 3.65e-05 5.63e-04 6.10e-03 -6.04e-03 1.40e-03 2.42e-03 1.46e-03 -4.21e-04 2.43e-03 2.31e-03 6.09e-04 3.30e-03 -6.90e-04 (1.56e-03) (1.62e-03) (3.01e-03)** (3.38e-03)* (2.83e-03) (4.35e-03) (2.39e-03) (4.40e-03) (3.00e-03) (2.33e-03) (2.00e-03) (2.76e-03) (4.09e-03) Constant 7.99e-04 2.52e-03 -2.75e-03 3.27e-03 -2.09e-03 2.05e-03 -2.04e-03 2.03e-03 2.61e-02 6.84e-03 -2.32e-03 4.90e-03 -2.96e-03 (9.50e-04) (2.40e-03) (2.00e-03) (2.58e-03) (2.06e-03) (2.80e-03) (1.39e-03) (5.60e-02) (4.89e-02) (2.66e-02) (2.46e-03) (7.09e-03) (1.13e-01) Observations 1560 1850 832 1044 239 836 970 873 679 829 824 808 345 Standard errors in parentheses * significant at 10%; ** significant at 5%; *** significant at 1%
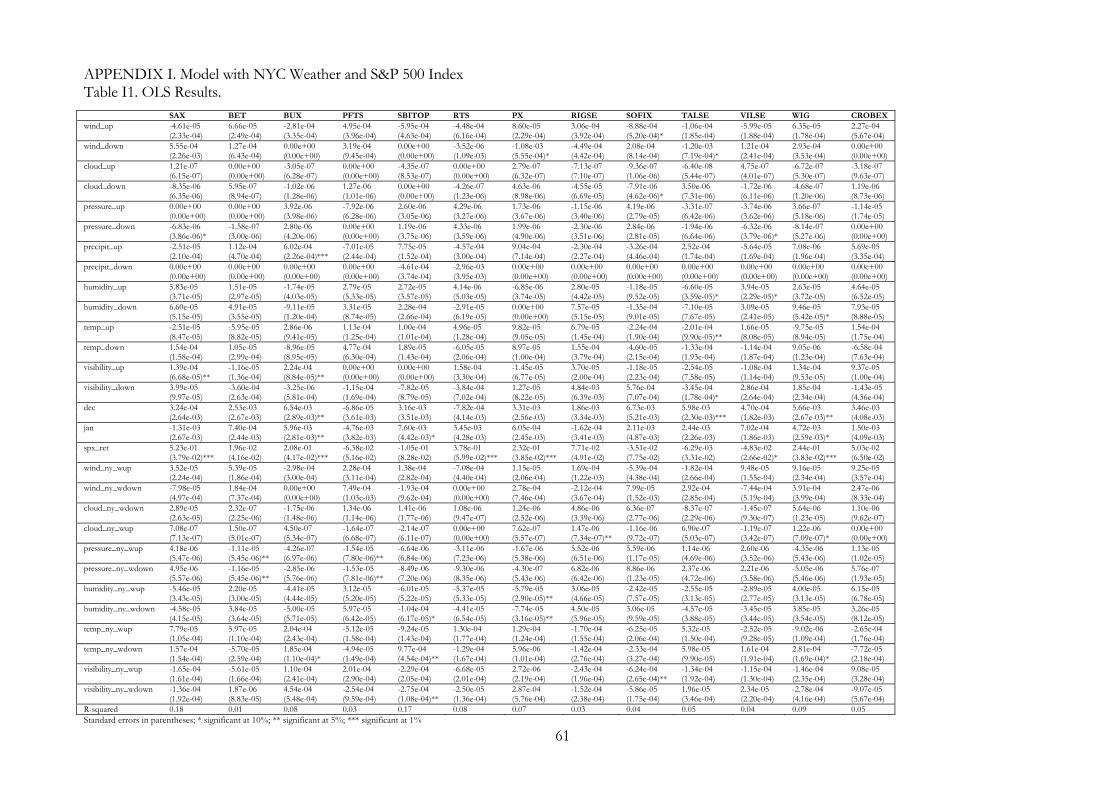
61
APPENDIX I. Model with NYC Weather and S&P 500 Index Table I1. OLS Results. SAX BET BUX PFTS SBITOP RTS PX RIGSE SOFIX TALSE VILSE WIG CROBEX wind_up -4.61e-05 6.66e-05 -2.81e-04 4.95e-04 -5.95e-04 -4.48e-04 8.60e-05 3.06e-04 -8.88e-04 -1.06e-04 -5.99e-05 6.35e-05 2.27e-04 (2.33e-04) (2.49e-04) (3.35e-04) (3.96e-04) (4.63e-04) (6.16e-04) (2.29e-04) (3.92e-04) (5.20e-04)* (1.85e-04) (1.88e-04) (1.78e-04) (5.67e-04) wind_down 5.55e-04 1.27e-04 0.00e+00 3.19e-04 0.00e+00 -3.52e-06 -1.08e-03 -4.49e-04 2.08e-04 -1.20e-03 1.21e-04 2.93e-04 0.00e+00 (2.26e-03) (6.43e-04) (0.00e+00) (9.45e-04) (0.00e+00) (1.09e-03) (5.55e-04)* (4.42e-04) (8.14e-04) (7.19e-04)* (2.41e-04) (3.53e-04) (0.00e+00) cloud_up 1.21e-07 0.00e+00 -3.05e-07 0.00e+00 -4.35e-07 0.00e+00 2.79e-07 -7.13e-07 -9.36e-07 -6.40e-08 4.75e-07 -6.72e-07 -3.18e-07 (6.15e-07) (0.00e+00) (6.28e-07) (0.00e+00) (8.53e-07) (0.00e+00) (6.32e-07) (7.10e-07) (1.06e-06) (5.44e-07) (4.01e-07) (5.30e-07) (9.63e-07) cloud_down -8.35e-06 5.95e-07 -1.02e-06 1.27e-06 0.00e+00 -4.26e-07 4.63e-06 -4.55e-05 -7.91e-06 3.50e-06 -1.72e-06 -4.68e-07 1.19e-06 (6.35e-06) (8.94e-07) (1.28e-06) (1.01e-06) (0.00e+00) (1.23e-06) (8.98e-06) (6.69e-05) (4.62e-06)* (7.31e-06) (6.11e-06) (1.20e-06) (8.73e-06) pressure_up 0.00e+00 0.00e+00 3.92e-06 -7.92e-06 2.60e-06 4.29e-06 1.73e-06 -1.15e-06 4.19e-06 -3.31e-07 -3.74e-06 3.66e-07 -1.14e-05 (0.00e+00) (0.00e+00) (3.98e-06) (6.28e-06) (3.05e-06) (3.27e-06) (3.67e-06) (3.40e-06) (2.79e-05) (6.42e-06) (3.62e-06) (5.18e-06) (1.74e-05) pressure_down -6.83e-06 -1.58e-07 2.80e-06 0.00e+00 1.19e-06 4.33e-06 1.99e-06 -2.30e-06 2.84e-06 -1.94e-06 -6.32e-06 -8.14e-07 0.00e+00 (3.86e-06)* (3.00e-06) (4.20e-06) (0.00e+00) (3.75e-06) (3.59e-06) (4.90e-06) (3.51e-06) (2.81e-05) (6.64e-06) (3.79e-06)* (5.27e-06) (0.00e+00) precipit_up -2.51e-05 1.12e-04 6.02e-04 -7.01e-05 7.75e-05 -4.57e-04 9.04e-04 -2.30e-04 -3.26e-04 2.52e-04 -5.64e-05 7.08e-06 5.69e-05 (2.10e-04) (4.70e-04) (2.26e-04)*** (2.44e-04) (1.52e-04) (3.00e-04) (7.14e-04) (2.27e-04) (4.46e-04) (1.74e-04) (1.69e-04) (1.96e-04) (3.35e-04) precipit_down 0.00e+00 0.00e+00 0.00e+00 0.00e+00 -4.61e-04 -2.96e-03 0.00e+00 0.00e+00 0.00e+00 0.00e+00 0.00e+00 0.00e+00 0.00e+00 (0.00e+00) (0.00e+00) (0.00e+00) (0.00e+00) (3.74e-04) (3.95e-03) (0.00e+00) (0.00e+00) (0.00e+00) (0.00e+00) (0.00e+00) (0.00e+00) (0.00e+00) humidity_up 5.83e-05 1.51e-05 -1.74e-05 2.79e-05 2.72e-05 4.14e-06 -6.85e-06 2.80e-05 -1.18e-05 -6.60e-05 3.94e-05 2.63e-05 4.64e-05 (3.71e-05) (2.97e-05) (4.03e-05) (5.33e-05) (3.57e-05) (5.03e-05) (3.74e-05) (4.42e-05) (9.52e-05) (3.59e-05)* (2.29e-05)* (3.72e-05) (6.52e-05) humidity_down 6.60e-05 4.91e-05 -9.11e-05 3.31e-05 2.28e-04 -2.91e-05 0.00e+00 7.57e-05 -1.35e-04 -7.10e-05 3.09e-05 9.46e-05 7.93e-05 (5.15e-05) (3.55e-05) (1.20e-04) (8.74e-05) (2.66e-04) (6.19e-05) (0.00e+00) (5.15e-05) (9.01e-05) (7.67e-05) (2.41e-05) (5.42e-05)* (8.88e-05) temp_up -2.51e-05 -5.95e-05 2.86e-06 1.13e-04 1.00e-04 4.96e-05 9.82e-05 6.79e-05 -2.24e-04 -2.01e-04 1.66e-05 -9.75e-05 1.54e-04 (8.47e-05) (8.82e-05) (9.41e-05) (1.25e-04) (1.01e-04) (1.28e-04) (9.05e-05) (1.45e-04) (1.90e-04) (9.90e-05)** (8.08e-05) (8.94e-05) (1.75e-04) temp_down 1.54e-04 1.05e-05 -8.96e-05 4.77e-04 1.89e-05 -6.05e-05 8.97e-05 1.55e-04 -4.60e-05 -1.33e-04 -1.14e-04 9.05e-06 -6.58e-04 (1.58e-04) (2.99e-04) (8.95e-05) (6.30e-04) (1.43e-04) (2.06e-04) (1.00e-04) (3.79e-04) (2.15e-04) (1.93e-04) (1.87e-04) (1.23e-04) (7.63e-04) visibility_up 1.39e-04 -1.16e-05 2.24e-04 0.00e+00 0.00e+00 1.58e-04 -1.45e-05 3.70e-05 -1.18e-05 -2.54e-05 -1.08e-04 1.34e-04 9.37e-05 (6.68e-05)** (1.36e-04) (8.84e-05)** (0.00e+00) (0.00e+00) (3.30e-04) (6.77e-05) (2.00e-04) (2.23e-04) (7.58e-05) (1.14e-04) (9.53e-05) (1.00e-04) visibility_down 3.99e-05 -3.60e-04 -3.25e-06 -1.15e-04 -7.82e-05 -3.84e-04 1.27e-05 4.84e-03 5.76e-04 -3.45e-04 2.86e-04 1.85e-04 -1.43e-05 (9.97e-05) (2.63e-04) (5.81e-04) (1.69e-04) (8.79e-05) (7.02e-04) (8.22e-05) (6.39e-03) (7.07e-04) (1.78e-04)* (2.64e-04) (2.34e-04) (4.36e-04) dec 3.24e-04 2.53e-03 6.54e-03 -6.86e-05 3.16e-03 -7.82e-04 3.31e-03 1.86e-03 6.73e-03 5.98e-03 4.70e-04 5.66e-03 3.46e-03 (2.64e-03) (2.67e-03) (2.89e-03)** (3.61e-03) (3.51e-03) (4.14e-03) (2.56e-03) (3.34e-03) (5.21e-03) (2.30e-03)*** (1.82e-03) (2.67e-03)** (4.08e-03) jan -1.31e-03 7.40e-04 5.96e-03 -4.76e-03 7.60e-03 3.45e-03 6.05e-04 -1.62e-04 2.11e-03 2.44e-03 7.02e-04 4.72e-03 1.50e-03 (2.67e-03) (2.44e-03) (2.81e-03)** (3.82e-03) (4.42e-03)* (4.28e-03) (2.45e-03) (3.41e-03) (4.87e-03) (2.26e-03) (1.86e-03) (2.59e-03)* (4.09e-03) spx_ret 5.23e-01 1.96e-02 2.08e-01 -6.38e-02 -1.05e-01 3.78e-01 2.32e-01 7.71e-02 -3.51e-02 -6.29e-03 -4.83e-02 2.44e-01 5.03e-02 (3.79e-02)*** (4.16e-02) (4.17e-02)*** (5.16e-02) (8.28e-02) (5.99e-02)*** (3.85e-02)*** (4.91e-02) (7.75e-02) (3.31e-02) (2.66e-02)* (3.83e-02)*** (6.50e-02) wind_ny_wup 3.52e-05 5.39e-05 -2.98e-04 2.28e-04 1.38e-04 -7.08e-04 1.15e-05 1.69e-04 -5.39e-04 -1.82e-04 9.48e-05 9.16e-05 9.25e-05 (2.24e-04) (1.86e-04) (3.00e-04) (3.11e-04) (2.82e-04) (4.40e-04) (2.06e-04) (1.22e-03) (4.38e-04) (2.66e-04) (1.55e-04) (2.34e-04) (3.57e-04) wind_ny_wdown -7.98e-05 1.84e-04 0.00e+00 7.49e-04 -1.93e-04 0.00e+00 2.78e-04 -2.12e-04 7.99e-05 2.92e-04 -7.44e-04 3.91e-04 2.47e-06 (4.97e-04) (7.37e-04) (0.00e+00) (1.03e-03) (9.62e-04) (0.00e+00) (7.46e-04) (3.67e-04) (1.52e-03) (2.85e-04) (5.19e-04) (3.99e-04) (8.33e-04) cloud_ny_wdown 2.89e-05 2.32e-07 -1.75e-06 1.34e-06 1.41e-06 1.08e-06 1.24e-06 4.86e-06 6.36e-07 -8.37e-07 -1.45e-07 5.64e-06 1.10e-06 (2.63e-05) (2.25e-06) (1.48e-06) (1.14e-06) (1.77e-06) (9.47e-07) (2.52e-06) (3.39e-06) (2.77e-06) (2.29e-06) (9.30e-07) (1.23e-05) (9.62e-07) cloud_ny_wup 7.08e-07 1.50e-07 4.50e-07 -1.64e-07 -2.14e-07 0.00e+00 7.62e-07 1.47e-06 -1.16e-06 6.90e-07 -1.19e-07 1.22e-06 0.00e+00 (7.13e-07) (5.01e-07) (5.34e-07) (6.68e-07) (6.11e-07) (0.00e+00) (5.57e-07) (7.34e-07)** (9.72e-07) (5.03e-07) (3.42e-07) (7.09e-07)* (0.00e+00) pressure_ny_wup 4.18e-06 -1.11e-05 -4.26e-07 -1.54e-05 -6.64e-06 -3.11e-06 -1.67e-06 5.52e-06 5.59e-06 1.14e-06 2.60e-06 -4.35e-06 1.13e-05 (5.47e-06) (5.45e-06)** (6.97e-06) (7.80e-06)** (6.84e-06) (7.23e-06) (5.38e-06) (6.51e-06) (1.17e-05) (4.69e-06) (3.52e-06) (5.43e-06) (1.02e-05) pressure_ny_wdown 4.95e-06 -1.16e-05 -2.85e-06 -1.53e-05 -8.49e-06 -9.30e-06 -4.30e-07 6.82e-06 8.86e-06 2.37e-06 2.21e-06 -5.05e-06 5.76e-07 (5.57e-06) (5.45e-06)** (5.76e-06) (7.81e-06)** (7.20e-06) (8.35e-06) (5.43e-06) (6.42e-06) (1.23e-05) (4.72e-06) (3.58e-06) (5.46e-06) (1.93e-05) humidity_ny_wup -5.46e-05 2.20e-05 -4.41e-05 3.12e-05 -6.01e-05 -5.37e-05 -5.79e-05 3.06e-05 -2.42e-05 -2.55e-05 -2.89e-05 4.00e-05 6.15e-05 (3.43e-05) (3.00e-05) (4.44e-05) (5.20e-05) (5.22e-05) (5.33e-05) (2.90e-05)** (4.66e-05) (7.57e-05) (3.13e-05) (2.77e-05) (3.13e-05) (6.78e-05) humidity_ny_wdown -4.58e-05 3.84e-05 -5.00e-05 5.97e-05 -1.04e-04 -4.41e-05 -7.74e-05 4.50e-05 3.06e-05 -4.57e-05 -3.45e-05 3.85e-05 3.26e-05 (4.15e-05) (3.64e-05) (5.71e-05) (6.42e-05) (6.17e-05)* (6.54e-05) (3.16e-05)** (5.96e-05) (9.59e-05) (3.88e-05) (3.44e-05) (3.54e-05) (8.12e-05) temp_ny_wup 7.79e-05 5.97e-05 2.04e-04 -5.12e-05 -9.24e-05 1.30e-04 1.29e-04 -1.70e-04 -6.25e-05 5.32e-05 -2.52e-05 -9.02e-06 -2.65e-04 (1.05e-04) (1.10e-04) (2.43e-04) (1.58e-04) (1.43e-04) (1.77e-04) (1.24e-04) (1.55e-04) (2.06e-04) (1.50e-04) (9.28e-05) (1.09e-04) (1.76e-04) temp_ny_wdown 1.57e-04 -5.70e-05 1.85e-04 -4.94e-05 9.77e-04 -1.29e-04 5.96e-06 -1.42e-04 -2.33e-04 5.98e-05 1.61e-04 2.81e-04 -7.72e-05 (1.54e-04) (2.59e-04) (1.10e-04)* (1.49e-04) (4.54e-04)** (1.67e-04) (1.01e-04) (2.76e-04) (3.27e-04) (9.90e-05) (1.91e-04) (1.69e-04)* (2.18e-04) visibility_ny_wup -1.65e-04 -5.61e-05 1.10e-04 2.01e-04 -2.29e-04 -6.68e-05 2.72e-06 -2.43e-04 -6.24e-04 -1.34e-04 -1.15e-04 -1.46e-04 9.08e-05 (1.61e-04) (1.66e-04) (2.41e-04) (2.90e-04) (2.05e-04) (2.01e-04) (2.19e-04) (1.96e-04) (2.65e-04)** (1.92e-04) (1.30e-04) (2.35e-04) (3.28e-04) visibility_ny_wdown -1.36e-04 1.87e-06 4.54e-04 -2.54e-04 -2.75e-04 -2.50e-05 2.87e-04 -1.52e-04 -5.86e-05 1.96e-05 2.34e-05 -2.78e-04 -9.07e-05 (1.92e-04) (8.83e-05) (5.48e-04) (9.59e-04) (1.08e-04)** (1.36e-04) (5.76e-04) (2.38e-04) (1.75e-04) (3.46e-04) (2.20e-04) (4.16e-04) (5.67e-04) R-squared 0.18 0.01 0.08 0.03 0.17 0.08 0.07 0.03 0.04 0.05 0.04 0.09 0.05 Standard errors in parentheses; * significant at 10%; ** significant at 5%; *** significant at 1%
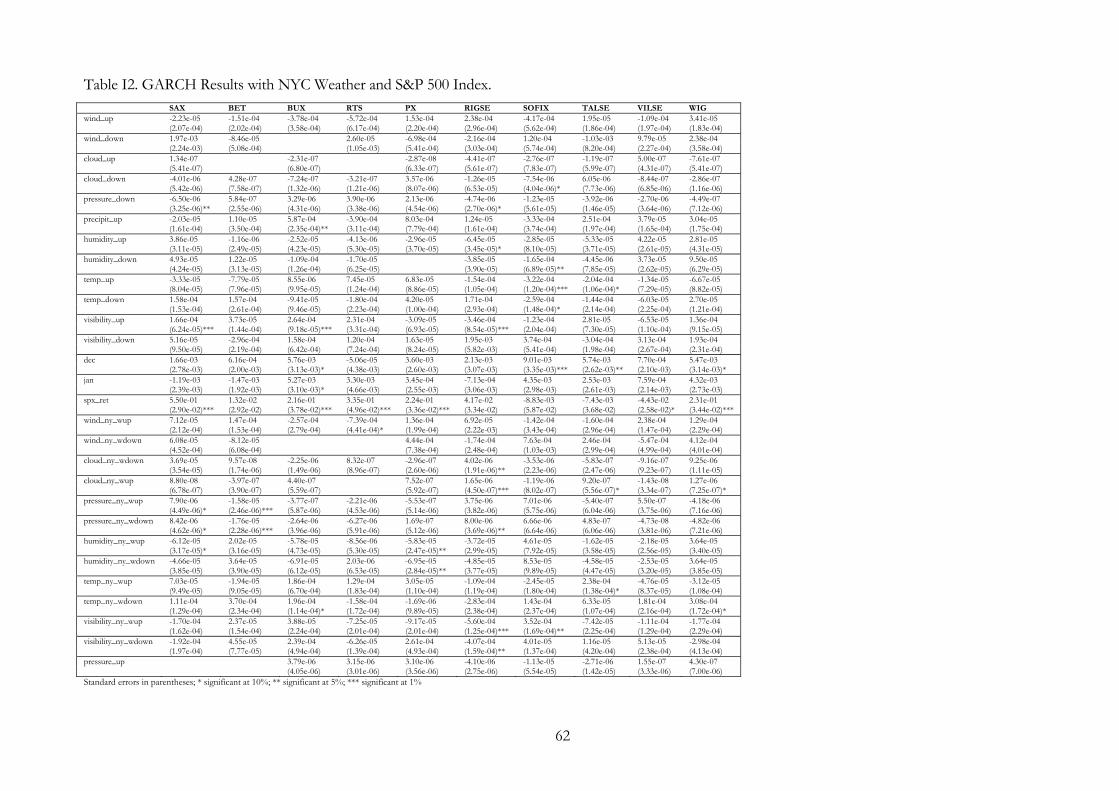
62
Table I2. GARCH Results with NYC Weather and S&P 500 Index.
SAX BET BUX RTS PX RIGSE SOFIX TALSE VILSE WIG wind_up -2.23e-05 -1.51e-04 -3.78e-04 -5.72e-04 1.53e-04 2.38e-04 -4.17e-04 1.95e-05 -1.09e-04 3.41e-05 (2.07e-04) (2.02e-04) (3.58e-04) (6.17e-04) (2.20e-04) (2.96e-04) (5.62e-04) (1.86e-04) (1.97e-04) (1.83e-04) wind_down 1.97e-03 -8.46e-05 2.60e-05 -6.98e-04 -2.16e-04 1.20e-04 -1.03e-03 9.79e-05 2.38e-04 (2.24e-03) (5.08e-04) (1.05e-03) (5.41e-04) (3.03e-04) (5.74e-04) (8.20e-04) (2.27e-04) (3.58e-04) cloud_up 1.34e-07 -2.31e-07 -2.87e-08 -4.41e-07 -2.76e-07 -1.19e-07 5.00e-07 -7.61e-07 (5.41e-07) (6.80e-07) (6.33e-07) (5.61e-07) (7.83e-07) (5.99e-07) (4.31e-07) (5.41e-07) cloud_down -4.01e-06 4.28e-07 -7.24e-07 -3.21e-07 3.57e-06 -1.26e-05 -7.54e-06 6.05e-06 -8.44e-07 -2.86e-07 (5.42e-06) (7.58e-07) (1.32e-06) (1.21e-06) (8.07e-06) (6.53e-05) (4.04e-06)* (7.73e-06) (6.85e-06) (1.16e-06) pressure_down -6.50e-06 5.84e-07 3.29e-06 3.90e-06 2.13e-06 -4.74e-06 -1.23e-05 -3.92e-06 -2.70e-06 -4.49e-07 (3.25e-06)** (2.55e-06) (4.31e-06) (3.38e-06) (4.54e-06) (2.70e-06)* (5.61e-05) (1.46e-05) (3.64e-06) (7.12e-06) precipit_up -2.03e-05 1.10e-05 5.87e-04 -3.90e-04 8.03e-04 1.24e-05 -3.33e-04 2.51e-04 3.79e-05 3.04e-05 (1.61e-04) (3.50e-04) (2.35e-04)** (3.11e-04) (7.79e-04) (1.61e-04) (3.74e-04) (1.97e-04) (1.65e-04) (1.75e-04) humidity_up 3.86e-05 -1.16e-06 -2.52e-05 -4.13e-06 -2.96e-05 -6.45e-05 -2.85e-05 -5.33e-05 4.22e-05 2.81e-05 (3.11e-05) (2.49e-05) (4.23e-05) (5.30e-05) (3.70e-05) (3.45e-05)* (8.10e-05) (3.71e-05) (2.61e-05) (4.31e-05) humidity_down 4.93e-05 1.22e-05 -1.09e-04 -1.70e-05 -3.85e-05 -1.65e-04 -4.45e-06 3.73e-05 9.50e-05 (4.24e-05) (3.13e-05) (1.26e-04) (6.25e-05) (3.90e-05) (6.89e-05)** (7.85e-05) (2.62e-05) (6.29e-05) temp_up -3.33e-05 -7.79e-05 8.55e-06 7.45e-05 6.83e-05 -1.54e-04 -3.22e-04 -2.04e-04 -1.34e-05 -6.67e-05 (8.04e-05) (7.96e-05) (9.95e-05) (1.24e-04) (8.86e-05) (1.05e-04) (1.20e-04)*** (1.06e-04)* (7.29e-05) (8.82e-05) temp_down 1.58e-04 1.57e-04 -9.41e-05 -1.80e-04 4.20e-05 1.71e-04 -2.59e-04 -1.44e-04 -6.03e-05 2.70e-05 (1.53e-04) (2.61e-04) (9.46e-05) (2.23e-04) (1.00e-04) (2.93e-04) (1.48e-04)* (2.14e-04) (2.25e-04) (1.21e-04) visibility_up 1.66e-04 3.73e-05 2.64e-04 2.31e-04 -3.09e-05 -3.46e-04 -1.23e-04 2.81e-05 -6.53e-05 1.36e-04 (6.24e-05)*** (1.44e-04) (9.18e-05)*** (3.31e-04) (6.93e-05) (8.54e-05)*** (2.04e-04) (7.30e-05) (1.10e-04) (9.15e-05) visibility_down 5.16e-05 -2.96e-04 1.58e-04 1.20e-04 1.63e-05 1.95e-03 3.74e-04 -3.04e-04 3.13e-04 1.93e-04 (9.50e-05) (2.19e-04) (6.42e-04) (7.24e-04) (8.24e-05) (5.82e-03) (5.41e-04) (1.98e-04) (2.67e-04) (2.31e-04) dec 1.66e-03 6.16e-04 5.76e-03 -5.06e-05 3.60e-03 2.13e-03 9.01e-03 5.74e-03 7.70e-04 5.47e-03 (2.78e-03) (2.00e-03) (3.13e-03)* (4.38e-03) (2.60e-03) (3.07e-03) (3.35e-03)*** (2.62e-03)** (2.10e-03) (3.14e-03)* jan -1.19e-03 -1.47e-03 5.27e-03 3.30e-03 3.45e-04 -7.13e-04 4.35e-03 2.53e-03 7.59e-04 4.32e-03 (2.39e-03) (1.92e-03) (3.10e-03)* (4.66e-03) (2.55e-03) (3.06e-03) (2.98e-03) (2.61e-03) (2.14e-03) (2.73e-03) spx_ret 5.50e-01 1.32e-02 2.16e-01 3.35e-01 2.24e-01 4.17e-02 -8.83e-03 -7.43e-03 -4.43e-02 2.31e-01 (2.90e-02)*** (2.92e-02) (3.78e-02)*** (4.96e-02)*** (3.36e-02)*** (3.34e-02) (5.87e-02) (3.68e-02) (2.58e-02)* (3.44e-02)*** wind_ny_wup 7.12e-05 1.47e-04 -2.57e-04 -7.39e-04 1.36e-04 6.92e-05 -1.42e-04 -1.60e-04 2.38e-04 1.29e-04 (2.12e-04) (1.53e-04) (2.79e-04) (4.41e-04)* (1.99e-04) (2.22e-03) (3.43e-04) (2.96e-04) (1.47e-04) (2.29e-04) wind_ny_wdown 6.08e-05 -8.12e-05 4.44e-04 -1.74e-04 7.63e-04 2.46e-04 -5.47e-04 4.12e-04 (4.52e-04) (6.08e-04) (7.38e-04) (2.48e-04) (1.03e-03) (2.99e-04) (4.99e-04) (4.01e-04) cloud_ny_wdown 3.69e-05 9.57e-08 -2.25e-06 8.32e-07 -2.96e-07 4.02e-06 -3.53e-06 -5.83e-07 -9.16e-07 9.25e-06 (3.54e-05) (1.74e-06) (1.49e-06) (8.96e-07) (2.60e-06) (1.91e-06)** (2.23e-06) (2.47e-06) (9.23e-07) (1.11e-05) cloud_ny_wup 8.80e-08 -3.97e-07 4.40e-07 7.52e-07 1.65e-06 -1.19e-06 9.20e-07 -1.43e-08 1.27e-06 (6.78e-07) (3.90e-07) (5.59e-07) (5.92e-07) (4.50e-07)*** (8.02e-07) (5.56e-07)* (3.34e-07) (7.25e-07)* pressure_ny_wup 7.90e-06 -1.58e-05 -3.77e-07 -2.21e-06 -5.53e-07 3.75e-06 7.01e-06 -5.40e-07 5.50e-07 -4.18e-06 (4.49e-06)* (2.46e-06)*** (5.87e-06) (4.53e-06) (5.14e-06) (3.82e-06) (5.75e-06) (6.04e-06) (3.75e-06) (7.16e-06) pressure_ny_wdown 8.42e-06 -1.76e-05 -2.64e-06 -6.27e-06 1.69e-07 8.00e-06 6.66e-06 4.83e-07 -4.73e-08 -4.82e-06 (4.62e-06)* (2.28e-06)*** (3.96e-06) (5.91e-06) (5.12e-06) (3.69e-06)** (6.64e-06) (6.06e-06) (3.81e-06) (7.21e-06) humidity_ny_wup -6.12e-05 2.02e-05 -5.78e-05 -8.56e-06 -5.83e-05 -3.72e-05 4.61e-05 -1.62e-05 -2.18e-05 3.64e-05 (3.17e-05)* (3.16e-05) (4.73e-05) (5.30e-05) (2.47e-05)** (2.99e-05) (7.92e-05) (3.58e-05) (2.56e-05) (3.40e-05) humidity_ny_wdown -4.66e-05 3.64e-05 -6.91e-05 2.03e-06 -6.95e-05 -4.85e-05 8.53e-05 -4.58e-05 -2.53e-05 3.64e-05 (3.85e-05) (3.90e-05) (6.12e-05) (6.53e-05) (2.84e-05)** (3.77e-05) (9.89e-05) (4.47e-05) (3.20e-05) (3.85e-05) temp_ny_wup 7.03e-05 -1.94e-05 1.86e-04 1.29e-04 3.05e-05 -1.09e-04 -2.45e-05 2.38e-04 -4.76e-05 -3.12e-05 (9.49e-05) (9.05e-05) (6.70e-04) (1.83e-04) (1.10e-04) (1.19e-04) (1.80e-04) (1.38e-04)* (8.37e-05) (1.08e-04) temp_ny_wdown 1.11e-04 3.70e-04 1.96e-04 -1.58e-04 -1.69e-06 -2.83e-04 1.43e-04 6.33e-05 1.81e-04 3.08e-04 (1.29e-04) (2.34e-04) (1.14e-04)* (1.72e-04) (9.89e-05) (2.38e-04) (2.37e-04) (1.07e-04) (2.16e-04) (1.72e-04)* visibility_ny_wup -1.70e-04 2.37e-05 3.88e-05 -7.25e-05 -9.17e-05 -5.60e-04 3.52e-04 -7.42e-05 -1.11e-04 -1.77e-04 (1.62e-04) (1.54e-04) (2.24e-04) (2.01e-04) (2.01e-04) (1.25e-04)*** (1.69e-04)** (2.25e-04) (1.29e-04) (2.29e-04) visibility_ny_wdown -1.92e-04 4.55e-05 2.39e-04 -6.26e-05 2.61e-04 -4.07e-04 4.01e-05 1.16e-05 5.13e-05 -2.98e-04 (1.97e-04) (7.77e-05) (4.94e-04) (1.39e-04) (4.93e-04) (1.59e-04)** (1.37e-04) (4.20e-04) (2.38e-04) (4.13e-04) pressure_up 3.79e-06 3.15e-06 3.10e-06 -4.10e-06 -1.13e-05 -2.71e-06 1.55e-07 4.30e-07 (4.05e-06) (3.01e-06) (3.56e-06) (2.75e-06) (5.54e-05) (1.42e-05) (3.33e-06) (7.00e-06) Standard errors in parentheses; * significant at 10%; ** significant at 5%; *** significant at 1%

63