Embed Size (px)
Citation preview

‘ITH the U.S. economy well into its fourth yearof expansion and approaching high rates of resourceemployment, renewed fears of accelerating inflationhave surfaced. One source of such concern is the
widely held view that the rate of inflation is a cycli-cal phenomenon, falling during recessions and risingas the economy approaches a cyclical peak. Accord-ing to this explanation, inflation is influenced by thedegree of slack in markets for goods, services, andresources. When there are ample supplies of unusedresources available, price pressures are presumed todiminish. Similarly, the inflation rate is believed toaccelerate as high employment conditions arise. Dur-ing such periods, resource availability becomes morelimited and firms, competing for scarce resources tomeet growing demand for their products, bid upresource prices and consequently product prices.’
Such an explanation has considerable appeal sinceit appears to be based upon standard supply-demandconsiderations, but the analysis is incomplete and itsuse for explaining inflation is limited. The explana-don obscures the nature of the inflationary process,fostering confusion about the cause of inflation and,more important, confusion over appropriate Govern-ment policies.
An alternative view contends that inflation resultsfrom a sustained rate of growth in the money stockwhich exceeds the growth rate of the quantity ofmoney demanded by the nation’s wealth owners.While the focus of this view is on the economy’srate of monetary expansion, it leaves open the possi-bility that in the short run, slack, or its absence, can
exert an additional independent influence on the rateof inflation. The analysis below indicates that suchan independent causal link between slack and theinflation rate is not supported by recent experience,once the rate of monetary expansion is taken intoaccount. An apparent relationship between the rateof inflation and the extent of slack in resource andgoods markets can easily arise, however. When mone-tary growth is procyclical, the timing of the impactof changes in monetary growth on the extent ofcapacity utilization and on the inflation rate can giverise to such observations.
For example, a recession can be caused by a slow-ing of the growth rate of the money stock. Such aslowdown in money growth, if sufficienfly sharp andmaintained, will reduce the growth rate of totalspending for final goods and services, expectationsof inflation, and the rate of inflation. As a conse-quence, increased slack (temporarily) and reducedinflation will both be observed, but each is solelythe result of the pattern of money growth. Thereneed be no independent causal relationship betweeneconomic slack and the inflation rate.
Similarly, an acceleration in monetary growth cancause a temporary reduction in slack in the economywhile fueling the longer-term trend rate of growth ofthe money stock and, consequently, the inflation rate.Such a sequence of events would ensure that an ac-celeration in the rate of inflation, as well as tightermarkets for resources, goods, and services, would beobserved at about the same time, but again solelyas a consequence of the pattern of money growth.
TIlE E%1.DEN{JE FIROM POSTWAR
RECESS.! JIll
Slack is not a well defined economic concept, butit refers to conditions in which existing resourcesare not utilized to the extent associated with “fullemployment.” Such underutilization is typically repre-sented by a higher unemployment rate or a lower
Page 7
Does the Stage of the Business CycleAffect the Inflation Rate?
JOHN A- TATOM
‘Such an explartation is part of the rationale for an impendingacceleration in inflation predicted by Irwin L. Kellner, Busi-ness Report, Manufacturers Hanover Trust, Spring 1978. Theview that slack, or the lack of it, influences the outlook forthe inflation rate has also been expressed recently by LindleyH. Clark, Jr. “How Much Slack?”, The Walt Street Journal,May 2, 1978 and in “The Labor Market May Be BreedingInflation,” Business Week, July 31, 1978, pp. 93-94. Suchanalysis also plays a crucial role in the Council of EconomicAdvisers’ recent discussion of the inflation problem. See Eco-nomic Report of the President, 1978, pp. 149-50, 188-72.

FEDERAL RESERVE SANK OF ST. LOUIS SEPTEMBER 1978
Table I
Inflation Rate and Postwar Recessions(Compound Annual Rates of Change of the GI4P Deflator)
lV/4LIV/49 111/5311/34 111/5711/58 It/6DL/6! tY.(~Y.Hv70 IY/73t/75
Inflalion Rate During:
Year Prior to Peak 4.1% I .9% 3.4% 1.6% 5.3% 7.5%
Recession (Peak to Trough) -2.D 1.5 .9 .6 5.1 Il .D
Year Following Recession 3.2 1.7 2.5 1.9 4.7 5.8
utilization rate of manufacturing plant and equip-ment than the rates achieved during economic booms.Even without a precise definition, however, mostobservers would agree that during a recession theeconomy has sufficient resources available at existingresource prices to produce goods and services at afaster rate than is observed. During the early periodsof economic recovery following a recession, moreslack would be present than during the peak periodbefore the recession. Thus, some evidence on therelationship between the degree of economic slackand inflation can be obtained by looking at the in-flation rate which existed before, during, and afterthe six postwar U.S. recessions. If inflation is a cycli-cal phenomenon, rising and falling with the paceof economic activity, then the inflation rate shouldbe greatest during the period immediately prior to acyclical peak, and lower during the recession andsubsequent recovery period.
In fact, the evidence from the four postwar reces-sions prior to the 1970s appears to be fairly consistentwith the cyclical view (Table I). In each case, infla-tion was not a significant problem during the reces-sion, averaging no more than a 1.5 percent annualrate. In the first recession (1948-49), prices actuallyfell, on average. Also in each case, the rate of infla-tion was lower than in the year prior to the recession.A comparison of the inflation rate in the year follow-ing a recession with that prevailing prior to therecession yields mixed results. In two of the firstfour recessions, prices rose slower after the recessionthan they did before the recession, and in two casesthey rose faster following the recession.
In contrast, the rate of inflation was relativelyhigh during the two most recent recessions. Nonethe-less, even these experiences appear to offer someevidence supporting the cyclical view. In the 1969-70recession, the inflation rate slowed slightly duringthe recession and in each of the two cases, the in-flation rate was lower in the year following therecession than it had been in the year preceding therecession. While the postwar evidence is not com-
pelling, it does, in the majority of cases, appear to beconsistent with the cyclical view of inflation.
TIlE CYCLICAL VIEW OF INFLATION
The cyclical view is embodied in what is referredto as the ‘Phillips Curve,” which indicates a trade-offrelationship between the rate of inflation and theunemployment rate such as that shown in Figure 1.2The existence of such a trade-off means that policy-makers can only choose among the available com-binations of unemployment and inflation in settingpolicies. In the cyclical context, it is clear from Fig-ure I that the lower unemployment rate associatedwith a cyclical peak requires a higher inflation rate,
Figure I
The Phillips Curve
2See A. W. Phillips, “The Relation Between Unemployment andthe Rate of Change of Money Wage Rates in the United King-dom, 1881-1957,” Economica (November 1958), pp. 283-99,and Richard C. Lipsey, “The Relation Between Unemploy-ment and the Rate of Change of Money Wage Rates in theUnited Kingdom, 1862-1957: A Further Analysis,” Economica(Februaiy 1960), pp. 1-31. The original analysis was statedin terms of a wage inflation-unemployment rate trade-off. Thiswas quickly translated into a price inflation-unemploymentrate trade-off by assuming that prices of goods and servicesare a constant mark-up over wage costs.
Rote
Rote
Page 8
FEDERAL RESERVE BANK OF ST. LOUIS SEPTEMBER 1978
while a lower inflation rate occurs only when theunemployment rate is higher, such as during arecession.
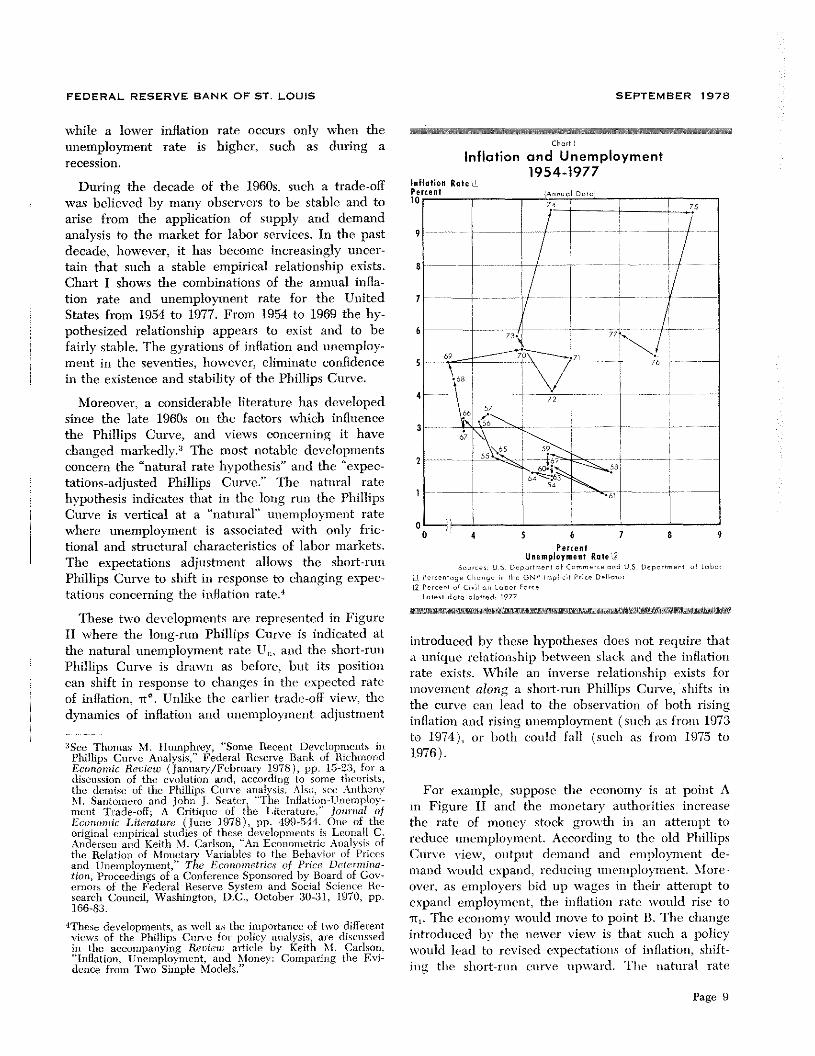
During the decade of the l960s, such a trade-offwas believed by many observers to be stable and toarise from the application of supply and demandanalysis to the market for labor services. In the pastdecade, however, it has become increasingly uncer-tain that such a stable empirical relationship exists.Chart I shows the combinations of the annual infla-tion rate and unemployment rate for the UnitedStates from 1954 to 1977. From 1954 to 1969 the hy-pothesized relationship appears to exist and to befairly stable, The gyrations of inflation and unemploy-ment in the seventies, however, eliminate confidencein the existence and stability of the Phillips Curve.
Moreover, a considerable literature has developedsince the late 1960s on the factors which influencethe Phillips Curve, and views concerning it havechanged markedly.3 The most notable developmentsconcern the “natural rate hypothesis” and the “expec-tations-adjusted Phillips Curve.” The natural ratehypothesis indicates that in the long run the PhillipsCurve is vertical at a “natural” unemployment ratewhere unemployment is associated with only fric-tional and structural characteristics of labor markets.The expectations adjustment allows the short-runPhillips Curve to shift in response to changing expec-tations concerning the inflation rate.4
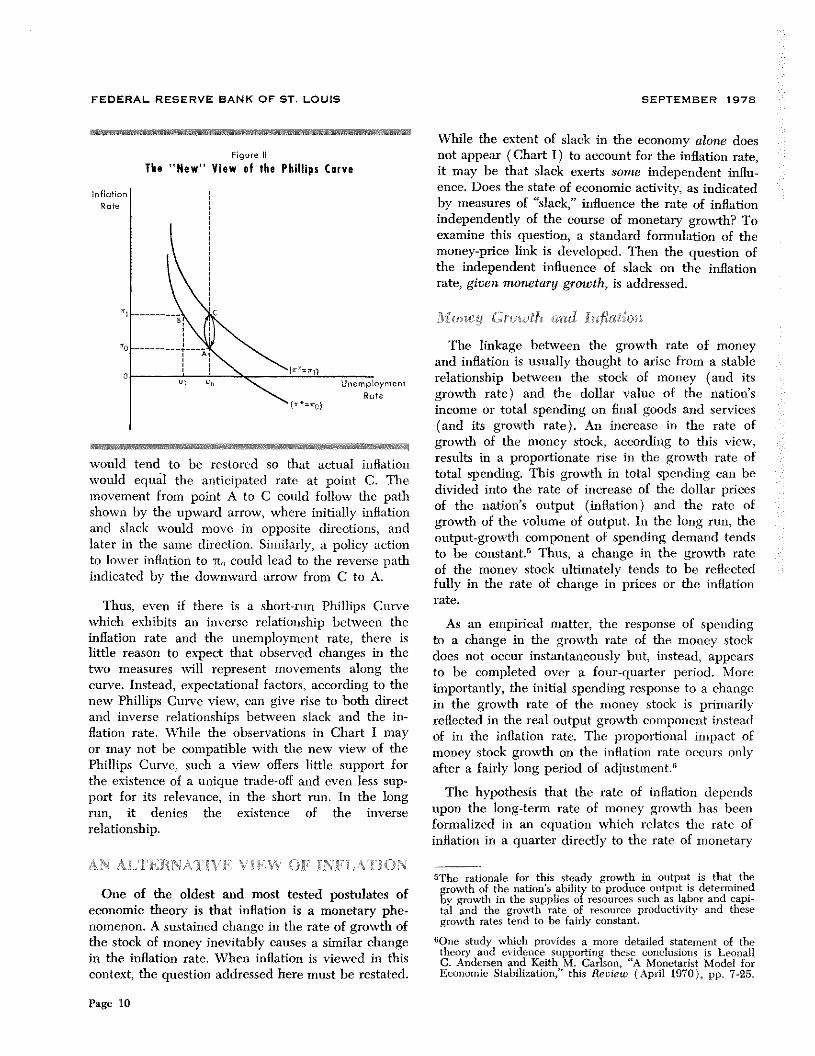
These two developments are represented in FigureII where the long-run Phillips Cnrve is indicated atthe natural unemployment rate U,, and the short-runPhilllips Curve is drawn as before, but its positioncan shift in response to changes in the expected rateof inflation, it
0. Unlike the eailier trade-off view, the
dynamics of inflation and unemployment adjustment
3See Thomas M. Humphrey, “Some Recent Developments inPhillips Curve Analysis,” Federal Reserve Bank of RichmondEconomic Review (January/February 1978), pp. 15-23, for adiscussion of the evolution and, according to some theorists,the demise of the Phillips Curve analysis. Also, see AnthonyM. Santomero and John J. Seater, “The Inflation—Unemploy-ment Trade-off; A Critique of the Literature,’ journal ofEconomic Literature (June 1978), pp. 499-541. One of theoriginal empirical studies of these developments is Leonall C.Andersen and Keith M. Carlson, “An Econometric Analysis ofthe Relation of Monetary Variables to the Behavior of Pricesand Unemployment,” The Econonsetries of Price Determina-tion, Proceedings of a Conference Sponsored by Board of Gov-ernors of the Federal Reserve System and Social Science Re-search Council, Washington, D.C., October 30-31, 1970, pp.166-83.
4These developments, as well as the importance of two differentviews of the Phillips Curve for policy analysis, are discussedin the accompanying Reeiew article by Keith M. Carlson.“Inflation, Unemployment, and Money: Comparing the Evi-dence from Two Simple Models,”
Chart
Inflation and Unemployment195 4-1977
PercentUnemploymeet Rate I
Soorcen; U.S. Department at Commerce and US Deportment at cabac
11 Percentage Change in tire ON? trnrpticit Price Detinrtot.[2 P,rce,,t at Cirriticne tabor Parr,.
Later’ data planed :977
introduced by these hypotheses does not require thata unique relationship between slack and the inflationrate exists. \Vhile an inverse relationship exists formovement along a short-run Phillips Cttrve, shifts inthe curve can lead to the observation of both risinginflation and rising unemployment (such as from 1973to 1974), or both could fall (such as from 1975 to1976).
For example, suppose the economy is at point Ain Figure II and the monetary authorities increasethe rate of money stock growth in an attempt toreduce unemployment. According to the old PhillipsCurve view, output demand and employment de-mane1 would expand, reducing unemployment. More-over, as employers bid up wages in their attempt toexpand employment, the inflation rate would rise to‘it,. The economy would move to point B. The changeintroduced by the newer view is that such a policywould lead to revised expectations of inflation, shift-ing the short-run curve upward. The natural rate
Inflation RatelPercentl0
Page 9
FEDERAL RESERVE BANK OF ST. LOUIS SEPTEMBER 1978
InflationRate
Figure II
The “New’’ View of the Phillips Curve
would tend to be restored so that actual inflationwould equal the anticipated rate at point C. Themovement from point A to C could follow the pathshown by the upward arrow, where initially inflationand slack would move in opposite directions, andlater in the same direction. Similarly, a policy actionto lower inflation to ~ could lead to the reverse pathindicated by the downward arrow from C to A.
Thus, even if there is a short-run Phillips Curvewhich exhibits an inverse relationship between theinflation rate and the unemployment rate, there islittle reason to expect that observed changes in thetwo measures will represent movements along thecurve. Instead, expectational factors, according to thenew Phillips Curve view, can give rise to both directand inverse relationships between slack and the in-flation rate. While the observations in Chart I mayor may not be compatible with the new view of thePhillips Curve, such a view offers little support forthe existence of a unique trade-off and even less sup-port for its relevance, in the short run. In the longrun, it denies the existence of the inverserelationship.
A~AIJfER1NATfl~E \ZIFTW.:i OF HOFF ATION
One of the oldest and most tested postulates ofeconomic theory is that inflation is a monetary phe-nomenon. A sustained change in the rate of growth ofthe stock of money inevitably causes a similar changein the inflation rate. When inflation is viewed in thiscontext, the question addressed here must be restated.
While the extent of slack in the economy alone doesnot appear (Chart I) to account for the inflation rate,it may be that slack exerts some independent influ-ence. Does the state of economic activity, as indicatedby measures of “slack,” influence the rate of inflationindependently of the course of monetary growth? Toexamine this question, a standard formulation of themoney-price link is developed. Then the question ofthe independent influence of slack on the inflationrate, given monetary growth, is addressed.
Bimneu (Oowth ~ Infl.atiori
The linkage between the growth rate of moneyand inflation is usually thought to arise from a stablerelationship between the stock of money (and itsgrowth rate) and the dollar value of the nation’sincome or total spending on final goods and services(and its growth rate). An increase in the rate ofgrowth of the money stock, according to this view,results in a proportionate rise in the growth rate oftotal spending. This growth in total spending can bedivided into the rate of increase of the dollar pricesof the nation’s output (inflation) and the rate ofgrowth of the volume of output. In the long run, theoutput-growth component of spending demand tendsto be constant.5 Thus, a change in the growth rateof the money stock ultimately tends to be reflectedfully in the rate of change in prices or the inflationrate.
As an empirical matter, the response of spendingto a change in the growth rate of the money stockdoes not occur instantaneously but, instead, appearsto be completed over a four-quarter period. Moreimportantly, the initial spending response to a changein the growth rate of the money stock is primarilyreflected in the real output growth component insteadof in the inflation rate. The proportional impact ofmoney stock growth on the inflation rate occurs onlyafter a fairly long period of adjustment.6
The hypothesis that the rate of inflation dependsupon the long-term rate of money growth has beenformalized in an equation which relates the rate ofinflation in a quarter directly to the rate of monetary
5The rationale for this steady growth in output is that thegrowth of the nation’s ability to produce output is determinedby growth in the supplies of resources such as labor and capi-tal and the growth rate of resource productivity and thesegrowth rates tend to be fahly constant.
6One study which provides a more detailed statement of thetheory and evidence supporting these conclusions is LeonallC. Andersen and Keith M. Carlson, “A Monetarist Model forEconomic Stabilization,” this Review (April 1970), pp. 7-25.
U1
Un
Rate
Page 10

FEDERAL RESERVE BANK OF ST. LOUIS SEPTEMBER 1978
Sh,d,d nr,rorrpr’n,e, p,rindnntbn,ir,ntrrernninrnn.
L ne,nrr.qnnrr,r ‘racer ganeth ‘nanette.nnnethrnr,ntthr ON? antler’,. andirn tan, qnnnrnrn in at,, tern,,.
intmt darn pinned; i,tlariar.2nd pr-nr’.,r in7Y. Mnr,p.2nd rican;,. lVza
growth which prevailed in the past. One such equa-tion, which can serve as the point of departure here,is:
(1)n
Mn P = uo + al ~ w~Mn M-m
where prices, F, are measured by the GNP deflator,and the money supply, M, is measured by Ml. Therate of increase of prices and money are measured bychanges in their logarithms (Mn).7 An estimate ofthe equation for the period 1/1954-1/1978 which con-siders money growth in the current and prior twentyquarters is:
20
(1’) 400’Aln P = -.- .460 + 1.140 1 wm 400’Aln M-t(—1.223) (12.409) 0
R2 .64
SE = 1.54
d = 1.07
The equation has the characteristics typically hypoth-esized — the constant tenn is not significantly different
~This equation is taken from Deals S. Kamosky, “The LinkBetween Money and Prices — 1971-76,” this Review (June1976), pp. 17-23. He argues that the sources of an auto-regression problem indicated by the Durban-Watson statisticfor the estimate in (1’) are the presence of wage and pricecontrols and their removal in the early 1970s as well as theprice level surge associated with the large increase in therelative price of energy resources in 1973-75. Such an auto-regression problem was not present up to mid-1971 and theproperties of the equation were the same. It must be notedthat the equation is intended as a short-hand description ofthe fundamental inflation process, and excludes other poten-tially important exogenous variables. The equation is esti-mated using a third degree polynominal with a zero tailconstraint.
from zero (t-statistics are indicated in parentheses)and the sum of the past money growth coefficients isnot significantly different from unity.
A simplification of this result is that the rate ofinflation equals the trend rate of money stock growth.Temporary developments, such as unusually adverseweather or strikes, may temporarily influence the in-flation rate from quarter to quarter, but the funda-mental, permanent component of the inflation rate isdetermined by the trend growth of the money stock.Before examining the independent influence of slack,given this view of inflation, it is useful to look at theexplanatory power of the trend rate of money stockgrowth for the period since 1954 (Chart II).
The errors produced with this simple relationshipare most notable over the 1971-75 period. In 1971-73the pattern of errors reflects the existence of wageand price controls and their removal. Initially theinflation rate was held below the rate indicated formoney growth but later, as controls ended, the infla-tion rate exceeded the rate of money growth. Thepattern of errors cancels out over a period longenough to allow prices to “catch up” to their normalrelation to the stock of money. From late 1973through early 1975, the relationship understates therate of increase in prices by a sizeable amount. Dur-ing this period, there was a substantial increase inthe relative price of energy resources which reducedthe economic capacity of the nation’s productivefacilities. This change caused a sharp, but brief,once-and-for-all rise in the level of prices in 1974, and
Cheer it
1954 1955 1956 1957 195$ 1959 1960 1961 1962 1963 1964 1965 1966 1967 196$ 1969 1970 1911 1917 1973 1974 1975 1976 1911 191$
Page 11

FEDERAL RESERVE BANK OF ST. LOWS SEPTEMBER 1978
the inflation rate quickly fell back in line with therate indicated by past money growth.°
Does the State of Economic Activity
Affect the Money - Price Link?
If the presence or absence of undenitilized re-sources has an independent influence on the rate ofinflation, then the discrepancy between the inflationrate and the trend growth of the money stock shouldbe systematically related to measures of the extentof “slack” in the economy. For example, using thecyclical view, one would expect that when there isevidence of slack in the economy, the rate of inflationwould tend to be smaller than monetary growth alonewould indicate. Moreover, the extent of the reductionin the inflation rate would presumably be related tothe extent of resource unemployment. Conversely,when the nation’s resources are fully employed, onewould expect, again using the cyclical approach, thatthe rate of inflation would exceed the rate indicatedby monetary factors alone.9
To examine this hypothesis, three measures ofslack are used, The first is the “CNP gap” whichmeasures the percent by which the economy’s abilityto produce goods and services, given its resourcesand their productivity, exceeds its actual output ofgoods and services as measured by real GNP.° Agiven percentage gap indicates the percentage bywhich the nation’s output of goods and services
could be expanded by fully utilizing the capital,labor, and energy resources available.
A second measure looks only at the extent of util-ization of labor services. This measure is the differ-ence between the actual unemployment rate of thecivilian labor force and the rate which would prevailif labor were fully employed.11 The third measurereflects slack in the utilization of capital resources.It is calculated by subtracting the Federal ReserveBoard capacity utilization rate from 87.5 percent. Thelatter figure is used here as full utilization of capac-ity, since it is the rate generally achieved at postwarcyclical peaks. Chart III shows the three measuresof slack,
According to the cyclical view, the relationship be-tween the discrepancies of the inflation rate fromtrend money growth in Chart II and the slack meas-ures in Chart III would he expected to be signifi-cantly negative. In fact, the simple correlation coeffi-cients of the inflation rate residuals are —.07, —.24, and—.27 for the GNP gap, excess unemployment rate, andexcess capacity measures, respectively. While thecorrelation coefficients all show the correct sign tosupport the cychcal view, they are much closer to zero(indicating no relationship) than they are to minusone (indicating perfect correlation). Moreover, regres-sion analysis of the inflation rate discrepancy-slackrelationship indicates no significant relationship be-tween inflation and slack, once trend money growthis taken into account, l’he average error between theinflation rate and trend money growth is not signifi-cantly different from zero in such regressions.12
1lThe full-employment unemnployment rate used here is thatprepared and described by Peter K. Clark, “Potential CNPin the United States, 1948-1980,” U.S. Productive Capacity:Estimating the Utilization Gap (Center for the Study ofAmerican Business, Washington University, St. Louis, 1977),pp. 21-66.
2For example, a regression equation for the hypothesis thatactual inflation during the year less trend money growththrough the current quarter depends upon the current gapyields the estimated equation:
100 ( luPt + ~—- in Pt) ---20 (in M1
—in Mt—ac) =.19— .O3G~
8For a discussion of the experience in 1971-76 and the supportit provides for the monetary explanation of inflation see Kar-nosky, “The Link Between Money and Prices.” The price levelimpact of the capacity loss, the mechanism linking prices to theloss of economic capacity, in 1973-74 is explained in more de-tail in Robert H. Rasche and John A. Tatom, “The Effects ofthe New Energy Regime on Economic Capacity, Production,and Prices,” this Review (May 1977), pp. 2-12.
9This statement of the hypothesis may be considered to be aversion of the new Phillips Curve viesv of inflation outlinedabove when an additional assumption is added to that view,The required assumption is that the expected rate of infla-tion, which shifts the Phillips Curve, is the rate indicatedby the rate of monetary expansion, i.e. equation (1’). Thendepartures of the actual inflation rate from the expected in-flation rate should be systematically related to the extentof slack, if the short-run Phillips Curve is negatively sloped.Viewed in this light, the evidence presented below is a testof the existence of a negatively sloped short-run Phillips Curve,given the expectations assmnption.
iOThc potential output series used here is a modified seriesbased upon the methods discussed in Robert H. Rasche andJohn A. Tatom, “Energy Resources and Potential CNP,” thisReview (June 1977), pp. 10-24. The series is prepared bythis Bank and is available, together with a description of themethod, from the author.
Page i2
where Pt is the price index in quarter t, M~is the stock ofmoney in quarter t and Ct is the existing gap in period t.The standard error of the equation is 1.20, and the t-statisticsfor the constant and G coefficient are 1.23 and --.66, respec-tively. Thus, a significant negative relationship can be re-jected at the 99 percent confidence level. In addition thestatistically insignificant constant indicates a zero mean dif-ference between trend money growth and the subsequentinflation rate. The adjusted R
2is zero to two decimal places.
The equations referred to in the text are esthuated with aCochrane-Orcutt adjustment and in no case does the constanthave a t-statistic larger than .96, or a slack coefficient havea t-statistic larger than 1.31, in absolute value.

FEDERAL RESERVE BANK OF ST. LOUIS SEPTEMBER 1976
Chart III
Measures of Slack
IIExcess Unemployment Percent
—4
F-- ~P
\~J/%~
F
JI1~____\4~-~-K
I Kill4 il~c~iii I
JEL~UJL U_
iUflk~IiJA
~~1F ] F
I SExcess Capacity
~5: Sinr/. ~c ~41I
F F F 4
41-Fl
F//~ F F F F F
Flii
F
411F/41 F F
Shoded areas represent periods oi business recessionsLatest data platted, 1st quarter
A more detailed test of the hypothesis that slackinfluences the rate of inflation is to use equation (1’)directly. Then the cyclical view may be regarded asan argument that “initial conditions” matter or thatthe predetermined stage of the business cycle is asignificant omitted variable in equation (1) and (F).This hypothesis can be tested by adding the laggedvalue of a measure of slack to equation (1’). Table IIshows the results obtained for three alternative mcas-ures of slack: the GNP gap, the excess of the unem-
Sources, uS. Department of Labor and US. Department of Commerce
3
2
0
~~1
-2
6
3
0
-3
-6
ployment rate over the full-employment unemploy-ment rate, and the Federal Reserve Board’s capacityutilization rate.’3 It should be noted that the capacity’
‘°Whcn a Cochrane-Orcutt procedure is used to adjust for thesignificant autoregression in the equations, none of the re-sults are altered except that the d-stntistics become satisfac-tory. The results reported in Table H were also obtained forthe shorter sample period 1/1954-11/1971. An alternativehypothesis is that slack slows inflation, but only when it islarge and, otherwise, inflation is detemsined only by moneygrowth. Using a dummy variable of one for quarters in which
Percent
I3
2
0
—I
-2
Percent20
15
10
S
0
-5
Percent
— 20
15
10
5
0
-5
Percent9
1954 1956 1958 1960 1962 1964 1966 1968 1910 1912 1974 1976 1978
Page 13

Teblo II
Estimates of the Effect of Initial Conditions(1/1954 — 1/1978)
Sum ofMoneyGrowth
Logged Vorioble Added coeffi- ~ocffi-to Equ olion ~I) dent t.stoti slit dents t-stotisl,c
Gop .07 .90 1.13 12.26
Excess Unemployment .03 .16 1.14 12.29
Copocily Utilizolion Rote .03 .70 1.14 12.38
Durbon.Wotsond - statistic
.64 110
64 1.08
.64 1.08
Alt s,,’Iar,,: ii., .sni.,r,,l L—l’S hEld ‘ens.rlcss’ln; I ‘‘1st. a r i n.I cop sti, I II m,.,cv ~ —h . a
Lsl.i it nd 31 PU ut.’’.i it,~ cIrt,~
utilization rate measures the inverse of slack heresince the rate is not subtracted from the arbitraryhigh-employment benchmark of 87.5 percent as inChart III. The effect of initial slack on the rate ofinflation has the wrong sign (positive when it ishypothesized to be negative) in the first two cases andis not significantly different from zero for any slackmeasure. The inclusion of a slack variable has nonoticeable effect on the monetary growth coefficientor on the quality of the fit of the equation.’4
The monetarist view also suggests that the extentof slack is influenced, in the short run, by changes inthe rate of monetary growth, but that in the long runsuch changes have no effect on real economic activ-ity. Table III presents estimates of the three slackvariables as determined by the current and pastmoney growth rates contained in the equations ofTable 11.15 In each case, the sum of the moneygrowth coefficients is not significantly different from
SEPTEMBER 1978
zero, verifying the hypothesized absence of long-runreal effects of monetary growth.1°
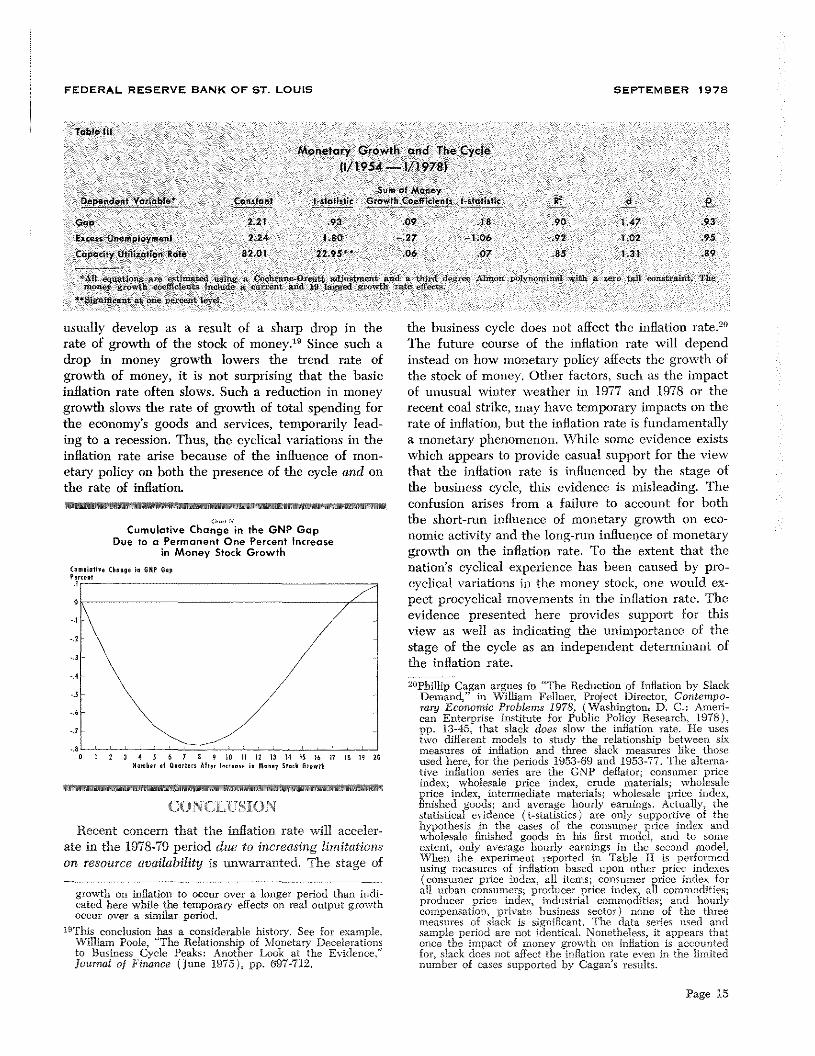
It is useful to examine the pattern of response of aslack variable, such as the GNP gap, to a change inthe rate of money growth, since it sheds more lighton the cyclical variability introduced by a change inthe rate of money growth. Chart IV shows the patternof response of the GNP gap to a one percent increasein the rate of growth of the money stock obtainedfrom the first equation in Table 111.17 For the firsteight quarters of such an increase in money growth,the GNP gap is reduced until it is about .77 percent-age points smaller. In the subsequent three years,however, such money growth leads to an increase inthe GNP gap so that, in the long run, there has beenno significant change in the size of the gap. Thus, anincrease in the rate of money growth has real effectsin the short run as the GNP gap is reduced. Thereare no long-run real effects of a permanent changein the rate of money growth; only the inflation rateis affected~’8
While the analysis above shows that the stage ofthe business cycle does not exert an independent in-fluence on the rate of inflation, the sometimes con-trasting evidence from recession experiences may bedisconcerting. The apparent conflict is easily resolvedby the modern view of the Phillips Curve, which sug-gests such dynamic changes may somethnes occur,and by the monetary explanation of inflation andshort-run fluctuations in economic activity. Recessions
FEDERAL RESERVE BANK OF ST. LOUIS
slack is greater than one standard deviation above its samplemean, and zero otherwise again does not alter the equation(1’) and the dummy variable is statistically insignificant ineach case.
~Note that the d-statistic is not affected either which indicatesthat slack is apparently not one of the important missingvariables. An alternative hypothesis might be that it is therate at which slack is reduced, rather than the level ofslack which affects the inflation rate. While it is difficult toargue that such a rate is an exogenous variable, includingquarterly changes in the slack variables in the reduced formabove yields the same results as for the level of slack, thatis, they exert no independent influence on the inflation rate.
‘5The high adjusted R2
results from the use of a Cochrane-Orcutt adjustment. Without such an adjustment, the adjustedR
2is smaller than .4 for each equation, indicating that multi-
collinearity is not likely to be the source of the lack ofsignificance of the slack variables in Table II.
Page 14
‘°Theresults tend to support another major proposition con-cerning the functioning of the economy — the economy isinherently stable. Neither the gap equation nor the excessunemployment equation, yield a constant term which is sig-nificantly different from zero, indicating that while changesin the rate of money growth affect the output gap and ex-cessive unemployment in the short run, both tend to zero inthe long ruu — independently of a constant rate of moneygrowth. Siniilarly, the significant constant term in the capac-ity utilization rate equation of 82 percent may be consideredthe steady-state capacity utilization rate which is also inde-pendent of any given sustained rate of money grow-tb. Asimilar conclusion using annual data and a model of thecapacity utilization rate amy be found in John A. Tatom,“The Measurement and Meaning of Potential Output — AComment on the Perloff and Wachter Results,” Carnegie-Rochester Conference Series on Public Polic}, Journal ofMonetary Economics, forthcoming January 1979. Not only isthe natural rate the same as that derived here, the timingof the adjustment of capacity utilization to changes in thensoney growth rate is also the same as that used here,
‘~Thet-statistics of the individual coefficients of money growthexceed 2.9 in every quarter except at the turning pointwhere the change in the gap is quite small in quarters6 to 8.
1tSimilar qualitative results have recently been found by RobertJ, Barro, “Unanticipated Money, Output, and the Price Levelin the United States,” Journal of Political Economy (August1978), pp. 549-80. Using a rational expectations model andannual data, he finds the timing of the impact of money
FEDERAL RESERVE BANK OF ST. LOUIS SEPTEMBER 1978
Table Ill
Monetary Growth and The Cycle
(1/1954 — 1/1978)
Sum of Money -
~!eend,nt Voricble Constant t-statistic Growth coefficients I-statistic d P
Gop 2.21 .93 .09 .18 .90 1.47 .93
Excess Unemployment 2.24 1.80 —.27 1.06 .92 1.02 .95
Capacity Utilization Rote 82.01 22-95’ - .06 .07 .85 1.3] .89
-‘All equations nv UtinlILteli ~Firig I (‘fl,’hiiLflL~_I) tat ~tttt,~trnc’ritawl a U nI is’ _ivr .\~nn.n ji’’h.inn.inal v.ith a, Cii. SILO ,‘n’i~t’aPt. ri..rn’.nry gi~o..’th euclid, .n L — nctude au’,,.’, sit at’0 10 tagged non Lb slut’ Er,., t.
*~SiylnhiCar.t at uric pgireni let i-I.
usually develop as a result of a sharp drop in therate of growth of the stock of money.19 Since such adrop in money growth lowers the trend rate ofgrowth of money, it is not surprising that the basicinflation rate often slows. Such a reduction in moneygrowth slows the rate of growth of total spending forthe economy’s goods and services, temporarily lead-ing to a recession. Thus, the cyclical variations in theinflation rate arise because of the influence of mon-etary policy on both the presence of the cycle and onthe rate of inflation.
Cumulative Change in the GNP GapDue to o Permanent One Percent Increase
in Money Stock Growth
CONCLUSION
Recent concern that the inflation rate will acceler-ate in the 1978-79 period due to increasing limitationson resource availability is unwarranted. The stage of
growth on inflation to occur over a longer period than indi-cated here while the temporary effects on real output growthoccur over a similar period.
~0This conclusion has a considerable history. See for example,William Poole, “The Relationship of Monetary Decelerationsto Business Cycle Peaks Another Look at the Evidence,”Journal of Finance (June 1975), pp. 697-712.
the business cycle does not affect the inflation rate.2°The future course of the inflation rate will dependinstead on how monetary policy affects the growth ofthe stock of money. Other factors, such as the impactof unusual winter weather in 1977 and 1978 or therecent coal strike, may have temporary impacts on therate of inflation, but the inflation rate is fundamentallya monetary phenomenon. While some evidence existswhich appears to provide casual support for the viewthat the inflation rate is influenced by the stage ofthe business cycle, this evidence is misleading. Theconfusion arises from a failure to account for boththe short-mn influence of monetary growth on eco-nomic activity and the long-run influence of monetarygrowth on the inflation rate. To the extent that thenation’s cyclical experience has been caused by pro-cyclical variations in the money stock, one would ex-pect procyclical movements in the inflation rate. Theevidence presented here provides support for thisview as well as indicating the unimportance of thestage of the cycle as an independent determinant ofthe inflation rate.2
°PhillipCagan argues in “The Reduction of Inflation by SlackDemand,” in William Fellner, Project Director, Contempo-rary Economic Probbarns 1978, (Washington
1D. C.: Ameri-
can Enterprise Institute for Public Policy Research, 1978),pp. 13-45, that slack does siow the inflation rate. He usestwo different models to study the relationship between sixmeasures of inflation and three slack measnres like thoseused here, for the periods 1953-69 and 1953-77. The alterna-tive inflation series are the GNP deflator; consumer priceindex; wholesale price index, crude materials; wholesaleprice index, intermediate materials; wholesale price index,finished goods; and average hourly earnings. Actually, thestatistical evidence (t-statistics) are only supportive of thehypothesis in the cases of the consumer price index andwholesale finished goods in his first model, and to someextent, only average hourly earnings in the second model.When the experiment reported in Table II is performedusing measures of inflation based upon other price indexes(consumer price index, all items; consumer price index forall urban consumers; producer price index, all commodities;producer price index, industrial commodities; and hourlycompensation, private business sector) none of the threemeasures of slack is significant. The data series used andsample period are not identical, Nonetheless, it appears thatonce the impact of money growth on inflation is accountedfor, slack does not affect the inflation rate even in the limitednumber of cases supported by Cagan’s results.
C,e,ltfl,, Chosge I, Cli? SepPurse,?
S 1 2 3 4 5 6 7 5 9 IS II 2 3 54 55 56 II Ii 9 25SI seb,, ,t O,?,?,r, Afl,r Is,,,,,, is lisp,, Sick G,owrI,
Page 15