Embed Size (px)
Citation preview

Does the factor theory of satisfaction explain political voting behaviour?
Schofield, P and Reeves, P
http://dx.doi.org/10.1108/EJM0820140524
Title Does the factor theory of satisfaction explain political voting behaviour?
Authors Schofield, P and Reeves, P
Type Article
URL This version is available at: http://usir.salford.ac.uk/35289/
Published Date 2015
USIR is a digital collection of the research output of the University of Salford. Where copyright permits, full text material held in the repository is made freely available online and can be read, downloaded and copied for noncommercial private study or research purposes. Please check the manuscript for any further copyright restrictions.
For more information, including our policy and submission procedure, pleasecontact the Repository Team at: [email protected].

'This article is © Emerald Group Publishing and permission has been granted for this version to appear here (http://dx.doi.org/10.1108/EJM-08-2014-0524). Emerald does not grant permission for this article to be further copied/distributed or hosted elsewhere without the express permission from Emerald Group Publishing Limited.'
Does the Factor Theory of Satisfaction Explain Political
Voting Behaviour?
Peter Schofield and Peter Reeves
Abstract
Purpose – The validity of the three factor theory of satisfaction in explaining
consumer decision making for products and services is well established. This paper
explains voter perceptions and voting behaviour in the 2010 UK General Election on
the basis of this theory, by evaluating the differential impact of government
performance on key political issues defined as hierarchical voter satisfaction factor
types.
Design/methodology/approach – British Election Survey (2010) data is used to test
the relative influence of hierarchical voter satisfaction factor types in predicting: (1)
the perceived overall performance of the former Labour government; (2) actual voting
behaviour. Sequential and multinomial logistic regression models are used in (1) and
(2), respectively.
Findings – ‘Basic’ factors explain more of the variance in perceived overall
government performance and voting behaviour than ‘performance’ factors. There are
significant positive main and interaction effects on Conservative and Liberal
Democrat party votes from Labour’s under performance on the ‘basic’ factors. The
results have important implications for political marketing and voting behaviour
research.
Originality/value – The study establishes the relevance of the three factor theory of
satisfaction within a political marketing context. It demonstrates that, controlling for
party loyalty, perceived government performance on the hierarchical voter satisfaction
factors explains voter perceptions and voting behaviour to a significant degree. In
particular, it highlights the criticality for voting behaviour of both the direct and
indirect impacts of ‘basic’ factor under performance.
Keywords – political marketing, three factor theory, voting behaviour,
Paper type - Research paper
Acknowledgement – The authors would like to thank Professors’ Harold, D. Clarke,
David Sanders, Marianne, C. Stewart, Paul Whiteley and the University of Essex for
making available on-line the British Election Study (BES 2010) database which
provides the data for this study.

'This article is © Emerald Group Publishing and permission has been granted for this version to appear here (http://dx.doi.org/10.1108/EJM-08-2014-0524). Emerald does not grant permission for this article to be further copied/distributed or hosted elsewhere without the express permission from Emerald Group Publishing Limited.'
Introduction
In recent decades the study of political marketing has emerged as a ‘significant area of
international research in contemporary marketing’ (Harris and Lock, 2010, p.297)
with a number of different trajectories. One of these trajectories has been the
application of consumer behaviour theory to voting behaviour (Ben-ur and Newman,
2010; Newman, 1999; Newman, 2002; Newman and Sheth, 1985). A number of
factors have been found to influence the decisions of voters including: demographics,
involvement, issues and policies, social imagery, emotion, candidate image, current
events, personal events, epistemic issues, identity and partisanship. Our study, while
in the tradition of attempting to understand voter perceptions and behaviour,
represents a departure from the existing models in this stream of political marketing,
in that it explains voting behaviour using the ‘three factor theory of satisfaction’
(Kano et al, 1984). The validity of the ‘three factor theory’ to explain consumer
satisfaction and behavioural intention has been established in other areas of marketing
(e.g. Deng and Pei, 2009; Matzler et al, 2004; Mittal et al, 1998), but hitherto its
relevance to political marketing, and in particular to explaining actual voting
behaviour remains untested.
Traditional models of consumer satisfaction are based on the assumption that
attribute-level performance and both overall satisfaction and behaviour, or
behavioural intention, are linked through a linear and symmetrical relationship. As
attribute performance increases, satisfaction and intention to both positively endorse
the product or service and to repurchase also increase, the opposite being the case
when attribute performance decreases. However, an increasing body of research has
found evidence to show that the relationship between attribute-level product
performance and both satisfaction and behavioural intention is nonlinear and
asymmetrical for certain product and service attributes (e.g. Deng and Pei, 2009; Oh,
2001; Matzler et al, 2003). This relationship is explained by the three factor theory,
which is underpinned by the notion of a dynamic importance construct, i.e. the
connection between the perceived performance and perceived importance of attributes
is causal. Thus, when performance changes importance also changes according to the
downward sloping performance-importance response (PIR) function, which is
typically steeper at lower than higher performance due to higher sensitivity to the
former (Deng et al, 2008; Matzler and Sauerwein, 2002; Sampson and Showalter,
1999). Within a political marketing context, it follows that where an issue is
important for voters, under performance by a political party on this issue is likely to
have a negative impact on votes ceteris paribus. It is therefore surprising that voting
behaviour has not yet been considered within the context of the three factor theory of
satisfaction despite the growing body of research relating to voters as consumers
(O’Cass, 2002).
The purpose of this research was to assess the predictive ability of a voting
behaviour model based on the three factor theory of satisfaction using data from the
2010 UK General Election. The model uses measures of voter satisfaction with
Labour government performance on nine issues over their previous term of office as
independent variables. The validity of this approach is supported by the fact that
'This article is © Emerald Group Publishing and permission has been granted for this version to appear here (http://dx.doi.org/10.1108/EJM-08-2014-0524). Emerald does not grant permission for this article to be further copied/distributed or hosted elsewhere without the express permission from Emerald Group Publishing Limited.'
‘only important issues really affect voting’ (Konstantinidis, 2008 p. 325). We
examined the impact of both party loyalty and voter satisfaction factor type,
controlling for loyalty, on both the perceived overall performance of the Labour
government and on actual voting behaviour in 2010.
Theoretical Background and Hypotheses
Predicting Voting Behaviour
Some of the earliest interest in voters as consumers emanates from consumer research
studies largely undertaken in the 1970s, which focussed on demographic variables and
the notion of involvement in various U.S electoral contests (Nakanishi, Cooper and
Kassarjian, 1974; Rothschild, 1978; Swinyard and Conney, 1978). A limitation of
this early research is that it uses a variety of variables, communication tools and
electoral contexts which limits its theoretical and empirical utility. However, this was
followed by a major theoretical advancement in voter behaviour prediction (Newman,
1981; Newman and Sheth, 1985). Newman and Sheth (1985) predicted political
choices with over 90% accuracy, by using seven variables: issues and policies, social
imagery, emotional feelings, candidate image, current events, personal events in the
voter’s life, and epistemic issues. Interestingly, their model exceeds predictions
which were made on the basis of either demographics or involvement. It was later
refined to a five variable predictive model based on political issues, social imagery,
candidate personality, situational contingency and epistemic value (Newman and
Sheth, 1987). The model has been replicated on a number of occasions (Ben-ur and
Newman, 2010; Newman, 1999; Newman, 2002). Its fundamental axiom is that
voters are consumers of service offered by a politician or political party, and the
results consistently demonstrate the impressive predictive utility of the model. For
example, Newman’s (2002) study showed 98.9% and 97.8% predictive accuracy for
party and candidate choice, and Ben-ur and Newman’s (2010) model achieved 93%
predictive accuracy for a party candidate. More recently, the original model
(Newman and Sheth, 1985) has been adapted and re-examined in international
comparative studies. The variables included issues and policies, current events,
candidate image, personal events, social imagery, epistemic issues, media and
emotion (See Cwalina et al, 2004; 2010). The results indicate that while the model is
useful as a theoretical framework for predictive analysis of voter behaviour, not all the
variables are relevant; the variables with greatest predictive power will be determined
on an election by election basis (O’Cass, 2002).
O’Cass (2002) returns to the notion of political involvement and to
demographics in his study of a contested seat in the Federal Lower House of
Representatives in Australia. He found that involvement was influenced by gender
and education level, and that involvement affects satisfaction with politics and choice
of both candidate and party. O’Cass and Nataraajan (2003), using data collected from
an Australian state election, found that voter concern significantly influences voter
involvement. They also showed that voter involvement influences both voter
confidence and satisfaction, and that voter confidence influences satisfaction. A
further study by O’Cass (2003) found that locus of control over political

'This article is © Emerald Group Publishing and permission has been granted for this version to appear here (http://dx.doi.org/10.1108/EJM-08-2014-0524). Emerald does not grant permission for this article to be further copied/distributed or hosted elsewhere without the express permission from Emerald Group Publishing Limited.'
circumstances influences voter decision involvement and vice-versa, and that voters’
perception of risk influences their level of involvement. Additionally, voter feelings
and involvement were found to influence voter satisfaction, while voter feelings,
involvement and satisfaction all individually influenced voting stability.
Baines et al (2003) examined national policies, local policies, leaders, values
and candidates as indicators of voting behaviour during the 2001 British General
Election. They found that respondents’ perceived performance on these issues
predicted voting intention more effectively than their perceived importance, voter
demographics or characteristics. Moreover, in a later study, based on the 2005 British
General Election, Baines et al (2005) found that party image perceptions are also
better predictors of voting intention than demographics for major U.K political
parties.
More recent studies have employed alternative approaches in an attempt to
understand voting behaviour in specific political contexts. Newman (2007) has
undertaken a longitudinal analysis of U.S. elections between 1980 and 2000 using
fuzzy set analysis. French and Smith (2010) have adopted a mental mapping
approach to understand how voters view U.K political brands. Phillips et al (2010)
used means end laddering to examine how voters may be segmented in accordance
with their decision processes to facilitate campaign message design. Additionally,
Baines et al (2011) used longitudinal real time tracking studies of floating voters in
the 2010 British General Election to gain insights into how communication channel
experiences influence floating voter decisions.
Voter Loyalty
The concept of loyalty and its influence on voting behaviour has been under
researched in the political marketing literature, although there has been some limited
discussion in terms of political brand loyalty. Needham (2006) argues that political
parties, like business organisations, need to focus on repeat business given the
proliferation of choice and social dealignment. Butler and Collins (1994) have also
discussed the issue of voter loyalty in regard to the tactical voter or counter-consumer,
who may vote for a party (or candidate) which is not their first choice in order to
prevent an unwanted party/candidate winning an electoral contest. Moreover, Gerber
et al (2010) have examined the influence of partisan identification on political
outcomes and found a causal relationship between partisanship and voting behaviour.
Loyalty’s lack of consideration in political marketing appears to reflect the
debate over the meaning of the loyalty construct in the wider marketing literature.
Day (1969) argued that loyalty consists of both attitudinal and behavioural
dimensions, while in the context of branding, Jacoby and Chestnut’s (1978) seminal
text referred to a wide range of competing loyalty measures. Nevertheless, a
significant number of methodologically robust quantitative studies in the last 20 years
have continued to examine brand loyalty from the behavioural perspective (e.g.
Bayus, 1992; Dekimpe et al, 1997; Liu, 2007; Sharp, 2010).

'This article is © Emerald Group Publishing and permission has been granted for this version to appear here (http://dx.doi.org/10.1108/EJM-08-2014-0524). Emerald does not grant permission for this article to be further copied/distributed or hosted elsewhere without the express permission from Emerald Group Publishing Limited.'
Dick and Basu (1994, p. 99) define customer loyalty “as the strength of the
relationship between an individual’s relative attitude and repeat patronage”. They
note that customer loyalty can be affected by cognitive, affective and conative
antecedents. They also contend that there can be: (1) latent loyalty where there is low
repeat patronage despite a high relative attitude towards the brand, and (2) spurious
loyalty where there is a high level of repeat patronage but low relative attitude
towards the brand (ibid p. 101). Oliver (1999) classifies loyalty according to four
sequential phases: cognitive, affective, conative, and action loyalty, a typology which
has been influential in the design of a number of other studies (e.g. Evanschitzky and
Wunderlich, 2006; Olsen et al., 2013; Yi and La, 2004).
There is debate within the literature as to whether satisfaction automatically
leads to consumer loyalty. A stream of research has shown that the satisfaction
loyalty link is a complicated and sometimes unpredictable relationship (Anderson and
Mittal, 2000; Agustin and Singh, 2005; Baumann et al, 2012; Mittal, and Lassar,
1998; Mittal and Kamakura, 2001; Oliva et al, 1992). Nevertheless, a number of
studies have found a relationship between satisfaction and intention to purchase (e.g.
Cronin et al, 1992; Oliver, 1980; Oliver and Swan, 1989). However, it should be
noted that intention does not necessarily lead to action (Oliver op cit).
More recently, the focus of loyalty has begun to shift to understanding
attitudinal loyalty and how it influences the relationships consumers have with their
brands (e.g. Aurier and Lanauze, 2012). For example, Fournier and Yao (1997) use
qualitative methods to critique the ‘black and white’ dichotomous notion of brand
loyalty/ brand disloyalty, and argue for a refocus of research on consumer brand
relationships. Delgado-Ballester and Munuera-Alemán (2001) have also examined
customer trust in the context of consumer brand loyalty. In addition, whilst earlier
loyalty research tended to examine products, more recent studies have focussed on the
service sector (e.g. Han et al, 2008; Harris and Ezeh, 2008; Moore et al, 2012).
Within this context, Wirtz and Mattilla (2003) have argued that consumers are loyal to
services to reduce risk in their consumption behaviour. This resonates with the
fundamental maxim of Newman and Sheth’s (1985) predictive model of voter
behaviour: voters are consumers of service offered by a politician or political party.
From this perspective, loyalty is defined behaviourally as repeat voting for the same
political party. Within the framework of our study, it was important to identify the
influence of loyalty on voter perceptions of party performance and on voting
behaviour, and then control for loyalty to test the relevance of the three factor theory.
We therefore hypothesised that:
H1. Loyalty has a significant influence on perceived political party performance;
H2. Loyalty has a significant influence on voting behaviour.
The Factor Theory of Satisfaction in Politics
Prior research has confirmed the existence of three types of hierarchical factors based
on their importance in relation to overall performance or satisfaction (e.g. Anderson
and Mittal, 2000; Deng and Pei, 2009; Matzler and Sauerwein, 2002; Ting and Chen,

'This article is © Emerald Group Publishing and permission has been granted for this version to appear here (http://dx.doi.org/10.1108/EJM-08-2014-0524). Emerald does not grant permission for this article to be further copied/distributed or hosted elsewhere without the express permission from Emerald Group Publishing Limited.'
2002). We have reinterpreted Matzler et al.’s (2004) description of the three factors
(basic, excitement and performance factors) to conceptualise the theory of voter
satisfaction within a political marketing context, as follows:
1. Basic factors (dissatisfiers). These are minimum requirements that cause
voter dissatisfaction if they are not delivered, but do not result in voter
satisfaction if they are delivered.
2. Excitement factors (satisfiers). These factors increase voter satisfaction if
delivered but do not result in voter dissatisfaction if not delivered. They
surprise and delight the voter.
3. Performance factors (hybrid factors). These factors produce satisfaction for
voters if delivered and lead to dissatisfaction for voters if they are missing.
Theoretically, excitement factors become important determinants of voter
satisfaction when overall performance is high, but are unimportant when overall
performance is low. Conversely, basic factors are critical when performance is low
and their influence on overall voter satisfaction decreases when performance
increases. By comparison, performance factors produce voter satisfaction when
performance is high and dissatisfaction when performance is low. It therefore follows
that if either important performance factors or basic factors are perceived to be under
performing, the negative impact on voter satisfaction is likely to be substantial,
whereas under performance on excitement or unimportant performance factors is
likely to be less critical. This paper tests the relevance of the factor theory of
satisfaction in the context of voter perceptions and behaviour. It does this by
examining the differential effects of the Labour party’s performance on issues which
fulfil basic requirements and minimise voter dissatisfaction (basic factors), compared
with those which add value and increase voter satisfaction (excitement factors) and
those which do both (performance factors). Given the result in the 2010 UK General
Election i.e. Labour party defeat, we therefore hypothesised, while controlling for
loyalty (based on voting behaviour in the 2005 General Election), that:
H3. Basic factor performance has the highest impact on the perceived overall
performance of the Labour party;
H4. Basic factor performance has the highest impact on voting behaviour.
Methodology
Participants and Variables
The British Election Study (BES, 2010) data set (n = 927) was used as the sample for
the study; all demographic details are provided in Table 1. The BES (2010) data set
provided respondent ratings on the former Labour government’s ‘handling’ of nine
key issues: crime, immigration, NHS, terrorism, the economy (generally), war in
Afghanistan, the financial crisis, education and taxation. These performance
measures, together with the data set’s measure of the perceived overall performance
of the former Labour government, facilitated the testing of the factor theory of
satisfaction in this context. The BES (2010) data set also featured each respondent’s
voting behaviour in both the 2010 and 2005 UK General Elections; this provided a

'This article is © Emerald Group Publishing and permission has been granted for this version to appear here (http://dx.doi.org/10.1108/EJM-08-2014-0524). Emerald does not grant permission for this article to be further copied/distributed or hosted elsewhere without the express permission from Emerald Group Publishing Limited.'
behavioural measure of loyalty: ‘action loyalty’ (Oliver, 1999). The impact of both
party loyalty and the former Labour government’s handling of each of the nine issues,
statistically controlling for loyalty, on their perceived overall performance as a
government and on voting behaviour in the 2010 election, could therefore be assessed.
Sequential multiple regression and multinomial logistic regression models,
respectively, were used for this purpose.
The use of policies as performance measures in the context of the factor theory
of satisfaction is supported by the criticality of the concept of market orientation in a
political marketing context (Ormrod and Henneberg, 2010a; 2010b) in that party
policies must satisfy voters. As such, party performance on key policies is a viable
measure of voter satisfaction. We acknowledge that a range of factors in addition to
policy issues have been found to influence voter perceptions and behaviour (e.g.
Baines et al, 2011; Cwalina et al, 2004; 2010; O’Cass, 2002; Newman and Sheth,
1987). However, they were either not suitable for use as performance measures, not
directly comparable with the policy issue performance measures because of the
response set or scale formats which were used in the BES (2010), or not measured in
the survey and therefore unavailable. By comparison, the directly comparable policy
issue ratings enabled both their classification as hierarchical voter satisfaction factor
types and the evaluation of their differential impact on perceived overall performance
and voting behaviour. This, in turn, enabled an assessment of the viability of the
factor theory of satisfaction in regard to explaining voter perceptions and behaviour in
the 2010 UK General Election.
The scaled data for both perceptions of the former Labour government’s
‘handling’ of the nine issues and the ‘general performance’ measure was reverse
coded (using the original labels) from low positive values to low negative values. As
such, perceptions of the former Labour government’s handling of the issues was
assessed on 5-point scales, labelled ‘Very Badly’ (1), ‘Fairly Badly’ (2), ‘Neither’ (3),
‘Fairly Well’ (4) and ‘Very Well’ (5). The perceived overall performance of the
former Labour government was assessed on a 5-point scale, labelled ‘Very Bad Job’
(1), ‘Bad Job’(2), ‘Neither’ (3), ‘Good Job’ (4) and ‘Very Good Job’ (5).
Table 1 about here
Method of Classification for the Hierarchical Factors
The hierarchical factor structure of the nine key issues and the asymmetric impact of
the Labour party’s handling of the issues on their perceived overall performance in the
2010 election were identified using penalty-reward contrast analysis. Regression
analysis with dummy variables was employed to identify value-enhancing
requirements (excitement factors) and minimum requirements (basic factors), together
with the performance (hybrid) factors (Matzler et al, 2004; Matzler and Sauerwein,
2002). Firstly, subjects’ ratings on the Labour party’s handling of each of the nine
variables were recoded to form dummy variables. The ‘handled very well’ ratings
were recoded to form the dummy variables to quantify excitement factors (value of 0),
while ‘handled fairly badly’ and ‘handled very badly’ ratings were used to form
dummy variables expressing basic factors (value of 1). Secondly, ratings on the

'This article is © Emerald Group Publishing and permission has been granted for this version to appear here (http://dx.doi.org/10.1108/EJM-08-2014-0524). Emerald does not grant permission for this article to be further copied/distributed or hosted elsewhere without the express permission from Emerald Group Publishing Limited.'
perceived overall performance scale were then regressed against the dummy variables
expressed as ‘penalties’ and ‘rewards’ to identify the hierarchical factor types (Brandt,
1988). For each of the nine issues, two measures were therefore obtained: i.e. how
high and low performance by the Labour party on the particular issue impacted on
their perceived overall performance. Partial correlation coefficients were used instead
of standardized multiple regression coefficients. The former represent a measure of
the linear association between Labour’s perceived overall performance, as the
dependent variable, and the perceived performance of each independent variable after
adjusting for the linear effect of the other issues; this ensures that the potential effects
of multicollinearity among the independent variables is avoided (Hair et al, 2009).
The constant in the regression equation is the average of all the referent groups on
perceived overall performance. As such, ‘penalties’ are expressed as the amount
subtracted from the constant i.e. low perceived performance and ‘rewards’ represent
the amount added to the constant i.e. high perceived performance (Matzler et al,
2004). If the reward exceeds the penalty, the issue is considered to be an excitement
factor or satisfier and if the penalty exceeds the reward, the issue is a basic factor or
‘dissatisfier’. If the reward and penalty are equal, there is a symmetrical relationship
between the party’s handling of the issue and their perceived overall performance; in
other words, the issue (performance factor) results in a favourable perception of their
overall performance, if it was handled well, but an unfavourable perception if it was
handled badly (Figure 1).
Figure 1 about here
Results and Discussion
The Satisfaction Factor Structure of the Key Political Issues
The results of the analysis show that the nine key issues identified in the British
Election Study (BES, 2010) vary in their impact on the perceived overall performance
of the Labour party at high (good) and low (poor) levels of handling. The Labour
party’s handling of two of the issues: immigration and terrorism, has no significant
impact on perceived overall performance. As such, they could not be classified as
hierarchical voter satisfaction factor types. Had they reached significance, the
reward/penalty balance (Figure 1) suggests they are performance factors.
Four of the issues can be classified as ‘basic’ factors or ‘dissatisfiers’: crime,
the economy (generally), war in Afghanistan and taxation. This is because their
negative impact on perceived overall performance is disproportionately large and
statistically significant when their handling is poor, but insignificant and either non-
existent or small when their handling is good. For crime and taxation, there is no
positive impact on perceived overall performance even when the party’s handling of
these issues was rated highly; there is only a statistically significant penalty for under
performance on these issues. For the economy (generally) and war in Afghanistan, the
reward for high perceived performance on these issues has no significant impact on
perceived overall performance. By contrast, there is a significant negative impact on
perceived overall performance, particularly in the case of the economy (generally).

'This article is © Emerald Group Publishing and permission has been granted for this version to appear here (http://dx.doi.org/10.1108/EJM-08-2014-0524). Emerald does not grant permission for this article to be further copied/distributed or hosted elsewhere without the express permission from Emerald Group Publishing Limited.'
The penalty for under-performing on the latter is considerable, and far outweighs that
for the other three basic factors, which have similar negative impacts. This shows that
handling of the economy (generally) is the most critical basic factor by a considerable
margin, i.e. the key dissatisfier; it also indicates that an intra-group two-tier hierarchy
exists within the basic factors.
The three remaining issues are ‘performance’ factors: NHS, financial crisis
and education because there are statistically significant penalties for poor performance
on the issues, and significant rewards for high performance in all three cases.
Education has higher rewards and penalties than either the NHS or financial crisis, but
there is considerable scope in all three cases for either positive or negative impact on
overall performance depending on the party’s handling of the issue. It should also be
noted that while the reward for good handling and the penalty for poor handling of
both education and the financial crisis are relatively well balanced, for the NHS the
reward for good performance is outweighed by the penalty for poor performance. Not
surprisingly, no excitement factors were identified because the nine variables
represent key issues which are critically important for voters. Table 2 provides a
summary of the issues as hierarchical voter satisfaction factor types.
Table 2 about here
The Impact of Loyalty and Hierarchical Factor Type on the Former Labour
Government’s Perceived Overall Performance
The results from sequential multiple regression analyses showing the relative impact
of the former Labour government’s handling of the nine key issues on their perceived
overall performance in shown in Table 3. First, the influence of party loyalty, based
on votes for Labour, Conservatives and the Liberal Democrats in the 2005 General
Election, was examined (Model 1) and subsequently controlled for. The result shows
that overall the net effect of voting behaviour in the 2005 General Election has a
highly significant negative influence and explains 33% of the variance in the Labour
party’s perceived overall performance.
Table 3 about here
Model 2 shows the significant impact of voting in 2010 on perceived overall
performance and the results from a one-way ANOVA (Table 4) show that the
negative impact is the net result of significant differences in loyalty (F = 280.04; df =
2; p<0.001) to the Conservative party (M = 1.72; SD = 0.85) and Liberal Democrat
party (M = 2.88; SD = 1.18) versus Labour loyalty (M = 4.07; SD = 0.70).
Furthermore, a post hoc test showed highly significant differences in perceived former
Labour government performance on all nine issues on the basis of loyalty to all three
parties. In all cases, Labour voter ratings were significantly higher than Liberal
Democrat voter ratings which, in turn, were significantly higher than Conservative
voter ratings. As such, hypothesis 1 (Loyalty has a significant influence on perceived
political party performance) is supported.

'This article is © Emerald Group Publishing and permission has been granted for this version to appear here (http://dx.doi.org/10.1108/EJM-08-2014-0524). Emerald does not grant permission for this article to be further copied/distributed or hosted elsewhere without the express permission from Emerald Group Publishing Limited.'
Table 4 about here
There was also a statistically significant strong association between voting in
2005 and voting in 2010 by party (χ2 = 486.63; p<0.001; Cramer’s V = 0.65) (Table
5). It is interesting to note that 88.89% of subjects who voted Conservative in 2005
voted for them in 2010, 82.52% of subjects who voted Liberal Democrat in 2005
voted for them in 2010, and 63% of those who voted Labour in 2005 remained loyal
in 2010. Moreover, just under one quarter (24.55%) of those voting Labour in 2005
voted Liberal Democrat in 2010 and 12.45% voted Conservative; by comparison, only
8.74% and 1.52% of those voting Liberal Democrat and Conservative respectively in
2005 switched to Labour in 2010. Hypothesis 2 (Loyalty has a significant influence
on voting behaviour) is therefore supported.
Table 5 about here
Model 3 in Table 3 shows that when the effects of loyalty are statistically
controlled for, Labour’s perceived handling of the nine key issues explains 73% (an
additional 58%) of the variance in Labour’s perceived overall performance. Five of
the issues make significant individual positive contributions to the overall
performance after the effects of voting in 2005 and 2010 are controlled. Not
surprisingly, the former Labour government’s poor handling of the economy
(generally) (BF), the primary dissatisfier, makes the largest contribution. The former
government’s handling of crime (BF) and taxation (BF) also have significant impacts
on their perceived overall performance, although the effect of the latter was expected
to be higher given the comparative penalty for low performance in taxation (Figure 1).
Moreover, it is notable that war in Afghanistan (BF) fails to have a significant impact
on the party’s overall performance. This result also supports the notion of an intra-
group hierarchy among the basic factors. More importantly, it shows that basic factor
under performance explains most of the variance (0.64) in Labour’s perceived overall
performance compared with performance factor impact (financial crisis: 0.14;
education: 0.10; NHS: not statistically significant). Hypothesis 3 (Basic factor
performance has the highest impact on the perceived overall performance of the
Labour party) is therefore supported.
The Impact of Hierarchical Satisfaction Factor Type on Voting Behaviour in 2010
To assess the impact of hierarchical satisfaction factor type on voting behaviour in the
2010 General Election and to test for main and interaction effects, a multinomial
logistic regression model was used. The model accurately classifies 85.9% of Labour
votes and 89.5% of Conservative votes, but only 38.6% of Liberal Democrat votes in
2010 (Table 6). The weak prediction of the latter may result from the relatively small
size of the party by total votes in comparison with Labour and Conservative parties.
This means that given the constituency based voting system in the U.K, the Liberal
Democrat party will not gain seats in proportion to their total market share because
the latter is spread unevenly across constituencies. Therefore, in some constituencies,
Liberal Democrat supporters may have voted tactically based on their expectations of
realistic outcomes. Such tactical voting may be an issue for all parties, but is more
acute for smaller parties in the UK given the ‘first past the post’ system of British

'This article is © Emerald Group Publishing and permission has been granted for this version to appear here (http://dx.doi.org/10.1108/EJM-08-2014-0524). Emerald does not grant permission for this article to be further copied/distributed or hosted elsewhere without the express permission from Emerald Group Publishing Limited.'
parliamentary elections. The model may therefore have performed more satisfactorily
with a proportional system of voting. However, the model has performed well overall
given that voters in the UK resolve some incongruities between partisanship and
policy evaluation through selective attribution, i.e. favoured parties are not always
blamed for policy failures, while less favoured parties are not always credited with
policy successes (Marsh and Tilley, 2010). Moreover, some inaccuracy may have
also resulted from distortion relating to retrospective or hypothetical evaluations of
opposition party competence to handle key issues in the absence of proven capability
in office over the same time period (Green and Jennings, 2012).
The results (Table 6) show that there are significant main and interaction
effects for the key issues. The first section shows the significant effects for each of
the key issues on Conservative party votes in 2010 with Labour votes as the referent
group, while the other variables in the model are held constant. There are significant
main effects on Conservative party votes from Labour’s poor performance on four of
the nine issues: handling of crime (BF); education (PF); the financial crisis (PF);
taxation (BF). The β statistics represent the multinomial logit estimates for the impact
of the former government’s handling of these issues on Conservative votes relative to
Labour votes. For a one unit improvement in Labour’s handling of these issues, the
log-odds of voting Conservative would decrease by 0.97 units (crime), 0.73 units
(education), 0.47 units (financial crisis) and 0.35 units (taxation). The Exp β statistics
represent the odds ratios for the predictors. All figures (<1) indicate that the risk of
the outcome falling in the comparison group (voting Conservative), relative to the
referent group (voting Labour), significantly decreases as the perception of Labour’s
handling of the issue improves. The confidence intervals (CI) for crime and education
indicate that the relationship between the dependent and independent variables in this
sample is true of the voting population. For financial crisis and taxation, the
confidence intervals indicate that the direction of this relationship may be unstable in
the population as a whole and this limits the generalisability of these particular
findings. The results suggest that had Labour’s performance on these four issues, but
particularly crime (BF) and education (PF), been better they would have gained more
votes from those who voted Conservative.
Table 6 about here
While there are main effects for only four of the issues, there are significant
interaction effects between six of them: handling of the economy (generally) (BF);
taxation (BF); crime (BF); immigration (U); financial crisis (PF); war in Afghanistan
(BF). Notably, all of the basic factors have significant interaction effects. The
interaction of handling of the economy (generally) (BF) and taxation (BF), together
with the interaction of handling of crime (BF) and the financial crisis (PF), and the
interaction of their handling of war in Afghanistan (BF) and the financial crisis (PF)
all have significant negative impacts. For perceived improvements in these particular
combinations, the log-odds of voting Conservative rather than Labour would decrease
by 1.47, 1.00 and 0.79 units, respectively. This result lends support to hypothesis 4
(Basic factor performance has the highest impact on voting behaviour). It also
indicates that there were additional votes to be gained from improvements in the

'This article is © Emerald Group Publishing and permission has been granted for this version to appear here (http://dx.doi.org/10.1108/EJM-08-2014-0524). Emerald does not grant permission for this article to be further copied/distributed or hosted elsewhere without the express permission from Emerald Group Publishing Limited.'
handling of these issues over and above those from the direct effects from the
improvements.
The interaction effect of the former government’s handling of crime (BF) and
the economy generally (BF), and their handling of immigration (U) and the financial
crisis (PF) are also significant. However, for perceived improvements in the combined
handling of crime and the economy (generally), the multinomial log-odds of voting
Conservative rather than Labour would increase by 1.40 rather than decrease, and the
confidence intervals indicate that this is true of the voting population. This effect may
result from loyalty to the Conservative party combined with factor type and both
perceived performance and importance of the issues from the perspective of
Conservative voters. Handling of crime and the economy (generally) are basic factors.
As such, the positive impact of improved performance may be negligible given that
Conservative voters’ perceived performance of the former government’s handling of
crime and the economy (generally) was rated as poor and ranked 4th
(mean: 2.03) and
7th
(mean: 1.80) out of nine, respectively (Table 4); this may explain why the voters
were not inclined to switch. Moreover, although crime is ranked fourth in importance
from the country's perspective, it is ranked seventh from a personal perspective (Table
7). Therefore, given the high importance of the economy (generally) from both
country and personal perspectives, it is likely that the combined effects of party
loyalty and low perceived performance have accounted for this anomaly. Immigration
was unable to be classified as a hierarchical voter satisfaction factor type; we have
therefore excluded its interaction with the financial crisis from the discussion.
The last section of Table 6 shows the significant main and interaction effects
for the key issues on Liberal Democrat party votes in 2010 with Labour votes as the
referent group, while the other variables in the model are held constant. There are
significant main effects on Liberal Democrat party votes from Labour’s poor
performance on four of the classified issues: handling of crime (BF); education (PF);
war in Afghanistan (BF); taxation (BF), three of which are basic factors. Immigration
(U) is again excluded from the discussion because it was unable to be classified as a
hierarchical voter satisfaction factor type. For a one unit perceived improvement in
the handling of the classified issues, the multinomial log-odds of voting Liberal
Democrat rather than Labour would decrease by 0.63 units (crime), 0.63 units
(education), 0.43 units (war in Afghanistan) and 0.36 units (taxation). Moreover, the
confidence intervals show that the results are generalizable, which indicates that had
Labour’s performance on these issues, particularly on crime and education, been more
favorably perceived they would have gained more votes from those who voted Liberal
Democrat. Therefore overall, the results indicate that improvements in five of the
issues: handling of crime (BF), education (PF), taxation (BF), the financial crisis (PF)
and war in Afghanistan (BF), but particularly the first three, would have significantly
increased the number of votes for Labour at the expense of both Conservative and
Liberal Democrat votes. By comparison, improvements in Labour’s handling of the
financial crisis (PF) would have persuaded Conservative voters to vote Labour
whereas improvements in their handling of war in Afghanistan (BF) would have
persuaded Liberal Democrat voters to vote Labour.

'This article is © Emerald Group Publishing and permission has been granted for this version to appear here (http://dx.doi.org/10.1108/EJM-08-2014-0524). Emerald does not grant permission for this article to be further copied/distributed or hosted elsewhere without the express permission from Emerald Group Publishing Limited.'
There are significant interaction effects between four of the issues. As was the
case with the Conservative comparison group, the interaction of the former
government’s handling of the economy (generally) (BF) and taxation (BF) produced
the largest highly significant effect. For the combined effect of perceived
improvements in these two areas, the log-odds of voting Liberal Democrat rather than
Labour would be expected to decrease by 1.16. The Exp β statistic for this interaction
indicates that the risk of voting Liberal Democrat relative to voting Labour
significantly decreases as the effect of the perception of Labour’s handling of the
issues in combination improves. This also lends support to hypothesis 4.
By contrast, the interaction effect of the former government’s handling of the
NHS (PF) and war in Afghanistan (BF) indicates that for combined improvements in
these two areas, the log-odds of voting Liberal Democrat rather than Labour would be
expected to increase by 0.55 rather than decrease. This indicates that the risk of
voting Liberal Democrat relative to voting Labour significantly increases as the
perception of Labour’s combined handling of these issues improves; for both
interaction effects, the results are generalizable. The positive impact on Liberal
Democrat votes of the latter possibly results from loyalty, and both the perceived
performance and importance of these issues for Liberal Democrat voters. While the
Labour government’s handling of the NHS is ranked second (mean: 3.21) for
performance by Liberal Democrat voters, their handling of war in Afghanistan is
ranked eighth out of nine (mean: 2.28) (Table 4). Moreover, both issues have low
perceived importance ranks (Table 7), which appears to have negated the effect of
Labour’s improved performance.
Table 7 about here
Overall, the findings show that basic factor performance has the highest
impact on voting behaviour. Hypothesis 4 is therefore supported. Generally, basic
factor under performance has a significant negative impact on Labour votes as
expected. In addition, the large majority of significant interaction effects involve
basic factors either in combination with other basic factors, or with performance
factors, notwithstanding the complexity of the basic and performance factor
interactions. The results therefore demonstrate the relevance of the three factor theory
within a political marketing context, and particularly in relation to perceived political
party performance and voting behaviour. A summary of the key results is given in
Table 8.
Table 8 about here
Conclusions
This study is differentiated from previous research in this area because it has
examined the impact of loyalty and political party handling of key issues on perceived
overall party performance and voting behaviour within the context of the three factor
theory of satisfaction. As such, it makes an important contribution to the political
marketing literature and voter behaviour research. Political party loyalty was found to

'This article is © Emerald Group Publishing and permission has been granted for this version to appear here (http://dx.doi.org/10.1108/EJM-08-2014-0524). Emerald does not grant permission for this article to be further copied/distributed or hosted elsewhere without the express permission from Emerald Group Publishing Limited.'
have a strong influence on both perceptions of the former Labour government’s
overall performance, and on voting behaviour in the 2010 UK General Election.
Moreover, there were highly significant differences in perceived former Labour
government performance on all nine issues on the basis of loyalty to all three parties,
as expected. Labour voter ratings were significantly higher than Liberal Democrat
voter ratings which, in turn, were significantly higher than Conservative voter ratings.
Loyalty was therefore controlled, and the variance in voting behaviour explained by
Labour’s handling of the key issues indicated that party credibility and reliability
relating to the important issues, significantly impacts on votes.
Theoretical Contribution
The study makes a theoretical contribution by demonstrating the value of the three
factor theory of satisfaction (Deng and Pei, 2009; Kano et al, 1984; Matzler et al,
2003; Matzler 2004; Matzler and Sauerwein, 2002; Ting and Chen, 2002) to a new
area of consumer decision making, that of voter satisfaction and voting behaviour.
Within this context, it also provides an insight into the relationship between voter
satisfaction and loyalty, which builds upon previous consumer behaviour research
(Anderson and Mittal, 2000; Agustin and Singh, 2005; Baumann et al, 2012; Mittal
and Lassar 1998; Mittal and Kamakura 2001; Oliva et al, 1992). The results show
that seven of the nine key political issues were reliably classified as hierarchical
factors. Four were ‘basic’ factors or ‘dissatisfiers’: crime; the economy (generally);
war in Afghanistan; taxation. The remaining issues were classified as ‘performance’
factors: the NHS; financial crisis; education. The basic factors were found to explain
more of the variance in Labour’s perceived overall performance than the performance
factors, while controlling for loyalty. Basic factor performance also had the highest
impact on actual voting behaviour. This is an important finding because it
demonstrates the relevance of the three factor theory of satisfaction to political
marketing. Another important contribution of the research is the identification of an
intra-group hierarchy within the basic factors, based on the comparison of the
penalties for basic factor low performance, and the proportion of variance in both
perceived overall performance and voting behaviour explained by the individual basic
factors. Within this context, the economy (generally) was highlighted as the primary
basic factor or key dissatisfier; this resonates with research findings relating to the
link between voting behaviour and government performance, particularly in economic
affairs (Marsh and Tilley, 2010)
The study furthermore extends the political marketing literature by empirically
testing the under-researched variables: loyalty and satisfaction, in this context. Hence
it adds to research over the last 15 years in political marketing that uses a variety of
new models to predict and understand voter behaviour (e.g. Baines et al, 2003;
2005, 2011; Ben-ur and Newman, 2010; Cwalina et al, 2004, 2010; French and Smith,
2010; Newman, 2007; O'Cass, 2002; O'Cass and Nataraajan, 2003).
The study also demonstrates how political science data can be used effectively
in consumer behaviour studies and provides a theoretically grounded method for
predicting actual voting behaviour using consumer satisfaction in the form of voter

'This article is © Emerald Group Publishing and permission has been granted for this version to appear here (http://dx.doi.org/10.1108/EJM-08-2014-0524). Emerald does not grant permission for this article to be further copied/distributed or hosted elsewhere without the express permission from Emerald Group Publishing Limited.'
perceptions of party performance. This resonates with the behavioural loyalty
literature (e.g. Bayus, 1992; Dekimpe et al, 1997; Liu, 2007; Sharp, 2010). The study
also confirms the predictive validity of the model with respect to voting behaviour in
that it accurately classifies 85.9% of Labour votes and 89.5% of Conservative votes
but only 38.6% of Liberal Democrat votes. The latter probably results from the
constituency based voting system in the UK, the relatively small size of the party by
total votes, and tactical voting by Liberal Democrat supporters. The overall accuracy
of the model may have also been affected by selective attribution and hypothetical
evaluations of opposition party competence to handle key issues in the absence of
proven capability.
Management Implications
A further contribution of the research, which demonstrates the practical value of
applying the theoretical model in this context, relates to the identification of Labour
party under performance on key issues. Through the classification of political issues
as theoretical satisfaction factor types, the study has highlighted areas of particular
weakness which resulted in voters switching to both the Conservative and Liberal
Democrat parties. Labour’s perceived under performance on the basic factors, both
directly and indirectly (in terms of influencing perceptions of their performance in
other areas) had the largest negative impact, although the party’s perceived under
performance on some of the performance factors was also critical. Improvements in
Labour’s handling of the financial crisis (PF) and taxation (BF), but particularly crime
(BF) and education (PF), would have gained more votes from those who voted
Conservative. By comparison, higher performance on crime (BF), education (PF),
immigration (U), war in Afghanistan (BF) and taxation (BF), would have gained more
votes from those who voted Liberal Democrat. From a strategic resource
management perspective, focusing on improved performance in three areas: taxation,
crime and education, rather than on issues where they feel they have a strong
reputation for competence (Green and Jennings, 2012), would have directly increased
the number of Labour votes at the expense of other parties.
Overall, from a managerial perspective, the findings demonstrate the criticality
of basic factor performance on voting behaviour. Public perceptions of basic factor
performance therefore need to be monitored, and both performance on particular
issues and communication about the handling of these issues needs to be managed
more effectively during the government’s term of office. This will improve perceived
overall party performance and potentially attract more votes and avoid losing votes.
As is the case with companies which rely on large and infrequent consumer
purchases, political parties need to market themselves effectively to win an election,
minimize post-voting dissonance and promote brand loyalty. The results therefore
support Baines et al’s (2003) recommendations that political parties should consider
psychographic segmentation in addition to the more traditional behavioural (loyalty)
and geo-demographic approaches, notwithstanding resource constraints and
operational difficulties.

'This article is © Emerald Group Publishing and permission has been granted for this version to appear here (http://dx.doi.org/10.1108/EJM-08-2014-0524). Emerald does not grant permission for this article to be further copied/distributed or hosted elsewhere without the express permission from Emerald Group Publishing Limited.'
Limitations and Recommendations for Future Research
While the paper makes an important theoretical contribution to the political marketing
literature and provides a foundation for the further study of voter satisfaction, its
limitations should be noted. The study was conducted using data from a single
election: the British Election Study (BES, 2010) data set; it was therefore constrained
by the relatively small sample size (n = 927) and the lack of additional variables
which were directly comparable with the policy issue measures that could be used to
test the relevance of the three factor theory in the context of predicting voting
behaviour. It should also be noted that while the impact of the ‘basic’ factors on the
Labour party’s perceived overall performance was greater than ‘performance’ factor
impact, the former government’s handling of immigration and terrorism were unable
to be classified as hierarchical factor types and were therefore untested. The
predictive validity of the Liberal Democrat voting behaviour model (and possibly that
for the other two parties) was also constrained by the constituency based voting
system and its tactical voting behaviour.
The study has demonstrated the relevance of the three factor theory of
satisfaction in the context of political marketing, and provides the basis for providing
accurate predictions of both overall party performance and more importantly, actual
voting behaviour. Moreover, its use of policy issues as performance measures offers a
new means of analysing the impact of policy in voter decision making through the
prism of satisfaction factor theory. The study therefore provides a foundation for
future research in this area. Given that the data set employed for the analysis was UK
specific, the generalizability of the findings is limited; further research is therefore
needed to test the external validity of the theoretical model by verifying the criticality
of basic factor performance in other political marketing scenarios, both domestically
and internationally. Moreover, future studies should combine policy issues with other
variables which have been investigated elsewhere such as the personality and image
of party leaders (Davies and Mian, 2010) as performance measures within the three
factor theoretical framework to improve the predictive validity of the model. The
model should also be tested in countries with a proportional system of voting to
eliminate bias from tactical voting among members of relatively small sub-samples.
References
Agustin, C. and Singh, J. (2005), “Curvilinear effects of consumer loyalty
determinants in relational exchanges”, Journal of Marketing Research, Vol. 42, No. 1,
pp. 96-108.
Anderson, E.W. and Mittal. V. (2000), “Strengthening the satisfaction-profit chain”,
Journal of Service Research, Vol. 3, No.2, pp. 107-120.
Aurier, P. and de Lanauze, G.S. (2012), “Impacts of perceived brand relationship
orientation on attitudinal loyalty: An application to strong brands in the packaged
goods sector”, European Journal of Marketing, Vol. 46, Nos. 11-12, pp. 1602-1627.
Baines, P.R., MacDonald, E.K, Wilson, H., and Blades, F. (2011), “Measuring
communication channel experiences and their influence on voting in the 2010 British
General Election”, Journal of Marketing Management, Vol. 27, No. 7-8, pp. 691-717.

'This article is © Emerald Group Publishing and permission has been granted for this version to appear here (http://dx.doi.org/10.1108/EJM-08-2014-0524). Emerald does not grant permission for this article to be further copied/distributed or hosted elsewhere without the express permission from Emerald Group Publishing Limited.'
Baines, P.R, Worcester, R.M, Jarrett, D. and Mortimore, R. (2003), “Market
segmentation and product differentiation in political campaigns: A technical feature
perspective”, Journal of Marketing Management, Vol. 19, No. 1/2, pp. 225-249.
Baines, P.R, Worcester, R.M, Jarrett, D. and Mortimore, R. (2005), “Product
attribute-based voter segmentation and resource advantage theory”, Journal of
Marketing Management, Vol. 21, No. 9/10, pp. 1079-1115.
Baumann, C., Elliott, G. and Burton, S. (2012), “Modelling customer satisfaction and
loyalty: survey data versus data mining”, Journal of Services Marketing, Vol. 26, No.
3, pp. 148-157.
Bayus, B.L. (1992), “Brand loyalty and marketing strategy: An application to home
appliances”, Marketing Science, Vol. 11, No.1, pp. 21-38.
Ben-Ur, J. and Newman, B.I. (2010), “A marketing poll: An innovative approach to
prediction, explanation and strategy”, European Journal of Marketing, Vol. 44, Nos.
3/4, pp. 515-538.
Brandt, D.R. (1988) “How service marketers can identify value-enhancing service
elements”, Journal of Services Marketing, Vol. 2, No. 3, pp. 35-41.
Butler, P. and Collins, N. (1994), “Political marketing: structure and process”,
European Journal of Marketing, Vol. 28, No.1, pp. 19-34.
BES (2010), The British Election Study (BES) by Clarke, H.D., Sanders, D., Stewart,
M.C, and Whiteley, P. http://www.bes2009-10.org/. Data File:
CSES2010MISH10.SAV.
Cronin, J.J, and Taylor, S.A. (1992), “Measuring service quality: A reexamination and
extension”, Journal of Marketing, Vol. 56, No. 3, pp. 55-68.
Cwalina, W., Falkowski, A. and Newman, B.I. (2010), “Towards the development of
a cross-cultural model of voter behavior: Comparative analysis of Poland and the
US”, European Journal of Marketing, Vol. 44, Nos. 3/4, pp. 351-368.
Cwalina, W., Falkowski, A., Newman, B.I. and Vercic,D. (2004), “Models of voter
behavior in traditional and evolving democracies: Comparative analysis of Poland,
Slovenia, and U.S.”, Journal of Political Marketing, Vol. 3, No.2, pp. 7-30.
Davies, G. and Mian, T. (2010), “The reputation of the party leader and the party
being led”, European Journal of Marketing, Vol. 44, Nos. 3/4, pp. 331-350.
Day, G.S. (1969), “A two-dimensional concept of brand loyalty”, Journal of
Advertising Research, Vol. 9, No. 3, pp. 29-35.
Dekimpe, M.G., Steenkamp, J.E.M, Mellens, M. and Abeele, P.V. (1997), “Decline
and variability in brand loyalty”, International Journal of Research in Marketing,
Vol. 14, No. 5, pp. 405-420.
Delgado-Ballester, E. and Munuera-Alemán, J.L. (2001), “Brand trust in the context
of consumer loyalty”, European Journal of Marketing, Vol. 35, Nos.11/12, pp.1238-
1258.
Deng, W-J., Kuo, Y-F. and Chen, W-C. (2008), “Revised importance-performance
analysis: Three factor theory and benchmarking”, The Service Industries Journal, Vol.
28, No. 1, pp. 37-51.
Deng, W-J. and Pei, W. (2009), “Fuzzy neural based importance-performance
analysis for determining critical service attributes”, Expert Systems with Applications,
Vol. 36, No. 2, Part 2, pp. 3774-3784.

'This article is © Emerald Group Publishing and permission has been granted for this version to appear here (http://dx.doi.org/10.1108/EJM-08-2014-0524). Emerald does not grant permission for this article to be further copied/distributed or hosted elsewhere without the express permission from Emerald Group Publishing Limited.'
Dick, A.S. and Basu, K. (1994), “Customer loyalty: Toward an integrated conceptual
framework”, Journal of the Academy of Marketing Science, Vol. 22, No.2, pp. 99-
113.
Evanschitzky, H. and Wunderlich, M. (2006), “An examination of moderator effects
in the four-stage loyalty model”, Journal of Service Research, Vol. 8, No. 4, pp. 330-
345.
Fournier, S. and Yao, J.L. (1997), “Reviving brand loyalty: a reconceptualization
within the framework of consumer-brand relationships”, International Journal of
Research in Marketing, Vol.14, No.5, pp. 451-472.
French, A. and Smith, G. (2010), “Measuring political brand equity: A consumer
oriented approach”, European Journal of Marketing, Vol. 44, Nos. 3/4, pp. 460-477.
Gerber, A.S., Huber, G. A. and Washington, E. (2010), “Party affiliation, partisanship,
and political beliefs: A field experiment”, American Political Science Review, Vol.
104, No. 4, pp. 720-744.
Green, J. and Jennings, W. (2012), “Valence as macro-competence: An analysis of
mood in party competence evaluations in Great Britain”, British Journal of Political
Science, Vol. 42, No. 2, pp. 311-343.
Hair, J. F., Black, W.C., Babin, B.J. and Anderson, R.E. (2009), Mutivariate data
analysis, 7th edition, Englewood Cliffs, NJ: Prentice Hall.
Han, X., Kwortnik, R.J. and Wang, C. (2008), “Service loyalty: an integrative model
and examination across service contexts”, Journal of Service Research, Vol. 11, No.
1, pp. 22-42.
Harris, L.C. and Ezeh, C. (2008), “Servicescape and loyalty intentions: An empirical
investigation”, European Journal of Marketing, Vol. 42, Nos. 3/4, pp. 390-422.
Harris, P. and Lock, A. (2010), ““Mind the gap”: The rise of political marketing and a
prospective on its future agenda”, European Journal of Marketing, Vol.44, No. 3/4,
pp. 297-307.
Jacoby, J. and Chestnut, R.W. (1978), “Brand loyalty measurement and
management”, New York: Wiley.
Kano, N., Seraku, N., Takahashi, F. and Tsuji, S. (1984), “Attractive quality and
must-be quality”. Hinshitsu: The Journal of the Japanese Society for Quality Control,
Vol. 14, No.2, pp.39-48.
Konstantinidis, I. (2008), “Who sets the agenda? Parties and media competing for the
electorate’s main topic of political discussion”, Journal of Political Marketing, Vol. 7,
No. 3/4, pp. 323- 337.
Liu, Y. (2007), “The long-term impact of loyalty programs on consumer purchase
behaviour and loyalty”, Journal of Marketing, Vol. 71, No. 4, pp.19-35.
Marsh, M. and Tilley, J. (2010), “The attribution of credit and blame to governments
and its impact on vote choice”, British Journal of Political Science, Vol. 40, No.1, pp.
115-134.
Matzler, K., Bailom, F., Hinterhuber, H.H., Renzl, B. and Pichler, J. (2004), “The
asymmetric relationship between attribute-level performance and overall customer
satisfaction: A reconsideration of the importance–performance analysis”, Industrial
Marketing Management, Vol. 33, No. 4, pp. 271-277.
Matzler, K. and Sauerwein, E. (2002), “The factor structure of customer satisfaction:
An empirical test of the importance grid and the penalty-reward-contrast analysis”,
International Journal of Service Industry Management, Vol. 13, No. 4, pp. 314-332.

'This article is © Emerald Group Publishing and permission has been granted for this version to appear here (http://dx.doi.org/10.1108/EJM-08-2014-0524). Emerald does not grant permission for this article to be further copied/distributed or hosted elsewhere without the express permission from Emerald Group Publishing Limited.'
Matzler, K., Sauerwein, E. and Heischmidt, K.A. (2003), “Importance-performance
analysis revisited: The role of the factor structure of customer satisfaction”, The
Service Industries Journal, Vol. 23, No. 2, pp. 112-129.
Mittal, B. and Lassar, W.M, (1998), “Why do customers switch? The dynamics of
satisfaction versus loyalty”, Journal of Services Marketing, Vol. 12, No. 3, pp. 177-
194.
Mittal, V. and Kamakura, W. A. (2001), “Satisfaction, repurchase intent, and
repurchase behavior: Investigating the moderating effect of customer characteristics”,
Journal of Marketing Research, Vol. 38, No.1, pp. 131- 142.
Mittal, V., Ross, W.T., and Baldasare, P.M. (1998), “The asymmetric impact of
negative and positive attribute-level performance on overall satisfaction and
repurchase intentions”, Journal of Marketing, Vol. 62, No.1, pp. 33-47.
Moore, M.L., Ratneshwar, S. and Moore, R.S. (2012), “Understanding loyalty bonds
and their impact on relationship strength: A service firm perspective”, Journal of
Services Marketing, Vol. 26, No. 4, pp. 253-264.
Nakanishi, M. Cooper, L.G. and Kassarjian, H.H. (1974), “Voting for a political
candidate under conditions of minimal information”, Journal of Consumer Research,
Vol. 1, No. 2, pp. 36-43.
Needham, C. (2006), “Brands and political loyalty”, Journal of Brand Management,
Vol. 13, No.3, pp. 178-187.
Newman, B.I. (1981), “The prediction and explanation of actual voting behavior in a
presidential primary election”, Unpublished PhD Thesis, University of Illinois at
Urbana-Champaign.
Newman, B.I. (1999), “A predictive model of voter behavior: The re-positioning of
Bill Clinton”, In, Newman, B.I. (Ed.) Handbook of Political Marketing, (pp. 259-
282), Thousand Oaks, CA: Sage.
Newman, B.I. (2002), “Testing a predictive model of voter behavior on the 2000 U.S.
Presidential election”, Journal of Political Marketing, Vol. 1, No. 2-3, pp. 159-173.
Newman, B.I. and Sheth, J.N. (1985), “A model of primary voter behavior”, Journal
of Consumer Research, Vol. 12, No. 2 pp. 178-187.
Newman, B.I. and Sheth, J.N (1987), “A theory of political choice behaviour”, New
York: Praeger.
Newman, P. (2007), “American voters’ statements of positive and negative preference
for candidates and parties 1980-2000: A fuzzy set investigation of predictive ability”,
Journal of Political Marketing, Vol. 6, No. 2/3, pp.109-140.
O’Cass, A. (2002), “A micromodel of voter choice: Understanding the dynamics of
Australian voter characteristics in a Federal Election”, Psychology & Marketing, Vol.
19, No. 12, pp. 1025-1046.
O’Cass, A. (2003), “Electoral choice: The effect of voter control and involvement on
satisfaction and voting stability”, Journal of Political Marketing, Vol. 3, No. 1, pp.
61-85.
O’Cass, A. and Nataraajan, R. (2003), “At the polls: Continuing to explore voter
psychology”, Journal of Political Marketing, Vol. 2, No.2, pp. 67-81.
Oh, H. (2001), “Revisiting importance-performance analysis”, Tourism Management,
Vol. 22, No. 6, pp. 617-627.

'This article is © Emerald Group Publishing and permission has been granted for this version to appear here (http://dx.doi.org/10.1108/EJM-08-2014-0524). Emerald does not grant permission for this article to be further copied/distributed or hosted elsewhere without the express permission from Emerald Group Publishing Limited.'
Oliva, T.A., Oliver, R.L, and MacMillan, I.C. (1992),”A catastrophe model for
developing service satisfaction strategies”, Journal of Marketing, Vol. 56, No. 3, pp.
83-95.
Oliver, R.L. (1999), “Whence consumer loyalty?” Journal of Marketing, Vol. 63, No.
4 (Special Issue) pp. 33-44.
Oliver, R.L. (1980), “A cognitive model of the antecedents and consequences of
satisfaction decisions”, Journal of Marketing Research, Vol. 17, No.4, pp. 460-469.
Oliver, R.L. and Swan. J.E. (1989), “Consumer perceptions of interpersonal equity
and satisfaction in transactions: A field survey approach”, Journal of Marketing, Vol.
53, No.2, pp. 21-35.
Olsen, S.O., Tudoran, A.A, Brunsø, K. and Verbeke, W. (2013), “Extending the
prevalent consumer loyalty modelling: The role of habit strength”, European Journal
of Marketing, Vol. 47, Nos. 1/2, pp. 303-323.
Ormrod, R.P. and Henneberg, S.C. (2010a), “An investigation into the relationship
between political activity levels and political market orientation”, European Journal
of Marketing, Vol. 44, Nos. 3/4, pp. 382-400.
Ormrod, R.P. and Henneberg, S.C. (2010b), “Understanding voter orientation in the
context of political market orientation: Is the political consumer king?” Journal of
Marketing Management, Vol. 26, No.1-2, pp. 108-130.
Phillips. J.M., Reynolds, T.J., and Reynolds, K. (2010), “Decision-based voter
segmentation: An application for campaign message development”, European Journal
of Marketing, Vol. 44, Nos. 3/4, pp. 310-330.
Rothschild, M.L. (1978), “Political advertising: A neglected policy issue in
marketing”, Journal of Marketing Research, Vol. 15, No.1, pp. 58-71.
Sampson, S. E., and Showalter, M. J. (1999), “The performance – importance
response function: Observations and implications”, The Service Industries Journal,
Vol. 19, No. 3, pp. 1-25.
Sharp, B. (2010), How Brands Grow: What Marketers Don’t Know, Oxford
University Press: Melbourne, Australia.
Swinyard, W.R. and Conney, K.A. (1978), “Promotional effects on a high - versus
low- involvement electorate”, Journal of Consumer Research, Vol. 5, No, 1 pp. 41-
48.
Ting, S-C. and Chen, C-N. (2002), “The asymmetrical and non-linear effects of store
quality attributes on customer satisfaction”, Total Quality Management, Vol. 13, No.
4, pp. 547-569.
Wirtz, J. and Mattila, A.S. (2003), “The effects of consumer expertise on evoked set
size and service loyalty”, Journal of Services Marketing, Vol.17, No.7, pp. 649-665.
Yi, Y. and La, S. (2004), “What influences the relationship between customer
satisfaction and repurchase intention? Investigating the effects of adjusted
expectations and customer loyalty”, Psychology & Marketing, Vol. 21, No.5, pp. 351-
373.

'This article is © Emerald Group Publishing and permission has been granted for this version to appear here (http://dx.doi.org/10.1108/EJM-08-2014-0524). Emerald does not grant permission for this article to be further copied/distributed or hosted elsewhere without the express permission from Emerald Group Publishing Limited.'
Figure 1: The Asymmetric Impact of the Labour Party’s Handling of the Key
Issues on Perceived Overall Performance
-0.003
-0.029
-0.135***
-0.021
-0.298***
-0.081*
-0.121**
-0.148**
-0.008
-0.084*
0.019
0.079*
0.062
0.045
0.018
0.096**
0.124***
-0.127***
-0.35
-0.25
-0.15
-0.05
0.05
0.15
Cri
me
Imm
igra
tio
n
NH
S
Terr
ori
sm
Eco
no
my
(Ge
ne
ral)
War
in A
fgh
anis
tan
Fin
anci
al C
risi
s
Edu
cati
on
Taxa
tio
n
Reward for GoodHandling (PositiveImpact onPerformance)
Penalty for PoorHandling (NegativeImpact onPerformance)

'This article is © Emerald Group Publishing and permission has been granted for this version to appear here (http://dx.doi.org/10.1108/EJM-08-2014-0524). Emerald does not grant permission for this article to be further copied/distributed or hosted elsewhere without the express permission from Emerald Group Publishing Limited.'
Table 1: British Election Study (2010) Sample
___________________________________________________________________________________________________ Category n % Category n %
______________________________________________________________________________________________________________________
Gender Own or Rent Home
Male 451 48.6 Own 658 71.0
Female 476 51.4 Rent 245 26.4
Neither 24 2.6
Age Age at Completion of Full Time Education
18-24 72 7.7 15 or younger 116 12.5
25-34 188 20.4 16 220 23.8
35-44 152 16.5 17 78 8.4
45-54 162 17.5 18 109 11.7
55-64 229 24.7 19+ 348 37.5
65+ 122 13.2 Still in Full Time Education 52 5.6
Marital Status Ethnicity
Married 456 49.2 White 883 95.3
Living with Partner 145 15.6 Mixed background 14 1.5
Separated (after marriage) 15 1.6 Asian or Asian British 19 2.0
Divorced 75 8.1 Black of Black British 9 1.0
Widowed 43 4.6 Other Ethnic Background 2 0.2
Single (never married) 193 20.9
Type of work Region
Professional or higher technical 203 21.9 East Anglia 62 6.7
Manager or Senior Administrator 121 13.1 East Midlands 80 8.6
Clerical 193 20.8 Greater London 116 12.5
Sales or Services 90 9.7 North 44 4.8
Small Business Owner 23 2.5 North West 99 10.7
Foreman or Supervisor 38 4.1 Scotland 77 8.3
Skilled Manual 68 7.3 South East 143 15.5
Semi-Skilled or Unskilled Manual 93 10.0 South West 99 10.7
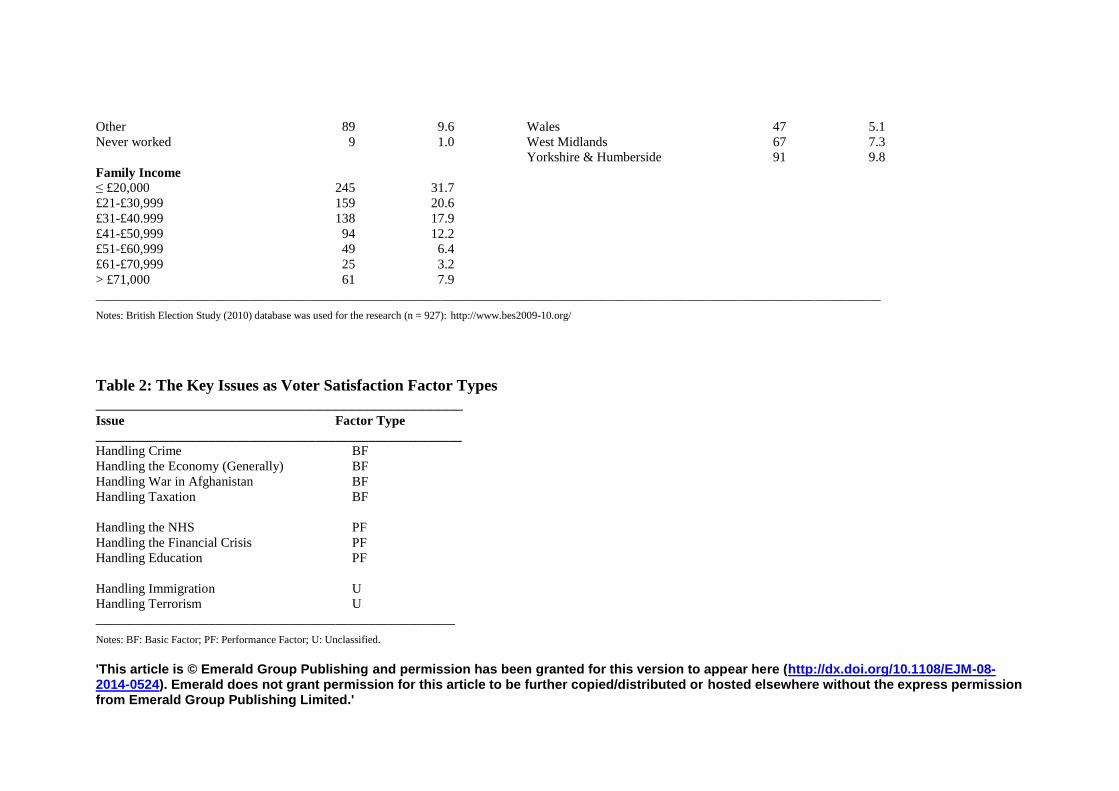
'This article is © Emerald Group Publishing and permission has been granted for this version to appear here (http://dx.doi.org/10.1108/EJM-08-2014-0524). Emerald does not grant permission for this article to be further copied/distributed or hosted elsewhere without the express permission from Emerald Group Publishing Limited.'
Other 89 9.6 Wales 47 5.1
Never worked 9 1.0 West Midlands 67 7.3
Yorkshire & Humberside 91 9.8
Family Income
≤ £20,000 245 31.7
£21-£30,999 159 20.6
£31-£40.999 138 17.9
£41-£50,999 94 12.2
£51-£60,999 49 6.4
£61-£70,999 25 3.2
> £71,000 61 7.9
______________________________________________________________________________________________________________________
Notes: British Election Study (2010) database was used for the research (n = 927): http://www.bes2009-10.org/
Table 2: The Key Issues as Voter Satisfaction Factor Types
______________________________________________ Issue Factor Type
_______________________________________________________ Handling Crime BF
Handling the Economy (Generally) BF
Handling War in Afghanistan BF
Handling Taxation BF
Handling the NHS PF
Handling the Financial Crisis PF
Handling Education PF
Handling Immigration U
Handling Terrorism U
______________________________________________________
Notes: BF: Basic Factor; PF: Performance Factor; U: Unclassified.

'This article is © Emerald Group Publishing and permission has been granted for this version to appear here (http://dx.doi.org/10.1108/EJM-08-2014-0524). Emerald does not grant permission for this article to be further copied/distributed or hosted elsewhere without the express permission from Emerald Group Publishing Limited.'
Table 3: The Impact of Party Loyalty and the Labour Party’s Handling of the
Key Issues on their Perceived Overall Performance in Government ___________________________________________________________________________________________
Independent Variables β t
______________________________________________________________________________
Model 1: Adjusted R2 = 0.12; F = 82.21; p <0.001
Vote in 2005 General Election -0.36*** -9.07
Model 2: Adjusted R2 = 0.15; F = 52.79; p <0.001; R
2 Change = 0.03; p <0.001
Vote in 2005 General Election -0.25*** -5.47
Vote in 2010 General Election -0.21*** -4.53
Model 3: Adjusted R2 = 0.73; F = 144.90; p <0.001; R
2 Change = 0.58; p <0.001
Vote in 2005 General Election -0.03 (ns) -1.21
Vote in 2010 General Election -0.03 (ns) -1.03
Handling the Economy (Generally) (BF) 0.36*** 6.19
Handling Crime (BF) 0.14 ** 3.26
Handling the Financial Crisis (PF) 0.14** 3.21
Handling Education (PF) 0.10* 2.40
Handling Taxation (BF) 0.08* 2.30
Handling NHS (PF) 0.06 (ns) 1.61
Handling Immigration (U) -0.03 (ns) -0.85
Handling the War in Afghanistan (BF) 0.03 (ns) 0.96
Handling Terrorism Risk (U) 0.02 (ns) 0.67
________________________________________________________________________________
Notes: BF: Basic Factor; PF: Performance Factor; U: Unclassified Factor.
*significant at the p <.05 level; ** significant at the p <.01 level; *** significant at the p <.001 level; ns = nonsignificant.
21 cases deleted due to Mahalanobis distance >25
Durbin-Watson statistics (1.98 – 2.02) indicate that the assumption of independent errors is tenable in all models.
VIF values: 1.00 (Model 1); 1.38 (Model 2); 1.45-5.92 (Model 3). Tolerance statistics: 0.65 (Model 1); 0.35 - 0.73 (Model 2); 0.43 - 0.68 (Model 3).
Predictor variance dimension loadings indicate the absence of collinearity in the data. In both models, confidence intervals

'This article is © Emerald Group Publishing and permission has been granted for this version to appear here (http://dx.doi.org/10.1108/EJM-08-2014-0524). Emerald does not grant permission for this article to be further copied/distributed or hosted elsewhere without the express permission from Emerald Group Publishing Limited.'
indicate that the estimates are likely to be representative of 95% of other samples.
Table 4: Perceived Performance on the Key Issues by Party Vote in 2010 _________________________________________________________________________________________________________________________________________________________________
Issue Overall Labour Conservative Liberal Democrat
Mean SD Rank Mean SD Rank Mean SD Rank Mean SD Rank
_______________________________________________________________________________________________________________________________________
Handling Crime 2.77 1.18 6 3.86 0.85 6 2.03 0.87 4 2.90 0.98 5
Handling Immigration 2.06 1.11 9 2.94 1.14 9 1.41 0.71 9 2.19 0.94 9
Handling NHS 3.10 1.27 2 4.18 0.89 1 2.32 1.03 2 3.21 1.11 2
Handling Terrorism 3.29 1.19 1 4.14 0.86 2 2.73 1.04 1 3.31 1.12 1
Handling Economy 2.78 1.35 5 4.07 0.88 4 1.80 0.93 7 2.89 1.21 6
Handling War 2.35 1.18 8 3.26 1.14 8 1.76 0.86 8 2.28 1.08 8
Handling Financial Crisis 2.88 1.37 4 4.11 0.87 3 1.94 1.02 6 3.02 1.30 3
Handling Education 2.95 1.23 3 4.03 0.85 5 2.21 0.96 3 3.01 1.11 4
Handling Taxation 2.73 1.23 7 3.75 0.92 7 1.97 0.94 5 2.78 1.05 7
Overall Performance 2.76 1.34 - 4.04 0.70 - 1.72 0.85 - 2.88 1.18 -
___________________________________________________________________________________________________________________________________________
Notes: One Way between groups ANOVA (Perceived performance by Labour, Conservative and Liberal Democrat vote in the 2010 General Election: F = 280.04; df = 2; p < 0.001 showed significant differences
between the three groups on all variables using a Bonferroni procedure (p<0.001).

'This article is © Emerald Group Publishing and permission has been granted for this version to appear here (http://dx.doi.org/10.1108/EJM-08-2014-0524). Emerald does not grant permission for this article to be further copied/distributed or hosted elsewhere without the express permission from Emerald Group Publishing Limited.'
Table 5: Cross Tabulation of Voting Behaviour in 2005 and 2010 by Party __________________________________________________________________________________________________________________
Political Party Labour Conservative Liberal Democrat Total
(2010) (2010) (2010)
__________________________________________________________________________________________________
Conservative (2005) 3 176 19 198
Liberal Democrat (2005) 9 9 85 103
Labour (2005) 172 34 67 273
Total 184 219 171 574
______________________________________________________________________________________________________
Table 6: Impact of Labour’s Handling of the Key Issues, as Factor Types, on Voting Behaviour in the 2010 General Election
____________________________________________________________________________________________________________________ 1. Classification of votes: n Predicted (%)
_____________________________________________________________________________________________________________________________________
Labour 184 158 85.9%
Conservative 219 196 89.5%
Liberal Democrat 171 66 38.6% _________________________________________________________________________________________________________________________________________________________________________
2. Impact of Key Issues: (Reference Group: Labour Votes)
β SE Wald df p Exp β C.I. (95%)
_______________________________________________________________________________________________________________________________________
Comparison Group: Conservative Votes
Main Effects:
Handling Crime (BF) -0.97* 0.23 17.86 1 <0.001 0.38 0.24 – 0.60
Handling Education (PF) -0.73* 0.23 9.62 1 0.002 0.48 0.31 – 0.77
Handling Financial Crisis (PF) -0.47* 0.26 3.19 1 0.05 0.63 0.38 – 1.05
Handling Taxation (BF) -0.35* 0.20 3.16 1 0.04 0.71 0.48 – 1.04
Handling the Economy (Generally) (BF) -0.46 (ns)
0.28 2.72 1 0.10 0.63 0.36 – 1.09
Handling Terrorism Risk [U] 0.17 (ns)
0.21 0.65 1 0.42 1.18 0.79 – 1.78
Handling the War in Afghanistan (BF) -0.16 (ns)
0.18 0.75 1 0.39 0.86 0.60 – 1.22

'This article is © Emerald Group Publishing and permission has been granted for this version to appear here (http://dx.doi.org/10.1108/EJM-08-2014-0524). Emerald does not grant permission for this article to be further copied/distributed or hosted elsewhere without the express permission from Emerald Group Publishing Limited.'
Handling NHS (PF) -0.10 (ns)
0.22 0.21 1 0.65 0.91 0.60 – 1.38
Handling Immigration [U] -0.07 (ns)
0.21 0.09 1 0.76 0.94 0.62 – 1.44
Interaction Effects:
Handling Economy (Generally)*Taxation -1.47* 0.42 12.51 1 <0.001 0.23 0.10 – 0.52
Handling Crime*Economy (Generally) 1.40* 0.50 7.91 1 0.005 4.04 1.53 – 10.71
Handling Immigration*Financial Crisis 1.20* 0.44 7.47 1 0.006 3.31 1.40 – 7.81
Handling Crime*Financial Crisis -1.00* 0.43 5.81 1 0.02 0.37 0.16 – 0.86
Handling War*Financial Crisis -0.79* 0.33 5.30 1 0.02 0.46 0.24 – 0.86
____________________________________________________________________________________________________________________________________
Comparison Group: Liberal Democrat Votes
Main Effects:
Handling Crime (BF) -0.63* 0.21 9.10 1 0.003 0.53 0.35 – 0.80
Handling Education (PF) -0.63* 0.21 8.70 1 0.003 0.54 0.35 – 0.81
Handling Immigration [U] 0.54* 0.18 9.47 1 0.002 1.71 1.22 – 2.41
Handling the War in Afghanistan (BF) -0.43* 0.15 8.33 1 0.004 0.65 0.48 – 0.87
Handling Taxation (BF) -0.36* 0.18 3.93 1 0.04 0.70 0.49 – 0.99
Handling NHS (PF) -0.06 (ns)
0.20 0.08 1 0.77 0.94 0.63 – 1.40
Handling Terrorism Risk [U] 0.009 (ns)
0.19 0.002 1 0.96 1.01 0.69 – 1.47
Handling the Economy (Generally) (BF) -0.30 (ns)
0.26 1.31 1 0.25 0.74 0.44 – 1.24
Handling Financial Crisis (PF) -0.11(ns)
0.25 0.19 1 0.67 0.90 0.56 – 1.45
Interaction Effects:
Handling Economy (Generally)*Taxation -1.16* 0.39 8.74 1 0.003 0.31 0.15 – 0.68
Handling of NHS*War 0.55* 0.26 4.27 1 0.04 1.73 1.03 – 2.90
______________________________________________________________________________________________________________________________________
BF: Basic Factor: IPF: Important Performance Factor; UPF: Unimportant Performance Factor; EF: Excitement Factor; [ - ]: Unreliably Classified;
*Statistically significant (p <0.001); (ns) non-significant.
Maximum Likelihood logit model: final -2LL: 721.07; χ2
= 535.10; df = 72; p <0.001
Goodness-of-fit: χ2
= 1031.44; df = 978; p = 0.12
Hosmer & Lemenshow’s measure (RL2): 0.82; Nagelkerke: 0.67; Cox & Snell: 0.59
Durbin-Watson statistics (1.98 – 2.02) indicate that the assumption of independent errors is tenable in all models.
VIF values (2.10 – 7.2), tolerance statistics (0.28 - 0.47) and predictor variance dimension loadings indicate the absence of collinearity in the data.

'This article is © Emerald Group Publishing and permission has been granted for this version to appear here (http://dx.doi.org/10.1108/EJM-08-2014-0524). Emerald does not grant permission for this article to be further copied/distributed or hosted elsewhere without the express permission from Emerald Group Publishing Limited.'
Table 7: Perceived Importance of the Policy Issues _________________________________________________________________________________________________________________________________________________________________
Issue Most Important Issue from the Voter’s Personal Perspective Most Important Issue from the Country’s Perspective
n % Rank n* % Rank n % Rank n* % Rank
_________________________________________________________________________________________________________________________________
Crime 10 2.09 7 16 2.68 7 11 1.75 4 14 1.98 4
Immigration 80 16.70 2 101 16.95 2 108 17.17 3 125 17.66 3
NHS 19 3.97 6 28 4.70 6 3 0.48 5 8 1.13 5
Terrorism - - 9 - - 9 2 0.32 7 6 0.85 6
Economy (Generally) 277 57.83 1 303 50.84 1 338 53.74 1 358 50.56 1
War in Afghanistan 1 0.21 8 2 0.34 8 2 0.32 7 3 0.42 9
Financial Crisis 23 4.80 5 49 8.22 4 160 25.44 2 185 26.13 2
Education 30 6.26 4 38 6.38 5 3 0.48 5 5 0.71 7
Taxation 39 8.14 3 59 9.90 3 2 0.32 7 4 0.56 8
________________________________________________________________________________________________________________________________
Notes: * aggregate of first, second and third mentioned most important issues

'This article is © Emerald Group Publishing and permission has been granted for this version to appear here (http://dx.doi.org/10.1108/EJM-08-2014-0524). Emerald does not grant permission for this article to be further copied/distributed or hosted elsewhere without the express permission from Emerald Group Publishing Limited.'
Table 8: Summary of the Key Results
____________________________________________________________________________________________________________________ Four of the policy issues were classified as ‘basic’ factors (‘dissatisfiers’): crime, the economy (generally), war in Afghanistan and taxation
Three of the issues were classified as ‘performance’ factors: NHS, financial crisis and education.
There are no ‘excitement’ factors and the Labour party’s perceived handling of immigration and terrorism is unclassified (because they had no significant impact on
overall perceived performance).
Handling of the economy (generally) is the key dissatisfier or most critical basic factor, creating an intra-group two-tier hierarchy within the basic factors.
Loyalty has a significant influence on Labour’s perceived performance: Labour voter ratings were significantly higher than Liberal Democrat voter ratings which, in
turn, were significantly higher than Conservative voter ratings.
Loyalty has a significant influence on voting behaviour: 89% of subjects who voted Conservative in 2005 voted for them in 2010, 83% of subjects who voted Liberal
Democrat in 2005 voted for them in 2010, and 63% of those who voted Labour in 2005 remained loyal in 2010; 25% of those voting Labour in 2005 voted Liberal
Democrat in 2010 and 12% voted Conservative; only 9% of those voting Liberal Democrat and 2% of those voting Conservative in 2005 switched to Labour in
2010.
Controlling for the effects of party loyalty, Labour’s perceived handling of the nine key issues explains 73% of the variance in Labour’s perceived overall
performance.
Basic factor under performance, on crime, taxation and especially the economy (generally), has the highest impact on the perceived overall performance of the
Labour party.
The policy issue-based model classifies 86% of Labour votes, 90% of Conservative votes and 39% of Liberal Democrat votes in 2010.
Labour’s poor performance on four of the nine issues: handling of crime (BF); education (PF); the financial crisis (PF); taxation (BF) has a significant direct impact
on Conservative party votes. Improvements in performance on these issues, particularly on crime (BF) and education (PF), would have gained more votes from
those who voted Conservative in 2010.
All of the basic factors (crime, the economy (generally), war in Afghanistan and taxation) have significant interaction effects, indicating that there were additional
Conservative votes to be gained from improvements in the handling of these issues over and above those from the direct effects from the improvements.
Labour’s poor performance on four of the nine issues: handling of crime (BF); education (PF); war in Afghanistan (BF); taxation (BF) has a significant direct impact
on Liberal Democrat party votes. Improvements in performance on these issues, particularly on crime (BF) and education (PF), would have gained more votes from
those who voted Liberal Democrat in 2010.
Overall, improvements in Labour’s performance on five of the issues: handling of crime (BF), education (PF), taxation (BF), the financial crisis (PF) and war in
Afghanistan (BF), but particularly the first three, would have directly increased the number of votes for Labour at the expense of both Conservative and Liberal
Democrat votes.
The significant interaction effects between Labour’s handling of the economy (generally) (BF) and taxation (BF) indicates that there were additional Liberal
Democrat votes to be gained from improvements in the handling of these issues over and above those from the direct effects from the improvements.
Basic factor under performance has the highest direct impact on voting behaviour; it also has the highest indirect effect: the large majority of significant interaction
effects involve basic factors either in combination with other basic factors, or with performance factors.
____________________________________________________________________________________________________________________________________

'This article is © Emerald Group Publishing and permission has been granted for this version to appear here (http://dx.doi.org/10.1108/EJM-08-2014-0524). Emerald does not grant permission for this article to be further copied/distributed or hosted elsewhere without the express permission from Emerald Group Publishing Limited.'
Notes: BF: Basic Factor; PF: Performance Factor


![afrOure immerman - DaffLibrarydafflibrary.org/wp-content/uploads/McClure-Zimmerman-2014.pdf · afrOure immerman 4*--11041 •1 ... ULBS C41 CORMS V..) ... 18", Bi: EJM] Partially](https://img.pdfslide.us/doc/110x75/5ae7727f7f8b9a3d3b8e8ae3/afroure-immerman-da-immerman-4-11041-1-ulbs-c41-corms-v-18-bi.jpg)