Embed Size (px)
Citation preview
RESEARCH Open Access
Does sucrose intake affect antropometricvariables, glycemia, lipemia and C-reactive proteinin subjects with type 1 diabetes?: a controlled-trialDébora Lopes Souto1,4*†, Lenita Zajdenverg2,5†, Melanie Rodacki2,5† and Eliane Lopes Rosado3,4†
Abstract
Background: It is unclear if the sugar intake may affect metabolic parameters in individuals with type 1 diabetes.Therefore, the purpose of this study was to evaluate the effects of sucrose intake in glycemic, lipemic,anthropometric variables, as well as in C-reactive protein (CRP) levels in these individuals.
Methods: Thirty-three subjects with type 1 diabetes were evaluated at baseline and 3-months after intervention.Volunteers were randomized into groups: sucrose-free (diet without sucrose) or sucrose-added (foods containing sucrosein composition). Both groups received the same macronutrient composition and used the carbohydrate countingmethods. All underwent an interview and anthropometric evaluation. Blood was drawn for glycated haemoglobin,glucose, total cholesterol, HDL, and CRP measurement, and the medical charts were reviewed in all cases.
Results: At baseline, anthropometric, clinical and laboratory variables did not differ between groups, except for thetriglycerides. Although at baseline triglycerides levels were higher in the sucrose-added group (p = 0.01), they did notdiffer between groups after the intervention (p = 0.92). After 3-months, CRP was higher in the sucrose-added than in thesucrose-free group (p = 0.04), but no further differences were found between the groups, including the insulinrequirements, anthropometric variables, body composition, and glycemic control. Both groups showed sugars intakeabove the recommendations at baseline and after intervention.
Conclusions: Sucrose intake, along with a disciplined diet, did not affect insulin requirements, anthropometric variables,body composition, lipemic and glycemic control. However, although the sucrose intakes increase CRP levels, the amountof sugar in the diet was not associated with this inflammatory marker.
Keywords: Diabetes, Sucrose, Body composition, C-reactive protein, Carbohydrate
BackgroundSucrose is a very attractive source of carbohydrate [1]. Thepreference for sucrose may be influenced by genetic factors[2-5], and others complex behaviors (such as craving, in-fant exposure, social habits, and personal dietary choices)[6-10]. The effect of sugars on lipid metabolism remains anextremely active area of inquiry because has been shown
that high-sugar diets may increase triglycerides levels insubjects with type 2 diabetes [11-13], but they do not seemto affect the lipid profile in subjects with type 1 diabetes, ifoptimal glycemic control is preserved [14-18].Carbohydrate is the major determinant of postprandial
glucose levels. The carbohydrate counting is the bestmethod for estimating the grams of carbohydrates in ameal and then calculating the pre-meal insulin dosebased on the self-monitored blood glucose (SMBG) andinsulin-to-carbohydrate ratio [1,19].The American Diabetes Association nutrition recom-
mendations state that the meal plans based on carbohy-drate counting remains a key strategy to achieve theglycemic control [1] because the adjustment of pre-prandialinsulin doses to the amounts of dietary carbohydrates
* Correspondence: [email protected]†Equal contributors1Institute of Nutrition Josué de Castro, Federal University of Rio de Janeiro,Brigadeiro Trompowski avenue, CCS building, - J block J - second floor -District: Ilha do Fundão, 360 Felisbelo Freire Street, Apartament 202 District:Ramos, Zipe Code: 21941-590, Rio de Janeiro, BrazilFull list of author information is available at the end of the article
METABOLIC SYNDROMEDIABETOLOGY &
© 2013 Souto et al.; licensee BioMed Central Ltd. This is an open access article distributed under the terms of the CreativeCommons Attribution License (http://creativecommons.org/licenses/by/2.0), which permits unrestricted use, distribution, andreproduction in any medium, provided the original work is properly cited.
Souto et al. Diabetology & Metabolic Syndrome 2013, 5:67http://www.dmsjournal.com/content/5/1/67
ingested during the subsequent meal resulted in improvedin glycemic control [20-24], self-management skills, qualityof life, and dietary freedom [25-29].However, the basic and advanced carbohydrate count-
ing are the common methods used currently in clinicalpractice [19,22,30]. In the basic method, the subjects areencouraged to eat constant amounts of carbohydrate atmeals. This is useful to understand the effect of food, in-sulin and to identify the portion sizes, considering thatone carbohydrate serving have an approximately 15 g ofcarbohydrates (these information are obtained from ex-change lists, internet and from the nutrition facts). Inthe advanced method, the patients should have a goodunderstanding of carbohydrate counting principles, aswell as understanding pattern management and how touse insulin-to-carbohydrate ratios [1,19,30]. Accordingto described, the inclusion of sucrose in the dietary planof individuals with type 1 diabetes is quite appealing andhas been a focus of interest, especially after the introduc-tion of the carbohydrate counting methods. However,previous studies suggested that sugar intake may activeinflammation pathways and increase circulatory levels ofthe inflammatory markers, such as C-reactive protein(CRP) both in health individuals [31-33] and patientswith type 2 diabetes [34]. However, clinical trials in type1 diabetes are still lacking.The goal of this study was to investigate the influence of
sucrose intake on anthropometric variables, body compos-ition, lipemia, glycemic control and CRP levels in subjectswith type 1 diabetes.
Subjects and methodsThis is a controlled clinical-trial was conducted betweenJuly 2009, and January 2011. Participants with type 1 dia-betes (disease duration of 24 years or more) were recruitedat the waiting room of the Clementino Fraga Filho Univer-sity Hospital, Brazil. Patients with body mass index (BMI) ≥30 kg/m2, smokers, alcoholics, users of lipid-lowering ororal hypoglycemic medications and other diseases (such ashypertension, celiac disease, hypo- and hyperthyroidism)were not included.The hospital database update on January 2010, the size
of the universe is 200 outpatients. Of these, only 80 (40%)of these cases were eligible and were then contacted and in-vited to participate. Forty-five (22%) refused and 35 (17.5%)volunteers agreed to participate in the study. All signed aninformed consent and the protocol was approved by theEthical Committee (Institutional Review Board, protocol050/09). During the follow-up, two patients were excluded(one had infection and another because did not use in-sulin properly) and a total of 33 (16.5%) participantscompleted the study. The sample is not representativeand was selected for convenience, thus, results are not
intended to represent exactly what would happen with apopulation [35].All volunteers were assessed at baseline and after 3-
months of intervention. They received three individualface-to-face consultation sessions which included adviceson food purchased, food selection, portion sizes, cookingmethods, and effect of food on glycemic control.Participants were allocated into two groups, according
to their sucrose intake reported in three 24-hour recalls.Individualized diet prescription based on the currentrecommendations (dietary energy content of 50-60% car-bohydrates, 15-20% of protein, 25-35% of total fat, lessthan 7% of saturated fatty acids, a maximum of 10% 10%from polyunsaturated fatty acids, and 10-15% of mono-unsaturated fatty acids) [1].Percent energy from macronutrients was similar in both
groups [1,36] and as well as the same instructions aboutcarbohydrate counting, and exchange lists with sucrose-free or with foods containing sucrose in its compositions(for sucrose-added group). The lists have been developedbased on “Choose your foods: Exchange lists for diabetes”[37] and contained more than 200 foods with a similaramount of carbohydrates (approximately 15 g of carbohy-drates per serving), however we detailed listings in thecatalogues of permitted and prohibited foods, based onthe amount of sugar in each product were also providedto the participants. Diets and dietary records were ana-lyzed using Software DietPró 5.5i (version 2008–2011)and the cutoff point for sucrose intake was < 7 or ≥ 7% tosucrose-free and sucrose-added group, respectively.The carbohydrate counting method was selected as ac-
cording to ability to the patient’s understand the man-agement plan and how to use insulin-to-carbohydrateratios properly [1,19]. The basic and advanced carbohy-drate counting were equally distributed between groups(p = 0.62). Basic method was used for 50% (n = 9) insucrose-free and 53.33% (n = 8) in sucrose-added group,and the advanced method was used for 50 and 46.67%(n = 9 for each) of volunteers in sucrose-free and sucrose-added group, respectively.Baseline dietary intake was evaluated from 3-day diet re-
cords. Volunteers were followed monthly when 24-hourrecalls were performed to verify adherence to the diet.Additionally, they were followed once a week by telephonecalls [38].Insulin, glucometer and test strips to check their SMBG
four-daily were provided to all participants. The insulin sen-sitivity factor was calculated as 1800 or 1500 (for rapid in-sulin analogs and regular insulin, respectively) divided bythe total daily insulin dose. Insulin-to-carbohydrate ratioswere calculated as 500 or 450 divided by the total dailyinsulin dose (for rapid insulin analogs and regular insulin,respectively) and frequently were adjusted 2-hour postpran-dial. Patients were instructed to calculate their premeal
Souto et al. Diabetology & Metabolic Syndrome 2013, 5:67 Page 2 of 8http://www.dmsjournal.com/content/5/1/67
insulin bolus doses based on carbohydrate intake, individu-alized insulin-to-carbohydrate ratios, and theirs SMBG [39].Blood sample were obtained after eight hours fasting,
and events that could influence the results were considered(such as: infections, flu, fever). Glycated haemoglobin wasperformed by high-performance liquid chromatography[40]. Fasting glucose, total cholesterol, HDL and triglycer-ides were measured by enzymatic colorimetric method,and CRP was determined by ultrasensitive colorimetricenzyme-linked immunosorbent assay [41]. LDL cholesterolwas calculated with the Friedewald equation [42].Body mass index was calculated as body weight in ki-
lograms divided by the square of height in meters [43].Waist circumference was determined as the average oftwo measurements calculated to the nearest 0.1 cm mid-way between the lower rib margin and the iliac crest aftera normal expiration [44]. Body composition was measuredby tetrapolar bioelectrical impedance (biodynamic Model450) [45].Statistical analyzes were performed in SPSS software
(version 16.0; SPSS Inc, Chicago, IL) with significancelevel of 5%. Quantitative variables were described as themean and standard deviation. Mann–Whitney test wasused for between-group comparison and Wilcoxon testto compare the effects of nutrition-knowledge in eachgroup. Linear regression was used to determine the valueof the triglycerides and CRP levels based upon the valuesof other variables.
ResultsThirty three patients with type 1 diabetes (21 men and12 women) with a mean age of 21.7 ± 5 years old (range,15 to 37) and mean duration of disease of 11.9 ± 6.4 years(range, 2 to 18) were included (Table 1). All were in abasal-bolus plan, 32 using multiple daily injections andone in insulin-pump.
Ten patients used the carbohydrate counting methodprior to the study (30%), and this proportion did not dif-fer between groups (p = 0.33).Anthropometric, biochemical and clinical basal charac-
teristics were similar between groups, except for the tri-glycerides levels, that were higher in the sucrose-addedgroup (p = 0.01) (Tables 1 and 2). Nevertheless, regressionanalysis showed no association between triglycerides andother variables (p > 0.05).Anthropometric variables were not associated with in-
sulin sensitivity factor, total daily insulin dose or insulin-to-carbohydrate ratio (p > 0.05).Both groups had a hypocaloric, hyperprotein, normogly-
cidic, normolipidic and an adequate fiber intake, whencompared with the American Diabetes Association [1]and Dietary Reference Intakes [36] current recommenda-tions. There were no differences between groups in theseparameters. Sucrose (p = 0.01) and saturated fatty acids(p = 0.03) intake were higher in the sucrose-added than inthe sucrose-free group, however, both groups showed sim-ple carbohydrate and saturated fatty acids intakes abovethe daily recommended intake based on the currentguidelines [1,36] (Table 3).
Characteristics of groups after interventionDuring the intervention, both groups remained in ahypocaloric, hyperprotein, normoglycidic, normolipidicand adequate fiber diet [1,36]. The sucrose-added groupcontinued to show a higher sucrose intake than sucrose-free group (p < 0.01), however both groups presentedsimple carbohydrate intake below the recommendations[1,36]. The monounsaturated fatty acids intake washigher in the sucrose-added group, when compared tothe sucrose-free group (p < 0.01), but both groups pre-sented intakes below the recommendations [1,36]. Theother nutrients did not differ between groups (Table 3).
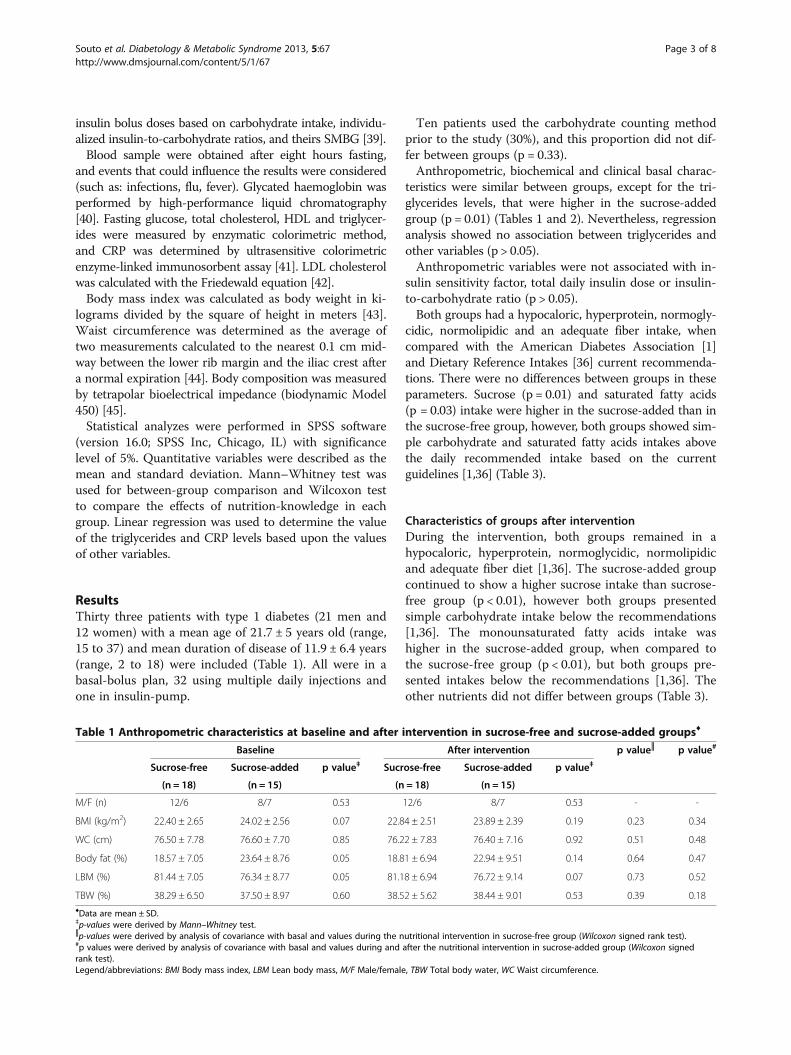
Table 1 Anthropometric characteristics at baseline and after intervention in sucrose-free and sucrose-added groups♦
Baseline After intervention p value║ p value#
Sucrose-free Sucrose-added p value‡ Sucrose-free Sucrose-added p value‡
(n = 18) (n = 15) (n = 18) (n = 15)
M/F (n) 12/6 8/7 0.53 12/6 8/7 0.53 - -
BMI (kg/m2) 22.40 ± 2.65 24.02 ± 2.56 0.07 22.84 ± 2.51 23.89 ± 2.39 0.19 0.23 0.34
WC (cm) 76.50 ± 7.78 76.60 ± 7.70 0.85 76.22 ± 7.83 76.40 ± 7.16 0.92 0.51 0.48
Body fat (%) 18.57 ± 7.05 23.64 ± 8.76 0.05 18.81 ± 6.94 22.94 ± 9.51 0.14 0.64 0.47
LBM (%) 81.44 ± 7.05 76.34 ± 8.77 0.05 81.18 ± 6.94 76.72 ± 9.14 0.07 0.73 0.52
TBW (%) 38.29 ± 6.50 37.50 ± 8.97 0.60 38.52 ± 5.62 38.44 ± 9.01 0.53 0.39 0.18♦Data are mean ± SD.‡p-values were derived by Mann–Whitney test.║p-values were derived by analysis of covariance with basal and values during the nutritional intervention in sucrose-free group (Wilcoxon signed rank test).#p values were derived by analysis of covariance with basal and values during and after the nutritional intervention in sucrose-added group (Wilcoxon signedrank test).Legend/abbreviations: BMI Body mass index, LBM Lean body mass, M/F Male/female, TBW Total body water, WC Waist circumference.
Souto et al. Diabetology & Metabolic Syndrome 2013, 5:67 Page 3 of 8http://www.dmsjournal.com/content/5/1/67
Comparing the intake before and after intervention,the sucrose-free group increased the sucrose, polyunsat-urated and monounsaturated fatty acids intake, howeverreduced the energy and fiber intake (p < 0.05). The Sucrose-added group reduced energy, carbohydrate and fiber, whileincreased fat intake (p < 0.05) (Table 3).
The data included an average of 111 ± 15.57 SMBGper month for each participant. Insulin requirements,anthropometric and laboratory variables did not differafter the intervention, in any of the groups. The sucrose-added group presented higher CRP concentrations thanothers volunteers (p = 0.04), although other variables did
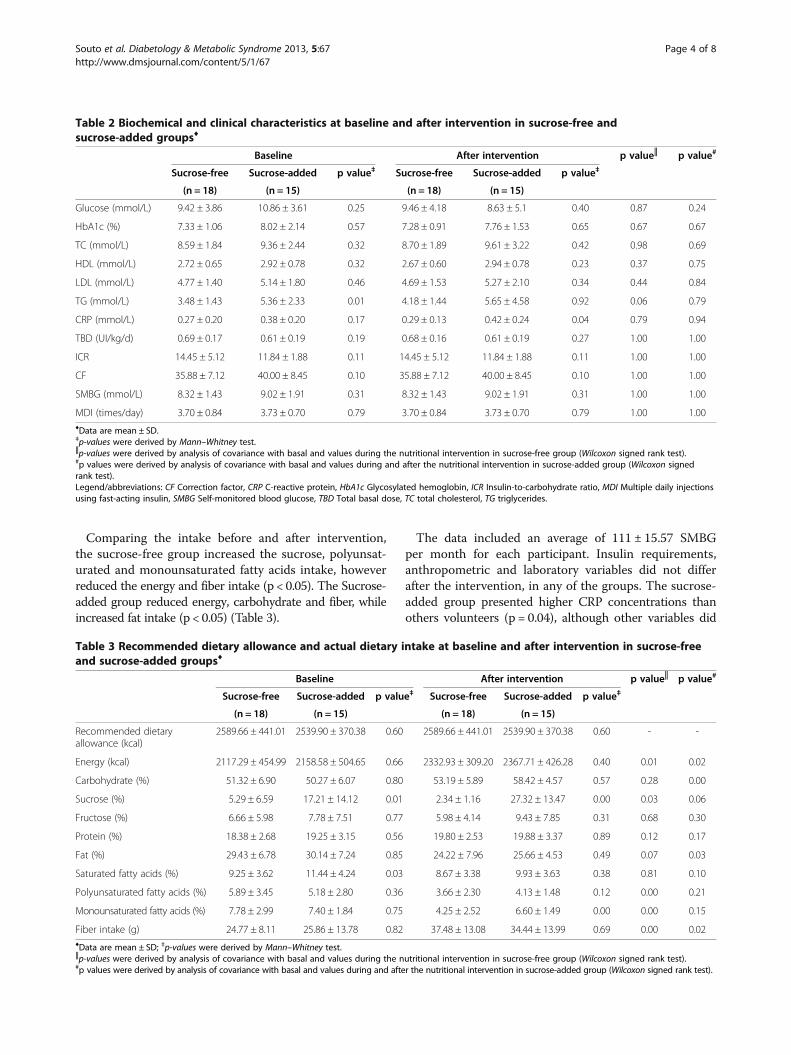
Table 2 Biochemical and clinical characteristics at baseline and after intervention in sucrose-free andsucrose-added groups♦
Baseline After intervention p value║ p value#
Sucrose-free Sucrose-added p value‡ Sucrose-free Sucrose-added p value‡
(n = 18) (n = 15) (n = 18) (n = 15)
Glucose (mmol/L) 9.42 ± 3.86 10.86 ± 3.61 0.25 9.46 ± 4.18 8.63 ± 5.1 0.40 0.87 0.24
HbA1c (%) 7.33 ± 1.06 8.02 ± 2.14 0.57 7.28 ± 0.91 7.76 ± 1.53 0.65 0.67 0.67
TC (mmol/L) 8.59 ± 1.84 9.36 ± 2.44 0.32 8.70 ± 1.89 9.61 ± 3.22 0.42 0.98 0.69
HDL (mmol/L) 2.72 ± 0.65 2.92 ± 0.78 0.32 2.67 ± 0.60 2.94 ± 0.78 0.23 0.37 0.75
LDL (mmol/L) 4.77 ± 1.40 5.14 ± 1.80 0.46 4.69 ± 1.53 5.27 ± 2.10 0.34 0.44 0.84
TG (mmol/L) 3.48 ± 1.43 5.36 ± 2.33 0.01 4.18 ± 1.44 5.65 ± 4.58 0.92 0.06 0.79
CRP (mmol/L) 0.27 ± 0.20 0.38 ± 0.20 0.17 0.29 ± 0.13 0.42 ± 0.24 0.04 0.79 0.94
TBD (UI/kg/d) 0.69 ± 0.17 0.61 ± 0.19 0.19 0.68 ± 0.16 0.61 ± 0.19 0.27 1.00 1.00
ICR 14.45 ± 5.12 11.84 ± 1.88 0.11 14.45 ± 5.12 11.84 ± 1.88 0.11 1.00 1.00
CF 35.88 ± 7.12 40.00 ± 8.45 0.10 35.88 ± 7.12 40.00 ± 8.45 0.10 1.00 1.00
SMBG (mmol/L) 8.32 ± 1.43 9.02 ± 1.91 0.31 8.32 ± 1.43 9.02 ± 1.91 0.31 1.00 1.00
MDI (times/day) 3.70 ± 0.84 3.73 ± 0.70 0.79 3.70 ± 0.84 3.73 ± 0.70 0.79 1.00 1.00♦Data are mean ± SD.‡p-values were derived by Mann–Whitney test.║p-values were derived by analysis of covariance with basal and values during the nutritional intervention in sucrose-free group (Wilcoxon signed rank test).#p values were derived by analysis of covariance with basal and values during and after the nutritional intervention in sucrose-added group (Wilcoxon signedrank test).Legend/abbreviations: CF Correction factor, CRP C-reactive protein, HbA1c Glycosylated hemoglobin, ICR Insulin-to-carbohydrate ratio, MDI Multiple daily injectionsusing fast-acting insulin, SMBG Self-monitored blood glucose, TBD Total basal dose, TC total cholesterol, TG triglycerides.
Table 3 Recommended dietary allowance and actual dietary intake at baseline and after intervention in sucrose-freeand sucrose-added groups♦
Baseline After intervention p value║ p value#
Sucrose-free Sucrose-added p value‡ Sucrose-free Sucrose-added p value‡
(n = 18) (n = 15) (n = 18) (n = 15)
Recommended dietaryallowance (kcal)
2589.66 ± 441.01 2539.90 ± 370.38 0.60 2589.66 ± 441.01 2539.90 ± 370.38 0.60 - -
Energy (kcal) 2117.29 ± 454.99 2158.58 ± 504.65 0.66 2332.93 ± 309.20 2367.71 ± 426.28 0.40 0.01 0.02
Carbohydrate (%) 51.32 ± 6.90 50.27 ± 6.07 0.80 53.19 ± 5.89 58.42 ± 4.57 0.57 0.28 0.00
Sucrose (%) 5.29 ± 6.59 17.21 ± 14.12 0.01 2.34 ± 1.16 27.32 ± 13.47 0.00 0.03 0.06
Fructose (%) 6.66 ± 5.98 7.78 ± 7.51 0.77 5.98 ± 4.14 9.43 ± 7.85 0.31 0.68 0.30
Protein (%) 18.38 ± 2.68 19.25 ± 3.15 0.56 19.80 ± 2.53 19.88 ± 3.37 0.89 0.12 0.17
Fat (%) 29.43 ± 6.78 30.14 ± 7.24 0.85 24.22 ± 7.96 25.66 ± 4.53 0.49 0.07 0.03
Saturated fatty acids (%) 9.25 ± 3.62 11.44 ± 4.24 0.03 8.67 ± 3.38 9.93 ± 3.63 0.38 0.81 0.10
Polyunsaturated fatty acids (%) 5.89 ± 3.45 5.18 ± 2.80 0.36 3.66 ± 2.30 4.13 ± 1.48 0.12 0.00 0.21
Monounsaturated fatty acids (%) 7.78 ± 2.99 7.40 ± 1.84 0.75 4.25 ± 2.52 6.60 ± 1.49 0.00 0.00 0.15
Fiber intake (g) 24.77 ± 8.11 25.86 ± 13.78 0.82 37.48 ± 13.08 34.44 ± 13.99 0.69 0.00 0.02♦Data are mean ± SD; ‡p-values were derived by Mann–Whitney test.║p-values were derived by analysis of covariance with basal and values during the nutritional intervention in sucrose-free group (Wilcoxon signed rank test).#p values were derived by analysis of covariance with basal and values during and after the nutritional intervention in sucrose-added group (Wilcoxon signed rank test).
Souto et al. Diabetology & Metabolic Syndrome 2013, 5:67 Page 4 of 8http://www.dmsjournal.com/content/5/1/67
not differ between groups (p > 0.05). CRP was not associ-ated with any of the anthropometric or laboratory vari-ables (p > 0.05). Regression analysis showed no associationbetween the amount of sucrose intake and CRP levels inany of the groups (p > 0.05) (Table 2).Triglycerides showed a positively association with the
mean of SMBG levels (r = 0.71; p = 0.00) only in thesucrose-added group, however, did not differ betweengroups after intervention (p = 0.92), as opposed to base-line (p = 0.01). There was a trend towards an increase intriglycerides levels in the sucrose-free group (p = 0.06),which was not observed in the sucrose-added group (p =0.79) (Table 2). However, the amount of sucrose intake waspositively associated to triglyceride levels (r = 0.52; p = 0.04).
DiscussionIn this study we showed that the sugar intake did notaffect the anthropometric variables, body composition andglycemic control after 3-months in subjects with type 1diabetes. This was the first clinical trial to assess the influ-ence of sucrose in these variables in individuals with type1 diabetes and showed a link between sucrose intake andincrease of CRP. Studies have reported that CRP levels arehigher in subjects with type 1 [46] and type 2 diabetes [47]compared with those without diabetes, while anotherstudy not find any correlation between CRP levels andtiter of autoantibodies in long-term type 1 individuals withtype 1 diabetes [48].Previous studies have shown positive correlation between
sugar intake and CRP in rats [49,50], healthy adults [51-54],children [55], obese [32,56], and individuals with type 2 dia-betes [57-59], suggesting several possible mechanisms. Oneexplanation would be the stimulation of the inflammatoryresponse as a consequence of hyperglycemia [53,57,60]. An-other mechanism could be an effect of glucose and fructosein enzymatic pathways and in the transcription factorsinvolved in lipogenesis. This could lead to peroxisome pro-liferation changes, microsomal enzyme induction, and tran-scription of inflammatory factors by the activating nuclearfactor-κB [61-63]. Alternatively, our third hypothesis is thatthe chronic hyperglycemia combined with sugar intakecould induced release of the neuropeptide Y (a sympatheticneurotransmitter) directly into the adipose tissue, whichstimulates endothelial cell (angiogenesis), and consequentlyleads to increase cytokines and acute phase proteins [64].There are other hypotheses to explain why high sugars
intake could lead to an increase in the levels of inflamma-tory markers. However, these mechanisms have been ob-served in mice [61,62], healthy [53,63], obese [63,65] orindividuals with type 2 [57,63]. To our knowledge, thiswas the first study to examine the effect of sucrose intakein the CRP levels in the subjects with type 1 diabetes.Even though the between-group differences in CRP in
the present study were small, and CRP has been used as
a consistent marker for evaluating the extent of cardiovas-cular diseases in subjects with type 1 diabetes [66-70], wesuggest that others determinants, such as genetic predis-position, coping mechanisms, and environmental factors,make individuals more susceptible to changes in this in-flammatory marker. Therefore, further studies are neces-sary to understand the effect of sugar intake in CRP levels.In addition, we showed that triglycerides levels did not
differ between groups after intervention, in contrast tobaseline, suggesting a trend toward an increased in tri-glycerides levels in sucrose-free group. Although, theincrease in triglyceride levels was not statistically signifi-cant, a possible reason for this worsening might be thereduced fiber intake [71,72].Furthermore, the scarcity of controlled studies asses-
sing the effect of sucrose intake on metabolic control inwell controlled subjects with type 1 diabetes difficult thecomparison with other studies. Controlled studies asses-sing the effect of sucrose in metabolic control of individ-uals with type 1 diabetes are still lacking because thestudies have used fructose as sugar source [73-75] orhigh-glycemic index diet [15,76,77]. Only one observationalstudy reported an association between sugar-sweetenedbeverages and high triglycerides levels in subjects with type1 diabetes [78], while a controlled trial showed no effect offoods with sucrose on triglycerides levels in this population[18]. Therefore, although our data suggests that the sucroseintake did not change triglycerides levels, further larger andlonger studies are still necessary to elucidate this finding.Furthermore, in this study, triglycerides had no rela-
tionship with CRP. This finding is opposite to otherstudies, which suggest that strategies to decrease inflam-matory activity in type 1 diabetes should focus on thetriglycerides levels [79]. Corroborating previous studiesthat have associated the glycemic control with triglycer-ides, we observed a positively association between triglyc-erides and SMBG, demonstrating the glycemic control isan important mediator of lipid abnormalities [16,17,80].This may occur because the insulin influences the activityof lipase lipoprotein and inhibits the lipolysis of fats storedin the tissues by inhibition of hormone-sensitive lipase.Thus, such as endogenous insulin, the effective insulintreatments influence the lipid transfers in well-controlledpatients with type 1 diabetes [16].There are potential limitations regarding the interpret-
ation of our data. Firstly, two characteristic (triglycerideslevels and saturated fatty acids intake) differed betweengroups at baseline. In addition, the sucrose intake wasnot the only dietary factor that differed between groupsduring the intervention (sucrose-added group presenteda higher monounsaturated fatty acids intake than thesucrose-free group). Interestingly, both groups had fattyacids intakes above the current recommendations, basedon the American Diabetes Association guidelines [1].
Souto et al. Diabetology & Metabolic Syndrome 2013, 5:67 Page 5 of 8http://www.dmsjournal.com/content/5/1/67
The first and second limitations probably occurred be-cause the sample was selected by convenience [35]. Fur-thermore, the adherence to the prescribed diet is difficultto accomplish [81-84]. Thus, these results could not rep-resent what would happen with the entire population [35].In summary, although American Diabetes Association
report that “unnecessarily restrict sucrose” [1] and all oursubjects (both groups) had less than 10% of energy fromsugars, we showed that intake of sucrose did not alterbody weight, body composition, glycemic and lipemiccontrol, however, there is a link between sucrose intakeand increase of CRP. For this reason, according to theabove result, we suggest that individuals with diabeteschoose to avoid high-sucrose foods even they may eat arelatively small amount. Therefore, further clinical stud-ies are needed to assess the relationship between sugarsand CRP levels in subjects with type 1 diabetes.
ConclusionsSucrose intake, along with a disciplined diet, comparedwith sucrose-free diet, did not affect insulin requirements,anthropometric variables, body composition, glycemic, andlipemic control. However, although the sucrose intakes in-crease CRP levels, the amount of sugar in the diet was notassociated with this inflammatory marker.
AbbreviationsBMI: Body mass index; CRP: C-reactive protein; SMBG: Self-monitoredblood glucose.
Competing interestsThe authors declare that they have no competing interests.
Authors’ contributionsDLS draft the manuscript, conceived, performed and coordinated the study.LZ and MR helped in the data collecting and contributed to draft themanuscript. ELR participated in design and coordination and draft themanuscript. All authors read and approved the final manuscript.
AcknowledgementsWe thank Marcus M.S. Oliveira, Maria Adelaide M. Santos, Joana R. Dantas,Érika S. Lima, Mariana P. Miranda, and Priscila M. Leal for help with datacollection. José Egídio Paulo de Oliveira to allow data collection and ourpatients for their cooperation.
Author details1Institute of Nutrition Josué de Castro, Federal University of Rio de Janeiro,Brigadeiro Trompowski avenue, CCS building, - J block J - second floor -District: Ilha do Fundão, 360 Felisbelo Freire Street, Apartament 202 District:Ramos, Zipe Code: 21941-590, Rio de Janeiro, Brazil. 2Medicine, FederalUniversity of Rio de Janeiro, Rio de Janeiro, Brazil. 3Food Science andTechnology, Federal University of Viçosa, Viçosa, Brazil. 4Institute of NutritionJosué de Castro, Federal University of Rio de Janeiro, Rio de Janeiro, Brazil.5Department of Internal Medicine, Section of Diabetes and Nutrology, FederalUniversity of Rio de Janeiro, Rio de Janeiro, Brazil.
Received: 14 May 2013 Accepted: 9 November 2013Published: 12 November 2013
References1. Bantle JP, Wylie-Rosett J, Albright AL, Apovian CM, Clark NG, Franz MJ,
Hoogwerf BJ, Lichtenstein AH, Mayer-Davis E, Mooradian AD, et al: Nutrition
recommendations and interventions for diabetes: a position statement ofthe American diabetes association. Diabetes Care 2008, 31(Suppl 1):S61–S78.
2. Le Floch JP, Le Lievre G, Sadoun J, Perlemuter L, Peynegre R, Hazard J:Taste impairment and related factors in type I diabetes mellitus.Diabetes Care 1989, 12:173–178.
3. Gondivkar SM, Indurkar A, Degwekar S, Bhowate R: Evaluation of gustatoryfunction in patients with diabetes mellitus type 2. Oral Surg Oral Med OralPathol Oral Radiol Endod 2009, 108:876–880.
4. Eny KM, Wolever TM, Corey PN, El-Sohemy A: Genetic variation in TAS1R2(Ile191Val) is associated with consumption of sugars in overweight andobese individuals in 2 distinct populations. Am J Clin Nutr 2010,92:1501–1510.
5. Perros P, MacFarlane TW, Counsell C, Frier BM: Altered taste sensation innewly-diagnosed NIDDM. Diabetes Care 1996, 19:768–770.
6. Peres DS, Franco LJ, dos Santos MA: Eating behavior among type 2diabetes women. Rev Saude Publica 2006, 40:310–317.
7. Beauchamp GK, Mennella JA: Flavor perception in human infants:development and functional significance. Digestion 2011, 83(Suppl 1):1–6.
8. Reed DR, McDaniel AH: The human sweet tooth. BMC Oral Health 2006,6 Suppl 1:S17.
9. Avena NM, Rada P, Hoebel BG: Evidence for sugar addiction: behavioraland neurochemical effects of intermittent, excessive sugar intake.Neurosci Biobehav Rev 2008, 32:20–39.
10. Yanovski S: Sugar and fat: cravings and aversions. J Nutr 2003,133:835S–837S.
11. Nathan DM, Meigs J, Singer DE: The epidemiology of cardiovasculardisease in type 2 diabetes mellitus: how sweet it is … or is it? Lancet1997, 350(Suppl 1):SI4–SI9.
12. Brunner S, Holub I, Theis S, Gostner A, Melcher R, Wolf P, Amann-Gassner U,Scheppach W, Hauner H: Metabolic effects of replacing sucrose by iso-maltulose in subjects with type 2 diabetes: a randomized double-blindtrial. Diabetes Care 2012, 35:1249–1251.
13. Blades B, Garg A: Mechanisms of increase in plasma triacylglycerolconcentrations as a result of high carbohydrate intakes in patients withnon-insulin-dependent diabetes mellitus. Am J Clin Nutr 1995,62:996–1002.
14. Rabasa-Lhoret R, Garon J, Langelier H, Poisson D, Chiasson J: Effects ofmeal carbohydrate content on insulin requirements in type 1 diabeticpatients treated intensively with the basal-bolus (ultralente-regular)insulin regimen. Diabetes Care 1999, 22:667.
15. Buyken A, Toeller M, Heitkamp G, Karamanos B, Rottiers R, Muggeo M, Fuller J,EURODIAB I: Glycemic index in the diet of European outpatients with type 1diabetes: relations to glycated hemoglobin and serum lipids. Am J Clin Nutr2001, 73:574.
16. Feitosa AC, Feitosa-Filho GS, Freitas FR, Wajchenberg BL, Maranhao RC:Lipoprotein metabolism in patients with type 1 diabetes under intensiveinsulin treatment. Lipids Health Dis 2013, 12:15.
17. Alcantara LM, Silveira NE, Dantas JR, Araujo PB, de Oliveira MM, Milech A,Zajdenverg L, Rodacki M, de Oliveira JE: Low triglyceride levels areassociated with a better metabolic control in patients with type 1diabetes. Diabet Metab Syndr 2011, 3:22.
18. Costa PC, Franco LJ: Introduction of sucrose in the diet plan of personswith type 1 diabetes: its influence in the glycemic control.Arq Bras Endocrinol Metabol 2005, 49:403–409.
19. Kulkarni KD: Carbohydrate counting: a practical meal-planning option forpeople with diabetes. Clinical Diabetes 2005, 23:120–122.
20. Bishop FK, Maahs DM, Spiegel G, Owen D, Klingensmith GJ, Bortsov A,Thomas J, Mayer-Davis EJ: The carbohydrate counting in adolescents withtype 1 diabetes (CCAT) study. Diabetes Spectrum 2009, 22:56–62.
21. Spiegel G, Bortsov A, Bishop FK, Owen D, Klingensmith GJ, Mayer-Davis EJ,Maahs DM: Randomized nutrition education intervention to improvecarbohydrate counting in adolescents with type 1 diabetes study: ismore intensive education needed? J Acad Nutri Dietetics 2012,112:1736–1746.
22. Bantle J, Wylie-Rosett J, Albright A, Apovian C, Clark N, Franz M, Hoogwerf B,Lichtenstein A, Mayer-Davis E, Mooradian A: Nutrition recommendationsand interventions for diabetes: a position statement of the Americandiabetes association. Diabetes Care 2008, 31:S61.
23. Chiesa G, Piscopo MA, Rigamonti A, Azzinari A, Bettini S, Bonfanti R, ViscardiM, Meschi F, Chiumello G: Insulin therapy and carbohydrate counting.Acta Biomed 2005, 76(Suppl 3):44–48.
Souto et al. Diabetology & Metabolic Syndrome 2013, 5:67 Page 6 of 8http://www.dmsjournal.com/content/5/1/67
24. Dias VM, Pandini JA, Nunes RR, Sperandei SL, Portella ES, Cobas RA, GomesMde B: Effect of the carbohydrate counting method on glycemic controlin patients with type 1 diabetes. Diabet Metab Syndr 2010, 2:54.
25. Martins MR, Ambrosio AC, Nery M, Aquino RD, Queiroz MS: Assessmentguidance of carbohydrate counting method in patients with type 2diabetes mellitus. Prim Care Diabetes 2013 [Epub ahead of print]
26. Waldron S, Hanas R, Palmvig B: How do we educate young people tobalance carbohydrate intake with adjustments of insulin? Horm Res 2002,57(Suppl 1):62–65.
27. Wylie-Rosett J, Aebersold K, Conlon B, Ostrovsky NW: Medical nutritiontherapy for youth with type 1 diabetes mellitus: more than carbohydratecounting. J Acad Nutri Dietetics 2012, 112:1724–1727. United States.
28. Marigliano M, Morandi A, Maschio M, Sabbion A, Contreas G, Tomasselli F,Tommasi M, Maffeis C: Nutritional education and carbohydrate countingin children with type 1 diabetes treated with continuous subcutaneousinsulin infusion: the effects on dietary habits, body composition andglycometabolic control. Acta Diabetol 2013 [Epub ahead of print]
29. Trento M, Borgo E, Kucich C, Passera P, Trinetta A, Charrier L, Cavallo F, Porta M:Quality of life, coping ability, and metabolic control in patients with type 1diabetes managed by group care and a carbohydrate counting program.Diabetes Care 2009, 32:e134.
30. Lopes Souto D, Lopes Rosado E: Use of carb counting in the dietarytreatment of diabetes mellitus. Nutr Hosp 2010, 25:18–25.
31. Liu S, Manson J, Buring J, Stampfer M, Willett W, Ridker P: Relation betweena diet with a high glycemic load and plasma concentrations ofhigh-sensitivity C-reactive protein in middle-aged women. Am J Clin Nutr2002, 75:492.
32. Sørensen L, Raben A, Stender S, Astrup A: Effect of sucrose oninflammatory markers in overweight humans. Am J Clin Nutr 2005, 82:421.
33. Levitan EB, Cook NR, Stampfer MJ, Ridker PM, Rexrode KM, Buring JE,Manson JE, Liu S: Dietary glycemic index, dietary glycemic load, bloodlipids, and C-reactive protein. Metabolism 2008, 57:437.
34. Malik VS, Popkin BM, Bray GA, Després J-P, Willett WC, Hu FB: Sugar-sweet-ened beverages and risk of metabolic syndrome and type 2 diabetes: ameta-analysis. Diabetes Care 2010, 33:2477.
35. Lwanga SK, Lemeshow S: Sample size determination in health studies:a practical manual/SK Lwanga and S. Lemeshow. England: World HealthOrganization; 1991.
36. Trumbo P, Schlicker S, Yates AA, Poos M: Dietary reference intakes forenergy, carbohydrate, fiber, fat, fatty acids, cholesterol, protein andamino acids. J Am Diet Assoc 2002, 102:1621–1630.
37. Geil PB: Choose your foods: exchange lists for diabetes: the 2008 revisionof exchange lists for meal planning. Diabetes Spectrum 2008, 21:281–283.
38. Wasson J, Gaudette C, Whaley F, Sauvigne A, Baribeau P, Welch H:Telephone care as a substitute for routine clinic follow-up. JAMA 1992,267:1788–1793.
39. Ginsberg BH: System for determining insulin dose using carbohydrate toinsulin ratio and insulin sensitivity factor. In Book System for determininginsulin dose using carbohydrate to insulin ratio and insulin sensitivity factor.Frankin Lakes, NJ (US): United States Patent; 2008. Patent number:US 7,404,796 B2.
40. Mosca A, Goodall I, Hoshino T, Jeppsson JO, John WG, Little RR, Miedema K,Myers GL, Reinauer H, Sacks DB, et al: Global standardization of glycatedhemoglobin measurement: the position of the IFCC working group.Clin Chem Lab Med 2007, 45:1077–1080.
41. Rifai N, Tracy R, Ridker P: Clinical efficacy of an automated high-sensitivityC-reactive protein assay. Clin Chem 1999, 45:2136.
42. Friedewald WT, Levy RI, Fredrickson DS: Estimation of the concentration oflow-density lipoprotein cholesterol in plasma, without use of thepreparative ultracentrifuge. Clin Chem 1972, 18:499–502.
43. World Health Organization: Physical status: the use and interpretation ofanthropometry, Report of a WHO Expert Committee. Technical Report Series,n. 854. Geneva: WHO; 1995.
44. World Health Organization: Waist circumference and waist-hip ratio: report ofa WHO expert consultation. Geneva: World Health Organixation; 2008:8–11.
45. Lukaski HC, Johnson PE, Bolonchuk WW, Lykken GI: Assessment of fat-freemass using bioelectrical impedance measurements of the human body.Am J Clin Nutr 1985, 41:810–817.
46. Turker Y, Aslantas Y, Aydin Y, Demirin H, Kutlucan A, Tibilli H, Turker Y,Ozhan H: Heart rate variability and heart rate recovery in patients withtype 1 diabetes mellitus. Acta Cardiol 2013, 68:145–150.
47. King DE, Mainous AG 3rd, Buchanan TA, Pearson WS: C-reactive proteinand glycemic control in adults with diabetes. Diabetes Care 2003,26:1535–1539.
48. Treszl A, Szereday L, Doria A, King GL, Orban T: Elevated C-reactive proteinlevels do not correspond to autoimmunity in type 1 diabetes.Diabetes Care 2004, 27:2769–2770.
49. Fuente-Martin E, Garcia-Caceres C, Diaz F, Argente-Arizon P, Granado M,Barrios V, Argente J, Chowen JA: Hypothalamic inflammation withoutastrogliosis in response to high sucrose intake is modulated by neonatalnutrition in male rats. Endocrinology 2013, 154:2318–2330.
50. Roncal-Jimenez CA, Lanaspa MA, Rivard CJ, Nakagawa T, Sanchez-Lozada LG, Jalal D, Andres-Hernando A, Tanabe K, Madero M, Li N, et al:Sucrose induces fatty liver and pancreatic inflammation in malebreeder rats independent of excess energy intake. Metabolism 2011,60:1259–1270.
51. Moreto F, de Oliveira EP, Manda RM, Torezan GA, Teixeira O, Michelin E,Burini RC: Pathological and behavioral risk factors for higher serumC-reactive protein concentrations in free-living adults–a Braziliancommunity-based study. Inflammation 2013, 36:15–25.
52. Yaghoobi N, Al-Waili N, Ghayour-Mobarhan M, Parizadeh SM, Abasalti Z,Yaghoobi Z, Yaghoobi F, Esmaeili H, Kazemi-Bajestani SM, Aghasizadeh R,et al: Natural honey and cardiovascular risk factors; effects on bloodglucose, cholesterol, triacylglycerole, CRP, and body weight comparedwith sucrose. Sci World J 2008, 8:463–469.
53. de Koning L, Malik VS, Kellogg MD, Rimm EB, Willett WC, Hu FB: Sweetenedbeverage consumption, incident coronary heart disease, and biomarkersof risk in men. Circulation 2012, 125:1735–1741. S1731.
54. Aeberli I, Gerber PA, Hochuli M, Kohler S, Haile SR, Gouni-Berthold I,Berthold HK, Spinas GA, Berneis K: Low to moderate sugar-sweetenedbeverage consumption impairs glucose and lipid metabolism andpromotes inflammation in healthy young men: a randomized controlledtrial. Am J Clin Nutr 2011, 94:479–485.
55. Kosova EC, Auinger P, Bremer AA: The relationships betweensugar-sweetened beverage intake and cardiometabolic markers in youngchildren. J Acad Nutri Dietetics 2013, 113:219–227.
56. Nicklas JM, Sacks FM, Smith SR, Leboff MS, Rood JC, Bray GA, Ridker PM:Effect of dietary composition of weight loss diets on high-sensitivityc-reactive protein: the randomized POUNDS LOST trial. Obesity 2013,21:681–689.
57. Sonestedt E, Overby NC, Laaksonen DE, Birgisdottir BE: Does high sugarconsumption exacerbate cardiometabolic risk factors and increase therisk of type 2 diabetes and cardiovascular disease? Food Nutr Res 2012,56. DOI: 10.3402/fnr.v56i0.19104. [Epub 2012 Jul 30].
58. Al-Waili NS: Natural honey lowers plasma glucose, C-reactive protein,homocysteine, and blood lipids in healthy, diabetic, and hyperlipidemicsubjects: comparison with dextrose and sucrose. J Med Food 2004,7:100–107.
59. Wolever T, Gibbs A, Mehling C, Chiasson J, Connelly P, Josse R, Leiter L,Maheux P, Rabasa-Lhoret R, Rodger N: The Canadian trial of carbohydratesin diabetes (CCD), a 1-y controlled trial of low-glycemic-index dietarycarbohydrate in type 2 diabetes: no effect on glycated hemoglobin butreduction in C-reactive protein. Am J Clin Nutr 2008, 87:114.
60. Esposito K, Nappo F, Marfella R, Giugliano G, Giugliano F, Ciotola M,Quagliaro L, Ceriello A, Giugliano D: Inflammatory cytokine concentrationsare acutely increased by hyperglycemia in humans: role of oxidativestress. Circulation 2002, 106:2067–2072.
61. Janevski M, Ratnayake S, Siljanovski S, McGlynn MA, Cameron-Smith D,Lewandowski P: Fructose containing sugars modulate mRNA of lipogenicgenes ACC and FAS and protein levels of transcription factors ChREBPand SREBP1c with no effect on body weight or liver fat. Food Funct 2012,3:141–149.
62. Koo HY, Wallig MA, Chung BH, Nara TY, Cho BH, Nakamura MT: Dietaryfructose induces a wide range of genes with distinct shift incarbohydrate and lipid metabolism in fed and fasted rat liver.Biochim Biophys Acta 2008, 1782:341–348.
63. Mucci L, Santilli F, Cuccurullo C, Davi G: Cardiovascular risk and dietarysugar intake: is the link so sweet? Intern Emerg Med 2012, 7:313–322.
64. Kuo LE, Czarnecka M, Kitlinska JB, Tilan JU, Kvetnansky R, Zukowska Z:Chronic stress, combined with a high-fat/high-sugar diet, shiftssympathetic signaling toward neuropeptide Y and leads to obesity andthe metabolic syndrome. Ann N Y Acad Sci 2008, 1148:232–237.
Souto et al. Diabetology & Metabolic Syndrome 2013, 5:67 Page 7 of 8http://www.dmsjournal.com/content/5/1/67
65. Bray GA: Fructose and risk of cardiometabolic disease. Curr Atheroscler Rep2012, 14:570–578.
66. Hayaishi-Okano R, Yamasaki Y, Katakami N, Ohtoshi K, Gorogawa S, KurodaA, Matsuhisa M, Kosugi K, Nishikawa N, Kajimoto Y, Hori M: ElevatedC-reactive protein associates with early-stage carotid atherosclerosis inyoung subjects with type 1 diabetes. Diabetes Care 2002, 25:1432–1438.
67. Ladeia AM, Stefanelli E, Ladeia-Frota C, Moreira A, Hiltner A, Adan L: Associationbetween elevated serum C-reactive protein and triglyceride levels in youngsubjects with type 1 diabetes. Diabetes Care 2006, 29:424–426.
68. Du M, Basu A, Fu D, Wu M, Centola M, Jenkins AJ, Hanssen KF, Garg SK,Hammad SM, Scardo JA, et al: Serum inflammatory markers and preeclampsiain type 1 diabetes: a prospective study. Diabetes Care 2013, 36:2054–2061.
69. Strychar I, Cohn JS, Renier G, Rivard M, Aris-Jilwan N, Beauregard H, Meltzer S,Belanger A, Dumas R, Ishac A, et al: Effects of a diet higher in carbohydrate/lower in fat versus lower in carbohydrate/higher in monounsaturated faton postmeal triglyceride concentrations and other cardiovascular riskfactors in type 1 diabetes. Diabetes Care 2009, 32:1597–1599.
70. Delahanty LM, Nathan DM, Lachin JM, Hu FB, Cleary PA, Ziegler GK, Wylie-Rosett J, Wexler DJ, Diabetes C: Complications trial/epidemiology of D:association of diet with glycated hemoglobin during intensive treatmentof type 1 diabetes in the diabetes control and complications trial.Am J Clin Nutr 2009, 89:518–524.
71. Harold MR, Reeves RD, Bolze MS, Guthrie RA, Guthrie DW: Effect of dietaryfiber in insulin-dependent diabetics: insulin requirements and serumlipids. J Am Diet Assoc 1985, 85:1455–1461.
72. Anderson JW, Randles KM, Kendall CW, Jenkins DJ: Carbohydrate and fiberrecommendations for individuals with diabetes: a quantitative assessmentand meta-analysis of the evidence. J Am Coll Nutr 2004, 23:5–17.
73. Couch SC, Crandell JL, Shah AS, Dolan LM, Merchant AT, Liese AD,Lawrence JM, Pihoker C, Mayer-Davis EJ: Fructose intake and cardiovascularrisk factors in youth with type 1 diabetes: SEARCH for diabetes in youthstudy. Diabetes Res Clin Pract 2013, 100:265–271.
74. Bantle JP, Laine DC, Thomas JW: Metabolic effects of dietary fructose andsucrose in types I and II diabetic subjects. JAMA 1986, 256:3241–3246.
75. Bantle JP, Swanson JE, Thomas W, Laine DC: Metabolic effects of dietaryfructose in diabetic subjects. Diabetes Care 1992, 15:1468–1476.
76. Giacco R, Parillo M, Rivellese AA, Lasorella G, Giacco A, D’Episcopo L,Riccardi G: Long-term dietary treatment with increased amounts offiber-rich low-glycemic index natural foods improves blood glucosecontrol and reduces the number of hypoglycemic events in type 1diabetic patients. Diabetes Care 2000, 23:1461–1466.
77. Wolever TM, Hamad S, Chiasson JL, Josse RG, Leiter LA, Rodger NW,Ross SA, Ryan EA: Day-to-day consistency in amount and source ofcarbohydrate intake associated with improved blood glucose control intype 1 diabetes. J Am Coll Nutr 1999, 18:242–247.
78. Bortsov A, Liese A, Bell R, Dabelea D, D’Agostino R Jr, Hamman R,Klingensmith G, Lawrence J, Maahs D, McKeown R: Sugar-sweetened anddiet beverage consumption is associated with cardiovascular risk factorprofile in youth with type 1 diabetes. Acta Diabetol 2011, 48:275.
79. Neithercott T: 30 Tips for successful carb counting. Top pointers fromreal people with diabetes. Diabetes Forecast 2011, 64:34–39.
80. Guy J, Ogden L, Wadwa RP, Hamman RF, Mayer-Davis EJ, Liese AD,D’Agostino R, Marcovina S, Dabelea D: Lipid and lipoprotein profiles inyouth with and without type 1 diabetes: the SEARCH for diabetes inyouth case–control study. Diabetes Care 2009, 32:416–420.
81. Price KJ, Lang JD, Eiser C, Tripp JH: Prescribed versus unrestricted carbohydratediets in children with type 1 diabetes. Diabet Med 1993, 10:962–967.
82. Kornides ML, Nansel TR, Quick V, Haynie DL, Lipsky LM, Laffel LM, Mehta SN:Associations of family meal frequency with family meal habits and mealpreparation characteristics among families of youth with type 1diabetes. Child Care Health Dev 2013 [Epub ahead of print].
83. Kulkarni K, Castle G, Gregory R, Holmes A, Leontos C, Powers M, SnetselaarL, Splett P, Wylie-Rosett J: Nutrition practice guidelines for type 1 diabetesmellitus positively affect dietitian practices and patient outcomes. Thediabetes care and education dietetic practice group. J Am Diet Assoc1998, 98:62–70. quiz 71–62.
84. Hanestad BR, Albrektsen G: Quality of life, perceived difficulties in adherence toa diabetes regimen, and blood glucose control. Diabet Med 1991, 8:759–764.
doi:10.1186/1758-5996-5-67Cite this article as: Souto et al.: Does sucrose intake affect antropometricvariables, glycemia, lipemia and C-reactive protein in subjects with type 1diabetes?: a controlled-trial. Diabetology & Metabolic Syndrome 2013 5:67.
Submit your next manuscript to BioMed Centraland take full advantage of:
• Convenient online submission
• Thorough peer review
• No space constraints or color figure charges
• Immediate publication on acceptance
• Inclusion in PubMed, CAS, Scopus and Google Scholar
• Research which is freely available for redistribution
Submit your manuscript at www.biomedcentral.com/submit
Souto et al. Diabetology & Metabolic Syndrome 2013, 5:67 Page 8 of 8http://www.dmsjournal.com/content/5/1/67
![Original Article Effective Delivery of Exogenous Compounds ... · systemic side effects, such as insomnia, dyspepsia, hyper-glycemia, and hypertension [4]. Glaucoma is caused by](https://img.pdfslide.us/doc/110x75/5ceb62dd88c993d8588b710e/original-article-effective-delivery-of-exogenous-compounds-systemic-side.jpg)