Embed Size (px)
Citation preview

Finance and Economics Discussion SeriesDivisions of Research & Statistics and Monetary Affairs
Federal Reserve Board, Washington, D.C.
Does Price Regulation Affect Competition? Evidence from CreditCard Solicitations
Yiwei Dou, Geng Li, and Joshua Ronen
2019-018
Please cite this paper as:Dou, Yiwei, Geng Li, and Joshua Ronen (2019). “Does Price Regulation Affect Com-petition? Evidence from Credit Card Solicitations,” Finance and Economics Discus-sion Series 2019-018. Washington: Board of Governors of the Federal Reserve System,https://doi.org/10.17016/FEDS.2019.018.
NOTE: Staff working papers in the Finance and Economics Discussion Series (FEDS) are preliminarymaterials circulated to stimulate discussion and critical comment. The analysis and conclusions set forthare those of the authors and do not indicate concurrence by other members of the research staff or theBoard of Governors. References in publications to the Finance and Economics Discussion Series (other thanacknowledgement) should be cleared with the author(s) to protect the tentative character of these papers.

Does Price Regulation Affect Competition? Evidence from Credit Card Solicitations
Yiwei Dou New York University
Geng Li Federal Reserve Board
Joshua Ronen New York University
February 2019 We study the unintended consequences of consumer financial regulations, focusing on the CARD Act, which restricts consumer credit card issuers’ ability to raise interest rates. We estimate the competitive responsiveness—the degree to which a credit card issuer changes offered interest rates in response to changes in interest rates offered by its competitors—as a measure of competition in the credit card market. Using small business card offers, which are not subject to the Act, as a control group, we find a significant decline in the competitive responsiveness after the Act. The decline in responsiveness is more pronounced for competitors’ reductions, as opposed to increases, in interest rates, and is more pronounced in areas with more subprime borrowers. The reduced competition underscores the potential unintended consequence of regulating the consumer credit market and contributes toward a more comprehensive and balanced evaluation of the costs and benefits of consumer financial regulations. The views presented in this paper are those of the authors and do not necessarily represent those of the Federal Reserve Board or its staff. Contact: [email protected] (YD), [email protected] (GL), and [email protected] (JR). We thank Johannes Stroebel and seminar participants at the Federal Reserve Board for helpful suggestions and comments.
1
1. Introduction
The subprime mortgage crisis of 2008 led to a surge of policy and legislative initiatives in
regulating consumer financial products. A number of federal legislations rolled out or were under
consideration to protect consumers in household finance markets. A notable example of such
legislations is the Credit Card Accountability, Responsibility, and Disclosure Act of 2009
(henceforth, the CARD Act or the Act).1 The CARD Act was enacted with the objective of
protecting consumers and establishing fair and transparent practices in the credit card market.
The Act restricts, among other things, consumer credit card issuers’ ability to increase interest
rates on outstanding balances. This restriction prompted the classic concern regarding unintended
consequences of hampering competition (Joskow and Rose, 1989), since it limits issuers’
feasible pricing space, making credit supply less elastic. In this paper, we investigate the effect of
the CARD Act on issuers’ competition.
Identifying effects on competition is challenging in part because, lacking proper
instruments, it is difficult to parse out observed quantity and price changes in equilibrium into
supply and demand effects. In this study, we take advantage of a unique proprietary dataset of
credit card mail solicitations (compiled by Mintel/Comperemedia) that presents supply measures
helpful for analyzing the dynamics of competition among credit suppliers (i.e., major credit card
issuers). Direct mail marketing has been one of the most important channels through which
banks market their credit card products to consumers (Grodzicki, 2014). Research demonstrates
that the information contained in these mail offers can be used to infer the supply of such credit
(Han et al., 2018).
1 Pub. L. No. 111-24, 123 Stat. 1734 (2009) (codified and scattered sections of the U.S.C.).

2
We focus on a particular aspect of competition, namely, the degree to which a credit card
issuer reacts to recent changes by its competitors, which we refer to as the competitive
responsiveness. The responsiveness of a firm to rivals’ actions has been used to assess
competition in other industries. For example, examining the motor vehicle industry, Doyle and
Snyder (1999) find that firms adjust their planned and actual production in response to similar
actions of their rivals, consistent with predictions from oligopoly competition theories (Li, 1985).
We propose an intuitive and theoretically appealing indicator to measure competition in the
credit card market—the degree to which a card issuer responds to earlier changes in offered
interest rates of its competitors. If competition in the credit card market weakened, each issuer
will dampen its responses to competitors’ changes in offered interest rates.
Credit card mail solicitations are infamously complex, typically including dozens of
contractual terms, many of which are presented only in the fine print. Our analysis focuses on
one particular term in solicitations—the regular purchase interest rate—for three reasons. First,
since the Act explicitly restricts increasing interest rates, it most directly affects card issuers’
competition on interest rates.2 Second, unlike the fine-print terms that consumers may often
overlook or ignore (such as international transaction fees), the regular purchase interest rate
(often referred to as the “go-to rate”) is one of the top-line terms that the offers saliently
highlight and it directly impacts consumers’ borrowing decisions (Agarwal, Chomsisengphet,
Mahoney, and Stroebel, 2015; Gabaix and Laibson, 2006). Third, extant research demonstrates
that individual consumers face substantial search and switching costs (Calem and Mester, 1995;
Kuchler, 2017; Pinheiro and Ronen, 2016; Stango, 2002). This potentially mutes observed
manifestations of rate competition in existing credit card accounts (Stango and Zinman, 2016). In
2 For example, the restrictions on interest rate increases are viewed as “the core, most important provision of the CARD Act” by the credit card industry (American Bankers Association, 2013).

3
contrast, changes in offered interest rates in solicitations and reactions to these changes among
credit card issuers better capture the dynamics of competition in the industry (Agarwal,
Chomsisengphet, Liu, and Souleles, 2006).
When competitors lower offered interest rates, an issuer’s optimal response must balance
two countervailing forces. On one hand, if an issuer does not lower its own offered interest rates
in response to competitors lowering theirs, it may lose potential customers to competitors. On the
other hand, lower average rates slash future interest revenue, at least until repricing the account.
Such interest revenue losses tended to be limited prior to the Act since the card issuers were
subject to few restrictions on raising rates on existing accounts. Because the Act limits issuers’
ability to reprice, it potentially also increases such revenue losses and thereby the cost of
mimicking lower rates offered by competitors. We therefore expect an issuer’s responsiveness to
its competitors’ changes in offered interest rates (in particular rate reductions) to become more
muted after the implementation of the CARD Act, indicating a decrease in competition.
Unobservable factors present a challenge to testing our conjectures that is frequently
encountered in policy evaluation exercises. These factors, rather than the Act, may have
contributed to changes in issuers’ responses to competitors’ moves. We follow Agarwal et al.
(2015) and circumvent this identification difficulty by using offers of small business credit cards,
which are not subject to the provisions of the Act, as the control group. Specifically, we employ
a difference-in-differences design to a sample of consumer and small business credit card offers
during 2001-2016. This design enables us to compare the before- and after-Act responsiveness of
issuers between consumer and small business credit card offers extended in the same local area
(a county in our baseline analysis). The Mintel data we use collects detailed demographic and
socioeconomic information about individual offer recipients, thereby allowing us to check the

4
covariate balance. We confirm that the recipients of consumer and small business card offers
exhibit similar annual changes in demographic and socioeconomic characteristics, both before
and after the implementation of the Act. In addition, we control for an extensive set of offer
recipient characteristics and economic conditions in the local area—all potentially affect the
competitive actions of issuers marketing to borrowers in a given county .
Our baseline analysis suggests that issuers’ responsiveness to competitors’ changes in
consumer card offered interest rates weakened after the Act, relative to offers for small business
cards. Our analysis indicates that, before the Act, for each one-percentage point change in the
average interest rate offered by competitors to consumers in the previous year, a card issuer
adjusted its own offered interest rates in the current year by about one half of a percentage point
in the same direction. This competitive responsiveness decreases by about 40 percent after the
implementation of the Act. We obtain similar results when focusing on counties with both
consumer and small business card offers and implementing the analysis at the metropolitan
statistical area (MSA) level. At the MSA level, we also study the changes in competitive
responsiveness at a quarterly frequency. We continue to find robust results.
We extend our analysis in a number of directions to shed more light on the relationship
between the Act and reduced competitive responsiveness. First, we exploit the feature that the
Act restricts an increase but not a decrease in interest rates of existing accounts, which may lead
to different competitive responsiveness changes with respect to competitors’ raising versus
lowering offered interest rates. We examine competitors’ positive and negative changes in
average interest rates offered separately and find more pronounced reduction in competitive
responsiveness to competitors’ decreases in offered interest rates. In other words, consumer

5
credit card issuers appeared to be reluctant to follow a competitor’s decreases, but not increases,
in offered rates.
Second, we track the more precise timing of the change in the offered-rate responsiveness
and find that the weakening in responsiveness in the consumer market relative to the small
business market did not take place before 2009, suggesting parallel pre-CARD Act trends of
interest rate responsiveness to consumer and small business card offers. Moreover, we find that
the reduction occurred in 2009, became stronger in 2010, and remained significant afterwards.
These dynamics are consistent with issuers having anticipated some implications of the Act in
their credit offering strategies during 2009, likely due to the Federal Reserve Board’s adoption of
similar credit card rules by the end of 2008 (Jambulapati and Stanvis, 2014; Zywicki, 2016), and
to the subsequent resolution of uncertainty having enhanced the effects of the legislation.
Third, we test whether the reduction in the offered-rate responsiveness varies with
average credit risk of consumers in a given area, measured using the share of subprime
borrowers in a county. In counties with a larger share of subprime borrowers, losing the ability to
reprice is likely more costly for issuers (Nelson, 2018). Consistent with this conjecture, we find a
more pronounced reduction in an issuer’s responsiveness to rivals’ decreases in offered interest
rate in such counties.
Fourth, we test if the findings are driven by the shift of consumer credit card offers
towards different client pools by different issuers. In such a scenario, the changes in the credit
quality of offer recipients of various card issuers may differ. For example, if the profile of offer
recipients of an issuer becomes riskier after the Act, competitive responsiveness would appear to
be more subdued; the opposite would be observed if the profile becomes less risky. We track the

6
share of subprime recipients and the average credit scores of recipients to capture changes in
offer recipients’ credit quality, and we find no evidence for this alternative explanation.
Fifth, we find no decline in competitive responsiveness to major credit card terms other
than the interest rate, such as reward programs and annual fees.3 The results suggest the reduced
responsiveness is concentrated in interest rate competition, the term prominently regulated by the
Act.
Finally, we also examine the extent to which weakened competitive responsiveness led to
more dispersed interest rates and higher markups in consumer card offers. In comparison to
small business cards, we find that the dispersion in consumer card offered rates and the spread of
these rates over two-year Treasury yield have increased after the Act. The results corroborate the
proposition that reduced competition led to greater price dispersion and higher prices paid by
consumers (Gerardi and Shapiro, 2009; Edmond, Midrigan, and Xu, 2015).
Our analysis demonstrates that interest rate regulations intended for consumer protection
changed the competitive landscape of the regulated industry, informing the current debate on the
consequences of regulating consumer financial products (Campbell et al., 2011; Chatterji and
Seamans, 2012). The Dodd-Frank Wall Street Reform and Consumer Protection Act of 2010
stiffened the regulations of a wide range of consumer products (e.g., mortgages, student loans,
and credit cards). The change in regulatory regime calls for more research to understand the
benefits and costs of regulating consumer products (Posner and Weyl, 2013), taking into account
both the regulations’ intended and unintended effects. In the extant literature, cost-and-benefit
analysis of the CARD Act yielded mixed evidence. On one hand, several studies document its
3 Although some provisions of the Act pertain to over-limit and late fees (see details in Section 2.1 below), the implications of these provisions for issuer competition are not as straightforward as interest rate related provisions. Moreover, Agarwal, Chomsisengphet, Mahoney, and Stroebel (2015) argue that the late and over-limit fees “are nonsalient to consumers and that consumers are only responsive to the interest rate.”

7
intended benefits in terms of fee reductions (Agarwal et al., 2015; Bar-Gill and Bubb, 2012). On
the other hand, a number of recent papers (Debbaut et al., 2016; Han et al., 2018; Jambulapati
and Stavins, 2014; Levitin, 2011; Pinheiro and Ronen, 2016) suggest the Act may have limited
credit supply, in particular to subprime borrowers. We show that weakened competition may add
up to a yet additional cost of the Act, thereby contributing to a more comprehensive assessment
of the legislation.4
We contribute to the industrial organization literature by proposing a new, appealing
measure of competition in the credit card market—the competitive responsiveness—and shed
light on the debate over the level of competition in this market (Ausubel, 1991; Brito and
Hartley, 1995; Calem and Mester, 1995; Grodzicki, 2017). Our innovative use of the data also
adds to the nascent literature that uses mail solicitation data to study various aspects of the credit
card industry. For example, using such data, Grodzicki (2015) represents an early effort of
constructing a structural model to study credit card market dynamics; Han et al. (2018) document
patterns of supply of unsecured credit to bankrupt consumers; Ru and Schoar (2016) study
issuers’ screening of consumer behavioral biases; Firestone (2014) examines potential racial
differentials in the credit card market.
The rest of the paper proceeds as follows. In Section 2, we provide an overview of the
U.S. credit card market and the Credit CARD Act. In Section 3, we describe data and sample
construction in detail. We present primary empirical results and robustness analysis in Section 4,
and analysis on price dispersion and markups in Section 5. We conclude in Section 6.
4 In a recent paper, Nelson (2018) estimates the welfare effects of the CARD Act’s pricing restrictions. He uses a structural model to infer dynamics of credit supply from equilibrium quantity and price data on existing credit card accounts. In contrast, our analysis employs a reduced form framework and measure credit supply using direct mail offers of credit.

8
2. An Overview of the Credit Card Market and the CARD Act
2.1 Landscape of the U.S. Credit Card Market
With a total outstanding balance above one trillion dollars, credit card debt represents one
of the major components of U.S. household liabilities. Unlike other household credit markets
such as mortgages and auto loans, the credit card industry is more concentrated, with a handful
of large issuers (accounting for over 70 percent of total outstanding balances) coexisting with
numerous much smaller issuers.
The industry also features several characteristics unique to the household finance market
that motivate our analysis. First, credit card contracts are notoriously vague and complex
compared with other household debt instruments. A typical credit card contract may include
dozens of terms regarding credit limits, interest rates, fees, penalties, rewards, and their changes,
and many are only presented in fine print. As a result, even financially savvy consumers
frequently have to focus on only the most salient terms, such as interest rates, when choosing a
product. In addition, heightened contractural complexity made borrowers vulnerable to being
exploited by issuers. Second, while the direct cost of opening an account is moderate, because of
the associated costs of searching, previous research has documented that the costs of switching
across issuers are high for borrowers with an open account. Such high switching costs give rise
to considerable market power an issuer has on its current customers but not on uncommitted
consumers. Third, and relatedly, competition on new customer acquisition is intense and direct.
The credit card industry is the only one that relies heavily on direct mail in customer
acquisition.5 Over 90 percent of the credit mail offer data we use are credit card offers.
5 More recently, credit card issuers also increased solicitation volume through email and social media platforms.
9
The unique structure and features of the industry prompted a long stream of research on
the competitiveness of the credit card market. In a seminal paper, Ausubel (1991) documents that
interest rates in this market are high and sticky, suggesting the market is not competitive. In
contrast, Brito and Hartley (1995) and Calem and Mester (1995) argues that competition is not
inconsistent with high and sticky interest rates. More recently, Grodzicki (2015) establishes how
the classical indicia characterizing a failure of competition in credit card lending during the
1980s were largely reversed in the decades that followed. Specifically, since 1990, issuers’
markups decreased substantially, prices have become responsive to underlying costs, and profits
have shrunk, notwithstanding increased market concentration in the same era.
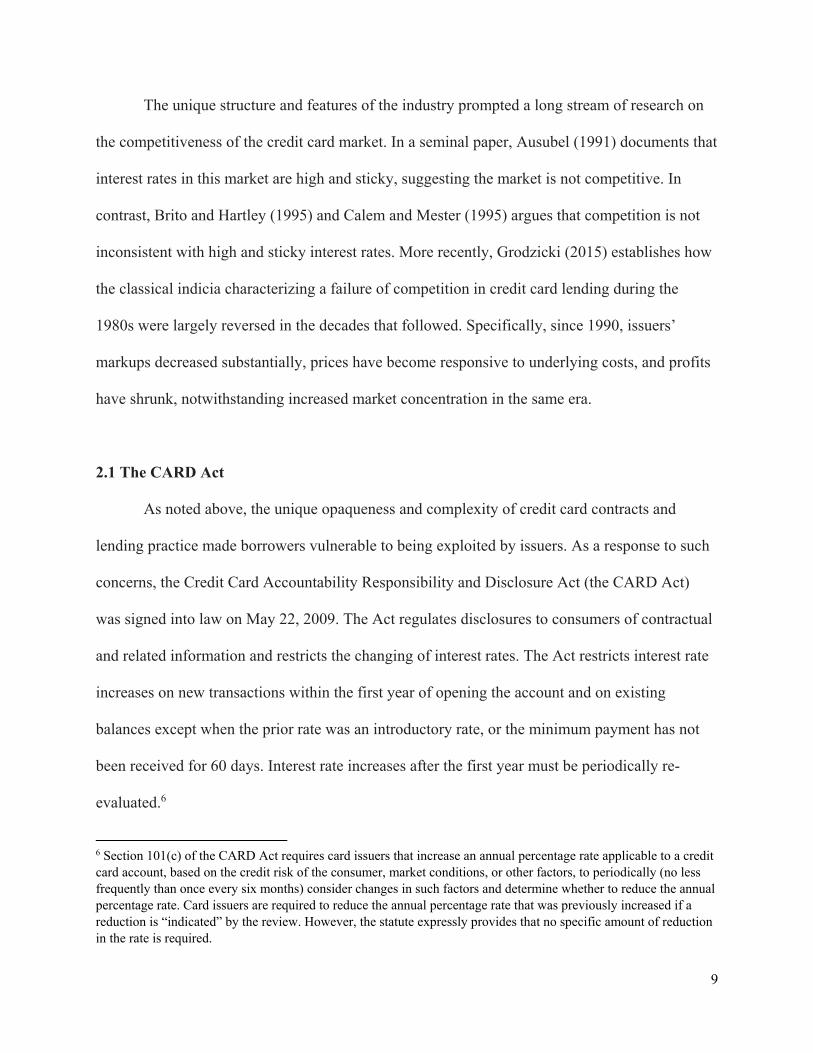
2.1 The CARD Act
As noted above, the unique opaqueness and complexity of credit card contracts and
lending practice made borrowers vulnerable to being exploited by issuers. As a response to such
concerns, the Credit Card Accountability Responsibility and Disclosure Act (the CARD Act)
was signed into law on May 22, 2009. The Act regulates disclosures to consumers of contractual
and related information and restricts the changing of interest rates. The Act restricts interest rate
increases on new transactions within the first year of opening the account and on existing
balances except when the prior rate was an introductory rate, or the minimum payment has not
been received for 60 days. Interest rate increases after the first year must be periodically re-
evaluated.6
6 Section 101(c) of the CARD Act requires card issuers that increase an annual percentage rate applicable to a credit card account, based on the credit risk of the consumer, market conditions, or other factors, to periodically (no less frequently than once every six months) consider changes in such factors and determine whether to reduce the annual percentage rate. Card issuers are required to reduce the annual percentage rate that was previously increased if a reduction is “indicated” by the review. However, the statute expressly provides that no specific amount of reduction in the rate is required.

10
The Act also regulates the charging of credit card fees. A card issuer cannot impose fees
on consumers making a transaction over an account’s credit limit unless the cardholder explicitly
“opts in” for the issuer to charge such a fee. Furthermore, an over-limit fee could be charged
only once when the limit is exceeded, and over-limit fees are capped at the actual over-limit
amount. A card issuer cannot impose a late fee of more than $25 unless one of the previous six
payments was also late, and the late fee cannot be greater than the minimum payment.
The CARD Act prompted an active line of research on its effectiveness and broader
impact on the credit card market. In the theoretical domain, Pinheiro and Ronen (2016) and Tam
(2011) show that the Act’s restrictions reduce consumer welfare by, among other things,
increasing average interest rates, hence resulting in lower levels of households borrowing. The
empirical findings of the Act’s cost-and-benefit analysis are somewhat mixed. On one hand, Bar-
Gill and Bubb (2012), using data ending in 2011, report substantially reduced fees regulated by
the Act with little change in purchase interest rates consistent with issuers having market power
before the Act. More recently, Agarwal et al. (2015) estimate that limits on fees saved consumers
about $12 billion per year by 2011, also without a significant increase in interest rates. On the
other hand, Han et al. (2018) show the CARD Act reduced credit supply to subprime borrowers;
and Nelson (2018) finds that the Act may have exacerbated the adverse retention among existing
account holders, both underscoring the additional social cost of the Act arising from its
unintended consequences.
Our analysis speaks to the intersection of the literature of credit card market
competitiveness and the CARD Act policy evaluation. We present novel evidence on how

11
interest rate competition evolved in the post-Act era, which represents an important factor to
consider in the overall assessment of the Act.
3. Data and Sample Construction
3.1 The Mintel Data
Our main data source is Mintel Comperemedia’s proprietary survey of U.S. consumers.7
Each month, Mintel randomly selects about 4,000 consumers from a pool of one million
consumers that Mintel acquired from a large survey service provider. On average, about 2,500
consumers choose to participate in the Mintel survey in a given month. Each participating
consumer is given a set of envelopes and asked to put the mails from an array of sectors that
Mintel monitors, including credit offers, into the envelopes and send them back to Mintel weekly
during the participating month. If consumers wish to respond to a credit offer, they are instructed
to detach the response portion and forward Mintel the remainder of the offer materials. These
consumers are offered prize raffles as a participating incentive. Our data span 2001 to 2016,
covering the recent credit cycle and the enactment and implement of the CARD Act.
Once receiving envelopes from responding consumers, the Mintel database records
essentially all information on the forwarded credit mail offers. This allows us to study not only
whether a consumer receives any credit offers, but also terms of the contracts offered. For
example, the data include information about the price of credit—the so-called “go-to” interest
rate, which is the regular non-promotional interest rate for purchases. The vast majority of the
mail offers collected in the Mintel survey are personal credit card offers, as the personal credit
7 Mintel is a consumer and marketing research company headquartered in the U.K. The data we use are collected by the company’s American subsidiary, Comperemedia. For more information about the company, see http://www.comperemedia.com.

12
card industry exhibits the greatest reliance on direct mail in customer acquisitions. Among other
types of credit, the Mintel data also include information on small business credit card offers,
which we will exploit as a control group in a spirit similar to Agarwal et al. (2015) and Han et al.
(2018). Since the survey is meant to make the weighted sample totals conform to population
totals, each offer comes with a weight to account for panel stratification. We apply the weights
provided by Mintel for all subsequent summary statistics and county-averages.
In addition to the survey on credit offers, Mintel conducts a separate survey on
participating consumers to collect their demographic and socioeconomic information. This
information is merged with the credit offer data. Moreover, the data include the zip code of the
offer recipients, allowing us to conduct the analysis at fairly granular geographical levels.
3.2 Sample Construction
The treatment group consists of all consumer credit card offers, and the control group
consists of all small business credit card offers. We focus on six largest credit card issuers of the
country—Citibank, Chase, Bank of America, Capital One, Discover, and American Express.
These issuers accounted for about 90% of the personal card offer mail volume in 2016. Ideally,
we want to examine offer terms from the issuers to the same consumer to hold consumer
attributes constant. However, the Mintel survey randomly selects consumers in each month,
precluding the possibility of tracing the same set of consumers over time. We thus construct a
longitudinal sample of major credit card issuers’ mail volume, and average terms (i.e., interest
rates, introductory rates, rewards program, annual fees, late fees and over-limit fees) of credit
card offers extended to consumers in a county on a yearly basis. In order to analyze an issuer’s

13
response to its competitors’ moves, we pair issuer i’s average in county c, year t with the average
of the other five issuers in the same county in year t-1.
Table 1 details our sample selection for both consumer and small business credit cards.
We first restrict our sample to counties where we observed at least one offer from an issuer in a
year for at least ten of the sixteen years in the data. This yields 828,500 offers to 1,149 counties
for consumer cards, and 36,200 offers to 1,013 counties for small business cards. To study the
between-bank competition, we then restrict the sample to the counties where, in a given year, we
observe offers extended by at least two distinct issuers. There are 823,174 consumer credit card
offers extended to consumers in 965 such counties, covering most of the counties in metropolitan
areas. The 823,174 offers represent about 51 billion offers in total to the U.S. population, after
accounting for weights assigned by Mintel to each offer. Small business card offers are sparser;
there are 28,625 small business card offers extended to owners of small businesses in about 300
counties. We use all of these offers in the baseline analysis and assess the sensitivity of our
results to using only counties with both consumer and small business card offers and only
counties with at least three offers in robustness tests. We also check whether the primary results
are robust to constructing the sample with the unit of observations at the issuer-MSA-year and
the issuer-MSA-quarter levels. While the latter allows us to examine the competitive
responsiveness over a shorter window, it is infeasible for the baseline model due to insufficient
number of offers at the county-level for each quarter.
We use an array of location-specific economic indicators as control variables.
Unemployment rates and house price appreciation at the county level are sourced from the
Bureau of Labor Statistics and CoreLogic Real Estate Data, respectively. To measure the average
credit risk of the consumers in a county, we calculate the share of consumers with subprime

14
credit scores using the Federal Reserve Bank of New York Consumer Credit Panel/Equifax (the
Equifax data). We compute both the level of and the annual change in the share of subprime
consumers within a county during our sample period (2001-2016). The demographic and
socioeconomic information of participating consumers in Mintel’s survey for each issuer is also
aggregated each year to the county-level for the consumer and small business card offers
separately (i.e., the share of high school graduates, people with some college education, people
with college degrees, white, homeowners and married people, and average household income).
Since our interest is the response coefficient on changes in offer terms, we take first-differences
for all aggregated demographic and socioeconomic characteristics.
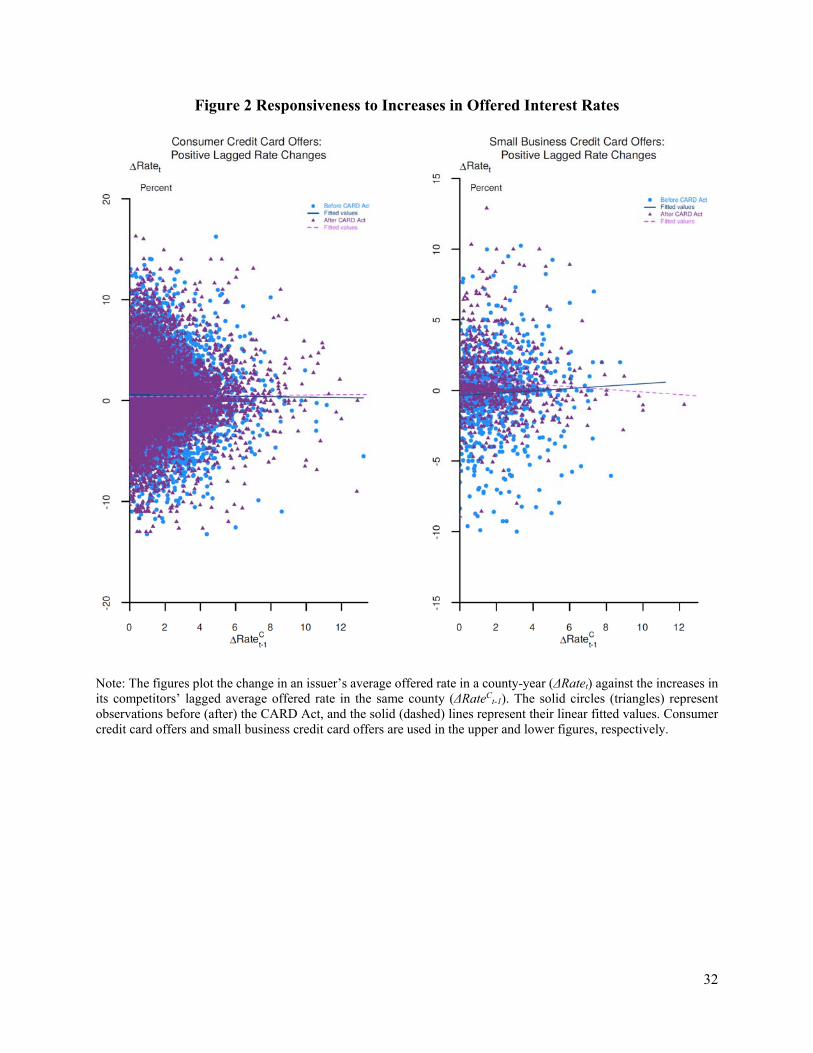
3.3. Descriptive Statistics
We begin by calculating annual changes in the county-level average credit card terms
offered by each issuer. The mean and standard deviation for the level of (change in) each term
are presented in Table 2 Panel A (B). There are 24,565 (1,008) and 18,046 (890) issuer-county-
year observations for consumer (small business) cards before and after the CARD Act. The
relative sizes of consumer and small business card offer samples are largely consistent with those
in Agarwal et al 2015.8 On average, an issuer’s annual interest rates of consumer credit card
offers are 11.495% pre-CARD Act, and 14.852% post-CARD Act. The average annual change in
interest rate is 0.197% pre-CARD Act and 0.443% post-CARD Act. We also break down the
changes into positive and negative rate changes. The standard deviations of the annual changes
in interest rates offered are similar to those of the levels of interest rates offered. A similar
pattern is also observed for small business card offers.
8 The data Agarwal et al use include 150 million consumer credit card accounts and 7 million small business credit card accounts, an about 20-to-1 ratio.

15
We then examine annual changes in demographic and socioeconomic characteristics of
offer recipients in the treatment and control samples to assess to what extent changes in the
underlying characteristics, rather than the implementation of the CARD Act, affect the outcome
of interest. Panel C of Table 2 shows means of changes in these characteristics in the pre- and
post- CARD Act periods in both the treatment and control samples, along with a test of
differences. Except for the average household income in the pre-period, we find no differences
between treatment and control groups in annual changes to demographic and socio economic
factors before and after the CARD Act. We control for changes in these factors in our regression
analysis.
4. Empirical Tests and Results
In this section, we formally test the hypothesis that an issuer’s response to competitors’
changes in offered interest rates declines after the implementation of the CARD Act. Section 4.1
investigates the competitive responsiveness in offered interest rates, and Section 4.2 examines
the responsiveness of an issuer to competitors’ changes in other credit card metrics. We separate
increases and decreases in competitor’s offered interest rates and test the predictions derived
from the main hypothesis in Section 4.3. Section 4.4 shows results from testing dynamic effects
of the Act. Section 4.5 tests whether the decline in the responsiveness of an issuer to
competitors’ decreases in interest rates varies with the share of subprime borrowers in a county.
Section 4.7 checks whether the responsiveness with respect to offer recipients’ credit quality
changes.

16
4.1. The CARD Act and Issuer Competition on Interest Rates
To illustrate our empirical design, we first estimate the following model using consumer
card offers only:
∆ ∆ ∆ ∆
(1)
where ΔRatet, the dependent variable, is the annual change in an issuer’s average interest rate
offered in a county (for notational simplicity, we omit the county index), and ΔRatet-1 is the one-
year lag of ΔRatet. ΔRateCt-1 is the lagged annual change in competitors’ average interest rate
offered in the same county. Using annual changes as opposed to levels of interest rates provides
two advantages. First, changes better capture our underlying construct. Second, the correlation
between interest rate levels of an issuer and those of its competitors in the same county can be
explained by persistent county-level factors (e.g., social capital or the distance to the New York
City) and thus may not capture the competitive responsiveness. The first-differences help us
remove such factors. Post CARD is a dummy variable equal to one for the years after the
implementation of the CARD Act (2010-2016) and zero for the years of 2001-2009. The vector
of control variables, Z, contains county-level economic conditions (i.e., unemployment rate and
house price appreciation), levels of and annual changes in the share of subprime consumers of
the county, the annual changes in demographic and socioeconomic compositions of offer
recipients (i.e., the share of high school graduates, people with some college education, people
with college degrees, white, homeowners and married people, and average household income).
All standard errors are clustered at the county level.
The variable of interest is ΔRateCt-1 × Post CARD, and β3 reveals the differences in the
competitive responsiveness of an issuer to competitors’ changes in interest rates between the pre-

17
and post- CARD Act periods. Our hypothesis that there is a decrease in the equilibrium
responsiveness with respect to competitors’ changes in interest rates of consumer card offers
after the CARD Act predicts a negative β3.
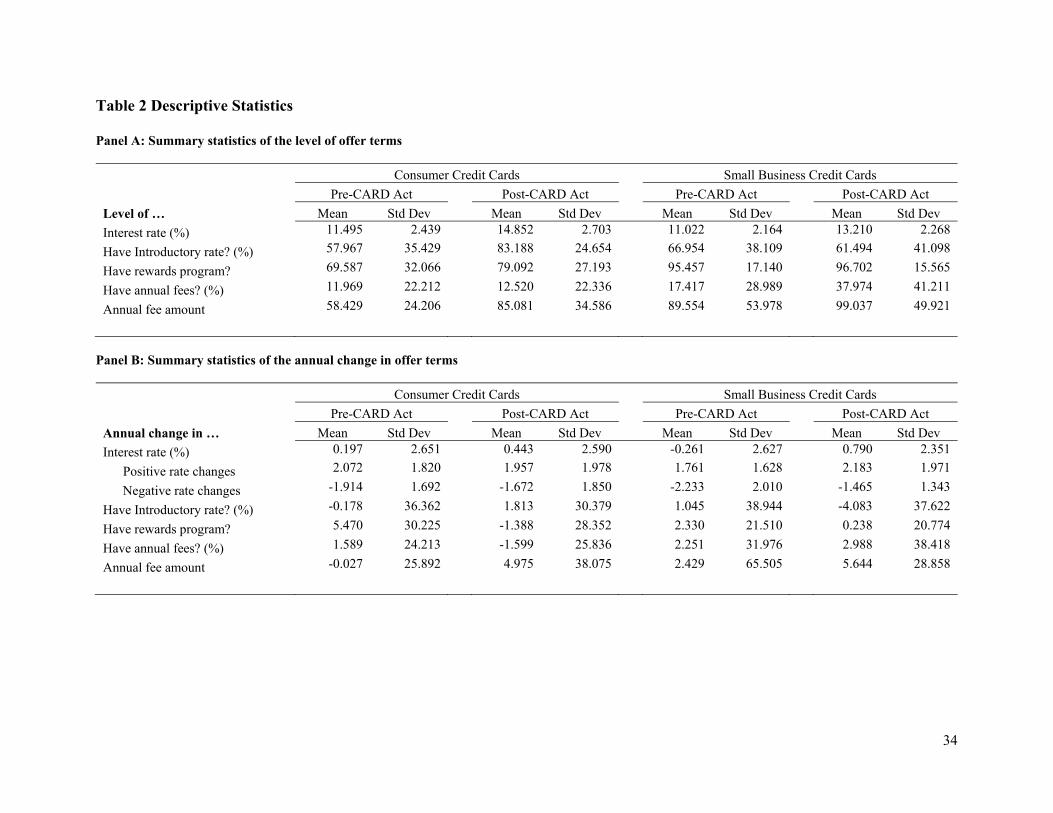
Table 3 Panel A shows coefficients and t-statistics from regression estimation of equation
(1) using consumer card offers only. We add each set of control variables progressively in
columns (1)-(3). ΔRatet-1 loads significantly negatively (two-tailed p-value < 0.01), suggesting a
mean-reverting process in offered interest rates. By contrast, ΔRateCt-1 loads significantly
positively (two-tailed p-value < 0.01), suggesting that before the CARD Act, when competitors
introduced changes to offered interest rates, an issuer followed suit in the same direction. For the
key parameter of interest, we observe a significant negative coefficient, ranging from -0.409 to -
0.412 across the three specifications, on ΔRateCt-1 × Post CARD (two-tailed p-value < 0.01).
Thus, after the adoption of the CARD Act, issuers of consumer cards do not respond as intensely
to competitors’ change in offered interest rates as they did before, consistent with the notion that
the regulation may have hampered competition.
This specification represents a time-series comparison, which may be confounded by
events other than the Act or secular trends that influence issuer competition. We therefore
introduce next our baseline model using both consumer and small business credit card offers,
which takes the form:
∆ ∆ ∆ ∆ ∆
∆
Notations are defined the same as in equation (1). We introduce a new dummy variable
Consumer that is equal to one for consumer credit card observations, and zero for small business
credit card observations. All standard errors are clustered at the county level.

18
This specification represents a difference-in-differences research design that compares
changes in the responsiveness of an issuer around the implementation of the CARD Act for
consumer credit cards, which were subject to the new law, with changes in the responsiveness
for small business credit cards, which the law did not cover. Similar to Agarwal et al. (2015), the
identifying assumption is that, in the absence of the CARD Act, an issuer’s response to
competitors’ changes in interest rates for consumer and small business card offers would have
maintained parallel trends. We provide evidence consistent with this assumption in Section 4.4.
The variable of interest is ΔRateCt-1 × Consumer × Post CARD. Our hypothesis that there is a
decrease in the equilibrium responsiveness with respect to competitors’ changes in interest rates
after the CARD Act for consumer cards predicts a negative γ5.
Table 3 Panel B shows coefficients and t-statistics from pooled regression estimation of
equation (2). We add each set of control variables progressively in columns (1)-(3). ΔRateCt-1 ×
Consumer loads significantly positively (two-tailed p-value < 0.01), suggesting that before the
CARD Act, compared with small business card offers, an issuer adjusts the interest rate of
consumer card offers more in response to competitors’ changes in interest rates. This is
consistent with the literature that the “winner’s curse” concern is more severe in small business
lending markets (Petersen and Rajan 2002). For the key parameter of interest, we observe a
significant negative coefficient (ranging from -0.380 to -0.395 across the three specifications) on
ΔRateCt-1 × Consumer × Post CARD (two-tailed p-value < 0.01). This result suggests that after
the adoption of the CARD Act, issuers of consumer cards do not respond as intensely to
competitors’ change in offered interest rates as they did before, in comparison to small business
card offers, consistent with our hypothesis. Regarding the economic magnitude of coefficients
before the CARD Act, applying the coefficients reported in column (3), for one percent lagged
19
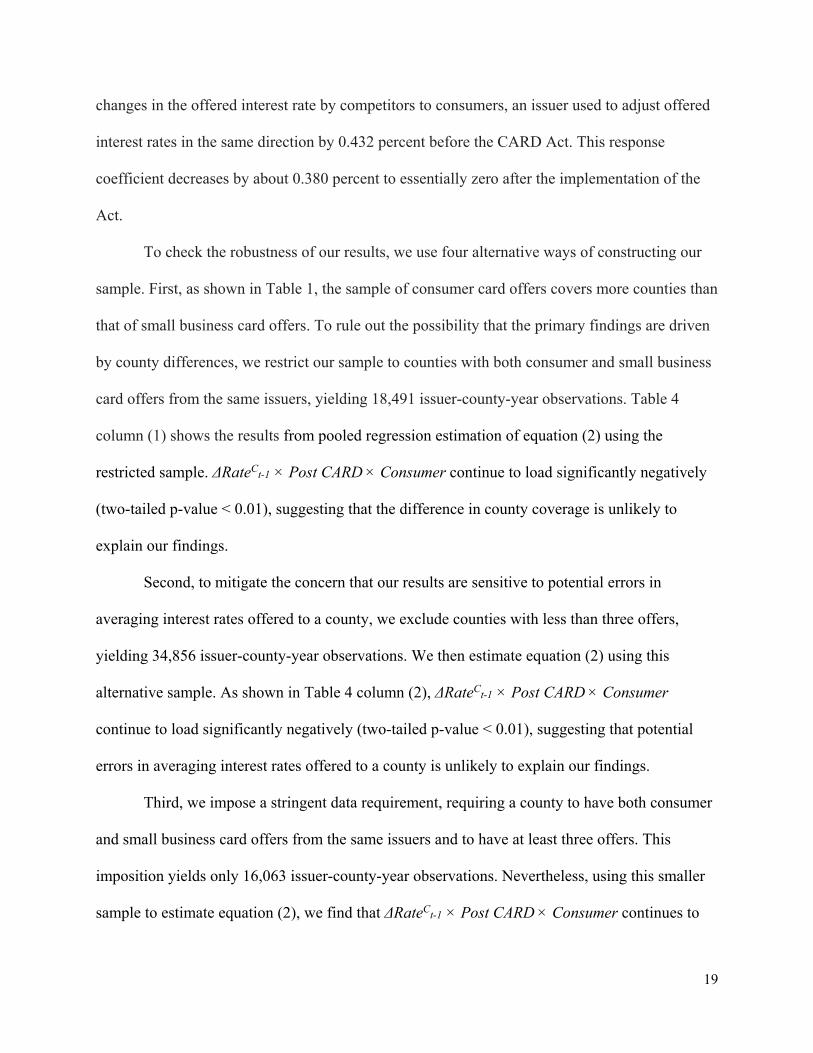
changes in the offered interest rate by competitors to consumers, an issuer used to adjust offered
interest rates in the same direction by 0.432 percent before the CARD Act. This response
coefficient decreases by about 0.380 percent to essentially zero after the implementation of the
Act.
To check the robustness of our results, we use four alternative ways of constructing our
sample. First, as shown in Table 1, the sample of consumer card offers covers more counties than
that of small business card offers. To rule out the possibility that the primary findings are driven
by county differences, we restrict our sample to counties with both consumer and small business
card offers from the same issuers, yielding 18,491 issuer-county-year observations. Table 4
column (1) shows the results from pooled regression estimation of equation (2) using the
restricted sample. ΔRateCt-1 × Post CARD × Consumer continue to load significantly negatively
(two-tailed p-value < 0.01), suggesting that the difference in county coverage is unlikely to
explain our findings.
Second, to mitigate the concern that our results are sensitive to potential errors in
averaging interest rates offered to a county, we exclude counties with less than three offers,
yielding 34,856 issuer-county-year observations. We then estimate equation (2) using this
alternative sample. As shown in Table 4 column (2), ΔRateCt-1 × Post CARD × Consumer
continue to load significantly negatively (two-tailed p-value < 0.01), suggesting that potential
errors in averaging interest rates offered to a county is unlikely to explain our findings.
Third, we impose a stringent data requirement, requiring a county to have both consumer
and small business card offers from the same issuers and to have at least three offers. This
imposition yields only 16,063 issuer-county-year observations. Nevertheless, using this smaller
sample to estimate equation (2), we find that ΔRateCt-1 × Post CARD × Consumer continues to

20
load significantly negatively (two-tailed p-value < 0.01), as shown in Table 4 column (3). This
result suggests that, despite a small sample with low statistical power, the two concerns together
are unlikely to affect our findings.
Fourth, to check the robustness of our results to using county to compute the average
offered rate by an issuer, we conduct our baseline analysis at the MSA level. Our sample has
24,180 issuer-MSA-year observations. As shown in Table 4 column (4), ΔRateCt-1 × Post CARD
× Consumer continues to load significantly negatively (two-tailed p-value < 0.01), suggesting
that measurement errors in delineating appropriate aggregation levels are unlikely to drive our
findings.
Finally, to explore the competitive responsiveness over a shorter window, we aggregate
the rates and recipient characteristics at the issuer-MSA-quarter level, yielding 53,224
observations. It is infeasible to do so for the baseline model due to insufficient number of offers
at the county-level for each quarter. Using this alternative sample, we find that ΔRateCt-1 × Post
CARD × Consumer continues to load significantly negatively (two-tailed p-value < 0.01), as
shown in Table 4 column (5).
Overall, the results are robust to controlling for a battery of variables (e.g., consumer
compositions) and to using alternative samples discussed above. Next, we assess to what extent
our primary finding is attributable to the CARD Act rather than other concurrent events. Five
sets of tests are conducted and discussed in Sections 4.2-4.6.
4.2. The CARD Act and Issuer Competition on Other Offer Terms
The CARD Act restricts issuers’ ability to reprice existing credit card accounts, whereas
the Act is silent or less restrictive on lending and customer acquisition practice such as

21
introductory interest rates, reward programs, and annual fees. Lenders’ competitive
responsiveness on these metrics, therefore, is not expected to decline in the wake of the CARD
Act. We test this prediction by estimating the following model:
∆ ∆ ∆ ∆ ∆ ∆
Where ΔVart equals the annual change in the average of any one of the five metrics—the
presence of introductory rates, the presence of rewards programs, the presence of annual fees,
and the annual fee amount—across all offers extended to a county in a year for consumer and
small business cards separately. All other variables are defined in the same fashion as in equation
(2). As shown in Table 5, ΔVarCt-1 × Post CARD × Consumer does not load for any of these
metrics that are unrelated to issuers’ repricing (two-tailed p-value > 0.1). The results, combined
with those in Table 3, suggest that the decline in issuer competition is concentrated in the interest
rate competition, mitigating the possibility that our findings are driven by omitted economic
trends and events, which tend to influence issuers’ competitive responsiveness in both interest
rates and other lending and customer acquisition practices.
4.3. Responsiveness to Increases and Decreases in Competitors’ Offered Interest rates
We exploit the unique feature of the Act that restricts an increase but not a decrease in the
rate of interest after a card is issued. Consequently, an issuer would be reluctant to follow a
competitor’s decreases in offered interest rates but would not be reluctant to increase offered
interest rates following such a move by its competitors. Indeed, as shown in figures 1 and 2, the
decreases in competitive responsiveness of consumer credit card offers relative to small business
card offers after the CARD Act are much more pronounced for competitors’ reductions of

22
offered interest rates (figure 1) than increases of offered interest rates (figure 2). Accordingly,
we create two indicators to separate increases and decreases in offered interest rates by
competitors, Δ+RateCt-1 (Δ-RateC
t-1), which are equal to the value of ΔRateCt-1 if it is positive
(negative) and zero otherwise. These two indicators are interacted with variables of interest in
equation (2). The regression specification takes the form:
∆ ∆ ∆ ∆ ∆ ∆
∆ ∆ ∆ ∆
As shown in Table 6, the coefficient of Δ+RateC
t-1 × Post CARD × Consumer is not
statistically distinguishable from zero, whereas the coefficient on Δ-RateCt-1 × Post CARD ×
Consumer is significantly negative (-0.672, two-tailed p-value < 0.01). The sharp contrast is in
line with our expectation that an issuer will reduce its responsiveness to competitors’ decrease
but not increase in offered interest rates after the CARD Act. Putting it in perspective, since the
average of Δ-RateCt-1 in the pre-CARD Act period is about -1.9%, our estimate suggests that an
issuer’s offered interest rates to consumers are about 1.3 percentage point higher ( -0.672 × -
1.914%) due to subdued competitive responsiveness in the post-CARD Act period, relative to
rates offered to small business owners.
4.4. Dynamic Effects
To rule out the possibility that our primary results are driven by pre-existing divergent
trends between consumer and small business credit cards, we examine the dynamic effects of the
Act on issuer competition. Five indicators, (Year2007, Year2008, Year2009, Year2010, and Year>2010),
are created to indicate respective year and 2011-2016 for Year>2010. We replace Post CARD
dummy in equation (4) with the five indicators and estimate the following modified regression:
23
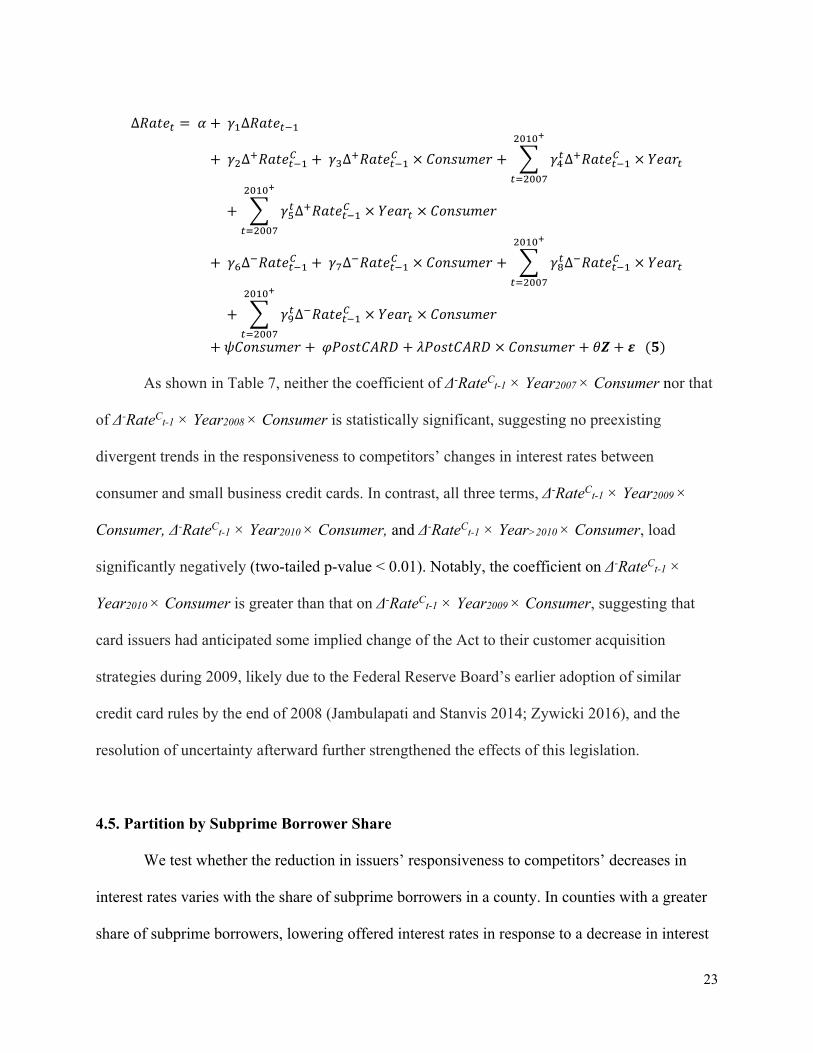
∆ ∆
∆ ∆ ∆
∆
∆ ∆ ∆
∆
As shown in Table 7, neither the coefficient of Δ-RateC
t-1 × Year2007 × Consumer nor that
of Δ-RateCt-1 × Year2008 × Consumer is statistically significant, suggesting no preexisting
divergent trends in the responsiveness to competitors’ changes in interest rates between
consumer and small business credit cards. In contrast, all three terms, Δ-RateCt-1 × Year2009 ×
Consumer, Δ-RateCt-1 × Year2010 × Consumer, and Δ-RateC
t-1 × Year>2010 × Consumer, load
significantly negatively (two-tailed p-value < 0.01). Notably, the coefficient on Δ-RateCt-1 ×
Year2010 × Consumer is greater than that on Δ-RateCt-1 × Year2009 × Consumer, suggesting that
card issuers had anticipated some implied change of the Act to their customer acquisition
strategies during 2009, likely due to the Federal Reserve Board’s earlier adoption of similar
credit card rules by the end of 2008 (Jambulapati and Stanvis 2014; Zywicki 2016), and the
resolution of uncertainty afterward further strengthened the effects of this legislation.
4.5. Partition by Subprime Borrower Share
We test whether the reduction in issuers’ responsiveness to competitors’ decreases in
interest rates varies with the share of subprime borrowers in a county. In counties with a greater
share of subprime borrowers, lowering offered interest rates in response to a decrease in interest

24
rates offered by competitors is more costly after the CARD Act, because issuers need more
repricing discretion for subprime borrowers (Nelson, 2018). As a result, we expect a stronger
reduction in an issuer’s responsiveness with respect to rivals’ decreases in offered interest rates
in counties with a higher share of subprime borrowers.
We use the top and bottom quartiles of the sample based on the share of subprime
borrowers in a county. Equation (4) is estimated for each subsample. As shown in Table 8, the
coefficient on Δ-RateCt-1 × Post CARD × Consumer is greater for counties with a high (above-top
quartile) share of subprime borrowers, in comparison to counties with a low (below-bottom
quartile) share of subprime borrowers. We implement a seemingly unrelated regression and find
that these two coefficients are significantly different at the 10% level, as reported in column 3.
4.6. Responsiveness with Respect to Changes in Recipients’ Credit Quality
Our last robustness analysis relates to an alternative explanation: the shift of consumer
credit card originations towards different client pools after the CARD Act. Specifically, the
overlap in the credit quality of target consumers between an issuer and its competitors may
persist before and decline after the Act. As the offered interest rate is a monotonic function of the
target consumers’ creditworthiness, this decline may explain the subdued responsiveness to
competitors’ change in offered interest rates after the CARD Act. Our control variables that
capture demographic and socioeconomic compositions of offer recipients alleviate this concern
to the extent that those variables already account for changes to offer recipients’ credit quality.
To further rule out this alternative explanation, we examine directly whether the
responsiveness with respect to changes in offer recipients’ credit quality decreases. Mintel
started to collect offer recipients’ VantageScores in 2007. For each issuer in a county-year, we

25
use the share of subprime recipients (with VantageScores < 700) and the average credit scores of
recipients to capture their credit quality for consumer and small business cards separately.9 We
then estimate equation (3), where ΔVart equals the annual change in one of the recipients’ credit
quality variables. As shown in Table 9, ΔVarCt-1 × Post CARD × Consumer does not load for any
of these credit quality measures (two-tailed p-value > 0.1). Thus, the shift of consumer credit
card originations towards different client pools after the CARD Act is unlikely to explain our
findings.
5. CARD Act, Price Dispersion and Markups
In previous subsections, we find a decreased competitive responsiveness concerning a
decrease in offered interest rates. The findings suggest reduced opportunities for consumers to
explore competitive interest rates. Next, we examine the extent to which such weakened
competitive responsiveness led to changes to dispersion in consumer credit card offered interest
rates and markups. If consumer credit card issuers do not follow competitors who offer lower
interest rates, we would expect greater dispersion and markups in consumer card offers to prevail
as competition weakens, in comparison to small business card offers (Gerardi and Shapiro, 2009;
Edmond, Midrigan, and Xu, 2015). We calculate offered rate dispersion as the difference
between the maximal and the minimal offered rates to the same consumer in a year, and average
markups as the mean of interest rates offered to a county by year, minus two-year Treasury yield,
for consumer credit cards and small business cards, respectively. We estimate the following
model
Offered rate dispersion or Markups = δ + γ1Post CARD + γ2Consumer + γ3Post CARD × Consumer + θZ + ε, (6)
9 One caveat is that the credit quality is not a linear function of credit scores.

26
where the dummy variables and interaction terms are defined in the same way as before. The
vector X contains county-level economic conditions, levels of and annual changes in the share of
subprime consumers of the county, and the annual changes in demographic and socioeconomic
compositions of offer recipients, all of which are defined as before.
Table 10 shows coefficients and t-statistics from regression estimation of equation (6).
We find that Post CARD × Consumer loads significantly positively in both columns (two-tailed
p-value < 0.01), suggesting that the price dispersion and average markups in consumer card
offers increase after the Act, in comparison to small business card offers. The coefficient on Post
CARD × Consumer in Column 1 (2) suggests that the Act increases price dispersion (markups)
of consumer card offers by 77.2 (69.5) basis points, in comparison to small business card offers.
The increase of 69.5 basis points is economically meaningful, representing a 9 percent increase
relative to the pre-CARD Act mean level of consumer card offers’ markups. The results indicate
that reduced competition as a result of the Act eventually led to greater price dispersion and
higher prices faced by consumers.
6. Conclusion
In this paper, we examine the effects of new legislation that restricts credit card issuers’
repricing ability (the CARD Act) on competition among issuers. Specifically, we study whether
the restrictions dampen competition among credit card issuers. A new competition measure is
introduced to capture the degree of an issuer’s adjustment in offered interest rates, as a response
to competitors’ changes in offered rates. Using a novel data set on offer terms in mail
solicitations for the entire credit card market, we conduct difference-in-differences analyses that
compare changes in issuers’ responsiveness around the Act for consumer credit cards, which

27
were subject to the new legislation, with changes in issuers’ responsiveness for small business
credit cards, which were not subject to the Act. We find a significant decline in the
responsiveness of an issuer to competitors’ changes in interest rates, but not in other credit card
terms that are unrelated to repricing. Consistent with our prediction, the decline is driven by an
issuer’s responsiveness to competitors’ decreases as opposed to increases in interest rates. The
decline cannot be explained by pre-existing divergent trends and becomes stronger for counties
with more subprime borrowers. The findings are resilient to using four alternative ways of
constructing the sample and accounting for offer recipients’ credit quality. We also show an
increase in price dispersion and markups for issuances after the Act, suggesting adverse effects
on consumers. Together, the results highlight an unintended consequence of the CARD Act (i.e.,
reduced competition among credit card issuers) and contribute toward a more comprehensive and
balanced evaluation of the costs and benefits of the regulation.

28
References Agarwal, S., S. Chomsisengphet, and C. Liu. 2010. The importance of adverse selection in the credit card market: Evidence from randomized trials of credit card solicitations. Journal of Money, Credit and Banking 42, 743-754. Agarwal, S., S. Chomsisengphet, C. Liu, and N. Souleles. 2006. Do consumers choose the right credit contracts? Review of Corporate Finance Studies 4, 239-257. Agarwal, S., S. Chomsisengphet, N. Mahoney, and J. Stroebel. 2015. Regulating consumer financial products: Evidence from credit cards. Quarterly Journal of Economics 130, 111-164. American Bankers Association. 2013. Response to notice and request for information regarding the credit card market. Available at https://www.aba.com/Advocacy/commentletters/Documents/clCardAct2013Feb.pdf Ausubel, L. 1991. The failure of competition in the credit card market. American Economic Review 81, 50-81. Bar-Gill, O., and R. Bubb. 2012. Credit card pricing: The CARD Act and beyond. Cornell Law Review 97, 1-52. Brito, D., and P. Hartley. 1995. Consumer rationality and credit cards. Journal of Political Economy 103, 400-433 Calem, P., and L. Mester. 1995. Consumer behavior and the stickiness of credit-card interest rates. American Economic Review 85, 1327-1336. Calem, P., M. Gordy, and L. Mester. 2006. Switching costs and adverse selection in the market for credit cards: New evidence. Journal of Banking and Finance 30, 1653-1685. Campbell, J., H. Jackson, B. Madrian, and P. Tufano. 2011. Consumer financial protection. Journal of Economic Perspectives 25, 91-114. Chatterji, A., and R. Seamans. 2012. Entrepreneurial finance, credit cards, and race. Journal of Financial Economics 106, 182-195. Debbaut, P., A. Ghent, and M. Kudlyak. 2016. The CARD Act and young borrowers: The effects and the affected. Journal of Money, Credit and Banking 48, 1495-1513. Doyle, M., and C. Snyder. 1999. Information sharing and competition in the motor vehicle industry. Journal of Political Economy 107, 1326-1364. Edelberg, W. 2006. Risk-based pricing of interest rates for consumer loans. Journal of Monetary Economics 53, 2283-2298.
29
Edmond, C., V. Midrigan, and D. Xu. 2015. Competition, markups, and the gains from international trade. American Economic Review 105, 3183-3221. Federal Reserve Board of Governors. 2010. Report to the Congress on the Use of Credit Cards by Small Businesses and the Credit Card Market for Small Businesses. Firestone, S. 2014. Race, Ethnicity, and Credit Card Marketing. Journal of Credit Money and Banking 46, 1205-24. Gabaix, X, and D. Laibson. 2006. Shrounded attributes, consumer myopia, and information suppression in competitive markets. Quarterly Journal of Economics 121, 505-540. Gerardi, K., and A. Shapiro. 2009. Does competition reduce price dispersion? New Evidence from the airline industry. Journal of Political Economy 117, 1-36. Grodzicki, D. 2015. Competition and customer acquisition in the U.S. credit card market. Working Paper, Pennsylvania State University. Grodzicki, D. 2017. The evolution of competition in the credit card market. Working Paper, Pennsylvania State University. Gross, D., and N. Souleles. 2002. Do liquidity constraints and interest rates matter for consumer behavior? Evidence from credit card data. Quarterly Journal of Economics 117, 149-185. Han, S., B. Keys, and G. Li. 2018. Unsecured credit supply, credit cycles, and regulation. Review of Financial Studies 31, 1184-217. Jambulapati, V., and J. Stavins. 2014. Credit CARD Act of 2009: What did banks do? Journal of Banking and Finance 46, 21-30. Joskow, Paul L., and Nancy L. Rose. 1989. “The Effects of Economic Regulation,” in Handbook of Industrial Organization, vol. 2, edited by Richard L. Schmalensee and Robert Willig, 1449-506. Amsterdam: North- Holland. Kerr, S., and L. Dunn. 2008. Consumer search behavior in the changing credit card market. Journal of Business & Economic Statistics 26, 345-453. Knittel, C., and V. Stango. 2003. Price ceilings and focal points for tacit collusion: Evidence from credit cards. American Economic Review 93, 1703-1729. Kuchler, T. 2017. Sticking to your plan: Empirical evidence on the role of present bias for credit card debt paydown. Working paper, New York University. Levitin, A. 2011. Rate-jacking: Risk-based & opportunistic pricing in credit cards. Utah Law Review 2, 339-367

30
Li, L. 1985. Cournot oligololy with information sharing. Rand Journal of Economics 16, 521-536. Mester, L. 1994. Why are credit card rates sticky? Economic Theory 4, 505-530. Nelson, S. 2018. Private information and price regulation in the US credit card market. Working Paper, MIT. Petersen, M., and R. Rajan. 2002. Does distance still matter? The information revolution in small business lending. Journal of Finance 57, 2533-2570. Pinheiro, T., and J. Ronen. 2016. Unintended consequences of the credit card Act. Journal of Law, Finance and Accounting 1, 93-138. Posner, E., and G. Weyl. 2013. Benefit-cost analysis for financial regulation. American Economic Review 103, 393-397. Ru, H., and A. Schoar. 2016. Do Credit Card Companies Screen for Behavioral Biases. Working paper, MIT. Stango, V. 2000. Competition and pricing in the credit card market. Review of Economics and Statistics 82, 499-508. Stango, V. 2002. Pricing with consumer switching costs: Evidence from the credit card market. Journal of Industrial Economics 50, 475-492. Stango, V. 2003. Strategic responses to regulatory threat in the credit card market. Journal of Law and Economics 46, 427-452. Stango, V., and J. Zinman. 2016. Borrowing high versus borrowing higher: Price dispersion and shopping behavior in the U.S. credit card market. Review of Financial Studies 29, 979-1006. Zywicki, T. 2016. No, the credit Card Act is not a free lunch. The Washington Post, January 13.

31
Figure 1 Responsiveness to Decreases in Offered Interest Rates
Note: The figures plot the change in an issuer’s average offered rate in a county-year (ΔRatet) against the decreases in its competitors’ lagged average offered rate in the same county (ΔRateC
t-1). The solid circles (triangles) represent observations before (after) the CARD Act, and the solid (dashed) lines represent their linear fitted values. Consumer credit card offers and small business credit card offers are used in the upper and lower figures, respectively.
32
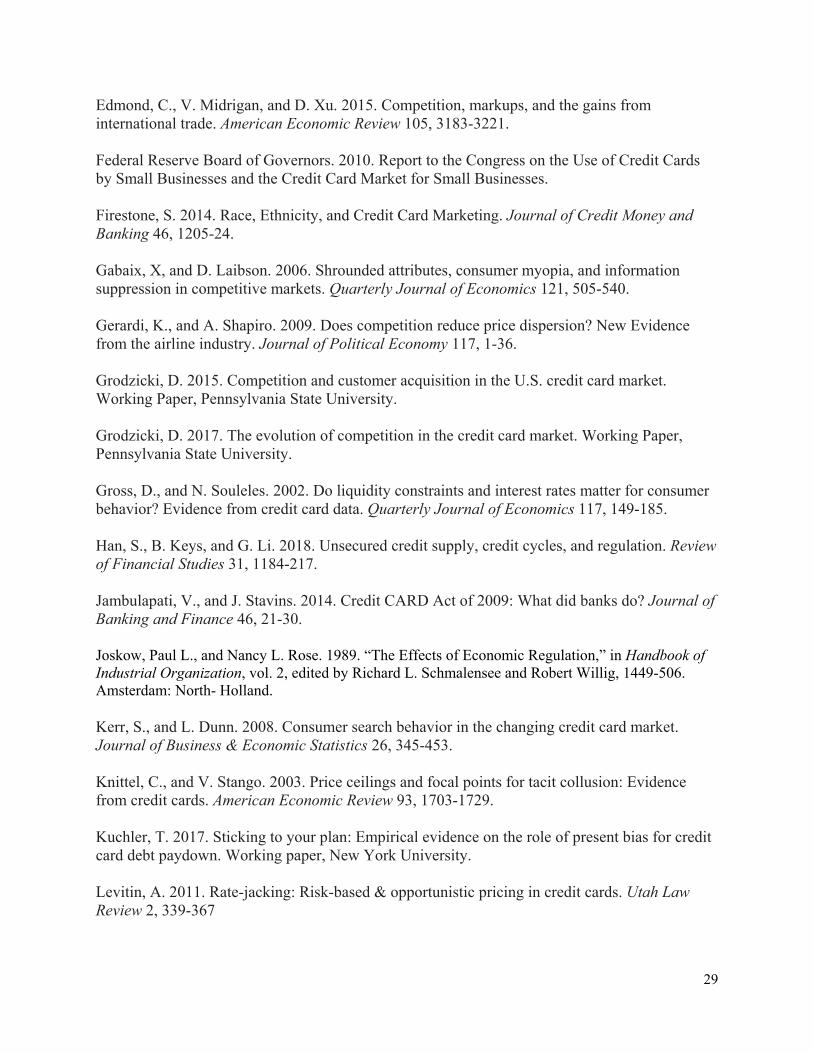
Figure 2 Responsiveness to Increases in Offered Interest Rates
Note: The figures plot the change in an issuer’s average offered rate in a county-year (ΔRatet) against the increases in its competitors’ lagged average offered rate in the same county (ΔRateC
t-1). The solid circles (triangles) represent observations before (after) the CARD Act, and the solid (dashed) lines represent their linear fitted values. Consumer credit card offers and small business credit card offers are used in the upper and lower figures, respectively.

33
Table 1 Sample Selection
Consumer Credit Card Small Business Credit Card Counties receiving offers in # of years ≥ 10 Number of offers 828,500 36,200
Number of counties 1,149 1,013
Counties receiving offers from # of issuers ≥ 2 Number of offers 823,174 28,625
Number of counties 965 317
Note: The table presents the numbers of offers and counties and key sample selection criteria. We focus on the six largest credit card issuers (American Express, Bank of America, Capital One, Chase, and Citigroup) and the counties where we observe credit card offers in at least ten out of the sixteen years between 2001 and 2016. We further restrict the sample to the counties where offers extended by more than one issuer were observed in at least one of these years. Source: Mintel Comperemedia, Mintel Credit Cards and Mortgage & Loan Databases.
34
Table 2 Descriptive Statistics Panel A: Summary statistics of the level of offer terms
Consumer Credit Cards Small Business Credit Cards
Pre-CARD Act Post-CARD Act Pre-CARD Act Post-CARD Act
Level of … Mean Std Dev Mean Std Dev Mean Std Dev Mean Std Dev
Interest rate (%) 11.495 2.439 14.852 2.703 11.022 2.164 13.210 2.268
Have Introductory rate? (%) 57.967 35.429 83.188 24.654 66.954 38.109 61.494 41.098
Have rewards program? 69.587 32.066 79.092 27.193 95.457 17.140 96.702 15.565
Have annual fees? (%) 11.969 22.212 12.520 22.336 17.417 28.989 37.974 41.211
Annual fee amount 58.429 24.206 85.081 34.586 89.554 53.978 99.037 49.921
Panel B: Summary statistics of the annual change in offer terms
Consumer Credit Cards Small Business Credit Cards
Pre-CARD Act Post-CARD Act Pre-CARD Act Post-CARD Act
Annual change in … Mean Std Dev Mean Std Dev Mean Std Dev Mean Std Dev
Interest rate (%) 0.197 2.651 0.443 2.590 -0.261 2.627 0.790 2.351
Positive rate changes 2.072 1.820 1.957 1.978 1.761 1.628 2.183 1.971
Negative rate changes -1.914 1.692 -1.672 1.850 -2.233 2.010 -1.465 1.343
Have Introductory rate? (%) -0.178 36.362 1.813 30.379 1.045 38.944 -4.083 37.622
Have rewards program? 5.470 30.225 -1.388 28.352 2.330 21.510 0.238 20.774
Have annual fees? (%) 1.589 24.213 -1.599 25.836 2.251 31.976 2.988 38.418
Annual fee amount -0.027 25.892 4.975 38.075 2.429 65.505 5.644 28.858

35
Panel C: Differences in annual changes in demographic and socioeconomic characteristics of consumer and small business credit card offer recipients
Pre-CARD Act Post-CARD Act
Annual Changes in … Consumer
Credit Card Small Business
Credit Card Diff P-value Consumer
Credit Card Small Business
Credit Card Diff P-value Share of high school graduates (%) -0.56 -1.70 1.14 39% -1.00 -1.20 0.19 88%
Share of people with some college education (%) -0.03 -1.00 0.97 44% -0.66 0.81 -1.46 22%
Share of people with college degrees (%) 0.54 1.33 -0.79 52% -2.38 -1.19 -1.19 32%
Share of white (%) -0.25 0.88 -1.12 22% -4.53 -3.46 -1.07 37%
Share of homeowners (%) 0.81 1.63 -0.82 40% -1.16 0.02 -1.18 19%
Share of married people (%) -0.07 2.40 -2.47 11% -3.60 -2.45 -1.15 45%
Household income ($) 952 3680 -2728 6% -990 -2009 1019 50%
Note: Panel A of the table presents summary statistics of the level of interest rates, mail volume, and other terms for consumer and small business credit cards offered in the same county. Panel B of the table presents summary statistics of the annual change in interest rates, mail volume, and other terms for consumer and small business credit cards offered in the same county. The statistics are estimated for the periods before and after the implementation of the CARD Act, respectively. Panel C presents summary statistics of the annual change in average demographic and socioeconomic characteristics of consumer and corporate credit card offer recipients, respectively, and the differences between the two. These statistics indicate that the annual change in offer recipients’ demographic and socioeconomic compositions do not show any statistically significant differences between consumer and small business card offers, either before or after the implementation of the CARD Act. Source: Mintel Comperemedia, Mintel Credit Cards and Mortgage & Loan Databases.
36
Table 3 The CARD Act and Issuer Competition on Interest Rates Panel A: Differences in competition using consumer credit card offers only
ΔRatet
(1) (2) (3) coef se coef se coef se ΔRatet-1 -0.372*** 0.006 -0.371*** 0.006 -0.367*** 0.006 ΔRateC
t-1 0.406*** 0.012 0.406*** 0.012 0.406*** 0.012 ΔRateC
t-1 × Post CARD -0.412*** 0.018 -0.411*** 0.018 -0.409*** 0.017 Controlling for
Post CARD Yes Yes Yes Local economic conditions Yes Yes Yes
Local subprime consumer share levels and changes No Yes Yes Offer recipients’ demographic and socioeconomic changes No No Yes
R-squared 0.138 0.142 0.153 Number of observations 42,611 42,611 42,591
Panel B: Difference in differences using small business credit card offers as the control group
ΔRatet
(1) (2) (3) coef se coef se coef se ΔRatet-1 -0.374*** 0.006 -0.373*** 0.006 -0.369*** 0.006 ΔRateC
t-1 -0.041 0.036 -0.030 0.036 -0.026 0.036 ΔRateC
t-1× Consumer 0.447*** 0.038 0.437*** 0.038 0.432*** 0.038 ΔRateC
t-1× Post CARD -0.018 0.046 -0.025 0.046 -0.030 0.046 ΔRateC
t-1× Post CARD × Consumer -0.395*** 0.049 -0.386*** 0.048 -0.380*** 0.048 Controlling for
Post CARD Yes Yes Yes Consumer Yes Yes Yes
Post CARD× Consumer Yes Yes Yes Local economic conditions Yes Yes Yes
Local subprime consumer share levels and changes No Yes Yes Offer recipients’ demographic and socioeconomic changes No No Yes
R-squared 0.141 0.145 0.155 Number of observations 44,509 44,509 44,487

37
Note: Panel A of the table presents differences using consumer credit card offers only, before and after the implementation of the CARD Act in how an issuer’s average interest rate offered in a county changes (ΔRatet), as a response to the lagged changes in the average interest rates offered by its competitors in the same county ΔRateC
t-1. Post CARD is equal to one for years of 2010-2016, and zero for years of 2001-2009. The variable of interest is ΔRateCt-1 × Post CARD and we
control for the issuer’s own lagged changes in the average interest rates offered in that county ΔRatet-1. In column (1), we control for county-level economic conditions (i.e., unemployment rate and house price appreciation). In column (2), we add levels of and annual changes in the share of subprime consumers of the county. In column (3) we further add annual changes in demographic and socioeconomic compositions of offer recipients (i.e., the share of high school graduates, people with some college education, people with college degrees, white, homeowners and married people, and average household income). Panel B presents the difference-in-differences analysis by contrasting changes in county-level average interest rates (ΔRatet) in response to lagged changes in competitors’ county-level average interest rates ΔRateC
t-1 between consumer and small business credit card offers. Consumer is equal to one for consumer credit card offers, and zero for small business credit card offers. The variable of interest is ΔRateC
t-1 × Post CARD × Consumer. We control for the issuer’s own lagged changes in the average interest rates offered in that county ΔRatet-1. In column (1), we control for county-level economic conditions (i.e., unemployment rate and house price appreciation). In column (2), we add levels of and annual changes in the share of subprime consumers of the county. In column (3) we further add annual changes in demographic and socioeconomic compositions of offer recipients (i.e., the share of high school graduates, people with some college education, people with college degrees, white, homeowners and married people, and average household income). Standard errors are clustered by county. *, (**), and [***] denote two-tailed statistical significance at 10%, (5%), and [1%] levels, respectively.

38
Table 4 Robustness Analyses ΔRatet
Counties with both consumer
and small business card
offers
Counties with ≥ 3 offers
Both (1) and (2) Issuer-MSA-year
level analysis Issuer-MSA-quarter
level analysis
(1) (2) (3) (4) (5) coef se coef se coef se coef se coef se
ΔRatet-1 -0.348*** 0.010 -0.355*** 0.006 -0.332*** 0.010 -0.363*** 0.008 -0.442*** 0.005
ΔRateCt-1 -0.011 0.036 -0.004 0.051 0.022 0.051 0.096*** 0.034 0.014 0.027
ΔRateCt-1× Consumer 0.418*** 0.040 0.460*** 0.053 0.419*** 0.056 0.362*** 0.038 0.084*** 0.029
ΔRateCt-1× Post CARD -0.043 0.046 -0.084 0.071 -0.106 0.071 -0.168*** 0.047 0.004 0.033
ΔRateCt-1× Post CARD × Consumer -0.372*** 0.052 -0.381*** 0.074 -0.343*** 0.078 -0.290*** 0.051 -0.090** 0.036
Controlling for
Post CARD Yes Yes Yes Yes Yes
Consumer Yes Yes Yes Yes Yes
Post CARD× Consumer Yes Yes Yes Yes Yes
Local economic conditions Yes Yes Yes Yes Yes
Local subprime consumer share levels and changes Yes Yes Yes Yes Yes
Offer recipients’ demographic and socioeconomic changes Yes Yes Yes Yes Yes
R-squared 0.150 0.168 0.153 0.157 0.208
Number of observations 18,491 34,856 16,063 24,180 53,224 Note: The table presents robustness tests of the difference-in-differences analysis by contrasting changes in area (county- or MSA-level) average interest rates (ΔRatet) in response to lagged changes in competitors’ area (county- or MSA-level) average interest rates (ΔRateC
t-1) between consumer and small business credit card offers. Consumer is equal to one for consumer credit card offers, and zero for small business credit card offers. The variable of interest is ΔRateC
t-1 × Post CARD × Consumer. We control for the issuer’s own lagged changes in the average interest rates offered in that area (ΔRatet-1). We control for economic conditions (i.e., unemployment rate and house price appreciation), levels of and annual changes in the share of subprime consumers of the area, the annual changes in demographic and socioeconomic compositions of offer recipients (i.e., the share of high school graduates, people with some college education, people with college degrees, white, homeowners and married people, and average household income). In column (1), we use a subset of counties where residents received both consumer and small business credit card offers extended by the same issuers. In column (2), we use a subset of counties where residents received at least three offers. In column (3), we use a subset of counties where residents received at least three offers, and the offers consist of both consumer and small business credit card offers extended by the same issuers. In column (4), we conduct the analysis using observations at the issuer-MSA-year level (as opposed to the issuer-county-year level). In column (5), we conduct the analysis using observations at the issuer-MSA-quarter level Standard errors are clustered by county for columns (1)-(3) and by MSA for columns (4)-(5). *, (**), and [***] denote two-tailed statistical significance at 10%, (5%), and [1%] levels, respectively.

39
Table 5 The CARD Act and Issuer Competition on Other Offer Terms
ΔVart =
ΔHave Intro ΔVart = ΔHave Rewards ΔHave Annual Fee ΔAnnual Fee
coef se coef se coef se coef se
ΔVart-1 -0.401*** 0.004 -0.437*** 0.005 -0.442*** 0.006 -0.465*** 0.023
ΔVarCt-1 -0.018 0.033 -0.031 0.043 -0.048 0.036 0.001 0.045
ΔVarCt-1 × Consumer 0.091*** 0.035 -0.016 0.045 0.023 0.038 0.020 0.053
ΔVarCt-1 × Post CARD 0.003 0.040 0.008 0.046 0.034 0.045 0.023 0.046
ΔVarCt-1 × Consumer × Post CARD -0.033 0.043 0.045 0.048 0.005 0.047 -0.023 0.054
Controlling for Post CARD Yes Yes Yes Yes
Consumer Yes Yes Yes Yes
Post CARD × Consumer Yes Yes Yes Yes
Local economic conditions Yes Yes Yes Yes
Local subprime consumer share levels and changes Yes Yes Yes Yes
Offer recipients’ demographic and socioeconomic changes Yes Yes Yes Yes
R-squared 0.177 0.222 0.197 0.228
Number of observations 45,267 45,096 45,267 8,771
Note: The table presents the difference-in-differences analysis of the responsiveness with respect to changes in offer terms other than interest rates (i.e., the presence of introductory interest rates (ΔHave Intro), the presence of reward programs (ΔHave Rewards), the presence of annual fees (ΔHave Annual Fee), and the amount of annual fees (ΔAnnual Fee)), using small business credit card offers as the control group. Post CARD is equal to one for years of 2010-2016 and zero for years of 2001-2009. Consumer is equal to one for consumer credit card offers, and zero for small business credit card offers. The variable of interest is ΔVarC
t-1 × Post CARD × Consumer. We control for the issuer’s own lagged changes in the respective term offered in that county ΔVart-1. We control for county-level economic conditions (i.e., unemployment rate and house price appreciation), levels of and annual changes in the share of subprime consumers of the county, the annual changes in demographic and socioeconomic compositions of offer recipients (i.e., the share of high school graduates, people with some college education, people with college degrees, white, homeowners and married people, and average household income). Standard errors are clustered by county. *, (**), and [***] denote two-tailed statistical significance at 10%, (5%), and [1%] levels, respectively.

40
Table 6 Responsiveness to Increases and Decreases in Competitors’ Offered Interest Rates
ΔRatet coef se
ΔRatet-1 -0.371*** 0.006
Δ+RateCt-1 0.052 0.086
Δ+RateCt-1 × Consumer 0.148* 0.088
Δ+RateCt-1 × Post CARD -0.104 0.096
Δ+RateCt-1 × Post CARD × Consumer -0.066 0.100
Δ-RateCt-1 -0.098 0.062
Δ-RateCt-1 × Consumer 0.668*** 0.066
Δ-RateCt-1 × Post CARD 0.037 0.080
Δ-RateCt-1 × Post CARD × Consumer -0.672*** 0.088
Controlling for
Post CARD Yes
Consumer Yes
Post CARD × Consumer Yes
Local economic conditions Yes
Local subprime consumer share levels and changes Yes
Offer recipients’ demographic and socioeconomic changes Yes
R-squared 0.158 Number of observations 44,487
Note: The table presents the difference-in-differences analysis of the changes in county-level average interest rates (ΔRatet) in response to lagged changes in competitors’ average interest rates (ΔRateC
t-1) between consumer and small business credit card offers. Post CARD is equal to one for years of 2010-2016 and zero for years of 2001-2009. Consumer is equal to one for consumer credit card offers, and zero for small business credit card offers. The analysis separates competitors’ positive and negative lagged changes in county-level average interest rates. The variable of interest is Δ+RateC
t-1 × Post CARD × Consumer and Δ-RateCt-1 × Post CARD × Consumer. We control for the issuer’s
own lagged changes in the average interest rates offered in that county (ΔRatet-1). We control for county-level economic conditions (i.e., unemployment rate and house price appreciation), levels of and annual changes in the share of subprime consumers of the county, the annual changes in demographic and socioeconomic compositions of offer recipients (i.e., the share of high school graduates, people with some college education, people with college degrees, white, homeowners and married people, and average household income). Standard errors are clustered by county. *, (**), and [***] denote two-tailed statistical significance at 10%, (5%), and [1%] levels, respectively.
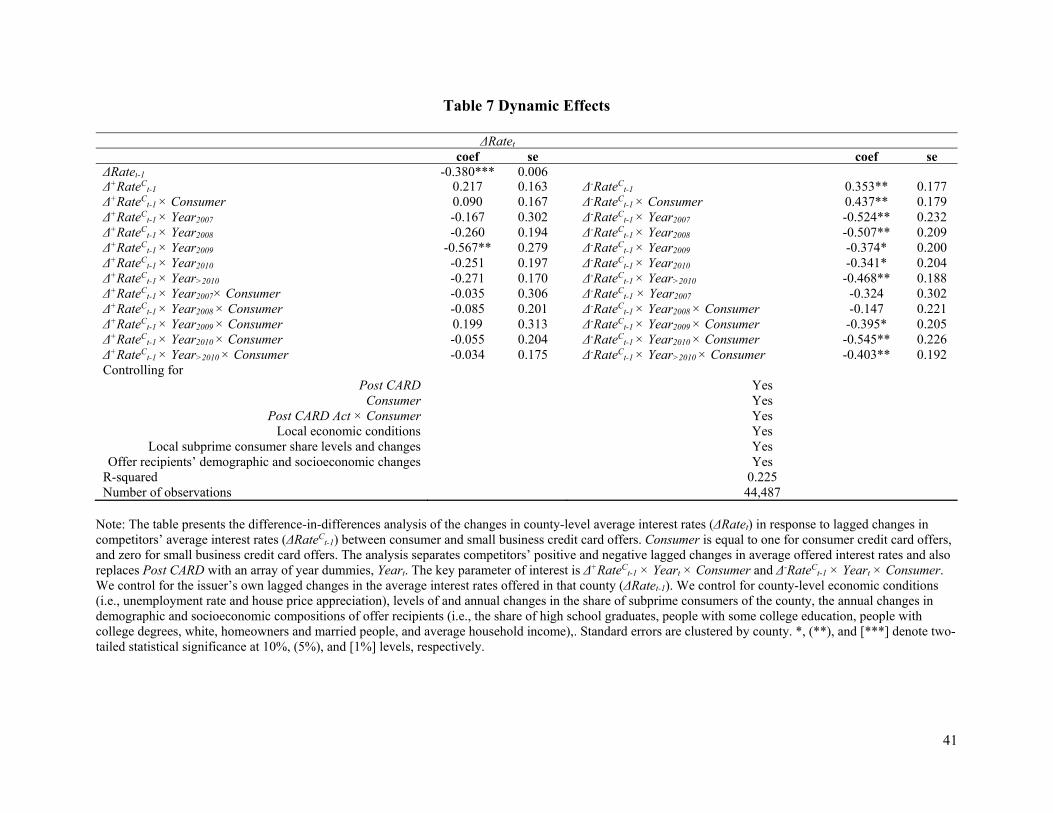
41
Table 7 Dynamic Effects
ΔRatet coef se coef se
ΔRatet-1 -0.380*** 0.006
Δ+RateCt-1 0.217 0.163 Δ-RateC
t-1 0.353** 0.177 Δ+RateC
t-1 × Consumer 0.090 0.167 Δ-RateCt-1 × Consumer 0.437** 0.179
Δ+RateCt-1 × Year2007 -0.167 0.302 Δ-RateC
t-1 × Year2007 -0.524** 0.232 Δ+RateC
t-1 × Year2008 -0.260 0.194 Δ-RateCt-1 × Year2008 -0.507** 0.209
Δ+RateCt-1 × Year2009 -0.567** 0.279 Δ-RateC
t-1 × Year2009 -0.374* 0.200 Δ+RateC
t-1 × Year2010 -0.251 0.197 Δ-RateCt-1 × Year2010 -0.341* 0.204
Δ+RateCt-1 × Year>2010 -0.271 0.170 Δ-RateC
t-1 × Year>2010 -0.468** 0.188 Δ+RateC
t-1 × Year2007× Consumer -0.035 0.306 Δ-RateCt-1 × Year2007 -0.324 0.302
Δ+RateCt-1 × Year2008 × Consumer -0.085 0.201 Δ-RateC
t-1 × Year2008 × Consumer -0.147 0.221 Δ+RateC
t-1 × Year2009 × Consumer 0.199 0.313 Δ-RateCt-1 × Year2009 × Consumer -0.395* 0.205
Δ+RateCt-1 × Year2010 × Consumer -0.055 0.204 Δ-RateC
t-1 × Year2010 × Consumer -0.545** 0.226 Δ+RateC
t-1 × Year>2010 × Consumer -0.034 0.175 Δ-RateCt-1 × Year>2010 × Consumer -0.403** 0.192
Controlling for
Post CARD Yes Consumer Yes
Post CARD Act × Consumer Yes Local economic conditions Yes
Local subprime consumer share levels and changes Yes Offer recipients’ demographic and socioeconomic changes Yes
R-squared 0.225 Number of observations 44,487
Note: The table presents the difference-in-differences analysis of the changes in county-level average interest rates (ΔRatet) in response to lagged changes in competitors’ average interest rates (ΔRateC
t-1) between consumer and small business credit card offers. Consumer is equal to one for consumer credit card offers, and zero for small business credit card offers. The analysis separates competitors’ positive and negative lagged changes in average offered interest rates and also replaces Post CARD with an array of year dummies, Yeart. The key parameter of interest is Δ+RateC
t-1 × Yeart × Consumer and Δ-RateCt-1 × Yeart × Consumer.
We control for the issuer’s own lagged changes in the average interest rates offered in that county (ΔRatet-1). We control for county-level economic conditions (i.e., unemployment rate and house price appreciation), levels of and annual changes in the share of subprime consumers of the county, the annual changes in demographic and socioeconomic compositions of offer recipients (i.e., the share of high school graduates, people with some college education, people with college degrees, white, homeowners and married people, and average household income),. Standard errors are clustered by county. *, (**), and [***] denote two-tailed statistical significance at 10%, (5%), and [1%] levels, respectively.

42
Table 8 Partition by Subprime Borrower Share (top vs. bottom quartiles)
ΔRatet Low Subprime sshaShare High Subprime p-value (1) (2) (3) coef se coef se (1) = (2) ΔRatet-1 -0.372*** 0.009 -0.374*** 0.00 0.879 Δ+RateC
t-1 0.144 0.112 -0.188 0.15 0.181 Δ+RateC
t-1 × Consumer 0.042 0.118 0.379** 0.15 0.186 Δ+RateC
t-1 × Post CARD -0.192 0.153 0.105 0.19 0.292 Δ+RateC
t-1 × Post CARD × Consumer 0.051 0.161 -0.330 0.20 0.196 Δ-RateC
t-1 -0.100 0.102 -0.089 0.13 0.946 Δ-RateC
t-1 × Consumer 0.709*** 0.106 0.651*** 0.13 0.742 Δ-RateC
t-1 × Post CARD -0.068 0.161 0.328 0.21 0.061* Δ-RateC
t-1 × Post CARD × Consumer -0.583*** 0.171 -0.971*** 0.22 0.095* Controlling for
Post CARD Yes Yes Consumer Yes Yes
Post CARD× Consumer Yes Yes Local economic conditions Yes Yes
Local subprime consumer share changes Yes Yes Offer recipients’ demographic and socioeconomic changes Yes Yes
R-squared 0.155 0.157 Number of observations 11,211 11,212
Note: The table presents the difference-in-differences analysis of the changes in county-level average interest rates (ΔRatet) in response to lagged changes in competitors’ average interest rates (ΔRateC
t-1) between consumer and small business credit card offers, by the share of subprime borrowers in a county. High (low) means above (below) the sample median. Post CARD is equal to one for years of 2010-2016, and zero for years of 2001-2009. Consumer is equal to one for consumer credit card offers, and zero for small business credit card offers. The analysis separates competitors’ positive and negative lagged changes in county-level average interest rates. The variable of interest is Δ+RateC
t-1 × Post CARD × Consumer and Δ-RateCt-1 × Post CARD × Consumer. We control for the issuer’s
own lagged changes in the average interest rates offered in that county (ΔRatet-1). We control for county-level economic conditions (i.e., unemployment rate and house price appreciation), levels of and annual changes in the share of subprime consumers of the county, the annual changes in demographic and socioeconomic compositions of offer recipients (i.e., the share of high school graduates, people with some college education, people with college degrees, white, homeowners and married people, and average household income). Column 3 presents the p-values of tests of equality of columns 1 and 2 coefficients using seemingly unrelated regressions. Standard errors are clustered by county. *, (**), and [***] denote two-tailed statistical significance at 10%, (5%), and [1%] levels, respectively.

43
Table 9 Responsiveness with Respect to Changes in Offer Recipients’ Credit Quality
ΔVart =
ΔSubprime Recipient Share ΔAve. Recipient Score coef se coef se ΔVart-1 -0.429*** 0.009 -0.405*** 0.007 ΔVarC
t-1 0.004 0.058 0.015 0.055 ΔVarC
t-1× Consumer 0.016 0.067 -0.033 0.064 ΔVarC
t-1× Post CARD 0.030 0.064 -0.022 0.060 ΔVarC
t-1× Post CARD × Consumer -0.025 0.073 0.071 0.070 Controlling for
Post CARD Yes Yes Consumer Yes Yes
Post CARD× Consumer Yes Yes Local economic conditions Yes Yes
Local subprime consumer share levels and changes Yes Yes Offer recipients’ demographic and socioeconomic changes Yes Yes R-squared 0.221 0.281 Number of observations 22,346 22,346
Note: The table presents the difference-in-differences analysis of responsiveness with respect to changes in credit quality of offer recipients (i.e., the subprime recipient share (ΔSubprime Recipient) and the average credit score of the recipients (ΔRecipient Score)), using small business credit card offers as the control group during 2007-2016. The credit scores of offer recipients are available since 2007. Post CARD is equal to one for years of 2010-2016 and zero for years of 2007-2009. Consumer is equal to one for consumer credit card offers, and zero for small business credit card offers. The variable of interest is ΔVarC
t-1 × Post CARD × Consumer. We control for the issuer’s own lagged changes in the respective credit quality measure of offer recipients in that county ΔVart-1. We control for county-level economic conditions (i.e., unemployment rate and house price appreciation), levels of and annual changes in the share of subprime consumers of the county, the annual changes in demographic and socioeconomic compositions of offer recipients (i.e., the share of high school graduates, people with some college education, people with college degrees, white, homeowners and married people, and average household income). Standard errors are clustered by county. *, (**), and [***] denote two-tailed statistical significance at 10%, (5%), and [1%] levels, respectively.

44
Table 10 Implications of Less Intense Competition
Offered rate dispersion Markup (1) (2) coef se coef se
Post CARD -1.511*** 0.066 4.753*** 0.062 Consumer 0.391*** 0.045 0.664*** 0.044
Post CARD × Consumer 0.772*** 0.067 0.695*** 0.063
Controlling for
Local economic conditions Yes Yes
Local subprime consumer share levels and changes Yes Yes Offer recipients’ demographic and socioeconomic
hYes Yes
R-squared 0.208 0.556
Number of observations 260,831 64,496 The table presents the difference-in-differences in the dispersion of offered rates and the average markup offered in a county before and after the implementation of the CARD Act between consumer and small business credit card offers. Offered rate dispersion is the difference between the maximal and the minimal offered rates to the same consumer. Markup is the average interest rates offered to a county-year minus the cost of funds. Post CARD is equal to one for years of 2010-2016 and zero for years of 2001-2009. Consumer is equal to one for consumer credit card offers, and zero for small business credit card offers. The variable of interest is Post CARD × Consumer. We control for county-level economic conditions (i.e., unemployment rate and house price appreciation), levels of and annual changes in the share of subprime consumers of the county, and annual changes in demographic and socioeconomic compositions of offer recipients (i.e., the share of high school graduates, people with some college education, people with college degrees, white, homeowners and married people, and average household income). Standard errors are clustered by county. *, (**), and [***] denote two-tailed statistical significance at 10%, (5%), and [1%] levels, respectively.