Embed Size (px)
Citation preview
WP/08/242
Does Openness to International Financial Flows Raise Productivity Growth?
M. Ayhan Kose, Eswar S. Prasad, and
Marco E. Terrones

© 2008 International Monetary Fund WP/08/242 IMF Working Paper Research Department
Does Openness to International Financial Flows Raise Productivity Growth?
Prepared by M. Ayhan Kose, Eswar S. Prasad, and Marco E. Terrones1
Authorized for distribution by Stijn Claessens
October 2008
Abstract This Working Paper should not be reported as representing the views of the IMF. The views expressed in this Working Paper are those of the author(s) and do not necessarily represent those of the IMF or IMF policy. Working Papers describe research in progress by the author(s) and are published to elicit comments and to further debate.
This paper provides a comprehensive analysis of the relationship between financial openness and total factor productivity (TFP) growth using an extensive dataset that includes various measures of productivity and financial openness for a large sample of countries. We find that de jure capital account openness has a robust positive effect on TFP growth. The effect of de facto financial integration on TFP growth is less clear, but this masks an important and novel result. We find strong evidence that FDI and portfolio equity liabilities boost TFP growth while external debt is actually negatively correlated with TFP growth. The negative relationship between external debt liabilities and TFP growth is attenuated in economies with higher levels of financial development and better institutions.
JEL Classification Numbers:
F41, F36, F43
Keywords: Financial openness; capital account liberalization; capital flows; external assets and liabilities; foreign direct investment; portfolio equity; debt; total factor productivity
Author’s E-Mail Address: [email protected]; [email protected]; [email protected]
1 We are grateful to Nauro Campos, Stijn Claessens, Peter Howitt, Paolo Mauro, Enrique Mendoza, Maury Obstfeld, Jonathan Ostry, Kate Phylaktis, Assaf Razin, and participants of the Emerging Markets Finance Conference (Cass Business School), the Conference on Global Liquidity and East Asian Economies (Hong Kong Institute for Monetary Research), and the World Congress of the International Economic Association for their helpful and constructive comments. We thank Dionysios Kaltis and Yusuke Tateno for excellent research assistance.
2
Contents Page
I. Introduction....................................................................................................................3
II. Methodology and Data...................................................................................................5
III. Basic Stylized Facts .......................................................................................................8
IV. Regression Results .........................................................................................................9 A. Basic Results on Financial Openness and TFP Growth...................................10 B. Composition of Flows and Stocks ...................................................................12
V. Extensions and Robustness Tests.................................................................................14 A. Alternative Measures of TFP ...........................................................................14 B. Alternative Measures of De Jure Capital Account Openness ..........................15 C. Alternative Ways of Splitting the Sample Based on Country Characteristics.16 D. Different Time Horizons..................................................................................17 E. An Alternative Specification............................................................................17 F. Other Controls, Outliers...................................................................................18 G. Concluding Remarks........................................................................................19 Tables 1. Sample Statistics: Median Values by Country Group .........................................................21 2. Financial Openness and TFP Growth: Cross-Section Regressions .....................................22 3. Financial Openness and TFP Growth: Panel Regressions...................................................23 4. Does the Composition of Exernal Liabilities Matter? ........................................................24 5. Alternative Measures of TFP ...............................................................................................25 6. Alternative Measures of Capital Account Openness ...........................................................26 7. Financial Openness and TFP Growth in Non-Industrial Countries .....................................27 8. Is There a Threshold Level of Financial Integration? .........................................................28 9. Effects on TFP Growth at Different Horizons.....................................................................29 10. Financial Openness and TFP Growth: Difference-in-Differences.....................................30 Figures 1. Growth Accounting for More and Less Financially Open Economies................................32 2. Growth Accounting for More and Less Financially Open Economies................................33 3. Growth Accounting for More and Less Financially Open Economies................................34 Table 1a. Summary Statistics.............................................................................................................31 References................................................................................................................................35
3
I. INTRODUCTION
A central debate in international finance is whether openness to foreign capital has significant growth benefits and whether, in the case of developing countries, these benefits outweigh the risks. In theory, there are a number of direct and indirect channels through which financial openness should increase economic growth. Yet there is little robust empirical evidence of a causal link between financial openness and economic growth. This is not for want of effort--a number of empirical studies have attempted to systematically examine whether financial openness contributes to growth using various approaches. The majority of these studies, however, tend to find no effect or at best a mixed effect for developing countries (see Kose et al., 2008, for an extensive survey).
The failure of most empirical studies to detect these presumed growth benefits has been used as ammunition by the critics of financial globalization who view unfettered capital flows as a serious impediment to global financial stability (e.g., Rodrik, 1998; Bhagwati, 1998; Stiglitz, 2004). By contrast, proponents of financial globalization argue that increased openness to capital flows has, by and large, proven essential for countries aiming to upgrade from lower to middle income status, while also enhancing stability among industrialized countries (e.g., Fischer, 1998; Summers, 2000). This is clearly a matter of considerable policy relevance, especially with major emerging market economies like China and India opening up their capital accounts and even a number of low-income countries experiencing large cross-border financial flows.
This paper attempts to change the direction of this debate by focusing on the impact of financial openness on productivity growth, rather than output growth. Why does financial openness have the potential to enhance aggregate efficiency and, by extension, total factor productivity (TFP) growth? Recent studies suggest that there are many channels through which financial openness can have a positive impact on productivity growth. For example, Kose et al. (2008) identify a set of indirect benefits of financial openness and argue that these could have a positive impact on TFP growth because they lead to more efficient resource allocation (also see Mishkin, 2006). These indirect “collateral” benefits could include development of the domestic financial sector, improvements in institutions (defined broadly to include governance, the rule of law etc.), better macroeconomic policies etc., all of which could result in higher growth through gains in allocative efficiency. Moreover, an earlier literature has argued that certain types of capital flows such as foreign direct investment (FDI) can yield productivity gains in recipient countries directly through transfers of technology and managerial expertise.
The nature of the relationship between financial openness and TFP growth has important welfare implications, especially in light of the recent literature emphasizing the role of TFP growth as the main driver of long-term per capita income growth. Although the earlier literature argued that factor accumulation is the key determinant of economic growth, a consensus is building that TFP growth is far more important than factor accumulation (Hall and Jones, 1999).2 2 Also see Easterly and Levine (2001), Klenow and Rodriguez-Clare (2005) and Parente and Prescott (2005). Jones and Olken (2008) present evidence that TFP growth fluctuations constitute the primary determinant of not just long-term but also short-term growth. Bosworth and Collins (2003), by contrast, argue that previous studies over-estimate the importance of TFP growth; they argue that factor
(continued…)
4
In parallel to this shift in the broader growth literature, the classical notion that capital mobility allows capital-poor countries to grow faster by relaxing the constraints on domestic investment has also been challenged. Gourinchas and Jeanne (2006) argue that capital controls constitute only a transitory distortion since even a financially closed economy can eventually accumulate capital domestically and so the distortion vanishes over time. Hence, viewing the benefits of financial openness as being equivalent to a permanent reduction in this distortion may be an overstatement of the benefits. In other words, the direct welfare or growth gains from capital mobility are likely to be small. Instead, the theory implies that the benefits from financial openness should be reflected in TFP growth.
In this paper, we provide a comprehensive analysis of the relationship between financial openness and productivity growth using an extensive dataset that includes various measures of productivity and financial openness for a large number of developed and developing countries. We distinguish between de jure capital account openness—the absence of restrictions on capital account transactions—and de facto financial integration, which we measure by stocks of foreign assets and liabilities relative to GDP. We find that economies with more open capital accounts generally have higher TFP growth. More importantly, our formal econometric analysis suggests that capital account openness has a causal effect on TFP growth even after controlling for the standard determinants of growth. This effect is robust to alternative regression specifications, the inclusion of a large set of control variables, and attempts to control for potential endogeneity. On the other hand, overall de facto financial integration does not seem to matter for TFP growth. However, this conclusion turns out to mask a novel and interesting result. When we disaggregate the financial integration measure into stocks of liabilities attributable to different types of underlying capital flows, we find strong evidence that FDI and portfolio equity boost TFP growth while debt is negatively correlated with GDP growth. The negative relationship between stocks of external debt liabilities and TFP growth is partially attenuated in economies with better-developed financial markets and better institutional quality.
Our paper is closely related to Bonfiglioli (2007), which is the only other empirical macro study we are aware of that analyzes the impact of overall financial integration on TFP growth. Her findings, based on cross-country data over the period 1975-99, also suggest that financial integration has a positive direct effect on productivity growth. Our paper is complementary to hers in that we use a more comprehensive and updated dataset. More importantly, as noted above, we use a wide array of de jure and de facto financial openness measures to provide a number of additional important results on how the nature of financial integration and the composition of external liabilities influences TFP growth.
This enables us to connect our results to an earlier literature focusing on the impact of specific types of capital flows on TFP growth. There is a strong presumption that FDI should yield productivity gains for domestic firms through several channels including imitation (adoption of new production methods), skill acquisition (education/training of labor force), and competition (efficient use of existing resources by domestic firms). Using cross-country data, Borensztein, accumulation and TFP growth are about equally important, even for long-run growth. Caselli (2005) contends that factor accumulation can not explain observed differences in growth across countries but that this may simply reflect problems in measurement of factors and how they enter the production function.
5
De Gregorio and Lee (1998) conclude that FDI increases an economy’s productive efficiency (also see de Mello, 1999; Xu, 2000). There is a larger literature studying the productivity enhancing effects of FDI using firm- or sector-level data (see Haskell et al., 2007, and references therein). Javorcik (2004) and others find evidence that FDI raises productivity growth through vertical spillovers, which stem from the interactions between foreign firms and their local suppliers (backward linkages) and customers (forward linkages), rather than horizontal spillovers, which are associated with productivity spillovers from foreign firms to domestic firms in the same sector.3 There is also some work looking at the effects of equity market liberalizations on productivity growth. For instance, Henry and Sasson (2008) find that equity market liberalizations are associated with an increase in the growth rate of labor productivity in emerging market economies (also see Mitton, 2006).
In the next section of the paper, we discuss the main features of our dataset and briefly review the mechanics of our growth accounting exercise. In Section III, we present a set of stylized facts about the relationship between financial integration and TFP growth. In Section IV, we examine this relationship using various empirical methods and in Section V we subject our main results to a battery of robustness tests. We conclude with a brief summary of our findings and their implications in Section VI.
II. METHODOLOGY AND DATA
Our approach in this paper is to rely on a dynamic panel regression framework. While this approach has some limitations, it enables us to provide a broad-brush characterization of the effects of financial openness on TFP growth at the macroeconomic level. When using dynamic panel methods on cross-country data, there are two major conceptual and econometric issues we need to contend with. The first relates to the point made by Henry (2007) that capital account liberalization should have only a temporary positive effect on productivity growth. This point is analytically correct, but it leaves open the possibility that the transition to a new steady state could take a long time, measured in decades not years, especially for countries that are far from the technology frontier. To move beyond very short-term effects and examine if financial openness has a sustained (even if not permanent) effect on productivity growth, our analysis focuses on low-frequency data (non-overlapping ten-year growth rates). This is a relevant horizon not just for capturing more than purely transitory and business cycle effects but may also signal the importance of capital account liberalization in triggering a productivity take-off. The second potential problem is that of reverse causality—the possibility that higher productivity growth attracts more foreign capital—and the related problem of endogeneity—productivity growth and capital inflows could both be responding to some other forces. Gourinchas and Jeanne (2007) find that, among developing countries, net capital inflows (measured as the negative of current account balances) are negatively correlated with productivity growth, which 3 Gorg and Greenaway (2004) and Lipsey and Sjoholm (2005) survey the evidence on FDI spillovers. In a recent contribution, Levchenko, Ranciere and Thoenig (2008) contend that financial openness has no effect on industry-level TFP growth in the manufacturing sector.
6
is evidence against the type of reverse causality that could undercut our results. However, Prasad, Rajan and Subramanian (2007) find that, despite evidence of “uphill” net flows of capital from developing to industrial countries, private capital flows—especially FDI—do tend to follow productivity growth (but during the 2000s, the picture becomes less clear even for FDI flows). Since our primary focus is on private capital flows, we cannot dismiss either of these potential econometric problems lightly.4 Unfortunately, it is difficult to find an appropriate instrument at the country level—a variable that, in principle, influences financial integration but not TFP growth. Hence, we tackle the endogeneity issue, in the presence of unobserved country fixed effects, using the system GMM approach of Blundell and Bond (1998), which uses suitable lagged levels and lagged first differences of the regressors as instruments. This is admittedly a mechanical approach to dealing with endogeneity but it is econometrically sound, has been widely used in a variety of different contexts, and has some intuitive appeal. Indeed, Bond, Hoeffler and Temple (2001) emphasize the numerous advantages of using this method in empirical growth studies. We study the empirical link between financial openness and TFP growth using a large sample of industrial and developing countries. We use the latest version of the Penn World Tables (Version 6.2, Heston, Summers and Aten, 2006) and supplement that with data from various other sources, including databases maintained by the World Bank and IMF. All data are in constant (2000) international prices. Out dataset comprises annual data over the period 1966–2005 for 67 countries—21 industrial and 46 developing. The latter group includes many emerging market economies, while the group of industrial countries corresponds to a sub-sample of the OECD economies for which data used in the empirical analysis are available.
The total factor productivity measure we use is based on the standard growth accounting framework (see Klenow and Rodriguez-Clare, 2005). Consider the standard Cobb-Douglas production function written as:
αα −= 1)(HLAKY
where Y is aggregate output, A is total factor productivity, K and H denote the aggregate stocks of physical and human capital respectively, and L is the number of workers.5 With time series data on Y, K, H, and L, and an estimate of the parameter α , which is the share of capital in total national income, it is straightforward to calculate TFP. We construct these series using data from the Penn World Tables Version 6.2. Following Klenow and Rodriguez-Clare (2005), we estimate
4 Razin, Sadka and Tong (2005) note that, in a bilateral context, host country FDI inflows should increase if the host country has a positive productivity shock. But they argue that this may be offset by the reduced outflows from the source country through a total profitability effect due to changes in input prices in that country, implying that endogeneity is not an obvious problem even in a reduced-form formulation linking FDI and productivity. Aizenman, Pinto and Radziwill (2008) find that countries that finance more of their investment domestically, rather than relying on foreign capital, have on average recorded higher growth rates than those with lower “self-financing” ratios. 5 Caselli and Feyrer (2007) argue that it is important to account for inputs such as land and natural resources when comparing marginal products of capital across countries. Since our focus is on productivity growth and the stock of land in a country is stable, this is not a major issue for our analysis.
7
the initial values of capital stocks and then use the standard capital formation equation, assuming an annual depreciation rate of 6 percent, to calculate each period’s capital stock. We also estimate human capital stocks based on a Mincerian function of returns to schooling (with a Mincerian return parameter of 0.085 for each additional year of schooling) using the Barro and Lee (2000) cross-country dataset on schooling attainment. We extrapolate these authors’ data for the period after 2000 using the average growth rate of schooling attainment for each country. This framework also allows for an accounting decomposition of the growth of output per worker into the contributions attributable to three components—TFP growth, capital deepening (change in the ratio of K to Y), and human capital accumulation (change in H):
/ /1
1 1Y L A K Y Hg g g gαα α
⎛ ⎞ ⎛ ⎞= + +⎜ ⎟ ⎜ ⎟− −⎝ ⎠ ⎝ ⎠
In our analysis, the parameter α is assumed to be one-third, following the standard practice in the literature. Gollin (2002) argues that, once one correctly accounts for self-employment income, capital income shares are in fact remarkably similar across countries and stable over time within countries (also see Bernanke and Gurkaynak, 2002). Nevertheless, in our empirical work, we will consider alternative measures of capital shares for each country in order to examine the sensitivity of our results to the choice of this parameter. To measure financial openness, we employ both de jure and de facto measures. Our benchmark measure of de jure capital account openness is a binary indicator that takes a value of one when the capital account is open; otherwise, it takes a value of zero. This classification is based on information contained in the International Monetary Fund’s Annual Report on Exchange Arrangements and Exchange Restrictions (AREAER) (Schindler, 2007). Our benchmark measure of de facto financial integration is the ratio of gross stocks of external liabilities to GDP—a cumulated measure of inflows that is most closely related to the notion of openness to foreign capital that could be associated with technological and other spillovers. We also consider alternative measures of integration and the roles played by various components of aggregate gross stocks of external assets and liabilities. These measures are primarily from Lane and Milesi-Ferretti’s (2006) External Wealth of Nations Database. In sensitivity tests for our empirical results, we will consider other measures of capital account openness as well. Kose et al. (2008) discuss the relative merits and drawbacks of each of these measures of financial openness. The de jure measure is relevant for analysis of the effects of capital account liberalization policies. But the existence of capital controls often does not accurately capture an economy’s actual level of integration into international financial markets. The intensity and effectiveness of enforcement of capital controls are not reflected in simple indicator measures. Many countries with extensive capital controls have still experienced massive outflows of private capital, while some economies with open capital accounts have recorded few capital inflows or outflows. The de facto measure may be conceptually more appropriate to the extent that we are interested in the effects of an outcome-based measure of financial integration. It also allows us to obtain a finer characterization of the degree of financial openness of different economies and to analyze the effects of different types of capital flows. On the other hand, many of the indirect
8
benefits of financial integration may be vitiated by the presence of capital controls. In view of these conceptual issues and the controversy surrounding the choice of the “right” measure, we will examine both types of measures of financial openness.6
We also consider several additional control variables in our regression analysis, including trade openness, changes in the terms of trade, institutional quality, and financial sector development. We face the usual problems in measuring these variables, especially the last two, which are important for our analysis. Given that there is little consensus on this issue, we simply follow the literature in using the ratio of private sector credit to GDP as a rough measure of financial development (or financial depth), fully recognizing that this measure has shortcomings but it has the advantage of being available on a reasonably consistent basis across a large group of countries and over a long period. Similarly, we use a broad measure of institutional quality that is the sum of the three key indexes from the International Country Risk Guide (corruption, law and order, and bureaucratic quality) and takes on values from 0 to 18.
III. BASIC STYLIZED FACTS
We begin by presenting some basic stylized facts about the relationship between the degree of financial integration and TFP growth. In addition to analyzing the link between these two variables for the full sample (1966-2005), we consider whether the nature of this relationship has changed over time by dividing the full sample into two sub-periods: 1966-1985 and 1986-2005. The mid-1980s represent a break-point in many respects—a number of countries began to undertake trade and financial liberalization programs around this period; the dramatic surge in international financial flows across industrial countries as well as between industrial and developing countries got started; and the Great Moderation (the decline in business cycle volatility across all groups of countries, especially the industrial ones) began. For the descriptive analysis in this section, we divide our sample into two coarse groups—more financially open (MFO) economies and less financially open (LFO) economies. The group of MFO economies includes those with above-median levels of financial openness and LFO economies are those with below-median levels. The cross-sectional median of financial openness is based on the average level of financial openness for each country over the full sample period.
We performed the standard growth accounting exercise (described in Section II) for each country in our sample. Figure 1a shows the cross-sectional medians of labor productivity growth and the median contributions of the three components separately for the MFO and LFO economies, with these two groups being separated on the basis of a de facto measure of financial integration (gross stocks of liabilities relative to GDP). The contribution of TFP growth to per-worker output growth is larger in the MFO economies. Indeed, consistent with the literature on the importance of TFP growth, this factor is on average the most important contributor to growth over the last four decades. The results are similar when we use a de jure measure of capital account openness to split the sample into MFO and LFO groups, using a similar sample-median criterion based on
6 Collins (2007) argues that de jure measures are less subject to endogeneity concerns than de facto indicators. Aizenman and Noy (2008) examine the relationship between de jure and de facto measures of financial openness.
9
this openness measure as the cutoff between the two groups (Figure 1b). These figures present the growth contributions of TFP and factors of production after scaling the growth rates with the relevant share coefficients.
Figure 2 presents the growth contributions of various components over time and across the groups of MFO and LFO countries. We again assume that the MFO and LFO split is based on the median value of the de facto financial integration measure for the full sample. In other words, there is no change in the composition of the groups over time. On average, MFO economies enjoyed faster productivity growth over the recent period of financial globalization. While physical and human capital accumulation were the largest contributors to GDP growth in the earlier period, the contribution of TFP growth increased dramatically during the globalization period. By contrast, in LFO economies, the contribution of TFP growth fell slightly during the globalization period and output growth was mostly attributed to the accumulation of both types of capital. It is also interesting to note that average output growth is rather similar between the two groups of economies during the globalization period, suggesting that there is no clear correlation between the level of financial openness and output growth, notwithstanding the sharp differences in the contribution shares of TFP growth.
To examine the robustness of these observations, we conduct a number of additional exercises. First, we switch to using our baseline de jure measure of capital account openness (from Schindler, 2007) to differentiate between more and less open economies. Figure 3 shows that the results are robust to the use of this alternative measure of financial integration. Next, we relax our assumption that the composition of the groups of MFO and LFO economies has been constant across the two sub-periods. Allowing the composition to change based on the median value of financial openness for each sub-sample does not change our main results (not shown here; see Figures 2b and 3b in Kose, Prasad and Terrones, 2008).
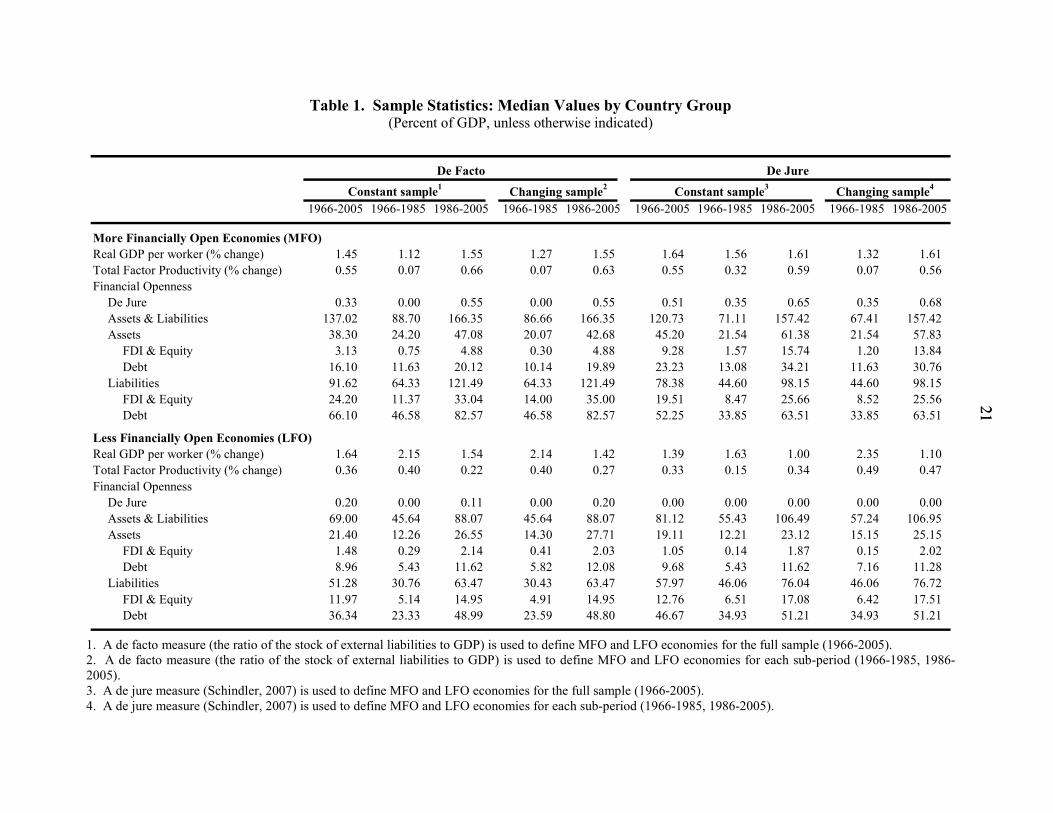
The summary statistics in Table 1 confirm that, even if one focuses on just the median (unscaled) growth rate of TFP, it is still the case that TFP growth has typically been higher in MFO economies compared to LFO economies over the period 1986-2005. When we use the de facto financial integration measure to classify economies into LFO and MFO groups (first two panels of Table 1), there is virtually no difference in the median growth rates of these two groups in the globalization period (which is the period when the distinction between the two groups has more bite as overall levels of integration were quite low before the mid-1980s). There is some evidence based on the de jure measure (third and fourth panels of Table 1) that countries with more open capital accounts have grown faster in the globalization period.
These stylized facts suggest that there is a relationship between financial openness and TFP growth, although we have so far established just a correlation using a coarse disaggregation of our sample of countries. Consistent with earlier literature, however, we find little evidence that the degree of financial openness has a robust positive correlation with output growth.
IV. REGRESSION RESULTS
We now turn to a more formal regression analysis of the relationship between financial openness and TFP growth. We start with some simple cross-section regressions and then move on to dynamic panel regressions to exploit the time series dimension of the data as well. Since we are
10
interested in low-frequency changes in TFP growth rather than year-to-year or business cycle-related fluctuations, we use ten-year averages of the underlying annual data in the panel regressions, which gives us a maximum of four observations per country. In addition to the standard determinants of growth discussed earlier, our reduced-form regressions include a term controlling for the initial level of TFP.7
A. Basic Results on Financial Openness and TFP Growth
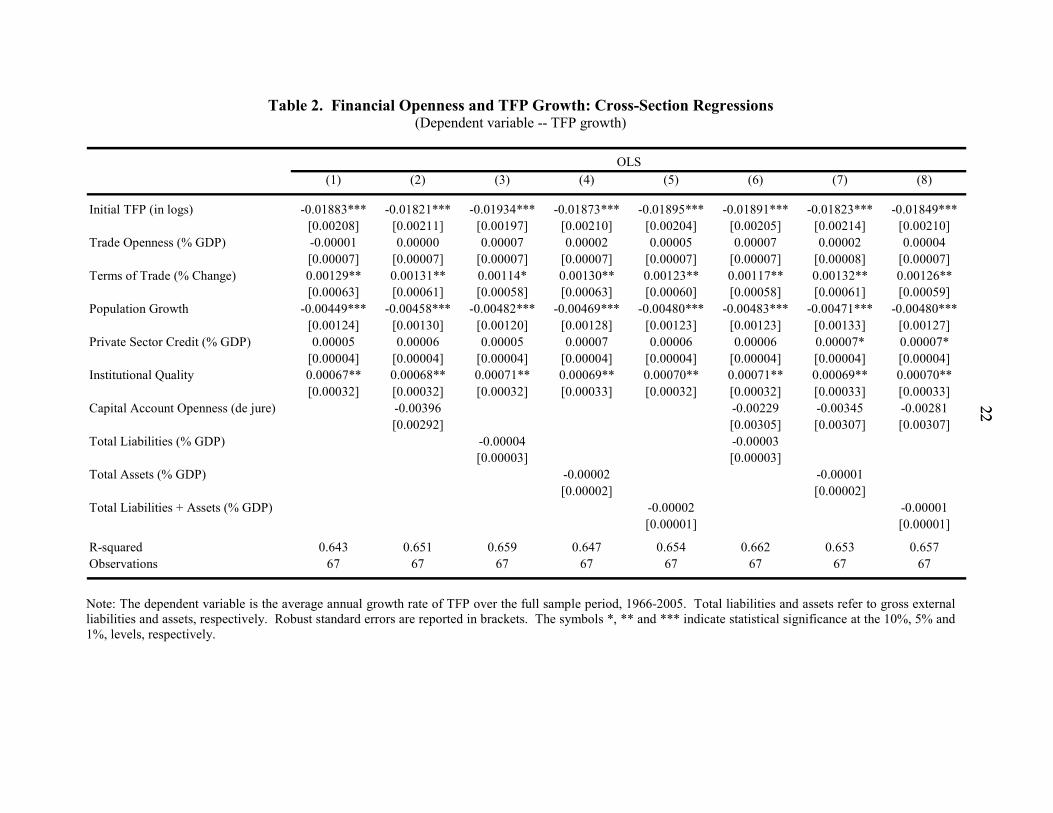
We begin with simple reduced-form cross-section regressions to more formally characterize the correlation between financial openness and TFP growth. The first column of Table 2 shows the basic cross-country regression from a growth framework. Of the variables that have been found by other authors to be robust in growth regressions, only three (the convergence term, population growth, and institutional quality) seem to matter for TFP growth. Trade openness and financial depth do not matter.8 On the other hand, unlike in standard growth regressions, changes in the terms of trade do seem to be positively associated with TFP growth. In the second column, we augment this regression with a measure of de jure capital account openness. This de jure measure of course provides at best a partial representation of a country’s integration with international financial markets. We now add to the regressions the benchmark measure of de facto financial integration discussed earlier—the ratio of gross external liabilities to GDP. The next two columns report results using as the measure of financial openness (i) the ratio of gross external assets to GDP and (ii) the ratio of the sum of gross external assets and liabilities to GDP. In the last three columns, we include both de jure and de facto measures of financial openness. There is no evidence that any of these measures of financial integration matters for TFP growth in the cross section, which echoes the result in the broader literature that financial integration is not strongly correlated with GDP growth.
Financial openness has of course changed markedly over time. To exploit the time series variation in the data, we now move on to using dynamic panel regressions based on ten-year averaged data for each country. The regression specification is as follows:
, , 1 , 1 , , ,' 'i t i t i t i t i t t i i ty y y FO Zγ β ϕ μ η ε− −− = + + + + +
where yi,t is the logarithm of TFP, yi,t-1 is the level of TFP at the beginning of each ten-year period, FOi,t is the set of financial openness measures, Zi,t is the set of relevant control variables,
7 Cross-country growth regressions typically include the initial level of GDP as a regressor to control for convergence effects. Although there is no clear theoretical reason to expect TFP convergence across countries, recent studies have suggested convergence to a common technology frontier. The initial level of TFP consistently enters our regressions with a statistically significant coefficient, so we leave it in. 8 The coefficients on both trade openness and financial sector development are positive and statistically significant in a number of specifications we examine later. Since they are not the main focus of our paper, however, we abbreviate our discussion of these important variables. For an extended discussion of the relationship between trade openness and productivity, see Alcala and Ciccone (2004), and for the one between financial sector development and productivity, see Benhabib and Spiegel (2000).
11
μt represent time dummies (for each non-overlapping ten-year period), ηi stands for the country fixed effects, and εi,t is the error term. Note that the dependent variable in this regression is TFP growth over the relevant ten-year period, and the control variables are growth rates (or averages, as the case may be) over the ten-year period. This regression is dynamic because it could be rewritten using yi,t as the dependent variable and yi,t-1 as an explanatory variable.
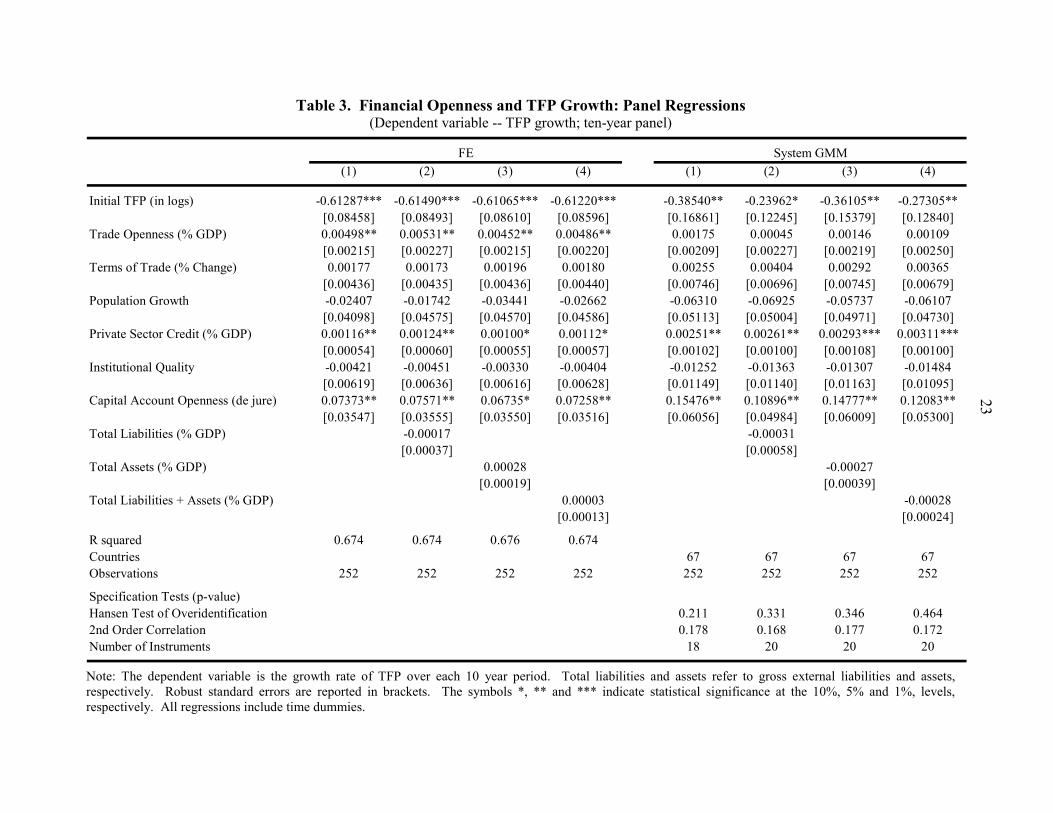
The first panel of Table 3 presents results from fixed effects (FE) panel regressions. The coefficient on the de jure measure of financial openness in the first column is significantly positive, implying that capital account openness is associated with higher TFP growth. When we include measures of de facto integration (columns 2-4), those don’t matter and it is still the case that de jure capital account openness is positively related to TFP growth. As noted earlier, a key concern about these regressions is that TFP growth and financial openness may be endogenous.9 The results in the second panel of Table 3 show that capital account openness matters for TFP growth even when we control for endogeneity using a version of the Blundell-Bond system GMM estimator that includes some refinements to limit the number of instruments.10 The results are quite similar whether we include the de jure measure of capital account openness by itself, or in conjunction with different measures of de facto integration. The coefficient estimates imply that an economy with an open capital account has, over a ten-year horizon, annual TFP growth that is about 0.11-0.15 percentage points higher than an economy that has extensive capital controls. Why does de jure capital account openness have a positive relationship with TFP growth while de facto openness doesn’t? While an open capital account by itself says nothing about an economy’s actual level of integration into international financial markets, many of the efficiency gains from competition, technology transfers, spillovers of good corporate and public governance practices etc. may be associated with an open capital account. Indeed, some outward flows could represent capital flight despite the existence of controls on outflows; this could reflect lack of confidence in a country’s macroeconomic policies or institutions. Similarly, inward flows that manage to circumvent capital account restrictions are much less likely to convey many of the indirect benefits of financial integration. 9 This concern is on top of the fact that when we include a country fixed effect in panels with a small cross-section, pooled OLS and within-groups estimators will be inconsistent. The system GMM method that we use also addresses this issue. 10 Roodman (2007) discusses the risks of using too many instruments in a mechanical manner, and suggests some criteria and procedures for limiting the set of instruments in system GMM estimation. We follow these procedures to reduce the number of instruments. Thus, for the difference regression that covers periods t and t-1, the instruments include log TFP at the beginning of t-1 and the averages in period t-2 of trade openness, terms of trade, population growth, private sector credit, institutional quality, capital account openness (de jure) and, depending on the regression equation, total liabilities, total assets, the sum of total liabilities and total assets, debt liabilities, and the sum of FDI and Equity liabilities, and their multiplicative terms. Likewise, for the levels regression corresponding to period t, the instruments include the difference of log TFP at the beginning of t and t-1 and the difference between the averages in period t-1 and the averages in period t-2 of trade openness, etc. Most explanatory variables are treated as endogenous; population growth, terms of trade, and de jure financial openness are treated as predetermined; and the time trend is treated as strictly exogenous.
12
Although there is little evidence that capital controls are effective at achieving their macroeconomic objectives beyond a short period, they are associated with substantial microeconomic costs that could eliminate the productivity gains associated with financial integration, especially if the controls are maintained for a prolonged period. For example, many authors have pointed out that capital controls can impose significant distortionary costs at the microeconomic (firm or industry) level, even if economic agents find ways to evade those controls (Forbes, 2007). In addition, capital controls distort the behavior of agents while valuable resources are wasted in seeking to circumvent them (Johnson and Mitton, 2003). Moreover, capital controls increase the cost of engaging in international trade, even for those firms that do not intend to evade them, because of expenses incurred in meeting various inspection and reporting requirements associated with the controls (Wei and Zhang, 2007). In all of these circumstances, while de facto integration may not by itself convey the indirect benefits of financial openness that would ultimately be reflected in higher TFP growth, de jure openness could be instrumental in attaining the productivity gains stemming from financial integration.
B. Composition of Flows and Stocks
We have so far considered aggregate measures of external liabilities and assets. There is a great deal of evidence, however, that not all types of flows have similar effects. A large body of theoretical and empirical evidence suggests that FDI flows, in particular, generate many of the indirect benefits of financial integration that we discussed earlier. Equity flows have also been shown to generate positive spillovers in terms of deepening and development of domestic financial markets, improvements in corporate governance among domestic firms etc. Debt flows, on the other hand, have many undesirable properties even though they do help loosen financing constraints at both the firm and country levels. Even at a conceptual level, debt flows lack the positive attributes of equity-like flows. They do not solve certain agency problems, can lead to inefficient capital allocation if domestic banks are poorly supervised, and generate moral hazard as debt is implicitly guaranteed by the government (in the case of corporate debt) and/or international financial institutions (both corporate and sovereign debt). Moreover, while FDI and portfolio equity flows are more stable and less prone to reversals, the procyclical and highly volatile nature of debt flows, especially short-term bank loans, can magnify the adverse impact of negative shocks on productivity growth.11
We now explore the implications of different forms of financial integration based on the nature of these underlying capital flows. First, we return to using gross external liabilities as a measure of financial openness, but now split stocks of liabilities into (i) FDI and portfolio equity liabilities, and (ii) debt liabilities.12 We club FDI and portfolio equity liabilities together because of the difficulty in telling apart the underlying flows and also because they have some common characteristics. They both have equity-like characteristics in terms of sharing of risk between investors and firms; they tend to be less volatile than debt flows; and other authors have found--using both macro and micro data--that they have positive spillovers. 11 See Kose et al. (2008) for a more extensive discussion and relevant references. 12 We use only de facto openness measures here as it is difficult to get disaggregated capital control measures for different types of flows, especially for a dataset such as ours that covers a long time span and a large number of countries.
13
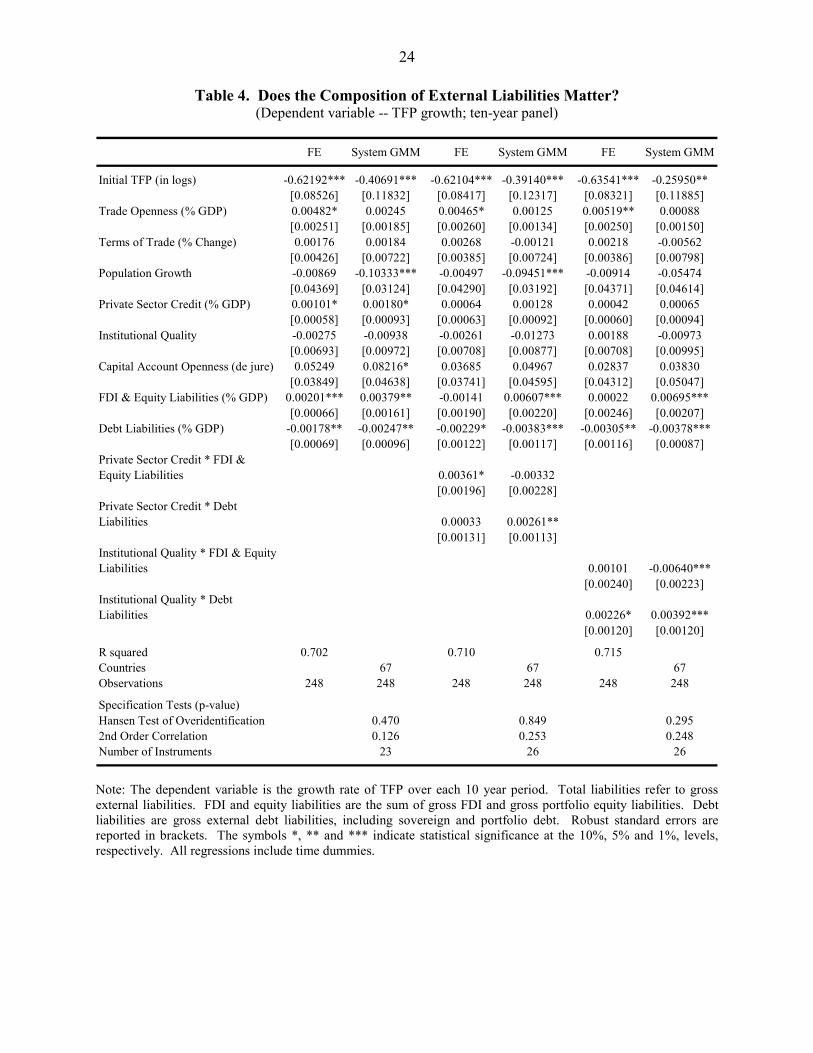
The results from splitting up the composition of external liabilities, presented in the first two columns of Table 4, are striking. In both specifications, there is strong evidence that FDI and equity liabilities boost TFP growth while debt liabilities reduce it.13 The GMM results indicate that a 10 percentage point increase in the ratio of FDI and equity liabilities to GDP would be associated with about a 0.4 percentage points increase in annual TFP growth over a ten-year period. A similar increase in the ratio of debt liabilities to GDP would be associated with TFP growth that is lower by about 0.2 percentage points.
It is not surprising that, even if debt does promote capital accumulation, it may not increase TFP growth. But the negative coefficient signals more than just a zero effect—it implies that more external debt is associated with lower TFP growth. Why should debt hurt TFP growth? It is possible that countries with weaker institutional frameworks and weakly-supervised financial institutions (which may not be fully captured by our composite measures of these characteristics) get more debt flows, which finance politically well-connected local firms that then grow bigger and stronger, to the detriment of other firms. This is clearly not good for aggregate efficiency and overall TFP growth. On the flip side, well-functioning financial markets and other institutions may enhance the TFP benefits of all types of flows.14
One way to get at these issues even using our coarse measures of financial and institutional development is to interact them with these two variables. In the second panel of Table 4, we interact the different stock measures of liabilities with a measure of financial development--the ratio of private credit to GDP. Focusing directly on the system GMM estimates in column 4, the basic coefficients on different stock variables are preserved. An interesting result is that there is a significant positive coefficient on the interaction between private sector credit and the stock of debt liabilities. That is, having well-developed financial markets substantially attenuates the negative impact of debt inflows on TFP growth. The size of the coefficients implies that the level of financial development beyond which the marginal effect of increases in the stock of external debt on TFP growth is positive corresponds to a credit to GDP ratio of nearly 150 percent, well beyond the level even in the more advanced emerging markets.15 This implies that, given their level of financial development, the TFP benefits of financial integration are most evident in developing countries when they receive inflows in the form of FDI or portfolio equity rather than debt. 13 We get a similar result when we use the difference between total liabilities and the sum of FDI and portfolio equity liabilities in place of just debt liabilities. When we split the stock of assets into the same two categories--FDI and portfolio equity assets and debt assets--the coefficients on both those measures of integration are small and statistically insignificant. Since most models about the benefits of financial openness—especially for non-industrial countries—focus on the role of inflows, we present results only for the composition of liabilities. 14 In our panel dataset, we find a weak positive (unconditional) correlation between the level of credit to GDP and the degree of de facto financial openness. The correlation between credit to GDP and the ratio of FDI plus equity liabilities to total liabilities is slightly stronger, suggesting that more financially developed economies receive more of their inflows in the form of FDI and equity rather than debt.
15 This calculation involves dividing the absolute value of the coefficient on debt liabilities (-0.00383) by the coefficient on its interaction with the level of credit to GDP (0.00261). The mean level of private sector credit to GDP in our sample is 0.57 (standard deviation: 0.44) in 1996-2005.
14
In the last two columns of Table 4, we report the results of similar interactions with the institutional quality variable. A higher value reflects better institutions. Here again, better institutional quality reduces the negative impact of debt liabilities on TFP growth.16 Somewhat surprisingly, we also find that improvements in institutional quality reduce the effects of FDI and portfolio equity liabilities on TFP growth. The implication is that, when an economy has attained a very high level of institutional development, even FDI flows don’t make much of a difference to TFP growth. While these results are statistically significant, however, the coefficient estimates indicate that, even at the highest level of institutional quality in our sample, the estimated marginal effect of an increase in FDI and equity liabilities is still positive and that of an increase in debt liabilities is still negative.
These results with the interaction terms suggest that there are subtle “threshold” effects in the data. That is, a country may need to attain a certain level of financial and institutional development before it can attain the full benefits of financial integration on TFP growth. This links up with a growing literature suggesting that the overall growth benefits of financial integration are higher above certain thresholds, and the risks are lower. These threshold effects seem to be most pertinent for external debt—the accumulation of large stocks of external debt by economies that have under-developed financial systems and weak institutions does little for their TFP growth; it could even hurt output and productivity growth by increasing the risks of crises.17
V. EXTENSIONS AND ROBUSTNESS TESTS
We now extend our main results and explore their robustness by checking their sensitivity in a few key dimensions. First, we consider alternative measures of total factor productivity. Second, we look at different measures of de jure capital account openness. Third, we examine if the country sample used in the regressions makes a difference; in particular, we check if the results are different for industrial and non-industrial countries, and also check if there is a clear split in results between highly financially open economies and those that are less open. Fourth, we look at the sensitivity of our results to changes in time horizons. Finally, we examine the possible impact of other controls and outliers on our main results.
A. Alternative Measures of TFP
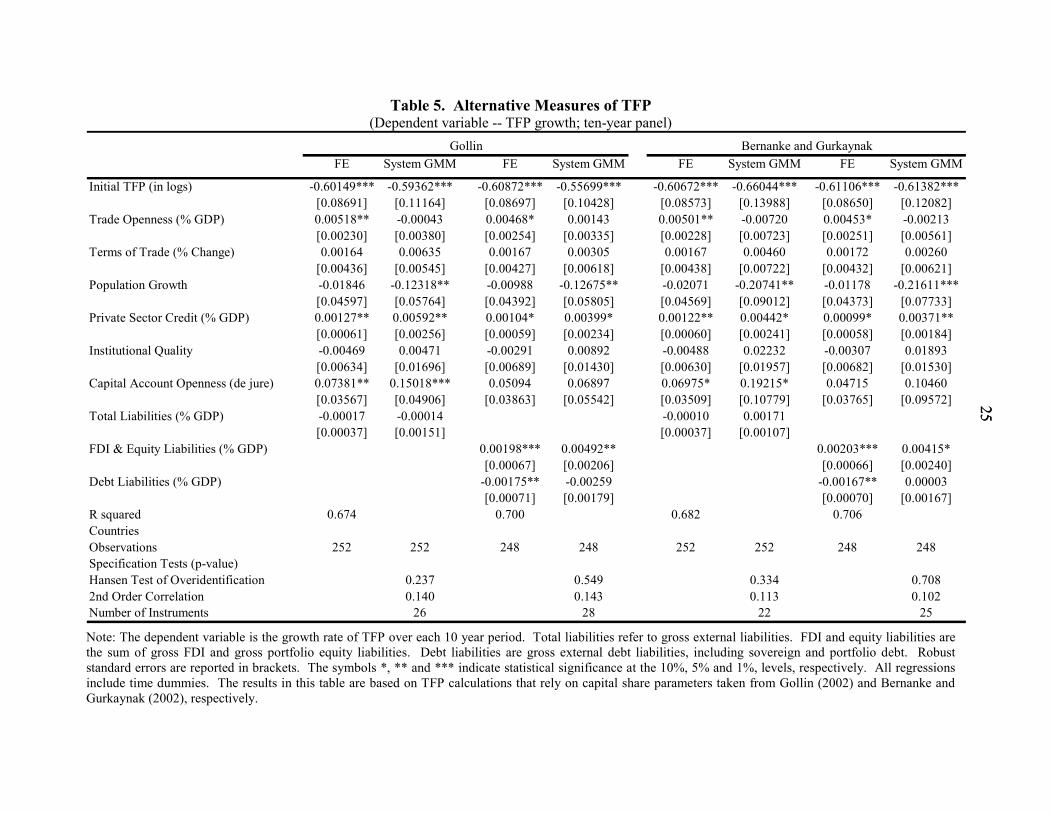
A key parameter choice in our construction of the TFP measure is the capital share parameter. In our baseline results, we have assumed that to be one-third. Some authors have argued that this parameter choice, which was originally based on U.S. data, is not appropriate as capital income shares vary widely cross countries. Based on national income accounts data for countries at various stages of development, this share ranges from 0.2 to 0.8. Gollin (2002) argues that these 16 We get a similar result when we use the difference between total liabilities and the sum of FDI and equity liabilities in place of just debt liabilities. 17 Kose, Prasad and Taylor (2008) survey this literature and provide some new results documenting the quantitative relevance of threshold effects. Aoki, Benigno and Kiyotaki (2005) present a theoretical model in which the effects of foreign debt inflows on domestic TFP depend on the level of financial depth. Prasad and Rajan (2008) discuss the implications of such threshold effects for capital account liberalization programs.
15
national accounts data do not correctly account for self-employed income (labor income of the self-employed is often treated as capital income) and income of small firms. Correcting for these two factors, the capital income shares for most developed and developing economies examined by Gollin cluster in the range of 0.20 to 0.35. Bernanke and Gurkaynak (2002) update Gollin’s work and extend it to a larger group of countries, confirming that choosing a common labor share of one-third is not a bad approximation. For the countries that are common to the two datasets, the estimated capital income shares in these two papers are similar but not identical. Of the 67 countries in our dataset, Gollin’s paper covers 18 and Bernanke and Gurkaynak’s paper covers 45. We redo the TFP calculations using the Gollins capital share data; for those countries in our dataset for which that paper does not report capital shares, we retain our baseline share parameter. We then repeat this exercise using the Bernanke-Gurkaynak capital share data. Table 5 contains the results of regressions using these alternative measures of TFP growth. Most of the main results are preserved. The de jure capital account openness measure is strongly significant when we include total liabilities to GDP as the measure of financial openness, but not when we split the stock of liabilities into FDI plus equity liabilities and debt liabilities. The former set of liabilities is still positively associated with TFP growth, although the coefficient on debt liabilities is significantly negative only in the FE specifications.
B. Alternative Measures of De Jure Capital Account Openness
In our empirical work, we have used a variety of measures of de facto financial integration. As noted earlier, policy-related measures of capital account restrictions capture a slightly different facet of financial integration than these de facto measures. We now explore what happens when we use alternative measures of capital account openness, rather than just the 0-1 indicator taken from the IMF. Chinn and Ito (2006) have recently developed a finer measure of capital account openness. They estimate a principal components model based on four categories of capital account restrictions for each country and interpret the first principal component as their composite measure of de jure capital account openness. The first panel of Table 6 reports the key results using the Chinn-Ito indicator of capital account openness. As in our baseline regressions, the de jure measure is significant when we use total liabilities to GDP as the de facto openness measure (the GMM coefficient is significant at the 11 percent level). And the results with the FDI plus equity and debt liability stocks remain broadly similar to our baseline results. We also experimented with other measures, such as the one constructed by Edwards (2007), and found that the results were essentially the same.18 We also tried a more selective indicator of de jure openness—the equity market liberalization measure used by authors such as Bekaert and Harvey (2000) and Henry (2000). This is a binary
18 Note that, despite the apparent differences amongst the Chinn-Ito index and other measures of overall de jure capital account openness, virtually all of these measures are based on data from the same source—the IMF’s Annual Reports on Exchange Arrangements and Exchange Restrictions (AREAER). Not surprisingly, these de jure measures are all highly correlated (see Schindler, 2007).
16
indicator that is set to unity when a country’s stock markets are opened up to foreign investors, and zero before then. Many authors have found a positive correlation between equity market liberalizations and GDP growth (see, e.g., Bekaert, Harvey and Lundblad, 2005). The second panel of Table 6 shows that this particular measure of de jure capital account openness is not significantly correlated with TFP growth. Part of the reason might be that, for many emerging markets and developing countries, portfolio equity inflows are still quite small relative to FDI and debt flows. Hence, liberalizing this portion of capital inflows by itself may not yield much of an effect on TFP, particularly once we control for the total stock of liabilities.
C. Alternative Ways of Splitting the Sample Based on Country Characteristics
The policy question about capital account liberalization is relevant mostly for non-industrial countries since most of the OECD industrial countries already have open capital accounts, with few restrictions on cross-border capital flows. Although non-industrial countries are anyway predominant in our sample, we re-estimated the key regressions after restricting the sample to this group. The results are reported in Table 7. As expected, the standard errors on the coefficients go up relative to the baseline regressions as the sample size is smaller. The point estimate of the coefficient on de jure capital account openness is larger than in full sample results and it is statistically significant in the GMM specification. When we add the ratio of the stock of liabilities to GDP to the regression, the coefficient on that variable is negative and the coefficient on the de jure openness measure remains positive but is no longer significant. The coefficient on FDI and equity liabilities is positive but not significant; the coefficient on debt liabilities, on the other hand, remains negative and strongly significant. Thus, the strongest result here is again that debt liabilities have a negative effect on TFP growth for non-industrial countries. Until this decade, debt inflows dominated overall inflows into emerging markets. Even though FDI flows have now become more important, debt still accounts for a large portion of the stock of external liabilities accumulated by non-industrial countries.19 As a consequence, for this group, the result for debt liabilities seems to get picked up even when we use total liabilities to GDP as the measure of financial openness.
The split between industrial and non-industrial countries is largely based on the level of development as measured, for instance, by the national level of per capita income. At the end of Section V, we discussed the possibility of other thresholds based on levels of financial and institutional development. A different threshold could be related to the level of financial integration itself. When a country has limited integration with international financial markets, it may not see much—if any—of the benefits, either direct or indirect. That is, these benefits may not just be proportional to the level of integration, as implicitly assumed in the linear regression framework, but might be apparent only after a certain level of integration has been achieved. We take a first stab at this issue by dividing our sample of countries into those that have above-median levels of financial integration (based on gross stocks of external liabilities to GDP) and
19 In 2000-04, debt accounted for about 52 percent of gross external liabilities of emerging markets, while FDI accounted for 37 percent. Portfolio equity liabilities accounted for most of the remainder. In 1980-84, the corresponding shares for debt and FDI were 85 percent and 14 percent, respectively.
17
those that have below-median levels. We then run our basic regressions separately for these two groups. The results are reported in Table 8. The positive coefficient on de jure capital account openness (in the first two columns), the positive coefficient on the stock of FDI and equity liabilities, and the negative coefficient on debt liabilities are all preserved for the MFO economies. For the LFO economies, these coefficients are all much smaller and not statistically significant.20 This confirms the intriguing possibility that the level of financial openness itself constitutes an important threshold for realizing the benefits of financial integration.
One remaining issue is whether specific characteristics of certain countries could be driving the results. For instance, some commodity-exporting countries receive a significant amount of FDI in their resource-extraction industries. This could increase TFP in those sectors but not in the overall economy and, in fact, could hurt overall TFP if Dutch disease effects—exchange rate appreciation spurred by capital inflows—lead to a reallocation of resources away from the manufacturing sector. We included a dummy for commodity-exporting countries (based on a criterion of exports accounting for a large share of total exports) and also interacted it with the stocks of different external liabilities. In general, these additional variables made little difference to any of our key results.
D. Different Time Horizons
We have used non-overlapping ten-year growth rates in our baseline analysis to obviate the effects of short-term and business cycle fluctuations. The results at this horizon suggest that the effects of financial openness on TFP growth are quite persistent, in contrast to the suggestion by Henry (2007) that the effects are likely to be highly transitory. To investigate this issue further, we re-estimated the baseline regressions using growth rates at different horizons. To allow for easy comparability, we report results based on the fixed effects specification in the first column of Table 4. Table 9 shows the results for data averaged over non-overlapping 3-year, 5-year, 7-year, 10-year and 15-year periods. The coefficients on the de jure capital account openness measure decline almost monotonically from 0.008 to 0.004 when we go from 3-year growth rates to 15-year growth rates. Similarly, the absolute values of the coefficients on FDI plus equity liabilities and on debt liabilities are larger at shorter horizons and decline as the horizon lengthens. The coefficients also become less statistically significant at longer horizons, which is as expected since the number of observations in the regressions shrinks at longer horizons. These results confirm that the effects of financial openness on TFP growth tend to wear off over time but are still economically and statistically significant at horizons of up to ten years, which makes capital account liberalization relevant as a policy tool for non-industrial countries.
E. An Alternative Specification
In their analysis, Bonfiglioli (2008) and Henry (2007) employ a variant of the standard baseline specification that we use. The regressions they run can be written using our notation as:
20 We obtained very similar results when we used the de jure capital account openness variable to distinguish between the MFO and LFO economies.
18
They interpret this as a difference-in-difference specification since the inclusion of country and time fixed effects knocks out country-specific and time-specific variation in the panel.
Table 10 shows the results from estimation of this specification, using three different measures of de jure capital account openness and three measures of de facto financial openness. Our core result--that an open capital account is associated with higher TFP growth--is preserved for two of the three de jure measures. The exception is the Bekaert-Harvey indicator—the coefficients on this are positive, but not quite statistically significant. We also experimented with the Edwards (2007) measure of de jure openness, which yielded results in line with the IMF and Chinn-Ito measures. Thus, we view these results as broadly supportive of our main conclusions.
F. Other Controls, Outliers
Some authors have argued that the exchange rate regime affects GDP growth. Given that it is the interaction of relatively fixed exchange rate regimes and capital account liberalization that has triggered many currency crises, controlling for the exchange rate regime is potentially important for output growth, although the link is less clear for TFP growth. We replicated the full set of baseline results from Table 4 with this additional control--the “fine” classification of de facto exchange rate regimes developed by Reinhart and Rogoff (2004), which has 15 different categories. The results (which we do not report here) indicate that, once we control for financial openness, the exchange rate regime has little additional influence on TFP growth and has only a marginal effect on the key coefficients of interest to us.21
We also conducted a battery of tests to check the sensitivity of our results to outliers. Rather than reporting these results in detail, we just briefly summarize the main experiments and results. We first eliminated all observations with financial openness values that were more than two standard deviations from their respective full sample means. This was done in two ways—first by eliminating only specific country-period observations that fell afoul of this rule (so a country could still be represented in the sample in other periods) and then by eliminating a country altogether from the sample if any of the observations pertaining to that country had to be dropped. The number of observations we dropped were typically less than 2 percent of the full sample of panel data. When we re-estimated the baseline regressions with these slightly smaller samples, the main baseline results were almost all entirely preserved. We also used the method proposed by Hadi (1994) for detecting outliers in multivariate regressions. Again, eliminating such outliers made little difference to the key results.
21 We also controlled for terms of trade volatility and found that it did not matter.
19
VI. CONCLUDING REMARKS
In this paper, we have provided a comprehensive empirical analysis of the relationship between financial openness and TFP growth. We find strong evidence that financial openness, as measured by de jure capital account openness, is associated with higher medium-term TFP growth. These results are robust to our attempts to deal with potential problems of endogeneity and reverse causality, leading us to the view that this may in fact be a causal relationship. But it is a subtle one. The level of de facto financial integration, as measured by the stock of external liabilities to GDP, is not correlated with TFP growth. But splitting up the stock of external liabilities reveals a novel and interesting result. FDI and equity inflows (cumulated over decade-long periods) contribute to TFP growth while debt inflows have the opposite effect. The negative effect of stocks of external debt liabilities on TFP is partially attenuated in economies with better-developed financial markets and better institutional quality.
Why does financial openness—when measured by capital account openness or the stock of FDI and portfolio equity liabilities—have a significant positive effect on TFP growth, while the existing literature suggests that the effect of financial openness on output growth is not at all robust? (Obstfeld, 2008, highlights this conundrum). There are several possible reasons for this finding. First, the timing of the adjustment of TFP and output to greater financial integration may be different. TFP growth is often associated with the introduction of new technologies. If these are general-purpose technologies simultaneously affecting a number of sectors, they could result in an increase in the rate of obsolescence of both physical and human capital. This could potentially slow down the growth rate of output in the short run, offsetting the growth-enhancing effects of TFP (Aghion and Howitt, 1998).
Second, financial openness might influence the reallocation of outputs and inputs across individual producers. By affecting the return to capital, financial openness could lead to changes in the entry and exit decisions of firms/plants. To the extent that this does not have a negative effect on net entry, aggregate factor productivity will increase because new plants are more productive than exiting plants.22 This reallocation from less productive to more productive plants would ultimately increase total factor productivity with no significant gains in employment. These productivity gains would increase over longer horizons since there could be additional gains from both learning and selection effects over longer periods. Third, there could be some adjustment costs that delay the realization of the positive effects of TFP on output growth in developing countries. As the adjustment of the capital stock to new technologies is completed, these effects are expected to disappear making the impact of financial openness on economic growth in the long run more visible. In light of the short history of the recent wave of financial globalization, which began in earnest only in the mid-1980s, perhaps it is easier to detect its positive effects on TFP growth than on output growth.
22 Foster, Haltiwanger, and Krizan (2001) study the contribution of the reallocation activity across individual producers in accounting for aggregate productivity growth.
20
The results in this paper point to a large and unfinished research agenda. One issue is to delineate more clearly the specific channels through which financial openness boosts productivity growth—these could include technological spillovers, higher efficiency due to increased competition, and improved corporate governance. A second issue is to investigate in more depth why de jure capital account openness delivers TFP growth benefits while de facto openness fails to do so. We have suggested some possible explanations but this issue remains to be conclusively resolved, especially since de facto openness seems to be more closely tied to GDP growth benefits than de jure openness.
Another important issue is to understand better why some economies seem to attain larger productivity gains from financial openness. Our results suggest that this depends on the nature of financial flows and also on domestic financial and institutional development. Interestingly, even when we control for these domestic variables, the level of financial integration itself seems to make a difference--economies with higher levels of integration have higher marginal benefits from additional integration. There seem to be a variety of complex interactions among international financial integration and domestic financial sector development. Pursuing this issue in detail is beyond the scope of this paper and we leave it for future work.
In summary, our analysis using macroeconomic data bolsters the microeconomic evidence (based on firm- or industry-level data) that financial integration, especially if it takes the form of FDI or portfolio equity flows, leads to significant gains in efficiency and TFP growth. Moreover, in tandem with the recent literature showing that TFP growth rather than factor accumulation is the key driver of long-term growth, our results suggest that—despite all the skepticism surrounding it and despite all of the potential costs and risks associated with it—capital account liberalization deserves another careful look.
21
21
Table 1. Sample Statistics: Median Values by Country Group (Percent of GDP, unless otherwise indicated)
More Financially Open Economies (MFO)Real GDP per worker (% change) 1.45 1.12 1.55 1.27 1.55 1.64 1.56 1.61 1.32 1.61Total Factor Productivity (% change) 0.55 0.07 0.66 0.07 0.63 0.55 0.32 0.59 0.07 0.56Financial Openness
De Jure 0.33 0.00 0.55 0.00 0.55 0.51 0.35 0.65 0.35 0.68Assets & Liabilities 137.02 88.70 166.35 86.66 166.35 120.73 71.11 157.42 67.41 157.42Assets 38.30 24.20 47.08 20.07 42.68 45.20 21.54 61.38 21.54 57.83
FDI & Equity 3.13 0.75 4.88 0.30 4.88 9.28 1.57 15.74 1.20 13.84Debt 16.10 11.63 20.12 10.14 19.89 23.23 13.08 34.21 11.63 30.76
Liabilities 91.62 64.33 121.49 64.33 121.49 78.38 44.60 98.15 44.60 98.15FDI & Equity 24.20 11.37 33.04 14.00 35.00 19.51 8.47 25.66 8.52 25.56Debt 66.10 46.58 82.57 46.58 82.57 52.25 33.85 63.51 33.85 63.51
Less Financially Open Economies (LFO)Real GDP per worker (% change) 1.64 2.15 1.54 2.14 1.42 1.39 1.63 1.00 2.35 1.10Total Factor Productivity (% change) 0.36 0.40 0.22 0.40 0.27 0.33 0.15 0.34 0.49 0.47Financial Openness
De Jure 0.20 0.00 0.11 0.00 0.20 0.00 0.00 0.00 0.00 0.00Assets & Liabilities 69.00 45.64 88.07 45.64 88.07 81.12 55.43 106.49 57.24 106.95Assets 21.40 12.26 26.55 14.30 27.71 19.11 12.21 23.12 15.15 25.15
FDI & Equity 1.48 0.29 2.14 0.41 2.03 1.05 0.14 1.87 0.15 2.02Debt 8.96 5.43 11.62 5.82 12.08 9.68 5.43 11.62 7.16 11.28
Liabilities 51.28 30.76 63.47 30.43 63.47 57.97 46.06 76.04 46.06 76.72FDI & Equity 11.97 5.14 14.95 4.91 14.95 12.76 6.51 17.08 6.42 17.51Debt 36.34 23.33 48.99 23.59 48.80 46.67 34.93 51.21 34.93 51.21
1966-1985 1986-20051986-2005 1966-2005 1966-1985 1986-20051966-2005 1966-1985 1986-2005 1966-1985
De Facto De Jure
Constant sample1 Changing sample2 Constant sample3 Changing sample4
1. A de facto measure (the ratio of the stock of external liabilities to GDP) is used to define MFO and LFO economies for the full sample (1966-2005). 2. A de facto measure (the ratio of the stock of external liabilities to GDP) is used to define MFO and LFO economies for each sub-period (1966-1985, 1986-2005). 3. A de jure measure (Schindler, 2007) is used to define MFO and LFO economies for the full sample (1966-2005). 4. A de jure measure (Schindler, 2007) is used to define MFO and LFO economies for each sub-period (1966-1985, 1986-2005).
22
22
Table 2. Financial Openness and TFP Growth: Cross-Section Regressions (Dependent variable -- TFP growth)
(1) (2) (3) (4) (5) (6) (7) (8)
Initial TFP (in logs) -0.01883*** -0.01821*** -0.01934*** -0.01873*** -0.01895*** -0.01891*** -0.01823*** -0.01849***[0.00208] [0.00211] [0.00197] [0.00210] [0.00204] [0.00205] [0.00214] [0.00210]
Trade Openness (% GDP) -0.00001 0.00000 0.00007 0.00002 0.00005 0.00007 0.00002 0.00004[0.00007] [0.00007] [0.00007] [0.00007] [0.00007] [0.00007] [0.00008] [0.00007]
Terms of Trade (% Change) 0.00129** 0.00131** 0.00114* 0.00130** 0.00123** 0.00117** 0.00132** 0.00126**[0.00063] [0.00061] [0.00058] [0.00063] [0.00060] [0.00058] [0.00061] [0.00059]
Population Growth -0.00449*** -0.00458*** -0.00482*** -0.00469*** -0.00480*** -0.00483*** -0.00471*** -0.00480***[0.00124] [0.00130] [0.00120] [0.00128] [0.00123] [0.00123] [0.00133] [0.00127]
Private Sector Credit (% GDP) 0.00005 0.00006 0.00005 0.00007 0.00006 0.00006 0.00007* 0.00007*[0.00004] [0.00004] [0.00004] [0.00004] [0.00004] [0.00004] [0.00004] [0.00004]
Institutional Quality 0.00067** 0.00068** 0.00071** 0.00069** 0.00070** 0.00071** 0.00069** 0.00070**[0.00032] [0.00032] [0.00032] [0.00033] [0.00032] [0.00032] [0.00033] [0.00033]
Capital Account Openness (de jure) -0.00396 -0.00229 -0.00345 -0.00281[0.00292] [0.00305] [0.00307] [0.00307]
Total Liabilities (% GDP) -0.00004 -0.00003[0.00003] [0.00003]
Total Assets (% GDP) -0.00002 -0.00001[0.00002] [0.00002]
Total Liabilities + Assets (% GDP) -0.00002 -0.00001[0.00001] [0.00001]
R-squared 0.643 0.651 0.659 0.647 0.654 0.662 0.653 0.657Observations 67 67 67 67 67 67 67 67
OLS
Note: The dependent variable is the average annual growth rate of TFP over the full sample period, 1966-2005. Total liabilities and assets refer to gross external liabilities and assets, respectively. Robust standard errors are reported in brackets. The symbols *, ** and *** indicate statistical significance at the 10%, 5% and 1%, levels, respectively.
23
Table 3. Financial Openness and TFP Growth: Panel Regressions (Dependent variable -- TFP growth; ten-year panel)
(1) (2) (3) (4) (1) (2) (3) (4)
Initial TFP (in logs) -0.61287*** -0.61490*** -0.61065*** -0.61220*** -0.38540** -0.23962* -0.36105** -0.27305**[0.08458] [0.08493] [0.08610] [0.08596] [0.16861] [0.12245] [0.15379] [0.12840]
Trade Openness (% GDP) 0.00498** 0.00531** 0.00452** 0.00486** 0.00175 0.00045 0.00146 0.00109[0.00215] [0.00227] [0.00215] [0.00220] [0.00209] [0.00227] [0.00219] [0.00250]
Terms of Trade (% Change) 0.00177 0.00173 0.00196 0.00180 0.00255 0.00404 0.00292 0.00365[0.00436] [0.00435] [0.00436] [0.00440] [0.00746] [0.00696] [0.00745] [0.00679]
Population Growth -0.02407 -0.01742 -0.03441 -0.02662 -0.06310 -0.06925 -0.05737 -0.06107[0.04098] [0.04575] [0.04570] [0.04586] [0.05113] [0.05004] [0.04971] [0.04730]
Private Sector Credit (% GDP) 0.00116** 0.00124** 0.00100* 0.00112* 0.00251** 0.00261** 0.00293*** 0.00311***[0.00054] [0.00060] [0.00055] [0.00057] [0.00102] [0.00100] [0.00108] [0.00100]
Institutional Quality -0.00421 -0.00451 -0.00330 -0.00404 -0.01252 -0.01363 -0.01307 -0.01484[0.00619] [0.00636] [0.00616] [0.00628] [0.01149] [0.01140] [0.01163] [0.01095]
Capital Account Openness (de jure) 0.07373** 0.07571** 0.06735* 0.07258** 0.15476** 0.10896** 0.14777** 0.12083**[0.03547] [0.03555] [0.03550] [0.03516] [0.06056] [0.04984] [0.06009] [0.05300]
Total Liabilities (% GDP) -0.00017 -0.00031[0.00037] [0.00058]
Total Assets (% GDP) 0.00028 -0.00027[0.00019] [0.00039]
Total Liabilities + Assets (% GDP) 0.00003 -0.00028[0.00013] [0.00024]
R squared 0.674 0.674 0.676 0.674Countries 67 67 67 67Observations 252 252 252 252 252 252 252 252
Specification Tests (p-value)Hansen Test of Overidentification 0.211 0.331 0.346 0.4642nd Order Correlation 0.178 0.168 0.177 0.172Number of Instruments 18 20 20 20
FE System GMM
Note: The dependent variable is the growth rate of TFP over each 10 year period. Total liabilities and assets refer to gross external liabilities and assets, respectively. Robust standard errors are reported in brackets. The symbols *, ** and *** indicate statistical significance at the 10%, 5% and 1%, levels, respectively. All regressions include time dummies.
24
Table 4. Does the Composition of External Liabilities Matter? (Dependent variable -- TFP growth; ten-year panel)
FE System GMM FE System GMM FE System GMM
Initial TFP (in logs) -0.62192*** -0.40691*** -0.62104*** -0.39140*** -0.63541*** -0.25950**[0.08526] [0.11832] [0.08417] [0.12317] [0.08321] [0.11885]
Trade Openness (% GDP) 0.00482* 0.00245 0.00465* 0.00125 0.00519** 0.00088[0.00251] [0.00185] [0.00260] [0.00134] [0.00250] [0.00150]
Terms of Trade (% Change) 0.00176 0.00184 0.00268 -0.00121 0.00218 -0.00562[0.00426] [0.00722] [0.00385] [0.00724] [0.00386] [0.00798]
Population Growth -0.00869 -0.10333*** -0.00497 -0.09451*** -0.00914 -0.05474[0.04369] [0.03124] [0.04290] [0.03192] [0.04371] [0.04614]
Private Sector Credit (% GDP) 0.00101* 0.00180* 0.00064 0.00128 0.00042 0.00065[0.00058] [0.00093] [0.00063] [0.00092] [0.00060] [0.00094]
Institutional Quality -0.00275 -0.00938 -0.00261 -0.01273 0.00188 -0.00973[0.00693] [0.00972] [0.00708] [0.00877] [0.00708] [0.00995]
Capital Account Openness (de jure) 0.05249 0.08216* 0.03685 0.04967 0.02837 0.03830[0.03849] [0.04638] [0.03741] [0.04595] [0.04312] [0.05047]
FDI & Equity Liabilities (% GDP) 0.00201*** 0.00379** -0.00141 0.00607*** 0.00022 0.00695***[0.00066] [0.00161] [0.00190] [0.00220] [0.00246] [0.00207]
Debt Liabilities (% GDP) -0.00178** -0.00247** -0.00229* -0.00383*** -0.00305** -0.00378***[0.00069] [0.00096] [0.00122] [0.00117] [0.00116] [0.00087]
0.00361* -0.00332[0.00196] [0.00228]
0.00033 0.00261**[0.00131] [0.00113]
0.00101 -0.00640***[0.00240] [0.00223]
0.00226* 0.00392***[0.00120] [0.00120]
R squared 0.702 0.710 0.715Countries 67 67 67Observations 248 248 248 248 248 248
Specification Tests (p-value)Hansen Test of Overidentification 0.470 0.849 0.2952nd Order Correlation 0.126 0.253 0.248Number of Instruments 23 26 26
Institutional Quality * FDI & Equity Liabilities
Institutional Quality * Debt Liabilities
Private Sector Credit * FDI & Equity Liabilities
Private Sector Credit * Debt Liabilities
Note: The dependent variable is the growth rate of TFP over each 10 year period. Total liabilities refer to gross external liabilities. FDI and equity liabilities are the sum of gross FDI and gross portfolio equity liabilities. Debt liabilities are gross external debt liabilities, including sovereign and portfolio debt. Robust standard errors are reported in brackets. The symbols *, ** and *** indicate statistical significance at the 10%, 5% and 1%, levels, respectively. All regressions include time dummies.
25
25
Table 5. Alternative Measures of TFP (Dependent variable -- TFP growth; ten-year panel)
FE System GMM FE System GMM FE System GMM FE System GMM
Initial TFP (in logs) -0.60149*** -0.59362*** -0.60872*** -0.55699*** -0.60672*** -0.66044*** -0.61106*** -0.61382***[0.08691] [0.11164] [0.08697] [0.10428] [0.08573] [0.13988] [0.08650] [0.12082]
Trade Openness (% GDP) 0.00518** -0.00043 0.00468* 0.00143 0.00501** -0.00720 0.00453* -0.00213[0.00230] [0.00380] [0.00254] [0.00335] [0.00228] [0.00723] [0.00251] [0.00561]
Terms of Trade (% Change) 0.00164 0.00635 0.00167 0.00305 0.00167 0.00460 0.00172 0.00260[0.00436] [0.00545] [0.00427] [0.00618] [0.00438] [0.00722] [0.00432] [0.00621]
Population Growth -0.01846 -0.12318** -0.00988 -0.12675** -0.02071 -0.20741** -0.01178 -0.21611***[0.04597] [0.05764] [0.04392] [0.05805] [0.04569] [0.09012] [0.04373] [0.07733]
Private Sector Credit (% GDP) 0.00127** 0.00592** 0.00104* 0.00399* 0.00122** 0.00442* 0.00099* 0.00371**[0.00061] [0.00256] [0.00059] [0.00234] [0.00060] [0.00241] [0.00058] [0.00184]
Institutional Quality -0.00469 0.00471 -0.00291 0.00892 -0.00488 0.02232 -0.00307 0.01893[0.00634] [0.01696] [0.00689] [0.01430] [0.00630] [0.01957] [0.00682] [0.01530]
Capital Account Openness (de jure) 0.07381** 0.15018*** 0.05094 0.06897 0.06975* 0.19215* 0.04715 0.10460[0.03567] [0.04906] [0.03863] [0.05542] [0.03509] [0.10779] [0.03765] [0.09572]
Total Liabilities (% GDP) -0.00017 -0.00014 -0.00010 0.00171[0.00037] [0.00151] [0.00037] [0.00107]
FDI & Equity Liabilities (% GDP) 0.00198*** 0.00492** 0.00203*** 0.00415*[0.00067] [0.00206] [0.00066] [0.00240]
Debt Liabilities (% GDP) -0.00175** -0.00259 -0.00167** 0.00003[0.00071] [0.00179] [0.00070] [0.00167]
R squared 0.674 0.700 0.682 0.706CountriesObservations 252 252 248 248 252 252 248 248Specification Tests (p-value)Hansen Test of Overidentification 0.237 0.549 0.334 0.7082nd Order Correlation 0.140 0.143 0.113 0.102Number of Instruments 26 28 22 25
Gollin Bernanke and Gurkaynak
Note: The dependent variable is the growth rate of TFP over each 10 year period. Total liabilities refer to gross external liabilities. FDI and equity liabilities are the sum of gross FDI and gross portfolio equity liabilities. Debt liabilities are gross external debt liabilities, including sovereign and portfolio debt. Robust standard errors are reported in brackets. The symbols *, ** and *** indicate statistical significance at the 10%, 5% and 1%, levels, respectively. All regressions include time dummies. The results in this table are based on TFP calculations that rely on capital share parameters taken from Gollin (2002) and Bernanke and Gurkaynak (2002), respectively.
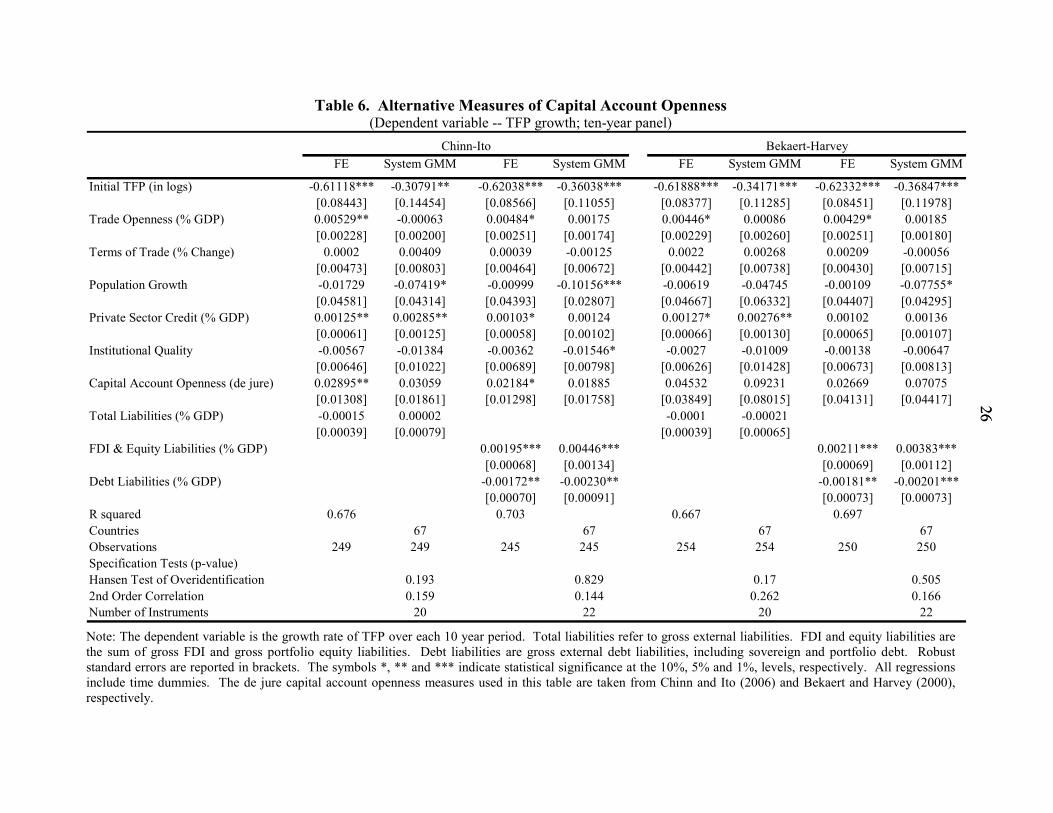
26
26
Table 6. Alternative Measures of Capital Account Openness (Dependent variable -- TFP growth; ten-year panel)
FE System GMM FE System GMM FE System GMM FE System GMM
Initial TFP (in logs) -0.61118*** -0.30791** -0.62038*** -0.36038*** -0.61888*** -0.34171*** -0.62332*** -0.36847***[0.08443] [0.14454] [0.08566] [0.11055] [0.08377] [0.11285] [0.08451] [0.11978]
Trade Openness (% GDP) 0.00529** -0.00063 0.00484* 0.00175 0.00446* 0.00086 0.00429* 0.00185[0.00228] [0.00200] [0.00251] [0.00174] [0.00229] [0.00260] [0.00251] [0.00180]
Terms of Trade (% Change) 0.0002 0.00409 0.00039 -0.00125 0.0022 0.00268 0.00209 -0.00056[0.00473] [0.00803] [0.00464] [0.00672] [0.00442] [0.00738] [0.00430] [0.00715]
Population Growth -0.01729 -0.07419* -0.00999 -0.10156*** -0.00619 -0.04745 -0.00109 -0.07755*[0.04581] [0.04314] [0.04393] [0.02807] [0.04667] [0.06332] [0.04407] [0.04295]
Private Sector Credit (% GDP) 0.00125** 0.00285** 0.00103* 0.00124 0.00127* 0.00276** 0.00102 0.00136[0.00061] [0.00125] [0.00058] [0.00102] [0.00066] [0.00130] [0.00065] [0.00107]
Institutional Quality -0.00567 -0.01384 -0.00362 -0.01546* -0.0027 -0.01009 -0.00138 -0.00647[0.00646] [0.01022] [0.00689] [0.00798] [0.00626] [0.01428] [0.00673] [0.00813]
Capital Account Openness (de jure) 0.02895** 0.03059 0.02184* 0.01885 0.04532 0.09231 0.02669 0.07075[0.01308] [0.01861] [0.01298] [0.01758] [0.03849] [0.08015] [0.04131] [0.04417]
Total Liabilities (% GDP) -0.00015 0.00002 -0.0001 -0.00021[0.00039] [0.00079] [0.00039] [0.00065]
FDI & Equity Liabilities (% GDP) 0.00195*** 0.00446*** 0.00211*** 0.00383***[0.00068] [0.00134] [0.00069] [0.00112]
Debt Liabilities (% GDP) -0.00172** -0.00230** -0.00181** -0.00201***[0.00070] [0.00091] [0.00073] [0.00073]
R squared 0.676 0.703 0.667 0.697Countries 67 67 67 67Observations 249 249 245 245 254 254 250 250Specification Tests (p-value)Hansen Test of Overidentification 0.193 0.829 0.17 0.5052nd Order Correlation 0.159 0.144 0.262 0.166Number of Instruments 20 22 20 22
Chinn-Ito Bekaert-Harvey
Note: The dependent variable is the growth rate of TFP over each 10 year period. Total liabilities refer to gross external liabilities. FDI and equity liabilities are the sum of gross FDI and gross portfolio equity liabilities. Debt liabilities are gross external debt liabilities, including sovereign and portfolio debt. Robust standard errors are reported in brackets. The symbols *, ** and *** indicate statistical significance at the 10%, 5% and 1%, levels, respectively. All regressions include time dummies. The de jure capital account openness measures used in this table are taken from Chinn and Ito (2006) and Bekaert and Harvey (2000), respectively.
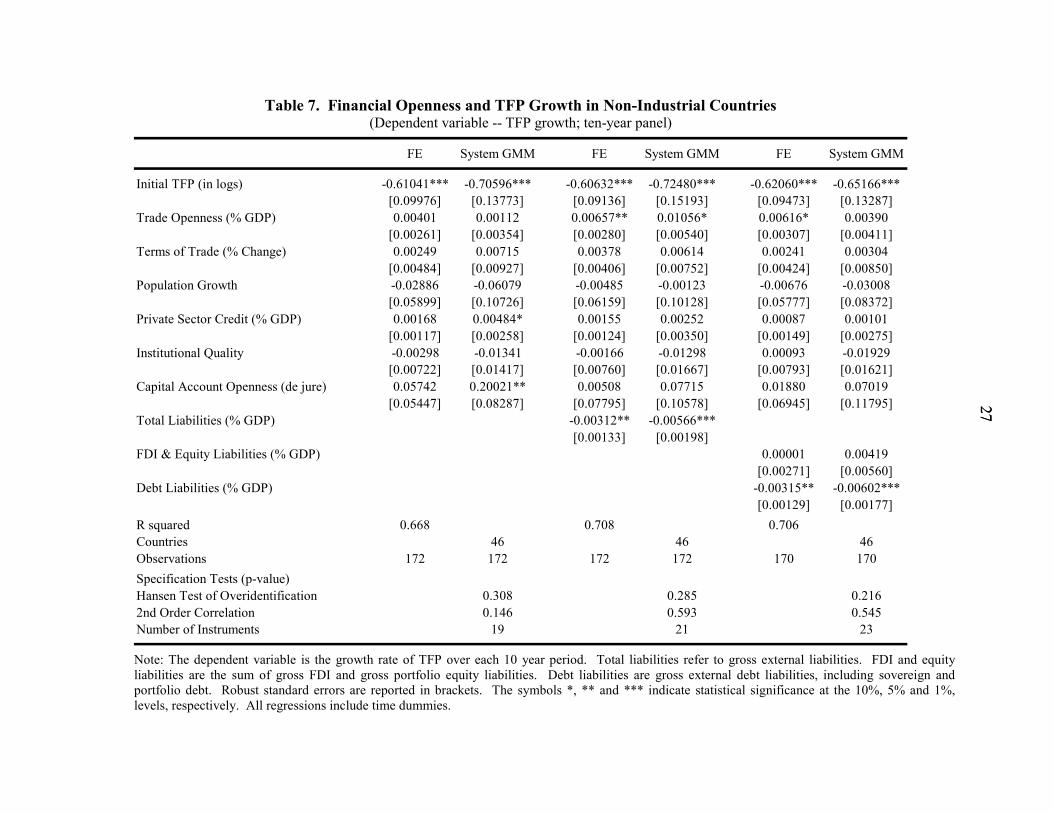
27
27
Table 7. Financial Openness and TFP Growth in Non-Industrial Countries (Dependent variable -- TFP growth; ten-year panel)
FE System GMM FE System GMM FE System GMM
Initial TFP (in logs) -0.61041*** -0.70596*** -0.60632*** -0.72480*** -0.62060*** -0.65166***[0.09976] [0.13773] [0.09136] [0.15193] [0.09473] [0.13287]
Trade Openness (% GDP) 0.00401 0.00112 0.00657** 0.01056* 0.00616* 0.00390[0.00261] [0.00354] [0.00280] [0.00540] [0.00307] [0.00411]
Terms of Trade (% Change) 0.00249 0.00715 0.00378 0.00614 0.00241 0.00304[0.00484] [0.00927] [0.00406] [0.00752] [0.00424] [0.00850]
Population Growth -0.02886 -0.06079 -0.00485 -0.00123 -0.00676 -0.03008[0.05899] [0.10726] [0.06159] [0.10128] [0.05777] [0.08372]
Private Sector Credit (% GDP) 0.00168 0.00484* 0.00155 0.00252 0.00087 0.00101[0.00117] [0.00258] [0.00124] [0.00350] [0.00149] [0.00275]
Institutional Quality -0.00298 -0.01341 -0.00166 -0.01298 0.00093 -0.01929[0.00722] [0.01417] [0.00760] [0.01667] [0.00793] [0.01621]
Capital Account Openness (de jure) 0.05742 0.20021** 0.00508 0.07715 0.01880 0.07019[0.05447] [0.08287] [0.07795] [0.10578] [0.06945] [0.11795]
Total Liabilities (% GDP) -0.00312** -0.00566***[0.00133] [0.00198]
FDI & Equity Liabilities (% GDP) 0.00001 0.00419[0.00271] [0.00560]
Debt Liabilities (% GDP) -0.00315** -0.00602***[0.00129] [0.00177]
R squared 0.668 0.708 0.706Countries 46 46 46Observations 172 172 172 172 170 170Specification Tests (p-value)Hansen Test of Overidentification 0.308 0.285 0.2162nd Order Correlation 0.146 0.593 0.545Number of Instruments 19 21 23
Note: The dependent variable is the growth rate of TFP over each 10 year period. Total liabilities refer to gross external liabilities. FDI and equity
liabilities are the sum of gross FDI and gross portfolio equity liabilities. Debt liabilities are gross external debt liabilities, including sovereign and portfolio debt. Robust standard errors are reported in brackets. The symbols *, ** and *** indicate statistical significance at the 10%, 5% and 1%, levels, respectively. All regressions include time dummies.
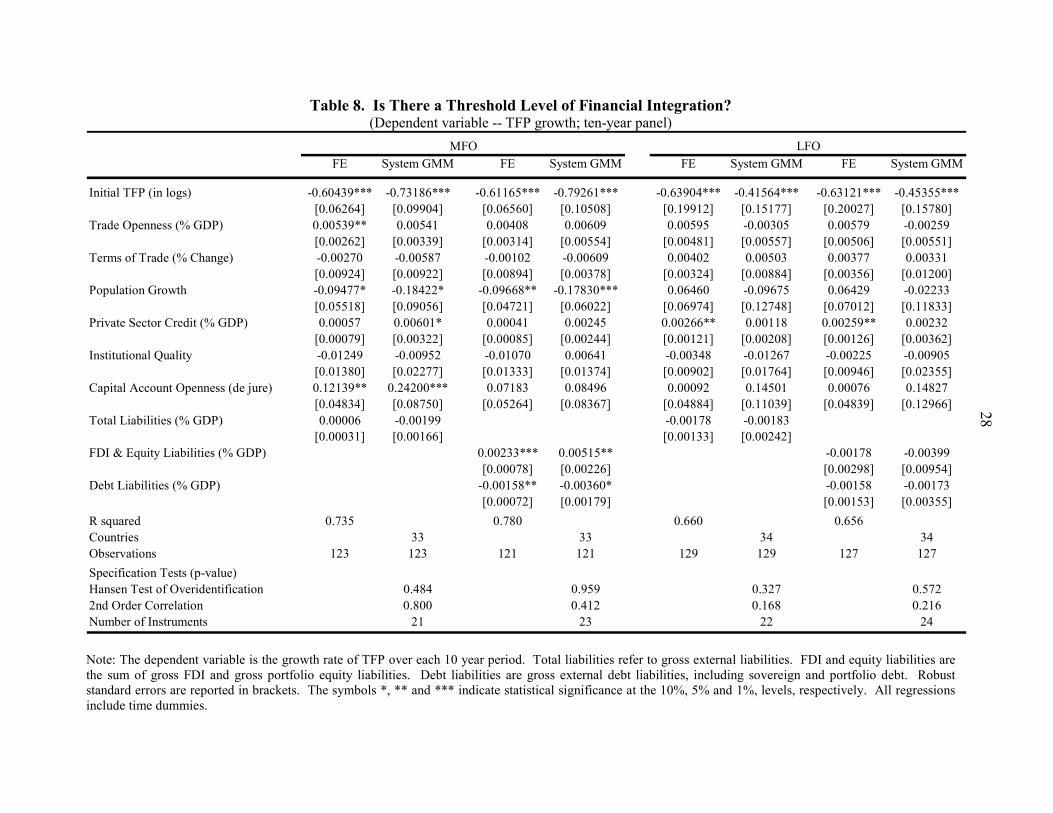
28
Table 8. Is There a Threshold Level of Financial Integration? (Dependent variable -- TFP growth; ten-year panel)
FE System GMM FE System GMM FE System GMM FE System GMM
Initial TFP (in logs) -0.60439*** -0.73186*** -0.61165*** -0.79261*** -0.63904*** -0.41564*** -0.63121*** -0.45355***[0.06264] [0.09904] [0.06560] [0.10508] [0.19912] [0.15177] [0.20027] [0.15780]
Trade Openness (% GDP) 0.00539** 0.00541 0.00408 0.00609 0.00595 -0.00305 0.00579 -0.00259[0.00262] [0.00339] [0.00314] [0.00554] [0.00481] [0.00557] [0.00506] [0.00551]
Terms of Trade (% Change) -0.00270 -0.00587 -0.00102 -0.00609 0.00402 0.00503 0.00377 0.00331[0.00924] [0.00922] [0.00894] [0.00378] [0.00324] [0.00884] [0.00356] [0.01200]
Population Growth -0.09477* -0.18422* -0.09668** -0.17830*** 0.06460 -0.09675 0.06429 -0.02233[0.05518] [0.09056] [0.04721] [0.06022] [0.06974] [0.12748] [0.07012] [0.11833]
Private Sector Credit (% GDP) 0.00057 0.00601* 0.00041 0.00245 0.00266** 0.00118 0.00259** 0.00232[0.00079] [0.00322] [0.00085] [0.00244] [0.00121] [0.00208] [0.00126] [0.00362]
Institutional Quality -0.01249 -0.00952 -0.01070 0.00641 -0.00348 -0.01267 -0.00225 -0.00905[0.01380] [0.02277] [0.01333] [0.01374] [0.00902] [0.01764] [0.00946] [0.02355]
Capital Account Openness (de jure) 0.12139** 0.24200*** 0.07183 0.08496 0.00092 0.14501 0.00076 0.14827[0.04834] [0.08750] [0.05264] [0.08367] [0.04884] [0.11039] [0.04839] [0.12966]
Total Liabilities (% GDP) 0.00006 -0.00199 -0.00178 -0.00183[0.00031] [0.00166] [0.00133] [0.00242]
FDI & Equity Liabilities (% GDP) 0.00233*** 0.00515** -0.00178 -0.00399[0.00078] [0.00226] [0.00298] [0.00954]
Debt Liabilities (% GDP) -0.00158** -0.00360* -0.00158 -0.00173[0.00072] [0.00179] [0.00153] [0.00355]
R squared 0.735 0.780 0.660 0.656Countries 33 33 34 34Observations 123 123 121 121 129 129 127 127Specification Tests (p-value)Hansen Test of Overidentification 0.484 0.959 0.327 0.5722nd Order Correlation 0.800 0.412 0.168 0.216Number of Instruments 21 23 22 24
MFO LFO
Note: The dependent variable is the growth rate of TFP over each 10 year period. Total liabilities refer to gross external liabilities. FDI and equity liabilities are the sum of gross FDI and gross portfolio equity liabilities. Debt liabilities are gross external debt liabilities, including sovereign and portfolio debt. Robust standard errors are reported in brackets. The symbols *, ** and *** indicate statistical significance at the 10%, 5% and 1%, levels, respectively. All regressions include time dummies.
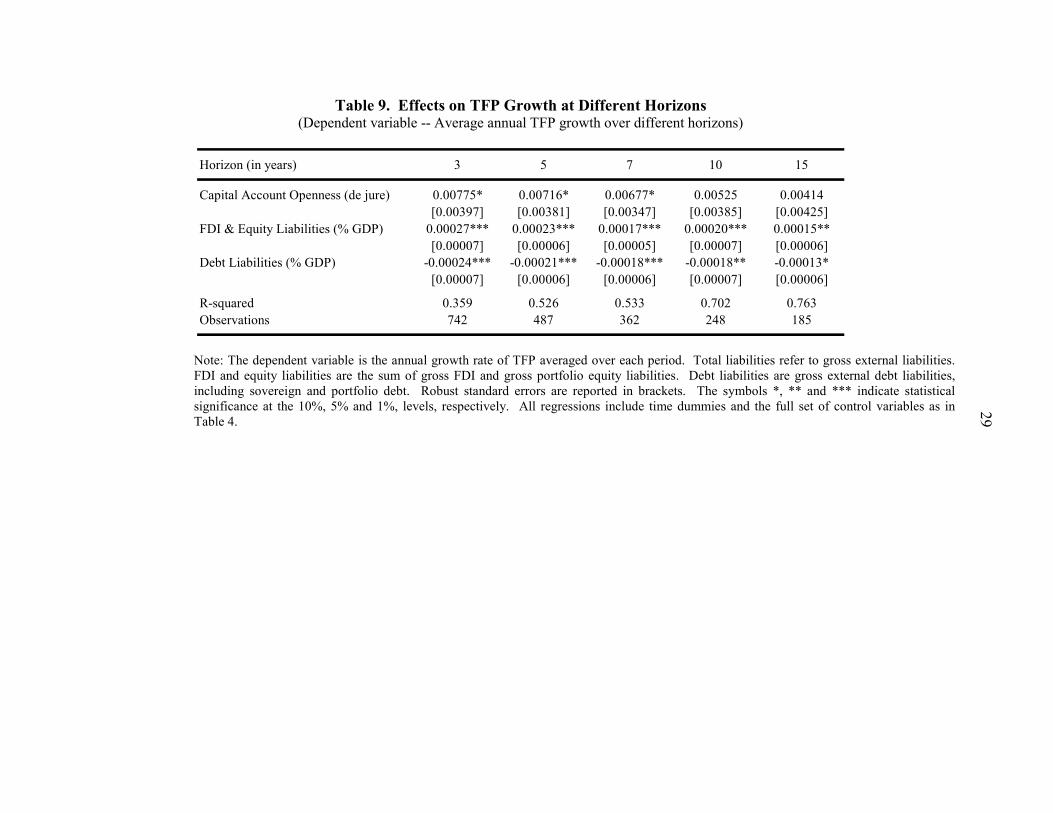
29
Table 9. Effects on TFP Growth at Different Horizons (Dependent variable -- Average annual TFP growth over different horizons)
Horizon (in years) 3 5 7 10 15
Capital Account Openness (de jure) 0.00775* 0.00716* 0.00677* 0.00525 0.00414[0.00397] [0.00381] [0.00347] [0.00385] [0.00425]
FDI & Equity Liabilities (% GDP) 0.00027*** 0.00023*** 0.00017*** 0.00020*** 0.00015**[0.00007] [0.00006] [0.00005] [0.00007] [0.00006]
Debt Liabilities (% GDP) -0.00024*** -0.00021*** -0.00018*** -0.00018** -0.00013*[0.00007] [0.00006] [0.00006] [0.00007] [0.00006]
R-squared 0.359 0.526 0.533 0.702 0.763Observations 742 487 362 248 185
Note: The dependent variable is the annual growth rate of TFP averaged over each period. Total liabilities refer to gross external liabilities.
FDI and equity liabilities are the sum of gross FDI and gross portfolio equity liabilities. Debt liabilities are gross external debt liabilities, including sovereign and portfolio debt. Robust standard errors are reported in brackets. The symbols *, ** and *** indicate statistical significance at the 10%, 5% and 1%, levels, respectively. All regressions include time dummies and the full set of control variables as in Table 4.
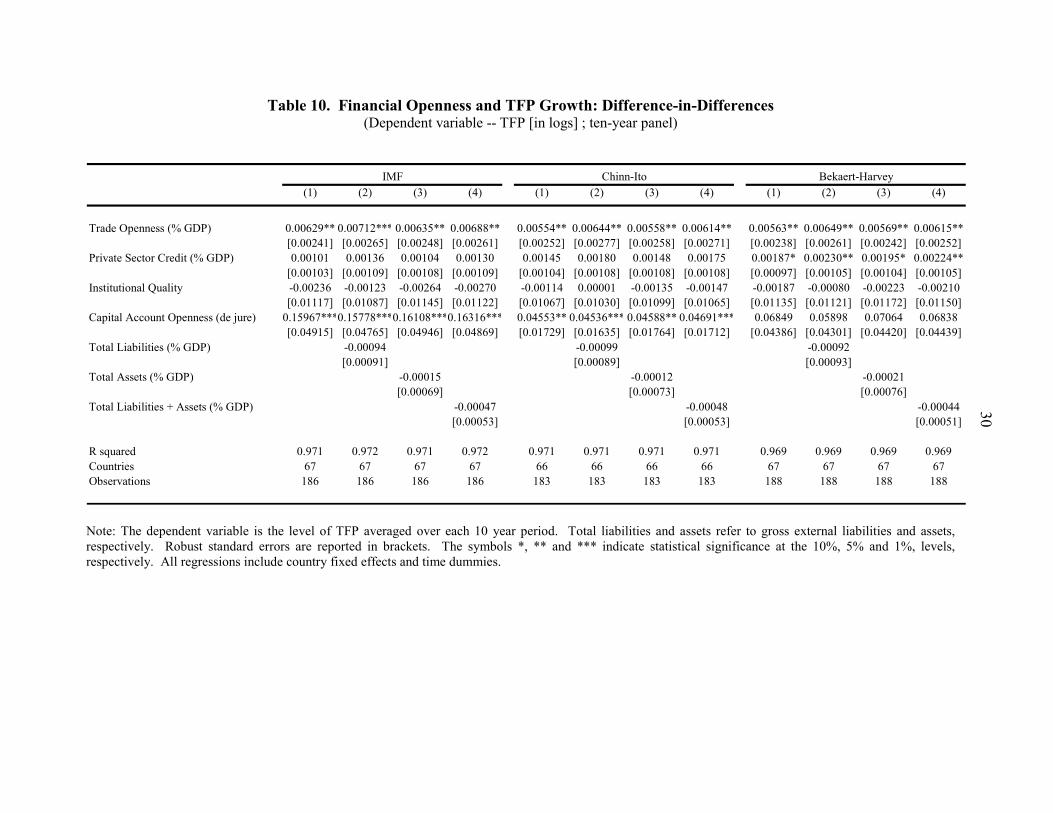
30
Table 10. Financial Openness and TFP Growth: Difference-in-Differences (Dependent variable -- TFP [in logs] ; ten-year panel)
(1) (2) (3) (4) (1) (2) (3) (4) (1) (2) (3) (4)
Trade Openness (% GDP) 0.00629** 0.00712*** 0.00635** 0.00688** 0.00554** 0.00644** 0.00558** 0.00614** 0.00563** 0.00649** 0.00569** 0.00615**[0.00241] [0.00265] [0.00248] [0.00261] [0.00252] [0.00277] [0.00258] [0.00271] [0.00238] [0.00261] [0.00242] [0.00252]
Private Sector Credit (% GDP) 0.00101 0.00136 0.00104 0.00130 0.00145 0.00180 0.00148 0.00175 0.00187* 0.00230** 0.00195* 0.00224**[0.00103] [0.00109] [0.00108] [0.00109] [0.00104] [0.00108] [0.00108] [0.00108] [0.00097] [0.00105] [0.00104] [0.00105]
Institutional Quality -0.00236 -0.00123 -0.00264 -0.00270 -0.00114 0.00001 -0.00135 -0.00147 -0.00187 -0.00080 -0.00223 -0.00210[0.01117] [0.01087] [0.01145] [0.01122] [0.01067] [0.01030] [0.01099] [0.01065] [0.01135] [0.01121] [0.01172] [0.01150]
Capital Account Openness (de jure) 0.15967***0.15778***0.16108***0.16316*** 0.04553** 0.04536*** 0.04588** 0.04691*** 0.06849 0.05898 0.07064 0.06838[0.04915] [0.04765] [0.04946] [0.04869] [0.01729] [0.01635] [0.01764] [0.01712] [0.04386] [0.04301] [0.04420] [0.04439]
Total Liabilities (% GDP) -0.00094 -0.00099 -0.00092[0.00091] [0.00089] [0.00093]
Total Assets (% GDP) -0.00015 -0.00012 -0.00021[0.00069] [0.00073] [0.00076]
Total Liabilities + Assets (% GDP) -0.00047 -0.00048 -0.00044[0.00053] [0.00053] [0.00051]
R squared 0.971 0.972 0.971 0.972 0.971 0.971 0.971 0.971 0.969 0.969 0.969 0.969Countries 67 67 67 67 66 66 66 66 67 67 67 67Observations 186 186 186 186 183 183 183 183 188 188 188 188
IMF Chinn-Ito Bekaert-Harvey
Note: The dependent variable is the level of TFP averaged over each 10 year period. Total liabilities and assets refer to gross external liabilities and assets, respectively. Robust standard errors are reported in brackets. The symbols *, ** and *** indicate statistical significance at the 10%, 5% and 1%, levels, respectively. All regressions include country fixed effects and time dummies.
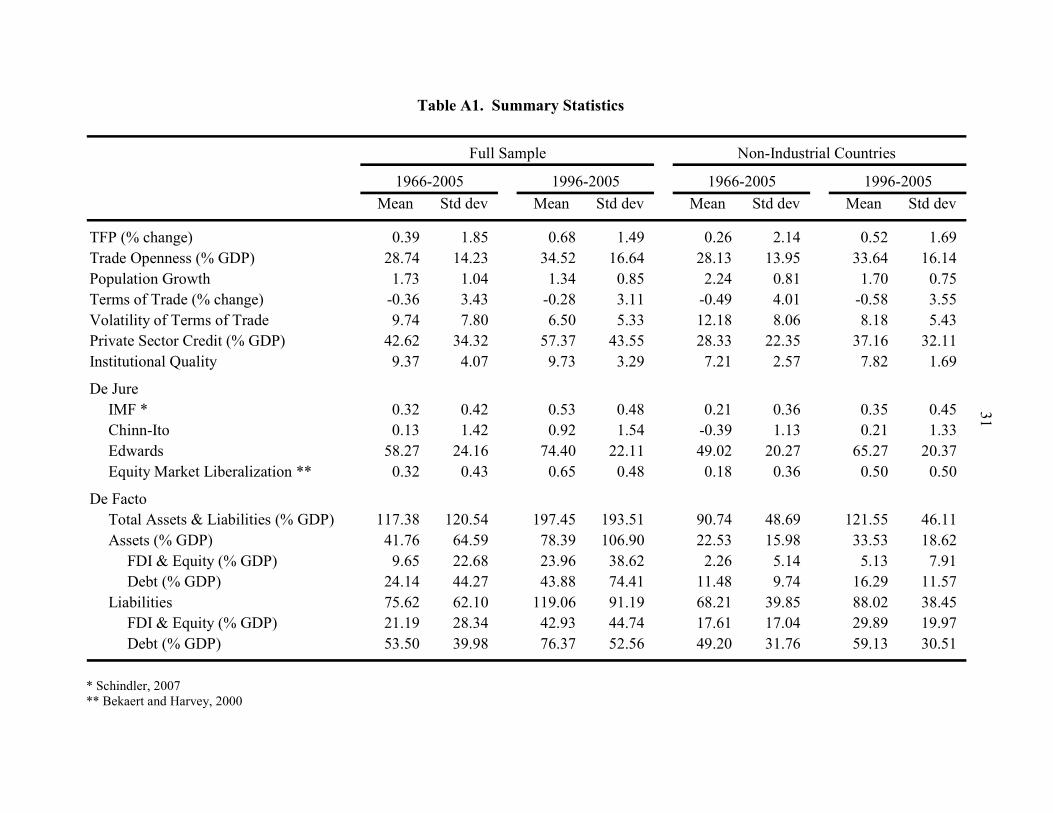
31
Table A1. Summary Statistics
TFP (% change) 0.39 1.85 0.68 1.49 0.26 2.14 0.52 1.69Trade Openness (% GDP) 28.74 14.23 34.52 16.64 28.13 13.95 33.64 16.14Population Growth 1.73 1.04 1.34 0.85 2.24 0.81 1.70 0.75Terms of Trade (% change) -0.36 3.43 -0.28 3.11 -0.49 4.01 -0.58 3.55Volatility of Terms of Trade 9.74 7.80 6.50 5.33 12.18 8.06 8.18 5.43Private Sector Credit (% GDP) 42.62 34.32 57.37 43.55 28.33 22.35 37.16 32.11Institutional Quality 9.37 4.07 9.73 3.29 7.21 2.57 7.82 1.69
De JureIMF * 0.32 0.42 0.53 0.48 0.21 0.36 0.35 0.45Chinn-Ito 0.13 1.42 0.92 1.54 -0.39 1.13 0.21 1.33Edwards 58.27 24.16 74.40 22.11 49.02 20.27 65.27 20.37Equity Market Liberalization ** 0.32 0.43 0.65 0.48 0.18 0.36 0.50 0.50
De FactoTotal Assets & Liabilities (% GDP) 117.38 120.54 197.45 193.51 90.74 48.69 121.55 46.11Assets (% GDP) 41.76 64.59 78.39 106.90 22.53 15.98 33.53 18.62
FDI & Equity (% GDP) 9.65 22.68 23.96 38.62 2.26 5.14 5.13 7.91Debt (% GDP) 24.14 44.27 43.88 74.41 11.48 9.74 16.29 11.57
Liabilities 75.62 62.10 119.06 91.19 68.21 39.85 88.02 38.45FDI & Equity (% GDP) 21.19 28.34 42.93 44.74 17.61 17.04 29.89 19.97Debt (% GDP) 53.50 39.98 76.37 52.56 49.20 31.76 59.13 30.51
Mean Std dev Mean Std devMean Std dev Mean Std dev
Full Sample Non-Industrial Countries
1966-2005 1996-2005 1966-2005 1996-2005
* Schindler, 2007 ** Bekaert and Harvey, 2000
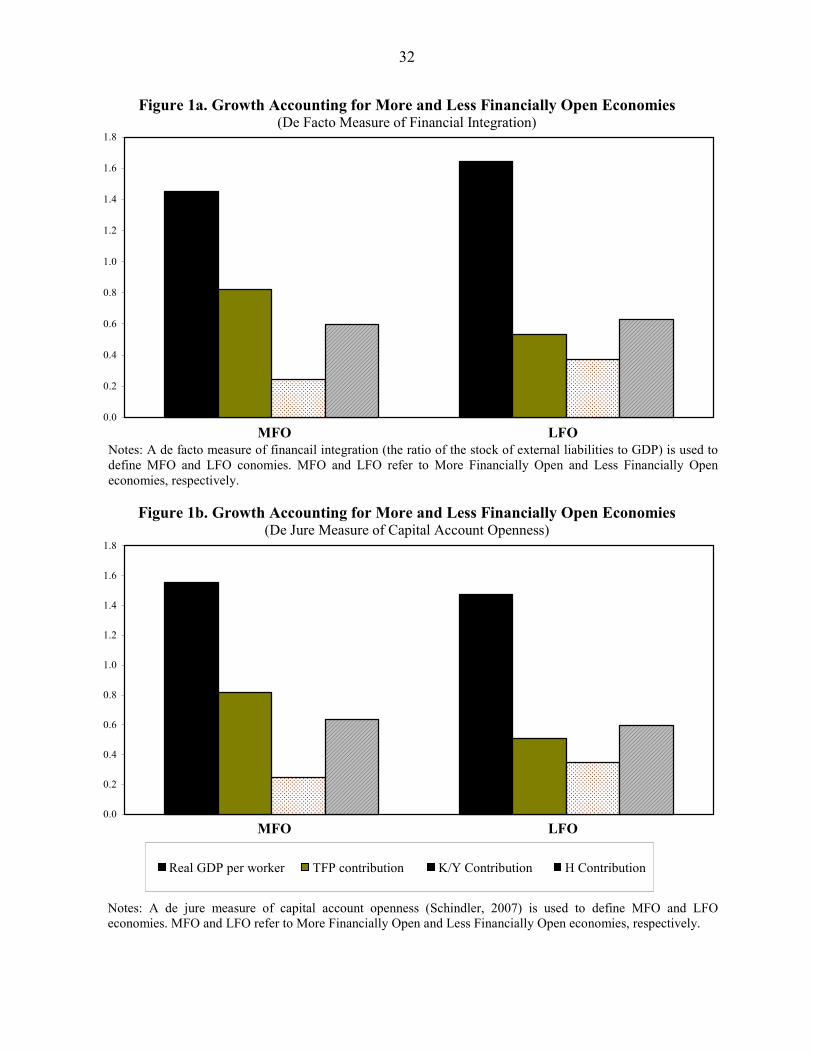
32
Figure 1a. Growth Accounting for More and Less Financially Open Economies (De Facto Measure of Financial Integration)
LFOMFO0.0
0.2
0.4
0.6
0.8
1.0
1.2
1.4
1.6
1.8
Notes: A de facto measure of financail integration (the ratio of the stock of external liabilities to GDP) is used to define MFO and LFO conomies. MFO and LFO refer to More Financially Open and Less Financially Open economies, respectively.
Figure 1b. Growth Accounting for More and Less Financially Open Economies (De Jure Measure of Capital Account Openness)
MFO LFO0.0
0.2
0.4
0.6
0.8
1.0
1.2
1.4
1.6
1.8
Notes: A de jure measure of capital account openness (Schindler, 2007) is used to define MFO and LFO
economies. MFO and LFO refer to More Financially Open and Less Financially Open economies, respectively.
Real GDP per worker TFP contribution K/Y Contribution H Contribution
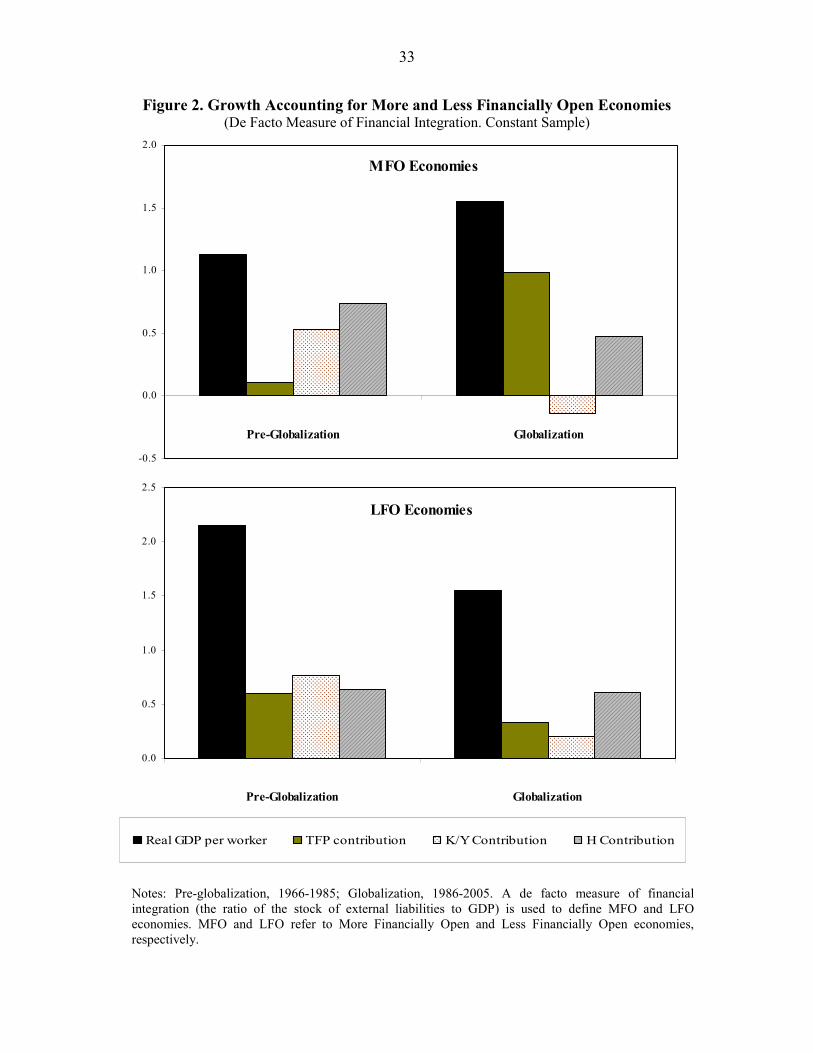
33
Figure 2. Growth Accounting for More and Less Financially Open Economies (De Facto Measure of Financial Integration. Constant Sample)
MFO Economies
-0.5
0.0
0.5
1.0
1.5
2.0
Pre-Globalization Globalization
LFO Economies
0.0
0.5
1.0
1.5
2.0
2.5
Pre-Globalization Globalization
Real GDP per worker TFP contribution K/Y Contribution H Contribution
Notes: Pre-globalization, 1966-1985; Globalization, 1986-2005. A de facto measure of financial
integration (the ratio of the stock of external liabilities to GDP) is used to define MFO and LFO economies. MFO and LFO refer to More Financially Open and Less Financially Open economies, respectively.
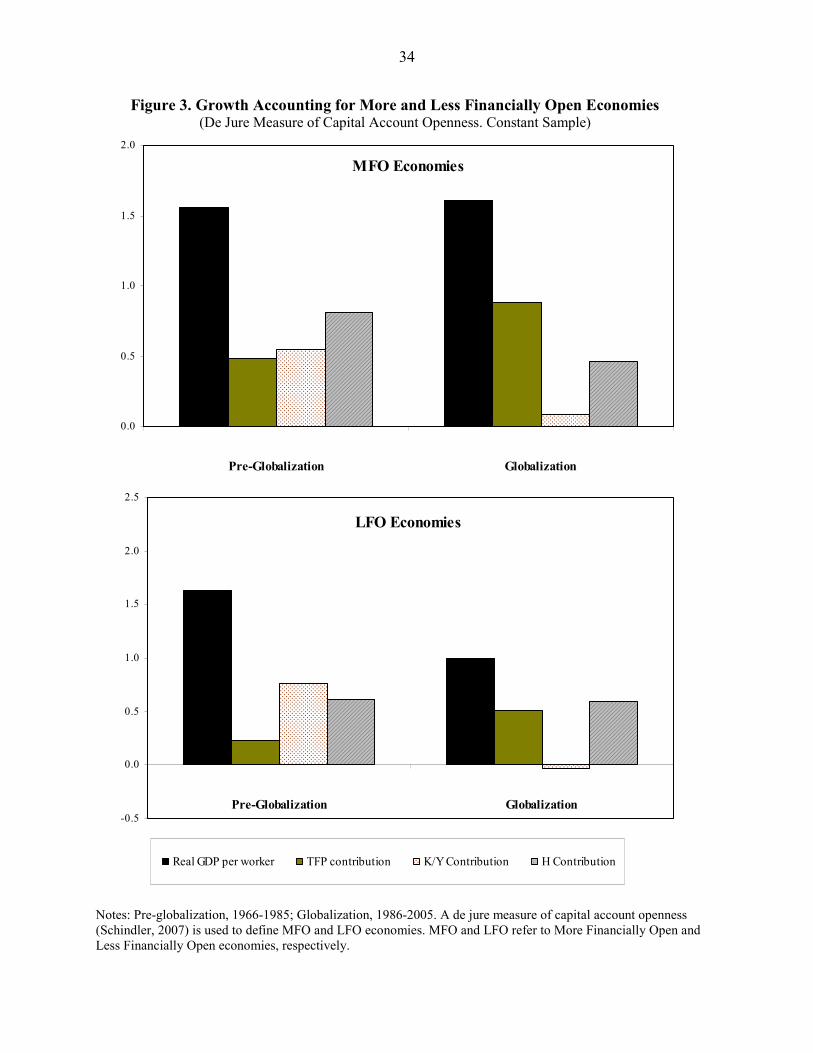
34
Figure 3. Growth Accounting for More and Less Financially Open Economies (De Jure Measure of Capital Account Openness. Constant Sample)
MFO Economies
0.0
0.5
1.0
1.5
2.0
Pre-Globalization Globalization
LFO Economies
-0.5
0.0
0.5
1.0
1.5
2.0
2.5
Pre-Globalization Globalization
Real GDP per worker TFP contribution K/Y Contribution H Contribution
Notes: Pre-globalization, 1966-1985; Globalization, 1986-2005. A de jure measure of capital account openness (Schindler, 2007) is used to define MFO and LFO economies. MFO and LFO refer to More Financially Open and Less Financially Open economies, respectively.
35
References
Aghion Philippe, and Peter Howitt, 1998, “Capital Accumulation and Innovation as Complementary Factors in Long-Run Growth,” Journal of Economic Growth, Vol. 3, pp. 111-130.
Aizenman, Joshua, and Ilan Noy, 2008, “Endogenous Financial and Trade Openness,” Review of International Economics, forthcoming.
Aizenman, Joshua, Brian Pinto and Arthur Radziwill, 2008, “Sources for Financing Domestic Capital--Is Foreign Saving a Viable Option for Developing Countries?” Journal of International Money and Finance, forthcoming.
Alcala, Francisco, and Antonio Ciccone, 2004, “Trade and Productivity,” Quarterly Journal of Economics, Vol. 119, No. 2, pp. 613-646.
Aoki, Kosuke, Gianluca Benigno and Nobuhiro Kiyotaki, 2005, “Adjusting to Capital Account Liberalization,” Working Paper, London School of Economics.
Arellano, Manuel, and Olympia Bover, 1995, “Another Look at the Instrumental Variable Estimation of Error-Correction Models,” Journal of Econometrics, Vol. 68, pp. 29-52.
Barro, Robert and Jong-Wha Lee, 2000, “International Data on Education Attainment: Updates and Implications,” NBER Working Paper No. 7911.
Bekaert, Geert, and Campbell R. Harvey, 2000, “Foreign Speculators and Emerging Equity Markets,” Journal of Finance, Vol. 55, No. 2, pp. 565–613.
Bekaert, Geert, Campbell R. Harvey and Christian Lundblad, 2005, “Does Financial Liberalization Spur Economic Growth,” Journal of Financial Economics, Vol. 77, pp. 3-55.
Benhabib, Jess, and Mark M. Spiegel, 2000, “The Role of Financial Development in Growth and Investment,” Journal of Economic Growth, Vol. 5, pp. 341-360.
Bernanke, Ben, and Refet Gurkaynak, 2002, “Is Growth Exogenous? Taking Mankiw, Romer and Weil Seriously,” NBER Macroeconomics Annual, Vol. 16, pp. 11-57.
Bhagwati, Jagdish, 1998, “The Capital Myth: The Difference between Trade in Widgets and Dollars,” Foreign Affairs, Vol. 7, No. 3, pp. 7-12.
Blundell, Richard, and Stephen Bond, 1998, “Initial Conditions and Moment Restrictions in Dynamic Panel Data Models,” Journal of Econometrics, Vol. 87, pp. 115-143.
Bond, Stephen R., Anke Hoeffler and Jonathan Temple, 2001, “GMM Estimation of Empirical Growth Models,” CEPR Working Paper No. 3048 (Centre for Economic Policy Research: London, UK).
Bonfiglioli, Alessandra, 2007, “Financial Integration, Productivity and Capital Accumulation,” Manuscript (Barcelona, Spain: Universitat Pompeu Fabra).
36
Borensztein, Eduardo, Jose De Gregorio, and Jong Wha-Lee, 1998, “How Does Foreign Direct Investment Affect Economic Growth,” Journal of International Economics, Vol. 45, No. 1, pp. 115-135.
Bosworth, Barry P., and Susan M. Collins, 2003, “The Empirics of Growth: An Update,” Brookings Papers on Economic Activity, 2003:2, pp. 113-206.
Caselli, Francesco, 2005, “Accounting for Cross-Country Income Differences.” in Handbook of Economic Growth, eds. Philippe Aghion and Steven Durlauf (The Netherlands: Elsevier Science), pp. 679-741.
Caselli, Francesco, and James Feyrer, 2007, “The Marginal Product of Capital,” Quarterly Journal of Economics, Vol. 122, No. 2, pp. 535-568.
Choe, Jong Il, 2003, “Do Foreign Direct Investment and Gross Domestic Investment Promote Economic Growth?” Review of Development Economics, Vol. 7, No. 1, pp. 44–57.
Chinn, Menzie, and Hiro Ito, 2006, “What Matters for Financial Development? Capital Controls, Institutions, and Interactions,” Journal of Development Economics, Vol. 61, No. 1, pp. 163-192.
Collins, Susan M., 2007, “Comments on “Financial Globalization, Growth, and Volatility in Developing Countries,” by Eswar Prasad, Kenneth Rogoff, Shang-Jin Wei, and M. Ayhan Kose,” in Globalization and Poverty, ed. Ann Harrison (Chicago, IL: University of Chicago Press).
de Mello, Luiz, 1999, “Foreign Direct Investment-Led Growth: Evidence from Time Series and Panel Data,” Oxford Economic Papers, Vol. 51, No. 1, pp. 133–51.
Easterly, William, and Ross Levine, 2001, “It’s Not Factor Accumulation: Stylized Facts and Growth Models,” World Bank Economic Review, Vol. 15, pp. 177–219.
Edwards, Sebastian, 2007, “Capital Controls, Sudden Stops and Current Account Reversals,” in International Capital Flows, ed. Sebastian Edwards (Chicago, IL: University of Chicago Press).
Fischer, Stanley, 1998, “Capital Account Liberalization and the Role of the IMF,” in Should the IMF Pursue Capital-Account Convertibility? Essays in International Finance 207, (Princeton, NJ: Princeton University), pp. 1–10.
Foster, Lucia, John Haltiwanger and C.J. Krizan, 2001, “Aggregate Productivity Growth: Lessons from Microeconomic Evidence,” in New Developments in Productivity Analysis, eds. Charles R. Hulten, Edwin R. Dean, and Michael J. Harper (Chicago, IL: University of Chicago Press).
Forbes, Kristin J., 2007, “The Microeconomic Evidence on Capital Controls: No Free Lunch,” in International Capital Flows, ed. Sebastian Edwards (Chicago, IL: University of Chicago Press).
Görg, Holger, and David Greenaway, 2004, “Much Ado about Nothing? Do Domestic Firms Really Benefit from Foreign Direct Investment?” World Bank Research Observer, Vol. 19, No. 2, pp. 171–97.
37
Gollin, Douglas, 2002, “Getting Income Shares Right,” Journal of Political Economy, Vol. 110, No. 2, pp. 458-474
Gourinchas, Pierre-Olivier, and Olivier Jeanne, 2006, “The Elusive Gains from International Financial Integration,” Review of Economic Studies, Vol. 73, No. 3, pp. 715-741.
———, 2007, “Capital Flows to Developing Countries: The Allocation Puzzle,” NBER Working Paper No. 13602.
Greenwood, Jeremy, and Boyan Jovanovic, 1990, “Financial Development, Growth and the Distribution of Income,” Journal of Political Economy, Vol. 98, pp. 1076-1107.
Hadi, Ali S., 1994, “A Modification of a Method for the Detection of Outliers in Multivariate Samples,” Journal of the Royal Statistical Society, Series (B), Vol. 56, pp. 393-396.
Hall, Robert E., and Charles I. Jones, 1999, “Why Do Some Countries Produce So Much More Output Per Worker Than Others?” Quarterly Journal of Economics, Vol. 114, No. 1, pp. 83-116.
Haskell, Jonathan E., Sonia C. Pereira, and Matthew J. Slaughter, 2007, “Does Inward Foreign Direct Investment Boost the Productivity of Domestic Firms?” Review of Economics and Statistics, Vol. 89, No. 3, pp. 482-496.
Henry, Peter B., 2000, “Stock Market Liberalization, Economic Reform, and Emerging Market Equity Prices,” Journal of Finance, Vol. 55, No. 2, pp. 529–64.
Henry, Peter B., 2007, “Capital Account Liberalization: Theory, Evidence and Speculation” Journal of Economic Literature, Vol. 45, pp. 887-935.
Henry, Peter B., and Diego Sasson, 2008, “Capital Account Liberalization, Real Wages, and Productivity,” NBER Working Paper No. 13880.
Heston, Alan, Robert Summers and Bettina Aten, Penn World Tables Version 6.2, Center for International Comparisons of Production, Income and Prices at the University of Pennsylvania, September 2006.
Javorcik, Beata S., 2004, “Does Foreign Direct Investment Increase the Productivity of Domestic Firms? In Search of Spillovers through Backward Linkages,” American Economic Review, Vol. 94, No. 3, pp. 605–27.
Johnson, Simon, and Todd Mitton, 2003, “Cronyism and Capital Controls: Evidence from Malaysia,” Journal of Financial Economics, Vol. 67, No. 2 (February), pp. 351–82.
Jones, Benjamin F., and Benjamin A. Olken, 2008, “The Anatomy of Start-Stop Growth,” Review of Economics and Statistics, forthcoming.
Klenow, Peter, and Andres Rodriguez-Clare, 2005, “Externalities and Growth,” in the Handbook of Economic Growth, eds. Philippe Aghion and Steven Durlauf (The Netherlands: Elsevier Science), pp. 817-861.
Kose, M. Ayhan, Eswar Prasad, Kenneth Rogoff and Shang-Jin Wei, 2008, “Financial Globalization: A Reappraisal,” IMF Staff Papers, forthcoming.
38
Kose, M. Ayhan, Eswar Prasad, and Ashley Taylor, 2008, “Thresholds in the Process of Financial Integration,” manuscript in preparation.
Kose, M. Ayhan, Eswar Prasad, and Marco Terrones, 2008, “Does Openness to International Financial Flows Contribute to Productivity Growth?” IZA Discussion Paper No. 3634.
Lane, Philip R., and Gian Maria Milesi-Ferretti, 2006, “The External Wealth of Nations Mark II: Revised and Extended Estimates of Foreign Assets and Liabilities, 1970–2004,” IMF Working Paper 06/69.
Levchenko, Andrei A., Romain Ranciere, and Matthias Thoenig, 2008, “Growth and Risk at the Industry Level: The Real Effects of Financial Liberalization,” Journal of Development Economics, forthcoming.
Lipsey, Robert E., and Fredrik Sjöholm, 2005, “The Impact of Inward FDI on Host Countries: Why Such Different Answers?” in Does Foreign Investment Promote Development? eds. Theodore H. Moran, Edward M. Graham, and Magnus Blomström (Washington, DC: Institute for International Economics Center for Global Development).
Mishkin, Frederic S., 2006, The Next Great Globalization: How Disadvantaged Nations Can Harness Their Financial Systems to Get Rich (Princeton, N.J.: Princeton University Press).
Mitton, Todd, 2006, “Stock Market Liberalization and Operating Performances at the Firm Level,” Journal of Financial Economics, Vol. 81, pp. 625-647.
Obstfeld, Maurice, 2008, “International Finance and Growth in Developing Countries: What Have We Learned?” Manuscript, University of California, Berkeley.
Parente, Stephen and Edward Prescott, 2005, “A Unified Theory of the Evolution of International Income Levels,” in the Handbook of Economic Growth, eds. Philippe Aghion and Steven Durlauf (The Netherlands: Elsevier Science), pp. 1371-1416.
Prasad, Eswar, Raghuram Rajan and Arvind Subramanian, 2007, “Foreign Capital and Economic Growth,” Brookings Papers on Economic Activity, Vol. 2007:1, pp. 153-209.
Prasad, Eswar, and Raghuram Rajan, 2008, “A Pragmatic Approach to Capital Account Liberalization,” Journal of Economic Perspectives, forthcoming.
Razin, Assaf, Efraim Sadka, and Hui Tong, 2005, “Bilateral FDI Flows: Threshold Barriers and Productivity Shocks,” NBER Working Paper No. 11639.
Reinhart, Carmen M., and Kenneth S. Rogoff, 2004, “The Modern History of Exchange Rate Arrangements: A Reinterpretation,” Quarterly Journal of Economics, Vol. 119, No. 1, pp. 1-48.
Rodrik, Dani, 1998, “Who Needs Capital-Account Convertibility?” Essays in International Finance, No. 207 (Princeton, NJ: Princeton University Press).
Roodman, David, 2007, “A Short Note on the Theme of Too Many Instruments,” Working Paper No. 125, Center for Global Development, Washington, DC.
39
Schindler, Martin, 2007, “Measuring Financial Integration: A Disaggregated Dataset of Capital Account Restrictions,” IMF Working Paper, forthcoming.
Stiglitz, Joseph, 2004, “Capital-Market Liberalization, Globalization, and the IMF,” Oxford Review of Economic Policy, Vol. 20, No. 1, pp. 57–71.
Summers, Lawrence H, 2000, “International Financial Crises: Causes, Prevention, and Cures.” American Economic Review, Vol. 90, No. 2, pp. 1–16.
Xu, Bin, 2000, “Multinational Enterprises, Technology Diffusion, and Host Country Productivity Growth,” Journal of Development Economics, Vol. 62, No. 2, pp. 477–93.
Wei, Shang-Jin, and Zhiwei Zhang, 2007, “Collateral Damage: Exchange Controls and International Trade,” IMF Working Paper 07/08 (Washington: International Monetary Fund).


![Openness Agreements: Part Two The Reality of Openness · Presented by © Adoptive Families Association of BC [2016] Openness Agreements: Part Two The Reality of Openness](https://img.pdfslide.us/doc/110x75/5e81797d22c1fb32191241b3/openness-agreements-part-two-the-reality-of-openness-presented-by-adoptive-families.jpg)