Embed Size (px)
Citation preview
Does Market Concentration Motivate Pulp and Paper Mills to
Vertically Integrate?*
Haizheng Li† School of Economics, Georgia Institute of Technology, Atlanta, GA 30332-0615, USA
Gewei Wang School of Economics, Georgia Institute of Technology, Atlanta, GA 30332-0615, USA
July, 2005
* This research was sponsored by the Center for Paper Business and Industry Studies (CPBIS), one of twenty-two Industry Centers funded by the Sloan Foundation. All of the opinions expressed in this paper are attributed to the authors and are not those of CPBIS or the Sloan Foundation. We thank Vivek Ghosal, Peter Ince, Derek Kellenberg, Patrick McCarthy, James McNutt for their helpful information and comments. All errors and omissions remain the responsibility of the authors. † E-mails: [email protected], [email protected].
2
Abstract
Paper mills vertically integrate into pulp production, partly because internalizing
the production of their inputs allows them to avoid transaction costs. Higher market
concentration, a proxy of higher asset specificity and transaction costs, should encourage
vertical integration in the pulp and paper industry. However, this relationship has not
been robust in previous studies or in our replication with updated FPL-UW data. Upon a
deeper analysis of the data, this study should clarify the mechanism by which transaction
cost can induce vertical integration in this particular industry, which does not have well-
defined intermediate goods markets. In order to specify the pulp markets where paper
mills are likely to trade, we construct a mill-specific concentration measure as a substitute
to traditional regional concentration measures. We also narrow our sample to mills
producing free sheet paper, the most profitable paper grade in this industry. With such
model refinement, this research exhibits a significantly positive correlation between
transaction cost and vertical integration.
JEL Classification: C23, D23, L16, L22, L69
Key Words: Market Concentration, Transaction Cost, Vertical Integration
3
1. Introduction
Recent empirical studies on the determinants of vertical integration have
witnessed a transition from the use of industry-level data to plant-level data (e.g.,
Acemoglu et al., 2004). The availability of mill-level data and the natural connection of
upstream and downstream production makes pulp and paper industry ideal to study
vertical integration to test economic theory (Ohanian 1994 and Melendez 2002).
Moreover, the pulp and paper industry has experienced an increasing degree of vertical
integration in the last century. For example, in 1900, the ratio of integrated mills to non-
integrated ones was 24%, and became 29% in 1940. The ratio increased to 77% in 1970
and to 84% in 2000. Transaction Cost Economics (TCE), introduced by Williamson
(1975), considers vertical integration as a way of circumventing potential holdup
problems. Therefore, internalizing the production of input allows mills to avoid
transaction costs.
Despite the dramatic four fold increase in the proportion of vertically integrated
mills, there are very few studies about vertical integration in this industry. Ohanian
(1994) studies the historical pattern of vertical integration in the pulp and paper industry
using data from 1900-1940. In line with TCE, Ohanian finds that the vertical integration
of pulp and paper production is positively associated with regional concentration, an
indicator of transaction cost. Melendez (2002) uses new data from 1970-2000 from the
same data sources Ohanian used to investigates the factors that influence the decision of a
paper mill to integrate into pulp production, but cannot find the same results.
In this study, we investigate vertical integration in the pulp and paper industry,
using a new data set from the Forest Products Laboratory in collaboration with the
University of Wisconsin (FPL-UW). The FPL-UW data record detailed capacities and
other information of individual mills in the United States from 1970 to 2000.
4
The pulp and paper industry has experienced a rapid evolution after the World
War II. Due to improved transportation and globalization, the pulp market that each
paper mill can access to has greatly extended. Therefore, it is important to find the actual
market for each paper mill so that transaction costs can be measured more accurately.
Our approach is to define mill-specific markets, in which paper mills are more likely to
trade, to replace the traditional regional markets; and then to construct a mill-specific
market concentration to measure transaction costs.
On the other hand, it is possible that the economic relationship between vertical
integration and transaction costs has changed, relative to other technological economies.
In order to test this possibility, we also estimate models for the paper grades that are
likely to be most affected by transactional costs. There are several paper grades in the
industry defined by end uses and production processes. The integration patterns may
differ in their production. More specifically, free sheet is used to produce printing and
writing paper, and is rather expensive compared to other grades of paper. Thus, it may be
economical to use market pulp in free sheet production. In this case, technological
economies may not dominate transaction-cost economies as in some other paper
production.
This paper is organized as follows. Section 2 introduces the standard transaction
cost economics on vertical integration, and Section 3 presents a brief review of the
literature that discusses vertical integration in the pulp and paper industry. Section 4
introduces our dataset. Section 5 estimates with a cross-sectional model in previous
studies. Section 6 refines our model by investigating the definition of pulp market and a
basic sample. Sections 7 and 8 estimate a model using panel data and check the
robustness with various specifications. Section 9 concludes.
5
2. Data
The data are from the United States Department of Agriculture (USDA) Forest
Service, Forest Products Laboratory (FPL), in collaboration with the University of
Wisconsin-Madison (FPL-UW hereafter). The data contain annual production capacity
for all mill locations in the United States from 1970 and 2000, including company name,
the city and state located, and ZIP code. The information on capacity is very detailed and
is differentiated by process type for each product category, such as using recycled fiber or
woodpulp, and integrated chemical pulp or market chemical pulp.1
The term “integrated” in the FPL-UW data means that papermaking capacity is
combined with pulping capacity at the same facility or mill location. Paper and
paperboard are downstream goods (“paper and paperboard” will be referred to as “paper”
in the following discussion unless otherwise specified), and pulp is upstream or
intermediate goods.
Because Lockwood’s Directory includes estimates for pulp capacity, Ohanian
(1994) and Melendez (2002) define a paper mill as vertically integrated if pulp capacity is
a positive value. The FPL-UW data do not have information on pulp capacity, but instead
report the sources of pulp used in the paper production. We can identify integration status
for each paper category based on whether the production utilizes integrated pulp. A
paper mill is defined as non-integrated if it only uses market chemical pulp. For example,
a free sheet mill is defined as integrated if it uses all or some integrated chemical pulp, 1 The product in the pulp and paper industry is divided into three broad commodity groups: paper, paperboard, and market pulp. The paper group includes eight conventional categories: newsprint, four categories of printing and writing paper (uncoated free sheet, coated free sheet, uncoated groundwood, and coated groundwood), tissue and sanitary paper products, unbleached kraft paper, and other specialty packaging and industrial paper products. The paperboard group includes four conventional commodity categories: linerboard and corrugating medium, solid bleached board, and other recycled paperboard. Market pulp is produced at one location and sold to industrial users at another location or exported. It primarily includes hardwood and softwood kraft market pulp, deinked market pulp based on recycled fiber, and relatively small amounts of bleached chemithermomechanical market pulp (CTMP) and cotton linter pulp. For more details, see Ince et al. (2001).
6
because it will need to have chemical pulping capacity to produce integrated pulp. In our
definition, vertically integrated mills include those use entirely integrated pulp or a
combination of integrated pulp and market pulp. Moreover, for a paper mill, if the pulp is
supplied internally by a pulp mill that belongs to the same owner, then this paper mill is
also defined as integrated because it does not entirely use market pulp. 2 Therefore, our
definition of VI is based on ownership and technical integration, not necessarily the
integration at the same production site.
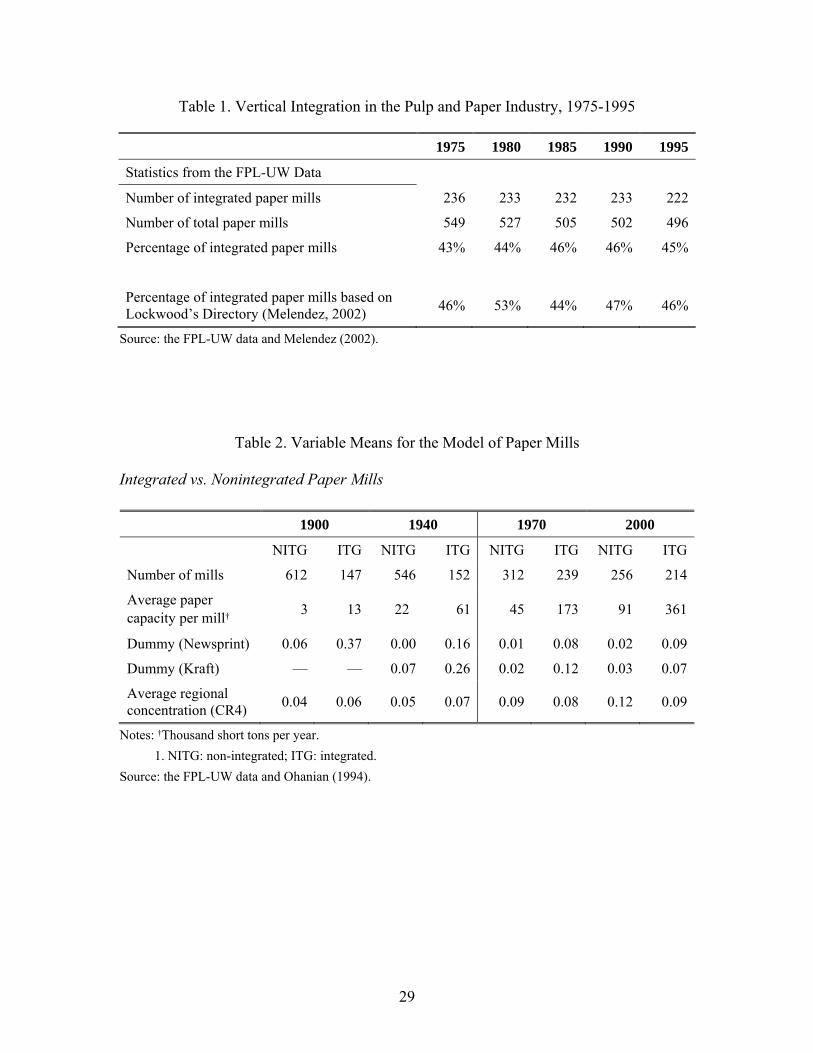
In order to compare the data, we present descriptive statistics in Table 1, in
comparison with the statistics from Melendez (2002), which is based on the same data
sources as Ohanian’s and covers the same time period as our data. As can be seen in the
table, the descriptive statistics on vertical integration are similar.3 In this study, recycled
pulping is viewed as non-integration because it is very different from wood pulping
process.
3. Vertical Integration in the Pulp and Paper Industry
In general, vertical integration can help to avoid the problems caused by market
imperfection, such as supply uncertainties, government intervention, or “double-
marginalization”. Additionally, vertical integration can be motivated by production-cost
reduction and transaction-cost reduction. Production cost can be retrenched if fewer
resources are used to produce the downstream output upon integration with the upstream
production process. Transaction cost, on the other hand, is incurred due to the probability
of “opportunistic behavior,” which may arise where specific assets are needed. Based on
the TCE, the fewer the number of parties in the intermediate-goods market and the more 2 As discussed later in the paper, such a mill must be close enough to the paper mill. 3 The pulp used in paper production can be classified broadly into three categories: mechanical pulp, chemical pulp, and recycled pulp. Recycled pulp is different from the other two pulping process since a paper mill can purchase recycled (deinked) pulp directly from the pulp market or purchase wasted paper for in-house recycling.
7
specialized the assets involved in the transaction, known as “asset specificity,” the higher
the transaction costs.4
When assets become specific to a particular transaction, the firm is vulnerable to
opportunistic behavior by the supplier (Klein et al., 1978).5 Globerman and Schwindt
(1986) argue that asset specificity occurs in papermaking because the salvage value for a
mill or component assets is low. The fixed-proportions and continuous-process nature of
papermaking also imply a greater potential loss from the interruption of input supply
compared to variable-proportion or batch-process industries (Ohanian, 1994).
While asset specificity cannot be easily measured, market concentration has been
used in studies to capture situations in which holdup problems are likely to occur. High
concentration indicates greater potential for exploitation in market transactions, and thus
the firm has greater incentive to vertically integrate. MacDonald (1985) finds that the
levels of vertical integration within the manufacturing sectors are strongly associated with
high levels of concentration. Ohanian (1993, 1994) investigates vertical integration in the
U.S pulp and paper industry, using mill-level data from 1900 to 1940 collected from the
Lockwood’s Directories.6 She finds that vertical integration of pulp and paper production
is positively associated with regional concentration, paper mill capacity, and the
production of standardized grades of paper. Melendez (2002) uses data for 1975 to 1995
from the same source as Ohanian to study vertical integration in the same industry.
However, unlike Ohanian, she finds that vertical integration is positively correlated to
paper mill capacity, the production of standardized grades of paper and forestland dummy,
but negatively associated with regional concentration. Because of the contradicting result,
4 For example, a desktop computer can be used in many productive activities whereas a Fourdrinier machine can be used only in papermaking. 5 As the topic of vertical integration has been popular in the domain of new institutional economics for many years, extensive literature reviews on the determinants of vertical integration can be found in recent studies, theoretical reviews such as that in Joskow (2005) and Whinston (2003), and empirical reviews such as that in Klein (2005) and Acemoglu et al. (2004). 6 Lockwood’s Directory of the Paper and Allied Trades, published since the 1870’s.
8
Melendez explains that market concentration is endogenously determined in the reduced
form model, and thus the estimates are biased.
4. A Cross-Sectional Model to Replicate Previous Studies
For the first step using our new data, we try to replicate Ohanian’s results. The
logit model is defined as
0 1 2 3 4( 1) ( ).i i i i iP VI concentration capacity news kraftβ β β β β= = Λ + + + +
VI is a dummy variable, equal to one if a paper mill is vertically integrated with the
pulping process and Λ is the logistic function.7 The type of integration is often modeled as
a discrete variable: “make”, “buy”, or “hybrid” (Klein, 2005). In this paper, “hybrid” is
defined as integrated as it still involves the pulp making process.
In the model, Concentration, which refers to regional market concentration, is a
measure of asset specificity. Ohanian defined it as the product of the top four mill
concentration ratios (CR4) for the pulp market and for the paper markets in each region.8
The concentration is calculated based on reported mill capacities.9 Capacity, the
logarithm of the paper capacity of each mill, is a proxy of mill size because data such as
sales or output are not available.10 Size is another proxy of transaction cost because the
frequency and volume of transaction rises with mill size. News and kraft are two
7 A “paper mill” is defined as “a mill with positive paper and paperboard capacity”. 8 Ohanian’s division of four regions is as follows: the North includes CT, DE, ME, MA, MD, NH, RI, VT, NY, NJ, PA; the Lake and Central regions include IL, IN, MI, OH, WI, IA, KS, MN, MO; the South includes FL, GA, NC, SC, VA, WV, AL, MS, TN, AR, LA, TX; the Pacific includes CA, OR, WA. The FPL-UW data include no mills in RI, but they include mill(s) in AK, AZ, CO, DC, ID, KY, MT, NM, OK. We added the states where paper mills were not located before 1940 into the four regions according to the Census division. 9 Ohanian argues that a regional measure is appropriate because most grades of pulp and paper were traded within the producing region during her sample period. 10 The paper capacity in Ohanian’s model is measured by thousands of pounds per 24 hours. We measure the capacity of pulp and paper by thousands of short tons per year.
9
dummies for positive newsprint and kraft capacity. They represent the higher degree of
asset specificity that results from the specialization of pulping assets so that they conform
to the requirements of the papermaker (Ohanian, 1994).
Ohanian’s model is estimated with cross-sectional data at ten-year intervals
between 1900 and 1940. We also estimate the model at ten-year intervals using our
sample. Table 2 shows the mean values of the independent variables in our model and
that from Ohanian’s Table 1. It appears that the pattern of vertical integration changed
significantly several decades after 1940. The total number of paper mills declined
considerably during the 20th century due to increased capacity of each paper machine.
Because of technology advance, the average capacity of paper mill increased dramatically
during the 20th century. From 1900 to 2000, the average capacity for both integrated and
non-integrated paper mills increased more than 29 times.
Although the number of integrated paper mills is still lower than the number of
non-integrated mills, these numbers became much closer after 1970. The ratio of the
capacity of integrated paper mills to that of non-integrated paper mills is also higher in
our sample period, and the proportion of newsprint and kraft mills declined in the 1900-
40s period and stabilized after 1970. The last row of Table 2 shows the concentration of
integrated and non-integrated mills. For both types of mills, market concentration has
been increasing. Also, it appears that the relationship between market concentration and
the status of vertical integration between 1970 and 2000 reversed, and non-integrated
mills became more concentrated.
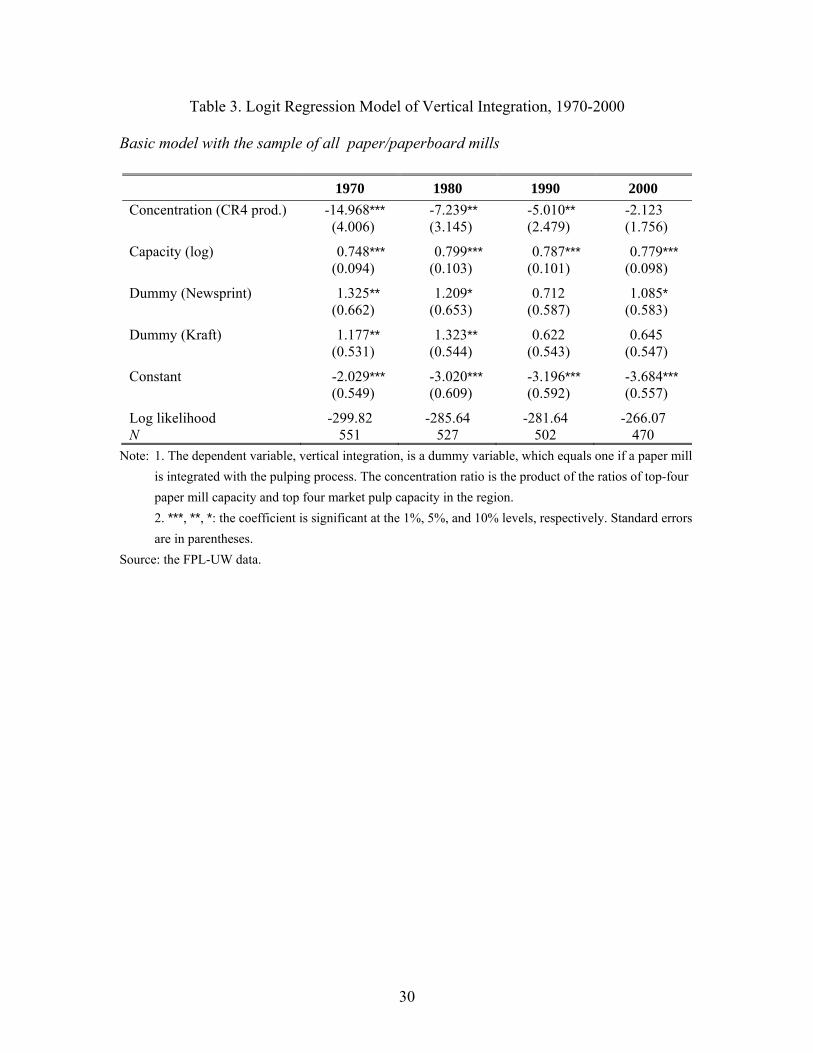
The estimates of Model (2) are reported in Table 3. All paper mills with positive
paper and paperboard capacity are included in each regression. The integration status is
shown to be positively associated with mill capacity and the two dummies of specialized
papermaking over our sample period, similar to those reported in Ohanian’s paper. The
coefficients of mill size are statistically significant in each sample year, but the
coefficients of specific paper grades are insignificant in some years after the 1980s.
10
However, the coefficients of concentration measure are negative and significant
(for most years), which clearly contradicts Ohanian’s result. With the same specification
but new data between 1975 and 1995 from the same data source Ohanian used--
Lockwood’s Directory, Melendez (2002) fails to obtain same result for the concentration
variables too, i.e., the coefficient of concentration is also negative and significant (see
Table 3.1 in Melendez).
Based on economic theory, concentration should generally promote vertical
integration. According to Perry (1992), there are three main factors causing integration:
technological economies, transactional economies and market imperfections.
Technological economies resulting from vertical integration help to save cost by
replacing some intermediate inputs with the primary input and reducing the requirements
of other intermediate inputs. An example from the paper industry is the energy savings
from not having to convert the dry pulp to its slush form for the paper production.
Transactional economies occur when transaction costs are reduced as integration replaces
market exchange by eliminating “opportunistic behavior.” Market imperfection theories
attribute vertical integration to avoiding costs caused by monopoly or monopsony market
power, price controls, and market uncertainty. In general, higher level of market
concentration should reinforce those factors. For example, higher market concentration
may increase the chance of “opportunistic behavior” and market uncertainties due to
fewer alternatives. As a result, higher concentration should generally cause higher
probability of vertical integration.
The question therefore becomes why the same model generate different results
using data from different time periods. In order to test the robustness of the result, we
estimated a few alternative specifications. The first one is to replace the current
concentration measure with a lagged value. Integrating pulping capacity with paper
production usually takes years to complete given the long term nature of the investment
in the pulp and paper industry. Therefore, the current market concentration may not
11
affect current status of vertical integration. Another advantage of using lagged value is
that it can mitigate the possible problem of endogeity for concentration, if some omitted
variables affect both current concentration and integration status. We use a three-year-
lagged CR4 to estimate the model, but the results change little from the model with
current concentration.
The second alternative specification is to control for the forest resources. During
the first half of the century, the paper industry in the U.S. was going through a relocation
process from the North towards the South by acquiring large timber tracts and
constructing high-capacity pulp mills.11 Meanwhile, many newly built pulp mills are
integrated into papermaking for sustained competitiveness (Toivanen, 2004). Thus, the
number of mills in the South was small and then concentration was high, but the ratio of
integrated paper mills was high, and hence a positive relationship between vertical
integration and concentration revealed.
After the 1970s, however, the industry settled, and the differences in market
concentration across regions narrowed. In the forest abundant south, many pulp mills
have been built there, which result in a low seller-market concentration. Because of the
historical pattern discussed above, those pulp mills are likely to integrate into paper
production. As a result, a high level of vertical integration correlates with a low level of
market concentration in this area. Therefore, omitted variables that represent the level of
forest resources are correlated with both market concentration and vertical integration.
To control for such an effect, we added a South dummy variable to control for forest
resources. Yet, the estimates for concentration variable still do not change much,
although the South dummy is positive and significant for vertical integration as expected.
11 Toivanen (2004) details the reason as, “Rapid diffusion of kraft pulp innovations propelled industrial relocation in the North American pulp and paper industry. The cost and availability of pulp wood in traditional industrial regions was a persistent subject of debate. ...... The kraft process was the first pulping technology that could potentially utilize on large scale the vast stands of Southern pine, often characterized as ‘waste,’ and thus prompted managers to consider Southern strategy.”
12
Because the expected positive effect of market concentration on vertical
integration predicted by economic theories only appeared in earlier data not in the new
data, we turn to refine the models by controlling for possible structural changes during
the last century. For the pulp and paper industry, major changes in last century probably
include i) technology advances that result in much larger capacity of an average mill, and
the larger capacity may cause the dominance of technological economies in determining
vertical integration; ii) improvement in transportation, which may make regional
concentration less important; iii) globalization that makes concentration in domestic
market less important.
5. Refinement in Specifications
A sample based on free sheet mills Technological economies in the pulp and paper industry lies primarily in reducing
costs involved in processing market pulp versus producing pulp directly at an integrated
mill.12 The cost advantage to integrated paper mills varies, depending on the structure and
sales price of the final product (Zavata, 1993). The savings from integration are
approximately five to ten percent of pulp manufacturing costs (Diesen, 1998). This
extend of saving is significant for low value-added paper product that mainly uses
mechanical pulp or unbleached kraft pulp.13 The relatively low prices of those products
make it less attractive to buy pulp from the market. Therefore, hardly any mechanical
pulp or unbleached kraft pulp is sold in the market, because the added cost in drying,
12 Typically, market pulp must be dried and baled before being shipped to the paper mill, where it has to be diluted again. In an integrated paper mill, wet pulp is sent directly to the paper machine. The elimination of the pulp-drying stage as well as the stage of converting the dry pulp to its slush reduces both investment and operating costs because a mill no longer needs for a drying machine, and saves energy and packaging material costs (Zavata, 1993). 13 For the pulp categories, the following common divisions are used: mechanical pulp (produced by a mechanical process), chemical pulp (produced by a chemical process), semi-chemical pulp (made by a chemical process followed by a mechanical process), and other pulp (for example, deinked pulp or recycled pulp).
13
transportation and re-wet makes it less attractive.14 As a result, paper grades that use
mechanical pulp or unbleached kraft pulp are mostly integrated in the production due to
the dominance of technological economies. For example, many newsprint and
paperboard mills are able to eliminate the use of purchased market pulp because of
improvements in technology.
On the other hand, the saving from vertical integration is less significant for high
value-added paper. For example, free sheet paper, which accounts for all fine writing and
printing paper, is produced primarily with bleached chemical pulp, with generally less
than ten percent mechanical pulp content. Although the cost of chemical pulp is much
higher than that of recycled pulp and mechanical pulp, free sheet paper is much more
expensive, compared to other grades of paper.15 As a result, almost all market pulp
produced and sold in North America is bleached kraft pulp, which is mainly for free sheet
production. Therefore, technological economies are less important for the decision of
vertical integration for freesheet mills.
The dramatically increased mill capacity after 1970 has reinforced technological
economies for those low value-added grades because of the savings from the economy of
scale. Since technological economies are likely to dominate other factors affecting
integration decisions for those grades, including those mills in the sample will not help to
identify the effects of other factors in vertical integration. This may cause the different
results using data after 1970 compared to that before 1940, when the economy of scale in
a mill was relatively small.
14 In 2000, the production of mechanical pulp in the U.S. was 1,745 thousand tons compared with that of chemical pulp of 48,199 thousand tons. Import of mechanical pulp in the U.S. was as low as 437 thousand tons. In the FPL-UW data, the capacity of U.S. market mechanical pulp was zero in the nine years between 1970 and 2000. 15 For example, coated free sheet (No. 1 grade) currently sells for about $1,500 per ton, whereas newsprint (an uncoated paper grade made from high-yield mechanical pulp, often with a very small fraction of bleached chemical pulp) currently sells for about $500. Bleached kraft market pulp costs about $300 to $400 per ton to make, so it is economical to use market pulp in coated free sheet paper, but the price of newsprint is too low to support the use of market pulp.
14
Therefore, we restrict our sample in two high value-added categories of paper
production: coated free sheet paper and uncoated free sheet paper.16 Free sheet mills
(referred to as mills with positive free sheet capacity) need bleached chemical pulp, so
they are more likely to involve a decision of whether to purchase market pulp or to
produce the pulp internally.17 In this case, factors other than technological economies
may also play an important role in firm’s decision of vertical integration.
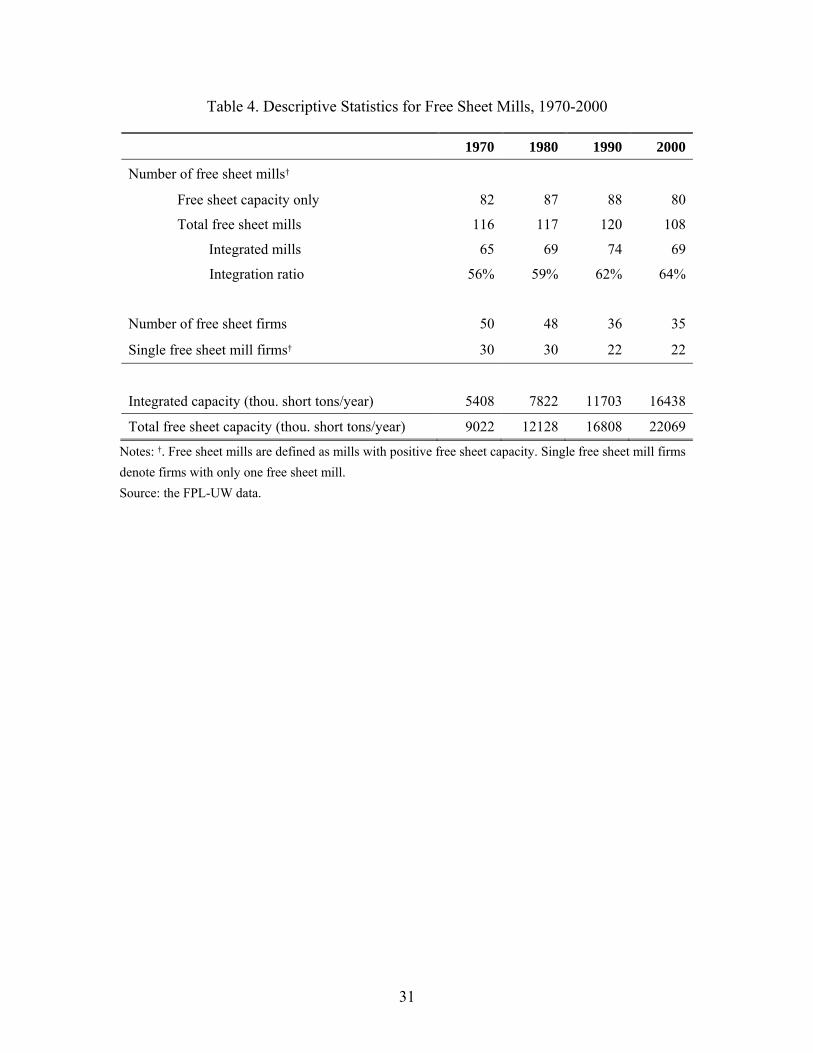
Table 4 presents some summary statistics. The size of free sheet mills grew and
the number decreases between 1970 and 2000. The total capacity of free sheet mills
increased 145 percent between 1970 and 2000, while the number of free sheet mills
decreased after 1990s. The number of firms and single-mill firms (referred to firms with
one mill only) declined even faster. The proportion of vertical integration rose from 56 to
64 percent from 1970 to 2000, and the ratio of integrated capacity to non-integrated
capacity gradually increased from 60 to 75 percent during the thirty years.
Reconsiderations on the pulp market
Most grades of pulp and paper were traded within the producing regions at the
beginning of the 20th century, which motivates Ohanian (1994) to use a regional
concentration measure. Nowadays, market pulp can be transported by sea or by rail a
very long distance at much lower costs than before. The import of chemical pulp in the
U.S. is equal to thirteen percent of chemical pulp production in 2000. Hence, assuming
that pulp is traded only within regions may no longer be true in the second half of the 20th
16 Coated free sheet paper generally falls on the highest value end of the printing and writing paper spectrum and used almost entirely in commercial printing applications such as annual reports, product sales brochures, or advertising pamphlets that generally demand high image quality and color printing. Uncoated free sheet paper is primarily used for producing office reprographic paper for copiers and printers. 17 Another grade that is likely to purchase market chemical pulp is tissue. In tissue production, recycled pulp is used extensively. It is a complicated issue with regard to whether recycled pulping should be viewed as integrated or non-integrated. Generally, recycled pulping may be carried out by either de-inking recovered paper or purchasing market recycled pulp. To avoid this complication, we do not include tissue mills in our sample. For freesheet mills, the use of recycled pulp is very limited.
15
century.18 Another problem for dividing the country into regional markets is that, for
some mills located close to the boundary of the region, they are more likely to trade
across region as they may be closer to mills in other regions. For these reasons, regional
concentration measure used for the data before 1940 may not be relevant to the data after
1970.
In order to balance the cost effectiveness of trading with mills closer-by and the
extended trading range after 1970, we define a mill-specific concentration measure. In
particular, according to industry sources, we define a circular market for each paper mill
of a 350-mile radius, in which the paper mill can purchase market pulp at lower
transportation costs.19 We refer to this market as a “neighbor market” in contrast to a
“peripheral market,” which includes the U.S. as well as foreign countries outside the
circular area. This distance is considered the maximum transportation distance for wet-
lap pulp and an effective distance of highway transportation for dried market pulp.20
Because for some paper mills, there is no mill located within neighbor market, we have
added the five closest pulp or paper mills outside the “neighbor market” in order to define
the market concentration. This setup is useful, as it reflects the relative accessibility for a
paper mill in purchasing market pulp.
For each mill’s neighbor market, we calculated a mill-specific market
concentration measure based on the Herfindahl-Hirschman Index (HHI). i.e., HHI for the
buyer market (HHI-paper) and the seller market (HHI-pulp), respectively.21 In the
calculation, HHI is based on the ownership, i.e., we only include mills belong to a
18 One kind of pulp called “wet-lap pulp”, which is not totally dried and has lots of moisture (about fifty percent), is still traded in the pulp market, albeit in small quantities. While wet-lap pulp is more cost-effective, it tends to deteriorate rapidly if it remains wet for a long time, e.g., a few days. Paper mills often use highway transportation for wet-lap pulp for its efficiency. 19 Melendez (2002) also used concentration measures for local market defined similarly. 20 In order to test the sensitivity, we also used other distances in our estimation. The results are not very sensitive. 21 Since some neighbor markets do not have four firms, we do not use CR4 to measure concentration.
16
different firm. Thus, it accounts for the possible interlink between sister mills that belong
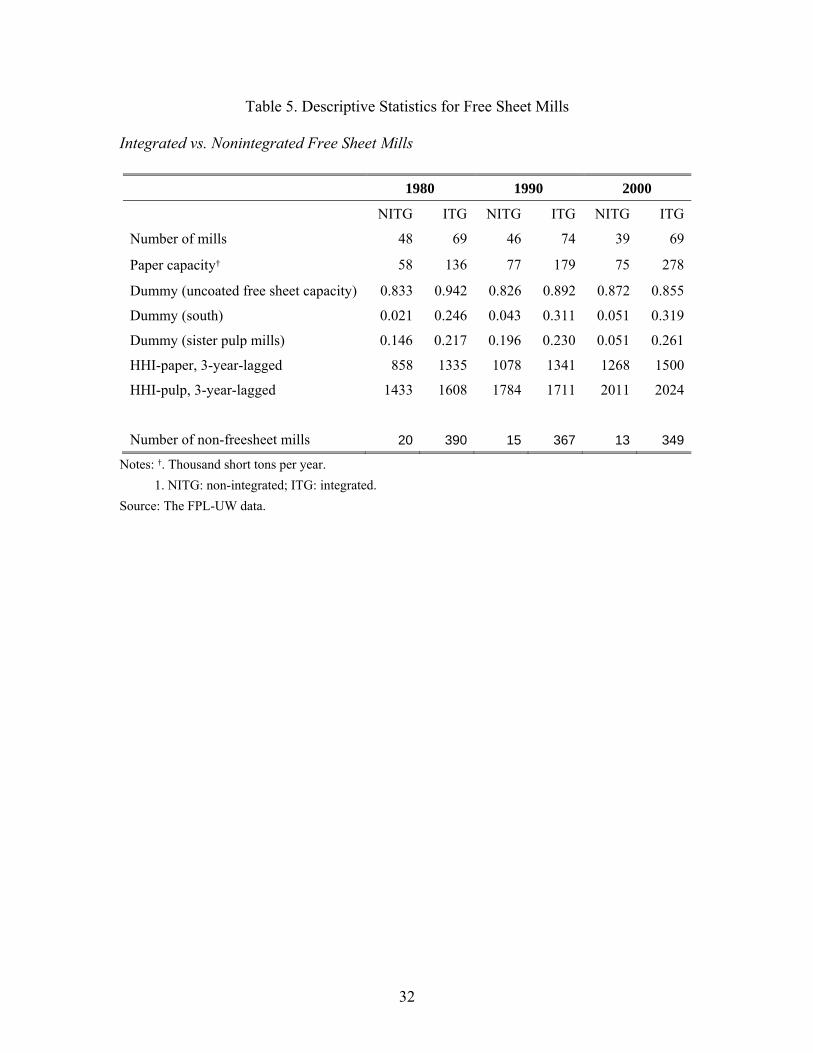
to the same firm. As shown in Table 6, HHI-paper is lower than HHI-pulp. The
concentration in both markets has been rising since 1970, resulting from industry
consolidation (Li, McCarthy, and Urmanbetova, 2005). Additionally, for HHI-pulp, the
difference between integrated mills and non-integrated ones are small; while for paper,
integrated mills are more concentrated than non-integrated ones.22
In addition, market concentration may exert different effects on integration
strategy for mills that have pulp mills owned by the same company in the “neighbor
market” (referred to as “sister pulp mills”) than for the mills that don’t have sister pulp
mills. In the former case, the impact of transactional economies and market imperfection
should be much smaller because of the accessibility of pulp from sister mills. In order to
control for this factor, we include a dummy variable for the existence of sister pulp mills
in the neighbor market.23
Estimates Using the new sample on free sheet mills and with the new measures on market
concentration, we re-estimate the logit model of vertical integration. In the model, we
use three-year lag of the concentration measure. We also include a dummy variable
indicating whether a mill is located in the South in order to capture the distribution of
forest resources. As discussed above, mills in south are more likely to be integrated.
Additionally, we also add a dummy variable for uncoated free sheet mills to control for
technological economies.24 As usual, free sheet capacity is included to reflect mill size, a
proxy of asset specificity.
22 Pulp mill is referred to a mill with positive market chemical pulp capacity. 23 Another option is to define a paper mill that has a sister mill close-by as integrated one. However, it is hard to specify such a distance. We believe that a dummy variable is less restrictive to control for the impact. 24 Coated free sheet paper uses mainly hardwood pulp.
17
Table 6 and 9 show cross-sectional estimates for free sheet mills based on
different specifications for concentration measures.25 In those tables, the estimates for
variables other than concentration are quite robust. More specifically, the coefficient of
capacity is always significantly positive, indicating the economy of scales from vertical
integration. The positive estimates of uncoated free sheet dummy show evidence that the
lower the paper grade is, the more likely it is to be vertically integrated due to
technological economies, as is the case for other low value-added grades. The South
dummy is always positively. This is because, as discussed above, in the forest abundant
area, paper mills are more likely to be integrated into pulp production.
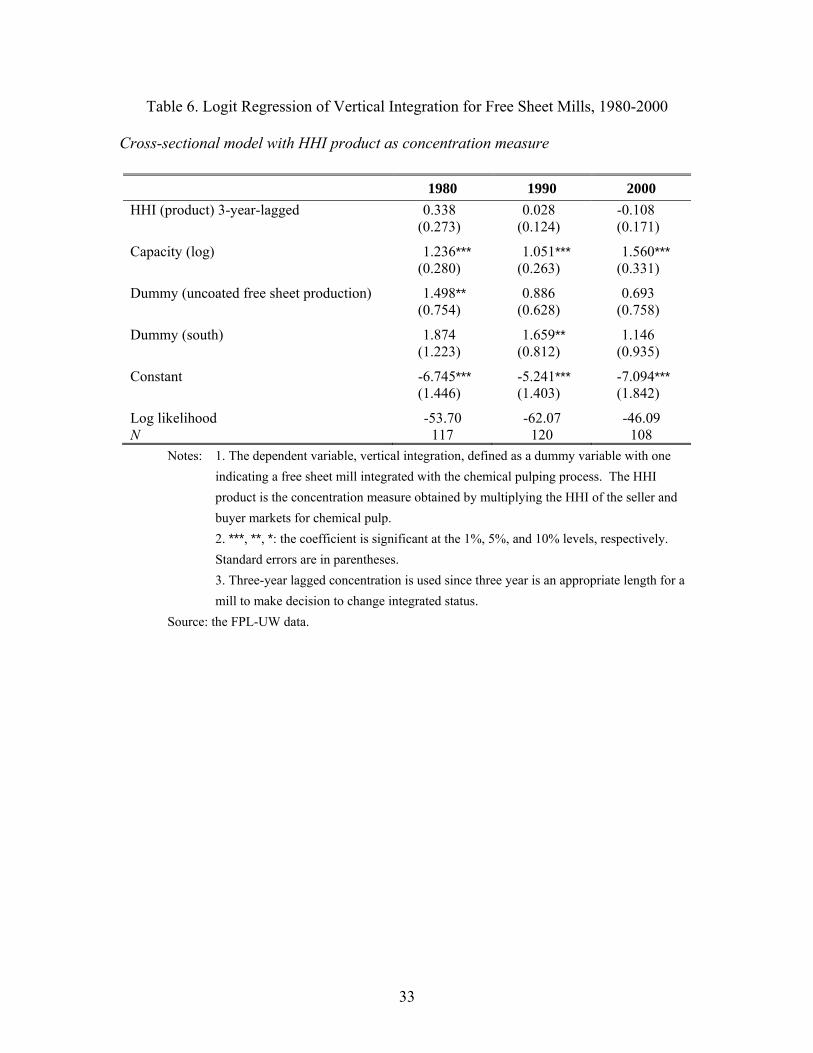
In Table 6, the interaction of HHI-paper and HHI-pulp is included as a
concentration measure. Based on Ohanian, “the product of the concentration ratios at
each stage is consistent with the possibility for opportunistic behavior on the part of
either party once a contract is negotiated” (page 203). The concentration measure
exhibits positive effects in 1980 and 1990, albeit insignificant from zero.
Generally, inclusion of only the interaction term of two regressors in a regression
model is restrictive, as it rules out the possibility that the marginal effect of each
regressor does not depend on the level of the other one. In a study of vertical integration
based on data for all manufacture industries, MacDonald (1985) uses the HHI for the
buyer and seller markets separately and finds that the concentration of the buyer and
seller markets both positively correlate with the vertical integration. He also tested for
the interaction of these two concentration measures, but found no strong evidence of
interaction effects between buyer and seller concentration. Therefore, we also estimated
models with HHI-pulp and HHI-paper with/without their interaction. However, the
results are similar, and the concentration measures are not statistically significant,
although they are mostly positive.
25 The results do not include 1970 due to the use of three-year lag of the concentration measure.
18
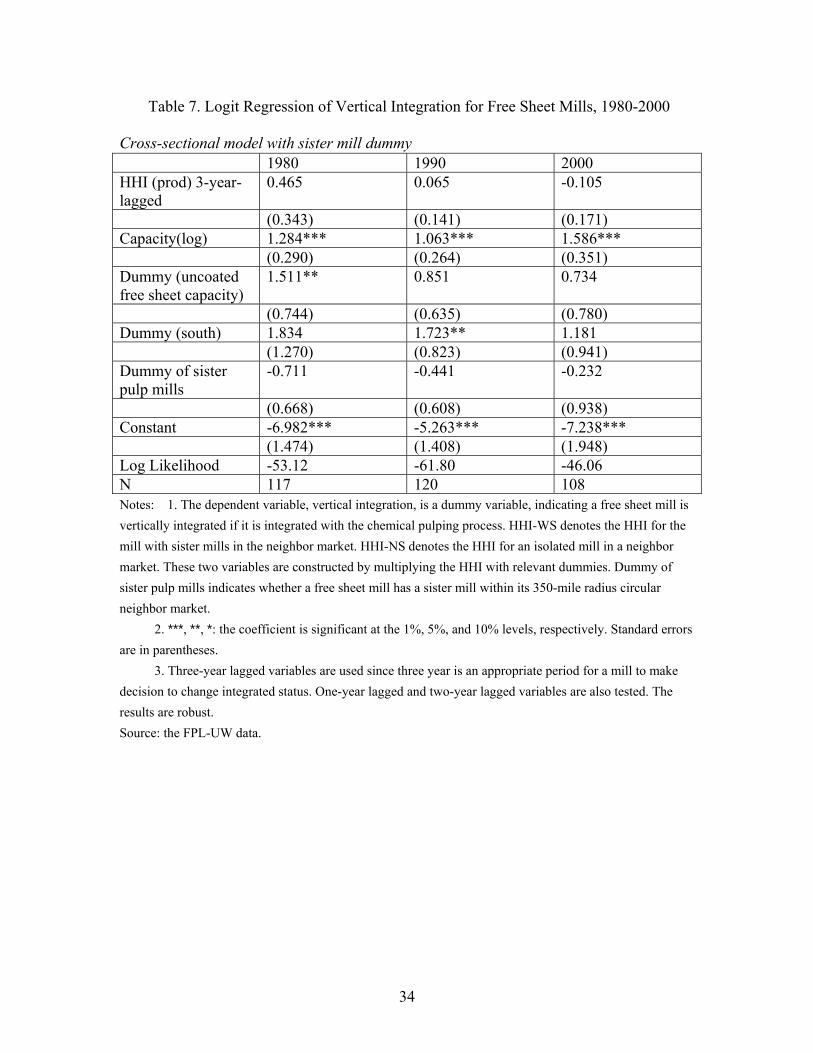
As discussed above, free sheet mills with or without sister pulp mills in the
neighbor market may behave differently in vertical integration. In Table 7, we add the
dummy variable to indicate the existence of sister mills in the neighbor market. As
expected, with a sister pulp mill near by, the incentive for vertical integration should be
lower. The estimated coefficient is negative cross years, although it is statistically
insignificant. However, the sign and significance for concentration measure does not
change.
two coefficients for concentration are estimated for mills with sister pulp mills
and mills without sister pulp mills in the neighbor market, referred to as HHI-WS and
HHI-NS26 respectively. In addition, a dummy variable indicating whether any sister pulp
mill exists in the neighbor market is included. However, for 1980 and 2000, two
coefficients of concentration are both positive but insignificant, and the coefficients of the
sister pulp mill dummy is negative. In the model for 1990, the coefficient of HHI-WS
becomes negative, and the estimate of the sister mill dummy is positive.
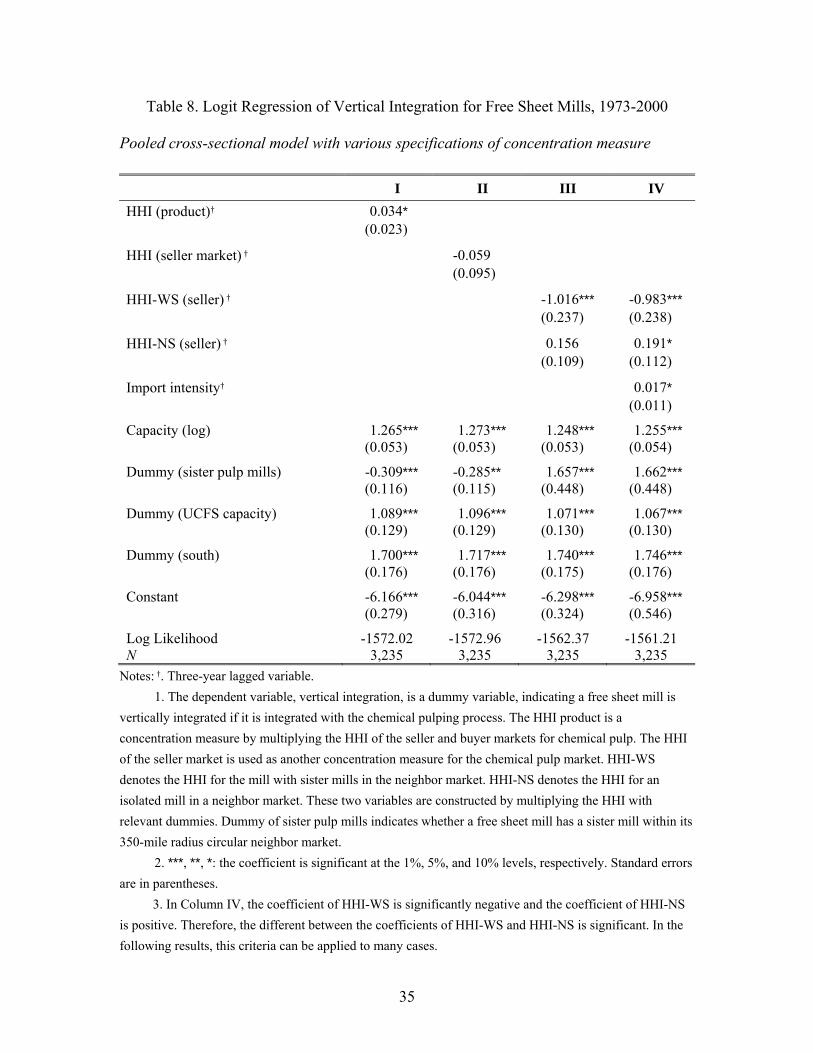
Additionally, we pool the sample across year so run the model and report the
results in Table 10. In the first three columns, we use similar specifications to those in
the models in Table 6, 8 and 9 except we add the dummy of the sister pulp mill into the
model of every column. In column I, the concentration shows an effect significantly
positive at 10% level. Column III seems to indicate a result that is closer to our
expectation, as the coefficient of the sister pulp mill is significantly positive, and the two
coefficients of concentration show different signs. It is confusing that the coefficient of
HHI-WS is significantly negative and the coefficient of HHI-NS is insignificantly
positive, which may still indicate the existence of downward biases.
A new variable, import intensity, is added in the model of column IV. Although
we construct a proxy of transaction cost in the neighbor market, the transaction cost in the
26 HHI-WS denotes the HHI for the mill with sister mills in the neighbor market. HHI-NS denotes the HHI for the isolated mill without sister mills in the neighbor market. These two variables are constructed by multiplying HHI with relevant dummies.
19
peripheral market and world market cannot be identified easily. Import intensity is
calculated as the market pulp import divided by total sales for each year in the United
States. We expect that transaction costs will be higher if the import intensity is greater
because high demand for imports leads to opportunistic seller behavior. The estimates of
other variables being robust, the coefficient of the HHI-NS becomes significantly positive
at a ten percent level compared with that in column III. Import intensity exhibits a
positive relationship with vertical integration, also significant at a ten percent level.
6. Panel Models
So far, we have found no strong evidence that market concentration and vertical
integration are positively related as indicated by standard theory. Due to unobservable
factors, we can control time-invariant factors that are unobservable or unidentifiable, such
as local resources, by extending our analysis to panel regression, which has become
feasible due to recent development of panel model for binary choice27 (e.g., see the
summary in Green, 2003).
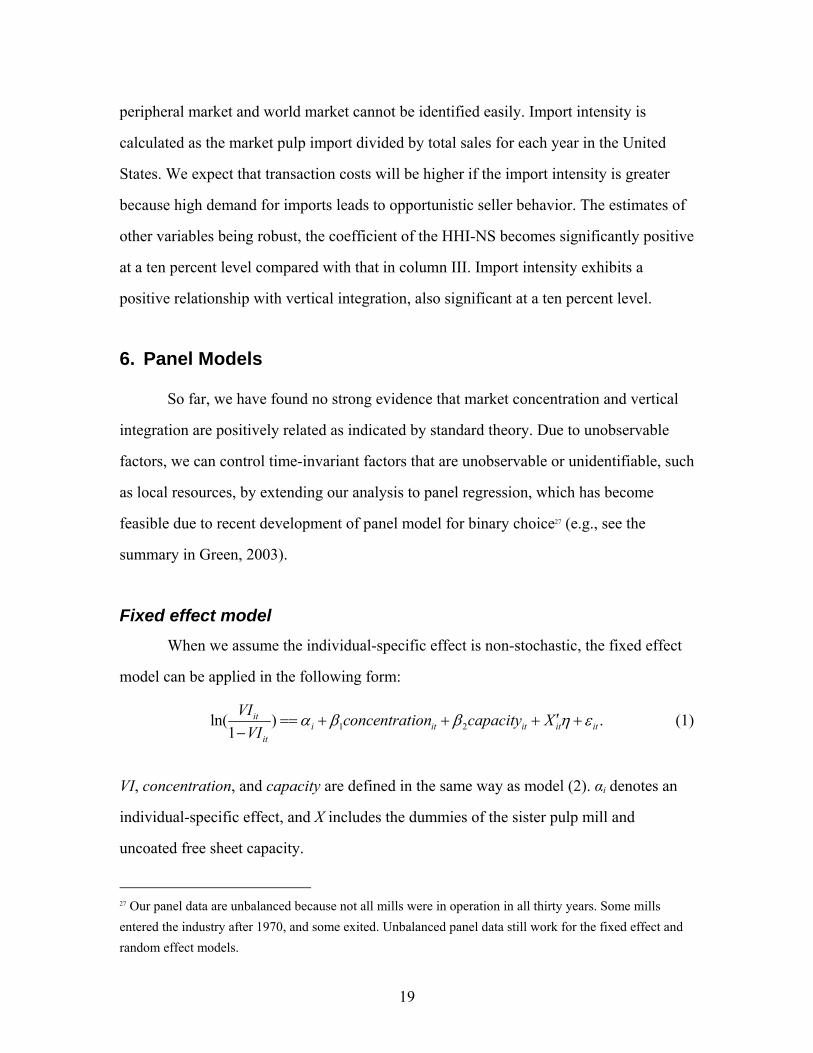
Fixed effect model When we assume the individual-specific effect is non-stochastic, the fixed effect
model can be applied in the following form:
1 2ln( ) .1
iti it it it it
it
VI concentration capacity XVI
α β β η ε′== + + + +−
(1)
VI, concentration, and capacity are defined in the same way as model (2). αi denotes an
individual-specific effect, and X includes the dummies of the sister pulp mill and
uncoated free sheet capacity.
27 Our panel data are unbalanced because not all mills were in operation in all thirty years. Some mills entered the industry after 1970, and some exited. Unbalanced panel data still work for the fixed effect and random effect models.
20
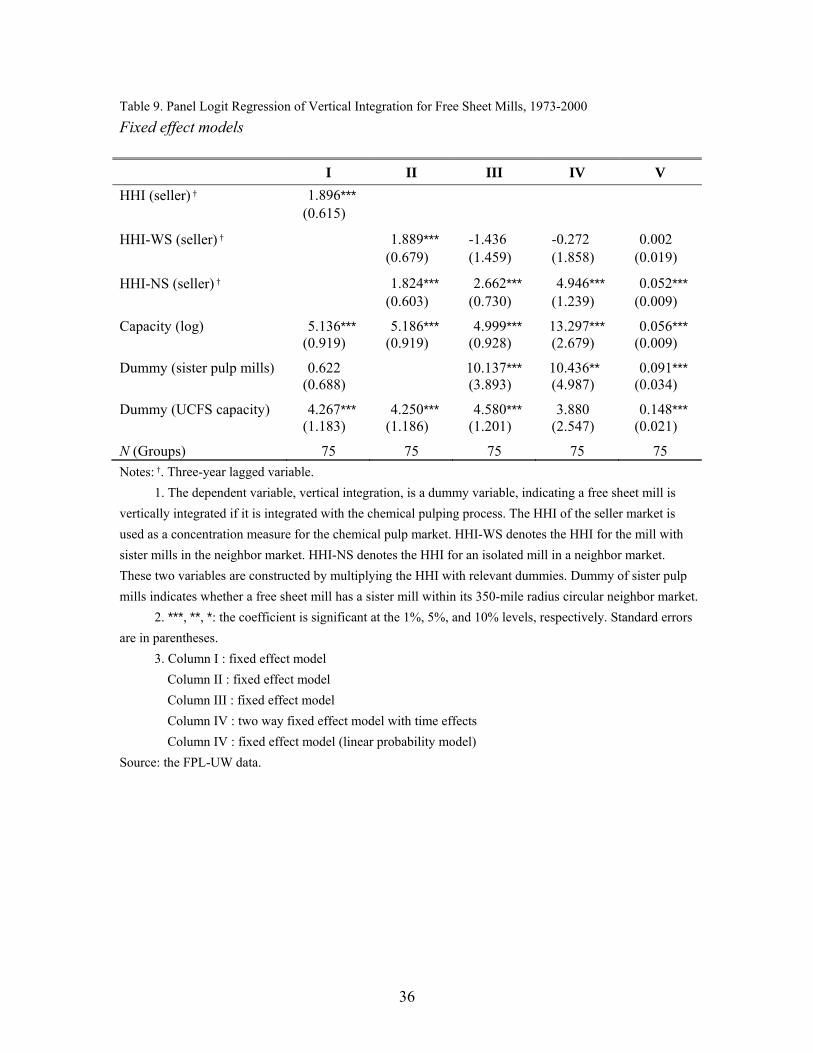
Columns I to IV of Table 9 report the estimates of the fixed effect models. In
column I, a three-year lagged HHI of the seller market is applied. Compared to the cross-
sectional model of column I in Table 8, the positive coefficient of concentration is more
significant, now at a 1% level. Furthermore, the coefficient of the dummy of the sister
pulp mill becomes positive, but not statistically significant. Downward biases were
adjusted to some extent, but still exist observably. We try to obtain two separate estimates
for the concentration of the seller market in the model of column II and drop the sister
mill dummy temporarily, and find that seller market concentration significantly affects
both types of mills positively, indicating that if integration is not controlled,
concentration has a delusive relationship with integration due to the positive correlation
between concentration in the neighbor seller market and the local existence of sister pulp
mills. When the sister mill dummy is added in the model of column III, the result is
perfectly consistent with what we expected: the coefficient of HHI-WS is insignificant
from zero, and the coefficient of HHI-NS is significantly positive. The dummy of the
sister pulp mill also shows a significantly positive effect, with z-statistics more than 2.6.
In other words, if a mill has some sister pulp mills nearby, it is more likely to be
integrated than isolated mills, given that the seller concentration in a neighbor market
maintains constant, and no correlation exists between seller concentration and integration
strategies for mills with access to in-firm purchasing. The model of column IV is a two-
way panel model with estimation of time effects for each year. The addition of time
effects does not change the estimated effects of HHI-WS and HHI-NS. We find a
significantly positive time trend in most years before 1990. However, in the last decade
of these thirty years, the annual time effects on vertical integration for free sheet mills are
insignificantly positive.
Some studies on vertical integration also use linear probability models with panel
data (e.g., Acemoglu et al., 2004). The following equation is such a linear probability
model with fixed effects:
21
1 2 .it i it it it itVI concentration capacity Xα β β η ε′== + + + + (2)
The results are shown in column V of Table 9. The estimates of column V become more
significant than those in the column III with the exception of the effect of HHI-WS,
which is highly insignificant from zero. Therefore, the relationship between concentration
and vertical integration is further verified.
Other models of panel regression After controlling the idiosyncratic time-invariant factors, we find a significantly
positive relationship between market concentration and vertical integration. This
relationship holds for mills with sister pulp mills nearby. In order to check the robustness
of the fixed effect model, the conditional fixed effect model and the random effect mode
are tested.
An incidental parameters problem occurs in the fixed effect model for a binary
dependent variable (e.g., Greene, 2003 and Hsiao, 2003), which means that as the time
length (T) of panel data is typically limited, even when the number of individual (N)
tends to infinity, the maximum likelihood estimators of all the parameters remains
inconsistent. The maximum length of time period in our sample is 28, 28 considered
moderately large. Chamberlain (1980) presents a conditional fixed effect model in which
estimates are less efficient than they are in the fixed effect model, but consistent even if T
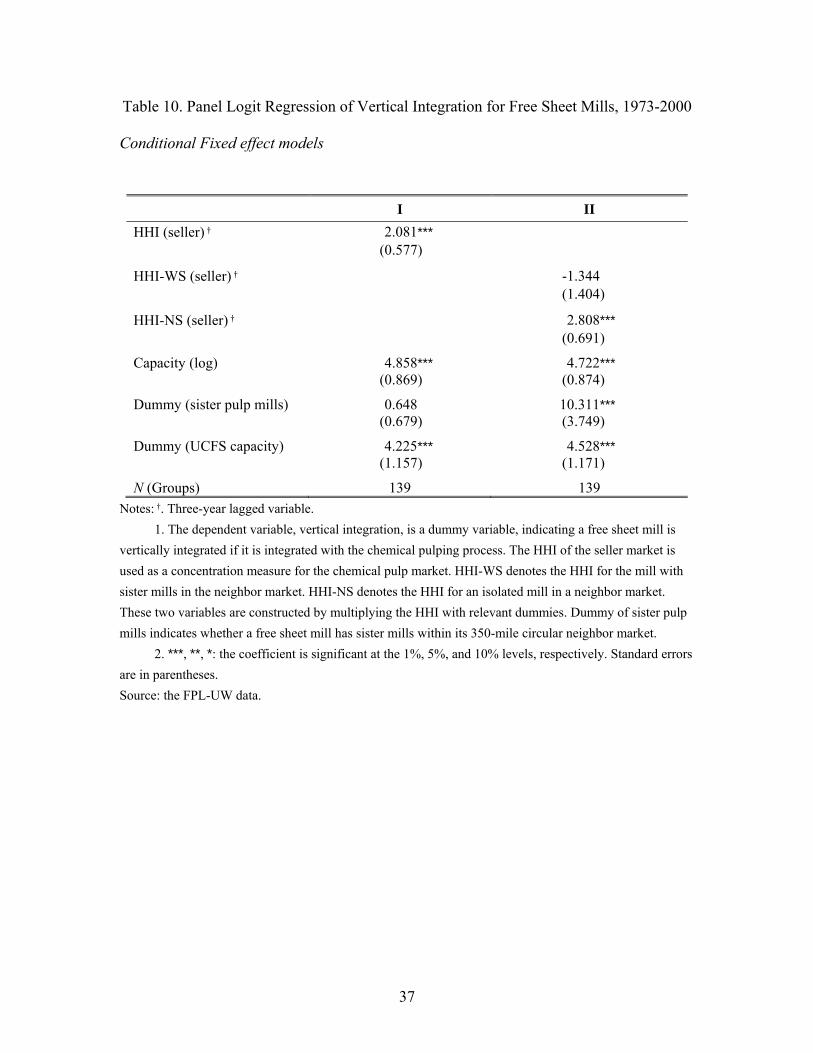
does not tend to infinity. Table 10 shows estimates from two conditional fixed effect
models. The results are quite similar to those in Table 9. While one common coefficient
of concentration is estimated (the column I), this coefficient is significantly positive.
However, the coefficient of the dummy for the sister pulp mill is insignificant. When two
coefficients of concentration are estimated, the one of HHI-WS is insignificant, and the
28 As three-year lagged concentration is used, our sample years are from 1973 to 2000.
22
other one of HHI-NS is significantly positive. Meanwhile, the coefficient of the dummy
for the sister pulp mill becomes highly significant.
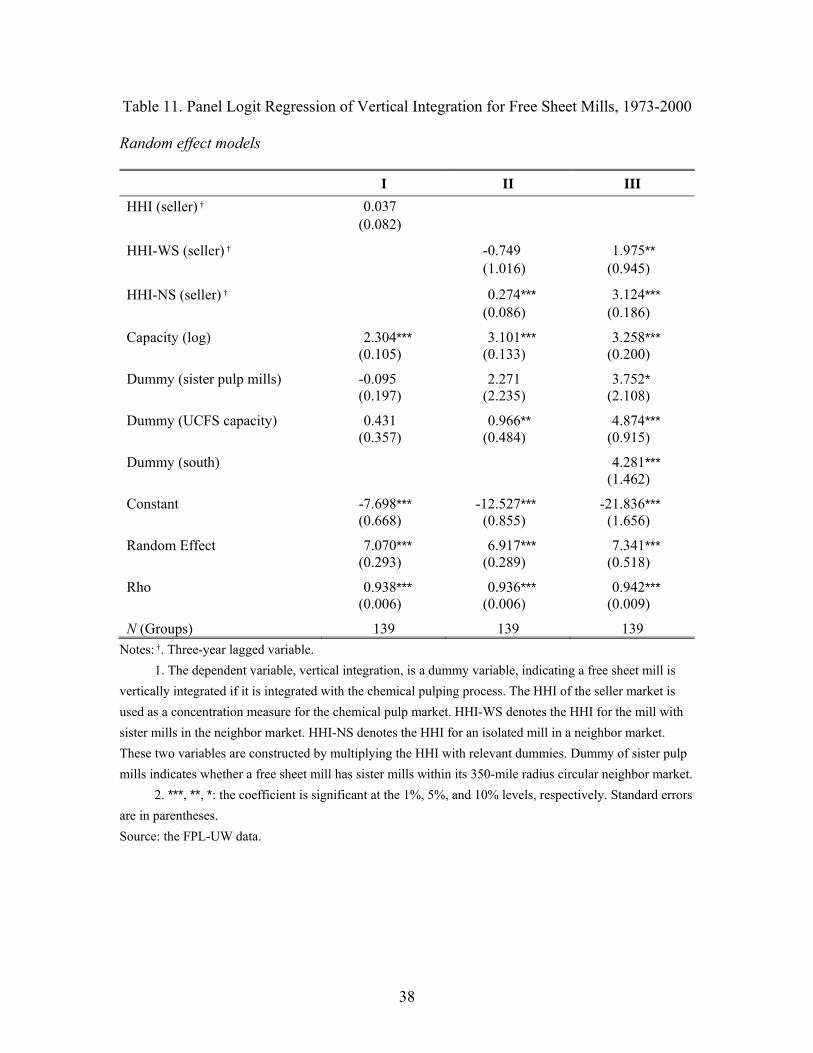
Associated with the fixed effect model, the random effect model can be used
under the assumption that the idiosyncratic time-invariant factors are independent of the
capacity and market concentration. Table 11 presents the estimates of the random effect
models, which slightly differ from those in the fixed effect models. In the one-
concentration-coefficient model (column I), the coefficient of concentration is
insignificantly positive, and the coefficient of the dummy for sister pulp mill is
insignificantly negative. However, with separate concentration effects applied (column II),
the results are again consistent with what we expected. The coefficient of HHI-WS is
insignificant from zero, and the coefficient of HHI-NS is significantly positive. The
coefficient of the dummy for the sister mills is still positive, but only significant at a 30%
level, which needs to be further investigated. We can add time-invariant variables in the
random effect model. When the South dummy is added (column III), all coefficients are
significantly positive, at least at a 10% level. The random effect models do not show as
robust results as the fixed effect models, but they are still acceptable and close to our
expectation.
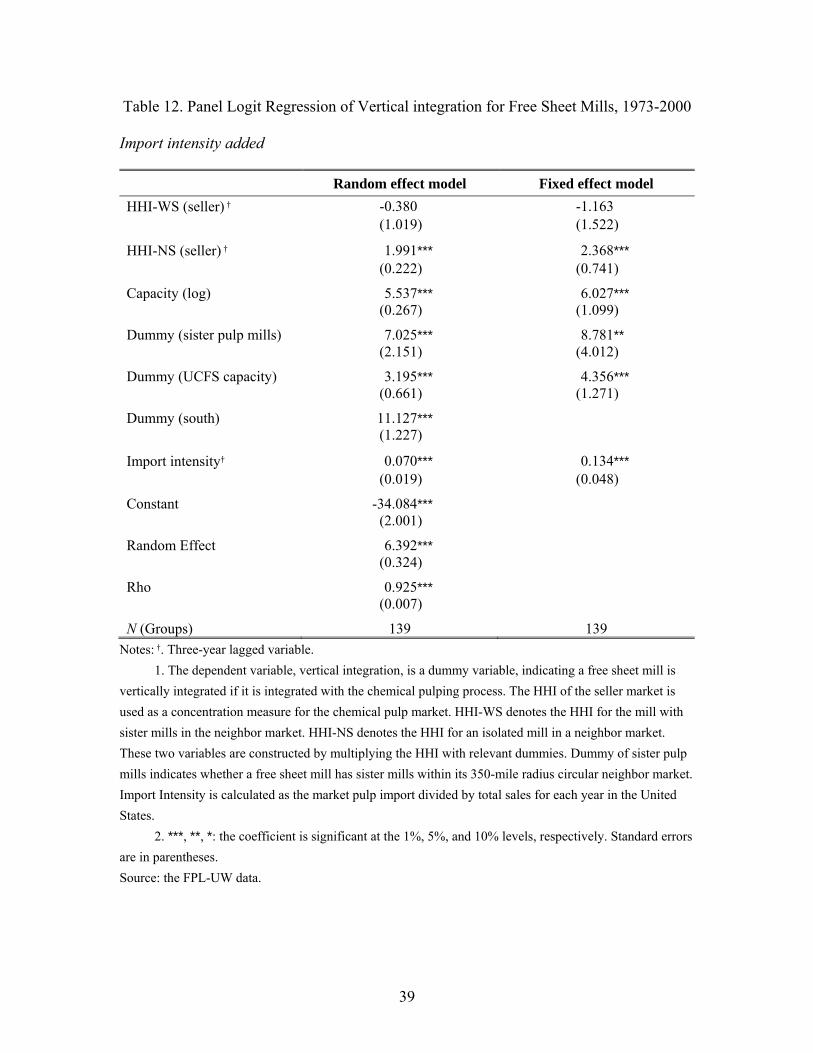
The variables we introduce into the models may not capture all the determinants
of vertical integration, but we find it difficult to locate other panel variables in the FPL-
UW or outer sources. We add an import intensity variable to our panel models to capture
the global effect of transaction cost. Import intensity, a time-series variable, has only one
value for each year. Adding such a factor cannot bring a better fit for the two-way fixed
effect model with full year dummies, but this is a good attempt to the random effect
model. The estimated results are shown in Table 12 with the random effect model in
column I and the fixed effect model in column II. The coefficients of import intensity are
significantly positive and consistent with our expectations. Higher import intensity
implies a possibility that the transaction cost for domestic product is relatively higher to
23
the transaction cost for foreign product, given the foreign supply does not vary and the
relative price of domestic and foreign pulp does not change. The coefficient of HHI-WS
becomes insignificant compared to that estimated without time factors in column III of
Table 9, the same as that in the fixed effect model now.
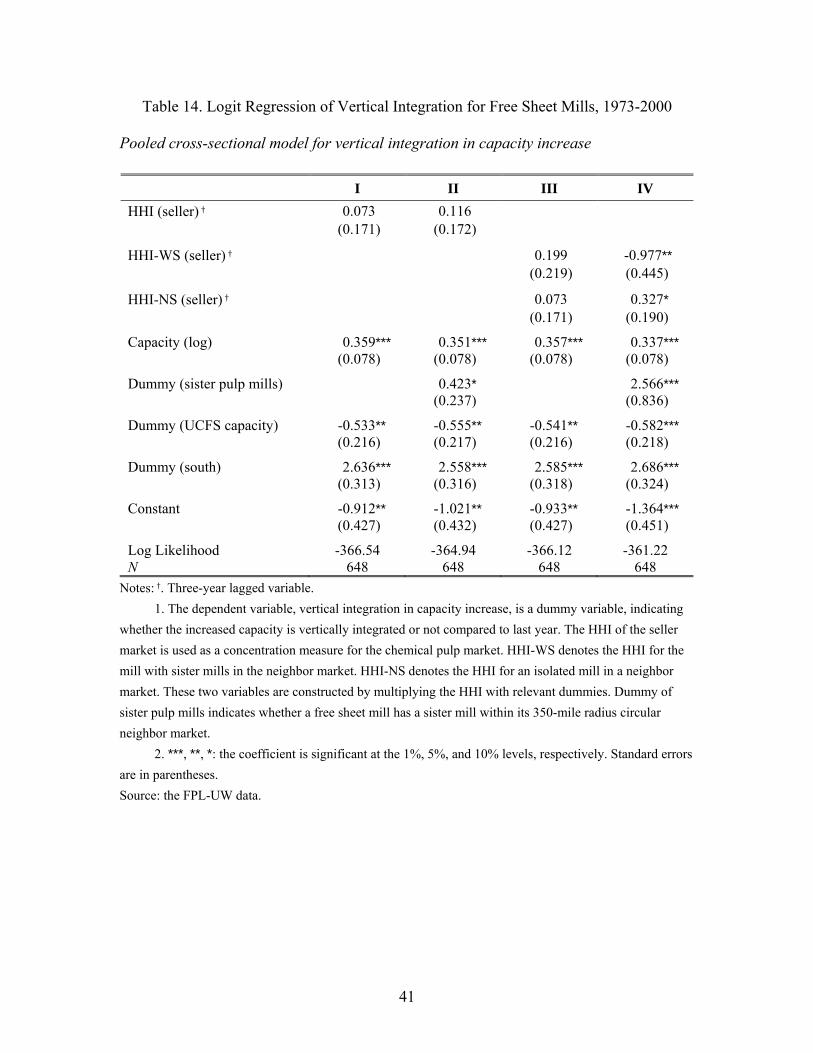
7. Robustness Check for Integration Dynamics
In the above sections, we have focused on analyzing the relationship between
integration status and market concentration. Integration dynamics is more interesting
because it implies more causal interpretation for independent variables. Since the number
of mills in this industry keeps declining, the size of the sample of new-entry free sheet
mills is relatively small. We are considering the sample in which free sheet mills increase
their free sheet capacities compared with the previous year, which also includes all the
new-entry mills. The sample size is thus enlarged from 29 to 648, but the sample is
notably unbalanced. Although some mills continued to increase their capacities in recent
years, capacity increase occurred at some mills only one time, so these mills were
dropped in the fixed effect models. Therefore, we can give the estimates only from
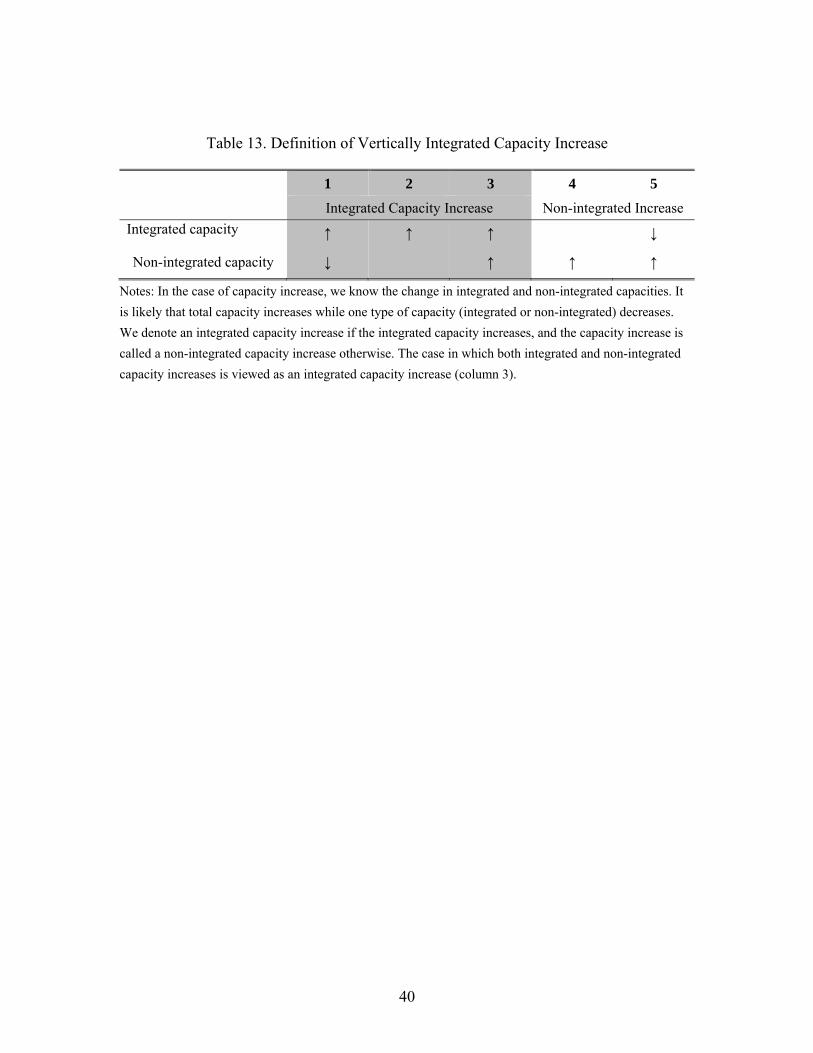
pooled models. Some variables are redefined in the pooled models for the new sample.
The binary dependent variable indicates whether the increased capacity is vertically
integrated or not compared to previous year. 29 The variable of capacity measures
increased capacity. The dummy variable of uncoated free sheet capacity indicates
whether increased capacity included uncoated free sheet capacity or not. In addition, the
concentration variable is one-year lagged since capacity increase can be a short term
strategy in contrast to the change in total capacity. Obviously, the estimates for 29 In the case of capacity increase, we know the change in integrated and non-integrated capacities. It is likely that total capacity increases while one type of capacity (integrated or non-integrated) decreases. Please see Table 13 for an illustrative explanation. We denote an integrated capacity increase if the integrated capacity increases, and the capacity increase is called a non-integrated capacity increase otherwise. The case in which both integrated and non-integrated capacity increases is viewed as an integrated capacity increase.
24
integration in capacity increase (Table 14) are very similar to the estimates obtained from
the integration status model (Table 8) that examines vertical integration in total capacity.
If a single effect of concentration is estimated, this effect is insignificantly positive
regardless of whether or not the sister pulp mill dummy is added (columns I and II). If
two separate effects of concentration are estimated, the estimates are similar to those
estimated in the pooled logit model for integration status (column III and IV). The
coefficient of HHI-WS is significantly negative while the coefficient of HHI-NS is
significantly positive. Since we cannot go further to the panel models, the robustness in
pooled models cannot guarantee the same results in the panel models. However, as the
estimates are biased downward in the pooled models, we anticipate a more significant
effect of HHI-NS in the correctly specified model, which is consistent with the TCE.
8. Summary and Conclusions
Based on the FPL-UW data, this study has produced results from cross-sectional, pooled,
and panel logit models that analyze the relationship between market concentration and
vertical integration in the pulp and paper industry. The transaction cost economics
indicates that this relationship should be positive, which is verified in Ohanian (1994), as
market concentration can be viewed as a proxy of asset specificity and transaction cost.
However, the new updated data from FPL fail to repeat Ohanian’s results in a duplicate
model due to the existence of endogeneity, which is now revealed in that technological
change tremendously changed the structure of industry.
Before extending our analysis to panel regression, due to the naturally integrated
production nowadays of the low-grade paper product such as newsprint, kraft, and
paperboard, we refine the model by narrowing the sample to free sheet mills and
introducing a mill-specific measure for concentration. Free sheet mills are likely to
purchase chemical pulp in the market because of higher profit margins even though
chemical pulp is also much more expensive. With the introduction of a mill-specific
25
concentration measure, we hope to locate the neighbor market in which the paper mill can
purchase market pulp at a lower cost. Free sheet mills are further divided into two
categories, those with or without sister pulp mills in their neighbor markets, because they
have a different pattern of vertical integration at the mill level caused by the different
status of vertical integration at the firm level.
In the cross-sectional and pooled logit models, the buyer concentration of paper mills is
positively associated with their integration status, but the estimates are sometimes
insignificant. Meanwhile, the coefficient of concentration for paper mills with access to
in-firm purchasing is expected to be insignificant from zero; however, it is significantly
negative in pooled models. Since controlling the technological factors of integration in
cross-sectional models which benefits the production is difficult, we utilize the panel
feature of the thirty-year data in order to control the time-invariant factors that affect the
strategy of vertical integration and correlate with market concentration, such as forestland
abundance. The estimates from the panel models all confirm our expectations. For
isolated mills in neighbor pulp markets, market concentration is positively correlated with
vertical integration. Furthermore, the mills along with sister pulp mills nearby are likely
to get pulp within their own firm; thus, their strategy of integration is affected little by
market concentration. Checked by various panel models, such as fixed effect, conditional
fixed effect, and random effect models, the results are robust enough to support our
hypothesis derived from transaction cost economics. Integration dynamics is investigated
tentatively in a pooled logit model when we look at the strategy of vertical integration
when free sheet mills increase capacity relative to the previous year. No dissimilarity
between the models appears whether the focus is on vertical integration in total capacity
or that in increased capacity.
In conclusion, many economic factors that affect vertical integration can be attributed to
the technological economy, which should be controlled in empirical models. Previous
26
studies did not thoroughly explore this particular industry, so they did not identify the real
mechanism linking market concentration and vertical integration. We have redefined the
measure for market concentration by narrowing our sample to mills that are most strongly
affected by transaction cost in the paper industry. Then, using panel regression and
robustness check, we successfully verify the sound relationship between transaction cost
and vertical integration.
27
References: Acemoglu, Daron, Philippe Aghion, Rachel Griffith, and Fabrizio Zilibotti, (2004),
"Vertical Integration and Technology: Theory and Evidence," NBER Working Paper 10997, National Bureau of Economic Research.
Chamberlain, Gary, (1980), "Analysis of Covariance with Qualitative Data," Review of
Economic Studies, 47(1): 225-38. Diesen, Magnus, (1998), Economy of Integration, in Magnus Diesen (ed.), Economics of
the Pulp and Paper Industry, Helsinki: Fapet Oy. Globerman, Steven and Richard Schwindt, (1986), "The Organization of Vertically
Related Transactions in the Canadian Forest Products Industries," Journal of Economic Behavior and Organization, 7(2): 199-212.
Greene, William, (2003), Econometric Analysis, 5th edition, New Jersey: Prentice-Hall. Hsiao, Cheng, (2003), Analysis of Panel Data, 2nd edition, New York: Cambridge
University Press. Ince, Peter J., Xiaolei Li, Mo Zhou, Joseph Buongiorno, and Mary Reuter, (2001),
"United States paper, paperboard, and market pulp capacity trends by process and location, 1970-2000," Research paper FPL-RP; 602, Forest Products Laboratory.
Li, Haizheng, Patrick McCarthy, and Aselia Urmanbetova, (2005), “Industry
Consolidation and Price-Cost Margins: Evidence from Pulp and Paper Industry,” working paper, School of Economics, Georgia Institute of Technology.
Joskow, Paul L., (2005), Vertical Integration, in Claude Ménard and Mary M. Shirley
(eds.), Handbook of New Institutional Economics, Amsterdam: Springer. Klein, Benjamin, Robert G. Crawford, and Armen A. Alchian, (1978), "Vertical
Integration, Appropriable Rents, and the Competitive Contracting Process," Journal of Law and Economics, 21(2): 297-326.
Klein, Peter G., (2005), The Make-or-Buy Decision: Lessons from Empirical Studies, in
Claude Ménard and Mary M. Shirley (eds.), Handbook of New Institutional Economics, Amsterdam: Springer.
28
MacDonald, James M., (1985), "Market Exchange or Vertical Integration: An Empirical
Analysis," Review of Economics and Statistics, 67(2): 327-58. Melendez, Marcela, (2002), A Dynamic Model of Vertical Integration for the American
Pulp and Paper Industry, Ph.D. Dissertation, Yale University. Ohanian, Nancy Kane, (1993), The American pulp and paper industry, 1900-1940: Mill
survival, firm structure, and industry relocation, Westport, Conn. and London: Greenwood Press.
Ohanian, Nancy Kane, (1994), "Vertical Integration in the U.S. Pulp and Paper Industry,
1900-1940," Review of Economics and Statistics, 76(1): 202-07. Perry, Martin K., “Vertical Integration: Determinants and Effects,” in Richard
Schmalensee and Robert Willig, ed., Handbook of Industrial Organization- Volume 1. Amsterdam, The Netherlands: North Holland, 1992.
Toivanen, Hannes, (2004), Learning and Corporate Strategy: The Dynamic Evolution of
the North American Pulp and Paper Industry, 1860-1960, Ph.D. Dissertation, Georgia Institute of Technology.
Whinston, Michael D., (2003), "On the Transaction Cost Determinants of Vertical
Integration," Journal of Law Economics, and Organization, 19(1): 1-23. Williamson, Oliver E., (1975), Markets and Hierarchies: Analysis and Antitrust
Implications, New York: The Free Press. Zavatta, Roberto, (1993), The Pulp and Paper Industry, in H. W. de Jong (ed.), The
Structure of European Industry, 3rd edition, Amsterdam: Kluwer Academic Publishers.
29
Table 1. Vertical Integration in the Pulp and Paper Industry, 1975-1995
1975 1980 1985 1990 1995
Statistics from the FPL-UW Data
Number of integrated paper mills 236 233 232 233 222
Number of total paper mills 549 527 505 502 496
Percentage of integrated paper mills 43% 44% 46% 46% 45%
Percentage of integrated paper mills based on Lockwood’s Directory (Melendez, 2002) 46% 53% 44% 47% 46%
Source: the FPL-UW data and Melendez (2002).
Table 2. Variable Means for the Model of Paper Mills
Integrated vs. Nonintegrated Paper Mills
1900 1940 1970 2000
NITG ITG NITG ITG NITG ITG NITG ITG
Number of mills 612 147 546 152 312 239 256 214
Average paper capacity per mill† 3 13 22 61 45 173 91 361
Dummy (Newsprint) 0.06 0.37 0.00 0.16 0.01 0.08 0.02 0.09
Dummy (Kraft) — — 0.07 0.26 0.02 0.12 0.03 0.07
Average regional concentration (CR4) 0.04 0.06 0.05 0.07 0.09 0.08 0.12 0.09
Notes: †Thousand short tons per year. 1. NITG: non-integrated; ITG: integrated. Source: the FPL-UW data and Ohanian (1994).
30
Table 3. Logit Regression Model of Vertical Integration, 1970-2000
Basic model with the sample of all paper/paperboard mills
1970 1980 1990 2000 Concentration (CR4 prod.) -14.968*** -7.239** -5.010** -2.123 (4.006) (3.145) (2.479) (1.756)
Capacity (log) 0.748*** 0.799*** 0.787*** 0.779*** (0.094) (0.103) (0.101) (0.098)
Dummy (Newsprint) 1.325** 1.209* 0.712 1.085* (0.662) (0.653) (0.587) (0.583)
Dummy (Kraft) 1.177** 1.323** 0.622 0.645 (0.531) (0.544) (0.543) (0.547)
Constant -2.029*** -3.020*** -3.196*** -3.684*** (0.549) (0.609) (0.592) (0.557)
Log likelihood -299.82 -285.64 -281.64 -266.07 N 551 527 502 470
Note: 1. The dependent variable, vertical integration, is a dummy variable, which equals one if a paper mill is integrated with the pulping process. The concentration ratio is the product of the ratios of top-four paper mill capacity and top four market pulp capacity in the region. 2. ***, **, *: the coefficient is significant at the 1%, 5%, and 10% levels, respectively. Standard errors are in parentheses.
Source: the FPL-UW data.
31
Table 4. Descriptive Statistics for Free Sheet Mills, 1970-2000
1970 1980 1990 2000
Number of free sheet mills†
Free sheet capacity only 82 87 88 80
Total free sheet mills 116 117 120 108
Integrated mills 65 69 74 69
Integration ratio 56% 59% 62% 64%
Number of free sheet firms 50 48 36 35
Single free sheet mill firms† 30 30 22 22
Integrated capacity (thou. short tons/year) 5408 7822 11703 16438
Total free sheet capacity (thou. short tons/year) 9022 12128 16808 22069
Notes: †. Free sheet mills are defined as mills with positive free sheet capacity. Single free sheet mill firms denote firms with only one free sheet mill. Source: the FPL-UW data.
32
Table 5. Descriptive Statistics for Free Sheet Mills
Integrated vs. Nonintegrated Free Sheet Mills
1980 1990 2000
NITG ITG NITG ITG NITG ITG
Number of mills 48 69 46 74 39 69
Paper capacity† 58 136 77 179 75 278
Dummy (uncoated free sheet capacity) 0.833 0.942 0.826 0.892 0.872 0.855
Dummy (south) 0.021 0.246 0.043 0.311 0.051 0.319
Dummy (sister pulp mills) 0.146 0.217 0.196 0.230 0.051 0.261
HHI-paper, 3-year-lagged 858 1335 1078 1341 1268 1500
HHI-pulp, 3-year-lagged 1433 1608 1784 1711 2011 2024
Number of non-freesheet mills 20 390 15 367 13 349
Notes: †. Thousand short tons per year. 1. NITG: non-integrated; ITG: integrated. Source: The FPL-UW data.
33
Table 6. Logit Regression of Vertical Integration for Free Sheet Mills, 1980-2000
Cross-sectional model with HHI product as concentration measure
1980 1990 2000 HHI (product) 3-year-lagged 0.338 0.028 -0.108 (0.273) (0.124) (0.171)
Capacity (log) 1.236*** 1.051*** 1.560*** (0.280) (0.263) (0.331)
Dummy (uncoated free sheet production) 1.498** 0.886 0.693 (0.754) (0.628) (0.758)
Dummy (south) 1.874 1.659** 1.146 (1.223) (0.812) (0.935)
Constant -6.745*** -5.241*** -7.094*** (1.446) (1.403) (1.842)
Log likelihood -53.70 -62.07 -46.09 N 117 120 108
Notes: 1. The dependent variable, vertical integration, defined as a dummy variable with one indicating a free sheet mill integrated with the chemical pulping process. The HHI product is the concentration measure obtained by multiplying the HHI of the seller and buyer markets for chemical pulp. 2. ***, **, *: the coefficient is significant at the 1%, 5%, and 10% levels, respectively. Standard errors are in parentheses. 3. Three-year lagged concentration is used since three year is an appropriate length for a mill to make decision to change integrated status.
Source: the FPL-UW data.
34
Table 7. Logit Regression of Vertical Integration for Free Sheet Mills, 1980-2000
Cross-sectional model with sister mill dummy 1980 1990 2000 HHI (prod) 3-year-lagged
0.465 0.065 -0.105
(0.343) (0.141) (0.171) Capacity(log) 1.284*** 1.063*** 1.586*** (0.290) (0.264) (0.351) Dummy (uncoated free sheet capacity)
1.511** 0.851 0.734
(0.744) (0.635) (0.780) Dummy (south) 1.834 1.723** 1.181 (1.270) (0.823) (0.941) Dummy of sister pulp mills
-0.711 -0.441 -0.232
(0.668) (0.608) (0.938) Constant -6.982*** -5.263*** -7.238*** (1.474) (1.408) (1.948) Log Likelihood -53.12 -61.80 -46.06 N 117 120 108 Notes: 1. The dependent variable, vertical integration, is a dummy variable, indicating a free sheet mill is vertically integrated if it is integrated with the chemical pulping process. HHI-WS denotes the HHI for the mill with sister mills in the neighbor market. HHI-NS denotes the HHI for an isolated mill in a neighbor market. These two variables are constructed by multiplying the HHI with relevant dummies. Dummy of sister pulp mills indicates whether a free sheet mill has a sister mill within its 350-mile radius circular neighbor market. 2. ***, **, *: the coefficient is significant at the 1%, 5%, and 10% levels, respectively. Standard errors are in parentheses. 3. Three-year lagged variables are used since three year is an appropriate period for a mill to make decision to change integrated status. One-year lagged and two-year lagged variables are also tested. The results are robust. Source: the FPL-UW data.
35
Table 8. Logit Regression of Vertical Integration for Free Sheet Mills, 1973-2000
Pooled cross-sectional model with various specifications of concentration measure
I II III IV HHI (product)† 0.034* (0.023)
HHI (seller market) † -0.059 (0.095)
HHI-WS (seller) † -1.016*** -0.983*** (0.237) (0.238)
HHI-NS (seller) † 0.156 0.191* (0.109) (0.112)
Import intensity† 0.017* (0.011)
Capacity (log) 1.265*** 1.273*** 1.248*** 1.255*** (0.053) (0.053) (0.053) (0.054)
Dummy (sister pulp mills) -0.309*** -0.285** 1.657*** 1.662*** (0.116) (0.115) (0.448) (0.448)
Dummy (UCFS capacity) 1.089*** 1.096*** 1.071*** 1.067*** (0.129) (0.129) (0.130) (0.130)
Dummy (south) 1.700*** 1.717*** 1.740*** 1.746*** (0.176) (0.176) (0.175) (0.176)
Constant -6.166*** -6.044*** -6.298*** -6.958*** (0.279) (0.316) (0.324) (0.546)
Log Likelihood -1572.02 -1572.96 -1562.37 -1561.21 N 3,235 3,235 3,235 3,235
Notes: †. Three-year lagged variable. 1. The dependent variable, vertical integration, is a dummy variable, indicating a free sheet mill is vertically integrated if it is integrated with the chemical pulping process. The HHI product is a concentration measure by multiplying the HHI of the seller and buyer markets for chemical pulp. The HHI of the seller market is used as another concentration measure for the chemical pulp market. HHI-WS denotes the HHI for the mill with sister mills in the neighbor market. HHI-NS denotes the HHI for an isolated mill in a neighbor market. These two variables are constructed by multiplying the HHI with relevant dummies. Dummy of sister pulp mills indicates whether a free sheet mill has a sister mill within its 350-mile radius circular neighbor market. 2. ***, **, *: the coefficient is significant at the 1%, 5%, and 10% levels, respectively. Standard errors are in parentheses. 3. In Column IV, the coefficient of HHI-WS is significantly negative and the coefficient of HHI-NS is positive. Therefore, the different between the coefficients of HHI-WS and HHI-NS is significant. In the following results, this criteria can be applied to many cases.
36
Table 9. Panel Logit Regression of Vertical Integration for Free Sheet Mills, 1973-2000 Fixed effect models
I II III IV V HHI (seller) † 1.896*** (0.615)
HHI-WS (seller) † 1.889*** -1.436 -0.272 0.002 (0.679) (1.459) (1.858) (0.019)
HHI-NS (seller) † 1.824*** 2.662*** 4.946*** 0.052*** (0.603) (0.730) (1.239) (0.009)
Capacity (log) 5.136*** 5.186*** 4.999*** 13.297*** 0.056*** (0.919) (0.919) (0.928) (2.679) (0.009)
Dummy (sister pulp mills) 0.622 10.137*** 10.436** 0.091*** (0.688) (3.893) (4.987) (0.034)
Dummy (UCFS capacity) 4.267*** 4.250*** 4.580*** 3.880 0.148*** (1.183) (1.186) (1.201) (2.547) (0.021)
N (Groups) 75 75 75 75 75 Notes: †. Three-year lagged variable. 1. The dependent variable, vertical integration, is a dummy variable, indicating a free sheet mill is vertically integrated if it is integrated with the chemical pulping process. The HHI of the seller market is used as a concentration measure for the chemical pulp market. HHI-WS denotes the HHI for the mill with sister mills in the neighbor market. HHI-NS denotes the HHI for an isolated mill in a neighbor market. These two variables are constructed by multiplying the HHI with relevant dummies. Dummy of sister pulp mills indicates whether a free sheet mill has a sister mill within its 350-mile radius circular neighbor market. 2. ***, **, *: the coefficient is significant at the 1%, 5%, and 10% levels, respectively. Standard errors are in parentheses. 3. Column I : fixed effect model Column II : fixed effect model Column III : fixed effect model Column IV : two way fixed effect model with time effects Column IV : fixed effect model (linear probability model) Source: the FPL-UW data.
37
Table 10. Panel Logit Regression of Vertical Integration for Free Sheet Mills, 1973-2000
Conditional Fixed effect models
I II HHI (seller) † 2.081*** (0.577)
HHI-WS (seller) † -1.344 (1.404)
HHI-NS (seller) † 2.808*** (0.691)
Capacity (log) 4.858*** 4.722*** (0.869) (0.874)
Dummy (sister pulp mills) 0.648 10.311*** (0.679) (3.749)
Dummy (UCFS capacity) 4.225*** 4.528*** (1.157) (1.171)
N (Groups) 139 139 Notes: †. Three-year lagged variable. 1. The dependent variable, vertical integration, is a dummy variable, indicating a free sheet mill is vertically integrated if it is integrated with the chemical pulping process. The HHI of the seller market is used as a concentration measure for the chemical pulp market. HHI-WS denotes the HHI for the mill with sister mills in the neighbor market. HHI-NS denotes the HHI for an isolated mill in a neighbor market. These two variables are constructed by multiplying the HHI with relevant dummies. Dummy of sister pulp mills indicates whether a free sheet mill has sister mills within its 350-mile circular neighbor market. 2. ***, **, *: the coefficient is significant at the 1%, 5%, and 10% levels, respectively. Standard errors are in parentheses. Source: the FPL-UW data.
38
Table 11. Panel Logit Regression of Vertical Integration for Free Sheet Mills, 1973-2000
Random effect models
I II III HHI (seller) † 0.037 (0.082)
HHI-WS (seller) † -0.749 1.975** (1.016) (0.945)
HHI-NS (seller) † 0.274*** 3.124*** (0.086) (0.186)
Capacity (log) 2.304*** 3.101*** 3.258*** (0.105) (0.133) (0.200)
Dummy (sister pulp mills) -0.095 2.271 3.752* (0.197) (2.235) (2.108)
Dummy (UCFS capacity) 0.431 0.966** 4.874*** (0.357) (0.484) (0.915)
Dummy (south) 4.281*** (1.462)
Constant -7.698*** -12.527*** -21.836*** (0.668) (0.855) (1.656)
Random Effect 7.070*** 6.917*** 7.341*** (0.293) (0.289) (0.518)
Rho 0.938*** 0.936*** 0.942*** (0.006) (0.006) (0.009)
N (Groups) 139 139 139 Notes: †. Three-year lagged variable. 1. The dependent variable, vertical integration, is a dummy variable, indicating a free sheet mill is vertically integrated if it is integrated with the chemical pulping process. The HHI of the seller market is used as a concentration measure for the chemical pulp market. HHI-WS denotes the HHI for the mill with sister mills in the neighbor market. HHI-NS denotes the HHI for an isolated mill in a neighbor market. These two variables are constructed by multiplying the HHI with relevant dummies. Dummy of sister pulp mills indicates whether a free sheet mill has sister mills within its 350-mile radius circular neighbor market. 2. ***, **, *: the coefficient is significant at the 1%, 5%, and 10% levels, respectively. Standard errors are in parentheses. Source: the FPL-UW data.
39
Table 12. Panel Logit Regression of Vertical integration for Free Sheet Mills, 1973-2000
Import intensity added
Random effect model Fixed effect model HHI-WS (seller) † -0.380 -1.163 (1.019) (1.522)
HHI-NS (seller) † 1.991*** 2.368*** (0.222) (0.741)
Capacity (log) 5.537*** 6.027*** (0.267) (1.099)
Dummy (sister pulp mills) 7.025*** 8.781** (2.151) (4.012)
Dummy (UCFS capacity) 3.195*** 4.356*** (0.661) (1.271)
Dummy (south) 11.127*** (1.227)
Import intensity† 0.070*** 0.134*** (0.019) (0.048)
Constant -34.084*** (2.001)
Random Effect 6.392*** (0.324)
Rho 0.925*** (0.007)
N (Groups) 139 139 Notes: †. Three-year lagged variable. 1. The dependent variable, vertical integration, is a dummy variable, indicating a free sheet mill is vertically integrated if it is integrated with the chemical pulping process. The HHI of the seller market is used as a concentration measure for the chemical pulp market. HHI-WS denotes the HHI for the mill with sister mills in the neighbor market. HHI-NS denotes the HHI for an isolated mill in a neighbor market. These two variables are constructed by multiplying the HHI with relevant dummies. Dummy of sister pulp mills indicates whether a free sheet mill has sister mills within its 350-mile radius circular neighbor market. Import Intensity is calculated as the market pulp import divided by total sales for each year in the United States. 2. ***, **, *: the coefficient is significant at the 1%, 5%, and 10% levels, respectively. Standard errors are in parentheses. Source: the FPL-UW data.
40
Table 13. Definition of Vertically Integrated Capacity Increase
1 2 3 4 5
Integrated Capacity Increase Non-integrated Increase Integrated capacity ↑ ↑ ↑ ↓
Non-integrated capacity ↓ ↑ ↑ ↑
Notes: In the case of capacity increase, we know the change in integrated and non-integrated capacities. It is likely that total capacity increases while one type of capacity (integrated or non-integrated) decreases. We denote an integrated capacity increase if the integrated capacity increases, and the capacity increase is called a non-integrated capacity increase otherwise. The case in which both integrated and non-integrated capacity increases is viewed as an integrated capacity increase (column 3).
41
Table 14. Logit Regression of Vertical Integration for Free Sheet Mills, 1973-2000
Pooled cross-sectional model for vertical integration in capacity increase
I II III IV HHI (seller) † 0.073 0.116 (0.171) (0.172)
HHI-WS (seller) † 0.199 -0.977** (0.219) (0.445)
HHI-NS (seller) † 0.073 0.327* (0.171) (0.190)
Capacity (log) 0.359*** 0.351*** 0.357*** 0.337*** (0.078) (0.078) (0.078) (0.078)
Dummy (sister pulp mills) 0.423* 2.566*** (0.237) (0.836)
Dummy (UCFS capacity) -0.533** -0.555** -0.541** -0.582*** (0.216) (0.217) (0.216) (0.218)
Dummy (south) 2.636*** 2.558*** 2.585*** 2.686*** (0.313) (0.316) (0.318) (0.324)
Constant -0.912** -1.021** -0.933** -1.364*** (0.427) (0.432) (0.427) (0.451)
Log Likelihood -366.54 -364.94 -366.12 -361.22 N 648 648 648 648
Notes: †. Three-year lagged variable. 1. The dependent variable, vertical integration in capacity increase, is a dummy variable, indicating whether the increased capacity is vertically integrated or not compared to last year. The HHI of the seller market is used as a concentration measure for the chemical pulp market. HHI-WS denotes the HHI for the mill with sister mills in the neighbor market. HHI-NS denotes the HHI for an isolated mill in a neighbor market. These two variables are constructed by multiplying the HHI with relevant dummies. Dummy of sister pulp mills indicates whether a free sheet mill has a sister mill within its 350-mile radius circular neighbor market. 2. ***, **, *: the coefficient is significant at the 1%, 5%, and 10% levels, respectively. Standard errors are in parentheses. Source: the FPL-UW data.