Embed Size (px)
Citation preview
Does Female Suffrage Increase Public Support for Government Spending?
Evidence from Swiss Ballots
Katharina E. Jaronicki
CESIFO WORKING PAPER NO. 4467 CATEGORY 2: PUBLIC CHOICE
NOVEMBER 2013
An electronic version of the paper may be downloaded • from the SSRN website: www.SSRN.com • from the RePEc website: www.RePEc.org
• from the CESifo website: Twww.CESifo-group.org/wp T
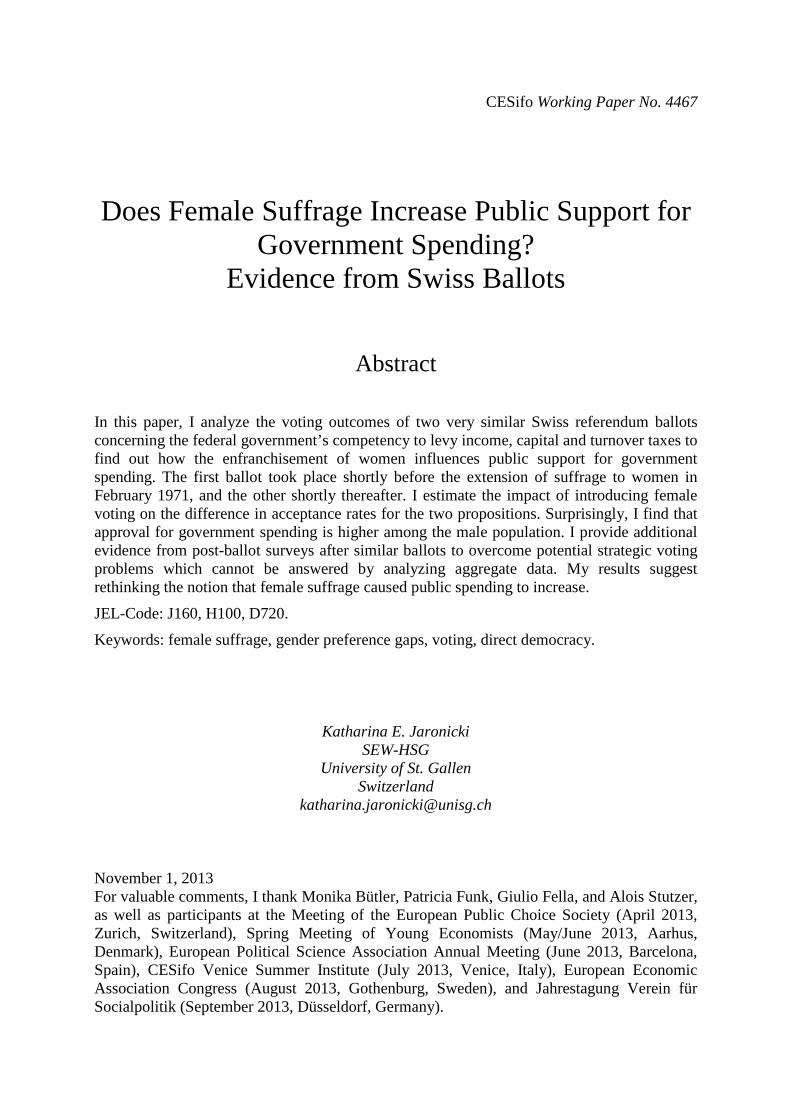
CESifo Working Paper No. 4467 Does Female Suffrage Increase Public Support for
Government Spending? Evidence from Swiss Ballots
Abstract In this paper, I analyze the voting outcomes of two very similar Swiss referendum ballots concerning the federal government’s competency to levy income, capital and turnover taxes to find out how the enfranchisement of women influences public support for government spending. The first ballot took place shortly before the extension of suffrage to women in February 1971, and the other shortly thereafter. I estimate the impact of introducing female voting on the difference in acceptance rates for the two propositions. Surprisingly, I find that approval for government spending is higher among the male population. I provide additional evidence from post-ballot surveys after similar ballots to overcome potential strategic voting problems which cannot be answered by analyzing aggregate data. My results suggest rethinking the notion that female suffrage caused public spending to increase.
JEL-Code: J160, H100, D720.
Keywords: female suffrage, gender preference gaps, voting, direct democracy.
Katharina E. Jaronicki
SEW-HSG University of St. Gallen
Switzerland [email protected]
November 1, 2013 For valuable comments, I thank Monika Bütler, Patricia Funk, Giulio Fella, and Alois Stutzer, as well as participants at the Meeting of the European Public Choice Society (April 2013, Zurich, Switzerland), Spring Meeting of Young Economists (May/June 2013, Aarhus, Denmark), European Political Science Association Annual Meeting (June 2013, Barcelona, Spain), CESifo Venice Summer Institute (July 2013, Venice, Italy), European Economic Association Congress (August 2013, Gothenburg, Sweden), and Jahrestagung Verein für Socialpolitik (September 2013, Düsseldorf, Germany).
1 Introduction
Several influential contributions have found a positive relation between female enfranchisement
and a subsequent rise in government spending and revenue pointing towards the existence of stronger
female preferences for large governments (e.g., Abrams & Settle, 1999; Aidt & Dallal, 2008; Aidt,
Dutta, & Loukoianova, 2006; Lott & Kenny, 1999). Female risk aversion with the increased need for
insurance from the state, or the breakdown of the family leading to higher divorce rates constitute
some of the most commonly provided explanations.
However, this literature does not convincingly show where gender gaps originate from: are they
due to “being female” or can they partly be explained by observable differences between men and
women? For example, Meltzer and Richard (1981) famously hypothesized that enfranchising new
constituents such that the median voter is poorer than before, increases the demand for redistri-
bution. Consequently, one would expect that extending suffrage to women, who on average have
lower incomes than men, should have a positive effect on redistributive spending. Not controlling
for such socioeconomic gaps might falsely attribute some of the effects to the fact that women
can vote, instead of having enfranchised a new group which is on average poorer than the former
electorate.
Also, the existent literature relies on analyses in representative democracies. A potential causal
mechanism through which female voting could increase government spending is through politicians’
behavior. These either change their policies, or women elect new, more spending-friendly politicians.
To understand whether the relationship between higher expenditures and female voting is causal
or influenced by a third force, e.g. more liberal thinking, the analysis of elections and politicians
would be required. Yet, the literature is relatively silent on the causal mechanism which would lead
to higher expenditures.
Literature confirms that women vote more often in favor of higher welfare expenditure, but
the outcomes also depend on the issue the money is spent for. Husted and Kenny (1997) suggest
that to analyze the effect of universal enfranchisement on government spending, it is necessary to
distinguish welfare and non-welfare spending. On the one hand, literature predicts higher welfare
spending with a poorer median voter. On the other hand, the effect on non-welfare expenditures like
public services critically depends on income and price elasticities of public services. So, while there
exist clear-cut predictions and empirical evidence for gender preference gaps on several spending
categories, explaining why women would prefer larger governments per se turns out to be more
difficult.
This paper provides a direct way of analyzing gender preference gaps for government spending
from referendum ballots instead of establishing causality indirectly via higher government expen-
ditures. The merit of examining direct democratic ballots lies in the fact that voters make real,
observable choices and reveal their preferences in this way. To this goal, I analyze the voting out-
comes of two very similar referendum ballots in Switzerland concerning federal taxation of which
one took place shortly before the extension of suffrage to women in 1971, and the other directly
thereafter. The ballot propositions lay down the constitutional basis for the Swiss government to
levy income, capital and turnover taxes. They are a measure of preferences for the federal govern-
ment’s spending. Without popular approval at the ballot the Swiss government would be deprived
of its authorization to levy federal taxes which are crucial for financing state expenditures. While
taxation of income and consumption is commonly found all over the world, it is a Swiss particular-
1
ity that voters even nowadays need to accept it’s legislative basis every few years. Therefore, over
time a large number of comparable votes on the federal financial system exist.
The first proposition in November 1970 with a men-only suffrage was rejected at ballot. But the
second proposal, which took place 7 months later with universal suffrage, was accepted. Since the
two ballots took place under two distinct suffrage regimes, differences in voting outcomes can be
directly attributed to differences in the electorate. The main question to be answered in this paper
is where the increase in approval comes from and whether it can be ascribed to gender preference
gaps for government spending.
The analysis is based on data from 2.188 Swiss municipalities, and a set of control variables from
the Swiss 1970 census. To isolate female approval for government spending, a similar reasoning to
Lott and Kenny (1999) is employed. How much of the increase in voter approval for government
spending can be explained by female voting depends crucially on the intensity with which women
made use of their voting rights. Therefore, I first estimate the effect the introduction of female
suffrage had on voter participation defined as voters divided by the Swiss adult population. This
yields the additional participation which is due to female suffrage. Also, I take cantonal female
voting rights and the male approval rate for female suffrage as turnout controls: cantonal voting
rights are independent of federal voting rights and display strong variation among the cantons
which makes them likely to influence turnout. Second, I use these estimates to identify the effect
the increase in participation stemming from female suffrage had on the increase in the approval rate
for government spending. By controlling for employment, independent employment, and fraction
of the old, I take into account important socioeconomic gender gaps which might partly explain
gender differences in voting.
Moreover, I take into account that the two ballot proposals, though very similar, are not identical
but differ in so far that the second proposal included a time limit whereas the first one did not.
This means that even in case of acceptance the second proposal would have required a new ballot
after 10 years while the first one did not. Traditionally, permanent federal financial orders have
been rejected in Switzerland which suggests that the inclusion of a time limit is an important
factor influencing voter decisions. I utilize voting results from a similar ballot in 1963 under the
males-only suffrage to proxy for the difference in the content of the two ballots which might have
led to some men changing their voting behavior between the two ballots.
The results show that men were between 8.5 and 12.5 percentage points more likely to favor
taxation and thus government spending than women. These results contradict the notion that
women are per se more likely to support large governments.
Two main concerns are that these results might only hold true for the voting population, i.e. be
conditional on the individual decision to go to the polls. Second, women might have hesitated to
use their newly gained voting rights immediately such that the results underestimate true female
preferences. I overcome these problems by extending the analysis to individual post-ballot survey
data. They are available for both voting and non-voting respondents for three similar ballots about
the federal fiscal order in 1981, 1991 and 1993. Results confirm the above findings that men are
more likely to approve government spending than women also for the non-voting population.
This paper adds to the existing literature on the effects of franchise extension on government
spending and revenue as well as gender preference gaps. The main innovation in my approach is
to directly analyze the outcomes of ballots instead of relating suffrage to government spending.
2
With the notable exception of Funk and Gathmann (2012) who explore gender preference gaps
for different spending categories by utilizing ballot votes, literature has so far only analyzed the
effect of female suffrage on the size of state expenditure. This approach, however, is imperfect since
voters only elect politicians who finally decide upon policies. By analyzing outcomes of referendum
ballots, I provide evidence for how voters decide directly on taxation and consequently government
spending. I complement literature which emphasizes the importance of distinguishing between
spending items when it comes to analyzing gender preference gaps. While women might be more
likely to care for redistributive spending as can be inferred from Meltzer and Richard (1981), they
might be indifferent or even opposed to other spending categories.
The remainder of the paper is organized as follows. First, the related literature is reviewed in
the next section. Section 3 provides information on the institutional setting this paper is based on:
I give a short overview of the development of the Swiss federal tax system and the two referendum
ballots which constitute the core of my analysis. Also, I describe the data. The empirical strategy
and the results are presented in section 4. I provide additional evidence from post-ballot surveys
which substantiate the main findings in section 5. The paper concludes in section 6.
2 Related literature
The hypothesis that extending the franchise to a poorer part of the population increases public
spending and revenue has been tested in several interesting contributions. Husted and Kenny
(1997) exploit the repeal of literacy tests and poll taxes in the U.S. which hitherto prevented
the poor and foreigners from voting. They find a 15% increase in welfare spending but no effect
on non-welfare spending. Closest to my research, a stream of literature analyzes the extension of
franchise to women and its impact on government spending and revenue. With the enfranchisement
of women, the new median voter becomes poorer since it is a well-established fact that women have
lower employment rates and earn less than men.1 Therefore, women are generally more inclined
to support larger government expenditure than men. In marriage, husbands tend to earn more
and transfer income to their wives who specialize in household production instead and care for
the children (e.g., Becker, 1974). While income differences and specialization are internalized in
marriage, the possibility of divorce, however, makes women more vulnerable economically since
they might be rendered with a low income to care solely for the children. Alimony usually is too
low to sustain the same lifestyle as in marriage. Analyzing historical data from the U.S., Lott and
Kenny (1999) find that the introduction of female suffrage raised government spending and revenue
as gradually more women made use of their voting rights. Following Lott and Kenny (1999), Aidt
and Dallal (2008) confirm their results for six western European countries for which the long-run
effects are significantly larger than the short-run effects. Similarly, Abrams and Settle (1999) find
that the introduction of female suffrage in Switzerland increased government spending on welfare
issues by 28%, and also total government spending grew by about 12%. Aidt et al. (2006) confirm
these findings for Europe and find in particular that female voting increased spending on health,
welfare and education. Miller (2008) documents rising levels of public health expenditure that
1In Switzerland, women earned 51% of the male hourly wage in 1930, 66% in 1971 and 67% in 1995 which showshow big the gender wage gap was despite its tendency to decrease over time. This information is based on data fromthe Swiss Economic and Social History Online Database.
3
can be attributed to the enfranchisement of women. Bertocchi (2011) finds empirical support that
allowing women to vote increases government spending, however, only in non-catholic countries in
which the cost of disenfranchisement is relatively high.
In contrast, Stutzer and Kienast (2005) who use the variation in the timing of female suffrage
in Swiss cantons, i.e. the 26 states in Switzerland, find that surprisingly enfranchising women
decreased government expenditures at cantonal level. They conclude that the negative effect might
stem from the existence of direct democracy instruments in Swiss cantons for which previous
research shows that they are likely to lead to smaller government size (e.g., Feld and Matsusaka
(2003) provide some evidence). This literature does not provide a convincing rationale for how
female voting lead to increased government spending which would have required the analysis of
elections and politicians’ behavior.2
Another stream of research finds evidence that women vote differently than men. Edlund and
Pande (2002) show that with an increase in divorces women started to vote more leftwing than
men. They find that this effect is strongest for middle-income couples: in marriage, husbands
transfer income to their wives. After a divorce, the authors show, men become relatively richer and
women relatively poorer which increases the women’s need for welfare spending and the likelihood of
voting leftwing. By analyzing individual voting data for Swiss referendums and initiatives between
1983 and 2003, Funk and Gathmann (2012) find considerable gender differences in preferences for
spending on health, environment, defense, and the welfare state.
One concern might be that preference gaps could falsely be ascribed to gender which in truth
stem from socioeconomic differences. E.g., as suggested by Meltzer and Richard (1981), lower female
incomes leading to a poorer median voter after female enfranchisement might be an explanation
for the increase in government spending. However, this would not be a particularly “female”
effect but would be also expected after enfranchising a poorer part of the male population. My
research also sheds light on these questions since I control for socioeconomic gender gaps like
differences in employment, independent employment and the age structure which are likely to
explain some differences between male and female voting decisions. In this way I make sure that
parts of the gender preference gap which are due to socioeconomic gender differences are not
mistakenly attributed to “being female”.
Research based on experimental techniques examines gender gaps other than socioeconomic
differences which might explain why women could have different preferences for government than
men. Literature documents that women are more risk averse (e.g., Holt & Laurya, 2002, 2005;
Schubert et al., 1999) and dislike competition (Gneezy, Niederle & Rustichini, 2003; Niederle &
Vesterlund, 2007). Also, experimental evidence suggests that women are more altruistic, dislike
inequality (Andreoni & Vesterlund, 2001; Selten & Ockenfels, 1998), and are more in favor of
redistribution than men (Luttmer & Singhal, 2011).
2Lott and Kenny (1999) also look at the politicians’ voting behavior in the U.S. senate and find that after theintroduction of female suffrage politicians voted more liberally. However, they fail to show that women were morelikely to vote for liberal politicians and did so because they desired higher government spending.
4
3 Institutional setup and data
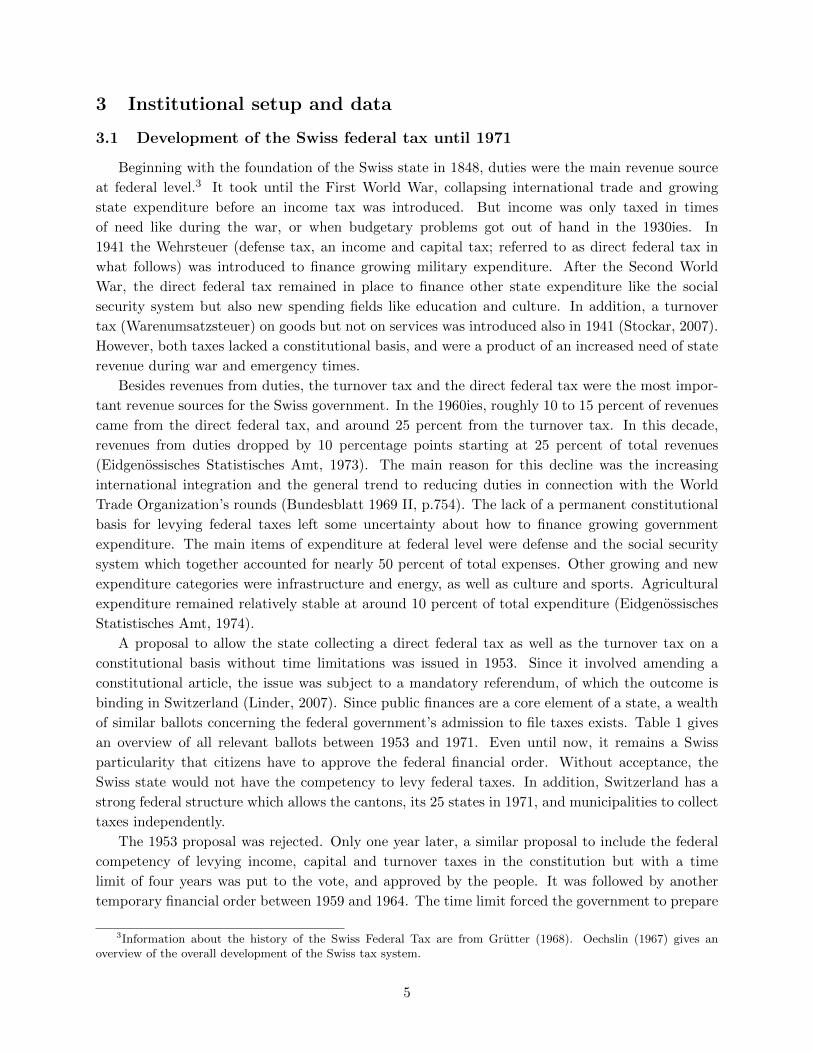
3.1 Development of the Swiss federal tax until 1971
Beginning with the foundation of the Swiss state in 1848, duties were the main revenue source
at federal level.3 It took until the First World War, collapsing international trade and growing
state expenditure before an income tax was introduced. But income was only taxed in times
of need like during the war, or when budgetary problems got out of hand in the 1930ies. In
1941 the Wehrsteuer (defense tax, an income and capital tax; referred to as direct federal tax in
what follows) was introduced to finance growing military expenditure. After the Second World
War, the direct federal tax remained in place to finance other state expenditure like the social
security system but also new spending fields like education and culture. In addition, a turnover
tax (Warenumsatzsteuer) on goods but not on services was introduced also in 1941 (Stockar, 2007).
However, both taxes lacked a constitutional basis, and were a product of an increased need of state
revenue during war and emergency times.
Besides revenues from duties, the turnover tax and the direct federal tax were the most impor-
tant revenue sources for the Swiss government. In the 1960ies, roughly 10 to 15 percent of revenues
came from the direct federal tax, and around 25 percent from the turnover tax. In this decade,
revenues from duties dropped by 10 percentage points starting at 25 percent of total revenues
(Eidgenossisches Statistisches Amt, 1973). The main reason for this decline was the increasing
international integration and the general trend to reducing duties in connection with the World
Trade Organization’s rounds (Bundesblatt 1969 II, p.754). The lack of a permanent constitutional
basis for levying federal taxes left some uncertainty about how to finance growing government
expenditure. The main items of expenditure at federal level were defense and the social security
system which together accounted for nearly 50 percent of total expenses. Other growing and new
expenditure categories were infrastructure and energy, as well as culture and sports. Agricultural
expenditure remained relatively stable at around 10 percent of total expenditure (Eidgenossisches
Statistisches Amt, 1974).
A proposal to allow the state collecting a direct federal tax as well as the turnover tax on a
constitutional basis without time limitations was issued in 1953. Since it involved amending a
constitutional article, the issue was subject to a mandatory referendum, of which the outcome is
binding in Switzerland (Linder, 2007). Since public finances are a core element of a state, a wealth
of similar ballots concerning the federal government’s admission to file taxes exists. Table 1 gives
an overview of all relevant ballots between 1953 and 1971. Even until now, it remains a Swiss
particularity that citizens have to approve the federal financial order. Without acceptance, the
Swiss state would not have the competency to levy federal taxes. In addition, Switzerland has a
strong federal structure which allows the cantons, its 25 states in 1971, and municipalities to collect
taxes independently.
The 1953 proposal was rejected. Only one year later, a similar proposal to include the federal
competency of levying income, capital and turnover taxes in the constitution but with a time
limit of four years was put to the vote, and approved by the people. It was followed by another
temporary financial order between 1959 and 1964. The time limit forced the government to prepare
3Information about the history of the Swiss Federal Tax are from Grutter (1968). Oechslin (1967) gives anoverview of the overall development of the Swiss tax system.
5
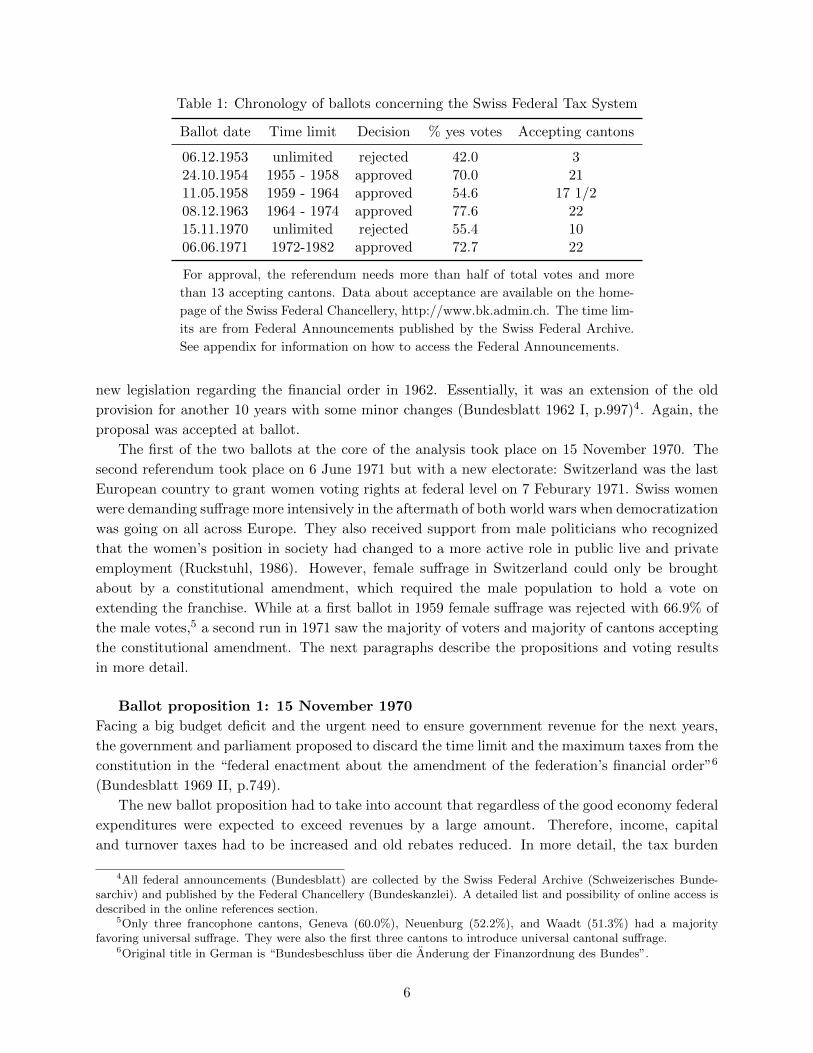
Table 1: Chronology of ballots concerning the Swiss Federal Tax System
Ballot date Time limit Decision % yes votes Accepting cantons
06.12.1953 unlimited rejected 42.0 324.10.1954 1955 - 1958 approved 70.0 2111.05.1958 1959 - 1964 approved 54.6 17 1/208.12.1963 1964 - 1974 approved 77.6 2215.11.1970 unlimited rejected 55.4 1006.06.1971 1972-1982 approved 72.7 22
For approval, the referendum needs more than half of total votes and more
than 13 accepting cantons. Data about acceptance are available on the home-
page of the Swiss Federal Chancellery, http://www.bk.admin.ch. The time lim-
its are from Federal Announcements published by the Swiss Federal Archive.
See appendix for information on how to access the Federal Announcements.
new legislation regarding the financial order in 1962. Essentially, it was an extension of the old
provision for another 10 years with some minor changes (Bundesblatt 1962 I, p.997)4. Again, the
proposal was accepted at ballot.
The first of the two ballots at the core of the analysis took place on 15 November 1970. The
second referendum took place on 6 June 1971 but with a new electorate: Switzerland was the last
European country to grant women voting rights at federal level on 7 Feburary 1971. Swiss women
were demanding suffrage more intensively in the aftermath of both world wars when democratization
was going on all across Europe. They also received support from male politicians who recognized
that the women’s position in society had changed to a more active role in public live and private
employment (Ruckstuhl, 1986). However, female suffrage in Switzerland could only be brought
about by a constitutional amendment, which required the male population to hold a vote on
extending the franchise. While at a first ballot in 1959 female suffrage was rejected with 66.9% of
the male votes,5 a second run in 1971 saw the majority of voters and majority of cantons accepting
the constitutional amendment. The next paragraphs describe the propositions and voting results
in more detail.
Ballot proposition 1: 15 November 1970
Facing a big budget deficit and the urgent need to ensure government revenue for the next years,
the government and parliament proposed to discard the time limit and the maximum taxes from the
constitution in the “federal enactment about the amendment of the federation’s financial order”6
(Bundesblatt 1969 II, p.749).
The new ballot proposition had to take into account that regardless of the good economy federal
expenditures were expected to exceed revenues by a large amount. Therefore, income, capital
and turnover taxes had to be increased and old rebates reduced. In more detail, the tax burden
4All federal announcements (Bundesblatt) are collected by the Swiss Federal Archive (Schweizerisches Bunde-sarchiv) and published by the Federal Chancellery (Bundeskanzlei). A detailed list and possibility of online access isdescribed in the online references section.
5Only three francophone cantons, Geneva (60.0%), Neuenburg (52.2%), and Waadt (51.3%) had a majorityfavoring universal suffrage. They were also the first three cantons to introduce universal cantonal suffrage.
6Original title in German is “Bundesbeschluss uber die Anderung der Finanzordnung des Bundes”.
6
would be shifted from the direct income tax to the indirect turnover tax such that revenue from
the turnover tax would increase considerably and revenue from income taxes would stay roughly
constant. The proposition wanted to increase the turnover tax for retailers from 3.6 to 4 percent,
and for wholesalers from 5.4 to 6 percent. The income tax set in progressively at an income of 8.500
Swiss Francs after deductions (7.700 Swiss Francs before). It allowed for deductions for married
individuals (2.500 Swiss Francs), children under 18 years and dependents (1.200 Swiss Francs)
(Bundesblatt 1970 II, p.3). Regarding the income tax, high income households would be worse off
with the new regulation than low income households because of a more progressive system. Also
married couples or families with many children would be better off than with the old regulation.
The government argued that an increase in turnover taxes to generate state revenue was the
preferable revenue source for the following reason: it was not a typical consumption tax because of
various exemptions for goods of daily use like food. It mainly taxed investment goods purchased
by firms and the government, in addition to goods like alcohol, tobacco, and clothing which were
purchased by households (Bundesblatt 1969 II, p.778). However, there seemed to be a general
uncertainty about who would carry the burden of the higher turnover tax. But presumably the
biggest load would be paid by enterprizes.
Critics of the proposal mostly pointed to an unsatisfactory regulation concerning the Swiss
cantons (Annee Politique Suisse, 2012). Especially it lacked a clear division of revenue and ex-
penditures between the federal government and the cantons because direct income taxes were an
important revenue source for cantons and municipalities (Bundesblatt 1969 II, p.773).
All major parties, associations and unions recommended their voters to accept the proposal.
Exceptions were the small Liberal Party of Switzerland (LPS), and the Labor Party (PdA) who
opposed the proposal for not being progressive enough (Annee Politique Suisse, 2012). These almost
unanimously positive voting recommendations indicate the importance of the issue at stake. On 15
November 1970 the Swiss voters - which was the male eligible population at that point - rejected
the proposition in a mandatory referendum. Though 55.4% of the voters were in favor the proposal,
it failed to accomplish a cantonal majority, i.e., in 13 of 22 cantons the approval rate was below 50
percent. The rejecting cantons were mainly concentrated in non-German speaking areas and small
central cantons.
Ballot proposition 2: 6 June 1971
The Swiss government immediately prepared a new proposal7 because it urgently needed more
revenue sources to finance growing state expenditure (Bundesblatt 1970 II, p.1581). In the major
parts the new proposal was identical to the old proposal, but had the following changes. The
biggest change included a time limit of 10 years (Bundesblatt 1971 I, p.487). This meant that in
the case of approval at the polls, the federal financial order had to be voted upon again in 1980
at the latest. As a further change, income tax ceilings of 9.5 percent for natural persons and 8
percent for legal persons were included. Also, the income tax schedule became more progressive
and started to tax individuals at incomes after deductions of 9.000 Swiss Francs. These measures
were taken to account for price inflation. It is important to note that the only essential change
between the first and the second ballot proposition was the inclusion of the time limit. Comparing
7“Federal enactment about the continuation of the federation’s financial order”. Original title in German is“Bundesbeschluss uber die Weiterfuhrung der Finanzordnung des Bundes”
7
the precise wording of both legislative texts shows that they are almost identical in all paragraphs.8
Consequently, if a man changes voting behavior between the ballots, content-wise the only obvious
reason can be the time limitation of the second proposition.
Again, the parties and associations almost unanimously asked the voters to accept the proposal
in their voting recommendations. Only the Labor Party (PdA), the Swiss Evangelic Party (EVP),
and the Alliance of Independents (PdA) were opposed to the proposal because it disregarded
deductions for working wives and was not progressive enough (Annee Politique Suisse, 2012).
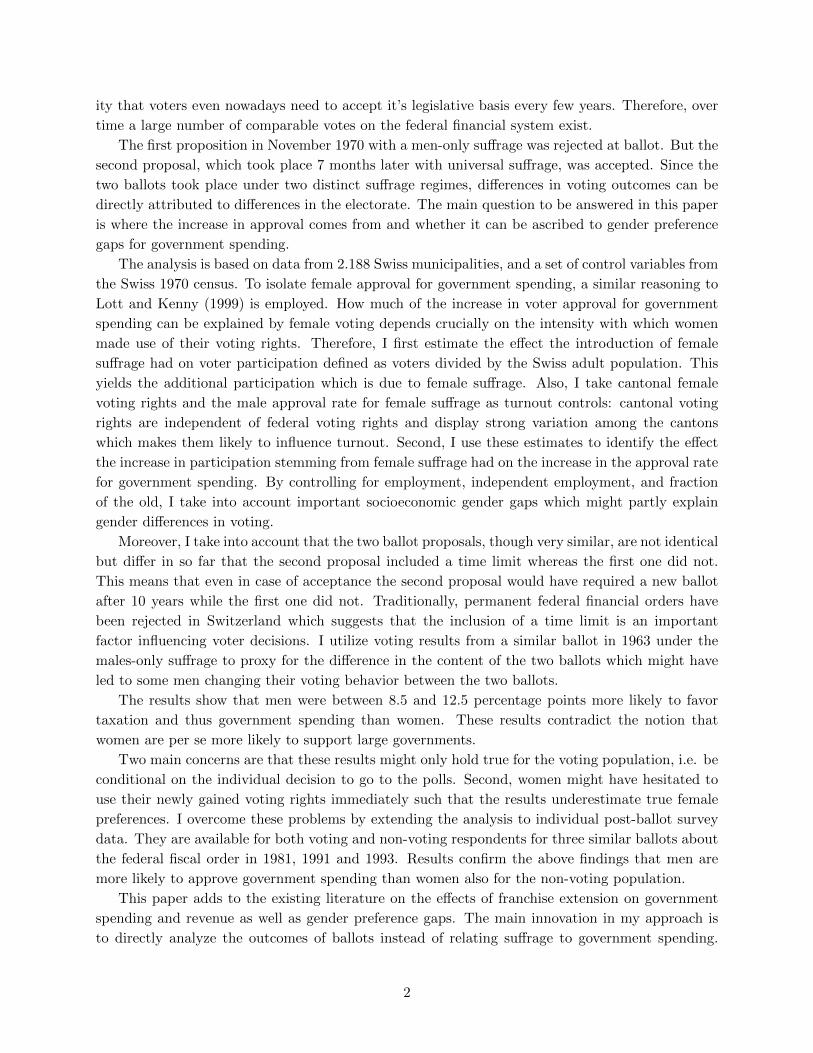
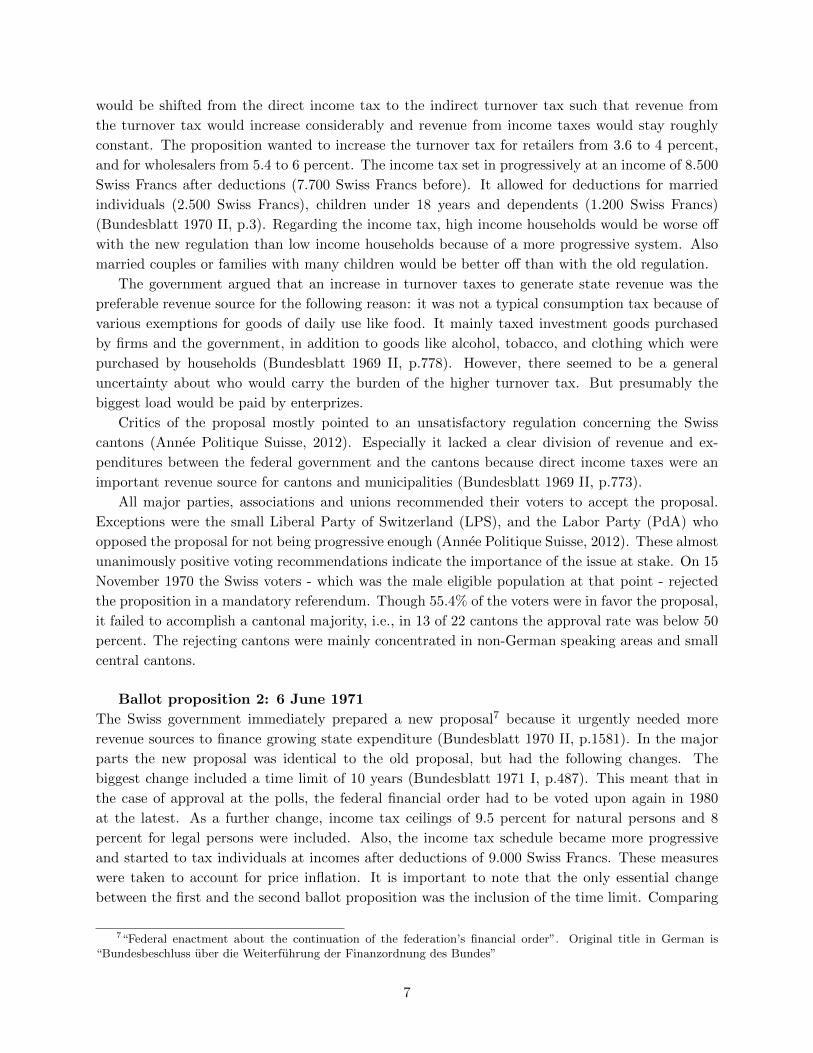
This time with universal suffrage the ballot proposal concerning the Federal Tax System was
accepted by a large margin with 72.7% of the votes, and a majority in all cantons. Figure 1 shows
the cantonal approval rates for both ballots. The maps are retrieved from swissvotes.ch9.
Figure 1: Cantonal approval rates for ballots 1 (15 November 1970) and (6 June 1971), source:swissvotes.ch
3.2 Data and descriptives
I collected a dataset for 2.188 Swiss municipalities with voting information for the relevant
ballots. They include the number of yes and no votes, valid votes and eligibles. Data from the
three cantons Aargau, Freiburg, and Ticino are not available at municipal level. Instead I include
the data from voting districts which comprise several municipalities each for these three cantons.
This adds 26 voting districts to the dataset.10 All voting data come from the Political Atlas of
Switzerland provided by the Swiss Statistical Office.
Since voting data come from two ballots with a time difference of 7 months, municipal mutations
need to be taken into account. I.e., several municipalities have merged during this time. Therefore,
I adjust the voting data from ballot 1 such that they are comparable to ballot 2. I do the same for
the census data which means that I sum the data from municipalities which have merged between
1970 and 1971. Further, there are two special cases in the cantons Bern and Thurgau. The first one
in the canton Bern is that voting results from very small municipalities are counted and reported
8The comparison is available from the author on request.9A project of the Institute of Political Science at the University of Bern, Switzerland, and the Annee Politique
Suisse.10I have contacted the cantonal archives of the three cantons in question. For some of the municipalities data exist,
and will be included in future estimates. Municipalities for which no data are available will have to be excluded.For robustness, the estimates are repeated excluding the three cantons in question. The results do not changequalitatively.
8
in some larger nearby municipality. Second, in Thurgau several municipalities which are available
separately in the census data together form a political municipality with different administrative
tasks. Voting data are reported for the latter only. I account for both special cases by adjusting
the census data accordingly such that they are comparable.
I use three groups of control variables. First, I include socioeconomic and demographic controls
which are typically included in turnout and voting research (education, income, employment, old
population) or are particular for Switzerland (catholic and German-speaking population). Second,
I control for large households, fraction of married and independent employment which are variables
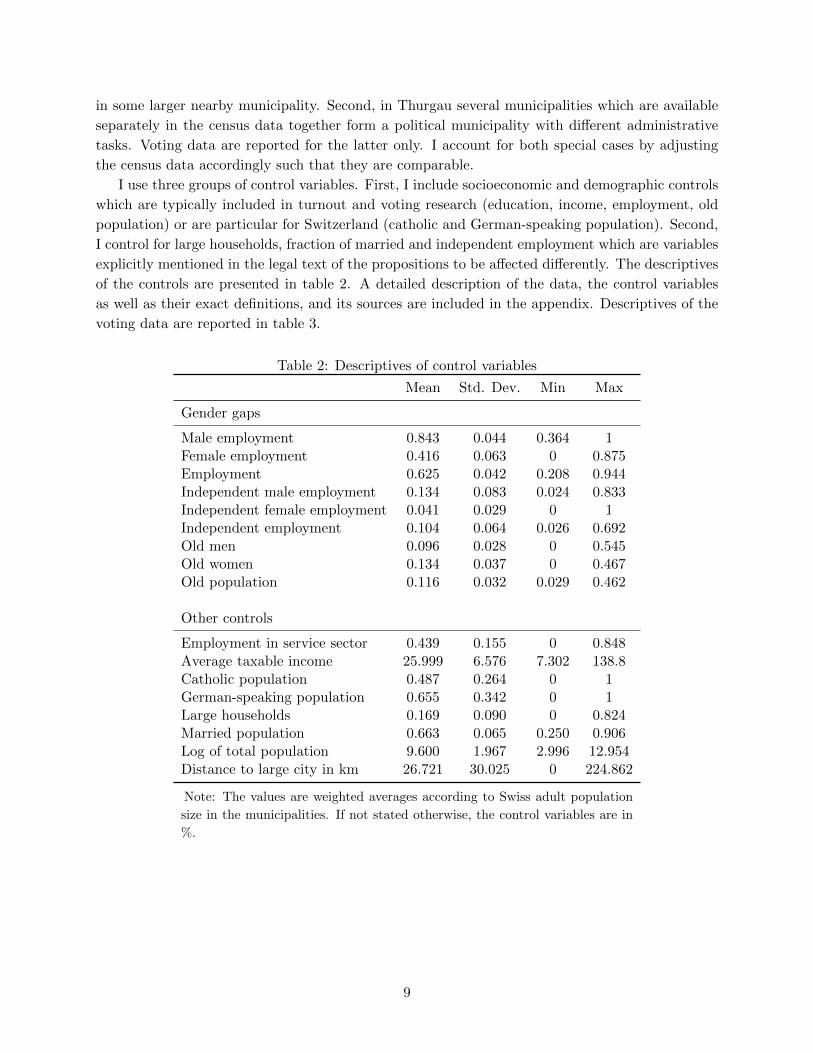
explicitly mentioned in the legal text of the propositions to be affected differently. The descriptives
of the controls are presented in table 2. A detailed description of the data, the control variables
as well as their exact definitions, and its sources are included in the appendix. Descriptives of the
voting data are reported in table 3.
Table 2: Descriptives of control variables
Mean Std. Dev. Min Max
Gender gaps
Male employment 0.843 0.044 0.364 1Female employment 0.416 0.063 0 0.875Employment 0.625 0.042 0.208 0.944Independent male employment 0.134 0.083 0.024 0.833Independent female employment 0.041 0.029 0 1Independent employment 0.104 0.064 0.026 0.692Old men 0.096 0.028 0 0.545Old women 0.134 0.037 0 0.467Old population 0.116 0.032 0.029 0.462
Other controls
Employment in service sector 0.439 0.155 0 0.848Average taxable income 25.999 6.576 7.302 138.8Catholic population 0.487 0.264 0 1German-speaking population 0.655 0.342 0 1Large households 0.169 0.090 0 0.824Married population 0.663 0.065 0.250 0.906Log of total population 9.600 1.967 2.996 12.954Distance to large city in km 26.721 30.025 0 224.862
Note: The values are weighted averages according to Swiss adult population
size in the municipalities. If not stated otherwise, the control variables are in
%.
9
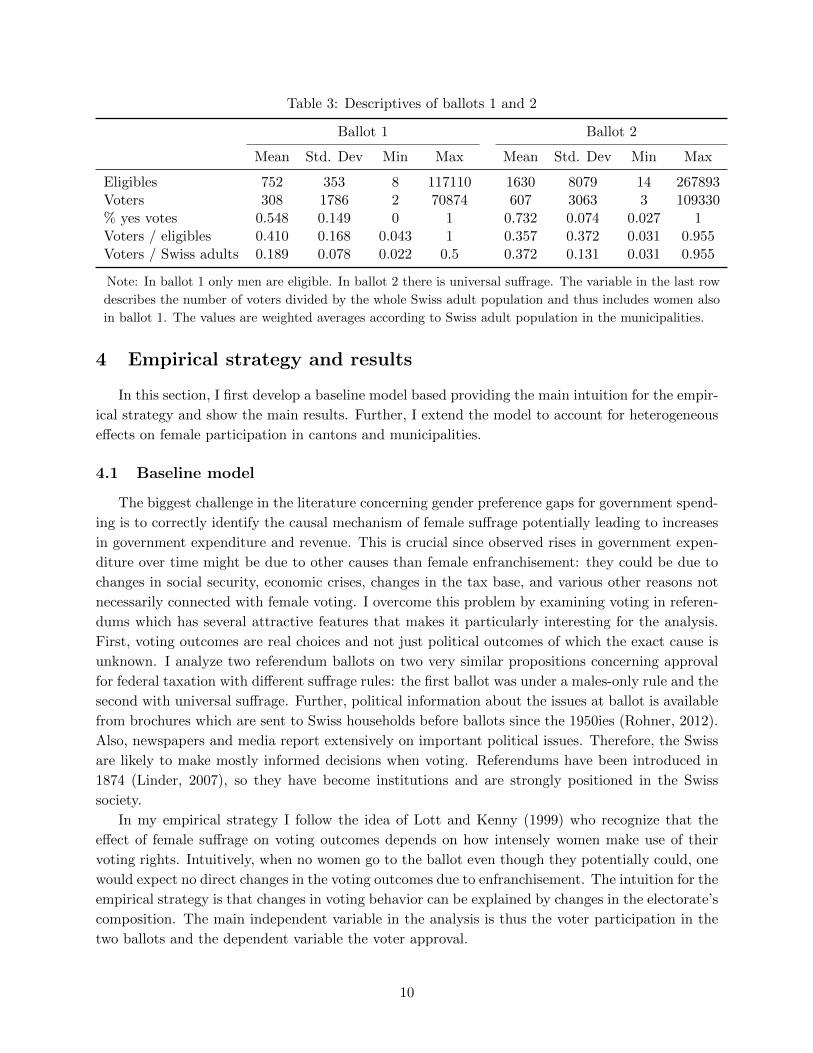
Table 3: Descriptives of ballots 1 and 2
Ballot 1 Ballot 2
Mean Std. Dev Min Max Mean Std. Dev Min Max
Eligibles 752 353 8 117110 1630 8079 14 267893Voters 308 1786 2 70874 607 3063 3 109330% yes votes 0.548 0.149 0 1 0.732 0.074 0.027 1Voters / eligibles 0.410 0.168 0.043 1 0.357 0.372 0.031 0.955Voters / Swiss adults 0.189 0.078 0.022 0.5 0.372 0.131 0.031 0.955
Note: In ballot 1 only men are eligible. In ballot 2 there is universal suffrage. The variable in the last row
describes the number of voters divided by the whole Swiss adult population and thus includes women also
in ballot 1. The values are weighted averages according to Swiss adult population in the municipalities.
4 Empirical strategy and results
In this section, I first develop a baseline model based providing the main intuition for the empir-
ical strategy and show the main results. Further, I extend the model to account for heterogeneous
effects on female participation in cantons and municipalities.
4.1 Baseline model
The biggest challenge in the literature concerning gender preference gaps for government spend-
ing is to correctly identify the causal mechanism of female suffrage potentially leading to increases
in government expenditure and revenue. This is crucial since observed rises in government expen-
diture over time might be due to other causes than female enfranchisement: they could be due to
changes in social security, economic crises, changes in the tax base, and various other reasons not
necessarily connected with female voting. I overcome this problem by examining voting in referen-
dums which has several attractive features that makes it particularly interesting for the analysis.
First, voting outcomes are real choices and not just political outcomes of which the exact cause is
unknown. I analyze two referendum ballots on two very similar propositions concerning approval
for federal taxation with different suffrage rules: the first ballot was under a males-only rule and the
second with universal suffrage. Further, political information about the issues at ballot is available
from brochures which are sent to Swiss households before ballots since the 1950ies (Rohner, 2012).
Also, newspapers and media report extensively on important political issues. Therefore, the Swiss
are likely to make mostly informed decisions when voting. Referendums have been introduced in
1874 (Linder, 2007), so they have become institutions and are strongly positioned in the Swiss
society.
In my empirical strategy I follow the idea of Lott and Kenny (1999) who recognize that the
effect of female suffrage on voting outcomes depends on how intensely women make use of their
voting rights. Intuitively, when no women go to the ballot even though they potentially could, one
would expect no direct changes in the voting outcomes due to enfranchisement. The intuition for the
empirical strategy is that changes in voting behavior can be explained by changes in the electorate’s
composition. The main independent variable in the analysis is thus the voter participation in the
two ballots and the dependent variable the voter approval.
10

Participation is defined as the number of people voting in a municipality m on a particular date
t divided by the total Swiss population aged 20 and older.11
participationtm =voterstm
adults1971,m, t ∈ {1970, 1971} (1)
Note that for ballot 2 this definition of participation coincides with the standard definition of
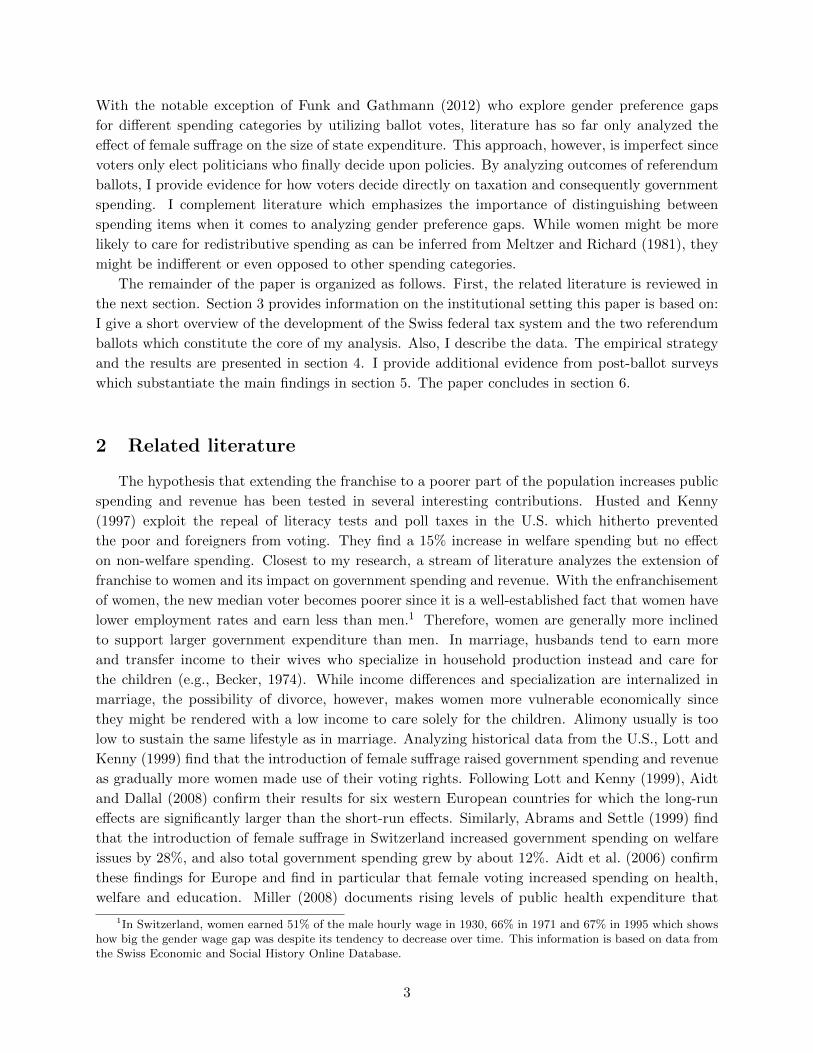
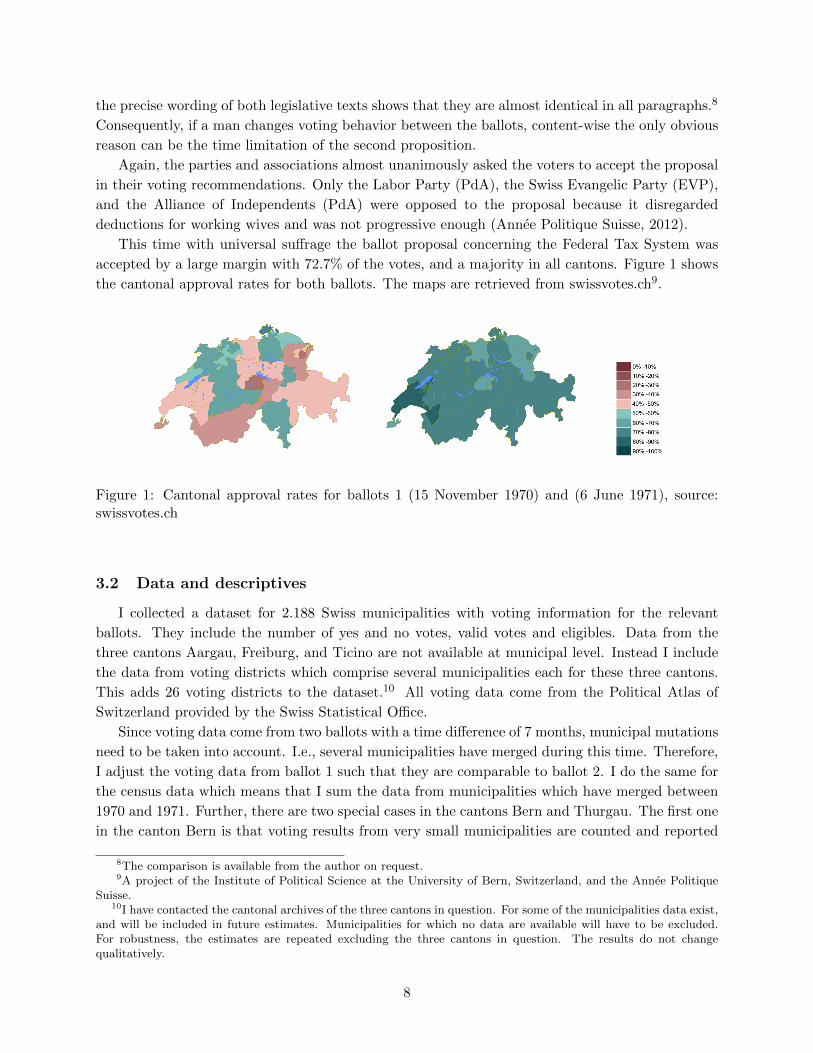
turnout voterstm/eligiblestm. To visualize the effect of female suffrage on voter participation in
Switzerland participation rates for elections to the Swiss parliament (Nationalrat) between 1951
and 1991 are presented in figure 2 since participation for referendums varies a lot (which might
be due to the importance of an issue or campaigning effects). In this time period, parliament was
elected every 4 years. The x-axis shows the election before and after the introduction of female
suffrage in 1971. Participation as defined above is depicted on the y-axis. I take the total number
of people above 20 years old from Swiss censuses and interpolate the numbers for the inter-census
years. The data are from the Swiss Statistical Office. The fraction of voters as compared to
the total adult population was steadily decreasing before the introduction of female suffrage. As
expected, the participation rate jumps by more than 20 percentage points in the 1971 election with
universal suffrage. However, afterwards the participation rate has a decreasing trend again. This
contrasts with the observation of Lott and Kenny (1999) who show that the turnout rate in the
U.S. continued increasing many years after the introduction of female suffrage. Thus on average
women in Switzerland made use of their voting rights relatively quickly. This is important for the
understanding of the results because ballot 2 is the first federal voting date after the introduction
of female suffrage at which voters decided on two bills.12 Therefore, selection into voting by women
should not pose a large problem.10.02.13 14:59turnout_elections.png 614×446 Pixel
Seite 1 von 1https://bizet.unisg.ch/mail/sew/06608715.nsf/0/2B3A9882F26ACE7DC…urnout_elections.png?OpenElement&FileName=turnout_elections.png
Figure 2: Participation rate (voterst / Swiss adult populationt) for parliamentary elections withoutand with female suffrage
The definition of voter participation applied in this paper is useful because it gives an intuition
for how many women participate in ballots once enfranchised. Participation without women in
ballot 1 is on average 18.9 percent in the sample and it ranges between 2.2 and 50 percent, i.e.,
18.9 percent of the Swiss adult population showed up at the voting booth. In fact, this number
constitutes the male voter participation as a fraction of the total Swiss adult population. If no
1120 was the voting age at that point in time.12The other proposition was about the protection of humans and their environment.
11
women made use of their voting rights in ballot 2, the participation rate would have remained
constant. Should women have voted with the same intensity as men and given that the fraction of
Swiss women older than 20 in the population is roughly equal to the male fraction, participation
would be expected to double to 37.8 percent on average. The average observed value is slightly
lower at 37.2 percent for ballot 2 with a range from 3.1 to 95.5 percent. On average, the difference
in participation between the two ballots participating men and women1971−participating men1970
adults1971amounts to
18.34 percentage points. Histograms of the dependent variable by ballot are depicted in figure 4.1.
The identifying assumption in my empirical analysis is the following
Assumption 1 Additional participation in ballot 2 comes from the female part of the population.
Or put differently: men are not more likely to participate once women are enfranchised. This
might be due to a decrease in the marginal benefit to vote when the electorate roughly doubles.
Further evidence which confirms that men are unlikely to increase their participation comes from
comparing participation rates of the two similar ballots in 1953 and 1954, both with male suffrage
only. For the first ballot in 1953 which did not include a time limit and was highly contested 60.27%
of the male eligible population turned out. In contrast, the less contested proposition including a
time limit of 4 years in 1954, drew only 46.77% of eligible men to the polls. Hence, I am confident
that the additional participation is likely to be a lower bound for female participation.
I define the dependent variable acceptancetm as the number of yes votes yestm divided by the
total Swiss population which is at least 20 years old adults1971,m.
acceptancetm =yestm
adults1971,m, t ∈ {1970, 1971} (2)
This measure is small for ballot 1, and represents the fraction of yes votes as commonly defined
for ballot 2. The intuition for the dependent variable is that the measure should not change if all
women rejected the proposal. In contrast, it would increase should some women approve of the
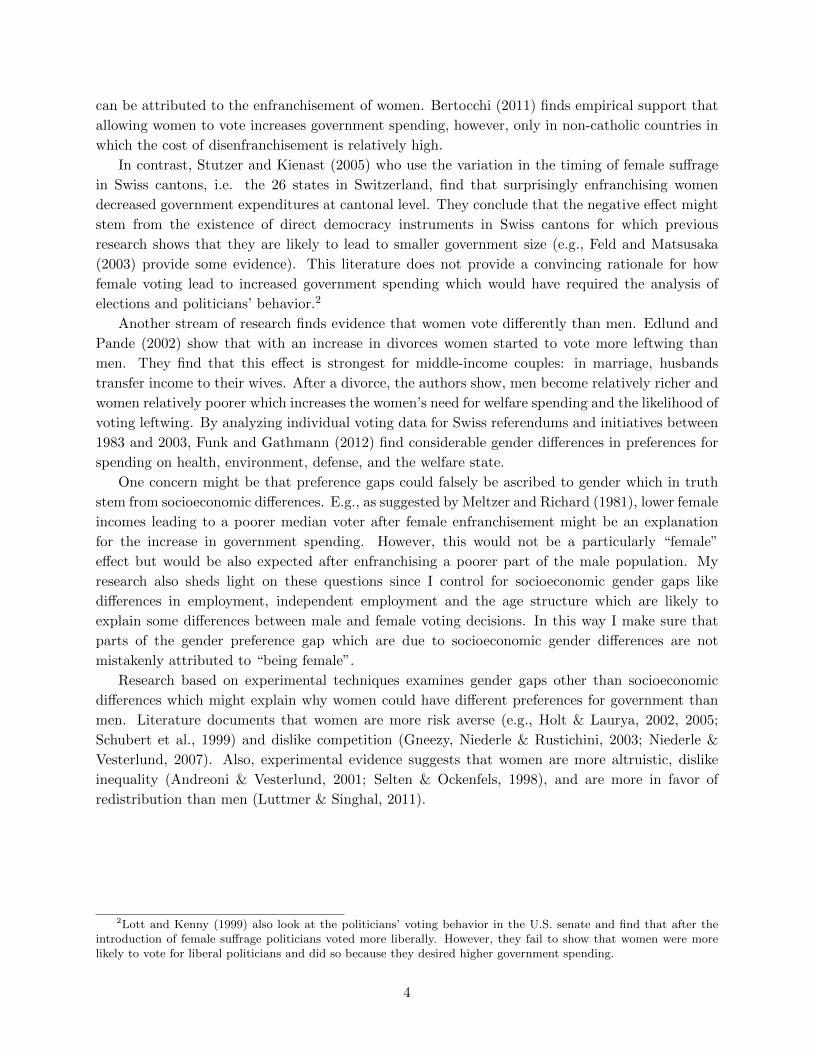
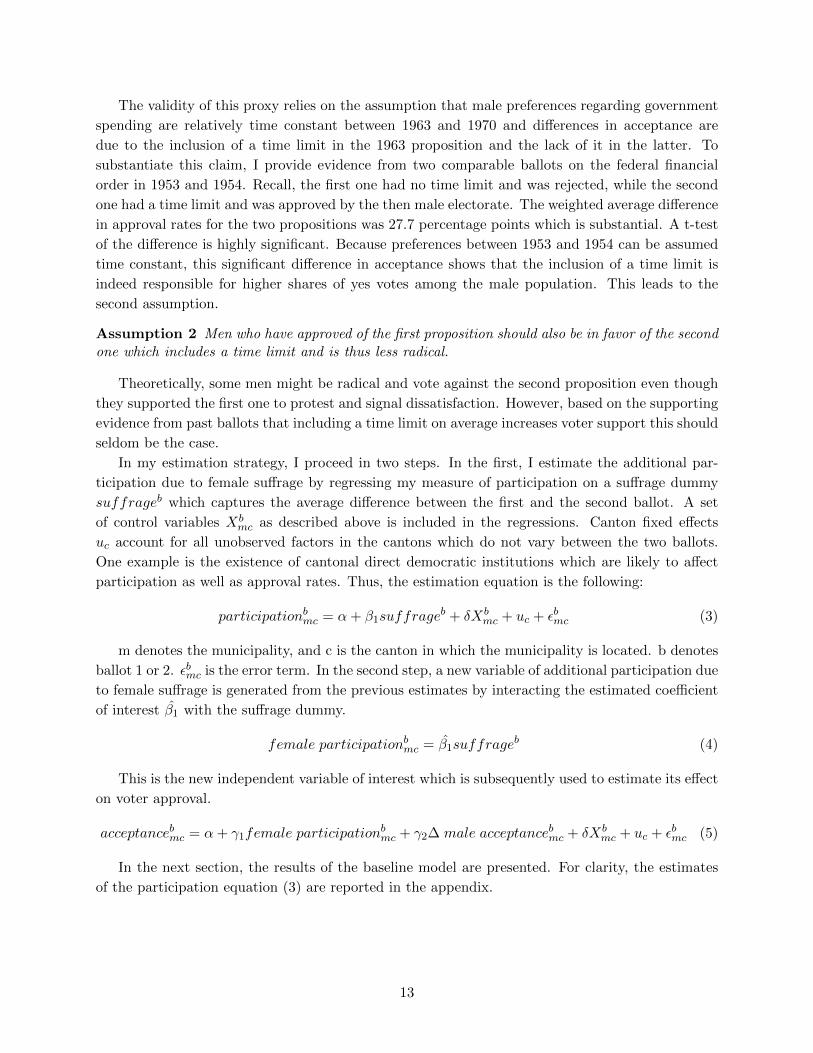
proposal. Histograms of the dependent variable by ballot are viewed in figure 4.1. They visualize
that the distribution of acceptance has moved to the right. The difference in approval rates between
both ballots yes votes1971−yes votes1970adults1971
is 15.79 percentage points.
What makes the analysis more complicated is the fact that the ballots are not entirely identical.
As explained above, the main difference between the proposals is a time limit of ten years in the
second proposal. I have noted before that proposals regarding the federal financial order including
time limits have also been approved by the male voting population, e.g., like in 1954, 1958, and
1963. This means that not only women are expected to be more likely to vote in favor of the
proposal but also some men should change their minds and vote yes instead of no. To account
for the fact that the second proposal is less extreme than the first, I take the difference between
the approval rates for ballot 1 and the ballot proposition in 1963 which also included a time limit
and was accepted by a large margin. The variable is denoted by ∆ male acceptancebmc with a
population-weighted mean of 22.5 percent and a standard deviation of 13.9. In this manner, I can
proxy the change in male approval rates when propositions include a time limit or not. The variable
is multiplied with the male participation rate, the male fraction of the population older than 20,
and a suffrage dummy such that it becomes 0 for the first ballot.13
13More details about the construction of this variable can be found in the appendix.
12
The validity of this proxy relies on the assumption that male preferences regarding government
spending are relatively time constant between 1963 and 1970 and differences in acceptance are
due to the inclusion of a time limit in the 1963 proposition and the lack of it in the latter. To
substantiate this claim, I provide evidence from two comparable ballots on the federal financial
order in 1953 and 1954. Recall, the first one had no time limit and was rejected, while the second
one had a time limit and was approved by the then male electorate. The weighted average difference
in approval rates for the two propositions was 27.7 percentage points which is substantial. A t-test
of the difference is highly significant. Because preferences between 1953 and 1954 can be assumed
time constant, this significant difference in acceptance shows that the inclusion of a time limit is
indeed responsible for higher shares of yes votes among the male population. This leads to the
second assumption.
Assumption 2 Men who have approved of the first proposition should also be in favor of the secondone which includes a time limit and is thus less radical.
Theoretically, some men might be radical and vote against the second proposition even though
they supported the first one to protest and signal dissatisfaction. However, based on the supporting
evidence from past ballots that including a time limit on average increases voter support this should
seldom be the case.
In my estimation strategy, I proceed in two steps. In the first, I estimate the additional par-
ticipation due to female suffrage by regressing my measure of participation on a suffrage dummy
suffrageb which captures the average difference between the first and the second ballot. A set
of control variables Xbmc as described above is included in the regressions. Canton fixed effects
uc account for all unobserved factors in the cantons which do not vary between the two ballots.
One example is the existence of cantonal direct democratic institutions which are likely to affect
participation as well as approval rates. Thus, the estimation equation is the following:
participationbmc = α+ β1suffrageb + δXb
mc + uc + εbmc (3)
m denotes the municipality, and c is the canton in which the municipality is located. b denotes
ballot 1 or 2. εbmc is the error term. In the second step, a new variable of additional participation due
to female suffrage is generated from the previous estimates by interacting the estimated coefficient
of interest β1 with the suffrage dummy.
female participationbmc = β1suffrageb (4)
This is the new independent variable of interest which is subsequently used to estimate its effect
on voter approval.
acceptancebmc = α+ γ1female participationbmc + γ2∆ male acceptancebmc + δXb
mc + uc + εbmc (5)
In the next section, the results of the baseline model are presented. For clarity, the estimates
of the participation equation (3) are reported in the appendix.
13
02
46
0 .5 1 0 .5 1
Ballot in 1970 (male suffrage) Ballot in 1971 (universal suffrage)
Den
sity
voters / Swiss > 20
05
10
0 .2 .4 .6 .8 0 .2 .4 .6 .8
Ballot in 1970 (male suffrage) Ballot in 1971 (universal suffrage)
Den
sity
yes votes / Swiss > 20
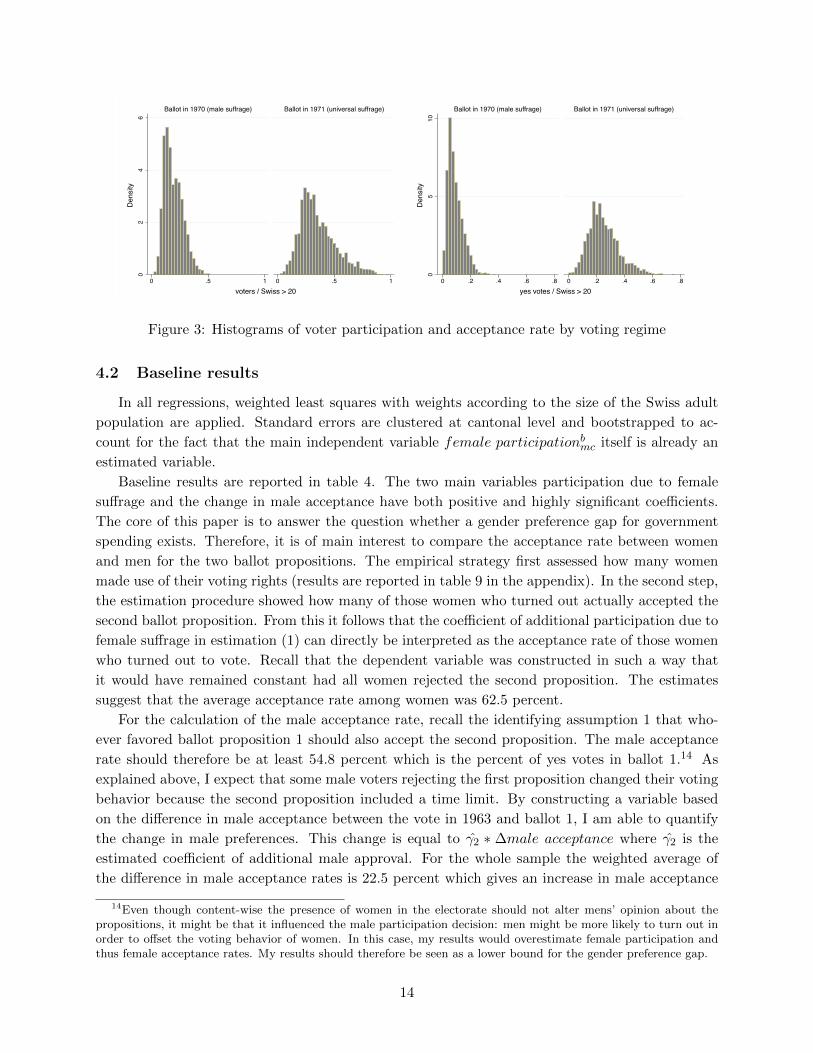
Figure 3: Histograms of voter participation and acceptance rate by voting regime
4.2 Baseline results
In all regressions, weighted least squares with weights according to the size of the Swiss adult
population are applied. Standard errors are clustered at cantonal level and bootstrapped to ac-
count for the fact that the main independent variable female participationbmc itself is already an
estimated variable.
Baseline results are reported in table 4. The two main variables participation due to female
suffrage and the change in male acceptance have both positive and highly significant coefficients.
The core of this paper is to answer the question whether a gender preference gap for government
spending exists. Therefore, it is of main interest to compare the acceptance rate between women
and men for the two ballot propositions. The empirical strategy first assessed how many women
made use of their voting rights (results are reported in table 9 in the appendix). In the second step,
the estimation procedure showed how many of those women who turned out actually accepted the
second ballot proposition. From this it follows that the coefficient of additional participation due to
female suffrage in estimation (1) can directly be interpreted as the acceptance rate of those women
who turned out to vote. Recall that the dependent variable was constructed in such a way that
it would have remained constant had all women rejected the second proposition. The estimates
suggest that the average acceptance rate among women was 62.5 percent.
For the calculation of the male acceptance rate, recall the identifying assumption 1 that who-
ever favored ballot proposition 1 should also accept the second proposition. The male acceptance
rate should therefore be at least 54.8 percent which is the percent of yes votes in ballot 1.14 As
explained above, I expect that some male voters rejecting the first proposition changed their voting
behavior because the second proposition included a time limit. By constructing a variable based
on the difference in male acceptance between the vote in 1963 and ballot 1, I am able to quantify
the change in male preferences. This change is equal to γ2 ∗ ∆male acceptance where γ2 is the
estimated coefficient of additional male approval. For the whole sample the weighted average of
the difference in male acceptance rates is 22.5 percent which gives an increase in male acceptance
14Even though content-wise the presence of women in the electorate should not alter mens’ opinion about thepropositions, it might be that it influenced the male participation decision: men might be more likely to turn out inorder to offset the voting behavior of women. In this case, my results would overestimate female participation andthus female acceptance rates. My results should therefore be seen as a lower bound for the gender preference gap.
14
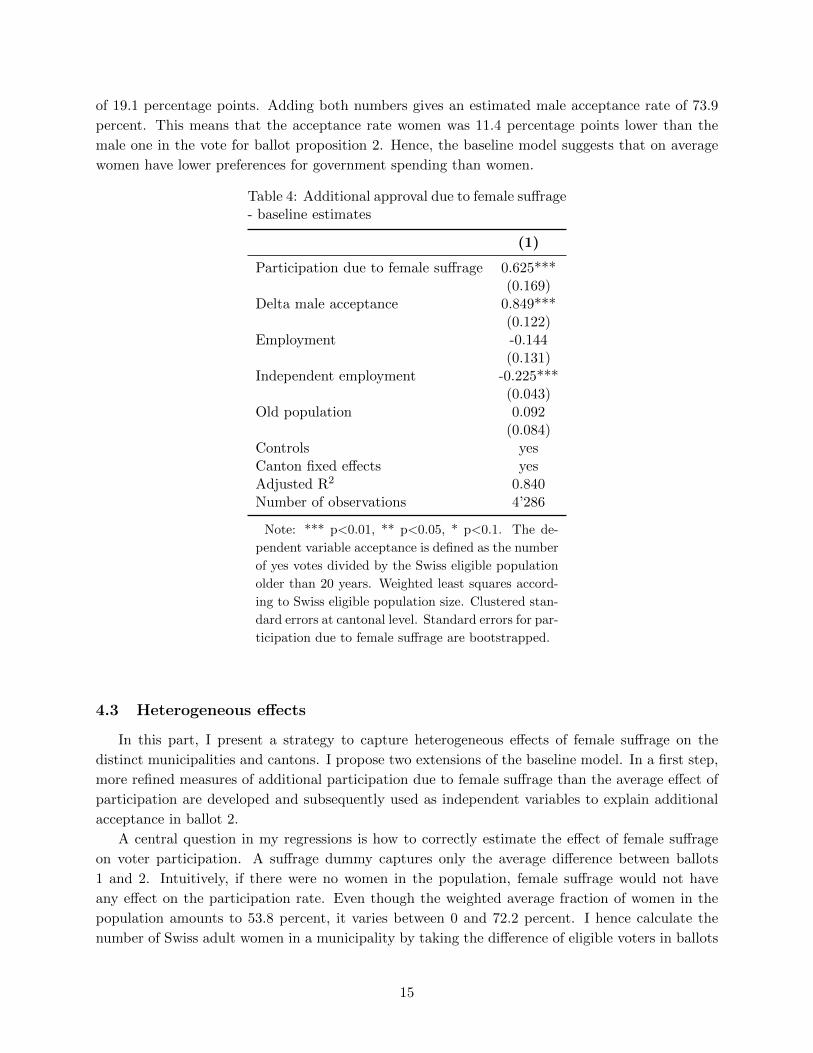
of 19.1 percentage points. Adding both numbers gives an estimated male acceptance rate of 73.9
percent. This means that the acceptance rate women was 11.4 percentage points lower than the
male one in the vote for ballot proposition 2. Hence, the baseline model suggests that on average
women have lower preferences for government spending than women.
Table 4: Additional approval due to female suffrage- baseline estimates
(1)
Participation due to female suffrage 0.625***(0.169)
Delta male acceptance 0.849***(0.122)
Employment -0.144(0.131)
Independent employment -0.225***(0.043)
Old population 0.092(0.084)
Controls yesCanton fixed effects yesAdjusted R2 0.840Number of observations 4’286
Note: *** p<0.01, ** p<0.05, * p<0.1. The de-
pendent variable acceptance is defined as the number
of yes votes divided by the Swiss eligible population
older than 20 years. Weighted least squares accord-
ing to Swiss eligible population size. Clustered stan-
dard errors at cantonal level. Standard errors for par-
ticipation due to female suffrage are bootstrapped.
4.3 Heterogeneous effects
In this part, I present a strategy to capture heterogeneous effects of female suffrage on the
distinct municipalities and cantons. I propose two extensions of the baseline model. In a first step,
more refined measures of additional participation due to female suffrage than the average effect of
participation are developed and subsequently used as independent variables to explain additional
acceptance in ballot 2.
A central question in my regressions is how to correctly estimate the effect of female suffrage
on voter participation. A suffrage dummy captures only the average difference between ballots
1 and 2. Intuitively, if there were no women in the population, female suffrage would not have
any effect on the participation rate. Even though the weighted average fraction of women in the
population amounts to 53.8 percent, it varies between 0 and 72.2 percent. I hence calculate the
number of Swiss adult women in a municipality by taking the difference of eligible voters in ballots
15
1 and 2.15 Thus, the higher the fraction of women in the population, the stronger the effect on
participation potentially can be. I account for this by multiplying the suffrage dummy suffrageb
with the fraction of Swiss women age 20 or older as compared to the total Swiss population that is
at least 20 years old %womenmc.
The equation for estimating additional participation due to female suffrage is therefore the
following:
participationbmc = α+ β1suffrageb ∗% womenmc + β2X
bmc + uc + εbmc (6)
For the second extension of the baseline model it is important to notice that female participation
rates can be influenced by the intensity with which women want to use their new voting rights,
and also by their bargaining power at home. In contrast to federal voting rights, female suffrage
at cantonal level was introduced between 1959 and 1990. Eight cantons allowed women to vote
on cantonal issues even before 1971 while in Appenzell Innerrhoden universal suffrage at cantonal
level had to be imposed by a court of law ruling in 1990. This means that women from these eight
cantons already had some voting experience on cantonal issues while in some cantons women had
to wait rather long for cantonal voting rights.16 I calculate the time in years between 7 February
1971, the first day of federal female suffrage, and the introduction of cantonal voting rights. For
the eight cantons with positive values the average number of years with cantonal female suffrage
amounts to 6.8 years with a standard deviation of 5.5. For the cantons with voting rights after
that date values are zero. I interact this variable with the suffrage dummy and the adult fraction
of Swiss women in each municipality. The underlying estimation equation for voter participation
becomes:
participationbmc = α+ β1suffrageb ∗% womenmc + β2cantonal suffragemc (7)
∗suffrageb ∗% womenmc + β3Xbmc + uc + εbmc
cantonal suffragemc is the time since cantonal suffrage for canton c in years as described above
for the ballot with universal suffrage. It is multiplied with the suffrage dummy suffrageb such
that it becomes zero for the first ballot. In an additional specification, I add the squared value
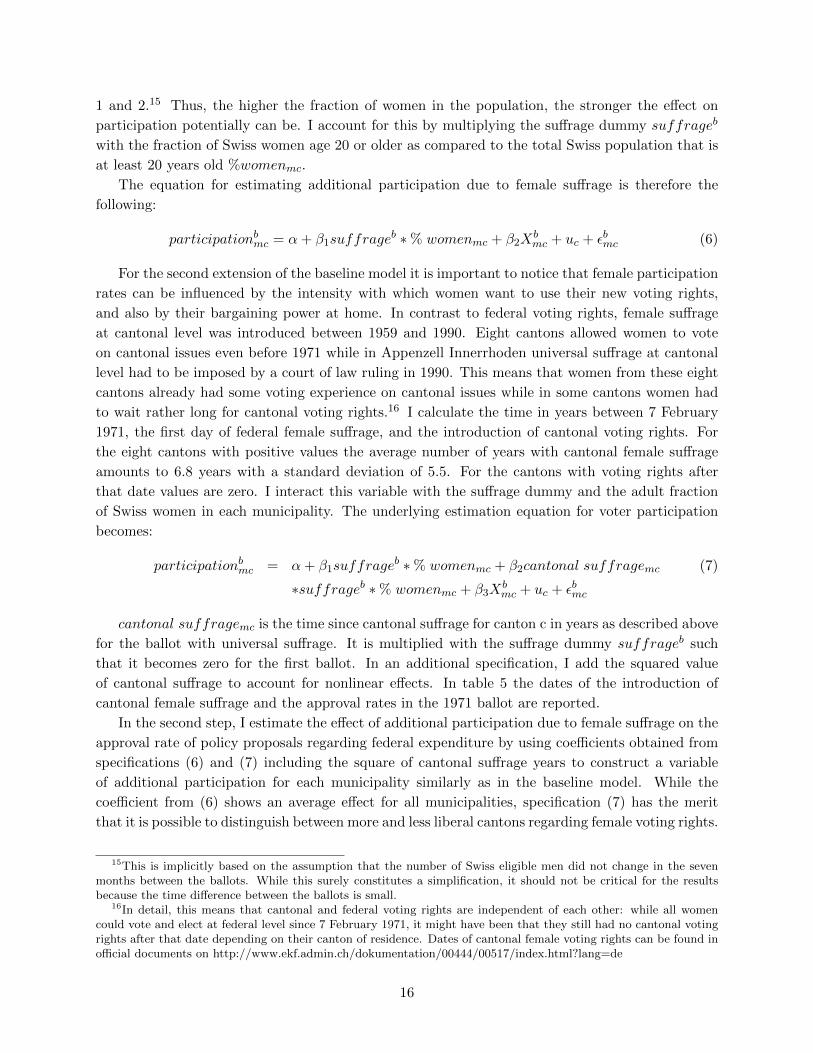
of cantonal suffrage to account for nonlinear effects. In table 5 the dates of the introduction of
cantonal female suffrage and the approval rates in the 1971 ballot are reported.
In the second step, I estimate the effect of additional participation due to female suffrage on the
approval rate of policy proposals regarding federal expenditure by using coefficients obtained from
specifications (6) and (7) including the square of cantonal suffrage years to construct a variable
of additional participation for each municipality similarly as in the baseline model. While the
coefficient from (6) shows an average effect for all municipalities, specification (7) has the merit
that it is possible to distinguish between more and less liberal cantons regarding female voting rights.
15This is implicitly based on the assumption that the number of Swiss eligible men did not change in the sevenmonths between the ballots. While this surely constitutes a simplification, it should not be critical for the resultsbecause the time difference between the ballots is small.
16In detail, this means that cantonal and federal voting rights are independent of each other: while all womencould vote and elect at federal level since 7 February 1971, it might have been that they still had no cantonal votingrights after that date depending on their canton of residence. Dates of cantonal female voting rights can be found inofficial documents on http://www.ekf.admin.ch/dokumentation/00444/00517/index.html?lang=de
16
It is also the estimation with the highest fit. The variable is 0 for ballot 1. As in the baseline model,
the measure of additional male approval is used to account for an increased likelihood of men to
accept the second proposition.
Table 5: Introduction of female suffrage at cantonal level, and approval for federal female suffrage
Canton Cantonal Suffrage Yes-votes 1971 in %
Aargau (AG) 7 February 1971 50.2Appenzell A.-Rh. (AA) 30 April 1989 39.9Appenzell I.-Rh. (AI) 27 November 1990 28.9Basel Land (BL) 23 June 1968 79.9Basel City (BS) 26 June 1966 82.2Bern (BE) 12 December 1971 66.5Freiburg (FR) 7 February 1971 71.1Geneva (GE) 6 March 1960 91.1Glarus (GL) 2 May 1971 41.3Graubunden (GR) 5 March 1972 54.8Luzern (LU) 25 October 1971 62.7Neuenburg (NE) 27 September 1959 82.0Nidwalden (NW) 30 April 1972 55.8Obwalden (OW) 24 September 1972 46.7Schaffhausen (SH) 7 February 1971 56.7Schwyz (SZ) 5 March 1972 42.2Solothurn (SO) 6 June 1971 64.1St.Gallen (SG) 23 January 1972 46.5Tessin (TI) 19 October 1969 75.3Thurgau (TG) 12 December 1971 44.1Uri (UR) 30 January 1972 36.3Waadt (VD) 1 February 1959 83.9Wallis (VS) 12 April 1970 79.9Zug (ZG) 7 February 1971 59.9Zurich (ZH) 15 November 1970 66.8
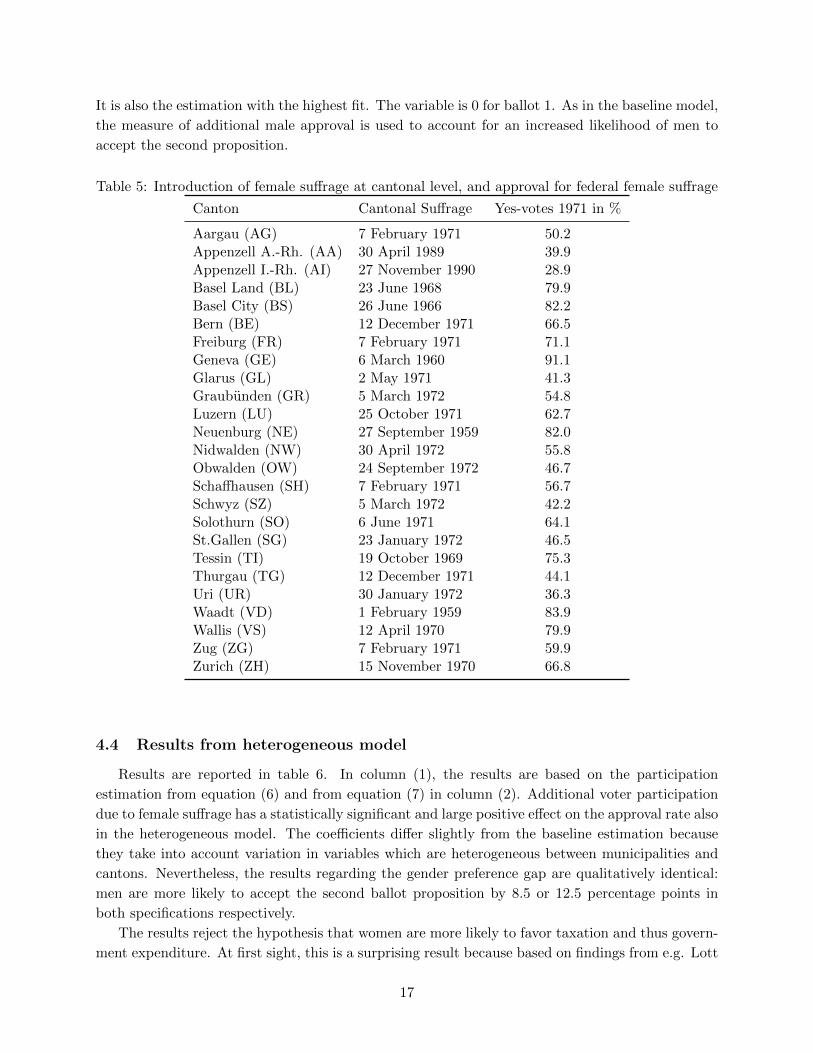
4.4 Results from heterogeneous model
Results are reported in table 6. In column (1), the results are based on the participation
estimation from equation (6) and from equation (7) in column (2). Additional voter participation
due to female suffrage has a statistically significant and large positive effect on the approval rate also
in the heterogeneous model. The coefficients differ slightly from the baseline estimation because
they take into account variation in variables which are heterogeneous between municipalities and
cantons. Nevertheless, the results regarding the gender preference gap are qualitatively identical:
men are more likely to accept the second ballot proposition by 8.5 or 12.5 percentage points in
both specifications respectively.
The results reject the hypothesis that women are more likely to favor taxation and thus govern-
ment expenditure. At first sight, this is a surprising result because based on findings from e.g. Lott
17
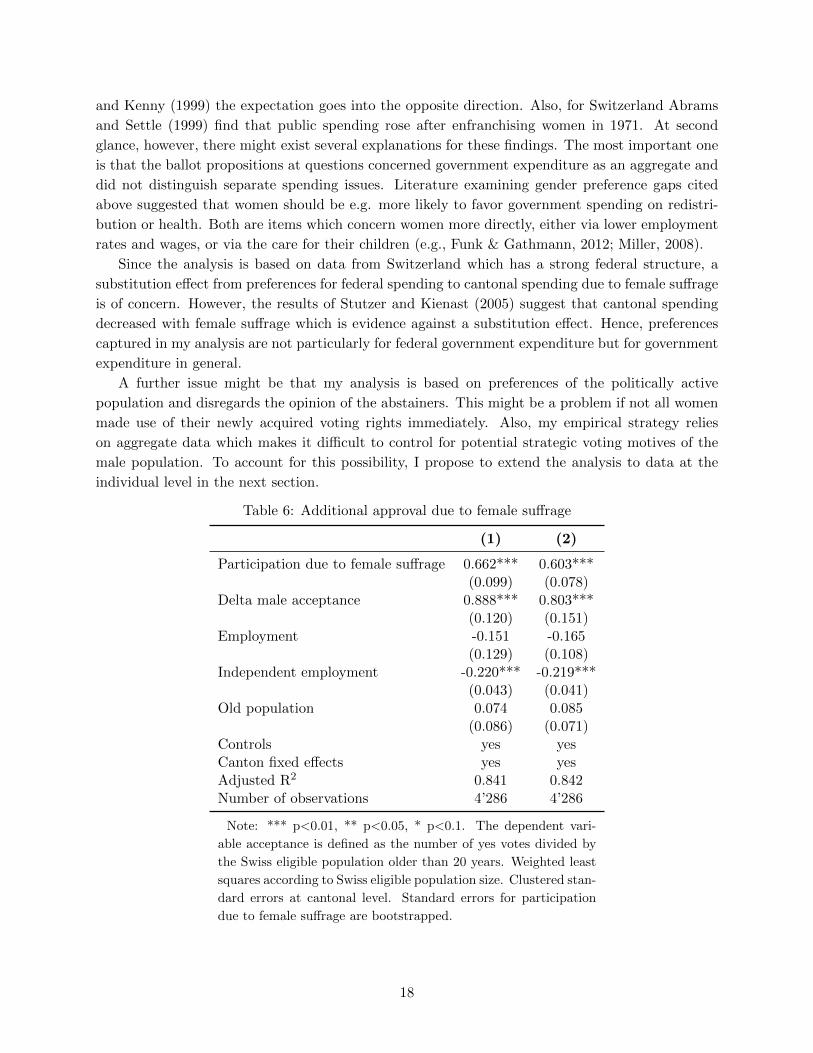
and Kenny (1999) the expectation goes into the opposite direction. Also, for Switzerland Abrams
and Settle (1999) find that public spending rose after enfranchising women in 1971. At second
glance, however, there might exist several explanations for these findings. The most important one
is that the ballot propositions at questions concerned government expenditure as an aggregate and
did not distinguish separate spending issues. Literature examining gender preference gaps cited
above suggested that women should be e.g. more likely to favor government spending on redistri-
bution or health. Both are items which concern women more directly, either via lower employment
rates and wages, or via the care for their children (e.g., Funk & Gathmann, 2012; Miller, 2008).
Since the analysis is based on data from Switzerland which has a strong federal structure, a
substitution effect from preferences for federal spending to cantonal spending due to female suffrage
is of concern. However, the results of Stutzer and Kienast (2005) suggest that cantonal spending
decreased with female suffrage which is evidence against a substitution effect. Hence, preferences
captured in my analysis are not particularly for federal government expenditure but for government
expenditure in general.
A further issue might be that my analysis is based on preferences of the politically active
population and disregards the opinion of the abstainers. This might be a problem if not all women
made use of their newly acquired voting rights immediately. Also, my empirical strategy relies
on aggregate data which makes it difficult to control for potential strategic voting motives of the
male population. To account for this possibility, I propose to extend the analysis to data at the
individual level in the next section.
Table 6: Additional approval due to female suffrage
(1) (2)
Participation due to female suffrage 0.662*** 0.603***(0.099) (0.078)
Delta male acceptance 0.888*** 0.803***(0.120) (0.151)
Employment -0.151 -0.165(0.129) (0.108)
Independent employment -0.220*** -0.219***(0.043) (0.041)
Old population 0.074 0.085(0.086) (0.071)
Controls yes yesCanton fixed effects yes yesAdjusted R2 0.841 0.842Number of observations 4’286 4’286
Note: *** p<0.01, ** p<0.05, * p<0.1. The dependent vari-
able acceptance is defined as the number of yes votes divided by
the Swiss eligible population older than 20 years. Weighted least
squares according to Swiss eligible population size. Clustered stan-
dard errors at cantonal level. Standard errors for participation
due to female suffrage are bootstrapped.
18
5 Supporting evidence from post-ballot surveys
Literature on turnout probabilities documents that citizens turn out because of various reasons.
Among them are socioeconomic variables, political and personal interest, information availability,
cost of voting, and voting history to name just a few (c.f. Wolfinger and Rosenstone (1980) for
an extensive analysis). Citizens who do not participate because they have no interest in the topic
and thus do not form any particular preferences about government spending, are of no concern.
However, abstention due to high voting cost, lack of information etc. might pose a problem,
especially since the second ballot took place only four months after female enfranchisement. The
participation decision is thus a selection into voting based on the citizens’ utility from voting. I
therefore extend the analysis to include evidence based on individual data from post-ballot surveys.
This also overcomes the problem of vote aggregation in the above analysis which made it impossible
to account for strategic or extreme voting motives.
Post-ballot surveys are conducted after all referendum and initiative ballots at national level
in Switzerland since 1981. The project is called VOX-survey, and the data are being published
by the Swiss foundation for research in social sciences.17 Randomly chosen respondents answer a
questionnaire by telephone. Among the information included are the voting behavior and various
socioeconomic controls as well as contextual information. The advantage of these polls is that
until the end of 1999 voters as well as eligible citizens who did not go to the polls answered the
questions. Importantly, they include the hypothetical answer of the nonparticipating respondents
to the question of how they would have decided if they had voted. This allows me to conduct
an analysis of voters and nonvoters by gender to analyze if the above results extend towards the
politically inactive population.
As becomes clear from above, the Swiss have to approve the federal financial order, i.e. the
federal government’s competency to levy federal taxes, by popular vote. This has not changed until
now since all propositions without a time limit have always been rejected so far. My analysis is
based on all three votes regarding the federal financial order between 1981 and 1999. These are the
ballots voted on 29 November 1981, 2 June 1991, and 28 November 1993 which is the latest ballot
concerning the federal financial order before 1999. Though tax rates and deductions have of course
changed since the ballot propositions in 1971, the matter is in fact identical to the propositions
analyzed above. The propositions of 1981 and 1993 include time limits for the federal financial order
until 1994 (Bundesblatt 1981 II, p.561) and 2006 (Bundesblatt 2003, p.1540) respectively. The 1991
proposition does not have a time limit. While in the above analysis it was of concern that women
have not yet grown accustomed to their voting rights and might have hesitated to participate, for
the later ballots female voting rights were already well established. Also, any potentially strategic
male voting behavior stemming from the introduction of female suffrage should have ceased to exist
by then.
In total, the dataset comprises answers of 1825 individuals of which 1159 have turned out to vote
and 666 have not. The main variable of interest is a gender dummy. To make the results comparable
to the main analysis above, I choose similar control variables as before. The controls are a dummy
for employment, a dummy if the respondent’s age was 65 or more, a dummy for tertiary education,
dummies for being catholic, and German-speaking. Though there exists information about income
17Data are available online on the following homepage: http://nesstar.sidos.ch/webview/index.jsp
19

and the independent work status of the respondents, these variables have too many missings which
would render the sample size unnecessarily small.18
Two concerns with electoral survey data are the reporting and non-response bias. The latter
cannot be accounted for because response is voluntary. For the former, Funk (2012) finds that
in VOX-surveys concerning federal finances no reporting bias exists on average. Nevertheless, I
compare self-reported voting with the true aggregate voting outcomes from the homepage of the
Swiss Federal Chancellery. On election day, the proposals received 69.0 (1981), 45.6 (1991), and
66.7 (1993) percent of yes votes in the total population. In the sample, 79.9 (1981), 43.9 (1991)
and 68.5 (1993) of respondents who turned out voted in favor of the proposal. This shows that
the sample is representative with respect to the voting outcomes for the ballots in 1991 and 1993.
However, self-reported voting behavior exceeds the true voting result for the 1981 ballot. A possible
explanation might be the relatively small sample size of 538 as compared to 726 and 842 in the
other two surveys.
In the pooled sample from all three ballots, among the participating 43.8 percent were women.
Of these 58.5 percent favored the propositions, compared to 64.1 percent among the male respon-
dents. Thus, among the participating the acceptance rate is higher for men than for women,
however, the difference is only weakly significant. In the group of nonparticipating, the fraction of
women was 47.1 percent. Of these, 49.7 percent would have voted yes, while 55.1 percent of men
would have done so. The descriptives by gender and participation including t-statistics by gender
can be found in table 7.
I estimate the following equation:
approvali = α+ β1femalei + δXi + uc + εi (8)
The dummy acceptancei takes the value 1 if individual i voted yes. The value 1 for the dummy
femalei indicates a female respondent. β1 is then the effect of being female on approval. If the
aggregate results hold true, β1 is expected to have a negative sign. Xi is a set of socioeconomic
controls as mentioned above, and εi is the error term. uc are canton dummies to account for canton
fixed effects.
Further, I estimate the following specification including an interaction term between women
and participation.
approvali = β0 + β1femalei + β2participationi + β3femalei ∗ participation+ β4Xi + uc + εi (9)
The marginal effect of being a women should be negative for participants as well as non-
participants if the main results extend to the non-voting population.
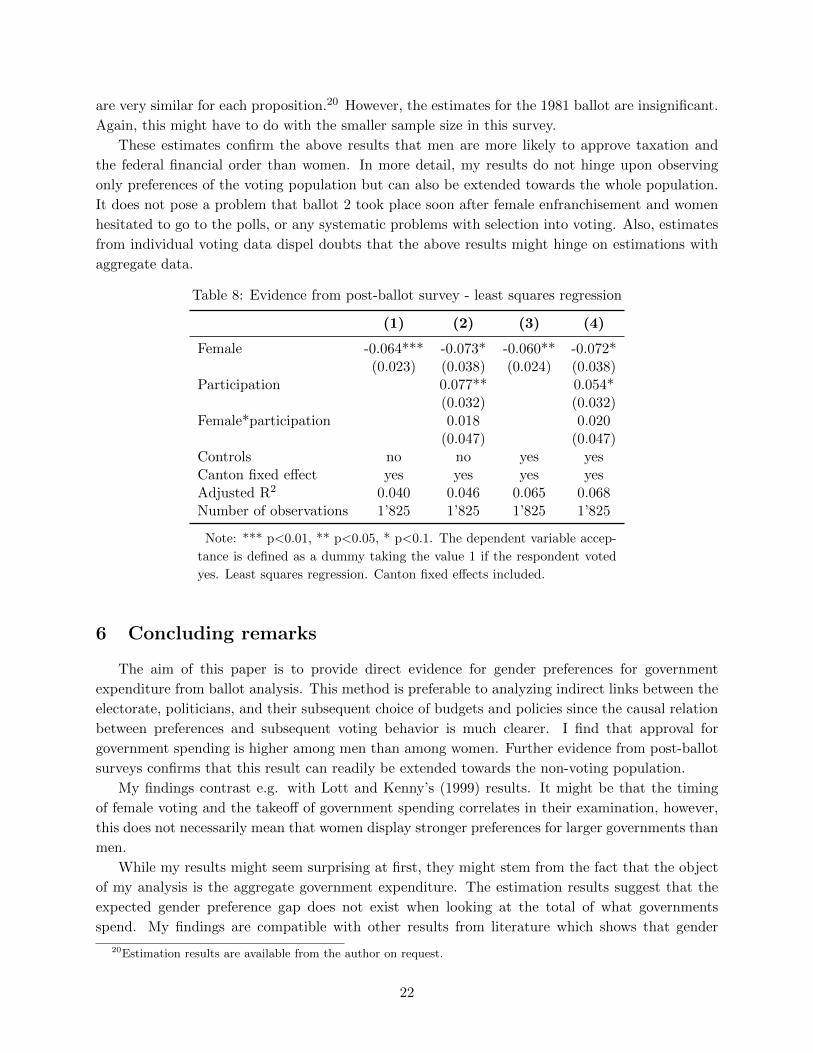
The main estimates are conducted with ordinary least squares because coefficients can be inter-
preted directly. Results are reported in table 8. Estimates of equation (8) are in column (1), those
of equation (9) in column (2). In columns (3) and (4) control variables are added in the regressions.
In all estimations the coefficient of the female dummy is negative and significant at the one,
five or ten percent significance level. The marginal effect of being a women on approving the
proposition ranges from -0.064 to -0.060. Being a women thus decreases the probability of voting
18Rerunning the regressions for the subsample of respondents for whom information on income are available doesnot change the results qualitatively.
20
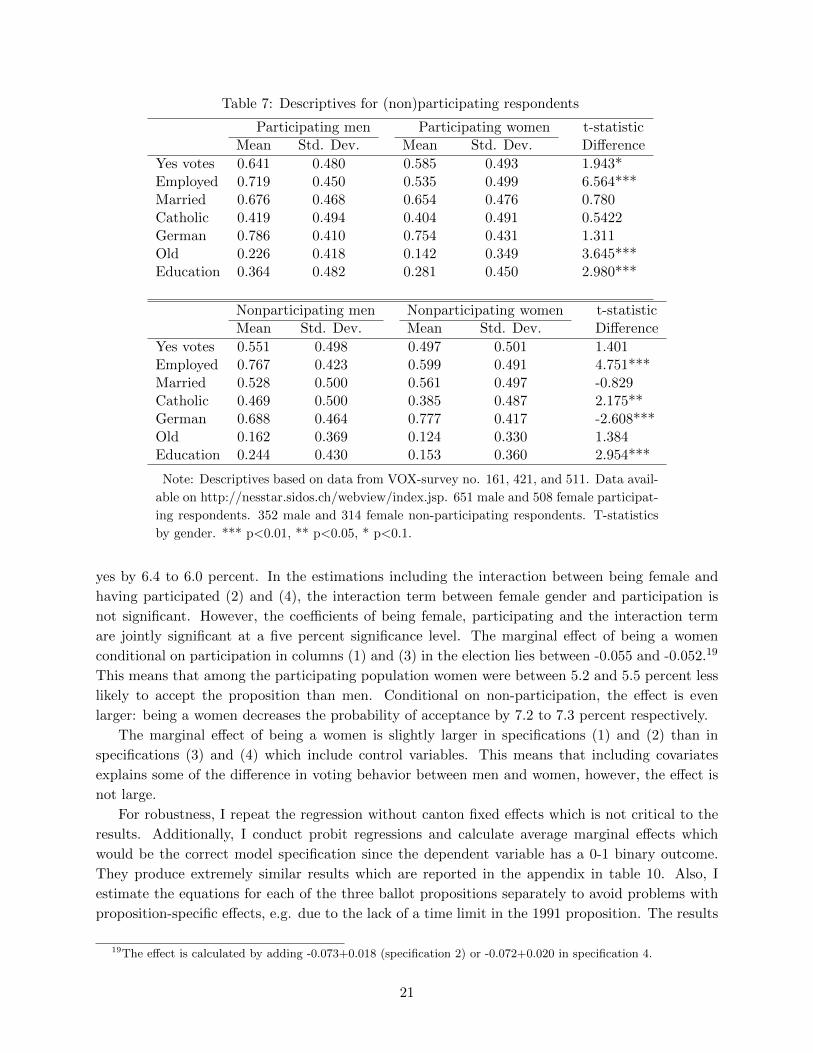
Table 7: Descriptives for (non)participating respondents
Participating men Participating women t-statisticMean Std. Dev. Mean Std. Dev. Difference
Yes votes 0.641 0.480 0.585 0.493 1.943*Employed 0.719 0.450 0.535 0.499 6.564***Married 0.676 0.468 0.654 0.476 0.780Catholic 0.419 0.494 0.404 0.491 0.5422German 0.786 0.410 0.754 0.431 1.311Old 0.226 0.418 0.142 0.349 3.645***Education 0.364 0.482 0.281 0.450 2.980***
Nonparticipating men Nonparticipating women t-statisticMean Std. Dev. Mean Std. Dev. Difference
Yes votes 0.551 0.498 0.497 0.501 1.401Employed 0.767 0.423 0.599 0.491 4.751***Married 0.528 0.500 0.561 0.497 -0.829Catholic 0.469 0.500 0.385 0.487 2.175**German 0.688 0.464 0.777 0.417 -2.608***Old 0.162 0.369 0.124 0.330 1.384Education 0.244 0.430 0.153 0.360 2.954***
Note: Descriptives based on data from VOX-survey no. 161, 421, and 511. Data avail-
able on http://nesstar.sidos.ch/webview/index.jsp. 651 male and 508 female participat-
ing respondents. 352 male and 314 female non-participating respondents. T-statistics
by gender. *** p<0.01, ** p<0.05, * p<0.1.
yes by 6.4 to 6.0 percent. In the estimations including the interaction between being female and
having participated (2) and (4), the interaction term between female gender and participation is
not significant. However, the coefficients of being female, participating and the interaction term
are jointly significant at a five percent significance level. The marginal effect of being a women
conditional on participation in columns (1) and (3) in the election lies between -0.055 and -0.052.19
This means that among the participating population women were between 5.2 and 5.5 percent less
likely to accept the proposition than men. Conditional on non-participation, the effect is even
larger: being a women decreases the probability of acceptance by 7.2 to 7.3 percent respectively.
The marginal effect of being a women is slightly larger in specifications (1) and (2) than in
specifications (3) and (4) which include control variables. This means that including covariates
explains some of the difference in voting behavior between men and women, however, the effect is
not large.
For robustness, I repeat the regression without canton fixed effects which is not critical to the
results. Additionally, I conduct probit regressions and calculate average marginal effects which
would be the correct model specification since the dependent variable has a 0-1 binary outcome.
They produce extremely similar results which are reported in the appendix in table 10. Also, I
estimate the equations for each of the three ballot propositions separately to avoid problems with
proposition-specific effects, e.g. due to the lack of a time limit in the 1991 proposition. The results
19The effect is calculated by adding -0.073+0.018 (specification 2) or -0.072+0.020 in specification 4.
21
are very similar for each proposition.20 However, the estimates for the 1981 ballot are insignificant.
Again, this might have to do with the smaller sample size in this survey.
These estimates confirm the above results that men are more likely to approve taxation and
the federal financial order than women. In more detail, my results do not hinge upon observing
only preferences of the voting population but can also be extended towards the whole population.
It does not pose a problem that ballot 2 took place soon after female enfranchisement and women
hesitated to go to the polls, or any systematic problems with selection into voting. Also, estimates
from individual voting data dispel doubts that the above results might hinge on estimations with
aggregate data.
Table 8: Evidence from post-ballot survey - least squares regression
(1) (2) (3) (4)
Female -0.064*** -0.073* -0.060** -0.072*(0.023) (0.038) (0.024) (0.038)
Participation 0.077** 0.054*(0.032) (0.032)
Female*participation 0.018 0.020(0.047) (0.047)
Controls no no yes yesCanton fixed effect yes yes yes yesAdjusted R2 0.040 0.046 0.065 0.068Number of observations 1’825 1’825 1’825 1’825
Note: *** p<0.01, ** p<0.05, * p<0.1. The dependent variable accep-
tance is defined as a dummy taking the value 1 if the respondent voted
yes. Least squares regression. Canton fixed effects included.
6 Concluding remarks
The aim of this paper is to provide direct evidence for gender preferences for government
expenditure from ballot analysis. This method is preferable to analyzing indirect links between the
electorate, politicians, and their subsequent choice of budgets and policies since the causal relation
between preferences and subsequent voting behavior is much clearer. I find that approval for
government spending is higher among men than among women. Further evidence from post-ballot
surveys confirms that this result can readily be extended towards the non-voting population.
My findings contrast e.g. with Lott and Kenny’s (1999) results. It might be that the timing
of female voting and the takeoff of government spending correlates in their examination, however,
this does not necessarily mean that women display stronger preferences for larger governments than
men.
While my results might seem surprising at first, they might stem from the fact that the object
of my analysis is the aggregate government expenditure. The estimation results suggest that the
expected gender preference gap does not exist when looking at the total of what governments
spend. My findings are compatible with other results from literature which shows that gender
20Estimation results are available from the author on request.
22
preference gaps exist but only for certain spending categories. This suggests that the scope of
government might matter more in the analysis of gender preference gaps than size of government.
E.g., Abrams and Settle (1999) find particularly strong effects of female suffrage on welfare spending
in Switzerland. Similarly, Aidt et al. (2006) show increases in health, welfare, and education
spending which are categories typically women would care for. Also Funk and Gathmann (2012)
discover gender preference gaps from individual data for health, environmental issues, defense and
welfare spending.
This paper also shows that it is important to account for socioeconomic gender differences
when analyzing gender preference gaps for the size of government. Otherwise some of the voting
differences which are due to differences in employment are taken to be caused by gender, and could
overestimate female preferences for government.
After the enfranchisement of women, public support for a larger government budget from people
who are eligible to elect politicians is not larger than before. Regarding the outcome of the vote,
namely acceptance, female suffrage does not change anything because women are not pivotal in this
case. Most likely, the male population alone would have also approved the proposition. Democratic
legitimization of government expenditure does not increase per se but only for spending categories
which are more important for women than for men.
For future research, my results emphasize the need to put more effort into understanding for
which spending categories gender preference gaps exist and what their determinants are.
23
References
Abrams, Burton A. and Russell F. Settle, “Women’s suffrage and the growth of the welfare
state,” Public Choice, 1999, 100 (3/4), 289–300.
Aidt, T.S., Jayasri Dutta, and Elena Loukoianova, “Democracy comes to Europe: Franchise
extension and fiscal outcomes 18301938,” European Economic Review, February 2006, 50 (2),
249–283.
Amt, Eidgenossisches Statistisches, Finanzen und Steuern von Bund, Kantonen und Gemein-
den 1971, Bern: Eidgenossisches Statistisches Amt Publikationsdienst, 1973.
, Offentliche Finanzen der Schweiz 1972, Bern: Eidgenossisches Statistisches Amt Publikations-
dienst, 1974.
Andreoni, James and Lise Vesterlund, “Which is the fair sex? Gender differences in altruism,”
Quarterly Journal of Economics, 2001, (February), 293–312.
Becker, Gary, “A theory of marriage,” in Theodore W. Schultz, ed., Economics of the family:
Marriage, children, and human capital, Chicago: University of Chicago Press, 1974, pp. 299 –
351.
Bertocchi, Graziella, “The enfranchisement of women and the welfare state,” European Economic
Review, May 2011, 55 (4), 535–553.
Edlund, Lena and Rohini Pande, “Why have women become left-wing? The political gender
gap and the decline in marriage,” Quarterly Journal of Economics, 2002, (August), 917–961.
Feddersen, Thimothy J. and Wolfgang Pesendorfer, “Abstention in elections with asym-
metric information and diverse preferences,” American Economic Review, 1996, 93 (2), 408–424.
and , “The swing voter’s curse,” American Political Science Review, 1999, 86 (3), 381–398.
Funk, Patricia, “Social incentives and voter turnout: evidence from the Swiss mail ballot system,”
Journal of the European Economic Association, 2010, 8 (5), 1077–1103.
, “How accurate are surveyed preferences for public policies? Evidence from a unique institutional
setup,” Barcelona GSE Working Paper, 2012, (657).
and Christina Gathmann, “Gender gaps in policy making : evidence from direct democracy,”
2012.
Gneezy, Uri, Muriel Niederle, and Aldo Rustichini, “Performance in competitive environ-
ments: Gender differences,” Quarterly Journal of Economics, 2003, (August), 1049–1074.
Grutter, Alfred, Die Eidgenossische Wehrsteuer, ihre Entwicklung und Bedeutung, Zurich: Juris
Druck + Verlag, 1968.
Hardmeier, Sibylle, Fruhe Frauenstimmrechtsbewegung in der Schweiz (1890-1930), Zurich:
Chronos, 1997.
24
Holt, Charles A. and Susan K. Laury, “Risk aversion and incentive effects,” American Eco-
nomic Review, December 2002, 92 (5), 1644–1655.
and , “Risk aversion and incentive effects : New data without order effects,” American
Economic Review, 2005, 95 (3), 902–904.
Husted, Thomas A. and Lawrence W. Kenny, “The effect of the expansion of the voting
franchise on the size of government,” 1997, 105 (1), 54–82.
Linder, Wolf, “Direct democracy,” in Ulrich Kloeti, Peter Knoepfel, Hanspeter Kriesi, Wolf
Linder, Yannis Papadopoulos, and Pascal Sciarini, eds., Handbook of Swiss politics, Zurich: Neue
Zurcher Zeitung, 2007, pp. 101 – 120.
Lott, John R. and Lawrence W. Kenny, “Did women’s suffrage change the size and scope of
government?,” Journal of Political Economy, 1999, 107 (6), 1163–1198.
Luttmer, Erzo F. P. and Monica Singhal, “Culture, context, and the taste for redistribution,”
American Economic Journal: Economic Policy, 2011, 3 (February), 157–179.
Meltzer, Allan H. and Scott F. Richard, “A rational theory of the size of government,”
Journal of Political Economy, 1981, 89 (5), 914–927.
Miller, Grant, “Womens suffrage, political responsiveness, and child survival in american history,”
Quarterly Journal of Economics, 2008, (August), 1287–1327.
Niederle, Muriel and Lise Vesterlund, “Do women shy away from competition? Do men
compete too much?,” Quarterly Journal of Economics, 2007, (August), 1067–1101.
Oechslin, Hanspeter, Die Entwicklung des Bundessteuersystems der Schweiz von 1848 bis 1966,
Einsiedeln: Etzel-Druck AG, 1967.
Office, Swiss Statistical, Eidgenossische Volkszhlung - Gemeinden - Demographische Merkmale,
Wirtschaftssektoren, Haushaltungen, Bern: Swiss Statistical Office, 1972.
Rohner, Gabriela, Die Wirksamkeit von Volksinitiativen im Bund 1848-2010, Zurich: Schulthess,
2012.
Ruckstuhl, Lotti, Frauen sprengen Fesseln, Bonstetten: Interfeminas, 1986.
Schubert, Renate, Martin Brown, Matthias Gysler, and Hans Wolfgang Brachinger,
“Financial decision-making: Are women really more risk-averse?,” American Economic Review,
1999, 89 (2), 381–385.
Selten, Reinhard and Axel Ockenfels, “An experimental solidarity game,” Journal of Eco-
nomic Behavior & Organization, March 1998, 34 (4), 517–539.
Stutzer, Alois and Lukas Kienast, “Demokratische Beteiligung und Staatsausgaben: Die
Auswirkungen des Frauenstimmrechts,” Swiss Journal of Economics and Statistics,, 2005, 141
(4), 617–650.
Wolfinger, Raymond E. and Steven J., Who votes?, New Haven: Yale University Press, 1980.
25
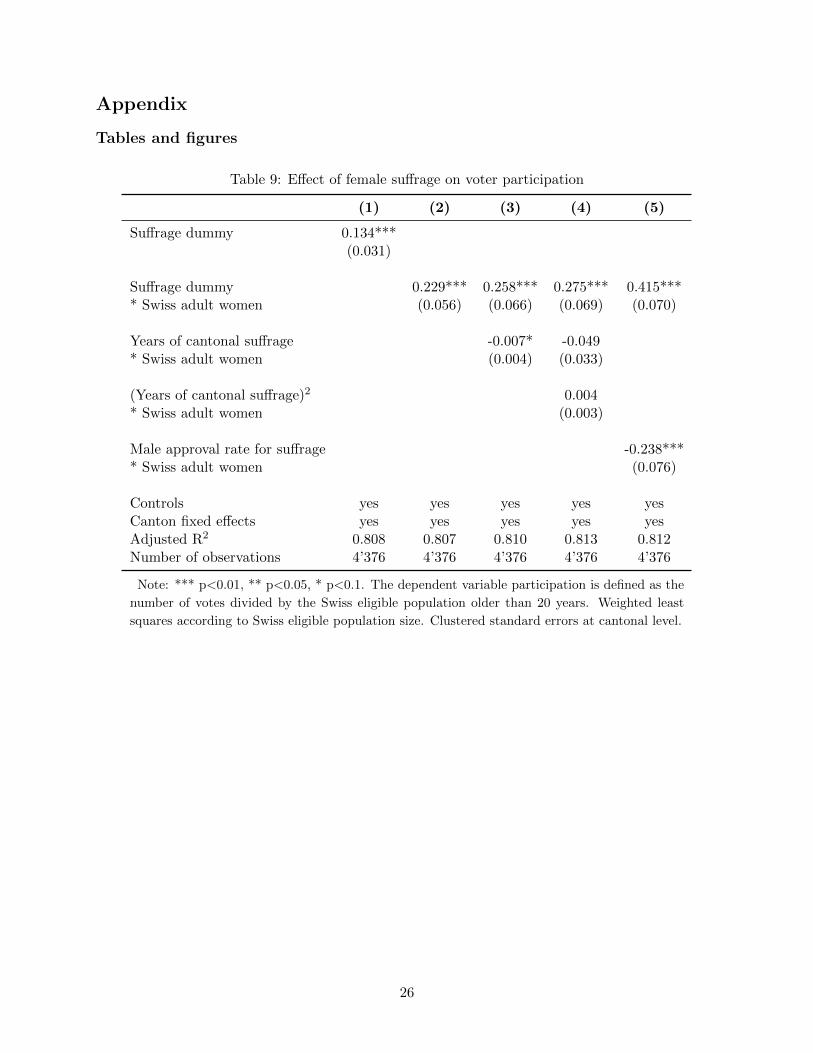
Appendix
Tables and figures
Table 9: Effect of female suffrage on voter participation
(1) (2) (3) (4) (5)
Suffrage dummy 0.134***(0.031)
Suffrage dummy 0.229*** 0.258*** 0.275*** 0.415**** Swiss adult women (0.056) (0.066) (0.069) (0.070)
Years of cantonal suffrage -0.007* -0.049* Swiss adult women (0.004) (0.033)
(Years of cantonal suffrage)2 0.004* Swiss adult women (0.003)
Male approval rate for suffrage -0.238**** Swiss adult women (0.076)
Controls yes yes yes yes yesCanton fixed effects yes yes yes yes yesAdjusted R2 0.808 0.807 0.810 0.813 0.812Number of observations 4’376 4’376 4’376 4’376 4’376
Note: *** p<0.01, ** p<0.05, * p<0.1. The dependent variable participation is defined as the
number of votes divided by the Swiss eligible population older than 20 years. Weighted least
squares according to Swiss eligible population size. Clustered standard errors at cantonal level.
26
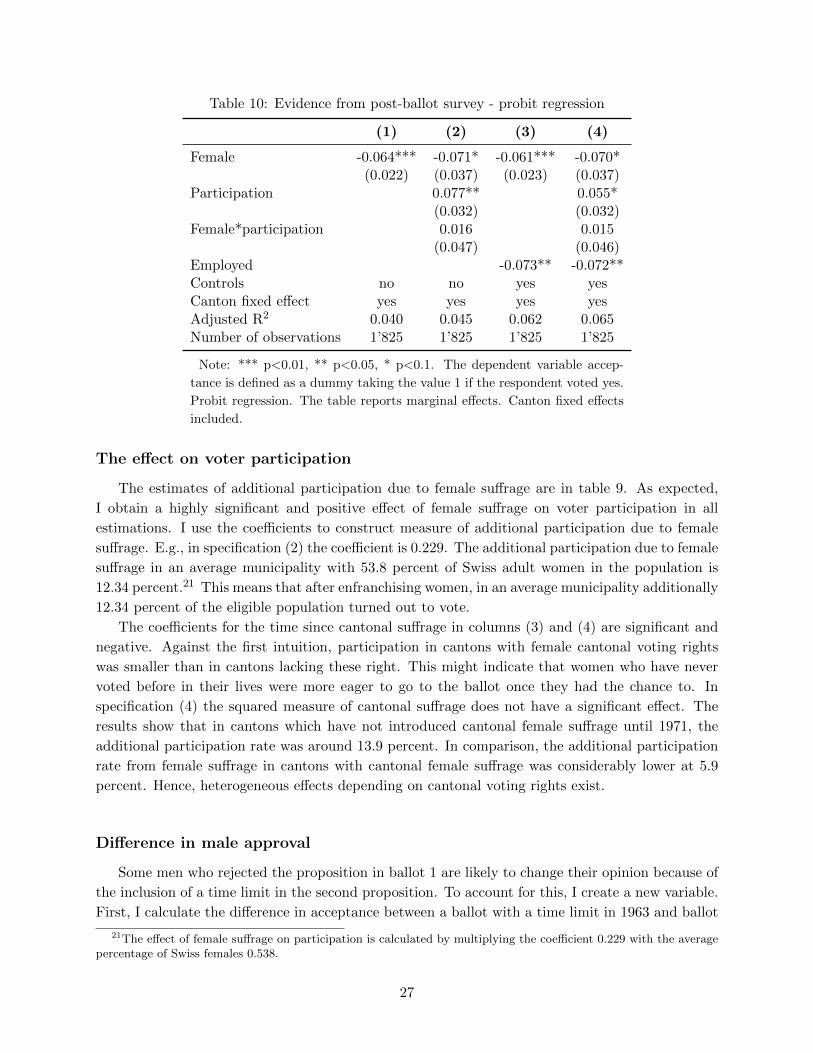
Table 10: Evidence from post-ballot survey - probit regression
(1) (2) (3) (4)
Female -0.064*** -0.071* -0.061*** -0.070*(0.022) (0.037) (0.023) (0.037)
Participation 0.077** 0.055*(0.032) (0.032)
Female*participation 0.016 0.015(0.047) (0.046)
Employed -0.073** -0.072**Controls no no yes yesCanton fixed effect yes yes yes yesAdjusted R2 0.040 0.045 0.062 0.065Number of observations 1’825 1’825 1’825 1’825
Note: *** p<0.01, ** p<0.05, * p<0.1. The dependent variable accep-
tance is defined as a dummy taking the value 1 if the respondent voted yes.
Probit regression. The table reports marginal effects. Canton fixed effects
included.
The effect on voter participation
The estimates of additional participation due to female suffrage are in table 9. As expected,
I obtain a highly significant and positive effect of female suffrage on voter participation in all
estimations. I use the coefficients to construct measure of additional participation due to female
suffrage. E.g., in specification (2) the coefficient is 0.229. The additional participation due to female
suffrage in an average municipality with 53.8 percent of Swiss adult women in the population is
12.34 percent.21 This means that after enfranchising women, in an average municipality additionally
12.34 percent of the eligible population turned out to vote.
The coefficients for the time since cantonal suffrage in columns (3) and (4) are significant and
negative. Against the first intuition, participation in cantons with female cantonal voting rights
was smaller than in cantons lacking these right. This might indicate that women who have never
voted before in their lives were more eager to go to the ballot once they had the chance to. In
specification (4) the squared measure of cantonal suffrage does not have a significant effect. The
results show that in cantons which have not introduced cantonal female suffrage until 1971, the
additional participation rate was around 13.9 percent. In comparison, the additional participation
rate from female suffrage in cantons with cantonal female suffrage was considerably lower at 5.9
percent. Hence, heterogeneous effects depending on cantonal voting rights exist.
Difference in male approval
Some men who rejected the proposition in ballot 1 are likely to change their opinion because of
the inclusion of a time limit in the second proposition. To account for this, I create a new variable.
First, I calculate the difference in acceptance between a ballot with a time limit in 1963 and ballot
21The effect of female suffrage on participation is calculated by multiplying the coefficient 0.229 with the averagepercentage of Swiss females 0.538.
27

1. Next, I multiply the difference with the fraction of Swiss eligible men and male turnout in
ballot 1. This is necessary to make the variable comparable to the additional participation due
to female suffrage. Finally, I multiply it with a suffrage dummy such that it become 0 for the
first ballot. The variable “difference in male approval” is thus constructed the following way:
suffrageb ∗% menm ∗ (% yes in ballot 1963m −% yes in ballot 1970m) ∗male turnoutm.
Federal announcements / Bundesblatter
The federal announcements are accessible online via http://www.amtsdruckschriften.bar.admin.ch.
• Bundesblatt 1962 I, pp. 997-1014. Botschaft des Bundesrates an die Bundesversammlung
uber die Weiterfuhrung der Finanzordnung des Bundes.
• Bundesblatt 1969 II, pp. 749-807. Botschaft des Bundesrates and die Bundesversammlung
uber die Anderung der Finanzordnung des Bundes.
• Bundesblatt 1970 II, pp. 1-5. Bundesbeschluss uber die Anderung der Finanzordnung des
Bundes.
• Bundesblatt 1970 II, pp. 1581-1608. Botschaft des Bundesrates an die Bundesversammlung
uber die Weiterfuhrung der Finanzordnung des Bundes.
• Bundesblatt 1971 I, pp. 486-491. Bundesbeschluss uber die Weiterfuhrung der Finanzordnung
des Bundes.
• Bundesblatt 2003 I, pp. 1531-1565. Botschaft ber die neue Finanzordnung.
Information about mutations of the municipalities are taken from the histor-
ical municipality register of the Swiss Statistical Office available online http :
//www.bfs.admin.ch/bfs/portal/de/index/infothek/nomenklaturen/blank/blank/gemliste/02.html
The Annee politique suisse (2012) is accessible online (http://www.anneepolitique.ch/de/aps-
online.php) and provides additional background information on ballots.
Data used from Swiss census (1970)
Catholics, Households with 5 and more persons, Married, Male population, Men working, Men
employed in service sector, Men independently employed, Men age 15 and older, Female population,
Women working, Total workers independently employed, Total employment in service sector, Total
population, Total population age 15 and older
28
Controls
Variable “distance to large city” is from the Federal Office for regional planning in the year
2000. The data were received from Marechal and Butler (2012). Framing Effects in Political
Decision Making: Evidence From a Natural Voting Experiment. Working Paper.
Variable “mean taxable income” is from the Eidgenossische Steuerverwaltung (Federal Tax
Administration) in Bern. It is measured for the years 1973/1974. Earlier municipal data are not
available.
Information about municipalities counting votes together in the canton Bern, and political
municipalities in the canton Thurgau were received by email from the Swiss Statistical Office.
They are available from the author upon request.
Voting data are from the Political Atlas of Switzerland of the Swiss Statistical Office. They
were retrieved for the following ballots:
• Bundesbeschluss vom 27.09.1963 uber die Weiterfuhrung der Finanzordnung des Bundes
(Verlangerung der Geltungsdauer von Art.41ter BV und Ermassigung der Wehrsteuer). Ballot
on 8 December 1963.
• Bundesbeschluss vom 24.06.1970 uber die Anderung der Finanzordnung des Bundes. Ballot
on 15 November 1970.
• Bundesbeschluss vom 09.10.1970 uber die Einfuhrung des Frauenstimm- und Wahlrechts in
eidgenossischen Angelegenheiten. Ballot on 7 February 1971.
• Bundesbeschluss vom 11.03.1971 uber die Weiterfuhrung der Finanzordnung des Bundes.
Ballot on 6 June 1971.
Choice of controls
Education and income are generally assumed to be positive drivers of turnout (Feddersen &
Pesendorfer, 1996, 1999). There are no data available on the educational background per munici-
pality in 1970. Thus, I very crudely account for education by using the percentage of population
employed in the service sector as a control. The intuition is that workers in the service sector on
average need a higher education level than in the agricultural or industrial sector. To control for
income, I include the mean taxable income in the regressions.
I take the percentage of the population employed compared to the total population above age
15 as an economic control. The higher employment, the lower approval for government expenditure
is expected to be.
I use several demographic controls to account for regional differences in the population. The
percentage of the population older than 65 years which accounts for the old population who is
eligible to vote is also included. The expectation regarding this control is in line with the general
notion that older people are more likely to vote than younger ones and thus should increase turnout
(Wolfinger & Rosenstone, 1980).
29
Further, I use the percentage of catholics in the population to account for more traditional
and conservative preferences. The expected effects might be twofold. On the one hand, turnout
can be higher in more catholic regions because families can go to the ballot directly after Sunday
mass and are seen by their neighbors fulfilling their civic duties. This was the only way of voting,
because postal voting was not yet available in Switzerland in 1970 (Funk, 2010). On the other
hand, the church decidedly opposed female political activity (Hardmeier, 1997) such that women
in predominantly catholic regions might have been less likely to participate in the voting. The
fraction of the German-speaking population is included to account for cultural differences between
municipalities. Especially in the Western cantons French is the dominant language, and Italian in
the canton Ticino.
As explained in the previous section, families with many children and married couples were
favored in both ballots when compared to the pre-1970 regulation of the tax system. I define large
households as households with five and more persons. A large household thus means that there
are several financially dependent persons in the house like children under 18 years or students.
The larger the number of children per household, the higher is the potential tax deduction. This
should increase the approval for both ballot proposals. Also, I account for the fraction of married
individuals in the population. For this control, the expectation goes into the same direction as
with large households: with a higher number of married persons tax deductions are higher and
thus expected approval which is true for both ballot propositions.
As described above, the new proposals shifted some of the tax burden from income taxes to
turnover taxes. This was likely to be paid for by firms and not private households. I control for
this by adding the fraction of independently employed workers to my analysis.
Urbanization needs to be controlled for since voters in more urban areas face lower voting
costs and people probably have other preferences. As a first measure, I include the logarithm
of the municipal population size accounting for large municipalities. A second measure is the
distance in kilometers from the municipality to the next regional center (i.e., to Zurich, Bern,
Basel, Winterthur, St.Gallen, Lugano, Lausanne, or Geneva). This captures the notion that some
small municipalities may be quite well connected with big cities while others may be located in
rural alpine regions.
Three controls for which data are available by gender are employment, independent employment
which is the proxy for the number of firms, and the fraction of the old. These variables also
constitute the controls which are most likely to differ between men and women. T-tests for all
three variables reject the hypothesis that the means by gender are not significantly different from
zero at a 1% significance level.
The most notable gender gap in these controls is in the employment rate. Women were much
less likely to work than their male counterparts. This means that with the introduction of female
suffrage the average employment rate of the electorate fell by a large amount. Edlund and Pande
(2002) suggest that this should increase approval for government expenditure. The most extreme
case they cite is when women are housewives and fully depend on their husbands’ income which
would render them depending on state welfare after a divorce. The data treats part-time and full-
time jobs equivalently. Therefore, the true female employment rate is probably even lower than
what is estimated here because many women are employed only in part-time occupations (Swiss
Statistical Office, 1972).
30
On average women live longer than men which is supported in the data by a higher fraction of
women above 65 years of age than of men. Enfranchising women thus increases the average fraction
of the old in the population which has implications for the expectation of voter turnout. On the one
hand, it is likely that young women vote more actively because costly political knowledge acquired
at a young age can be used for a longer time. However, older women, even though they were not
allowed to vote before 1971, have passively gained political experience throughout their lives. Since
older people are in general more likely to make use of their voting rights, I expect in a similar vain
to Lott and Kenny (1999) the fraction of older women in the population to be positively correlated
with the turnout rate.
31