Embed Size (px)
Citation preview

Does 3D phenotyping yield substantial insights in thegenetics of the mouse mandible shape?Nicolas Navarro∗,1 and A. Murat Maga†, ‡
∗Biogéosciences, UMR CNRS 6282, Univ. Bourgogne Franche-Comté, EPHE, PSL Research University, F-21000 Dijon, France, †Division of CraniofacialMedicine, Department of Pediatrics, University of Washington, Seattle, WA, United States of America, ‡Center for Developmental Biology and RegenerativeMedicine, Seattle Children’s Research Institute, Seattle, WA, United States of America
ABSTRACT We describe the application of high-resolution 3D micro-computed tomography, together with 3Dlandmarks and geometric morphometrics, to validate and further improve previous quantitative genetic studiesthat reported QTLs responsible for variation in mandible shape of laboratory mice using a new backcrossbetween C57BL/6J and A/J inbred strains. Despite the increasing availability of 3D imaging techniques,artificial flattening of the mandible by 2D imaging techniques seems at first an acceptable compromise forlarge-scale phenotyping protocols thanks to abundance of low-cost digital imaging systems such microscopesor digital cameras. We evaluated the gain of information from considering explicitly this additional thirddimension and also from capturing variation on the bone surface where no precise anatomical landmarkcan be marked. Multivariate QTL mapping conducted with different landmark configurations (2D versus3D; manual versus semilandmarks) broadly agreed with the findings of previous studies. Significantly moreQTLs (23) were identified and more precisely mapped when the mandible shape was captured with a largeset of semilandmarks coupled with manual landmarks. It appears that finer phenotypic characterizationof the mandibular shape with 3D landmarks, along with higher density genotyping, yields better insightsinto the genetic architecture of the mandibular development. Most of the main variation is nonethelesspreferentially embedded in the natural 2D plane of the hemi-mandible, reinforcing the results of earlierinfluential investigations.
KEYWORDS
3D geometricmorphometricsmultivariate QTLmappingMus musculusmandible shape
INTRODUCTION
Geometric morphometric methods based on landmarks offer aconvenient statistical framework to conduct quantitative geneticanalyses of the shape of complex morphological structures such asskull and mandible (Klingenberg 2010). Among model systems ingenetics and development of complex trait, the mouse mandibleis probably one of the most extensively used (Atchley et al. 1985;Atchley and Hall 1991). The primary reason for this success isits intermediate level of complexity (Klingenberg and Navarro2012) between rather complex models such as the skull (Hallgríms-son et al. 2014) and simpler models such as the drosophila wing
Copyright © 2016 Nicolas Navarro et al.Manuscript compiled: Tuesday 23rd February, 2016%1Biogéosciences, UMR 6282, Univ. Bourgogne Franche-Comté, 6 bd Gabriel, F-21000Dijon, France. E-mail: [email protected]
(Dworkin et al. 2011; Debat et al. 2009) or other insect appendages(e.g., Khila et al. 2009; Emília Santos et al. 2015; Prud’homme et al.2012). One historical reason, and probably a major constituent ofthat success, is the relative flatness of this bone allowing rudimen-tary 2D imaging techniques to be used effectively.
Genetic architecture, imprinting effects, integration and mod-ularity of mouse mandible have been investigated in fairly highdetail using geometric morphometrics (Klingenberg et al. 2001,2004; Leamy et al. 2008; Boell et al. 2013; Suto 2009; Boell et al. 2011;Boell 2013; Boell and Tautz 2011). One common assumption in themajority of these studies is the approximation of the mandible to a2D shape based either on photograph of the medial or of the buccalsides. 2D imaging of 3D shapes is well known to imply an informa-tion loss and errors due to the object projection (see Cardini 2014,for a review of this source of error). This flattening may representa major factor of variation in the sample because of its intricateinteraction with the positioning of the object and its shape itself. It
Volume X | February 2016 | 1
INVESTIGATIONS
G3: Genes|Genomes|Genetics Early Online, published on February 26, 2016 as doi:10.1534/g3.115.024372
© The Author(s) 2013. Published by the Genetics Society of America.
has been nonetheless a common practice for years in the commu-nity to collect data in 2D mainly because of technical availabilityand feasibility as well as processing speed compared to 3D data.Despite potential consequences, the 2D projection error inherent tothis practice has been rarely explicitly assessed in morphometricprotocols compare to other kind of digitization and observer errorsthat are routinely controlled (e.g., Muñoz-Muñoz and Perpiñan2010; Yezerinac et al. 1992). For the mandible, the sole study thatwe are aware of reports that 2D approximation is actually accu-rate for marmot data (Cardini 2014). With increased availabilityand reduced cost of both surface and volumetric high-resolutionimaging, it is becoming more and more feasible to conduct studiesusing 3D landmarks and while emancipating from issues relatedto artificial 2D flattening.
At the same time in genetics, there is a growing interest to deci-pher the genetic architecture of within-population variation andlocal adaptation using genome-wide association studies in eithernatural populations or outbred stocks (Mott and Flint 2013; Flintand Eskin 2012). In such populations, variants are segregatingat variable frequencies and linkage disequilibrium is in the orderof a few dozen kb (Yalcin et al. 2010), and this molecular varia-tion need to be captured. Nowadays, dense SNP maps obtainedfrom genotyping arrays commercially available or from diversegenotyping-by-sequencing techniques such as whole-genome rese-quencing (Huang et al. 2009), RAD-seq (Baird et al. 2008; Petersonet al. 2012; Miller et al. 2007), multiplexed shotgun sequencing (An-dolfatto et al. 2011; Cande et al. 2012), or targeted capture (Jonesand Good 2016; Linnen et al. 2013; Olson 2007; Chevalier et al. 2014;Hodges et al. 2007; Gnirke et al. 2009), may yielded thousands tomillions of SNPs even in species lacking reference genome (Elshireet al. 2011). This structure of molecular variation requires the useof large sample sizes that are in the order of a few thousands in thebest case scenario of average minor allele frequencies (e.g., Valdaret al. 2006; Navarro and Klingenberg 2007). Failure to reach thesehigh sample sizes will undoubtedly come up with difficulties toreach significance and be able to make decision between noiseand signal in association (Ledur et al. 2009). These studies mayfinally come up with mixed results, mapping the main playersbut accounting only for a low fraction of the total genetic variancesuggesting large amount of missing heritability (e.g., Pallares et al.2014).
Whether the imaging modality is 2D or 3D, process of acquiringlandmark coordinates remained predominantly the same in thelast 30 years, i.e. tedious, manual expert annotation of the anatomy.Moreover, the third dimension presents unique challenges (e.g.,dealing with accurate projection of 3D structure on a 2D mediumlike computer screen and/or artifacts relating to the orthographicor perspective rendering of the specimen), and the amount of timeto access the accuracy of landmarking (i.e. making sure the se-lected landmark is actually located on the specimen, not an artifactof 3D rendering angle) clearly counter-balances the gains by adramatic cost on the actual feasible sample size. Landmarking in3D requires from 10 seconds to 1 minute per landmark dependingon the expertise and software used (Bromiley et al. 2014). Thesenumbers are also in the order of time required for digitizing acomplete mandible in 2D. Modern phenomics need those largesample sizes to follow high-throughput genomic technologies andquestions of modern genetics (Houle et al. 2010). A variety of alter-natives to manual expert annotation exists or are currently underdevelopment depending on the field and the imaging modalitiesused (Perakis et al. 2014; Liu et al. 2008; Aneja et al. 2015; Perakiset al. 2010; Guo et al. 2013). For instance, attempts have been made
to annotate landmarks on CT scans of new specimens using ma-chine learning algorithm applied to an initial training set createdby experts (Bromiley et al. 2014), or using registrations of wholesurfaces or volumes (Rolfe et al. 2011) sometimes coupled withmultiple atlases allowing a precision comparable to manual edit-ing (Young and Maga 2015). Most approaches are actually basedon the dense registration of whole surfaces or volumes and there-fore encapsulate homologies at the level of the whole structure.In such phenotyping protocols, constraining the registration ofthe whole structure with some expert annotation improves pointcorrespondence by ensuring homologies of some anatomical fea-tures (McCane 2013). The semilandmark approach (Bookstein 1997;Gunz et al. 2005; Gunz and Mitteroecker 2013) employs such pointson curves and surfaces for which homology condition is relaxed.These landmarks do not have a one-to-one correspondence butquantify anatomical regions where precise manual annotation isnot feasible or possible. The technique uses true landmarks toanchor the homology and the optimal placements of these pointsare obtained by sliding them locally on the surface until either theProcrustes distance or the Bending energy is minimized (Gunz andMitteroecker 2013).
Here we want to revisit some of the QTL studies of mandibu-lar shape in mice using landmarks acquired in 3D. We chose themandible as our structure of interest, because it is a well-studiedmodel system where several QTL mapping of geometric shapehave already been done in the past in inbred intercross (Klingen-berg et al. 2001; Leamy et al. 2008). Since none of these studies haveassociated 3D data for their samples, we turn to a new mouse back-cross between A/J and C57BL/6J that we recently reported (Magaet al. 2015). We want to reassess mandibular shape genetics usingthis new dataset and 3D phenotyping, and evaluate the gain ofinformation (if any) from the third dimension given that mandibleflattening seems at first an acceptable compromise for large-scalestudy. As a secondary goal, we want to increase the phenotypiccoverage of the mandible using a template of semilandmarks thatis tied into the already collected expert landmarks and assess if weobtain any further benefit from dense phenotypic coverage.
MATERIALS AND METHODS
Experimental design and statistical shape analysisAll experimental design, genotyping, the rational for mappingshape loci using multivariate techniques and a complete devel-opment of the multiple QTL mapping approach used are de-tailed in an open paper (Maga et al. 2015). Briefly, skulls of433 (A/J×C57BL/6J)×A/J 28-day-old individuals were microCTscanned at 18µm spatial resolution, and genotyped from liver tis-sue at 882 informative autosomal SNPs using the Illumina mediumdensity linkage panel. After phenotyping and removing six in-complete specimens (see below for specific details relative to themandible) a full generalized Procrustes analysis (Dryden andMardia 1998) was performed on these 3D landmarks using theR/Morpho package (Schlager 2015a), and then multivariate shapeQTL mapping was done using the R/shapeQTL package (Navarro2015) of R statistical software (R Core Team 2015). All animal proto-cols were approved by the University of Washington’s InstitutionalAnimal Care and Use Committee.
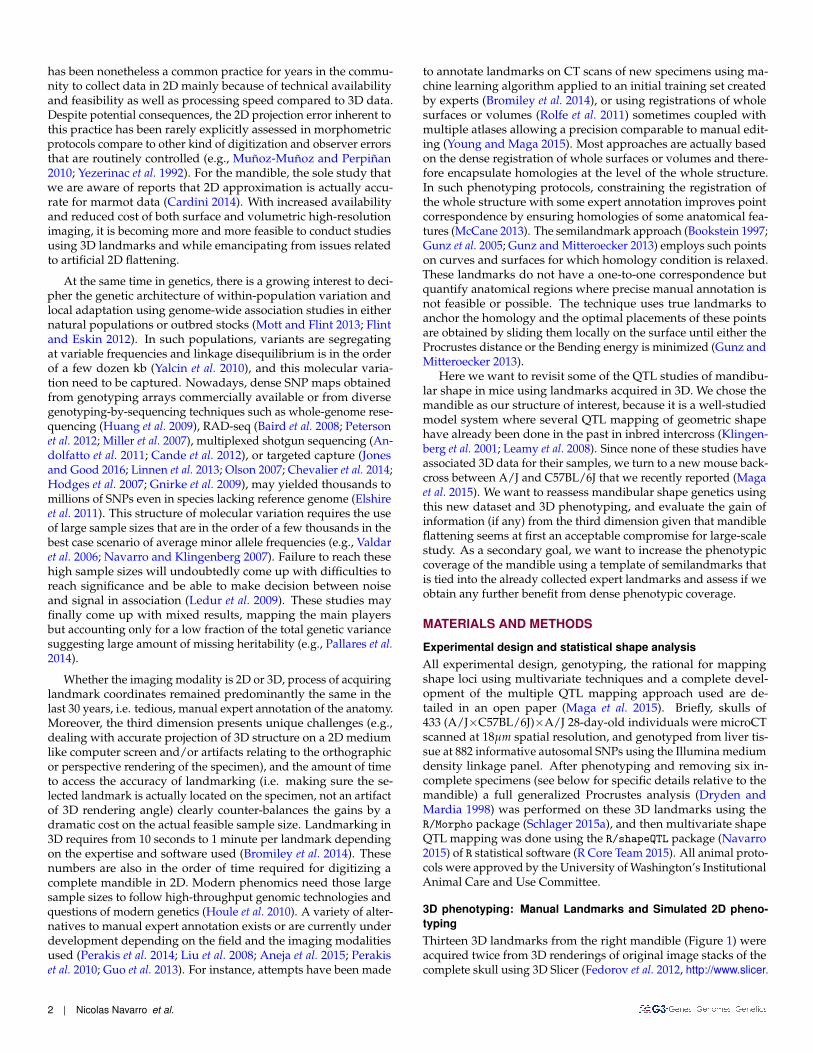
3D phenotyping: Manual Landmarks and Simulated 2D pheno-typingThirteen 3D landmarks from the right mandible (Figure 1) wereacquired twice from 3D renderings of original image stacks of thecomplete skull using 3D Slicer (Fedorov et al. 2012, http://www.slicer.
2 | Nicolas Navarro et al.
org). The sets were averaged as the best estimate of the landmarklocation. These landmarks correspond to the classical set of ∼15landmarks used in previous studies of mouse mandible genetics(Atchley et al. 1985; Klingenberg et al. 2004; Leamy et al. 2008). Weinitially acquired more landmarks but we found some gross orsystematic errors on several of them, which were consequentlyremoved. On the remaining set of 13, no systematic error betweenlandmarking sessions was found (F32,821 = 1.28, p = 0.14), and thepercentage of measurement error was 4.38% and ranged from 2.6to 7.55% per landmark.
Figure 1 Mandibular 3D surface, landmark and semilandmark tem-plates. Light blue and gray dots are manual 3D landmarks. Smallgreen dots represent the semilandmark template. The two gray land-marks and the small purple dot were used as initial reference planefor 2D flattening prior to optimization.
For a fair comparison with existing results based on 2D imagingand to better evaluate the gain from the third dimension indepen-dently of the gain of a denser genotyping, we artificially flattenedthe mandibular 3D landmarks. To do that, we first aligned eachmandible to its main axes, then chose three landmarks to start(dark gray and purple landmarks in Figure 1): the lower pointof the angular process, the lower end of symphysis and an addi-tional landmark (purple landmark) at the top of the inner ridgemeeting the molar alveolus. Positions of the first two were refinediteratively based on the innermost vertex of the mesh along thenormal to the plane they defined with the third landmark. Thesethree landmarks defined an approximate natural plane on whichthe mandible would lay. All 13 landmarks were then orthogonallyprojected according to the normal to this plane.
3D phenotyping: SemilandmarksRight mandibles were segmented from the articulated heads. Im-age voxel resolution was reduced from 18µm to 36µm to makefurther image processing and computations more feasible. We
applied a global threshold to remove non-bone material followedby a watershed algorithm to fill any gaps, since watertight meshesare critical for generating semilandmarks on the bone surface. A3D Gaussian filter with σ = 0.2 was applied to reduce the noise invoxel data. Along this process six specimens were identified withincomplete mandible scans, and removed from the analysis.
Because the manual landmarks were annotated on the originalfull-resolution, articulated mouse heads, small differences may ex-ist between the 3D surface and the 3D landmarks due to the image-processing pipeline employed. Therefore, we back-projected theaveraged landmarks onto the mandibular surface based on theshortest Euclidean distance between the landmark and the 3Dmesh. This ensured that the manual landmarks also existed on thehemi-mandible meshes generated for this analysis.
A template of uniformly distributed semilandmarks was gen-erated using poisson-disk sampling on the closest individual tothe mean shape of 3D landmarks. As an alternative, targeted tem-plates using curves and patches may have been developed to focuson specific anatomical features like ridges on the surface (e.g.. mas-seteric ridge) or borders (Swiderski and Zelditch 2013; Andersonet al. 2014), but our aim is to model the bone surface densely. Pointslying on the incisors or molars were also manually identified andremoved from the template. In the end, we retained 579 semi-landmarks (green landmarks in Figure 1) in addition to our 13expert-annotated landmarks. This template was deformed ontonew samples by thin-plate splines based on these 13 landmarks.
Semilandmarks were further slided based on the bending-energy and back-projected on the actual mesh surfaces after thesliding relaxation (Gunz et al. 2005). Both the expert-annotatedlandmark and the semilandmark data were subjected to twoindependent full GPA. The described procedure made use ofvcgSample function from the Rvcg package (Schlager 2015b) andthe closemeshKD, placePatch and 3Dslider functions of theR/Morpho package (Schlager 2015a).
Shape QTL mapping
The effect at the locus l was estimated using the multivariate linearmodel yi|Mi ∼ Nq(µ + ∑c xicβc + ∑j pijβj, S) where xic is thevalue of the covariate c and pij = Pr(gi = j|Mi) is the probabilityof the QTL genotypes given the flanking markers M for individuali. These probabilities were computed using R/qtl (Broman et al.2003). The effects β are the q-dimensional effect of the covariate c(i.e. log of the centroid size, gender and direction-of-cross) or ofthe genotype j representing the direction and magnitude of theshape change of the overall configuration of landmarks within theshape space.
A forward/backward algorithm was used for multiple QTLmodel searching. This procedure drops and refines position ofadditive QTLs without any prior knowledge on their number perchromosome, and compares models based on a penalized LODscore (Broman and Speed 2002; Broman and Sen 2009; Manichaikulet al. 2009), pLOD(γ) = − log10 p − T|γ|. The forward searchwas repeated up to a model γ including 50 QTLs. The penalty Tfor each additional QTL was evaluated using 1000 permutationsapproach (Churchill and Doerge 1994). One classic inferentialapproach in geometric morphometrics uses the sum of the residualsum of squares (Goodall 1991). Here, pLOD scores are derivedfrom the Pillai’s trace, a classic multivariate statistic, which makeuse of covariances and is proven to be fairly robust in a variety ofsituations (Olson 1974, 1976; Tabachnick and Fidell 2013). However,it is important to note that recent approaches to decipher the basisof adaptation or speciation using RAD-seq or similar techniques
Volume X February 2016 | mandible shape QTLs in 3D | 3

(see Jones and Good 2016, for a review) in non-model organismsmay have fairly small sample size compared to the dimensionalityof phenotypes (e.g., Huber et al. 2015). Such n << p studies mightgain in robustness at focusing just on variances, dropping thecost of estimating covariances, as suggested also in other contexts(Adams 2014). Our multivariate approach for mapping multipleQTLs is very similar to the one developed for mapping of function-valued trait with pLOD based on the sum of the residual sum ofsquares (Kwak et al. 2014; Gray et al. 2015). Bayes credible intervalsof QTLs were computed from the 10LOD(θ) profile (Dupuis andSiegmund 1999; Sen and Churchill 2001; Manichaikul et al. 2006).
The magnitude of shape changes associated with each QTL wasexpressed first in unit of Procrustes distance as the norm of the
additive vector∥∥∥βj
∥∥∥ = (βjβtj)
0.5 (Klingenberg et al. 2001; Work-man et al. 2002). Also, the amount of variation account for, givenall other QTLs and covariates, was reported as the percentageof total Procrustes variance (%SST in Table S1 and S2), a statis-tic routinely used with multivariate linear model (e.g., Monteiro1999). We also reported the effect size as a percentage of varianceaccounted for in the specific direction defined by the additive vec-tor βj in the shape space (%SS proj Scores in Table S1 and S2).
For that, we defined a new shape variable, v = Yβtj(βjβ
tj)−0.5,
corresponding to the shape variable the most associated with theshape changes defined by βj and containing both the effect andthe residuals in that specific direction (Drake and Klingenberg2008). The proportion of those projection scores explained by theQTL j is then the ratio of variance between the E(v|pj) and thescores v. Its expectation with backcross and unlinked QTLs is
h2j =
∑k β2j,k
βj(BtB + 4× Σe)βtj(βjβ
tj)−1
.
QTL-based G matrices were compared across the three ap-proaches using only the xy(z)-coordinates of the 13 manual land-marks that were common across the set of matrices to be compared.Many approaches for matrix similarity have been used in the liter-ature for comparing G matrices across populations (e.g., Aguirreet al. 2013; Teplitsky et al. 2014) or between levels of variation(see for example Debat et al. 2009, for contrasting canalizationand developmental stability). Overall distance between G matri-ces was assessed with the root Euclidean distance (Dryden et al.2009), dH(G1, G2) = ||G1/2
1 −G1/22 || with the matrix square root
G1/2 = UΛ1/2U−1 where UΛU−1 is the spectral decompositionof G. Then, the similarity between gmax was measured as theirangle, which was compared to 100, 000 pairs of random vectorsto assess significance whether two gmax were more similar thanpairs of random vectors (Klingenberg and Leamy 2001). To extendthis comparison beyond gmax and pairwise comparisons, we com-puted the common subspace H across the three G (Krzanowski1979). The matrix H = ∑3
i=1 AiAti , where Ai corresponds to the
first qi eigenvectors of Gi. We chose qi based on the cumulativeamount of variance accounted for (≥ 90%). Briefly, the spectral de-composition of H provided axes maximizing the similarity amongmatrices ∆ = ∑3
i=1 cos2 δi, where δi is the angle between an eigen-vector and the subspace Ai. An upper bound of ∆ is the number ofmatrices to compare. Angles δi quantified how different are eacheigenvector of H from the qi eigenvector of Gi (see for exampleAguirre et al. 2013, for a more detailed treatment). Finally, wecompared also the three datasets based on their difference in termof heritability. With multidimensional trait, heritability is also mul-tidimensional (Klingenberg 2010), meaning that beyond an overallamount of heritable variance there are also directions across the
shape space accounting for a varying degree of heritable variation.The multivariate analogue to h2 is GP−, where − stands for theMoore-Penrose generalized inverse. Its spectral decompositionUΛU−1 provided these directions in the shape space maximizingheritability (Klingenberg and Leamy 2001).
These shape features uh as well as any eigenvector of G orP or QTL effects βj might then be amplified and visualized ascolorized 3D surface using thin-plate spline mapping from themean shape and its mesh model and by computing the signeddistance between these extrapolated meshes. This visualizationprocedure made use of tps3d and meshDist functions from theR/Morpho package (Schlager 2015a).
Comparison with previous mapping dataMandible shape QTL have been already assessed in several studiesusing 2D landmarks on F2 mice from a LG/J×SM/J intercross(Klingenberg et al. 2001, 2004) or on F3 mice from the same cross(Leamy et al. 2008). Despite missing confidence intervals for thediscovered QTLs, the latter was kept for comparison, becauseit represented a follow-up study on the former two with moremarkers and more individuals. A genome-wide association studyusing the first generation of wild-caught mice from a hybrid zone(Pallares et al. 2014) was also included in comparisons. It differsfrom the three others by its use of outbred hybrid mice, 3D data,but smaller sample size (Table 1).
Closest proximal and distal markers given for the confidenceintervals in earliest studies were converted to the current geneticmap (Cox et al. 2009) using the Jackson’s Laboratory Marker QueryTool. The SNP used in the mapping from F3 of the LG/J×SM/Jintercross (Leamy et al. 2008) were converted to the Cox map usingthe Mouse Map Converter tool of the Jackson Laboratory usingthe SNP IDs. Six SNPs were not recovered from their IDs in theconversion. Genomic positions in the NCBI build37 for theseSNPs were known from the updated heterogeneous stock data(Shifman et al. 2006; Valdar et al. 2006). They were then convertedfrom those NCBI build37 genomic coordinates to the Cox mapusing the Mouse Map Converter tool. The genomic positions ofloci discovered in Pallares et al. (2014) were converted from theGRCm38 coordinates to the Cox’s map using the same tool.
Some markers used in LG×SM studies (Klingenberg et al. 2001,2004) are now known to be syntenic and do not localize to a specificlocation in the genome. Overall three QTLs were removed from thecomparison, and left or right positions of the confidence intervalwere imputed with values from the central position for three others.The central position of two other QTLs was treated as missingbecause the new map position fall outside the confidence intervaland the closest flanking marker was several dozen of cM away.All these imputation leads to slightly underestimated descriptivestatistics on confidence interval from previous studies. Such biasis nonetheless against any evidence of gain in precision of QTLlocation with more recent data.
Data AvailabilityGenotypes and phenotypes are available from the supplementaryFile S1 as a cross object readable by R/qtl or R/shapeQTL.
RESULTS
Mandible shape variationVariation from expert-annotated 3D landmarks was dispersed with22 out of 32 principal components (PC) with a variance higher than1% and explaining 94% of the total Procrustes variance. Two first
4 | Nicolas Navarro et al.

n Table 1 Study design and descriptive statistics on confidence interval on QTL positions
Studya N land Dim N mrk N ind Ageb cross N QTL Q1c Median Q3 ∑
Present-2D 13 2D 822 427 28 N2:(B6×AJ)×AJ 17 6 9 20 276.8
Present-3D 13 3D 882 427 28 N2:(B6×AJ)×AJ 19 7 9 17.3 271.2
Present-3D Semiland 13+579 3D 882 427 28 N2:(B6×AJ)×AJ 23 2.5 5.1 9.2 168.9
Klingenberg et al. (2001) 5 2D 76 476 70 F2:LG×SM 23 12 16.9 29.6 477
Klingenberg et al. (2004) 16 2D 76/96 954 70 F2:LG×SM 32 8.5 13.3 24 560
Leamy et al. (2008) 15 2D 353 374+1515 70 F2+F3:LG×SM 37
Pallares et al. (2014) 14 3D 145 378 178 63-84 F1:wild-caught 10 0.04 0.09 0.12 0.9
a For the Klingenberg’s studies, QTLs with markers now known to be syntenic were either removed or replaced with the central position of the QTL when possible. See text for further detailsb Age in daysc Intervals are given in cM according to the current genetic map (Cox et al. 2009) and were converted from earlier map or physical position using the Jackson’s Laboratory Marker Query
Tool.
PCs explained about 13% each (Figure 2A). Interestingly, the in-terpolated shape changes (using thin-plate-spline) associated withPC1 show strong correlated deformations in muscle insertion re-gions where no landmarks are digitized to actually capture genuinevariation in these regions. Shape variation in 2D was dispersedwith 18 out of 22 PCs with a variance higher than 1% explaining97% of the total Procrustes variance and the first three PCs explain-ing between 10 and 14% each. Based only on the xy-coordinatesof the 13 landmarks, major axes of variation are more similar thantwo random vectors (α = 25.3◦, p < 10−5) once the permutationbetween PC1 and PC2 on 3D landmarks, which account for almostthe same amount of variance, is controlled.
Semilandmark variation was most dispersed with 426 non-nulleigenvalues from which 19 PCs, with a percentage of explainedvariance higher than 1%, explained 79% of the total Procrustesvariance, the first two explaining 13 and 14% each. We chose to usethe first 71 PCs that accounted for 95% of the total variance. Basedonly on fixed landmarks, the main axis of phenotypic variation isvery similar to PC1 from 2D landmarks (α = 40.9◦, p = 2× 10⁻⁵)or to PC2 from the 3D landmarks (α = 26.6◦, p < 10−5).
Covariates analysisThe main effects of centroid size, gender and directionality of thecross on mandible shape were found to be significant (p < 0.0001)but no significant interactions among them were found. Altogetherthey explained 4.5% of the total Procrustes variance. The direction-of-cross was the major effect in this sample, explaining 2.5% ofthe total Procrustes variance (Table S1). Covariate results with2D shapes were similar to the 3D data (Table S1). Results fromthe multivariate linear model of the three covariates were similarto those from the 3D manual landmark only with the covariatesexplaining 5.5% of the variance altogether.
2D embedding of shape variation3D shapes from manual landmarks were oriented according to thereference 2D plane allowing to decompose each effect according tothe antero-posterior and bucco-lingual axes (Figure 3). The varia-tion of the 3D landmarks on each PC in the bucco-lingual directionis highly variable (light gray amount in Figure 3). However majoraxes of variation (PC1 to PC10; ∼ 73.6% of the total Procrustes vari-ance) are embedded mainly in the antero-posterior/dorso-ventralplane of the mandible (black and dark gray) with a very littlecomponent of this variation in the bucco-lingual direction (4.4%).
PC1 PC4 PC7 PC10 PC13 PC16 PC19 PC22
% o
f P
va
ria
nce
05
10
15
2D landmarks
3D landmarks
Semilandmarks
A
PC1 PC4 PC7 PC10 PC13 PC16 PC19 PC22
% o
f G
va
ria
nce
05
10
15
20
2D landmarks
3D landmarks
Semilandmarks
B
PC 1
PC 1
Figure 2 Principal component analyses of mandible shape variation.A) Percentage of variance explained by the first 22 PCs from phe-notypic covariance matrices together with the visualization of shapechanges associated with PC 1 from 3D landmark and semilandmarkdatasets. In the visualization, darker colors (red or blue) representinterpolated shape changes diverging from the mean shape. Greencolor represents unchanged shape of the mandible compared to themean shape. B) Percentage of variance explained by the first 22PCs from G matrices based on discovered QTLs.
Volume X February 2016 | mandible shape QTLs in 3D | 5

10
00
A) 3D Landmarks%
effe
ct
PC
% e
ffe
ct
B) Semilandmarks
PC
QTL
QTLXCS G
XCS G
10
00
Figure 3 Percentage of shape changes within the xy-plane (black) and along the z direction (gray). The proportion of shape effect β that liedalong the mth dimension (m = 1, 2 or 3) is the sum of the squared effects over the k landmarks on the mth dimension normalized by the normof the effect, ∑k
i=1 β2i,m/ ‖β‖. The figure may be understood as the proportion of changes that is embedded in the flat plane (xy) or that get
out this plane (z). Such parametrization is sensical here, despite that shapes are invariant to rotation by definition, only because they werespecifically oriented according to this specific coordinate system . A) Principal components, covariate and QTL effects for 3D landmarks. B)Principal components, covariate and QTL effects for semilandmarks. Covariates are noted CS for the log of the centroid size, X for the directionof the cross, and G for gender.
Accordingly only between 9 and 13% of covariate effects (size, sexor direction-of-cross) was along this bucco-lingual axis. Shapevariation from the semilandmarks was again mostly embedded inthe flat plane with only 5.9% of the variation in the bucco-lingualdirection, and covariate effects were mostly within this plane (∼90% of the effect).
QTL mapping of mandible shapeIn all three cases (2D, Manual 3D landmarks and Semilandmarks),the three covariates (log of the centroid size, gender and direction-of-cross) were included in the QTL mapping as additive covariates.Multivariate QTL mapping identified between 17 QTLs for 2Dlandmarks, 19 QTLs for 3D manual landmark and 23 QTLs for the3D semilandmark analysis. All autosomes but two (chromosomes18 and 19) harbor at least one, and in some cases up to threeQTLs (chromosome 11) depending on the phenotyping methodused. Summaries on position of the discovered QTLs (location,nearest marker, and the confidence intervals) are provided in Table2 for semilandmarks. Summaries for all three cases are providedin Table S2 and plotted on Figure 4. The median widths of theconfidence intervals were 9 cM for both 3D landmarks and their2D projections, and 5 cM for the semilandmark dataset, and threequarters of the confidence intervals were smaller than 17.3 cM,20 cM and 9.2 cM respectively for these three datasets (Table 1).Thirteen QTLs were replicated across the three approaches, all 2DQTLs were replicated in 3D but some were splitted in two with thesemilandmark data or were not captured, eight were only mappedwith the semilandmarks and two only with the 3D landmarks(Table S2; Figure 4).
Effect sizes of QTLs were small (∼1% of total Procrustes vari-ance; Table S2) but explained in average ∼12% of the variance inthe specific direction defined by the QTL effect (regression pro-jection scores). Replicated QTLs between 2D and 3D data ex-plained a similar percentage of total Procrustes variance (Wilcoxon
test: V16 = 57, p = 0.82), but 3D effects explained a signif-icantly greater percentage of variance in the specific directionof the QTL (projection scores) than 2D effects (Wilcoxon test:V16 = 153, p = 7.63 × 10⁻⁶). Accordingly to shape variationand covariate effects, QTLs act mainly in the 2D plane (Figure 3).However, the contribution of the third dimension may be as highas 30% for some QTLs with the manual landmarks or the semi-landmarks (Figure 3). It is important to note that these QTLs werenot detected in the 2D analysis (Table S2). Visualization of QTLeffects from 3D landmarks only or semilandmarks are provided insupplementary Figure S1 and Figure S2.
Comparison of QTL-based G matricesAltogether, these QTLs accounted for 14.6% (2D), 15.1% (3D) and16.9% (semilandmarks) of the total Procrustes variance. Fromthose, 12.8% (3D) and 14.4% (semilandmarks) of the genetic vari-ance are along the third dimension. Overall differences among thethree G2k matrices measured by the root Euclidean distances dHare low, the semilandmark matrix appearing as the most different(dSemi−2D/3D = 0.012 and d2D−3D = 0.002). In agreement with thisobservation and similarly to P matrices, G matrices presented avery similar eigenvalue profile among the three approaches (Fig-ure 2) with gmax explaining about 20% of the variance. Here alsothere were a permutation between the two first PC in the 3D land-marks compared to the two other datasets. Once this permu-tation was controlled, these three gmax were more similar thanrandom vectors (α2D/3D = 18.2◦, p < 10−5, α2D/Semi = 61.4◦, p =0.012, α3D/Semi = 69◦, p = 0.025) based only on the xy-coordinatesof the 13 fixed landmarks for the two first comparisons and onxyz-coordinates for the last one.
The Krzanowski’s common subspace analysis confirmed theseobservations. Angles between the first seven eigenvectors of thecommon subspace H and the q PCs accounting for 90% of thevariance for each matrices (q = 9 for 2D landmarks or 10 for
6 | Nicolas Navarro et al.

n Table 2 Closest SNP, confidence interval, and protein-coding gene content of semilandmark QTLs
QTL Closest SNP Chr Left Pos Right Replic. nPCGa nCG.2Db nCG.3D CG.Semic
SH1 gnf01.075.385 1 42.33 43.62 44.33 2D, 3D 56 4
SH2 rs3722345 2 51.09 51.09 60.54 2D, 3D 243 2 2
SH3 rs6274061 3 12.01 20.01 21.01 81 2
SH4 rs3676039 3 59.01 65.01 77.01 115 2 Lef1
SH5 rs3711477 4 52.01 52.20 53.01 3D 12 1
SH6 UT_4_132.137715 4 81.01 83.01 84.01 44 Rere
SH7 rs13478154 5 13.50 15.71 17.50 2D, 3D 75 6 9 Shh, Drc1, Ift172
SH8 rs13478388 5 43.50 52.50 56.50 2D, 3D 345 12 6 Ambn, Fras1, Prkg2,Dmp1, Idua, Fgfrl1, Mn1,Kctd10
SH9 CEL-6_86289708 6 41.55 43.00 43.00 2D, 3D 3 4 3
SH10 rs3658783 6 84.00 88.00 89.28
SH11 rs13479427 7 43.05 55.02 57.20 477 Akap13, Kif7, Serpinh1,Folr1
SH12 rs6386110 8 22.38 25.52 27.52 2D, 3D 69 1 7
SH13 rs3721056 9 43.10 44.47 71.10 2D, 3D 366 2 2 Atr, Ryk
SH14 rs3686911 10 3.03 3.18 9.03 48
SH15 mCV24217147 10 67.03 70.03 71.12 2D, 3D 24 3 1
SH16 rs3700830 11 12.08 16.08 17.08 52
SH17 rs13481127 11 48.08 49.08 54.08 2D, 3D 116
SH18 rs3672597 11 82.08 84.08 86.08 2D, 3D 106
SH19 rs13481321 12 6.90 7.99 8.95 3D 44
SH20 rs3693942 13 25.00 26.00 26.52 2D, 3D 36
SH21 CEL-15_36490596 15 13.68 13.68 14.99 2D, 3D 32
SH22 rs4204106 16 33.03 48.03 53.31 2D, 3D 177
SH23 rs6298471 17 16.03 18.14 21.14 314
a Number of protein-coding genes in the interval.b Number of candidate genes annotated for ‘mandible’ in the MGI databases in the QTL confidence interval from 2D or 3D datasets.c Candidate genes annotated for ‘mandible’ in the MGI databases in the QTL confidence interval for the semilandmark analysis. Candidates with non-synonymous or splice-site variants
between AJ and C57BL/6J are indicated in bold.
Volume X February 2016 | mandible shape QTLs in 3D | 7

1 2 3 4 5 6 7 8 9 10
Lo
ca
tio
n (
cM
)L
oca
tio
n (
cM
)
11 12 13 14 15 16 17 18 19
2D landmarks
3D landmarks
Semilandmarks
Klingenberg et al 2001
Klingenberg et al 2004
Leamy et al 2008
Pallares et al 2014
Figure 4 QTLs from 2D, 3D and semilandmark analyses. Resultsfrom earlier studies from the LG/J×SM/J intercrosses (Klingenberget al. 2001, 2004; Leamy et al. 2008) and from the Pallares et al.(2014) GWAS are plotted in the grey boxes.
dim1 dim4 dim7 dim10 dim13 dim16 dim19 dim22
dimensions of GP−
h2
0.0
0.2
0.4
0.6
0.8
1.0
2D landmarks
3D landmarks
Semilandmarks
Figure 5 Multivariate heritabilities of shape dimensions. The h2 arethe eigenvalues of the GP− matrix). The shapes correspond to theshape changes associated to the first dimension of GP− for the 3Dlandmark or the semilandmarks. For the significance of the colorsee Figure 2.
the G2k based on 3D landmarks or semilandmark datasets) weresmall (δ ranging from 1.6◦ to 16◦). Their associated eigenvalueswere very closed to their maximum value of three (∆ rangingfrom 2.997 to 2.859). This means that the common subspace maybe almost perfectly recovered from linear combinations of the qieigenvectors of any of the G2k matrices. The semilandmark G2kmatrix appeared again the quickest to diverge, underlying theadditional information we get from semilandmarks even if therewere not explicitly taken into account in the construction of thecommon subspace.
Multivariate heritabilities are systematically greater with 3Dthan 2D data (Figure 5) but in the same order ranging from 0.55to 0.01. Semilandmarks show dimensions with an heritabilityranging from 0.76 to 0.15. The shape changes associated with themost heritable dimension were very different to the one observedon 3D landmarks only (Figure 5). Such discrepancies seems eas-ily explained as the strong changes appeared to map on ridgesand mandible surface where no manual landmark can be easilycaptured.
DISCUSSION
Previous studies using QTL mapping of mandible size and shapein mouse have relied typically on 2D landmarks and sparse sam-pling of the genome using microsatellite markers (Klingenberget al. 2001, 2004) or a few hundred SNPs (Leamy et al. 2008). Ourprimary purpose in this study was to validate QTL responsible forthe variation in mandibular shape observed in mice using 3D phe-notyping and with denser genotyping than previously attemptedand assess the gains (if any) from the consideration of the thirddimension.
We detected marginally fewer QTLs than studies based on theLG/J×SM/J intercross (Table 1). This might be expected as wefit a model with all QTLs simultaneously whereas those studiesmodeled the genetics of the trait at the chromosome-wide level andused sample sizes about three times bigger. Effect of sample sizeand/or of allele frequencies seems striking in the study of Pallareset al. (2014) where only 10 loci were discovered but in greaterprecision thanks to their use of an outbred population and a denseSNP map. Overall, about half of the 23 QTLs we discovered werealready known in literature. Only one region on chromosome15 seemed to replicate across the three different crosses (Figure4). Another GWAS locus on chromosome 16 was replicated inour cross. Two QTLs previously detected with imprinting due tomaternal genetic effect (Leamy et al. 2008) were also replicated here.At the time of the submission, a 3D geometric morphometric studyusing about 700 laboratory outbred mice, 80,000 SNPs and anunivariate association mapping of the main principal componentswas published (Pallares et al. 2015). They mapped with greatprecision seven loci for mandible shape and their main finding,which was related to the Mn1 gene, seems to be replicated herebased on gene content (SH8 on chromosome 5 in Table 2).
It may initially appear that not much difference exists betweenthe mapping results based on 3D manual landmarks and their 2Dprojections, due to their significant overlap (Figure 4). However,the benefit of adding the third dimension is demonstrated by thereduction in the confidence intervals of the QTL estimates. Themedian CI estimate for our 2D projection results was 11 cM. Yet,when we conducted the mapping on 3D landmarks, extreme CIswere marginally reduced and median CI was down to 6.3 cM whenwe used semilandmarks. The difference was even more strikingwhen we considered the total length of the QTL intervals, whichdropped by 120 cM representing a 38% drop in the number of
8 | Nicolas Navarro et al.

known protein coding genes with 75% of QTLs covering at most146 protein coding genes (358 with 2D and 271 with 3D landmarks).The 2D projection data yield very similar results to the one of13.3 cM obtained from the remaining 24 QTLs reported in earlierstudies (Klingenberg et al. 2001, 2004) despite a marked differencein molecular marker density (10-fold).
The consideration of the third dimension leads to the discoverywith 3D landmarks of two additional QTLs on chromosome 1 and14, both QTLs covering a few mandible-annotated genes (Disp1,Hhat, Ifr6, and Kat6b). Adding one dimension to each landmark (i.e.10 independent dimensions to the shape space) increases detectionpower. This increase in power is not just related to bigger effectsizes or higher dimensionality, which could be more costly thanreally useful in some cases (Healy 1969; Adams 2014). Actually, thetwo additional QTLs have 26% and 32% of their effect along theseadditional dimensions. Thus, the specific consideration of the thirddimension in the mapping clearly is very informative in these cases.The relaxed constrains on homology of semilandmarks and theirability to model the surface of bone densely led to the discovery ofeight additional QTLs. Three of them show between 20% and 30%of their effect on the third dimension. Three of those additionalQTLs cover one to four mandible-annotated candidate genes: Lef1,Rere, and in the same QTL Akap13, Kif7, Serpinh1 and Folr1. Theoverall additive genetic variation (G) is consistent between 2D and3D data both in term of amount of total variation captured anddirectionality of major variations. Beyond an overall similaritywith other data, semilandmarks capture original shape featuresrelated to the bone surface, and those features drive the pattern ofmultivariate heritability (GP−).
Multivariate approaches have been repeatedly shown morepowerful than analyzing individual PCs (or univariate traits) inde-pendently in various contexts (see for instance in GWAS, Galeslootet al. 2014; Gao et al. 2014; Stephens 2013). However, this univariatePC approach is commonly used, at least for operational reasons(e.g., Pallares et al. 2014, 2015; Percival et al. 2016, with geometricmorphometric data). An incidental result of our study is the pleafor using fully multivariate approach with shape data beside themain reason that shape is a single multidimensional trait (Klingen-berg and Gidaszewski 2010; Collyer et al. 2015). Major phenotypicPCs appear to have only minor component of variance on the thirddimension whereas some QTLs present up to a third of their vari-ation on that specific direction. Prior selection of shape variablesbased on phenotypic PCA will reduce effect sizes by a third forthose QTLs, thus reducing power. We have nonetheless chosen toreduce the dimensionality of the semilandmark data using suchtechnique. However, we kept most of the total variance (95%)while discarding a large amount of non-null dimensions (355). Ourassumption is that the remaining was only random variation. Suchnoisiness is inherent to the registration process of semilandmarks.This assumption leads us to not re-estimate the effects and their as-sociated effect sizes on the complete shape, but doing so will onlychange our estimates marginally. However, this re-estimation ofQTL effect on the complete shape may be a good practice when theQTL detection was, for some reason, done on a strongly reducedshape space (Pallares et al. 2014, 2015; Liu et al. 2014; Zeng et al.2000; Langlade et al. 2005; Mezey et al. 2005; Franchini et al. 2013).Major QTLs may be detected with the first PCs only, but they havepleiotropic effects also on additional dimensions.
In conclusion, the congruence of our results pleads for robust-ness of our knowledge on the genetic architecture of the mousemandible built over a few decades and initially based on 2D imag-ing techniques. There are many benefits of doing 2D morpho-
metrics in large phenotyping program that may resumed to thesimplicity and time-wise of the techniques, but they come at theprice of accuracy. Despite inherent difficulties and workload thatmay impeded broader use of 3D techniques, there are informationto be gained from even for a fairly flat structure like the mousemandible. Once these technical and cost difficulties have beenchallenged, it appears that making the most of new technologiesby opting for denser phenotyping is worth the supplementarytechnical expertise that it required, and may clearly provide somenew insights on the genetics of shape.
ACKNOWLEDGMENTS
We acknowledge following institutions and endowments for spon-soring portions of this research: NIH/NIDCR Pathways to Inde-pendence award to AMM (5K99DE021417-02). Conseil Régionalde Bourgogne funding to NN (CRB PARI Agrale 5 Faber 2014-9201AAO047S01518). We acknowledge Erika Jessett for her help inimage processing, Sarah Park for her help in DNA sample prepa-ration, and we would like to thanks two anonymous reviewers fortheir constructive comments.
LITERATURE CITED
Adams, D. C., 2014 A method for assessing phylogenetic leastsquares models for shape and other high-dimensional multivari-ate data. Evolution 68: 2675–2688.
Aguirre, J. D., E. Hine, K. McGuigan, and M. W. Blows, 2013 Com-paring G: multivariate analysis of genetic variation in multiplepopulations. Heredity 112: 21–29.
Anderson, P. S., S. Renaud, and E. J. Rayfield, 2014 Adaptive plas-ticity in the mouse mandible. BMC Evol. Biol. 14: 85.
Andolfatto, P., D. Davison, D. Erezyilmaz, T. T. Hu, J. Mast et al.,2011 Multiplexed shotgun genotyping for rapid and efficientgenetic mapping. Genome Res. 21: 610–617.
Aneja, D., S. R. Vora, E. D. Camci, L. G. Shapiro, and T. C. Cox,2015 Automated Detection of 3D Landmarks for the Eliminationof Non-Biological Variation in Geometric Morphometric Anal-yses. 28th IEEE International Symposium on Computer-BasedMedical Systems (22-25 June São Carlos, Brazil) .
Atchley, W. R. and B. K. Hall, 1991 A model for development andevolution of complex morphological structures. Biol. Rev. Camb.Philos. Soc. 66: 101–157.
Atchley, W. R., A. A. Plummer, and B. Riska, 1985 Genetics ofmandible form in the mouse. Genetics 111: 555–577.
Baird, N. A., P. D. Etter, T. S. Atwood, M. C. Currey, A. L. Shiveret al., 2008 Rapid SNP Discovery and Genetic Mapping UsingSequenced RAD Markers. PloS One 3: e3376–7.
Boell, L., 2013 Lines of least resistance and genetic architectureof house mouse (Mus musculus) mandible shape. Evolution &Development 15: 197–204.
Boell, L., S. Gregorova, J. Forejt, and D. Tautz, 2011 A comparativeassessment of mandible shape in a consomic strain panel ofthe house mouse (Mus musculus)–implications for epistasis andevolvability of quantitative traits. BMC Evol. Biol. 11: 309.
Boell, L., L. F. Pallares, C. Brodski, Y. Chen, J. L. Christian et al., 2013Exploring the effects of gene dosage on mandible shape in miceas a model for studying the genetic basis of natural variation.Dev. Genes Evol. 223: 279–287.
Boell, L. and D. Tautz, 2011 Micro-evolutionary divergence pat-terns of mandible shapes in wild house mouse (Mus musculus)populations. BMC Evol. Biol. 11: 306.
Volume X February 2016 | mandible shape QTLs in 3D | 9

Bookstein, F. L., 1997 Landmark methods for forms without land-marks: morphometrics of group differences in outline shape.Med. Image Anal. 1: 225–243.
Broman, K. W. and S. Sen, 2009 A Guide to QTL Mapping with R/qtl.Springer.
Broman, K. W. and T. P. Speed, 2002 A model selection approachfor the identification of quantitative trait loci in experimentalcrosses. J. R. Stat. Soc. Series B Stat. Methodol.) 64: 641–656.
Broman, K. W., H. Wu, S. Sen, and G. A. Churchill, 2003 R/qtl: QTLmapping in experimental crosses. Bioinformatics 19: 889–890.
Bromiley, P. A., A. C. Schunke, H. Ragheb, N. A. Thacker, andD. Tautz, 2014 Semi-automatic landmark point annotation forgeometric morphometrics. Front. Zool. 11: 61.
Cande, J., P. Andolfatto, B. Prud’homme, D. L. Stern, and N. Gom-pel, 2012 Evolution of multiple additive loci caused divergencebetween Drosophila yakuba and D. santomea in wing rowing dur-ing male courtship. PLoS One 7: e43888.
Cardini, A., 2014 Missing the third dimension in geometric mor-phometrics: how to assess if 2D images really are a good proxyfor 3D structures? Hystrix 25: 73–81.
Chevalier, F., C. L. Valentim, P. T. LoVerde, and T. J. Anderson, 2014Efficient linkage mapping using exome capture and extremeQTL in schistosome parasites. BMC Genomics 15: 617.
Churchill, G. A. and R. W. Doerge, 1994 Empirical threshold valuesfor quantitative trait mapping. Genetics 138: 963–971.
Collyer, M. L., D. J. Sekora, and D. C. Adams, 2015 A methodfor analysis of phenotypic change for phenotypes described byhigh-dimensional data. Heredity 115: 357–365.
Cox, A., C. L. Ackert-Bicknell, B. L. Dumont, Y. Ding, J. T. Bell etal., 2009 A new standard genetic map for the laboratory mouse.Genetics 182: 1335–1344.
Debat, V., A. Debelle, and I. Dworkin, 2009 Plasticity, canalization,and developmental stability of the Drosophila wing: joint ef-fects of mutations and developmental temperature. Evolution63: 2864–2876.
Drake, A. G. and C. P. Klingenberg, 2008 The pace of morphologicalchange: historical transformation of skull shape in St Bernarddogs. Proc. Biol. Sci. 275: 71–76.
Dryden, I. L., A. Koloydenko, and D. Zhou, 2009 Non-Euclideanstatistics for covariance matrices, with applications to diffusiontensor imaging. Ann. Appl. Stat. .
Dryden, I. L. and K. V. Mardia, 1998 Statistical Shape Analysis. Wiley.Dupuis, J. and D. Siegmund, 1999 Statistical methods for mapping
quantitative trait loci from a dense set of markers. Genetics 151:373–386.
Dworkin, I., J. A. Anderson, Y. Idaghdour, E. K. Parker, E. A. Stone,and G. Gibson, 2011 The effects of weak genetic perturbations onthe transcriptome of the wing imaginal disc and its associationwith wing shape in Drosophila melanogaster. Genetics 187: 1171–1184.
Elshire, R. J., J. C. Glaubitz, Q. Sun, J. A. Poland, K. Kawamotoet al., 2011 A robust, simple genotyping-by-sequencing (GBS)approach for high diversity species. PLoS One 6: e19379–10.
Emília Santos, M., C. S. Berger, P. N. Refki, and A. Khila, 2015Integrating evo-devo with ecology for a better understanding ofphenotypic evolution. Brief. Funct. Genomics 2015: 1–12.
Fedorov, A., R. Beichel, J. Kalpathy-Cramer, J. Finet, J.-C. Fillion-Robin et al., 2012 3D Slicer as an image computing platform forthe quantitative imaging network. Magn. Reson. Imaging pp.1323–1341.
Flint, J. and E. Eskin, 2012 Genome-wide association studies inmice. Nat. Rev. Genet. 13: 807–817.
Franchini, P., C. Fruciano, M. L. Spreitzer, J. C. Jones, K. R. Elmeret al., 2013 Genomic architecture of ecologically divergent bodyshape in a pair of sympatric crater lake cichlid fishes. Mol. Ecol.23: 1828–1845.
Galesloot, T. E., K. van Steen, L. A. L. M. Kiemeney, L. L. Janss, andS. H. Vermeulen, 2014 A Comparison of multivariate genome-wide association methods. PLoS One 9: e95923–8.
Gao, H., T. Zhang, Y. Wu, Y. Wu, L. Jiang et al., 2014 Multiple-traitgenome-wide association study based on principal componentanalysis for residual covariance matrix. Heredity 113: 526–532.
Gnirke, A., A. Melnikov, J. Maguire, P. Rogov, E. M. LeProust et al.,2009 Solution hybrid selection with ultra-long oligonucleotidesfor massively parallel targeted sequencing. Nat. Biotechnol. 27:182–189.
Goodall, C., 1991 Procrustes methods in the statistical analysis ofshape. J. R. Stat. Soc. Series B Stat. Methodol. 53: 285–339.
Gray, M. M., M. D. Parmenter, C. A. Hogan, I. Ford, R. J. Cuthbertet al., 2015 Genetics of rapid and extreme size evolution in islandmice. Genetics 201: 213–228.
Gunz, P. and P. Mitteroecker, 2013 Semilandmarks: a method forquantifying curves and surfaces. Hystrix 24: 103–109.
Gunz, P., P. Mitteroecker, and F. L. Bookstein, 2005 Semiland-marks in three dimensions. In Modern Morphometrics in Phys-ical Anthropology, edited by D. E. Slice, pp. 73–98, Kluwer Aca-demic/Plenum Publishers, New York.
Guo, J., X. Mei, and K. Tang, 2013 Automatic landmark annota-tion and dense correspondence registration for 3D human facialimages. BMC Bioinformatics 14: 232.
Hallgrímsson, B., W. Mio, R. S. Marcucio, and R. Spritz, 2014 Let’sface it–complex traits are just not that simple. PLoS Genet. 10:e1004724.
Healy, M. J. R., 1969 Rao’s paradox concerning multivariate testsof significance. Biometrics 25: 411–413.
Hodges, E., Z. Xuan, V. Balija, M. Kramer, M. N. Molla et al., 2007Genome-wide in situ exon capture for selective resequencing.Nat. Genet. 39: 1522–1527.
Houle, D., D. R. Govindaraju, and S. Omholt, 2010 Phenomics: thenext challenge. Nat. Rev. Genet. 11: 855–866.
Huang, X., Q. Feng, Q. Qian, Q. Zhao, L. Wang et al., 2009High-throughput genotyping by whole-genome resequencing.Genome Res. 19: 1068–1076.
Huber, B., A. Whibley, Y. L. Poul, N. Navarro, A. Martin et al.,2015 Conservatism and novelty in the genetic architecture ofadaptation in Heliconius butterflies. Heredity 114: 515–524.
Jones, M. R. and J. M. Good, 2016 Targeted capture in evolutionaryand ecological genomics. Mol. Ecol. 25: 185–202.
Khila, A., E. Abouheif, and L. Rowe, 2009 Evolution of a novelappendage ground plan in water striders is driven by changesin the Hox gene Ultrabithorax. PLoS Genet. 5: e1000583–9.
Klingenberg, C. P., 2010 Evolution and development of shape:integrating quantitative approaches. Nat. Rev. Genet. 11: 623–635.
Klingenberg, C. P. and N. A. Gidaszewski, 2010 Testing and quan-tifying phylogenetic signals and homoplasy in morphometricdata. Syst. Biol. 59: 245–261.
Klingenberg, C. P. and L. J. Leamy, 2001 Quantitative genetics ofgeometric shape in the mouse mandible. Evolution 55: 2342–2352.
Klingenberg, C. P., L. J. Leamy, and J. M. Cheverud, 2004 Integra-tion and modularity of quantitative trait locus effects on geomet-ric shape in the mouse mandible. Genetics 166: 1909–1921.
Klingenberg, C. P., L. J. Leamy, E. J. Routman, and J. M. Cheverud,
10 | Nicolas Navarro et al.

2001 Genetic architecture of mandible shape in mice: effects ofquantitative trait loci analyzed by geometric morphometrics.Genetics 157: 785–802.
Klingenberg, C. P. and N. Navarro, 2012 Development of the mousemandible: a model system for complex morphological struc-tures. In Evolution of the House Mouse, edited by M. Macholán,S. J. E. Baird, and J. Pialek, pp. 135–149, Cambridge UniversityPress.
Krzanowski, W. J., 1979 Between-Groups Comparison of PrincipalComponents. J. Amer. Stat. Ass. 74: 703–707.
Kwak, I.-Y., C. R. Moore, E. P. Spalding, and K. W. Broman, 2014 Asimple regression-based method to map quantitative trait lociunderlying function-valued phenotypes. Genetics 197: 1409–1416.
Langlade, N. B., X. Feng, T. Dransfield, L. Copsey, A. I. Hanna et al.,2005 Evolution through genetically controlled allometry space.Proc. Natl. Acad. Sci. U.S.A. 102: 10221–10226.
Leamy, L. J., C. P. Klingenberg, E. Sherratt, J. B. Wolf, and J. M.Cheverud, 2008 A search for quantitative trait loci exhibitingimprinting effects on mouse mandible size and shape. Heredity101: 518–526.
Ledur, M. C., N. Navarro, and M. Pérez-Enciso, 2009 Large-scaleSNP genotyping in crosses between outbred lines: how useful isit? Heredity 105: 173–182.
Linnen, C. R., Y.-P. Poh, B. K. Peterson, R. D. H. Barrett, J. G.Larson et al., 2013 Adaptive evolution of multiple traits throughmultiple mutations at a single gene. Science 339: 1312–1316.
Liu, J., W. Gao, S. Huang, and W. L. Nowinski, 2008 A Model-Based, Semi-Global Segmentation Approach for Automatic 3-DPoint Landmark Localization in Neuroimages. IEEE Trans. Med.Imag. 27: 1034–1044.
Liu, J., T. Shikano, T. Leinonen, J. M. Cano, M.-H. Li et al., 2014Identification of major and minor QTL for ecologically importantmorphological traits in three-spined sticklebacks (Gasterosteusaculeatus). G3 (Bethesda) 4: 595–604.
Maga, A. M., N. Navarro, M. L. Cunningham, and T. C. Cox,2015 Quantitative trait loci affecting the 3D skull shape and sizein mouse and prioritization of candidate genes in-silico. Front.Physiol. 6: 1–13.
Manichaikul, A., J. Dupuis, S. Sen, and K. W. Broman, 2006 Poorperformance of bootstrap confidence intervals for the locationof a quantitative trait locus. Genetics 174: 481–489.
Manichaikul, A., J. Y. Moon, S. Sen, B. S. Yandell, and K. W. Bro-man, 2009 A model selection approach for the identification ofquantitative trait loci in experimental crosses, allowing epistasis.Genetics 181: 1077–1086.
McCane, B., 2013 Shape variation in outline shapes. Syst. Biol. 62:134–146.
Mezey, J. G., D. Houle, and S. V. Nuzhdin, 2005 Naturally segre-gating quantitative trait loci affecting wing shape of Drosophilamelanogaster. Genetics 169: 2101–2113.
Miller, M. R., J. P. Dunham, A. Amores, W. A. Cresko, and E. A.Johnson, 2007 Rapid and cost-effective polymorphism identi-fication and genotyping using restriction site associated DNA(RAD) markers. Genome Res. 17: 240–248.
Monteiro, L. R., 1999 Multivariate regression models and geometricmorphometrics: the search for causal factors in the analysis ofshape. Syst. Biol. 48: 192–199.
Mott, R. and J. Flint, 2013 Dissecting quantitative traits in mice.Annu. Rev. Genomics Hum. Genet. 14: 421–439.
Muñoz-Muñoz, F. and D. Perpiñan, 2010 Measurement error inmorphometric studies: comparison between manual and com-
puterized methods. Ann. Zool. Fennici 47: 46–56.Navarro, N., 2015 shapeQTL: shape QTL mapping experiment
with R. R package version 0.2. https://github.com/nnavarro/shapeQTL.
Navarro, N. and C. P. Klingenberg, 2007 Mapping multiple QTLsof geometric shape of the mouse mandible. In Systems BiologyStatistical Bioinformatics, edited by S. Barber, P. D. Baxter, andK. V. Mardia, pp. 125–128, Leeds.
Olson, C. L., 1974 Comparative Robustness of Six Tests in Multi-variate Analysis of Variance. J. Am. Stat. Assoc. 69: 894–908.
Olson, C. L., 1976 On choosing a test statistic in multivariate analy-sis of variance. Psychol. Bull. 83: 579–586.
Olson, M., 2007 Enrichment of super-sized resequencing targetsfrom the human genome. Nat. Methods 4: 891–892.
Pallares, L. F., B. Harr, L. M. Turner, and D. Tautz, 2014 Use of anatural hybrid zone for genomewide association mapping ofcraniofacial traits in the house mouse. Mol. Ecol. 23: 5756–5770.
Pallares, L. F., P. Carbonetto, S. Gopalakrishnan, C. C. Parker, C. L.Ackert-Bicknell et al., 2015 Mapping of craniofacial traits in out-bred mice identifies major developmental genes involved inshape determination. PLoS Genet. 11: e1005607.
Perakis, P., G. Passalis, T. Theoharis, and I. A. Kakadiaris, 2010 3Dfacial landmark detection & face registration. IEEE TPAMI .
Perakis, P., T. Theoharis, and I. A. Kakadiaris, 2014 Feature fusionfor facial landmark detection. Pattern Recogn. 47: 2783–2793.
Percival, C. J., D. K. Liberton, F. Pardo-Manuel de Villena, R. Spritz,R. Marcucio et al., 2016 Genetics of murine craniofacial morphol-ogy: diallel analysis of the eight founders of the CollaborativeCross. J. Anat. 228: 96–112.
Peterson, B. K., J. N. Weber, E. H. Kay, H. S. Fisher, and H. E.Hoekstra, 2012 Double digest RADseq: an inexpensive methodfor de novo SNP discovery and genotyping in model and non-model species. PLoS One 7: e37135–11.
Prud’homme, B., C. Minervino, M. Hocine, J. D. Cande, A. Aouaneet al., 2012 Body plan innovation in treehoppers through theevolution of an extra wing-like appendage. Nature 473: 83–86.
R Core Team, 2015 R: A Language and Environment for StatisticalComputing .
Rolfe, S. M., L. G. Shapiro, T. C. Cox, A. M. Maga, and L. L. Cox,2011 A landmark-free framework for the detection and descrip-tion of shape differences in embryos. Conference Proceedings ofthe IEEE Engineering in Medicine and Biology Society 2011 pp.5153–5156.
Schlager, S., 2015a Morpho: Calculations and visualisations relatedto Geometric Morphometrics. R-package version 2. 3.0 .
Schlager, S., 2015b Rvcg: Manipulations of Triangular MeshesBased on the ’VCGLIB’ API .
Sen, S. and G. A. Churchill, 2001 A statistical framework for quan-titative trait mapping. Genetics 159: 371–387.
Shifman, S., J. T. Bell, R. R. Copley, M. S. Taylor, R. W. Williamset al., 2006 A high-resolution single nucleotide polymorphismgenetic map of the mouse genome. PLoS Biol. 4: e395.
Stephens, M., 2013 A unified framework for association analysiswith multiple related phenotypes. PLoS One 8: e65245.
Suto, J.-I., 2009 Identification of multiple quantitative trait lociaffecting the size and shape of the mandible in mice. Mamm.Genome 20: 1–13.
Swiderski, D. L. and M. L. Zelditch, 2013 The complex ontogenetictrajectory of mandibular shape in a laboratory mouse. J. Anat.223: 568–580.
Tabachnick, B. G. and L. S. Fidell, 2013 Using Multivariate Statistics.Pearson Education, Inc, Boston, 6th edition.
Volume X February 2016 | mandible shape QTLs in 3D | 11

Teplitsky, C., M. R. Robinson, and J. Merilä, 2014 Evolutionary po-tential and constraints in wild populations. In Quantitative Genet-ics in the Wild, edited by A. Charmantier, D. Garant, and L. E. B.Kruuk, pp. 190–208, Oxford University Press, Oxford.
Valdar, W., L. C. Solberg, D. Gauguier, S. Burnett, P. Klenerman etal., 2006 Genome-wide genetic association of complex traits inheterogeneous stock mice. Nat. Genet. 38: 879–887.
Workman, M. S., L. J. Leamy, E. J. Routman, and J. M. Cheverud,2002 Analysis of quantitative trait locus effects on the size andshape of mandibular molars in mice. Genetics 160: 1573–1586.
Yalcin, B., J. Nicod, A. Bhomra, S. Davidson, J. Cleak, L. Farinelli,M. Østerås, A. Whitley, W. Yuan, X. Gan, M. Goodson, P. Klener-man, A. Satpathy, D. Mathis, C. Benoist, D. J. Adams, R. Mott,and J. Flint, 2010 Commercially available outbred mice forgenome-wide association studies. PLoS Genet. 6: e1001085–15.
Yezerinac, S. M., S. C. Lougheed, and P. Handford, 1992 Measure-ment error and morphometric studies: statistical power andobserver experience. Syst. Biol. 41: 471–482.
Young, R. and A. M. Maga, 2015 Performance of single andmulti-atlas based automated landmarking methods comparedto expert annotations in volumetric microCT datasets of mousemandibles. Front. Zool. 12: 33.
Zeng, Z. B., J. Liu, L. F. Stam, C. H. Kao, J. M. Mercer et al., 2000 Ge-netic architecture of a morphological shape difference betweentwo Drosophila species. Genetics 154: 299–310.
12 | Nicolas Navarro et al.