Embed Size (px)
Citation preview

DOE/EIA-0520(98/03)
International Petroleum
Energy Information Administration""
Statistics Report March 1998
RECEIVED fcPR 1 6 B98 O ST I
/ £ *► ^
i « * r y. **
*\ -.$.?: miftvt
—>*i***K ■A'
•"V V
t 4 %v -
n
.V

HOW TO OBTAIN EIA PRODUCTS AND SERVICES
For further information on any of the following services, or for answers to energy information questions, please contact EIA's National Energy Information Center: National Energy Information Center (NEIC) (202) 586-8800 Energy Information Administration (202) 586-0727 (fax) Forrestal Building, Room 1F-048 TTY: (202) 586-1181 Washington, DC 20585 E-mail: [email protected]
Electronic Products and Services
EIA's Internet Site Services offer nearly all EIA publications. Users can view and download selected pages or entire reports, search for information, download EIA data and analysis applications, and find out about new EIA information products and services.
World Wide Web: http://www.eia.doe.gov Gopher: gopher://gopher.eia.doe.gov FTP: ftp://ftp.eia.doe.gov
EIA also offers a listserve service for EIA press releases and other short documents. Sign up on the EIA World Wide Web site.
EIA's CD-ROM, Energy InfoDisc, contains most EIA publications, several databases, and an energy forecasting model. The Energy InfoDisc, produced quarterly, is available for a fee from STAT-USA, Department of Commerce, 1-800-STAT-USA.
The Comprehensive Oil and Gas Information Source (COGIS), a bulletin board service, contains data files from most of EIA's oil- and gas-related reports. It is available for a fee from STAT-USA, on 1-800-STAT-USA.
EIA's Electronic Publishing System (EPUB) bulletin board contains data files, directories, and forecasts from most EIA reports. It can be accessed free of charge by dialing (202) 586-2557.
Many of EIA's data files and modeling programs are available for sale on diskette, tape, or cartridge, through either the National Technical Information Service or the Office of Scientific and Technical Information, Department of Energy. Contact NEIC for information on specific products, sources, and media, and ordering instructions.
Printed Publications
EIA directories are available free of charge from NEIC. Recent periodicals and one-time reports are available from the Government Printing Office. Older reports are available from the National Technical Information Service:
Superintendent of Documents National Technical Information Service U.S. Government Printing Office U.S. Department of Commerce P.O. Box 371954 Springfield, VA 22161 Pittsburgh, PA 15250-7954 5285 Port Royal Road (202) 512-1800; (202)-512-2250 (fax) (703) 487-4650; (703) 321-8547 (fax)
Released for Printing: April 1,1998
Questions concerning the contents of this report should be directed to Michael J. Grillot, (202) 586-6577 ® Printed with soy ink on recycled paper

DISCLAIMER
This report was prepared as an account of work sponsored by an agency of the United States Government. Neither the United States Government nor any agency thereof, nor any of their employees, makes any warranty, express or implied, or assumes any legal liability or responsibility for the accuracy, completeness, or usefulness of any information, apparatus, product, or process disclosed, or represents that its use would not infringe privately owned rights. Reference herein to any specific commercial product, process, or service by trade name, trademark, manufacturer, or otherwise does not necessarily constitute or imply its endorsement, recommendation, or favoring by the United States Government or any agency thereof. The views and opinions of authors expressed herein do not necessarily state or reflect those of the United States Government or any agency thereof.

DISCLAIMER
Portions of this document may be illegible electronic image products. Images are produced from the best available original document.

DOE/EIA-0520(98/03) Distribution Category UC-950
International Petroleum Statistics Report
March 1998 ASTER
Energy Information Administration Office of Energy Markets and End Use
" w S S r S ^ S f OSmBUTION OF THIS DOCUMENT IS UNLIMITED
This report was prepared by the Energy Information Administration, the independent statistical and analytical agency within the U.S. Department of Energy. The information contained herein should be attributed to the Energy Information Administration and should not be construed as advocating or reflecting any policy position of the Department of Energy or any other organization.

Preface The International Petroleum Statistics Report is a monthly publication that provides current international oil data. This report is published for the use of Members of Congress, Federal agencies, State agencies, industry, and the general public. Publication of this report is in keeping with responsibilities given the Energy Information Administration in Public Law 95-91 (Section 205(a)(2)) that states:
"The Administrator shall be responsible for carrying out a central, comprehensive, and unified energy data and information program which will collect, evaluate, assemble, analyze and disseminate data and information ..."
The International Petroleum Statistics Report presents data on international oil production, demand, imports, and stocks. The report has four sections. Section 1 contains time series data on world oil production, and on oil demand and stocks in the Organization for Economic Cooperation and Development (OECD). This section contains annual data beginning in 1985, and monthly data for the most recent two years. Section 2 presents an oil supply/demand balance for the world. This balance is presented in quarterly intervals for the most recent two years. Section 3 presents data on oil imports by OECD countries. This section contains annual data for the most recent year, quarterly data for the most recent two quarters, and monthly data for the most recent twelve months. Section 4 presents annual time series data on world oil production and oil stocks, demand, and trade in OECD countries. World oil production and OECD demand data are for the years 1970 through 1996; OECD stocks from 1973 through 1996; and OECD trade from 1986 through 1996.
Data for the United States are developed by the Energy Information Administration's (EIA) Office of Oil and Gas. Data for other countries are derived largely from published sources, including International Energy Agency publications, the EIA International Energy Annual, and the trade press. (See sources after each section.) All data are reviewed by the International Statistics Branch of EIA. All data have been converted to units of measurement familiar to the American public. Definitions of oil production and consumption are consistent with other EIA publications.
General information about this publication may be obtained from W. Calvin Kilgore, Director, Office of Energy Markets and End Use, (202) 586-1617, and from Louis D. DeMouy, Director, Integrated Energy Statistics Division, (202) 586-6557. Detailed questions and comments concerning the contents of the International Petroleum Statistics Report may be directed to Michael J. Grillot, Team Leader, International Energy Statistics Team, (202) 586-6577; Patricia A. Smith (202) 586-6925, or to H. Vicky McLaine (202) 586-9412; Oil Market Chronology - Douglas Maclntyre (202) 586-1831.
Historical revisions reflect changes to data that were published in the International Energy Annual 1996, which is also available on the EIA Home Page (http://www.eia.doe.gov/emeu/iea/contents.html).
Energy Information Administration / International Petroleum Statistics Report March 1998

Oil Market Chronology - February 1998
The following chronology lists international events of potential significance for world petroleum markets. Sources include: Dow Jones (DJ), the New York Times (NYT), the Washington Post (WP), and the Wall Street Journal (WSJ).
February 1 A U.S. federal judge denies a preliminary injunction requested by civil rights lawyers that would have removed California-based Unocal Corporation from a $1.2 billion pipeline project in Burma. The lawsuit alleges a variety of human rights violations by the Burmese government in connection with the project. The judge's ruling states that prohibiting Unocal's participation in the project would not stop the human rights abuses claimed in the lawsuit. President Clinton imposed trade and economic sanctions on Burma in April 1997, but the ban did not affect existing investments. Unocal holds a 28 percent share in the pipeline project, which is being constructed from Burma to Thailand. (DJ)
United Nations (U.N.) Secretary-General Kofi Annan calls for an increase in the amount of oil Iraq can sell under the U.N.-sponsored oil-for-food program. Annan recommends raising the sales limit from $2.14 billion every six months to $5.2 billion. The recommendation now moves to the U.N.'s 15-member Security Council for approval. (WP)
February 2 Western partners in the Caspian Pipeline Consortium have frozen funds for a $2 billion pipeline and are pushing for a shake-up in the Consortium's Russian-led management. The/900-mile pipeline will eventually transport 1.4 million barrels of oil per day from Kazakhstan's Tengiz oil field through Russia to the Black Sea port of Novorossiysk. Oil shipments were scheduled to begin in late 1999, but will likely be delayed at least one year as a result of this latest development. Continued funding of the project was contingent upon the Consortium obtaining Russian rights of way and various federal and local permits for the pipeline by the end of 1997. During a meeting in December 1997, the Western partners discovered that much of this work had not been completed. (WSJ)
February 3 Azerbaijan's state oil company Socar and U.S.-based Conoco announce an agreement to conduct a joint study of Azerbaijan's natural gas processing industries. The study will examine the commercial viability of gathering, processing, and transporting Azerbaijan's natural gas and natural gas liquids for export and domestic use. The study will be conducted over a period of six months. (DJ)
Russia's RAO Gazprom has sold its 10 percent stake in Centgas, a consortium set up to construct a $2 billion Turkmenistan-Afghanistan-Pakistan natural gas pipeline. U.S.-based Unocal Corporation acquired 7 percent of Gazprom's shares, bringing its total stake in the Centgas to 54 percent. The remaining 3 percent went to Japanese-owned Indonesia Petroleum and Itochu, South Korea's Hyundai Engineering & Construction Company, and Pakistan's Crescent Group. The 800-mile pipeline will extend from the Daulatabad gas field in southeastern Turkmenistan through Afghanistan to Pakistan. (DJ)
February 4 General Motors and Amoco Corporation announce a groundbreaking partnership to jointly develop clean-burning motor vehicle fuels. The partnership is the first of its kind between an automaker and an oil company. General Motors Vice Chairman Harry Pearce says that cleaner diesel fuels and cleaner-burning reformulated gasoline are necessary for the success of future hybrid vehicles, which will run on a combination of gasoline and electricity. (WSJ) (DJ)
General Motors, Chrysler Corporation, and Ford Motor Company announce that they will participate in the Environmental Protection Agency's National Low Emission Vehicle Program. The Program requires automakers to build cars that will be 70 percent cleaner than current models. In exchange for the voluntary participation of the car companies, eight Northeastern states and the District of Columbia gave up the right to adopt higher California emissions standards. The automakers will begin producing the cleaner cars in 1999 in the Northeast and two years later in the rest of the country. Ten foreign automakers have agreed to participate as well, including Honda, Toyota, Nissan, BMW, Mercedes, Saab, Subaru, Suzuki, Volvo, and Rolls Royce. (NYT) (WP) (DJ)
February 5 Following a ruling by a federal judge denying a request from environmentalists and Native Americans seeking to block the sale of the Elk Hills Naval Petroleum Reserve, the U.S. Department of Energy formally transfers ownership of the reserve to Occidental Petroleum Corporation. Occidental purchased a 78 percent interest in the field for $3.65 billion. Chevron Corporation currently holds the remaining 22 percent. Elk Hills contains 450 million barrels of proven oil reserves; however, officials from Occidental believe the reserve may contain one billion barrels of recoverable reserves. (DJ)
Energy Information Administration / International Petroleum Statistics Report March 1998

February S Norway's state oil company Statoil AS and its partners will invest $400 million to expand the development of Venezuelan oil field LL 652. The investment will cover the first phase of the expansion designed to increase production from 10,000 barrels per day to 115,000 barrels per day over the next ten years. The field's recoverable reserves are estimated at 500 million barrels. Statoil and Chevron each hold a 30 percent interest in the project with Phillips and Atlantic Richfield each holding 20 percent. (DJ)
The United Kingdom's Hardy Oil & Gas announces the discovery of a major new natural gas field in the South West Miano concession onshore Pakistan. The exploration well Sawan-1, operated by Austria's OMV, produced a flow rate of 58 million cubic feet per day. Reserves are estimated at approximately 918 billion cubic feet. Commercial development is expected to begin in 1998, and initial production is to start by the end of 1999. Hardy and Pakistan Petroleum Limited each hold a 30 percent interest in the concession, with OMV holding a 25 percent interest. (DJ)
February 6 Iraq rejects key parts of United Nations (U.N.) Secretary-General Kofi Annan's proposal to increase the amount of oil Iraq is permitted to sell under the U.N.'s oil-for-food program from $2.14 billion to $5.2 billion. In a letter to Annan, Iraqi Foreign Minister Mohammed Saeed al-Sahhaf objects to additional funds to pay for U.N. monitoring, proposals to repair electric power stations in northern Iraq, and plans for U.N. agencies to target aid to specific groups such as the poor and children. Al-Sahhaf writes that the Iraqi government should deliver the aid and determine which power stations are repaired not the U.N. (WP) (DJ)
February 9 In a letter to United Nations (U.N.) Secretary-General Kofi Annan, Iraqi Foreign Minister Mohammed Saeed al-Sahhaf informs the U.N. that Iraq can only export up to $4 billion of oil in six months. The letter is a response to Annan's recommendation to the U.N. to allow Iraq to increase the amount it can export under the oil-for-food program from $2.14 billion to $5.2 billion. In addition, al-Sahhaf writes that a larger share of the oil sales should go towards humanitarian aid, while the amounts funding U.N. programs and a compensation fund for Persian Gulf war victims should be reduced. (DJ)
Georgian President Eduard Shevardnadze escapes an assassination attempt as he is headed home in Tbilisi, Georgia's capital. This represents the second assassination attempt against him in three years. Shevardnadze is not injured, but two bodyguards are dead and four others seriously wounded. Shevardnadze suggests that the attack could have been related to his country's attempt to be part of a pipeline route transporting Caspian Sea oil to the Black Sea. (WP)
February 10 The United Nations (U.N.) approves 34 oil contracts submitted by Iraq which will meet its $2 billion quota under the third phase of the U.N.-sponsored oil-for-food program. The 34 contracts total 151.8 million barrels of oil. Iraq exported 121.1 million barrels during the first phase and 127.3 million barrels during the second. The increase in volume is due to weakening oil prices on international markets. (DJ)
President Fidel Ramos signs into law legislation deregulating the country's oil industry. It is the last major structural reform sought by the International Monetary Fund (IMF) before it allows the Philippines to withdraw from its current IMF borrowing program. The new law provides for a five-month transition period before full deregulation and a $73 million buffer fund that can be used to subsidize certain petroleum products. (DJ)
Energy Africa Limited, a South African oil and gas exploration company, announces the discovery of oil off the coast of Congo about 10 miles southwest of the Nkossa oil field. The Bilondo Marine 1 well produced flow rates of 8,520 barrels of oil per day. The well also tapped into a different geological structure from Nkossa, proving the existence of a separate field. The discovery was made within the Haute Mer exploration permit which could contain estimated oil reserves of 500 million barrels. Energy Africa holds a 4 percent interest in a consortium that includes Elf Aquitaine (51 percent), Chevron (30 percent), and Hydro Congo (15 percent). (DJ)
February 11 Russia's RAO Gazprom and Italy's ENI SpA sign a preliminary agreement for joint exploration and exploitation of the Astrakhan region in Russia. The Astrakhan fields are estimated to contain up to one billion barrels of oil equivalent. The deal is worth $3 billion and includes ENI taking a yet-to-be-determined stake in Gazprom. In addition, the two companies envision joint ventures in other regions of the world, including Europe, the Mediterranean, and China. (DJ)
February 16 The United Nations (U.N.) Iraq Sanctions Committee approves a pricing plan for Iraqi oil to be shipped under the third phase of the U.N.-sponsored oil-for-food program. The approval clears the way for Iraq to export $1.07 billion of oil in each of two 90-day periods. The first 90-day period ends on March 5, 1998. (DJ)
XV Energy Information Administration / International Petroleum Statistics Report March 1998

February 17 A barge carrying about 200,000 gallons of diesel fuel sinks in rough seas off the coast of the United Arab Emirates. The barge is suspected of transporting smuggled fuel from Iraq. (DJ)
February 18 United Nations (U.N.) Secretary-General Kofi Annan receives unanimous support from the U.N. Security Council for his diplomatic trip to Iraq. Annan is scheduled to meet with President Saddam Hussein and other Iraqi leaders in an attempt to reach a diplomatic solution to the standoff between Iraq and the U.N. over weapons inspections. (DJ)
The international environmental group Greenpeace praises a policy decision by the European Union (EU) Commission to ban the disposal of offshore oil and gas platforms at sea. The Commission also called on countries in the Ospar Convention to adopt the same policy. The Ospar Convention regulates marine pollution in the North East Atlantic from Gibraltar to the Arctic. The policy, which carries an exemption for large concrete platforms, still requires approval from EU foreign ministers. The ministers will address the policy at a Ministerial meeting on July 20-24,1998. (DJ)
February 19 The U.S. Justice Department intervenes in four lawsuits against DuPont Company's Conoco Unit, Royal Dutch/Shell Group's Shell Oil Company, Burlington Resources, and Amoco Corporation. The companies are accused of violating the False Claims Act by knowingly underpaying royalties to the US government and Indian nations for oil extracted from public and Indian lands. No estimate of the value of the underpayments has been released, but a Justice Department attorney says that, since 1988, the companies had undervalued hundreds of millions of barrels of oil taken from the Gulf of Mexico and western states. (NYT) (WSJ)
February 20 The United Nations (U.N.) Security Council votes unanimously to more than double the amount of oil Iraq can export under the U.N. oil-for-food program. The Security Council's vote increases the amount Iraq can export from $2.14 billion to $5.26 billion over six months. Iraq maintains that it only has the capability to export up to $4 billion over a six-month period. (DJ)
February 22 Sudan signs a $600 million agreement with three foreign companies to construct a 994-mile pipeline to cany oil from the western fields of Higlig to Bashair Port, near Port Sudan on the Red Sea. The pipeline will transport 150,000 barrels per day and is expected to be operational by June 1999. The Sudanese government's partners are China's CPECC Oil Company, Argentina's Techint, and Britain's Weir and Allan Diesel (DJ)
United Nations (U.N.) Secretary-General Kofi Annan reaches an agreement with senior Iraqi officials over U.N. inspections of suspected Iraqi weapons sites. The deal includes opening eight Iraqi presidential compounds to weapons inspectors, one of the major points of contention between Iraq and the U.N. Annan will now present the agreement to the U.N. Security Council for approval. (WP)
February 23 Amerada Hess Corporation of the U.S. signs two production-sharing contracts with Malaysia's Petronas Carigali, marking Amerada Hess' entry into exploration activities in Malaysia. The contracts give Amerada Hess a 70 percent stake in block PM304 offshore Terengganu and an 80 percent stake in block SK306 offshore Sarawak. Amerada Hess has committed to spending $24.9 million and drilling five well on the two blocks. (DJ)
Japan's Export-Import Bank signs a loan agreement worth approximately $80 million with Gas Authority of India Limited to help finance capacity expansion work on a natural gas pipeline linking Gujarat, Madhya, and Uttar provinces with the Bombay North oil and gas field. The loan is being co-financed by the Asian Development Bank. The loan will be used to boost the capacity of the pipeline from 636 million cubic feet per day to 1.2 billion cubic feet per day. (DJ)
February 24 Turkmenistan and Shell Exploration B.V. sign a Memorandum of Understanding (MOU) providing Shell with the exclusive right to promote a project to transport Turkmen natural gas to Turkey. As part of the MOU, Shell will conduct a feasibility study on a proposed 1,200-mile gas pipeline connecting Turkmenistan and Turkey via Iranian territory. (DJ)
February 26 State oil company Petroleos de Venezuela (PdVSA) announces that three major Venezuelan oil joint ventures will be delayed 6-8 months due to budget cuts. Lower-than- expected oil prices have forced PdVSA to cut its investment plan for 1998 by approximately $1 billion. The three projects are the Cerro Negro joint venture with Mobil Corporation, the Total-led Sincor project in the Zuata region, and the Arco-led Petrolera Ameriven S.A. joint venture in the Hamaca zone. All three are extra-heavy crude upgrading projects in the Orinoco Belt region in southeast Venezuela. (DJ)
Energy Information Administration / International Petroleum Statistics Report March 1998 V

Contents
Page
Section 1. Annual and Monthly Oil Data
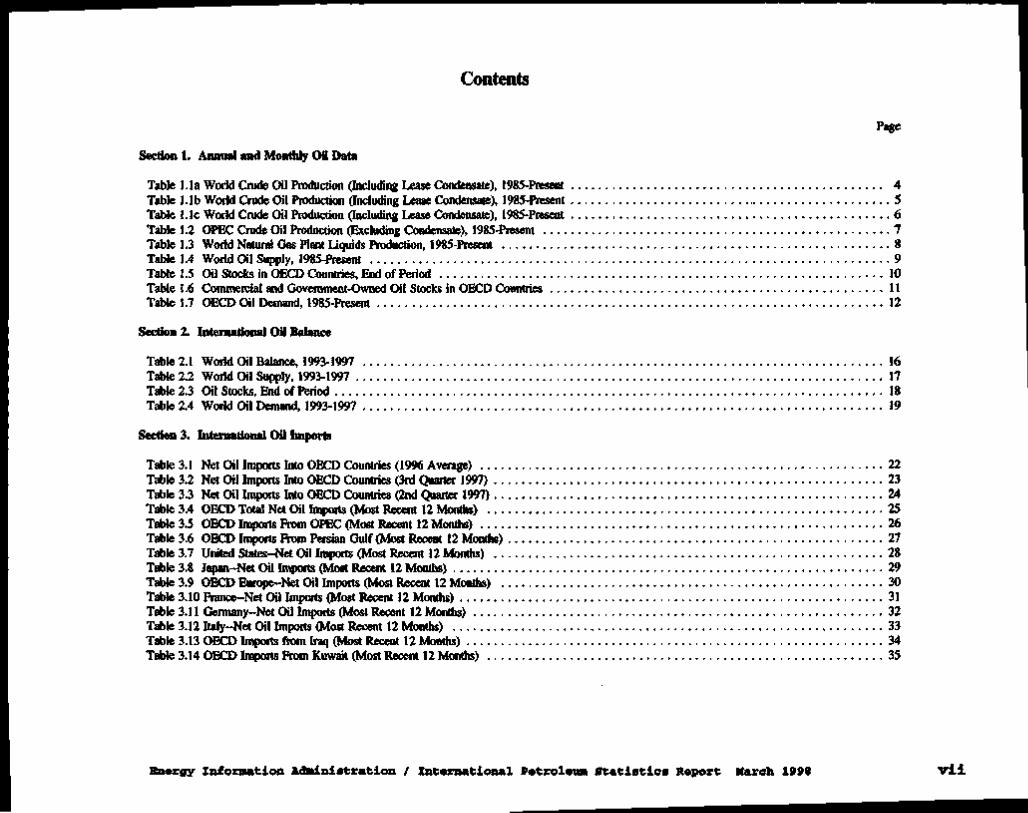
Table 1.1a World Crude Oil Production (Including Lease Condensate), 1985-Present 4 Table 1.1b World Crude Oil Production (Including Lease Condensate), 1985-Present 5 Table 1.1c World Crude Oil Production (Including Lease Condensate), 1985-Present 6 Table 1.2 OPEC Crude Oil Production (Excluding Condensate), 1985-Present 7 Table 1.3 World Natural Gas Plant Liquids Production, 1985-Present 8 Table 1.4 World Oil Supply, 1985-Present 9 Table 1.5 Oil Stocks in OECD Countries, End of Period 10 Table 1.6 Commercial and Government-Owned Oil Stocks in OECD Countries 11 Table 1.7 OECD Oil Demand, 1985-Present 12
Section 2. International Oil Balance
Table 2.1 World Oil Balance, 1993-1997 16 Table 2.2 World Oil Supply, 1993-1997 17 Table 2.3 Oil Stocks, End of Period 18 Table 2.4 World Oil Demand, 1993-1997 19
Section 3. International Oil Imports
Table 3.1 Net Oil Imports Into OECD Countries (1996 Average) 22 Table 3.2 Net Oil Imports Into OECD Countries (3rd Quarter 1997) 23 Table 3.3 Net Oil Imports Into OECD Countries (2nd Quarter 1997) 24 Table 3.4 OECD Total Net Oil Imports (Most Recent 12 Months) 25 Table 3.5 OECD Imports From OPEC (Most Recent 12 Months) 26 Table 3.6 OECD Imports From Persian Gulf (Most Recent 12 Months) 27 Table 3.7 United States-Net Oil Imports (Most Recent 12 Months) 28 Table 3.8 Japan-Net Oil Imports (Most Recent 12 Months) 29 Table 3.9 OECD Europe-Net Oil Imports (Most Recent 12 Months) 30 Table 3.10 France-Net Oil Imports (Most Recent 12 Months) 31 Table 3.11 Germany-Net Oil Imports (Most Recent 12 Months) 32 Table 3.12 Italy-Net Oil Imports (Most Recent 12 Months) 33 Table 3.13 OECD Imports from Iraq (Most Recent 12 Months) 34 Table 3.14 OECD Imports From Kuwait (Most Recent 12 Months) 35
Energy Information Administration / International Petroleum Statistics Report March 1998 vii

Contents - Continued
Page
Section 4. Historical Oil Data Series
Table 4.1a World Crude Oil Production (Including Lease Condensate), 1970-1997 38 Table 4.1b World Crude Oil Production (Including Lease Condensate), 1970-1997 39 Table 4.1c World Crude Oil Production (Including Lease Condensate), 1970-1997 40 Table 4.2 OPEC Crude Oil Production (Excluding Condensate), 1980-1997 41 Table 4.3 World Natural Gas Plant Liquids Production, 1970-1997 42 Table 4.4 World Oil Supply, 1970-1997 43 Table 4.5 Oil Stocks in OECD Countries, End of Period 44 Table 4.6 World Oil Demand, 1970-1996 45 Table 4.7 OECD Total Net Oil Imports, 1986-1996 46 Table 4.8 OECD Imports From OPEC, 1986-1996 47 Table 4.9 OECD Imports From Persian Gulf, 1986-1996 48 Table 4.10 United States-Net Oil Imports, 1986-1996 49 Table 4.11 Japan-Net Oil Imports, 1986-1996 50 Table 4.12 OECD Europe-Net Oil Imports, 1986-19% 51 Table 4.13 France-Net Oil Imports, 1986-1996 52 Table 4.14 Germany-Net Oil Imports, 1986-1996 53 Table 4.15 Italy-Net Oil Imports, 1986-1996 54 Table 4.16 OECD Imports From Iraq, 1986-1996 55 Table 4.17 OECD Imports From Kuwait, 1986-1996 56
Appendix A. Organizational and Geographical Definitions 59 Appendix B. Explanatory Notes 61 Appendix C. Glossary 65 Appendix D. Estimation Procedures 67 Appendix E. Conversions
Table El. Refined Petroleum Products Conversion Factors 70 Table E2. Barrels of Crude Oil per Metric Ton, 1986-1995 71
Figures
Figure 1. World Crude Oil Production, Monthly 2 Figure 2. Leading Crude Oil Producers, Monthly 2 Figure 3. OECD Oil Consumption, Monthly 3 Figure 4. OECD Oil Stocks, Monthly 3
viii Energy information Administration / International Petroleum Statistics Report March 1998

1. Annual and Monthly Oil Data

Figure 1. World Crude Oi l Production, Monthly
IV
60-
50-> CO 0 L.
^ 4 0 -in
§
0
5 20
10-
. .-—'•->. „^"" ' ' " World
OPEC . - — — — „ -
Persian Gulf
T i i i i i i i i i r n i -i i m 'i r i i i r i r i "I TV r m r JFMAMJJASONDJFMAMJJASONDJFMAMJJASOND
1996 1997 1998
Source: Tables l.la-l.lc
Figure 2. Leading Crude Oil Producers, Monthly
10
8-
0
a
S 4-
Saudi Arabia
" ' - '*
0 i i i i i i i i i i i i i i i i i i i i i i • i i i i i i i i i i i i i i J F M A M J J A S O N D J F M A M J J A S O N D J F M A M J J A S O N D 1996 1997 1998
Source: Tables l.la-l.lc
2 Energy Information Administration / International Petroleum Statistics Report March 1998

Figure 3. OECD Oil Consumption, Monthly Figure 4. OECD Oil Stocks, Monthly
60
50-
a (0 g 30-
c 0
^ 2 0 -
10-
OECD
United States
OECD Europe
Japan
i i i i i i i i i i i i i i i i i i i i i i i i i i ' i 'i i i i i i i i i J F M A M J J A S O N D J F M A M J J A S O N D J F M A M J J A S O N D
1995 1996 1997
Source: Table 1.7
4,000-
3,000-
2,500
£ ^ 2,000 o
1,500-
1,000-
500-
OECD
United States
OECD Europe
Japan
0'i i i i i i i i i i i i i i i i i i i i i i i i i i i i' i i i i i i i J F M A M J J A S O N D J F M A M J J A S O N D J F M A M J J A S O N D
1995 1996 1997
Source: Table 1.5
Energy Information Administration / International Petroleum Statistics Report March 1998 3

Table 1.1a World Crude Oi l Production (Including Lease Condensate), 1985-Present (Thousand Barrels per Day)
A l g e r i a Indonesia
1,325 1,390 1,343 1,342 1,409 1,462 1,592 1,504 1,511 1,510 1,503 1,547 1,570 1,590 1,600 1,560 1,580 1,530 1,530 1,530 1,490 1,490 1,540 1,540 1,546
Iran
2,250 2,035 2,298 2,240 2,810 3,088 3,312 3,429 3,540 3,618 3,643 3,686 3,685 3,685 3,685 3,685 3,635 3,735 3,685 3,685 3,485 3,635 3,685 3,685 3,664
Iraq
1,433 1,690 2,079 2,685 2,897 2,040 305 425 512 553 560
R579 1,085 1,125 1,175 1,275 1,325 605 605
1,515 1,735 1,625 1,390 781
1,187
Kuwaiti,/
1,023 1,419 1,585 1,492 1,783 1,175 190
1,058 1,852 2,025 2,057 2,062 2,085 2,077 2,105 2,107 2,027 2,050 2,070 2,070 2,075 2,075 2,075 2,175 2,083
Libya
1,059 1,034 972
1,175 1,150 1,375 1,483 1,433 1,361 1,378 1,390 1,401 1,430 1,430 1,440 1,450 1,450 1,450 1,450 1,450 1,450 1,450 1,450 1,450 1,446
Nigeria
1,495 1,467 1,341 1,450 1,716 1,810 1,892 1,943 1,960 1,931 1,993 2,188 2,280 2,310 2,240 2,310 2,270 2,340 2,330 2,350 2,300 2,400 2,360 2,320 2,317
Qatar
301 308 293 346 380 406 395 423 413 415 R442 510 585 585 585 585 605 690 685 685 685 685 705 705 649
Saudi Arabial/
3,388 4,870 4,265 5,086 5,064 6,410 8,115 8,332 8,198 8,120 8,231 8,218 8,265 8,408 8,515 8,568 8,548 8,540 8,560 8,660 8,665 8,665 8,615 8,725 8,562
United Arab Emirates
1,193 1,330 1,541 1,565 1,860 2,117 2,386 2,266 2,159 2,193 R2,233 2,278 2,300 2,330 2,360 2,360 2,210 2,325 2,325 2,325 2,325 2,325 2,305 2,310 2,316
Venezuela
1,677 1,787 1,752 1,903 1,907 2,137 2,375 2,371 2,450 2,588 2,750 3,053 3,190 3,190 3,200 3,220 3,240 3,260 3,270 3,390 3,430 3,430 3,460 3,490 3,315
Total OPEC
16,181 18,275 18,517 20,324 22,071 23,195 23,275 24,398 25,119 25,510 R26,004 R26,764 27,735 28,000 28,185 28,400 28,170 27,785 27,790 28,940 28,920 29,060 28,865 28,471 28,362
1985 Average 1,037 1986 Average 945 1987 Average 1, 048 1988 Average 1,040 1989 Average 1,095 1990 Average 1,175 1991 Average 1,230 1992 Average 1,214 1993 Average 1,162 1994 Average 1,180 1995 Average 1,202 1996 Average 1,242 1997 January 1,260
February 1, 270 March 1,280 April 1,280 May 1,280 June 1,260 July 1,280 August 1,280 September 1,280 October 1,280 November 1,280 December 1, 290
1997 Average 1,277 1998 January 1,290 1,520 3,635 1,261 2,215 1,450 2,208 715 8,765 2,435 3,440 28,934
1/ Includes about one-half of the production in the Kuwait-Saudi Arabia Neutral Zone from 1980 through July 1990 and beginning in June 1991. Kuwaiti Neutral Zone output was discontinued following Iraq's invasion of Kuwait on August 2, 1990, but was resumed in June 1991. From August 1990 through May 1991, all production in the Neutral Zone was included in the-data for Saudi Arabia. In January 1998, Neutral Zone production by both Kuwait and Saudi Arabia totaled about 530 thousand barrels per day. Notes: •OPEC«Organization of Petroleum Exporting Countries. 'Monthly data are often preliminary and also may not average
to the annual totals due to rounding. Sources: See end of Section 1.
4 Energy Information Administration / International Petroleum Statistics Report March 1998

Table 1.1b World Crude Oi l Production (Including Lease Condensate), 1985-Present (Thousand B a r r e l s p e r Day)
United North Norway Kingdom Sea l / Angola
Argent i n a
Aus t ra l i a B r a z i l Canada China Colombia Ecuador
1985 Average... 1986 Average... 1987 Average... 1988 Average... 1989 Average... 1990 Average... 1991 Average... 1992 Average... 1993 Average... 1994 Average... 1995 Average... 1996 Average... 1997 January...
February.. March. April May June July August September. October... November.. December..
1997 Average... 1998 January...
788 870
1,022 1,158 1,554 1,704 1,890 2,229 2,350 2,521 2,768 3,104 3,268 3,263 3,063 3,388 3,194 3,025 3,194 2,890 2,927 3,209 3,192 3,229 3,153
2,530 2,539 2,406 2,232 1,802 1,820 1,797 1,825 1,915 2,375 2,489 2,568 2,693 2,660 2,638 2,515 2,315 2,135 2,447 2,407 2,483 2,610 2,602 2,700 2,517
3,417 3,547 3,584 3,540 3,515 3,667 3,811 4,182 4,403 5,058 5,400 5,822 6,126 6,074 5,863 6,063 5,677 5,339 5,820 5,462 5,589 6,000 5,992 6,116 5,843
231 282 360 452 455 475 500 526 509 536 646 709 700 715 720 720 720 710 715 720 717 725 725 750 720
460 434 428 449 460 483 485 553 594 650 715 756 820 820 830 840 840 815 820 840 845 850 850
R845 835
575 520 547 538 490 575 545 535 503 536 562 570 565 561 594 594 576 574 584 605 626 616 565
R590 R588
564 572 566 554 596 631 630 626 643 671 695 795 840 830 830 830 830 830 860 845 830
R740 830 830
R827
1,471 1,474 1,535 1,616 1,560 1,553 1,548 1,605 1,679 1,746 1,805
Rl,837 1,874 1,920 1,900 1,823 1,737 1,835 1,889 1,895 1,930 1,956 1,970 1,985 1,893
2,505 2,620 2,690 2,730 2,757 2,774 2,835 2,845 2,890 2,939 2,990 3,131 3,210 3,240 3,215 3,230 3,275 3,220 3,190 3,190 3,195 3,195 3,158 3,090 3,200
176 305 385 378 403 440 419 433 456 450 585 623 650 640 620 650 650 640 605 635 660 715 745
R730 R662
281 293 174 302 279 285 299 321 344 365 392
R396 385 385 380 390 380 360 360 370 390 385
R395 R390 R381
3,293 2,597 6,082 760 845 528 830 1,912 3,240 750 390
1/ North Sea includes the united Kingdom Offshore, Norway, Denmark, Netherlands Offshore, and Germany Offshore. R»Revised data. Notes: 'Monthly data are often preliminary and also may not average to the annual totals due to rounding. See Section 4
for historical series. Sources: See end of Section 1.
Energy Information Administration / International Petroleum Statistics Report March 1998 5

Table 1.1c World Crude Oil Production (Including Lease Condensate), 1985-Present (Thousand Barrels per Day)
Former United Egypt Gabon India Malaysia Mexico Oman Russia U.S.S.R. Syria States Otherl/ World
1985 1986 1987 1988 1989 1990 1991 1992 1993 1994 1995 1996 1997
1997 1998
February....
September... November.... December....
887 813 896 848 865 873 874 881 890 896 920 922 885 885 890 890 880 870 880 870 860 860 860 860 874 860
172 166 155 159 208 270 294 298 313 329
R365 368 370 370 370 370 370 370 370 370 360 370 370
R360 R368 360
620 630 609 635 700 660 615 561 534 590 703 651 650 650 660 685 685 685 685 685 675 678 681
R675 675 675
440 504 497 540 585 619 646 653 640 645 682 695 730 730 730 750 750 740 740 740 760 760 760 760 746 760
2,745 2,435 2,548 2,512 2,520 2,553 2,680 2,669 2,673 2,685 2,618 2,855 2,940 2,970 2,970 2,945 2,990 3,005 3,035 3,080 3,105 3,087 3,085
R3,056 R3,023 3,085
498 560 582 617 641 685 700 740 776 810 851 883 890 900 900 900 890 900 840 870 870 880 890
R910 R887 910
— — — — — — —
7,632 6,730 6,135 5,995
R5,850 5,789 5,729 5,772 5,893 5,902 5,902 5,923 5,945 5,958 5,954 5,945 5,893 5,884 5,979
11, 11. 12, 12, 11, 10, 9,
585 895 050 053 715 975 992 — — — — —
----—
— — — — — — — —
178 194 230 265 340 388 492 481 554 560
R575 604 565 565 565 560 560 560 560 560 560 560 560 560 561 560
8,971 8,680 8,349 8,140 7,613 7,355 7,417 7,171 6,847 6,662 6,560 6,465
E6,387 E6,514 E6,470 E6,483 E6,401 E6,341 E6,316 E6,282 E6,388 E6,435 E6,450 RE6,475 RE6,411 PE6,390
2,124 2,166 2,120 2,235 2,249 2,253 2,274
R3,228 R3,280 R3,382 R3,410 R3,509 3,706 3,685 3,725 3,747 3,711 3,716 3,670 3,663 3,664 3,678
R3,714 R3,691 R3,698 3,720
53,982 56,227 56,666 58,737 59,863 60,566 60,207
R60,212 R60.238 R60.992 R62.331 R64,054 65,652 66,031 66,027 66,603 65,825 65,018 65,473 66,402 66,723
R67,323 R67,212 R66,850 R66,262 67,379
XI Other is a calculated total derived from the difference between "World" and the sum of production in "Total OPEC" (Table 1.1a) and all other countries listed (Tables 1.1b and 1.1c). The total "North Sea" is not subtracted from the world total, though Norway and the United Kingdom have been subtracted. — = Not applicable. R=Revised data. E-Estimated. PE-Preliminary estimate. RE«Revised estimate. Notes: 'Monthly data are often preliminary and also may not average to the annual totals due to rounding. See Section 4
for historical series. Sources: See end of Section 1.
6 Energy Information Administration / International Petroleum Statistics Report March 1998

Table 1.2 OPEC Crude Oil Production (Excluding Condensate), 1985-Present (Thousand Barrels per Day)
United Indo- Saudi Arab Vene- Total
Algeria nesia Iran Iraq Kuwaiti/ Libya Nigeria Qatar Arabial/ Emirates zuela OPEC
1985 1986 1987 1988 1989 1990 1991 1992 1993 1994 1995 1996 1997
1997 1998
Average... Average... Average... Average... Average... Average... Average... Average... Average... Average... Average... Average... January... February.. March .... April .... May .... June .... July .... August.... September. October... November.. December.. Average... January...
702 600 648 640 690 765 800 772 747 750 767 812 830 840 850 850 850 830 850 850 850 850 850 860 847 860
1,181 1,257 1,189 1,177 1,231 1,281 1,410 1,326 1,327 1,334 1,343 1,367 1,390 1,410 1,420 1,380 1,400 1,350 1,350 1,350 1,310 1,310 1,360 1,360 1,366 1,340
2,250 2,035 2,298 2,240 2,810 3,088 3,312 3,429 3,540 3,600 3,608 3,651 3,650 3,650 3,650 3,650 3,600 3,700 3,650 3,650 3,450 3,600 3,650 3,650 3,629 3,600
1,433 1,690 2,079 2,685 2,897 2,040 305 425 512 548 550 579
1,080 1,120 1,170 1,270 1,320 600 600
1,510 1,730 1,620 1,385 776
1,182 1,256
1,023 1,419 1,585 1,492 1,783 1,175 190
1,058 1,852 2,034 2,057 2,062 2,085 2,077 2,105 2,107 2,027 2,050 2,070 2,070 2,075 2,075 2,075 2,175 2,083 2,215
1,059 1,034 972
1,175 1,150 1,375 1,483 1,433 1,361 1,378 1,390 1,401 1,430 1,430 1,440 1,450 1,450 1,450 1,450 1,450 1,450 1,450 1,450 1,450 1,446 1,450
1,475 1,447 1,291 1,400 1,666 1,755 1,832 1,820 1,835 1,887 1,876 2,051 2,180 2,210 2,140 2,210 2,170 2,240 2,230 2,250 2,200 2,300 2,260 2,220 2,217 2,108
301 308 293 346 380 406 395 423 413 409 449 475 550 550 550 550 570 655 650 650 650 650 670 670 614 680
3,388 4,870 4,265 5,086 5,064 6,410 8,115 8,332 8,198 8,147 8,231 8,218 8,265 8,408 8,515 8,568 8,548 8,540 8,560 8,660 8,665 8,665 8,615 8,725 8,562 8,765
1,133 1,270 1,441 1,465 1,783 2,066 2,326 2,206 2,109 2,183 2,197 2,198 2,220 2,250 2,280 2,280 2,130 2,245 2,245 2,245 2,245 2,245 2,225 2,230 2,236 2,355
1,558 1,645 1,587 1,715 1,747 2,097 2,338 2,334 2,410 2,542 2,710 3,013 3,150 3,150 3,160 3,180 3,200 3,220 3,230 3,350 3,390 3,390 3,420 3,450 3,275 3,400
15,503 17,575 17,648 19,421 21,201 22,458 22,506 23,558 24,304 24,812 25,179 25,826 26,830 27,095 27,280 27,495 27,265 26,880 26,885 28,035 28,015 28,155 27,960 27,566 27,457 28,029
XI Includes about one-half of the production in the Kuwait-Saudi Arabia Neutral Zone from 1980 through July 1990 and beginning in June 1991. Kuwaiti Neutral Zone output was discontinued following Iraq's invasion of Kuwait on August 2, 1990, but was resumed in June 1991. From August 1990 through May 1991, all production in the Neutral Zone was included in the data for Saudi Arabia. In January 1998, Neutral Zone production by both Kuwait and Saudi Arabia totaled about 530 thousand barrels per day. Notes: 'OPEC'Organization of Petroleum Exporting Countries. See Appendix A for countries in this group. •Monthly data are often preliminary and also may not average to the annual totals due to rounding. Sources: See end of Section 1.
Energy Information Administration / International Petroleum Statistics Report March 1998 7

Table 1.3 World Natural Gas Plant Liquids Production, 1985-Present (Thousand Barrels per Day)
Saudi Former United Persian Algeria Canada Mexico Arabia Russia USSR States!/ Gulf2/ 0APEC3/ 0PEC3/ World
1985 1986 1987 1988 1989 1990 1991 1992 1993 1994 1995 1996 1997
1997 1998
Average
May
September....
120 120 140 120 130 130 140 140 145 140 145
R150 145 145 145 145 145 145 145 145 145 145 145 145 145 145
337 328 367 381 410 426 431 460 506 529 581
R596 660 645 652 610 597 595 598 625 626 646 655 665 631 665
271 352 338 370 384 428 457 454 459 461 447 423 370 375 385 360 380 370 370 370 425 409 405
R418 R386 385
375 385 418 499 503 620 680 713 704 698 701 697 700 710 720 725 725 720 720 730 730 730 725 735 723 735
— — --— — — — 230 220 200 180
R185 R200 R200 R200 R200 R200 R200 R200 R200 R200 R200 R200 R200 R200 200
350 440 430 450 425 425 420 --— — --—
— --— — — — --— --— —
1,609 1,551 1,595 1,625 1,546 1,559 1,659 1,697 1,736 1,727 1,762 1,830 1,815 1,900 1,907 1,849 1,832 1,842 1,850 1,850 1,871 1,840 1,753
Rl,798 Rl,842 El,836
645 700 721 808 851 930 931
1,003 1,040 1,071 1,106 1,082 1,085 1,095 1,105 1,110 1,110 1,105 1,105 1,115 1,115 1,115 1,110 1,120 1,108 1,120
808 860 900 979
1,041 1,107 1,113 1,185 1,238 1,267 1,301
Rl,295 Rl,287 Rl,297 Rl,307 Rl,312 Rl,312 Rl,307 Rl,307 Rl,317 Rl,317 Rl,317 Rl,312 Rl,322 Rl,310 1,322
892 969
1,006 1,077 1,188 1,281 1,299 1,364 1,435 1,465 1,506
Rl,501 Rl,465 Rl,475 Rl,485 Rl,490 Rl,490 Rl,485 Rl,485 Rl,495 Rl,495 Rl,495 Rl,490 Rl,500 Rl,488 1,500
3,938 4,150 4,279 4,481 4,502 4,632 4,827 R4,975 R5,181 R5,293 R5,485 R5,582 R5,595 R5,660 R5,694 R5,566 R5,508 R5,487 R5,524 R5.548 R5,651 R5,641 R5,601 R5,678 R5,596 5,669
XI U.S. geographic coverage is the 50 States and the District of Columbia. Excludes fuel ethanol blended into finished motor gasoline.
2/ See Appendix A for countries in this group. 3/ OAPEC-Organization of Arab Petroleum Exporting Countries. OPEC»Organization of Petroleum Exporting Countries.
See Appendix A for countries in these groups. R>Revised data. E-Estimated. Notes: 'Monthly data are often preliminary and also may not average to the annual totals due to rounding. See
Section 4 for historical series. Sources: See end of Section 1.
8 Energy Information Administration / International Petroleum Statistics Report March 1998

Table 1.4 World Oi l Supply, 1985-Present (Thousand Barrels per Day)
United StatesjL/
11,192 10,905 10,648 10,473 9,880 9,677 9,883 9,768 9,602 9,413 9,400 9,445
E9,249 E9,519 E9,482 E9,385 E9,321 E9,253 E9,407 E9,346 E9,503 E9,531 E9,458 RE9,540 RE9,416 PE9,420
Persian Gulf2/
10,320 12,441 12,869 14,310 15,733 16,249 15,704 17,010 17,792 18,072 R18,351 R18,486 19,162 19,377 19,602 19,762 19,532 19,122 19,107 20,127 20,157 20,197 19,957 19,573 19,641 20,218
OAPEC3/ OPEC3/ World
1985 Average... 1986 Average... 1987 Average... 1988 Average... 1989 Average... 1990 Average... 1991 Average... 1992 Average... 1993 Average... 1994 Average... 1995 Average... 1996 Average... 1997 January...
February.. March April Hay June July August September. October... November.. December..
1997 Average... 1998 January...
11,498 13,653 13,992 15,662 16,658 17,232 16,747 17,871 18,505 18,745 R19,069 R19,259 R19,898 R20,123 R20,373 R20,534 R20,344 R19,799 R19,859 R20.869 R21,089 R20,979 R20,689 R20,315 R20,407
21,010
17,151 19,310 19,589 21,465 23,323 24,536 24,625 25,818 26,610 27,031
R27,566 R28.321 R29,256 R29,531 R29,726 R29,946 R29,716 R29,326 R29.331 R30,491 R30,471 R30,611 R30,411 R30,027 R29,905
30,490
R59,262 R61,769 R62,427 R64,705 R65,892 R66,754 R66,632 R66,960 R67,361 R68,250 R69,860 R71,764 R73,305 R73,807 R73,836 R74,233 R73,432 R72,586 R73,249 R74,175 R74,629 R75,231 R75,079 R74,806 R74,031 75,253
XI U.S. geographic coverage is the 50 States and the District of Columbia. Beginning in 1993, includes fuel ethanol blended into finished motor gasoline and oxygenate production from merchant MTBE plants. 2/ See Appendix A for countries in this group. 7/ OAPEC»Organization of Arab Petroleum Exporting Countries. OPEC»Organization of Petroleum Exporting Countries. See Appendix A for countries in these groups. R>Revised data. E*Estimated. PE«Prelimlnary estimate. RE*Revised estimate. Notes: 'Oil Supply includes crude oil, natural gas plant liquids, other liquids, and refinery gain. See Explanatory Note 1 in Appendix B. 'Monthly data are often preliminary and also may not average to the annual total due to rounding. See Section 4 for historical series. Sources: See end of Section 1.
Energy Information Administration / International Petroleum Statistics Report March 1998 9

Table 1.5 Oil Stocks in OECD Countries, End of Period (Million Barrels)
United OECD United Total France Italy Germany!/ Kingdom Europe2/ States3_/ Canada Japan 0ther4/ OECD
1985 1986 1987 1988 1989 1990 1991 1992 1993 1994 1995 1996
1997
September....
September....
139 127 127 140 138 140 153 146 158 158 159 154 156 156 165 163 160 162 160 152 156 160 158 156 159 160 159 163 153 153 158 157 152 163
157 155 169 155 164 172 160 174 163 164 162 157 156 153 150 157 158 155 159 162 155 152 152 158 156 160 151 150 151 150 151 144 144 150
233 252 259 266 271 265 288 310 309 312 301 301 298 296 298 295 296 297 295 295 296 297 300 304 307 311 300 309 298 304 303 291 290 291
123 124 121 112 118 112 119 113 118 115 107 107 103 106 109 105 104 105 101 105 104 106 108 107 105 109 108 108 111 106 108 106 106 106
1,092 1,133 1,130 1,118 1,133 1,163 1,181 1,219 1,221 1,240 1,228 1,236 1,224 1,212 1,236 1,233 1,229 1,242 1,237 1,229 1,237 1,243 1,256 1,279 1,269 1,272 1,247 1,246 1,231
Rl,225 Rl,252 1,230
Rl,228 1,248
1,519 1,593 1,607 1,597 1,581 1,621 1,617 1,592 1,647 1,653 1,563 1,544 1,500 1,482 1,502 1,520 1,546 1,550 1,545 1,551 1,538 1,522 1,507 1,503 1,482 1,512 1,519 1,562 1,577 1,559 1,570 1,594 1,598 1,599
113 111 126 116 114 121 119 107 105 119 109 104 102 109 109 107 107 110 110 113 111 105 103 104 101 105 108 104 103 105 113 109
R109 110
494 509 540 538 577 590 606 603 618 645 630 638 615 627 622 641 640 637 658 664 673 665 651 650 642 650 665 664 662 670 669 680
R693 699
66 72 71 71 71 73 65 67 69 69 71 73 69 70 72 75 73 83 79 83 82 81 74 80 75 76 80 81 83 81 80 77 82 79
3,284 3,418 3,474 3,440 3,476 3,568 3,588 3,588 3,661 3,726 3,601 3,596 3,511 3,500 3,540 3,575 3,597 3,621 3,629 3,641 3,640 3,616 3,591 3,616 3,570 3,616 3,619 3,657 3,656
R3,640 R3,683 3,689
R3,709 3,735
XI Through December 1990, the data for Germany are for the former West Germany only. Beginning with January 1991, the data for Germany are for the unified Germany, i.e., the former East Germany and West Germany. 2/ "OECD Europe" consists of Austria, Belgium, Denmark, Finland, France, Germany, Greece, Iceland, Ireland, Italy, Luxembourg,
the Netherlands, Norway, Portugal, Spain, Sweden, Switzerland, Turkey, and the United Kingdom. 3/ U.S. geographic coverage is the 50 States and the District of Columbia. 4/ "Other" consists of Australia, New Zealand, and the U.S. Territories. R>Revised data. Notes: 'Oil Stocks - See Explanatory Note 2 in Appendix B. 'See Section 4 for historical series. Sources: See end of Section 1.
10 Energy Information Administration / International Petroleum Statistics Report March 1998

Table 1.6 Commercial and Government-Owned Oi l Stocks i n OECD Countr ies (End of September 1997) (Mi l l ion B a r r e l s )
Government Country Commercial Owned Tota l
Canada 109 0 109 United S t a t e s l / 1,031 563 1,594 United S t a t e s T e r r i t o r i e s 27 0 27
Japan 368 312 680 Austra l ia /New Zealand 50 NA 50 Austria 22 0 22 Belgium/Luxembourg 31 0 31 Denmark 24 0 24 Finland 25 0 25 France 157 0 157 Germany^/ 236 55 291 Greece 27 NA 27 Ireland 7 2 9 Italy 138 6 144 Netherlands 99 0 99 Norway 49 0 49 Portugal 20 0 20 Spain 100 0 100 Sweden 30 0 30 Switzerland 46 0 46 Turkey 51 0 51 United Kingdom 106 0 106 OECD Europe 1,167 63 1,230 Total OECD 2,751 938 3,689
XI U.S. geographic coverage is the 50 States and the District of Columbia. 21 Data are for the unified Germany, i.e., the former East Germany and West Germany. NA=Not Available. Notes: 'Sum of components may not equal total due to rounding. 'Oil Stocks - See Explanatory Note 2 in Appendix B.
•OECDaOrganization for Economic Cooperation and Development. See Appendix A for countries in this group. Sources: See end of Section 1.
Energy Information Administration / International Petroleum Statistics Report March 1998 11

Table 1.7. OECD Oil Demand, 1985-Present (Thousand Barrels per Day)
United OECD United Total France Italy Germany!/ Kingdom Europe2/ States3/ Canada Japan Other4/ OECD
1985 1986 1987 1988 1989 1990 1991 1992 1993 1994 1995 1996
1997
Average.. Average.. Average.. Average.. Average.. Average.. Average.. Average.. Average.. Average.. Average.. January.. February.
September October.. November. December. Average.. January... February.
September. October... November..
1,775 1,772 1,789 1,797 1,857 1,818 1,935 1,926 1,875 1,833 1,896 1,879 2,183
1,929 1,989 1,880 2,021 1,935 2,165 2,137
1,990 2,148 1,732
1,717 1,738 1,855 1,836 1,930 1,872 1,863 1,937 1,852 1,841 2,048 2,113 2,259 2,189 1,961 1,880 1,908 2,158 1,786 2,074 2,201 2,083 2,088 2,058 2,037 2,126 1,928 1,999 1,898 1,948 2,029 1,808 2,181 2,216 2,185
2,338 2,498 2,424 2,422 2,280 2,382 2,828 2,843 2,900 2,879 2,875 2,901 3,030 2,860 2,743 2,864 2,830 2,957 3,035 3,095 2,860 2,975 2,796 2,911 2,901 2,673 2,685 3,225 2,787 3,136 3,098 2,740 3,161 2,877 2,878
1,634 1,649 1,603 1,697 1,738 1,752 1,801 1,803 1,815 1,837 1,845 1,762 1,919 1,859 1,853 1,846 1,738 1,790 1,795 1,877 1,910 1,966 1,836 1,845 1,828 1,907 1,776 1,823 1,711 1,791 1,766 1,724 1,833
Rl,849 1,803
11,681 12,102 12,255 12,427 12,531 12,629 13,391 13,605 13,523 13,597 14,120 14,036 15,138 14,275 13,676 13,778 13,597 14,245 13,873 14,775 14,722 14,700 14,458 14,269 14,633 14,580 13,579
R14,656 R13,494 R14,340 R14,732 R13,501 R14,958 R15,125 14,320
15,726 16,281 16,665 17,283 17,325 16,988 16,714 17,033 17,237 17,718 17,725 18,261 18,620 18,301 17,885 17,957 18,107 18,211 18,658 17,655 19,171 18,535 18,334 18,309 18,560 18,308 17,869 18,572 18,244 18,563 19,065 18,506 18,480 19,121 18,491
1,504 1,506 1,548 1,693 1,733 1,690 1,622 1,643 1,688 1,727 1,755 1,805 1,874 1,744 1,667 1,715 1,796 1,802 1,880 1,763 1,809 1,941 1,771 1,797 1,862 1,862 1,780 1,745 1,823 1,913 1,949 1,912
Rl,856 Rl,934 1,866
4,384 4,439 4,484 4,752 4,983 5,140 5,284 5,446 5,401 5,674 5,711 6,328 6,886 6,437 5,748 5,147 5,114 5,502 5,567 5,361 5,580 6,114 6,648 5,867 6,291 6,751 6,146 5,303 5,076 5,131 5,440 5,391 5,411
R5,411 5,734
976 951 959 939 998
1,027 1,056 1,041 1,118 1,174 1,227 1,165 1,172 1,151 1,154 1,113 1,128 1,084 1,113 1,024 1,133 1,064 1,192 1,124 1,138 1,140 1,141 1,174 1,065 1,090 1,142 1,106 1,158
Rl,158 1,126
34,271 35,279 35,911 37,093 37,570 37,475 38,067 38,768 38,967 39,890 40,537 41,595 43,690 41,907 40,130 39,709 39,742 40,843 41,091 40,578 42,414 42,354 42,402 41,366 42,483 42,641 40,515 R41,449 R39,703 R41,037 R42,328 R40,417 R41,864 R42.749 41,537
XI Through December 1990, the data for Germany are for the former West Germany only. Beginning with January 1991, the data for Germany are for the unified Germany, i.e., the former East Germany and West Germany.
2/ "OECD Europe" consists of Austria, Belgium, Denmark, Finland, France, Germany, Greece, Iceland, Ireland, Italy, Luxembourg, the Netherlands, Norway, Portugal, Spain, Sweden, Switzerland, Turkey, and the United Kingdom. 3/ U.S. geographic coverage is the 50 States and the District of Columbia. 4/ "Other" consists of Australia, New Zealand, and the U.S. Territories. R»Revised data. Notes: 'The term Demand is used interchangeably with Consumption and Petroleum Products Supplied. See Appendix C for
definition. «See Section 4 for historical series. Sources: See end of Section 1.
12 Energy Information Administration / International Petroleum Statistics Report March 1998

Sources for Section 1 (Annual and Monthly Oil Data)
Crude Oil Production, Natural Gas Liquids Production, Other Liquids, and Refinery Gain
United States: Energy Information Administration (EIA), Petroleum Supply Annual 1996 and Petroleum Supply Monthly. February 1998.
Other Countries: Annual data - EIA, International Energy Annual, various issues. Monthly data- Canada- Maclean Hunter Publishing Company, Oilweek, various issues. Denmark, Mexico, Netherlands, Norway, Germany, and all OPEC countries — Petroleum and Energy Intelligence Weekly, Inc., Petroleum Intelligence Weekly, various issues. All Other Countries - PennWell Publishing Company, Oil and Gas Journal, various issues. Refinery Gains: National Petroleum Council, U.S. Petroleum Refinery Study. October 1986.
Oil Stocks
United States: EIA, Petroleum Supply Annual 19% and Petroleum Supply Monthly. February 1998.
Other OECD Countries: • Organization for Economic Cooperation and Development (OECD), Ouarteriy Oil Statistics and Energy Balances, various issues. • OECD, Monthly Oil Statistics data base, 1985-1997.
Oil Demand
United States: EIA, Petroleum Supply Annual 1996 and Petroleum Supply Monthly, February 1998.
Other OECD Countries: • OECD, Ouarteriy Oil Statistics and Energy Balances, various issues. • OECD, Monthly Oil Statistics data base, 1985-1997.
Energy Information Administration / International Petroleum Statistics Report March 1998


2. International Oil Balance Data

T a b l e 2 . 1 World Oi l Balance, 1993-1997 ( M i l l i o n B a r r e l s P e r Day)
1993 1994
Annua l
A v e r a g e
1995 1996 1997
Q u a r t e r Annua l Q u a r t e r Annua l
F i r s t Second T h i r d F o u r t h A v e r a g e F i r s t Second T h i r d F o u r t h Ave rage
S u p p l y l / OECD
U n i t e d S t a t e s 2 / 9 . 6 0 9 . 4 1 O t h e r OECD 8 .40 9 . 2 5 Total OECD 18.00 18.66
Non-OECD OPEC 26.61 27.03 Former USSR 7.96 7.27 Other Non-OECD 14.80 15.29 Total Non-OECD 49.36 49.59
Total World Supply 67.36 68.25 Demand3/
OECD United States2/ 17.24 17.72 Other OECD 21.73 22.17 Total OECD 38.97 39.89
Non-OECD China 2.96 3.14 Former USSR 5.64 4.85 Other Non-OECD 19.48 20.43 Total Non-OECD 28.08 28.42
Total World Demand 67.04 68.31 Stock Draws / Discrepancy Net Reported Stock Draws4/
U. S. Commercial -.12 .00 U. S. Strategic -.03 -.01 Other OECD -.05 -.16 For Export & Afloat -. 04 .03 Commr. Floating Storage... -.00 -.00 Total Reported Draws -. 24 -. 15
Other Stock Draws and Statistical Discrepancy^/ -.08 .21
9 . 4 0 9 .80
1 9 . 2 0
2 7 . 5 7 7 . 1 4
1 5 . 9 5 5 0 . 6 6 6 9 . 8 6
17 .72 2 2 . 8 1 4 0 . 5 4
3 . 3 1 4 . 7 2
21 .62 2 9 . 6 6 7 0 . 1 9
. 2 5
.00
. 09 - . 12 - .00 .22
.12
9 . 4 0 1 0 . 1 9 1 9 . 5 9
2 8 . 1 4 7 . 0 7
1 6 . 4 7 5 1 . 6 9 7 1 . 2 9
1 8 . 3 9 2 3 . 9 8 4 2 . 3 7
3 . 5 1 4 . 7 5
2 2 . 4 9 3 0 . 7 5 7 3 . 1 2
. 8 6
. 0 3
. 22
. 3 3 - . 0 0 1.44
. 39
9 . 3 9 1 0 . 1 5 1 9 . 5 3
2 8 . 1 0 7 . 0 5
1 6 . 6 9 5 1 . 8 3 7 1 . 3 7
1 7 . 9 8 2 1 . 8 8 3 9 . 8 6
3 . 5 6 4 . 2 7
2 2 . 4 1 3 0 . 2 5 7 0 . 1 1
- . 7 7 . 0 5
- . 3 5 - . 0 5 - . 0 0
- 1 . 1 2
9 . 4 0 1 0 . 2 0 1 9 . 6 1
2 8 . 3 4 7 . 0 3
1 6 . 6 1 5 1 . 9 8 7 1 . 5 9
1 8 . 1 8 2 2 . 6 6 4 0 . 8 4
3 . 6 0 4 . 2 7
2 1 . 7 3 2 9 . 6 0 7 0 . 4 4
.16
. 1 1
.43
. 05
.00
.54
- . 1 4 - . 6 1
9 . 5 9 1 0 . 6 3 2 0 . 2 2
2 8 . 7 0 7 . 0 5
1 6 . 8 4 5 2 . 5 9 7 2 . 8 1
1 8 . 6 8 2 3 . 7 1 4 2 . 3 9
3 . 6 5 4 . 6 5
2 3 . 2 1 3 1 . 5 1 7 3 . 9 0
. 3 9
.09
. 0 6 - . 2 7 - . 0 0
. 27
.82
9 . 4 4 1 0 . 2 9 1 9 . 7 4
2 8 . 3 2 7 . 0 5
1 6 . 6 5 5 2 . 0 2 7 1 . 7 6
1 8 . 3 1 2 3 . 0 6 4 1 . 3 7
3 . 5 8 4 . 4 9
2 2 . 4 6 3 0 . 5 3 7 1 . 8 9
.08
.07
.12
. 0 1
.00
. 0 1
9 . 4 1 1 0 . 6 7 2 0 . 0 8
2 9 . 5 0 6 . 9 9
1 7 . 0 7 5 3 . 5 6 7 3 . 6 4
1 8 . 2 4 2 3 . 6 1 4 1 . 8 5
3 . 7 6 4 . 7 7
2 3 . 5 5 3 2 . 0 8 7 3 . 9 4
.09
.03
.22
.28
.00
.55
9 . 3 2 1 0 . 1 5 1 9 . 4 7
2 9 . 6 6 7 . 1 5
1 7 . 1 4 5 3 . 9 5 7 3 . 4 2
3 . 8 1 4 . 3 1
2 3 . 4 7 3 1 . 5 9 7 2 . 3 1
. 7 1
.00
.27
.27
.00
.17
9 . 4 2 1 0 . 2 2 1 9 . 6 3
3 0 . 0 9 7 . 2 0
1 7 . 0 9 5 4 . 3 8 7 4 . 0 1
1 8 . 4 6 1 8 . 6 9 2 2 . 2 6 2 2 . 8 5 4 0 . 7 2 4 1 . 5 3
.12 .84 .94
3 . 8 3 4 . 3 2
2 2 . 7 5 3 0 . 8 9 7 2 . 4 3
- . 1 8 . 0 0
- . 1 8 - . 4 9 - . 0 0 - . 8 5
- . 7 3
9 . 5 1 9 . 4 2 1 0 . 7 8 1 0 . 4 6 2 0 . 2 9 1 9 . 8 7
3 0 . 3 5 7 . 1 8
1 7 . 2 1 5 4 . 7 4 7 5 . 0 4
NA NA NA NA NA NA NA NA
NA NA NA NA NA NA NA
2 9 . 9 1 7 . 1 3
1 7 . 1 3 5 4 . 1 6 7 4 . 0 3
NA NA NA NA NA NA NA NA
NA NA NA NA NA NA NA
XI Supply includes production of crude oil (including lease condensate), natural gas plant liquids, other hydrogen and hydrocarbons for refinery feedstocks, refinery gains, alcohol, and liquids produced from coal and other sources.
2/ U.S. geographical coverage is the 50 States and the District of Columbia. See Explanatory Note 1 in Appendix B. 3/ The term Demand is used interchangeably with the terms Consumption and Petroleum Products Supplied. See Appendix C for
definition. 4/ Stock draws are positive numbers, stock additions are negative numbers. 5/ This is computed as Total Demand minus the sum of Total Supply and Total Reported Stock Draw.
NA - Not Available. Note: Sum of components may not equal total due to rounding.
Sources: See end of Section 2.
16 Energy Information Administration / International Petroleum Statistics Report March 1998

Table 2.2 World Oil Supply, 1993-1997 (Million Barrels Per Day)
1993 1994 1995 1996 1997
9.60 2.24 4.67 1.48 18.00
1.16 1.51 3.54 .51
1.85 1.36 1.96 .41
8.20 2.16 2.45 1.44 .06
26.61 7.96 2.89 3.16 8.75 49.36 67.36
Annual Average
9.41 2.33 5.38 1.54 18.66
1.18 1.51 3.62 .55
2.02 1.38 1.93 .41
8.12 2.19 2.59 1.46 .06
27.03 7.27 2.94 3.17 9.17
49.59 68.25
9.40 2.45 5.80 1.55 19.20
1.20 1.50 3.64 .56
2.06 1.39 1.99 .44
8.23 2.23 2.75 1.51 .06
27.57 7.14 2.99 3.09 9.86 50.66 69.86
First
9.40 2.42 6.23 1.55 19.59
1.22 1.54 3.71 .55
2.05 1.40 2.18 .50
8.20 2.28 2.96 1.50 .06
28.14 7.07 3.09 3.32 10.06 51.69 71.29
Quarter Second
9.39 2.45 6.09 1.60 19.53
1.24 1.54 3.67 .55
2.06 1.40 2.19 .50
8.14 2.27 2.99 1.50 .06
28.10 7.05 3.14 3.38 10.17 51.83 71.37
Third
9.40 2.51 6.10 1.59 19.61
1.25 1.54 3.71 .55
2.06 1.40 2.17 .51
8.24 2.28 3.07 1.50 .06
28.34 7.03 3.14 3.25 10.21 51.98 71.59
Fourth
9.59 2.59 6.45 1.59 20.22
1.26 1.57 3.65 .66
2.08 1.40 2.22 .53
8.29 2.29 3.19 1.50 .06
28.70 7.05 3.16 3.27 10.41 52.59 72.81
Annual Average
9.44 2.49 6.22 1.58 19.74
1.24 1.55 3.69 .58
2.06 1.40 2.19 .51
8.22 2.28 3.05 1.50 .06
28.32 7.05 3.13 3.31 10.21 52.02 71.76
First
9.41 2.61 6.45 1.61 20.08
1.27 1.59 3.68 1.13 2.09 1.43 2.28 .58
8.40 2.33 3.19 1.47 .06
29.50 6.99 3.22 3.36 10.48 53.56 73.64
Quarter Second
9.32 2.46 6.06 1.63 19.47
1.27 1.56 3.68 1.07 2.06 1.45 2.31 .63
8.55 2.30 3.24 1.49 .06
29.66 7.15 3.24 3.38 10.52 53.95 73.42
Third
9.42 2.58 5.99 1.65 19.63
1.28 1.52 3.62 1.28 2.07 1.45 2.33 .68
8.63 2.32 3.36 1.49 .06
30.09 7.20 3.19 3.49 10.41 54.38 74.01
Fourth
9.51 2.69 6.46 1.64 20.29
1.28 1.52 3.67 1.26 2.11 1.45 2.36 .70
8.67 2.31 3.46 1.50 .06
30.35 7.18 3.15 3.51 10.55 54.74 75.04
Annual Average
9.42 2.58 6.24 1.63 19.87
1.28 1.55 3.66 1.19 2.08 1.45 2.32 .65
8.56 2.32 3.31 1.49 .06
29.91 7.13 3.20 3.44 10.49 54.16 74.03
OECD United Statesl/... Canada North Sea2/ Other OECD Total OECD
Non-OECD OPEC Crude Algeria Indonesia..... Iran Iraq Kuwait Libya Nigeria Qatar Saudi Arabia.. United Arab
Emirates... Venezuela
Natural Gas Plant Liquids
Processing Gain. Total OPEC
Former USSR China Mexico Other Non-OECD.... Total Non-OECD....
Total Supply
XI U.S. geographic coverage is the 50 States and the District of Columbia. 2/ North Sea includes the United Kingdom Offshore, Norway, Denmark, Netherlands Offshore, and Germany Offshore. Notes: 'Supply includes crude oil (including lease condensate), natural gas plant liquids, (except for individual OPEC
countries), other hydrogen and hydrocarbons for refinery feedstocks, alcohol, liquids produced from coal and other sources, and processing gain (except for individual OPEC countries). For OPEC, natural gas plant liquids production and processing gain are shown as separate lines. 'Sum of components may not equal total due to rounding. NA » Not Available. Sources: See end of Section 2.
Energy information Administration / International Petroleum Statistics Report March 1998 17

Table 2.3 Oil Stocks, Bod of Period ut
1993 1994 1995 1996 1997 Year End Quarter Quarter
First Second Third Fourth First Second Third Fourth
OECD United Statesl/ Commercial 1,060 Strategic 587
U. S. Territories 25 Canada 105 Japan. 618 OECD Europe France 158 Germany 309 Italy 163 United Kingdom 118 Other OECD Europe.... 475 Total 1,221
Australia 6 New Zealand 44 Total OECD 3,661
Stocks for Export and Afloat2/ 945
Commercial Floating3/.... 70
1,061 592 26
119 645 158 312 164 115 490
1,240 43
3,726 935 70
971 592 24
109 630 159 301 162 107 499
1,228 47
3,601 980 70
893 589 22
109 627 156 296 153 106 501
1,212 48
3,500 950 70
962 584 23 107 640 160 296 158 104 511
1,229 50
3,597 955 70
977 574 29
113 664 152 295 162 105 515
1,229 54
3,641 960 70
941 566 25
103 651 158 300 152 108 537
1,256 49
3,591 985 70
1 3
1
949 563 23
105 650 160 311 160 109 532 ,272 53
,616 ,010 70
1
1 3
,014 563 27
103 662 153 298 151 111 518 ,231 56
,656 985 70
1
1 3
1
,031 563 27
109 680 157 291 144 106 531 ,230 50
,689 ,030 70
NA NA NA NA NA NA NA NA NA NA NA NA NA NA NA
XI U.S. stock data include Alaskan crude oil in transit by water. These data were previously reported in stocks for export and afloat. U.S. geographic coverage is the 50 States and the District of Columbia. 2/ Stocks held at export terminals of major crude oil producing countries and commercial oil afloat based
on quarterly analysis of world seaborne movements. 3/ Stocks stored by industry in tankers moored offshore. Excludes strategic storage. NA " Not Available. Notes: «Oil Stocks - See Note 2 in Appendix B. 'Sum of components may not equal total due to rounding. Sources: See end of Section 2.
18 Energy Information Administration / International Petroleum Statistics Report March 1998

Table 2 . 4 World O i l Demand, 1993-1997 (Million Barrels Per Day)
1993 1994 Annual Average
1995 1996 1997 Quarter Annual Quarter Annual
First Second Third Fourth Average First Second Third Fourth Average
OECD United Statesl/ 17.24 U. S. Territories .24 Canada 1.69 Japan 5.40 OECD Europe2_/ France 1.88 Italy 1.85 United Kingdom 1.81 Germany3/ 2.90 Other OECD Europe.... 5.08 Total OECD Europe.... 13.52
Australia & New Zealand .88 Total OECD 38.97
Non-OECD China 2.96 Former USSR 5.64 Other Non-OECD 19.48 Total Non-OECD 28.08
Total World Demand 67.04
17.72 . 2 6
1.73 5.67
1.83 1.84 1.84 2.88 5 .21
13.60 . 92
39.89
3.14 4.85
20.43 28.42
17.72 .24
1.76 5.71
1.90 2.05 1.84 2.88 5.45
14.12 . 99
40.54
3.31 4.72
21.62 29.66
18.39 . 2 1
1.81 6.54
2 .01 2.19 1.84 2.93 5.50
14.47 . 96
42.37
3 .51 4.75
22.49 30.75
17.98 . 19
1.73 5.33
1.85 1.92 1.81 2.81 5.29
13.68 .94
39.86
3.56 4.27
22.41 30.25
18.18 .17
1.82 5.48
1.92 2.01 1.82 3.03 5.52
14.29 . 90
40.84
3.60 4.27
21.73 29.60
18.68 . 19
1.84 6.11
1.96 2.12 1.90 2.88 5.76
14.63 . 94
42.39
3.65 4.65
23.21 31.51
18.31 . 19
1.80 5.87
1.93 2.06 1.85 2 .91 5.52
14.27 . 9 3
41.37
3.58 4.49
22.46 30.53
18.24 . 2 0
1.83 6.38
2.03 2.03 1.83 2.76 5 .61
14.25 . 94
41.85
3.76 4.77
23.55 32.08
18.46 . 17
1.83 5.17
1.83 1.95 1.77 3.05 5.56
14.15 . 94
40.72
3 .81 4 .31
23.47 31.59
18.69 . 1 9
1.91 5 .41
1.95 2.00 1.77 3.00 5.67
14.39 . 9 5
41.53
3.83 4.32
22.75 30.89
NA NA NA NA
NA NA NA NA NA NA NA NA
NA NA NA NA
NA NA NA NA
NA NA NA NA NA NA NA NA
NA NA NA NA
68.31 70.19 73.12 70.11 70.44 73.90 71.89 73.94 72.31 72.43 NA NA
XI U.S. geographic coverage is the 50 States and the District of Columbia. 2/ "OECD Europe" consists of Austria, Belgium, Denmark, Finland, France, Germany, Greece, Iceland, Ireland, Italy,
Luxembourg, the Netherlands, Norway, Portugal, Spain, Sweden, Switzerland, Turkey, and the United Kingdom. 3/ Through December 1990, the data for Germany are for the former West Germany only. Beginning with January 1991, the
data for Germany are for the unified Germany, i.e., the former East Germany and West Germany. Notes: 'Oil demand includes bunkers and refinery fuel. The term Demand is used interchangeably with the terms
Consumption and Petroleum Products Supplied. See Appendix C for definition. 'Sum of components may not equal total due to rounding. NA » Not Available. Sources: See end of Section 2.
Energy Information Administration / International Petroleum Statistics Report March 1998 19

Sources for Section 2 (International Oil Balance Data)
Crude Oil Production, Natural Gas Liquids Production, Other Liquids, and Refinery Gain
United States: Energy Information Administration (EIA), Petroleum Supply Annual 1996 and Petroleum Supply Monthly. February 1998.
Other Countries: Annual data — EIA, International Energy Annual, various issues. Monthly data — Canada — Maclean Hunter Publishing Company, Oilweek, various issues. Denmark, Mexico, Netherlands, Norway, Germany, and all OPEC countries - Petroleum and Energy Intelligence Weekly, Inc., Petroleum Intelligence Weekly, various issues. Other Countries -- PennWell Publishing Company, Oil and Gas Journal, various issues. Refinery Gains: National Petroleum Council, U.S. Petroleum Refinery Study, October 1986.
Oil Stocks
United States: EIA, Petroleum Supply Annual 1996 and Petroleum Supply Monthly, February 1998.
Other OECD Countries: • Organization for Economic Cooperation and Development (OECD), Quarterly Oil Statistics and Energy Balances, various issues. • OECD, Monthly Oil Statistics data base, 1990-1997. Stocks for Export and Afloat and Commercial Floating Stocks - Petroleum Economics Limited, Oil Industry Developments, various issues.
Oil Demand
United States: EIA, Petroleum Supply Annual 1996 and Petroleum Supply Monthly. February 1998.
Other OECD Countries: • OECD, Quarterly Oil Statistics and Energy Balances, various issues. • OECD, Monthly Oil Statistics data base, 1990-1997.
OPEC Countries: EIA, International Energy Annual, various issues and Short-Term Energy Outlook, various issues.
Other countries: EIA, International Energy Annual, various issues and Short-Term Energy Outlook, various issues.
Energy Information Administration / International Petroleum Statistics Report March 1998

3. International Oil Imports

Table 3.1 Average Net Oil Imports into OECD Countries, (1996 Average) (Million Barrels per Day)
Total
Total Net Imports.. 21.455 Imports from 0PEC5/ 15.630 Imports from
Persian Gulf 6/ Total 9.215 Bahrain . 035 Iran 1.549 Iraq . 007 Kuwait 1.034 U.A.E 1.474 Qatar .352 Saudi Arabia 4.763 Imports from OPEC-Africa
Total 3.834 Algeria 1.089 Libya 1.204 Nigeria 1.541 Imports from OPEC-South America Total 1.987 Venezuela 1.987 Imports from
OPEC-Far East Total .630 Indonesia. . 630
Total
7.339 6.053
3.171 .001
1.059 .006 .288 .004 .002
1.811
2.644 .746
1.204 .694
.206
.206
.033
.033
United Kingdom
-0.839 .234
.102
.000
.017
.000
.032
.000
.000
.054
.090
.023
.035
.032
.042
.042
.000
.000
OECD
France
1.738 .897
.573
.001
.172
.000
.017
.001
.000
.381
.323
.105
.051
.168
.001
.001
.000
.000
Europe
Germanyl/
2.793 .660
.145
.000
.018
.000
.016
.000
.000
.111
.462
.125
.258
.079
.053
.053
.000
.000
Italy
1.791 1.244
.502
.001
.263
.000
.000
.000
.002
.236
.714
.110
.580
.025
.008
.008
.021
.021
Other Europe2/
1.857 3.018
1.849 .000 .588 .006 .223 .003 .000
1.029
1.054 .383 .281 .389
.103
.103
.012
.012
United States3_/
8.498 4.194
1.594 -.002 .000 .001 .236
-.003 .000
1.363
.872
.256
.000
.616
1.667 1.667
.058
.058
OECD Outi
Canada
-0.803 .261
.111 -.039 .000 .000 .000 -.072
.094
.063
.000
.031
.056
.056
.000
.000
side Europe
Japan
5.790 4.470
4.025 .033 .451 .000 .500
1.396 .335
1.310
.032
.012 -.020
.003
.003
.442
.442
0ther4/
0.632 .653
.313
.003
.000
.000
.010
.077
.016
.207
.192
.012
.000
.180
.054
.054
.097
.097
XI The data for Germany are for the unified Germany, i.e., the former East Germany and West Germany. 2/ "Other Europe" consists of Austria, Belgium, Denmark, Finland, Greece, Iceland, Ireland, Luxembourg, the Netherlands,
Norway, Portugal, Spain, Sweden, Switzerland, and Turkey. 3/ U.S. geographic coverage is the 50 States and District of Columbia. 4/ "Other" consists of Australia, New Zealand, and U. S. Territories. 5/ OPECsOrganization of Petroleum Exporting Countries. See Appendix A for countries in this group. 6/ The Persian Gulf countries are all members of OPEC, except for Bahrain. Notes: 'Imports include crude oil, natural gas liquids, and refined products, and are on a direct basis. «OECD=Organization for
Economic Cooperation and Development. See Appendix A for countries in this group. 'Negative numbers represent net exports. •A dash (-) indicates no trade. 'Zeroes (.000) indicate net imports of less than 0.0005 million barrels per day. 'See Section 4 for annual data.
Sources: See end of Section 3.
22 Energy Information Administration / International Petroleum Statistics Report March 1998

Table 3.2 Net Oil Imports into OECD Countries, (3rd Quarter 1997) (Million Barrels per Day)
OECD Europe OECD Outside Europe Total
United Total Kingdom France Germany!/ Italy
Other Europe2/
United States3/ Canada Japan 0ther4/
Total Net Imports.. 21.992 Imports from 0PEC5/ 16.225 Imports from
Persian Gulf6/ Total 9.733 Bahrain . 019 Iran 1.462 Iraq .215 Kuwait 1.119 U.A.E 1.493 Qatar .361 Saudi Arabia 5.064 Imports from OPEC-Africa
Total 3.771 Algeria 1.023 Libya 1.257 Nigeria 1.490 Imports from OPEC-South America Total 2.156 Venezuela 2.156 Imports from OPEC-Far East Total 584 Indonesia . 584
7.638 6.233
3.517 .000
1.022 .159 .304 .013 .000
2.019
2.464 .658
1.257 .549
.231
.231
.021
.021
-0 .821 .233
.110
.000
.000
.000
.028
.000
.000
.082
.090
.018
.062
.010
.034
.034
.000
.000
1.715 .965
.712
.000
.166
.065
.045
.000
.000
.436
.253
.118
.068
.068
.000
.000
.000
.000
2.857 .658
.176
.000
.025
.000
.013
.002
.000
.135
.423
.081
.264
.078
.059
.059
.000
.000
1.708 1.344
.606
.000
.254
.027
.000
.000
.000
.324
.697
.078
.599
.020
.027
.027
.013
.013
2.179 3.032
1.914 .000 .576 .066 .218 .012 .000
1.041
1.001 .364 .264 .373
.110
.110
.008
.008
8.990 4.563
1.804 -.003 .000 .030 .294 .000 .000
1.484
1.012 .270 .000 .741
1.688 1.688
.056
.056
-0.783 .343
.112
.021
.023
.000
.000
.068
.100
.067
.000
.032
.131
.131
.000
.000
5.646 4.433
3.979 .016 .419 .000 .520
1.407 .352
1.266
.066
.027
.039
.000
.000
.404
.404
0.501 .652
.320
.006
.000
.003
.002
.073
.009
.227
.129
.000
.000
.129
.106
.106
,103 ,103
XI The data for Germany are for the unified Germany, i.e., the former East Germany and West Germany. 2/ "Other Europe" consists of Austria, Belgium, Denmark, Finland, Greece, Iceland, Ireland, Luxembourg, the Netherlands,
Norway, Portugal, Spain, Sweden, Switzerland, and Turkey. 3/ U.S. geographic coverage is the 50 States and District of Columbia. 4/ "Other" consists of Australia, New Zealand, and U. S. Territories. 5/ OPEC-Organization of Petroleum Exporting Countries. See Appendix A for countries in this group. 6/ The Persian Gulf countries are all members of OPEC, except for Bahrain. Notes: 'Imports include crude oil, natural gas liquids, and refined products, and are on a direct basis. *OECD-Organization for
Economic Cooperation and Development. See Appendix A for countries in this group. 'Negative numbers represent net exports. •A dash (-) indicates no trade. 'Zeroes (.000) indicate net imports of less than 0.0005 million barrels per day. 'See Section 4 for annual data.
Sources: See end of Section 3.
Energy Information Administration / international Petroleum Statistics Report March 1998 23

Table 3.3 Net Oi l Imports i n t o OECD Countr ies , (2nd Quarter 1997) (Million Barrels per Day)
Total
Total Net Imports.. 21.573 Imports from 0PEC5/ 15.942 Imports from
Persian Gulf6/ Total 9.501 Bahrain . 028 Iran 1.392 Iraq 445 Kuwait 1.014 U.A.E 1.425 Qatar . 347 Saudi Arabia 4.850 Imports from OPEC-Africa Total 3.665 Algeria .978 Libya 1.246 Nigeria 1.441 Imports from OPEC-South America
Total 2.241 Venezuela 2.241 Imports from OPEC-Far East Total . 563 Indonesia . 563
Total
7.001 5.810
3.328 .000
1.001 .305 .235 .003 .000
1.784
2.218 .595
1.246 .376
.253
.253
.011
.011
United Kingdom
-0.614 .198
.103
.000
.000
.000
.028
.000
.000
.075
.062
.022
.040
.000
.033
.033
.000
.000
OECD Europe
France
1.626 .792
.572
.000
.129
.080
.001
.000
.000
.362
.220
.125
.077
.018
.000
.000
.000
.000
Germanyl/
2.800 .644
.178
.000
.027
.000
.014
.002
.000
.134
.413
.077
.254
.082
.053
.053
.000
.000
Italy
1.599 1.278
.545
.000
.257
.017
.000
.000
.000
.271
.718
.100
.596
.022
.005
.005
.010
.010
Other Europe2_/
1.590 2.897
1.931 .000 .587 .209 .192 .000 .000 .942
.805
.270
.279
.255
.162
.162
.000
.000
United States3_/
9.324 4.734
1.773 .000 .000 .095 .230
-.007 .005
1.450
1.132 .319 .000 .812
1.769 1.769
.060
.060
OECD Out)
Canada
-0.761 .233
.135 -.065 .000 .000 .000 -.070
.023
.023
.000
.000
.074
.074
.000
.000
side Euros
Japan
5.374 4.329
3.939 .028 .327 .040 .542
1.322 .330
1.350
.054
.034 -.019
.000
.000
.364
.364
>e
0ther4/
0.635 .836
.325
.000
.000
.003
.007
.107
.012
.195
.239
.006
.000
.233
.145
.145
.127
.127
XI The data for Germany are for unified Germany, i.e., the former East Germany and West Germany. 2/ "Other Europe" consists of Austria, Belgium, Denmark, Finland, Greece, Iceland, Ireland, Luxembourg, the Netherlands,
Norway, Portugal, Spain, Sweden, Switzerland, and Turkey. 3/ U.S. geographic coverage is the 50 States and District of Columbia. 4/ "Other" consists of Australia, New Zealand, and U. S. Territories. 5/ OPEC-Organization of Petroleum Exporting Countries. See Appendix A for countries in this group. 6/ The Persian Gulf countries are all members of OPEC, except for Bahrain. Notes: 'Imports include crude oil, natural gas liquids, and refined products, and are on a direct basis. 'OECD>Organization for
Economic Cooperation and Development. See Appendix A for countries in this group. 'Negative numbers represent net exports. •A dash (-) indicates no trade. 'Zeroes (.000) indicate net imports of less than 0.0005 million barrels per day. 'See Section 4 for annual data.
Sources: See end of Section 3.
24 Energy Information Administration / International Petroleum Statistics Report March 1998

Table 3 .4 OECD T o t a l Net Impor t s (Most Recent 12 Months) (Mi l l ion B a r r e l s p e r Day)
1996 1997
Dec J a n F eb Mar Apr i l May June J u l y August Sept Oct Nov
To t a l 21.757 United S t a t e s l / . . . . 8.404 Canada - . 981 OECD Europe2/ 7.710 Main European Impor te r s
France 1.804 Germany3/ 2.805 Italy 1.911 Spain 1.252 Netherlands .801
European Net Exporters Norway -3.108 United Kingdom.... -.995 Smaller European Importers Austria .215 Belgium........... .665 Denmark -.030 Ireland . 143 Finland .255 Greece . 355 Iceland .008 Luxembourg .038 Portugal . 222 Sweden .449 Switzerland .290 Turkey .630
Japan 6.013 Other OECD . 610
23.010 8.595 - .752 8.183
1.919 2.939 2.036 1.239
.765
-3.157 - .952
.206
.727 - .005
.140
.243
.411
.018
.039
.374
.363
.236
.640 6.196
.788
21.897 8.460 - .919 7.219
1.892 2.665 1.853 1.284
.747
-3.182 - .856
.220
.510
.062
.139
.147
.353
.010
.046
.217
.332
.270
.509 6.531
.605
21.350 8.780 - .724 6.460
1.586 2.626 1.690 1.124
.633
-3 .331 - .810
.178
.661 - .034
.093
.109
.335
.020
.043
.315
.440
.259
.521 6.298
.536
21.383 8.997 - .724 6.478
1.633 2.729 1.359 1.253
.977
-3.642 - .795
.217
.569 - .062
.165
.136
.332
.007
.040
.291
.423
.250
.596 5.995
.637
21 9 -7
1 2 1 1
- 3 -
5
.866
.565
.796
.245
.766
.963
.794
.216
.609
.301
.661
.223
.556
.017
.104
.187
.316
.022
.038
.257
.344
.269
.527
.218
.633
21.461 9.402 - .763 7.273
1.475 2.703 1.638 1.132
.795
-2 .931 - .385
.199
.521 - . 015
.134
.180
.335
.012
.036
.285
.319
.293
.545 4.914
.635
21.870 8.691 - .625 7.748
1.785 3.129 1.666 1.443
.751
-3 .353 - .768
.248
.523 - .026
.129
.217
.368
.020
.039
.289
.328
.301
.659 5.573
.482
21.910 9.081 - . 846 7.542
1.695 2.674 1.662 1.225
.995
- 2 . 7 3 1 - . 9 5 1
.159
.629
.014
.096
.112
.419
.020
.037
.217
.347
.294
.630 5.576
.556
22 9 -7
1 2 1 1
- 3 -
5
.202
.204
.881
.623
.663
.766
.800
.334
.752
.228
.742
.249
.547
.022
.162
.210
.321
.023
.037
.349
.394
.287
.677
.792
.463
22.725 9.347 - . 7 1 9 7.893
1.977 2 .711 1.882 1.331
.587
-2 .810 -1 .027
.226
.579
.016
.160
.243
.419
.023
.042
.304
.347
.269
.613 5.759
.445
22.438 8.705 - . 838 8.132
1.865 2.822 2.047 1.335
.754
-3 .149 - . 8 7 5
.218
.530
.009
.123
.157
.438
.014
.039
.381
.536
.244
.645 5.911
.528
XI U.S. geographic coverage is the 50 States and District of Columbia. 2/ "OECD Europe" consists of Austria, Belgium, Denmark, Finland, France, Germany, Greece, Iceland, Ireland, Italy,
Luxembourg, the Netherlands, Norway, Portugal, Spain, Sweden, Switzerland, Turkey, and the United Kingdom. 3/ The data for Germany are for the unified Germany, i.e., the former East Germany and West Germany. Notes: 'Imports include crude oil, natural gas liquids, and refined products, and are on a direct basis. «OECD»Organization
for Economic Cooperation and Development. See Appendix A for countries in this group. 'Negative numbers represent net exports. •A dash (-) indicates no trade. 'Zeroes (.000) indicate net imports of less than 0.0005 million barrels per day. 'See Section 4 for annual data.
Sources: See end of Section 3.
Energy Information Administration / International Petroleum Statistics Report March 1998 25

Table 3.5 OECD Imports from OPEC (Most Recent 12 Months) inxx-Lxoo mnviti per Say)
1996 1997
Dec Jan Feb Mar April May June July August Sept Oct Nov
Total 15.893 United Statesl/.... 3.920 Canada . 323 OECD Europe2/ 6.213 Main European Importers France .888 Germany!/ . 645 Italy 1.372 Spain . 864 Netherlands .911
European Net Exporters Norway . 000 United Kingdom.... .188 Smaller European Importers Austria .000 Belgium .238 Denmark . 044 Ireland . 000 Finland . 000 Greece . 297 Portugal . 145 Sweden .105 Switzerland . 079 Turkey .436
Japan 4.620 Other OECD .817
16.623 4.066
.313 6.398
.820
.605 1.429
.960
.744
.009
.179
.000
.298
.025
.000
.000
.362
.197
.145
.103
.522 5.026
.820
16.233 4.109
.364 5.994
1.095 .618
1.281 .773 .620
.007
.215
.000
.223
.052
.000
.000
.293
.168
.104
.109
.435 5.137
.629
15.848 4.251
.274 5.446
.809
.660 1.270
.630
.598
.000
.176
.000
.157
.000
.000
.000
.275
.220
.150
.097
.404 5.236
.642
16.289 4.538
.201 5.811
.802
.668 1.142
.707
.948
.000
.176
.000
.290
.025
.000
.000
.284
.142
.127
.063
.436 4.839
.900
16.023 4.886
.241 6.004
.753
.683 1.484
.703
.787
.000
.199
.000
.315
.049
.000
.010
.286
.180
.093
.087
.377 4.175
.717
15.511 4.774
.255 5.608
.824
.581 1.202
.693
.699
.000
.219
.000
.309
.033
.000
.000
.294
.179
.092
.093
.390 3.977
.896
15.691 4.273
.293 6.146
1.020 .656
1.379 .764 .760
.000
.271
.000
.244
.006
.000
.000
.300
.177
.067
.094
.409 4.357
.621
16.334 4 .691
.457 6.134
.797
.682 1.276
.722
.927
.000
.190
.000
.326
.027
.000
.000
.333
.156
.089
.101
.508 4.416
.636
16.663 4.730
.279 6.425
1.084 .636
1.379 .864 .744
.000
.239
.000
.352
.067
.000
.008
.299
.206
.025
.107
.415 4.527
.702
17.060 4.800
.409 6.461
1.131 .649
1.353 .820 .810
.007
.170
.000
.351
.024
.000
.007
.360
.135
.086
.111
.447 4.775
.615
16.596 4.277
.285 6.472
.846
.647 1.491
.794
.823
.008
.219
.000
.346
.049
.000
.007
.302
.161
.170
.098
.509 4.801
.762
XI U.S. geographic coverage is the 50 States and District of Columbia. 2/ "OECD Europe" consists of Austria, Belgium, Denmark, Finland, France, Germany, Greece, Iceland, Ireland, Italy,
Luxembourg, the Netherlands, Norway, Portugal, Spain, Sweden, Switzerland, Turkey, and the United Kingdom. 3/ The data for Germany are for the unified Germany, i.e., the former East Germany and West Germany. Notes: 'Imports include crude oil, natural gas liquids, and refined products, and are on a direct basis. *OECD»Organization
for Economic Cooperation and Development; OPEC»Organization of Petroleum Exporting Countries. See Appendix A for countries in these groups. 'Negative numbers represent net exports. «A dash (-) indicates no trade. • Zeroes (.000) indicate net imports of less than 0.0005 million barrels per day. 'See Section 4 for annual data. Sources: See end of Section 3.
26 Energy Information Administration / International Petroleum statistics Report March 1998

Table 3.6 OECD Imports from Pers ian Gulf (Most Recent 12 Months) (Mi l l ion B a r r e l s p e r Day)
1996 1997
Dec J a n F e b Mar Apr i l May June J u l y August Sept Oct Nov
Tota l 9.622 United S t a t e s l / . . . . 1.673 Canada . 128 OECD Europe2/ 3.133 Main European Importers France .569 Germany3/ . 106 Italy .532 Spain .288 Netherlands . 661 European Net Exporters Norway . 000 United Kingdom.... .067 Smaller European Importers Austria .000 Belgium . 219 Denmark.. .000 Finland . 000 Greece . 245 Portugal . 100 Sweden . 061 Switzerland .000 Turkey .286 Japan 4.219 Other OECD .469
9.986 1.548
.130 3.322
.535
.088
.550
.340
.568
.000
.066
.000
.250
.000
.000
.317
.091
.132
.000
.385 4.616
.369
9.914 1.533
.144 3.159
.753
.094
.589
.301
.499
.000
.059
.000
.191
.000
.000
.250
.057
.074
.005
.287 4.750
.328
9.569 1.625
.067 2.857
.404
.131
.507
.355
.456
.000
.084
.000
.119
.000
.000
.232
.164
.132
.005
.267 4.705
.315
10.003 1.858
.133 3.223
.599
.189
.458
.388
.569
.000
.078
.000
.233
.000
.000
.251
.052
.070
.010
.327 4.499
.291
9.565 1.701
.137 3.584
.555
.153
.646
.413
.642
.000
.107
.000
.285
.000
.000
.254
.161
.064
.014
.289 3.816
.327
8.931 1.763
.136 3.169
.563
.192
.526
.287
.515
.000
.124
.000
.250
.000
.000
.243
.138
.067
.014
.249 3.505
.357
9.330 1.712
.066 3.277
.640
.176
.618
.318
.539
.000
.123
.000
.228
.000
.000
.266
.062
.067
.009
.231 3.884
.392
9.871 1.836
.198 3.599
.644
.187
.571
.358
.640
.000
.091
.000
.292
.000
.000
.288
.087
.065
.009
.365 3.955
.282
10.006 1.867
.071 3.681
.857
.164
.629
.425
.467
.000
.115
.000
.331
.023
.000
.262
.119
.000
.005
.282 4.103
.284
10.683 1.876
.168 3.889
.842
.205
.645
.411
.670
.000
.081
.000
.331
.000
.000
.328
.051
.066
.014
.244 4.518
.233
10.028 1.682
.065 3.512
.525
.155
.603
.336
.588
.000
.129
.000
.331
.000
.000
.270
.088
.136
.005
.348 4.517
.253
XI U.S. geographic coverage is the 50 States and District of Columbia. 2/ "OECD Europe" consists of Austria, Belgium, Denmark, Finland, France, Germany, Greece, Iceland, Ireland, Italy,
Luxembourg, the Netherlands, Norway, Portugal, Spain, Sweden, Switzerland, Turkey, and the United Kingdom. 3/ The data for Germany are for the unified Germany, i.e., the former East Germany and West Germany. Notes: 'Imports include crude oil, natural gas liquids, and refined products, and are on a direct basis. *OECDK>rganization
for Economic Cooperation and Development. See Appendix A for countries in this group. •"Persian Gulf" consists of Bahrain, Iran, Iraq, Kuwait, Qatar, Saudi Arabia, and the United Arab Emirates. 'Negative numbers represent net exports. •A dash (-) indicates no trade. 'Zeroes (.000) indicate net imports of less than 0.0005 million barrels per day. 'See Section 4 for annual data. Sources: See end of Section 3.
Energy Information Administration / International Petroleum Statistics Report March 1998 27

Table 3.7 United States—Net Oi l Imports (Most Recent 12 Months) (Million Barrels per Day)
1996 1997
Dec Jan Feb Mar April May June July August Sept Oct Nov
Total Net Imports.. imports from 0PEC1/ Imports from Persian Gulf2/
Total Bahrain Iran Iraq Kuwait U.A.E Qatar Saudi Arabia Imports from OPEC-Africa
Total Algeria Libya Nigeria Imports from OPEC-South America
Total Venezuela Imports from OPEC-Far East
Total Indonesia
8.404 3.920
1.673 .000 .000 .014 .262
-.003 .000
1.400
.534
.214
.000
.320
1.635 1.635
.078
.078
8.595 4.066
1.548 -.003 .000 .000 .209 .000 .000
1.342
.813
.282
.000
.531
1.629 1.629
.073
.073
8.460 4.109
1.533 .000 .000 .000 .172 .000 .000
1.361
.943
.319
.000
.624
1.584 1.584
.049
.049
8.780 4.251
1.625 -.003 .000 .035 .315
-.014 .000
1.292
.867
.309
.000
.558
1.738 1.738
.018
.018
8.997 4.538
1.858 .000 .000 .069 .204
-.003 .015
1.573
1.025 .320 .000 .705
1.615 1.615
.040
.040
9.565 4.886
1.701 .000 .000 .102 .128
-.003 .000
1.474
1.249 .290 .000 .959
1.850 1.850
.086
.086
9.402 4.774
1.763 .000 .000 .115 .361
-.016 .000
1.303
1.117 .349 .000 .768
1.840 1.840
.054
.054
8.691 4.273
1.712 -.003 .000 .088 .331 .011 .000
1.285
.871
.291
.000
.580
1.614 1.614
.073
.073
9.081 4.691
1.836 -.003 .000 .000 .229
-.009 .000
1.619
1.143 .261 .000 .882
1.695 1.695
.014
.014
9.204 4.730
1.867 -.003 .000 .000 .322
-.003 .000
1.551
1.022 .259 .000 .763
1.756 1.756
.082
.082
9.347 4.800
1.876 -.003 .000 .177 .349
-.002 .016
1.339
.949
.272
.000
.677
1.930 1.930
.042
.042
8.705 4.277
1.682 .000 .000 .220 .220
-.003 .000
1.245
.891
.267
.000
.624
1.628 1.628
.076
.076
XI OPEC-Organization of Petroleum Exporting Countries. See Appendix A for countries in this group. 2/ The Persian Gulf countries are all members of OPEC, except for Bahrain. Notes: 'Imports include crude oil, natural gas liquids, and refined products, and are on a direct basis. 'U.S. geographic
coverage is the 50 States and District of Columbia. 'Negative numbers represent net exports. *A dash (-) indicates no trade. • Zeroes (.000) indicate net imports of less than 0.0005 million barrels per day. 'See Section 4 for annual data. Sources: See end of Section 3.
28 Energy Information Administration / International Petroleum Statistics Report March 1998

Table 3.8 Japan—Net Oil Imports (Most Recent 12 Months) (Million Barrels per Day)
1996 1997
Dec Jan Feb Mar April May June July August Sept Oct Nov
Total Net Imports.. Imports from OPEC1/ Imports from Persian Gulf2/
Total Bahrain Iran Iraq Kuwait U.A.E Qatar Saudi Arabia
Imports from OPEC-Africa
Total Algeria Nigeria Imports from OPEC-South America Total Venezuela Imports from OPEC-Far East Total Indonesia
6.013 4.620
4.219 .053 .456 .000 .519
1.419 .276
1.496
.000
.000
.000
.014
.014
.439
.439
6.196 5.026
4.616 .037 .465 .000 .642
1.706 .239
1.527
.033
.000
.033
.019
.019
.395
.395
6.531 5.137
4.750 .009 .742 .067 .571
1.449 .402
1.510
.000
.000
.000
.000
.000
.397
.397
6.298 5.236
4.705 .029 .669 .000 .548
1.488 .397
1.574
.000
.000
.000
.011
.011
.549
.549
5.995 4.839
4.499 .045 .316 .061 .640
1.570 .349
1.516
.016
.016
.000
.000
.000
.369
.369
5.218 4.175
3.816 .031 .409 .059 .464
1.220 .350
1.284
.046
.046
.000
.000
.000
.344
.344
4.914 3.977
3.505 .008 .253 .000 .523
1.180 .291
1.251
.100
.041
.059
.000
.000
.380
.380
5.573 4.357
3.884 .011 .469 .000 .471
1.368 .320
1.245
.079
.019
.060
.000
.000
.405
.405
5.576 4.416
3.955 .008 .322 .000 .515
1.422 .417
1.271
.038
.038
.000
.000
.000
.432
.432
5.792 4.527
4.103 .031 .467 .000 .575
1.430 .318
1.282
.081
.024
.057
.000
.000
.373
.373
5.759 4.775
4.518 .014 .401 .000 .541
1.390 .426
1.745
.000
.000
.000
.000
.000
.272
.272
5.911 4.801
4.517 .014 .505 .000 .539
1.585 .414
1.459
.000
.000
.000
.000
.000
.298
.298
XI OPEC-Organization of Petroleum Exporting Countries. See Appendix A for countries in this group. 2/ The Persian Gulf countries are all members of OPEC, except for Bahrain. Notes: 'Imports include crude oil, natural gas liquids, and refined products, and are on a direct basis.
•Negative numbers represent net exports. *A dash (-) indicates no trade. 'Zeroes (.000) indicate net imports of less than 0.0005 million barrels per day. 'See Section 4 for annual data.
Sources: See end of Section 3.
Energy Information Administration / International Petroleum Statistics Report March 1998 29

Table 3.9 OECD Europe—Net Oi l Imports (Most Recent 12 Months) (Million Barrels per Day)
1996 1997
Dec Jan Feb Mar April May June July August Sept Oct Nov
Total Net Imports.. Imports from OPEC1/ Imports from Persian Gulf2/ Total Bahrain Iran Iraq Kuwait U.A.E Qatar Saudi Arabia Imports from OPEC-Africa Total Algeria Libya Nigeria Imports from OPEC-South America Total Venezuela Imports from OPEC-Far East
Total Indonesia
7.710 6.213
3.133 .000 .957 .065 .218 .004 .000
1.889
2.898 .749
1.243 .906
.162
.162
.021
.021
8.183 6.398
3.322 .003 .866 .308 .309 .001 .000
1.835
2.915 .807
1.303 .806
.147
.147
.017
.017
7.219 5.994
3.159 .002 .754 .342 .322 .000 .000
1.738
2.614 .660
1.179 .776
.204
.204
.019
.019
6.460 5.446
2.857 .000 .813 .344 .222 .002 .000
1.475
2.457 .641
1.271 .545
.132
.132
.000
.000
6.478 5.811
3.223 .000 .875 .404 .217 .003 .000
1.723
2.264 .694
1.109 .461
.324
.324
.000
.000
7.245 6.004
3.584 .000
1.157 .471 .248 .002 .000
1.705
2.187 .551
1.295 .341
.208
.208
.026
.026
7.273 5.608
3.169 .000 .964 .036 .240 .002 .000
1.927
2.204 .542
1.333 .328
.229
.229
.006
.006
7.748 6.146
3.277 .000 .899 .000 .286 .036 .000
2.057
2.639 .696
1.289 .654
.220
.220
.011
.011
7.542 6.134
3.599 .001
1.153 .151 .247 .003 .000
2.043
2.283 .683
1.246 .354
.236
.236
.017
.017
7.623 6.425
3.681 .000
1.013 .330 .382 .001 .000
1.954
2.471 .594
1.235 .642
.236
.236
.037
.037
7.893 6.461
3.889 .000
1.057 .394 .237 .005 .000
2.195
2.401 .555
1.206 .640
.168
.168
.003
.003
8.132 6.472
3.512 .001 .960 .094 .301 .000 .000
2.156
2.750 .754
1.238 .757
.178
.178
.032
.032
1/ OPEC-Organization of Petroleum Exporting Countries. See Appendix A for countries in this group. 2/ The Persian Gulf countries are all members of OPEC, except for Bahrain. Notes: 'Imports include crude oil, natural gas liquids, and refined products, and are on a direct basis. ."OECD Europe"
consists of Austria, Belgium, Denmark, Finland, France, Germany, Greece, Iceland, Ireland, Italy, Luxembourg, the Netherlands, Norway, Portugal, Spain, Sweden, Switzerland, Turkey, and the United Kingdom. 'Negative numbers represent net exports. •A dash (-) indicates no trade. 'Zeroes (.000) indicate net imports of less than 0.0005 million barrels per day. •See Section 4 for annual data. Sources: See end of Section 3.
30 Energy Information Administration / International Petroleum Statistics Report March 1998

Table 3.10 France—Net Oil Imports (Most Recent 12 Months) (Million Barrels per Day)
1996 1997
Dec Jan Feb Mar April May June July August Sept Oct Nov
Total Net Imports.. Imports from OPEC1/ Imports from Persian Gulf2/ Total Bahrain Iran Iraq. Kuwait U.A.E Qatar Saudi Arabia Imports from OPEC-Africa Total Algeria Libya Nigeria Imports from OPEC-South America Total Venezuela Imports from OPEC-Far East Total Indonesia
1.804 .888
.569
.000
.123
.000
.000
.001
.000
.444
.319
.068
.068
.183
.000
.000
.000
.000
1.919 .820
.535
.000
.061
.065
.002
.000
.000
.407
.285
.177
.014
.094
.000
.000
.000
.000
1.892 1.095
.753
.000
.122
.159
.070
.000
.000
.401
.342
.216
.044
.083
.000
.000
.000
.000
1.586 .809
.404
.000
.107
.102
.002
.000
.000
.194
.405
.187
.063
.154
.000
.000
.000
.000
1.633 .802
.599
.000
.153
.082
.003
.000
.000
.361
.204
.124
.080
.000
.000
.000
.000
.000
1.766 .753
.555
.000
.102
.154
.000
.000
.000
.299
.196
.115
.051
.030
.000
.000
.001
.001
1.475 .824
.563
.000
.131
.002
.000
.000
.000
.429
.261
.138
.102
.022
.000
.000
.000
.000
1.785 1.020
.640
.000
.127
.000
.063
.000
.000
.450
.379
.195
.110
.074
.000
.000
.000
.000
1.695 .797
.644
.001
.206
.064
.003
.000
.000
.370
.153
.091
.027
.035
.000
.000
.000
.000
1.663 1.084
.857
.000
.166
.133
.069
.000
.000
.489
.227
.065
.066
.096
.000
.000
.000
.000
1.977 1.131
.842
.000
.172
.149
.000
.000
.000
.521
.288
.060
.058
.170
.000
.000
.000
.000
1.865 .846
.525
.001
.104
.033
.000
.000
.000
.388
.321
.116
.060
.146
.000
.000
.000
.000
XI OPEC»Organization of Petroleum Exporting Countries. See Appendix A for countries in this group. 2/ The Persian Gulf countries are all members of OPEC, except for Bahrain. Notes: 'Imports include crude oil, natural gas liquids, and refined products, and are on a direct basis. 'Negative numbers
represent net exports. «A dash (-) indicates no trade. 'Zeroes (.000) indicate net imports of less than 0.0005 million barrels per day. 'See Section 4 for annual data. Sources: See end of Section 3.
Energy Information Administration / International Petroleum Statistics Report March 1998 31

Table 3.11 Germany—Net Oil Imports (Most Recent 12 Months) f 1*4 1 H rm Barrels per Day)
1996 1997
Dec Jan Feb Mar April May June July August Sept Oct Nov
Total Net Imports.. Imports from OPEC1/ Imports from Persian Gulf2/ Total Bahrain Iran Iraq Kuwait U.A.E Qatar Saudi Arabia Imports from OPEC-Africa Total Algeria Libya Nigeria Imports from OPEC-South America Total Venezuela Imports from OPEC-Far East Total Indonesia
2.805 .645
.106
.000
.000
.000
.011
.000
.000
.094
.511
.139
.250
.121
.029
.029
.000
.000
2.939 .605
.088
.000
.012
.000
.009
.000
.000
.068
.503
.108
.276
.118
.014
.014
.000
.000
2.665 .618
.094
.000
.011
.000
.009
.000
.000
.074
.505
.100
.216
.189
.018
.018
.000
.000
2.626 .660
.131
.000
.028
.000
.010
.000
.000
.094
.485
.108
.256
.121
.043
.043
.000
.000
2.729 .668
.189
.000
.029
.000
.020
.002
.000
.137
.416
.108
.182
.126
.064
.064
.000
.000
2.963 .683
.153
.000
.016
.000
.009
.002
.000
.125
.470
.054
.318
.097
.059
.059
.001
.001
2.703 .581
.192
.000
.037
.000
.013
.002
.000
.140
.352
.070
.261
.021
.037
.037
.000
.000
3.129 .656
.176
.000
.022
.000
.014
.005
.000
.135
.378
.061
.252
.066
.101
.101
.001
.001
2.674 .682
.187
.000
.037
.000
.009
.000
.000
.141
.459
.092
.273
.095
.036
.036
.000
.000
2.766 .636
.164
.000
.017
.000
.016
.000
.000
.130
.431
.091
.267
.073
.041
.041
.000
.000
2.711 .649
.205
.000
.041
.000
.012
.000
.000
.152
.401
.106
.215
.080
.043
.043
.000
.000
2.822 .647
.155
.000
.019
.009
.014
.000
.000
.113
.449
.087
.261
.102
.043
.043
.000
.000
XI OPEC-Organization of Petroleum Exporting Countries. See Appendix A for countries in this group. 2/ The Persian Gulf countries are all members of OPEC, except for Bahrain. Notes: 'Imports include crude oil, natural gas liquids, and refined products, and are on a direct basis. 'The data for Germany
are for the unified Germany, i.e., the former East Germany and West Germany. 'Negative numbers represent net exports. •A dash (-) indicates no trade. 'Zeroes (.000) indicate net imports of less than 0.0005 million barrels per day. 'See Section 4 for annual data. Sources: See end of Section 3.
32 Energy Information Administration / International Petroleum statistics Report March 1998

Table 3.12 Italy—Net Oil Imports (Most Recent 12 Months) (Million Barrels per Day)
1996 1997
Dec Jan Feb Mar April May June July August Sept Oct Nov
Total Net Imports.. Imports from 0PEC1/ Imports from Persian Gulf2/
Imports from OPEC-Africa
Imports from OPEC-South America Total Imports from OPEC-Far East Total
1.911 1.372
.532
.000
.238
.000
.000
.000
.000
.294
.820
.122
.637
.061
.000
.000
.021
.021
2.036 1.429
.550
.003
.241
.048
.000
.000
.000
.258
.848
.110
.632
.105
.017
.017
.017
.017
1.853 1.281
.589
.002
.249
.000
.000
.000
.000
.338
.672
.084
.524
.065
.004
.004
.018
.018
1.690 1.270
.507
.000
.250
.032
.000
.002
.000
.223
.756
.073
.617
.066
.007
.007
.000
.000
1.359 1.142
.458
.000
.147
.000
.000
.000
.000
.311
.669
.141
.492
.036
.016
.016
.000
.000
1.794 1.484
.646
.000
.365
.049
.000
.000
.000
.232
.814
.101
.684
.029
.000
.000
.024
.024
1.638 1.202
.526
.000
.256
.000
.000
.000
.000
.270
.669
.059
.610
.000
.000
.000
.006
.006
1.666 1.379
.618
.000
.232
.000
.000
.000
.000
.386
.699
.058
.612
.030
.051
.051
.010
.010
1.662 1.276
.571
.000
.259
.021
.000
.000
.000
.291
.670
.073
.597
.000
.018
.018
.017
.017
1.800 1.379
.629
.000
.272
.062
.000
.000
.000
.295
.723
.104
.588
.031
.013
.013
.013
.013
1.882 1.353
.645
.000
.261
.095
.001
.000
.000
.288
.705
.056
.600
.048
.000
.000
.003
.003
2.047 1.491
.603
.000
.242
.022
.000
.000
.000
.338
.850
.128
.611
.111
.006
.006
.032
.032
XI OPEC-Organization of Petroleum Exporting Countries. See Appendix A for countries in this group. 2/ The Persian Gulf countries are all members of OPEC, except for Bahrain. Notes: 'Imports include crude oil, natural gas liquids, and refined products, and are on a direct basis. 'Negative numbers
represent net exports. *A dash (-) indicates no trade. 'Zeroes (.000) indicate net imports of less than 0.0005 million barrels per day. 'See Section 4 for annual data. Sources: See end of Section 3.
Energy Information Administration / International Petroleum Statistics Report March 1998 33

Table 3.13 OECD Imports from I r aq (Most Recent 12 Months) ( M i l l i o n B a r r e l s p e r Day fo r Crude O i l , Na tu ra l Gas Liquids and Refined Products )
1996 1997
Dec J a n Feb Mar Apr i l May June J u l y August Sept Oct Nov
T o t a l 0.080 Uni ted S t a t e s l / . . . . .014 Canada .000 OECD Europe2/ . 065 Main European Importers France . 000 Germany3/ .000 Italy .000 Spain . 029 Netherlands .000
European Net Exporters United Kingdom.... .000 Smaller European Importers Austria .000 Belgium . 000 Denmark . 000 Greece . 000 Portugal . 000 Sweden . 000 Switzerland . 000 Turkey . 037 Japan. . 000 Other OECD . 000
0.308 .000 .000 .308
.065
.000
.048
.094
.006
.000
.000
.020
.000
.011
.000
.000
.000
.064
.000
.000
0.409 .000 .000 .342
.159
.000
.000
.021
.000
.000
.000
.029
.000
.000
.000
.000
.000
.133
.067
.000
0.380 .035 .000 .344
.102
.000
.032
.097
.000
.000
.000
.008
.000
.000
.034
.000
.000
.071
.000
.001
0.537 .069 .000 .404
.082
.000
.000
.131
.094
.000
.000
.014
.000
.000
.000
.000
.010
.074
.061
.003
0.636 .102 .000 .471
.154
.000
.049
.066
.031
.000
.000
.053
.000
.000
.031
.000
.005
.081
.059
.004
0.155 .115 .000 .036
.002
.000
.000
.033
.000
.000
.000
.000
.000
.000
.000
.000
.000
.000
.000
.004
0.097 .088 .000 .000
.000
.000
.000
.000
.000
.000
.000
.000
.000
.000
.000
.000
.000
.000
.000
.009
0.152 .000 .000 .151
.064
.000
.021
.066
.000
.000
.000
.000
.000
.000
.000
.000
.000
.000
.000
.000
0.401 .000 .071 .330
.133
.000
.062
.135
.000
.000
.000
.000
.000
.000
.000
.000
.000
.000
.000
.000
0.610 .177 .033 .394
.149
.000
.095
.150
.000
.000
.000
.000
.000
.000
.000
.000
.000
.000
.000
.006
0.386 .220 .065 .094
.033
.009
.022
.030
.000
.000
.000
.000
.000
.000
.000
.000
.000
.000
.000
.007
XI U.S. geographic coverage is the 50 States and District of Columbia. 2/ "OECD Europe" consists of Austria, Belgium, Denmark, Finland, France, Greece, Iceland, Ireland, Italy,
Luxembourg, the Netherlands, Norway, Portugal, Spain, Sweden, Switzerland, Turkey, the United Kingdom, and Germany. 3/ Through December 1990, the data for Germany are for the former West Germany only. Beginning with January 1991, the data for
Germany are for the unified Germany, i.e., the former East Germany and West Germany. Notes: 'Imports include crude oil, natural gas liquids, and refined products, and are on a direct basis. 'OECD*Organization
for Economic Cooperation and Development. See Appendix A for countries in this group. 'Negative numbers represent net exports. •A dash (-) indicates no trade. 'Zeroes (.000) indicate net imports of less than 0.0005 million barrels per day. 'See Section 4 for annual data.
Sources: See end of Section 3.
34 Energy Information Administration / International Petroleum Statistics Report March 1998

Table 3.14 OECD Imports from Kuwait (Most Recent 12 Months) (Mi l l ion B a r r e l s p e r Day)
1996 1997
Dec J a n Feb Mar Apr i l May June J u l y August Sept Oct Nov
Tota l 1.009 United S t a t e s l , / . . . . . 262 Canada . 000 OECD Europe2/ . 218 Main European Importers France . 000 Germany3_/ . 011 Italy .000 Spain . 000 Netherlands . 164
European Net Exporters Norway . 000 United Kingdom.... .028 Smaller European Importers Austria . 000 Belgium . 000 Denmark . 000 Greece . 000 Portugal . 000 Sweden . 000 Switzerland . 000 Turkey . 015 Japan . 519 Other OECD . 011
1.170 .209 .000 .309
.002
.009
.000
.000
.255
.000
.028
.000
.000
.000
.000
.000
.000
.000
.015
.642
.010
1.075 .172 .000 .322
.070
.009
.000
.000
.148
.000
.059
.000
.015
.000
.000
.000
.000
.000
.020
.571
.011
1.096 .315 .000 .222
.002
.010
.000
.003
.158
.000
.029
.000
.008
.000
.000
.000
.000
.000
.012
.548
.011
1.064 .204 .000 .217
.003
.020
.000
.000
.125
.000
.029
.000
.024
.000
.000
.000
.000
.000
.016
.640
.002
0.853 .128 .000 .248
.000
.009
.000
.000
.205
.000
.027
.000
.007
.000
.000
.000
.000
.000
.000
.464
.013
1.131 .361 .000 .240
.000
.013
.000
.000
.184
.000
.028
.000
.000
.000
.000
.000
.000
.000
.016
.523
.006
1.090 .331 .000 .286
.063
.014
.000
.000
.149
.000
.028
.000
.000
.000
.000
.000
.000
.000
.031
.471
.002
0.993 .229 .000 .247
.003
.009
.000
.000
.188
.000
.027
.000
.000
.000
.000
.000
.000
.000
.020
.515
.002
1.281 .322 .000 .382
.069
.016
.000
.000
.238
.000
.029
.000
.000
.023
.000
.000
.000
.000
.007
.575
.002
1.130 .349 .000 .237
.000
.012
.001
.000
.180
.000
.029
.000
.000
.000
.000
.000
.000
.000
.016
.541
.003
1.063 .220 .000 .301
.000
.014
.000
.000
.222
.000
.036
.000
.014
.000
.000
.000
.000
.000
.016
.539
.002
XI U.S. geographic coverage is the 50 States and District of Columbia. 2/ "OECD Europe" consists of Austria, Belgium, Denmark, Finland, France, Greece, Iceland, Ireland, Italy,
Luxembourg, the Netherlands, Norway, Portugal, Spain, Sweden, Switzerland, Turkey, the United Kingdom, and Germany. 3/ Through December 1990, the data for Germany are for the former West Germany only. Beginning with January 1991, the data for
Germany are for the unified Germany, i.e., the former East Germany and West Germany. Notes: 'Imports include crude oil, natural gas liquids, and refined products, and are on a direct basis. 'OECD»Organization
for Economic Cooperation and Development. See Appendix A for countries in this group. 'Negative numbers represent net exports. •A dash (-) indicates no trade. 'Zeroes (.000) indicate net imports of less than 0.0005 million barrels per day. 'See Section 4 for annual data.
Sources: See end of Section 3.
Energy Information Administration / International Petroleum statistics Report March 1998 35

Sources for Section 3 (International Oil Imports)
Oil Imports
United States: • Energy Information Administration (EIA), Petroleum Supply Annual 1996 and Petroleum Supply Monthly, February 1998. Other OECD Countries: • Organization for Economic Cooperation and Development (OECD), Quarterly Oil Statistics and Energy Balances, various issues. • OECD, Monthly Oil Statistics data base, 1991-1997.
36 Energy Information Administration / International Petroleum Statistics Report March 1998

4. Historical Oil Data Series
1970-1997

Table 4.1a World Crude Oil Production (Including Lease Condensate), (Thousand Barrels per Day)
1970-1997
Algeria Indonesia Iran Iraq Kuwait!/ Libya Nigeria Qatar
United Saudi Arab Vene- Total Arabia!/ Emirates zuela OPEC
1970 Average 1,029 854 3,829 1,549 2,990 3,318 1,083 362 3,799 780 3,708 23,301 1971 Average 785 892 4,540 1,694 3,197 2,761 1,531 431 4,769 1,060 3,549 25,209 1972 Average 1,062 1,081 5,023 1,466 3,283 2,239 1,816 482 6,016 1,203 3,220 26,891 1973 Average 1,097 1,339 5,861 2,018 3,020 2,175 2,054 570 7,596 1,533 3,366 30,629 1974 Average 1,009 1,375 6,022 1,971 2,546 1,521 2,255 518 8,480 1,679 2,976 30,351 1975 Average 983 1,307 5,350 2,262 2,084 1,480 1,783 438 7,075 1,664 2,346 26,771 1976 Average 1,075 1,504 5,883 2,415 2,145 1,933 2,067 497 8,577 1,936 2,294 30,327 1977 Average 1,152 1,686 5,663 2,348 1,969 2,063 2,085 445 9,245 1,999 2,238 30,893 1978 Average 1,231 1,635 5,242 2,563 2,131 1,983 1,897 487 8,301 1,831 2,165 29,464 1979 Average 1,224 1,591 3,168 3,477 2,500 2,092 2,302 508 9,532 1,831 2,356 30,581 1980 Average 1,106 1,577 1,662 2,514 1,656 1,787 2,055 472 9,900 1,709 2,168 26,606 1981 Average 1,002 1,605 1,380 1,000 1,125 1,140 1,433 405 9,815 1,474 2,102 22,481 1982 Average 987 1,339 2,214 1,012 823 1,150 1,295 330 6,483 1,250 1,895 18,778 1983 Average 968 1,343 2,440 1,005 1,064 1,105 1,241 295 5,086 1,149 1,801 17,497 1984 Average 1,014 1,412 2,174 1,209 1,157 1,087 1,388 394 4,663 1,146 1,798 17,442 1985 Average 1,037 1,325 2,250 1,433 1,023 1,059 1,495 301 3,388 1,193 1,677 16,181 1986 Average 945 1,390 2,035 1,690 1,419 1,034 1,467 308 4,870 1,330 1,787 18,275 1987 Average 1,048 1,343 2,298 2,079 1,585 972 1,341 293 4,265 1,541 1,752 18,517 1988 Average 1,040 1,342 2,240 2,685 1,492 1,175 1,450 346 5,086 1,565 1,903 20,324 1989 Average 1,095 1,409 2,810 2,897 1,783 1,150 1,716 380 5,064 1,860 1,907 22,071 1990 Average 1,175 1,462 3,088 2,040 1,175 1,375 1,810 406 6,410 2,117 2,137 23,195 1991 Average 1,230 1,592 3,312 305 190 1,483 1,892 395 8,115 2,386 2,375 23,275 1992 Average 1,214 1,504 3,429 425 1,058 1,433 1,943 423 8,332 2,266 2,371 24,398 1993 Average 1,162 1,511 3,540 512 1,852 1,361 1,960 413 8,198 2,159 2,450 25,119 1994 Average 1,180 1,510 3,618 553 2,025 1,378 1,931 415 8,120 2,193 2,588 25,510 1995 Average 1,202 1,503 3,643 560 2,057 1,390 1,993 R442 8,231 R2,233 2,750 R26,004 1996 Average 1,242 1,547 3,686 R579 2,062 1,401 2,188 510 8,218 2,278 3,053 R26,764 1997 Average P 1,277 1,546 3,664 1,187 2,083 1,446 2,317 649 8,562 2,316 3,315 28,362
XI Includes about one-half of the production in the Kuwait-Saudi Arabia Neutral Zone from 1970 through 1989 and beginning in June 1991. Kuwaiti Neutral Zone output was discontinued following Iraq's invasion of Kuwait on August 2, 1990, but was resumed in June 1991. From August 1990 through May 1991, all production in the Neutral Zone was included in the data for Saudi Arabia. PaPreliminary. R»Revised data. Notes: «OPEC>Organization of Petroleum Exporting Countries. Sources: See end of Section 4.
38 Energy Information Administration / International Petroleum Statistics Report March 1998

Table 4 . 1 b World Crude Oi l Production (Including Lease Condensate), 1970-1997 (Thousand B a r r e l s p e r Day)
United North Argen- Austra-Norway Kingdom S e a l / Angola t i n a l i a B r a z i l Canada China Colombia Ecuador
1970 Average 0 2 0 112 393 178 1971 Average 6 2 6 93 423 309 1972 Average 33 2 35 140 433 327 1973 Average 32 2 36 162 420 369 1974 Average 35 2 38 169 414 388 1975 Average 189 12 202 165 395 409 1976 Average 279 245 525 108 398 426 1977 Average 280 768 1,055 194 431 431 1978 Average 356 1,082 1,446 131 453 432 1979 Average. 403 1,568 1,976 147 473 441 1980 Average 528 1,622 2,151 150 491 380 1981 Average 501 1,811 2,322 130 496 394 1982 Average 520 2,065 2,617 122 491 370 1983 Average 614 2,291 2,965 177 491 416 1984 Average 697 2,480 3,250 208 478 492 1985 Average 788 2,530 3,417 231 460 575 1986 Average 870 2,539 3,547 282 434 520 1987 Average 1,022 2,406 3,584 360 428 547 1988 Average 1,158 2,232 3,540 452 449 538 1989 Average 1,554 1,802 3,515 455 460 490 1990 Average 1,704 1,820 3,667 475 483 575 1991 Average 1,890 1,797 3,811 500 485 545 1992 Average 2,229 1,825 4,182 526 553 535 1993 Average 2,350 1,915 4,403 509 594 503 1994 Average 2,521 2,375 5,058 536 650 536 1995 Average 2,768 2,489 5,400 646 715 562 1996 Average 3,104 2,568 5,822 709 756 570 1997 Average P 3,153 2,517 5,843 720 835 588
167 174 167 169 176 177 167 161 160 166 182 213 260 339 475 564 572 566 554 596 631 630 626 643 671 695 795 827
1,263 1,348 1,532 1,798 1,551 1,430 1,314 1,321 1,316 1,500 1,435 1,285 1,271 1,356 1,438 1,471 1,474 1,535 1,616 1,560 1,553 1,548 1,605 1,679 1,746 1,805
Rl,837 1,893
600 780 900
1,090 1,315 1,490 1,670 1,874 2,082 2,122 2,114 2,012 2,045 2,120 2,296 2,505 2,620 2,690 2,730 2,757 2,774 2,835 2,845 2,890 2,939 2,990 3,131 3,200
219 214 196 184 168 157 146 138 131 124 126 125 141 152 168 176 305 385 378 403 440 419 433 456 450 585 623 662
4 4 78 209 177 161 188 183 202 214 204 211 211 237 258 281 293 174 302 279 285 299 321 344 365 392
R396 381
XI North Sea includes the United Kingdom Offshore, Norway, Denmark, Netherlands Offshore, and Germany Offshore. P-Preliminary. R-Revised. Sources: See end of Section 4.
Energy Information Administration / International Petroleum Statistics Report March 1998 39

Table 4.1c World Crude Oil Production (Including Lease Condensate), 1970-1997 (Thousand Barrels per Day)
Former United Egypt Gabon India Malaysia Mexico Oman Russia U.S.S.R. Syria States Other!/ World
326 293 231 165 150 235 330 415 485 525 595 598 670 727 822 887 813 896 848 865 873 874 881 890 896 920 922 874
109 115 125 150 202 223 223 222 209 203 175 151 156 157 157 172 166 155 159 208 270 294 298 313 329 R365 368 368
144 143 156 147 156 165 175 199 226 245 182 325 390 480 519 620 630 609 635 700 660 615 561 534 590 703 651 675
18 69 93 91 81 98 165 184 217 283 283 264 306 365 440 440 504 497 540 585 619 646 653 640 645 682 695 746
487 486 505 465 571 705 831 981
1,209 1,461 1,936 2,313 2,748 2,689 2,780 2,745 2,435 2,548 2,512 2,520 2,553 2,680 2,669 2,673 2,685 2,618 2,855 3,023
332 294 282 293 290 343 366 341 315 295 282 319 324 375 414 498 560 582 617 641 685 700 740 776 810 851 883 887
— --— — — — — — — — — — — — — — — — — — — —
7,632 6,730 6,135 5,995
R5,850 5,884
6,985 7,475 7,890 8,324 8,912 9,523 10,060 10,603 11,105 11,384 11,706 11,850 11,912 11,972 11,861 11,585 11,895 12,050 12,053 11,715 10,975 9,992
— — — — — —
80 100 124 105 124 170 175 188 170 166 164 166 160 167 170 178 194 230 265 340 388 492 481 554 560
R575 604 561
9,637 9,463 9,441 9,208 8,774 8,375 8,132 8,245 8,707 8,552 8,597 8,572 8,649 8,688 8,879 8,971 8,680 8,349 8,140 7,613 7,355 7,417 7,171 6,847 6,662 6,560 6,465 6,411
1,529 1,518 1,592 1,667 1,711 1,636 1,620 1,655 1,706 1,821 1,842 1,859 1,892 1,946 2,015 2,124 2,166 2,120 2,235 2,249 2,253 2,274
R3,228 R3,280 R3,382 R3,410 R3,509 3,698
45,886 48,518 51,138 55,679 55,716 52,828 57,344 59,707 60,158 62,674 59,600 56,076 53,481 53,256 54,489 53,982 56,227 56,666 58,737 59,863 60,566 60,207
R60,212 R60,238 R60,992 R62,331 R64,054 66,262
XI other is a calculated total derived from the difference between "World" and the sum of production in "Total OPEC" (Table 1.1a) and all other countries listed (Tables 1.1b and 1.1c). The total "North Sea" is not subtracted from the world total, though Norway and the United Kingdom have been subtracted. — ■ Not applicable. P=Preliminary. RnRevised data. Sources: See end of Section 4.
40 Energy Information Administration / International Petroleum Statistics Report March 1998
1970 Average 1971 Average 1972 Average 1973 Average 1974 Average 1975 Average 1976 Average 1977 Average 1978 Average 1979 Average 1980 Average 1981 Average 1982 Average 1983 Average 1984 Average 1985 Average. 1986 Average 1987 Average 1988 Average 1989 Average 1990 Average 1991 Average 1992 Average 1993 Average 1994 Average 1995 Average 1996 Average 1997 Average P....

Table 4.2 OPEC Crude Oil Production (Excluding Condensate), 1980-1997 (Thousand Barrels per Day)
United Indo- Saudi Arab Vene- Total
Algeria nesia Iran Iraq Kuwait!/ Libya Nigeria Qatar Arabia!/ Emirates zuela OPEC
1980 1981 1982 1983 1984 1985 1986 1987 1988 1989 1990 1991 1992 1993 1994 1995 1996 1997
Average... Average... Average... Average... Average... Average... Average... Average... Average... Average... Average... Average... Average... Average... Average... Average .. Average .. Average P.
1,006 802 712 648 694 702 600 648 640 690 765 800 772 747 750 767 812 847
1,497 1,513 1,247 1,245 1,279 1,181 1,257 1,189 1,177 1,231 1,281 1,410 1,326 1,327 1,334 1,343 1,367 1,366
1,662 1,380 2,214 2,440 2,174 2,250 2,035 2,298 2,240 2,810 3,088 3,312 3,429 3,540 3,600 3,608 3,651 3,629
2,514 1,000 1,012 1,005 1,209 1,433 1,690 2,079 2,685 2,897 2,040
305 425 512 548 550 579
1,182
1,656 1,125
823 1,064 1,157 1,023 1,419 1,585 1,492 1,783 1,175
190 1,058 1,852 2,034 2,057 2,062 2,083
1,787 1,140 1,150 1,105 1,087 1,059 1,034
972 1,175 1,150 1,375 1,483 1,433 1,361 1,378 1,390 1,401 1,446
2,045 1,423 1,285 1,231 1,368 1,475 1,447 1,291 1,400 1,666 1,755 1,832 1,820 1,835 1,887 1,876 2,051 2,217
472 405 330 295 394 301 308 293 346 380 406 395 423 413 409 449 475 614
9,900 9,815 6,483 5,086 4,663 3,388 4,870 4,265 5,086 5,064 6,410 8,115 8,332 8,198 8,147 8,231 8,218 8,562
1,704 1,469 1,215 1,109 1,091 1,133 1,270 1,441 1,465 1,783 2,066 2,326 2,206 2,109 2,183 2,197 2,198 2,236
2,147 2,083 1,878 1,768 1,689 1,558 1,645 1,587 1,715 1,747 2,097 2,338 2,334 2,410 2,542 2,710 3,013 3,275
26,390 22,155 18,349 16,996 16,805 15,503 17,575 17,648 19,421 21,201 22,458 22,506 23,558 24,304 24,812 25,179 25,826 27,457
XI Includes about one-half of the production in the Kuwait-Saudi Arabia Neutral Zone from 1980 through July 1990 and beginning in June 1991. Kuwaiti Neutral Zone output was discontinued following Iraq's invasion of Kuwait on August 2, 1990, but was resumed in June 1991. From August 1990 through Hay 1991, all production in the Neutral Zone was included in the data for Saudi Arabia. P-Preliminary. Note: OPEC»Organization of Petroleum Exporting Countries. See Appendix A for Countries in this group. Sources: See end of Section 4.
Energy Information Administration / International Petroleum statistics Report March 1998 41

Table 4 .3 World Na tura l Gas Plant Liquids Production, 1970-1996 (Thousand Barrels per Day)
Algeria Canada Mexico Saudi
Arabia Russia Former USSR
120 135 155 170 190 205 220 235 255 270 285 300 315 330 340 350 440 430 450 425 425 420 — — — — — —
United Statesl,/
1,660 1,693 1,744 1,738 1,688 1,633 1,603 1,618 1,567 1,584 1,573 1,609 1,550 1,559 1,630 1,609 1,551 1,595 1,625 1,546 1,559 1,659 1,697 1,736 1,727 1,762 1,830 1,842
Persian Gulf2/
119 138 155 191 231 246 291 335 410 458 534 599 612 552 604 645 700 721 808 851 930 931
1,003 1,040 1,071 1,106 1,082 1,108
1 1 1 1 1 1 1
Rl 1
0APEC3/
137 147 159 196 219 252 313 366 447 535 618 691 721 655 761 808 860 900 979 ,041 ,107 ,113 ,185 ,238 ,267 ,301 ,295 ,310
1 1 1 1 1 1 1 1 1
Rl 1
0PEC3/
205 243 275 324 347 372 442 482 566 637 732 825 842 780 869 892 969 ,006 ,077 ,188 ,281 ,299 ,364 ,435 ,465 ,506 ,501 ,488
World
2,383 2,508 2,676 2,785 2,789 2,790 2,865 2,982 3,078 3,285 3,444 3,625 3,626 3,635 3,869 3,938 4,150 4,279 4,481 4,502 4,632 4,827
R4,975 R5,181 R5,293 R5,485 R5,582 5,596
1970 Average 3 200 58 1971 Average 4 234 59 1972 Average 4 293 61 1973 Average 9 314 75 1974 Average 12 314 80 1975 Average 20 309 80 1976 Average 24 289 95 1977 Average 19 290 105 1978 Average 25 281 115 1979 Average 30 331 150 1980 Average 36 331 193 1981 Average 49 330 241 1982 Average 58 318 255 1983 Average 56 309 265 1984 Average 105 336 257 1985 Average 120 337 271 1986 Average 120 328 352 1987 Average 140 367 338 1988 Average 120 381 370 1989 Average 130 410 384 1990 Average 130 426 428 1991 Average 140 431 457 1992 Average 140 460 454 1993 Average 145 506 459 1994 Average 140 529 461 1995 Average ....*. 145 581 447 1996 Average R150 R596 423 1997 Average P.... 145 631 386
50 50 55 90
130 140 185 215 250 303 369 433 430 330 355 375 385 418 499 503 620 680 713 704 698 701 697 723
— — --— — --— — — — — — — — --— — — — --— —
230 220 200 180
R185 200
XI U.S. geographic coverage is the 50 States and the District of Columbia. 2/ See Appendix A for countries in this group. 3/ OAPEC-Organization of Arab Petroleum Exporting Countries. OPECsOrganization of Petroleum Exporting Countries.
See Appendix A for countries in these groups. PvPreliminary. R=Revised data. Sources: See end of Section 4.
42 Energy Information Administration / International Petroleum Statistics Report March 1998

Table 4 .4 World Oi l Supply, 1970-1997 (Thousand B a r r e l s p e r Day)
United Statesl/
Persian Gulf2/ OAPEC3/ OPEC3/ World
1970 Average... 1971 Average... 1972 Average... 1973 Average... 1974 Average... 1975 Average... 1976 Average... 1977 Average... 1978 Average... 1979 Average... 1980 Average... 1981 Average... 1982 Average... 1983 Average... 1984 Average... 1985 Average... 1986 Average... 1987 Average... 1988 Average... 1989 Average... 1990 Average... 1991 Average... 1992 Average... 1993 Average... 1994 Average... 1995 Average .. 1996 Average .. 1997 Average P.
11 11 11 11 10 10 10 10 10 10 10 10 10 10 11 11 10 10 10 9 9 9 9 9 9 9 9
,673 ,554 ,601 ,428 ,978 ,505 ,251 ,437 ,820 ,707 ,809 ,739 ,783 ,788 ,107 ,192 ,905 ,648 ,473 ,880 ,677 ,883 ,768 ,602 ,413 ,400 ,445 ,416
13,541 15,940 17,734 20,895 21,550 19,223 21,847 22,098 21,067 21,569 18,541 15,894 12,815 11,676 11,433 10,320 12,441 12,869 14,310 15,733 16,249 15,704 17,010 17,792 18,072
R18,351 R18,486 19,641
14,571 15,427 16,451 18,656 18,399 16,831 19,563 20,372 19,819 22,575 20,715 17,619 13,786 12,416 12,619 11,498 13,653 13,992 15,662 16,658 17,232 16,747 17,871 18,505 18,745
R19,069 R19,259 20,407
23,567 25,514 27,228 31,015 30,762 27,218 30,841 31,443 30,120 31,300 27,419 23,393 19,702 18,352 18,389 17,151 19,310 19,589 21,465 23,323 24,536 24,625 25,818 26,610 27,031
R27,566 R28,321 29,905
48,986 51,766 54,574 59,300 59,391 56,511 61,121 63,665 64,225 66,973
R64,152 R60.761 R58,225 R58.054 R59,644 R59,262 R61.769 R62.427 R64.705 R65.892 R66,754 R66.632 R66.960 R67,361 R68.250 R69.860 R71,764 74,031
XI U.S. geographic coverage is the 50 States and the District of Columbia. 2/ See Appendix A for countries in this group. 3/ OAPEC-Organization of Arab Petroleum Exporting Countries. OPEC>Organization of Petroleum Exporting Countries.
See Appendix A for countries in these groups. P-Preliminary. R»Revised data. Note: Oil Supply includes crude oil, natural gas plant liquids, other liquids, and refinery gain. See Explanatory
Note 1 in Appendix B. Sources: See end of Section 4.
Energy Information Administration / International Petroleum Statistics Report March 1998

Table 4.5 Oil Stocks in OECD Countries, End of Year (Million Barrels)
United OECD United Total France Italy Germany!/ Kingdom Europe2/ States3/ Canada Japan Other4/ OECD
1973 1974 1975 1976 1977 1978 1979 1980 1981 1982 1983 1984 1985 1986 1987 1988 1989 1990 1991 1992 1993 1994 1995 1996
December .... December .... December P....
201 249 225 234 239 201 226 243 214 193 153 152 139 127 127 140 138 140 153 146 158 158 159 158
152 167 143 143 161 154 163 170 167 179 149 159 157 155 169 155 164 172 160 174 163 164 162 152
181 213 187 208 225 238 272 319 297 272 249 239 233 252 259 266 271 265 288 310 309 312 301 300
156 191 165 165 148 157 169 168 143 125 118 112 123 124 121 112 118 112 119 113 118 115 107 108
1,070 1,227 1,154 1,205 1,268 1,219 1,353 1,464 1,337 1,258 1,142 1,130 1,092 1,133 1,130 1,118 1,133 1,163 1,181 1,219 1,221 1,240 1,228 1,256
1,008 1,074 1,133 1,112 1,312 1,278 1,341 1,392 1,484 1,430 1,454 1,556 1,519 1,593 1,607 1,597 1,581 1,621 1,617 1,592 1,647 1,653 1,563 1,507
140 145 174 153 167 144 150 164 161 136 121 128 113 111 126 116 114 121 119 107 105 119 109 103
303 370 375 380 409 413 460 495 482 484 470 479 494 509 540 538 577 590 606 603 618 645 630 651
67 64 67 68 68 68 75 72 67 68 68 69 66 72 71 71 71 73 65 67 69 69 71 74
2,588 2,880 2,903 2,918 3,224 3,122 3,379 3,587 3,531 3,376 3,255 3,362 3,284 3,418 3,474 3,440 3,476 3,568 3,588 3,588 3,661 3,726 3,601 3,591
XI Data through December 1990 are for the former West Germany. Beginning with January 1991, the data for Germany are for the unified Germany, i.e., the former East Germany and West Germany
2/ "OECD Europe" consists of Austria, Belgium, Denmark, Finland, France, Germany, Greece, Iceland, Ireland, Italy, Luxembourg, the Netherlands, Norway, Portugal, Spain, Sweden, Switzerland, Turkey, and the United Kingdom. 3/ U.S. geographic coverage is the 50 States and the District of Columbia. In the United States in January 1975, 1981, and
1983, numerous respondents were added to bulk terminal and pipeline surveys affecting subsequent stocks reported. Using the new basis, the end-of-year U.S. stocks, in million barrels, would have been 1,121 in 1974, 1,425 in 1980, and 1,461 in 1982. 4/ "Other" consists of Australia, New Zealand, and the U.S. Territories. P»Pre1 iminary. Note: Oil Stocks - See Explanatory Note 2 in Appendix B. Sources: See end of Section 4.
44 Energy Information Administration / International Petroleum Statistics Report March 1998

Table 4.6 World Oil Demand, 1970-1996 (Thousand Barrels per Day)
OECD OECD Excluding Including
United OECD United East East East world France Italy Germany!/ Kingdom Europe2/ States3/ Canada Japan 0ther4/ Germany Germany Germany Total
1970 1971 1972 1973 1974 1975 1976 1977 1978 1979 1980 1981 1982 1983 1984 1985 1986 1987 1988 1989 1990 1991 1992 1993 1994 1995 1996
Average... Average... Average... Average... Average... Average... Average... Average... Average... Average... Average... Average... Average... Average... Average... Average... Average... Average... Average... Average... Average... Average... Average... Average... Average... Average... Average P.
1,937 2,115 2,322 2,601 2,447 2,252 2,420 2,294 2,408 2,463 2,256 2,023 1,880 1,835 1,754 1,775 1,772 1,789 1,797 1,857 1,818 1,935 1,926 1,875 1,833 1,896 1,935
1,710 1,838 1,947 2,068 2,004 1,855 1,971 1,897 1,952 2,039 1,934 1,874 1,781 1,750 1,646 1,717 1,738 1,855 1,836 1,930 1,872 1,863 1,937 1,852 1,841 2,048 2,058
2,607 2,702 2,859 3,055 2,748 2,650 2,877 2,865 2,927 3,003 2,707 2,449 2,372 2,324 2,322 2,338 2,498 2,424 2,422 2,280 2,382 2,828 2,843 2,900 2,879 2,875 2,911
2,096 2,141 2,284 2,341 2,210 1,911 1,892 1,905 1,938 1,971 1,725 1,590 1,590 1,531 1,849 1,634 1,649 1,603 1,697 1,738 1,752 1,801 1,803 1,815 1,837 1,845 1,845
12,404 13,005 13,934 14,925 13,988 13,217 14,124 13,916 14,290 14,667 13,634 12,515 12,053 11,765 11,736 11,681 12,102 12,255 12,427 12,531 12,629 13,391 13,605 13,523 13,597 14,120 14,269
14,697 15,213 16,367 17,308 16,653 16,322 17,461 18,431 18,847 18,513 17,056 16,058 15,296 15,231 15,726 15,726 16,281 16,665 17,283 17,325 16,988 16,714 17,033 17,237 17,718 17,725 18,309
1,516 1,565 1,664 1,729 1,779 1,779 1,818 1,850 1,902 1,971 1,873 1,768 1,578 1,448 1,472 1,504 1,506 1,548 1,693 1,733 1,690 1,622 1,643 1,688 1,727 1,755 1,797
3,817 4,142 4,363 4,949 4,864 4,621 4,837 4,880 4,945 5,050 4,960 4,848 4,582 4,395 4,576 4,384 4,439 4,484 4,752 4,983 5,140 5,284 5,446 5,401 5,674 5,711 5,867
836 831 948 988
1,095 1,041 1,119 1,160 1,204 1,178 1,072 1,080 1,008 954 989 976 951 959 939 998
1,027 1,056 1,041 1,118 1,174 1,227 1,124
33,270 34,755 37,275 39,900 38,379 36,980 39,358 40,237 41,187 41,379 38,595 36,269 34,517 33,793 34,500 34,271 35,279 35,911 37,093 37,570 37,475
— — — — — —
223 238 270 282 307 307 329 347 363 369 375 355 371 336 340 362 362 342 322 301 283 — — --— — —
33,493 34,993 37,545 40,182 38,686 37,287 39,687 40,584 41,550 41,748 38,970 36,624 34,888 34,129 34,840 34,633 35,641 36,253 37,415 37,871 37,758 38,067 38,768 38,967 39,890 40,537 41,366
46,808 49,416 53,094 57,237 56,677 56,198 59,673 61,826 64,158 65,220 63,067 60,903 59,503 58,744 59,836 60,091 61,759 62,999 64,819 65,917 65,985 66,577 66,742 67,043 68,313 70,193 71,894
XI Data through 1990 are for the former West Germany. Beginning with January 1991, the data for Germany are for the unified Germany, i.e., the former East Germany and West Germany.
2/ "OECD Europe" consists of Austria, Belgium, Denmark, Finland, France, Germany, Greece, Iceland, Ireland, Italy, Luxembourg, the Netherlands, Norway, Portugal, Spain, Sweden, Switzerland, Turkey, and the United Kingdom. 3/ U.S. geographic coverage is the 50 States and the District of Columbia. 4/ "Other" consists of Australia, New Zealand, and the U.S. Territories. P>Preliminary. —-Not Applicable. Note: The term Demand is used interchangeably with Consumption and Petroleum Products Supplied. See Appendix C for
definition. Sources: See end of Section 4.
Energy Information Administration / International Petroleum Statistics Report March 1998

Table 4 .7 OECD Tota l Net Imports , 1986-1996 (Mi l l i on B a r r e l s p e r Day)
1986 1987 1988 1989 1990 1991 1992 1993 1994 1995 1996
Average
T o t a l 17.670 Uni ted S t a t e s l . / . . . . 5.439 Canada - . 3 9 1 OECD Europe2/ 7. 893 Main European Importers France 1.682 Germany^/ 2.380 Italy 1.642 Netherlands .632 Spain .747
European Net Exporters Norway -.718 United Kingdom.... -1.067 Smaller European Importers Austria . 188 Belgium . 456 Denmark . 150 Ireland . 098 Finland .229 Greece .245 Iceland .011 Luxembourg . 024 Portugal . 183 Sweden .379 Switzerland . 290 Turkey . 342
Japan 4.392 Other OECD .338
18.008 5.914 - .358 7.742
1.742 2 .281 1.718
.562
.803
- .866 -1 .015
.194
.443
.122
.081
.242
.230
.013
.028
.199
.309
.254
.402 4.418
.291
18.706 6.587 - .585 7.774
1.718 2.279 1.590
.646
.869
-1.036 - .760
.185
.451
.107
.076
.200
.242
.012
.028
.198
.313
.258
.397 4.680
.250
20.082 7.202 - .462 7.994
1.711 2.112 1.716
.635
.952
-1.420 - .200
.191
.454
.078
.079
.220
.252
.011
.031
.246
.290
.254
.384 5.035
.313
20.456 7.161 - .425 8.210
1.750 2.202 1.788
.677
.950
-1.543 - .214
.201
.442
.063
.095
.208
.273
.011
.034
.250
.324
.273
.425 5.239
.270
20.414 6.626 - .479 8.588
1.869 2.664 1.769
.690
.951
-1 .825 - .158
.212
.506
.048
.094
.211
.297
.012
.039
.258
.312
.273
.366 5.286
.392
20.783 6.938 - .546 8.459
1.784 2.739 1.839
.713
.998
-2.102 - . 2 2 1
.209
.517
.032
.097
.188
.326
.011
.040
.279
.320
.277
.413 5.464
.467
21.226 7.618 - .586 8.127
1.761 2.723 1.747
.688 1.066
-2.254 - . 355
.205
.503
.023
.102
.182
.327
.014
.039
.272
.335
.250
.500 5.467
.599
21.133 8.054 - .623 7.355
1.615 2.731 1.778
.720 1.119
-2 .586 - .850
.210
.517
.027
.109
.234
.292
.015
.040
.270
.362
.262
.490 5.766
.580
20.717 7.886 - .756 7.226
1.721 2.699 1.820
.700 1.202
-2.794 - .969
.194
.495
.039
.116
.145
.343
.015
.036
.291
.356
.248
.569 5.716
.644
21.455 8.498 - .803 7.339
1.738 2.793 1.791
.763 1.183
-3.150 - .839
.213
.572
.028
.124
.180
.350
.015
.039
.274
.405
.260
.600 5.790
.632
XI U.S. geographic coverage is the 50 States and District of Columbia. 2/ "OECD Europe" consists of Austria, Belgium, Denmark, Finland, France, Germany, Greece, Iceland, Ireland, Italy,
Luxembourg, the Netherlands, Norway, Portugal, Spain, Sweden, Switzerland, Turkey, and the United Kingdom. 3/ Data through 1990 are for the former West Germany. Notes: 'Imports include crude oil, natural gas liquids, and refined products, and are on a direct basis. »OECD-Organization
for Economic Cooperation and Development. See Appendix A for countries in this group. 'Negative numbers represent net exports. •A dash (-) indicates no trade. 'Zeroes (.000) indicate net imports of less than 0.0005 million barrels per day. •Data for 1995 are preliminary.
Sources: See end of Section 4.
46 Energy Information Administration / International Petroleum Statistics Report March 1998

Table 4 . 8 OECD Impor t s from OPEC, (Mi l l ion B a r r e l s p e r Day)
1986-1996
1986 1987 1988 1989 1990 1991 1992 1993 1994 1995 1996
Average
Tota l 12.280 United S t a t e s l . / . . . . 2.724 Canada . 158 OECD Europe2/ 6.073 Main European Importers France .882 Germany3/ . 830 Italy 1.361 Netherlands .768 Spain .584
European Net Exporters Norway . 008 United Kingdom.... .324 Smaller European Importers Austria .090 Belgium .288 Denmark . 025 Ireland . 001 Finland .021 Greece. .273 Portugal .120 Sweden . 086 Switzerland . 068 Turkey . 344
Japan 3.036 Other OECD .288
12.327 2.988
.154 5.597
.684
.675 1.307
.767
.543
.002
.277
.087
.257
.053
.001
.023
.279
.101
.062
.069
.411 3.198
.389
13.049 3.439
.161 5.842
.737
.761 1.191
.850
.604
.002
.322
.082
.302
.067 -
.011
.233
.118
.074
.051
.439 3.309
.298
14.521 3.986
.205 6.188
.875
.739 1.260
.892
.686
.003
.342
.086
.353
.069 -
.013
.244
.156
.064
.021
.384 3.788
.355
15.576 4.172
.199 6.633
1.101 .771
1.375 .850 .652
.007
.406
.097
.313
.044
.000
.013
.340
.166
.073
.036
.388 4.062
.510
15.360 3.918
.210 6.728
1.021 .859
1.393 .900 .700
.014
.377
.108
.362
.006
.000
.029
.298
.139
.105
.052
.365 4.026
.478
15.567 3.888
.210 6.758
.932
.957 1.343
.914
.632
.004
.390
.115
.359
.001
.000
.033
.346
.152
.116
.051
.412 4.198
.512
16.018 4.103
.268 6.794
1.006 .948
1.222 .982 .582
.005
.439
.128
.359
.006
.000
.007
.303
.166
.123
.063
.452 4.245
.609
15.765 4.036
.285 6.385
.956
.838 1.117
.906
.668
.003
.306
.119
.284
.008
.000
.004
.266
.227
.126
.082
.475 4.495
.563
15.469 3.979
.257 6.154
.911
.711 1.203
.791
.781
.003
.254
.057
.276
.022
.000
.004
.263
.209
.109
.083
.477 4.467
.612
15.630 4.194
.261 6.053
.897
.660 1.244
.779
.775
.001
.234
.023
.284
.027
.000
.001
.280
.177
.091
.098
.483 4.470
.653
XI U.S. geographic coverage is the 50 States and District of Columbia. 2/ "OECD Europe" consists of Austria, Belgium, Denmark, Finland, France, Germany, Greece, Iceland, Ireland, Italy,
Luxembourg, the Netherlands, Norway, Portugal, Spain, Sweden, Switzerland, Turkey, and the United Kingdom. 3/ Data through 1990 are for the former West Germany. Notes: 'Imports include crude oil, natural gas liquids, and refined products, and are on a direct basis. »OECD=Organization
for Economic Cooperation and Development; OPEC»Organization of Petroleum Exporting Countries. See Appendix A for countries in these groups. 'Negative numbers represent net exports. *A dash (-) indicates no trade. 'Zeroes (.000) indicate net imports of less than 0.0005 million barrels per day. 'Data for 1995 are preliminary.
Sources: See end of Section 4.
Energy Information Administration / International Petroleum Statistics Report March 1998 47

Table 4.9 OECD Imports from Persian Gulf, 1986-1996
1986 1987 1988 1989 1990 1991 1992 1993 1994 1995 1996
Average
Imports from Persian Gulf
Total 7.228 United Statesl./... .909 Canada . 054 OECD Europe^/ 3.513 Main European Importers France . 586 Germany3/ .232 Italy .817 Netherlands . 509 Spain .328
European Net Exporters Norway . 006 United Kingdom... .173 Smaller European Importers Austria . 011 Belgium . 182 Denmark .024 Finland . 021 Greece .204 Portugal .088 Sweden .036 Switzerland . 008 Turkey . 289
Japan 2.557 Other OECD . 195
7.392 1.072
.054 3.330
.459
.187
.782
.516
.295
.002
.164
.026
.162
.047
.022
.211
.069
.029
.008
.348 2.637
.299
7.941 1.526
.056 3.428
.484
.197
.643
.587
.306
.212
.025
.224
.063
.011
.146
.066
.045
.007
.411 2.691
.241
9.121 1.857
.069 3.754
.647
.216
.619
.663
.352 _
.240
.022
.277
.067
.012
.181
.085
.043
.007
.323 3.173
.267
9.667 1.961
.081 3.908
.864
.217
.626
.647
.291
.000
.250
.016
.250
.043
.011
.268
.073
.039
.007
.307 3.394
.322
9.249 1.835
.084 3.660
.708
.227
.595
.609
.281
.011
.222
.021
.279
.004
.021
.219
.067
.064
.007
.324 3.370
.300
9.456 1.774
.092 3.666
.640
.215
.573
.650
.231
.000
.220
.031
.292
.000
.023
.291
.074
.068
.007
.349 3.586
.338
10.029 1.775
.105 4.048
.757
.250
.548
.744
.287
.000
.303
.036
.291
.002
.002
.253
.050
.088
.008
.429 3.721
.381
9.609 1.722
.119 3.506
.651
.217
.430
.662
.275
.000
.174
.038
.232
.000
.002
.214
.117
.076
.012
.405 3.946
.316
9.310 1.563
.070 3.365
.647
.172
.494
.563
.324
.000
.135
.035
.252
.000
.002
.223
.107
.068
.007
.336 3.979
.334
9.215 1.594
.111 3.171
.573
.145
.502
.566
.304
.000
.102
.004
.263
.000
.000
.235
.083
.067
.006
.320 4.025
.313
XI U.S. geographic coverage is the 50 States and District of Columbia. 2/ "OECD Europe" consists of Austria, Belgium, Denmark, Finland, France, Germany, Greece, Iceland, Ireland, Italy,
Luxembourg, the Netherlands, Norway, Portugal, Spain, Sweden, Switzerland, Turkey, and the United Kingdom. 3/ Data through 1990 are for the former West Germany. Notes: 'Imports include crude oil, natural gas liquids, and refined products, and are on a direct basis. »OECD-Organization
for Economic Cooperation and Development. See Appendix A for countries in this group. '"Persian Gulf" consists of Bahrain, Iran, Iraq, Kuwait, Qatar, Saudi Arabia, and the United Arab Emirates. 'Negative numbers represent net exports. »A dash (-) indicates no trade. 'Zeroes (.000) indicate net imports of less than 0.0005 million barrels per day. •Data for 1995 are preliminary. Sources: See end of Section 4.
48 Energy Information Administration / International Petroleum statistics Report March 1998

Table 4.10 United States—Net Oi l Imports , 1986-1996 (Million Barrels per Day)
1986 1987 1988 1989 1990 1991 1992 1993 1994 1995 1996
Average
Total Net Imports.. 5.439 Imports from 0PEC1/ 2.724 Imports from
Persian Gulf2/ Total .909 Bahrain. .001 Iran .019 Iraq .081 Kuwait .068 U.A.E .043 Qatar . 013 Saudi Arabia . 685 Imports from OPEC-Africa Total .711 Algeria .271 Libya . 000 Nigeria .440 Imports from OPEC-South America
Total .788 Venezuela... .788 Imports from OPEC-Far East Total .317 Indonesia .317
5.914 2.988
1.072 - . 0 0 1
.098
.083
.082
.059
.000
.751
.830
.295
.000
.535
.801
.801
.284
.284
6.587 3.439
1.526 .000 .000 .343 .092 .028 .000
1.063
.918
.300
.000
.618
.790
.790
.205
.205
7.202 3.986
1.857 - . 0 0 1
.000
.449
.157
.027
.002 1.224
1.084 .269 .000 .815
.861
.861
.182
.182
7.161 4.172
1.961 - . 001
.000
.518
.086
.016
.004 1.339
1.080 .280 .000 .800
1.016 1.016
.113
.113
6.626 3.918
1.835 - . 0 0 1
.032
.000
.006
.001
.000 1.797
.956
.253
.000
.703
1.020 1.020
.106
.106
6.938 3.888
1.774 - .002
.000
.000
.051
.004
.001 1.720
.876
.196
.000
.680
1.161 1.161
.075
.075
7.618 4.103
1.775 - .002
.000
.000
.353
.009
.001 1.414
.956
.220
.000
.736
1.295 1.295
.074
.074
8.054 4.036
1.722 - . 002
.000
.000
.312
.011
.000 1.402
.880
.243
.000
.637
1.322 1.322
.109
.109
7.886 3.979
1.563 - . 0 0 3
.000
.000
.218
.004
.000 1.344
.859
.234
.000
.625
1.468 1.468
.087
.087
8.498 4.194
1.594 - . 0 0 2
.000
.001
.236 - . 0 0 3
.000 1.363
.872
.256
.000
.616
1.667 1.667
.058
.058
XI OPEC-Organization of Petroleum Exporting Countries. See Appendix A for countries in this group. 2/ The Persian Gulf countries are all members of OPEC, except for Bahrain. Notes: 'Imports include crude oil, natural gas liquids, and refined products, and are on a direct basis. *U.S. geographic
coverage is the 50 States and District of Columbia. 'Negative numbers represent net exports. *A dash (-) indicates no trade. • Zeroes (.000) indicate net imports of less than 0.0005 million barrels per day. 'Data for 1995 are preliminary. Sources: See end of Section 4.
Energy Information Administration / International Petroleum Statistics Report March 1998 49

Table 4.11 Japan—Net Oil Imports, 1986-1996 (Million Barrels per Day)
1986 1987 1988 1989 1990 1991 1992 1993 1994 1995 1996
Average
Total Net Imports.. 4.392 Imports from OPEC1/ 3.036 Imports from
Persian Gulf21 Total 2.557 Bahrain . 034 Iran .220 Iraq . 164 Kuwait .278 U.A.E .890 Qatar . 183 Saudi Arabia .789
Imports from OPEC-Africa Total .016 Algeria . 015 Libya .001 Nigeria Imports from
OPEC-South America Total .012 Venezuela .012 Imports from OPEC-Far East Total .486 Indonesia .486
4.418 3.198
2.637 .037 .230 .105 .347 .773 .139
1.005
.023
.023
4.680 3.309
2.691 .036 .187 .173 .341 .822 .203 .930
.044
.044
5.035 3.788
3.173 .042 .291 .219 .458 .929 .250 .984
.015
.015
5.239 4.062
3.394 .037 .385 .146 .291
1.032 .263
1.240
.011
.010
5.286 4.026
3.370 .037 .383 .000 .014
1.285 .285
1.367
.011
.010
5.464 4.198
3.586 .029 .362 .000 .220
1.256 .300
1.420
.007
.007
5.467 4.245
3.721 .025 .384 .000 .368
1.287 .330
1.327
.008
.008
5.766 4.495
3.946 .028 .459 .000 .430
1.398 .328
1.303
.017
.012
5.716 4.467
3.979 .029 .399 .000 .501
1.420 .335
1.296
.026
.011
5.790 4.470
4.025 .033 .451 .000 .500
1.396 .335
1.310
.032
.012
.001 .001 .000 .000 .005 .016 .020
.012
.012
.563
.563
.011
.011
.599
.599
.011
.011
.631
.631
.011
.011
.682
.682
.010
.010
.673
.673
.010
.010
.624
.624
.009
.009
.533
.533
.009
.009
.551
.551
.002
.002
.488
.488
.003
.003
.442
.442
XI OPEC»Organization of Petroleum Exporting Countries. See Appendix A for countries in this group. 2/ The Persian Gulf countries are all members of OPEC, except for Bahrain. Notes: 'Imports include Crude Oil, Natural Gas Liquids, and Refined Products, and are on a direct basis. 'Negative numbers
represent net exports. *A dash (-) indicates no trade. 'Zeroes (.000) indicate net imports of less than 0.0005 million barrels per day. 'Data for 1995 are preliminary.
Sources: See end of Section 4.
50 Energy Information Administration / International Petroleum Statistics Report March 1998

Table 4 .12 OECD Europe—Net O i l I m p o r t s , 1986-1996 (Mi l l ion B a r r e l s p e r Day)
1986 1987 1988 1989 1990 1991 1992 1993 1994 1995 1996
Average
Tota l Net I m p o r t s . . 7.893 Imports from 0PEC1/ 6.073 Imports from
P e r s i a n Gulf2/ Tota l 3.513 Bahrain . 002 I r a n .511 I r a q .717 Kuwait .456 U.A.E .164 Q a t a r . . . . .054 Saudi Arabia 1.609
Imports from OPEC-Africa Tota l 2.309 Alger ia .615 Libya .967 Niger ia .727
Imports from OPEC-South America
To ta l .252 Venezuela . 252 Imports from OPEC-Far East Total . 002 Indonesia . 002
7.742 5.597
3.330 .001 .732 .905 .469 .206 .040 .978
2.058 .627 .962 .469
.208
.208
.002
.002
7.774 5.842
3.428 .009 .850 .959 .474 .134 .021 .981
2.198 .646
1.071 .481
.220
.220
.005
.005
7 6
3
1
1
2
1
.994
.188
.754
.005
.076
.897
.452
.214
.024
.086
.224
.648
.044
.532
.212
.212
.004
.004
8 6
3
1
1
2
1
.210
.633
.908
.020
.190
.591
.346
.446
.026
.290
.509
.683
.267
.559
.227
.227
.008
.008
8.588 6.728
3.660 .002
1.132 .000 .019 .281 .009
2.217
2.818 .757
1.332 .729
.249
.249
.002
.002
8 6
3
1
2
2
1
.459
.758
.666
.003
.113
.000
.142
.199
.006
.203
.818
.772
.361
.686
.268
.268
.009
.009
8 6
4
1
2
2
1
.127
.794
.048
.004
.253
.001
.461
.092
.000
.237
.491
.693
.193
.605
.240
.240
.019
.019
7 6
3
1
2
2
1
.355
.385
.506
.003
.074
.000
.302
.067
.000
.060
.644
.690
.233
.721
.219
.219
.019
.019
7.226 6.154
3.365 .000
1.149 .000 .269 .011 .002
1.933
2.500 .724
1.201 .575
.273
.273
.017
.017
7.339 6.053
3.171 .001
1.059 .006 .288 .004 .002
1.811
2.644 .746
1.204 .694
.206
.206
.033
.033
XI OPECoiOrganization of Petroleum Exporting Countries. See Appendix A for countries in this group. 2/ The Persian Gulf countries are all members of OPEC, except for Bahrain. Notes: •imports include crude oil, natural gas liquids, and refined products, and are on a direct basis. '"OECD Europe"
consists of Austria, Belgium, Denmark, Finland, France, Germany, Greece, Iceland, Ireland, Italy, Luxembourg, the Netherlands, Norway, Portugal, Spain, Sweden, Switzerland, Turkey, and the United Kingdom. 'Negative numbers represent net exports. •A dash (-) indicates no trade. 'Zeroes (.000) indicate net imports of less than 0.0005 million barrels per day. 'Data for 1995
are preliminary. Sources: See end of Section 4.
Energy Information Administration / International Petroleum Statistics Report March 1998 51

Table 4.13 France—Net Oil Imports, 1986-1996 *1 a i£iT» 1*totr\
1986 1987 L988 1989 1990 1991 1992 1993 1994 1995 1996
Average
Total Net Imports.. 1.682 Imports from OPEC1/ .882 Imports from Persian Gulf2/
Total .586 Bahrain .001 Iran .065 Iraq . 109 Kuwait . 023 U.A.E .035 Qatar .030 Saudi Arabia .324 Imports from OPEC-Africa Total .279 Algeria .089 Libya .061 Nigeria . 129 Imports from OPEC-South America
Total .019 Venezuela . 019 Imports from OPEC-Far East Total .000 Indonesia . 000
1.742 .684
.459 -
.088
.151
.044 -
.002
.175
.212
.072
.064
.076
.012
.012
-
1.718 .737
.484
.007
.012
.143
.017
.017
.017
.271
.249
.079
.090
.079
.011
.011
-
1.711 .875
.647
.002
.158
.128
.021
.040
.009
.288
.218
.089
.065
.064
.012
.012
.000
.000
1.750 1.101
.864
.011
.182
.062
.015
.233
.022
.339
.233
.092
.079
.062
.015
.015
.000
.000
1.869 1.021
.708
.000
.171
.000
.011
.064
.003
.459
.296
.107
.104
.084
.017
.017
.001
.001
1.784 .932
.640
.001
.151
.000
.029
.033
.002
.424
.281
.105
.087
.090
.011
.011
.001
.001
1.761 1.006
.757
.002
.243
.000
.032
.025
.000
.454
.242
.066
.063
.112
.010
.010
.000
.000
1.615 .956
.651
.000
.156
.000
.016
.003
.000
.477
.301
.089
.059
.153
.003
.003
.000
.000
1.721 .911
.647
.000
.208
.000
.022
.002
.000
.416
.262
.103
.043
.115
.002
.002
.000
.000
1.738 .897
.573
.001
.172
.000
.017
.001
.000
.381
.323
.105
.051
.168
.001
.001
.000
.000
XI OPEC=Organization of Petroleum Exporting Countries. See Appendix A for countries in this group. 2/ The Persian Gulf countries are all members of OPEC, except for Bahrain. Notes: 'Imports include Crude Oil, Natural Gas Liquids, and Refined Products, and are on a direct basis. 'Negative numbers
represent net exports. »A dash (-) indicates no trade. 'Zeroes (.000) indicate net imports of less than 0.0005 million barrels per day. 'Data for 1995 are preliminary.
Sources: See end of Section 4.
52 Energy Information Administration / International Petroleum Statistics Report March 1998

Table 4.14 Germany—Net Oi l Imports , 1986-1996 (Million Barrels per Day)
1986 1987 1988 1989 1990 1991 1992 1993 1994 1995 1996
Average
Total Net Imports.. 2.380 Imports from OPEC1/ .830 Imports from
Persian Gulf2/ Total . 232 Bahrain Iran .041 Iraq . 016 Kuwait .021 U.A.E .004 Qatar Saudi Arabia .151 Imports from OPEC-Africa Total .484 Algeria . 137 Libya .152 Nigeria .195 Imports from
OPEC-South America Total .113 Venezuela . 113 Imports from OPEC-Far East Total .001 Indonesia . 001
.281
.675
.187 -
.020
.052
.017
.024
.001
.072
.401
.146
.160
.095
.086
.086
.002
.002
2.279 .761
.197 -
.051
.032
.013
.006
.001
.095
.472
.141
.237
.095
.091
.091
-
2.112 .739
.216 -
.041
.009
.022
.023
.002
.119
.436
.106
.235
.095
.086
.086
-
2.202 .771
.217 -
.055
.004
.013
.016
.003
.125
.465
.098
.244
.123
.088
.088
.002
.002
2.664 .859
.227 -
.053
.000
.000
.012
.002
.161
.524
.126
.262
.136
.107
.107
.000
.000
2.739 .957
.215 -
.021
.000
.009
.002
.001
.182
.614
.183
.252
.179
.128
.128
.000
.000
2.723 .948
.250
.000
.053
.000
.022
.002
.000
.173
.594
.195
.244
.154
.105
.105
.000
.000
2 .731 .838
.217
.001
.040
.000
.026
.001
.000
.149
.543
.161
.244
.139
.079
.079
.000
.000
2.699 .711
.172
.000
.031
.000
.015
.000
.000
.125
.461
.135
.234
.093
.078
.078
.000
.000
2.793 .660
.145
.000
.018
.000
.016
.000
.000
.111
.462
.125
.258
.079
.053
.053
.000
.000
XI OPEC-Organization of Petroleum Exporting Countries. See Appendix A for countries in this group. 2/ The Persian Gulf countries are all members of OPEC, except for Bahrain. Notes: •Imports include crude oil, natural gas liquids, and refined products, and are on a direct basis. 'Data through 1990
are for the former West Germany. 'Negative numbers represent net exports. *A dash (-) indicates no trade. 'Zeroes (.000) indicate net imports of less than 0.0005 million barrels per day. 'Data for 1995 are preliminary.
Sources: See end of Section 4.
Energy Information Administration / International Petroleum Statistics Report March 1998 53

Table 4.15 I t a ly—Net Oi l Imports , 1986-1996 ( M i l l i o n B a r r e l s p e r Day)
1986 1987 1988 1989 1990 1991 1992 1993 1994 1995 1996
Average
To ta l Net I m p o r t s . . 1.642 Imports from OPEC1/ 1.361 Imports from
P e r s i a n Gul f2 / To t a l .817 Bahrain . 001 I r a n .135 I r a q .114 Kuwait . 147 U.A.E .051 Qatar .004 Saudi Arabia .364
Imports from OPEC-Africa T o t a l . 505 A l g e r i a . 087 Libya .309 N i g e r i a . 110
Imports from OPEC-South America
To t a l .039 Venezuela . 039 Imports from OPEC-Far East Total Indonesia
1.718 1.307
.782
.000
.141
.167
.142
.109
.029
.194
.489
.109
.342
.038
.037
.037
-
1.590 1.191
.643 -
.093
.198
.118
.060
.002
.171
.516
.108
.389
.019
.029
.029
.002
.002
1.716 1.260
.619
.001
.124
.138
.093
.085
.008
.171
.626
.150
.430
.045
.014
.014
.002
.002
1.788 1.375
.626
.000
.192
.079
.063
.075
.000
.216
.740
.155
.556
.029
.007
.007
.003
.003
1.769 1.393
.595
.001
.231
.000
.000
.044
.004
.315
.793
.155
.581
.057
.004
.004
.001
.001
1.839 1.343
.573
.001
.239
.000
.007
.013
.001
.312
.757
.140
.584
.034
.005
.005
.009
.009
1.747 1.222
.548
.000
.221
.000
.012
.002
.000
.313
.653
.096
.542
.015
.002
.002
.019
.019
1.778 1.117
.430
.000
.143
.000
.001
.000
.000
.286
.660
.099
.543
.018
.007
.007
.019
.019
1.820 1.203
.494
.000
.233
.000
.000
.000
.002
.260
.679
.100
.562
.017
.014
.014
.015
.015
1.791 1.244
.502
.001
.263
.000
.000
.000
.002
.236
.714
.110
.580
.025
.008
.008
.021
.021
XI OPECaOrganization of Petroleum Exporting Countries. See Appendix A for countries in this group. 2/ The Persian Gulf countries are all members of OPEC, except for Bahrain. Notes: 'Imports include Crude Oil, Natural Gas Liquids, and Refined Products, and are on a direct basis. 'Negative numbers
represent net exports. «A dash (-) indicates no trade. 'Zeroes (.000) indicate net imports of less than 0.0005 million barrels per day. 'Data for 1995 are preliminary. Sources: See end of Section 4.
54 Energy Information Administration / international Petroleum Statistics Report March 1998

Table 4.16 OECD Imports from Iraq, (Million Barrels per Day)
1986-1996
1986 1987 1988 1989 1990 1991 1992 1993 1994 1995 1996
Average
Tota l 0.964 United S t a t e s V . . . . .081 Canada OECD Europe2/...... .717 Main European Importers France . 109 Germany3/ . 016 Italy .114 Netherlands . 067 Spain . 117
European Net Exporters United Kingdom.... .071 Smaller European Importers Austria Belgium . 026 Denmark Greece . 030 Portugal . 024 Sweden Switzerland Turkey . 143 Japan . 164 Other OECD . 002
1.103 .083 .010 .905
.151
.052
.167
.034
.080
.082
.015
.049
.001
.065
.019
.003
.000
.188
.105
.000
1.489 .343 .001 .959
.143
.032
.198
.039
.092
.070
.007
.037 -
.059
.029
.003 -
.250
.173
.013
1.581 .449 .013 .897
.128
.009
.138
.101
.109
.034
.000
.047 -
.052
.024
.005
.000
.250
.219
.003
1.276 .518 .011 .591
.062
.004
.079
.117
.063
.027
.000
.029
.000
.044
.019
.000
.000
.146
.146
.011
0.000 .000 .000 .000
.000
.000
.000
.000
.000
.000
.000
.000
.000
.000
.000
.000
.000
.000
.000
.000
0.000 .000 .000 .000
.000
.000
.000
.000
.000
.000
.000
.000
.000
.000
.000
.000
.000
.000
.000
.000
0.001 .000 .000 .001
.000
.000
.000
.000
.000
.000
.001
.000
.000
.000
.000
.000
.000
.000
.000
.000
0.000 .000 .000 .000
.000
.000
.000
.000
.000
.000
.000
.000
.000
.000
.000
.000
.000
.000
.000
.000
0.000 .000 .000 .000
.000
.000
.000
.000
.000
.000
.000
.000
.000
.000
.000
.000
.000
.000
.000
.000
0.007 .001 .000 .006
.000
.000
.000
.000
.002
.000
.000
.000
.000
.000
.000
.000
.000
.003
.000
.000
XI U.S. geographic coverage is the 50 States and District of Columbia. 2/ "OECD Europe" consists of Austria, Belgium, Denmark, Finland, France, Germany, Greece, Iceland, Ireland, Italy,
Luxembourg, the Netherlands, Norway, Portugal, Spain, Sweden, Switzerland, Turkey, and the United Kingdom. 3/ Data through 1990 are for the former West Germany. Notes: 'Imports include crude oil, natural gas liquids, and refined products, and are on a direct basis. *OECD-Organization
for Economic Cooperation and Development. See Appendix A for countries in this group. 'Negative numbers represent net exports. •A dash (-) indicates no trade. 'Zeroes (.000) indicate net imports of less than 0.0005 million barrels per day. 'Data for 1995
are preliminary. Sources: See end of Section 4.
Energy Information Administration / International Petroleum Statistics Report March 1998 55

Table 4.17 OECD Imports from Kuwait, 1986-1996 (Mi l l i on B a r r e l s p e r Day)
1986 1987 1988 1989 1990 1991 1992 1993 1994 1995 1996
Average
T o t a l 0.829 Uni ted S t a t e s l / . . . . .068 Canada OECD Europe2/ .456 Main European Importers France . 023 Germany3/ . 021 Italy .147 Netherlands . 122 Spain .020
European Net Exporters Norway United Kingdom.... .014 Smaller European Importers Austria Belgium . 006 Denmark . 020 Finland Greece . 038 Portugal Sweden Switzerland Turkey .046 Japan .278 Other OECD .028
0.925 .082
-.469
.044
.017
.142
.150
.015
.011
.000
.045 -
.030
.001 --
.013
.347
.026
0.936 .092
-.474
.017
.013
.118
.189
.030
.006
.004 -
.060 -
.015
.003 --
.019
.341
.029
1.084 .157
-.452
.021
.022
.093
.194
.015
.006
.002 -
.066 -
.009
.003
.001 -
.019
.458
.017
0.740 .086 .004 .346
.015
.013
.063
.151
.010
.045
.000
.000
.034 -
.000
.002
.001 -
.011
.291
.013
0.039 .006
-.019
.011
.000
.000
.002
.003
.002
.000
.001
.000
.000
.000
.000
.000
.000
.000
.014
.000
0.414 .051
-.142
.029
.009
.007
.052
.000
.027
.000
.006
.000 -
.002
.000
.000
.000
.010
.220
.000
1.191 .353 .000 .461
.032
.022
.012
.254
.015
.000
.049
.000
.056
.000 -
.005
.000
.002
.000
.016
.368
.009
1.081 .312 .027 .302
.016
.026
.001
.179
.000
.000
.058
.000
.005
.000 -
.001
.000
.000
.000
.016
.430
.011
0.997 .218 .000 .269
.022
.015
.000
.176
.000
.000
.039
.000
.004
.000 -
.000
.000
.000
.000
.014
.501
.009
1.034 .236 .000 .288 .017 .016 .000 .193 .000 .000 .032
.000
.015
.000 -
.000
.000
.000
.000
.015
.500
.010
1/ U.S. geographic coverage is the 50 States and District of Columbia. 2/ "OECD Europe" consists of Austria, Belgium, Denmark, Finland, France, Germany, Greece, Iceland, Ireland, Italy,
Luxembourg, the Netherlands, Norway, Portugal, Spain, Sweden, Switzerland, Turkey, and the United Kingdom. 3/ Data through 1990 are for the former West Germany. Notes: 'Imports include crude oil, natural gas liquids, and refined products, and are on a direct basis. *OECD-Organization
for Economic Cooperation and Development. See Appendix A for countries in this group. 'Negative numbers represent net exports. •A dash (-) indicates no trade. 'Zeroes (.000) indicate net imports of less than 0.0005 million barrels per day. 'Data for 1995
are preliminary. Sources: See end of Section 4.
56 Energy Information Administration / International Petroleum Statistics Report March 1998

Sources for Section 4 (Historical Oil Data)
Crude Oil Production, Natural Gas Liquids Production, Other Liquids, and Refinery Gain
United States: • Energy Information Administration (EIA), Petroleum Supply Annual 1996: • Bureau of Mines, Mineral Industry Surveys, Petroleum Statement. Annual, various issues.
Other Countries: • EIA, International Energy Annual, various issues. • EIA, International Petroleum Annual. 1978. • United Nations, Yearbook of World Energy Statistics. 1979. Refinery Gains: National Petroleum Council, U.S. Petroleum Refinery Study. October 1986.
Oil Stocks
United States: EIA, Petroleum Supply Annual 1996.
Other OECD Countries: • 1973-1982: Organization for Economic Cooperation and Development (OECD), Quarterly Oil Statistics and Energy Balances, various issues. • 1983-1997: OECD, Monthly Oil Statistics in the EIA, International Energy Database.
Oil Demand
United States: EIA, Petroleum Supply Annual 19%.
Other OECD Countries: • 1973-1981: OECD, Quarterly Oil Statistics and Energy Balances, various issues. • OECD, Annual Oil Statistics data base, 1970-1979. • 1982-1997: OECD, Monthly Oil Statistics in the EIA International Energy Database.
Oil Imports
United States: Energy Information Administration (EIA), Petroleum Supply Annual 1996.
Other OECD Countries: • Organization for Economic Cooperation and Development (OECD), Quarterly Oil Statistics and Energy Balances, various issues. • OECD Monthly Oil Statistics database, 1991-1997.
Energy Information Administration / International Petroleum Statistics Report March 1998 57


Appendix A
Organizational and Geographical Definitions

Appendix A. Organizational and Geographical Definitions
International Energy Agency (IEA) countries are: Australia, Austria, Belgium, Canada, Denmark, Finland, France, Germany, Greece, Ireland, Italy, Japan, Luxembourg, Netherlands, New Zealand, Norway, Portugal, Spain, Sweden, Switzerland, Turkey, United Kingdom, and United States.
Organization for Economic Cooperation and Development (OECD) countries are: Australia, Austria, Belgium, Canada, Czech Republic, Denmark, Finland, France, Germany, Greece, Hungary, Iceland, Ireland, Italy, Japan, Luxembourg, Mexico, Netherlands, New Zealand, Norway, Poland, Portugal, South Korea, Spain, Sweden, Switzerland, Turkey, United Kingdom, and United States. Total OECD includes the United States Territories (Guam, Puerto Rico, and the U.S. Virgin Islands). Total OECD excludes data for Czech Republic, Hungary, Mexico, Poland, and South Korea which are not yet available.
OECD Europe countries are: Austria, Belgium, Czech Republic, Denmark, Finland, France, Germany, Greece, Hungary, Iceland, Ireland, Italy, Luxembourg, Netherlands, Norway, Poland, Portugal, Spain, Sweden, Switzerland, Turkey, and United Kingdom. OECD Europe excludes data for Czech Republic, Hungary, and Poland which are not yet available.
Organization of Petroleum Exporting Countries (OPEC) members are: Algeria, Indonesia, Iran, Iraq, Kuwait, Libya, Nigeria, Qatar, Saudi Arabia, the United Arab Emirates, and Venezuela. As of December 31, 1992, Ecuador withdrew its membership in OPEC, and as of December 31, 1994, Gabon withdrew its membership. For consistency, Ecuador and Gabon are excluded in the historical series of OPEC totals.
Arab members of OPEC are: Algeria, Iraq, Kuwait, Libya, Qatar, Saudi Arabia and the United Arab Emirates.
Orgnniggturn of Arsb Petroleum Ex^ortin0 Countries 'OAPEO are: Algeria, Bahrain, E(runt, Ir^f, Kuwait, L-ibva, Neutral Zone, f"httar, Saudi Arabia, Syria, Tunisia, and the United Arab Emirates. In April 1979 Egypt was suspended from OAPEC membership. Li May 1989 Egypt rejoined OAPEC. For consistency, Egypt is included in the historical series of the OAPEC totals.
Persian (Arabian) Gulf countries are: Bahrain, Iran, Iraq, Kuwait, Qatar, Saudi Arabia, and the United Arab Emirates.
The term "Former USSR" is being used in the International Petroleum Statistics Report as a purely geographical expression, referring to the Commonwealth of Independent States (CIS), Georgia, and the three Baltic States (Estonia, Latvia, and Lithuania).
60 Energy Information Administration / International Petroleum Statistics Report March 1998

Appendix B
Explanatory Notes

Appendix B. Explanatory Notes
Note 1: World Oil Supply
Supply includes production of crude oil (including lease condensate), natural gas plant liquids, other hydrogen and hydrocarbons for refinery feedstocks, refinery gain, alcohol, and liquids produced from coal and other sources. Beginning in 1993, U.S. data includes fuel ethanol blended into finished motor gasoline and oxygenate production from merchant MTBE plants.
Note 2: Oil Stocks
The International Energy Agency (IEA) assembles and reports total oil stock data for the member countries of the Organization for Economic Cooperation and Development (OECD). Oil stocks include crude oil (including strategic reserves), unfinished oils, natural gas plant liquids, and refined petroleum products. In its report titled Quarterly Oil Statistics and Energy Balances of OECD Countries, the IEA defines oil stocks as follows: "All non-military stocks held by importers (including all final consumers directly), refiners, Governments, major non-importing final consumers eligible under JJEA/OECD commitments and by foreign entities in the following facilities: bulk terminals, refinery tanks, pipeline tankage, barges, intercoastal tankers (when port of departure and destination are in the reporting country), tankers in port (to the extent that their cargo is to be unloaded in the reporting country), and inland ship bunkers. Oil is reported regardless of the ownership of such storage facilities." IEA data exclude "oil held in pipelines, rail and truck tank cars, sea-going ships' bunkers, service stations, retail stores and tankers at sea." Also the IEA defines the United States to be the 50 States and the District of Columbia, and the U.S. Territories (Guam, Puerto Rico, and the U.S. Virgin Islands). The Energy Information Administration (EIA) does not include the United States Territories in its statistical definition of the United States. Further, the EIA includes oil in oil pipelines as part of its stock data. Tables 1.5, 1.6, 2.3, and 4.4 include oil stocks for the United States according to EIA definitions. Using IEA definitions, at the end of September 1997 United States (including territories) oil stocks totaled 1,450 million barrels.
Note 3: A Change to the Oil Balance in Section 2.
Prior to August 1992, Section 2 of the International Petroleum Statistics Report presented a balance of oil supply, demand, and stock change for the Market Economies, at quarterly time intervals. The communist countries, or Centrally Planned Economies (CPEs) were not included in the balance, mainly because good quarterly data for oil demand in these countries were not available. Net imports from the CPEs were included in the balance as part of total Market Economies supply. At present, the former Soviet Union and most of the countries of Eastern Europe are in transition from communism to market economies; because of this there are no longer good political or economic reasons to publish an oil balance only for the countries that have traditionally been market economies. Beginning with the August 1992 edition, Section 2 of the International Petroleum Statistics Report was changed from a Market Economies oil balance to a world oil balance.
The main data issues related to this change may be summarized as follows:
Supply Data. Monthly oil supply data are available for all countries of the world. These data are used to generate Tables 1.1 to 1.4; they were used to expand the Section 2 supply table (Table 2.2) to the whole world.
Demand Data. EIA has now developed quarterly figures for world oil demand, including demand in the former CPEs; these are published in Table 4 of EIA's Short-Term Energy Outlook. The procedures involved in developing quarterly world demand numbers may be summarized as follows:
62 Energy Information Administration / International Petroleum Statistics Report March 1998

Complete monthly data are available for the 24 OECD countries. Annual demand data for all countries (about 200 countries) are presented in EIA's International Energy Annual. In 1993, the OECD accounted for about three-fifths of total world demand, the 25 largest consumers outside of the OECD accounted for about one-third of the world total, and the remaining countries (about 150 countries) accounted for less than one-tenth of the total. The key problem, therefore, is to develop good figures for the 25 largest consumers outside the OECD.
Of these 25 countries, by far the largest consumer is Russia, which in 1993 accounted for about one-sixth of the demand in the group of 25. The next largest consumer is China, which in 1993 accounted for about one-seventh of the demand in the group. Thus in 1993 Russia and China accounted for one-third of the demand in the group of 25. For these 2 countries, data are available on oil production and net exports. The demand numbers shown in Section 2 are computed as production minus net exports. This is the same procedure used in the EIA Short-Term Energy Outlook, by the International Energy Agency in their Monthly Oil Market Report, and in other respected publications that deal with international oil markets. Note, however, that this method of computing demand ignores both refinery gain and stock changes.
For other major consuming countries outside of the OECD, quarterly demand data are developed based upon the latest available annual data, analytic judgment about current trends, and some seasonal adjustments. These are the same procedures used for the Short-Term Energy Outlook.
Stocks Data. Reliable stocks data are available for the OECD countries. Estimates of stocks for export and afloat, and of commercial floating stocks, are available. (See sources at the end of Section 2.)
For on-land stocks outside the OECD, there is little reliable data. Most estimates of on-land stocks outside the OECD are based on the theory that stocks are approximately equal to some number of days of demand. Demand figures (which themselves involve some degree of estimation) are then used to compute estimates of stock levels.
In the International Petroleum Statistics Report, it had been the practice for some time to estimate that on-land stocks in the traditional market economies outside of the OECD were equal to 55 days of demand. This was acceptable, mainly because the rule was used only to estimate a relatively small part of total stocks (about 16 percent).
When Section 2 was converted from a Market Economies oil balance to a world oil balance, there were important changes in the conditions that made it reasonable to estimate on-land stocks outside of the OECD using the rule of 55 days of demand. When the CPEs are included, the stocks that must be estimated are a considerably larger part of the total. In 1990, total oil demand in the former CPEs was more than 80 percent as large as demand in all of the non-OECD traditional market economies. Thus the quantity of stocks that would have to be estimated using a 55-day rule would nearly double, and the estimated components of stock levels and stock changes would become relatively large parts of the total. One consequence of this is that the statistical discrepancy (as shown in Table 2.1) would become less useful as an indicator of the overall consistency of the data. The statistical discrepancy is computed from supply, demand, and stock change. If a large part of the stock change is estimated, then the statistical discrepancy loses much of its significance.
As already noted, quarterly demands in the former Soviet Union and in China are computed as production minus net exports. This computation implicitly assumes a zero stock change. Demand in the former Soviet Union is falling. If we were to use a 55-day rule to compute stock levels, falling demand would imply falling stock levels. This would contradict the assumption of zero stock change which was used in computing demand.
Energy Information Administration / International Petroleum Statistics Report March 1998 63

In view of all this, the following approach has been adopted. Table 2.3 now shows levels of stocks for the OECD countries, levels of stocks for export and afloat, and levels of commercial floating storage. Stock changes based on these stock levels are shown in Table 2.1. At this time, no other stock levels are shown. Table 2.1 now has a single line labelled "Other Stock Draw and Statistical Discrepancy", which contains the computed values needed to make the table balance.
It may become possible in the future to obtain reliable information on certain categories of on-land stocks outside the OECD. If such data become available, they will be added to Table 2.3, and the corresponding stock change information will be added to Table 2.1.
Changes in Formats and Sign Conventions. There were several changes in Section 2 to make the International Petroleum Statistics Report more consistent with other EIA publications, especially with the Short-Term Energy Outlook. The numbers were changed from 1 decimal place to 2 decimal places. The word "consumption", as used before August 1992, was changed to "demand". The sign convention for stock changes in Table 2.1 was changed. Stock draws are now indicated by positive numbers, and stock additions are indicated by negative numbers. Table 2.1 also uses a new sign convention for the line labelled "Other Stock Draw and Statistical Discrepancy". The values in this line are now computed as Total Demand minus the sum of Total Supply and Total Reported Stock Draw. This is the reverse of the sign convention used before August 1992.
Summary. Section 2 was expanded from a Market Economies oil balance to a world oil balance. Supply data are tracked for all producing countries. Demand data are tracked for the 24 OECD countries, and for 25 large consumers outside of the OECD. Demand for the remaining countries (less than 10 percent of total demand) is estimated, for years that are not yet available in the International Energy Annual. The stock levels in these tables are based on reported data for the OECD and for stocks at sea. The line in Table 2.1 labelled "Other Stock Draw and Statistical Discrepancy" is a balancing item.
Energy Information Administration / International Petroleum Statistics Report March 1998

Appendix C
Glossary

Appendix C. Glossary
Alcohol. The family name of a group of organic chemical compounds composed of carbon, hydrogen, and oxygen. The molecules in the series vary in chain length and are composed of a hydrocarbon plus a hydroxyl group. Alcohol includes methanol and ethanol.
Demand (Consumption/Petroleum Products Supplied). Total petroleum products supplied is the sum of all petroleum products supplied. For each product, the amount supplied is calculated by summing production, crude oil burned directly, imports, and net withdrawals from primary stocks and subtracting exports.
Crude Oil. A mixture of hydrocarbons that existed in liquid phase in underground reservoirs and remains liquid at atmospheric pressure after passing through surface-separating facilities. Crude oil production is measured at the wellhead and includes lease condensate.
Government-Owned Stocks. Oil stocks owned by the national government and held for national security. In the United States these stocks are known as the Strategic Petroleum Reserve.
Lease Condensate. A liquid recovered from natural gas at the well or at small gas/oil separators in the field. Consists primarily of pentanes and heavier hydrocarbons (also called field condensate).
Natural Gas Plant Liquids. Products obtained from processing natural gas at natural gas processing plants, including natural gasoline plants, cycling plants, and fractionators. Products obtained include ethane, liquefied petroleum gases, (propanes, butane, propane-butane mixtures, and ethane-propane mixtures), isopentane, natural gasoline, unfractionated streams, plant condensate, and other minor quantities of finished products, such as motor gasoline, special naphthas, jet fuel, kerosene, and distillate fuel oil.
Oil Stocks. Oil stocks include crude oil (including strategic reserves), unfinished oils, natural gas plant liquids, and refined petroleum products. See Explanatory Note 2.
Other Hydrocarbons. Other materials processed at refineries. Includes coal tar derivatives, hydrogen, gilsonite, and natural gas received by the refinery for reforming into hydrogen.
Oxygenates. Any substance which, when added to gasoline, increases the amount of oxygen in that gasoline blend. They include: Fuel Ethanol, Methanol, and MTBE (Methyl tertiary butyl ether).
Petroleum Products. Petroleum products are obtained from the processing of crude oil (including lease condensate), natural gas, and other hydrocarbon compounds. Petroleum products include unfinished oils, aviation gasoline, motor gasoline, naphtha-type jet fuel, kerosene-type jet fuel, kerosene, distillate fuel oil, residual fuel oil, ethane, liquefied petroleum gases, petrochemical feedstocks, special naphthas, lubricants, paraffin wax, petroleum coke, asphalt road oil, still gas, and other miscellaneous products.
Processing Gain. The amount by which the total volume of refinery output is greater than the volume of input for given period of time. The processing gain arises when crude oil and other hydrocarbons are processed into products that are, on average, less dense than the input.
Processing Loss. The amount by which the total volume of refinery output is less than the volume of input for given period of time. The processing loss arises when crude oil and other hydrocarbons are processed into products that are, on average, more dense than the input.
66 Energy Information Administration / International Petroleum Statistics Report March 1998

Appendix D
Estimation Procedures

Appendix D. Estimation Procedures
Estimation procedures are used for demand numbers in many of the countries outside of the OECD, in cases where data from EIA's International Energy Annual are not yet available. Demand numbers for 1995 and earlier years, for all countries, may be found in EIA's International Energy Annual 1995, published in December 1996, which is the most recent published edition of the International Energy Annual. EIA's WORLD ENERGY database contains final demand data for all countries of the world for 1994, and preliminary demand data for all countries for 1995. Instructions for downloading this database may be found on EIA's home page (http://www.eia.doe.gov/emeu/world/contents.html). The status of the demand numbers shown in Section 2 of this current International Petroleum Statistics Report may be summarized as follows.
The OECD demand numbers are, as usual, based on the latest Quarterly Oil Statistics and Monthly Oil Statistics tapes from the International Energy Agency.
For countries outside of the OECD, the following approach is used. The numbers for 1994 and earlier years match the demand numbers in the WORLD ENERGY database on EIA's home page. Numbers for 1995 forward are the best available EIA estimates, based upon the best annual data currently available, analytic judgment about current trends, and some seasonal adjustments. These are the same numbers that appear in the international oil balance table in EIA's Short-Term Energy Outlook.
The two largest non-OECD oil consumers are the former Soviet Union and China. For these two countries, published data are available on production and net exports. Demand is computed as production minus net exports. This is the same approach used in the Short-Term Energy Outlook, by the International Energy Agency in their Monthly Oil Market Report, and in other major publications dealing with international oil data. Note, however, that because of this computation, the demand numbers for the former Soviet Union and China implicitly exclude stock draw and refinery gain.
Energy Information Administration / International Petroleum Statistics Report March 1998

Appendix E
Conversions

Table El. Refined Petroleum Products Conversion Factors
Product Barrels per Metric Ton
Asphalt 6.06 Distillate Fuel Oil 7.46 Gasoline, Aviation 8.90 Gasoline, Motor 8.53 Greases 6.30 Jet Fuel, Kerosene-type 7.93 Jet Fuel, Naptha-type 8.27 Kerosene 7.73 Liquefied Petroleum Gas (LPG) 11.60 Lubricants 7.00 Miscellaneous Products 8.04 Naphthas 8.22 Natural Gas Liquids (NGL) 10.40 Natural Gasoline 10.00 Paraffin Oil 7.14 Paraffin Wax 7.87 Petrolatum 7.87 Petroleum Coke 5.51 Residual Fuel Oil 6.66 White Spirits 8.50
70 Energy Information Administration / International Petroleum Statistics Report March 1998

Table E2. Barrels of Crude Oil per Metric Ton, 1986-1995
1986 1987 1988 1989 1990 1991 1992 1993 1994 1995
North America Canada 7.453 Mexico 6.965 United States 7.333 Central & South America Argentina 7.149 Bolivia 7.881 Brazil . . . . . . . . . 7.268 Chile 7.506 Colombia 7.084 Cuba 6.449 Ecuador 7.130 Peru 7.407 Trinidad and Tobago 7.084 Venezuela 6.880 Western Europe Austria 7.082 Denmark 7.689 France 7.332 Germany Germany, East 7.340 Germany, West 7.247 Greece 7.178 Italy 6.853 Netherlands 6.853 Norway 7.810 Spain 7.506 Sweden 7.247 Turkey 7.150 United Kingdom 7.466 Former Yugoslavia 7.418 Croatia Serbia and Montenegro Slovenia . . . . . . . . . . . . . ~-
7.453 6.965 7.333
7.149 7.881 7.268 7.506 7.084 6.449 7.130 7.407 7.084 6.880
7.082 7.689 7.332
— 7.340 7.247 7.178 6.853 6.853 7.810 7.506 7.247 7.150 7.466 7.418
- -- -—
7.453 6.965 7.333
7.149 7.881 7.268 7.506 7.084 6.449 7.130 7.407 7.084 6.880
7.082 7.689 7.332
— 7.340 7.247 7.178 6.853 6.853 7.810 7.506 7.247 7.150 7.466 7.418
- -- -—
7.453 6.965 7.333
7.149 7.881 7.268 7.506 7.084 6.449 7.130 7.407 7.084 6.880
7.082 7.689 7.332
— 7.340 7.247 7.178 6.853 6.853 7.810 7.506 7.247 7.150 7.466 7.418
— — —
7.186 6.965 7.333
7.120 7.881 7.056 7.506 7.080 6.449 7.130 7.407 7.084 6.890
7.200 7.405 7.332
— 7.340 7.247 7.231 7.300 7.239 7.644 7.506 7.247 7.200 7.523 7.418
— - -—
7.186 6.965 7.333
7.120 7.881 7.056 7.506 7.080 6.449 7.130 7.407 7.084 6.890
7.200 7.405 7.332 7.330
— —
7.231 7.300 7.239 7.644 7.506 7.247 7.200 7.523 7.418
- -- -—
7.186 6.965 7.333
7.120 7.881 7.056 7.506 7.080 6.449 7.130 7.407 7.084 6.890
7.200 7.405 7.332 7.330
— —
7.231 7.300 7.239 7.644 7.506 7.247 7.200 7.523
— 7.418 7.418
—
7.186 6.965 7.333
7.120 7 .881 7.056 7.506 7.080 6.449 7.130 7.407 7.084 6.890
7.200 7.405 7.332 7.330
— —
7.231 7.300 7.239 7.644 7.506 7.247 7.200 7.523
- -7.418 7.418 7.418
7.186 6.965 7.333
7.120 7 .881 7.056 7.506 7.080 6.449 7.130 7.407 7.084 6.890
7.200 7.405 7.332 7.330
— —
7.231 7.300 7.239 7.644 7.506 7.247 7.200 7.523
—• 7.418 7.418 7.418
7.186 6.965 7.333
7.120 7.881 7.056 7.506 7.080 6.449 7.130 7.407 7.084 6.890
7.200 7.405 7.332 7.330
— —
7.231 7.300 7.239 7.644 7.506 7.247 7.200 7.523
— 7.418 7.418 7.418
— - No Production of this form of energy. Sources: International Energy Annual 1995. DOE/EIA-0219(95) (96/12) (December 1996)
Energy Information Administration / International Petroleum Statistics Report March 1998 71

Table E2. Barrels of Crude Oil per Metric Ton, 1986-1995 (continued)
1986
Eastern Europe & Former U.S.S.R. Albania 6.594 Bulgaria Former Czechoslovak!) Czech Republic . . Slovakia Hungary . . . Poland . . . Romania . . . Former U.S.S.R Azerbaijan Belarus . . . Georgia . . . Lithuania . . Kazakstan . . Kyrgyzstan Russia . . . Tajikistan Turkmenistan Ukraine . . . . Uzbekistan
i 7.332 6.780
— ,
6.690 7.418 7.506 7.270
— — — — — — — — — — —
Middle East
— » No Production of this form of energy. Sources: Int .ernat: .on ia] 3 &e >rS V Annual 1995.
1987
6.594 7.332 6.780
— —
6.690 7.418 7.506 7.270
------— — — — — __ — —
7.320 7.305 7.426 7.247 7.190 7.245 7.332 7.500 7.268 6.836 7.480 7.636
1988
6.594 7.332 6.780
— —
6.690 7.418 7.506 7.270
— — — — — — — — — — —
7.320 7.305 7.426 7.247 7.190 7.245 7.332 7.500 7.268 6.836 7.480 7.632
DOE/EIA-0219(95)
1989
6.594 7.332 6.780
--—
6.690 7.418 7.506 7.270
--— — — — — — — — — —
7.320 7.305 7.426 7.247 7.190 7.245 7.332 7.500 7.268 6.836 7.480 7.632
(96/12)
1990
6.594 7.332 6.780
--—
6.690 7.418 7.506 7.270
--— — --— — — — --— —
7.320 7.305 7.430 7.247 7.190 7.250 7.330 7.500 7.323 6.836 7.480 7.631
1991
6.594 7.332 6.780
— --
6.690 7.418 7.506 7.270
— --— — — — — — __ — —
7.320 7.305 7.430 7.247 7.190 7.250 7.330 7.500 7.323 6.836 7.480 7.631
1992
6.594 7.332 6.780
--—
6.690 7.418 7.506
— 7.270 7.270 7.270
— 7.270 7.270 7.270 7.270 7.270 7.270 7.270
7.320 7.305 7.430 7.247 7.190 7.250 7.330 7.500 7.323 6.836 7.480 7.631
(December 1996).
1993
6.594 7.332
— 6.780 6.780 6.690 7.418 7.506
--7.270 7.270 7.270 7.270 7.270 7.270 7.270 7.270 7.270 7.270 7.270
7.320 7.305 7.430 7.247 7.190 7.250 7.330 7.500 7.323 6.836 7.480 7.631
1994
6.594 7.332
--6.780 6.780 6.690 7.418 7.506
— 7.270 7.270 7.270 7.270 7.270 7.270 7.270 7.270 7.270 7.270 7.270
7.320 7.305 7.430 7.247 7.190 7.250 7.330 7.500 7.323 6.836 7.480 7.631
1995
6.594 7.332
— 6.780 6.780 6.690 7.418 7.506
--7.270 7.270 7.270 7.270 7.270 7.270 7.270 7.270 7.270 7.270 7.270
7.320 7.305 7.430 7.247 7.190 7.250 7.330 7.500 7.323 6.836 7.480 7.631
72 Energy Information Administration / International Petroleum Statistics Report March 1998

Table E2. Barrels of Crude Oil per Metric Ton, 1986-1995 (continued)
1986 1987 1988 1989 1990 1991 1992 1993 1994 1995
Africa Algeria 7.936 Angola 7.409 Benin 6.870 Cameroon . . . . . 7.205 Congo 7.506 Cote d'lvoire (Ivory Coast) . . . . 7.285 Egypt 7.256 Equatorial Guinea Gabon 7.305 Ghana 7.285 Libya 7.515 Morocco 7.600 Nigeria 7.315 South Africa Sudan Tunisia 7.689 Zaire 7.320 Far East & Oceania Australia 7.855 Bangladesh 7.453 Brunei 7.340 Burma 7.084 China 7.320 India 7.600 Indonesia 7.558 Japan 7.285 Malaysia 7.641 New Zealand 8.127 Pakistan 7.500 Papua New Guinea Philippines 7.285 Taiwan 6.568 Thailand 6.758 Vietnam 7.082
7.936 7.409 6.870 7.205 7.506 7.285 7.256
— 7.305
— 7.515 7.600 7.315
— —
7.689 7.320
7.855 7.453 7.340 7.084 7.320 7.600 7.558 7.285 7.641 8.127 7.500
— 7.285 6.568 6.758 7.082
7.936 7.409 6.870 7.205 7.506 7.285 7.256
— 7.305
— 7.515 7.600 7.315
— —
7.689 7.320
7.855 7.453 7.340 7.084 7.320 7.600 7.558 7.285 7.641 8.127 7.500
— 7.285 6.568 6.758 7.082
7.936 7.409 6.870 7.205 7.506 7.285 7.256
— 7.305
— 7.515 7.600 7.315
— —
7.689 7.320
7.855 7.453 7.340 7.084 7.320 7.600 7.558 7.285 7.641 8.127 7.500
- -7.285 6.568 6.758 7.082
8.130 7.409 6.870 7.205 7.506 7.285 7.256
— 7.305
— 7.580 7.600 7.315
— —
7.689 7.320
7.868 7.453 7.340 7.084 7.320 7.600 7.558 7.357 7.641 8.127 7.500
- -7.285 6.568 6.758 7.082
8.130 7.409 6.870 7.205 7.506 7.285 7.256 8.077 7.305
— 7.580 7.600 7.315
— —
7.689 7.320
7.868 7.453 7.340 7.084 7.320 7.600 7.558 7.357 7.641 8.127 7.500 7.809 7.285 6.568 6.758 7.082
8.130 7.409 6.870 7.205 7.506 7.285 7.256 8.077 7.305 7.285 7.580 7.600 7.315 9.853 7.452 7.689 7.320
7.868 7.453 7.340 7.084 7.320 7.600 7.558 7.357 7.641 8.127 7.500 7.809 7.285 6.568 6.758 7.082
8.130 7.409 6.870 7.205 7.506 7.285 7.256 8.077 7.305 7.285 7.580 7.600 7.315 9.853 7.452 7.689 7.320
7.868 7.453 7.340 7.084 7.320 7.600 7.558 7.357 7.641 8.127 7.500 7.809 7.285 6.568 6.758 7.082
8.130 7.409 6.870 7.205 7.506 7.285 7.256 8.077 7.305 7.285 7.580 7.600 7.315 9.853 7.452 7.689 7.320
7.868 7.453 7.340 7.084 7.320 7.600 7.558 7.357 7.641 8.127 7.500 7.809 7.285 6.568 6.758 7.082
8.130 7.409 6.870 7.205 7.506 7.285 7.256 8.077 7.305 7.285 7.580 7.600 7.315 9.853 7.452 7.689 7.320
7.868 7.453 7.340 7.084 7.320 7.600 7.558 7.357 7.641 8.127 7.500 7.809 7.285 6.568 6.758 7.082
— - No Production of this form of energy. Sources: International Energy Annual 1995. DOE/EIA-0219(95) (96/12) (December 1996).
Energy Information Administration / International Petroleum Statistics Report March 1998 73