Embed Size (px)
Citation preview
International Journal of
Chemical Reactor EngineeringVolume Article A
Dodecane Decomposition in a
Radio-Frequency (RF) Plasma
Reactor
Laura Merlo-Sosa∗ Gervais Soucy†
∗University of Sherbrooke, [email protected]†Universite de Sherbrooke, [email protected]
ISSN 1542-6580Copyright c©2005 by the authors.
All rights reserved. No part of this publication may be reproduced, stored in a retrievalsystem, or transmitted, in any form or by any means, electronic, mechanical, photocopying,recording, or otherwise, without the prior written permission of the publisher, bepress, whichhas been given certain exclusive rights by the author.

Dodecane Decomposition in a Radio-Frequency(RF) Plasma Reactor
Laura Merlo-Sosa and Gervais Soucy
Abstract
The research outlined here includes a study of the production of carbon black(CB) in an inductive plasma reactor, using dodecane (C12H26) as the startingmaterial. Thermodynamic and kinetic studies were carried out to predict thespecies concentrations likely to be obtained in the pyrolysis process at plasmatemperatures. A thorough statistical experimental design was undertaken toinvestigate the influence of the different operational conditions such as: the feedrates of dodecane, the reactor pressure, the plate power applied to the plasmatorch and the composition of the plasma gas, on the production of carbon blackand gaseous acetylene-like compounds. Thermodynamic and kinetic modelswere compared with experimental results, a kinetic reaction model best repre-senting the experimental results. Morphological analysis of the solid productusing Transmission Electron Microscopy (TEM) indicates that a high plasmatemperature is the most important factor affecting the final morphology of thecarbon black formed during the reaction. Carbon black with average particlesize of 10-30 nm and specific surface of 130 m2/g was obtained. Morphologicalanalyses also demonstrated the presence of new structures ranging from carbonblack to fullerenes and including certain “graphitized” carbon molecules.
KEYWORDS: Carbon Black, Thermal Plasma, Plasma Reactor, Dodecane
1. INTRODUCTION
Plasma technology has been used since 1980 as an alternate method for generating carbon black that takes advantage of the plasma's high enthalpy property. The principle of carbon black manufacture, by the "cracking" of a hydrocarbon vapour using a plasma source, was patented in France in 1980 (Fulcheri et al., 1995), and several studies have since been dedicated to this subject. Thus in 1983, Ibberson et al. used a 15-kW RF induction plasma reactor to process various hydrocarbons. Methane, n-hexane and benzene were fed to the reactor and carbon black, in high yields, of up to 98%, were obtained, with a corresponding low energy requirement per kg of carbon produced (2.2 kWh per kg of carbon). Bolouri and Amouroux (1986) described carbon (acetylene) black production by direct processing of natural gas in an argon RF plasma reactor. Overall, their results show that, with a well-designed reactor, almost all input methane can be converted to carbon and acetylene. The carbon yield reaches ~ 45% when the total methane conversion rate approaches 100%. The solid product obtained presents similar qualities to those of acetylene black obtained by the classical processes. Two, more recent laboratory-scale investigations of carbon black production have been conducted using a HF plasma reactor at the Plasma Technology Research Center, in Canada (Bergeron, 1997; Lavoie, 1997). Light hydrocarbons were used as the feedstock in the process and plasma power levels of between 25 and 70 kW were used. In the first process stage, propane was fed to the system. The injection method employed was found to be the most important parameter in this plasma process. These authors found a relationship between the particular carbon black morphology and the method of feed injection. For example, radial injection produced "flat" form particles similar to those present in acetylene black produced at high frequency. Axial injection produced very spherical form particles, comparable to those carbon blacks with specific surfaces in the order of 75 to 100 m2/g. A carbon black production rate of 0.35 g/s was obtained for the radial injection. Propane decomposition rates of between 70 and 100% were observed during these experiences. In the second described process, methane was fed to the plasma system, generating methane decomposition yields of ~100% and carbon black yields of ~ 55% at 60 kW. Carbon black, with particle sizes of between 20 and 80 nm and specific surfaces up to 250 m2/g, was obtained. The feed rates and the particular injection method employed were found to be the most important parameters determining the morphology of the carbon black produced. Specifically, smaller size particles, with higher specific surfaces, were found when the feed rate was increased. Impurities levels of below 100 ppm were found during these experiences. In 1990, Kvaerner started the development of the innovative Kvaerner CB&H process (Lynum, 1993). This process was considered primarily as a hydrogen-supply process (Gaudernack and Lynum, 1998). By pyrolysing the hydrocarbon feedstock, the process produces two valuable products, i.e. hydrogen and carbon black. The process yields almost 100 % in feedstock efficiency and the impurity levels of the process products are restricted to only those impurities introduced in the feedstock. Although the Kvaerner Engineering organization represents this technology for industrial scale application (Shaw, 1994), to date, no evidence has been forthcoming to demonstrate that the process can economically produce carbon black of commercial interest.
On the other hand, the use of plasma technology for the production of carbon black has been under active investigation in France since 1993. Initially, the 3-phase AC plasma reactor process employing graphite electrodes was used for carbon black synthesis from methane (Fulcheri et al., 1995). Following demonstration of the feasibility of the process, a new R&D project, involving industrial companies with the research organization, was initiated in 1997 (Fulcheri et al., 1999). This new, environmentally friendly plasma process, for the production of new carbon black grades and hydrogen, has been also patented (Schwob et al., 2000). Experiments have shown that a wide range of hydrocarbons could be used as the feedstock. The black obtained by the AC plasma method was characterized by the formation of rather small primary particles (~ 50 nm dia). They are abundant in an aggregate form and are highly fused together in the aggregate. The specific surface area values range from 52 to 80 m2/g and DBP range from 153 to 232 ml/100 g of carbon. This carbon black behaves in like manner to all other blacks, such as those used in many rubber compounds, and obeys similar rules (Fulcheri et al., 2002).
Because of their remarkable properties such as their high temperature and activated species density, thermal plasma processes are considered to be among the most promising technologies for the synthesis and production of new grades of carbon black. The objective of this present work is to further explore and study the production of carbon black, and the valuable gaseous by-products, using radio frequency (RF) inductively coupled plasma
1Merlo-Sosa and Soucy: Dodecane Decomposition in a Radio-Frequency (RF) Plasma Reactor
Produced by The Berkeley Electronic Press, 2005

technology. RF plasma systems offer broader control of the chemistry and increased processing residence times in comparison to those of other plasmas systems. The method is based on the evaporation and reaction of long-chain hydrocarbon molecules, using a RF plasma torch working with either inert or reductive plasma gases. Dodecane (C12H26) was used as the raw material, while argon-helium and argon-hydrogen were used as the inert or reductive plasma gases, respectively. Here, dodecane was used as the model molecule in order to simulate the conversion of heavy hydrocarbon molecules to form new special structures of carbon black powders and, at the same time, valuable lighter hydrocarbons for improved transportability. Additionally, dodecane acts as a representative molecule for the heavy hydrocarbons (i.e., more than 10 carbon atoms), along with reliable safety data and well-known thermodynamic properties.
2. THEORETICAL BACKGROUND
The use of high temperature hydrocarbon decomposition to produce carbon black has been studied from both the kinetics and the thermodynamics points of view. The thermodynamic study predicts the equilibrium concentrations of carbon black particles, lighter hydrocarbons and their precursor species, as a function of temperature. On the other hand, chemical kinetics, the description of chemical systems varying with time (Benson, 1976), predicts the reaction pathways for the formation of the precursors and final products, at the high reaction temperatures employed.
These theoretical studies permit the analysis of the thermodynamic and kinetic behavior of the plasma chemical system and the effect of operational conditions (temperature, pressure and composition) on the final carbon black and lighter hydrocarbons yields, and the total degradation of the model molecule, dodecane (C12H26).
2.1 Thermodynamic Study on Carbon Black Production
For a process involving a change in composition and occurring within a closed system at constant temperature and pressure, it has been long shown that the criterion for equilibrium establishment is that the Gibbs free energy be at its minimum value. The Gibbs free energy of a system consisting of N species can be written as:
∑=
∧=
N
1iiimix nG µ (1)
Where ni is the number of mols of component i and ∧
iµ is the chemical potential of component i in the
mixture.
According to the formulation of the complex chemical equilibrium given in Kyle (1999), the expression that describe the Gibbs free energy for components in a perfect gas mixture is given as;
∑ ∑= =
=+
+=N
1iil
m
1lli
fimix 0pln
RT
G
RT
G βλ∆ (2)
Where the second term on the right hand side of the expression is added to satisfy the elemental balance constraints.
2 International Journal of Chemical Reactor Engineering Vol. 3 [2005], Article A4
http://www.bepress.com/ijcre/vol3/A4
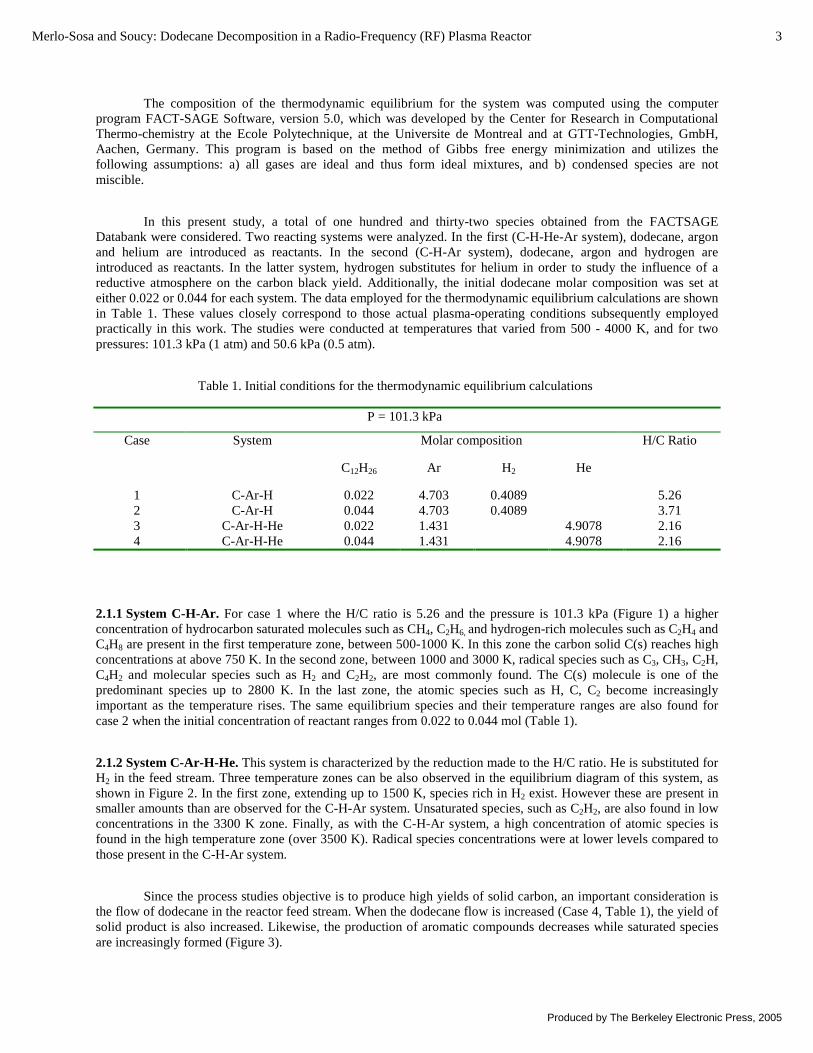
The composition of the thermodynamic equilibrium for the system was computed using the computer program FACT-SAGE Software, version 5.0, which was developed by the Center for Research in Computational Thermo-chemistry at the Ecole Polytechnique, at the Universite de Montreal and at GTT-Technologies, GmbH, Aachen, Germany. This program is based on the method of Gibbs free energy minimization and utilizes the following assumptions: a) all gases are ideal and thus form ideal mixtures, and b) condensed species are not miscible.
In this present study, a total of one hundred and thirty-two species obtained from the FACTSAGE Databank were considered. Two reacting systems were analyzed. In the first (C-H-He-Ar system), dodecane, argon and helium are introduced as reactants. In the second (C-H-Ar system), dodecane, argon and hydrogen are introduced as reactants. In the latter system, hydrogen substitutes for helium in order to study the influence of a reductive atmosphere on the carbon black yield. Additionally, the initial dodecane molar composition was set at either 0.022 or 0.044 for each system. The data employed for the thermodynamic equilibrium calculations are shown in Table 1. These values closely correspond to those actual plasma-operating conditions subsequently employedpractically in this work. The studies were conducted at temperatures that varied from 500 - 4000 K, and for two pressures: 101.3 kPa (1 atm) and 50.6 kPa (0.5 atm).
Table 1. Initial conditions for the thermodynamic equilibrium calculations
P = 101.3 kPa
Molar compositionCase System
C12H26 Ar H2 He
H/C Ratio
1 C-Ar-H 0.022 4.703 0.4089 5.262 C-Ar-H 0.044 4.703 0.4089 3.713 C-Ar-H-He 0.022 1.431 4.9078 2.164 C-Ar-H-He 0.044 1.431 4.9078 2.16
2.1.1 System C-H-Ar. For case 1 where the H/C ratio is 5.26 and the pressure is 101.3 kPa (Figure 1) a higher concentration of hydrocarbon saturated molecules such as CH4, C2H6, and hydrogen-rich molecules such as C2H4 and C4H8 are present in the first temperature zone, between 500-1000 K. In this zone the carbon solid C(s) reaches high concentrations at above 750 K. In the second zone, between 1000 and 3000 K, radical species such as C3, CH3, C2H, C4H2 and molecular species such as H2 and C2H2, are most commonly found. The C(s) molecule is one of the predominant species up to 2800 K. In the last zone, the atomic species such as H, C, C2 become increasingly important as the temperature rises. The same equilibrium species and their temperature ranges are also found for case 2 when the initial concentration of reactant ranges from 0.022 to 0.044 mol (Table 1).
2.1.2 System C-Ar-H-He. This system is characterized by the reduction made to the H/C ratio. He is substituted for H2 in the feed stream. Three temperature zones can be also observed in the equilibrium diagram of this system, as shown in Figure 2. In the first zone, extending up to 1500 K, species rich in H2 exist. However these are present in smaller amounts than are observed for the C-H-Ar system. Unsaturated species, such as C2H2, are also found in low concentrations in the 3300 K zone. Finally, as with the C-H-Ar system, a high concentration of atomic species is found in the high temperature zone (over 3500 K). Radical species concentrations were at lower levels compared to those present in the C-H-Ar system.
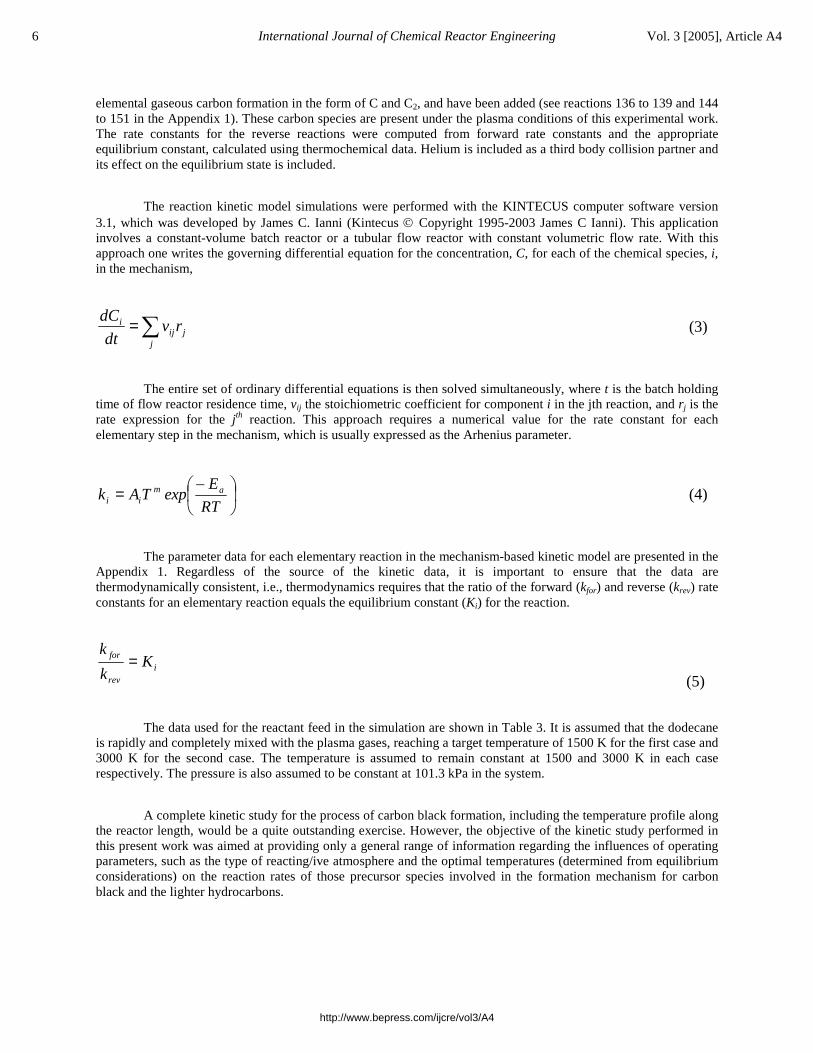
Since the process studies objective is to produce high yields of solid carbon, an important consideration is the flow of dodecane in the reactor feed stream. When the dodecane flow is increased (Case 4, Table 1), the yield of solid product is also increased. Likewise, the production of aromatic compounds decreases while saturated species are increasingly formed (Figure 3).
3Merlo-Sosa and Soucy: Dodecane Decomposition in a Radio-Frequency (RF) Plasma Reactor
Produced by The Berkeley Electronic Press, 2005
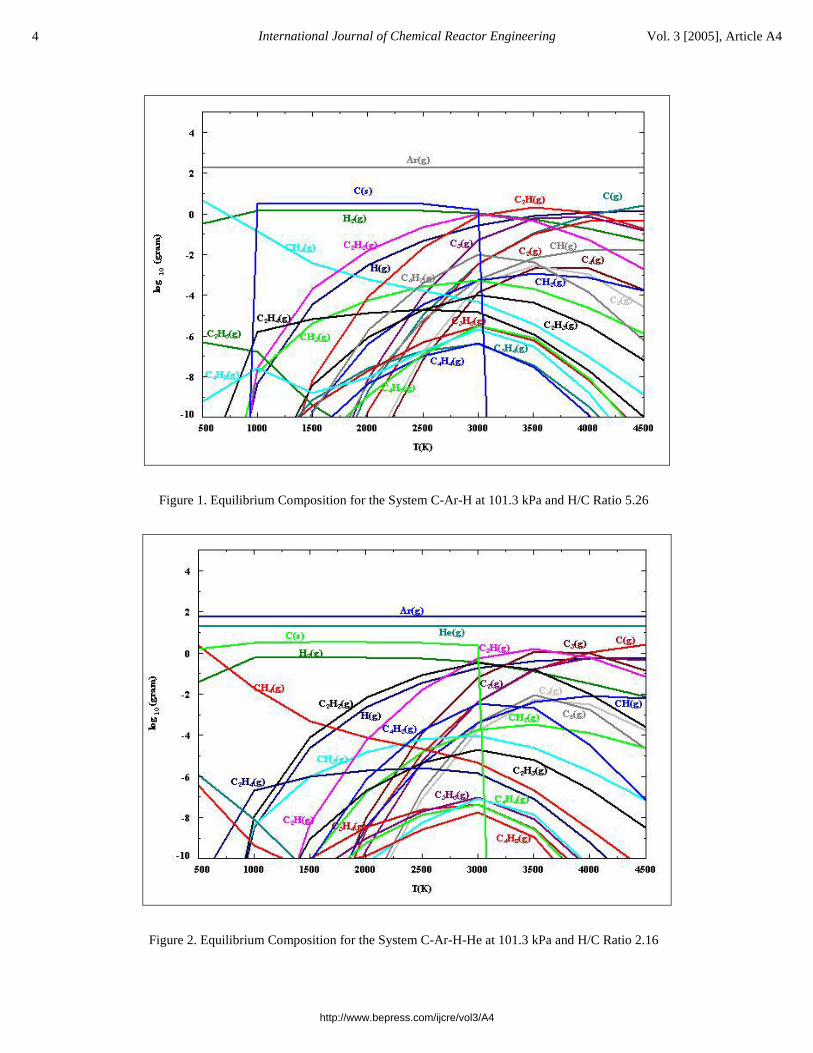
Figure 1. Equilibrium Composition for the System C-Ar-H at 101.3 kPa and H/C Ratio 5.26
Figure 2. Equilibrium Composition for the System C-Ar-H-He at 101.3 kPa and H/C Ratio 2.16
4 International Journal of Chemical Reactor Engineering Vol. 3 [2005], Article A4
http://www.bepress.com/ijcre/vol3/A4
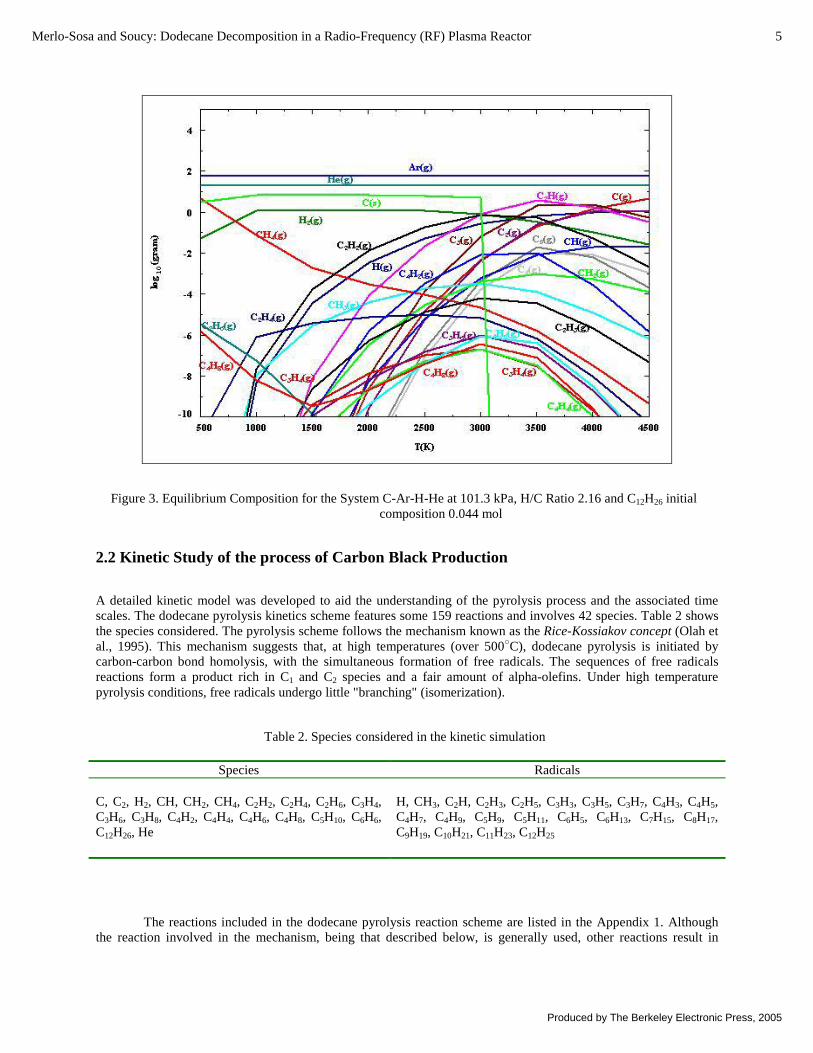
Figure 3. Equilibrium Composition for the System C-Ar-H-He at 101.3 kPa, H/C Ratio 2.16 and C12H26 initial composition 0.044 mol
2.2 Kinetic Study of the process of Carbon Black Production
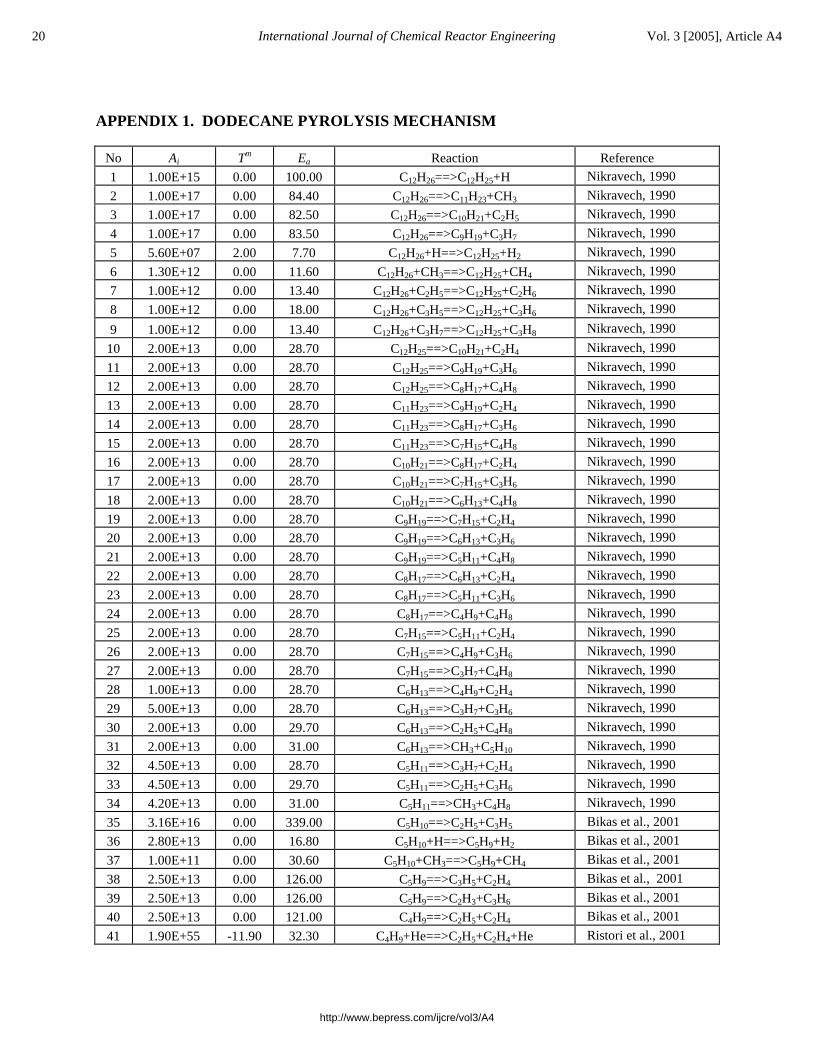
A detailed kinetic model was developed to aid the understanding of the pyrolysis process and the associated time scales. The dodecane pyrolysis kinetics scheme features some 159 reactions and involves 42 species. Table 2 shows the species considered. The pyrolysis scheme follows the mechanism known as the Rice-Kossiakov concept (Olah et al., 1995). This mechanism suggests that, at high temperatures (over 500○C), dodecane pyrolysis is initiated by carbon-carbon bond homolysis, with the simultaneous formation of free radicals. The sequences of free radicals reactions form a product rich in C1 and C2 species and a fair amount of alpha-olefins. Under high temperature pyrolysis conditions, free radicals undergo little "branching" (isomerization).
Table 2. Species considered in the kinetic simulation
Species Radicals
C, C2, H2, CH, CH2, CH4, C2H2, C2H4, C2H6, C3H4, C3H6, C3H8, C4H2, C4H4, C4H6, C4H8, C5H10, C6H6, C12H26, He
H, CH3, C2H, C2H3, C2H5, C3H3, C3H5, C3H7, C4H3, C4H5, C4H7, C4H9, C5H9, C5H11, C6H5, C6H13, C7H15, C8H17, C9H19, C10H21, C11H23, C12H25
The reactions included in the dodecane pyrolysis reaction scheme are listed in the Appendix 1. Although the reaction involved in the mechanism, being that described below, is generally used, other reactions result in
5Merlo-Sosa and Soucy: Dodecane Decomposition in a Radio-Frequency (RF) Plasma Reactor
Produced by The Berkeley Electronic Press, 2005
elemental gaseous carbon formation in the form of C and C2, and have been added (see reactions 136 to 139 and 144 to 151 in the Appendix 1). These carbon species are present under the plasma conditions of this experimental work. The rate constants for the reverse reactions were computed from forward rate constants and the appropriate equilibrium constant, calculated using thermochemical data. Helium is included as a third body collision partner and its effect on the equilibrium state is included.
The reaction kinetic model simulations were performed with the KINTECUS computer software version 3.1, which was developed by James C. Ianni (Kintecus Copyright 1995-2003 James C Ianni). This application involves a constant-volume batch reactor or a tubular flow reactor with constant volumetric flow rate. With this approach one writes the governing differential equation for the concentration, C, for each of the chemical species, i, in the mechanism,
∑=j
jiji rv
dt
dC (3)
The entire set of ordinary differential equations is then solved simultaneously, where t is the batch holding time of flow reactor residence time, vij the stoichiometric coefficient for component i in the jth reaction, and rj is the rate expression for the jth reaction. This approach requires a numerical value for the rate constant for each elementary step in the mechanism, which is usually expressed as the Arhenius parameter.
−=RT
EexpTAk am
ii (4)
The parameter data for each elementary reaction in the mechanism-based kinetic model are presented in the Appendix 1. Regardless of the source of the kinetic data, it is important to ensure that the data are thermodynamically consistent, i.e., thermodynamics requires that the ratio of the forward (kfor) and reverse (krev) rate constants for an elementary reaction equals the equilibrium constant (Ki) for the reaction.
irev
for Kk
k=
(5)
The data used for the reactant feed in the simulation are shown in Table 3. It is assumed that the dodecane is rapidly and completely mixed with the plasma gases, reaching a target temperature of 1500 K for the first case and 3000 K for the second case. The temperature is assumed to remain constant at 1500 and 3000 K in each case respectively. The pressure is also assumed to be constant at 101.3 kPa in the system.
A complete kinetic study for the process of carbon black formation, including the temperature profile along the reactor length, would be a quite outstanding exercise. However, the objective of the kinetic study performed in this present work was aimed at providing only a general range of information regarding the influences of operating parameters, such as the type of reacting/ive atmosphere and the optimal temperatures (determined from equilibrium considerations) on the reaction rates of those precursor species involved in the formation mechanism for carbon black and the lighter hydrocarbons.
6 International Journal of Chemical Reactor Engineering Vol. 3 [2005], Article A4
http://www.bepress.com/ijcre/vol3/A4
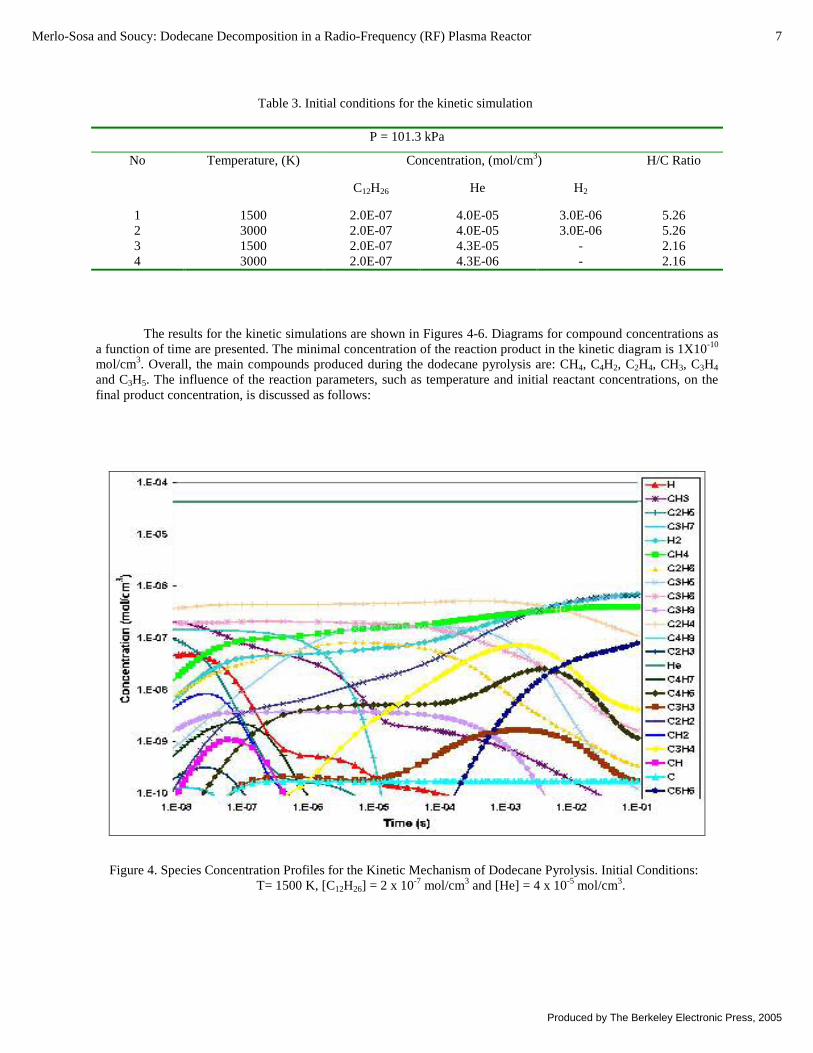
Table 3. Initial conditions for the kinetic simulation
P = 101.3 kPa
Concentration, (mol/cm3)No Temperature, (K)
C12H26 He H2
H/C Ratio
1 1500 2.0E-07 4.0E-05 3.0E-06 5.262 3000 2.0E-07 4.0E-05 3.0E-06 5.263 1500 2.0E-07 4.3E-05 - 2.164 3000 2.0E-07 4.3E-06 - 2.16
The results for the kinetic simulations are shown in Figures 4-6. Diagrams for compound concentrations as a function of time are presented. The minimal concentration of the reaction product in the kinetic diagram is 1X10⁻¹⁰
mol/cm3. Overall, the main compounds produced during the dodecane pyrolysis are: CH4, C4H2, C2H4, CH3, C3H4
and C3H5. The influence of the reaction parameters, such as temperature and initial reactant concentrations, on the final product concentration, is discussed as follows:
Figure 4. Species Concentration Profiles for the Kinetic Mechanism of Dodecane Pyrolysis. Initial Conditions: T= 1500 K, [C12H26] = 2 x 10⁻⁷ mol/cm3 and [He] = 4 x 10⁻⁵ mol/cm3.
7Merlo-Sosa and Soucy: Dodecane Decomposition in a Radio-Frequency (RF) Plasma Reactor
Produced by The Berkeley Electronic Press, 2005
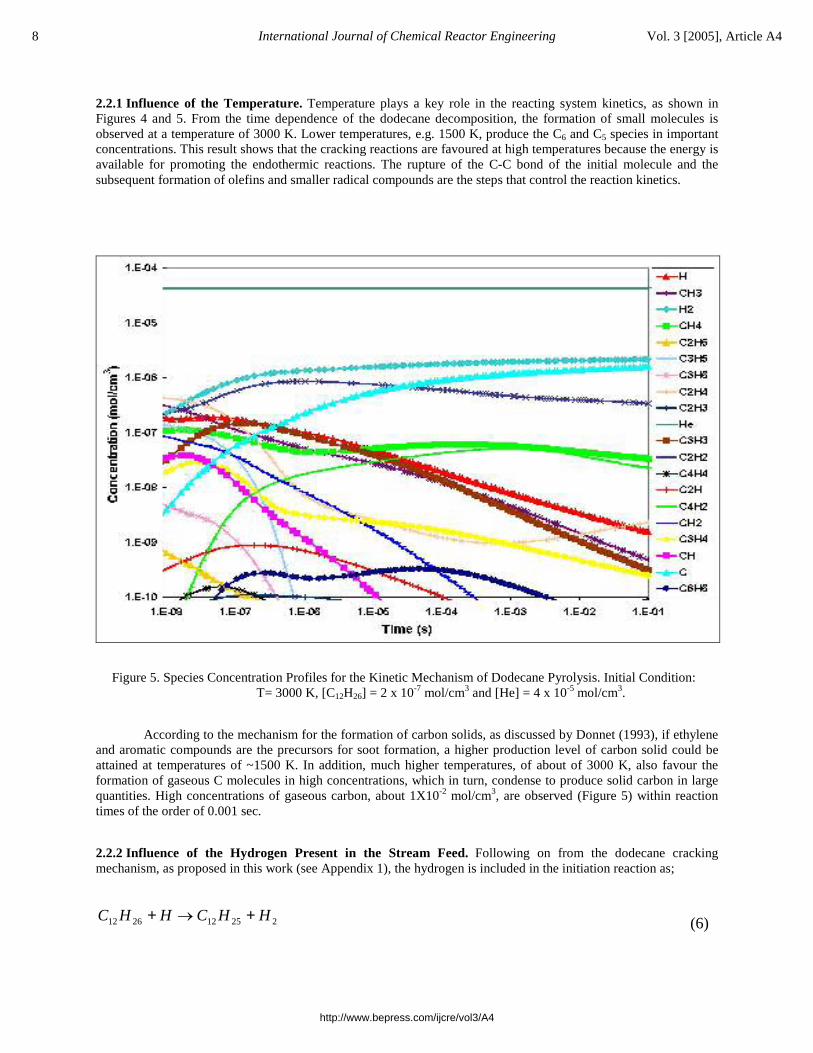
2.2.1 Influence of the Temperature. Temperature plays a key role in the reacting system kinetics, as shown in Figures 4 and 5. From the time dependence of the dodecane decomposition, the formation of small molecules is observed at a temperature of 3000 K. Lower temperatures, e.g. 1500 K, produce the C6 and C5 species in important concentrations. This result shows that the cracking reactions are favoured at high temperatures because the energy is available for promoting the endothermic reactions. The rupture of the C-C bond of the initial molecule and the subsequent formation of olefins and smaller radical compounds are the steps that control the reaction kinetics.
Figure 5. Species Concentration Profiles for the Kinetic Mechanism of Dodecane Pyrolysis. Initial Condition: T= 3000 K, [C12H26] = 2 x 10⁻⁷ mol/cm3 and [He] = 4 x 10⁻⁵ mol/cm3.
According to the mechanism for the formation of carbon solids, as discussed by Donnet (1993), if ethylene and aromatic compounds are the precursors for soot formation, a higher production level of carbon solid could be attained at temperatures of ~1500 K. In addition, much higher temperatures, of about of 3000 K, also favour the formation of gaseous C molecules in high concentrations, which in turn, condense to produce solid carbon in large quantities. High concentrations of gaseous carbon, about 1X10⁻² mol/cm3, are observed (Figure 5) within reaction times of the order of 0.001 sec.
2.2.2 Influence of the Hydrogen Present in the Stream Feed. Following on from the dodecane cracking mechanism, as proposed in this work (see Appendix 1), the hydrogen is included in the initiation reaction as;
225122612 HHCHHC +→+ (6)
8 International Journal of Chemical Reactor Engineering Vol. 3 [2005], Article A4
http://www.bepress.com/ijcre/vol3/A4
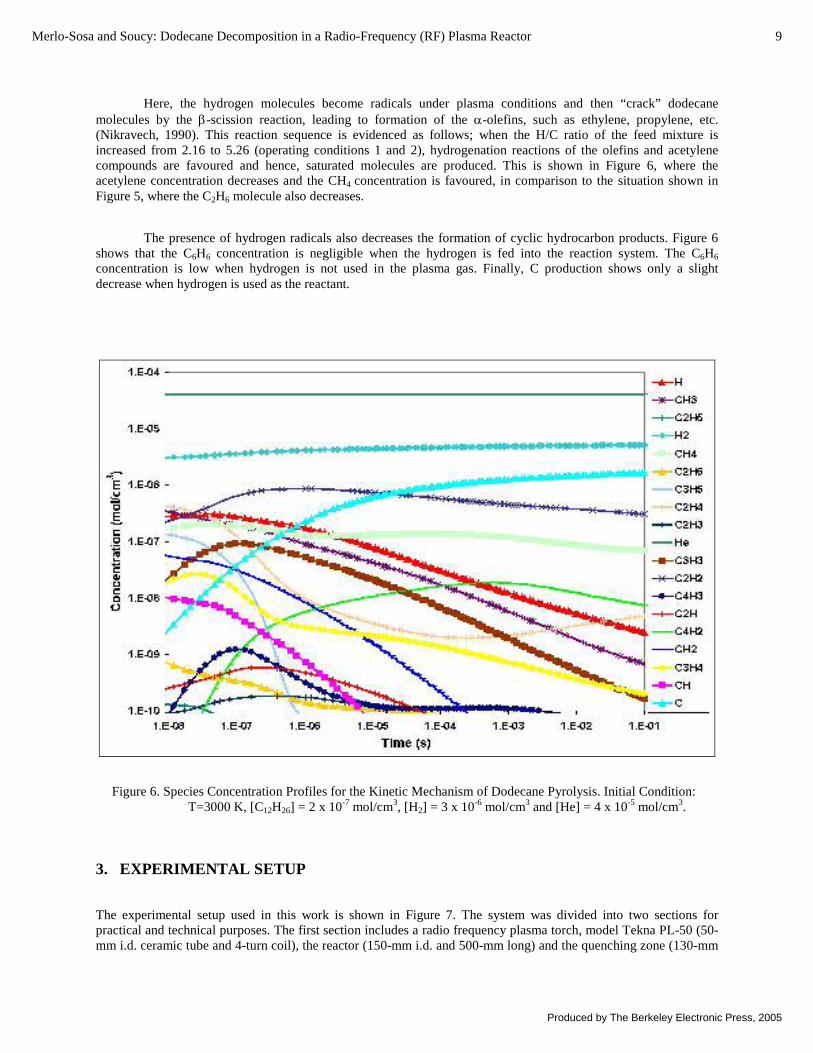
Here, the hydrogen molecules become radicals under plasma conditions and then “crack” dodecane molecules by the β-scission reaction, leading to formation of the α-olefins, such as ethylene, propylene, etc. (Nikravech, 1990). This reaction sequence is evidenced as follows; when the H/C ratio of the feed mixture is increased from 2.16 to 5.26 (operating conditions 1 and 2), hydrogenation reactions of the olefins and acetylene compounds are favoured and hence, saturated molecules are produced. This is shown in Figure 6, where the acetylene concentration decreases and the CH4 concentration is favoured, in comparison to the situation shown in Figure 5, where the C2H6 molecule also decreases.
The presence of hydrogen radicals also decreases the formation of cyclic hydrocarbon products. Figure 6 shows that the C6H6 concentration is negligible when the hydrogen is fed into the reaction system. The C6H6
concentration is low when hydrogen is not used in the plasma gas. Finally, C production shows only a slight decrease when hydrogen is used as the reactant.
Figure 6. Species Concentration Profiles for the Kinetic Mechanism of Dodecane Pyrolysis. Initial Condition: T=3000 K, [C12H26] = 2 x 10⁻⁷ mol/cm3, [H2] = 3 x 10⁻⁶ mol/cm3 and [He] = 4 x 10⁻⁵ mol/cm3.
3. EXPERIMENTAL SETUP
The experimental setup used in this work is shown in Figure 7. The system was divided into two sections for practical and technical purposes. The first section includes a radio frequency plasma torch, model Tekna PL-50 (50-mm i.d. ceramic tube and 4-turn coil), the reactor (150-mm i.d. and 500-mm long) and the quenching zone (130-mm
9Merlo-Sosa and Soucy: Dodecane Decomposition in a Radio-Frequency (RF) Plasma Reactor
Produced by The Berkeley Electronic Press, 2005
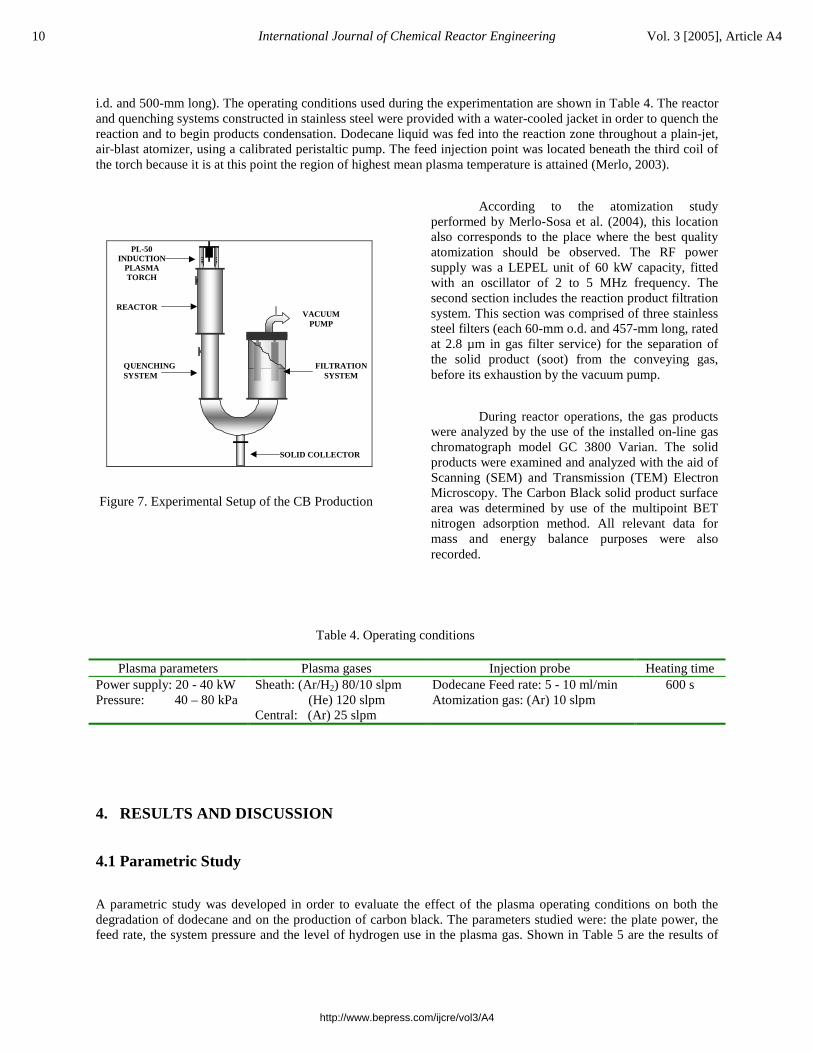
i.d. and 500-mm long). The operating conditions used during the experimentation are shown in Table 4. The reactor and quenching systems constructed in stainless steel were provided with a water-cooled jacket in order to quench the reaction and to begin products condensation. Dodecane liquid was fed into the reaction zone throughout a plain-jet, air-blast atomizer, using a calibrated peristaltic pump. The feed injection point was located beneath the third coil of the torch because it is at this point the region of highest mean plasma temperature is attained (Merlo, 2003).
VACUUM PUMP
PL-50 INDUCTION
PLASMA TORCH
FILTRATION SYSTEM
QUENCHING SYSTEM
REACTOR
SOLID COLLECTOR
Figure 7. Experimental Setup of the CB Production
According to the atomization study performed by Merlo-Sosa et al. (2004), this location also corresponds to the place where the best quality atomization should be observed. The RF power supply was a LEPEL unit of 60 kW capacity, fitted with an oscillator of 2 to 5 MHz frequency. The second section includes the reaction product filtration system. This section was comprised of three stainless steel filters (each 60-mm o.d. and 457-mm long, rated at 2.8 µm in gas filter service) for the separation of the solid product (soot) from the conveying gas, before its exhaustion by the vacuum pump.
During reactor operations, the gas products were analyzed by the use of the installed on-line gas chromatograph model GC 3800 Varian. The solid products were examined and analyzed with the aid of Scanning (SEM) and Transmission (TEM) Electron Microscopy. The Carbon Black solid product surface area was determined by use of the multipoint BET nitrogen adsorption method. All relevant data for mass and energy balance purposes were also recorded.
Table 4. Operating conditions
Plasma parameters Plasma gases Injection probe Heating time Power supply: 20 - 40 kWPressure: 40 – 80 kPa
Sheath: (Ar/H2) 80/10 slpm (He) 120 slpm Central: (Ar) 25 slpm
Dodecane Feed rate: 5 - 10 ml/minAtomization gas: (Ar) 10 slpm
600 s
4. RESULTS AND DISCUSSION
4.1 Parametric Study
A parametric study was developed in order to evaluate the effect of the plasma operating conditions on both the degradation of dodecane and on the production of carbon black. The parameters studied were: the plate power, the feed rate, the system pressure and the level of hydrogen use in the plasma gas. Shown in Table 5 are the results of
10 International Journal of Chemical Reactor Engineering Vol. 3 [2005], Article A4
http://www.bepress.com/ijcre/vol3/A4

the statistical experimental design (Factorial 24), in terms of the three response variables of interest; i.e. % ofRecovered Mass, calculated as [(Recovered soot mass/Feeding carbon in dodecane) x 100]; % of Acetylene Yield, calculated as [(Mass carbon of acetylene in the gas phase/Mass carbon input in the feedstock inflow) x 100] and Surface Area of Carbon Black. The first two variables are related to the process efficiency for dodecane decomposition and to the carbon black production. The third variable is related to the quality of the carbon black produced and corresponds to the BET Surface Area measurements.
4.1.1 The Effect of Plasma Power. The results, as set out in Table 5, indicate that the plasma power was the most important operational factor during the experimental program. For instance, higher values of recovered solid mass are observed in all even numbered runs (40 kW), compared to those found in all odd numbered runs (20 kW). Increasing the plate power input leads to increasing plasma energy levels, thereby influencing the ionization processes of plasma gas molecules and atoms. As expected, the use of higher plate powers produced corresponding higher plasma temperatures. Thus, the higher value of plasma power (40 kW) permitted the complete decomposition of the input dodecane, being transformed into carbon black. This increase in the % of recovered mass is observed in all experiments. In some cases, the % of recovered mass is doubled, e.g. when He was used as the sheath gas in place of hydrogen. The highest value observed for the % of recovered mass was found at 40 kW, with He used as the sheath gas (see Test 16, Table 5). At this point, it could be inferred that the high temperature of the helium plasma (due to its high thermal conductivity) is responsible for the apparent doubling of the carbon black production. On the other hand, both thermodynamic and kinetic studies show that the high plasma temperatures strongly enhance the yield of gaseous carbon species, such as C, C2, C3, etc., which are considered to be the precursors for carbon black particles formation.
Table 5. Results obtained for; the recovered solids mass (%), acetylene yield (%) and surface area (m2/g) for the experimental design
Run PlatePower(kW)
FeedRate
(ml/min)
ReactorPressure
(kPa)
SheathGas
RecoveredSolids Mass
(%)
C2H2
Yield(%)
BET Surface Area(m2/g)
1 20 4.8 40 Ar-H2 13 76 1632 40 4.0 40 Ar-H2 17 55 1353 20 10 40 Ar-H2 12 28 1604 40 10 40 Ar-H2 22 31 1375 20 4.3 80 Ar-H2 13 79 1916 40 4.9 80 Ar-H2 13 56 1447 20 9 80 Ar-H2 9 72 1828 40 10.3 80 ArH2 20 32 1529 20 4.5 40 Ar-He 8 57 132
10 40 5.4 40 Ar-He 18 51 14011 20 10 40 Ar-He 9 65 10812 40 11.8 40 Ar-He 22 31 14013 20 4.7 80 Ar-He 12 56 13014 40 4.6 80 Ar-He 23 55 12115 20 10 80 Ar-He 13 63 11316 40 11.4 80 Ar-He 28 32 121
The plasma power intensity is also an important factor in determining the acetylene yield, but here it has a negative effect. Lower acetylene yields were obtained when the plate power was raised to 40 kW; i.e. acetylene production is diminished while the yield of carbon solids is increased. This observation however does not agree with the findings of the thermodynamic study because, at high power inputs, and consequently at high temperatures in the plasma, the study indicates that a positive impact on the formation of C2H2 species should be apparent. Hence, high concentrations of this molecular species are expected in the plasma products. This relationship can be explained by
11Merlo-Sosa and Soucy: Dodecane Decomposition in a Radio-Frequency (RF) Plasma Reactor
Produced by The Berkeley Electronic Press, 2005
the theory of acetylene involvement in carbon black formation (Donnet, 1993). This theory suggests that acetylene is the essential building block in soot formation and that soot is formed by the simultaneous polymerization and dehydrogenation of acetylene. Carbon black was in fact produced during the above-described experiments; using the available acetylene and thus lowering the acetylene concentrations that were eventually measured in the reactor exhaust gas. It is important to remember that temperature gradients exist in the reactor and the process of polymerization and dehydrogenation of acetylene, leading to the production of carbon black, could be taking place in a zone of lower than peak temperature within the reactor.
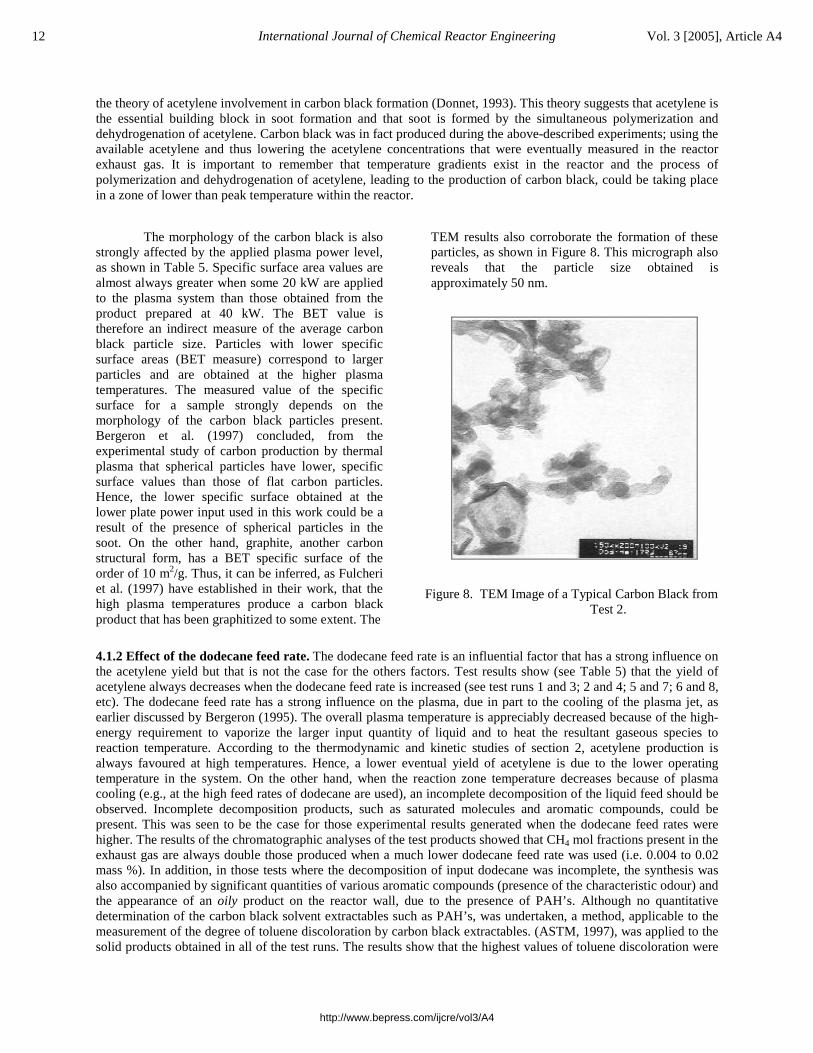
The morphology of the carbon black is also strongly affected by the applied plasma power level, as shown in Table 5. Specific surface area values are almost always greater when some 20 kW are applied to the plasma system than those obtained from the product prepared at 40 kW. The BET value is therefore an indirect measure of the average carbon black particle size. Particles with lower specific surface areas (BET measure) correspond to larger particles and are obtained at the higher plasma temperatures. The measured value of the specific surface for a sample strongly depends on the morphology of the carbon black particles present. Bergeron et al. (1997) concluded, from the experimental study of carbon production by thermal plasma that spherical particles have lower, specific surface values than those of flat carbon particles. Hence, the lower specific surface obtained at the lower plate power input used in this work could be a result of the presence of spherical particles in the soot. On the other hand, graphite, another carbon structural form, has a BET specific surface of the order of 10 m2/g. Thus, it can be inferred, as Fulcheri et al. (1997) have established in their work, that the high plasma temperatures produce a carbon black product that has been graphitized to some extent. The
TEM results also corroborate the formation of these particles, as shown in Figure 8. This micrograph also reveals that the particle size obtained is approximately 50 nm.
Figure 8. TEM Image of a Typical Carbon Black from Test 2.
4.1.2 Effect of the dodecane feed rate. The dodecane feed rate is an influential factor that has a strong influence on the acetylene yield but that is not the case for the others factors. Test results show (see Table 5) that the yield of acetylene always decreases when the dodecane feed rate is increased (see test runs 1 and 3; 2 and 4; 5 and 7; 6 and 8, etc). The dodecane feed rate has a strong influence on the plasma, due in part to the cooling of the plasma jet, asearlier discussed by Bergeron (1995). The overall plasma temperature is appreciably decreased because of the high-energy requirement to vaporize the larger input quantity of liquid and to heat the resultant gaseous species to reaction temperature. According to the thermodynamic and kinetic studies of section 2, acetylene production is always favoured at high temperatures. Hence, a lower eventual yield of acetylene is due to the lower operating temperature in the system. On the other hand, when the reaction zone temperature decreases because of plasma cooling (e.g., at the high feed rates of dodecane are used), an incomplete decomposition of the liquid feed should be observed. Incomplete decomposition products, such as saturated molecules and aromatic compounds, could be present. This was seen to be the case for those experimental results generated when the dodecane feed rates were higher. The results of the chromatographic analyses of the test products showed that CH4 mol fractions present in the exhaust gas are always double those produced when a much lower dodecane feed rate was used (i.e. 0.004 to 0.02 mass %). In addition, in those tests where the decomposition of input dodecane was incomplete, the synthesis was also accompanied by significant quantities of various aromatic compounds (presence of the characteristic odour) and the appearance of an oily product on the reactor wall, due to the presence of PAH’s. Although no quantitative determination of the carbon black solvent extractables such as PAH’s, was undertaken, a method, applicable to the measurement of the degree of toluene discoloration by carbon black extractables. (ASTM, 1997), was applied to the solid products obtained in all of the test runs. The results show that the highest values of toluene discoloration were
12 International Journal of Chemical Reactor Engineering Vol. 3 [2005], Article A4
http://www.bepress.com/ijcre/vol3/A4
obtained when higher dodecane feed rate was used than when low value feed rates was used, with those systems. Thus it was inferred that PAH’s are present in the soot because of incomplete decomposition of the input dodecane under these operating conditions. Hence, gas chromatography, coupled with mass spectrometry analysis, was applied to these soot products. This analysis showed that some PAH’s, such as Ethylbenzene and p-Xylene, were absorbed in the soot, the concentrations of these products being estimated to lie in the range of hundreds of ppm. Another factor of considerable importance that influences the decomposition of dodecane is the characteristics of the liquid dodecane spray produced by the atomizer. The optimal operating conditions, required for the atomizer to generate the finest degree of atomization, are presented in the detailed work of Merlo (2003). In their discussion, the authors have shown that the dodecane feed rate has a considerable influence on the droplet size produced. An increase in the dodecane feed rate (from 5 to 10 ml/min) generates an increase of about 15% in the value of the droplet SMD. In this way, high feed rate values lead to incomplete decomposition of the dodecane, as discussed above.
From the evaluation of the results, the influence of the dodecane feed rate on the % recovered mass is not seen to be as important as it is for the acetylene yield. However, a positive effect on the % recovered mass occurs when the plate power is increased for both levels of feed rate studied (5 and 10 ml/min). This implies that there is an influence of the combined effect (the plate power and feed rate) influencing the % recovered mass. For instance, high plate powers generate higher plasma temperatures and are thus capable of vaporizing higher throughputs of dodecane, leading to the production of larger amounts of soot (see runs 4, 8, 12, 16). By contrast with the latter finding, higher dodecane feed rates generate higher amounts of soot but, at the same time, the plasma tail zone is cooled more rapidly.
4.1.3 Effect of the sheath gas. The previously displayed test results also show that the sheath gas factor has strong influence on the specific surface of the carbon blacks produced. Table 5 shows that higher values of the carbon product specific surface were almost always obtained when H2 plasma is used. The carbon structure could be affected in several ways. First, the presence of hydrogen in the system favours the formation of hydrocarbons such as methane, discussed earlier in the thermodynamic and kinetic studies. These gaseous compounds utilise any available carbon existing in the system and so the product carbon concentration will decrease. Aggregate formation develops when individual particles, existing in an isolated form in the gas stream, adhere and fuse together. When H2 is fed to the system, only a few aggregates or small aggregates are formed. As a consequence of the formation of these smaller aggregates, an increase in the specific surface value might well be expected.
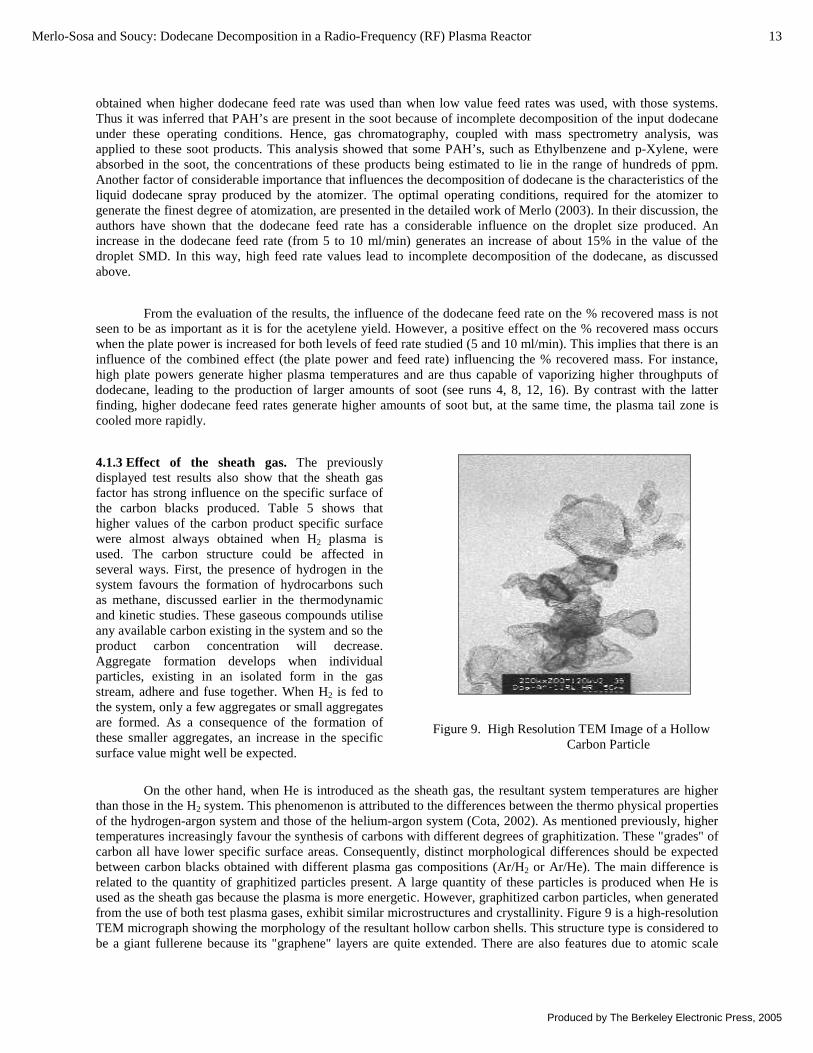
Figure 9. High Resolution TEM Image of a Hollow Carbon Particle
On the other hand, when He is introduced as the sheath gas, the resultant system temperatures are higher than those in the H2 system. This phenomenon is attributed to the differences between the thermo physical properties of the hydrogen-argon system and those of the helium-argon system (Cota, 2002). As mentioned previously, higher temperatures increasingly favour the synthesis of carbons with different degrees of graphitization. These "grades" of carbon all have lower specific surface areas. Consequently, distinct morphological differences should be expected between carbon blacks obtained with different plasma gas compositions (Ar/H2 or Ar/He). The main difference is related to the quantity of graphitized particles present. A large quantity of these particles is produced when He is used as the sheath gas because the plasma is more energetic. However, graphitized carbon particles, when generated from the use of both test plasma gases, exhibit similar microstructures and crystallinity. Figure 9 is a high-resolution TEM micrograph showing the morphology of the resultant hollow carbon shells. This structure type is considered to be a giant fullerene because its "graphene" layers are quite extended. There are also features due to atomic scale
13Merlo-Sosa and Soucy: Dodecane Decomposition in a Radio-Frequency (RF) Plasma Reactor
Produced by The Berkeley Electronic Press, 2005
curvatures, related to the presence of linking pentagons, and where no graphene edges are observed (Fulcheri, 2002). The morphology of these carbon blacks shows that the new structures of such "blacks" (with potential new properties) can be obtained by means of the H.F. continuous plasma process. Morphological studies using Transmission Electron Microscopy (TEM) techniques permit the determination of the average particles size (10-30 nm). Elemental analysis, using an appropriate LECO Instrument, has indicated that high purity soot (99.69 %wt), and almost no hydrogen (<0.3 %wt of H) were generated. In addition, the same soot was extracted with dry toluene for the determination of low molecular weight fullerenes (C60 and C70) content, using an UV/VIS spectrophotometer operated at 329 nm. The test results revealed that the C60 and C70 fullerenes were absent from the soot, thus confirming the high degree of purity of our product. Because giant fullerenes are insoluble in toluene, the presence of these carbon structures cannot be quantified by UV/VIS spectrometry.
Returning to consideration of the effect of sheath gas on the %-recovered carbon mass, this variable was found to be invariably higher when He was used than H2. In fact the highest carbon mass value was obtained when some 40 kW was applied to the plasma torch (see Test 16). H2 use as the sheath gas in the plasma torch system responds in several ways. Firstly, it makes the atomic H/C ratio larger by increasing the presence of elemental H, in comparison to those systems where He is present. This concept has been previously explained in the thermodynamic study section. As a sheath gas, H2 is thermally excited, dissociates in the plasma system and participates actively in the subsequent cracking reactions. This inhibits the soot production process because the added H2 contributes mainly to the formation of saturated species such as CH4 (Nikravech et al, 1989). This reaction sequence is corroborated by the experimental results. It can be seen that the CH4 mol fractions measured in the reactor exhaust gas, as determined by gas chromatographic analysis, are always higher in those tests where the H2 sheath gas was used.
4.1.4 Effect of the system pressure. In contrast with the effects of plasma power and dodecane feed rate, the effect of the overall system pressure had no appreciable influence on carbon mass recoveries and acetylene yields. Plasma volume contraction with increasing reactor system pressure was observed in these experiments. In general, the residence time for the dodecane feed decreases when the plasma volume is reduced. Moreover, the cooling effect induced by the liquid feed injection into the center of the plasma gradually becomes more important. Incomplete decomposition of the dodecane and high soot production levels are attained. These findings are observed in the experimental results when He is used as the sheath gas (see test runs 9 and 13; 10 and 14; 11 and 15; 12 and 18 in Table 5); but they are not evident when H2 is used as the sheath gas.
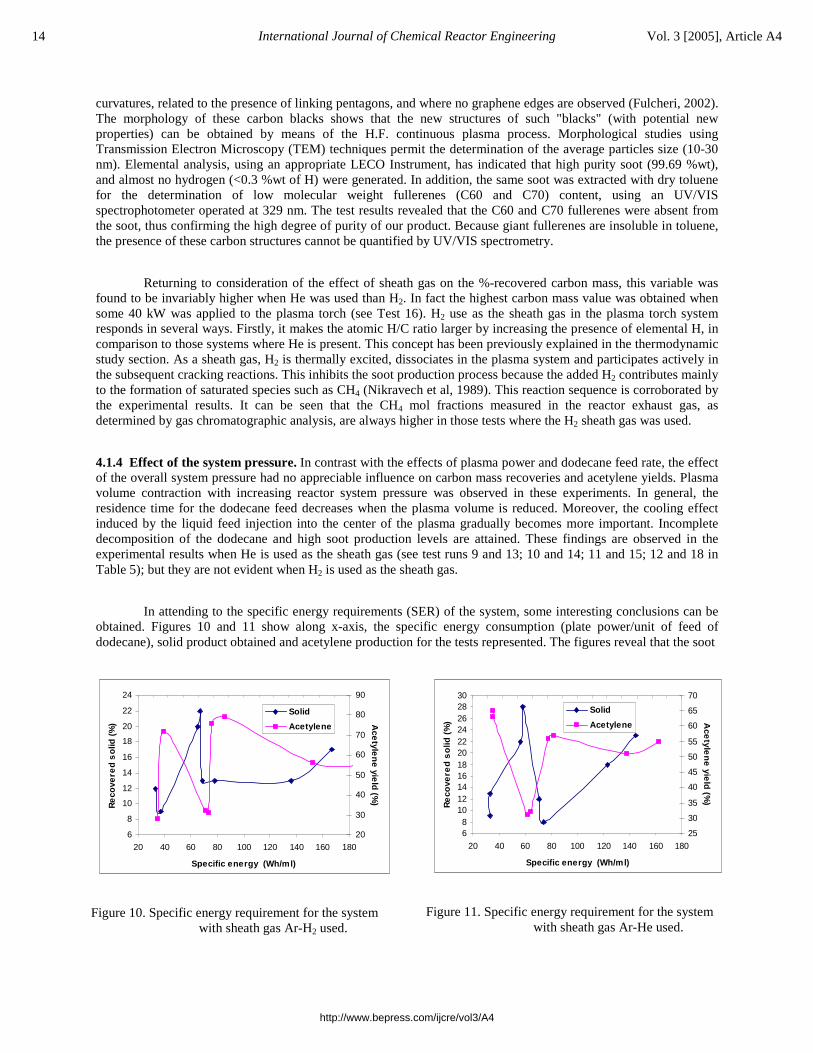
In attending to the specific energy requirements (SER) of the system, some interesting conclusions can be obtained. Figures 10 and 11 show along x-axis, the specific energy consumption (plate power/unit of feed of dodecane), solid product obtained and acetylene production for the tests represented. The figures reveal that the soot
6
8
10
12
14
16
18
20
22
24
20 40 60 80 100 120 140 160 180
Specific energy (Wh/ml)
Re
cove
red
so
lid (
%)
20
30
40
50
60
70
80
90
Ace
tylen
e yie
ld (%
)
Solid
Acetylene
Figure 10. Specific energy requirement for the system with sheath gas Ar-H2 used.
68
1012141618202224262830
20 40 60 80 100 120 140 160 180
Specific energy (Wh/ml)
Re
cove
red
so
lid (
%)
25
30
35
40
45
50
55
60
65
70
Ace
tylen
e yie
ld (%
)
Solid
Acetylene
Figure 11. Specific energy requirement for the system with sheath gas Ar-He used.
14 International Journal of Chemical Reactor Engineering Vol. 3 [2005], Article A4
http://www.bepress.com/ijcre/vol3/A4
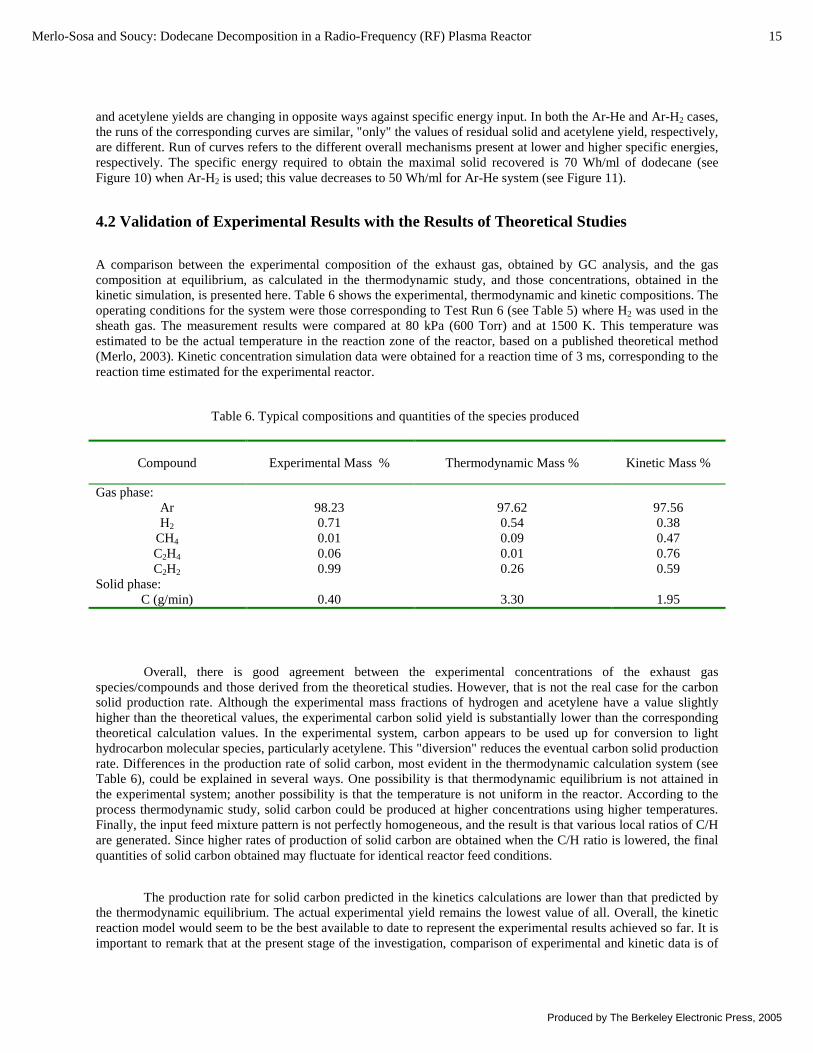
and acetylene yields are changing in opposite ways against specific energy input. In both the Ar-He and Ar-H2 cases, the runs of the corresponding curves are similar, "only" the values of residual solid and acetylene yield, respectively, are different. Run of curves refers to the different overall mechanisms present at lower and higher specific energies, respectively. The specific energy required to obtain the maximal solid recovered is 70 Wh/ml of dodecane (see Figure 10) when Ar-H2 is used; this value decreases to 50 Wh/ml for Ar-He system (see Figure 11).
4.2 Validation of Experimental Results with the Results of Theoretical Studies
A comparison between the experimental composition of the exhaust gas, obtained by GC analysis, and the gas composition at equilibrium, as calculated in the thermodynamic study, and those concentrations, obtained in the kinetic simulation, is presented here. Table 6 shows the experimental, thermodynamic and kinetic compositions. The operating conditions for the system were those corresponding to Test Run 6 (see Table 5) where H2 was used in the sheath gas. The measurement results were compared at 80 kPa (600 Torr) and at 1500 K. This temperature was estimated to be the actual temperature in the reaction zone of the reactor, based on a published theoretical method (Merlo, 2003). Kinetic concentration simulation data were obtained for a reaction time of 3 ms, corresponding to the reaction time estimated for the experimental reactor.
Table 6. Typical compositions and quantities of the species produced
Compound Experimental Mass % Thermodynamic Mass % Kinetic Mass %
Gas phase:Ar 98.23 97.62 97.56H2 0.71 0.54 0.38
CH4 0.01 0.09 0.47C2H4 0.06 0.01 0.76C2H2 0.99 0.26 0.59
Solid phase:C (g/min) 0.40 3.30 1.95
Overall, there is good agreement between the experimental concentrations of the exhaust gas species/compounds and those derived from the theoretical studies. However, that is not the real case for the carbon solid production rate. Although the experimental mass fractions of hydrogen and acetylene have a value slightly higher than the theoretical values, the experimental carbon solid yield is substantially lower than the corresponding theoretical calculation values. In the experimental system, carbon appears to be used up for conversion to light hydrocarbon molecular species, particularly acetylene. This "diversion" reduces the eventual carbon solid production rate. Differences in the production rate of solid carbon, most evident in the thermodynamic calculation system (see Table 6), could be explained in several ways. One possibility is that thermodynamic equilibrium is not attained in the experimental system; another possibility is that the temperature is not uniform in the reactor. According to the process thermodynamic study, solid carbon could be produced at higher concentrations using higher temperatures. Finally, the input feed mixture pattern is not perfectly homogeneous, and the result is that various local ratios of C/H are generated. Since higher rates of production of solid carbon are obtained when the C/H ratio is lowered, the final quantities of solid carbon obtained may fluctuate for identical reactor feed conditions.
The production rate for solid carbon predicted in the kinetics calculations are lower than that predicted by the thermodynamic equilibrium. The actual experimental yield remains the lowest value of all. Overall, the kinetic reaction model would seem to be the best available to date to represent the experimental results achieved so far. It is important to remark that at the present stage of the investigation, comparison of experimental and kinetic data is of
15Merlo-Sosa and Soucy: Dodecane Decomposition in a Radio-Frequency (RF) Plasma Reactor
Produced by The Berkeley Electronic Press, 2005
an informal nature only; further investigations are required to interpret those differences found between the calculated and measured data.
From the technological standpoint, the findings of this research show that thermal plasma processing is an efficient and safe procedure that not only enables the production of special carbon black products to take place but it also facilitates the decomposition of dodecane, with much reduced emission of contaminants. The environmentally friendly and minimal contaminant effects of this reaction allow us to predict that this technology will become one of the most promising new processes to produce carbon black with particular and desirable characteristics, using an efficient and improved method.
5. CONCLUSIONS
The basic experimental method used in the research presented in this work involved the production of carbon black materials, via the decomposition of dodecane (C12H26) liquid in an induction plasma reactor. In using thermal plasma technology, advantage can be taken of the high enthalpy reaction conditions generated in the reactor during the synthesis of carbon black materials of various morphologies.
The thermodynamic equilibrium studies undertaken predicted that significant concentrations of carbon solid, hydrogen, acetylene and unsaturated radical species are formed over the temperature range between 1200 and 3000 K. In turn, the presence of atomic species, such as H(g), C(g), C2(g), becomes important at temperatures greater than 3000 K. On the other hand, the results of the reaction kinetics simulation, conducted at 3000 K, have permitted us to predict that the formation of gaseous carbon molecules at high concentrations might lead to the formation of solid carbon particles by vapour condensation, involving reaction times of the order of 0.001 sec.
Various factors are found to play a significant role in the production of carbon black. Of these, the most important factors, contributing to the production of carbon black, are the plasma power (40 kW) and the helium used as the plasma torch sheath gas. The maximum input carbon, recovered, as a solid mass was 28 %. This yield may be the result of the very high temperatures reached in the reaction zone under these operating conditions. In the case of the more valuable gaseous by-products, the formation of C2H2 is enhanced when hydrogen is used as sheath gas (up to 79% C2H2 yield, based on carbon input). It is possible that hydrogen, both as radical and elemental forms in the reaction zone, act as reactive species that promote the recombination and hydrocarbon formation reactions. The experimental design also shows that the morphology of the carbon black is strongly influenced by plasma power level and sheath gas composition. A relationship between the carbon product specific surface and these factors has been established, where lower specific surface values correspond to larger carbon black size particles being found at the higher temperatures. These particles are spherical in shape and present BET specific surface values of the order of 130 m2/g. As far as the effect of plasma operating conditions on soot and acetylene formation is concerned, the SER has been calculated for the experimental test. Results show that there is an "optimum" range of specific energy value (50-70 Wh/ml) where the residual solid has a maximum yield, coinciding with a minimum in acetylene yield.
Finally, although the TEM observations of this work show morphological characteristics typical of regular carbon black structures, the presence of new “special structures”, such as the "giant fullerenes" and some other partially graphitized particles, obtained at the highest experimental temperatures employed, are of particular interest. In addition to the existing advantages of low contaminant inputs, the production of these unusual products during the plasma promoted reactions places the RF plasma reactor system in the ranks of the very few promising techniques presently known for the production of a wide range of carbon black products having the above-described special properties.
16 International Journal of Chemical Reactor Engineering Vol. 3 [2005], Article A4
http://www.bepress.com/ijcre/vol3/A4
The results of this experimental and theoretical work may be used to establish the optimal operating parameters for the synthesis of new grades of carbon blacks, with regard to their potential applications and in the actual eventual production process design and scale-up.
ACKNOWLEDGEMENTS
The Authors gratefully acknowledge the financial support in this research of the National Council of Science and Technology (CONACYT) and the National Institute of Nuclear Research (ININ) from Mexico, and the Fonds pour la Formation of Chercheurs et l’Aide à la Recherche and the Natural Science and Engineering Research Council of Canada (NSERC) and especially thanks Dr. Peter Lanigan for the proofreading of this paper.
NOTATION
Ai Pre-exponential Factor for the ith ReactionCi Concentration of the ith Chemical SpecieEa Activation Energy (kJ/mol)Gmix Gibbs Energy of the Mixture (kJ/mol)kfor Forward Rate Constantkrev Reverse Rate ConstantKi Equilibrium Constant for ith Reactionni Mole Number of the ith Component pi Partial Pressure (kPa)R Gas Constant (8.314 kJ/mol K)rj Rate Expression for the jth ReactionT Temperature, Plasma Temperature (K)t Time (s)Tm Temperature (K)
Greek Lettersβil Formula Coefficientsλl Lagrangian Multipliers∧
iµ Chemical Potential of Component i in the Mixture
vij Stoichiometric Coefficient for Component i in the jth Reaction
REFERENCES
ASTM D 1618-97, “Standard Test Method for Carbon Black Extractables-Toluene Discoloration”, American Society for Testing Materials, 309-310 (1997).
Benson, S.W., “Thermochemical Kinetics”, Second Edition, John Wiley and Sons, Inc., USA, (1976).
Bergeron, E., “Étude du traitement thermique de déchets liquides dans un réacteur à plasma inductif” (in French) M.Sc.A. Thesis, Département de Génie Chimique, Université de Sherbrooke, Canada, (1995).
17Merlo-Sosa and Soucy: Dodecane Decomposition in a Radio-Frequency (RF) Plasma Reactor
Produced by The Berkeley Electronic Press, 2005
Bergeron, E., “Production de carbone par pyrolyse du méthane dans un plasma thermique” (in French), M.Sc.A. Thesis, Département de Génie Chimique, Université de Sherbrooke, Canada, (1997).
Boulori, K., Amouroux, J., “Reactor Design and Energy Concepts for a Plasma Process of Acetylene Black Production”, Plasma Chemistry and Plasma Processing, Vol. 6, No. 4, 335-348 (1986).
Cota, G., “Synthesis of Carbon Nanostructures Using a High Frequency Induction Plasma Reactor”, Ph. D. Thesis, Département de Génie Chimique, Université de Sherbrooke, Canada, (2002).
Donnet, J.B., Bansal, R.P., Wang, M.J., “Carbon Black, Science and Technology”, 2nd Edition, Marcel Dekker, New York, (1993).
Factsage, “Thermodynamic Equilibrium Software”, version 5.0, Center for Research in Computational Thermochemistry of the École Polytechnique at the Université de Montréal and with GTT-Technologies, GmbH, Aachen, Germany, (2001).
Fulcheri, L., Flamant, G., Fabry, F., Probst, N, Grivei, E. Chapman, C., Fischer, F., “Advance in the 3-Phase Plasma Technology for the Production of Carbon Black and Hydrogen”, ISCP-14, Vol. 4, 2161-2166 (1999).
Fulcheri, L., Probst, N., Flamant, G., Fabry, F., Grivei, E., Bourrat, X., “Plasma Processing: A step towards the production of new grades of Carbon Black”, Carbon, Vol. 40, 169-176 (2002).
Fulcheri, L., Schwob, Y., Flamant, G., “Comparison Between New Carbon Nanostructures Produced by Plasma with Industrial Carbon Black Grades”, Journal of Physics III, France, Vol. 7, 491-503 (1997).
Fulcheri, L., Schwob, Y., Variot, B, Flamant, G., Badie, J.M., Fischer, F., Kassabji, F., Saint Just, J., “A 3-Phase A.C. Plasma Process for Carbon Black Production from Methane”, 3rd European Congress on Thermal Plasma Processes, VDI Berichte NR. 1166, Aachen, Germany, 525-532 (1995).
Gaudernack, B., Lynum, S., “Hydrogen from Natural Gas Without release of CO2 to the Atmosphere”, Int. J. Hydrogen Energy, Vol. 23, No. 12, 1087-1093 (1998).
Ianni, J.C., “Kintecus Computer Software” Version 3.1, Kintecus Copyright 1995-2003, (2003).
Ibberson, V.J., Christofides, C., “Processing of Hydrocarbon in a Thermal R. F. Plasma Reactor”, ISPC-6 Montreal, Vol. 1, 254-257 (1983).
Kovener, G.S., “Use of a RF Plasma for Thermal Pyrolysis of CH4 and Heavy Oils”, ISPC-6 Montreal, Vol. 1, 258-263 (1983).
Kyle, B.G., “Chemical and Process Thermodynamics”, 3rd Edition, Englewood Ciffs, N. J. Prentice Hall, (1999).
Lavoie, M., “Synthèse de Noir De Carbone à partir de Propane, utilisant un Plasma Thermique” (in French) M.Sc.A. Thesis, Département de Génie Chimique, Université de Sherbrooke, Canada, (1997).
18 International Journal of Chemical Reactor Engineering Vol. 3 [2005], Article A4
http://www.bepress.com/ijcre/vol3/A4
Lynum, S., “System for the production of carbon black”, Patent Number WO 93/20153.14/10/93 (1993).
Merlo-Sosa, L., “Dodecane Decomposition in a Radio-Frequency (RF) Plasma Reactor” Ph. D. Thesis, Département de Génie Chimique, Université de Sherbrooke, Canada, (2003).
Nikravech, M., Pernin, J.F., Lecrivain, S., Amouroux, J., “Plasma-fluidized Bed Hydrocracking Process of Heavy Hydrocarbons”, ISPC-9 Pugnochiuso, Italy, 709-714 (1989).
Nikravech, M.M., “Conception et Mise en Oeuvre d’un Réacteur de Craquage Lit-Fluidisé sous Plasma” (in French), Ph. D. Thesis, Chimie Appliquée et Génie de Procèdes Industriels, Université Pierre et Maire Curie, Paris, France, (1990).
Olah, G.A., Arpad, M., “Hydrocarbon chemistry”, New York Wiley & Sons, (1995).
Perry, H.R., “Perry’s Chemical Engineers’ Handbook: Physical and Chemical Data”, 7th Edition, New York, Mc Graw-Hill, (1997).
Schwob, Y., “Conversion of Carbon or Carbon-Containing Compounds in Plasma”, US Patent Number: 6 099 696 (2000).
Shaw, D., “Carbon Black process is flexible” in “Carbon Black”, European Rubber Journal, Vol. 180, No. 1, 18-27(1998).
Soucy, G., Bergeron, E., Boulos, M., “Design of an Induction Plasma Reactor for the Reforming of Aromatic Liquid Wastes”, High Temperature Material Processes, Vol. 2, 195-206 (1998).
19Merlo-Sosa and Soucy: Dodecane Decomposition in a Radio-Frequency (RF) Plasma Reactor
Produced by The Berkeley Electronic Press, 2005
APPENDIX 1. DODECANE PYROLYSIS MECHANISM
No Ai Tm Ea Reaction Reference
1 1.00E+15 0.00 100.00 C12H26==>C12H25+H Nikravech, 1990
2 1.00E+17 0.00 84.40 C12H26==>C11H23+CH3 Nikravech, 1990
3 1.00E+17 0.00 82.50 C12H26==>C10H21+C2H5 Nikravech, 1990
4 1.00E+17 0.00 83.50 C12H26==>C9H19+C3H7 Nikravech, 1990
5 5.60E+07 2.00 7.70 C12H26+H==>C12H25+H2 Nikravech, 1990
6 1.30E+12 0.00 11.60 C12H26+CH3==>C12H25+CH4 Nikravech, 1990
7 1.00E+12 0.00 13.40 C12H26+C2H5==>C12H25+C2H6 Nikravech, 1990
8 1.00E+12 0.00 18.00 C12H26+C3H5==>C12H25+C3H6 Nikravech, 1990
9 1.00E+12 0.00 13.40 C12H26+C3H7==>C12H25+C3H8 Nikravech, 1990
10 2.00E+13 0.00 28.70 C12H25==>C10H21+C2H4 Nikravech, 1990
11 2.00E+13 0.00 28.70 C12H25==>C9H19+C3H6 Nikravech, 1990
12 2.00E+13 0.00 28.70 C12H25==>C8H17+C4H8 Nikravech, 1990
13 2.00E+13 0.00 28.70 C11H23==>C9H19+C2H4 Nikravech, 1990
14 2.00E+13 0.00 28.70 C11H23==>C8H17+C3H6 Nikravech, 1990
15 2.00E+13 0.00 28.70 C11H23==>C7H15+C4H8 Nikravech, 1990
16 2.00E+13 0.00 28.70 C10H21==>C8H17+C2H4 Nikravech, 1990
17 2.00E+13 0.00 28.70 C10H21==>C7H15+C3H6 Nikravech, 1990
18 2.00E+13 0.00 28.70 C10H21==>C6H13+C4H8 Nikravech, 1990
19 2.00E+13 0.00 28.70 C9H19==>C7H15+C2H4 Nikravech, 1990
20 2.00E+13 0.00 28.70 C9H19==>C6H13+C3H6 Nikravech, 1990
21 2.00E+13 0.00 28.70 C9H19==>C5H11+C4H8 Nikravech, 1990
22 2.00E+13 0.00 28.70 C8H17==>C6H13+C2H4 Nikravech, 1990
23 2.00E+13 0.00 28.70 C8H17==>C5H11+C3H6 Nikravech, 1990
24 2.00E+13 0.00 28.70 C8H17==>C4H9+C4H8 Nikravech, 1990
25 2.00E+13 0.00 28.70 C7H15==>C5H11+C2H4 Nikravech, 1990
26 2.00E+13 0.00 28.70 C7H15==>C4H9+C3H6 Nikravech, 1990
27 2.00E+13 0.00 28.70 C7H15==>C3H7+C4H8 Nikravech, 1990
28 1.00E+13 0.00 28.70 C6H13==>C4H9+C2H4 Nikravech, 1990
29 5.00E+13 0.00 28.70 C6H13==>C3H7+C3H6 Nikravech, 1990
30 2.00E+13 0.00 29.70 C6H13==>C2H5+C4H8 Nikravech, 1990
31 2.00E+13 0.00 31.00 C6H13==>CH3+C5H10 Nikravech, 1990
32 4.50E+13 0.00 28.70 C5H11==>C3H7+C2H4 Nikravech, 1990
33 4.50E+13 0.00 29.70 C5H11==>C2H5+C3H6 Nikravech, 1990
34 4.20E+13 0.00 31.00 C5H11==>CH3+C4H8 Nikravech, 1990
35 3.16E+16 0.00 339.00 C5H10==>C2H5+C3H5 Bikas et al., 2001
36 2.80E+13 0.00 16.80 C5H10+H==>C5H9+H2 Bikas et al., 2001
37 1.00E+11 0.00 30.60 C5H10+CH3==>C5H9+CH4 Bikas et al., 2001
38 2.50E+13 0.00 126.00 C5H9==>C3H5+C2H4 Bikas et al., 2001
39 2.50E+13 0.00 126.00 C5H9==>C2H3+C3H6 Bikas et al., 2001
40 2.50E+13 0.00 121.00 C4H9==>C2H5+C2H4 Bikas et al., 2001
41 1.90E+55 -11.90 32.30 C4H9+He==>C2H5+C2H4+He Ristori et al., 2001
20 International Journal of Chemical Reactor Engineering Vol. 3 [2005], Article A4
http://www.bepress.com/ijcre/vol3/A4
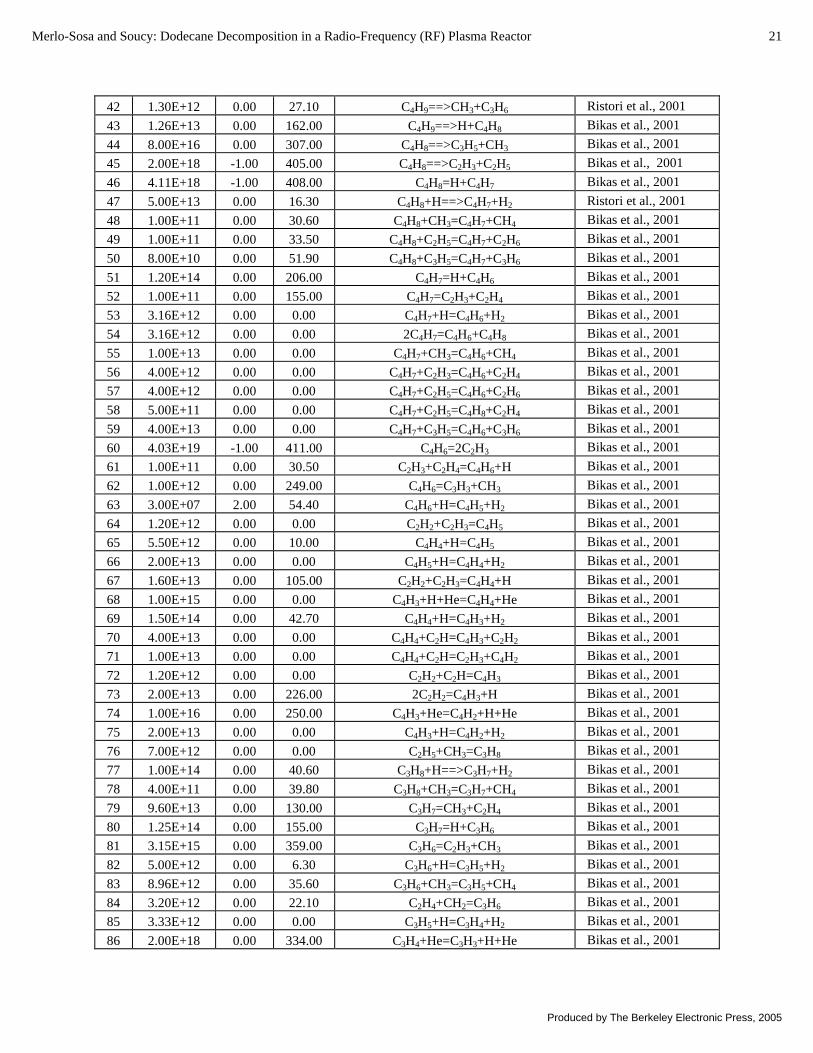
42 1.30E+12 0.00 27.10 C4H9==>CH3+C3H6 Ristori et al., 2001
43 1.26E+13 0.00 162.00 C4H9==>H+C4H8 Bikas et al., 2001
44 8.00E+16 0.00 307.00 C4H8==>C3H5+CH3 Bikas et al., 2001
45 2.00E+18 -1.00 405.00 C4H8==>C2H3+C2H5 Bikas et al., 2001
46 4.11E+18 -1.00 408.00 C4H8=H+C4H7 Bikas et al., 2001
47 5.00E+13 0.00 16.30 C4H8+H==>C4H7+H2 Ristori et al., 2001
48 1.00E+11 0.00 30.60 C4H8+CH3=C4H7+CH4 Bikas et al., 2001
49 1.00E+11 0.00 33.50 C4H8+C2H5=C4H7+C2H6 Bikas et al., 2001
50 8.00E+10 0.00 51.90 C4H8+C3H5=C4H7+C3H6 Bikas et al., 2001
51 1.20E+14 0.00 206.00 C4H7=H+C4H6 Bikas et al., 2001
52 1.00E+11 0.00 155.00 C4H7=C2H3+C2H4 Bikas et al., 2001
53 3.16E+12 0.00 0.00 C4H7+H=C4H6+H2 Bikas et al., 2001
54 3.16E+12 0.00 0.00 2C4H7=C4H6+C4H8 Bikas et al., 2001
55 1.00E+13 0.00 0.00 C4H7+CH3=C4H6+CH4 Bikas et al., 2001
56 4.00E+12 0.00 0.00 C4H7+C2H3=C4H6+C2H4 Bikas et al., 2001
57 4.00E+12 0.00 0.00 C4H7+C2H5=C4H6+C2H6 Bikas et al., 2001
58 5.00E+11 0.00 0.00 C4H7+C2H5=C4H8+C2H4 Bikas et al., 2001
59 4.00E+13 0.00 0.00 C4H7+C3H5=C4H6+C3H6 Bikas et al., 2001
60 4.03E+19 -1.00 411.00 C4H6=2C2H3 Bikas et al., 2001
61 1.00E+11 0.00 30.50 C2H3+C2H4=C4H6+H Bikas et al., 2001
62 1.00E+12 0.00 249.00 C4H6=C3H3+CH3 Bikas et al., 2001
63 3.00E+07 2.00 54.40 C4H6+H=C4H5+H2 Bikas et al., 2001
64 1.20E+12 0.00 0.00 C2H2+C2H3=C4H5 Bikas et al., 2001
65 5.50E+12 0.00 10.00 C4H4+H=C4H5 Bikas et al., 2001
66 2.00E+13 0.00 0.00 C4H5+H=C4H4+H2 Bikas et al., 2001
67 1.60E+13 0.00 105.00 C2H2+C2H3=C4H4+H Bikas et al., 2001
68 1.00E+15 0.00 0.00 C4H3+H+He=C4H4+He Bikas et al., 2001
69 1.50E+14 0.00 42.70 C4H4+H=C4H3+H2 Bikas et al., 2001
70 4.00E+13 0.00 0.00 C4H4+C2H=C4H3+C2H2 Bikas et al., 2001
71 1.00E+13 0.00 0.00 C4H4+C2H=C2H3+C4H2 Bikas et al., 2001
72 1.20E+12 0.00 0.00 C2H2+C2H=C4H3 Bikas et al., 2001
73 2.00E+13 0.00 226.00 2C2H2=C4H3+H Bikas et al., 2001
74 1.00E+16 0.00 250.00 C4H3+He=C4H2+H+He Bikas et al., 2001
75 2.00E+13 0.00 0.00 C4H3+H=C4H2+H2 Bikas et al., 2001
76 7.00E+12 0.00 0.00 C2H5+CH3=C3H8 Bikas et al., 2001
77 1.00E+14 0.00 40.60 C3H8+H==>C3H7+H2 Bikas et al., 2001
78 4.00E+11 0.00 39.80 C3H8+CH3=C3H7+CH4 Bikas et al., 2001
79 9.60E+13 0.00 130.00 C3H7=CH3+C2H4 Bikas et al., 2001
80 1.25E+14 0.00 155.00 C3H7=H+C3H6 Bikas et al., 2001
81 3.15E+15 0.00 359.00 C3H6=C2H3+CH3 Bikas et al., 2001
82 5.00E+12 0.00 6.30 C3H6+H=C3H5+H2 Bikas et al., 2001
83 8.96E+12 0.00 35.60 C3H6+CH3=C3H5+CH4 Bikas et al., 2001
84 3.20E+12 0.00 22.10 C2H4+CH2=C3H6 Bikas et al., 2001
85 3.33E+12 0.00 0.00 C3H5+H=C3H4+H2 Bikas et al., 2001
86 2.00E+18 0.00 334.00 C3H4+He=C3H3+H+He Bikas et al., 2001
21Merlo-Sosa and Soucy: Dodecane Decomposition in a Radio-Frequency (RF) Plasma Reactor
Produced by The Berkeley Electronic Press, 2005

87 2.00E+07 2.00 20.90 C3H4+H=C3H3+H2 Bikas et al., 2001
88 2.00E+11 0.00 32.20 C3H4+CH3=C3H3+CH4 Bikas et al., 2001
89 2.00E+12 0.00 11.30 C3H4+H=C3H5 Bikas et al., 2001
90 1.30E+05 2.50 4.18 C3H4+H=CH3+C2H2 Bikas et al., 2001
91 3.00E+13 0.00 0.00 C2H2+CH=C3H3 Bikas et al., 2001
92 1.80E+14 0.00 0.00 C2H2+CH2=C3H3+H Bikas et al., 2001
93 4.00E+13 0.00 0.00 C3H3+CH2=C4H4+H Bikas et al., 2001
94 1.00E+13 0.00 157.00 C3H3+CH3=C2H5+C2H Bikas et al., 2001
95 7.00E+13 0.00 0.00 C3H3+CH=C4H3+H Bikas et al., 2001
96 1.40E+09 1.50 31.10 C2H6+H=C2H5+H2 Bikas et al., 2001
97 7.54E+00 3.73 9.88 C2H6+CH3=C2H5+CH4 Bikas et al., 2001
98 2.20E+13 0.00 36.30 C2H6+CH2=C2H5+CH3 Bikas et al., 2001
99 8.20E+13 0.00 167.00 C2H5=H+C2H4 Bikas et al., 2001
100 1.14E+12 0.00 0.00 C2H5+CH3=C2H4+CH4 Bikas et al., 2001
101 2.70E+11 0.00 98.11 C2H5+C2H2=C2H6+C2H Fincke et al.,2002
102 1.39E+12 0.00 0.00 2C2H5=C2H4+C2H6 Fincke et al., 2002
103 3.50E+16 0.00 299.00 C2H4+He=C2H2+H2+He Bikas et al., 2001
104 7.30E+17 0.00 404.00 C2H4+He=C2H3+H+He Bikas et al., 2001
105 5.40E+14 0.00 62.40 C2H4+H=C2H3+H2 Bikas et al., 2001
106 4.16E+12 0.00 45.56 C2H4+CH3=C2H3+CH4 Fincke et al., 2002
107 1.20E+13 0.00 -2.40 CH2+CH3=H+C2H4 Bikas et al., 2001
108 2.00E+14 0.00 166.00 C2H3=H+C2H2 Bikas et al., 2001
109 1.20E+13 0.00 0.00 C2H3+H=C2H2+H2 Bikas et al., 2001
110 9.64E+11 0.00 0.00 2C2H3=C2H2+C2H4 Fincke et al., 2002
111 3.92E+11 0.00 0.00 C2H3+CH3=C2H2+CH4 Fincke et al., 2002
112 1.20E+13 0.00 3.34 2CH2=C2H2+H2 Bikas et al., 2001
113 6.62E+13 0.00 116.00 C2H2+H=C2H+H2 Bikas et al., 2001
114 1.30E+04 3.00 33.60 CH4+H=CH3+H2 Bikas et al., 2001
115 1.30E+13 0.00 39.90 CH4+CH2=2CH3 Bikas et al., 2001
116 3.00E+13 0.00 -1.70 CH4+CH=H+C2H4 Bikas et al., 2001
117 3.16E+13 0.00 61.40 2CH3=C2H5+H Bikas et al., 2001
118 1.81E+13 0.00 0.00 2CH3=C2H6 Bikas et al., 2001
119 1.00E+14 0.00 134.00 2CH3=C2H4+H2 Bikas et al., 2001
120 1.02E+16 0.00 379.00 CH3+He=CH2+H+He Bikas et al., 2001
121 6.90E+14 0.00 345.00 CH3+He=CH+H2+He Fincke et al., 2002
122 2.11E+14 0.00 0.00 CH3+H=CH4 Bikas et al., 2001
123 7.90E+11 0.00 0.00 CH3+C2H3=CH4+C2H2 Ristori et al., 2001
124 7.23E+13 0.00 0.00 CH2+H2=CH3+H Bikas et al., 2001
125 1.81E+13 0.00 0.00 CH2+C2H3=C2H2+CH3 Fincke et al., 2002
126 1.81E+13 0.00 0.00 CH2+C2H=C2H2+CH Fincke et al., 2002
127 9.64E+13 0.00 0.00 CH2+C2H4=C3H6 Bikas et al., 2001
128 1.60E+13 0.00 -2.40 CH2+CH4=2CH3 Bikas et al., 2001
129 1.11E+08 1.79 7.00 CH+H2=H+CH2 Bikas et al., 2001
130 5.00E+05 2.00 30.30 CH2+H2=H+CH3 Bikas et al., 2001
131 1.20E+14 0.00 3.34 2CH2=C2H2+2H Bikas et al., 2001
22 International Journal of Chemical Reactor Engineering Vol. 3 [2005], Article A4
http://www.bepress.com/ijcre/vol3/A4

132 2.40E+14 0.00 41.57 2CH2=CH3+CH Fincke et al., 2002
133 4.00E+15 0.00 374.54 CH2+He=CH+H+He Fincke et al., 2002
134 4.22E+13 0.00 0.00 CH2+CH3=H+C2H4 Ristori et al., 2001
135 4.00E+13 0.00 0.00 CH+CH2=H+C2H2 Bikas et al., 2001
136 3.00E+13 0.00 0.00 CH+CH3=C2H3+H Bikas et al., 2001
137 7.89E+13 0.00 0.67 CH+H==>C+H2 Bikas et al., 2001
138 1.90E+14 0.00 280.19 CH+He==>C+H+He Fincke et al., 2002
139 1.30E+14 0.00 246.93 CH2+He==>C+H2+He Fincke et al., 2002
140 1.81E+14 0.00 0.00 C2H+H=C2H2 Fincke et al., 2002
141 1.81E+12 0.00 2.08 C2H+CH4=C2H2+CH3 Fincke et al., 2002
142 9.64E+11 0.00 0.00 C2H+C2H3=2C2H2 Fincke et al., 2002
143 1.81E+12 0.00 0.00 C2H+C2H5=C2H2+C2H4 Fincke et al., 2002
144 7.94E+13 0.00 487.40 C2H==>2C+H Laflamme, 1988
145 1.00E+09 0.00 0.00 C2H+H==>2C+H2 Laflamme, 1988
146 1.40E+17 0.00 98.00 C2H+H==>CH2+C Laflamme, 1988
147 4.57E+07 0.00 17.20 C2H2+He=C2+H2+He Fincke et al., 2002
148 1.81E+12 0.00 0.00 2C2H=C2H2+C2 Fincke et al., 2002
149 3.61E+15 0.00 598.17 C2H+He=C2+H+He Fincke et al., 2002
150 3.61E+13 0.00 118.21 C2H+H=C2+H2 Fincke et al., 2002
151 3.72E+14 0.00 580.53 C2+He==>2C+He Fincke et al., 2002
152 1.85E+18 -1.00 0.00 2H+He=H2+He Bikas et al., 2001
153 1.10E+08 2.90 372.00 C6H5=C4H3+C2H2 Bikas et al., 2001
154 1.20E+12 0.00 0.00 2C3H3=C6H6 Bikas et al., 2001
155 7.00E+11 0.00 41.80 C3H3+C3H4=C6H6+H Bikas et al., 2001
156 2.80E+03 2.90 5.85 C2H2+C4H5=C6H6+H Bikas et al., 2001
157 7.10E+13 0.00 2.80 C6H5+H=C6H6 Bikas et al., 2001
158 7.90E+13 0.00 41.80 C6H6+H=C6H5+H2 Bikas et al., 2001
159 2.00E+12 0.00 63.00 C6H6+CH3=C6H5+CH4 Bikas et al., 2001
23Merlo-Sosa and Soucy: Dodecane Decomposition in a Radio-Frequency (RF) Plasma Reactor
Produced by The Berkeley Electronic Press, 2005