Embed Size (px)
Citation preview

2-- -ffi --21 023
(jender Differences in Educationin Mexico
Susan Wendy Parker and Carla Pederzini
EDUCATk"ONAugust 2000 T HE WO0R LD B AN K
Pub
lic D
iscl
osur
e A
utho
rized
Pub
lic D
iscl
osur
e A
utho
rized
Pub
lic D
iscl
osur
e A
utho
rized
Pub
lic D
iscl
osur
e A
utho
rized
Pub
lic D
iscl
osur
e A
utho
rized
Pub
lic D
iscl
osur
e A
utho
rized
Pub
lic D
iscl
osur
e A
utho
rized
Pub
lic D
iscl
osur
e A
utho
rized


Gender Differences in Education in Mexico
Susan Wendy Parker, Ph.DCarla Pederzini, M.S.

Photography Credits: Front cover: Nepal, S. Noorani (UNICEF); Haiti, J. Perkell (UNICEF);Pakistan, U. Anzar (World Bank); Back cover: Guinea-Bissau, G. Pirozzi (UNICEF).

Table of Contents
ACKNOWLEDGEMENTS ..................................................................... 3
INTRODDCTIIN.
SECTION 1The Educational System in Mexico ..................................................................... 7
SECTION 2Theoretical and Empirical Literature on EducationalInvestments in Male and Female Children ..................................................................... 15
Empirical Studies on Schooling ..................................................................... 16
SECTION 3Current Trends in Education in Mexico: Assistance andAttainment of Youth and Young Adults ..................................................................... 19
SECTION 4Empirical Model and Data ..................................................................... 27
Samples Used in the Analysis ..................................................................... 27Independent Variables ..................................................................... 28
Characteristics of the Child and Siblings .................................. ................................... 28Characteristics of the Parents ..................................................................... 28Characteristics of the Household ..................................................................... 29Characteristics of the Community ..................................................................... 30
SECTION 5Regression Results ..................................................................... 33
SECTION 6Conclusions and Policy Implications ..................................................................... 39
R eferences ..................................................................... 41
Tables
I . Average Years of Completed Schooling, by Age Group, RurallUrban Residence, and Sex .102. Average Years Behind in School by Age, Sex, and Urban/Rural Residence .243. Means and Standard Deviations of Variables Used in the Analysis: Youth Aged 12 to 15 .314. Determinants of the Probability of School Attendance, Youth Aged 12 to 15 .335. Determinants of the Probability of School Attendance, by Urban and
Rural Residence, Youth Aged 12 to 15 .346. Determinants of the Probability of Being Behind in School, Youth Aged 12 to 15. 357. Determinants of the Probability of Being Behind in School, by
Urban and Rural Residence, Youth Aged 12 to 15 .36
l

Figures
1. Percentage of Population with No School, by Age Group and Sex ...................................................... 82. Average Years of Completed Schooling, by Age Group and Sex ........................................................ 83. Average Completed Years of Schooling, by Age Group and Per Capita Income Decile ................... 104. Average Years of Completed Schooling, by Selected Age Groups,
Per Capita Income Decile, and Sex .............................................................. 125. Percentage of Population Attending School, by Age and Sex ............................................................ 196. Percentage of Population Attending School, by Size of Locality, Age, and Sex ............. .................. 207. Percentage of Population Attending School, by Age and Per Capita Income Decile ......................... 218. Average Completed Years of Schooling, by Size of Locality, Sex, and Age ..................................... 229. Average Completed Years of Schooling, by Per Capita Income Decile and Age .............................. 2310. Percentage of Children Behind in School, by School Attendance, Age, and Sex .2411. Percentage of Children Behind in School, by Sex, Age, and Per Capita Income Decile .25
2

ACKNOWLEDGEMENTS
This paper was prepared as part of the World Bank, LCSPR Project under the direction ofMaria Correia and Olympia Icochea. LCSPR gratefully acknowledges the assistance of theConsejo Nacional de Poblaci6n (CONAPO), the Instituto Nacional de Estadistica, Geografia eInformatica (INEGI), and the Programa de Educaci6n, Saludy Alimentaci6n (PROGRESA) forsupplying essential data.
Susan Wendy Parker is the Advisor for the Education, Health, and Nutrition Program(PROGRESA), Secretary of Social Development, and can be reached at Insurgentes Sur 1480;Col. Barrio de Actipan; 02320 Mexico D.F. MEXICO, (525) 629-99-10, ext. 3855; Fax: (525)524-9881, Email: susanp(progresa.gob.mx.
Carla Pederzini is a Doctoral student in the Center of Demography and UrbanDevelopment, El Colegio de Mexico; Camino al Ajusco, No. 20, 01000 Mexico D.F. MEXICO,Email: [email protected].
This paper is part of a series printed and disseminated under the auspices of the Girls'Education Thematic Group in the Education Department, Human Development Network, of theWorld Bank. The views expressed in papers in this series are those of the authors and should notbe attributed to the World Bank. This particular paper was prepared for Maria Correia, SectorManager, Gender Sector, Latin America and Caribbean Region with their financial support. Thepaper was peer reviewed prior to being printed. Benjamin Crow managed the layout andpublishing.
3

4

INTRODUCTION
One of the basic principles behind a just society is the equality of access to opportunities.While defining what consists of equality of opportunities is notoriously difficult, there is generalagreement that access to education constitutes one of the most important. Nevertheless, it isobvious that equal access to even basic education is not universal at the worldwide level, andhuge differences in educational attainment exist both within and across countries.
The level of education is a fundamental factor in the development of a country. There isample evidence that a highly educated labor force is one of the key factors in promoting acountry's development. Lack of an adequate education has been one of the most important factorscontributing to the persistency and increases in poverty in Latin America (Londoino 1996).
Just as important as the overall level of education in a country is the distribution ofeducation between its residents. In most countries, the level of schooling for females is lower thanthat for males. Evidence demonstrates, furthermore, that the gender gap in education is higher indeveloping countries than in more developed countries, although as we shall see later, LatinAmerica generally has lower educational differences between men and women than other regions.
Women's education has been demonstrated to have substantial positive external effectsapart from its beneficial effects on the women herself. Besides generating private returns fromtheir participation in the labor market, women's education has strong impacts on diversevariables, such as their children's health and mortality, as well as their own fertility andreproductive health. Numerous studies have demonstrated that social returns to investing inwomen's education outweigh the social returns to investing in male's education (Schultz 1993;King and Hill 1993).
Other studies have shown that it is not only important to invest in the education of menand women, but that it is important to eliminate the gender gap between them as well. There isevidence that gender inequality in education is associated with reductions in GDP per capita(King and Hill 1993). The benefits of increasing female education are therefore more than just anincrease in income or in productivity. The implication, therefore, is that if female education levelsare not increased to the same education levels as men, social indicators can only be achieved atmuch higher levels of economic growth.
Within Latin America, gender differences are generally lower than in other developingcountries, although this growth rate has been less than in other regions (BID 1996). Furthermore,substantial progress has been made over the last generations in eliminating gender differences ineducation. Since 1960, there has been a large general expansion in education within the regionand sharp falls in gender differences between men and women. Primary school enrollment andcompletion statistics show no differences by gender in most countries, and to a large extent thesetrends carry over to secondary education. Those countries which are most likely to still havegender gaps favoring men in education in younger generations are the poorer countries, such asBolivia, whereas in wealthier countries there are no significant differences between men andwomen in educational attainment, except in very poor and/or indigenous areas. An interestingcorollary of this is that those countries with higher levels of education tend also to be thosecountries in which there are lower or no differences between men and women in educationalattainment (Bustillo 1993).
S

This paper concentrates on the determinants of education in Mexico, an area in whichthere has been little empirical investigation. Mexico is an interesting case study for education as itrepresents a country, which, like much of Latin America, has experienced growth in educationalattainments over the last decades. Nevertheless, given its level of GDP, Mexico actually doesvery poorly in terms of education, with its population having two and one-half years less ofeducation than what it should have (BID 1996). Additionally, Mexico has very high inequality inincome and wealth, as well as a large indigenous population, which is difficult to access both dueto the diversity of languages spoken and geographical isolation.
The paper has two central goals. The first is to analyze the determinants of the level ofeducation of boys and girls in Mexico. Here we will concentrate on the effects of familybackground (such as education of parents), economic and poverty status of the family, the effectof place of residence (to measure potential supply effects of schooling), government subsidieswhich may affect educational attendance, and demographic composition of the family (includingnumber of siblings and birth order).
The second objective is to understand gender differences in education. Mexico alsoprovides an interesting case study for studies of gender inequalities in education as theeducational gap has decreased substantially between men and women over the last 50 years. Thispaper attempts to analyze the factors which affect how families invest in boys' and girls'education.
The analysis will use the National Survey of the Population and Housing Count (Conteo).The Conteo has two parts. It was carried out in 1995 as a census of the population. However, amore detailed household questionnaire was applied to a subsample of the population at the sametime. It includes information on all individuals in the household, including their labor marketbehavior; educational level and whether they are currently studying; all forms of monetaryincome, including program transfers; as well as demographic and other useful information, suchas disabilities. The Conteo is the best available information for the purposes of our study for anumber of reasons, including: (i) it has a large sample, which enables us to focus on the roles ofrural residence and poverty which are important determinants of educational attainment; (ii) itincludes all monetary income sources; (iii) it also includes detailed information on number ofyears studied, including number of years dedicated to technical careers, as well as whetherindividuals are currently attending school and, if not, whether they have ever attended.
The paper is organized as follows. We first describe the educational system in Mexicoand present trends in educational attainment over the last few generations. We then provide abrief description of the existing theoretical and empirical literature on the determinants ofeducational investmnent in children, as well as some evidence that has been found on educationalinvestments between girls and boys. We then present a detailed descriptive analysis of currenttrends in school attendance and attainment of individuals aged 6 to 29. Next, we turn to theempirical models, where we estimate the determinants of school attendance and the probability offalling behind in school. The regressions focus on child, family, household, as well as communitycharacteristics. After the results section, we conclude with an interpretation of our findings in thecontext of gender differences in education and the policy implications of our analysis.
6

SECTION 1. THE EDUCATIONAL SYSTEM IN MEXICO
The Mexican education system consists of mandatory free primary and, as of 1992,secondary education. As might be expected, primary coverage is almost universal in Mexico, butsecondary coverage lags substantially behind.I At the high school level, (preparatoria) studentsmay choose between a curriculum oriented towards preparing them for higher education and acurriculum which is oriented towards technical schools and/or curriculum which prepares themfor entering the workforce. Nevertheless, by the high school level, as we will see below, themajority of youth are no longer attending school.
Technical school is an option which is quite popular, particularly among women.Technical school is normally one to three years of school which can be done after primary,secondary, or high school. Generally, technical school involves the training of a particular skill oroccupation, such as computing, nursing, secretaries, and electronic technicians2 Almost 15percent of all women (versus 7.5 percent of men) report that they have attended technical school,and the percentage of female workers with technical school is approximately 21 percent(compared with 8 percent of male workers).
University-level education is attained by only a small fraction of the population.Approximately 15 percent of men aged 25 to 40 and 11 percent of women aged 25 to 40 reporthaving completed at least one year of university-level education.
Overall levels of education have been increasing steadily over the last 50 years, asmeasured by the percentage of the population never attending school and average years ofschooling attained. Figure 1 and Figure 2 demonstrate that the level of education has increaseddramatically between the older and younger generations. For instance, whereas the average yearsof completed schooling for individuals between the ages of 25 and 29 is approximately eightyears of schooling, for the population aged 65 and older, this figure is less than three years ofschooling. Almost half of the population over age 65 report that they never attended school.
Approximately 10 percent of children attend private primary and secondary schools.
2Previously, studies to be a teacher were part of technical school, but have been changed within the last 10 years to bea college-level program.
7

Figure 1. Percentage of Population with No School, by Age Group and Sex
50
45 -
40 -
35
c"' -
20
15
10
5
10-14 15-19 20-24 25-29 30-34 35-39 40-44 45-49 50-54 55-59 60-64 >64
* Male u Female
Source: Author's calculations from Encuesta del Conteo 1995.
Figure 2. Average Years of Completed Schooling, by Age Group and Sex
10
9
8
7
6
cu54.
3
2
0
5- 9 10 - 15 - 20 - 25 - 30 - 35 - 40 - 45 - 50 - 55 - 60-64 65+14 19 24 29 34 39 44 49 54 59
Age Group
+.~ Male Female
Source: Authors' calculations from Encuesta del Conteo 1995.
In termns of the gender education gap, Figure 1 and Figure 2 demonstrate that the gendergap is generally increasing with age; that is, over time, the gender gap appears to be closing. Withrespect to number of years of schooling, higher education levels of men than women begin toappear only in the age group 20 to 24 and are increasing thereafter. It is also important to mentionthat the gender gap appears to be decreasing after age 50. This may be due to a selection
8

mechanism. That is, women tend to have a longer life span than men, and given that it is probablethat individuals who live longer also have higher education levels, a decreasing educational gapby gender could be explained. It may also be the case that for the older generation, there was littleaccess to schools above the primary level when they were of school age, which-may limit theextent of the gender gap.
It is important to emphasize the role of technical school in gender differences ineducation. The Conteo is the first data set in Mexico which allows the accurate measurement ofnumber of years spent in technical school. As girls and young women are much more likely toattend technical school than boys and young men, the Conteo allows a more accuratemeasurement of number of school years attained. Without correct accounting for technical school,there would appear to be a larger gap in years of completed schooling than is actually the case.Nevertheless, this raises another issue, which is whether technical schooling should be "counted"in the same manner as other types of schooling. For instance, many technical schools require onlyprimary education as a prerequisite, and it is not obvious that one year of this technical schoolingcan be considered equivalent to a year of secondary education.3 For the purposes of this article,
4we will consider technical schooling to be equivalent to one year of schooling.
Table 1 shows that currently, as well as historically, education levels are much lower inrural areas than urban areas.' For the population above age 40, years of completed schooling inrural areas are less than half than those in urban areas. The levels of education in rural areas areparticularly low for the higher age groups of individuals in rural areas, where the average level ofeducational attainment is only 1.5 years for men, and 1.2 years for women.
Nor is it obvious how to measure equivalency in this sense, although a likely candidate would be to compare thereturns to education from these different types of schooling.
4The Appendix repeats Figure 2, excluding years of technical school from consideration. Compared with Figure 2, theFigure shows some differences in the educational gap between men and women. For instance, for the age group 20 to24, not considering technical education implies a gap favoring men, whereas considering technical school implies nodifferences.
5These tables may overstate the differences between rural and urban areas, as presumably a portion of the individualswho currently live in urban areas migrated from rural areas, and individuals who migrate may be likely to have a highereducational level than those who stay.
9

Table 1. Average Years of Completed Schooling, by Age Group, Rural/Urban Residence,and Sex
Male FemaleUrban Rural Urban Rural
5-9 1.33 1.13 1.38 1.2110-14 5.07 4.39 5.29 4.5315-19 8.75 6.26 8.39 6.3820-24 9.13 6.35 9.21 6.2525-29 9.40 6.13 9.18 5.6030-34 9.37 5.59 8.34 4.9935-39 8.78 4.63 7.50 3.8740-44 8.18 3.88 6.60 3.0945-49 7.19 3.09 5.56 2.3550-54 6.05 2.61 5.06 2.0755-59 5.23 2.17 4.10 1.9460-64 4.49 1.84 3.64 1.6465+ 3.40 1.50 2.91 1.21Total 5.83 3.43 5.60 3.31Source: Authors' calculations from Encuesta del Conteo 1995.
Figure 3 and Figure 4 present the distribution between education and per capitahousehold income levels by age group. These graphs helps illustrate the mutual interactionsbetween education and income. Whereas for the younger groups, living in a family with low percapita income is associated with low educational achievement; for the higher age groups, whohave long since completed their educational level, the trends imply that the low educationalattainment is a factor associated in the low level of per capita income.
Figure 3. Average Completed Years of Schooling, by Age Group and Per Capita IncomeDecile
14
12
1 0
8
6
4
2 _____=
5 -9 10- 15- 20- 25- 30- 35- 40- 45- 50- 55- 60- >64
14 19 24 29 34 39 44 49 54 59 64
Age Group
I+ 2 3h3~ 4 )K 5 + 6 7 --. 8 _,9 + 10
Note: The legend refers to Per Capita Income Decile with I being lowest and 10 being highest.Source: Authors' calculations from Encuesta del Conteo 1995.
10

To summarize, the descriptive evidence presented here shows large increases ineducation levels of the population over time, as well as evidence that gender gaps in educationbetween men and women have decreased as well. The considerably large falls in the gender gapsare noteworthy and similar to trends in other Latin American countries. While there have been noobvious gender-specific policies in education in Mexico over the last 30 years that would havecontributed to the reduction of the gender gap, we mention two factors here that we feel to beimportant determinants. The first relates to the general expansion in education, which impliesadditional schools and easier access to these schools. Parents may be more reluctant to send theirdaughters to schools that are not close by or require substantially more walking than their sons.Through this mechanism, general expansion in education facilities could have a larger impact ongirls' school attendance than on boys'.
A second factor likely to help explain the reduction of the gender gap is the increase inwomen's labor force participation, which has coincided with the period of reduction of the gendergap. The rise in labor force participation of women in Mexico has been the fastest of all countriesin Latin America with increases in the participation rate of 256 percent between 1970 and 1990(Valdez and others 1995). Whereas Mexican female labor force participation was well below theaverage of the region in 1970, this increase has allowed Mexico to catch up with the rest of theregion. Male labor force participation on the other hand has fallen over this period. Theimplications of increases in labor force participation on education levels are numerous, probablythe most important being that increased participation of women implies larger returns to investing
11

Figure 4. Average Years of Completed Schooling, by Selected Age Groups, Per Capita Income Decile, and Sex
Age Group 5-9 Age Group 10-14Age Group 15-19
24 - 6 10 .6 -9 -
2 - - 7 --- --
10 6
06
0. . .. .. ..... ... ----- - ---02,~~~~~~~ 02~~~~~~~~~~~~~~~~~~~~~~~~~~~~~~~~~~~~~~~~~~~~~~~~~~~~~~~~~~~~~~~~~~~~~~~~~~~~~~~~~~~~~~~~~~~~~~~~~~~
1 2 1 4 5 6 7 8 9 2o 04I 2 3 1 5 6 7 8 9 10 01- -4
Income Lve- 1 2 3 4 5 6 7 8 9 10Infone Level lox~~~~~~~~~~~~~~~~~~Stom. Level
Lt2F¶ole ,va- Mle S Iei ..- Feml -. Mole]
Age Group 20-24AgeGroup2024A5e C roup 25-29 Age Group 30-39
14~~~~~~~~~~~~~~~~~~~~~~~~~41
12 ~~~~~~~~~~~~~~~~~~~~12 .-
10 10 10.3-
o _ F_ I I I _ .e o , , , , , , ,._ o + I _, I I II- iA -- -- - 4 4
0 - --- - --- - ---- 0 .,.---.--- .----.- ,-.----2
I 1 2 3 0 5 6 1 0 9 10 1 2 J 4 5 6 7 8 9 10 1 2 1 4 5 6 7 1 9 10
Ineomy Level In-ome Lu,.! I.c.R.. ite
H[+Femaie- Male +FYennale. u5-MaLr- +Fcn9le .u-Ml
AgeGroup 40-49 Age Group 50-59 Age Group 60+
14 1
12 . .. .10 _ - 1S .0X =---------
4~~~~~~~~~~~~~~~~~~~~~~~~~~~~~~~~~~~~~~~~~~. ....s 4owJ ? - -----10~~~~~~~~~~~~~~~~~~~~~~~~~~~~~~~l
4 2 ---
4--- 0 S 9 1 5 6 7 S 9 1
Income Levfl Income Level Imom Level
LizFemale= .1MoLe _ .- Female -u-Maie -a r:MSource: Authors' calculations from Encuesta del Conteo 1995.
12

in education for girls. That is, if parents expect that their daughters are likely to spend more yearsworking in the labor market, they may invest more heavily in their daughter's education.
Finally, what is notable from these descriptive trends are the differences between ruraland urban areas as well as the differences by per capita income levels. This descriptive evidencesuggests that poverty is an important part of the story behind differences in education levelsbetween these populations.
13

14

SECTION 2. THEORETICAL AND EMPIRICALLITERATURE ON EDUCATIONAL INVESTMENTS IN
MALE AND FEMALE CHILDREN
Economic theories on the determinants of investment in education begin with the theoryof human capital, whereby individuals choose to invest in education depending on costs andbenefits of this investment (Becker 1975). Costs include both direct expenditures associated withschooling as well as indirect costs representing the opportunity cost (usually foregone earningsduring the time of studies), whereas benefits refer to the increase in the present value of lifetimeearnings associated with education investments. Investments in education are expected to increasewith expected retums and decrease with increased costs.
This general theory of human capital is expanded by Becker to include a focus on gender,which is related to the organization of work in households. The division of labor between menand women in the household is based, according to the new household economics, on thespecialization of activities which lead to a greater efficiency. According to Becker, either due tobiological questions or previous discrimination against women which affect their expected returnsto educational investments, women's investment in human capital may be lower than men's.
Closely related to Becker's theories on gender and human capital, Mincer and Polacheck(1982) demonstrate that one's perspectives on time use and labor market participation in thefuture help to determine investments in human capital. Because of their larger responsibilities ofhousehold tasks, women anticipate shorter periods and/or interrupted periods of employment,which motivates them to invest differently in human capital than men, both in quantitative andqualitative terms. Women tend to invest in human capital which produces quick returns anddepreciates faster because of their frequent absences from the labor market.
An alternative perspective is provided by Francis Vella (1993) who maintains that theattitudes towards female work, which may be constructed independently of the education system,are those which determine investment in human capital. Her results demonstrate that the attitudesof women towards women's work are developed in youth and can lead to substantial reductionsin human capital investment, labor supply, and retums to education.
Another reason why gender differences in education may exist can be found in the largepercentage of returns to education for women which are social, implying that women receive lessof the benefit of their investment. Men, on the other hand, capture a larger fraction of the totalreturns to education in the labor market (Schultz 1992; King and Hill 1993).
In the case of the human capital decisions of children, these are often viewed as decisionsmade for them by their parents. Decisions by parents to invest differently in their sons' anddaughters' education may be due to differences in the expected net (of costs) returns of boys' andgirls' education. Girls may be viewed as having a lower expected return to educationalinvestments, so that it may be more "efficient' and not necessarily openly "discriminatory" toinvest more in sons' schooling.
King and Hill focus on various reasons for why the costs and returns to male and femaleeducation may differ from the perspective of parents. For instance, if schools are located faraway, parents may be more reluctant to allow daughters to travel long distances than sons. The
15

costs of children attending school also depend on their opportunity costs in termns of work (eithermarket or domestic), and in certain cultural contexts, these opportunity costs may be higher forgirls than for boys. With respect to benefits, girls may face lower returns to human capitalinvestments because of labor market discrimination or because of lower time spent in the labormarket, thereby reducing the benefits to investing in the education of girls. Parents may also tendto invest in children who will be more likely to economically support them in their old age. Ifparents' expectations are that their sons will be more likely to finance them in their old age, theymay be likely to invest more in sons' education levels.
Parish and Willis (1992) provide an interesting set of alternative hypotheses towardsviewing investment in daughters and sons. First, the authors focus on altruism, which implies thataside from their own consumption, parents care about the well-being of their children. Thishypothesis, nevertheless, does not assume that parents care equally about the well-being of eachchild, but is compatible with a larger weight on the well-being of boy children than girl children.Altruistic parents invest more in children with greater opportunities, equaling the well-being oftheir children through compensatory transfers towards the most "disadvantaged." If there is morealtruism towards sons than daughters, sons will receive larger transfers than daughters.
Under the hypothesis of "resource dilution," large families result in lower levels ofeducation for all children. Middle children are those who are most affected. The number ofchildren and the order of birth can affect the education opportunities even in the absence ofmanipulation in favor of the own interest of the parents. The authors also focus on the potentialrole of credit restrictions or conditional altruism. The lack of capacity of the individuals to obtaincredit against their future income as collateral implies that the current conditions of the familywill determine if investments in education are made. Parents are willing to finance only thosechildren who, according to their perception, are in conditions to return the resources. This canexplain gender discrimination, according to the authors, as sons may have greater possibilities topay back investments.
Intrahousehold allocation models provide an alternative focus towards viewing familyresource allocation decisions (Thomas 1993; Quisimbing and others 1997). Under these models,heterogeneity of preferences between family members is permitted, such that the outcomes mayreflect the level of bargaining power of the different members. These models are interesting inthat they allow the income, assets, and educational level of different persons in the household tohave different impacts on the outcomes of interest. Numerous studies have found evidence ofdifferential impacts of resources controlled by women versus resources controlled by men. (SeeHaddad and Hoddinott (1997) for a summary of recent literature.)
Empirical Studies on Schooling
There are a number of empirical studies relevant to our analysis. As we cannotadequately address all of them here, we will concentrate on some of the most recent and mostrelevant studies in the context of Latin America.
There have been very few studies which empirically analyze the determinants ofeducation in Mexico. One exception is Post and others (1998), who analyze rates of continuationfrom primary to secondary school in the different states of Mexico, with particular focus on thechange to mandatory secondary education implemented in 1992. They argue that communitycharacteristics are important for analyzing gender differentials in education; that is, the moremarginated the state, the greater the inequality in girls' education. They also analyze the
16

determinants of being a full-time student for the age group 13 to 15 in Mexico in 1984 and 1992,finding that family resources had a larger impact on children studying in 1992 than in 1984.
Palafox and others (1994) analyze the determinants of schooling achievement in Mexico,using an interesting database on cognitive achievement scores in math and Spanish of children inprimary schools. They find that male students tend to do better both in mathematics and Spanishthan female students, even after controlling for socioeconomic characteristics. Parental educationlevels are positively associated with student achievement as is living in a two parent family.
Singh and Santiago (1997) analyze the impact of schooling on farm earnings as well asthe determinants of household demand for children's schooling in rural areas of Mexico. Theyfind that the amount of land farmed is a strong, positive determinant of the average number ofyears of completed schooling, which they interpret as evidence of an income effect in the demandto education. They also find that mothers' schooling has an important impact on education levelsof children but that fathers' schooling has no impact.
Knaul and Parker (1998) jointly consider the relationship between schooling and workparticipation of urban youth in Mexico, looking at the determinants of beginning a work spell orleaving school in the context of the economic crisis of 1995. They find that income shocks have apositive probability on the probability of working and of leaving school both for boys and forgirls.
In the context of other Latin American countries, there are a number of studies whichfocus on gender differences in educational outcomes. King and Bellew analyze the genderinequality in Peru between 1940 and 1980. They argue that gender inequality in education hasdecreased substantially. Important determining factors of school enrollment include parent'seducation level as well as wealth. Their findings suggest that wealthier parents are more likely tosend daughters to school. Their findings also show that school inputs (such as availability oftextbooks) have a positive impact on enrollment for girls whereas they have little impact on theenrollment of boys, suggesting that school quality may be more important for the enrollment ofgirls than boys. Also in the case of Peru, Patrinos and Psacharopoulos (1997) found that familysize, as well as the interaction of age and gender of siblings with their time allocation, haveimportant impacts on educational progress.
Barros, Fox, and Mendoga (1997) demonstrate the lower probability of school attendanceamong children living in female-headed families in Brazil. For the case of Brazil, Levison (1991)and Psacharopoulos and Arriagada (1989) show the importance of similar factors as well aseducation of parents and family income on both labor force participation and school attendance.The importance of parental education levels as determinants of both child work and schoolattainment are also shown in Lam and Schoeni (1992) and Parish and Willis (1992). Finally,Duryea (1997) uses panel data to estimate the effects of shocks to family income and father'sunemployment on educational attainment in Brazil. She finds that unemployment has a small, butsignificant, negative impact on the probability that both boys and girls aged 10 to 15 advancethrough school. Family structure and parents' education are also important factors.
17

18

SECTION 3. CURRENT TRENDS IN EDUCATION INMEXICO: ASSISTANCE AND ATTAINMENT OF
YOUTH AND YOUNG ADULTS
In this section, we present trends in school assistance and educational attainment of thepopulation of individuals between ages 6 and 29, taking into account a number of variablescorrelated with school achievement, including income levels and the size of localities. Weconsider this age group to provide a full picture of educational attaimnent, given that, even at age25, over 5 percent of the population still reports to be attending school. We focus primarily hereon the differences by gender and how the roles of rural-urban residence and income level arerelated to these differences.
Figure 5 presents the percentage of the male and female population attending school. Thefigure shows that by age 8, the percentage of children attending school is over 95 percent. It isinteresting to note that school attendance increases from age 6 to age 9, which is evidence of acertain degree of late enrollment, although this late enrollment does not appear to differ bygender. School attendance begins to fall by age 1 1, with important declines in attendancebeginning at age 12, an age which (usually) coincides with the end of primary school. At this age,it is also important to note that a gender gap begins in attendance. For instance, at age 13, 86percent of boys are attending school versus 81 percent of girls. These trends are suggestive thatmore girls than boys tend to end their education level at the primary level. Nevertheless, by ages16 and 17, which normally correspond to the end of secondary level education, boys begin todrop out at the same rate as girls. At age 19, a gap begins once again, presumably resulting fromyoung men entering college at a higher rate than young women. For instance, 24 percent of malesaged 19 are attending school whereas 21.1 percent of females of this age are attending school.
Figure 5. Percentage of Population Attending School, by Age and Sex
80
70
Z 50
40
30
20
6 7 0 9 a0 ii 2 83 14 15 86 17 Is 19 20 21 22 23 24 25 26 27 20 29
Age
.4.. Female -. M....Maie
Source: Authors' calculations from Encuesta del Conteo 1995.
1 9

Figure 6 considers these trends by the size of the locality. In Mexico, rural areas aregenerally defined as localities with less than 2,500 residents. Rural areas tend to have a higherpercentage of the population in poverty, lower availability of health and educational services, anda smaller social infrastructure of roads, water systems, telephone services, etc. We consider threegroups of localities: the first corresponding to communities with less than 2,500 habitants; thesecond corresponding to communities with between 2,500 and 99,999 inhabitants, and the thirdcorresponding to localities with more than 100,000 individuals.
Figure 6. Percentage of Population Attending School, by Size of Locality, Age, and Sex
1.0
O0 .9 --- ---- - --- ~- -~- ~-- -- - -- - - --- - - -- -- - -- -- --- --- -- -- --- -- - ---- ---
0.8 9 -; - - - - -- - - -- - - - ;
0 6 -- --- -- -- --- ---- - -- - - -- - - -- --- - -- - --- -- --- --0.4
0.06 7 8 9 10 11 12 13 14 15 16 17 18 19 20 21 22 23 24 25 26 27 28 29
Age
+ Male -Less than 2,500 Male2,500-99.900 Male 100,000 andMore
,....F . Female- Less than 2,500 ... Female 2,500-99,900 + FemalelO00,000andmore
Source: Authors' calculations from Encuesta del Conteo 1995.
Figure 6 shows that the percentage of the population attending school is uniformly lowerfor rural areas than for urban areas. It also shows that the gender gap in school attendance islarger in the rural areas than in medium- and large-size cities/communities. In the case of largecities, attendance appears to be about the same for boys and girls until age 17, where boys beginto have a higher school attendance than girls. This presumably corresponds to the age at whichindividuals begin to enter college. In both the medium-sized communities and the ruralcommunities, a gender gap in attendance begins at the age of 11 and is larger in the ruralcommunities. For instance, at age 13, 79.1 percent of boys are attending school in ruralcommunities versus only 70.1 percent of girls. By age 17, there appears to be little difference inschool attendance between boys and girls with very low overall attendance rates, particularly inrural areas.
20

Figure 7 considers the relationship between school attendance and per capita householdincome level. It is clear that lower levels of per capita are associated with lower schoolattendance. It is particularly noteworthy that the lower income deciles show evidence of very lateentry to school as enrollment increases sharply from ages 6 to 9.
Figure 7. Percentage of Population Attending School, by Age and Per Capita Income Decile
100%
60%
20% ----T - ---- ----------------------
6 7 0 9 10 11 12 13 14 15 16 17 IB 19 20 Zl 22 23 24 25 26 27 ZS 29
Age
Source: Authors' calculations from Encuesta del Conteo 1995.
21

Figure 8 shows the number of years of completed schooling for individuals aged 6 to 29by size of locality. The gender gaps evident in school attendance are not obvious in years ofcompleted schooling. Actually, for the medium and larger communities, there is a "reverse"gender gap which favors girls, as girls appear to have a higher number of completed years ofschooling than boys until their mid-20s. For the rural communities, the number of years ofcompleted schooling is more or less equal until age 24, where a gap begins with men having ahigher number of years of completed schooling than women.
Figure 8. Average Completed Years of Schooling, by Size of Locality, Sex, and Age
12
10
8
6
4
2
06 7 8 9 10 11 12 13 14 15 16 17 18 19 20 21 22 23 24 25 26 27 28 29
Age
+Less than 2,500 Male .Less than 2,500 Female 2,500 -99,999 Male
' 2,500 -99,999 Female 3 More than 100,000 M ale . More than 0o0,00o Female
Source: Authors' calculations from Encuesta del Conteo 1995.
22

Figure 9 considers the relationship between years of completed schooling and incomelevels. It bears out previous findings, that the lower levels of income are more likely to havelower educational attainment.
Figure 9. Average Completed Years of Schooling, by Per Capita Income Decile and Age
14
12
10 _ _ _ _ _ _ _ _ _ _ _ _ _ _ _ _
2
0
6 7 8 9 10 ii 12 13 14 15 16 17 18 19 20 21 22 23 24 25 26 27 28 29
Age
I 1 2 3,3 4 ^|5 +6 + 7 8 _9 +10
Source: Authors' calculations from Encuesta del Conteo 1995.
How can the conflicting patterns of school attendance and years of completed schoolingbe explained? Why does a significant and important gender gap in attendance beginning at thesecondary level of schooling not coincide with a reduced number of years of schooling at theseages, even in rural areas where attendance gaps are quite large?
One possible explanation is that while fewer girls attend school, those that do attendschool do better in school than boys. That is, they are more likely to complete school levels ontime, less likely to fall behind in school, and less likely to repeat grades. While we do not haveexplicit infornation on repeated grades, we can look at the percentage of children behind inschool, where behind in school is defined as being at least one grade behind where the childshould be, taking into account his or her age.6 Figure 10 clearly shows that the percentage of boysbehind in school begins to become larger than that for girls by age 9.7 Figure 11 shows thatincome plays a strong role not only in school attendance, but also in the probability of fallingbehind in school.
More formally, children behind in school are defined to be those children where age-years of completed schooling areless than seven and greater than zero.
Note that we do not know whether boys and girls who are not attending have dropped out or will return at some pointto school.
23

Figure 10. Percentage of Children Behind in School, by School Attendance, Age, and Sex
100% l
80% %
8 9 10 1 12 13 14 15 16 17 18Age
BoysAttending * a Girs Attending
Source: Authors' calculations from Encuesta del Conteo 1995.
Finally, Table 2 considers the extent to which boys and girls fall behind in school withincreased age. The table shows the average number of years behind in school for childrenattending school from ages 8 to 18, by urban and rural residence. The table demonstrates than atall ages, boys tend to be further behind in school than girls both in rural and urban areas. Thereare also large differences between urban and rural residence with children living in rural areasbeing further behind in school at all ages. By age 12, for instance, boys in rural areas, on average,are one and one-half years behind where they should be in school, whereas the correspondingfigure in urban areas is 0.72.
Table 2. Average Years Behind in School by Age, Sex, and Urban/Rural ResidenceChildren Attending School
Rural UrbanBoys Girls All Boys Girls All
8 0.48 0.38 0.43 0.21 0.18 0.199 0.72 0.59 0.65 0.36 0.29 0.3210 1.00 0.78 0.89 0.49 0.38 0.4411 1.08 0.98 1.03 0.69 0.47 0.5812 1.52 1.29 1.41 0.75 0.54 0.6513 1.62 1.36 1.50 0.88 0.60 0.7414 1.68 1.52 1.61 0.97 0.65 0.8215 1.93 1.78 1.86 0.98 0.64 0.8116 2.12 1.92 2.03 1.19 0.90 1.0517 2.52 2.02 2.28 1.28 1.17 1.2218 3.45 3.24 3.35 1.69 1.39 1.53Source: Encuesta del Conteo 1995; Authors' calculations.
24

Figure 11. Percentage of Children Behind in School, by Sex, Age, and Per Capita Income Decile
Boys Boys
0.9 _ ' o'' - 0 90.8 0.8
0.7 ---. - - -. 0.7
ag440 03 0- - 03rO ,A=;
0 2, . . . . . . . . . .. . . . .... . . . ... o.I. . .. .......... . ... -. 0.2
0.0 -t----------- -- -- - 0.0 - - - - -
- Age Age
Girls Girls
'I0
k! 0.7 . . .. - - 0.4 .. --
0.3 0.3 . ...
0.0 --- .... - ---------- 4 . -- . . ......-----. ..
0 2 . - -- -- - ... ... ... . . . .. .. . 0. 0 ........ .. -- ~ ---- ~ ~ ~ ~ .
0.0 I- f---t t - -- -+---t- -t -t-- t 0.0 T- - -- I ~~- I- -- -- TT T
12 13 14 15 16 17 18 19 20 21 22 23 24 25 12 13 14 15 16 17 18 19 20 21 22 23 24 25
Age Age
1.0 ~ -23i H U 1.07- 8 <|1
Source. Authors' calculations from Encuesta del Conteo 1995.
25
To summarize then, in this section we have considered gender differences in education inyouth in termns of attendance and attainment. We have found that, with respect to attendance, girlsbegin to drop out of school at a higher rate than boys beginning at age 12, particularly in smallcommunities and in low-income households. Nevertheless, we have found that these differencesin attendance do not necessarily translate into immediately overall higher levels of education foryoung men, but rather these differences show up in terms of educational attainment after age 20.The reasons for this are that even though boys have higher rates of attendance than girls for atleast some age groups, they tend to be more likely to fall behind in school.
The degree to which both boys and girls (particularly boys) fall behind in school is quitean important effect in schooling achievement. The phenomenon of grade repetition, whichpresumably these trends reflect is an important issue in Mexico and is likely related to labormarket participation and domestic work at early ages, which may not initially lead to schooldropout, leads to grade repetition and likely subsequent dropout.
This complex picture of educational attainment in the younger generations suggests thatboth attendance and school performance while in school are important indicators of long-runschool attainment. In the next section, we consider the determinants of school attendance and theprobability of falling behind in school.
26

SECTION 4. EMPIRICAL MODEL AND DATA
In this section, we turn to our estimation models of the detenninants of educationalinvestrnents in boys and girls. The estimation methods are based on reduced form models of thedemand for education. The (parental) demand for education of children is expected to depend onfactors affecting the expected returns from the educational investments, as well as factorsaffecting direct and indirect costs of schooling. This framework implies the following model ofdemand for schooling:
Ey = Bo + BiX1 + B2Xj + 5jZ + 6,
where E4 represents the educational investments in childj in household i; Xi represents the vectorof explanatory variables common to all members of the household (within these are communitycharacteristics; and Xy represents the characteristics specific to the child (Parish and Willis 1995).The error term is specified in two parts: one term which is specific to each child and anotherwhich is common to all siblings. Because of the common part of the error tern to each child inthe same family (de), we estimate robust (Huber-White) standard errors.
Consistent with the descriptive data presented above, we consider two separate dependentvariables in our model, including the probability of school attendance and the probability of beingbehind in school. For the case of the probability of being behind in school, we consider only thesample of children currently attending school. For each model, we conduct our analysis onsubsamples by rural/urban residence.
Samples Used in the Analysis
In our analysis, we focus on the group of youth aged 12 to 15. We chose this group forseveral reasons. First, the descriptive evidence above suggested that a gender gap in attendancebegins to appear at age 12 between boys and girls and is particularly high between ages 12 and15, which are precisely the ages at which children should be attending secondary school.Secondly, the analysis showed that the largest gaps between boys and girls in terms of fallingbehind in school begin after age 11.
Finally, we are concerned about sample selection issues which occur after age 15,particularly for girls. In our sample, we use only children who are children of the household headand/or spouse of the household head because these are the only children for which we canidentify their parents, and henceforth analyze the impact of parent characteristics on childschooling. Nevertheless, this raises sample selection questions as to hether these children andyoungsters are representative of the sample of all children. We are concerned with the biasesarising from excluding youngsters who marry at an early age and leave the household to formtheir own household, an effect which is particularly important for girls.
8 This may introduce some sample selection bias into the analysis, so that a type of selection correction model wouldbe appropriate to control for the probability of attending school. Nevertheless, we are unable to find any appropriateidentifying variables which would affect the probability of school attendance but not affect whether the child wasbehind in his/her studies.
It also excludes children in families where the child's grandfather or grandmother is reported as household head.
27

Comparing the marital status of girls between ages 16 and 20 demonstrates that girls whoare not children of the household head are much more likely to be married (about 10 percentversus 1 percent of those living with parents). That is, they have most likely left the householdthey grew up in to form another household with their husband. This implies a selection in that thegirls who remain living in their original household with their parents are much more likely tocontinue studying than girls who leave their household to marry. For this additional reason, weexclude the analysis of educational decisions of individuals above age 15.
Independent Variables
We consider several sets of independent variables, including characteristics of the child,characteristics of the parents, household and demographic characteristics, and community-levelcharacteristics, including the supply of secondary schools.
Characteristics of the Child and Siblings
Characteristics of the child included in the model are the age and sex of the child. Wealso experimented with variables measuring the birth order, including dummy variablesmeasuring whether the child was the oldest or youngest child living in the family.'0 Some recentevidence has found that middle children do worse in terms of household schooling investments(Parish and Willis 1993). Nevertheless, these variables were found to be insignificant in all casesand were left out of the final models.
We also include measures of children aged 0 to 5, children aged 6 to 11, and othersiblings aged 12 to 20 in the household. We expect that the presence of younger children mayhave negative impacts on schooling, due to either additional domestic responsibilities oreconomic necessities. Other siblings of school age may have negative impacts on educationthrough tradeoffs between quantity and quality, or through the "dilution" of family resources
Characteristics of the Parents
We are particularly interested in the potential effects of the educational levels of thefather and mother. Parental education should have a positive influence on child education throughparental influence, a home environment more oriented toward study, the greater ability of parentsto help children with homework, etc. It is also likely to pick up economic status of the household,although we include a number of other measures of economic status."
Some previous literature in other countries has demonstrated that father and mothereducational levels have different impacts on the level of education and other outcomes of sonsand daughters. In particular, it has been found that mother's level of education generally has alarger impact on child education outcomes, particularly those of girls.
We also include dummy variables measuring whether the father and mother of the childare present in the household. These variables may pick up both economic and work effects as
10 Unfortunately, we have no information on children who are no longer living in the household so that the oldest childin the household is not necessarily the oldest child of the parents. Additionally, we do not know if a mother's fertilityhas been completed so that the youngest child may not be the last child.
In the case where education is missing for parents, we impute the mean value.
28

well as motivational or psychological aspects associated with schooling. Parents absent from thehousehold may place additional work burdens on children: for instance, if children enter the laborforce to replace adult income or if children at home engage in more domestic work to make up forparents. Studies in the context of other countries have found that children of single parents oftenperform worse in school, even when controls for income status are in place (Garasky 1992).These worse outcomes are often attributed to motivational and psychological factors associatedwith a parent's separation or divorce. In our case, there are few mothers of children absent fromthe household, whereas approximately 15 percent of fathers are absent from the household.Almost all of these households are female-headed households.
Characteristics of the Household
The economic status of the household, as demonstrated in the descriptive statistics,should be a fundamental determinant of educational determinants and differences in educationbetween boys and girls. The economic status affects educational investments in children throughthe ability of the household to pay direct and indirect costs of their child's schooling. Poorerhouseholds have fewer resources with which to finance such aspects as transportation and schoolsupplies. Additionally, the opportunity cost of children attending school may be higher for poorhouseholds in terms of forfeited income and/or help in domestic chores.12
We include a measure of per capita adult (over age 20) income levels. We exclude childand youngster income from the analysis as we consider work decisions of children to beendogenous to their educational decisions, so that it is inappropriate to include their labor income.This, nevertheless, may be inappropriate in a family labor supply model where adult labordecisions are not exogenous to child labor market decisions, and clearly educational and workdecisions are related for children.
An important set of variables which may be directly related to the school attendance ofchildren are those measuring whether anyone in the family receives government subsidies. Weinclude three different measures: whether a family member receives free school breakfasts(provided by DIF, National System for Integral Family Development), whether anyone receivesscholarships for children's education (these could be in the form of payments for attending schoolor for purchasing school supplies and likely part of the compensatory programs of the Secretaryof Public Education, who provides these transfer in some poor marginated areas), and whether thehousehold receives milk free (through LICONSA, a milk subsidy program). While we do notknow exactly whom in the household receives these benefits, we consider that their recipiencymay be important stimulus to the school attendance of all children in these families.
We also include other measures of income and wealth of the household, includingwhether the floor of the household dwelling is an earth floor. Finally, we include a measure ofwhether there are any disabled individuals in the household. This variable may be important tothe extent to which children substitute for the labor of disabled individuals.
In this paper we do not attempt to analyze the complicated relationship between child work and school attendance.See Knaul and Parker (1997) for an analysis of the inter-relationships between work and school in the context oflongitudinal data for Mexico.
29

Characteristics of the Community
The availability, distance, and accessibility of schools are key variables for measuring thecosts of attending school. We use measures of the number of per capita secondary schools, whereper capita refers to the secondary school age population (ages 12 to 15) as indicators of the supplyof schools in the municipality.13 We do not have direct measures of the distances to schools forthe children in each community. Rather, we use an (admittedly crude) indicator of altitude in thearea as a measure of difficulty of access to schools in rural areas only.
While we have access to information on the supply of schools at the level of the locality, unfortunately the databaseof the Conteo does not contain information on the locality so that we are unable to match this school information to thelocality level. Instead, we use the next level of geographic aggregation, the municipality.
30
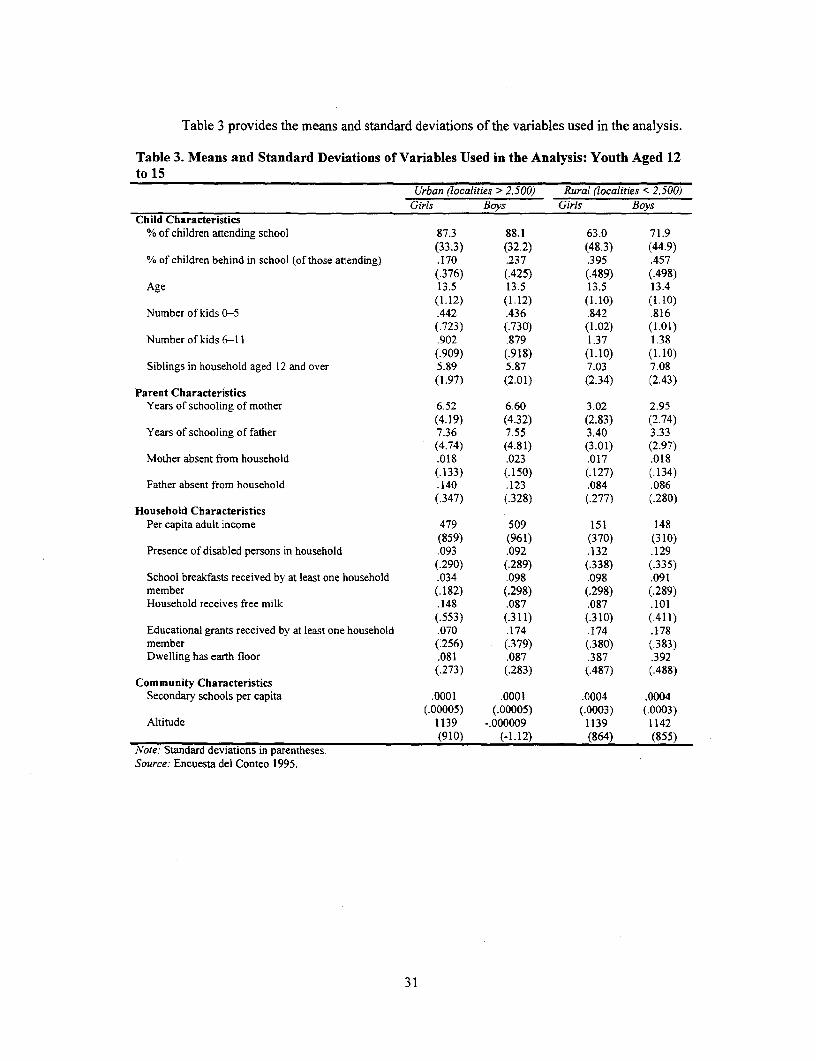
Table 3 provides the means and standard deviations of the variables used in the analysis.
Table 3. Means and Standard Deviations of Variables Used in the Analysis: Youth Aged 12to 15
Urban (localities > 2,500) Rural (localities < 2,500)Girls Boys Girls Boys
Child Characteristics% of children attending school 87.3 88.1 63.0 71.9
(33.3) (32.2) (48.3) (44.9)% of children behind in school (of those attending) .170 .237 .395 .457
(.376) (.425) (.489) (.498)Age 13.5 13.5 13.5 13.4
(1.12) (1.12) (1.10) (1.10)Number of kids 0-5 .442 .436 .842 .816
(.723) (.730) (1.02) (1.01)Number of kids 6-11 .902 .879 1.37 1.38
(.909) (.918) (1.10) (I.10)Siblings in household aged 12 and over 5.89 5.87 7.03 7.08
(1.97) (2.01) (2.34) (2.43)Parent Characteristics
Years of schooling of mother 6.52 6.60 3.02 2.95(4.19) (4.32) (2.83) (2.74)
Years of schooling of father 7.36 7.55 3.40 3.33(4.74) (4.81) (3.01) (2.97)
Mother absent from household .018 .023 .017 .018(.133) (.150) (.127) (.134)
Father absent from household .140 .123 .084 .086(.347) (.328) (.277) (.280)
Household CharacteristicsPer capita adult income 479 509 151 148
(859) (961) (370) (310)Presence of disabled persons in household .093 .092 .132 .129
(.290) (.289) (.338) (.335)School breakfasts received by at least one household .034 .098 .098 .091member (.182) (.298) (.298) (.289)Household receives free milk .148 .087 .087 .101
(.553) (.311) (.310) (.411)Educational grants received by at least one household .070 .174 .174 .178member (.256) (.379) (.380) (.383)Dwelling has earth floor .081 .087 .387 .392
(.273) (.283) (.487) (.488)Community Characteristics
Secondary schools per capita .0001 .0001 .0004 .0004(.00005) (.00005) (.0003) (.0003)
Altitude 1139 -.000009 1139 1142(910) (-1.12) (864) (855)
Note: Standard deviations in parentheses.Source: Encuesta del Conteo 1995.
31

32

SECTION 5. REGRESSION RESULTS
Table 4 through 7 contain the main regression results. Beginning with school attendance,the results show important large impacts of parental education on attendance of girls and boys.While the education level of both parents is highly significant, it is interesting to note that forgirls, the level of education of the mother has a larger positive impact than the level of educationof the father. Nevertheless, the reverse is true for boys, as the education of the father has a largerimpact on their school attendance than the mother's.
Table 4. Determinants of the Probability of School Attendance, Youth Aged 12 to 15Girls Boys
Child CharacteristicsAge -.096* -.091*
(-26.6) (-29.6)Number of kids 0 to 5 -.027* -.017*
(-5.57) (-4,10)Number of kids 6 toll -.I 0I -.010*
(-2.23) (-2.67)Number of siblings aged 12 and over in household -.010* -0017
(-3.78) (-0.75)Parent Characteristics
Years of schooling of mother .020* .011*(13.0) (8.80)
Years of schooling of father .015* .014*(10.5) (11.2)
Mother absenT from household -.149* -.136*(-4.47) (-5.23)
Father absent from household -.056* -.047*(-4.40) (-4.28)
Household CharacteristicsLog of per capita adult income .0196* .0129*
(4.52) (4.29)Presence of disabled persons in household .0004 -.028*
(0.40) (-2.86)School breakfasts received by at least one household member .055* .013
(3.64) (1.00)Household in free milk program .005* -.002
(0.76) (-35)Educational grants received by at least one household member -054* .042*
(4.94) (4.60)Dwelling has earth floor -.051 * -.056*
(-5.27) (-6.87)Community Characteristics
Secondary schools per capita 3.05* 2.15*(1.93) (1.60)
Locality less than 2,500 residents (rural) -.120* -.056*(- 10.0) (-5.74)
Locality with 2,500 to 100,000 residents -.035* -.019*(-3.16) (-2.02)
N 10,364 10,849Model statistic Chi2(17)=2,359 Chi2(17)=2,217Notes: Marginal effects reported in place of coefficients; t-statistics in parentheses.Source: Encuesta del Conteo 1995.
33

Table 5. Determinants of the Probability of School Attendance, by Urban and RuralResidence, Youth Aged 12 to 15
Urban (localities > 2,500) Rural (localities < 2,500)Girls Boys Girls Boys
Child CharacteristicsAge -.060* -.064* 158* -.142*
(-16.8) (-20.9) (-20.6) (-20.5)Number of kids 0-5 -.030* -.021* -.023* -.010
(-6.11) (-5.09) (-2.40) (-1.18)Number of kids 6-11 -.005 -.007* -.019* -.011
(-1.15) (-1.86) (-1.91) (-1.16)Siblings in household aged 12 and over -.011 * -.001 -.005 -.0034
(-4.17) (-0.83) (-0.92) (-0.54)Parent Characteristics
Years of schooling of mother .015* .007* .025* .018*(11.0) (6.53) (6.90) (5.64)
Years of schooling of father .010* .010* .020* .019*(8.12) (9.40) (5.61) (5.96)
Mother absent from household -.089* -.082* -.219* -.215*(-2.72) (-3.40) (-3.36) (-3.46)
Father absent from household -.044* -.026* -.057* -.104*(-3.89) (-2.70) (-1.83) (-3.59)
Household CharacteristicsLog per capita adult income .020* .010* .016* .013*
(3.73) (3.25) (1.90) (1.93)Presence of disabled persons in household .007 -.022* .024 -.047*
(0.92) (-2.25) (1.05) (-2.21)School breakfasts received by at least one household .028 .005 .104* .020member (1.50) (0.30) (3.70) (0.78)Household in free milk program .0007 .0006 .043' -.013
(0.12) (0.11) (1.60) (-0.79)Educational grants received by at least one household .029* .030* .084* .063*member (2.26) (2.83) (4.02) (3.46)Dwelling has earth floor -.046* -.056* -.073* -.065*
(-4,05) (-5.63) (-4.14) (-4.11)Community Characteristics
Secondary schools per capita .807 -2.54 4.43' 7.47*(0.34) (-1.35) (1.73) (2.93)
Altitude -.00005' -.00003'(-5.32) (-3.90)
N 6,512 6,732 3,852 4,008Model Statistic Chi2(15)=1099 Chi2(15> 1160 Chi2(16)-781 Chi2(16)=1099
Aote: Standard deviations in parentheses.Source: Encuesta del Conteo 1995.
34

Table 6. Determinants of the Probability of Being Behind in School, Youth Aged 12 to 15(Marginal effects repoted in place of coefficients)
Girls BoysChild CharacteristicsAge .016* .025*
(3.70) (5.49)Number of kids 0-5 .017* .004
(2.83) (0.58)Number of kids 6-11 .013* .009
(2.38) (1.47)Siblings in household ages 12 and over .015* .027*
(4.36) (7.15)Parent CharacteristicsYears of schooling of mother -.021* -.020*
(-13.1) (-11.6)Years of schooling of father -.0il* -.014*
(-7.34) (-8.77)Mother absent from household .208* .209*
(4.83) (5.28)Father absent from household .033* .049*
(2.25) (3.01)Household CharacteristicsLog of per capita adult income -.012* -.020*
(-2.29) (-3.38)Presence of disabled persons in household .004 .055*
(0.31) (3.45)School breakfasts received by at least one household .018 .052*member (0.97) (2.26)Household in free milk program -.007 -.007
(-0.70) (-0.75)Educational grants received by at least one household .037* .057*member (2.60) (3.60)Dwelling has earth floor .157* .167*
(I 1.9) (I 1.9)Community CharacteristicsSecondary schools per capita -3.72* -3.86*
(-1.86) (-1.74)Locality less than 2,500 residents (rural) .061 * .039*
(4.51) (2.65)Locality with 2,500-10,000 residents -.024* -.016
(-1.99) (-1.25)N 7,917 8,725Model Statistic Chi2(17)=1440 Chi2(17)=1652Arote: T statistics in parentheses.Source: Encuesta del Conteo 1995.
35

Table 7. Determinants of the Probability of Being Behind in School, by Urban and RuralResidence, Youth Aged 12 to 15
Urban (localities > 2,500) Rural (localities < 2,500)Girls Boys Girls Boys
Child CharacteristicsAge .008* .022* .0381* .030*
(1.89) (4.38) (3.83) (3.32)Number of kids 0-5 .009 -.003 .037* .014
(1.36) (-0.45) (2.91) (1.19)Number of kids 6-11 .010* .014* .016* -.002
(1.84) (2.09) (1.30) (-0.17)Siblings in household aged 12 and over .014* .025* .018* .033*
(3.92) (5.91) (2.41) (4.68)Parent Characteristics
Years of schooling of mother -.014* -.011* -.042* -.030*(-9.26) (-9.09) (-9.69) (-7.28)
Years of schooling of father -.009* -.016* -.017* -.021*(-6.05) (-7.07) (-3.88) (-5.35)
Mother absent from household .126* .241* .387* .126(2.94) (5.59) (4.30) (1.55)
Father absent from household .027* .057* .056 .035(1.92) (3.44) (1.44) (0.98)
Household CharacteristicsLog per capita adult income -.002 -.016* -.020* -.023*
(-0.27) (-1.53) (-2.00) (-1.70)Presence of disabled persons in household .021 .058* -.032 .049*
(1.41) (3.16) (-1.11) (1.69)School breakfasts received by at least one household -.001 .065* .069* .061*member (-0.08) (2.02) (1.98) (1.77)Household in free milk program -.0004 -.010 -.043 .004
(-0.05) (-1.05) (-1.34) (0.22)Educational grants received by at least one household .045* .019 .031 .088*member (2.47) (0:95) (1.29) (3.62)Dwelling has earth floor .127* .126* .187* .192*
(7.67) (6.75) (8.23) (9.08)Community Characteristics
Secondary schools per capita -4.02 -3.59 -5.39 6.34*(-1.34) (-1.03) (-1.66) (-1.86)
Altitude .00002* .00003*(2.16) (3.40)
N 5,471 5,782 2,446 2,943Model Statistic Chi2(15)=581 Chi2(16)=781 Chi2(16)=470 Chi2(16)=506
Note: T statistics in parentheses.Source: Encuesta del Conteo 1995.
Mothers and fathers absent from the household have important negative impacts on theprobability of their children attending school. In particular, the impact of the mother being absentfrom the household is very large, reducing the probability of school attendance by 14.9 percent inthe case of girls and 13.6 percent in the case of boys. The corresponding effect of the father beingabsent is to lower the probability of school attendance by 5.6 percent for girls and 4.7 percent forboys.
It is interesting to note that the variables measuring school breakfast receipt andeducation grants have strong positive impacts on girls' school attendance. For boys, theeducational grants variable is the only significant variable of the govemment subsidy programs.Even so, the effect of this variable is lower for boys than for girls. These results appear to indicate
36

that at least some of the government's efforts at increasing well-being have a positive impact onschool attendance, most importantly in the case of girls.'4
All of the measures of household economic status including per capita income andhousehold dwellings with an earth floor demonstrate that greater economic status results in ahigher probability of school attendance.
The presence of disabled individuals is negatively and significantly related to theprobability of school attendance only in the case of boys, suggesting that boys may substitute forfamily disabled workers in the labor force, thereby reducing the probability that they attendschool. On the other hand, small children in the family have a much larger negative effect onschool attendance for girls than for boys, although it is significant for both. For instance, anadditional child in the family aged 0 to 5 reduces the probability of school attendance for girls by2.7 percent, and only 1.7 percent for boys. This may reflect that older daughters have additionaldomestic responsibilities associated with younger brothers and sisters, which are incompatiblewith school attendance, whereas increased younger brothers and sisters may increase theprobability of entering the labor force for older brothers. In the case of siblings one's age or older,the evidence indicates that this negatively affects the attendance of girls only, which may indicatethat in large families girls are the ones most likely to be excluded from educational investments.
At the level of the community, the supply of secondary schools is positively andsignificantly related to the probability of school attendance both for boys and girls, with largerimpacts for girls. This may indicate that increases in the supply of schools have a larger impact ongirls' school attendance, for instance, if parents are more reluctant to send their girls to schoolswhich are further from the community.
Table 5 presents the same regressions disaggregated by rural/urban residence, where ruralresidence is defined as localities with less than 2,500 persons. Mother and father educationallevels continue to be important and significant determinants of school attendance in all of thesamples, with particularly large impacts in the rural areas. Again, the pattern is repeated wherethe impacts of the mother's education are larger for girls, whereas the impacts of father educationare larger for boys. In rural areas, the education of the mother and the father have impacts whichare twice the size of the impacts in urban areas. Similarly, absent fathers or mothers have muchlarger negative impacts on the school attendance of rural children than urban children. A motherabsent from the household reduces the probability of school attendance by 22 percent for girls,versus 8.9 percent in urban areas. It is also interesting to note that in rural areas, absent fathershave a much larger negative impact on school attendance for boys than for girls, consistent withthe explanation that boys may substitute in the work force for their absent fathers in rural areas.
Measures of income status continue to be important both in rural and urban samnples ofboys and girls. The impacts of economic indicators have generally larger impacts on the schoolattendance in rural zones, and particularly on the attendance of girls. Again, presence of disabledindividuals has negative impacts on school attendance only in the case of boys.
In the case of social programs, the regressions show that these programs have muchlarger impacts on school attendance in rural areas than in urban areas, and particularly on theschool attendance of girls. In rural areas, the variable of school breakfasts increases theprobability of attending school by 10.4 percent for girls, whereas the corresponding impact for
14 This could represent a result of targeting, if some of these prograns were more highly targeted to girls rather thanboys, for instance in the case of education scholarships.
37

boys is 2 percent. The variables representing school grants is significant in all four samples;however, the effects are again much larger (more than double) in rural zones and larger for girlsthan for boys.
The results of other children in the family show mixed results. The number of childrenaged 0 to 5 continues to have negative and significant effects on all samples except for boys inrural areas. Older siblings have negative effects on school attendance only for girls in urban areas.
In terms of community indicators, the supply of secondary schools is positively related tothe probability of school attendance for boys and girls in rural areas only. This is consistent withevidence that secondary school supply is particularly a problem in rural areas. Altitude has anegative and significant effect on the probability of school attendance, which is consistent with astory where higher altitude may measure difficulty of access to schools and thereby negativelyaffect school attendance.
We now turn to the regressions of the probability of currently attending but being at leastone grade behind in school. The results are quite similar to the regressions of the probability ofattending school in terms of the variables which are most important. Parental education levelscontinue to play a fundamental role in the probability of falling behind in school with theeducation of the mother having a larger impact on both girls and boys. Absent mothers andfathers have strong positive effects on the probability of falling behind in school, with absentmothers having much larger impacts.
Income status of the household is negatively associated with the probability of fallingbehind in school, but in contrast to the school attendance regressions, the impacts are generallylarger for boys than for girls. As with the results for school attendance, the presence of disabledindividuals affects only the probability of boys falling behind in school whereas number ofyounger children in the family have a positive effect of falling behind in school only for girls.Other siblings have a positive effect on falling behind in school for both samples, indicating thatsize of family is an important aspect for investment in child schooling.
The effects of subsidies are, at first glance, inconsistent with expectations, as the schoolgrants and school breakfasts are positively associated with falling behind in school. Nevertheless,we believe this result may be due to the return of students who were previously not attendingschool to school precisely because of these programs, and these students are, of course, morelikely to have been behind in school.
Turning to the disaggregated regressions by urban/rural residence (Table 7), parentaleducation measures are much more important to explaining the probability of falling behind inrural zones than in urban zones, consistent with our findings on school attendance. Here theeffects show larger impacts of the mother's education on girls' achievements and larger impactsof father's schooling on boys' achievement. Again, the mother's absence from the household ismuch more important than the father's absence from the household.
Economic status is important in all four samples, particularly in rural areas where theimpacts of income measures are generally much larger than in urban areas. Small children againhave a negative impact on the probability of falling behind in school in the case of girls but not inthe case of boys. In all four samples, older siblings have positive and strong impacts on theprobability of falling behind in school, providing support for the "dilution" of family resourcesargument.
38

SECTION 6. CONCLUSIONS AND POLICYIMPLICATIONS
This paper has shown that important progress has been made in improving educationalattainment in Mexico over the last decades. The average number of years of schooling achievedhas doubled over the last four decades and gender differences in education have beensubstantially reduced. Nevertheless, Mexico still lags behind other Latin American countries interms of education, given its level of GDP. Furthermore, large differences in educationalattainment between rural and urban areas remain, differences which are clearly related to incomeand wealth. The analysis of this paper suggests that the most important determinant ofeducational attainment in Mexico is poverty.
The gender gap in education has fallen substantially over the last 30 years, to the extentthat girls and boys below the age of 20 no longer display significant differences in educationalattainment, as measured by years of schooling attained. This reduction of the gender gap, ageneralized finding in Latin American, may be related to two factors, the first being the generalexpansion in education levels in Latin America which, while not specifically oriented toincreasing girls' education, may have a larger impact on girls' attendance if schools are moreeasily accessible, and girls are more likely to not attend school if schools are located outside ofthe community. This paper has shown evidence that the supply of secondary schools is a largerdeterminant of girls' school attendance than boys'. Another important factor is the increase inwomen's labor force participation, which has occurred over the same period as the reduction ofthe gender gap, and clearly has increased the returns to investing in education for women.
The current educational difficulties of boys and girls appear to manifest themselves indifferent ways. Descriptive analysis of educational attainment of Mexican youth shows that inattendance, girls begin to fall behind boys in secondary school. Nevertheless, these trends inattendance do not show up in worse schooling attainment for girls, as measured by years ofschooling completed until past the ages of 20 to 25. The reason for this is that while boys attendschool more during these ages, they are more likely to repeat grades and fall behind in school.The policy implication which surges as a result of this analysis is that policies should be aimed atstopping the dropout of girls after primary school and should be aimed at trying to understandwhy boys who continue attending school are more likely to fall behind in school than girls. It isclearly important to understand why attendance and dropout display such important differencesbetween boys and girls.
The evidence on gender gaps suggests that it is possible that, at the national level, girlsand boys currently below 20 years old will become Mexico's first generation in which there isequal educational attainment of men and women. Nevertheless, men are still more likely to enrollin college than women. For the future, an important issue with respect to gender and educationwill be attendance at the university level and the types of careers and majors which womenchoose to study. In many Latin American countries, it has been shown that women tend to beconcentrated in traditionally female areas, such as education and health (Bustillo 1991).
One important factor which appears to be behind the reduction of the gender gap ineducation is the effect of parental education levels. We have found evidence that the education ofparents is highly important to explaining educational outcomes, even after controlling for anumber of other income status variables. In particular, the impacts of the mother's education havea larger impact on girls' education than the father's education, whereas the impacts of the father's
39

education have a larger impact on boys' education than the mother's education. This finding isconsistent with a number of interpretations. Mothers may be likely to be role models for girls,whereas fathers may be more likely to be role models for their sons. A more economicexplanation is that education levels of the parents are indicators of bargaining power in thehousehold with mothers concentrating their resources on investment in daughters and fathersdoing the same with their sons.
While further research is needed to be able to identify the mechanisms through whichparental education affects student achievement, we believe this is an important finding, and whileconfirming that the mother's education is an important variable for childhood development, ourresults suggest that in the case of boys, the father's impact is also very important. Efforts tostimulate the educational attainment of both boys and girls should take this into account.
Another interesting set of variables found to be important in the attendance of childrenare government social programs. Both school breakfast and educational grants programs werefound to have strong impacts on attendance, particularly in rural and urban areas. Further researchbehind the reasons for these impacts is needed. In particular, it would be useful to carry out thisanalysis with data which specify exactly which children in the family are benefited bygovernment programs.
Progresa, the Education, Health, and Nutrition Program, is an example of a new program(begun in 1997 after the Conteo was carried out) targeted at promoting the educational level ofboys and girls in poor, rural contexts. Among its other benefits, the program includes educationalgrants to children attending school between the third grade of primary and the end of secondaryschool. To receive the grants, children must be attending school and must successfully completethe school year cycle. Additionally, grants for girls at the secondary school level are slightlyhigher than for boys. Given the evidence found in this paper that rural areas have much lowereducational attainments and that girls begin to drop out at the beginning of secondary, Progresaseems like an appropriate response. The program is expected to have incorporated two millionfamilies in marginalized rural areas by the end of 1998.
Secondary school availability was found to be an important factor affecting theeducational outcomes of children of secondary school age, so that an important policy implicationis to continue the construction of secondary schools, particularly in rural areas.
Our analysis also found evidence of large negative impacts of absent mothers and fathersfrom the household on children's educational attainment, even after a number of controls forincome and wealth status of the household. These findings are also consistent with a number ofinterpretations. Children, particularly girls, may fill in as "substitute" parents in cases where one(or more) of their parents is absent, making it more difficult to keep up with the demands ofschooling. Alternatively, the absence of one of their parents may create emotional distress whichnegatively affects their schooling, or the lack of supervision may translate into increasedabsenteeism at school and poor performance.
40
REFERENCES
Albomoz, Orlando. 1969. Sociologia de la Educaci6n, Publicaciones del Instituto Societas.Caracas.
Almeras, Diane. 1994. "Logros y obstaculos en la educacion formal de las mujeres." Revista de laCepal/Naciones Unidas, Econ6mica para America Latina y el Caribe. 54:61-79.
Inter-American Development Bank. 1996. "Como organizar con exito los servicios sociales." InProgreso Economico y Social en America Latina 1996.Washington D.C. BancoInteramericano de Desarrollo.
Becker, Gary. 1964. Human Capital, A theoretical and empirical analysis, with special referenceto education. New York: Columbia University Press.
1981. A treatise on the Family. Cambridge, Mass.: Harvard University Press.
Becker, Gary S., Kevin M. Murphy, and Robert Tamura. 1990. "Human Capital, Fertility andEconomic Growth." Journal of Political Economy 98(5).
Behrman, Jere, and Anil B. Deolalikar. 1993. "Unobserved Household and CommunityHeterogeneity and the Labor Market Impact of Schooling: A Case Study for Indonesia."Economic Development and Cultural Change 41 :[461]-88.
Birdsall, Nancy. 1988. "Economic Approaches to Population Growth." In Hollis Chenery andT.N. Srinivasan, eds., Handbook of Development Economics. New York: NewAmsterdam.
Blaug, Mark. 1976. "The empirical status of Human Capital Theory: A slightly jaundicedsurvey." Journal of Economic Literature September.
Bracho, Teresa. 1995. "Distribuci6n y desigualdad educativa en Mexico." Estudios Socioldgicos13(31). El Colegio de Mdxico, Mexico.
1997. "La exclusion de la educaci6n basica. Decisiones familiares sobre escolarizacion"Working Paper No. 58, Division of Public Administration, CIDE, Mexico.
Bracho, Teresa, and A. Zamudio. 1989. "Los rendimientos economicos de la escolaridad."Economia Mexicana, CIDE, Mexico.
Brown, Cynthia, Jose A. Pagan, and Eduardo Rodriguez Oreggia. 1996. "OccupationalAttainment and Gender Earning Differentials in Mexico." Mimeo.
Bustillo, Ines. 1993. "Latin American and the Carribean." In E.M. King and M.A. Hill, eds.,Women 's Education in Developing Countries. Baltimore, Md.: Johns Hopkins UniversityPress.
Carnoy, Martin. 1997. "New Approaches to Human Capital." Mimeo.
41
Castro, T., and F. Juarez. 1994. "Women's Education and Fertility in Latin America: Exploringthe Significance of Education for Women's Lives." DHS Working Paper Number 10,USAID, Calverton, Md.
Cochrane, Susan. 1979. "Fertility and Education: What Do We Really Know." World BankOccasional Papers 26. Washington, D.C.
1982. "Education and Fertility: An Expanded Examination of the Evidence." In Gail P.Kelly and Carolyn M. Elliot, eds., Women 's Education in the Third World: ComparativePerspectives. Albany: State University of New York Press.
Cochrane, Susan, Leslie Joanne, and Donald J. O'Hara. 1980. "Parental Education and ChildHealth: Intracountry Evidence." In Susan Cochrane, Donald J. O'Hara, and JoanneLeslie, eds., The Effects of Education on Health. World Bank Working Paper 405.Washington, D.C.
Chowdhury, Kowsar P. 199. "Literacy and Primary Education." Working Paper No. 50.Washington D.C.: World Bank.
Deble, Isabelle. 1980. La Educaci6n de las Mujeres. Paris: UNESCO.
Duryea, Suzanne. 1997. "Children's Advancement through School in Brazil: The Role ofTransitory Shocks to Household Income." Mimeo. Inter-American Development Bank.
Echevarria, Cristina, and Antonio Merlo. 1997. "Gender Differences in Education in a DynamicHousehold Bargaining Model." Working Paper WP-AD97-25. Instituto Valenciano deInvestigaciones Econ6micas, Valencia.
Fagerlind, Ingemar, and Lawrence J. Saha. 1989. Education and National Development: AComparative Perspective. Oxford: Pergamon Press.
Garasky, Steven. 1995. "The effects of family structure on educational attainment: Do the effectsvary by the age of the child?" American Journal of Economics and Sociology 54(1):89-105.
Garcia, Brigida, Edith Pacheco, and Mercedes Blanco. "Genero y trabajo extradomestico."Mimeo.
Gomes-Neto, Joao Batista, and Erik Hanushek. 1994. "Causes and Consequences of GradeRepetition: Evidence from Brazil." Economic Development and Cultural Change43:117-48.
Haddad, L., J. Hoddinott, and Harold Alderman, eds. 1997. Intrahousehold Resource Allocationin Developing Countries: Methods, Models and Policy. Baltimore, Md.: Johns HopkinsUniversity Press for the International Food Policy Research Institute.
Hossain, Shaikh. 1990. "Interrelations Between Child Education, Health, and Family Size:Evidence from a Developing Country." Economic Development and Cultural Change38:763-81.
INEGI. 1997. "Mujeres y Hombres en Mexico", Aguascalientes.
42
Jejeebhoy, Shireen. 1993. Women 's Education and Fertility Behaviour: A Case Study of RuralMaharashtra, India. New York: United Nations.
Jelin, E., ed. 1991. Family, Household and Gender Relations in Latin America. London: K. PaulInternational.
King, Elizabeth, and Rosemary Bellew. 1991. "Gains in the Education of Peruvian Women,1940-1980." World Bank Discussion Papers 472. Washington, D.C.
King. Elizabeth, and Anne Hill, eds. 1993. Women's Education in Developing Countries:Barriers, Benefits, and Policies. Baltimore, Md.: Johns Hopkins University Press.
King, Elizabeth, and Lee A. Lillard. 1987. "Education Policy and Schooling Attainment inMalaysia and the Philipines." Economics of Education Review 6:167-81.
Knaul, Felicia, and Susan Parker. 1998. "Patterns over Time and Determinants of Early LaborForce Participation and School Dropout: Evidence from Longitudinal and RetrospectiveData on Mexican Children and Youth." Paper presented at the 1998 Annual Meeting ofthe PAA. Chicago.
Lillard, Lee A., and Robert J. Willis. 1994. "Intergenerational Educational Mobility: Effects ofFamily and State in Malaysia." Journal of Human Resources 29(4):1126.
Londofio de la Cuesta, Jose Luis. 1996. Poverty, Inequality, and Human Capital Development inLatin America. Washington, D.C.: World Bank.
Mincer, Jacob, and Solomon Polachek. 1982. "La inversi6n de la familia en capital humano: Lasganancias de la mujer" en Estudios sobre la mujer, Secretaria de Prograrnaci6n yPresupuesto, Mexico.
Palafox, Juan Carlos, Juan Prawda, and Eduardo Velez. 1994. "Primary School Quality inMexico." Comparative Education Review 38(2).
Parish, W.L., and Robert Willis. 1992. "Daughters, Education and Family Budgets. TaiwanExperiences." Journal of Human Resources 28(4).
Parker, Susan W. "Wage Levels of Male and Female Salaried and Self-employed Workers inUrban Mexico, 1986-1992: A Micro-econometric Approach." Mimeo.
Post, David, Rosario Garcia, and Rocio Flores. 1998. "Public Policy and the Equality of Accessto Secondary School in Mexico." Mimeo.
Psacharopoulos, George, and Zafiris Tzannatos. 1992. Women's Employment and Pay in LatinAmerica: Overview and Methodology. Washington, D.C.: World Bank.
Psacharopoulos, George, and Ana Maria Arriagada. 1989. "Determinants of Early Age HumanCapital Formation: Evidence from Brazil." Economic Development and Cultural Change37:683-708.
Schultz, T. Paul. 1988. "Education Investments and Returns." In Hollis Chenery and T.N.Srinivasan, eds., Handbook ofDevelopment Economics. New York: New Amsterdam.
43
Schultz, T. Paul. 1992. "Symposium on Investments in Women's Human Capital andDevelopment." Journal of Human Resources 28(4).
Schultz, T. Paul. 1993. "Returns to Women's Education." In Elizabeth King and Ann Hill, eds.,Women 's Education in Developing Countries: Barriers, Benefits, and Policies.Baltimore, Md.: Johns Hopkins University Press.
Schultz, T. Paul. 1994. "Human Capital, Family Planning and their Effects on PopulationGrowth." Population Economics 84(2):255-260.
Schultz, T.W. 1968. Valor Econ6mico de la Educaci6n, Uteha, Mexico.
Schultz, T.W., ed. 1974. Economics of the Family, National Bureau of Economic Research
Singh, Ram D. 1994. "Fertility-Mortality Variations Across LDCs: Women's Education, LaborForce Participation and Contraceptive Use." KYKLOS 47(2):209-229.
Singh, Ram D., and Maria Santiago. 1997. "Farm Earnings, Educational Attaimnent, and the Roleof Public Policy: Some Evidence from Mexico." World Development 25(12).
Steele, Diane. 1992. "Women's Participation Decisions and Earnings in Mexico." In GeorgePsacharopoulos and Zafiris Tzannatos, eds., Women 's Employment and Pay in LatinAmerica: Overview and Methodology. Washington, D.C." World Bank.
Strauss, John, Paul J. Gertler, Omar Rahman, Kristin Fox. 1993. "Gender and Life-CycleDifferentials in the Patterns and Determinants of Adult Health." Journal of HumanResources 28(4):791-837.
Thomas. Duncan. 1989. "Intra-household Resource Allocation: An Inferential Approach."Journal of Human Resources 25(4).
Valdes, Teresa, and Enrique Gomariz, eds. 1993. Mujeres Latinoamericanas en Cifras Vol. sobreMexico, Madrid/Santiago de Chile, Ministerio de Asuntos Sociales (Espania), Instituto dela Mujer,.
Vella, Francis. 1994. "Gender Roles and Human Capital Investment: The Relationship betweenTraditional Attitudes and Female Labour Market Performance." Economica 61:191-211.
Wainerrnan, Catalina. 1982. "The Impact of Education on the Female Labor Force in Argentinaand Paraguay." In Gail P. Kelly and Carolyn M. Elliot, eds., Women 's Education in theThird World: Comparative Perspectives. Albany: State University of New York Press.
44


EDUCATA>ONT H E W O R L D B A N K
EDUCATE GIRLS - INVEST IN YOUR FUTURE
HUMAN DEVELOPMENT NETWORK
THEWORLD BANK
Kv 5z _mr.>)r..x-a nn. u,n v X)ru