Embed Size (px)
Citation preview

MTO AER P&P Article Adult Public Use File Documentation, Page 1
Documentation of the MTO Adult Public Use Datasets
for the American Economic Review Papers & Proceedings Article:
“Long-Term Neighborhood Effects on Low-Income Families: Evidence from
Moving to Opportunity”
by
Jens Ludwig, Greg J. Duncan, Lisa A. Gennetian, Lawrence F. Katz,
Ronald C. Kessler, Jeffrey R. Kling, and Lisa Sanbonmatsu
American Economic Review Papers & Proceedings Vol. 103 no. 3 pp. 226-231
Published May 2013
Documentation last updated:
December 9, 2013
Data were provided by the U.S. Department of Housing and Urban Development. The contents of this
document do not necessarily reflect the views or policies of the U.S. Department of Housing and Urban
Development or the U.S. Government.
This documentation was prepared with the assistance of Matt Sciandra and Ray Yun Gou, research
analysts at the National Bureau of Economic Research.

MTO AER P&P Article Adult Public Use File Documentation, Page 2
Contents
1. Overview ......................................................................................................................................................................... 3
2. Background on the MTO Experiment ............................................................................................................................. 4
3. Sample, Sources, and Measures ...................................................................................................................................... 6
3.1 Adult Sample .......................................................................................................................................................... 6
3.2 Data Sources ........................................................................................................................................................... 6
3.3 Measures ................................................................................................................................................................. 8
4. Construction of the Cell-Level PUF ............................................................................................................................... 9
5. Construction of the Expanded Pseudo-Individual PUF ................................................................................................ 11
6. Replicating Results Using the PUFs ............................................................................................................................. 13
6.1 Estimation of Intention-to-Treat Effects (AER P&P Table 1) .............................................................................. 13
6.2 Estimation of Control and Treatment Means ........................................................................................................ 18
6.3 Estimation of the Relationship Between Outcomes and Specific Neighborhood Conditions .............................. 18
7. Summary ....................................................................................................................................................................... 19
References ............................................................................................................................................................................. 20
Appendix A – Variable List for the Cell-Level PUF File ..................................................................................................... 21
Appendix B – Variable List for the Pseudo-Individual PUF File ......................................................................................... 26
Appendix C – Program Code Showing the Collapse and Expansion of the Data ................................................................. 29
Appendix D – Stata Code for Estimating Intention-to-Treat Effects Using the AER P&P PUF .......................................... 36
Appendix E – Stata Code Used to Create the Outcome Indices Used in the AER P&P Article ........................................... 42
Appendix F – Detailed Documentation for the Mental Health Disorder Outcomes Included in the AER P&P Article ....... 44
Appendix G – Detailed Coding of Selected Variables Used for the AER P&P Article (separate document) ...................... 55
Also included are the following tables and figures:
Table 1. Key Variables on the Cell-Level PUF Dataset ....................................................................................................... 10
Table 2. Key Variables on the Expanded Pseudo-Individual PUF Dataset .......................................................................... 12
Table 3. Comparisons of AER P&P Article Outcomes (Plus Index Components) Using Individual-Level Data vs.
Expanded Pseudo-Individual Data for the Experimental and Section 8 Groups ................................................... 15

MTO AER P&P Article Adult Public Use File Documentation, Page 3
DOCUMENTATION OF
MTO ADULT PUBLIC USE DATASETS
FOR AMERICAN ECONOMIC REVIEW PAPERS & PROCEEDINGS ARTICLE:
“Long-Term Neighborhood Effects on Low-Income Families:
Evidence from Moving to Opportunity”
American Economic Review Papers & Proceedings Vol. 103 no. 3 pp. 226-231
1. Overview
The public use files (PUFs) are designed for a rough replication of the Moving to Opportunity (MTO)
adult analysis in Table 1 of the article “Long-Term Neighborhood Effects on Low-Income Families:
Evidence from Moving to Opportunity” published in the journal American Economic Review Papers &
Proceedings (AER P&P) in May 2013 (available via www.mtoresearch.org/final.htm). Separate PUFs for
replicating youth results in the AER P&P article will soon be available via www.nber.org/mtopuf. The
article shows that moving from a high-poverty to lower-poverty neighborhood leads to long-term
improvements in adult physical and mental health and subjective well-being, despite not affecting
economic self-sufficiency.
The two PUFs available at www.nber.org/mtopuf and that will also be made available at the Inter-
university Consortium for Political and Social Research’s (ICPSR) Replication Datasets collection
(www.icpsr.umich.edu/icpsrweb/ICPSR/index.jsp) are:
1. mto_aer_puf_cells_ad_20131025.dta – To preserve confidentiality, the data on 3,273 adults
included in the AER P&P analyses have been collapsed to 81 cells (ranging in size from 14 to 143
respondents). The cells are homogenous on MTO site and treatment group status to allow for the
estimation of impacts. When possible, the cells have also been divided by treatment compliance
status and race. The file contains the mean, standard deviation, and sum of weights for all
outcomes and mediators. There are 193 variables on the file (see Appendix A for a complete list
of variables).
2. mto_sci_aer_pseudo_ad_20131025.dta – The adult cell-level data have been expanded to a
pseudo-individual level dataset (n=3273) that for each outcome mimics that outcome’s mean
value, standard deviation, and approximate number of observations within a cell. However, the
outcome values for individual records within a cell do not reflect the actual values on the original
individual level file. The file has 74 variables (see Appendix B for a complete list).
The U.S. Department of Housing and Urban Development (HUD) provided the MTO data and must be
acknowledged in any paper using these PUFs. The contents of this document do not necessarily reflect the
views or policies of HUD or the U.S. Government.

MTO AER P&P Article Adult Public Use File Documentation, Page 4
MTO is a randomized housing experiment administered by HUD that gave low-income families living in
high-poverty areas in five cities the chance to move to lower-poverty areas. Families were randomized
into one of three treatment groups: (1) an Experimental group who received a housing voucher that could
only be used in a low-poverty (< 10%) census tract, (2) a Section 8 group who received an unrestricted
hosing voucher, or (3) a control group who did not receive a voucher but remained eligible for any
government assistance to which they otherwise would have been entitled.
The PUFs contain information on:
long-term outcomes including economic self-sufficiency and physical and mental health;
demographic information like age, gender, race/ethnicity, employment status, and education
level;
other baseline indicators such as income, neighborhood safety and satisfaction, and reasons for
wanting to move via MTO; and
program information such as treatment group, randomization site, and treatment compliance.
Note that a few variables included on the PUFs have been modified to ensure data confidentiality (see
variables with “rad_” in their names). Before the data were aggregated, some demographic information
was replaced with group averages and some continuous monetary measures were rounded and top-coded.
Census tract characteristics have also been rounded.
Note that the PUFs include survey data on employment but do not include the administrative data on
employment and earnings that are shown in the AER P&P article appendix due to data sharing
restrictions. The PUFs allow for the estimation of impacts for the voucher groups jointly or separately and
to estimate impacts controlling for baseline site. It is not possible to include controls for the full set of
baseline covariates included in the models used for the AER P&P article due to the aggregation of the
data. Table 3 in this memo illustrates that, despite these limitations, the estimates using the PUFs produce
means, point estimates, and standard errors that are quite similar to those in the original AER P&P article.
To more precisely estimate impacts and use a more complete set of covariates, the individual-level data
are needed. Many of the variables analyzed for the AER P&P article are on the restricted-access dataset
produced for the MTO article in the journal Science (available via ICPSR at
www.icpsr.umich.edu/icpsrweb/ICPSR/studies/34860). A more complete restricted access dataset will be
archived later with ICPSR.
2. Background on the MTO Experiment
The MTO demonstration was authorized by the U.S. Congress in section 152 of the Housing and
Community Development Act of 1992. HUD launched MTO to test whether offering housing vouchers to
families living in public housing projects in high-poverty neighborhoods of large inner cities could
improve their lives and the lives of their children by allowing them to move to lower-poverty
neighborhoods.
From 1994 to 1998, the MTO demonstration enrolled 4,604 low-income households in Baltimore, Boston,
Chicago, Los Angeles, and New York. Eligibility for MTO was limited to households with children in

MTO AER P&P Article Adult Public Use File Documentation, Page 5
public or other government-subsidized, project-based housing in selected high-poverty areas. Enrolled
families were assigned at random to one of three groups:
1. The Experimental group (also called the low-poverty voucher group) received Section 8 rental
assistance certificates or vouchers that they could use only in census tracts with 1990 poverty
rates below 10 percent. The families received mobility counseling and help in leasing a new unit.
One year after relocating, families could use their voucher to move again if they wished, without
any special constraints on location.
2. The Section 8 group (also called the traditional voucher group) received regular Section 8
certificates or vouchers that they could use anywhere; these families received no special mobility
counseling.
3. The control group received no certificates or vouchers through MTO, but continued to be
eligible for project-based housing assistance and whatever other social programs and services to
which they would otherwise be entitled.
Forty-eight percent of families in the Experimental group and 63% of families in the Section 8 group
“complied” with the treatment by moving using a housing voucher obtained through MTO. For more
details on the motivation for and structure of the MTO experiment, please see the Chapter 1 of the MTO
Final Impacts Evaluation report (Sanbonmatsu et al., 2011).
Because it was implemented as an experiment, MTO overcomes some of the empirical challenges of
identifying neighborhood effects on people’s life outcomes that have limited previous research. An MTO-
type experiment enables us to determine whether moving to a lower-poverty neighborhood itself, rather
than some other characteristic of the individuals or families that might be related to both their propensity
to move and their behavioral outcomes, directly caused improvements in health, economic security, or
some other outcome of interest. Because of random assignment, the control group’s experience shows, on
average, what would have happened to the families in the treatment groups had they not been offered a
voucher through MTO.
Researchers have collected survey data on MTO participants at different points in time:
Baseline (1994-1998): At the time families applied for the program, the household head filled out
a survey with information about the household and basic information about each household
member.
Short-Term Site by Site Findings - Preliminary studies conducted a few years into the program by
research teams at each site
Canvasses (1997 and 2000): Families were canvassed and asked a limited set of questions.
Interim evaluation (2002): Abt Associates, along with the National Bureau of Economic Research
(NBER), conducted an evaluation of the program 4 to 7 years on average after random
assignment (interviews were completed with 3,519 adults). The interim survey asked questions
about: housing, neighborhood, employment and education, income and public assistance, outlook
and social networks, physical and mental health, and household composition. (Links to the main
findings from the interim evaluation are available at www.mtoresearch.org/interim.htm. Orr, et al.

MTO AER P&P Article Adult Public Use File Documentation, Page 6
(2003) and Kling, Liebman, and Katz (2007) are the most comprehensive sources for the interim
findings.)
Final impacts evaluation (2008-2010): 10-15 year follow-up with families. This wave of data
collection is the basis for the AER P&P article.
In addition, researchers have also conducted qualitative interviews with families (see
www.mtoresearch.org/qualitative.htm).
3. Sample, Sources, and Measures
3.1 Adult Sample
The PUF datasets consist of data on the 3,273 adults interviewed for the long-term MTO evaluation.
Researchers at NBER conducted the evaluation and the Institute for Social Research (ISR) at the
University of Michigan (through a subcontract) interviewed MTO adults and youth. ISR completed the
interviews between June 2008 and April 2010. One adult was selected for interview from each
Experimental and control group household and, for budgetary reasons, one adult was selected from a
random two-thirds subsample of the Section 8 group households. The overall effective response rate
(ERR) for the adult survey was 89.6%, and the ERRs by MTO treatment group were similar: 90.8% for
the Experimental group, 86.6% for the Section 8 group, and 90.0% for the control group. The long-term
adult survey instrument is available at www.mtoresearch.org/instruments/final_hhold.pdf.
3.2 Data Sources
The data analyzed for the AER P&P article and included in the PUFs come from survey data, physical
measurements, and also census data linked to participants’ residential address histories.
Survey Data: The adult survey asked respondents a variety of questions about their economic
circumstances, physical and mental health, neighborhoods, housing, social networks, and other topics.
Embedded within the survey was a structured diagnostic interview to assess mental health disorders such
as depression and generalized anxiety, based on portions of the World Health Organization’s Composite
International Diagnostic Interview.1 The adult survey was designed to take about 75 minutes, with an
additional 20 minutes allotted for physical measurements and dried blood spot collection.
Physical Measurements: During the long-term survey, interviewers measured height and weight using a
modified version of the protocols from the University of Michigan Health and Retirement Study (HRS;
ISR, 2008). For height, respondents removed their shoes and stood with their heels and shoulders against
a wall. Height was marked on the wall with the use of a rafter angle square and measured to the nearest
quarter-inch (0.6 cm) with a metal tape measure. For weight, respondents also removed their shoes as
well as heavy outer clothing and items from their pockets. Weight was measured to the nearest half-pound
(0.23 kg) with a digital electronic floor scale (Health o meter [Pelstar], model 800KL), which had a
maximum capacity of 180 kg (397 lbs.). If height or weight could not be measured or if subsequent
quality checks revealed an unusual value after the interview, respondent self-reports were obtained.
1 For more information, see Kessler and Üstün (2004).

MTO AER P&P Article Adult Public Use File Documentation, Page 7
Using HRS protocols, interviewers also took respondents’ blood pressure readings during the long-term
survey. Respondents sat at a table with their feet flat on the floor and rested their arm on the table with the
palm facing up. The blood pressure cuff of the Omron Automatic Blood Pressure Monitor (model HEM-
711DLX) was placed on the respondent’s upper left arm approximately half an inch above the elbow. The
cable leading from the cuff to the monitor rested in the center of the arm, over the brachial artery.
Interviewers were instructed that the cuff should fit the arm but be loose enough so that one finger could
be placed between the cuff and the arm (the cuff was designed to accommodate arm circumferences from
22 to 42 centimeters). The monitor itself was turned away from the respondent. Two readings were
attempted, with the second reading occurring at least 45 seconds after the first. Interviewers also
instructed respondents to remain calm and avoid talking during the readings to avoid influencing the
readings. The blood pressure readings were taken after several sections of the survey had already been
completed to ensure that respondents had been at rest beforehand.
Respondents were provided with a form indicating their height and weight measurements and blood
pressure readings and were encouraged to share this record with their doctor on their next visit. The
information sheet also included the American Heart Association recommendation that blood pressure be
kept at 120/80 or lower. Respondents were not given the reading(s) until after the second blood pressure
reading was attempted to avoid having the first reading influence the second.
More detailed protocols for the height, weight, and blood pressure measurements can be found at
www.mtoresearch.org/instruments.html.
Dried Blood Spot Assays: During the long-term survey, interviewers collected a small sample of blood via
finger prick following HRS protocols. An autoretractable lancet finger stick was used to collect up to five
drops of whole-blood capillary samples on specimen-collection paper (Whatman no. 903). To avoid risks
to participants, respondents with a history of a bleeding disorder or who were taking medication that
could affect coagulation were excluded. Respondents were given information about values that are
considered within normal limits by the American Health Association: total cholesterol < 240 mL, high-
density lipoprotein (HDL) cholesterol > 40 mL, glycosylated hemoglobin (HbA1c) < 7 mg/dL, and C-
reactive protein (CRP) < 3 mg/L. Interviewers allowed the blood spots to dry for 15 minutes and then
placed them in a foiled envelope with a desiccant packet. Interviewers mailed the samples once per week
to a central location for proper freezer storage at –20°C to –30°C. Because the interviews for Section 8
adults started about eight months after experimental and control interviews, more of the Section 8 assays
were done in the later batches by the laboratory. Samples were assayed at a laboratory with Clinical
Laboratory Improvement Amendments certification (FlexSite Diagnostics) with the use of a Roche
COBAS Integra immunochemical analyzer that was validated for use with dried blood spots and certified
by the National Glycohemoglobin Standardization Program.
A more detailed protocol for the dried blood spot collection can be found at
www.mtoresearch.org/instruments.html.
Census Data Linked to Address Histories: To help us understand the neighborhood conditions in which
MTO families were living during the course of the program, we reconstructed each family’s residential
history from random assignment onward. Our strategy was to assemble a best guess of the family’s
residential history from administrative records and previous canvasses and surveys of MTO families and
then ask MTO adults to confirm or correct their full history. After constructing the residential histories,

MTO AER P&P Article Adult Public Use File Documentation, Page 8
we geocoded all addresses to 1990 and 2000 Census tracts and linked the tracts to data from those two
decennial censuses as well as to the 2005-09 American Community Surveys 5-year averages data. The
tract characteristics were then linearly interpolated and extrapolated to capture neighborhood
characteristics of all the addresses where families lived from the time of random assignment through May
2008, weighting each tract by the duration of time the family lived in that tract. Although Figure 1 in the
AER P&P article cannot be replicated using the PUFs, the duration-weighted poverty measure used to
create the figure for the article is included on the PUFs.
3.3 Measures
Obesity Measures: Height and weight were used to calculate body mass index (BMI), equal to weight in
kilograms divided by height in meters squared. Moderate obesity was defined as BMI ≥ 30 and very
severe obesity was defined as BMI ≥ 40.
Hypertension Measures: The two systolic readings were averaged if both were valid and the two diastolic
readings were averaged if they were both valid. If only one valid set of readings was available, outcomes
were based on the single set of readings. A reading was considered valid if the diastolic value was over 40
mmHg, the systolic value was over 60 mmHg, and the systolic value was at least 10 points higher than the
diastolic value. Using definitions suggested by the National Institutes of Health, National Heart, Lung and
Blood Institute, and Obesity Education Initiative (2004), hypertension was coded as systolic pressure ≥
140 mmHg or diastolic pressure ≥ 90 mmHg (see also Chobanian et al., 2003).
Diabetes Measure: Glycosylated hemoglobin (HbA1c) was assayed from the dried blood spots collected
during the long-term survey. A single HBA1c measurement provides an integrated assessment of a
person’s average blood glucose levels over the preceding several months; fasting is not required before a
sample is obtained (Saudek et al., 2008). HbA1c values of 6.5% or higher were coded as indicating
diabetes (American Diabetes Association, 2010).
Index Measures: The data include index measures of mental health, physical health, and economic self-
sufficiency as well as an overall index measure that combines the components of the individual indices.
The elements of these outcome indices were pre-specified to the current study, based on what was
constructed for the interim follow-up. Our economic self-sufficiency index is composed of an indicator
for whether the respondent is currently employed and not on Temporary Assistance to Needy Families
(TANF), an indicator for currently employed, total annual earning, an indicator for currently on TANF,
and total annual income from government programs. Our physical health index consists of self-reported
health is fair or poor, the respondent had an asthma attack the past year, obesity, hypertension, and trouble
carrying groceries or climbing stairs. Our mental health index consists of a psychological distress index
score for the past month, depression in the past year, Generalized Anxiety Disorder in the past year, calm
and peaceful during the past month, and normal sleep last night. The overall index consists of the 15
components of the 3 indices described above.
Each variable within these outcome indices is first re-scaled so that higher values equal “better”
outcomes, then converted to z-scores by subtracting the control group mean and dividing by the control
group standard deviation, then averaged across all individual outcomes within the domain, and then re-
scaled again so that the index itself has a standard deviation of one. For people missing data on any
element of the index, we impute the group average value of that variable, which yields estimates that are

MTO AER P&P Article Adult Public Use File Documentation, Page 9
the equivalent of the average of the coefficients. See Appendix F for the Stata code used to generate the
indices.
4. Construction of the Cell-Level PUF
The cell-level PUF includes the data on the 3,273 adults interviewed as part of the MTO long-term
evaluation. Individual-level data have been aggregated into 81 cells. Cells are homogenous by
randomization site and treatment group and largely homogenous by the magnitude of the analysis weight.
In addition, cells were further divided by treatment compliance status and race (non-Hispanic African-
Americans) when cells were sufficiently large. Code used to collapse the data can be found in Appendix
C. The table below lists some of the key variables on the file, and Appendix A contains a complete list of
variables on the file.
MTO AER P&P Article Adult Public Use File Documentation, Page 10
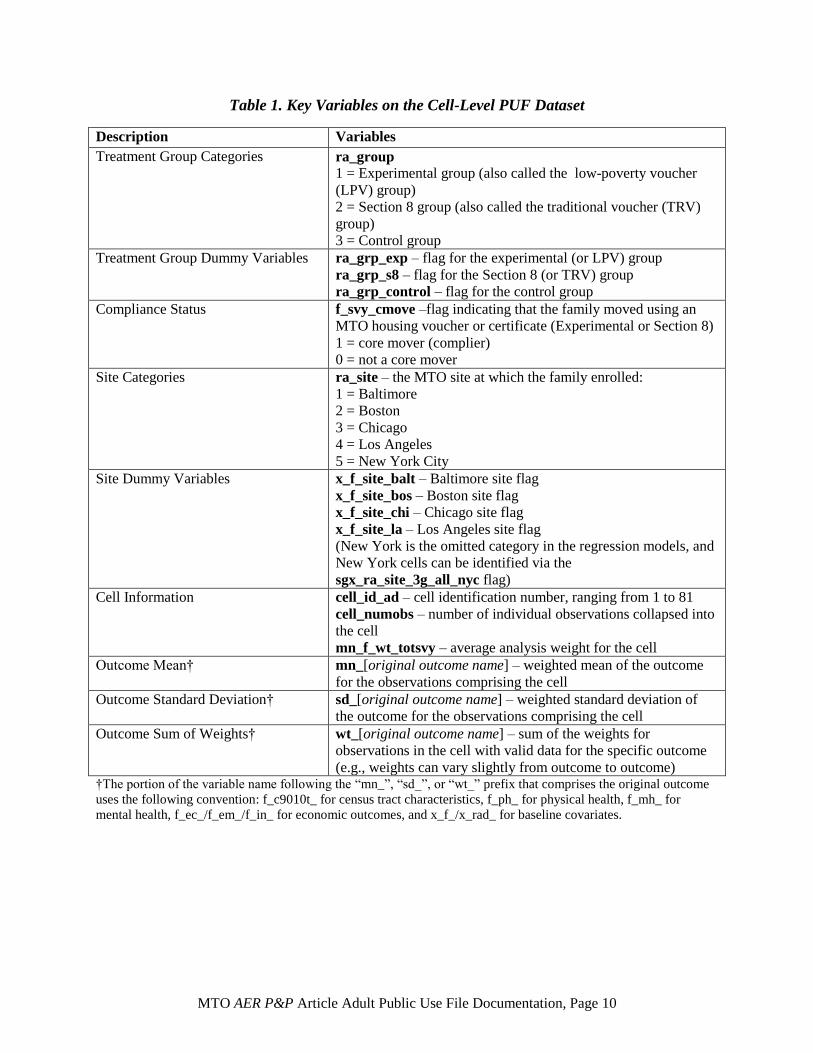
Table 1. Key Variables on the Cell-Level PUF Dataset
Description Variables
Treatment Group Categories ra_group
1 = Experimental group (also called the low-poverty voucher
(LPV) group)
2 = Section 8 group (also called the traditional voucher (TRV)
group)
3 = Control group
Treatment Group Dummy Variables ra_grp_exp – flag for the experimental (or LPV) group
ra_grp_s8 – flag for the Section 8 (or TRV) group
ra_grp_control – flag for the control group Compliance Status f_svy_cmove –flag indicating that the family moved using an
MTO housing voucher or certificate (Experimental or Section 8)
1 = core mover (complier)
0 = not a core mover
Site Categories ra_site – the MTO site at which the family enrolled:
1 = Baltimore
2 = Boston
3 = Chicago
4 = Los Angeles
5 = New York City
Site Dummy Variables x_f_site_balt – Baltimore site flag
x_f_site_bos – Boston site flag
x_f_site_chi – Chicago site flag
x_f_site_la – Los Angeles site flag
(New York is the omitted category in the regression models, and
New York cells can be identified via the
sgx_ra_site_3g_all_nyc flag)
Cell Information cell_id_ad – cell identification number, ranging from 1 to 81
cell_numobs – number of individual observations collapsed into
the cell
mn_f_wt_totsvy – average analysis weight for the cell
Outcome Mean† mn_[original outcome name] – weighted mean of the outcome
for the observations comprising the cell
Outcome Standard Deviation† sd_[original outcome name] – weighted standard deviation of
the outcome for the observations comprising the cell
Outcome Sum of Weights† wt_[original outcome name] – sum of the weights for
observations in the cell with valid data for the specific outcome
(e.g., weights can vary slightly from outcome to outcome) †The portion of the variable name following the “mn_”, “sd_”, or “wt_” prefix that comprises the original outcome
uses the following convention: f_c9010t_ for census tract characteristics, f_ph_ for physical health, f_mh_ for
mental health, f_ec_/f_em_/f_in_ for economic outcomes, and x_f_/x_rad_ for baseline covariates.

MTO AER P&P Article Adult Public Use File Documentation, Page 11
5. Construction of the Expanded Pseudo-Individual PUF
To make it easier to calculate standard errors for impact estimates, we expanded the aggregated cell-level
data to mimic an individual-level file. We expanded each cell by the number of observations that had
been aggregated into the cell (e.g., if the cell had originally had 20 records, we add an additional 19
duplicate records for the cell). This yields a total of 3,273 observations on the expanded file and mimics
the N’s, weight, and weighted means of the original file. To calculate the standard errors of the impacts
correctly, each outcome needs to have the same standard deviation within a cell as it did in the original
file. To mimic the standard deviation of the original observations comprising the cell, we artificially set
one record within each cell to a value above the mean (mean + V2), one record to a value below the mean
(mean – V2), and set the rest of the observations to the outcome’s mean (or to missing if there were
missing data for some observations)2. These new values are assigned to variables starting with the prefix:
ps_*. In addition to the ps_* variables, we have created pseudo dichotomous variables that start with the
prefix psbi_* and are restricted to values of 0, 1, or missing. These dichotomous measures allow for the
rough replication of our logit analyses. These pseudo dichotomous variables have been constructed to
approximate the number of non-missing observations and the weighted mean for the outcome for each
cell. The “pseudo individual-level” file roughly mimics the original data for the purposes of running
impact estimates by site and treatment group and running instrumental variable estimates using the
predicted share poor and share minority variables. However, the pseudo-individual data CANNOT be
used to examine cross-variable correlations, to run regressions other than basic impact estimates, or to run
impact estimates that control for baseline characteristics other than site. This is because the values of the
ps_* and psbi_* variables have been artificially set and while they capture the mean and the standard
deviation for the variable across the cell, they DO NOT reflect the actual values in the original dataset.
Within a cell, any relationship between variables is strictly an artifact of the way the data were expanded.
The ps_* and psbi_* variables can be used as the dependent variable in an impact estimate; however, they
should not be used on the right-hand side as a covariate. As the first record within each cell has been set
to a high value for that outcome, outcomes will appear artificially correlated with each other. Appendix C
shows the code used to expand the cell-data to create the pseudo individual-level data.
Below is a description of some of the key variables on the expanded pseudo-individual file. For a
complete list of variables see Appendix B.
2 V2 = square root of [(variance of population * number of observations in the cell)/2]

MTO AER P&P Article Adult Public Use File Documentation, Page 12
Table 2. Key Variables on the Expanded Pseudo-Individual PUF Dataset
Description Variables
Treatment Group Categories ra_group
1 = Experimental group (also called the low-poverty voucher
(LPV) group)
2 = Section 8 group (also called the traditional voucher (TRV)
group)
3 = Control group
Treatment Group Dummy Variables ra_grp_exp – flag for the experimental (or LPV) group
ra_grp_s8 – flag for the Section 8 (or TRV) group
ra_grp_control – flag for the control group Compliance Status f_svy_cmove –flag indicating that the family moved using an
MTO housing voucher or certificate (Experimental or Section 8)
1 = core mover (complier)
0 = not a core mover
Site Categories ra_site – the MTO site at which the family enrolled:
1 = Baltimore
2 = Boston
3 = Chicago
4 = Los Angeles
5 = New York City
Site Dummy Variables x_f_site_balt – Baltimore site flag
x_f_site_bos – Boston site flag
x_f_site_chi – Chicago site flag
x_f_site_la – Los Angeles site flag
(New York is the omitted category in the regression models, and
New York site observations can be identified via the
sgx_ra_site_3g_all_nyc flag)
Pseudo-Individual Level Measures for
Outcomes, Mediators, and Select
Baseline Characteristics†
ps_[original outcome name] – These are synthetic variables that
for each cell mimic the original data in terms of the number of
observations, weighted mean of the data, and standard deviation
of the data. HOWEVER, these variables were constructed using
the cell-level PUF data and are NOT actual individual-level data.
These variables include the index measures (ps_f_ec_idx_z_ad,
ps_f_ph_idx_fix_z_ad, ps_f_mh_idx_z_ad, and
ps_f_all_idx_fix_z_ad).
Pseudo-Individual Level Binary
Measures for Dummy Variable
Outcomes and Mediators†
psbi_[original outcome name] – These are synthetic dummy
variables (with values of 0, 1, or missing) that approximate the
original data in terms of the number of observations and the
weighted mean. HOWEVER, these variables were constructed
using the cell-level PUF data and are NOT actual individual-
level data. These variables include the obesity
(psbi_f_ph_bmi_obese*_srm_ad) and diabetes
(psbi_f_db_hba1c_diab_final) measures and most of the index
components measures. † See note to Table 1.

MTO AER P&P Article Adult Public Use File Documentation, Page 13
6. Replicating Results Using the PUFs
6.1 Estimation of Intention-to-Treat Effects (AER P&P Table 1)
The impacts presented in Table 1 of the AER P&P article are intention-to-treat (ITT) effects or the
impacts of being offered an MTO Experimental group or a traditional Section 8 housing voucher. The
impacts are calculated separately for each treatment group, i.e. different models for the Experimental-
Control and Section 8-Control impacts. Using the expanded pseudo-individual file, the ITT effects are
estimated using a linear regression with the outcome or mediator as the dependent variable and the key
independent variable being the dummy variable indicating assignment to the treatment group whose
impact you are calculating (ra_grp_exp = 1 for Experimental, ra_grp_s8 = 1 for Section 8). The
regression also controls for randomization site (using the four x_f_site_* indicators, with New York City
as the omitted category)3, applies a probability weight (mn_f_wt_totsvy), and generates Huber-White
standard errors.
In Stata, the command line to estimate the impact on the adult mental health index of being offered an
MTO Experimental group housing voucher is as follows:
regress ps_f_mh_idx_z_ad ra_grp_exp x_f_site_balt x_f_site_bos x_f_site_chi
x_f_site_la [pw=mn_f_wt_totsvy] if ra_grp_s8==0
where the Section 8 group is excluded (ra_grp_s8 == 0) and the ITT impact of the voucher will be the
coefficient on the variable ra_grp_exp or _b[ra_grp_exp]. Similarly to estimate the impact of being
offered an MTO Section 8 voucher would be:
regress ps_f_mh_idx_z_ad ra_grp_s8 x_f_site_balt x_f_site_bos x_f_site_chi
x_f_site_la [pw=mn_f_wt_totsvy] if ra_grp_exp==0
See Appendix D for the Stata program that generates the ITT estimates using the expanded pseudo-
individual PUF data.
Table 3 below compares three sets of impact estimates:
1. using the individual-level data and controlling for all covariates (these results match those
presented in the AER P&P article);
2. using the individual-level data and controlling only for randomization site; and
3. using the expanded pseudo-individual data from the PUF and controlling only for randomization
site. The PUF data have been collapsed into cells by site and group and then expanded and thus
do not allow one to control for additional baseline characteristics in the regression model.
Note that in addition to the outcomes presented in Table 1 of the AER P&P article, we have also included
in the table below and in the PUF data the duration-weighted neighborhood poverty variable used to
create Figure 1 (which as a reminder cannot be replicated using the PUFs) as well as the component
outcomes that feed into the indices (economic self-sufficiency, physical health, mental health, and the
3 As mentioned above, the results in the AER P&P article cannot be replicated exactly because the additional
independent variables used for the article could not be made available on the PUFs.
MTO AER P&P Article Adult Public Use File Documentation, Page 14
overall index).4 Although Table 3 does not include estimates of the effects of treatment-on-the-treated
(TOT), or the effect of the MTO treatment on those who actually move through MTO, the TOT effects
are shown in the appendix to the AER P&P article. The TOT estimates in the AER P&P appendix were
estimated using instrumental variables, however, one can also roughly calculate the TOT by dividing the
ITT estimate by the weighted compliance rate (the fraction of adults in the treatment groups who moved
using their MTO vouchers; Bloom, 1984). The weighted compliance rate for the experimental group can
be calculated using the pseudo file as:
summarize ps_f_svy_cmove [aw=mn_f_wt_totsvy] if ra_grp_exp==1
4 Table 3 below includes columns for the control group means as a reference point, but Table 1 in the AER P&P
article did not include control means. See the next section and Appendix D for information on calculating means for
the control and treatment groups.

MTO AER P&P Article Adult Public Use File Documentation, Page 15
Table 3. Comparisons of AER P&P Article Outcomes (Plus Index Components) Using Individual-Level Data vs.
Expanded Pseudo-Individual Data for the Experimental and Section 8 Groups
Indiv.-
Level
Data
Pseudo-
Indiv.
Data
Indiv.-
Level
Data
Pseudo-
Indiv.
Data
TABLE 1
Panel A. Outcome indices (z-scores)
Index for all outcomes 0.000 0.000 0.037 0.039 0.039 -0.010 0.034 0.034 3273 3273
(0.040) (0.043) (0.043) (0.059) (0.053) (0.051)
Economic self-sufficiency 0.000 0.000 -0.029 -0.020 -0.020 -0.112 * -0.076 -0.076 3271 3271
(0.040) (0.043) (0.042) (0.059) (0.054) (0.052)
Absence of physical health problems 0.000 0.000 0.055 0.053 0.053 0.062 0.079 0.079 3273 3273
(0.042) (0.044) (0.043) (0.058) (0.052) (0.051)
Absence of mental health problems 0.000 0.000 0.069 0.066 0.066 0.063 0.101 * 0.101 ** 3273 3273
(0.042) (0.043) (0.043) (0.062) (0.052) (0.051)
Panel B. Selected individual health outcomes
Psychological distress, K6 z-score 0.000 0.000 -0.106 ** -0.097 ** -0.097 ** -0.081 -0.111 ** -0.111 ** 3273 3273
(0.042) (0.043) (0.043) (0.060) (0.053) (0.052)
BMI ≥ 40 0.175 0.177 -0.036 ** -0.033 ** -0.034 ** -0.038 * -0.026 -0.025 3221 3221
(0.016) (0.016) (0.016) (0.023) (0.019) (0.019)
Blood test detected diabetes (HbA1c ≥ 6.5%) 0.204 0.204 -0.050 *** -0.042 ** -0.042 ** -0.015 0.003 0.002 2737 2732
(0.018) (0.019) (0.018) (0.026) (0.024) (0.023)
FIGURE 1
Neighborhood share poor, duration-weighted 0.396 0.000 -0.088 *** -0.090 *** 0.039 -0.062 *** -0.067 *** 0.034 3270 3273
(0.006) (0.006) (0.043) (0.007) (0.006) (0.051)
Full
Covariates
Individual-
Level Data
Individual-
Level Data
Site CovariatesControl Mean N
Experimental versus Control
Site Covariates
Section 8 versus Control
Pseudo-
Individual
Data
Full
Covariates
Individual-
Level Data
Individual-
Level Data
Pseudo-
Individual
Data

MTO AER P&P Article Adult Public Use File Documentation, Page 16
Indiv.-
Level
Data
Pseudo-
Indiv.
Data
Indiv.-
Level
Data
Pseudo-
Indiv.
Data
INDEX COMPONENTS
(not shown in article)
Economic self-sufficiency
Employed and not receiving Temporary
Assistance for Needy Families (TANF) 0.499 0.498 -0.020 -0.018 -0.016 -0.066 ** -0.046 * -0.044 * 3260 3260
(0.021) (0.022) (0.021) (0.030) (0.027) (0.026)
Employed 0.525 0.525 -0.007 -0.006 -0.004 -0.068 ** -0.051 * -0.049 * 3264 3264
(0.021) (0.022) (0.021) (0.030) (0.027) (0.026)
Earnings $12,289 $12,292 293 293 576 -251 -251 -251 3141 3140
(576) (576) (613) (883) (883) (883)
Receiving TANF 0.158 0.158 0.011 0.007 0.008 0.037 * 0.009 0.009 3262 3262
(0.015) (0.015) (0.015) (0.022) (0.020) (0.019)
Government income $3,543 $3,543 255 255 217 191 191 191 3139 3139
(217) (217) (530) (318) (318) (318)
Physical health
Fair or poor self-reported 0.436 0.438 -0.004 0.000 -0.001 0.017 -0.010 -0.010 3269 3269
(0.020) (0.022) (0.021) (0.030) (0.027) (0.026)
Health limits ability to climb several
flights of stairs or lift or carry groceries 0.510 0.510 -0.050 ** -0.048 ** -0.049 ** -0.026 -0.039 -0.036 3270 3270
(0.021) (0.022) (0.021) (0.030) (0.027) (0.026)
Asthma attack in past year 0.293 0.292 -0.017 -0.018 -0.018 -0.037 -0.031 -0.029 3267 3266
(0.019) (0.020) (0.019) (0.028) (0.024) (0.023)
Hypertension 0.315 0.315 0.007 0.005 0.005 -0.023 -0.015 -0.017 3102 3100
(0.020) (0.021) (0.020) (0.029) (0.026) (0.025)
Obese (body mass index ≥ 30) 0.584 0.586 -0.011 -0.012 -0.013 -0.010 -0.010 -0.011 3221 3221
(0.021) (0.022) (0.021) (0.031) (0.027) (0.026)
N
Individual-
Level Data
Individual-
Level Data
Pseudo-
Individual
Data
Individual-
Level Data
Individual-
Level Data
Pseudo-
Individual
Data
Table 3. (continued)
Experimental versus Control Section 8 versus Control
Control Mean
Full
Covariates Site Covariates
Full
Covariates Site Covariates

MTO AER P&P Article Adult Public Use File Documentation, Page 17
Indiv.-
Level
Data
Pseudo-
Indiv.
Data
Indiv.-
Level
Data
Pseudo-
Indiv.
Data
INDEX COMPONENTS (continued)
(not shown in article)
Mental health
K6 raw score (range 0-24), past month 6.961 6.961 -0.537 ** -0.492 ** -0.492 ** -0.413 -0.562 ** -0.562 ** 3273 3273
(0.212) (0.220) (0.217) (0.306) (0.269) (0.263)
Depression, past year 0.138 0.141 -0.017 -0.015 -0.017 -0.014 -0.016 -0.016 3273 3273
(0.014) (0.015) (0.015) (0.020) (0.018) (0.018)
Generalized anxiety disorder, past year 0.066 0.065 0.003 0.005 0.006 -0.027 ** -0.025 ** -0.022 * 3273 3273
(0.011) (0.011) (0.011) (0.014) (0.011) (0.011)
Calm and peaceful, past month 0.487 0.487 0.015 0.019 0.019 -0.039 -0.001 0.000 3272 3272
(0.022) (0.022) (0.021) (0.031) (0.027) (0.026)
Slept 7-8 hours last night 0.291 0.291 0.014 0.018 0.017 0.015 0.019 0.022 3241 3241
(0.020) (0.020) (0.020) (0.029) (0.025) (0.024)
Full
Covariates Site Covariates N
Individual-
Level Data
Individual-
Level Data
Pseudo-
Individual
Data
Individual-
Level Data
Individual-
Level Data
Pseudo-
Individual
Data
Notes: * = p < .10, ** = p < .05, *** = p < .01.
Table 3. (continued)
Experimental versus Control Section 8 versus Control
Control Mean
Full
Covariates Site Covariates

MTO AER P&P Article Adult Public Use File Documentation, Page 18
6.2 Estimation of Control and Treatment Means
While not presented in the main tables of the AER P&P article, mean values for the control group and the
MTO treatment (voucher) groups and p-value levels of the differences between the groups can be
calculated using the expanded pseudo-individual file.
In Stata, the weighted mean of an outcome or a baseline characteristic (such as “never married”) can be
calculated by using the average weight variable (mn_f_wt_totsvy) and restricting to either the control
group (ra_grp_control = 1) or one of the treatment groups (ra_grp_exp = 1 or ra_grp_s8 = 1):
summarize ps_x_f_ad_nevmarr [aw=mn_f_wt_totsvy] if ra_grp_control==1
summarize ps_x_f_ad_nevmarr [aw=mn_f_wt_totsvy] if ra_grp_exp==1
summarize ps_x_f_ad_nevmarr [aw=mn_f_wt_totsvy] if ra_grp_s8==1
To test the significance of the difference in means, we use a weighted regression of the treatment group
dummy (either the Experimental group of the Section 8 group) on the baseline characteristic. We use the
t-statistic on the treatment group coefficient to calculate the p-value for a two-tailed t-test of two samples
with equal variance. In Stata (using the Experimental group for this example):
regress ps_x_f_ad_nevmarr ra_grp_exp [pw=mn_f_wt_totsvy] if ra_grp_s8==0
scalar sc_diff_pv = ttail(e(df_r), abs(_b[ra_grp_exp] / _se[ra_grp_exp])) * 2
where the Section 8 group is excluded (ra_grp_s8 == 0), e(df_r) is the regression degrees of freedom,
_b[ra_grp_exp] is the coefficient on the treatment dummy variable, and _se[ra_grp_exp] is the standard
error of the treatment variable.
6.3 Estimation of the Relationship Between Outcomes and Specific Neighborhood
Conditions
While not presented in the main exhibits of the AER P&P article, the relationship between outcomes and
specific neighborhood conditions can be estimated using the PUF data via a two-stage least squares
(2SLS), instrumental variables (IV) approach, as shown in Appendix Figure 3 of the AER P&P article for
the relationship between subjective well-being and neighborhood poverty and minority concentration. We
do not detail the IV approach here, but the PUFs do include a predicted share poor and share minority
value for all observations such that only the second stage of the 2SLS model needs to be estimated.
Additional details, including Stata code for the IV method, are available as part of the documentation for
the MTO Science article PUF at www.nber.org/mtopuf.

MTO AER P&P Article Adult Public Use File Documentation, Page 19
7. Summary
The PUFs described are designed to allow the user to roughly replicate the MTO results for adults that
were presented in the AER P&P article “Long-Term Neighborhood Effects on Low-Income Families:
Evidence from Moving to Opportunity.” (Data allowing for the replication of youth analyses in the article
will be made available as a separate PUF.) The PUFs contain information for MTO adults on physical and
mental health, economic self-sufficiency, and other outcomes and mediators. The data have been
aggregated by site and by treatment group assignment to allow for the replication of impact estimates.
Aggregation protects the confidentiality of the data. Under no circumstances should the user attempt to
identify any individual in the datasets. Users who wish to explore the individual-level data that allow for
more types of analyses and controlling for a more complete set of baseline covariates in estimating
impacts can apply for access to the restricted access dataset when it becomes available via ICPSR.

MTO AER P&P Article Adult Public Use File Documentation, Page 20
References
American Diabetes Association. 2010. “Standards of medical care in diabetes – 2010.” Diabetes Care.
33(1): S11-61.
Bloom, Howard S. 1984. “Accounting for No-Shows in Experimental Evaluation Designs.” Evaluation
Review. 8(2): 225-246.
Chobanian, Aram V., George L. Bakris, Henry R. Black, William C. Cushman, Lee A. Green, Joseph L.
Izzo, Jr., Daniel W. Jones, et al., and the National High Blood Pressure Education Program
Coordinating Committee. 2003. Seventh report of the Joint National Committee on Prevention,
Detection, Evaluation, and Treatment of High Blood Pressure. Hypertension. 42(6): 1206-52.
Institute for Social Research. 2008. Health and retirement study: Physical measures and biomarkers
2008. Ann Arbor: University of Michigan. Available at
http://hrsonline.isr.umich.edu/modules/meta/2008/core/qnaire/online/2008PhysicalMeasuresBiom
arkers.pdf.
Kessler, Ronald C., and Kathleen R. Merikangas. 2004. “The National Comorbidity Survey Replication
(NCS-R): Background and aims.” International Journal of Methods in Psychiatric Research. 13
(2): 60-68.
Kling, Jeffrey R., Jeffrey B. Liebman, and Lawrence F. Katz. 2007. “Experimental Analysis of
Neighborhood Effects.” Econometrica. 75(1): 83-119.
National Institutes of Health, National Heart, Lung and Blood Institute, and Obesity Education Initiative.
2004. Seventh report of the Joint National Committee on Prevention, Detection, Evaluation, and
Treatment of High Blood Pressure. Washington, DC: National Institutes of Health.
Orr, Larry, Judith D. Feins, Robin Jacob, Erik Beecroft, Lisa Sanbonmatsu, Lawrence F. Katz, Jeffery B.
Liebman, and Jeffrey R. Kling. 2003. Moving to Opportunity for Fair Housing Demonstration
Program: Interim Impacts Evaluation. U.S. Department of Housing and Urban Development,
Office of Policy Development and Research, Washington, DC; available at
www.huduser.org/Publications/pdf/MTOFullReport.pdf.
Sanbonmatsu, Lisa, Jens Ludwig, Lawrence F. Katz, Lisa A. Gennetian, Greg J. Duncan, Ronald C.
Kessler, Emma Adam, Thomas W. McDade, and Stacy Tessler Lindau. 2011. Moving to
Opportunity for Fair Housing Demonstration Program: Final Impacts Evaluation. U.S.
Department of Housing and Urban Development, Office of Policy Development and Research,
Washington, DC; available at www.huduser.org/portal/publications/pubasst/MTOFHD.html.
Saudek, Christopher D., William H. Herman, David B. Sacks, Richard M. Bergenstal, David Edelman,
Mayer B. Davidson. 2008. “A new look at screening and diagnosing diabetes mellitus.” Journal
of Clinical Endocrinology and Metabolism. 93(7): 2447-53.

MTO AER P&P Article Adult Public Use File Documentation, Page 21
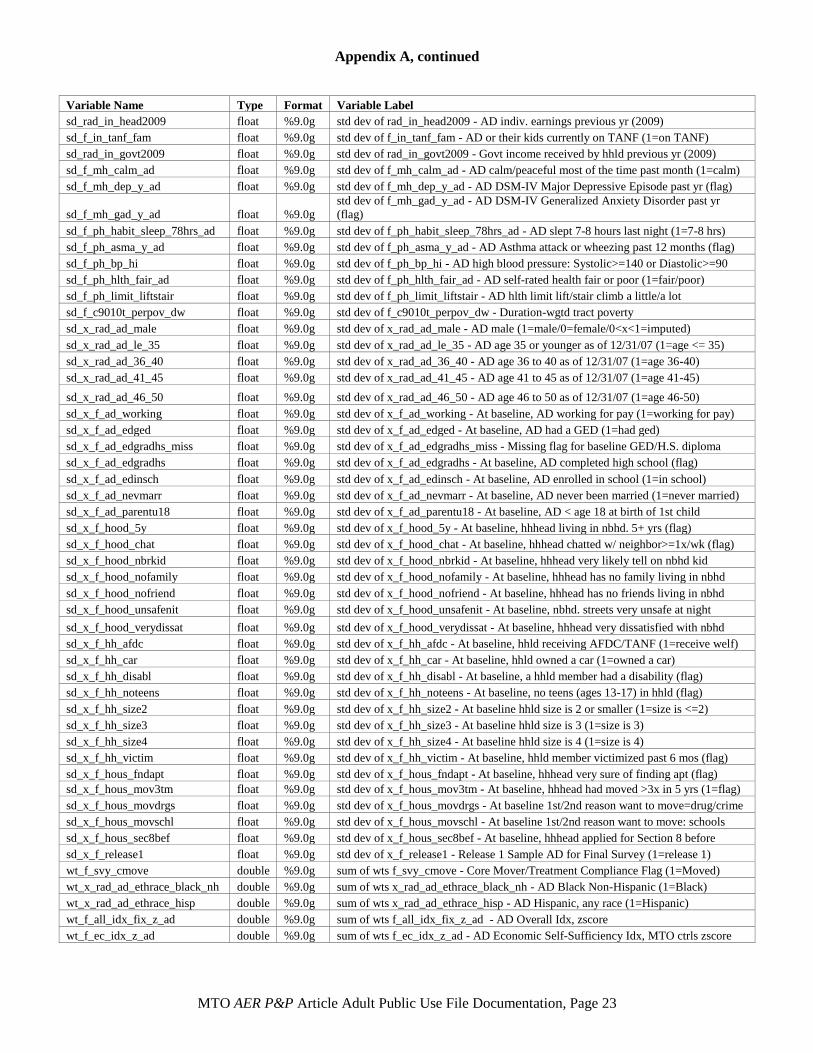
Appendix A – Variable List for the Cell-Level PUF File
(mto_aer_ad_puf_cells_20131025.dta)
Note that this appendix is a variable list only. For further details on the variables, please see section 4 above (specifically
Table 1), which explains the variable prefixes, as well as Appendix G, which includes detailed documentation of the
outcome and mediator measures.
obs: 81
vars: 193
Variable Name Type Format Variable Label
cell_id_ad float %9.0g cell_id_ad - number id assigned to cell
ra_group float %34.0g
ra_group - Randomization grp (1=Low-PovVouch/Exp, 2=TradVouch/Sec8,
3=Control)
ra_grp_exp float %43.0g ra_grp_exp - Low-Poverty Voucher (Experimental) grp (1=LPV)
ra_grp_s8 float %43.0g ra_grp_s8 - Traditional Voucher (Section 8) grp (1=TRV)
ra_grp_control float %31.0g ra_grp_control - Control grp flag (1=control)
ra_site float %15.0g ra_site - Site (1=Baltimore/2=Boston/3=Chicago/4=Los Angeles/5=New York City)
x_f_site_balt float %42.0g x_f_site_balt - AD in Baltimore Site (1=Baltimore, 0=Not Baltimore)
x_f_site_bos float %45.0g x_f_site_bos - AD in Boston Site (1=Boston, 0=Not Boston)
x_f_site_chi float %44.0g x_f_site_chi - AD in Chicago Site (1=Chicago, 0=Not Chicago)
x_f_site_la float %40.0g x_f_site_la - AD in LA Site (1=Los Angeles, 0 = Not Los Angeles)
sgx_rasite_3g_all_nyc float %43.0g sgx_rasite_3g_all_nyc - New York site, all grps (1=New York City)
mn_f_wt_totsvy float %9.0g mn_f_wt_totsvy - average of f_wt_totsvy for obs in cell
cell_numobs long %10.0g cell_numobs - # of observations contributing to cell
cell_sumwgt double %10.0g cell_sumwgt - sum of weights for the cell
mn_f_svy_cmove float %9.0g mean of f_svy_cmove - Core Mover/Treatment Compliance Flag (1=Moved)
mn_x_rad_ad_ethrace_black_nh float %9.0g mean of x_rad_ad_ethrace_black_nh - AD Black Non-Hispanic (1=Black)
mn_x_rad_ad_ethrace_hisp float %9.0g mean of x_rad_ad_ethrace_hisp - AD Hispanic, any race (1=Hispanic)
mn_f_all_idx_fix_z_ad float %9.0g mean of f_all_idx_fix_z_ad - AD Overall Idx, zscore
mn_f_ec_idx_z_ad float %9.0g mean of f_ec_idx_z_ad - AD Economic Self-Sufficiency Idx, MTO ctrls zscore
mn_f_ph_idx_fix_z_ad float %9.0g mean of f_ph_idx_fix_z_ad - AD Absence of Physical Health Probs Idx, zscore
mn_f_mh_idx_z_ad float %9.0g mean of f_mh_idx_z_ad - AD Absence of Mental Health Problems Idx, zscore
mn_f_mh_k6_raw_ad float %9.0g mean of f_mh_k6_raw_ad - AD Psychological Distress Idx (K6) (0-24)
mn_f_mh_k6_z_ad float %9.0g mean of f_mh_k6_z_ad - AD Psychological Distress Idx (K6), zscore
mn_f_ph_bmi_obese3_srm_ad float %9.0g mean of f_ph_bmi_obese3_srm_ad - AD obese 3 (measured/self-reports): BMI>=40
mn_f_ph_bmi_obese_srm_ad float %9.0g mean of f_ph_bmi_obese_srm_ad - AD obese (measured/self-reports): BMI>=30
mn_f_db_hba1c_diab_final float %9.0g mean of f_db_hba1c_diab_final - AD diabetes (blood test): HbA1c>=6.5%
mn_f_in_selfsuf_ad float %9.0g mean of f_in_selfsuf_ad - AD employed and not on TANF (1=self sufficient)
mn_f_em_emp_ad float %9.0g mean of f_em_emp_ad - AD employed or temporarily absent last week (1=emp)
mn_rad_in_head2009 float %9.0g mean of rad_in_head2009 - AD indiv. earnings previous yr (2009)
mn_f_in_tanf_fam float %9.0g mean of f_in_tanf_fam - AD or their kids currently on TANF (1=on TANF)
mn_rad_in_govt2009 float %9.0g mean of rad_in_govt2009 - Govt income received by hhld previous yr (2009)
mn_f_mh_calm_ad float %9.0g mean of f_mh_calm_ad - AD calm/peaceful most of the time past month (1=calm)
mn_f_mh_dep_y_ad float %9.0g mean of f_mh_dep_y_ad - AD DSM-IV Major Depressive Episode past yr (flag)
mn_f_mh_gad_y_ad float %9.0g mean of f_mh_gad_y_ad - AD DSM-IV Generalized Anxiety Disorder past yr (flag)
mn_f_ph_habit_sleep_78hrs_ad float %9.0g mean of f_ph_habit_sleep_78hrs_ad - AD slept 7-8 hours last night (1=7-8 hrs)
mn_f_ph_asma_y_ad float %9.0g mean of f_ph_asma_y_ad - AD Asthma attack or wheezing past 12 months (flag)

Appendix A, continued
MTO AER P&P Article Adult Public Use File Documentation, Page 22
Variable Name Type Format Variable Label
mn_f_ph_bp_hi float %9.0g mean of f_ph_bp_hi - AD high blood pressure: Systolic>=140 or Diastolic>=90
mn_f_ph_hlth_fair_ad float %9.0g mean of f_ph_hlth_fair_ad - AD self-rated health fair or poor (1=fair/poor)
mn_f_ph_limit_liftstair float %9.0g mean of f_ph_limit_liftstair - AD hlth limit lift/stair climb a little/a lot
mn_f_c9010t_perpov_dw float %9.0g mean of f_c9010t_perpov_dw - Duration-wgtd tract poverty
mn_x_rad_ad_male float %9.0g mean of x_rad_ad_male - AD male (1=male/0=female/0<x<1=imputed)
mn_x_rad_ad_le_35 float %9.0g mean of x_rad_ad_le_35 - AD age 35 or younger as of 12/31/07 (1=age <= 35)
mn_x_rad_ad_36_40 float %9.0g mean of x_rad_ad_36_40 - AD age 36 to 40 as of 12/31/07 (1=age 36-40)
mn_x_rad_ad_41_45 float %9.0g mean of x_rad_ad_41_45 - AD age 41 to 45 as of 12/31/07 (1=age 41-45)
mn_x_rad_ad_46_50 float %9.0g mean of x_rad_ad_46_50 - AD age 46 to 50 as of 12/31/07 (1=age 46-50)
mn_x_f_ad_working float %9.0g mean of x_f_ad_working - At baseline, AD working for pay (1=working for pay)
mn_x_f_ad_edged float %9.0g mean of x_f_ad_edged - At baseline, AD had a GED (1=had ged)
mn_x_f_ad_edgradhs_miss float %9.0g mean of x_f_ad_edgradhs_miss - Missing flag for baseline GED/H.S. diploma
mn_x_f_ad_edgradhs float %9.0g mean of x_f_ad_edgradhs - At baseline, AD completed high school (flag)
mn_x_f_ad_edinsch float %9.0g mean of x_f_ad_edinsch - At baseline, AD enrolled in school (1=in school)
mn_x_f_ad_nevmarr float %9.0g mean of x_f_ad_nevmarr - At baseline, AD never been married (1=never married)
mn_x_f_ad_parentu18 float %9.0g mean of x_f_ad_parentu18 - At baseline, AD < age 18 at birth of 1st child
mn_x_f_hood_5y float %9.0g mean of x_f_hood_5y - At baseline, hhhead living in nbhd. 5+ yrs (flag)
mn_x_f_hood_chat float %9.0g mean of x_f_hood_chat - At baseline, hhhead chatted w/ neighbor>=1x/wk (flag)
mn_x_f_hood_nbrkid float %9.0g mean of x_f_hood_nbrkid - At baseline, hhhead very likely tell on nbhd kid
mn_x_f_hood_nofamily float %9.0g mean of x_f_hood_nofamily - At baseline, hhhead has no family living in nbhd
mn_x_f_hood_nofriend float %9.0g mean of x_f_hood_nofriend - At baseline, hhhead has no friends living in nbhd
mn_x_f_hood_unsafenit float %9.0g mean of x_f_hood_unsafenit - At baseline, nbhd. streets very unsafe at night
mn_x_f_hood_verydissat float %9.0g mean of x_f_hood_verydissat - At baseline, hhhead very dissatisfied with nbhd
mn_x_f_hh_afdc float %9.0g mean of x_f_hh_afdc - At baseline, hhld receiving AFDC/TANF (1=receive welf)
mn_x_f_hh_car float %9.0g mean of x_f_hh_car - At baseline, hhld owned a car (1=owned a car)
mn_x_f_hh_disabl float %9.0g mean of x_f_hh_disabl - At baseline, a hhld member had a disability (flag)
mn_x_f_hh_noteens float %9.0g mean of x_f_hh_noteens - At baseline, no teens (ages 13-17) in hhld (flag)
mn_x_f_hh_size2 float %9.0g mean of x_f_hh_size2 - At baseline hhld size is 2 or smaller (1=size is <=2)
mn_x_f_hh_size3 float %9.0g mean of x_f_hh_size3 - At baseline hhld size is 3 (1=size is 3)
mn_x_f_hh_size4 float %9.0g mean of x_f_hh_size4 - At baseline hhld size is 4 (1=size is 4)
mn_x_f_hh_victim float %9.0g mean of x_f_hh_victim - At baseline, hhld member victimized past 6 mos (flag)
mn_x_f_hous_fndapt float %9.0g mean of x_f_hous_fndapt - At baseline, hhhead very sure of finding apt (flag)
mn_x_f_hous_mov3tm float %9.0g mean of x_f_hous_mov3tm - At baseline, hhhead had moved >3x in 5 yrs (1=flag)
mn_x_f_hous_movdrgs float %9.0g mean of x_f_hous_movdrgs - At baseline 1st/2nd reason want to move=drug/crime
mn_x_f_hous_movschl float %9.0g mean of x_f_hous_movschl - At baseline 1st/2nd reason want to move: schools
mn_x_f_hous_sec8bef float %9.0g mean of x_f_hous_sec8bef - At baseline, hhhead applied for Section 8 before
mn_x_f_release1 float %9.0g mean of x_f_release1 - Release 1 Sample AD for Final Survey (1=release 1)
sd_f_svy_cmove float %9.0g std dev of f_svy_cmove - Core Mover/Treatment Compliance Flag (1=Moved)
sd_x_rad_ad_ethrace_black_nh float %9.0g std dev of x_rad_ad_ethrace_black_nh - AD Black Non-Hispanic (1=Black)
sd_x_rad_ad_ethrace_hisp float %9.0g std dev of x_rad_ad_ethrace_hisp - AD Hispanic, any race (1=Hispanic)
sd_f_all_idx_fix_z_ad float %9.0g std dev of f_all_idx_fix_z_ad - AD Overall Idx, zscore
sd_f_ec_idx_z_ad float %9.0g std dev of f_ec_idx_z_ad - AD Economic Self-Sufficiency Idx, MTO ctrls zscore
sd_f_ph_idx_fix_z_ad float %9.0g std dev of f_ph_idx_fix_z_ad - AD Absence of Physical Health Probs Idx, zscore
sd_f_mh_idx_z_ad float %9.0g std dev of f_mh_idx_z_ad - AD Absence of Mental Health Problems Idx, zscore
sd_f_mh_k6_raw_ad float %9.0g std dev of f_mh_k6_raw_ad - AD Psychological Distress Idx (K6) (0-24)
sd_f_mh_k6_z_ad float %9.0g std dev of f_mh_k6_z_ad - AD Psychological Distress Idx (K6), zscore
sd_f_ph_bmi_obese3_srm_ad float %9.0g
std dev of f_ph_bmi_obese3_srm_ad - AD obese 3 (measured/self-reports):
BMI>=40
sd_f_ph_bmi_obese_srm_ad float %9.0g std dev of f_ph_bmi_obese_srm_ad - AD obese (measured/self-reports): BMI>=30
sd_f_db_hba1c_diab_final float %9.0g std dev of f_db_hba1c_diab_final - AD diabetes (blood test): HbA1c>=6.5%
sd_f_in_selfsuf_ad float %9.0g std dev of f_in_selfsuf_ad - AD employed and not on TANF (1=self sufficient)
sd_f_em_emp_ad float %9.0g std dev of f_em_emp_ad - AD employed or temporarily absent last week (1=emp)
Appendix A, continued
MTO AER P&P Article Adult Public Use File Documentation, Page 23
Variable Name Type Format Variable Label
sd_rad_in_head2009 float %9.0g std dev of rad_in_head2009 - AD indiv. earnings previous yr (2009)
sd_f_in_tanf_fam float %9.0g std dev of f_in_tanf_fam - AD or their kids currently on TANF (1=on TANF)
sd_rad_in_govt2009 float %9.0g std dev of rad_in_govt2009 - Govt income received by hhld previous yr (2009)
sd_f_mh_calm_ad float %9.0g std dev of f_mh_calm_ad - AD calm/peaceful most of the time past month (1=calm)
sd_f_mh_dep_y_ad float %9.0g std dev of f_mh_dep_y_ad - AD DSM-IV Major Depressive Episode past yr (flag)
sd_f_mh_gad_y_ad float %9.0g
std dev of f_mh_gad_y_ad - AD DSM-IV Generalized Anxiety Disorder past yr
(flag)
sd_f_ph_habit_sleep_78hrs_ad float %9.0g std dev of f_ph_habit_sleep_78hrs_ad - AD slept 7-8 hours last night (1=7-8 hrs)
sd_f_ph_asma_y_ad float %9.0g std dev of f_ph_asma_y_ad - AD Asthma attack or wheezing past 12 months (flag)
sd_f_ph_bp_hi float %9.0g std dev of f_ph_bp_hi - AD high blood pressure: Systolic>=140 or Diastolic>=90
sd_f_ph_hlth_fair_ad float %9.0g std dev of f_ph_hlth_fair_ad - AD self-rated health fair or poor (1=fair/poor)
sd_f_ph_limit_liftstair float %9.0g std dev of f_ph_limit_liftstair - AD hlth limit lift/stair climb a little/a lot
sd_f_c9010t_perpov_dw float %9.0g std dev of f_c9010t_perpov_dw - Duration-wgtd tract poverty
sd_x_rad_ad_male float %9.0g std dev of x_rad_ad_male - AD male (1=male/0=female/0<x<1=imputed)
sd_x_rad_ad_le_35 float %9.0g std dev of x_rad_ad_le_35 - AD age 35 or younger as of 12/31/07 (1=age <= 35)
sd_x_rad_ad_36_40 float %9.0g std dev of x_rad_ad_36_40 - AD age 36 to 40 as of 12/31/07 (1=age 36-40)
sd_x_rad_ad_41_45 float %9.0g std dev of x_rad_ad_41_45 - AD age 41 to 45 as of 12/31/07 (1=age 41-45)
sd_x_rad_ad_46_50 float %9.0g std dev of x_rad_ad_46_50 - AD age 46 to 50 as of 12/31/07 (1=age 46-50)
sd_x_f_ad_working float %9.0g std dev of x_f_ad_working - At baseline, AD working for pay (1=working for pay)
sd_x_f_ad_edged float %9.0g std dev of x_f_ad_edged - At baseline, AD had a GED (1=had ged)
sd_x_f_ad_edgradhs_miss float %9.0g std dev of x_f_ad_edgradhs_miss - Missing flag for baseline GED/H.S. diploma
sd_x_f_ad_edgradhs float %9.0g std dev of x_f_ad_edgradhs - At baseline, AD completed high school (flag)
sd_x_f_ad_edinsch float %9.0g std dev of x_f_ad_edinsch - At baseline, AD enrolled in school (1=in school)
sd_x_f_ad_nevmarr float %9.0g std dev of x_f_ad_nevmarr - At baseline, AD never been married (1=never married)
sd_x_f_ad_parentu18 float %9.0g std dev of x_f_ad_parentu18 - At baseline, AD < age 18 at birth of 1st child
sd_x_f_hood_5y float %9.0g std dev of x_f_hood_5y - At baseline, hhhead living in nbhd. 5+ yrs (flag)
sd_x_f_hood_chat float %9.0g std dev of x_f_hood_chat - At baseline, hhhead chatted w/ neighbor>=1x/wk (flag)
sd_x_f_hood_nbrkid float %9.0g std dev of x_f_hood_nbrkid - At baseline, hhhead very likely tell on nbhd kid
sd_x_f_hood_nofamily float %9.0g std dev of x_f_hood_nofamily - At baseline, hhhead has no family living in nbhd
sd_x_f_hood_nofriend float %9.0g std dev of x_f_hood_nofriend - At baseline, hhhead has no friends living in nbhd
sd_x_f_hood_unsafenit float %9.0g std dev of x_f_hood_unsafenit - At baseline, nbhd. streets very unsafe at night
sd_x_f_hood_verydissat float %9.0g std dev of x_f_hood_verydissat - At baseline, hhhead very dissatisfied with nbhd
sd_x_f_hh_afdc float %9.0g std dev of x_f_hh_afdc - At baseline, hhld receiving AFDC/TANF (1=receive welf)
sd_x_f_hh_car float %9.0g std dev of x_f_hh_car - At baseline, hhld owned a car (1=owned a car)
sd_x_f_hh_disabl float %9.0g std dev of x_f_hh_disabl - At baseline, a hhld member had a disability (flag)
sd_x_f_hh_noteens float %9.0g std dev of x_f_hh_noteens - At baseline, no teens (ages 13-17) in hhld (flag)
sd_x_f_hh_size2 float %9.0g std dev of x_f_hh_size2 - At baseline hhld size is 2 or smaller (1=size is <=2)
sd_x_f_hh_size3 float %9.0g std dev of x_f_hh_size3 - At baseline hhld size is 3 (1=size is 3)
sd_x_f_hh_size4 float %9.0g std dev of x_f_hh_size4 - At baseline hhld size is 4 (1=size is 4)
sd_x_f_hh_victim float %9.0g std dev of x_f_hh_victim - At baseline, hhld member victimized past 6 mos (flag)
sd_x_f_hous_fndapt float %9.0g std dev of x_f_hous_fndapt - At baseline, hhhead very sure of finding apt (flag)
sd_x_f_hous_mov3tm float %9.0g std dev of x_f_hous_mov3tm - At baseline, hhhead had moved >3x in 5 yrs (1=flag)
sd_x_f_hous_movdrgs float %9.0g std dev of x_f_hous_movdrgs - At baseline 1st/2nd reason want to move=drug/crime
sd_x_f_hous_movschl float %9.0g std dev of x_f_hous_movschl - At baseline 1st/2nd reason want to move: schools
sd_x_f_hous_sec8bef float %9.0g std dev of x_f_hous_sec8bef - At baseline, hhhead applied for Section 8 before
sd_x_f_release1 float %9.0g std dev of x_f_release1 - Release 1 Sample AD for Final Survey (1=release 1)
wt_f_svy_cmove double %9.0g sum of wts f_svy_cmove - Core Mover/Treatment Compliance Flag (1=Moved)
wt_x_rad_ad_ethrace_black_nh double %9.0g sum of wts x_rad_ad_ethrace_black_nh - AD Black Non-Hispanic (1=Black)
wt_x_rad_ad_ethrace_hisp double %9.0g sum of wts x_rad_ad_ethrace_hisp - AD Hispanic, any race (1=Hispanic)
wt_f_all_idx_fix_z_ad double %9.0g sum of wts f_all_idx_fix_z_ad - AD Overall Idx, zscore
wt_f_ec_idx_z_ad double %9.0g sum of wts f_ec_idx_z_ad - AD Economic Self-Sufficiency Idx, MTO ctrls zscore

Appendix A, continued
MTO AER P&P Article Adult Public Use File Documentation, Page 24
Variable Name Type Format Variable Label
wt_f_ph_idx_fix_z_ad double %9.0g sum of wts f_ph_idx_fix_z_ad - AD Absence of Physical Health Probs Idx, zscore
wt_f_mh_idx_z_ad double %9.0g sum of wts f_mh_idx_z_ad - AD Absence of Mental Health Problems Idx, zscore
wt_f_mh_k6_raw_ad double %9.0g sum of wts f_mh_k6_raw_ad - AD Psychological Distress Idx (K6) (0-24)
wt_f_mh_k6_z_ad double %9.0g sum of wts f_mh_k6_z_ad - AD Psychological Distress Idx (K6), zscore
wt_f_ph_bmi_obese3_srm_ad double %9.0g
sum of wts f_ph_bmi_obese3_srm_ad - AD obese 3 (measured/self-reports):
BMI>=40
wt_f_ph_bmi_obese_srm_ad double %9.0g sum of wts f_ph_bmi_obese_srm_ad - AD obese (measured/self-reports): BMI>=30
wt_f_db_hba1c_diab_final double %9.0g sum of wts f_db_hba1c_diab_final - AD diabetes (blood test): HbA1c>=6.5%
wt_f_in_selfsuf_ad double %9.0g sum of wts f_in_selfsuf_ad - AD employed and not on TANF (1=self sufficient)
wt_f_em_emp_ad double %9.0g sum of wts f_em_emp_ad - AD employed or temporarily absent last week (1=emp)
wt_rad_in_head2009 double %9.0g sum of wts rad_in_head2009 - AD indiv. earnings previous yr (2009)
wt_f_in_tanf_fam double %9.0g sum of wts f_in_tanf_fam - AD or their kids currently on TANF (1=on TANF)
wt_rad_in_govt2009 double %9.0g sum of wts rad_in_govt2009 - Govt income received by hhld previous yr (2009)
wt_f_mh_calm_ad double %9.0g sum of wts f_mh_calm_ad - AD calm/peaceful most of the time past month (1=calm)
wt_f_mh_dep_y_ad double %9.0g sum of wts f_mh_dep_y_ad - AD DSM-IV Major Depressive Episode past yr (flag)
wt_f_mh_gad_y_ad double %9.0g
sum of wts f_mh_gad_y_ad - AD DSM-IV Generalized Anxiety Disorder past yr
(flag)
wt_f_ph_habit_sleep_78hrs_ad double %9.0g sum of wts f_ph_habit_sleep_78hrs_ad - AD slept 7-8 hours last night (1=7-8 hrs)
wt_f_ph_asma_y_ad double %9.0g sum of wts f_ph_asma_y_ad - AD Asthma attack or wheezing past 12 months (flag)
wt_f_ph_bp_hi double %9.0g sum of wts f_ph_bp_hi - AD high blood pressure: Systolic>=140 or Diastolic>=90
wt_f_ph_hlth_fair_ad double %9.0g sum of wts f_ph_hlth_fair_ad - AD self-rated health fair or poor (1=fair/poor)
wt_f_ph_limit_liftstair double %9.0g sum of wts f_ph_limit_liftstair - AD hlth limit lift/stair climb a little/a lot
wt_f_c9010t_perpov_dw double %9.0g sum of wts f_c9010t_perpov_dw - Duration-wgtd tract poverty
wt_x_rad_ad_male double %9.0g sum of wts x_rad_ad_male - AD male (1=male/0=female/0<x<1=imputed)
wt_x_rad_ad_le_35 double %9.0g sum of wts x_rad_ad_le_35 - AD age 35 or younger as of 12/31/07 (1=age <= 35)
wt_x_rad_ad_36_40 double %9.0g sum of wts x_rad_ad_36_40 - AD age 36 to 40 as of 12/31/07 (1=age 36-40)
wt_x_rad_ad_41_45 double %9.0g sum of wts x_rad_ad_41_45 - AD age 41 to 45 as of 12/31/07 (1=age 41-45)
wt_x_rad_ad_46_50 double %9.0g sum of wts x_rad_ad_46_50 - AD age 46 to 50 as of 12/31/07 (1=age 46-50)
wt_x_f_ad_working double %9.0g sum of wts x_f_ad_working - At baseline, AD working for pay (1=working for pay)
wt_x_f_ad_edged double %9.0g sum of wts x_f_ad_edged - At baseline, AD had a GED (1=had ged)
wt_x_f_ad_edgradhs_miss double %9.0g sum of wts x_f_ad_edgradhs_miss - Missing flag for baseline GED/H.S. diploma
wt_x_f_ad_edgradhs double %9.0g sum of wts x_f_ad_edgradhs - At baseline, AD completed high school (flag)
wt_x_f_ad_edinsch double %9.0g sum of wts x_f_ad_edinsch - At baseline, AD enrolled in school (1=in school)
wt_x_f_ad_nevmarr double %9.0g sum of wts x_f_ad_nevmarr - At baseline, AD never been married (1=never married)
wt_x_f_ad_parentu18 double %9.0g sum of wts x_f_ad_parentu18 - At baseline, AD < age 18 at birth of 1st child
wt_x_f_hood_5y double %9.0g sum of wts x_f_hood_5y - At baseline, hhhead living in nbhd. 5+ yrs (flag)
wt_x_f_hood_chat double %9.0g sum of wts x_f_hood_chat - At baseline, hhhead chatted w/ neighbor>=1x/wk (flag)
wt_x_f_hood_nbrkid double %9.0g sum of wts x_f_hood_nbrkid - At baseline, hhhead very likely tell on nbhd kid
wt_x_f_hood_nofamily double %9.0g sum of wts x_f_hood_nofamily - At baseline, hhhead has no family living in nbhd
wt_x_f_hood_nofriend double %9.0g sum of wts x_f_hood_nofriend - At baseline, hhhead has no friends living in nbhd
wt_x_f_hood_unsafenit double %9.0g sum of wts x_f_hood_unsafenit - At baseline, nbhd. streets very unsafe at night
wt_x_f_hood_verydissat double %9.0g sum of wts x_f_hood_verydissat - At baseline, hhhead very dissatisfied with nbhd
wt_x_f_hh_afdc double %9.0g sum of wts x_f_hh_afdc - At baseline, hhld receiving AFDC/TANF (1=receive welf)
wt_x_f_hh_car double %9.0g sum of wts x_f_hh_car - At baseline, hhld owned a car (1=owned a car)
wt_x_f_hh_disabl double %9.0g sum of wts x_f_hh_disabl - At baseline, a hhld member had a disability (flag)
wt_x_f_hh_noteens double %9.0g sum of wts x_f_hh_noteens - At baseline, no teens (ages 13-17) in hhld (flag)
wt_x_f_hh_size2 double %9.0g sum of wts x_f_hh_size2 - At baseline hhld size is 2 or smaller (1=size is <=2)
wt_x_f_hh_size3 double %9.0g sum of wts x_f_hh_size3 - At baseline hhld size is 3 (1=size is 3)
wt_x_f_hh_size4 double %9.0g sum of wts x_f_hh_size4 - At baseline hhld size is 4 (1=size is 4)
wt_x_f_hh_victim double %9.0g sum of wts x_f_hh_victim - At baseline, hhld member victimized past 6 mos (flag)
wt_x_f_hous_fndapt double %9.0g sum of wts x_f_hous_fndapt - At baseline, hhhead very sure of finding apt (flag)
wt_x_f_hous_mov3tm double %9.0g sum of wts x_f_hous_mov3tm - At baseline, hhhead had moved >3x in 5 yrs (1=flag)

Appendix A, continued
MTO AER P&P Article Adult Public Use File Documentation, Page 25
Variable Name Type Format Variable Label
wt_x_f_hous_movdrgs double %9.0g
sum of wts x_f_hous_movdrgs - At baseline 1st/2nd reason want to
move=drug/crime
wt_x_f_hous_movschl double %9.0g sum of wts x_f_hous_movschl - At baseline 1st/2nd reason want to move: schools
wt_x_f_hous_sec8bef double %9.0g sum of wts x_f_hous_sec8bef - At baseline, hhhead applied for Section 8 before
wt_x_f_release1 double %9.0g sum of wts x_f_release1 - Release 1 Sample AD for Final Survey (1=release 1)
predsg_perpov_dw_z float %9.0g predsg_perpov_dw_z - predicted (on site-group) dw tract share poor
predsg_pminorty_dw_z float %9.0g predsg_pminorty_dw_z - predicted (on site-group) dw tract share minority

MTO AER P&P Article Adult Public Use File Documentation, Page 26
Appendix B – Variable List for the Pseudo-Individual PUF File
(mto_aer_puf_pseudo_adult_20131025.dta)
Note that this appendix is a variable list only. For further details on the variables, please see section 5 above
(specifically Table 2), which explains the variable prefixes, as well as Appendix G, which includes detailed
documentation of the outcome and mediator measures.
obs: 3,273
vars: 74
Variable Name Type Format
Value
Label Variable Label
cell_id_ad float %9.0g cell_id_ad - number id assigned to cell
ra_group float %34.0g GROUP
ra_group - Randomization grp (1=Low-PovVouch/Exp,
2=TradVouch/Sec8, 3=Control)
ra_grp_exp float %43.0g LPV ra_grp_exp - Low-Poverty Voucher (Experimental) grp (1=LPV)
ra_grp_s8 float %43.0g TRV ra_grp_s8 - Traditional Voucher (Section 8) grp (1=TRV)
ra_grp_control float %31.0g CONTROL ra_grp_control - Control grp flag (1=control)
ra_site float %15.0g SITE
ra_site - Site (1=Baltimore/2=Boston/3=Chicago/4=Los Angeles/5=New
York City)
x_f_site_balt float %42.0g BALT x_f_site_balt - AD in Baltimore Site (1=Baltimore, 0=Not Baltimore)
x_f_site_bos float %45.0g BOS x_f_site_bos - AD in Boston Site (1=Boston, 0=Not Boston)
x_f_site_chi float %44.0g CHI x_f_site_chi - AD in Chicago Site (1=Chicago, 0=Not Chicago)
x_f_site_la float %40.0g LA x_f_site_la - AD in LA Site (1=Los Angeles, 0 = Not Los Angeles)
sgx_rasite_3g_all_nyc float %43.0g NYC sgx_rasite_3g_all_nyc - New York site, all grps (1=New York City)
mn_f_wt_totsvy float %9.0g mn_f_wt_totsvy - average of f_wt_totsvy for obs in cell
tmp_order_incell float %9.0g tmp_order_incell - order of pseudo records within cell
ps_f_svy_cmove float %9.0g
pseudo obs f_svy_cmove - Core Mover/Treatment Compliance Flag
(1=Moved)
ps_x_rad_ad_ethrace_black_nh float %9.0g
pseudo obs x_rad_ad_ethrace_black_nh - AD Black Non-Hispanic
(1=Black)
ps_x_rad_ad_ethrace_hisp float %9.0g
pseudo obs x_rad_ad_ethrace_hisp - AD Hispanic, any race
(1=Hispanic)
ps_f_all_idx_fix_z_ad float %9.0g pseudo obs f_all_idx_fix_z_ad - AD Overall Idx, zscore
ps_f_ec_idx_z_ad float %9.0g
pseudo obs f_ec_idx_z_ad - AD Economic Self-Sufficiency Idx, MTO
ctrls zscore
ps_f_ph_idx_fix_z_ad float %9.0g
pseudo obs f_ph_idx_fix_z_ad - AD Absence of Physical Health Probs
Idx, zscore
ps_f_mh_idx_z_ad float %9.0g
pseudo obs f_mh_idx_z_ad - AD Absence of Mental Health Problems
Idx, zscore
ps_f_mh_k6_raw_ad float %9.0g
pseudo obs f_mh_k6_raw_ad - AD Psychological Distress Idx (K6) (0-
24)
ps_f_mh_k6_z_ad float %9.0g pseudo obs f_mh_k6_z_ad - AD Psychological Distress Idx (K6), zscore
psbi_f_ph_bmi_obese3_srm_ad float %12.0g OBESE3
pseudo dum f_ph_bmi_obese3_srm_ad - AD obese 3 (measured/self-
reports): BMI>=40
psbi_f_ph_bmi_obese_srm_ad float %11.0g OBESE
pseudo dum f_ph_bmi_obese_srm_ad - AD obese (measured/self-
reports): BMI>=30
psbi_f_db_hba1c_diab_final float %25.0g HBA1C
pseudo dum f_db_hba1c_diab_final - AD diabetes (blood test):
HbA1c>=6.5%
psbi_f_in_selfsuf_ad float %24.0g SELFSUF
pseudo dum f_in_selfsuf_ad - AD employed and not on TANF (1=self
sufficient)

Appendix B, continued
MTO AER P&P Article Adult Public Use File Documentation, Page 27
Variable Name Type Format
Value
Label Variable Label
psbi_f_em_emp_ad float %58.0g EMP
pseudo dum f_em_emp_ad - AD employed or temporarily absent last
week (1=emp)
ps_rad_in_head2009 float %9.0g pseudo obs rad_in_head2009 - AD indiv. earnings previous yr (2009)
psbi_f_in_tanf_fam float %13.0g TANF
pseudo dum f_in_tanf_fam - AD or their kids currently on TANF (1=on
TANF)
ps_rad_in_govt2009 float %9.0g
pseudo obs rad_in_govt2009 - Govt income received by hhld previous
yr (2009)
psbi_f_mh_calm_ad float %50.0g CALM
pseudo dum f_mh_calm_ad - AD calm/peaceful most of the time past
month (1=calm)
psbi_f_mh_dep_y_ad float %33.0g DEP
pseudo dum f_mh_dep_y_ad - AD DSM-IV Major Depressive Episode
past yr (flag)
psbi_f_mh_gad_y_ad float %43.0g GAD
pseudo dum f_mh_gad_y_ad - AD DSM-IV Generalized Anxiety
Disorder past yr (flag)
psbi_f_ph_habit_sleep_78hrs_ad float %22.0g SLEEP
pseudo dum f_ph_habit_sleep_78hrs_ad - AD slept 7-8 hours last night
(1=7-8 hrs)
psbi_f_ph_asma_y_ad float %20.0g ASTHMA
pseudo dum f_ph_asma_y_ad - AD Asthma attack or wheezing past 12
months (flag)
psbi_f_ph_bp_hi float %9.0g HPB
pseudo dum f_ph_bp_hi - AD high blood pressure: Systolic>=140 or
Diastolic>=90
psbi_f_ph_hlth_fair_ad float %33.0g HEALTH
pseudo dum f_ph_hlth_fair_ad - AD self-rated health fair or poor
(1=fair/poor)
psbi_f_ph_limit_liftstair float %27.0g LIMITED
pseudo dum f_ph_limit_liftstair - AD hlth limit lift/stair climb a little/a
lot
ps_f_c9010t_perpov_dw float %9.0g pseudo obs f_c9010t_perpov_dw - Duration-wgtd tract poverty
predsg_perpov_dw_z float %9.0g predsg_perpov_dw_z - predicted (on site-group) dw tract share poor
predsg_pminorty_dw_z float %9.0g
predsg_pminorty_dw_z - predicted (on site-group) dw tract share
minority
ps_x_rad_ad_male float %9.0g
pseudo obs x_rad_ad_male - AD male
(1=male/0=female/0<x<1=imputed)
ps_x_rad_ad_le_35 float %9.0g
pseudo obs x_rad_ad_le_35 - AD age 35 or younger as of 12/31/07
(1=age <= 35)
ps_x_rad_ad_36_40 float %9.0g
pseudo obs x_rad_ad_36_40 - AD age 36 to 40 as of 12/31/07 (1=age
36-40)
ps_x_rad_ad_41_45 float %9.0g
pseudo obs x_rad_ad_41_45 - AD age 41 to 45 as of 12/31/07 (1=age
41-45)
ps_x_rad_ad_46_50 float %9.0g
pseudo obs x_rad_ad_46_50 - AD age 46 to 50 as of 12/31/07 (1=age
46-50)
ps_x_f_ad_working float %9.0g
pseudo obs x_f_ad_working - At baseline, AD working for pay
(1=working for pay)
ps_x_f_ad_edged float %9.0g pseudo obs x_f_ad_edged - At baseline, AD had a GED (1=had ged)
ps_x_f_ad_edgradhs_miss float %9.0g
pseudo obs x_f_ad_edgradhs_miss - Missing flag for baseline GED/H.S.
diploma
ps_x_f_ad_edgradhs float %9.0g
pseudo obs x_f_ad_edgradhs - At baseline, AD completed high school
(flag)
ps_x_f_ad_edinsch float %9.0g
pseudo obs x_f_ad_edinsch - At baseline, AD enrolled in school (1=in
school)
ps_x_f_ad_nevmarr float %9.0g
pseudo obs x_f_ad_nevmarr - At baseline, AD never been married
(1=never married)
ps_x_f_ad_parentu18 float %9.0g
pseudo obs x_f_ad_parentu18 - At baseline, AD < age 18 at birth of 1st
child
ps_x_f_hood_5y float %9.0g
pseudo obs x_f_hood_5y - At baseline, hhhead living in nbhd. 5+ yrs
(flag)
ps_x_f_hood_chat float %9.0g
pseudo obs x_f_hood_chat - At baseline, hhhead chatted w/
neighbor>=1x/wk (flag)
ps_x_f_hood_nbrkid float %9.0g
pseudo obs x_f_hood_nbrkid - At baseline, hhhead very likely tell on
nbhd kid
ps_x_f_hood_nofamily float %9.0g
pseudo obs x_f_hood_nofamily - At baseline, hhhead has no family
living in nbhd

Appendix B, continued
MTO AER P&P Article Adult Public Use File Documentation, Page 28
Variable Name Type Format
Value
Label Variable Label
ps_x_f_hood_nofriend float %9.0g
pseudo obs x_f_hood_nofriend - At baseline, hhhead has no friends
living in nbhd
ps_x_f_hood_unsafenit float %9.0g
pseudo obs x_f_hood_unsafenit - At baseline, nbhd. streets very unsafe
at night
ps_x_f_hood_verydissat float %9.0g
pseudo obs x_f_hood_verydissat - At baseline, hhhead very dissatisfied
with nbhd
ps_x_f_hh_afdc float %9.0g
pseudo obs x_f_hh_afdc - At baseline, hhld receiving AFDC/TANF
(1=receive welf)
ps_x_f_hh_car float %9.0g pseudo obs x_f_hh_car - At baseline, hhld owned a car (1=owned a car)
ps_x_f_hh_disabl float %9.0g
pseudo obs x_f_hh_disabl - At baseline, a hhld member had a disability
(flag)
ps_x_f_hh_noteens float %9.0g
pseudo obs x_f_hh_noteens - At baseline, no teens (ages 13-17) in hhld
(flag)
ps_x_f_hh_size2 float %9.0g
pseudo obs x_f_hh_size2 - At baseline hhld size is 2 or smaller (1=size
is <=2)
ps_x_f_hh_size3 float %9.0g pseudo obs x_f_hh_size3 - At baseline hhld size is 3 (1=size is 3)
ps_x_f_hh_size4 float %9.0g pseudo obs x_f_hh_size4 - At baseline hhld size is 4 (1=size is 4)
ps_x_f_hh_victim float %9.0g
pseudo obs x_f_hh_victim - At baseline, hhld member victimized past 6
mos (flag)
ps_x_f_hous_fndapt float %9.0g
pseudo obs x_f_hous_fndapt - At baseline, hhhead very sure of finding
apt (flag)
ps_x_f_hous_mov3tm float %9.0g
pseudo obs x_f_hous_mov3tm - At baseline, hhhead had moved >3x in
5 yrs (1=flag)
ps_x_f_hous_movdrgs float %9.0g
pseudo obs x_f_hous_movdrgs - At baseline 1st/2nd reason want to
move=drug/crime
ps_x_f_hous_movschl float %9.0g
pseudo obs x_f_hous_movschl - At baseline 1st/2nd reason want to
move: schools
ps_x_f_hous_sec8bef float %9.0g
pseudo obs x_f_hous_sec8bef - At baseline, hhhead applied for Section
8 before
ps_x_f_release1 float %9.0g
pseudo obs x_f_release1 - Release 1 Sample AD for Final Survey
(1=release 1)

MTO AER P&P Article Adult Public Use File Documentation, Page 29
Appendix C – Program Code Showing the Collapse and Expansion of the Data
Code Snippets (from 01_aer_ad_cellpuf_colexp_20131025.do):
************************************************
**** Step 2. Set variable lists ****
************************************************
* set weight variable
global wtvar f_wt_totsvy
* set compliance var
global movevar f_svy_cmove
* site interacted with the two treatment groups
global sgx_ex sgx_rasite_ex_all_bal sgx_rasite_ex_all_bos sgx_rasite_ex_all_chi
sgx_rasite_ex_all_la sgx_rasite_ex_all_nyc
global sgx_s8 sgx_rasite_s8_all_bal sgx_rasite_s8_all_bos sgx_rasite_s8_all_chi
sgx_rasite_s8_all_la sgx_rasite_s8_all_nyc
* site covariates
global sitecovs x_f_site_balt x_f_site_bos x_f_site_chi x_f_site_la
sgx_rasite_3g_all_nyc
* categorical site and treatment variables
global categvar ra_site ra_group
* treatment group flags *
global treatvar ra_grp_exp ra_grp_s8 ra_grp_control
* Indices
global idxvars f_mh_idx_z_ad f_ph_idx_fix_z_ad f_ec_idx_z_ad
* Mental health index components
global mhvars f_mh_k6_raw_ad f_mh_dep_y_ad f_mh_gad_y_ad f_mh_calm_ad
f_ph_habit_sleep_78hrs_ad
* Physical health index components
global phvars f_ph_hlth_fair_ad f_ph_asma_y_ad f_ph_bmi_obese_srm_ad f_ph_bp_hi
f_ph_limit_liftstair
* Economic self-sufficiency index components
global ecvars rad_in_head2009 rad_in_govt2009 f_in_selfsuf_ad f_em_emp_ad
f_in_tanf_fam
* Share poor in tract
global povvars f_c9010t_perpov_dw
* Outcome variables need a shorter labels to be created
global no_labels f_all_idx_fix_z_ad f_ph_bmi_obese3_srm_ad f_db_hba1c_diab_final
f_mh_k6_z_ad
* create COMBINED list of adult outcomes needed for the AER (that are not binary)

Appendix C, continued
MTO AER P&P Article Adult Public Use File Documentation, Page 30
global aer_adult $idxvars $phvars $mhvars $ecvars $povvars $no_labels
* Covariates controlled for in aer adult analysis (other than site) (AppTable1)
global xcov_adult x_rad_ad_male x_rad_ad_le_35 x_rad_ad_36_40 x_rad_ad_41_45
x_rad_ad_46_50 x_rad_ad_ethrace_black_nh x_rad_ad_ethrace_hisp ///
x_f_ad_working x_f_ad_edged x_f_ad_edgradhs_miss x_f_ad_edgradhs
x_f_ad_edinsch x_f_ad_nevmarr x_f_ad_parentu18 ///
x_f_hood_5y x_f_hood_chat x_f_hood_nbrkid x_f_hood_nofamily
x_f_hood_nofriend x_f_hood_unsafenit x_f_hood_verydissat ///
x_f_hh_afdc x_f_hh_car x_f_hh_disabl x_f_hh_noteens x_f_hh_size2
x_f_hh_size3 x_f_hh_size4 x_f_hh_victim ///
x_f_hous_fndapt x_f_hous_mov3tm x_f_hous_movdrgs x_f_hous_movschl
x_f_hous_sec8bef x_f_release1
* Variables that already have a shorter labels
global yes_labels $wtvar $movevar $sgx_ex $sgx_s8 $sitecovs $categvar $treatvar
$idxvars $mhvars $phvars $ecvars $povvars $xcov_adult
* Variables that need a dummy version
global dummyvar f_ph_bmi_obese3_srm_ad f_db_hba1c_diab_final ///
f_in_selfsuf_ad f_em_emp_ad f_in_tanf_fam ///
f_ph_hlth_fair_ad f_ph_asma_y_ad f_ph_bmi_obese_srm_ad f_ph_bp_hi
f_ph_limit_liftstair ///
f_mh_dep_y_ad f_mh_gad_y_ad f_mh_calm_ad f_ph_habit_sleep_78hrs_ad
* site-group predicted variables
global predsgvar predsg_perpov_dw_z predsg_pminorty_dw_z
...
*****************************
**** Step 6. Prepare data for collapsing by creating additional variables
*****************************
/* This step uses cell_id_ad to aggregate the data. The resulting cell-level file
will contain:
cell_id,
raw count of obs,
sum of cell weights,
mean and standard deviation and sum of weights for outcome and mediator variables,
means for site-group predicted neighborhood characteristics (such as poverty and
share minority),
mean for African-American Non-Hispanic, and
means for key analysis variables such as ra_site, ra_group, core move, and site
dummies.
As cells should be homogenous by site and group, the means of these key vars should
only take the usual values (1-5 and 1-3).
We need the sum of weights for outcomes and mediators since these variables can
have missing values.
We need the std dev for variables of interest such as the outcomes, mediators, and
perhaps baseline characteristics because they will be used to estimate
the std errors.

Appendix C, continued
MTO AER P&P Article Adult Public Use File Documentation, Page 31
*/
**** Step 6a. Create copies of variables with new prefixes to save mean, sd, and
sum of weights for raech variable ****
* FOR EACH OUTCOME, create 3 new variables to use in the collapse:
* wt_{outcomename} contains the weights for obs that have non-missing values for
the outcome. wt_* will be rawsum'd in the collapse.
* sd_{outcomename} contains copy of outcome values. In the collapse these will be
replaced with the weighted standard deviation of the outcome within the cell.
* mn_{outcomename} contains copy of outcome values. In the collapse these will be
replaced with the weighted mean value of the outcome within the cell.
foreach X of varlist $aer_adult $xcov_adult $movevar {
gen wt_`X' = ${wtvar} if missing(`X') ~= 1
gen sd_`X' = `X'
gen mn_`X' = `X'
}
**** Step 6b. Predict share poor and shaer minority using site-group ****
** poverty prediction
regress f_c9010t_perpov_dw_z ${sgx_ex} ${sgx_s8} x_f_site_balt x_f_site_bos
x_f_site_chi x_f_site_la [pw = $wtvar]
predict predsg_perpov_dw_z if e(sample)
label var predsg_perpov_dw_z "predsg_perpov_dw_z - predicted (on site-group) dw
tract share poor"
** minority prediction
regress f_c9010t_pminorty_dw_z ${sgx_ex} ${sgx_s8} x_f_site_balt x_f_site_bos
x_f_site_chi x_f_site_la [pw = $wtvar]
predict predsg_pminorty_dw_z if e(sample)
label var predsg_pminorty_dw_z "predsg_pminorty_dw_z - predicted (on site-group)
dw tract share minority"
**** Step 6c. Save full variable labels ****
foreach var of varlist $aer_adult $xcov_adult $sitecovs $categvar $treatvar
$predsgvar f_svy_cmove {
local lb`var': var label `var'
}
...
******************************
**** Step 8. Collapse the data by cell_id and save weighted means and standard
deviations, sum of weights, and obseration counts.
******************************
* collapse data to create cell means, std devs, and sum of wgts for each variable
and for each cell a count of obs and raw sum of weights
* note that $predsgvar $sitecovs $categvar and $treatvar are homog by cell so these
will be preserved with original name (even though created using "mean")
#delimit;
collapse
(mean) mn_* $predsgvar $sitecovs $categvar $treatvar
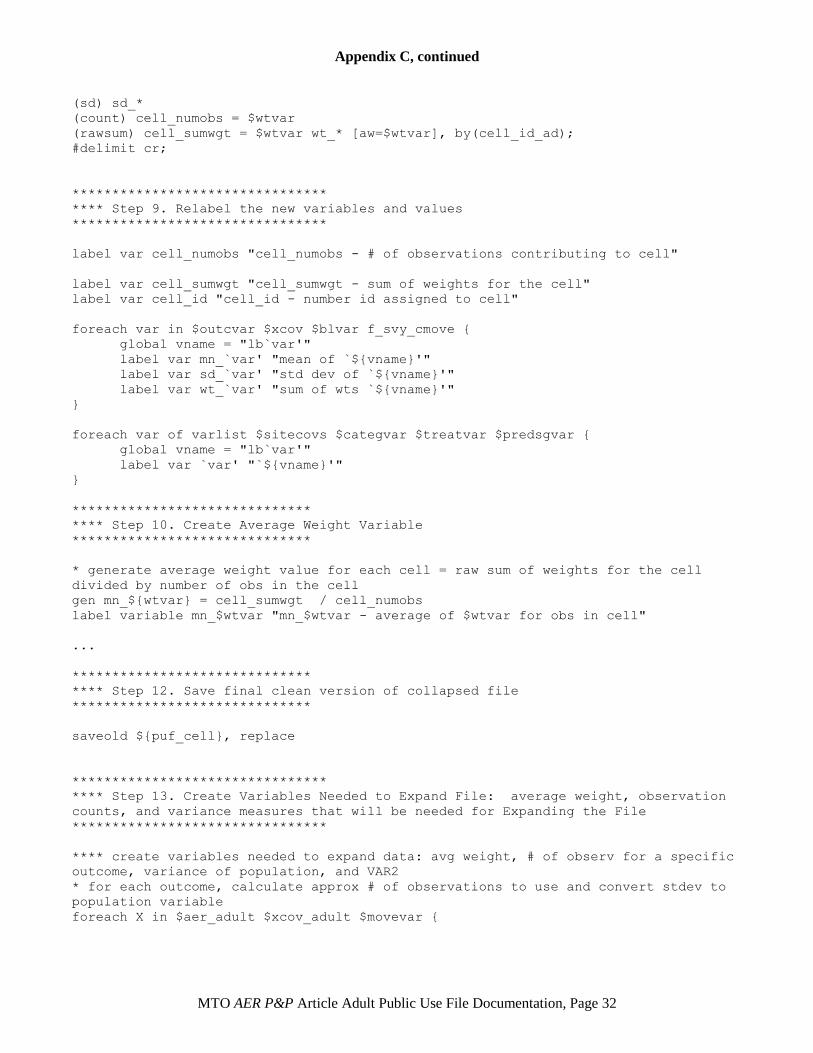
Appendix C, continued
MTO AER P&P Article Adult Public Use File Documentation, Page 32
(sd) sd_*
(count) cell_numobs = $wtvar
(rawsum) cell_sumwgt = $wtvar wt_* [aw=$wtvar], by(cell_id_ad);
#delimit cr;
********************************
**** Step 9. Relabel the new variables and values
********************************
label var cell_numobs "cell_numobs - # of observations contributing to cell"
label var cell_sumwgt "cell_sumwgt - sum of weights for the cell"
label var cell_id "cell_id - number id assigned to cell"
foreach var in $outcvar $xcov $blvar f_svy_cmove {
global vname = "lb`var'"
label var mn_`var' "mean of `${vname}'"
label var sd_`var' "std dev of `${vname}'"
label var wt_`var' "sum of wts `${vname}'"
}
foreach var of varlist $sitecovs $categvar $treatvar $predsgvar {
global vname = "lb`var'"
label var `var' "`${vname}'"
}
******************************
**** Step 10. Create Average Weight Variable
******************************
* generate average weight value for each cell = raw sum of weights for the cell
divided by number of obs in the cell
gen mn_${wtvar} = cell_sumwgt / cell_numobs
label variable mn_$wtvar "mn_$wtvar - average of $wtvar for obs in cell"
...
******************************
**** Step 12. Save final clean version of collapsed file
******************************
saveold ${puf_cell}, replace
********************************
**** Step 13. Create Variables Needed to Expand File: average weight, observation
counts, and variance measures that will be needed for Expanding the File
********************************
**** create variables needed to expand data: avg weight, # of observ for a specific
outcome, variance of population, and VAR2
* for each outcome, calculate approx # of observations to use and convert stdev to
population variable
foreach X in $aer_adult $xcov_adult $movevar {

Appendix C, continued
MTO AER P&P Article Adult Public Use File Documentation, Page 33
* set number of observations for the outcome within the cell to yield sum of
weights as close to actual total as possible
gen ob_`X' = round(cell_numobs * (wt_`X'/(mn_${wtvar}*cell_numobs)))
label variable ob_`X' "ob_`X' - approx. # of obs for variable"
* convert stdev of sample to variance of population for each outcome
gen vr_`X' = (sd_`X')^2*((ob_`X' -1)/ob_`X' )
label variable vr_`X' "vr_`X' - variance of popul for the outcome"
* set VAR2
gen v2_`X' = ((vr_`X' * ob_`X' )/2)^0.5
label variable v2_`X' "v2_`X' - var2 for the outcome"
}
********************************
**** Step 14. Expand Collapsed PUF file to Pseudo-Individual Data and Reset Values
for Outcomes to Mimic Mean, SD, and N of Individual-Level Data
********************************
**** 14a. Expand the cell-level data to pseudo-individual
* expand data by the number of observations in each cell (the number of
observations in each cell)
expand cell_numobs
sum mn_$wtvar
**** 14b. create a variable that is the record number (order) of each expanded
observation within that cell
sort cell_id_ad
by cell_id_ad: gen tmp_order_incell = _n
label var tmp_order_incell "tmp_order_incell - order of pseudo records within cell"
**** 14c. Loop through each outcome and create and label a new pseudo individual
outcome (ps_*) that has same approx n, mean, and sd as actual data
**** by replacing first obs of cell with higher value, 2nd obs with lower
value, and blank out any cells beyond approx cell count.
foreach X in $outcvar $xcov $blvar $movevar {
rename mn_`X' ps_`X'
* relabel variables
global vname = "lb`X'"
label var ps_`X' "pseudo obs `${vname}'"
* set first observation within cell to a value that is VAR2 distance ABOVE
the mean
replace ps_`X' = ps_`X' + v2_`X' if tmp_order_incell == 1
* set 2nd observation within cell to a value that is VAR2 distance BELOW the
mean
replace ps_`X' = ps_`X' - v2_`X' if tmp_order_incell == 2
* blank out values beyond the number of obs in the cell that represent valid
data for that outcome (e.g., if only 14 records had DBS data and the cell has
16 records, set records 15 and 16 to blank on dbs)
replace ps_`X' = . if tmp_order_incell > ob_`X'
}
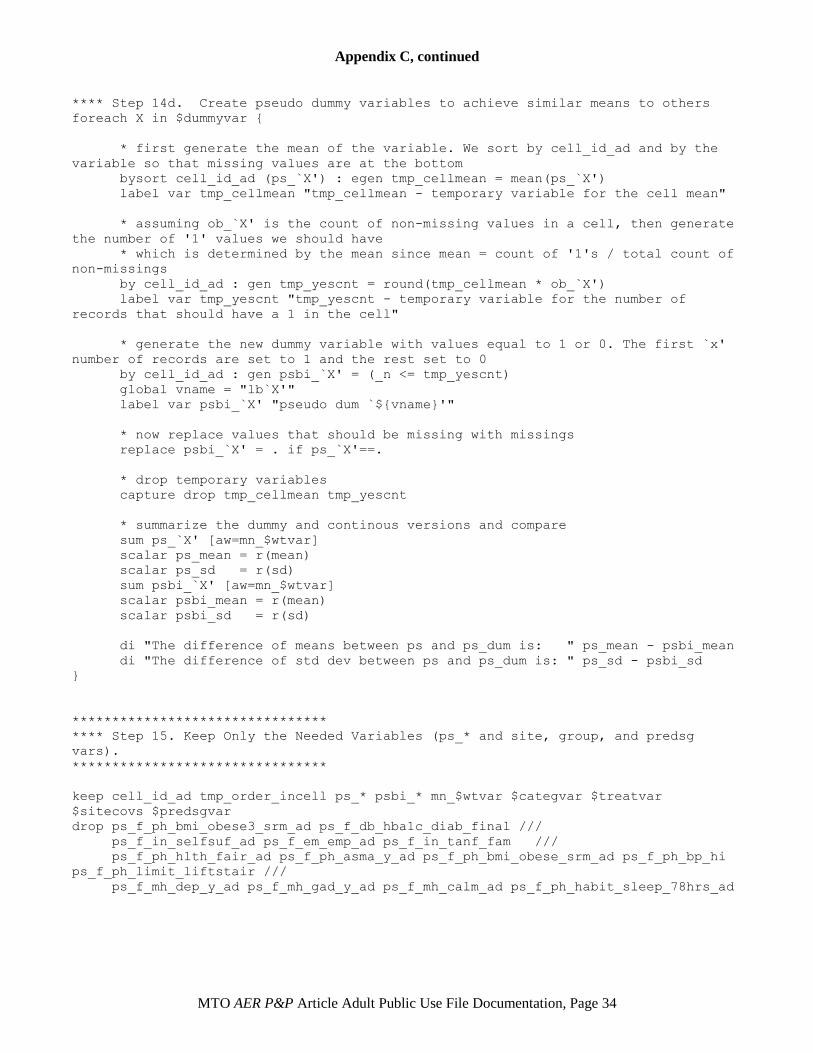
Appendix C, continued
MTO AER P&P Article Adult Public Use File Documentation, Page 34
**** Step 14d. Create pseudo dummy variables to achieve similar means to others
foreach X in $dummyvar {
* first generate the mean of the variable. We sort by cell_id_ad and by the
variable so that missing values are at the bottom
bysort cell_id_ad (ps_`X') : egen tmp_cellmean = mean(ps_`X')
label var tmp_cellmean "tmp_cellmean - temporary variable for the cell mean"
* assuming ob_`X' is the count of non-missing values in a cell, then generate
the number of '1' values we should have
* which is determined by the mean since mean = count of '1's / total count of
non-missings
by cell_id_ad : gen tmp_yescnt = round(tmp_cellmean * ob_`X')
label var tmp_yescnt "tmp_yescnt - temporary variable for the number of
records that should have a 1 in the cell"
* generate the new dummy variable with values equal to 1 or 0. The first `x'
number of records are set to 1 and the rest set to 0
by cell_id_ad : gen psbi_`X' = (_n <= tmp_yescnt)
global vname = "lb`X'"
label var psbi_`X' "pseudo dum `${vname}'"
* now replace values that should be missing with missings
replace psbi_`X' = . if ps_`X'==.
* drop temporary variables
capture drop tmp_cellmean tmp_yescnt
* summarize the dummy and continous versions and compare
sum ps_`X' [aw=mn_$wtvar]
scalar ps_mean = r(mean)
scalar ps_sd = r(sd)
sum psbi_`X' [aw=mn_$wtvar]
scalar psbi_mean = r(mean)
scalar psbi_sd = r(sd)
di "The difference of means between ps and ps_dum is: " ps_mean - psbi_mean
di "The difference of std dev between ps and ps_dum is: " ps_sd - psbi_sd
}
********************************
**** Step 15. Keep Only the Needed Variables (ps_* and site, group, and predsg
vars).
********************************
keep cell_id_ad tmp_order_incell ps_* psbi_* mn_$wtvar $categvar $treatvar
$sitecovs $predsgvar
drop ps_f_ph_bmi_obese3_srm_ad ps_f_db_hba1c_diab_final ///
ps_f_in_selfsuf_ad ps_f_em_emp_ad ps_f_in_tanf_fam ///
ps_f_ph_hlth_fair_ad ps_f_ph_asma_y_ad ps_f_ph_bmi_obese_srm_ad ps_f_ph_bp_hi
ps_f_ph_limit_liftstair ///
ps_f_mh_dep_y_ad ps_f_mh_gad_y_ad ps_f_mh_calm_ad ps_f_ph_habit_sleep_78hrs_ad

Appendix C, continued
MTO AER P&P Article Adult Public Use File Documentation, Page 35
********************************
**** Step 16. Save expanded file as STATA and SAS datasets
********************************
saveold ${puf_pseudo}, replace

MTO AER P&P Article Adult Public Use File Documentation, Page 36
Appendix D – Stata Code for Estimating Intention-to-Treat Effects
Using the AER P&P PUF
/*
PROGRAM: 02_aer_ad_pseudopuf_itt_20131118.do
AUTHOR: Ray Yun Gou
Purpose: This program provides code for replicating the Moving to Opportunity final
evaluation Intention-to-treat (ITT)
effects and associated statistics for the outcomes shown in Table 1 in the American
Economic Review Papers & Proceedings
article by J. Ludwig et al. entitled "Long-term Neighborhoods Effects on Low-Income
Families: Evidence from Moving to
Opportunity" (May 2013), using a public use pseudo-individual data file.
The sample consists of MTO adults interviewed for the 10-15 year evaluation of MTO
(n = 3273). Researchers
can access the data at http://www.nber.org/mtopuf/ and eventually at ICPSR
(http://icpsr.umich.edu).
The program loops through a list of variables covering the outcome indices and
additional physical and mental health
outcomes in Table 1 of the AER P&P article as well as the components of the
indices, which are presented in the appendix
to the article. For each of these measures, the program calculates the control mean
as well as the intention-to-treat
estimate and its 95% confidence interval, the p-value, and the mean for both the
Experimental and Section 8 treatment groups.
The program creates the following outputs which are logged to a CSV file:
**** Control Mean:
The control mean is calculated as a weighted mean using the weight mn_f_wt_totsvy
for particpants in the control group (ra_group=3 or ra_grp_control=1).
**** Treatment Group Mean:
The mean for each treatment group (the Experimental Group and the Section 8 Group)
is calculated as the weighted mean
using the weight mn_f_wt_totsvy (Experimental Group is ra_group=1 or ra_grp_exp=1,
Section 8 Group is ra_group=2 or ra_grp_s8=1).
**** Intention-to-treat (ITT) effect, 95% confidence interval, Standard Error, T-
statistic, and P-value
The ITT effect and its associated statistics are calculated using an OLS regression
that includes indicators for MTO randomization
site as covariates and that are p-weighted (using mn_f_wt_totsvy).
STEPS:
1. Set options, program directories, and names of the input and output files
1a. Set STATA Version
1b. Set options
1c. Set dataset to use
1d. Set output file

Appendix D, continued
MTO AER P&P Article Adult Public Use File Documentation, Page 37
2. Define globals for weight variable and list of outcomes
2a. Define weight global
2b. Define outcomes global
3. Open Expanded Pseudo Individual Public Use File
4. Open CSV results file and write column header names
4a. Create file link to CSV results file for ITT results
4b. Write column headers to CSV results file for ITT results
5. Calculate ITTs and associated statistics for each outcome
5a. Open loop to calculate ITTs for each outcome defined in the global
$outcomes
5b. Calculate weighted control mean for the outcome and store value
5c. Calculate the weighted mean for the Experimental treatment group for the
outcome
5d. Calculate the Experimental treatment group ITT impact on the outcome
using a linear regression model
5e. Store the Experimental group ITT results as scalars or local variables
and calculate p-value, set significance symbols, and save results as scalars
5f. Calculate the weighted mean for the Section 8 treatment group for the
outcome
5g. Calculate the Section 8 treatment group ITT impact on the outcome using a
linear regression model
5h. Store the Section 8 group ITT results as scalars or local variables and
calculate p-value, set significance symbols, and save results as scalars
5i. Calculate overall N for the outcome and store value
5j. Write results for the outcome to CSV results file
6. Close CSV results file
7. Print date and time
*/
**************************************************************************
**** STEP 1: Set options, program directories, and names of the input and output
files ****
**************************************************************************
**** 1a. Set STATA version ****
version 12
**** 1b. Set options ****
clear all
set more off
set maxvar 10000
set linesize 255
**** 1c. Set dataset to use ****
global data http://www.nber.org/mtopuf/mto_aer_ad_puf_pseudo_20131025.dta
* !!!! USER MUST UPDATE DIRECTORY OF OUTPUT FILE AND DATE !!!!
**** 1d. Set output file ****
* Set today's date for dating the log
global todaydt 20131118
* Set name of log file
global pgmdir ~/mtoproj/m10_pgm/papers/icpsr_archive/aer_ad/outputs/
global logname "${pgmdir}02_aer_ad_pseudo_itt_${todaydt}.csv"
* !!!! END NECESSARY USER-SET OPTIONS !!!!

Appendix D, continued
MTO AER P&P Article Adult Public Use File Documentation, Page 38
************************************************************
**** STEP 2: Define globals for weight variable and list of outcomes ****
************************************************************
**** 2a. Define weight global ****
global weight mn_f_wt_totsvy
**** 2b. Define outcomes global ****
#delimit ;
global outcomes
ps_f_mh_idx_z_ad ps_f_ph_idx_fix_z_ad ps_f_ec_idx_z_ad
ps_f_all_idx_fix_z_ad ps_f_mh_k6_z_ad psbi_f_ph_bmi_obese3_srm_ad
psbi_f_db_hba1c_diab_final
ps_f_c9010t_perpov
psbi_f_mh_dep_y_ad psbi_f_mh_gad_y_ad psbi_f_mh_calm_ad
ps_f_mh_k6_raw_ad psbi_f_ph_habit_sleep_78hrs_ad
psbi_f_ph_hlth_fair_ad psbi_f_ph_asma_y_ad psbi_f_ph_bmi_obese_srm_ad
psbi_f_ph_bp_hi psbi_f_ph_limit_liftstair
psbi_f_em_emp_ad ps_rad_in_govt2009 ps_rad_in_head2009
psbi_f_in_selfsuf_ad psbi_f_in_tanf_fam ;
#delimit cr
*****************************************************************
**** STEP 3: Open Expanded Pseudo Individual Public Use File ****
*****************************************************************
use ${data}, clear
*********************************************************************
**** STEP 4: Open CSV results file and write column header names ****
*********************************************************************
**** 4a. Create file link to CSV results file for ITT results ****
file open csvlog using "$logname", write replace
**** 4b. Write column headers to CSV results file for ITT results ****
file write csvlog
"lookup,variable,abbr,c_mean,ex_n,ex_itt,ex_ittsig,ex_se,ex_pv,ex_mean,s8_n,s8_itt,
s8_ittsig,s8_se,s8_pv,s8_mean,N,"
***************************************************************************
**** STEP 5: Calculate ITTs and associated statistics for each outcome ****
***************************************************************************
**** 5a. Open loop to calculate ITTs for each outcome defined in the global
$outcomes ****
foreach outcome of varlist $outcomes {
**** 5b. Calculate weighted control mean for the outcome and store value ****
sum `outcome' [aw=${weight}] if ra_group==3
* set scalar to control mean

Appendix D, continued
MTO AER P&P Article Adult Public Use File Documentation, Page 39
scalar cmean = r(mean)
**** 5c. Calculate the weighted mean for the Experimental treatment group for the
outcome ****
sum `outcome' [aw=${weight}] if ra_group==1
scalar ex_mean = r(mean)
**** 5d. Calculate the Experimental treatment group ITT impact on the outcome using
a linear regression model ****
* regress variable against the treatment group indicator and controlling for
randomization site
regress `outcome' ra_grp_exp x_f_site_balt x_f_site_bos x_f_site_chi
x_f_site_la [pw=${weight}] if ra_group~=2
**** 5e. Store Experimental group ITT results as scalars or local variables and
calculate p-value, set significance symbols, and save results as scalars ****
* save ITT estimate
scalar ex_itt = _b[ra_grp_exp]
* save robust standard error (for ITT)
scalar ex_ittse = _se[ra_grp_exp]
* calculat the t-statistic
scalar ex_tsta = ex_itt / ex_ittse
* analytic N
scalar ex_n = e(N)
* degrees of freedom
scalar ex_df_r = e(df_r)
* Calculate p value
scalar ex_ittpv = ttail( ex_df_r, abs( ex_tsta ))*2
* Set significance symbols
if ex_ittpv < .01 {
local ex_ittsig ***
}
else if ex_ittpv < .05 {
local ex_ittsig **
}
else if ex_ittpv < .1 {
local ex_ittsig *
}
else {
local ex_ittsig
}
**** 5f. Calculate the weighted mean for the Section 8 treatment group for the
outcome ****
sum `outcome' [aw=${weight}] if ra_group==2
scalar s8_mean = r(mean)

Appendix D, continued
MTO AER P&P Article Adult Public Use File Documentation, Page 40
**** 5g. Calculate the Section 8 treatment group ITT impact on the outcome using a
linear regression model ****
* regress variable against the treatment group indicator and controlling for
randomization site
regress `outcome' ra_grp_s8 x_f_site_balt x_f_site_bos x_f_site_chi x_f_site_la
[pw=${weight}] if ra_group~=1
**** 5h. Store the Section 8 group ITT results as scalars or local variables and
calculate p-value, set significance symbols, and save results as scalars ****
* save ITT estimate
scalar s8_itt = _b[ra_grp_s8]
* save robust standard error (for ITT)
scalar s8_ittse = _se[ra_grp_s8]
* calculat the t-statistic
scalar s8_tsta = s8_itt / s8_ittse
* analytic N
scalar s8_n = e(N)
* degrees of freedom
scalar s8_df_r = e(df_r)
* Calculate p value
scalar s8_ittpv = ttail(s8_df_r, abs( s8_tsta ))*2
* Set significance symbols
if s8_ittpv < .01 {
local s8_ittsig ***
}
else if s8_ittpv < .05 {
local s8_ittsig **
}
else if s8_ittpv < .1 {
local s8_ittsig *
}
else {
local s8_ittsig
}
**** 5i. Calculate overall N for the outcome and store value ****
sum `outcome' [aw=${weight}]
* set scalar to overall N
scalar N = r(N)
**** 5j. Write results for the outcome to CSV results file ****
file write csvlog "`outcome'_Adults_sep,`outcome',_Adults_sep, " %20.3f (cmean)
"," ///
%20.0f (ex_n) "," %20.3f (ex_itt) ", `ex_ittsig'," %20.3f (ex_ittse) "," %20.3f
(ex_ittpv) "," %20.3f (ex_mean) "," ///

Appendix D, continued
MTO AER P&P Article Adult Public Use File Documentation, Page 41
%20.0f (s8_n) "," %20.3f (s8_itt) ", `s8_ittsig'," %20.3f (s8_ittse) "," %20.3f
(s8_ittpv) "," %20.3f (s8_mean) "," %20.3f (N) "," _n
}
****************************************
**** STEP 6: Close CSV results file ****
****************************************
file close csvlog
*************************************
**** STEP 7: Print date and time ****
*************************************
disp "Program End on " c(current_date) " at " c(current_time)

MTO AER P&P Article Adult Public Use File Documentation, Page 42
Appendix E – Stata Code Used to Create the Outcome Indices
Used in the AER P&P Article
The code below creates the “mkindex” program that is referenced in the code shown in the detailed coding for key
variables in Appendix G.
capture program drop mkindex
program define mkindex
syntax varlist(max=30) [pw] [if] , [iname(name)]
* varlist is the variables to include in index
* accepts pweights
* accepts new name for index
* accepts "if" statement to identify the sample
* ra_group MUST BE DEFINED.
di "index to create: `iname'"
di "vars to put in index: `varlist'"
di "type of weight: `weight'"
di "actual weight: `exp'"
*di "sample restriction: " sub`if'
* mark records to use in creating the index *
tempvar touse
mark `touse' `if'
count if `touse'
* creating temporary variables for the index (y) and counter of # of non-missing
outcomes (n)
tempvar y n
gen `y' = 0
gen `n' = 0
* START LOOP THROUGH EACH OUTCOME TO INCLUDE IN INDEX
foreach v of varlist `varlist' {
di "`v'"
* standardize the outcome using the control groups mean and std deviation
* set temporary variable for mean value for that sample and treatment group
tempvar mv
gen `mv'=0
* start RA group index
forvalues i = 1/3 {
* set mean to that ra group's mean if it matches the person's ra group assignment
sum `v' [aw `exp'] if ra_group==`i' & `touse'
replace `mv' = r(mean) if ra_group==`i' & `touse'
}
* end RA group index
sum `v' [aw `exp'] if ra_group==3 & `touse'
* if outcome is not missing, standardize the outcome, if missing then use mean for
that treatment group
capture drop chk_`v'

Appendix E, continued
MTO AER P&P Article Adult Public Use File Documentation, Page 43
gen chk_`v' = cond( (inlist(`v', ., .d, .r) == 0) ,( (`v'-
r(mean))/r(sd) ), ( (`mv'-r(mean))/r(sd) ) ) if `touse'
qui replace `y' = `y' + cond( (inlist(`v', ., .d, .r) == 0) ,( (`v'-
r(mean))/r(sd) ), ( (`mv'-r(mean))/r(sd) ) ) if `touse'
* update counter of outcomes in the index for an individual
qui replace `n' = `n' + (inlist(`v', ., .d, .r) == 0) if `touse'
}
qui sum `n'
* set final index value to sum of the standardized values divided by # of non-
missing items
capture drop `iname'
gen `iname' = `y'/r(max) if `n'>0 & `touse'
end
* The format for calling the “mkindex” program is:
* mkindex my_outcome_vars_to_include_in_index [pw= my_weight_var ] if
my_sample_spec ,
iname ( my_name_for_index)

MTO AER P&P Article Adult Public Use File Documentation, Page 44
Appendix F – Detailed Documentation for the Mental Health Disorder Outcomes
Included in the AER P&P Article
This appendix describes the construction of the major depression in the past year (f_mh_dep_y_ad) and
Generalized Anxiety Disorder (GAD) in the past year (f_mh_gad_y_ad) variables that were components of the
mental health index (f_mh_idx_z_ad) that was presented in the AER P&P article. Also included below is
information about the construction of bipolar and related disorder variables, which were used in the construction
of the depression and GAD measures. General information about these two variables can be found in Appendix G.
DSM-IV Major Depressive Episode
A. Five(or more) of the following symptoms have been present during the same 2-week period and represent a
change from previous functioning; at least one of the symptoms is either (1) depressed mood or (2) loss of
interest or pleasure. Note: DSM-IV states that children and adolescents may be “irritable rather than sad”.
This is not operationalized when examining adults who report symptoms from childhood.
Part 1 AND Part 2.
Part 1. Symptoms have been present during the same 2 week period and at least one of the symptoms is
either(1) depressed mood or (2) loss of interest or pleasure.
(HDE6b_D22b >= 2 weeks OR HDE6e_D22d >= 2 weeks) AND
(HDE7a_D24a is Yes(1) OR HDE7b_D24c is Yes(1) OR HDE7c_D24e is Yes(1) OR
HDE7d_D24f is Yes(1))
Note: D24b, D24d, D39 are deleted from NCSR.
Part 2. least five of the following symptoms must be present and represent a change from previous
functioning:
Note: “change from previous functioning” is implicit in the item corresponding to each symptom (e.g.
“more than usual”, “less than usual”).
1. depressed mood most of the day, nearly every day, as indicated by either subjective report(e.g.,
feels sad or empty) or observation made by others.
HDE7a_D24a is Yes(1) OR HDE7b_D24c is Yes(1).
Note D24b, D24d are deleted from NCSR.
2. markedly diminished interest or pleasure in all, or almost all, activities most of the day, nearly
every day(as indicated by either subjective account or observation made by others)
HDE7c_D24e is Yes(1) OR HDE7d_D24f is Yes(1).
3. significant weight loss when not dieting or weight gain (e.g., a change of more than 5% of body
weight in a month), or decrease or increase in appetite nearly every day.

Appendix F, continued
MTO AER P&P Article Adult Public Use File Documentation, Page 45
HDE9a_D26a is Yes(1) OR HDE9b_D26b is Yes(1) OR HDE9c_D26c is Yes(1) OR
HDE9d_D26e is Yes(1).
Note D26d, D26f(weight gain, loss) deleted from NCSR.
4. insomnia or hypersomnia nearly every day.
HDE9e_D26g is Yes(1) OR HDE9f_D26h is Yes(1).
5. psychomotor agitation or retardation nearly every day(observable by others, not merely subjective
feelings of restlessness or being slowed down).
HDE9i_D26m is Yes(1) OR HDE9k_D26o is Yes(1).
6. fatigue or loss of energy nearly every day.
HDE9g_D26j is Yes(1).
7. feelings of worthlessness or excessive or inappropriate guilt(which may be delusional) nearly
every day(not merely self-reproach or guilt about being sick)
HDE9o_D26u is Yes(1).
8. diminished ability to think or concentrate, or indecisiveness, nearly every day(either by subjective
account or as observed by others)
HDE9l_D26p is Yes(1) OR HDE9m_D26r is Yes(1) OR HDE9n_D26s is Yes(1).
9. recurrent thoughts of death (not just fear of dying), recurrent suicidal ideation without a specific
plan, or a suicide attempt or a specific plan for committing suicide.
HDE9p_D26aa is Yes(1) OR HDE9q_D26bb is Yes(1) OR HDE9r_D26cc is Yes(1).
Note: Respondents leave D24, D26 series after 5 of the following symptoms endorsed:
(1) IF HDE7a_D24a OR HDE7b_D24c IS CODED ‘1’ (YES) INCREMENT COUNT BY ONE.
(2) IF HDE7c_D24e OR HDE7d_D24f IS CODED ‘1’ (YES) INCREMENT COUNT BY ONE.
(3) IF HDE9a_D26a OR HDE9b_D26b IS CODED ‘1’ (YES) INCREMENT COUNT BY ONE.
(4) If HDE9c_D26c OR HDE9d_D26d IS CODED ‘1’ (YES) INCREMENT COUNT BY ONE
(5) IF HDE9e_D26g OR HDE9f_D26h IS CODED ‘1’ (YES) INCREMENT COUNT BY ONE.
(6) IF HDE9g_D26j IS CODED ‘1’ (YES) INCREMENT COUNT BY ONE.
(7) IF HDE9i_D26m OR HDE9k_D26o IS CODED ‘1’ (YES) INCREMENT COUNT BY ONE.
(8) IF HDE9l_D26p OR HDE9m_D26r OR HDE9n_D26s IS CODED ‘1’ (YES) INCREMENT
COUNT BY ONE.
(9) IF HDE9o_D26u IS CODED ‘1’ (YES) INCREMENT COUNT BY ONE.
(10) IF HDE9p_D26aa OR HDE9q_D26bb OR HDE9r_D26cc IS CODED ‘1’ (YES) INCREMENT
COUNT BY ONE.
If respondent has 4 of 9 DSM-IV Criteria A part 2 symptoms and
sum(HDE9a_D26a = 1 or HDE9b_D26b = 1,HDE9c_D26c = 1 or HDE9d_D26e = 1) = 2 and
HDE9p_D26aa is missing then respondent meets Criteria A Part 2.

Appendix F, continued
MTO AER P&P Article Adult Public Use File Documentation, Page 46
B. The symptoms do not meet criteria for a Mixed Episode
Not operationalized.
C. Part 1 OR Part 2.
Part 1. The symptoms cause clinically significant distress.
HDE12_D17 is (2,3,4).
Note: D18, D19, D24b deleted from NCSR.
Part 2. The symptoms cause clinically significant impairment in social, occupational, or other important
areas of functioning.
HDE11_D28 is (3,4,5)
Note D28a, D66a-d deleted from NCSR.
D. The symptoms are not due to the direct physiological effects of a substance (e.g., a drug of abuse, a
medication), or are not due to a general medical condition. NOTE: D29b is used as an initial screener only.
All open ended items are reviewed by a clinician to determine organic exclusion.
Note: D29a, D29b deleted from NCSR, criteria not operationalized.
E. Part 1 OR Part 2 OR Part 3
Part 1. The symptoms are not better accounted for by Bereavement.
Not operationalized.
Part 2. If the symptoms are associated with bereavement, they persist for longer than two months
Not operationalized
Part 3. If the symptoms are associated with bereavement, they are characterized by (a) marked functional
impairment, (b) morbid preoccupation with worthlessness, (c) suicidal ideation, (d) psychotic symptoms,
or (e) psychomotor retardation. At least one of a-e must be present.
Not operationalized
NOTE: D23 was deleted from the instrument therefore the bereavement criteria could not be operationalized.
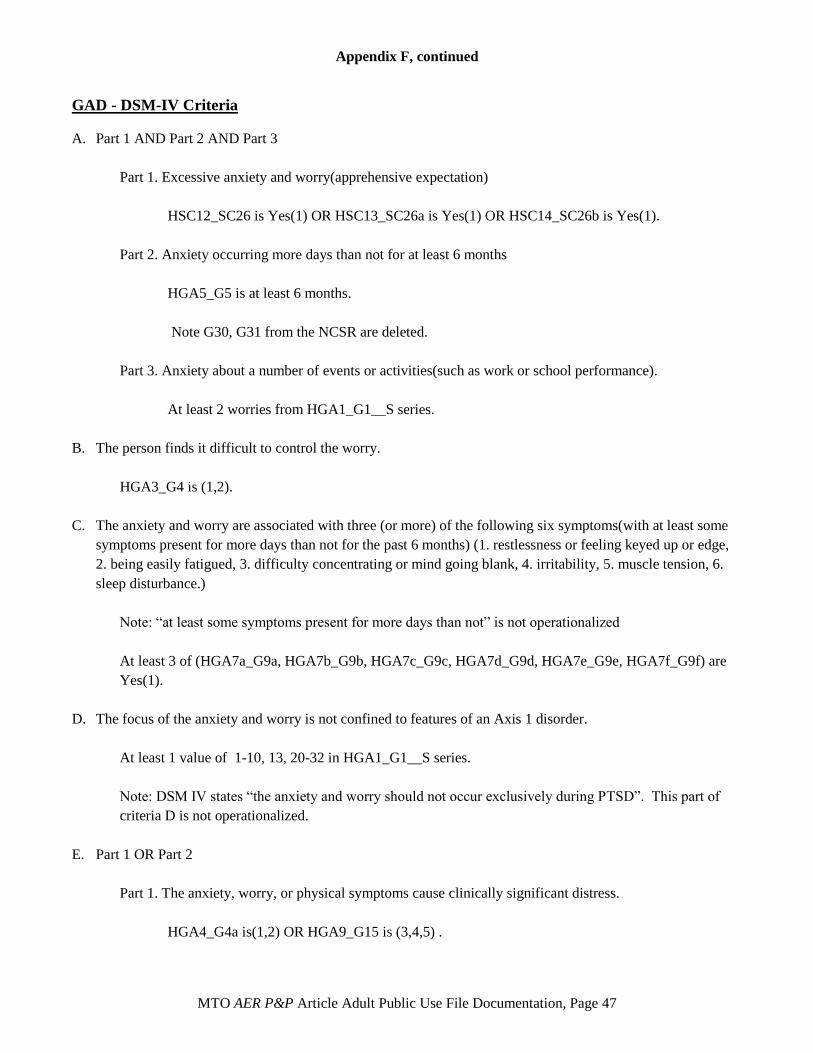
Appendix F, continued
MTO AER P&P Article Adult Public Use File Documentation, Page 47
GAD - DSM-IV Criteria
A. Part 1 AND Part 2 AND Part 3
Part 1. Excessive anxiety and worry(apprehensive expectation)
HSC12_SC26 is Yes(1) OR HSC13_SC26a is Yes(1) OR HSC14_SC26b is Yes(1).
Part 2. Anxiety occurring more days than not for at least 6 months
HGA5_G5 is at least 6 months.
Note G30, G31 from the NCSR are deleted.
Part 3. Anxiety about a number of events or activities(such as work or school performance).
At least 2 worries from HGA1_G1__S series.
B. The person finds it difficult to control the worry.
HGA3_G4 is (1,2).
C. The anxiety and worry are associated with three (or more) of the following six symptoms(with at least some
symptoms present for more days than not for the past 6 months) (1. restlessness or feeling keyed up or edge,
2. being easily fatigued, 3. difficulty concentrating or mind going blank, 4. irritability, 5. muscle tension, 6.
sleep disturbance.)
Note: “at least some symptoms present for more days than not” is not operationalized
At least 3 of (HGA7a_G9a, HGA7b_G9b, HGA7c_G9c, HGA7d_G9d, HGA7e_G9e, HGA7f_G9f) are
Yes(1).
D. The focus of the anxiety and worry is not confined to features of an Axis 1 disorder.
At least 1 value of 1-10, 13, 20-32 in HGA1_G1__S series.
Note: DSM IV states “the anxiety and worry should not occur exclusively during PTSD”. This part of
criteria D is not operationalized.
E. Part 1 OR Part 2
Part 1. The anxiety, worry, or physical symptoms cause clinically significant distress.
HGA4_G4a is(1,2) OR HGA9_G15 is (3,4,5) .

Appendix F, continued
MTO AER P&P Article Adult Public Use File Documentation, Page 48
Part 2. The anxiety, worry, or physical symptoms cause clinically significant impairment in social,
occupational, or other important areas of functioning.
HGA10_G17 is (3,4,5).
F. Part 1 AND Part 2
Part 1. The disturbance is not due to the direct physiological effects of a substance(e.g. a drug of abuse, a
medication) or due to a general medical condition(e.g., hyperthyroidism).
Note: G18a, G18b from NCSR are deleted, criteria not operationalized.
Part 2. The disturbance does not occur exclusively during a Mood Disorder, a Psychotic Disorder, or a
Pervasive Developmental Disorder.
Note: Psychotic Disorder and Pervasive Developmental Disorder hierarchies are not
operationalized.
(Major Depression = No(5) AND Minor Depression = No(5) AND Mania = No(5))
OR
((Major Depression = Yes(1) OR Minor Depression = Yes(1) OR Mania = Yes(1)) AND
(GAD onset < Mood onset) OR
(GAD recency > Mood recency) ))
Manic Episode (Old Version) – DSM-IV Criteria (MH_MAN_OLD)
A. Part 1 AND Part 2
Part 1. A distinct period of abnormally and persistently elevated, expansive, or irritable mood.
HSC9_SC24 = Yes(1) OR HSC11_SC25a = Yes(1).
Part 2. A distinct period of abnormally and persistently elevated, expansive, or irritable mood lasting at
least 1 week(or any duration if hospitalization is necessary).
(HMA2b_M3b >= 1 week) OR (HMA2e_M3d >= 1 week) OR (HMA6b_M6b >= 1 week) OR
(HMA6e_M6d >= 1week).
Note: M20, M22, M48 from NCSR are deleted.

Appendix F, continued
MTO AER P&P Article Adult Public Use File Documentation, Page 49
B. During the mood disturbance, three(or more) of the following symptoms have persisted (four if the mood is
only irritable) and have been present to a significant degree:
Mood is only irritable: HSC11_SC25a is Yes(1) AND (HSC9_SC24 is NOT Yes(1))
1. inflated self-esteem or grandiosity
HMA7n_M7n is Yes(1) OR HMA7o_M7o is Yes(1).
2. decreased need for sleep(e.g., feels rested after only 3 hours of sleep)
HMA7j_M7j is Yes(1).
3. more talkative than usual or pressure to keep talking
HMA7f_M7f is Yes(1).
4. flight of ideas or subjective experience that thoughts are racing
HMA7i_M7i is Yes(1).
5. distractibility (i.e., attention too easily drawn to unimportant or irrelevant external stimuli)
HMA7g_M7g is Yes(1) OR HMA7h_M7h is Yes(1).
6. increase in goal-oriented activity(either socially, at work or school, or sexually) or psychomotor
agitation.
HMA7a_M7a is Yes(1) OR HMA7b_M7b is Yes(1) OR HMA7c_M7c is Yes(1) OR
HMA7e_M7e is Yes(1).
7. excessive involvement in pleasurable activities that have a high potential for painful
consequences(e.g., engaging in unrestrained buying sprees, sexual indiscretions, or foolish business
investments)
HMA7k_M7k is Yes(1) OR HMA7l_M7l is Yes(1) OR HMA7m_M7m is Yes(1).
C. The symptoms do not meet criteria for a Mixed Episode
Not Operationalized

Appendix F, continued
MTO AER P&P Article Adult Public Use File Documentation, Page 50
D. Part 1 OR Part 2 OR Part 3
Part 1. The mood disturbance is sufficiently severe to cause marked impairment in occupational
functioning or in usual social activities or relationships with others.
HMA9_M9 is (4,5).
Note: M9a, M27a-d, M29, M33 from NCSR are deleted.
Part 2. The mood disturbance is sufficiently severe to necessitate hospitalization to prevent harm to self.
Note M48 from NCSR is deleted, criteria not operationalized.
Part 3. There are psychotic features
HMA7o_M7o is Yes(1).
E. The symptoms are not due to the direct physiological effects of a substance(e.g., a drug of abuse, a
medication, or other treatment) or a general medical condition (e.g. hyperthyroidism)
Note M10a, M10b from NCSR are deleted, criteria not operationalized.
MTO Bipolar I Old (F_MH_BIPOLARI_OLD)
MH_MAN_OLD is Yes(1).
Hypomanic Episode (Old version) – DSM-IV Criteria (MH_HYP_OLD)
A. Part 1 AND Part 2
Part 1. A distinct period of abnormally and persistently elevated, expansive, or irritable mood.
HSC9_SC24 is Yes(1) OR HSC11_SC25a is Yes(1).
Part 2. A distinct period of abnormally and persistently elevated, expansive, or irritable mood lasting at
least 4 days, that is clearly different from the usual nondepressed mood.
HSC9_SC24 is Yes(1) OR (HMA2b_M3b >= 4 days) OR (HMA2e_M3d >= 4 days) OR
(HMA6b_M6b >= 4 days) OR
HMA6e_(M6d >= 4 days).
Note: M20, M22 from NCSR are deleted.

Appendix F, continued
MTO AER P&P Article Adult Public Use File Documentation, Page 51
B. During the mood disturbance, three(or more) of the following symptoms have persisted(four if the mood is
only irritable) and have been present to a significant degree:
Mood is only irritable: HSC11_SC25a is Yes(1) and (HSC9_SC24 is NOT Yes(1))
1. inflated self-esteem or grandiosity
HMA7n_M7n is Yes(1) OR HMA7o_M7o is Yes(1).
2. decreased need for sleep(e.g., feels rested after only 3 hours of sleep)
HMA7j_M7j is Yes(1).
3. more talkative than usual or pressure to keep talking
HMA7f_M7f is Yes(1).
4. flight of ideas or subjective experience that thoughts are racing
HMA7i_M7i is Yes(1).
5. distractibility (i.e., attention too easily drawn to unimportant or irrelevant external stimuli)
HMA7g_M7g is Yes(1) OR HMA7h_M7h is Yes(1).
6. increase in goal-oriented activity(either socially, at work or school, or sexually) or psychomotor
agitation.
HMA7a_M7a is Yes(1) OR HMA7b_M7b is Yes(1) OR HMA7c_M7c is Yes(1) OR
HMA7e_M7e is Yes(1).
7. excessive involvement in pleasurable activities that have a high potential for painful
consequences(e.g., engaging in unrestrained buying sprees, sexual indiscretions, or foolish business
investments)
HMA7k_M7k is Yes(1) OR HMA7l_M7l is Yes(1) OR HMA7m_M7m is Yes(1).
C. The episode is associated with an unequivocal change in functioning that is uncharacteristic of the person
when not symptomatic.
HMA9_M9 is (3,4,5).
Note: M9a, M27a-d, M29, M33 from NCSR are deleted.

Appendix F, continued
MTO AER P&P Article Adult Public Use File Documentation, Page 52
D. The disturbance in mood and the change in functioning are observable by others.
Not Operationalized
E. Part 1 AND Part 2 AND Part 3.
Note: By strict DSM criteria, those people who meet all criteria for mania but have a duration of 4 to 6
days without hospitalization are excluded from a diagnosis of hypomania. (See mania criterion A,D and
hypomania criterion E). We have defined these people as meeting hypomania. This is implemented by
suppressing Criterion E for those with a duration of 4 to 6 days and without hospitalization.
Part 1. The mood disturbance is not severe enough to cause marked impairment in occupational
functioning or in usual social activities or relationships with others.
NOT(HMA9_M9 is (4,5)).
Note: M9a, M27a-d, M29, M33 from NCSR are deleted.
Part 2. The mood disturbance is not severe enough to necessitate hospitalization to prevent harm to self.
Note M48 from NCSR is deleted, criteria not operationalized.
Part 3. There are no psychotic features
HMA7o_M7o is No(5).
F. The symptoms are not due to the direct physiological effects of a substance(e.g., a drug of abuse, a
medication, or other treatment) or a general medical condition (e.g. hyperthyroidism)
Note M10a, M10b from NCSR are deleted, criteria not operationalized.
MTO Adult Bipolar II Old(F_MH_BIPOLARII_OLD)
A. Presence (or history) of one or more Major Depressive Episodes
f_mh_mde_evr_ad is Yes(1)
B. Presence (or history) of at least one Hypomanic Episode
mh_hyp_old is Yes(1)
C. There has never been a Manic Episode or Mixed Episode
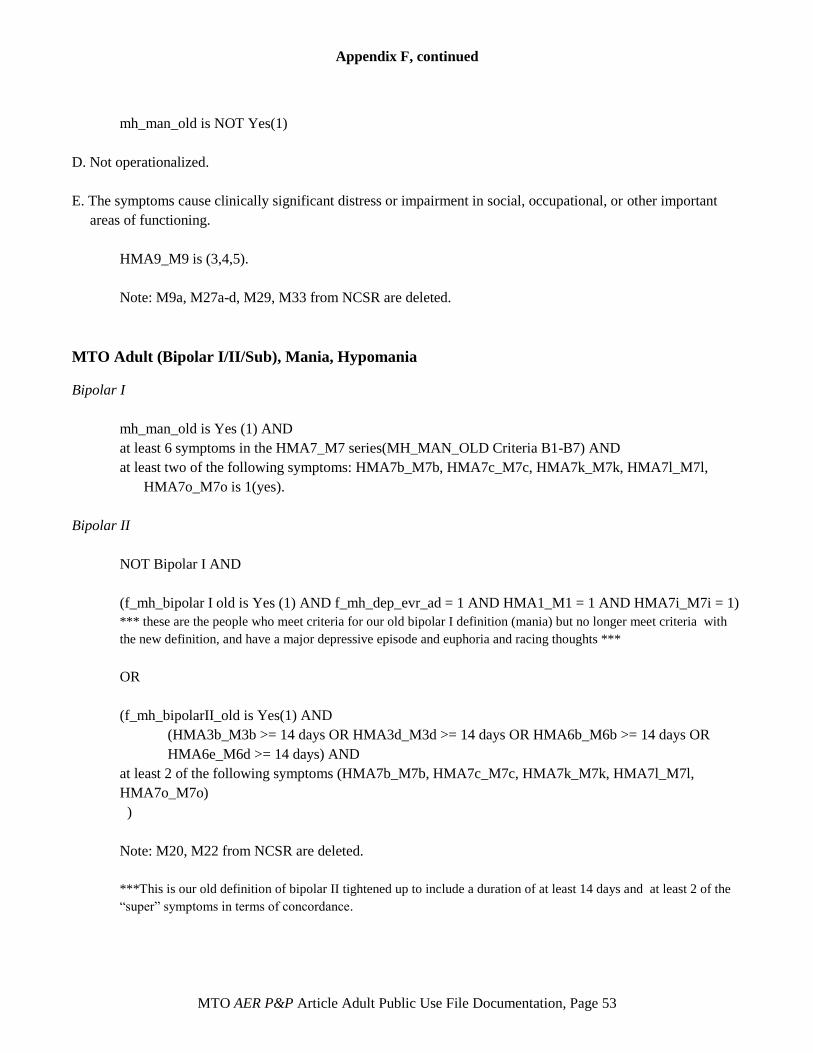
Appendix F, continued
MTO AER P&P Article Adult Public Use File Documentation, Page 53
mh_man_old is NOT Yes(1)
D. Not operationalized.
E. The symptoms cause clinically significant distress or impairment in social, occupational, or other important
areas of functioning.
HMA9_M9 is (3,4,5).
Note: M9a, M27a-d, M29, M33 from NCSR are deleted.
MTO Adult (Bipolar I/II/Sub), Mania, Hypomania
Bipolar I
mh_man_old is Yes (1) AND
at least 6 symptoms in the HMA7_M7 series(MH_MAN_OLD Criteria B1-B7) AND
at least two of the following symptoms: HMA7b_M7b, HMA7c_M7c, HMA7k_M7k, HMA7l_M7l,
HMA7o_M7o is 1(yes).
Bipolar II
NOT Bipolar I AND
(f_mh_bipolar I old is Yes (1) AND f_mh_dep_evr_ad = 1 AND HMA1_M1 = 1 AND HMA7i_M7i = 1)
*** these are the people who meet criteria for our old bipolar I definition (mania) but no longer meet criteria with
the new definition, and have a major depressive episode and euphoria and racing thoughts ***
OR
(f_mh_bipolarII_old is Yes(1) AND
(HMA3b_M3b >= 14 days OR HMA3d_M3d >= 14 days OR HMA6b_M6b >= 14 days OR
HMA6e_M6d >= 14 days) AND
at least 2 of the following symptoms (HMA7b_M7b, HMA7c_M7c, HMA7k_M7k, HMA7l_M7l,
HMA7o_M7o)
)
Note: M20, M22 from NCSR are deleted.
***This is our old definition of bipolar II tightened up to include a duration of at least 14 days and at least 2 of the
“super” symptoms in terms of concordance.

Appendix F, continued
MTO AER P&P Article Adult Public Use File Documentation, Page 54
Bipolar Sub
*** anyone left with old mania/hypomania who did not meet criteria for bipolar I and bipolar II above***
Not Bipolar I or Bipolar II as defined above AND (mh_man_old is Yes(1) OR mh_hyp_old is Yes(1)).
Mania (dsm_man)
Bipolar I is Yes(1).
Hypomania (dsm_hyp)
Bipolar II is Yes(1) OR (Bipolar Sub is Yes(1) AND mh_hyp_old is Yes(1)).
Sub-Hypomania (dsm_hypsub)
Bipolar Sub is Yes(1) AND (f_mh_bipolarIII Old is Yes(1) OR mh_hyp_old is Yes(1)).

MTO AER P&P Article Adult Public Use File Documentation, Page 55
Appendix G – Detailed Coding of Selected Variables Used for the AER P&P Article
(separate document)
This appendix is available at www.nber.org/mtopuf/mto_aer_ad_puf_docu_memo_apndxG_20131209.pdf.