Embed Size (px)
Citation preview

ED 474 668
AUTHOR
TITLE
INSTITUTIONREPORT NOPUB DATENOTEAVAILABLE FROM
PUB TYPEEDRS PRICEDESCRIPTORS
IDENTIFIERS
ABSTRACT
DOCUMENT RESUME
UD 035 421
Wolff, Laurence; Castro, Claudio de MouraSecondary Education in Latin America and the Caribbean: TheChallenge of Growth and Reform. Sustainable DevelopmentDepartment Technical Paper Series.Inter-American Development Bank, Washington, DC.
EDU-1112000-01-0160p.Publications, Education Unit, Inter-American DevelopmentBank, 1300 New York Avenue, N.W., Washington, DC 20577. Tel:202-623-2087; Fax: 202-623-1558; e-mail: sds/[email protected];Web site: http://www.iadb.org/sds/edu
Reports Descriptive (141)
EDRS Price MF01/PC03 Plus Postage.Academic Achievement; Computer Uses in Education; DevelopingNations; Diversity (Student); Educational Change; EducationalFinance; *Educational Quality; Educational Research;Educational Technology; Expenditure per Student; ForeignCountries; Governance; Labor Market; Public Schools;*Secondary Education; Teacher Competencies; Thinking Skills*Caribbean; *Latin America; Reform Efforts
This paper synthesizes the issues, problems, research, andcurrent best practice in secondary education in Latin America and theCaribbean. Overall, Latin America and the Caribbean enroll much lowerpercentages of school age children in secondary education than the region'schief competitors, and the region's secondary education is inadequate byinternational standards. Secondary vocational education is usually lowprestige, underfunded, and inadequately linked to the labor market.Expenditures per student are much lower than the region's competitors. Thepaper identifies six critical areas for quality improvement, including:increased learning of higher order skills in mathematics, communications, andlanguage and better measurement of achievement; more effective instruction,schools, and systems; public school management reform; use of technology forimprovement of educational quality; reassessment of the relationship betweensecondary schooling and the labor market; and more and better research onwhat works in secondary education in terms of increased learning, retention,
and performance in the labor market. The paper estimates criticalquantitative, financial, and human resources needs during the next 10 yearsand identifies a variety of strategies for meeting the challenges in a cost-
efficient manner. (Contains 88 references.) (SM)
Reproductions supplied by EDRS are the best that can be madefrom the original document.

U.S. DEPARTMENT OF EDUCATIONOffice of Educational Research and Improvement
EDUCATIONAL RESOURCES INFORMATION
A(jreceived from the person or organizationhis document has been reproduced as
CENTER (ERIC)
originating it
Minor changes have been made toimprove reproduction quality
Points of view or opinions stated in thisdocument do not necessarily representofficial OERI position or policy
PERMISSION TO REPRODUCE AND 1DISSEMINATE THIS MATERIAL HAS
BEEN GRANTED BY
L. ao/1.We / -Aiwa/ 4kezIg.fr e zuk
TO THE EDUCATIONAL RESOURCESINFORMATION CENTER (ERIC)
1
Secondary Educationin Latin erica and
the Caribbean:
The Challenge of Growth and Reform
Laurence WolffClaudio de Moura Castro
Sustainable Development DepartmentTechnical Papers Series
Inter-American Development Bank
Sustainable Development Department
Education Unit
BEST COPY AVAILABLE

Secondary Education inLatin America and the Caribbean
The Challenge of Growth and Reform
Laurence WolffClaudio de Moura Castro
Inter-American Development Bank
Washington, D.C.
Sustainable Development DepartmentTechnical Papers Series
3

Cataloging-in-Publication data provided by theInter-American Development BankFelipe Herrera Library
Wolff, Laurence.Secondary education in Latin America and the Caribbean : the challenge of growth
and reform I Laurence Wolff, Claudio de Moura Castro.
p. cm. (Sustainable Development Dept. Technical papers series ; EDU-111)Includes bibliographical references.
1. Education, Secondary- -Latin America. 2. Education, Secondary- -Caribbean Area. 3.Educational innovations- -Latin America. 4. Educational innovations- -Caribbean Area.5. Educational Planning- -Latin America. 6. Educational planning- -Caribbean Area. 7.Educational change- -Latin America. 8. Educational change- -Caribbean Area. I. Castro,Claudio de Moura. II.Inter-American Development Bank. Sustainable DevelopmentDept. Education Unit. III. Title. IV. Series.
373 C28--dc21
Laurence Wolff is a long-term consultant and Claudio de Moura Castro is the Chief Edu-cation Advisor in the Sustainable Development Department. The authors wish to ac-knowledge the assistance and contributions of Julissa Reynoso and Norma Garcia, aswell as comments received from John Helwig, Ernesto Schiefelbein, Carlos Henan, Al-berto Rodriguez, Aimee Verdisco and Juan Carlos Navarro. This paper was prepared asbackground for the development,of the Bank's strategy for primary and secondary educa-tion.
The information and opinions contained in this article are those of the authors and do notnecessarily reflect official position of the Inter-American Development Bank.
January 2000
This publication (No. EDU-111) can be obtained through:
Publications, Education UnitInter-American Development Bank1300 New York Avenue, N.W.Washington, D.C. 20577
E-mail: sds/[email protected]: 202-623-1558Web site: www.iadb.org /sds /edu

Foreword
The mounting interdependence of markets and the increasing intellectualcontent of production, require a labor force with stronger skills inmathematics, language and communications as well as more flexibility,creativity and an ability to work cooperatively. Secondary education iscritical to the success of nations in this new environment. In order tocompete effectively, the countries of Latin America and the Caribbeanmust address the challenge of providing improved access to secondaryeducation while enhancing its quality and relevance. This paper providesa timely synthesis of the issues, problems, research and current bestpractice in the region and elsewhere. Among other elements, it identifiessix critical areas for quality improvementincreased learning and meas-urement of achievement; more effective instruction, schools and systems;management reform; use of technology for quality improvement; reas-sessment of the relationship between secondary schooling and the labormarket; and research on "what works." The paper estimates criticalquantitative, financial and human resources needs during the next tenyears and identifies a variety of strategies for meeting the challenges in acost-efficient manner. On this basis, this report may provide useful guid-ance for policymakers.
Waldemar W. WirsigManagerSustainable Development Department
5

Contents
Summary1
The Economic and Social Context3
The Current Situation5
Six Critical Areas for Improvingthe Quality of Secondary Education
17
The Challenge of Meeting Growthand Quality Improvement Targets
28
Annexes41
6
Summary
This paper summarizes the available informationand recent experience of secondary education inLatin America and the Caribbean, identifiescritical issues, and provides an "indicative"agenda for growth and reform"indicative"because data and information are inadequate andbecause individual countries need to define theirown needs and specific policies.
THE CURRENT SITUATION
The changing characteristics of today's and to-morrow's economies, especially globalizationand the increasing intellectual content of pro-duction, require a labor force with strongermathematics, language, and communicationsskills, as well as flexibility, creativity and anincreased ability to work together cooperatively.In developed countries these demands have re-sulted in virtually universal secondary educa-tion, revised curricula, and higher learning stan-dards. In contrast, Latin America and the Carib-bean enroll much lower percentages of schoolage children in secondary education than theregion's chief competitors. In the region learn-ing in secondary education is inadequate by in-ternational standards; the implemented curricu-lum is outdated and poorly matched with labormarket needs; teachers have inadequate subjectknowledge, poor pedagogy, and are often un-motivated; learning materials are scarce and in-adequate; schools rarely have a sense of missionand identity, and school directors usually havelittle authority and recognition. These problemsare complicated by the increasing numbers ofstudents entering secondary education with fardifferent social backgrounds and needs, com-pared to those who previously participated in arelatively elitist system. Furthermore, the poor,especially those in rural areas, are grossly under-
7
represented, and large numbers of young adultsare still in secondary education, mainly a resultof repetition at earlier levels and in secondaryschools.
Fortunately, nearly every country in the regionhas begun to pay attention to secondary educa-tion. While few of these efforts have been ade-quately evaluated, this paper identifies some ofthe most promising innovations, focusing onimproving the quality of education and onmeeting needs for quantitative expansion.
IMPROVING THE QUALITY OFSECONDARY EDUCATION
There are six critical areas for improving thequality of secondary education. Many of theseare similar to those of primary education. Thefirst critical area is to focus on increased learn-ing of higher order skills in mathematics, com-munications, and language and to measure prog-ress toward learning goals. At the same timetraditional academic competencies must becomplemented by a wide variety of other skills,such as civic responsibility in a democratic soci-ety, creativity and innovation, cooperativeproblem solving and teamwork, an understand-ing of the role of technology in society, and en-vironmental awareness. Secondly, attractinghigher qualified teachers into secondary educa-tion will be fundamental, since secondary schoolteachers have many more labor market optionsthan primary school teachers. Teacher traininginstitutions and faculties need to receive specialattention since they are essential for each coun-try's economic future. They need especially tofocus on increased subject matter knowledge.Third, public school management reform willneed to focus on giving the school director

authority and adequate remuneration, ensure thathe/she is qualified, and provide feedback as wellas rewards on the basis of performance. Fourth,technology appropriately used can improve thequality of education. Fifth, the structure of sec-ondary education and its relationship to workmust be rethought. For example, business andclerical training will need to become moreclosely integrated into academic schools, andtechnical courses moved to the post-secondarylevel. To prepare the less academically inclinedstudents for work, countries in the region willneed to identify and experiment with a variety ofmodels, keeping in mind that vocational trainingfor the less academically inclined is best locatedoutside the formal system in modular trainingprograms more closely linked with industry. Fi-nally, more and better research is needed onwhat works in secondary education in terms ofincreased learning, retention, and performancein the labor market.
MEETING THE CHALLENGE OFGROWTH AND REFORM
The region needs to increase enrollments rapidlyto keep up with both labor market and socialdemands. Governments participating in Santiagosummit of the Americas proposed that enroll-
2
ment ratios increase from the current 55 percentto 75 percent by the year 2010. Based on asimulation of possible increases in secondaryeducation, to achieve these goals the regionwould need to invest over US$10 billion in sec-ondary school construction, and recurrent costswould have to double in real terms. Given therecent and anticipated economic growth of LatinAmerica, significant quantitative increases andqualitative improvement could be affordable formost, but not all, countries in the region, pro-vided cost effective education policies are fol-lowed, especially with regard to encouragingbetter use of teacher time, increasing studentcontact hours, using distance education to re-duce costs and reach underserved groups, re-ducing repetition, and leveraging public fundsby encouraging increased private sector invest-ment in secondary education. The level of in-creases in enrollment in each country will de-pend on socioeconomic conditions and perspec-tives, as well as on the rigor by which countriesidentify cost-effective solutions. For equity,countries will need to implement proactive poli-cies targeting the poor and underserved. Giventhe scale of the effort needed, government ac-tions must be in partnership with all stake-holders, including parents, labor unions, the in-formed public, and the private productive sector.
8

The Economic and Social Context
This paper examines the current status of secon-dary education in Latin America in the contextof world-wide economic changes and identifiesa wide variety of policy options for ensuring thatsecondary education can play a positive role inthe region's economic and social development.It focuses mainly on formal, academic educationrather than on vocational and other forms of job-oriented training.' The paper begins with a re-view of the current situation with regard toquality, efficiency, equity, costs, and structureusing a variety of statistical, analytical, and an-ecdotal sources. It continues with a summary ofpolicy options with regard to quality improve-ment and quantitative expansion, including sce-narios for meeting financial needs. An annexprovides a detailed planning exercise estimating,on a country by country basis, the costs ofmeeting both quantitative and qualitative goals.The paper does not provide a detailed countryby country menu for reform, nor should it beconsidered a definitive analysis of the subject.
At the outset it should be noted that secondaryeducation, until recently, has been the "forgot-ten" level of education in the region. This hasbeen a result of lack of political visibility andthe weaknesses of the constituencies for thislevel of education. Higher education always hadstrong interest groups behind it and political ac-tivism at this level has been conspicuous. Pri-mary education has been targeted during the pastdecade since this level has the most glaringshortcomings. Multilateral banks have been veryactive in this area and effective reform and im-
' A separate paper (Castro, Carnoy and Wolff, forth-coming) examines 'in greater detail issues related tothe structure of secondary education and the relation-ships between education and the world of work.
3
provement are taking place. The result every-where has been increased primary school gradu-ates, many of them with aspirations to continuetheir education at the secondary level. At themoment when there is a great need to expandand reform secondary education, the requisitefunds are lacking, and the analytical work hasnot been undertaken. This is one reason the rec-ommendations in this paper must be consideredpreliminary.
There is now a strong movement in many coun-tries in the region to pay attention to secondaryeducation. Chile, Argentina, Colombia, Uru-guay, Barbados, Paraguay, and El Salvador haverecently undertaken major efforts to expand andimprove secondary education. El Salvador,Costa Rica, Dominican Republic, Mexico, andothers have sought to expand and improve lowersecondary education (grades 6-9). Brazil ismaking secondary education its priority over thenext four years. Peru is beginning a major re-form of the structure of secondary education aswell as a major expansion. The time is thereforeripe to review issues and identify critical areasfor action.
Secondary education in the region faces thesame issues of changing economic structures asthe rest of the world. Economic organizationseverywhere now must emphasize speed, lowcost, and continuous innovation. Facing intenseprice competition, countries need to constantlysearch for ways to encourage production effi-ciency through improving the mix and use ofcapital and labor; companies need to monitor thepreferences of customers and maintain a con-stant vigil for ways of improving goods andservices. In this new world workers from thefactory floor to the front line need to develop a

set of new and more sophisticated skills, in-cluding technical knowledge, trainability andflexibility, increased responsibility, analyticalcapacity, innovative skills, cooperative workskills, and communication skills.
These characteristics of today's and tomorrow'seconomies require a new paradigm of pedagogywithin the schools. The changes are summarizedin Table 1.
In developed countries the impact of marketchanges has also meant that secondary educationis now nearly universal. With a universal clien-tele this means that the nonacademically in-clined must gain the fundamentals of mathe-matics, communications, language, problemsolving, and other skills necessary for today'sand tomorrow's marketplace. One fundamentalchallenge in developed as well as developingcountries is, therefore, to provide higher orderskills in an appropriate context to the non -academically inclined.
As Latin America and the Caribbean haveemerged from the downturn of the late 1980sand early 1990s, the most rapid growth has beenin nontraditional industries. In accordance withinternational trends, restructured economies andprivate businesses in the region are demandingmore flexible, trainable labor, especially in themore developed economies. Unfortunately, hu-man capital accumulation in Latin America hasbeen not only weak, but unequal. The region'spoor record in education is costly for growth andexacerbates income inequality (Birdsall, 1998).Gross enrollment ratios of 53 percent are belowthe average for countries at similar levels ofGDP per capita. The impact of world trends onsecondary education will be very similar to thatof developed countries, although delayed byperhaps 10 to 20 years, since enrollment ratiosare currently relatively low, and since somecountries and sub-regions will continue to relyon primary exports and low wage structures forsome time.
Table 1Matches between Workplaces and Pedagogies
Traditional Arrangements New ArrangementsWorkplace Pedagogy Workplace Pedagogy1. Passive order-takingin a hierarchical workorganization; heavysupervision to controlworkers.
1. Teachers as expertsconvey knowledge topassive learners.
1. Workers are expectedto take responsibility foridentifying and solvingproblems and foradapting to change bylearning.
1. Under teacher supportand guidance, studentsassume responsibilityfor learning, in the proc-ess developing know-ing-how-to-learn skills.
2. Emphasis on limitedresponses to limitedproblems and on gettinga task done.
2. Emphasis on facts andgetting right answers.
2. Workers deal withnon-routine problemsthat have to be analyzedand solved.
2. The focus is on alter-native ways to frameissues and problems.
3. Focus on the specifictask independent of or-ganizational context orbusiness strategy.
3. What is to be learnedis stripped of meaning-ful context.
3. Workers are expectedto make decisions thatrequire understandingthe broader context oftheir work and theircompany's priorities.
3. Ideas, principles andfacts are introduced,used and understood inmeaningful context.
Source: Golladay et al., 1996.
4 0

The Current Situation
Secondary education in the region has alwayssought to prepare and select for higher educationand to provide terminal education for those en-tering the labor market. The region has found itdifficult to meet these objectives because of thequalitative, funding, management and teachingweaknesses described below. Increasingly sec-ondary education is being asked to take on newroles in terms of inculcating values such as citi-zenship, environmental awareness, cooperation,and democratic participation. All of these needsand problems are becoming more pressing asincreased numbers of students enter secondaryeducation with far different social backgroundsfrom those who previously participated in arelatively elitist system. The region is deficientin the availability of places in secondary educa-tion, as well as in the provision of quality, effi-ciency and equity. The structure and often thecontent of secondary education is outdated.
This section examines three sources of data andinformation to identify issues in secondary edu-cation: 1) standard statistics gathered by allcountries; 2) research and education sector onthis level of education; and 3) anecdotal evi-dence and observations by experts working inthe area. Examining these three areas we canbegin to identify the main issues of secondaryeducation.
LOW ACCESS,EFFICIENCY, AND EQUITY
Definitions
Countries define the length of secondary educa-tion differently, ranging from three to sevenyears. Table 2 summarizes the official length ofsecondary education in the region. In the major-ity of countries secondary education is five orsix years in duration, usually with a "junior" and
5
then a "senior" secondary cycle. The junior sec-ondary cycle is usually considered as part of"basic" educationof eight to nine-year dura-tion and considered the minimum that all chil-dren should complete.2 In Brazil and El Salva-dor secondary education lasts only three years;in Jamaica it is seven years long; and in Bolivia,Chile, Dominican Republic and Venezuela it isfour years in length. These differences in theofficial length of secondary systems make sta-tistical comparisons as well as generalizationsdifficult.
Table 2Official Length of Secondary Education
Seven years JamaicaSix years Colombia
CubaEcuador
GuatemalaHaiti
MexicoPanama
ParaguayUruguay
Five years ArgentinaCosta RicaHondurasNicaragua
PeruTrinidad and Tobago
Four years BoliviaChile
Dominican RepublicVenezuela
Three years BrazilEl Salvador
2 But this is usually not the case.
11

Enrollment Ratios
Accepting each country's definition of thelength, in 1995 the gross enrollment ratio in theregion as a whole was 55 percent compared to49 percent in 1985, and absolute enrollment was29 million.3 This compares with enrollment ra-tios in the OECD and East Asian countries ofclose to or more than 100 percent. These ratiosvary greatly within the region. Jamaica, Colom-bia, Cuba, Panama, Uruguay, Argentina, andChile enroll over 65 percent of the cohort; whilethe enrollment ratio in Guatemala, Haiti, Para-guay, Honduras and Venezuela is under 40 per-cent (Table 3).
Overall, compared with the rest of the world,most countries in the region have enrollmentpercentages lower than can be expected giventheir per capita income. Table 4 compares en-rollment ratios in Latin America and the Carib-bean with the average for countries with similarper capita incomes. Within the region, differ-ences are mainly a result of the relative eco-nomic development in the region, but also thequality and efficiency of primary education.Compared with per capita income, countries en-rolling far less than would be expected includeBrazil, Venezuela, the Dominican Republic, ElSalvador, Bolivia, Guatemala and Haiti. In con-trast, Cuba, Uruguay, Argentina, Chile andTrinidad and Tobago enroll more students than
3 An analysis of the data on "middle school" (grades6 to 8) for Brazil shows that enrollments in grades 6to 8 are equivalent to 80 percent of the school agepopulation. If Brazil considered secondary educationto be six years equivalent, then its overall enrollmentratio would be 65 percent rather than 45 percent, andthe region as a whole would show a significantlyhigher gross enrollment ratio.
would be expected given their per-capita in-come.
In most of Latin America, differences betweengross and net enrollment ratios are high. In theworst case (Brazil) the net enrollment ratio is 19percent, compared to a 45 percent gross enroll-ment ratio. Similar differences, but not as great,occur in all the Spanish-speaking countries forwhich data are available (e.g., Venezuela, 35percent and 20 percent; Dominican Republic, 41percent and 22 percent; Chile, 67 percent and 50percent), but not in the anglophone countries.The difference between net and gross enrollmentis a result of large numbers of overage youths aswell as young adults attending secondaryschools, with many youths of secondary age stillin primary school. This problem is a result of the"culture of repetition" in the region, which hasannual repetition rates of up to 40 percent forschool age children in primary education. Olderstudents are more likely to need to work andmay have to attend school part-time. In addition,Chile, Uruguay and Brazil have recently re-ported high repetition in secondary education.With the exceptions of Guatemala and Bolivia,where girls' enrollment is lower than that ofboys, there is little difference between girls' andboys' enrollment in secondary education in theregion. In several countries girls' enrollmentratios are slightly higher than those of boys.
6 1 2
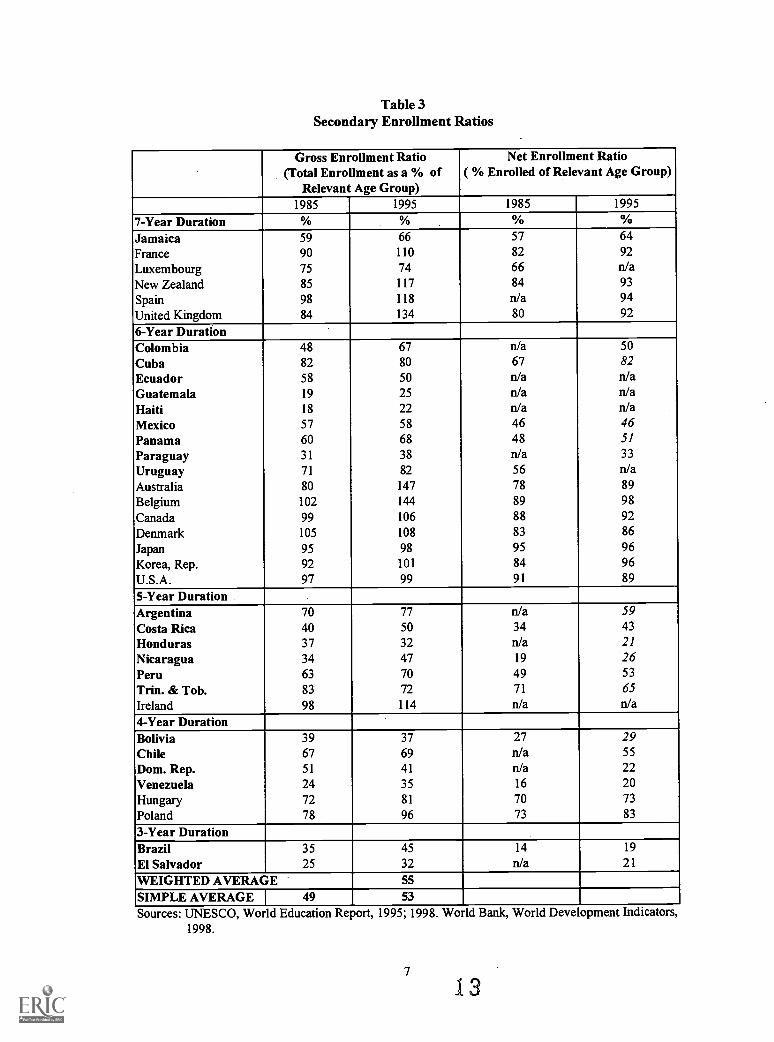
Table 3Secondary Enrollment Ratios
Gross Enrollment Ratio(Total Enrollment as a % of
Relevant Age Group)
Net Enrollment Ratio( % Enrolled of Relevant Age Group)
1985 1995 1985 1995
7-Year Duration % % % %
Jamaica 59 66 57 64
France 90 110 82 92
Luxembourg 75 74 66 n/aNew Zealand 85 117 84 93
Spain 98 118 n/a 94
United Kingdom 84 134 80 92
6-Year DurationColombia 48 67 n/a 50
Cuba 82 80 67 82
Ecuador 58 50 n/a n/aGuatemala 19 25 n/a n/aHaiti 18 22 n/a n/aMexico 57 58 46 46Panama 60 68 48 51
Paraguay 31 38 n/a 33
Uruguay 71 82 56 n/aAustralia 80 147 78 89
Belgium 102 144 89 98
Canada 99 106 88 92
Denmark 105 108 83 86
Japan 95 98 95 96
Korea, Rep. 92 101 84 96
U.S.A. 97 99 91 89
5-Year DurationArgentina 70 77 n/a 59Costa Rica 40 50 34 43
Honduras 37 32 n/a 21
Nicaragua 34 47 19 26Peru 63 70 49 53
Trin. & Tob. 83 72 71 65
Ireland 98 114 n/a n/a4-Year DurationBolivia 39 37 27 29Chile 67 69 n/a 55
Dom. Rep. 51 41 n/a 22Venezuela 24 35 16 20Hungary 72 81 70 73
Poland 78 96 73 83
3-Year DurationBrazil 35 45 14 19
El Salvador 25 32 n/a 21
WEIGHTED AVERAGE 55
SIMPLE AVERAGE I 49 53
Sources: UNESCO, World Education Report, 1995; 1998. World Bank, World Development Indicators,1998.
7
13

Table 4Secondary Level Gross Enrollment Ratios
(% of Relevant Age Group 1996)
Low Income Countries(US$760 per capita
or less)
Lower Middle IncomeCountries
(US$761-3,030)
Upper Middle IncomeCountries
(US$3,031-9,360)Cuba 80 Peru 70 Uruguay 85Nicaragua 44 World Average 69 Argentina 77World Average 42 Colombia 67 Chile 75Honduras 32 Jamaica 66* Trinidad and Tobago 74Haiti 22* Ecuador 50 Panama 68
Costa Rica 47 World Average 61Paraguay 44 Mexico 61D. Republic 41 Brazil 45Bolivia 37* Venezuela 40El Salvador 34Guatemala 26
Source: World Development Indicators, 1998 and 1999.*Figure corresponds to 1995.
Student/Teacher Ratios
Reported student/teacher ratios in the region(Table 5) range from 8:1 in Argentina and Vene-zuela, to 11:1 in Brazil, and 38:1 in Nicaragua,with a weighted regional average of 16:1. It isvery likely that teachers in countries such as Ar-gentina, Venezuela, and Brazil are being double-counted, since they may work in two differentinstitutions, often one public and one privateinstitution. This makes comparisons and policydecisions problematic. A more important meas-ure would be the student/class ratio. Statisticalsystems in the region generally are not able toclarify this issue. With the exception of Nicara-gua and Honduras, student/teacher ratios do notappear excessively high (over 25:1).
Expenditures per Student
Reported current expenditures per student insecondary schools vary from $67 in Guatemalaand $75 in Dominican Republic, to $964 in Ar-gentina, expressed on the basis of official ex-change rates. These figures compare with$4,000 to $7,000 per year in OECD countries. Inthe 1980s real public spending per pupil in ele-mentary and secondary education dropped in anumber of countries, including Argentina, Chile,Costa Rica, and Mexico, and Venezuela, largelybecause of sharp declines in real teacher salaries
8
(Carnoy and Castro, 1996; Carnoy and Wel-mond, 1997). There is little information on perstudent expenditures in the 1990s but, at theleast, it is likely to have held steady or increasedgiven the real average increases in GNP in theregion of 3.2 percent per annum during the pe-riod 1990-96.
Equity
A comparison of educational attainment by so-cial class (see Chart 1) shows a wide discrep-ancy between attainment levels of 21 year olds.In Paraguay, for example, on average upper in-come 21 year olds complete almost twelve yearsof education compared to five years of educa-tion for the poorest cohort. Among countries forwhich data are available, the highest social classdiscrepancies can be found in Brazil, El Salva-dor, Paraguay and Honduras. There are alsomajor inequities within countries. For example,in Northeast Brazil about 25 percent of thehigher income age group has achieved ninthgrade or higher compared to about 5 percent ofthe lowest income age group. These inequitiesare as much a result of the inadequacies of pri-mary education as that of secondary education.In any event, as secondary education enrollmentratios increase, the main new clienteles will bethose from the lower and lower middle classes.

Table 5Student/Teacher Ratios and Current Expenditure Per Student
Student/Teacher Ratio1995*
Current Expenditureper Student (US$) 1995
7-Year DurationJamaica 22 $378
6-Year DurationColombia 22 $210
Cuba 10 $451
Ecuador 13 $209
Guatemala 16 $67
Haiti n/a
Mexico 17 $664
Panama 18 $358
Paraguay 12 $186
Uruguay 18 $414
5-Year DurationArgentina 8 $964
Costa Rica 21 $496
Honduras 28 $132
Nicaragua 38 n/a
Peru 19 $219
Trinidad & Tobago 20 $641
4-Year DurationBolivia $144
Chile 17 $374
Dominican Republic 22 $75
Venezuela* 8 $207
3-Year DurationBrazil 11 $615
El Salvador $81
WEIGHTED AVERAGE 15.6 $498
SIMPLE AVERAGE 17.9 $344
(*) To estimate the weighted average, 18 is used as a default ratio when data for thecountry is not available.
(**) Italics indicate 1992 figure.
Sources: UNESCO World Education Report, 1995, 1998; World Bank, World DevelopmentIndicators, 1998.
9
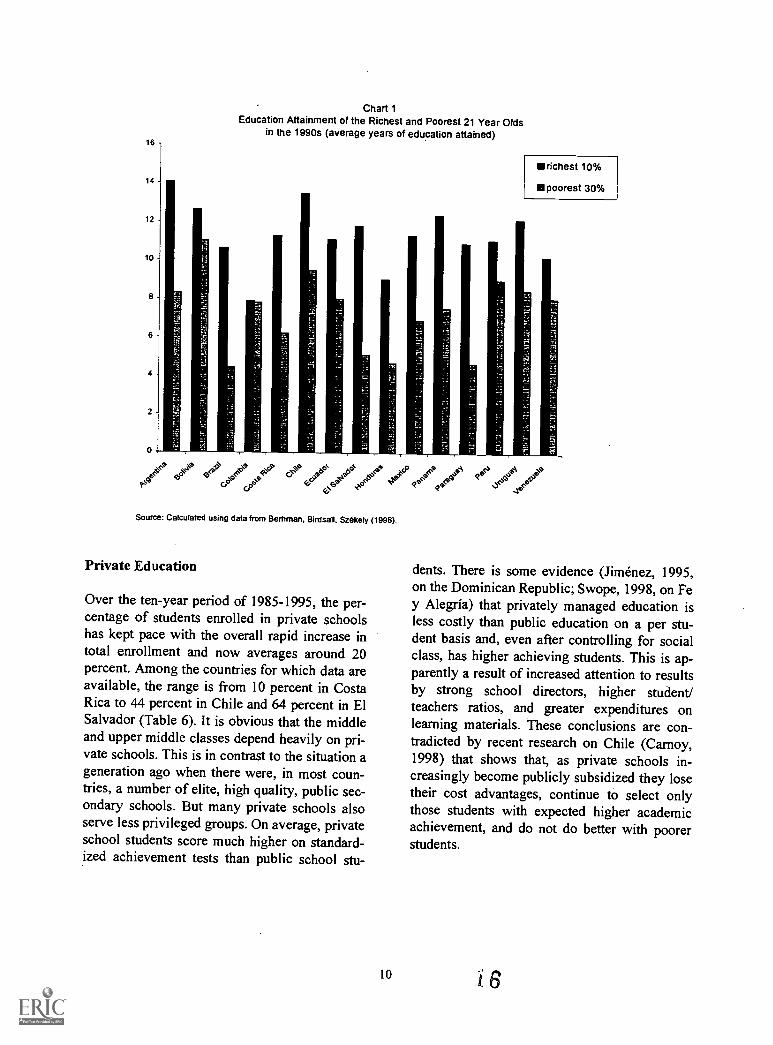
Chart 1Education Attainment of the Richest and Poorest 21 Year Olds
in the 1990s (average years of education attained)
OP\Cr 21.
CS'0
richest 10%
le poorest 30%
bok ,okcps, ,p+ 04
4,7,0
Source: Calculated using data from Berhman, Birdsall, Szekely (1998).
Private Education
Over the ten-year period of 1985-1995, the per-centage of students enrolled in private schoolshas kept pace with the overall rapid increase intotal enrollment and now averages around 20percent. Among the countries for which data areavailable, the range is from 10 percent in CostaRica to 44 percent in Chile and 64 percent in ElSalvador (Table 6). It is obvious that the middleand upper middle classes depend heavily on pri-vate schools. This is in contrast to the situation ageneration ago when there were, in most coun-tries, a number of elite, high quality, public sec-ondary schools. But many private schools alsoserve less privileged groups. On average, privateschool students score much higher on standard-ized achievement tests than public school stu-
10
dents. There is some evidence (Jimenez, 1995,on the Dominican Republic; Swope, 1998, on Fey Alegria) that privately managed education isless costly than public education on a per stu-dent basis and, even after controlling for socialclass, has higher achieving students. This is ap-parently a result of increased attention to resultsby strong school directors, higher student/teachers ratios, and greater expenditures onlearning materials. These conclusions are con-tradicted by recent research on Chile (Carnoy,1998) that shows that, as private schools in-creasingly become publicly subsidized they losetheir cost advantages, continue to select onlythose students with expected higher academicachievement, and do not do better with poorerstudents.

Table 6Enrollment in Private Schools
I 1985 (%) I 1995 (%)7-Year DurationJamaica
I4
IN/A
6-Year DurationColombia 42 39
Cuba --
Ecuador 34
Guatemala 38 --
Haiti 84
Mexico 4 --
Panama 14 13
Paraguay 23 24
Uruguay 15 16
5-Year DurationArgentina 30
Costa Rica 9 10
Honduras 42
Nicaragua 20 24
Peru 15 16
Trinidad & Tobago --
4-Year DurationBoliviaChile 39 44
Dominican Republic 30 33
Venezuela* 25 35
3-Year DurationBrazilEl Salvador 51 64
Source: UNESCO World Education Report, 1995, 1998.
Teachers and Teacher Training
The available data shows that the percentage ofteachers with higher education degrees is low.Only 39 percent of secondary school teachers inArgentina have higher education degrees. Thecomparable percentage in Panama is nine. Al-though the number of teachers increased rapidlyin the region during the 1980s, the drop inteachers' real salaries during that decade createda recruitment crisis in countries such as Argen-tina, Costa Rica, Peru, and Uruguay. Accordingto one analysis, the number of first year teachereducation students in Argentina fell from 14,000
11
in 1987 to 10,400 in 1992, and is increasinglydrawn from high school graduates who havefailed in their pursuit of university careers(Braslaysky, 1995). Although this analysis re-fers to primary school teachers, a similar prob-lem reportedly exists for university-trained sec-ondary school teachers. In Uruguay, a shortageof applications for teaching posts led to accep-tance of uncertified applicants for hard-to-fillposts in rural and marginal urban areas and toproposals to reduce the course work in the in-stitutos normales from four to two years (Fil-gueira and Marrero, 1995). All this occurreddespite rising real (and relative to middle-level
17

urban wages) salaries for Uruguayan teachers.4In Costa Rica, the Ministry replaced almost 20percent of qualified teachers in secondaryschools with aspirantes and autorizados, bothunqualified categories for teachers (Carnoy andTorres, 1994). In Peru, the proportion of uncerti-fied teachers increased in the 1980s, so that by1990, almost 50 percent of secondary teacherswere uncertified (World Bank, 1993).
Vocational/Technical Education
The structure of secondary education, especiallythe relationship between vocational/technicaland academic education, varies greatly through-out the world. In fact, secondary and post sec-ondary school structures have been referred toas "jungles or mazes," especially with regard totechnical/vocational and work-related activities.The United States and Canada have a singlecomprehensive secondary school, within whichacademic programs with varying degrees oftracking and demands, as well as vocational/technical programs, are offered. Germany sends36 percent of each secondary school cohort tovocational schools, including its "dual" appren-ticeship system. France splits post primaryschools into different modalitiesmath/science,arts and humanities, commercial, technicaland also has separate vocational schools. Tradi-tionally, Latin America and the Caribbean haveopted for the academic/vocational dichotomy;and several countries have also adopted theFrench model of splitting academic schools. Ta-ble 7 summarizes the structure of upper secon-dary education in six OECD countries.
It should be emphasized that the definition oftechnical /vocational schooling varies greatly inthe region5 as well as in OECD countries. Table8 summarizes the current situation in terms ofenrollment in these schools as defined by eachcountry. The percentage of students attendingvocational/technical secondary schools variesgreatly from country to country, but averages 30
A major new program in Uruguay seeks to reversethis trend.5 Training courses outside the formal system (e.g.,SENAUSENA-type training courses) are not includedin the data.
percent for the region as a whole. In Argentina,60 percent of students attend what are defined asvocational, technical, and professional schools.In the English-speaking Caribbean countries andMexico, only five to 12 percent of secondaryschool students attend vocational schools.
INADEQUATE AND OUTDATEDLEARNING, PEDAGOGY,
MANAGEMENT, AND CURRICULUM
Learning
The TIMSS/IEA mathematics and science testsare the only recent study which compareslearning at the secondary level in the region withthe rest of the world. In this case, Colombia(eighth grade) is the only Latin American coun-try represented. Colombia scored 41st out of 42countries. At least ten of those countries had percapita incomes equal to or less than that of Co-lombia. In 1992 Venezuela and Trinidad andTobago participated in that year's IEA readingsurvey of eighth graders. Venezuela scoredlower than all countries except Nigeria, Zim-babwe, and Botswana. Trinidad and Tobagoscored above those countries as well as aboveThailand and the Philippines, suggesting that theEnglish-speaking countries of the Caribbeanmay be doing better in education than otherLatin America countries. Country assessmentsof secondary school achievement have begun inEl Salvador, Costa Rica, Brazil, Argentina, andother countries. These studies invariably showthat children are achieving far below the levelsexpected as defined by leading educators andcurriculum experts.
Pedagogy
Based on much anecdotal but little systematicevidence, classroom pedagogy is usually out-dated, based on frontal lectures, with insufficientstudent participation and little use of textbooksor teaching materials other than chalk and talk.While there is discussion of new pedagogicaltrends, such as constructivism, classroom prac-tice benefits little from this approach except in a
12 1 8

Table 7Characteristics of Upper Secondary Education in Six OECD Countries
Country Principal characteristicsYears of Upper
SecondaryEducation
Percentage in"general"education
USA and Canada Single comprehensive school, wide variety of courseofferings at different levels of difficulty.
3 or 4 100
France Secondary schools streamed according to math/science,arts/humanities, commercial, and technical specializa-tion. Separate vocational and apprenticeship schools.
3 72
Italy Separate general, teacher training, technical, voca-tional, and fine arts schools, with the latter three in-cluding work experience.
5 56
Germany Separate grammar, technical, and vocational schoolswith work experience required for vocational/technicalstudents.
4 or 5 64
England Two years of comprehensive, "modern" (e.g., voca-tionally oriented) and "grammar" (e.g., academic)schools followed by two years of college preparatory("A" level) or terminal "further education" courses.
4 61
Table 8Shares of General and Technical Education Enrollment
at the Secondary Level (Most Recent Estimates)
Country Year % Gen. Ed. % Vo-TechArgentina 1985 40 60Belize 1994-95 99 1
Bolivia 1990 ---Brazil 1985 33 49Chile 1996 56 44Colombia 1993 76 21
Costa Rica 1995 78 22Dominican Republic 1994-95 91 8
Ecuador 1992-93 66 35El Salvador 1993 25 74Guatemala 1980 70 17
Guyana 1994-95 100 0Haiti 1985-86 97 2Honduras 1991 65 30Jamaica 1985-86 96 4Mexico 1994-95 89 11
Nicaragua 1993 92 7
Panama 1990 74 25Paraguay 1994 92 8
Peru 1995 100 0Suriname 1992-93 59 35
Uruguay 1995 84 16Venezuela 1992-93 82 18
Source: UNESCO, Statistical Yearbook, 1997, Table 3.7.
13
19

small number of schools.6 Teaching materials,basic library materials, science and other typesof equipment, libraries, computers, copy ma-chines, and other tools which can strengthen thepedagogical process are lacking. There is littlesystematic information but much anecdotal evi-dence on the inadequacies of teacher training.Teacher training is the lowest prestige program,and teacher trainers often the least qualifiedamong university staff. There is excessive em-phasis on the theoretical elements of the psy-chology of education, and inadequate subjectmatter preparation and practice teaching.
Management
There is almost no research in Latin Americathat systematically identifies process and man-agement issues, or seeks to identify the reasonswhy some schools are more "effective" thanothers. Based on much anecdotal evidence,many secondary schools in the region do notoperate as coherent institutions with a sense ofidentity, cohesion, and commitment. There aremany "taxi" teachers, who teach in two or moreinstitutions. School directors enjoy little recog-nition or authority. There is little interactionwith the community or with parents. Because ofthe nature of funding and management, manypublic schools are poorly maintained, oftendirty, with broken windows and nonfunctioningequipment. Since 1994, many countries in theregion have initiated programs to address andresolve these problems.
Curriculum
The TIMSSIIEA study reviewed mathematicsand science curriculum and textbooks, and pro-vided partial information for Mexico, Argentina,and Colombia. The review showed that whilethe official curriculum in math and science wasroughly comparable to that in the developedcountries, Mexican and Colombian textbooks
'In many faculties of education in Latin Americathere appears to be a misunderstanding that the con-cept of "constructivism" requires that individualteachers invent their own pedagogical approachesrather than identify, adapt, and utilize best practicesto meet students' needs.
14
(but not Argentinean textbooks) were deficientin "mathematical reasoning" and "complexcommunications" (which are "higher orderskills") compared to most OECD countries. Asreported by the TIMSS study, the mathematicsand science curriculum in the three countrieswas reasonably up to date, but curriculum goalsare not achieved because of inadequate teaching,too little time on task, and lack of teaching mate-rials. There was a striking lack of coordinationbetween the formal curriculum, the curriculumas presented by the teacher in the classroom, andwhat is learned by the student.
As noted, while the formal academic curriculumin math, science, and language is often up todate, in most countries studied, children on av-erage learn half of what is in the official cur-riculum. Much of what is taught also appearsirrelevant to those expecting to enter the labormarket or already in it. Some curriculum areas,such as technology, health, and civic education,are nonexistent or out of date. However, to someextent the region's autonomous training institu-tions, such as SENAI, SENAC (Brazil), andSENA (Colombia), have made up for the fail-ures of the formal education system by provid-ing modular training opportunities to primaryand secondary school leavers.
Structure
Based on observation and discussions, with onlya few exceptions, traditional vocational secon-dary schools are inadequately funded, poorlylinked with the labor market and are not consid-ered prestigious. Secondary technical education,when adequately funded, has often preparedstudents for higher education rather than for thelabor market. Private schools teaching business,computer, accounting, and secretarial courseshave sprung up everywhere to fill the gap.Training of primary school teachers at the sec-ondary level is no longer viable in the fewcountries where it continues. Comprehensivesecondary schools, styled after those in theUnited States, have not taken hold except in arelatively small number of schools in Colombia(INEMs) where, contrary to their initial objec-tives, the vast majority of graduates go on tohigher education.
' 0(

A SUMMARY OF ISSUES
Based on regional and country data, researchand observations, the following conclusions canbe reached:7
Access and Equity
Enrollment ratios in secondary education aremuch lower than in the region's chief competi-tors; large numbers of overage children andyoung adults are enrolled, mainly as a result ofrepetition at earlier levels; the poor, especiallythose in rural areas, are grossly underrepre-sented in secondary education; and secondaryeducation programs rarely, if ever, take into ac-count the needs of working students and poten-tial students living in rural areas.
Structure, Content, and the Relationship ofSchooling to Work
Secondary vocational education is usually lowprestige, underfunded and inadequately linkedwith the labor market; some technical programshave served as preparation for higher educationrather than the labor market; public commercialeducation is inadequate. Training of primaryschool teachers at the secondary level is nolonger appropriate in the few countries where itcontinues; and a number of critical new cur-riculum areas, such as civic education, healtheducation, and technology awareness, are notyet developed.
Learning
Achievement levels in secondary education areinadequate by international standards. While the
A number of detailed country studies of secondaryeducation have recently been undertaken, in partthrough IDB and World Bank financing, and provideanalyses of the situation on a country by country ba-sis, mainly using statistical approaches (e.g., flowmodels, financing and costs, enrollment ratios, multi-variate statistical correlation analysis, etc.). The re-sults of these studies in each country are summarizedin Annex 1. Overall, they corroborate the problemsdescribed above of low enrollment rates, lowachievement levels, low teacher quality, lack of inputquality, repetition, and inequity.
formal academic curriculum is often up to date,classroom teaching and learning as well as text-books are rarely adequate to meet curriculumgoals and pedagogy is inadequately linked withreal life experiences. Students attending nightschool and/or working, as well as older andpoorer students, score lowest on standardizedachievement tests. Teachers, student, parents,and employers do not have clear and verifiablemeasures of learning standards and achieve-ment. Teachers have inadequate subject knowl-edge, poor pedagogy, and are often unmoti-vated. Learning materials are scarce and inade-quate. Public schools rarely have a sense of mis-sion and identity, and school directors have littleauthority and recognition.
Costs and Efficiency
Expenditures per student are much lower com-pared to the region's competitors but varygreatly from one country to another. Stu-dent/teacher ratios also vary greatly and there isinadequate information on teacher utilizationand student class size; and repetition and drop-out rates are excessive.
In spite of, or perhaps in response to, the bleakdiagnosis described above, the conditions ofsecondary education in Latin America arechanging. In the last five years, Argentina,Mexico, Chile, Uruguay, Colombia, El Salvador,and the Brazilian states of Sao Paulo and Paranahave initiated secondary education growth andreform efforts. In the Caribbean, Trinidad andTobago and Barbados have launched secondaryreform and expansion efforts. The federal gov-ernment of Brazil has approved major curricu-lum and structural reforms and is planning tomake secondary education its priority over thenext four years. Peru is beginning a major re-form of the structure of secondary education, aswell as an expansion. Nearly every other coun-try in the region is initiating secondary educa-tion growth and reform programs.
Efforts need to focus on two areasquality andquantity. The third chapter summarizes the sixcritical areas for quality improvement. Thefourth chapter summarizes the quantitativechallenge and how it can be met. Both these
15
21

sections take into account current reform efforts,most of which have been initiated but not yetevaluated.
Reform issues facing the region are both differ-ent from and similar to those faced in Europeand North America. The difference is thatEurope and North America are at or close toproviding universal secondary education up toage 18 or 19; and especially in Europe, that
16
learning and achievement is far higher than thelevels in Latin America and the Caribbean. Thesimilarities include: the increasing complemen-tarity of academic and vocational education, anemphasis on higher order learning, a concernwith civic and moral education, decentralization,and improving teacher quality. Annex 2 summa-rizes current reform efforts in Europe and theUnited States.
Six Critical Areas for Improvingthe Quality of Secondary Education
This section discusses an agenda for improvingthe quality of secondary education in the region.This is an incomplete agenda because currentdata and information are inadequate and indi-vidual countries need to define their own objec-tives and strategies.
Quality has many valid definitions, which aresummarized in Box 1.
Based on experience to date and these defini-tions, the following six areas are critical forquality improvement:
Increased focus on learning and on themeasurement of achievement.
More effective instruction and better teach-ers.
Management reform.
Using technology and learning materialsappropriately for quality improvement.
Rethinking the structure of secondary edu-cation and its relationship to the world ofwork.
Undertaking applied research on what worksin terms of learning, retention and labormarket performance.
INCREASED LEARNING ANDMEASUREMENT OF ACHIEVEMENT
Quality improvement means increased learning,especially of higher order skills in mathematics,communications, and language. The increasingawareness of the inadequacy of learning in the
17
region has led to the inception of national testingin nearly every Latin American country. An in-creasing number of countries are participating ininternational testing programs.
However, testing, setting standards, and report-ing results do not guarantee increased learning,any more than measuring crop output guaranteesimproved crop productivity. But this informationcan help lead to a new role for the informedpublican understanding that the object ofschooling is learning and an insistence thatschools provide the environment and opportu-nity for such learning. Industrialists, for exam-ple, need to understand that, even though theirchildren may attend private schools, the qualityof public education also affects them, sincepublic schools are producing tomorrow's work-ers. The mass media and politicians need to un-derstand that good education is good politics.And the informed public needs also to insist thatevery candidate for public office has an articu-late education policy.
To make testing a tool for encouraging increasedlearning, clear standards must be articulated andtest results need to be disseminated to the prin-cipal stakeholders (teachers, students, parents,industrialists, politicians, etc.) in a user friendlyform. Also, testing needs to be technically ofadequate qualitypermitting measurement ofthe curriculum and fair comparisons, especiallyof the "value added" of schooling. Finally, co-herent strategies need to be designed for the useof the results, for example, to identify, provideincentives for, and reward "effective" schools,and to provide feedback to teachers as well ascurriculum and textbook developers (see Wolff,1997, for a detailed discussion of issues in edu-cational assessment in the region).
23

BOX 1What is Quality in Education?
Educational quality has many, sometimes conflicting definitions. Quality is best defined as the extent to which children learn the basic skills andknowledge necessary to function in a modem society and utilize these skills in their life. Since this is difficult to measure, numerous proxies are used,as defined below:
I.) Output quality: The most fundamental definition of quality is that of the extent to which children attain the knowledge and skills which societywishes to impart to them. These knowledge and skills are not simply academic skills (e.g., Howard Gardner has identified seven such dimensions:linguistic, logical-mathematical, bodily-kinesthetic, spatial, musical, interpersonal, and intrapersonal). In the 21st century the technological revolutionwill require new worker skills. The new worker will need to be a problem solver, flexible, computer literate, a communicator, and able to work inteams. A high quality elementary and secondary school system is one which has a good match between what children learn and what is needed tofunction in a modem society. Output quality can be measured in the labor market through tests of workers' knowledge and measurement of workerproductivity. This is rarely done because of complexity and costs. Within the schools output quality can be measured by achievement tests measuringthe extent to which national curriculum goals are achieved. Given current curriculum goals throughout the world designed to educate this kind of citi-zen, low quality can, in part, be defined as "rote learning or learning in isolation" and high quality would be the learning of higher order skills.Implications for Latin America: Latin American education systems are not educating the citizen-worker of the 21st century. Nor is the region pro-viding adequate mathematics and reading skills. lEA studies show that LAC countries are far below the developed world and also below the Far Eastand the Middle East. On intemational tests, Latin American countries score only above Africa. The English - speaking. Caribbean may be doing slightlybetter.
2.) Quality as Value Added: Quality may be defined in relation to "value-added." In this definition a high quality school or school system is onewhich increases the learning of students relative to their status at the beginning of their schooling period. This suggests that a school whose clientele ischildren of illiterate peasants could be "higher quality" than an urban middle class school even if its absolute results, in terms of test scores or reten-tion, were relatively low. Quality as value added can be measured statistically and through time series data. A number of countries are explicitly rec-ognizing this element, especially by providing additional resources to at risk schools, recognizing schools doing better than expected (e.g., France) andproviding rewards to schools which improve their scores.Implications for Latin America: There is not enough awareness of this issue in among Latin American political leaders and the general public. Chilehas recognized that low performing schools need special help, and is providing incentives for improved performance.3.) Quality as high standards: Quality may also be defined as "high examination and promotion standards." This definition is useful if it is accom-panied by a commitment that all children can achieve these standards, but is counter-productive if adequate resources are not provided and most chil-dren fail. In the United States, chaotic expectations of learning lead to no standards, but states are now seeking to define and enforce standards espe-cially at the secondary level.Implications for Latin America: There is evidence that teachers. are using "high standards" to fail children in first grade since they are unable to readby the end of the first year. But this approach does not take into account different learning styles as well as children's impoverished backgrounds andis counterproductive. At higher grades, while the national curriculum can be clear and modem in its objectives, teachers pay little attention to it andlearning is inadequate. The "standards" movement at the eighth grade level requires realistic curriculum expectations and a commitment of adequatephysical resources and school processes so that all or nearly all children can achieve at the desired level Brazil is moving in this direction.4.) Quality of school inputs: Quality is often defined in relation to physical and other inputs, such as school buildings, textbooks, computers andnumber and educational levels of teachers. A high quality school would be one with good physical facilities, adequate equipment and educational ma-terials, and well trained teachers. It is assumed that input quality will lead to better achievement and retention, and there is a fair amount of researchseeking to measure this relationship.Implications for Latin America: School inputs (e.g., expenditures per student, teacher qualifications) are inadequate in rural schools and often inurban slum schools as well. Northeast Brazil is an extreme example of this problem. .A review of research has identified textbooks, teacher subjectknowledge, time on task, and school snacks as inputs that have an impact on achievement. However, contrary to popular belief, lower student/teacherratios are not effective in raising achievement. Teacher qualifications, as measured by number of year of formal training, have also been found to havea weak impact, if any, in student learning, probably due to the fact that years of training is a poor proxy for quality teaching.5.) Quality in School Processes: Quality may also be considered in relation to schooling processes. In this case quality refers to good school man-agement; well coordinated, modem classroom pedagogical practices; flexibility to revise or change processes as needed; and dedicated teachers work-ing together as a team to achieve specific goals. Good school processes are often the "missing element" necessary to ensure that school inputs lead toincreased learning and retention. They can be measured mainly through systematic observation (qualitative research). There is increasing interest inthis element of schooling.Implications for Latin America: The "typical" school has a director selected by central authorities on the basis of bureaucratic criteria; teachers oftenhave two or more jobs, rarely remain in the school building when classes are over, work in isolation, and are inadequately supervised ("civil service"mentality). But there are many efforts in the region to change school processes (e.g., Escuela Nueva in Colombia, EDUCO in El Salvador, communityinvolvement in schooling in Minas Gerais and in secondary schools in Nicaragua, teacher learning circles in Uruguay, etc.).6.) Proxies for Output Quality: Levels of Literacy and Schooling in the General Population, and Completion and Repetition Rates: Levels ofschooling can be taken as proxy for learning in the general population. This assumes rough equivalency of secondary school levels across countries.Within the school system, in the absence of well structured, internationally comparable achievement tests, and considering that it is difficult to testchildren who drop out of school, the number of children who complete a particular level of schooling (e.g., completion rates) is often taken as a proxyfor learning achievement. High repetition rates are also often considered a proxy for low achievement, since clearly something is amiss when upwardof 50 percent of children fail the year.Implications for Latin America: Levels of schooling of the general population in the region are significantly lower than in East Asian countries andthe difference is growing. Current completion rates are low, compared to competitors. Repetition, especially in basic education, is the highest in theworld, leading to the inefficient use of funds. Repetition is grossly underreported in official statistics. Only modest progress has been made in reduc-ing repetition.
18
EST COPY AVAILABLE

One way of helping to ensure that feasible cur-riculum goals are met is to establish minimumproficiency examinations, as is being imple-mented in Costa Rica (a secondary school leav-ing test counts 25 percent in the students' finalgrade), or examinations which are made avail-able on the students' permanent record. Thisapproach avoids the disadvantages of highstakes examinations necessary for graduation,where teachers and students become exclusivelypreoccupied with "teaching to the test," andwould allow for at least some flexibility in cur-riculum. A number of other countries in the re-gion, including El Salvador, Argentina, Brazil,and Chile, have begun to test secondary schoolstudents and, in effect, to establish minimumstandards of achievement.
MORE EFFECTIVE INSTRUCTION,BETTER TEACHERS AND REFORMED
TEACHER TRAINING
To achieve the goals of increased learning andmore effective instruction, more time must bedevoted to learning and less to administrative,rote, and routine processes. Teachers need betterknowledge of their subject matter and need tohave the capacity to vary their pedagogical ap-proaches to achieve different learning objectiveswith different groups of pupils. The imple-mented curriculum (e.g., what is taught), notsimply the "official" curriculum, must be re-vised to emphasize higher order skills.
Attracting higher qualified recruits into secon-dary education will be fundamental. To achievethis, overall teachers' salaries will need to in-crease. The increased labor market demand forcomputer skills makes it particularly difficult torecruit mathematics teachers; financial incen-tives will therefore need to be provided forteachers in areas such as mathematics wherethere is scarcity. The provision of loans orscholarships to students embarking on a tracktraining course of study (which is being imple-mented in Uruguay and is under discussionelsewhere), especially for bright but poor stu-dents, would attract better students. Any loanelements could be discounted for each year ofteaching in public (rural or low-income) secon-dary schools.
19
But salary increases without increased profes-sional responsibilities and accountability couldwell be self-defeating. Teacher career laddersand related financial and other incentives needto be designed to encourage good teaching. Ef-forts at changing career ladders are underway inseveral countries. Career ladders could be basedin part on observed competence, including in-creased flexibility to school authorities in pro-viding salary increments on the basis of per-formance. The title of "master teacher," withaccompanying financial rewards for thosejudged superiors in their pedagogy could be in-troduced into the career ladder. Teacher unionswill have to be convinced to work directly withgovernment on professionalization and higherstandards, including eliminating the excessivepoliticization of negotiations over salaries andworking conditions. National campaigns to"value" secondary (as well as primary) schoolteachers, through awards and recognition, canalso help raise the status of the teaching profes-sion. A standards approach to teacher trainingcould include setting up tests for entering teach-ers, especially in content knowledge, as is al-ready the case in Mexico and the United States
The content of teacher preparation needs a com-plete overhaul. The first step is to establish anational policy that places special attention onteacher training institutions and faculties sincethey are essential for the economic future. Forexample, a fund to support innovation in teachertraining could be established, to be awarded on acompetitive basis to proposals which seek tochange the objectives, content, efficiency andeffectiveness of teacher training on a sustainablebasis. The focus would be on developing a widevariety of instructional approaches to achievemore demanding and higher order learninggoals. Investment packages could be madeavailable to upgrade teacher training facilities,through the provision of computers, audio-visualand other learning materials, and libraries. Pro-gram reforms could include: 1) establishing ef-fective practice teaching programs managed bymaster teachers who are adequately remuner-ated; 2) developing "sandwich" programswhereby teacher trainees teach full time inschools under the guidance of master teachersbefore they receive their final degree; 3) ensur-
25
ing that all future teachers understand and utilizetechnology in education, including requiringcomputer literacy for all future secondary schoolteachers; 4) especially for upper secondary levelteachers, an emphasis on subject knowledge; 5)financial and other incentives for the best uni-versity professors in subject matter areas to be-come involved in teacher training; and 6) part-nerships between teacher training institutionsand individual schools and school systems. Atthe same time it should be emphasized that re-search suggests that increased formal qualifica-tions of teachers (e.g., master's degrees) do notnecessarily result in increased learning if otherelements, especially incentives and workingconditions, are not simultaneously changed.
Improved instruction requires more time on task.This involves two elements: the number of stu-dent contact hours and the amounts of time stu-dents spend actively learning in the classroomand doing homework. The number of studentcontact hours varies between 600 and 800 ac-cording to official guidelines, which is similar tothat of developed countries. However, the actualnumber of student contact hours is far lower be-cause of regular strikes, teacher absenteeism,late arrival, and early departure. In nearly allLatin American countries (but not in the Eng-lish-speaking Caribbean) students need to spendmore hours in school. Moreover, there is evi-dence that large amounts of classroom time arespent on classroom discipline and on routineadministrative matters, which reduces the num-ber of hours actually spent learning.
Many countries are beginning to understand theimportance of teacher issues. Uruguay has es-tablished a special targeted program to train sec-ondary teachers in residential post secondaryinstitutions. Chile, the states of Parana and SaoPaulo in Brazil, and Uruguay are increasing stu-dent contact hours and reforming teacher educa-tion. Chile has established a fund to supportteacher training initiatives. Research and relatedpolicy discussions are underway in many coun-tries in the region on issues related to teacherremuneration, working conditions, and incen-tives.
20
SCHOOL ANDSYSTEM MANAGEMENT REFORM
Much of the recent research on effective schoolsemphasizes the centrality of the school directorand the importance of local autonomy andteamwork coupled with system-wide account-ability and incentives for increased learningand/or retention of students. Little of this re-search has been undertaken in the region.
A comparative study of public and private sec-ondary schools in five countries, including theDominican Republic and Colombia (WorldBank, 1995), sheds light on school effectivenessissues. The study found that achievement inprivate schools was higher and costs lower thanpublic schools even when social economicbackground was controlled for. While studies inother countries have not found these cost-effectiveness advantages for private education,the conclusions of this study are nonethelessimportant, since the critical differences betweenprivate and public schools were: 1) the privateschool principal had much more decision-making power; 2) private schools placed a muchgreater emphasis on academic achievement; 3)student/teacher ratios were higher in privateschools; 4) teacher qualifications in privateschools were slightly lower; and 5) privateschools invested more in educational materials.
There is no reason for public schools not to beable to adopt similar approaches. This wouldmean ensuring that the school director is quali-fied, giving him the authority and adequate re-muneration, and providing rewards on the basisof performance. School directors would receivesignificantly higher salaries provided they wereselected on the basis of competency and aresubject to performance review. Financial andadministrative incentives would be used to en-courage teachers to teach full time in one school,so that he/she can act as part of a team ratherthan as an itinerant provider of lessons (taxi-teachers). Secondary school physical facilitieswill require adequate space for teachers to pre-pare their lessons and interact with other teach-ers. Classrooms should be opened up to obser-
2 6

vation, assessment and collegial advice in orderto end the isolation of teachers.
Parents will need to be more involved but suchinvolvement will not, by itself, result in in-creased student achievement, especially in lowerincome districts where parents at best have aprimary education.
Decentralization requires a special effort at es-tablishing a central monitoring system, clearstandards, intensive guidance and support toschools, especially with regard to instruction.Schools should be relatively free to reward, andin some cases, fire staff, as well as to allocatediscretionary funds, but they should be held ac-countable with regard to improvements in reten-tion and achievement. As one commentator hasput it:
Is student learning better in schools wherethere are democratic school councils or inschools where the principal runs the show? ...the whole point of school reform is to have stu-dents learn more. If this doesn't happen, the ex-periment is a failure, no matter how happy thechildren, the parents and teachersand the re-formers are. (Shanker)
One critical problem of public secondary educa-tion is its abandonment by much of the middleand all of the upper class. To attract the middleclass back into the public system, it may be ap-propriate to establish "magnet" schools or partsof schools (as was the case a generation ago inmany countries), with a specific focus on areassuch as math and science, music and arts, or lib-eral arts. Entrance to those schools would bebased on competitive examinations (but withspecial attention to talented children from poorerfamilies) and the schools would impart an in-structional level equivalent to the best privateschools but at only slightly higher costs thannormal public secondary schools. This approachcould help to create a lobby of vocal, concernedparents who would support increased learning ofall children in the public system.8 Trinidad and
8 One approach would be to incorporate all or a por-tion of the International Baccalaureate (IB) curricu-lum and teacher training program. The IB is a high
21
Tobago is one country in the region which haslaunched such a program.
Chile, El Salvador, the Brazilian states of MinasGerais and Parana, Argentina, Paraguay, El Sal-vador, and Nicaragua are a few of the countriesand states which are considering or have initi-ated such decentralization at the secondary level.
USING EDUCATIONAL MATERIALSAND TECHNOLOGY
FOR QUALITY IMPROVEMENT
Low cost science equipment, functioning librar-ies, copiers, and adequate textbooks are no lesscritical in the information age than in the past. Inmost countries, textbooks are purchased by stu-dents. It would be appropriate to begin to pro-vide free or subsidized textbooks on the basis ofneed. Hands-on in-service training is needed inthe utilization of teaching/learning materials andto help individual teachers develop their ownmaterials.
Given the scarcity of good quality secondaryteachers and inadequate pedagogy, many coun-tries are considering the use of technology insecondary education as a means of both in-creasing access and improving instruction.Mexico has taken a leading role with its Tele-secundaria (television teaching) which todayteaches 20 percent of secondary students, and istargeted to rural areas with few students. El Sal-vador, Guatemala, and Nicaragua are usingTelesecundaria material on a pilot basis (seeBox 2).
The Brazilian Telecurso 2000 using broadcastTV and tapes targets young adults who did notfinish primary or secondary schools. Telecursois currently beginning to expand directly toregular classrooms, in some cases providing in-struction in physics and mathematics whenqualified teachers are lacking. Several states areconsidering replacing night classes, which oftenrequire three hours of class every evening, with
quality international secondary school program origi-nally designed for children of European expatriatesbut now expanding rapidly, especially in US publicschools.

Box 2Mexico's Telesecundaria: A Cost-Effective Program
Mexico's Telesecundaria program has been existence for 30 years. The project was created thirty years ago, to respond to theneeds of rural communities where a regular middle school would not be feasible. Instead of having one teacher for each disci-pline, Telesecundaria has one single teacher (a "home teacher") who. teaches all disciplines for the three grades. After the 1993reform and the introduction of satellite transmission, enrollment has increased rapidly. The program now serves one millionstudents. The latest version of Telesecundaria puts teachers and students on the screen, brings context and practical uses of theconcepts taught and extensively uses images and clips to illustrate and help students. The TV gives teaching its pace. Bookspick up where the TV leaves off and follow a minutely detailed organization of the remaining time. At eight o'clock, theteachers in 14, 000 schools in Mexico turn on the TV. The students then watch 15 minutes of television. The set is turned offand the written material and guidebooks take over, providing detailed guidance for the remaining 45 minutes. For example, theteacher asks whether students need to understand better the concepts just seen. Then, they might read aloud, apply what wastaught in practical exercises, followed by a brief evaluation of what has been learned. To finish, there is a review of the materi-als taught. At nine, another discipline starts, following the same routine. The morning classes include the academic disciplines.
Recent research (Castro, Wolff, and Garcia, 1999) has confirmed the cost-effectiveness of Telesecundaria. In terms of effec-tiveness completion rates in Telesecundaria are the same as general secondary schools (about 79 percent) and significantlyhigher than technical and vocational schools. A recent unpublished survey showed that Telesecundaria students score lowerthan regular secondary school students in a standardized test given to seventh graders (lower scores would be expected sincethese students are from poor rural areas); however, by the ninth grade they score as well on the same tests as regular schoolstudents in mathematics and have made up half the difference in language. The most recent estimates show that unit costs inTelesecundaria are roughly the same as those of regular secondary schools in urban areas. The lower student class ratios inTelesecundaria (about 20:1) and annualized technology and production costs (pro-rated for a million students) are offset bylarger numbers of teachers and administrative personnel in regular secondary schools. In addition, the costs of establishingregular secondary schools in rural areas would be prohibitive because of the need for teachers specialized in each subject
"tele-classes" requiring fewer formal classroomhours. A study of Telecurso's cost-effectivenessis also currently underway. Both these programspermit the very best methods and teachers toreach students who would otherwise not haveaccess to a secondary education or might onlyhave access to inadequate services. In short, thepotential of mass media (television and, for pri-mary schools, radio) for improving the qualityof instruction and improving access appears tohave been demonstrated in the region.
While the potential for computers and the Inter-net to improve the quality of education is verygreat, high costs, connection difficulties, lowteacher quality, and institutional inertia and re-sistance mean that the use of computers forteaching purposes should, for the time being, berestricted to well-designed pilot projects. Fivecountries (Brazil, Venezuela, Colombia, Pan-ama, and Peru) are planning to work together ona computer/Internet/media based pilot project toimprove science and mathematics teaching inupper secondary schools (Haddad, 1999). Theprogram will seek to: 1) identify the best Inter-
22
net and media based teaching programs; 2)benchmark learning objectives against interna-tional standards such as the International Bac-calaureate and the TIMSS curriculum analysisproject; and 3) train and integrate teachers intothe learning process. It is expected that 50 to100 schools in three to four countries will par-ticipate in the pilot project. It can be expectedthat within five years costs will go down rapidly,software and teacher training will improve, andwidespread use of computers and the Internetfor teaching purposes will be feasible.
Programs should also be developed to exposestudents to computers and related informationprocessing as part of their general education.The impact of a more computer literate popula-tion on economic growth may be very high. Onestudy (Wolff) in Costa Rica estimated that thedifferences in salary between technical andnontechnical workers was so great (about 50percent) that if only an additional 1 percent ofsecondary graduates entered technical fields as aresult of their exposure to information technol-ogy, the social rate of return for investment in
28

computer education would be positive. At thesame time, rather than embarking on large-scalepurchases of computers, it may be possible tocontract with private institutions to providecomputer literacy training. Since many privatecompanies are already doing this outside theformal system, costs would be low and feasibil-ity high. Finally, to prepare for the future, a keypolicy should be to ensure that future teachersare computer literate.
RETInNICENG THE STRUCTUREOF SECONDARY EDUCATIONAND ITS RELATIONSHIP TO
THE WORLD OF WORK
A separate paper covers in detail issues relatedto the structures of secondary education and therelationship of secondary education to the worldof work (Castro, Carnoy and Wolff, forthcom-ing). This section summarizes the conclusions ofthat paper, based on worldwide trends, a chang-ing clientele, and new labor market needs.
In the first place, the gap between the "voca-tional" and "academic" curriculums needs to bereduced. For example an understanding of therole of technology in society, especially infor-mation technology, as well as hands-on under-standing of computers, is rapidly becoming partof "general" education. Business and commer-cial curriculums are becoming more importantand more closely linked with academic educa-tion. Vocational subjects require greater knowl-edge of mathematics and better reading skills.All students require increased higher orderskills.
In addition, secondary education in the regioncan no longer afford to overlook the increas-ingly important role of competencies and skillsother than academic ones. Learning goals there-fore will also need to include increased capacityfor cooperative problem solving and teamwork;civic responsibility in a democratic society; en-vironmental awareness and responsibility; andcreativity and innovation. Little is known abouthow to effectively achieve these new learninggoals. An understanding of the role of technol-ogy in society, especially information technol-ogy, and hands-on understanding of computers,
will be necessary. Least cost approaches for im-parting this knowledge must be developed.While there is much discussion about new sub-ject matter such as technology awareness andcivic education, little is yet known in the regionabout how to achieve these goals or how toplace higher order skills in context so that theybecome relevant to students' lives.
Preparing less academically inclined students forwork will continue to be a difficult issue. Coun-tries will need to identify and experiment with avariety of models. For the academically less tal-ented, higher order skills will need to be em-bodied in more practical "contextualized" tasksand activities, a pedagogical task which, up tonow, no country in the region has attempted andone with which the developed countries continueto struggle. In any event, formal vocationalschools are far more expensive than academicschooling, invariably employ poorly qualifiedteachers and outdated equipment, and take toolong considering the increasing importance ofgeneral education. Specific job preparation, in-cluding vocational training for the nonacademi-cally inclined, needs to move out of the formalsystem and into nonformal, often private train-ing programs, with modular approaches. This isespecially important for the 25 to 50 percent ofstudents who end their formal schooling at thelower secondary level (grade 9) as well as forthose students who do not complete ninth grade.A wide variety of experimental linkages withindustry (sandwich courses, apprenticeships,secondary schools in factories, etc.) should betried but these will inevitably cover only a smallpercentage of all secondary school students andwill depend on the peculiar circumstances ofeach country. This paper does not review in de-tail these options.
The structure of "general" education can be di-vided into junior and upper secondary education.Junior secondary education (grades 7 to 9) canbe expected to have a unitary curriculum. Formost countries there are several options at theupper secondary level, none of which is neces-sarily superior to the others and which depend toa great extent on history and social context. Oneoption is to take the French approach, empha-sizing broad families of occupations, such as
23
29
liberal arts, math/science, and commerce. ButFrance continues to track a minority of studentsinto specific vocational schools. Another optionis the USA/Canada approach of comprehensivehigh schools which include academic and voca-tional tracks. But this approach does not seem tofit into the social and educational history of mostLatin American countries and exists only to alimited extent in Colombia's INEMs. Similarly,the German approach of sandwich courses, part-time employment and heavy emphasis on voca-tional subjects would not work in Latin Ameri-can countries, except in limited circumstances.
Where enrollment ratios in secondary educationare already high and economies are moderniz-ing, technical courses tend to migrate to thepost-secondary level, since they require in-creasing doses of basic mathematics, science,and communication. This solution resolves, atleast in part, the problem of the dichotomy be-tween preparation for higher education and oc-cupational training; but it may not yet be feasi-ble for most occupations in low-income, low-enrollment countries such as Honduras andGuatemala. The successful secondary technicalschools must be autonomous and closely tied toindustry. They are also expensive, offer highquality education and training and tend to bespecialized in one industrial branch (electronics,dairy, wines, ceramics, precision mechanics),sometimes including R&D projects.
Argentina has taken the lead in establishing aFrench approach to the structure of general edu-cation and Mexico is now considering it. Brazilis establishing a common track includingmathematics, science, language, and socialstudies to be taught to all secondary school stu-dents; however, the subjects will be taught withdifferent emphasis and levels of rigor. Individualschools can be allowed to complete the curricu-lum with elements of their own choice (30 per-cent of the hours available), thus blurring thedifference between academic and vocational.But Brazil has not yet defined the minimumlevel of "rigor" for the compulsory subjects nordesigned the guidelines for the remaining 30percent. Peru is beginning a two-year "restrictedaccess" academic senior high school (grades 11and 12) focussing mainly on college preparation
24
to raise standards, but also in part as a means oflowering expectations or further education for10th grade graduates. Trinidad and Tobago iseliminating its multiplicity of types of secondaryschools in favor of a single model with opportu-nities for school-based specialization, includingmagnet schools.
Others countries have sought to reshape techni-cal education, often through locating it at thepost-secondary level. Mexico has established anautonomous secondary technical system(CONAFE) in an effort to provide greater flexi-bility and linkages with industry (see Lee,1998). Chile has expanded the linkages betweena restricted number of secondary technicalschools and industry. Many countries have an-nounced that they will "contextualize" academiceducation so that it is accessible to the new, lessacademically clienteles entering secondary edu-cation, building on experiments and programsalready underway in Europe and the UnitedStates. But the evidence is not yet in on the rela-tive success of these efforts, which in any eventwill require major teacher training and upgrad-ing as well as revised textbooks.
There remain a number of difficult issues re-garding the preparation of less academically in-clined students for work. Many options exist indeveloped countries, ranging from the Germanapprenticeship programs to "sandwich" coursesbetween industry and schools, secondary schoolequivalency programs run within factories, andthe United States tech/prep approach. LatinAmerican countries will need to identify andexperiment with the most appropriate models,keeping in mind that formal vocational schoolscan be fax more expensive than academicschooling and invariably suffer from poorlyqualified teachers and outdated equipment.Furthermore, an excessive preoccupation with"boxes" and restructuring secondary educationmay divert attention from fundamental issuesrelated to teacher working conditions and qual-ity, and increasing the learning of higher orderskills in mathematics, language, communication,etc. Finally, curriculum reform without consen-sus, training, and adequate materials is self-defeating.
30

RESEARCH ON WHAT WORKS INSECONDARY EDUCATION
Education systems throughout the world arenotorious for the widespread implementation ofnew ideas and programs without adequate test-ing or evaluation. In the United States, for ex-ample, less that one percent of the Departmentof Education's budget is devoted to research
(Krueger, 1999). Latin America and the Carib-bean are no different when it comes to lack ofresearch on what works in education.
In 1994 a meta-study (Fuller, 1994) examinedthe small number of studies devoted to whatworks in secondary education in developingcountries, with the following results:
Table 9Effects of Inputs, Teachers, and Pedagogy on Secondary School Achievement
in Developing Countries, as of 1994
FactorNumber of
Significant Effects Number of StudiesExpenditures per student 3 5
Average class size 2 21
School size 1 5
Textbooks 7 13
Supplementary readers 2 2Instructional media 0 0
Quality of facilities 1 1
School library 3 4Science laboratory 1 1
School nutrition 1 1
Teachers length of education 5 8
Tertiary or teachers college 8 14
In service teacher training 3 4Gender (female) 2 4
Teacher experience 1 12
Teacher salary 2 11
Instructional time 11 15
Active, complex pedagogy 2 5
Frequent monitoring of studentperformance
0 1
Cooperative-learning taskstructure
2 2
Independence from centralgovernment
0 1
Principal's staff assessment 0 1
Principal's training level 1 2School inspection visits 0 1
Source: Fuller and Clarke, 1994.
25

Factors measured in more than ten studies,which had positive impacts on learning in morethan half the studies, included: textbooks, in-structional time, and teachers' level of educa-tion. Factors in more than ten studies, which hadlittle or no impact on learning, included: classsize, teacher experience, and teachers' salaries.Other factors appeared in too few studies todraw distinct conclusions. This study also em-phasized the importance of more qualitative andcase study approaches, especially measuring theprocesses which result in "effective schools,"e.g., schools which score higher than expectedgiven the socioeconomic level of students orbased on students' knowledge in the beginningof the year.
Based on the above and on reviews of recentresearch in the region, the research still neededin secondary education includes a wide varietyof approaches and subjects. The following is aninitial listing of such research.
Measuring What Works through StatisticalAnalysis
With the increased power of computers, sophis-ticated quantitative and analytical techniques,including flow analysis and hierarchical linearmodels (HLM), are now available to most re-searchers, provided they have adequate training.The new student testing programs in manycountries offer a ready source of data for analy-sis. Statistical techniques can help to tease outcomplex relationships between inputs, processesand outputs. In particular, they can be used todetermine whether new programs have an im-pact on learning. Natural or structured "quasi-experimental" designs can be set up to compareresults of two samples of students with differentexperiences. Evaluations of this sort should al-ways measure the cost-effectiveness of alterna-tive programs.
School Effectiveness Studies
Since statistical analyses do not provide a fullpicture of the educational process, they shouldbe complemented by "school effectiveness"studies. These studies measure the critical proc-
26
ess variables in secondary schools which lead tohigher achievement and retention of students.Schools scoring higher than expected, given thesocioeconomic status of their students, or com-pared with past scores, are examined on a caseby case basis to try to identify process charac-teristics not normally identified in standard sta-tistical analyses. School effectiveness studieselsewhere in the world have led to conclusionson the importance of school director leadership,collaborative teacher efforts, and school/com-munity involvement.
Studies on Teacher Demand, Knowledge andPedagogy
Studies on teachers should include examinationsof the labor market for teachers differentiated bysubject matter. For example, there is anecdotalevidence of a shortage of science and mathe-matics teachers that needs to be documented. Ifthe anecdotal evidence is proved correct, itwould have major implications for policies pro-viding incentives for teachers in shortage skillareas. Studies of teacher subject matter knowl-edge are also important.9 A comprehensive pro-gram of testing of teacher subject knowledgecould be instituted in the medium term. Othercritical areas include: case studies of teachertraining programs, both pre-and in-service, thatseem to have an impact; and reviews of teacherincentive systems, teacher careers and incentivesand how these can be changed to encourage ex-cellence.
Output and Demand Measurements
A wide variety of analysis is needed on learningand achievement in school as well as on per-formance in the labor market of school leavers.Interviews with entrepreneurs as well as jobanalysis can determine the fit between schooloutput and the characteristics of employees witha secondary education. Many studies of this sorthave emphasized the importance of non-
One simple approach to this question would be togive the TIMSS tests in math and science, which arenow available on the Internet, to a sample of currentteachers as well as to newly graduated teachers.
32

academic skills such as team work, punctuality,and discipline. As noted earlier, most countriesare implementing assessment programs. But lit-tle is known on the impact of national testing onsecondary school teaching and pedagogy, in-cluding the extent to which the tests are resultingin increased learning and under what conditions,and the extent to which the tests may be dis-couraging innovation. Tracer studies on whathappens to rural and poorer students who com-plete primary and/or lower secondary educationcould determine how many enter the labor mar-ket because of lack of access to schools or be-cause of economic need. This could lead to theestablishment of specific programs (e.g., dis-tance education) targeted to these students.
Management Studies
Studies on ways to increase time on task in acost-effective way could focus on the utilizationof teachers and classroom spaces, examining therelationships between student-class ratios, stu-dent hours per week, and teacher hours per weekin a variety of schools and states. There is anec-dotal evidence, for example, that student classratios go down considerably in the last year ofsecondary schooling because many studentsdrop out; that proliferation of subjects combinedwith small schools leads to the underutilizationof teachers, that teachers have little or no time or
27
preparation or in-school coordination, and thatsome school regulations encourage the prolif-eration of "taxi teachers." Reviews of the cost-effectiveness of private schools vis a vis publicschools are important to clarify the debate overpublic support of private institutions. In this re-gard, a review of public oversight of privatesecondary schools could determine the extent towhich such oversight hinders or encouragesquality, access, and equity. A related set ofstudies would cover issues regarding physicalfacilities in secondary education, including aninventory of the adequacy of current facilities; astudy to determine the future model of schoolconstruction and equipment to meet curriculumexpectations, how these physical facilitiesshould be used, and the cost implications forusing different types of school and utilizationmodels, including single shift. Studies of nightschools and secondary equivalency programsand their operations could lead to proposals forchanges to improve their cost-effectiveness.School management studies could examine thereal number of hours of study (rather than theofficial number of hours); the extent to whichthere is any sense of coordination and coopera-tion among teachers and school principals andhow the sense of a "school" can be encouraged.Finally case studies of the processes by whichinstitutions change and reforms are implementedcan lead to more effective reform strategies.
33

The Challenge of Meeting Growthand Quality Improvement Targets
ESTIMATING QUANTITATIVE TARGETSAND FINANCIAL AND
HUMAN RESOURCES NEEDS
To raise the overall educational attainment levelof the general population, improve competitive-ness on international markets and reduce ineq-uity in the region, the region's current enroll-ment ratio of 55 percent will need to be in-creased significantly. Annex 3 provides a set ofillustrative enrollment, financing, and teacherneeds projections for countries in the region,based on the current secondary level enrollmentratios in each country, the current and projectedschool age population, and the definition of sec-ondary education used in each country. Table 10summarizes the results of the regional projec-tions.
These projections are based on a number of re-gion-wide assumptions about secondary educa-tion which may not be appropriate to individualcountries. For example, the projections assumethat to keep up with social demand as well aseconomic needs, gross enrollment ratios would
need to increase by 20 percent to the year 2010,to about 75 percent. This is consistent with therecommendations of the Santiago Summit, butwould be an enormous increase, considering thatthe enrollment ratio increased by only 4 percentbetween 1985 and 1995. The projections furtherassume a 50 percent real increase in unit costs toimprove quality. It could be argued that a 50percent increase in unit costs is inadequate,since this would barely cover improvements inteacher salaries and leave little over for educa-tional materials. The projections assume that thecost of the construction of one student place is$1,000 and that student/teacher ratios will re-main steady in each country. It should be em-phasized that there is nothing definitive aboutthese projections; rather they are designed toprovide rough orders of magnitude about possi-ble objectives for growth and quality improve-ment in the region. Every nation will need to doits own, far more detailed projections. For ex-ample, alternative projections could be madewith a higher increase in unit costs and moremodest enrollment increases.
Table 10Summary of Regional Enrollment and Cost Projections
Item 1995 2010Gross enrollment ratio 55% 75%School age population 46 million 49 millionEnrollments 25 million 36 millionUnit expenditure $498 $754Total current expenditure $11.6 billion $16.5 billionExpenditure as a percent of GDP 0.6% 0.8%Capital cost needs 1995-2010 for increased enrollment $11 billionStudent/teacher ratios 15.6 15.6Teachers 1.8 million 2.6 millionNew and replacement teachers to be trained 1995-2010 1.8 million
28
34
Even with these caveats, the exercise shows thatthe region as a whole could increase the grossenrollment ratio in secondary education by 20percent (equivalent to enrolling 36 million stu-dents in the year 2010 compared to 25 million in1995),1O and also increase unit costs by 50 per-cent; at a cost of 0.2 percent of GDP (increasingthe percentage of GDP devoted to secondaryeducation from 0.6 percent to 0.8 percent). Thisimprovement is possible not only because ofhoped for economic growth (it is assumed thatGNP growth would continue at 3.0 percent perannum) but also because the school age popula-tion will increase only 8 percent over the period1995-2010 (from 46 million to 49 million). In afew countries, such as Brazil and Uruguay, thesecondary school age population may actuallydecline. With this decreasing burden of depend-ency, Latin America has a window of 20 yearsto invest in social infrastructure. However, be-cause of continued population growth and cur-rent low enrollment ratios, some of the poorercounties (e.g., Guatemala, Honduras, and Nica-ragua) will not be able to meet these ambitioustargets.
The projections assume no change in stu-dent/teacher ratios, which currently average15.6:1 in the region, based on official figures.11Assuming this is correct, and assuming replace-ment needs of five percent per annum, the re-gion would need to train 1.8 million new teach-ers between 1995 and 2005. In addition, thecapital cost for construction of new schools isestimated at over $11 billion, not including thereplacement or upgrading of existing schools.
While it appears that Latin America can meetambitious goals for secondary education, low-ered economic growth could put the attainmentof these objectives in jeopardy. In addition, itwill be important to pay attention to cost-efficiency, especially student/teacher ratios,
10 In Brazil the length of secondary education is threeyears. If secondary education were six years inlength, then an additional several million studentswould need to be enrolled in the region." It is possible that many teachers in Brazil, Argen-tina, and Venezuela are double counted because theymay be teaching in two different schools.
since a decrease in student/teacher ratios wouldhave an important impact on expenditures.
In any event, the increased numbers of studentsattending and finishing secondary education andgoing on to university mean that the average"knowledge" base of the population is rising.This is important, since studies of studentachievement show a strong positive relationbetween additional years of schooling and per-formance on achievement tests, even when earlyaptitude is accounted for (see, for example,Knight and Sabot, 1987). The salary incentivesin the labor market push individuals and thepublic sector to invest in more schooling.
While the planning exercise does not differenti-ate between lower and upper secondary educa-tion, it is clear that the quantitative needs of eachcountry vary significantly. The focus of thelower income countries, as well as states withinlarger countries, will be on expanding access tolower secondary education; for higher incomecountries, the focus will be on reaching under-served populations in lower secondary educationand on overall expansion of upper secondaryeducation.
The increase in enrollment in each country willdepend on its socioeconomic conditions andoutlook, as well as on the rigor with whichcountries identify cost-effective solutions. Mostcountries in the region have already embarkedon secondary school expansion programs.
Along with quantitative increases, countries willneed to implement proactive policies targetingthe poor and underserved. These policies couldinclude: 1) targeted school construction in un-derserved urban slum and rural areas; 2) morerecurrent funding and assistance, includingteacher incentives, to schools in rural and urbanslums; 3) financial and other incentives for mo-tivated teachers and principals to work in under-privileged areas; 4) distance education for hardto reach groups (rural people and young adults);and 5) in some cases, direct financial support tolower income students to cover the cost of fore-gone wages (in the form of, say, textbook subsi-dies). Most countries are targeting their publicschool construction efforts, and a few (Mexico,
29

El Salvador, Brazil) are using distance educationfor hard to reach populations. But very few areproviding increased funding, including monetaryand other incentives to qualified teachers, toteach in urban and rural slums. El Salvador isinitiating a program of financial support forneedy secondary school children.12
SEEKING COST EFFECTIVENESS INSECONDARY EDUCATION
Given the region's recent economic perform-ance, there is not necessarily a contradictionbetween quality and quantity. In the first place,many improvements in quality are not costlysince they require more effective input mixesrather than vastly increased unit costs. In thesecond place, it is entirely possible that the re-gion can achieve quantitative and qualitativetargets if economic growth continues at close tothe pace reached between 1990 and 1996 of 3.2percent per annum.13 Qualitative targets are notincompatible with quantity not only because ofbetter economic performance, but also becauseof the demographic transition now taking placewhich has led to a slowdown in the rate ofgrowth of the school age population. In addition,qualitative improvement may well reduce quan-titative pressures since higher quality shouldreduce repetition rates.
Nonetheless, it is important to seek the mostcost-effective mixes of inputs in order to achieveboth quantitative and qualitative goals. Appliedresearch is needed to begin to understand theseissues but, as noted above, research on whatworks in terms of achievement and retention (tosay nothing of labor market performance) is justbeginning. Even with the current paucity of re-search and good indicators, it is possible toidentify a number of measures that would reducerelative costs including policies related toteacher utilization, student contact hours, repeti-tion, distance education, and the role of privateeducation.
12 But monetary rather than in-kind subsidies arerisky since they may lead to expectations of expen-sive entitlements for the less than needy." Economic growth will be nil in 1999 but shouldrebound in the following years.
30
Defining Policies on Student/teacher and Stu-dent Class Ratios
Student/teacher ratios are by far the most im-portant element affecting unit costs. In nearly allLatin American countries it appears that stu-dent/teacher ratios are not excessively high; butthere is a tendency to reduce student/teacherratios without any explicit policy or guidelines.At the same time, most international studieshave shown that within a class size range of 20to 40 students there appear to be little differ-ences in learning. In fact, Korea, with among thehighest scores on international tests, has had formany years a class size of 40 students in secon-dary education.
Student/teacher ratios are based on a combina-tion of student class size, number of studenthours per week and number of teaching hoursper week. For example, Table 11 shows threeways to achieve a ratio of 16 students perteacher. The number of teaching hours per weekcould range from 15 to 31 and the student classratio could range from 18 to 36, while using thesame number of teachers.
It will be important to keep track of all of theseelements and to establish national, regional, orlocal guidelines on the combination which ismost appropriate for achieving the maximumlearning at the minimum cost. This will also re-quire better statistics on teachers, especiallythose working at more than one school. A widevariety of policies can be considered. For exam-ple, there is anecdotal evidence that many teach-ers spend too many hours per week teaching,usually in different schools, with a resulting lackof time for classroom planning. Agreementscould be reached to increase class sizes, ensurethat teachers work in only one school, and util-ize the savings from larger classes to provideteachers with paid, in-school planning time(similar to alternative C above). In addition, av-erage school size, restrictions with regard tosubjects teachers are permitted to teach, and
36

Table 11Policy Alternatives in Teacher Utilization
Three Ways of Reaching a Student /Teacher Ratio of 16:1
Alternative A Alternative B Alternative CStudent Hours Per Week 30 35 34
Teaching Hours per Week 20 31 15
Student Class Size 25 18 36
Student/teacher Ratio 16 16 16
policies on minimum and maximum hours ofteaching in single or multiple schools can alsohave an impact on student/teacher ratios.
Alternative Means of Increasing StudentContact Hours
While in many Latin American countries (butnot in the English-speaking Caribbean) it is im-portant to increase the hours students spend ac-tively learning in secondary school, a vast andexpensive construction program (doubling thenumber of physical facilities to eliminate doubleshifting), as Chile has recently undertaken, is notthe only option. In the first place, increasing thelength of the school year will require no in-creased capital expenditure and could have amajor impact on learning. Ending the habit oflong strikes will also achieve similar goals withlittle incremental costs. In addition, time on task
can be increased by simply giving students morehomework, which has been shown in manystudies to have a positive impact on studentachievement. There is already adequate time,even on a double shift (four and a half hours perday-7:30-12:00, 12:30-5 pm) for direct aca-demic instruction. Additional time will have tobe found for the other elements of a wellrounded secondary educationsports, art, mu-sic, social relationships, and community service,which could be undertaken outside schoolbuildings. In short, in most countries it is appro-priate to define a mix of cost effective policiesto increase time on task. Single shift with fullfacilities is an option only where economicgrowth is long standing and other social goalsare affordable. Box 3 provides an example of aprogram undertaken in Uruguay to rationalizeteacher utilization as well as to increase studentcontact hours.
Box 3Teacher Rationalization in Uruguay
In 1996 Uruguay implemented a program of rationalization of school time and teacher utilization that nearly paysfor itself. The objective was to increase the number of hours in school of both students and teachers. Specifically,Uruguay increased the number of daily hours in school from three hours and 45 minutes to five hours and 30minutes, the length of each class rose from 35 to 45 minutes, and the time for sports and recreation from 15 min-utes to 60 minutes, with the result that all three shift schools became two shift schools serving the same numberof students. The increased time for teachers in school resulted in a 12.5 percent increase in teacher salaries, aswell as increases in the time for support staff. A bonus system was instituted to reduce absenteeism. Savings wereachieved through modest increases in the student class ratios (the number of students per class was increasedfrom 29:1 to 31:1), reducing the number of administrative staff (since double rather than triple shifts were ad-ministered) and expected reductions in teacher absenteeism. (IDB, 1996)
31 3 0

Reducing Repetition
Policies which reduce repetition and dropoutrates will also lead to major savings on recurrentcosts. Secondary school repetition may be serv-ing the same negative purpose that it does forprimary education, as a "substitute" for peda-gogical quality and for an understanding of stu-dents' learning problems. As in primary educa-tion, students who repeat are much more likelyto drop out. The first step is to develop an in-formation system to identify the extent and thenthe causes of repetition. Brazil has made enor-mous progress in measuring repetition and flowrates, but many other countries are lagging.
Using Distance Education
As noted, distance education has been shown tobe a cost-effective means of extending coverageat low costs than traditional secondary educationto the underprivileged and underserved, espe-cially in rural areas, but also for adults. Mex-ico's Telesecundaria program, described below,has a long history of providing access in ruralareas to secondary education at lower costs perstudent than conventional secondary education.Brazil's Telecurso 2000, which has not yet beenfully evaluated, is directed to young adults whoare seeking secondary school equivalency. Dis-tance education around the world has also beenshown to be a cost-effective means of in-serviceteacher training.
Benefiting from Private Investment inSecondary Education
Public secondary education will need to remainmainly free, to improve quality, and to attractthe middle class back. At the same time, gov-ernments can rely on private education to reducethe burden on public funds as well as to providediversity, increased choice, and, possibly,greater cost effectiveness. A wide variety of op-tions (buying places, vouchers, teacher second-ment) are available. In terms of capital expen-ditures, efforts could be made to increase theaccess of private institutions to credit marketsfor school construction, and the governmentcould restrain from building public schools in
32
middle- and upper-class localities. Chile andColombia have already undertaken broad ex-periments in secondary level vouchers, and theprivate Fe y Alegria programs in several coun-tries have benefited from government supportwith very positive and cost-effective results.Support and regulation of private educationmust be designed to encourage efficiency aswell as to ensure equity. To illustrate the com-plexity of issues with regard to regulation ofprivate secondary schools, one study on Chile(Carnoy, 1998) showed that private secondaryschool vouchers increased social inequities; inaddition, as levels of public funding have in-creased, the cost advantages of private schoolsin Chile decreased.
Systematically Measuring Costs
Finally, while it is always difficult to measurethe effectiveness of quality enhancing measures,it is relatively easy to measure costs, although itis rarely done. The costs of proposed qualityenhancing interventions should be measured.Table 12 shows estimates of the costs of severalsecondary school interventions in a typical LatinAmerican country.
CREATING PARTNERSHIPS AND ASYSTEMS APPROACH
Governments must be prepared to fund much ofthe capital costs associated with expanding ac-cess to secondary education, including the con-struction of physical facilities, provision ofequipment, and teacher training. Equally, gov-ernments must commit additional resources tofund current expenditures. Given the enormousneeds, governments must act in partnership withother stakeholders, especially parents, privateeducational institutions, labor unions, and theprivate productive sector to meet financialneeds, raise learning standards, revise curricu-lum and improving working conditions. It willbe particularly important to enlist teachers' un-ions in the reform efforts, to share financial re-sponsibility with private institutions and withparents, and to seek advice from businessmen onthe desired characteristics of secondary schoolgraduates who will be entering the labor force.
38

Table 12Estimated Costs of Selected Interventions in Secondary Education
Intervention% Increase in UnitExpenditures (est.)*
One hour per week access to computers 13
Raise teachers salaries by 10% 9Free school lunch for all 30Free textbooks to all 13
One additional hour of schooling per day 15MIS to identify low performing schools 0.3Four weeks of in-service training 10In-school vocational training 100Increase homework given to students 0Single shift school construction and 6 hrs ofinstruction per day
43**
(*) It assumes 20:1 student/teacher ratio and $400 expenditures per student per year.(**) Including annualized cost of school construction.
Secondary school expansion should always beaccompanied by government and stakeholderattention to reforms that improve quality, in-crease equity and efficiency, better school man-agement, and are more relevant to changing cli-entele, labor market and social needs. The spe-cific nature and content of these reform effortswill depend on country conditions. Among theelements to which governments and stake-holders must provide most attention are the fol-lowing:
Redefining the model of secondary educa-tion in accordance with the new demands ofthe labor market and the clientele. This in-cludes new approaches to technical/voca-tional education and defining a new com-mon core of curriculum. However, curricu-lum reform must not be an end in itself andshould be integrated into a wide variety ofpolicies that promote quality, equity, and ef-ficiency.
Attention to cost effective mixes of inputs toachieve quality improvement goals, includ-ing appropriate student/teacher ratios, inex-pensive school construction, optimumschool sizes, distance education, partner-ships with private institutions, and fundingbasic school inputs like libraries, scienceequipment and copying machines before thelarge-scale purchase of computers.
Strategies to attract higher quality teachersto the profession; reform teacher training;provide in-service training that is hands-on,practical, and classroom based; adaptationand testing of new and better teaching mate-rials; and provide greater autonomy toschools while also making them accountablefor the results;
Attention to equity, that is, explicitly de-signed policies to provide school places ofgood quality to lower income students, aswell as developing outreach programs foryoung adults seeking secondary schoolequivalency.
Institutional capacity building and sustai-nability; client, beneficiary, and stakeholderownership; knowledge about the issues andoptions of education reform and their rela-tionships to the larger socioeconomic con-text; simple but robust monitoring andevaluation instruments; a process rather ablueprint approach for education reform;better assessment, statistics, applied researchand feedback to stakeholders; and pilot proj-ects, experimentation and innovation ratherthan wholesale implementation of untestedideas.
33
33

References
American Federation of Teachers (AFT) and NEA, Peer Assistance & Peer Review. 1998. Shaping theProfession that Shapes the Future. AFT/NEA handbook. Conference on Teacher Quality, Sep-tember 25-27, 1998. Washington, D.C.
Berhman,J., N. Birdsall and M. Szekely. 1998. Intergenerational Schooling Mobility and Macro Condi-tions and Schooling Policies in Latin America. Office of the Chief Economist Working Paper#386. Washington, D.C.: Inter-American Development Bank.
Birdsall, Nancy. 1998. Education, the People's Asset. Washington, D.C.: Inter-American DevelopmentBank.
Butelman, A., and P. Romaguera. 1994. Educaci6n media general vs. tecnica. Retorno economic° y de-sercion. Corporacion de Investigaciones Economicas para Latinoamerica, CIEPLAN.
Braslaysky, C. 1998. La educacion secundaria en la Argentina: 1Desafio cuantitativo o cualitativo?Criterios generales, dispositivos y desarrollos para el proximo siglo. Ministerio de Cultura yEducacion de Argentina. Buenos Aires, Argentina.
Cariola, M. L. La educacion secundaria en proceso de masfficacion. Un desafio para la regi6n. Centrode Investigacion y Desarrollo de la Educacion (CIDE). Santiago de Chile.
. Dilemas sobre la reestructuracion de la educaci6n media. Centro de Investigacion y De-sarrollo de la Educacion (CIDE). Santiago de Chile.
Carnoy, M. 1998. National Voucher Plans in Chile and Sweden: Did Privatization Reforms Make forBetter Education? Comparative Education Review, No. 42, August 1998.
Castro, Claudio de Moura. 1997. 0 secundario: esquecido em um desvao do ensino. Ministry of Educa-tion, Brazil. Brasilia.
Castro, Claudio de Moura, M. Carnoy, and L. Wolff. Forthcoming. Secondary Schools and the Transitionto Work. Washington D.C.: Inter-American Development Bank.
Centro de Investigacion y de Estudios Avanzados del Instituto Politecnico Nacional. 1994. Programapara abatir el rezago educativo. Evaluacion cualitativa del impacto. Informe final. Mexico.
Cerda, A. M., V. Edwards, and M. V. Gomez. 1995. Algunos aspectos de las practicas de trabajo y so-cializacion en establecimientos de enserianza media. Reference paper for the Workshop Seminar"Reforma de la educacion media en Chile: i,Mas equidad?" Santiago de Chile, April 10-11, 1995.
Corriere della Sera. Milan, August 7, 1999, p. 7.
Council of Europe. 1999. Council of Europe Committee of Ministers Recommendation No. R (99) 2 ofthe Committee of Ministers to Member States on Secondary Education. Adopted by the Com-
34 40
mittee of Ministers on January 19, 1999 at the 65th meeting of the Ministers' Deputies. Stras-bourg, France.
Crouch, L. 1995. Financing Secondary Expansion in Latin America: An Estimation of Magnitudes Re-quired, and Private and Decentralized Options. North Carolina: Research Triangle Institute.
ECLAC. 1995. Calidad y equidad de la educacion media en Chile. Santiago de Chile.
. 1995. Educacion media y las oportunidades ocupacionales en Chile. Santiago de Chile.
. 1995. La equidad en la educacion y el trabajo: Algunas especificidades de genero. Santiago deChile, April 10-11, 1995.
. 1995. El Mece-Media: Mejorar la calidad para incrementar la equidad. Santiago de Chile,April 10-11, 1995.
. 1995. Educacion tecnica, equidad y movilidad. Santiago de Chile, April 10-11, 1995.
Epstein, E. H., ed. 1998. Comparative Education Review. Vol. 42. Ohio State University
Golladay, Frederick, et al. 1996. A Human Capital Strategy for Competing in World Markets. In Towardsthe Twenty First Century: A Long-Term Development Strategy for the Middle East and North Af-rica. Washington, D.C.: The World Bank.
Gomez, V.M. 1993. El valor social, ocupacional y formativo de la educacion tecnica secundaria en Co-lombia. Revista Colombiana de Educacion. No. 27, p. 97. Santa Fe de Bogota, Colombia.
Gomez, V.M., C. Turbay, G. Acosta, and E. M Acuna. 1993. El valor social, ocupacional y formativo dela educacion tecnica secundaria en Colombia. Estudio cualitativo de instituciones en cuatro areasurbanas del pais. Santa Fe de Bogota, Colombia.
Government of Brazil, Ministry of Education. 1998. Diretrizes Nacionais Para a Organizacao Curriculardo Ensino Medio. Brasilia, 1998.
. 1998. Avaliacao de Concluintes do Ensino Medio. Bahia, Goias, Pernambuco, Parana,Rio Grande do Norte, Rio de Janeiro, Rondonia, Sergipe, Sao Paulo. Brazil.
. 1997. Avaliacao do Ensino Medio e Acesso ao Ensino Superior. PROMED. Trabalhosapresentados no Seminario Internacional 30 junho a 2 julho 1997. Brazil.
. 1997. Programa de Melhoria e Expansao do Ensino Medio. Brasilia.
. 0 Novo Ensino Medio. Brazil.
. 1998. Relatorio Final 98. Exame Nacional Do Ensino Medio ENEM. Brasil.
Government of Chile, Ministry of Education. 1995. El liceo por dentro: Estudio etnografico sobre prcicti-cas de trabajo en educacion media. Santiago de Chile, Chile.
Government of El Salvador, Ministry of Education. 1995. Lineamientos para el cambio cualitativo delnivel de educacion media. Nueva San Salvador, El Salvador.
35
41

. Lineamientos para la evaluacion del aprendizaje en educacion media. Direccion Na-cional de Education. El Salvador.
Government of Venezuela, Consejo Nacional de Educacion. 1997-1998. Compromiso educativo na-cional. Calidad para todos. Caracas, Venezuela.
Government of Venezuela, Ministry of Education. 1997. Propuesta para la reorientacion del nivel deeducacion media diversificada y profesional. Oficina Sectorial de Planificacion y Presupuesto.Comite de Gestion. Caracas, Venezuela.
Fletcher, P. R. Secondary Education in Brazil: Does Education Quality Enhance Learning and ReduceRepetition? PROFLUXO International, Rio de Janeiro, Brazil.
France, Ministry of National Education. 1993. L'enseignement secondaire en France. General AffairsOffice, France.
Fuller, B., and P. Clarke. 1994. How to Raise the Effectivness of Secondary Schools? Universal and Lo-cally Tailored Investment Strategies. Education and Social Policy Department. ESP DiscussionPaper Series No. 28. Washington D.C.: The World Bank.
Ibarrola, M. 1996. Siete politicas fundamentales para la educacion secundaria en America Latina. Situa-cion actual y propuestas. Direcci6n General, Fundaci6n SNET para la Cultura del Maestro Mexi-cano, A.C. Mexico. Document presented at the Meeting of Ministers of Education of LatinAmerica and the Caribbean, Jamaica, May 1997.
Inter-American Development Bank. 1997. Honduras. Propuesta de prestamo para un programa deapoyo a programas alternativos de educacion basica y al tercer ciclo de educacion basica.Washington, D.C.
. 1996. Brazil: Proposal for a Loan to the State of Parana for a Secondary Education Im-provement Program in the State of Parana. Washington, D.C.
. 1996. Brazil. Proposal for a Loan to the State of Parana for a Secondary Education Im-provement Program in the State of Parana. Washington, D.C.
. 1997. Costa Rica. Proposal for a Loan for Preschool and Lower Secondary EducationProgram. Washington, D.C.
. 1995. Dominican Republic: Proposal for a Loan for the Second Stage ofa Basic Educa-tion Improvement Program. Washington, D.C.
. 1998. El Salvador: Proposal for a Loan for a Support Program of Education Technolo-gies. Washington, D.C.
. 1997. Guatemala. Proposal for a Loan to Support Education Reforms. Washington, D.C.
. 1997. Honduras. Proposal for a Loan to Support Alternative Basic Education Programsand Middle School Education. Washington, D.C.
. Mexico. Distance Education Program (ME-0052). Loan Proposal. Washington, D.C.
36
42

. 1997. Panama. Proposal for a Loan for an Educational Development Project. Washing-ton, D.C.
. 1996. Uruguay: Proposal for a Loan for a Secondary Education Modernization Pro-gram. Washington, D.C.
Herrin, Carlos, and Alberto Rodriguez Pinzon. 1999. Brazil: Secondary Education Sector Study. Wash-ington, D.C. Under preparation.
Jimenez, Emmanuel, and Marlaine E. Lockheed. 1995. Public and Private Secondary Education in De-veloping Countries, A Comparative Study. Discussion Paper #309. Washington, D.C.: The WorldBank.
Kallen, Denis. 1997. Secondary Education in Europe: Problems and Prospects. Strasbourg: Council ofEurope Publishing.
Knight, J.B. and R.H. Sabot. 1987. Educational Policy and Labor Productivity: An Output AccountingApproach. Economic Journal 97 (March): 199-214.
Krueger, Alan B. 1999. But Does it Work. New York Times, November 7, Education Review, p. 46.
Laurier, M., and J. Cloutier. Evaluacion del impacto del componente de informatica educativa dePROMECE. Ministerio de Educacion Pablica de Costa Rica. Universite de Montreal, Canada.
Lee, Kye Woo. 1998. An Alternative Technical Education System: A Case Study of Mexico. The Inter-national Journal of Educational Development. Also World Bank Discussion Paper No. 9811.Washington, D.C.
Montero L., P. 1993. Diagn6stico de la educaci6n tecnico-profesional y una estrategia de cambio cu-rricular. Centro de Investigacion y Desarrollo de la Educacion. Santiago de Chile.
Navarro, J. C. Peru's Approach to Secondary Education Reform: The New Bachillerato.
Operti, R., G., De Armas. 1998. Analisis de la desercion en el primer alio del ciclo basic° de educaciOnsecundaria en Montevideo: Una aproximacion a los factores causales y a los cuadros actitudi-nales del abandono liceal. Cuadernos de trabajo. Serie Estudios Sociales sobre la Educacion.October, No. II. Administracion Nacional de Educacion Publica, Consejo Directivo Central.Montevideo, Uruguay.
OECD. 1992. Pathways for Learning, Education and Training from 16 to 19. Paris.
Pascual K.E., and R. Navarro. 1992. Informe final de la linea de accion No.1 . Estudio de la incidencia dela formacion inicial en el desempelio profesional de los profesores de educacion. media. ProyectoMECE/MEDIA, Requerimientos para la formacion de profesores de educacion media. ConsorcioFacultad de Educacion de la PUC y Otros.
Pineros Jimenez, L. Jaime and A. Rodriguez Pinzon. 1998. Los insumos escolares en la educacion se-cundaria y su efecto sobre el rendimento academic° de los estudiantes: Un estudio en Colombia.LCHSD Paper Series 36. Washington, D.C.: The World Bank.
37 43
Pontificia Universidad Catolica de Chile, Ministerio de Educacion. 1993. Proyecto MECE IV.2 Destinoeducativo laboral de los egresados de enseilanza media. Chile.
Rojas F., A., and C. Cardemil 0. 1992. Calidad de la ensenanza media. Un estudio de caso. Centro deInvestigacion y Desarrollo de la Educaci6n (CIDE). Santiago de Chile.
Secondary Education. 1999. Towards a Vision and Policies for Reform. Draft Proposal for CollectiveAction, UNESCO.
Schakmann C., L., S. Zepeda, and E. Toro. 1992. Encuesta internacional sobre la situacion de la forma-cion cientifica en la enseiicmza secundaria. Instituto Internacional de Planificacion de la Edu-cacion. UNESCO. Santiago de Chile.
Schmidt, Wiliam E. et al. 1998. Facing the Consequences, Using TIMSS for a Closer Look at UnitedStates Mathematics and Science Education. Boston: Kluwer Academic Publishers.
Shanker, Albert. 1994. Where We Stand: The Chicago Reform. New York Times. April 7. Editorial sec-tion.
Sindicato Nacional de Trabajadores de la EducaciOn. 1994. Documentos de trabajo para su discusion.Secundaria. Los cambios en la educacion bcisica. Primer Congreso Nacional de Educacion"Educacion pablica de calidad y trabajo docente profesional: El compromiso sindical." Mexico.
Thulstrup, E. W. School Laboratories in Developing Countries: Are they Worth the Effort and Expense?
UNESCO. 1998. World Education Report 1998. Paris: UNESCO.
. 1995. World Education Report 1995. Paris: UNESCO.
. 1997. Statistical Yearbook. Paris: UNESCO.
United Nations. 1996. The Sex and Age Distribution of the World Populations. New York: The UnitedNations.
United Nations, Economic Commission for Latin America and the Caribbean (ECLAC). 1996. The Stra-tegic Role of Secondary Education in Achieving Well-Being and Social Equity. Document pre-sented at the Seventh Regional Conference of Ministers of Education for Latin America and theCaribbean, May 13-17, Jamaica.
. 1995. Informe del Seminario-Taller sobre reforma de la educacion media en Chile: iHa-cia una mayor equidad? Santiago de Chile, April 10-11.
Universidad de Santiago de Chile, Departamento de Economia. 1993. Evaluacion economica de la edu-cacion media en Chile. Proyecto MECE/MEDIA IV.3, Informe Final. Santiago de Chile.
Vexler, Idel, et al. 1997. La educaciOn secundaria de adolescentes en el Perk Foro Educativo. Lima,Peru.
Wolff, Laurence. 1998. Costa Rica: Computers in Education. In Education in the Information Age, ed.Claudio de Moura Castro. Washington, D.C.: Inter-American Development Bank.
38
44

World Bank. 1998. Project Appraisal Document, Third Secondary Education Project, the Province ofBuenos Aires, Argentina. Washington, D.C.
. 1993. Staff Appraisal Report, Colombia, Secondary Education Project. Washington, D.C. .
. 1995. Staff Appraisal Report, the Dominican Republic, Second Basic Education Develop-ment Project.
. 1997. Staff Appraisal Document, El Salvador, Secondary Education Project.
. 1999. World Development Indicators 1999. Washington, D.C.: The World Bank.
. 1998. World Development Indicators 1998. Washington, D.C.: The World Bank.
.1995. World Development Indicators 1995. Washington, D.C.: The World Bank.
345

Annexes
46

Annex 1Sector Studies of Secondary Education in the Region
A number of detailed country studies of secondary education have recently been undertaken which pro-vide analyses of the situation on a country-by-country basis, mainly using statistical approaches (e.g.,flow models, financing and costs, enrollment ratios, multivariate statistical analysis ofcorrelations, etc.).World Bank and IDB appraisal and sector reports summarize the results of these studies, which are de-scribed below.
In the Brazilian state of Parana repetition in 1995 averaged 17 percent in the ninth and tenth grades, and29 percent of students dropped out in the first year of secondary education (IDB, 1996). Only 47 percentof beginning students completed secondary education and they took an average of 4.7 years to completethe three-year course. In 1995, 40 percent of students were enrolled in general education. Fifty-eight per-cent were enrolled in teacher preparation and commerce. Sixty-eight percent of students attended secon-dary school at night. Eighty percent of teachers were university graduates (licenciados), textbooks werevirtually nonexistent, libraries were severely lacking, and computers were unavailable to students. Notone public secondary school was actually built for that purpose. Lack of maintenance was endemic. Mostschools enrolled less than 400 students. In 1994, $133 was spent per student compared to $237 at primarylevels and $2,631 at the state's higher education level. Less than $8 was spent on nonsalary recurrent ex-penditures.
A review of public secondary education in Uruguay in 1996 (IDB, 1996) revealed that only eight percentand 11 percent of public secondary school students passed national mathematics and Spanish achieve-ment tests, compared to 40 percent and 50 percent of students in private schools. Repetition was esti-mated at 11 percent and dropout at 13 percent for lower secondary school. Public schools mainly servedthe lower and middle classes. Thirty-six percent of students in public institutions were in the lowest in-come quintile, while only seven percent were in the highest quintile. The curriculum consisted of 12 sub-jects within a school day lasting no longer than 3.5 hours. Many schools ran three and even four dailysessions. Because of the structure of the system teachers were required to divide their time among severaldifferent schools. Teacher salaries averaged $400 per month. School management was highly centralized.Student/teacher ratios were a relatively low 16:1 (20 hour teaching load). There was evidence of signifi-cant teacher absenteeism. Teacher pay was not based on qualifications, merit, or performance. There wasno monetary advantage to being a school principal. Only 31 percent of teachers were qualified.
Studies of secondary education in Colombia in 1992 (World Bank, 1992) identified low enrollment ratios(46 percent) as a key problem. Most public secondary schools operated on two and three shifts. Becauseof a lack of places, the government initiated a voucher system for students to attend private secondaryschools. Repetition rates averaged 16 percent. In many rural areas, secondary education did not extendbeyond grade nine. The majority of Colombia's teachers had a university degree. While textbooks wereof reasonable quality, most public secondary students had only one or two textbooks. Libraries were ex-tremely limited, laboratories were usually unavailable or underutilized. On average, private secondaryschools cost 10 percent less per student than public schools (Jimenez and Lockheed, 1995). Even aftercontrolling for social class and selection discrimination, students in private schools in Colombia hadhigher achievement than those in public schools.
Studies of secondary education in Chile undertaken in the early 1990s (summarized in World Bank 1995)identified inadequate linkages of technical vocational schools with the productive sector and 12 percentrepetition rates, resulting in an average time of 5.3 years to complete the four year course. Public schoolstudents answered correctly only 39 to 48 percent of the questions on a standardized Spanish test based
43
47

on the official curriculum and only 20 to 29 percent of the questions on a mathematics test, compared to40 to 50 percent for private schools. Frontal teaching, drilling, rare use of textbooks, poor presentation ofmaterials, and inadequate integration with students experiences were endemic. Textbooks were inade-quate and often unused. Ninety-six percent of upper income students attend secondary school comparedto 52 percent of rural school children. Compared with other countries in the region, the gross enrollmentratio in Chile was high (76 percent).
A review of secondary education in Mexico (IDB, 1997) showed that demand for middle school (grades7 to 9) was increasing rapidly but there were over 10 million Mexicans without nine years of education,of whom 10 percent wished to continue their studies. Large numbers of students still dropped out of mid-dle school. Night school programs were particularly inefficient, with only 51 percent of the cohort even-tually graduating. The demand for high school education was expected to rise sharply by 2004.
A study of secondary education in El Salvador (World Bank, 1997) found that enrollment rates were only29 percent, compared to 53 percent for the region as a whole. Secondary school services were concen-trated in urban areas, especially in San Salvador. Lack of financial resources contribute to low enroll-ment. Among those not in school, some 37 percent had to work. Direct costs of secondary education inpublic schools were estimated at US$229. Scores on a national achievement test averaged 45 percent formathematics and 48 percent for language. There were no adequate accreditation and quality controlmechanisms for private schools. More than 90 percent of expenditures went to salaries. The secondarysystem in 1997 was highly centralized, in contrast with the decentralized primary school system.
A study in Colombia (Pineros and Rodriguez, 1998) of students who took the ICFES examination foren-trance into higher education, at the end of secondary school grades, used a "Hierarchical Linear Model"to identify the impact of individual, school and process variables on student achievement. With regard tostudent characteristics, the following items had positive impacts on student learning: 1) student's socio-economic background, and 2) students' persistence in one school. The socioeconomic background has astronger impact on language scores than on mathematics scores. With regard to school variables, 1) pri-vate schools had a much greater variance than public schools; 2) after controlling for the socioeconomicbackground, public schools scored higher than private schools; 3) the school accounts for between 15percent and 18 percent of the variance in private schools and between 12 percent and 16 percent of thevariance in public schools; 4) the higher the amount of payments made by parents in public schools thelower the scores (this is explained by the fact that the less prestigious public schools appear to requiremore parental assistance); 5) the amount paid in private schools had no impact on scores; 6) students insingle shift full-time schools scored higher than students in double shift schools (these students spent 30percent more time in school); the availability of workshops had little effect on student scores; and 7) pro-vision of textbooks had no impact on scores (but it should be noted that in nearly all cases students pur-chased their own textbooks).
A study undertaken in Brazil (Herrin and Rodriguez, 1999) provides the most recent results and mostsophisticated analysis. The study concludes that demand for secondary education largely depends oncontinued improvement of flows at the primary level. Different Brazilian states are at different stageswhich suggests different degrees of readiness for secondary education expansion and different types ofinvestments. Although universal access to primary education has been largely achieved, Brazil is far fromachieving universal basic education (grades 1 to 8). Only one in two Brazilians actually finish the 8thgrade and they take 11.2 years to do so. The main challenge remains to continue to reduce repetition ra-tes. At the Ensino Medio level, the main challenge is dropout, not repetition. Dropout is strongly linkedto large grade-age gaps (result of high repetition in primary) and to the inadequacy of teaching methodsand materials for young working adults (relevance and quality of secondary education). The expectedtrade-off between study and work and the rising opportunity cost with age do not seem to be among themain factors associated with secondary dropout. This is so because the majority of students work and stu-
48
dy simultaneously (over 60 percent attend night schools), and there is a statistically significant effect ofrising educational demands from the labor market and higher wages for higher education acting as an"accelerator" for demand for secondary education. Family variables, notably parent's education, arestrong predictors of the educational progress of their children. It would take an additional R$4,000 percapita to compensate for the effect of a one year difference in parents' education on the probability thattheir children will complete secondary education. This means that income support programs, as a tool forreducing droput are costly and of limited effectiveness, given the very poor quality of public secondaryeducation available to the poor (particularly in night schools). The benefits of "universally" designedprograms to improve educational outcomes do not reach the poor adequately (for example, in schoolsnacks). The notable exception is the livro didatico, a program which is both well targeted and effectivein improving learning outcomes. Most of the innovative experiences documented among secondaryschools so far are of a narrow pedagogical scope. There is little innovation in terms of school manage-ment, outside of a few private schools. Students in "night" schools, which account for 60 percent ofen-rollment, score much lower on national achievement tests than those in day schools; boys score higherthan girls in mathematics; younger students score better than older students;students in daytime academicand technical schools score highest. Private schools do much better than public schools but, based onavailable data, all of this effect can be explained by higher socioeconomic status of students and betterequipment and learning materials.
453

Annex 2Secondary Education Reform in Europe and the United States
EUROPE
In 1996, the Council of Europe, a cooperative association of nearly all European countries, commissioneda series of studies on secondary education reform in its member countries. In 1999, the Committee ofMinisters adopted a statement on secondary education. The statement begins with the assumption that aquality education experience must be provided to all children up to the age of 18 or 19. It then focuses on:1) a concern with the implications on secondary education of the speed and unpredictability of economicchange, a labor market where job security can no longer be guaranteed, the undermining of social cohe-sion, the need for greater awareness of the environment, and the new importance of information technol-ogy; 2) better links and a new balance between general education and technical and vocational educationand between acquiring knowledge and specific skills and developing more general key competencies; 3)considering the school rather than the class as the basic educational unit, and reorganizing the schoolaround a multidisciplinary team open to the outside world; 4) an emphasis in curriculum reform on politi-cal and social competence, abilities for living in a multicultural society, proficient oral and written com-munication, competence in the information society, and the ability to learn throughout life; 5) focussingin teacher training on interdisciplinary studies, interpersonal and social relations, developing capacities toassist students in assimilating information, developing key knowledge competencies, evaluation and self-evaluation, continuing education, and special attention to training of school heads and administrators; 6)an emphasis on the process of reform, with permanent evaluation and feedback from all stakeholders; and7) establishing a specifically European dimension of schooling, including a sprit of openness to the rest ofthe world, understanding of a common heritage, and democracy (Kallen, 1997, and Council of Europe,1999).
Italy has recently initiated a wide variety of reforms designed to catch up with the rest of Europe in termsof enrollment ratios; focus on learning, including establishing national standards and testing;and ration-alize its complex system of academic and vocational schools (Corriere della Sera, 1999).
UNITED STATES
Efforts in the United States focus on increasing levels of achievement and learning but also include aconcern with civic education and with providing more meaningful education experiences to disadvan-taged and less academically gifted children.
The US performance on the TIMSS math and science tests has been particularly disappointing at the sec-ondary school level. While fourth grade students perform reasonably well, eight graders fall behind andtwelfth graders fall even further behind. Especially in lower secondary schools, few new topics are intro-duced and existing ones are not covered in depth. Over 40 percent of high school students never take ba-sic algebra (Schmidt, et al, 1998).
A study (Bishop, 1996) was undertaken of the causes of low achievement in US high schools comparedto France, the Netherlands, and Britain. The study concluded that one of the main causes of low achieve-ment was the lack of an external subject specific examinations providing grades reported to students andteachers and reported in the students secondary school certificates. In the United States, students wereranked relative to their classmates rather than against an external criterion. Subjects were taught at vastlydifferent levels, but the results were not well signaled to interested parties. The study showed that
46
50

achievement scores in New York state were higher than in most other states because New York did havean external examination (the Regents). It showed that teachers in the United States had lower pay, worseworking conditions (more hours in schools) and lower subject matter mastery than their counterparts inEurope.
The study suggested the following actions to raise achievement scores in US high schools: 1) set externalsubject specific examinations that supplement but do no displace teacher assessments of grades; 2) pro-vide open parental choice of upper secondary schools with money following students; and 3) require highentry standards for teachers sustained by high wages and good working conditions. Other studies, in-cluding TIMSS, have shown that time on academic tasks is low.
Current reform efforts in the United States include raising standards at all levels of secondary education,with a focus on higher order skills in mathematics, language, and communication; identifying practicalways of teaching civics, and providing additional help to minority and disadvantaged students to reducedropout and ensure that they learn at levels similar to those of more privileged students, in part throughembodying mathematics and communications skills in practical programs and activities (e.g., thetech/prep approach).
47
51

Annex 3A Planning Exercise for Secondary Education in the Regionl4
This annex presents three planning exercises that highlight three secondary education subject areas inLatin America and the Caribbean: 1) enrollment; 2) current and future costs; and 3) teacher needs.
ENROLLMENT RATES
Gross enrollment and net enrollment rates were compiled from the UNESCO World Education Reports.It should be noted that countries differ greatly in their definitions of secondary education. For most coun-tries in the region, the official duration of secondary education is between four and six years; in Braziland El Salvador, it is three years and in Jamaica it is seven years.15 As shown in Table 1, as of 1995 theregion lagged behind the OECD and the developing nations of East Asia in gross enrollment ratios, withthe region averaging 55 percent compared to around 100 percent for OECD countries. The region im-proved its gross enrollment slightly (by 4 percent) between 1985 and 1995. Net enrollment ratios, whenavailable, are significantly lower than gross enrollment ratios, suggesting the enrollment of many overageyouths in secondary education. The difference is greatest in the case of Brazil, where the net enrollmentratio is 26 percent lower than the gross enrollment ratio. The main explanations are repetition in primaryeducation and/or secondary education, and voluntary late-entry or part-time study. Variations in enroll-ment rates across countries reflect differences in the demand for education and in the extent of compul-sory schooling.
At the Summit of the Americas held in Santiago de Chile, a goal was set for achieving 75 percent re-gional enrollment in secondary education by 2010. Meeting this target would mean an increase of 20 per-cent from the 1995 regional average. In Table 1, a 20 percent increase in the gross enrollment ratio wasprojected for each country for the year 2010. This increase would enable LAC to compete more closelywith OECD and Asian countries. In order to achieve such an increase in secondary enrollment, thereneeds to be a significant improvement in completion rates for primary education, which is in fact takingplace throughout the region. For example, a review of recent and projected improvements in primaryschool efficiency in Brazil and Mexico suggests that demand for secondary school places would be suchthat a 20 percent increase in secondary enrollment ratios could be called for if financially feasible.
To predict future enrollments in, the region, the applicable school age population was used. Numberswere compiled using the actual "expected" populations for 1995, 2005 and 2010 from the United Na-tion's publication, The Sex and Age Distribution of the World Population. The two most appropriate agecategories (10 to 14 and 15 to 19) were adopted. Relevant population according to official duration wasderived by dividing the total school age population figures by the number of years of official secondaryschool duration as outlined in the first column of Table 1. For the region as a whole, this figure will in-crease from approximately 46 million in 1995 to 49 million in 2010. For 1995 enrollment, the 1995 gross
14 This annex was prepared by Norma Garcia and Julissa Reynoso.15 For comparative purposes, when the Brazilian three-year secondary school system is adjusted for 6years, Brazil's1995 gross enrollment ratio increases from 45 percent to 68 percent. Enrollment figures for this estimate were com-piled using official 1995 figures from the Brazilian National Institute for Studies and Research on Education (INEP)and the Ministry of Education (MEC). The author selected the last three years of primary education and calculatedthe 1995 enrollment for a total of six years of enrollment. That figure of 13.9 million students was divided by therelevant population for a six-year school system (in this case 20.5 million). A 68 percent gross enrollment ratiodramatically alters the real numbers in current and future enrollments. Furthermore, using this figure the 1995 re-gional weighted average would be closer to 60 percent, a 5 point increase.
48
52
enrollment ratios were multiplied by the 1995 relevant population figures; for the 2010 enrollment pro-jections, the 2010 20 percent increase target ratios were multiplied by the 2010 predicted relevant popu-lation. On the basis of these calculations, the projected total enrollment increase is of approximately 11million students by the year 2010, with Brazil and Mexico accounting for the largest increase (1.4 and 2.8million, respectively). It should be noted that in nearly all countries the secondary school age populationwill increase slowly between 1995 and 2010.
CURRENT AND LONG-TERM COSTS
Overall spending on secondary education is based on the number of students enrolled. Almost all the cur-rent expenditure per pupil numbers were obtained from UNESCO's World Education Reports; however,data for Venezuela, Brazil and Peru were not available in these reports and national ministries of educa-tion statistics were used instead. As shown in Table 2, expenditures range from $67 in Guatemala and$73 in Dominican Republic, to $615 in Brazil, $664 in Mexico and $964 in Argentina, suggesting that, onaverage, the more affluent countries spend relatively more per student. Some exceptions are Venezuela,which spends $207 and Cuba, with a spending of $451 per student.
Total current expenditure was derived by multiplying current expenditure per pupil by current enrollment.The regional total amounts to $11.6 billion. Using the proposed 20 percent 1995-2010 enrollment in-crease outlined in the previous section, along with an estimated $1,000/student capital cost, an estimatedcapital cost for enrollment increase was derived. Based on the current expenditure per pupil and the 1995-2010 enrollment increase figures, the estimated cost for enrollment increase at current expenditure wascalculated. The expenditure per pupil for 2010 was calculated by increasing the current expenditure perpupil by 50 percent, estimating an average annual growth of 3.0 percent for the 1995-2010 period.
Using the total current expenditure for the region, the region currently allocates approximately 0.6 per-cent of its GNP (current regional GNP is $1,804 billion) towards secondary education. In order to keeppace with the increased enrollment and increased expenditures per student,the region would have to allo-cate an additional 0.2 percent of its GNP by 2010, assuming an annual average 3.0 percent economicgrowth rate for the 1995-2010 period. This would certainly be achievable. These increased funds wouldminimally cover higher teacher salaries and more equipment, library books, and technology. In mostcountries it would not be necessary to lower student/teacher ratios. Indeed, provided that current eco-nomic and political transitions continue, these figures are feasible targets.
TEACHER NEEDS
Education ministries and local decisionmakers need to consider a number of trade-offs in setting educa-tion budgets and determining the volume of educational activity. In the case of teaching, decisions mustencompass teacher salary levels, size of classes, designated hours of teaching time and intended instruc-tion time planned for students. The amount spent on education and the result in terms of the intensity ofstudent to teacher contact will depend on what choices are made for each of these factors. Some of thesevariants are addressed in the Table 3.
The 1995 student/teacher ratios are found in UNESCO's World Education Reports. Data for all countrieswas not available and in those cases a default number of 18, the simple average for the region, was used(the weighted average is 15.6 due to the lower averages for Brazil, Mexico and Argentina). In the case ofArgentina and Venezuela, ratios were 8:1; this may partly be due to double-counting of teachers who mayteach in two different schools. Using current student/teacher ratios, the current number of teachers wascalculated using the given 1995 enrollment numbers. The total number of existing teachers in the regionfor 1995 was 1.8 million. The additional teacher need by 2010 estimates the number of additional teach-ers needed per country to maintain current student/teacher ratios in each country. Numbers were derived
49
53
by dividing 1995-2010 enrollment increases by current student/teacher ratios. The replacement teacherneed by 2010 estimates the number of replacement teachers required to meet current existing number ofteacher figures, given a replacement rate of 55 percent. Total teacher needs by 2010 are the sum of theadditional teacher need and replacement teacher need. This is the number of teachers who will need to betrained over the 1995-2010 period.
The figures indicate that the region needs an additional 1.8 million teachers to keep up with the predictedincrease in enrollment and maintain current student- teacher ratios. Teachers are the mediators betweenthe objectives and results of the secondary school system. Hence, it is imperative to focus on this compo-nent of education policy and funding to train this large number of teachers adequately and effectively andto remunerate them appropriately.
5450

Tab
le 1
Enr
ollm
ent
Cou
ntrie
s
Gro
ss E
nrol
lmen
tR
atio
(%
of
Rel
evan
t Age
Gro
up)
Net
Enr
ollm
ent R
atio
(%)
1985
-199
5D
iffer
ence
inG
ross
2010
20%
Incr
ease
Tar
get i
nG
ross
Sch
ool A
ge P
opul
atio
n (1
,000
s)R
elev
ant P
opul
atio
n A
ccor
ding
to O
ffici
al D
urat
ion
(1,0
00s)
Enr
ollm
ent
(1,0
00s)
1995
-201
0E
nrol
lmen
tIn
crea
se
(1,0
00s)
1985
1995
1985
1995
1995
2005
2010
1995
2005
2010
1,99
52,
010
Age
10-1
4A
ge15
-19
Age
10-1
4A
ge15
-19
Age
10-1
4A
ge15
-19
7-Y
ear
Dur
atio
n11
31%
Jam
aica
59%
66%
57%
64%
7%86
%24
724
226
523
126
226
534
234
736
922
631
791
Fra
nce
90%
110%
82%
92%
Luxe
mbo
urg
75%
74%
66%
n/a
New
Zea
land
85%
117%
84%
93%
Spa
in98
%11
8%n/
a94
%U
nite
d K
ingd
om84
%13
4%80
%92
%6-
Yea
r D
urat
ion
Col
ombi
a48
%67
%n/
a50
%19
%87
%3,
815
3,61
94,
254
4,10
74,
193
4,21
64,
460
5,01
75,
045
2,98
84,
389
1,40
1C
uba
82%
80%
67%
82%
-2%
100%
772
767
781
860
705
772
923
985
886
739
886
147
Ecu
ador
58%
50%
n/a
n/a
-8%
70%
1,34
01,
245
1,42
71,
373
1,44
61,
422
1,55
11,
680
1,72
177
61,
205
429
Gua
tem
ala
19%
25%
n/a
n/a
6%45
%1,
360
1,16
81,
729
1,52
51,
908
1,71
4'
1,51
71,
952
2,17
337
997
859
9H
aiti
18%
22%
n/a
n/a
4%42
%84
573
21,
023
919
1,10
21,
004
946
1,16
51,
264
208
531
323
Mex
ico
57%
58%
46%
46%
1%78
%10
,385
10,2
8510
,858
10,3
5110
,826
10,6
0412
,402
12,7
2512
,858
7,19
310
,029
2,83
6P
anam
a60
%68
%48
%51
%8%
88%
277
259
296
287
293
291
322
350
350
219
308
90P
arag
uay
31%
38%
n/a
33%
7%58
%60
248
372
666
876
672
465
183
689
424
751
927
1U
rugu
ay71
%82
%56
%n/
a11
%10
2%25
827
625
925
526
425
832
030
831
326
331
957
Aus
tral
ia80
%14
7%78
%89
%B
elgi
um10
2%14
4%89
%98
%C
anad
a99
%10
6%88
%92
%D
enm
ark
105%
108%
83%
86%
Japa
n95
%98
%95
%96
%K
orea
, Rep
.92
%10
1%84
%96
%U
.S.A
.97
%99
%91
%89
%5-
Yea
r D
urat
ion
Arg
entin
a70
%77
%n/
a59
%7%
97%
3,28
53,
350
3,42
73,
357
3,50
03,
433
3,31
83,
392
3,46
72,
554
3,36
380
8C
osta
Ric
a40
%50
%34
%43
%10
%70
%37
133
641
940
742
841
935
441
342
417
729
612
0H
ondu
ras
37%
32%
n/a
21%
-5%
52%
728
624
909
810
959
905
676
860
932
216
485
268
Nic
arag
ua34
%47
%19
%26
%13
%67
%56
147
563
057
768
662
851
860
465
724
344
019
7P
eru
63%
70%
49%
53%
7%90
%2,
715
2,58
22,
839
2,80
32,
842
2,82
72,
649
2,82
12,
835
1,85
42,
551
697
Trin
. & T
ob.
83%
72%
71%
65%
-11%
92%
149
128
110
132
107
109
139
121
108
100
990
Irel
and
98%
114%
n/a
n/a
4-Y
ear
Dur
atio
nB
oliv
ia*
39%
37%
27%
29%
-2%
57%
876
783
1,09
996
11,
171
1,08
566
482
490
224
651
426
9C
hile
67%
69%
n/a
55%
2%89
%1,
287
1,21
21,
456
1,41
81,
431
1,44
81,
000
1,15
01,
152
690
1,02
533
5D
om. R
ep.*
51%
41%
n/a
22%
-10%
61%
855
932
804
905
918
911
715
684
732
293
446
153
Ven
ezue
la*
24%
35%
16%
20%
11%
55%
2,46
92,
263
2,74
62,
670
2,78
32,
738
1,89
32,
166
2,20
866
21,
215
552
Hun
gary
72%
81%
70%
73%
Pol
and
78%
96%
73%
83%
3-Y
ear
Dur
atio
nB
razi
lt35
%45
%14
%19
%10
%65
%17
,480
16,6
6215
,663
16,9
0715
,225
15,6
0510
,243
9,77
19,
249
4,60
96,
012
1,40
3E
l Sal
vado
r25
%32
%n/
a21
%7%
52%
654
729
752
691
792
749
415
433
462
133
240
108

WE
IGH
TE
DA
VE
RA
GE
55%
16.0
3
SIM
PLE
AV
ER
AG
E49
%53
%4%
73%
2,33
32,
234
2,38
52,
373
2,39
12,
369
2,09
22,
209
2,22
71,
137
1,64
450
7
Ave
rage
Ave
rage
Ave
rage
Ave
rage
Ave
rage
Ave
rage
Tot
alT
otal
Tot
alT
otal
Tot
alT
otal
Tot
alT
otal
Tot
alT
otal
Tot
alT
otal
W/O
BR
AZ
IL O
RM
EX
ICO
49%
53%
4%73
%23
,466
.00
22,2
0525
,951
24,9
5626
,556
25,9
1823
,371
26,1
1913
,213
13,2
1320
,127
6,91
4
AN
DE
AN
46%
52%
5%72
%11
,215
.00
10,4
9212
,365
11,9
1412
,435
12,2
8811
,216
12,5
086,
526
6,52
69,
874
3,34
8C
AR
IBB
EA
N59
%56
%-2
%76
%2,
868.
002,
801
2,98
33,
047
3,09
43,
061
3,06
53,
302
1,56
61,
566
2,28
071
4M
EX
ICO
AN
DC
EN
TR
AL
AM
ER
ICA
39%
45%
6%65
%14
,336
.00
13,8
7615
,593
14,6
4815
,892
15,3
1016
,203
17,3
488,
560
8,56
012
,777
4,21
7
SO
UT
HE
RN
CO
NE
55%
. 62%
7%82
%22
,912
.00
21,9
8321
,531
22,6
0521
,186
21,4
6815
,531
15,3
848,
363
8,36
311
,237
2,87
4
TO
TA
L51
,331
49,1
5252
,472
52,2
1452
,607
52,1
2746
,015
48,6
0449
,001
25,0
1536
,168
11,1
53
(*)
Cha
nge
in d
urat
ion
betw
een
time
fram
es(t
) W
hen
num
bers
are
adj
uste
d fo
r a
6-ye
ar s
econ
dary
sch
oolin
g du
ratio
n in
Bra
zil,
the
1995
gros
s en
rollm
ent r
atio
is 6
8%.
Italic
s in
dica
te 1
992
figur
es.
Def
initi
ons:
Gro
ss E
nrol
lmen
t Rat
io (
% o
f Rel
evan
t Age
Gro
up)
is th
e to
tal e
nrol
lmen
t in
seco
nd-le
vel e
duca
tion,
rega
rdle
ss o
f age
, div
ided
by
the
popu
latio
n of
the
age
grou
p w
hich
offi
cial
ly c
orre
spon
ds to
seco
ndar
y sc
hool
ing.
Rel
evan
t Pop
ulat
ion
Acc
ordi
ng to
Offi
cial
Dur
atio
n is
the
popu
latio
n in
thou
sand
s of
the
age
grou
p w
hich
offi
cial
ly c
orre
spon
ds to
sec
ond
leve
l gen
eral
edu
catio
n. S
tatis
tics
wer
e de
rived
by
divi
ding
the
tota
l sch
ool a
ge p
opul
atio
n in
dica
ted
in p
revi
ous
colu
mns
by
the
num
ber
ofye
ars
of o
ffici
al s
econ
dary
sch
ool d
urat
ion
as o
utlin
ed in
the
first
col
umn.
Enr
ollm
ent i
s th
e to
tal n
umbe
r in
thou
sand
s of
stu
dent
s en
rolle
d at
the
seco
ndar
y le
vel.
Num
bers
wer
e de
rived
by
mul
tiply
ing
the
rele
vant
pop
ulat
ion
acco
rdin
g to
offi
cial
dur
atio
n by
the
gros
sen
rollm
ent p
erce
ntag
e.
Sou
rces
:
UN
ES
CO
, Wor
ld E
duca
tion
Rep
ort,
1995
; 199
8. W
orld
Ban
k, W
orld
Dev
elop
men
t Ind
icat
ors,
199
8 C
D-R
OM
. Uni
ted
Nat
ions
, The
Sex
and
Age
Dis
trib
utio
n of
the
Wor
ld P
opul
atio
ns, 1
996.

Tab
le 2
Cur
rent
and
Lon
g-T
erm
Cos
ts
Cou
ntri
esC
urre
nt E
xpen
ditu
re p
erPu
pil (
US$
)*19
95
Tot
al C
urre
ntE
xpen
ditu
re($
1,00
0s)
Est
imat
ed C
apita
l Cos
t for
Enr
ollm
ent I
ncre
ase
at$1
000/
stud
ent (
$1,0
00s)
Est
imat
ed C
ost f
or E
nrol
lmen
tIn
crea
se a
t Cur
rent
Exp
endi
ture
($1,
000s
)E
xpen
ditu
re p
er P
upil
2010
(US$
)*7-
Yea
r D
urat
ion
Jam
aica
$378
$85,
397
$91,
336
$34,
525.
01$5
676-
Yea
r D
urat
ion
Col
ombi
a$2
10$6
27,5
78$1
,401
,030
$294
,216
.30
$315
Cub
a$4
51$3
33,1
63$1
47,4
80$6
6,51
3.48
$677
Ecu
ador
$209
$162
,080
$429
,060
$89,
673.
54$3
14G
uate
mal
a$6
7$2
5,40
6$5
98,7
40$4
0,11
5.58
$101
Hai
tin/
a$3
22,5
48M
exic
o$6
64$4
,776
,258
$2,8
36,0
80$1
,883
,157
.12
$996
Pana
ma
$358
$78,
290
$89,
664
$32,
099.
71$5
37Pa
ragu
ay$1
86$4
6,01
3$2
71,1
40$5
0,43
2.04
$279
Uru
guay
$414
$108
,769
$56,
736
$23,
488.
70$6
215-
Yea
r D
urat
ion
Arg
entin
a$9
64$2
,462
,514
$808
,030
$778
,941
$1,4
46C
osta
Ric
a$4
96$8
7,66
8$1
19,7
00$5
9,37
1$7
44H
ondu
ras
$132
$28,
554
$268
,320
$35,
418
$198
Nic
arag
uan/
a$1
96,7
30Pe
ru$2
19$4
06,0
15$6
97,1
00$1
52,6
65$3
29T
rini
dad
& T
obag
o$6
41$6
3,92
1-$
360
-$23
1$9
624-
Yea
r D
urat
ion
Bol
ivia
$144
$35,
357
$268
,836
$38,
712
$216
Chi
le$3
74$2
57,9
57$3
35,2
00$1
25,3
65$5
61D
omin
ican
Rep
ublic
$73
$21,
980
$153
,208
$11,
184
$110
Ven
ezue
la$2
07$1
37,1
33$5
52,1
40$1
14,2
93$3
113-
Yea
r D
urat
ion
Bra
zil
$615
$1,7
80,2
92$1
,402
,680
$862
,648
$923
El S
alva
dor
$81
$39,
786
$107
,628
$8,7
18$1
22W
EIG
HT
ED
AV
ER
AG
E$4
98$7
54SI
MPL
E A
VE
RA
GE
$344
$469
Sim
ple
Ave
rage
Tot
als
Tot
als
Tot
als
Sim
ple
Ave
rage
W/O
BR
AZ
IL O
R M
EX
ICO
$311
$5,0
07,5
81$6
,717
,536
$1,9
55,5
01$4
67A
ND
EA
N$1
98$1
,368
,163
$3,3
48,1
66$6
89,5
60$2
97C
AR
IBB
EA
N$3
86$5
04,4
60$3
91,6
64$1
11,9
92$5
79M
EX
ICO
& C
EN
TR
AL
AM
ER
ICA
$300
$5,0
35,9
63$4
,216
,862
$2,0
58,8
80$4
50
SOU
TH
ER
N C
ON
E$5
11$4
,655
,545
$2,8
73,7
86$1
,840
,875
$766
TO
TA
L...
..
..
$11,
564,
131
$11,
153,
026
$4,7
01,3
06E
xpen
ditu
repe
r Pu
pil f
or.
oris
the
publ
ic e
xpen
ditu
re p
er p
upil
a ju
ste
byes
timat
ing
an a
vera
ge a
nnua
l gro
wth
of
3.0
from
the
1995
-201
0 pe
riod
.It
alic
s in
dica
te 1
991
figu
re.
Sour
ces:
UN
ESC
O, W
orld
Edu
catio
n R
epor
t, 19
95; 1
998.
Wor
ld B
ank,
Wor
ld D
evel
opm
ent I
ndic
ator
s, 1
998
CD
-RO
M. U
nite
d N
atio
ns, T
he S
ex a
ndA
ge D
istr
ibut
ion
of th
e W
orld
Pop
ulat
ions
, 199
6.

Tab
le 3
Tea
cher
Nee
ds
Cou
ntri
es19
95 P
upil-
Tea
cher
Rat
io"
Exi
stin
g N
umbe
r of
Tea
cher
s (1
,000
s) :
1995
Add
itona
l Tea
cher
Nee
d by
201
0 (1
,000
s)R
epla
cem
ent T
each
er N
eed
by 2
010
at 5
5% R
epla
cem
ent R
ate
(1,0
00s)
Tot
al A
dditi
onal
Tea
cher
Nee
dby
201
0 (1
,000
s)
7-Y
ear
Dur
atio
n39
4Ja
mai
ca22
10.3
4.2
5.6
9.8
6-Y
ear
Dur
atio
nC
olom
bia
2213
5.8
63.7
74.7
138.
4C
uba
1073
.914
.740
.655
.4E
cuad
or13
59.7
33.0
32.8
65.8
Gua
tem
ala
1623
.737
.413
.050
.5H
aiti
1811
.617
.96.
424
.3M
exic
o17
423.
116
6.8
232.
739
9.5
Pana
ma
1812
.15.
06.
711
.7Pa
ragu
ay12
20.6
22.6
11.3
33.9
Uru
guay
1814
.63.
28.
011
.25-
Yea
r D
urat
ion
Arg
entin
a8
319.
310
1.0
175.
627
6.6
Cos
ta R
ica
218.
45.
74.
610
.3H
ondu
ras
287.
79.
64.
213
.8N
icar
agua
386.
45.
23.
58.
7Pe
ru-1
997
.636
.753
.790
.4T
rini
dad
& T
obag
o20
5.0
-0.0
2.7
2.7
4-Y
ear
Dur
atio
nB
oliv
ia*
1813
.614
.97.
522
.4C
hile
1740
.619
.722
.342
.0D
omin
ican
Rep
ublic
*22
13.3
7.0
7.3
14.3
Ven
ezue
la*
882
.869
.045
.511
4.6
3-Y
ear
Dur
atio
nB
razi
l11
419.
012
7.5
230.
535
8.0
El S
alva
dor
187.
46.
04.
110
.0W
EIG
HT
ED
AV
ER
AG
E15
.6
SIM
PLE
AV
ER
AG
E17
.9
Sim
ple
Ave
rage
Tot
alT
otal
Tot
alT
otal
W/O
BR
AZ
IL O
R M
EX
ICO
1896
4.4
476.
453
0.4
1,00
6.8
AN
DE
AN
1638
9.5
217.
321
4.2
431.
6C
AR
IBB
EA
N18
114.
043
.862
.710
6.5
ME
XIC
O &
CE
NT
RA
L A
ME
RIC
A22
488.
923
5.7
268.
950
4.6
SOU
TH
ER
N C
ON
E13
814.
127
4.0
447.
872
1.7
TO
TA
L1,
806.
577
0.7
993.
61,
764.
3*)
Cha
nge
in d
urat
ion
betw
een
time
fram
es.
(**)
Exc
ept i
n th
e ca
se o
f T
rini
dad
and
Tob
ago,
18
is u
sed
as a
def
ault
ratio
whe
n da
ta f
or th
e co
untr
y is
not
ava
ilabl
e.It
alic
s in
dica
te 1
992
figu
res.
Sour
ces:
UN
ESC
O, W
orld
Edu
catio
n R
epor
t, 19
95; 1
998.
Wor
ld B
ank,
Wor
ld D
evel
opm
ent I
ndic
ator
s, 1
998
CD
-RO
M. U
nite
d N
atio
ns, T
he S
ex a
nd A
ge D
istr
ibut
ion
of th
e W
orld
Pop
ulat
ions
,19
96.
Def
initi
ons:
Exi
stin
g N
umbe
r of
Tea
cher
s es
timat
es th
e nu
mbe
r of
teac
hers
by
divi
ding
tota
l enr
ollm
ent n
umbe
rs b
y gi
ven
stud
ent-
teac
her
ratio
s.A
dditi
onal
Tea
cher
Nee
d by
201
0 es
timat
es th
e nu
mbe
r of
add
ition
al te
ache
rs n
eede
d pe
r co
untr
y to
mai
ntai
n cu
rren
t pup
il-te
ache
r ra
tios.
Num
bers
wer
e de
rive
d by
div
idin
g 19
95-2
010
enro
llmen
t inc
reas
e by
cur
rent
pup
il-te
ache
r ra
tios.
Rep
lace
men
t Tea
cher
Nee
d -
55%
.R
epla
cem
ent R
ate
estim
ates
the
num
ber
of r
epla
cem
ent t
each
ers
requ
ired
to m
eet c
urre
nt e
xist
ing
num
ber
of te
ache
r fi
gure
s.T
otal
Tea
cher
Nee
d by
201
0 is
the
sum
of
the
addi
tiona
l tea
cher
nee
d an
d re
plac
emen
t tea
cher
nee
d.

Other publications from the Education Unit
Higher Education in Latin America and the Caribbean. A Strategy Paper. December 1997, N° EDU-101.(English, Spanish, and Portuguese versions available)
Institutional Reform in Mexican Higher Education: Conflict and Renewal in Three Public Universities, byRollin Kent. February 1998, N° EDU-102. (English only)
Education Statistics in Latin America and the Caribbean, by R.W. McMeekin. January 1998, N° EDU-104.(English and Spanish versions available)
The Stubborn Trainers vs. the Neoliberal Economists: Will Training Survive the Battle?, by Claudio deMoura Castro. June 1998, N° EDU-106. (English only)
Trinta anos de FINEP: Banco ou mecenas, fomento ou balc do?, by Maria Helena de Magalhaes Castro andEva Stal. August 1998, N° EDU-107. (Portuguese only)
Cost-Effectiveness of Education Policies in Latin America: A Survey of Expert Opinion, by ErnestoSchiefelbein, Laurence Wolff and Paulina Schiefelbein. December 1998, N° EDU-109. (Englishonly)
Proyecto Joven: New Solutions and Some Surprises, by Claudio de Moura Castro. July 1999, N° EDU-110.(English only)
A revoluctio silenciosa: Autonomia fincmciera da USP e UNICAMP, by Maria Helena Magalhaes Castro.December 1996, N° SOC96-102. (Portuguese only)
Cerrando la brecha, by Roman Mayorga. January 1997, N° SOC97-101. (Spanish and English)
La reforma educativa en America Latina - Actas de un seminario, Claudio de Moura Castro and MartinCarnoy, editors. August 1997, N° SOC97-102. (Spanish only)
Inversion en la calidad de la educacion pziblica en el Peru y su efecto sobre la fuerza de trabajo y lapobreza, by Jaime Saavedra. March 1997, N° SOC97-104. (Spanish only)
La educacion superior en America Latina - Testimonios de un seminario de rectores, Salvador Malo andSamuel Morley, editors. (Spanish only)
Education in the Information Age, Claudio de Moura Castro, editor. (English and Spanish) Available throughthe IDB Bookstore, phone (202) 623-1753, e-mail: [email protected].
For more information, please contact the Education Unit at:Phone: (202) 623-2087Fax: (202) 623-1558E-mail: sds/[email protected]: http://wwwiadb.orgisds/edu
59

Inter-American Development BankSustainable Development Department
1300 New York Ave., N.W.Washington, D.C. 20577, USA
www.iadb.org/sds
60
U.S. Department of EducationOffice of Educational Research and Improvement (OERI)
National Library of Education (NLE)Educational Resources Information Center (ERIC)
REPRODUCTION RELEASE(Specific Document)
L DOCUMENT IDENTIFICATION:
liti) 0 3;- 421
Title:-e-c 0,,-Lb0..fik- b v c -01/4 --t 01.1 LA-KM ti4M GA1 c4 T t C-4 DIA 13 M
Author(s): J (1. e vj 0
Corporate Source:
P141teXac.1-41 caNi\e.4e M t'141" /3.#4'M Le-
Publication Date:
II. REPRODUCTION RELEASE:In order to disseminate as widely as possible timely and significantmaterials of interest to the educational community, documents announced in the
monthly abstract journal of the ERIC system, Resources in Education (RIE), are usually made available to users in microfiche, reproduced paper copy,
and electronic media, and sold through the ERIC Document Reproduction Service (EDRS). Credit is given to the source of each document, and, if
reproduction release is granted, one of the following notices is affixed to the document.
If permission is granted to reproduce and disseminate the identified document,please CHECK ONE of the following three options and sign at the bottom
of the page.The sample sticker shown below will be
affixed to all Level 1 documents
1
PERMISSION TO REPRODUCE ANDDISSEMINATE THIS MATERIAL HAS
BEEN GRANTED BY
ce 'oTO THE EDUCATIONAL RESOURCES
INFORMATION CENTER (ERIC)
Level 1
The sample sticker shown below will beaffixed to all Level 2A documents
PERMISSION TO REPRODUCE ANDDISSEMINATE THIS MATERIAL IN
MICROFICHE, AND IN ELECTRONIC MEDIAFOR ERIC COLLECTION SUBSCRIBERS ONLY,
HAS BEEN GRANTED BY
eke
sad
2A
TO THE EDUCATIONAL RESOURCESINFORMATION CENTER (ERIC)
Level 2A
nCheck here for Level 1 release, permitting Check here for Level 2A release, permitting
reproduction and dissemination in microfiche or other reproduction and dissemination in microfiche and in
ERIC archival media (e.g., electronic) and paper electronic media for ERIC archival collection
copy. subscribers only
Signhere,4please
The sample sticker shown below will beaffixed to all Level 28 documents
PERMISSION TO REPRODUCE ANDDISSEMINATE THIS MATERIAL IN
MICROFICHE ONLY HAS BEEN GRANTED BY
2B
\e
SI6``.9
TO THE EDUCATIONAL RESOURCESINFORMATION CENTER (ERIC)
Level 2B
Check here for Level 28 release, permittingreproduction and dissemination in microfiche only
Documents will be processed as Indicated provided reproduction quality permits.If permission to reproduce is granted, but no box is checked, documents will be processed at Level 1.
hereby grant to the Educational Resources Information Center (ERIC) nonexclusivepermission to reproduce and disseminate this document
as indicated above. Reproduction from. the ERIC microfiche or electronic media by persons other than ERIC employees and its systemcontractors requires permission from the copyright holder. Exception is made fornon-profit reproduction by libraries and other servico agencies
to satisfy information needs of educators in response to discrete inquiries.
Signature:
6.44.,...e it)Organ aVAddress:
t (..km-xt,-MAEA\Ack-k OE tie> o 9 04
k500 tAq."4 tr4(4- 15k,44 NI/ PAPhSti-Acr N (QC 30.7 7 7
Printed Name/Position/Title:
-1Z a.EkCao'N t6t4.C(ASPTel3Ph7:
1-3- 2-8go FAx-.20 (,a3-
Mad5774 04,0. oRfr Date://0/ 03(over)
III. DOCUMENT AVAILABILITY INFORMATION (FROM NON-ERIC SOURCE):If permission to reproduce is not granted to ERIC, or, if you wish ERIC to cite the availability of the document from another source, pleaseprovide the following information regarding the availability of the document. (ERIC will not announce a document unless it is publiclyavailable, and a dependable source can be specified. Contributors should also be aware that ERIC selection criteria are significantly morestringent for documents that cannot be made available through EDRS.)
Publisher/Distributor:
Address:
Price:
IV. REFERRAL OF ERIC TO COPYRIGHT/REPRODUCTION RIGHTS HOLDER:If the right to grant this reproduction release is held by someone other than the addressee, please provide the appropriate name andaddress:
Name:
Address:
ERIC Clearinghouse on Urban EducationV. WHERE TO SEND THIS FORM: Box 40, Teachers College
Columbia University525 W. 120th Street, Main Hall 3U3
Send this form to the following ERIC Clearinghouse: New York, NY 10027
Tel: 212-678-3433 / 800-601-4868Fax: 212-678-4012
http: / /eric-web.tc.colurnbia.edu
However, if solicited by the ERIC Facility, or if making an unsolicited contribution to ERIC, return this form (and the document beingcontributed) to:
-
EFF-088 (Rev. 2/2000)°
rocessi and R ence Facility.3-A Fo Boulev
La Maryla 20706
TeToll
FAX:e-mail: ericfac
WWW: http://ericfac.picca
hone:e: 800-
-552-423742
-552-470t ed.go
csc.com