Embed Size (px)
Citation preview
DOCUMENT RESUME
ED 289 228 EA 019 738
AUTHOR Beck, John J.TITLE Profile of the Principalship. A Study of Principals'
Perceptions.PUB DATE Jun 87NOTE 73p.PUB TYPE Reports Research/Technical (143)
EDRS PRICE MF01/PC03 Plus Postage.DESCRIPTORS *Administrator Attitudes; *Administrator Education;
Educational Administration; Elementary SecondaryEducation; Employment Experience; *EmploymentPotential; Instructional Leadership; *Job Skills;Occupational Surveys; *Principals; ProfessionalDevelopment; *Program Effectiveness
IDENTIFIERS *Texas
ABSTRACTThis study surveyed 1,300 elementary, junior
high/middle school, and high school principals in Texas byquestionnaire to gather their perceptions on issues related to theprincipalship. The following four issues were explored: (1) source ofexpertise; (2) skills necessary to the success of any principal; (3)level of expertise of the respondents in each of the identifiedskills; and (4) adequacy of preparation received in each of therespondents' university programs in educational administration.Findings indicate that on-the-job experience and common sense werethe most important sources of expertise, whereas universitypreparation programs and experiences gained outside of education werethe leas" important sources. Campus leadership, instructionalleadership, and interpersonal relations are the skills perceived tobe of most importance to success. Curriculum development, physicalplant management, and budgeting and finance skills were seen as beingof least importance to success. Principals perceived that level ofexpertise closely matched the perceived necessity of the skill, butthe expertise was seen to have been obtained from sources other thantheir university preparation program in educational administration. A20-item bibliography and 8 appendices of survey instruments and datacomprise one-half of the report. (Author/CJH)
***********************************************************************
Reproductions supplied by EDRS are the best that can be madefrom the original document.
*************************************k*********************************
PROFILE OF THE PRINCIPALSHIPA STUDY OF PRINCIPALS' PERCEPTIONS
by
John J. Beck, Ph.D.
Department of Educational Administration andPsychological Services
Southwest Texas State UniversitySan Marcos, Texas 78666
U s DEPARTMENT OF EDUCATIONOtte of Educational ROSSIMN and improvement
EDUCATIONAL RESOURCES INFORMATIONCENTER (ERIC)
KThis document Nis been reproduced asreceived from Ili* person or organizationoriginating itMinor change* hove been made to improvereproduction duality
Rointa oteurasof opinionsstated minis docu-ment do not necessarily represent officialOERI position or policy
BEST COPYAVAIL 4BLE
16,
June, 1987
2
"PERMISSION TO REPRODUCE THISMATERIAL HAS BEEN GRANTED BY
TO THE EDUCATIONAL RESOURCESINFORMATION CENTER (ERIC)"
I
PROFILE OF THE PRINCIPALSHIPA STUDY OF PRINCIPALS' PERCEPTIONS
by
John J. Beck, Ph.D.Associate Professor of Educational Administration
Southwest Texas State UniversitySan Marcos, Texas 78666
June, 1987
Abstract
1,000 elementary, junior high/middle school, and high schoolprincipals were surveyed via questionnaire to gather theirperceptions on four issues related to the principalship: 1)source of expertise, 2) skills necessary to the success of anyprincipal, 3) level of expertise of the respondents in each ofthe identified skills, and 4) adequacy of preparation received inthe respondents' university preparation program in educationaladministration. Findings indicated that on-the-job experienceand common sense were the most important sources of expertisewhile university prepration programs and experiences gainedoutside of education were the least important sources. Campusleadership, instructional leadership, and interpersonal relationswere found to be the skills perceived to ae of most importance tosuccess while curriculum development, physical plant management,and budgeting and finance skills were seen to be of leastimportance. Principals perceived level of expertise closelymatched the perceived necessity of the skill, but the expertisewas seen to have been obtained from sources other than theiruniversity preparation program in educational administration.
3
Review of Literature
Method
TABLE OF CONTENTS
1
5
Results 6
Analysis of Total Sample 6
Descriptive Statistics for Total Sample 7
Significant Relations Among Demographic Variables 14Significant Relations Among Demographic Variables
and Principals' Perceptions of Sources of Competenceto Succeed as a Building Principal 19
Significant Relations Among Demographic Variablesand Principals' Perceived Importance of SelectedSkills to the Success of Any Principal 20
Significant Relations Among Demographic Variablesand Principals' Perceived Level of Expertise inthe Selected Skill Areas 22
Significant Relations Among Demographic Variablesand Principals' Perceived Level of PreparationReceived in Their University Educational Admin-istration Program 25
Open-Ended Responses 27
Conclusions 29
Bibliography 35
AppendicesA: Questionnaire Cover Letter 37B: Questionnaire 38C: Tabulation of Frequency of Response and Per Cept
Response by Categorical Value for Six IndependentVariables 40
D: Tables of Relationships Between Pairs ofDemographic Variables 42
E: Tables of Relationships Between DemographicVariables and Principals' Perceptions of Sourcesof Competence to Succeed as a Buil.:1'.ng Principal 53
F: Tables of Relationships Between DemographicVariables and Principals' Perceived Importanceof Selected Skills to the Success of Any Principal 55
G: Tables of Relationships Between DemographicVariables and Principals' Perceived Expertiseiu Selected Skills 58
H: Tables of Relationships Between DemographicVariables and Principals' Perceptions of TheirUniversity Educational Admini_strAti,In Programs 66
4
PROFILE OF THE PRINCIPALSHIP
A STUDY OF PRINCIPALS' PERCEPTIONS
America's schools have been the subject of close scrutiny in
recent years, and it is likely that this attention will continue.
Education is now, more than ever before, a popular topic for
discussion at all levels, from national to local. The major
result of this attention, brought about by a deep-rooted concern
about the effectiveness of America's schools, is a refocusing in
the '80s on the schools as a knowledge institution (Thomson,
1986). School principals are an integral part of this change in
America's values concerning what a school ought to be.
The principalship continues to be the "hot corner" in the
educational enterprise, and it is a central issue in current
discussions on effective schools. Most of the recent national
education reports highlight the role of the principal in
promoting excellence. The perception is that the building
principal is in a pivotal position to effect school improvement
(Dianda, 1984). This "Great Principal" notion is inferred, for
the most part, from case studies of inner-city elementary schools
in which these principals e.r.press a schoolwide emphasis on basic
skills achievement, set high expectations for students and
teachers, and impart a belief in a vision of what might be
(Gersten and ethers, 1982).
Skeptics of the "Great Principal" notion argue that it is
naive to think that principals, not all of whom were effective
1
teachers, can either acquire or maintain a higher level of
teaching expertise than the teachers they supervise (Goodlad,
1983). Furthermore, non-instructional chores consume a major
proportion of the principal's day; many teachers do not welcome
an "intrusive" principal; and many principals cannot balance
leadership responsibilities with teachers' need for instructional
autonomy, a key ingredient in many successful schools (Wolcott,
1973; Howell, 1981). Joyce (1986) argued that many school
administrators are oriented toward logistics and community
relations rather than instructional leadership.
A significant factor which bears upon the principal's
perceived inability to effect critical change in any function of
the organization called school is the set of perceptions about
the principal's role. Wolcott (1973) argued that the traditions
that have traced the principalship have only served to burden and
hamper the principal's effectiveness. He said that since
principals are hired to serve their institutions and their
societles as monitors for continuity, it is ironic and
unfortunate that school administrators are heralded as agents of
change and unreasonable to expect them to be such agents.
Another important factor which belies the "Great Principal"
notion is the reward system imposed on principals by
superintendents and boards of education. Until very recently,
principals tended to be hired for their "non-boat-rocking"
qualities rather than their intelligence, creativity, or courage
(Gibboney, 1987). Allison (1983) argued that rather than create
orders, principals much prefer to take and to give them; that
2
low
6
schools are like the military in that conformity to rules and
regulations is a major virtue; and that among ,,,hatever qualities
a principal may have, being outspoken or indeperdent is not among
them.
Just as the nature and effectiveness of the principal's role
is controversial, so is the nature and effectiveness of education
programs for principals. Gibboney (1987) offered the opinion
that those least likely to offer critical insights into
educational issues are those educated in school law, budgets,
personnel, and public relations. He argued for an education for
administrators rooted in the "fundamental enlightenment of
thought" as opposed to the simple acquisition of skills.
Conversely, the National Association of Secondary School
Principals (NASSP) defines the primary gnal of training for
administrators to be increased competence which, in turn, is
defined as "a synonym for specific skill performance" (NASSP
Special Report, 1985).
On the one hand, one camp argues for skills acquisition
through techniques such as cooperative assessment centers as
defined and illustrated in the NASSP report. On the other hand,
a second camp argues for something beyond skills acquisition.
Cewelti (1982) argued for general improvement of university
preparation programs with an emphasis on human resources
development. Wollcott (1973) saw the purpose of administrator
programs to be helping school administrators better understand
the social processes in which they are engaged. Gibboney (1987)
would have administrators study content from philosophy, history,
3
social science, and the classic works in education rather than
what he referred co as "trivial courses in management and
administration that have been taught for several decades."
The problems of role preparation, role definiti,n, and role
specifications are further complicated because of the limited
amount of research on formal training or preparation of school
principals. Little is known, for example, about the relative
effectiveness of one process over another. In fact, the limited
research on the effect of training in the. form of graduate study
seems to suggest that a negative relationship may exist between
one's perceived effectiveness and the number of credits of
graduate study. While one may reason that what one learns prior
to job entry has an impact on performance, the role context of
the work environment may be much more important in c:etermining
the behavior of a principal (Greenfield, 1982, 1985).
The literatu..e reporting practicing principals' perceptions
of the value of various types of preparation and experience also
is mixed. Hoyle (1985) found little evidence to connect
administrator preparation with either work patterns or
effectiveness of the administrator. In a study of elementary
printApals (Pharis and Zakariya, 1979) found that 36% of their
sample reported their graduate education to be of much value
while only 6% found it to be of little value. The elementary
principals reported, however, that their experience as a teacher
and their on-the-job training were both of greater value than
their graduate preparation. Thus, principalq are more likely to
get ideas for innovation from other principals and t'achers than
4
from college courses. Similarly, in a study of 65 elementary
principals in the same district (Trider, Leithwood, and
Montgomery, 1945), it was found that principals' professional
experiences, beliefs, and values appeared, to a large measure, to
determine what they did on the job. Page and Page (1984) found
that principals perceived that they had received adequate
graduate instruction in school plant, observation of instruct'
compliance with governance guidelines, evaluation of self, and
evaluation of teachers. They perceived inadequate instruction in
administration of the lunch program, pupil transportation,
leadership of non-teaching staff, purchasing, extra-curricular
activities, board relat:ons, and parental reqltions.
Method
The major purpose of this study was to investigate the
perceptions of principals in Texas regarding the source and level
of expertise of their knowledge and leadership skills. To
achieve this purpose, the following questions were investigated:
1. What are principals' perceived sources of theircompetence?
2. What are principals' perceived relative importance ofselected responsibilities?
3. What are principals' perceived level of expertise inselected responsibilities?
4. What are principals' perceived level of satisfaction intheir university educational administration program?
To investigate these questions, 1000 school principals in
Texas, representing 17 per cent of the 5,892 principals in the
5
State, were randomly selected to participate in the study. A
stratified random samp3ing procedure was used to insure
proportionate distribution across elementary, middle
school/junior high, and high school principals. Of the 1000
principals in the sample, 600 were elementary, 174 were middle
school/junior high, and 226 were high school.
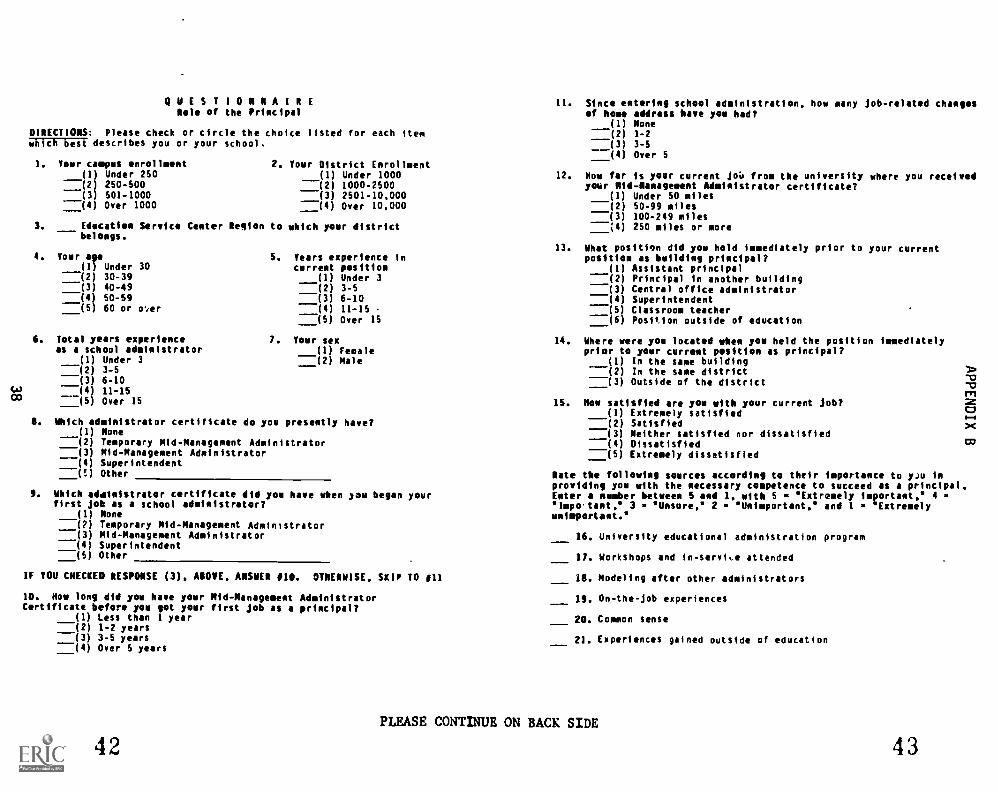
A 53item questionnaire was designed to answer the research
questions. The questionnaire was distributed to a panel of
experts including practicing principals and educational
administration faculty members. After the instrument was revised
and validated, it was distributed to the sample by mail with a
cover letter explaining its purpose. A copy of the cover letter
and the questionnaire are found in appendices A and B,
respectively.
Results
Of the 1000 questionnaires mailed, 650, or 65 per cent of
the sample, were returned in a form useable for analysis. The
rate of return as 63 per cent (378 of 600) for elementary
principals; seventyone per cent (123 of 174) for middle
school/junior high principals; and 65 per cent (148 of 226) for
high school principals.
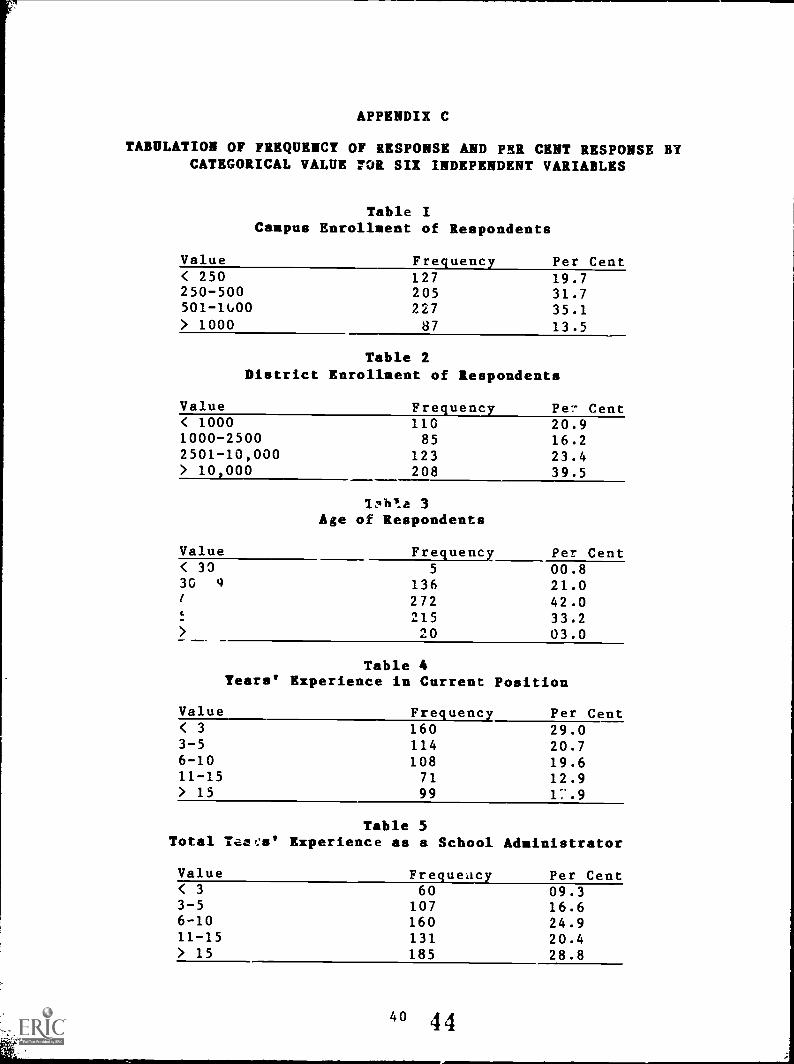
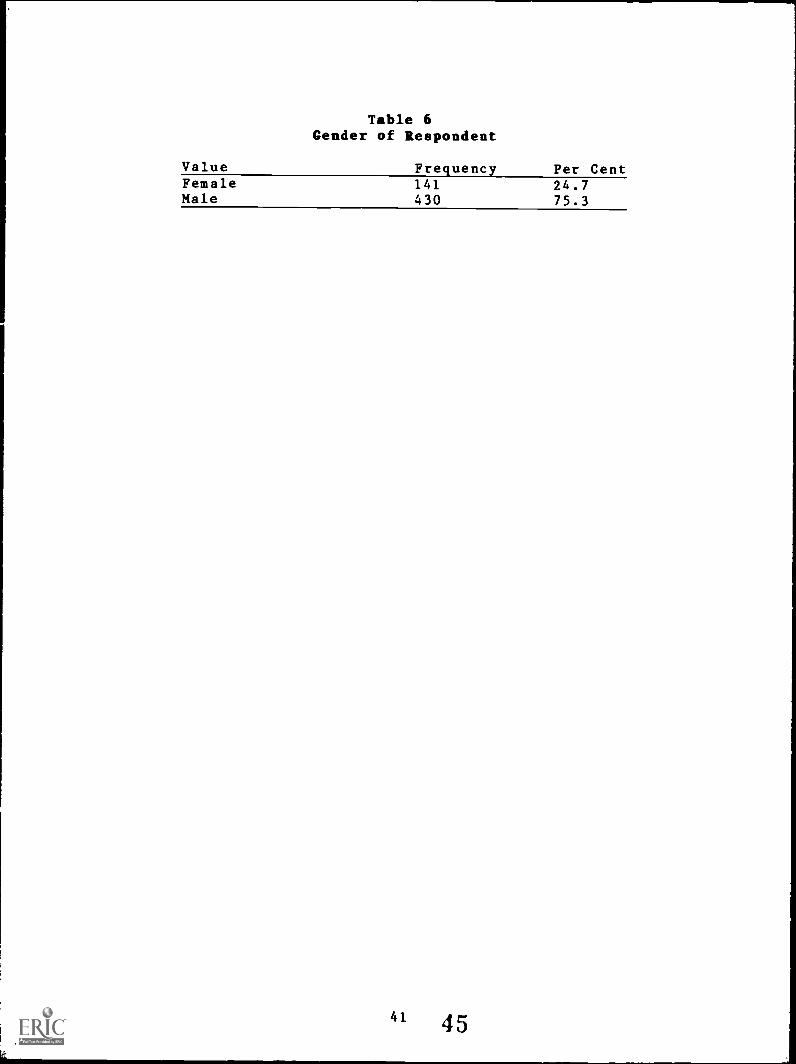
Analysis of total sample: Data were collected on eight
independent variables. Descriptive information for the total
sample on camrus enrollment, district enrollment, respondents'
age, years of experience in the current position, total years of
experience, and sex are found in Appendix C. The chi-square
statistic was computed to measure the strength of relationships
among independent and dependent variables and Spearman rank-order
correlations were computed to measure the relationship among
various rankings of data.
Descriptive Statistics for Total Sample: Data were collected to
determine the career path of principals. These data were drawn
from questionnaire items which pertained to certification,
position changes, career mobility, current job satisfaction.
Data were also collected sad analyzed on principals' perceptions
of the importance of selected sources to their success and on
principals' perceptions of their levels of expertise and
preparedness with respect to selected job responsibilities.
Current Texas certification standards specify a
mid-management certificate requiring 45 graduate credits for a
school principal at any level. A temporary administrators'
certificate may be obtained, however, if the applicant has a
masters' degree and twelve hours of the specified core of
administrative courses. Of the respondents in this study, 64.6
per cent held a mid-management certificate and another 20.3 per
cent held a superintendents' certificate. Five per cent of the
respondents held a temporary certificate and 9.3 per cent had
legitimate certificates issued under older certification
standards, either the 1955 or the 1972 standards. Table 7,
below, illustrates the data in response to the question, "Which
administrator certificate d3 you presently have?"
711
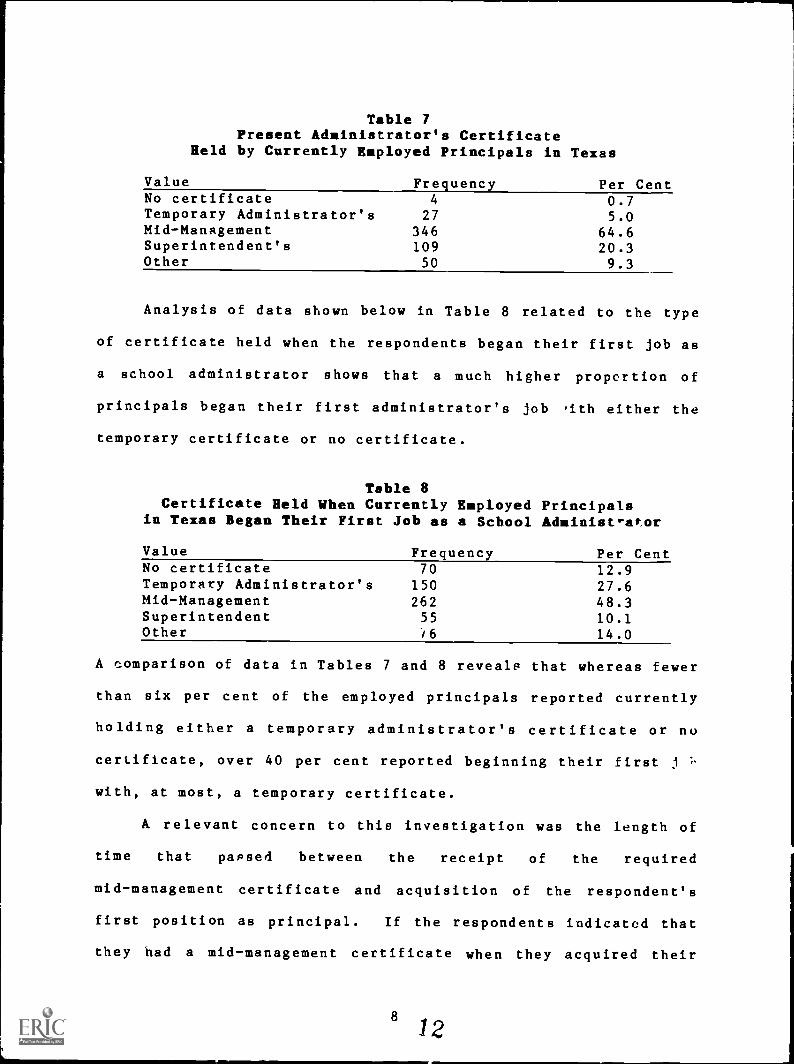
Table 7Present Adinistrator's Certificate
Held by Currently Enployed Principals in Texas
Value Fre uenc Per CentNo certificate 4 0.7Temporary Administrator's 27 5.0Mid-Management 346 64.6Superintendent's 109 20.3Other 50 9.3
Analysis of data shown below in Table 8 related to the type
of certificate held when the respondents began their first job as
a school administrator shows that a much higher proportion of
principals began their first administrator's job 'ith either the
temporary certificate or no certificate.
Table 8Certificate Held When Currently Employed Principals
in Texas Began Their First Job as a School Adainist'ator
Value Frequency Per CentNo certificate 70 12.9Temporary Administrator's 150 27.6Mid-Management 262 48.3Superintendent 55 10.1Other ./6 14.0
A comparison of data in Tables 7 and 8 reveals that whereas fewer
than six per cent of the employed principals reported currently
holding either a temporary administrator's certificate or no
certificate, over 40 per cent reported beginning their first j
with, at at most, a temporary certificate.
A relevant concern to this investigation was the length of
time that passed between the receipt of the required
mid-management certificate and acquisition of the respondent's
first position as principal. If the respondents indicated that
they had a mid-management certificate when they acquired their
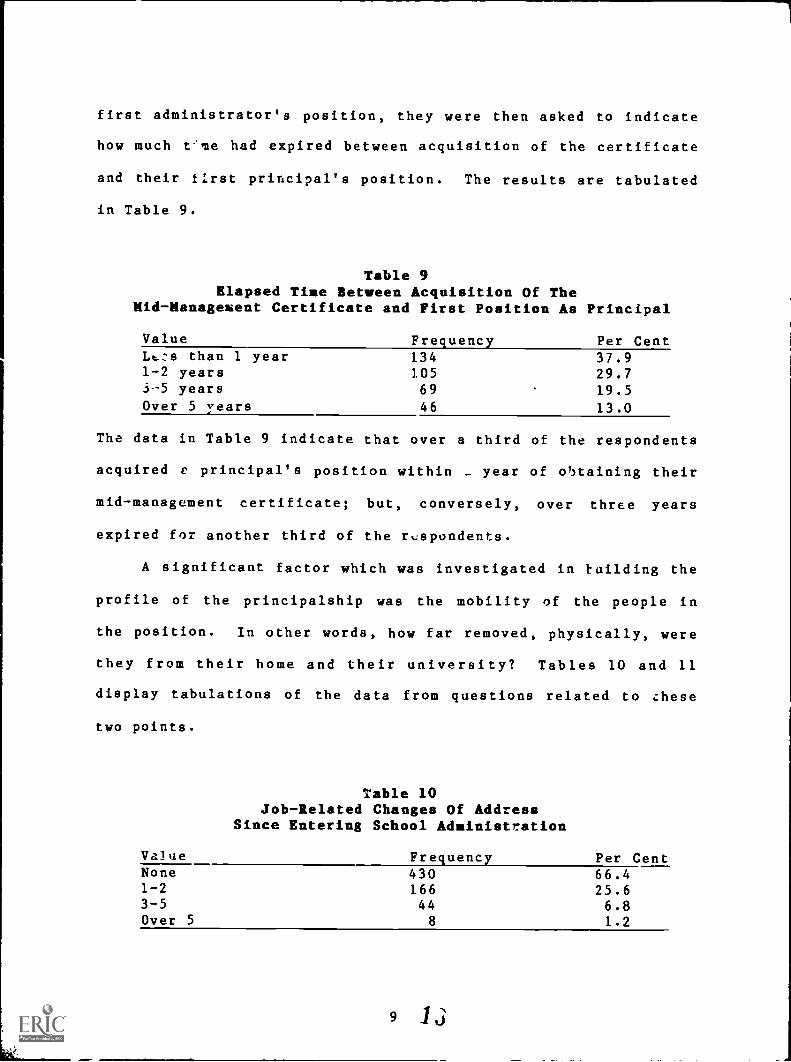
first administrator's position, they were then asked to indicate
how much t'me had expired between acquisition of the certificate
and their tIrst principal's position. The results are tabulated
in Table 9.
Table 9Elapsed Time Between Acquisition Of The
Mid-Management Certificate and First Position As Principal
Value Frequency Per CentLt..-Is than 1 year 134 37.91-2 years 105 29.73-5 years 69 19.5Over 5 years 46 13.0
The data in Table 9 indicate that over a third of the respondents
acquired r principal's position within - year of obtaining their
mid-management certificate; but, conversely, over three years
expired for another third of the respondents.
A significant factor which was investigated in building the
profile of the principalship was the mobility of the people in
the position. In other words, how far removed, physically, were
they from their home and their university? Tables 10 and 11
display tabulations of the data from questions related to these
two points.
Table 10Job-Related Changes Of Address
Since Entering School Administration
Value Frequency Per CentNone 430 66.41-2 166 25.63-5 44 6.8Over 5 8 1.2
9 1 ,
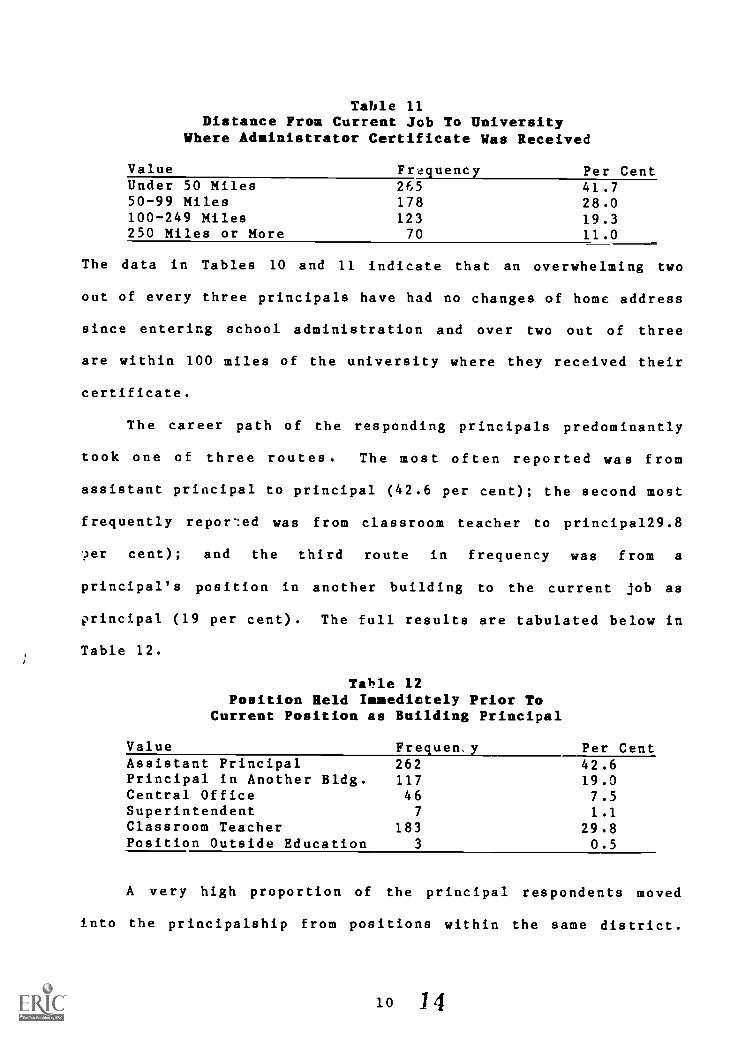
Table 11Distance From Current Job To University
Where Adainistrator Certificate Was Received
ValueUnder 50 Miles50-99 Miles100-249 Miles250 Miles or More
Frequency26517812370
Per Cent41.728.019.311.0
The data in Tables 10 and 11 indicate that an overwhelming two
out of every three principals have had no changes of home address
since entering school administration and over two out of three
are within 100 miles of the university where they received their
certificate.
The career path of the responding principals predominantly
took one of three routes. The most often reported was from
assistant principal to principal (42.6 per cent); the second most
frequently repor%ed was from classroom teacher to principa129.8
er cent); and the third route in frequency was from a
principal's position in another building to the current job as
principal (19 per cent). The full results are tabulated below in
Table 12.
Table 12Position Held Immediately Prior To
Current Position as Building Principal
Value Frequency Per CentAssistant Principal 262 42.6Principal in Another Bldg. 117 19.0Central Office 46 7.5Superintendent 7 1.1Classroom Teacher 183 29.8Position Outside Education 3 0.5
A very high proportion of the principal respondents moved
into the principalship from positions within the same district.
10 14
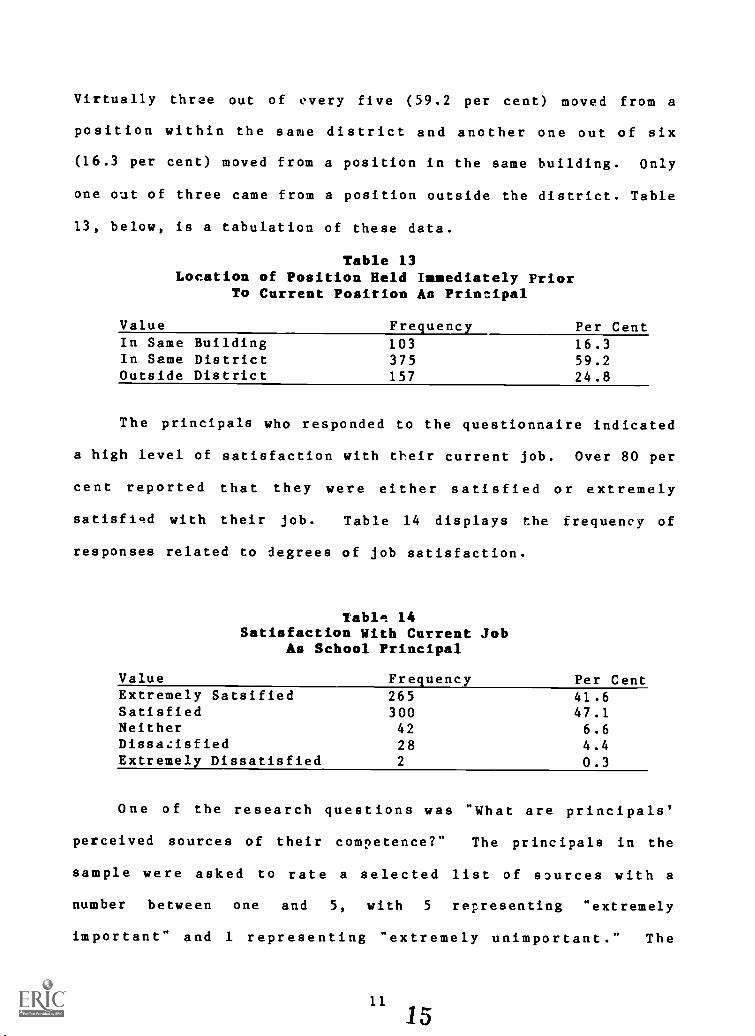
Virtually three out of every five (59.2 per cent) moved from a
position within the same district and another one out of six
(16.3 per cent) moved from a position in the same building. Only
one out of three came from a position outside the district. Table
13, below, is a tabulation of these data.
Table 13Location of Position Held Immediately Prior
To Current Position As Principal
ValueIn Same BuildingIn Same DistrictOutside District
Frequency103375157
Per Cent16.359.224.8
The principals who responded to the questionnaire indicated
a high level of satisfaction with their current job. Over 80 per
cent reported that they were either satisfied or extremely
satisfied with their job. Table 14 displays the frequency of
responses related to degrees of job satisfaction.
Table 14Satisfaction With Current Job
As School Principal
Value Frequency Per CentExtremely Satsified 265 41.6Satisfied 300 47.1Neither 42 6.6Dissatisfied 28 4.4Extremely Dissatisfied 2 0.3
One of the research questions was "What are principals'
perceived sources of their competence?" The principals in the
sample were asked to rate a selected list of sources with a
number between one and 5, with 5 representing "extremely
important" and 1 representing "extremely unimportant." The
11
15
1
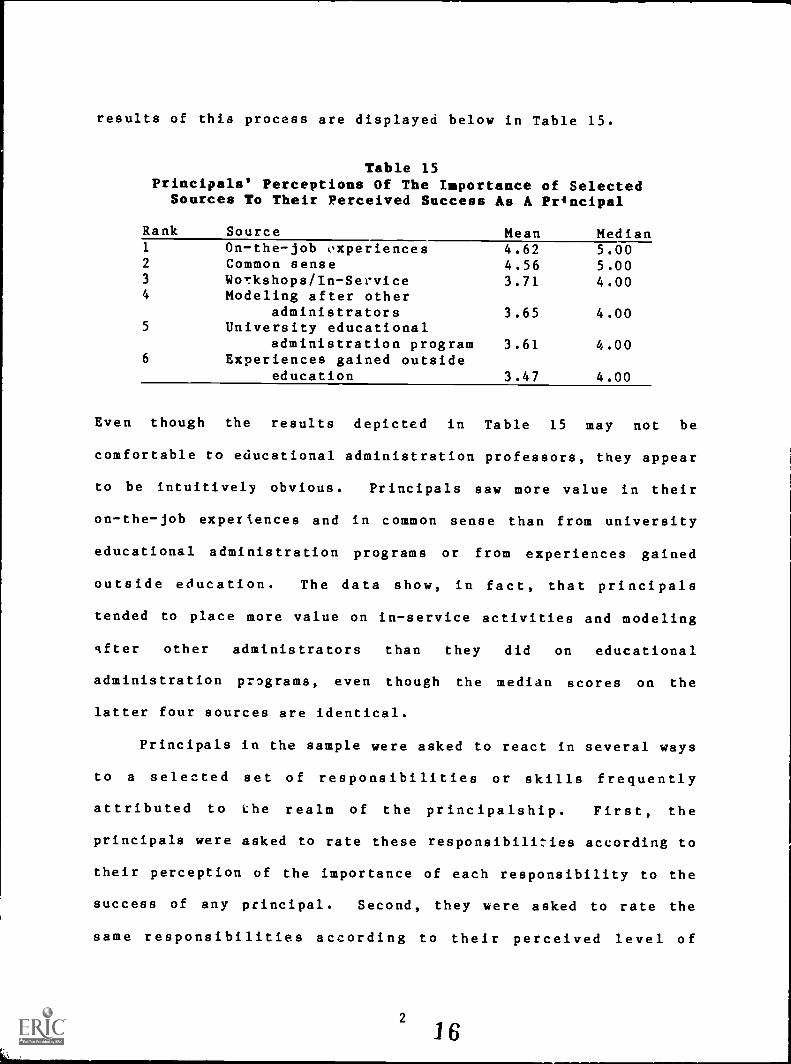
results of this process are displayed below in Table 15.
Table 15Principals' Perceptions Of The Importance of Selected
Sources To Their Perceived Success As A Pr4ncipal
Rank Source Mean1 On-the-job experiences 4.622 Common sense 4.563 Workshops/In-Service 3.714 Modeling after other
administrators 3.655 University educational
administration program 3.616 Experiences gained outside
education 3.47
Median5.005.004.00
4.00
4.00
4.00
Even though the results depicted in Table 15 may not be
comfortable to educational administration professors, they appear
to be intuitively obvious. Principals saw more value in their
on-the-job experiences and in common sense than from university
educational administration programs or from experiences gained
outside education. The data show, in fact, that principals
tended to place more value on in-service activities and modeling
4fter other administrators than they did on educational
administration programs, even though the median scores on the
latter four sources are identical.
Principals in the sample were asked to react in several ways
to a selected set of responsibilities or skills frequently
attributed to the realm of the principalship. First, the
principals were asked to rate these responsibilities according to
their perception of the importance of each responsibility to the
success of any principal. Second, they were asked to rate the
same responsibilities according to their perceived level of
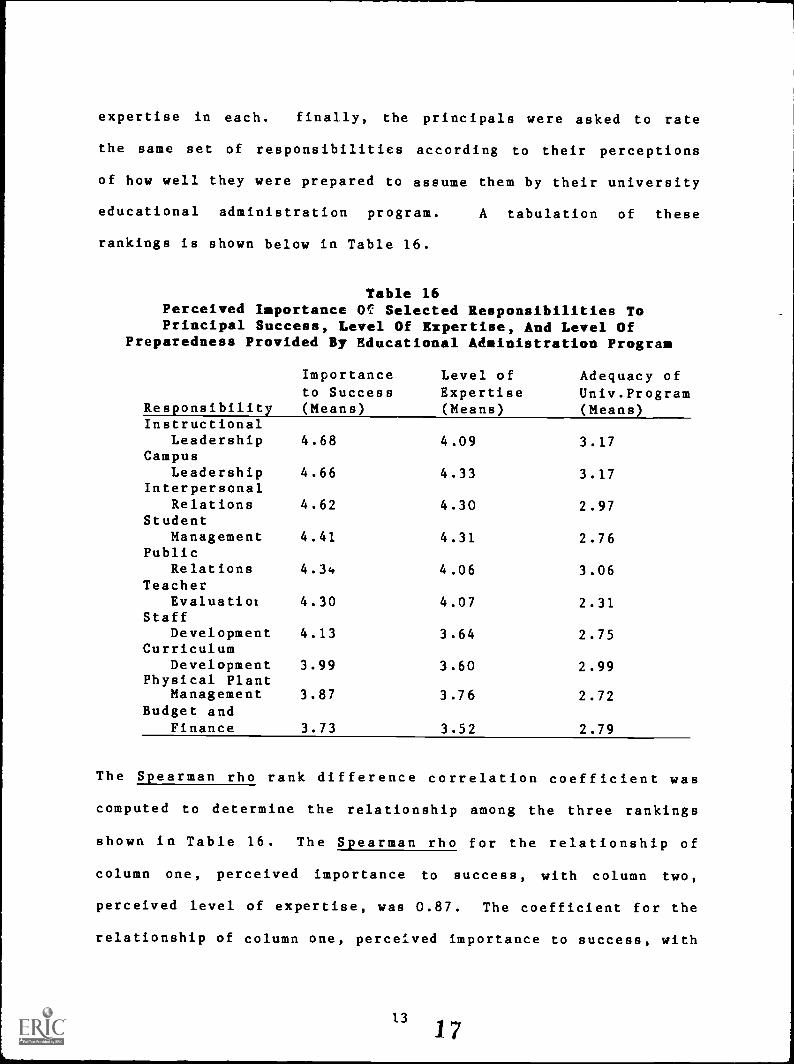
expertise in each. finally, the principals were asked to rate
the same set of responsibilities according to their perceptions
of how well they were prepared to assume them by their university
educational administration program. A tabulation of these
rankings is shown below in Table 16.
Table 16Perceived Importance Of:: Selected Responsibilities ToPrincipal Success, Level Of Expertise, And Level Of
Preparedness Provided By Educational Administration Program
Importance Level of Adequacy ofto Success Expertise Univ.Program
Responsibility (Means) (Means) (Means)Instructional
Leadership 4.68 4.09 3.17Campus
Leadership 4.66 4.33 3.17Interpersonal
Relations 4.62 4.30 2.97Student
Management 4.41 4.31 2.76Public
Relations 4.34 4.06 3.06Teacher
Evaluatiot 4.30 4.07 2.31Staff
Development 4.13 3.64 2.75Curriculum
Development 3.99 3.60 2.99Physical Plant
Management 3.87 3.76 2.72Budget and
Finance 3.73 3.52 2.79
The Spearman rho rank difference correlation coefficient was
computed to determine the relationship among the three rankings
shown in Table 16. The Spearman rho for the relationship of
column one, perceived importance to success, with column two,
perceived level of expertise, was 0.87. The coefficient for the
relationship of column one, perceived importance to success, with
column three, perceived adequacy of university preparation, was
0.60. The Spearman rho rank difference correlation coefficient
between column two, perceived level of expertise, with column
three, perceived adequacy of university preparation, was 0.31.
Significant Relationships Among Demographic Variables
Using the Chi-Square statistic, each of the seven
independent variables was tested against the following variables:
1. Current administrator's Certificate2. Administrator's certificate held when first administrator
job was obtained3. Elapsed time between receipt of mid-management certifi-
cate and first job as principal4. Tob-related changes of home address5. Distance of current job from the University where admin-
istrator training was received6. Position held immediately prior to current principal's
position7. Location of position held immediately prior to current
principal's position8. Satisfaction with current job
The following matrix depicts those pairs of variables which were
tested, and those which yielded a significant relationship (alpha
= 0.05) are indicated with an asterisk. The numbers (1-8) at the
top of each column identify the eight variables listed above,
respectively:
1418
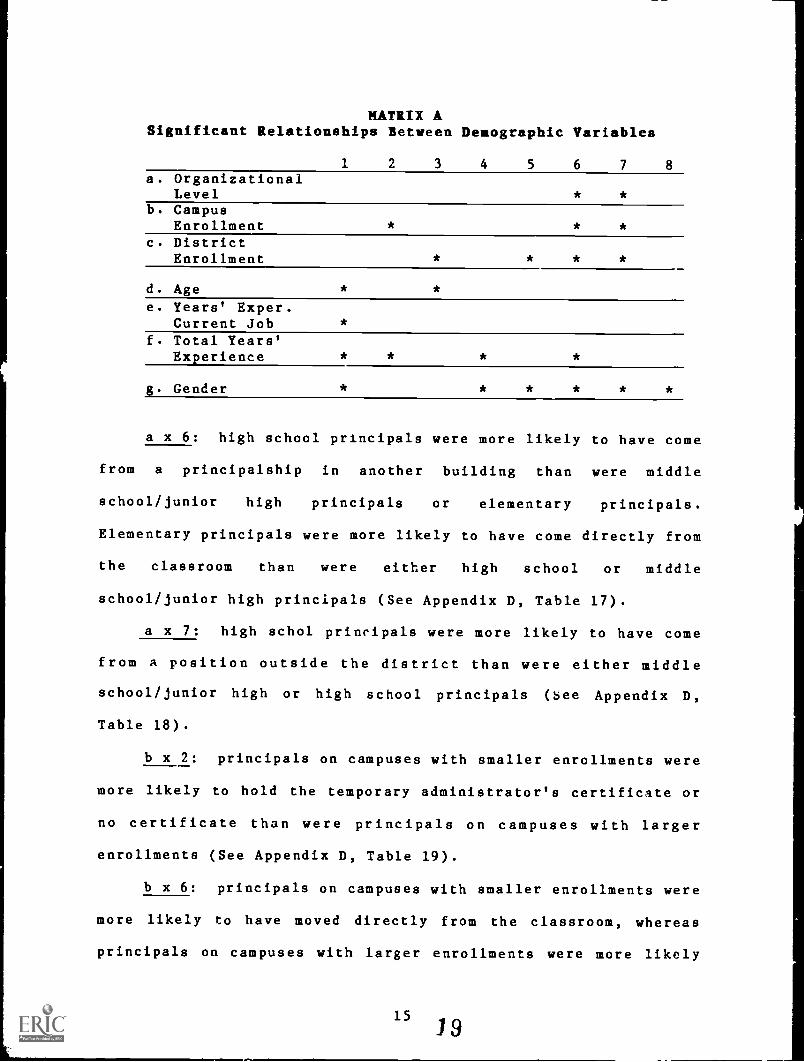
MATRIX ASignificant Relationships Between Deaographic Variables
1 2 3 4 5 6 7 8a. Organizational
Levelb. Campus
Enrollment *
c. DistrictEnrollment *
d. Agee. Years' Exper.
Current Job *
f. Total Years'Experience
g. Gender *
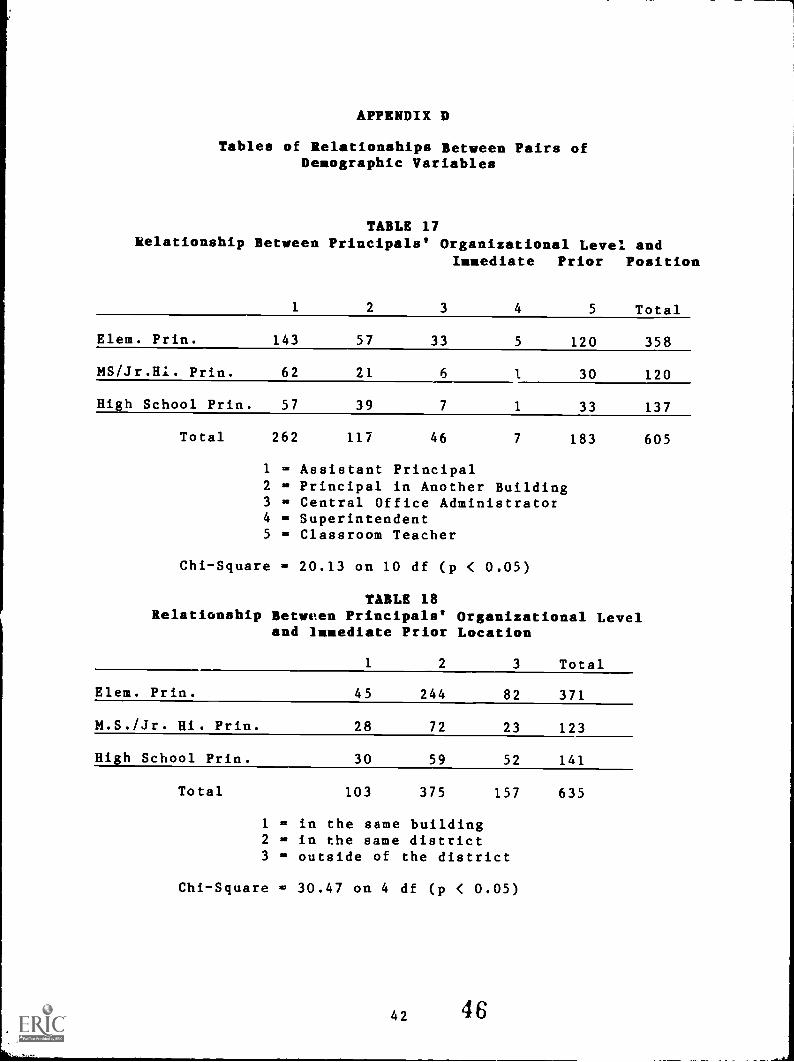
a x 6: high school principals were more likely to have come
from a principalship in another building than were middle
school/junior high principals or elementary principals.
Elementary principals were more likely to have come directly from
the classroom than were either high school or middle
school/junior high principals (See Appendix D, Table 17).
a x 7: high schol principals were more likely to have come
from a position outside the district than were either middle
school/junior high or high school principals (See Appendix D,
Table 18).
b x 2: principals on campuses with smaller enrollments were
more likely to hold the temporary administrator's certificate or
no certificate than were principals on campuses with larger
enrollments (See Appendix D, Table 19).
b x 6: principals on campuses with smaller enrollments were
more likely to have moved directly from the classroom, whereas
principals on campuses with larger enrollments were more likely
to have moved into the principalship from the assistant
principalship (See Appendix D, Table 20).
b x 7: principals on campuses with smaller enrollments were
more likely to have come from outside the district than were
principals on campuses with larger enrollments (See Appendix D,
Table 21).
c x 3: principals in districts with smaller enrollments
were more likely to have obtained their principalship within one
year of receipt of their mid-management certificate while
principals in districts with larger enrollments were more likely
to have waited 3-5 years to acquire their principalship after
receipt of their mid-management certificate (See Appendix D,
Table 22).
c x 5: principals in districts with larger enrollments were
closer to the university where they received their administrator
training than were principals in districts with smaller
enrollments (See Appendix d, Table 23).
c x 6: principals in districts with smaller enrollments
were more likely to have moved into the principalship directly
from the classroom than were principals in districts with larger
enrollments (See Appendix d, Table 24).
c x 7: principals in districts with smaller enrollments
were more likely to have movt: into'the principalship from a
position outside the district than were principals in districts
with larger enrollments (See Appendix d, Table 25).
d x 1: younger principals were more likely to currently
hold the mid-management certificate than were older principals
16
(See Appendix d, Table 26).
d x 3: older principals were more likely to have waited
longer to acquire their first principalship after receipt of
their mid-management certificate than were younger principals
(See Appendix d, Table 27).
e x 1: principals with more years' experience in their
current position were more likely to hold the superintendent's
certificate than were principals with fewer y rs' experience
while principals with fewer years' experience in their current
position were more likely to hold the temporary administrator's
certificate than were principals with more total years'
experience (See Appendix d, Table 28).
f x 1: principals with more years' total experience were
more likely to hold the superintendent's certificate or some
other higher certificate than were principals with fewer total
years' experience (See Appendix d, Table 29).
f x 2: younger principals were more likely to have acquired
the mid-management certificate when they acquired their first
principalship than were older principals (See Appendix d, Table
30) .
f x 4: principals with fewer years' total experience were
more likely to have had fewer job-related moves than were
principals with more years' total experience (See Appendix d,
Table 31).
f x 6: principals with fewer years' total experience were
more likely to have moved into the principalship directly from
the classroom than were principals with more years' total
17
21
experience while principals with more years' total experience
were more likely to have moved into the principalship from an
assistant principal's position than were principals with fewer
years' total experience (See Appendix d, Table 32).
g x 1: male principals were more likely to hold the
superintendent's certificate than were female principals (See
Appendix d, Table 33).
g x 4: male principals were more likely to have have had a
greater number of jobrelated moves than were female principals
(See Appendix d, Table 34).
g x 5: female principals were more likely to be located
closer to the university where they received their
administrator's training than were male principals (See Appendix
d, Table 35).
g x 6: femme principals' position held immediately prior
to current position was more likely to have been either assistant
principal or central office while male principals' position held
was more likely to have been classroom teacher or principal in
another building (See Appendix d, Table 36).
g x 7: female principals were more likely to have moved
into the principalship from a position within the same building
or district while male principals were more likely to have moved
from a position outside the district (See Appendix d, Table 37).
x 8: female principals were more likely to have expressed
a higher level of job satisfaction than were male principals (See
Appendix d, Table 37).
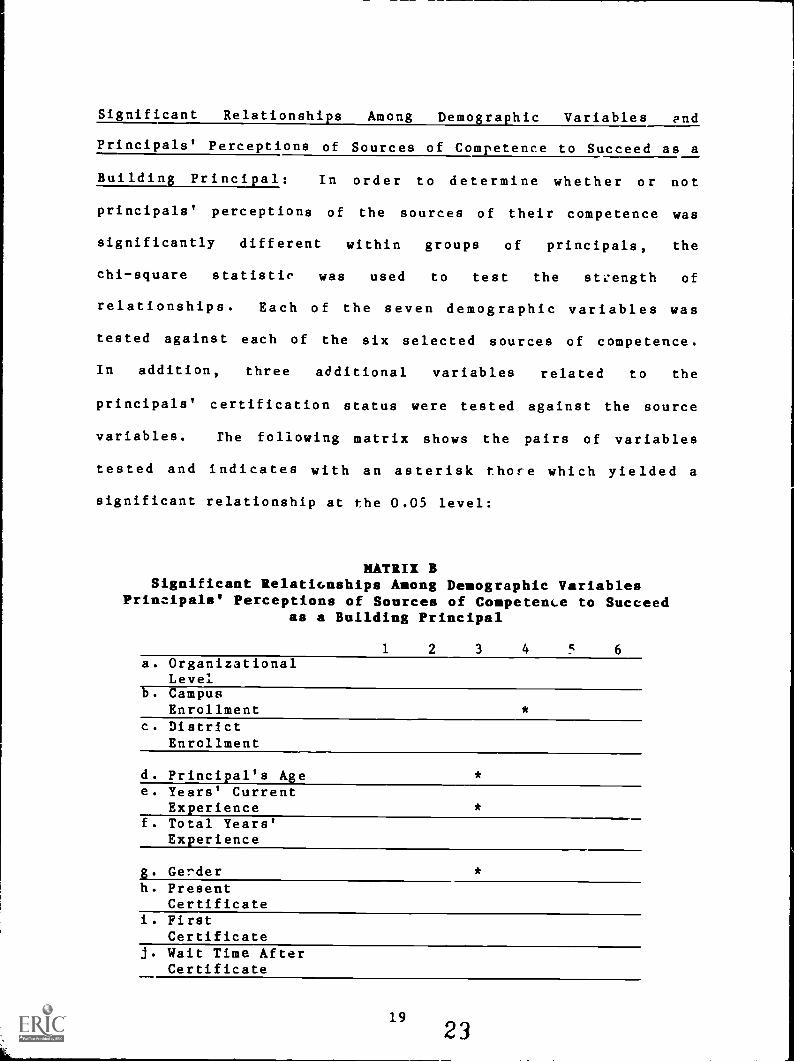
Significant Relationships Among Demographic Variables and
Principals' Perceptions of Sources of Competence to Succeed as a
Building Principal: In order to determine whether or not
principals' perceptions of the sources of their competence was
significantly different within groups of principals, the
chi-square statistic was used to test the strength of
relationships. Each of the seven demographic variables was
tested against each of the six selected sources of competence.
In addition, three additional variables related to the
principals' certification status were tested against the source
variables. The following matrix shows the pairs of variables
tested and indicates with an asterisk thole which yielded a
significant relationship at the 0.05 level:
MATRIX BSignificant Relationships Among Demographic Variables
Principals' Perceptions of Sources of Competence to Succeedas a Building Principal
1 2 3 4 s 6
a. OrganizationalLevel
campusEnrollment *
c. DistrictEnrollment
d. Principal's Agee. Years' Current
Experience
*
*
f. Total Years'Experience
g. Gerder *
h. PresentCertificate
i. FirstCertificate
j. Wait Time AfterCertificate
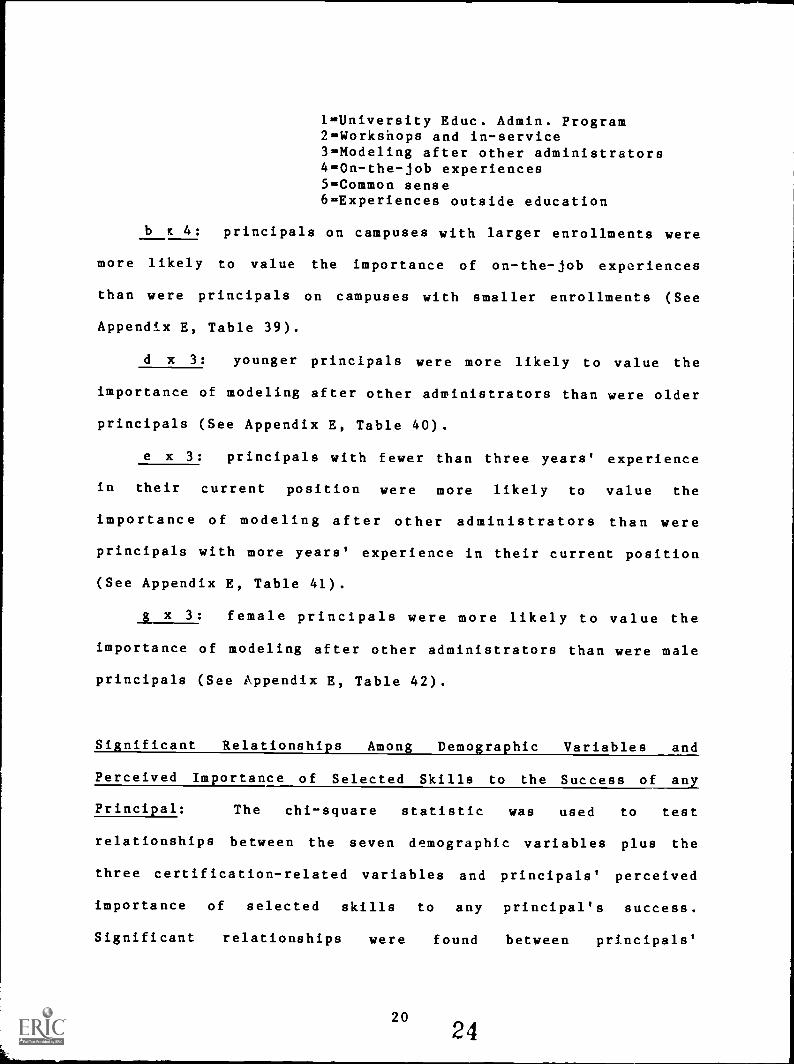
1=University Educ. Admin. Program2=Workshops and in-service3=Modeling after other administrators4=0n-the-job experiences5=Common sense6=Experiences outside education
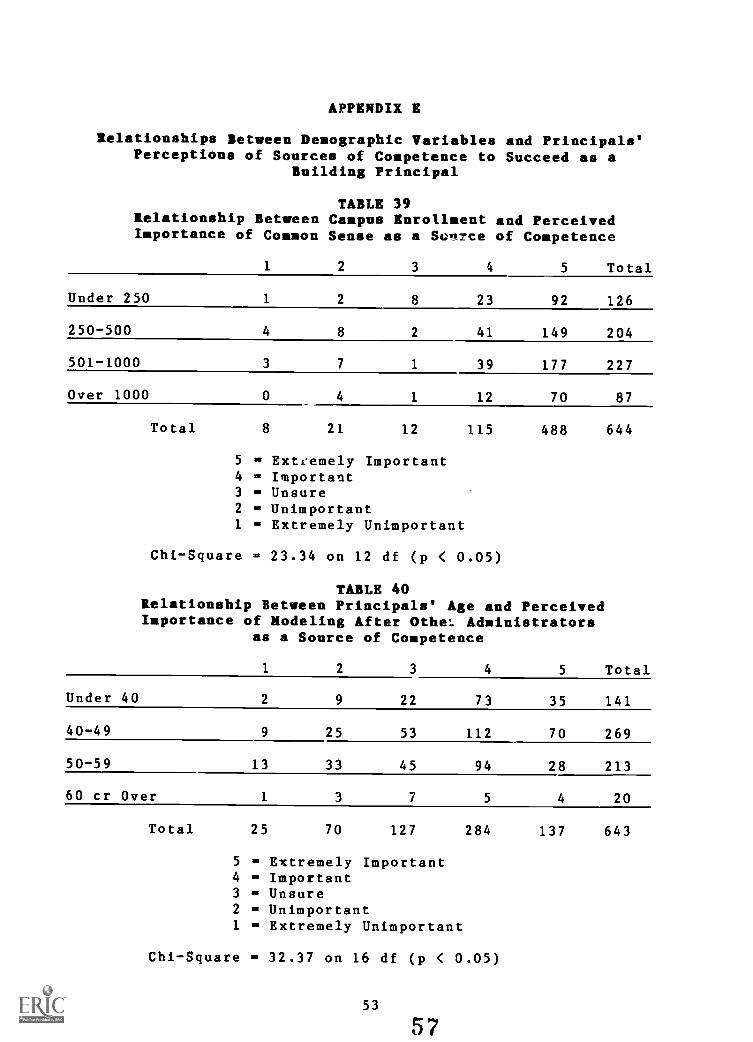
b K 4: principals on campuses with larger enrollments were
more likely to value the importance of on-the-job experiences
than were principals on campuses with smaller enrollments (See
Appendix E, Table 39).
d x 3: younger principals were more likely to value the
importance of modeling after other administrators than were older
principals (See Appendix E, Table 40).
e x 3: principals with fewer than three years' experience
in their current position were more likely to value the
importance of modeling after other administrators than were
principals with more years' experience in their current position
(See Appendix E, Table 41).
_IL x 3: female principals were more likely to value the
importance of modeling after other administrators than were male
principals (See Appendix E, Table 42).
Significant Relationships Among Demographic Variables and
Perceived Importance of Selected Skills to the Success of any
Principal: The chi-square statistic was used to test
relationships between the seven demographic variables plus the
three certification-related variables and principals' perceived
importance of selected skills to any principal's success.
Significant relationships were found between principals'
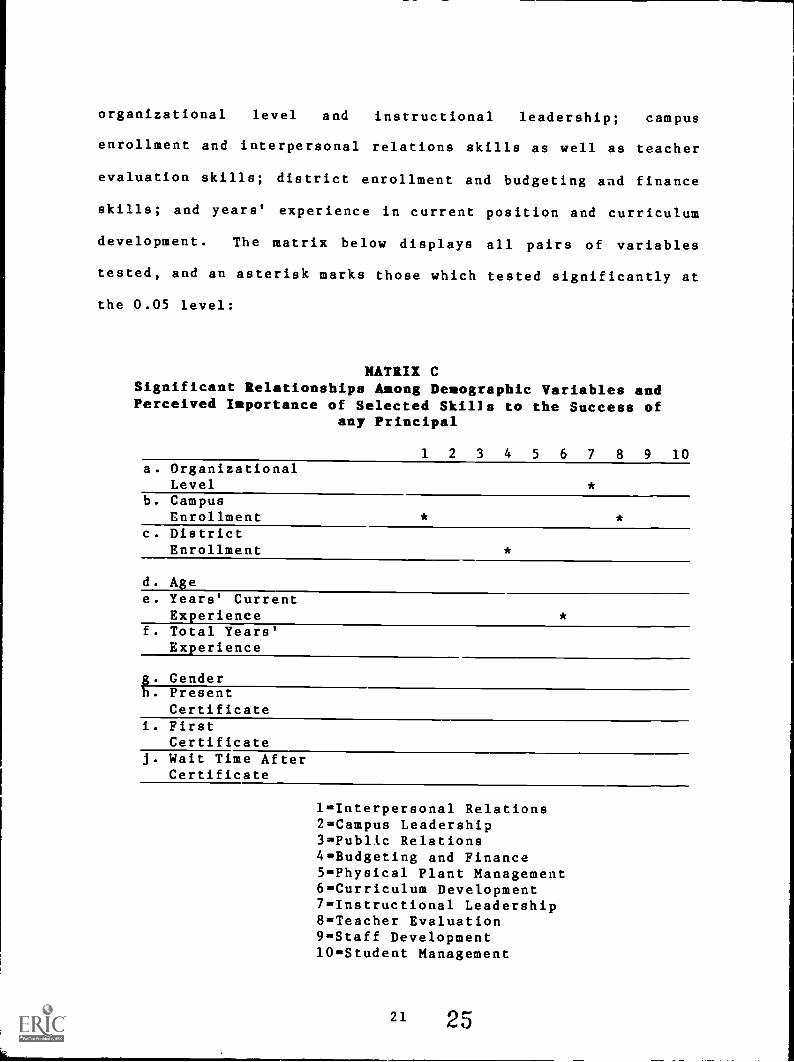
organizational level and instructional leadership; campus
enrollment and interpersonal relations skills as well as teacher
evaluation skills; district enrollment and budgeting and finance
skills; and years' experience in current position and curriculum
development. The matrix below displays all pairs of variables
tested, and an asterisk marks those which tested significantly at
the 0.05 level:
MATRIX CSignificant Relationships Among Demographic Variables andPerceived Importance of Selected Skills to the Success of
any Principal
1 2 3 4 5 6 7 8 9 10a. Organizational
Levelb. Campus
Enrollmentc. District
Enrollment
d. Agee. Years' Current
Experiencef. Total Years'
Experience
. Gender
. PresentCertificate
i. FirstCertificate
j. Wait Time AfterCertificate
1=Interpersonal Relations2=Campus Leadership3=Public Relations4=Budgeting and Finance5=Physical Plant Management6=Curriculum Development7=Instructional Leadership8=Teacher Evaluation9=Staff Development10=Student Management
21 25
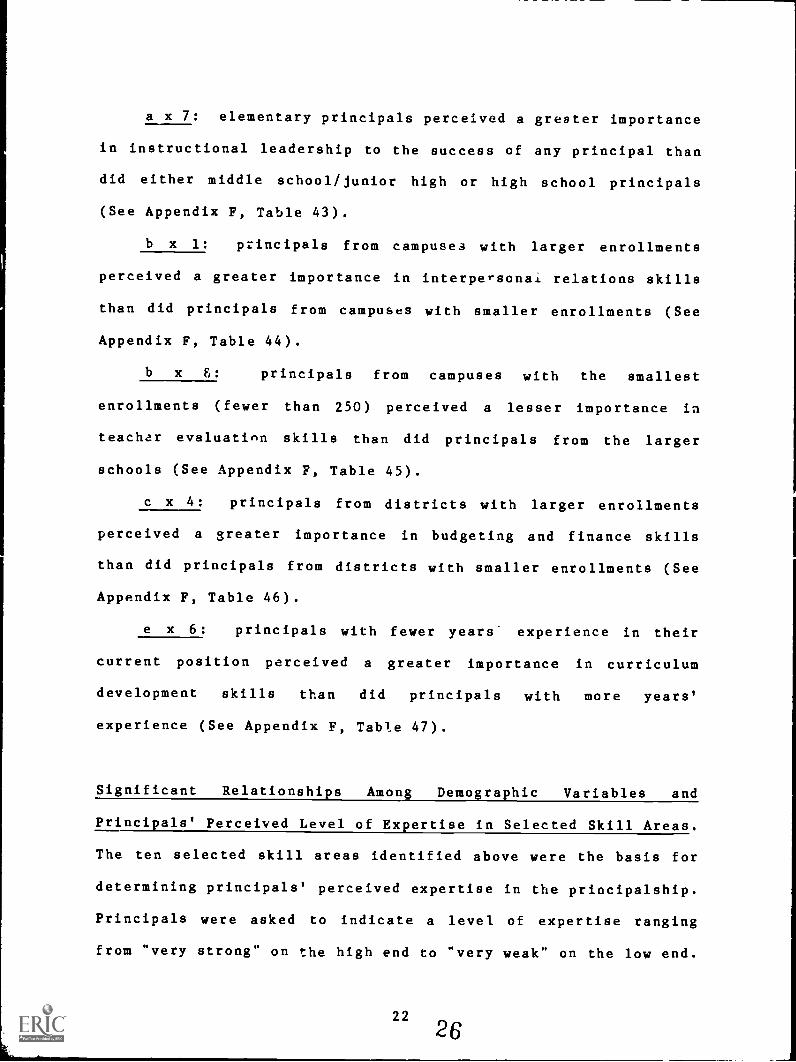
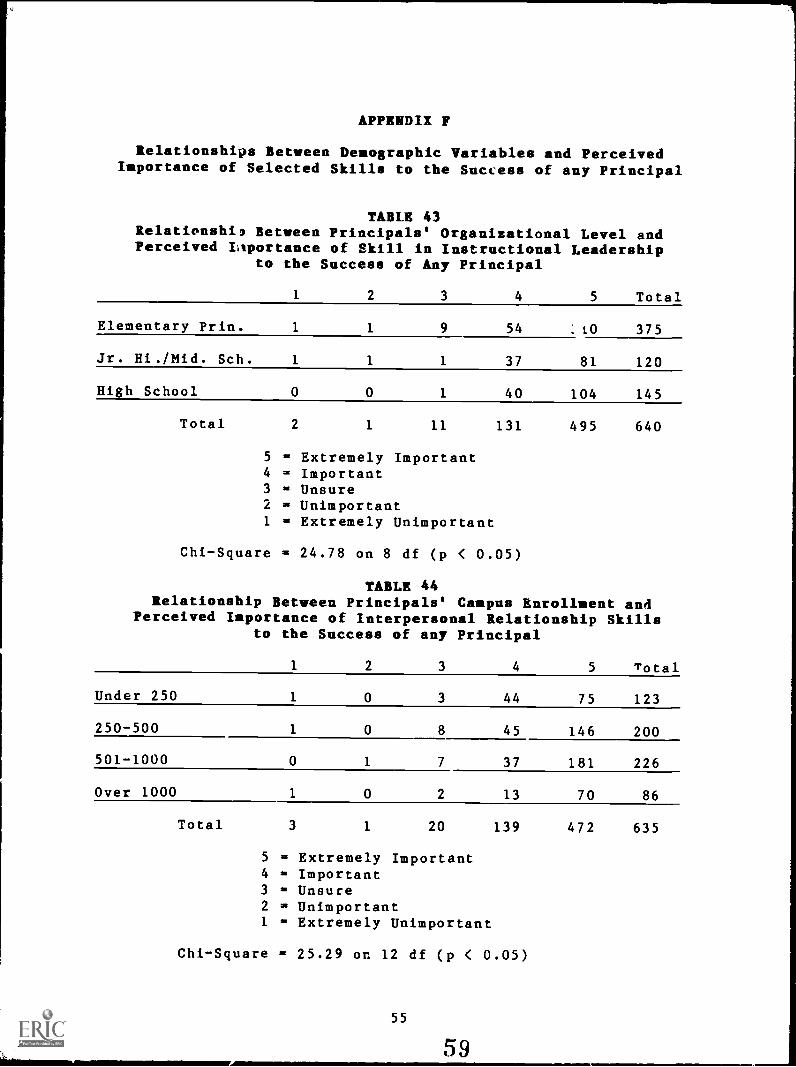
a x 7: elementary principals perceived a greater importance
in instructional leadership to the success of any principal than
did either middle school/junior high or high school principals
(See Appendix F, Table 43).
b x 1: principals from campuses with larger enrollments
perceived a greater importance in interpersonal relations skills
than did principals from campuses with smaller enrollments (See
Appendix F, Table 44).
b x &: principals from campuses with the smallest
enrollments (fewer than 250) perceived a lesser importance in
teacher evaluation skills than did principals from the larger
schools (See Appendix F, Table 45).
c x 4: principals from districts with larger enrollments
perceived a greater importance in budgeting and finance skills
than did principals from districts with smaller enrollments (See
Appendix F, Table 46).
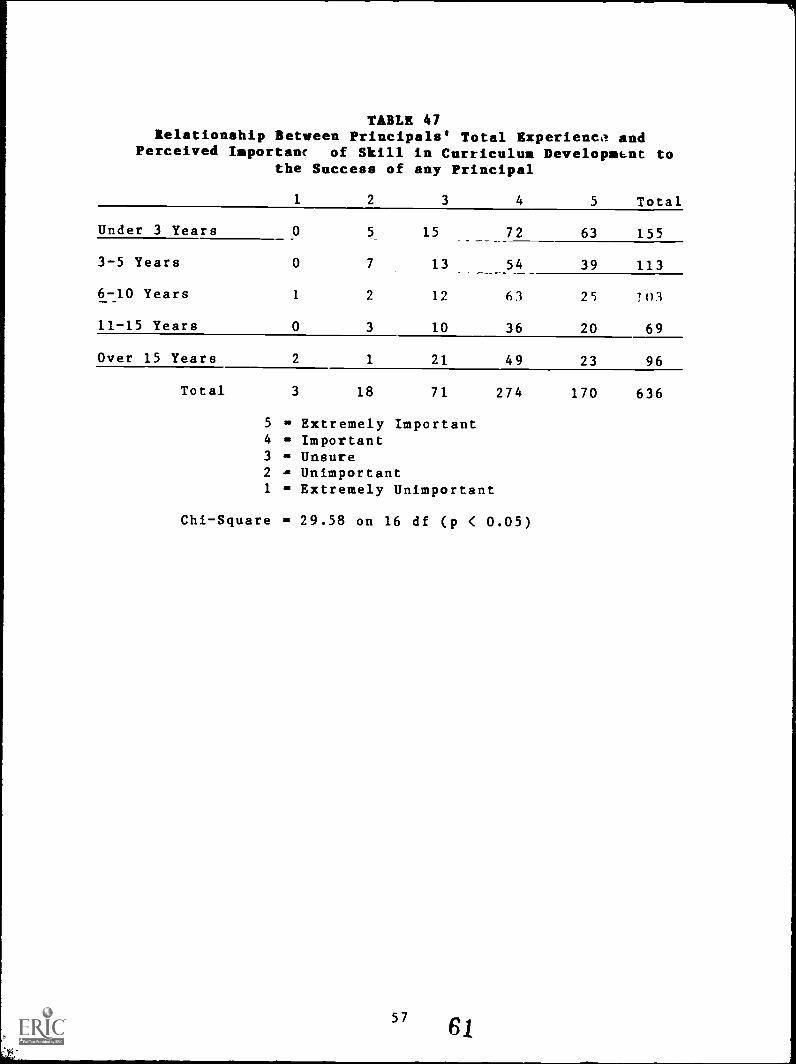
e x 6: principals with fewer years' experience in their
current position perceived a greater importance in curriculum
development skills than did principals with more years'
experience (See Appendix F, Table 47).
Significant Relationships Among Demographic Variables and
Principals' Perceived Level of Expertise in Selected Skill Areas.
The ten selected skill areas identified above were the basis for
determining principals' perceived expertise in the principalship.
Principals were asked to indicate a level of expertise ranging
from "very strong" on the high end to "very weak" on the low end.
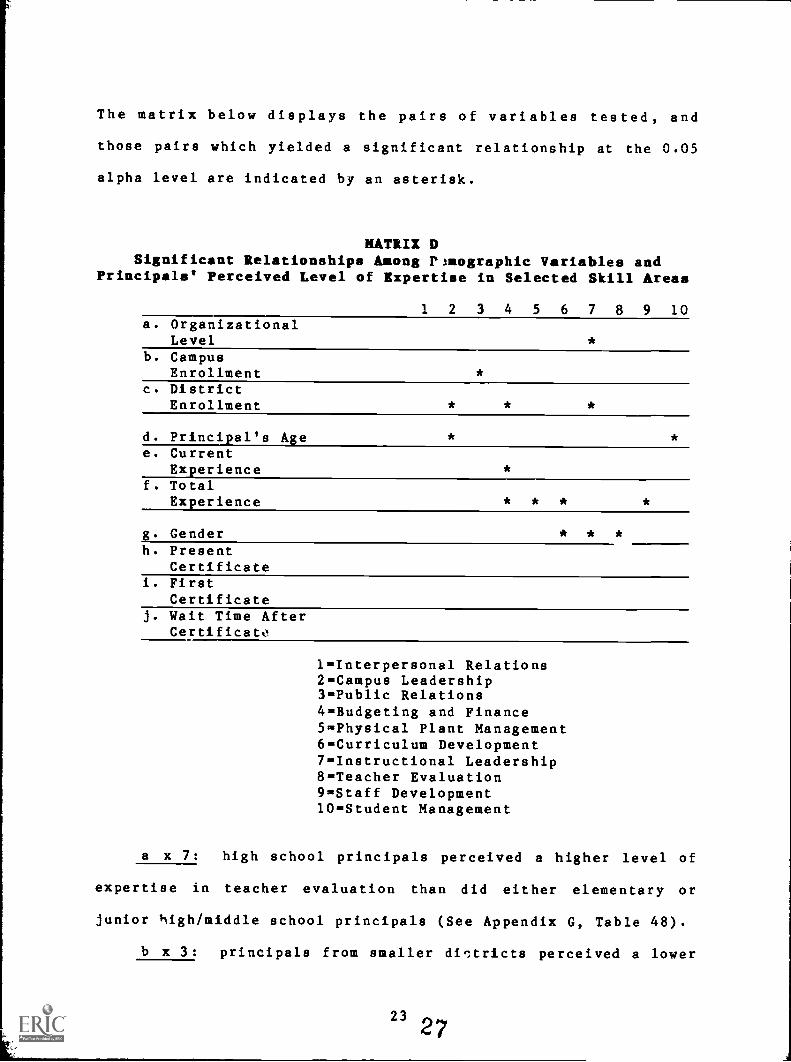
The matrix below displays the pairs of variables tested, and
those pairs which yielded a significant relationship at the 0.05
alpha level are indicated by an asterisk.
MATRIX DSignificant Relationships Among rmographic Variables and
Principals' Perceived Level of Expertise in Selected Skill Areas
1 2 3 4 5 6 7 8 9 10a. Organizational
Levelb. Campus
Enrollmentc. District
Enrollment * * *
d. Principal's Agee. Current
Experiencef. Total
Experience * * *
g. Gender * * *h. Present
Certificatei. First
CertificateJ. Wait Time After
Certificate
1- Interpersonal Relations2=Campus Leadership3- Public Relations4- Budgeting and Finance5- Physical Plant Management6- Curriculum Development7- Instructional Leadership8- Teacher Evaluation9=Staff Development10=Student Management
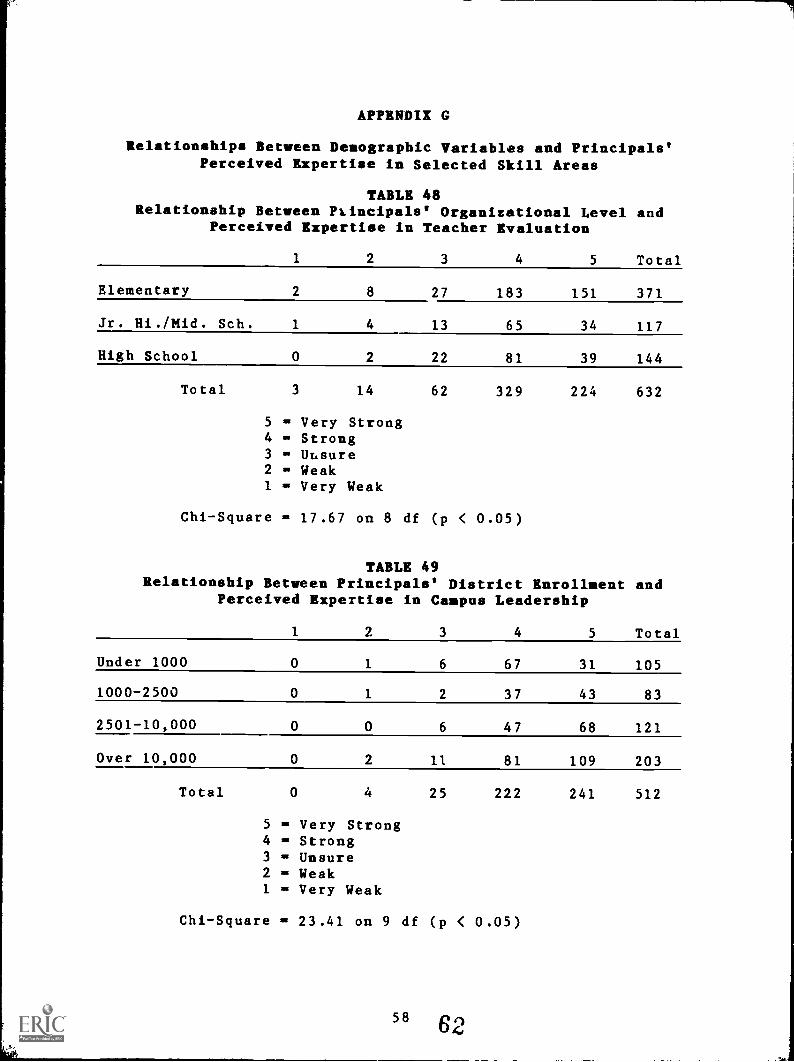
a x 7: high school principals perceived a higher level of
expertise in teacher evaluation than did either elementary or
junior high/middle school principals (See Appendix G, Table 48).
b x 3: principals from smaller disltricts perceived a lower
23 27
level of expertise in campus leadership than did principals from
larger districts (See Appendix G, Table 49).
c x 2: principals from campuses win smaller enrollments
perceived a lower level of expertise in public relations than did
principals from campuses with larger enrollments (See Appendix G,
Table 50).
c x 4: principals from districts with enrollments under
1000 perceived a lower level of expertise in budgeting and
finance skills than did principals from districts with larger
enrollments (See Appendix G, Table 51).
c x 7: principals from districts with enrollments under
1000 perceived a lower level of expertise in instructional
leadership skills than did principals from districts with
enrollments over 2,500 (See Appendix G, Table 52).
d x 2: older principals perceived a higher level of
expertise in campus leadership than did younger principals (See
Appendix G, Table 53).
d x 10: principals in the 30-50 year alp_ range perceived a
higher level of expertise in student management than did older
principals (See Appendix G, Table 54).
e x 4: principals with fewer than three years' experience
in their current position perceived a lower level of expertise in
budgeting and finance skills than did principals with more years'
experience in their current job (See Appendix G, Table 55).
f x 4: principals with more years" total experience
perceived a higher level of expertise in budgeting and finance
skills than did principals with fewer years' total experience
24
28
(See Appendix G, Table 56).
f x 5: principals with more years' total experience
perceived a higher level of expertise in physical plant
management than did principals with fewer years' total experience
(See Appendix G, Ta,le 57).
f x 6: principals with more years' total experience
perceived a higher level of expertise in curriculum development
than did principals with fewer years' total experience (See
Appendix G, Table 58).
f x 9: principals with more years' total experience
perceived a higher level of expertise in staff development skills
than did principals with fewer years' total experience (See
Appendix G, Table 59).
ji. x 6: female principals perceived a higher level of
expertise in curriculum development than did male principals (See
Appendix G, Table 60).
g x 7: female principals perceived a higher level of
expertise in instructional leadership than did male principals
(See Appendix G, Table 61).
g x 8: female principals perceived a higher level of
expertise in teacher evaluation than did male principals (See
Appendix G, Table 62).
Significant Relationships Among Demographic Variables and
Principals' Perceived Level of Preparation Received in Their
University Educational Administtation Program. Principals were
asked to indicate the level of preparation
25
29
00, provided by their
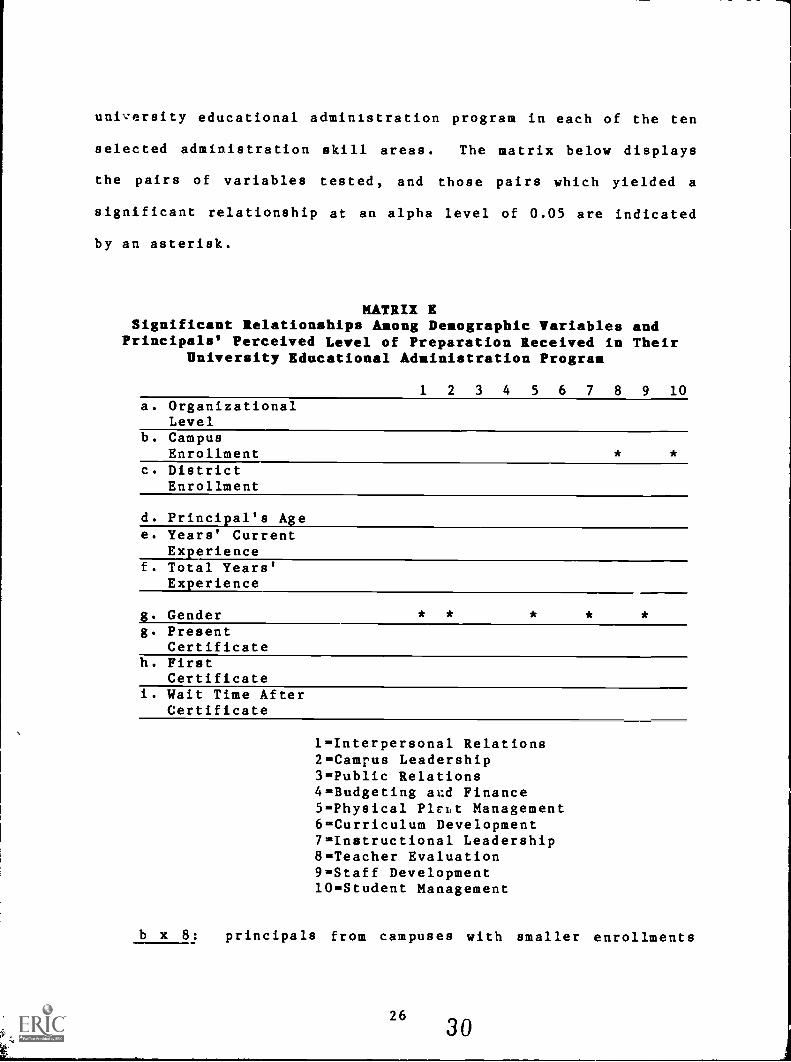
university educational administration program in each of the ten
selected administration skill areas. The matrix below displays
the pairs of variables tested, and those pairs which yielded a
significant relationship at an alpha level of 0.05 are indicated
by an asterisk.
MATRIX ESignificant Relationships Among Demographic Variables and
Principals' Perceived Level of Preparation Received in TheirUniversity Educational Administration Program
1 2 3 4 5 6 7 8 9 10a. Organizational
Levelb. Campus
Enrollmentc. District
Enrollment
d. Principal's Agee. Years' Current
Experiencef. Total Years'
Experience
g. Genderg. Present
Certificateh. First
Certificatei. Wait Time After
Certificate
* * *
1=Interpersonal Relations2=Campus Leadership3=Public Relations4=Budgeting ar.d Finance5=Physical PleLt Management6=Curriculum Development7=Instructional Leadership8=Teacher Evaluation9=Staff Development10=Student Management
b x 8: principals from campuses with smaller enrollments
perceived a better preparation in teacher evaluation than did
principals from campuses with larger enrollments (See Appendix H,
Table 63).
b x 10: principals from campuses with enrollments between
250-500 perceived a Jetter preparation in student management than
did either principals from campuses with smaller enrollments or
principals from campuses with larger enrollments (See Appendix H,
Table 64).
p x 1: male principals perceived a better preparation in
ir'erpersonal relations than did female principals (See Appendix
H, Table 65).
g x 2: female principals perceived a better preparation in
campus leadership skills than did male principals (See Appendix
H, Table 66).
g x 5: male principals perceived a better preparation in
physical plant management skills than did female principals (see
Appendix H, Table 67).
g x 7: female principals perceived a better preparation in
instructional leadership skills than did male principals (See
Appendix H, Table 68).
g x 9: female principals perceived a better preparation in
staff development skills than did male principals (See Appendix
H, Table 69).
Analysis of OpenEnded Responses. The principals were asked to
.respond to the questions, "In a few words, what is most
satisfying about your current job as principal?" and "In a few
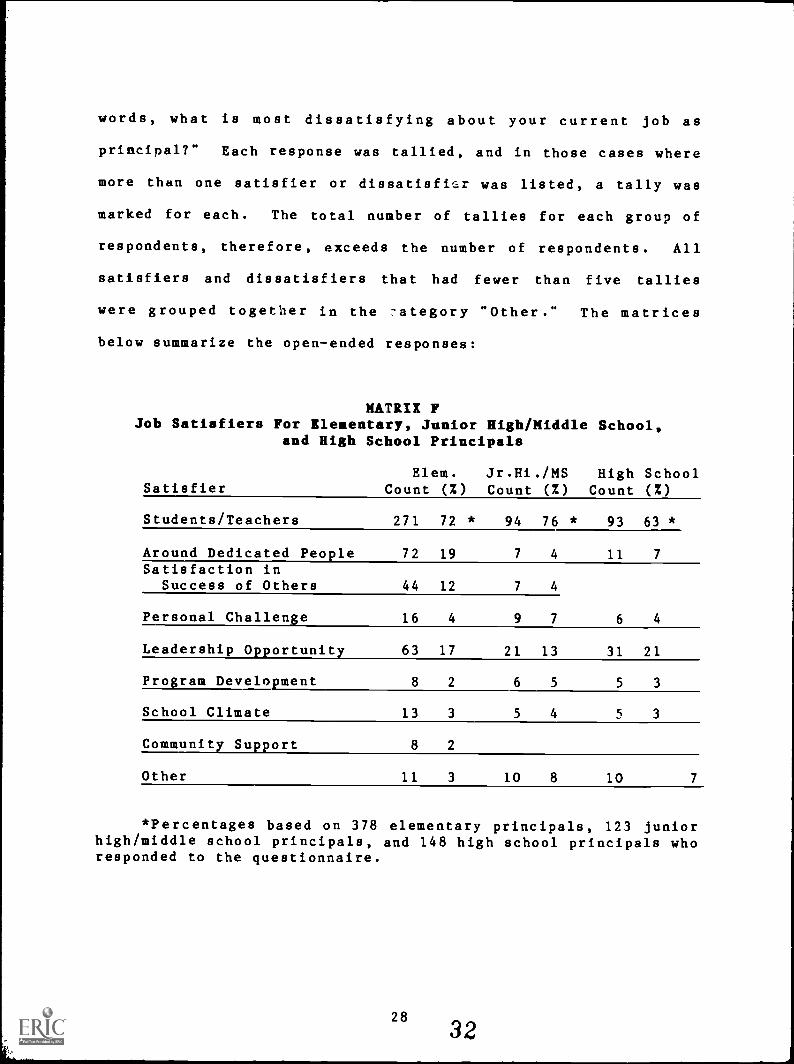
words, what is most dissatisfying about your current job as
principal?" Each response was tallied, and in those cases where
more than one satisfier or dissatisfir was listed, a tally was
marked for each. The total number of tallies for each group of
respondents, therefore, exceeds the number of respondents. All
satisfiers and dissatisfiers that had fewer than five tallies
were grouped together in the 7ategory "Other." The matrices
below summarize the open-ended responses:
MATRIX FJob Satisfiers For Elementary, Junior High/Middle School,
and High School Principals
Elem. Jr.Hi./MS High SchoolSatisfier Count (%) Count (%) Count (%)
Students/Teachers 271 72 * 94 76 * 93 63 *
Around Dedicated People 72 19 7 4 11 7
Satisfaction inSuccess of Others 44 12 7 4
Personal Challenge 16 4 9 7 6 4
Leadership Opportunity
Pro ram Develo ment
School Climate
63 17 21 13 31 21
8 2 6 5 5 3
13 3 5 4 5 3
Community Support 8 2
Other 11 3 10 8 10 7
*Percentages based on 378 elementary principals, 123 juniorhigh/middle school principals, and 148 high school principals whoresponded to the questionnaire.
28
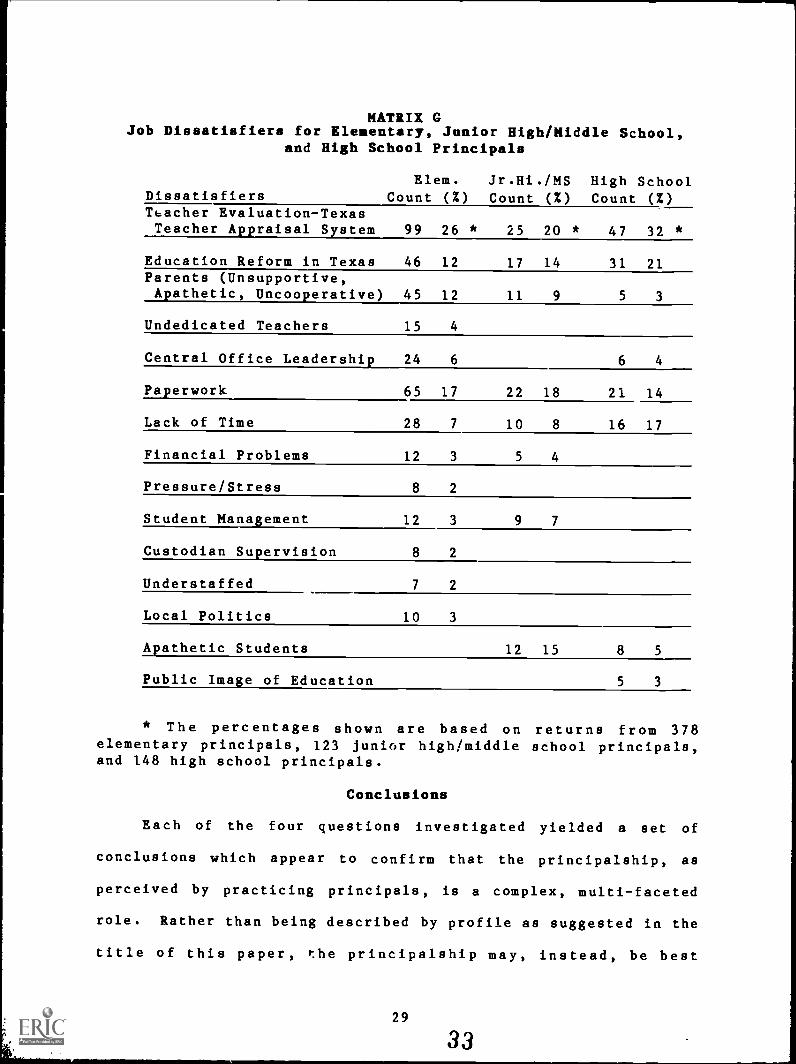
MATRIX GJob Dissatisfiers for Elesentary, Junior High/Middle School,
and High School Principals
Elem. Jr.Hi./MS High SchoolDissatisfiers Count (%) Count (%) Count (%)Teacher Evaluation-TexasTeacher Appraisal System 99 26 * 25 20 * 47 32 *
Education Reform in Texas 46 12 17 14 31 21Parents (Unsupportive,Apathetic, Uncooperative) 45 12 11 9 5 3
Undedicated Teachers 15 4
Central Office Leadership 24 6 6 4
Paperwork 65 17 22 18 21 14
Lack of Time 28 7 10 8 16 17
Financial Problems 12 3 5 4
Pressure/Stress 8 2
Student Management 12 3 9 7
Custodian Supervision 8 2
Understaffed 7 2
Local Politics 10 3
Apathetic Students 12 15 8 5
Public Image of Education 5 3
* The percentages shown are based on returns from 378elementary principals, 123 juni6r high/middle school principals,and 148 high school principals.
Conclusions
Each of the four questions investigated yielded a set of
conclusions which appear to confirm that the principalship, as
perceived by practicing principals, is a complex, multi-faceted
role. Rather than being described by profile as suggested in the
title of this paper, the principalship may, instead, be best
29
33
.1
described as multi-dimensional. When perceptions of the entire
smaple are analyzed, for example, the results neatly overlay
other reseazch findings and intuitive logic. When perceptions of
various subsets of the sample are analyzed and compared one to
the other, however, the results reveal a complex set of
relationships.
Sources of Competence. One-the-job experiences and common
sense were seen as the most important sources of competence by
principals. University educational administration preparation
programs and experiences gained outside of education were seen as
least important. An explanation of the relatively low perceived
importance of educational administration preparation programs may
be that principals have internalized the learnings to the extend
that they are perceived as common sense.
Modeling after other administrators was the one source that
yielded differences among subsets of principals. Principals from
campuses with larger enrollments, younger principals, principals
with fewer than three years' experience in their current job, and
female principals were significantly more likely to value the
importance of modeling than were their counterparts. Except for
this one source of modeling after other administrators, all
subsets tested yielded no significant differences in relative
importance of the sources.
Importance of and Level of Expertise in Selected
Administrative Skills and Adeequcy of University Educational
Administration Programs in Preparing Principals to Execute the
Skills. Whereas the principals surveyed perceived all ten areas
of responsibility to be of importance, they saw university
educational administration preparation programs to be of lesser
importance in preparing them to execute the skills. The lowest
ranked skill area in perceived importance to success was
budgeting and finance skills. This area had a mean of 3.73 on a
one-to-five scale with five being high. Conversely, preparation
in instructional leadership by university educational
administration programs yielded the highest mean of only 3.17.
When principals' perceived level of exoertise was compared
to perceived adequacy of preparation, level of expertise yielded
much higher means, and the rank difference correlation
coefficient was a relatively low 0.31. Thus, while principals
saw themselves with relatively high levels of expertise in all
ten areas, they did not attribute this expertise to their
university preparation programs.
When relationships among subsets of principals were tested
against principals' perceived level of expertise in the selected
skill areas, those which yielded significant relationships were
size of district, age of the principal, total administrative
experience, and gender of the principal (See Matrix D). Findings
related to principals' gender were the most intriguing. Female
principals saw themselves as having significantly more expertise
in curriculum development, instructional leadership, and teacher
evaluation skills than did male principals. One possible
explanation of these findings is that female principals are, in
general, newer to the principalship and are, therefore, more
aware o2 the importance of these skills.
31 35
Gender was again the variable that yielded significant
differences in relationships when compared to principals'
perceptions of the adequacy of their university preparation
program in educational administration. Male principals perceived
a 'aigher level of preparation in interpersonal relations and in
physical plant management skills while female principals
perceived a higher level of preparation in campus leadership
skills, instructional leadership skills, and staff development
skills. A study of these results may lead to a conclusion
similar to the one related to perceived expertise. Since female
principals are, in general, newer to the principalship, they may
be more aware of the importance of these skills. Another
possible reason may be that the females in the study were
predominantly at the elementary level, and traditionally
elementary principals have expressed a greater interest in
curriculum and instruction skills than their counterparts at the
secondary level.
Open-Ended Responses. No surprises were found in the
e-Rmination of open-ended responses in which principals were
asked to indicate what is most satisfying to them in their
current job. Sy an overwhelming majority, principals see their
association with students and teachers to be the most satisfying.
Working relationships with what were termed "dedicated people,"
regardless of where they were was also given as an important
satisfier. Opportunities for leadership, the personal challenge
associated with the principalship, and personal satisfaction in
the success of others were also perceived to be satisfiers.
32
Those satisfiers mentioned less often were program development,
the school climate, and community support. Thus, one may
conclude that principals enjoy their job because of leadership
opportunities with dedicated people, especially students and
teachers.
Whereas the range of satisfiers was basically limited to
eight, the dissatisfiers mentioned numbered approximately forty.
All three organizational groups of principals agreed that the new
Texas Teacher Appraisal System, educational reform, paperwork,
lack of time, and unsupportive/apathetic/uncooperative parents
were major dissatisfiers. The most frequently mentioned of these
were coping with educational reform and the Texas Teacher
Appraisal System.
Elementary princi -1s tended to indicate a wider range of
dissatisfiers than did either junior high/middle school or high
school principals. Elementary principals mentioned uncommitted
teachers whereas the other two groups did not; they mentioned
pressure and/or stress whereas the other two groups did not; they
mentioned custodial supervision whereas the other two groups did
not; they mentioned understaffing whereas the other two groups
did not; and they mentioned local politics, either in the
district or in the community whereas the the other two groups did
not.
Analysis of the open-ended responses as well as the
categorical responses appear to describe the principal as someone
who is generally more satisfied than dissatisfied; someone who
has a high perception of expertise in the field; and as someone
33 37
who looks upon common sense and on-the-job experiences as being
of greater value than education received in a university program
in educational administration.
Bibliography
Allison, Derek J., and others. "Thinking Critically AboutEducational Administration: A Martian View." Paperpresented at the Annual Meeting of the Canadian Associationfor the Study of Educational Administration, Vancouver,B.C., June 5, 1983. ED 251 933.
Beck, John J. "thje Administrative Manager in the 21st Century:An International Perspective." Paper presented at thePan-Pacific Converence II: A Business, Economic, andTechnological Exchange, Seoul, Korea, May, 1985. ED 258 333
Carnine, Douglas, Russel Gersten, and Susan Green. "ThePrincipal as Instructional Leader: A Second Look."Educational Leadership 40(December, 1982), 47-50.
Cawelti, Gordon. "Training for Effective School Administrators."Educational Leadership 39(February, 1982), 324-329.
Dianda, Marcella R. The Superintendent's Can-Do Guide to SchoolImprovement. Washington, D. C: Council for EducationalDevelopment and Research, 1984. 113 pages.
Gibboney, richard A. "Education of Administrators: 'An AmericanTragedy'." Education Week (April 15, 1987), 28.
Goodlad, John I. A Place Called School: Prospects for theFuture. New York(McGraw Hill, 1983).
Greenfield, William D. "Being and Becoming a Principal:Responses to Work contexts and Socialization Processes."Paper presented at the Annual Meeting of the AmericanEducation Research Association, Chicago, March 31-April 4,1985. ED 254 932.
Greenfield, William D. "Reseal.h on Public School Principals: AReview and Recommendations." Paper prepared foz theNational Conference on the Principalship, convened by theNational Institute for Education, Washington, D.C., October20-22, 1982. ED 224 178.
Howell, Bruce. "Profile of the Principalship." EducationalLeadership 38(Jaauary, 1981), 333-336.
Hoyle, John R., F. English, and B. Steffy. Skills for SuccessfulSchool Leaders. Arlington, Virginia (American Associationof School Administrators, 1985).
Joyce, Bruce R. Improving America's Schools. New York (LongmanPress, 1986).
Page, Jane A. and Fred M. Page, Jr. "Principals' Perceptions of
35
39
Their Role and the Perceived Effectiveness of Their AcademicPreparation for that Role." Educational ResourcesInformation Center, 1984. ED 242 710
Pharis, William L. and Sally Banks Zakariya. The ElementarySchool Principalshi_p in 1978: A Research Study. Reston,Virginia (National Association of Elementary SchoolPrincipals, 1979).
. PerformanceBased Preparation of Principals: AFramework for Improvement. Reston, Virginia (NationalAssociation of Secondary School Principals, 1985).
Thomson, Scott. "The Eighties: How Are We Doing?" NASSPBulletin 70(March, 1986), 40-49.
Trider, Donald M., Kenneth A. Leithwood, and Deborah J.Montgomery, "Exploring the Causes of Principal Behavior."Paper presented at the Annual Meeting of the AmericnaEducational Research Association, Chicago, March 31April 4,1985. ED 257 178.
Weldy, Gilbert R. Principals: What They Do and Who they Are.Reston, Virginia (National Association of Secondary SchoolPrincipals, 1979).
Wolcott, Harry F. The Man in the Principal's Office: AnEthnography. New York (Holt, Rinehart, and Winston, 1973).
3 6 41
7
APPENDIX A
Southwest Texas State UniversitySan Marcos. Texas 786664616 AC512 245-2575
'department of Educational AdmInIshation
and Mythological lervloesJanuary 5, 1986
Dear Colleague:
Your role as building principal is critical in determiningschool effectiveness. Most researchers and other observers of theeducational scene have referred to the building principal as the"gatekeeper of change." The overall effectiveness of a school isoften traced directly to the actions of the principal.
As we all search for ways to increase the principal'sopportunities for success, it becomes very important to learn moreabout who the principal is, what is important to the principal,and what the principal believes to be important concerning his orher role. inese data can be used to help the profession meet itsresponsibilities.
I am interested in studying the role of the principal inTexas. You have been selected to participate in a study whichinvestigates this ISSUE. Please take a few minutes to completethe enclosed questionnaire, and return it in the envelope whichhas been provided. If you have any questions or concerns, pleasecall me at (512) 245-2575
Sincerely,
n J. eck, Jr., Ph.D.t,'Associate Professor
Enclosures
CO
QUESTI ONNAIRERole of the Principal
DIRECTIONS: Please check or circle the choice listed forTWEE-Fiii describes you or your school.
1. Your campus enrollment(1) Under 250
---(2) 250-500(3) 501-1000
---(4) Over 1000
3. Education Servicebelongs.
4. Your age(1) Under 30
--(2) 30-39
-----(3)
40-49(4) 50-59
--(5) 60 or Wier
Center
6. Total years experienceas a school administrator
(1) Under 3--(2) 3-5
------(3)
6-10(4) 11-15(5) Over 15
Region
each item
2. Your District Enrollment(1) Under 1000
---(2) 1000-2500---(3) 2501-10,000---(4) Over 10,000
to which your district
5. Years experience incurrent position
(I) Under 3----(2) 3-5---(3) 6-10----(4) 11-15---(5) Over 15
7. Your sex(I) Female(2) Male
8. Which administrator certificate do you presently___(1) None
(2) Temporary Mid-Management Administrator(3) Mid-Management Administrator(4) Superintendent
:::(1) Other
I. Which administrator certificate did you have when you began yourfirst job as a school administrator?_(1) None___(2) Temporary Mid-Management Administrator___(3) Mid-Management Administrator_(4) Superintendent
(5) Other
IF YOU CHECKED RESPONSE (3), ABOVE, ANSWER 10. OTNERWISE, SKIP TO /11
10. How long did you have your Mid-Nanagement AdministratorCertificate before you got your first job as a principal?
(1) Less than 1 year___(2) 1-2 years
(3) 3-5 years_(4) Over 5 years
have?
11. Since entering school administration, how many job-related changesof home address have you had?
(1) None---(2) 1-2--(3) 3-5--(4) Over 5
12. How far is your current jo4 from the university where you receivedyour Nid-Management Administrator certificate?
(1) Under 50 miles---(2) 50-99 miles
(3) 100-249 miles;4) 250 miles or more
13. What position did you hold immediately prior to your currentposition as building principal?
(I) Assistant principal--(2) Principal in another building---(3) Central office administrator--(4) Superintendent
----(5) Classroom teacher::::(6) Position outside of education
14. Where were you located when you held the position immediatelyprior to your current position as principal?
(1) In the same building----(2) In the same district:::(3) Outside of the district
15. Now satisfied are you with your current job?(1) Extremely satisfied
----(2) Satisfied---(3) Neither satisfied nor dissatisfied---(4) Dissatisfied:::(5) Extremely dissatisfied
Rate the following sources according to their importance to yJu inproviding you with the necessary competence to succeed as a principal.Enter a number between 5 and 1, with 5 "Extremely important,' 4'Impo.tant,e 3 'Unsure,' 2 'Unimportant,' and 1 'Extremelyunimportant.'
16. University educational administration program
17. Workshops and in- service attended
18. Modeling after other administrators
11. On-the-job experiences
20. Common sense
21. Experiences gained outside of education
PLEASE CONTINUE ON BACK SIDE
42 43
APPENDIX C
TABULATION OF FREQUENCY OF RESPONSE AND P38 CENT RESPONSE BYCATEGORICAL VALUE YOR SIX INDEPENDENT VARIABLES
Value< 250250-500501-11,00
> 1000
Table ICampus Enrollment of Respondents
Frequency12720522787
Per Cent19.731.735.113.5
Table 2District Enrollment of Respondents
Value Frequency Per Cent< 1000 110 20.91000-2500 85 16.22501-10,000 123 23.4> 10,000 208 39.5
lzillte 3
Age of Respondents
Value Frequency Per Cent< 30 5 00.830 q 136 21.0i 272 42.0
215 33.2> 20 03.0
Table 4Years' Experience in Current Position
Value Frequency Per Cent< 3 160 29.03-5 114 20.76-10 108 19.611-15 71 12.9> 15 99 17.9
Table 5Total Teace Experience as a School Administrator
Value Frequency Per Cent< 3 60 09.33-5 107 16.66-10 160 24.911-15 131 20.4> 15 185 28.8
40 44
ValueFemaleMale
Table 6Gender of Respondent
Frequency141430
Per Cent24.775.3
41 45
APPENDIX D
Tables of Relationships Between Pairs ofDemographic Variables
TABLE 17Relationship Between Principals' Organizational Level and
Immediate Prior Position
1 2 3 4 5 Total
Elem. Prin. 143 57 33 5 120 358
MS/Jr.Hi. Prin. 62 21 6 1 30 120
High School Prin. 57 39 7 1 33 137
Total 262 117 46 7 183 605
1 = Assistant Principal2 = Principal in Another Building3 = Central Office Administrator4 = Superintendent5 = Classroom Teacher
Chi-Square = 20.13 on 10 df (p < 0.05)
TABLE 18Relationship Between Principals' Organizational Level
and immediate Prior Location
1 2 3 Total
Elem. Prin. 45 244 82 371
M.S./Jr. Hi. Prin. 28 72 23 123
High School Prin. 30 59 52 141
Total 103 375 157 635
1 = in the same building2 = in the same district3 = outside of the district
Chi-Square = 30.47 on 4 df (p < 0.05)
42 46
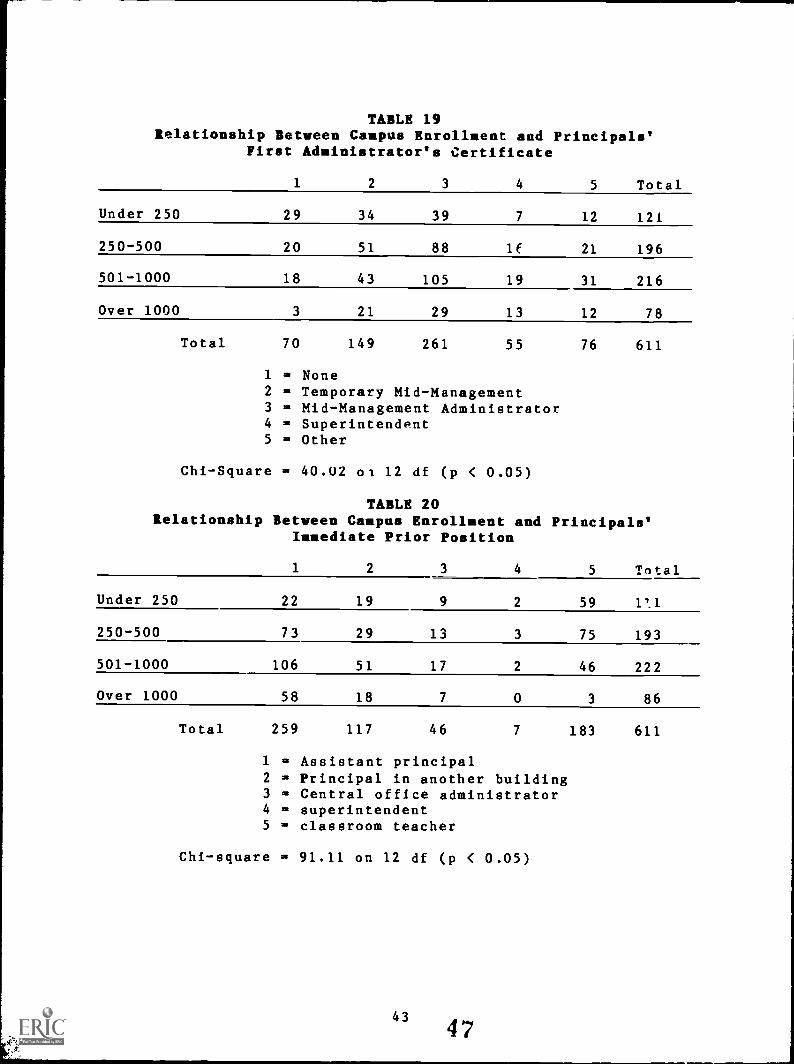
TABLE 19Relationship Between Campus Enrollment and Principals'
First Administrator's Certificate
1 2 3 4 5 Total
Under 250 29 34 39 7 12 121
250-500 20 51 88 if 21 196
501-1000 18 43 105 19 31 216
Over 1000 3 21 29 13 12 78
Total 70 149 261 55 76 611
1 = None2 = Temporary Mid-Management3 = Mid-Management Administrator4 = Superintendent5 = Other
Chi-Square = 40.02 ol 12 df (p < 0.05)
TABLE 20Relationship Between Campus Enrollment and Principals'
Immediate Prior Position
1 2 3 4 5 Total
Under 250 22 19 9 2 59 1"_1
250-500 73 29 13 3 75 193
501-1000 106 51 17 2 46 222
Over 1000 58 18 7 0 3 86
Total 259 117 46 7 183 611
1 = Assistant principal2 = Principal in another building3 = Central office administrator4 = superintendent5 = classroom teacher
Chi-square = 91.11 on 12 df (p < 0.05)
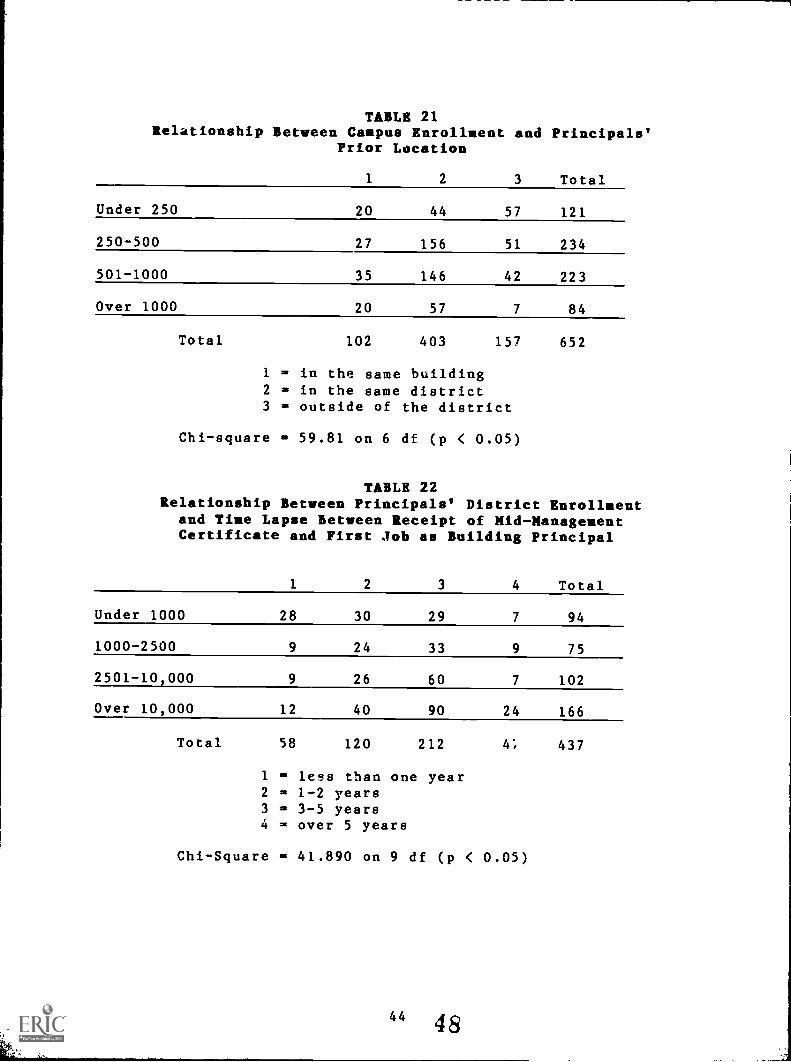
TABLE 21Relationship Between Campus Enrollment and Principals'
Prior Location
1 2 3 Total
Under 250 20 44 57 121
250-500 27 156 51 234
501-1000
Over 1000
Total
35 146 42 223
20 57 7 84
102 403 157 652
1 = in the same building2 = in the same district3 = outside of the district
Chi-square = 59.81 on 6 df (p < 0.05)
TABLE 22Relationship Between Principals' District Enrollment
and Time Lapse between Receipt of Mid-ManagementCertificate and First Job as Building Principal
1 2 3 4 Total
Under 1000 28 30 29 7 94
1000-2500 9 24 33 9 75
2501-10,000 9 26 60 7 102
Over 10,000 12 40 90 24 166
Total 58 120 212 4; 437
1 = less than one year2 = 1-2 years3 = 3-5 years4 = over 5 years
Chi-Square = 41.890 on 9 df (p < 0.05)
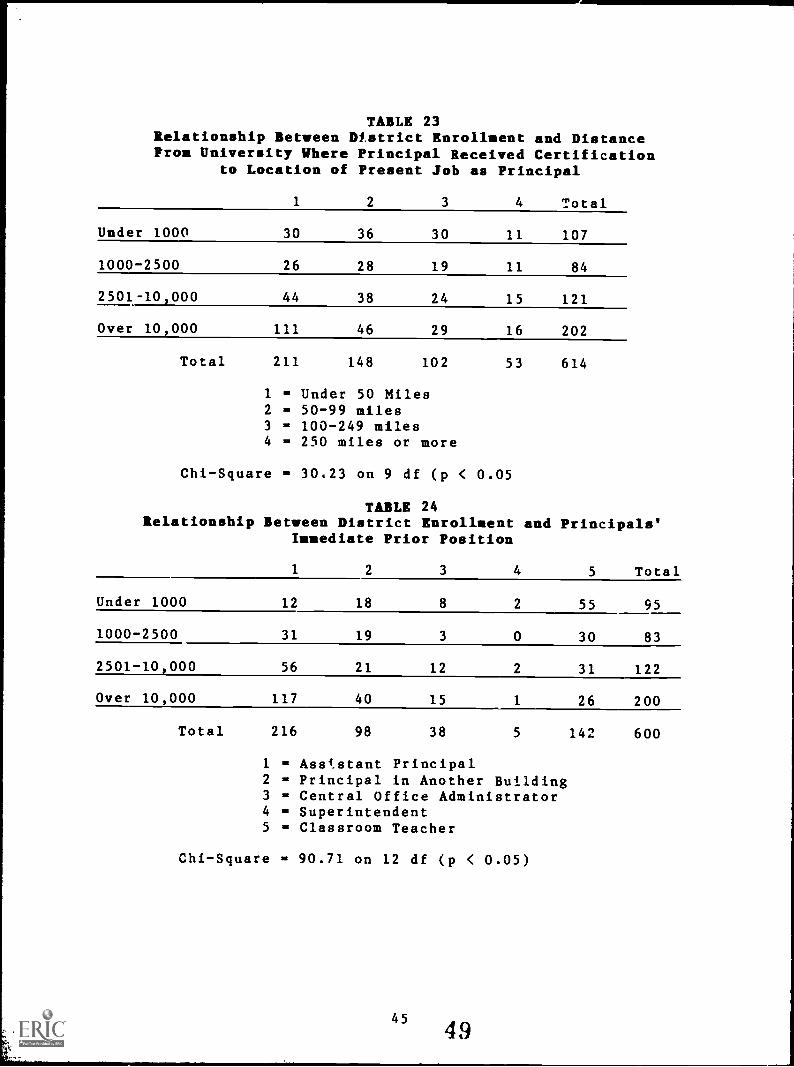
TABLE 23Relationship Between District Enrollment and DistanceFrom University Where Principal Received Certification
to Location of Present Job as Principal
1 2 3 4 Total
Under 1000 30 36 30 11 107
1000-2500 26 28 19 11 84
2501-10,000 44 38 24 15 121
Over 10,000 111 46 29 16 202
Total 211 148 102 53 614
1 = Under 50 Miles2 = 50-99 miles3 = 100-249 miles4 = 250 miles or more
Chi-Square = 30.23 on 9 df (p < 0.05
TABLE 24Relationship Between District Enrollment and Principals'
Immediate Prior Position
1 2 3 4 5 Total
Under 1000 12 18 8 2 55 95
1000-2500 31 19 3 0 30 83
2501-10,000 56 21 12 2 31 122
Over 10,000 117 40 15 1 26 200
Total 216 98 38 5 142 600
1 = Asststant Principal2 = Principal in Another Building3 = Central Office Administrator4 = Superintendent5 = Classroom Teacher
Chi-Square = 90.71 on 12 df (p < 0.05)
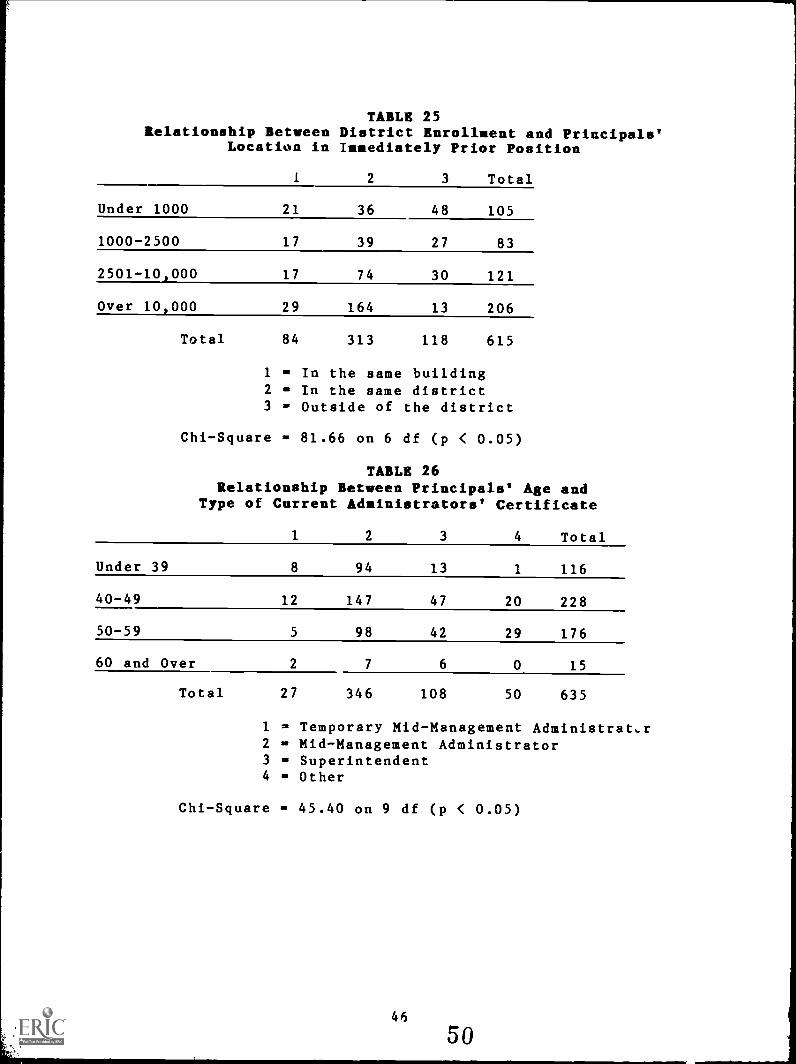
TABLE 25Relationship Between District Enrollaent and Principals'
Location in Iuuediately Prior Position
1 2 3 Total
Under 1000 21 36 48 105
1000-2500 17 39 27 83
2501-10,000 17 74 30 121
Over 10,000 29 164 13 206
Total 84 313 118 615
1 w In the same building2 = In the same district3 w Outside of the district
Chi-Square w 81.66 on 6 df (p < 0.05)
TABLE 26Relationship Between Principals' Age and
Type of Current kduinistrators' Certificate
1 2 3 4 Total
Under 39 8 94 13 1 116
40-49 12 147 47 20 228
50-59 5 98 42 29 176
60 and Over 2 7 6 0 15
Total 27 346 108 50 635
1 = Temporary Mid-Management Administrator2 w Mid-Management Administrator3 w Superintendent4 w Other
Chi-Square w 45.40 on 9 df (p < 0.05)
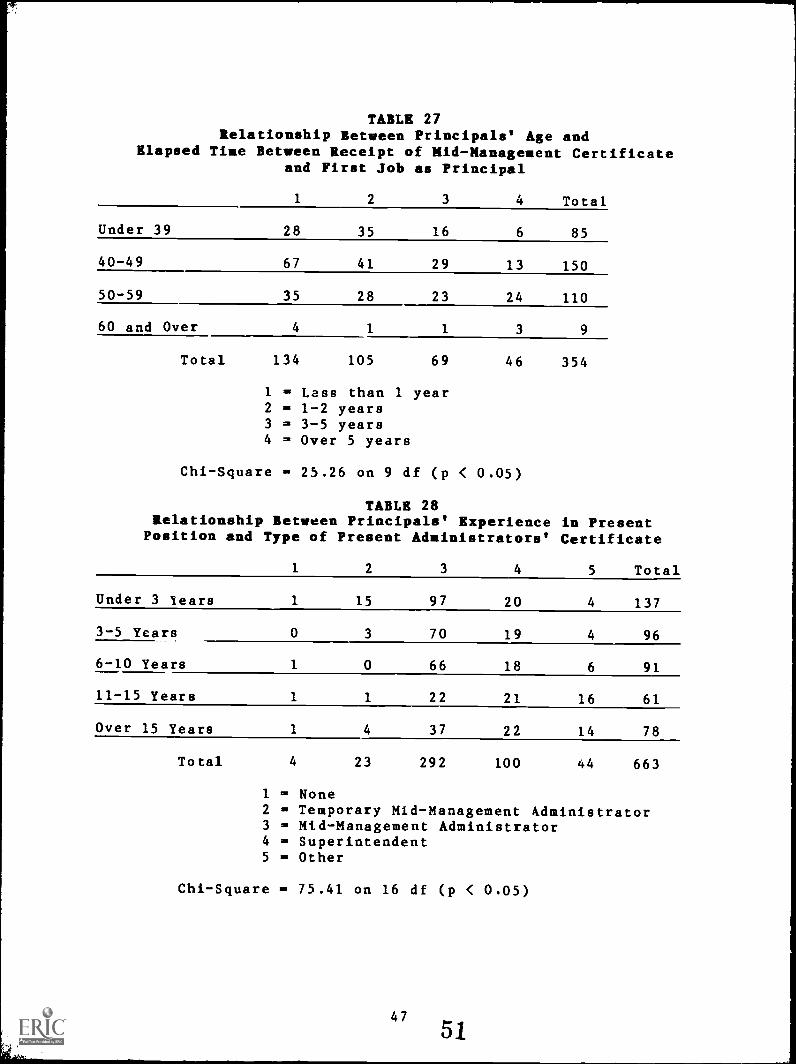
TABLE 27Relationship Between Principals' Age and
Elapsed Time Between Receipt of Mid-Management Certificateand First Job as Principal
1 2 3 4 Total
Under 39 28 35 16 6 85
40-49 67 41 29 13 150
50-59 35 28 23 24 110
60 and Over 4 1 1 3 9
Total 134 105 69 46 354
1 .. Lass than 1 year2 .. 1-2 years3 3-5 years4 Over 5 years
Chi-Square .. 25.26 on 9 df (p < 0.05)
TABLE 28Relationship Between Principals' Experience
Position and Type of Present Administrators'in PresentCertificate
1 2 3 4 5 Total
Under 3 Years 1 15 97 20 4 137
3-5 Years 0 3 70 19 4 96
6-10 Years 1 0 66 18 6 91
11-15 Years 1 1 22 21 16 61
Over 15 Years 1 4 37 22 14 78
Total 4 23 292 100 44 663
1 ... None
2 is, Temporary Mid-Management Administrator3 Mid-Management Administrator4 Superintendent5 .. Other
Chi-Square . 75.41 on 16 df (p < 0.05)
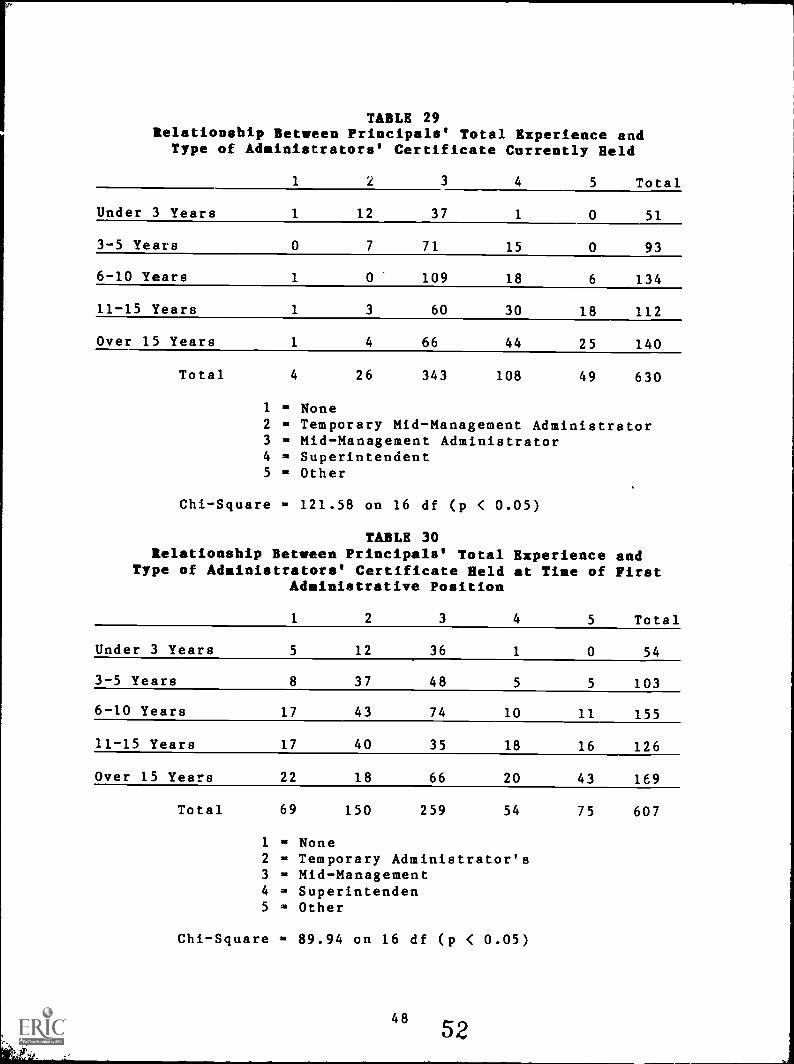
TABLE 29Relationship Between Principals' Total Experience and
Type of Aduinistrators' Certificate Currently Held
1 2 3 4 5 Total
Under 3 Years 1 12 37 1 0 51
3-5 Years 0 7 71 15 0 93
6-10 Years 1 0 109 18 6 134
11-15 Years 1 3 60 30 18 112
Over 15 Years 1 4 66 44 25 140
Total 4 26 343 108 49 630
1 = None2 = Temporary Mid-Management Administrator3 = Mid-Management Administrator4 = Superintendent5 = Other
Chi-Square = 121.58 on 16 df (p < 0.05)
TABLE 30Relationship Between Principals' Total Experience
Type of Aduiniatrators' Certificate Held at Tine ofAduinistrative Position
andFirst
1 2 3 4 5 Total
Under 3 Years 5 12 36 1 0 54
3-5 Years 8 37 48 5 5 103
6-10 Years 17 43 74 10 11 155
11-15 Years 17 40 35 18 16 126
Over 15 Years 22 18 66 20 43 169
Total 69 150 259 54 75 607
1 = None2 = Temporary Administrator's3 = Mid-Management4 = Superintenden5 = Other
Chi-Square = 89.94 on 16 df (p < 0.05)
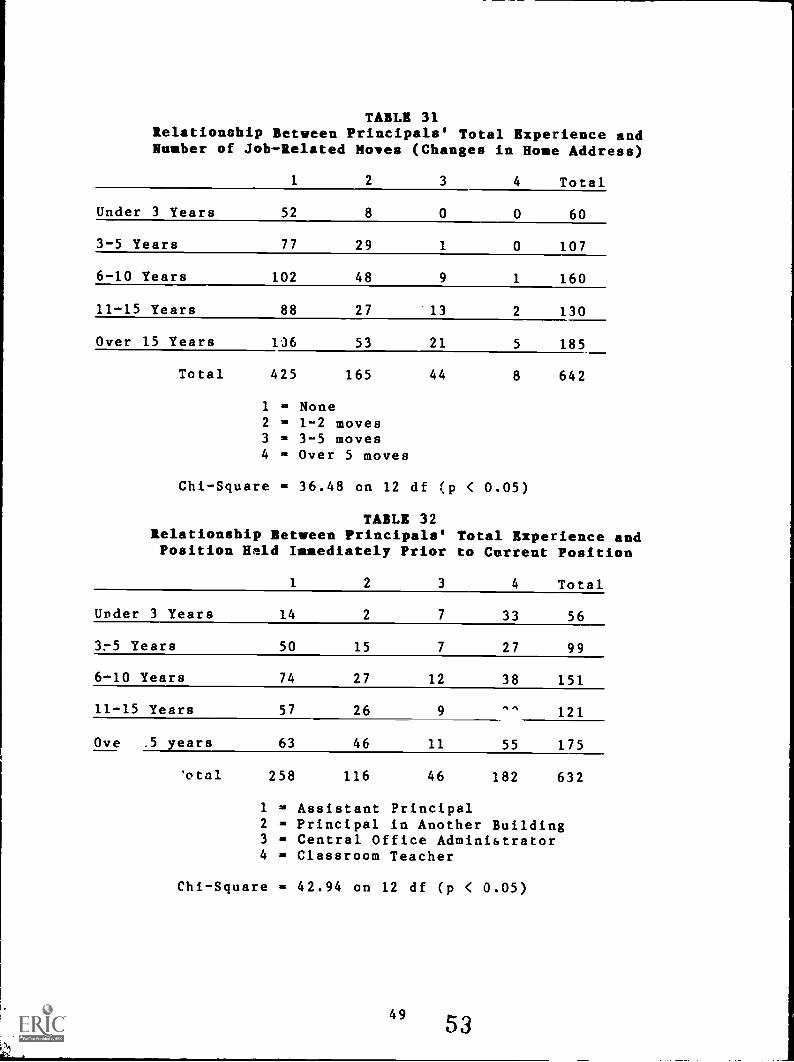
TABLE 31Relationship Between Principals' Total Experience andRnuber of Job-Related Moves (Changes in Howe Address)
1 2 3 4 Total
Under 3 Years 52 8 0 0 60
3-5 Years 77 29 1 0 107
6-10 Years 102 48 9 1 160
11-15 Years 88 27 13 2 130
Over 15 Years 106 53 21 5 185
Total 425 165 44 8 642
1 = None2 = 1-2 moves3 = 3-5 moves4 = Over 5 moves
Chi-Square = 36.48 on 12 df (p < 0.05)
TABLE 32Relationship Between Principals' Total Experience andPosition Held Immediately Prior to Current Position
1 2 3 4 Total
Under 3 Years 14 2 7 33 56
3 -5 Years 50 15 7 27 99
6-10 Years 74 27 12 38 151
11-15 Years 57 26 9nn 121
Ove .5 years 63 46 11 55 175
'otal 258 116 46 182 632
1 = Assistant Principal2 = Principal in Another Building3 = Central Office Administrator4 = Classroom Teacher
Chi-Square = 42.94 on 12 df (p < 0.05)
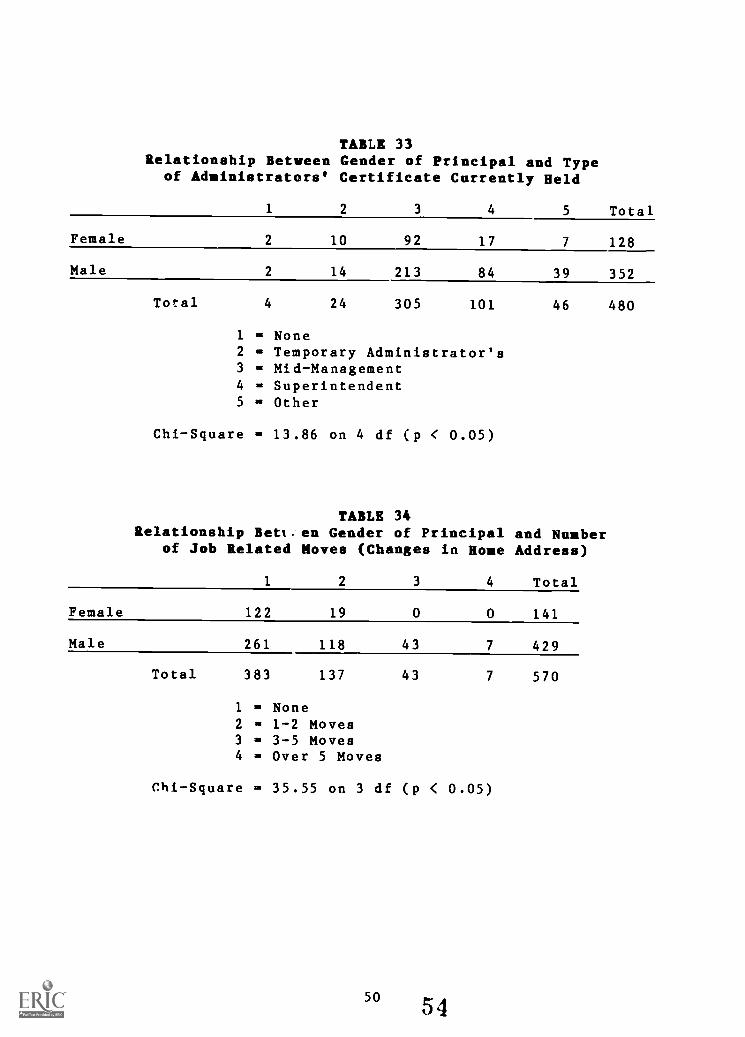
TABLE 33Relationship Between Gender of Principal and Type
of Aduinistrators' Certificate Currently Held
1 2 3
Female 2 10 92
Male 2 14 213
Total 4 24 305
4 5 Total
17 7 128
84 39 352
101 46 480
1 = None2 = Temporary Administrator's3 = Mid-Management4 = Superintendent5 = Other
Chi-Square = 13.86 on 4 df (p < 0.05)
TABLE 34Relationship Betl.en Gender of Principal and Number
of Job Related Moves (Changes in Hone Address)
1. 2 3 4 Total
Female 122 19 0 0 141
Male 261 118 43 7 429
Total 383 137 43 7 570
1 =
2 =
3 =
4 =
None1-2 Moves3-5 MovesOver 5 Moves
Chi-Square = 35.55 on 3 df (p < 0.05)
5054
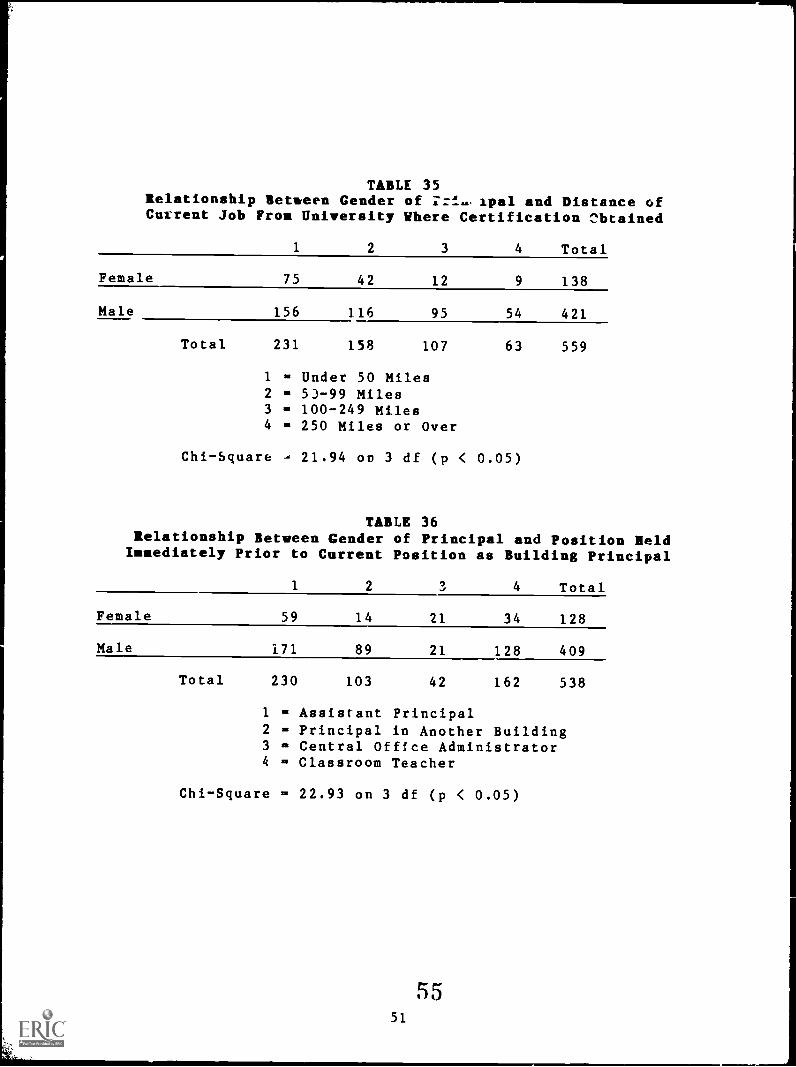
TABLE 35Relationship Between Gender of Zzi... rpal and Distance ofCurrent Job From University Where Certification obtained
1 2 3 4 Total
Female 75 42 12 9 138
Male 156 116 95 54 421
Total 231 158 107 63 559
1 = Under 50 Miles2 = 53-99 Miles3 = 100-249 Miles4 = 250 Miles or Over
Chi-Square - 21.94 on 3 df (p < 0.05)
TABLE 36Relationship Between Gender of Principal and Position HeldImmediately Prior to Current Position as Building Principal
0 4 Total1 2 4
Female 59 14 21 34 128
Male 171 89 21 128 409
Total 230 103 42 162 538
1 = Assistant Principal2 = Principal in Another Building3 = Central Office Administrator4 = Classroom Teacher
Chi-Square = 22.93 on 3 df (p < 0.05)
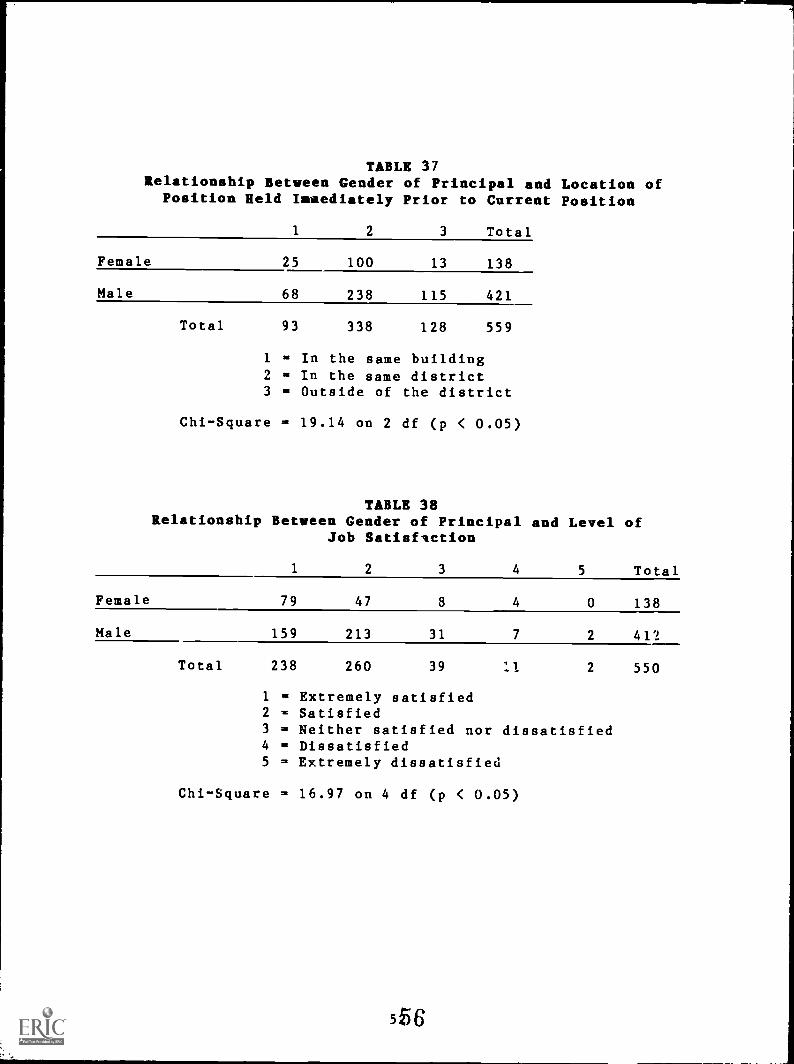
TABLE 37Relationship Between Gender of Principal and Location of
Position Held Ingediately Prior to Current Position
1 2 3 Total
Female
Male
Total
25 100 13 138
68 238 115 421
93 338 128 559
1 = In the same building2 = In the same district3 = Outside of the district
Chi-Square = 19.14 on 2 df (p < 0.05)
TABLE 38Relationship Between Gender of Principal and Level of
Job Satisfaction
1 2 3 4 5 Total
Female 79 47 8 4 0 138
Male 159 213 31 7 2 412
Total 238 260 39 11 2 550
1 = Extremely satisfied2 = Satisfied3 = Neither satisfied nor dissatisfied4 = Dissatisfied5 = Extremely dissatisfied
Chi-Square = 16.97 on 4 df (p < 0.05)
556
APPENDIX E
Relationships Between Demographic Variables and Principals'Perceptions of Sources of Competence to Succeed as a
Building Principal
TABLE 39Relationship Between Campus Enrollment and PerceivedImportance of Common Sense as a Sulirce of Competence
1 2 3 4 5 Total
Under 250 1 2 8 23 92 126
250-500 4 8 2 41 149 204
501-1000 3 7 1 39 177 227
Over 1000 0 4 1 12 70 87
Total 8 21 12 115 488 644
5 = Extremely Important4 = Important3 = Unsure2 = Unimportant1 = Extremely Unimportant
Chi-Square = 23.34 on 12 df (p < 0.05)
TABLE 40Relationship Between Principals' Age and PerceivedImportance of Modeling After Other. Administrators
as a Source of Competence
1 2 3 4 5 Total
Under 40 2 9 22 73 35 141
40-49 9 25 53 112 70 269
50-59 13 33 45 94 28 213
60 cr Over 1 3 7 5 4 20
Total 25 70 127 284 137 643
5 = Extremely Important4 = Important3 = Unsure2 = Unimportant1 = Extremely Unimportant
Chi-Square = 32.37 on 16 df (p < 0.05)
53
57
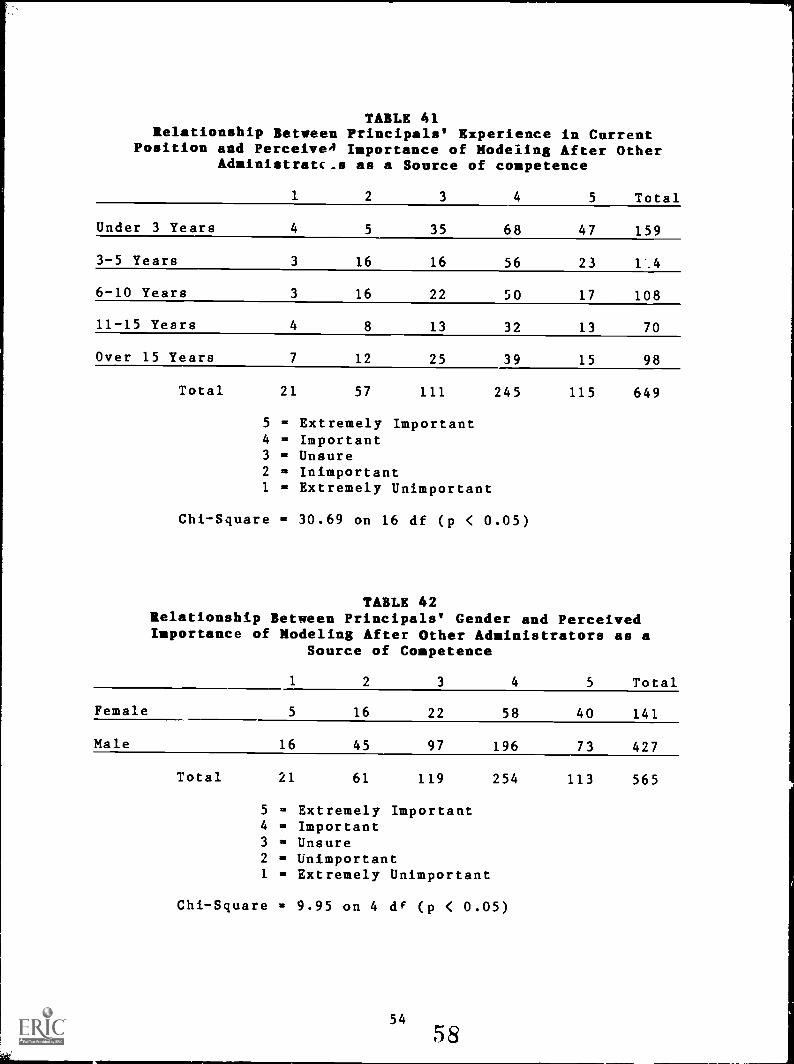
TABLE 41Relationship Between Principals' Experience in Current
Position and Perceives Importance of Modeling After OtherAdministratc_s as a Source of competence
1 2 3 4 5 Total
Under 3 Years 4 5 35 68 47 159
3-5 Years 3 16 16 56 23 1".4
6-10 Years 3 16 22 50 17 108
11-15 Years 4 8 13 32 13 70
Over 15 Years 7 12 25 39 15 98
Total 21 57 111 245 115 649
5 = Extremely Important4 = Important3 = Unsure2 = InimportantI = Extremely Unimportant
Chi-Square = 30.69 on 16 df (p < 0.05)
TABLE 42Relationship Between Principals' Gender and PerceivedImportance of Modeling After Other Administrators as
Source of Competence
1 2 3 4 5
a
Total
Female 5 16 22 58 40 141
Male 16 45 97 196 73 427
Total 21 61 119 254 113 565
5 = Extremely Important4 = Important3 = Unsure2 = Unimportant1 = Extremely Unimportant
Chi-Square = 9.95 on 4 df (p < 0.05)
APPENDIX F
Relationships Between Demographic Variables and PerceivedImportance of Selected Skills to the Success of any Principal
TABLE 43Relationshi) Between Principals' Organizational Level andPerceived Importance of Skill in Instructional Leadership
to the Success of Any Principal
1 2 3 4 5 Total
Elementary Prin. 1 1 9 54 ;t0 375
Jr. Hi./Mid. Sch. 1 1 1 37 81 120
High School 0 0 1 40 104 145
Total 2 1 11 131 495 640
5 = Extremely Important4 = Important3 = Unsure2 = Unimportant1 = Extremely Unimportant
Chi-Square = 24.78 on 8 df (p < 0.05)
TABLE 44Relationship Between Principals' Campus Enrollment and
Perceived Importance of Interpersonal Relationship Skillsto the Success of any Principal
1 2 3 4 5 Total
Under 250 1 0 3 44 75 123
250-500 1 0 8 45 146 200
501-1000 0 1 7 37 181 226
Over 1000 1 0 2 13 70 86
Total 3 1 20 139 472 635
5 = Extremely Important4 = Important3 = Unsure2 = Unimportant1 = Extremely Unimportant
Chi-Square = 25.29 on 12 df (p < 0.05)
55
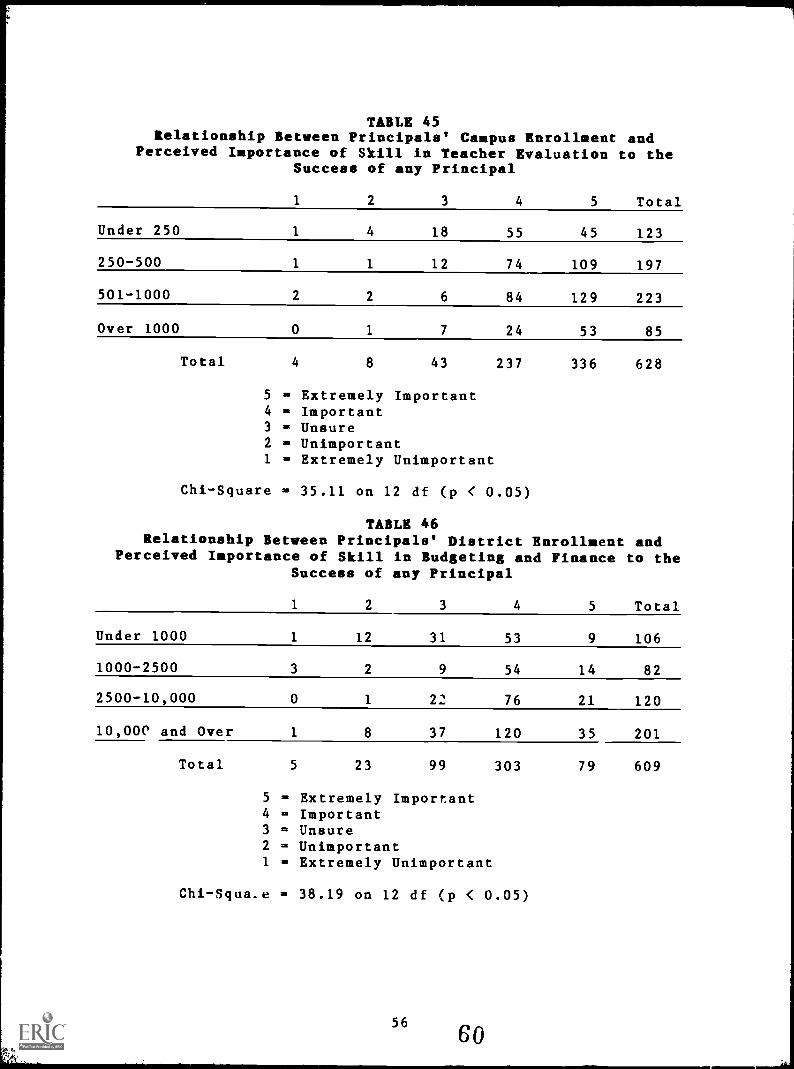
TABLE 45Relationship Between Principals' Campus Enrollment and
Perceived Importance of Skill in Teacher Evaluation to theSuccess of any Principal
1 2 3 4 5 Total
Under 250 1 4 18 55 45 123
250-500 1 1 12 74 109 197
501-1000 2 2 6 84 129 223
Over 1000 0 1 7 24 53 85
Total 4 8 43 237 336 628
5 = Extremely Important4 = Important3 = Unsure2 = Unimportant1 = Extremely Unimportant
Chi-Square = 35.11 on 12 df (p < 0.05)
TABLE 46Relationship Between Principals' District Enrollment and
Perceived Importance of Skill in Budgeting and Finance to theSuccess of any Principal
1 2 3 4 5 Total
Under 1000 1 12 31 53 9 106
1000-2500 3 2 9 54 14 82
2500-10,000 0 1 22 76 21 120
10,00e and Over 1 8 37 120 35 201
Total 5 23 99 303 79 609
5 = Extremely Important4 = Important3 = Unsure2 = Unimportant1 = Extremely Unimportant
Chi - Square = 38.19 on 12 df (p < 0.05)
5660
1
I
TABLE 47Relationship Between Principals' Total Experienckl and
Perceived Inportanc of Skill in Curriculun Develormnt tothe Success of any Principal
1 2 3 4 5 Total
Under 3 Years 0 5 15 72 63 155
3-5 Years 0 7 13 54 39 113
6 -10 Years 1 2 1 2 63 2 5 1 0 3
11-15 Years 0 3 10 36 20 69
Over 15 Years 2 1 21 49 23 96
Total 3 18 71 274 170 636
5 = Extremely Important4 = Important3 = Unsure2 a Unimportant1 = Extremely Unimportant
Chi-Square = 29.58 on 16 df (p < 0.05)
57 61
APPENDIX C
Relationships Between Denographic Variables and Principals'Perceived Expertise in Selected Skill Areas
TABLE 48Relationship Between Principals' Organizational Level
Perceived Expertise in Teacher Evaluation
1 2 3 4 5
and
Total
Elementary 2 8 27 183 151 371
Jr. Hi./Mid. Sch. 1 4 13 65 34 117
High School 0 2 22 81 39 144
Total 3 14 62 329 224 632
5 = Very Strong4 = Strong3 = Unsure2 = Weak1 = Very Weak
Chi-Square = 17.67 on 8 df (p < 0.05)
TABLE 49Relationship Between Principals' District Enrollment and
Perceived Expertise in Campus Leadership
1 2 3 4 5 Total
Under 1000 0 1 6 67 31 105
1000-2500 0 1 2 37 43 83
2501-10,000 0 0 6 47 68 121
Over 10,000 0 2 11 81 109 203
Total 0 4 25 222 241 512
5 = Very Strong4 = Strong3 = Unsure2 = Weak1 = Very Weak
Chi-Square = 23.41 on 9 df (p < 0.05)
58 62
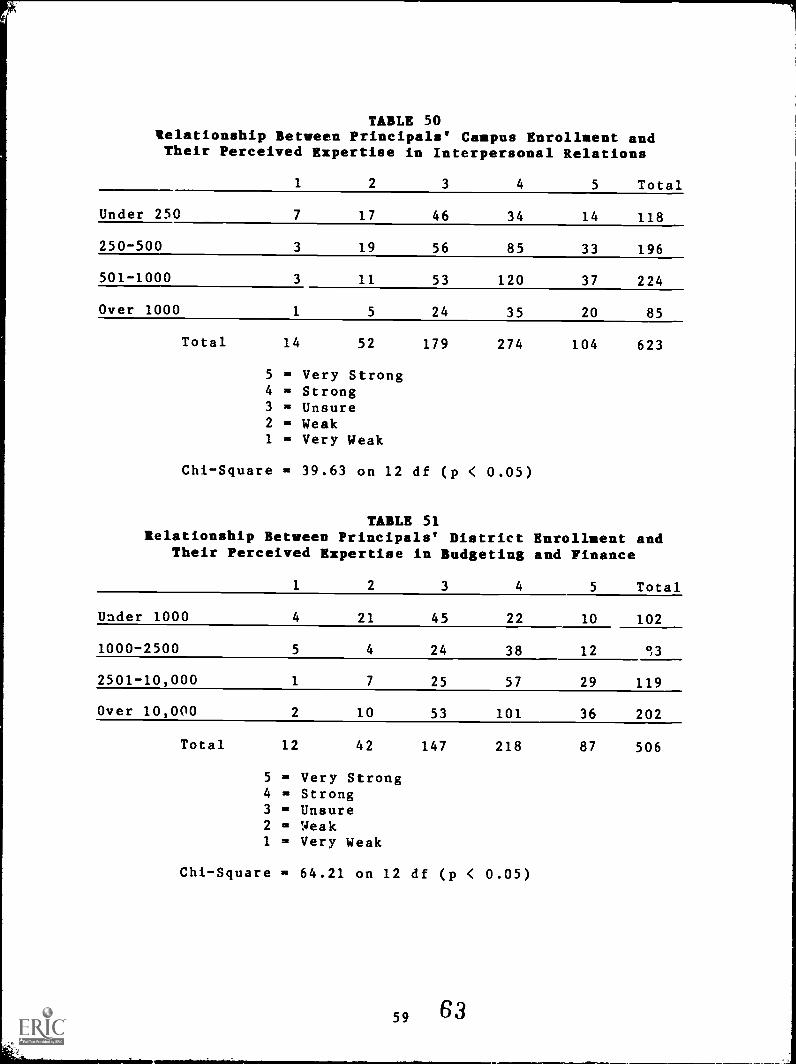
TABLE 50Relationship Between Principals' Caapus Enrollment andTheir Perceived Expertise in Interpersonal Relations
1 2 3 4 5 Total
Under 250 7 17 46 34 14 118
250-500 3 19 56 85 33 196
501-1000 3 11 53 120 37 224
Over 1000 1 5 24 35 20 85
Total 14 52 179 274 104 623
5 = Very Strong4 = Strong3 = Unsure2 = Weak1 = Very Weak
Chi-Square = 39.63 on 12 df (p < 0.05)
TABLE 51Relationship Between Principals' District Enrollaent and
Their Perceived Expertise in Budgeting and Finance
1 2 3 4 5 Total
Under 1000 4 21 45 22 10 102
1000-2500 5 4 24 38 12 °,3
2501-10,000 1 7 25 57 29 119
Over 10,000 2 10 53 101 36 202
Total 12 42 147 218 87 506
5 = Very Strong4 = Strong3 = Unsure2 = Weak1 = Very Weak
Chi-Square = 64.21 on 12 df (p < 0.05)
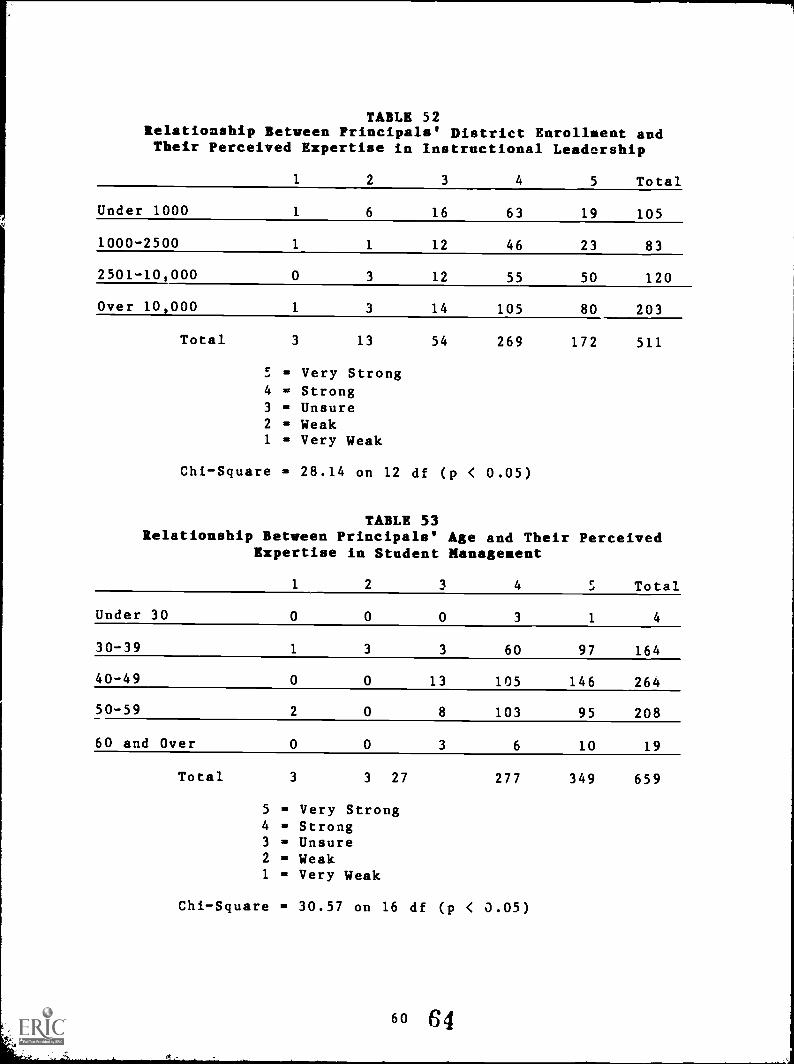
1
TABLE 52Relationship Between Principals' District Enrollment andTheir Perceived Expertise in Instructional Leadership
1 2 3 4 5 Total
Under 1000 1 6 16 63 19 105
1000-2500 1 1 12 46 23 83
2501-10,000 0 3 12 55 50 120
Over 10,000 1 3 14 105 80 203
Total 3 13 54 269 172 511
= Very Strong4 = Strong3 = Unsure2 = Weak1 = Very Weak
Chi-Square = 28.14 on 12 df (p < 0.05)
TABLE 53Relationship Between Principals' Age and Their Perceived
Expertise in Student Management
1 2 3 4 5 Total
Under 30 0 0 0 3 1 4
30-39 1 3 3 60 97 164
40-49 0 0 13 105 146 264
50-59 2 0 8 103 95 208
60 and Over 0 0 3 6 10 19
Total 3 3 27 277 349 659
5 = Very Strong4 = Strong3 = Unsure2 = Weak1 = Very Weak
Chi-Square = 30.57 on 16 df (p < 0.05)
60 64
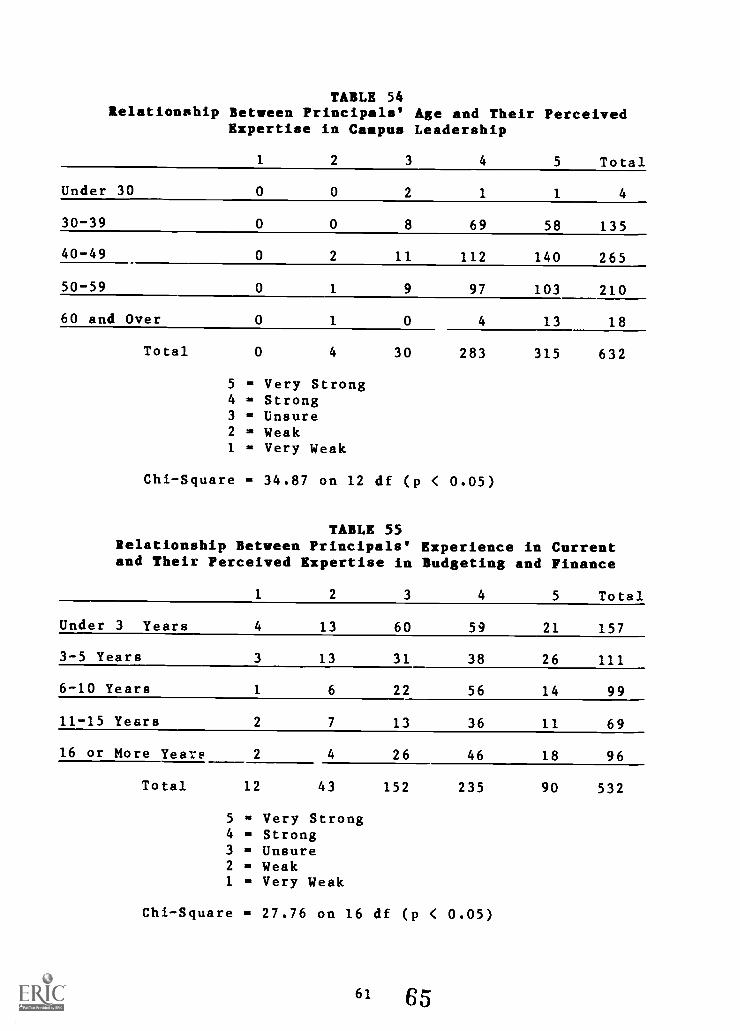
TABLE 54Relationship Between Principals' Age and Their Perceived
Expertise in Caapus Leadership
1 2 3 4 5 Total
Under 30 0 0 2 1 1 4
30-39 0 0 8 69 58 135
40-49 0 2 11 112 140 265
50-59 0 1 9 97 103 210
60 and Over 0 1 0 4 13 18
Total 0 4 30 283 315 632
5 = Very Strong4 = Strong3 = Unsure2 = Weak1 = Very Weak
Chi-Square = 34.87 on 12 df (p < 0.05)
TABLE 55Relationship Between Principals Experience in Currentand Their Perceived Expertise in Budgeting and Finance
1 2 3 4 5 Total
Under 3 Years 4 13 60 59 21 157
3-5 Years 3 13 31 38 26 111
6-10 Years 1 6 22 56 14 99
11-15 Years 2 7 13 36 11 69
16 or More Years 2 4 26 46 18 96
Total 12 43 152 235 90 532
5 = Very Strong4 = Strong3 = Unsure2 = Weak1 = Very Weak
Chi-Square = 27.76 on 16 df (p < 0.05)
61 65
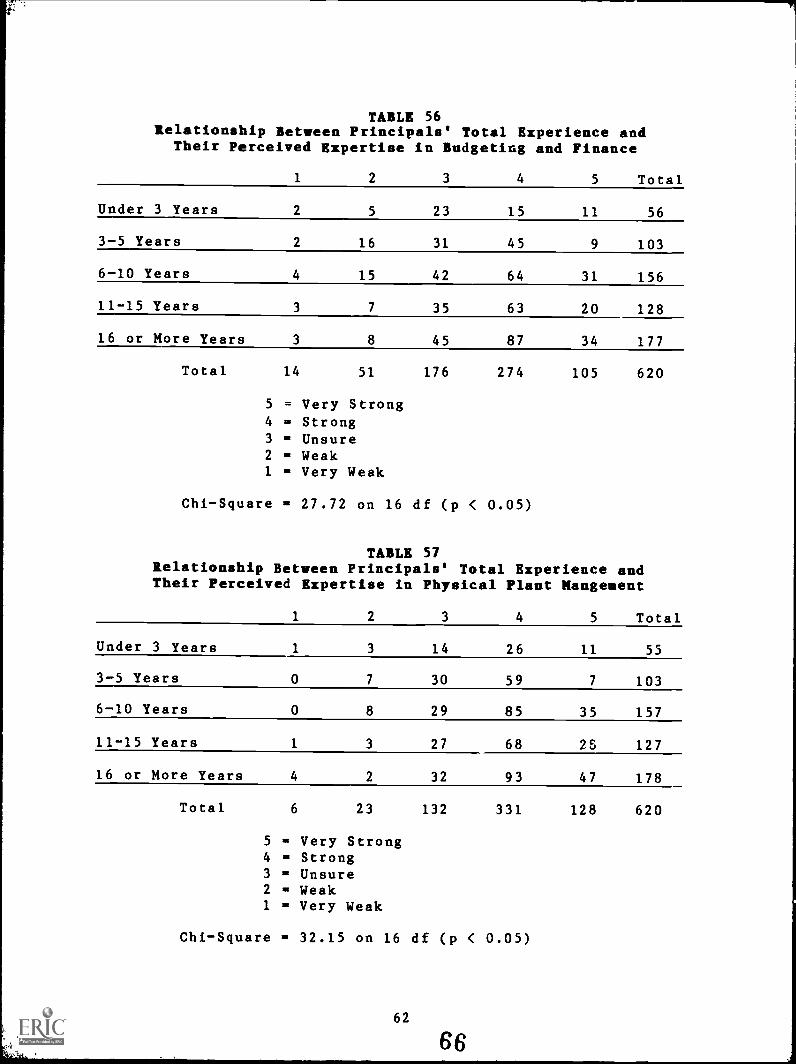
TABLE 56Relationship Between Principals' Total Experience and
Their Perceived Expertise in Budgeting and Finance
1 2 3 4 5 Total
Under 3 Years 2 5 23 15 11 56
3-5 Years 2 16 31 45 9 103
6-10 Years 4 15 42 64 31 156
11-15 Years 3 7 35 63 20 128
16 or More Years 3 8 45 87 34 177
Total 14 51 176 274 105 620
5 = Very Strong4 = Strong3 = Unsure2 = Weak1 = Very Weak
Chi-Square = 27.72 on 16 df (p < 0.05)
TABLE 57Relationship Between Principals' Total Experience andTheir Perceived Expertise in Physical Plant Mangeaent
1 2 3 4 5 Total
Under 3 Years 1 3 14 26 11 55
3-5 Years 0 7 30 59 7 103
6-10 Years 0 8 29 85 35 157
11-15 Years 1 3 27 68 25 127
16 or More Years 4 2 32 93 47 178
Total 6 23 132 331 128 620
5 = Very Strong4 = Strong3 = Unsure2 = Weak1 = Very Weak
Chi-Square = 32.15 on 16 df (p < 0.05)
62
66
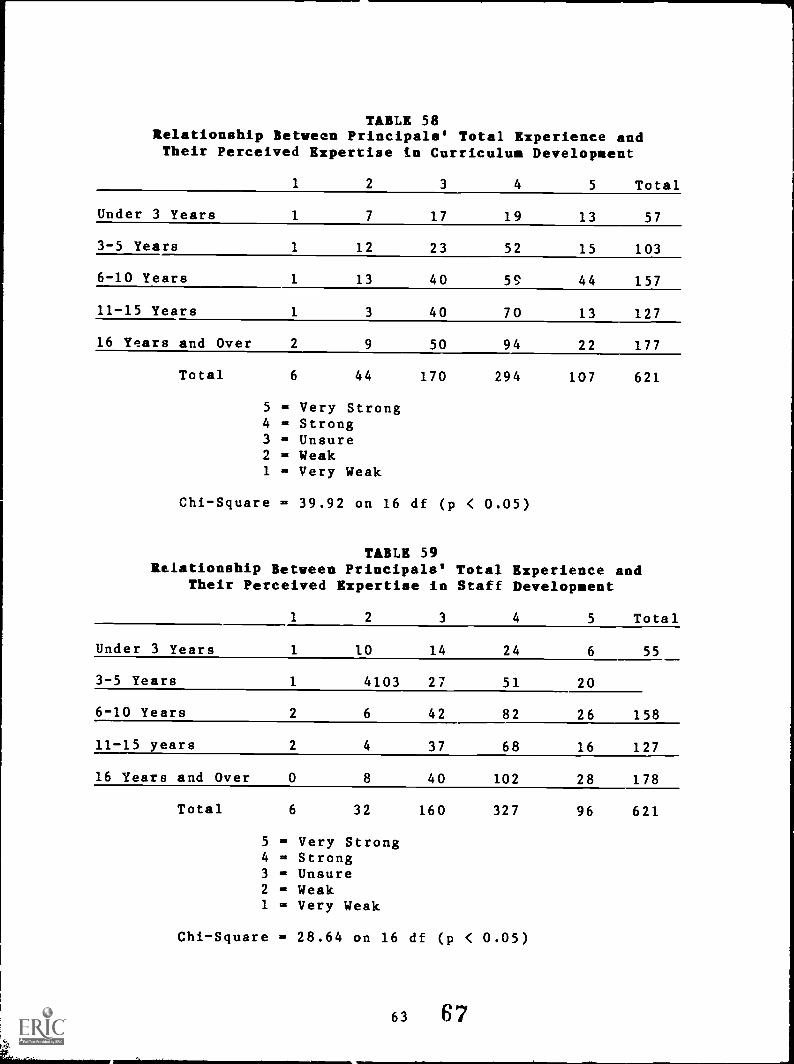
TABLE 58Relationship Between Principals' Total Experience andTheir Perceived Expertise in Curriculum Development
1 2 3 4 5 Total
Under 3 Years 1 7 17 19 13 57
3-5 Years 1 12 23 52 15 103
6-10 Years 1 13 40 59 44 157
11-15 Years 1 3 40 70 13 127
16 Years and Over 2 9 50 94 22 177
Total 6 44 170 294 107 621
5 = Very Strong4 = Strong3 = Unsure2 = Weak1 = Very Weak
Chi-Square = 39.92 on 16 df (p < 0.05)
TABLE 59Relationship Between Principals' Total Experience and
Their Perceived Expertise in Staff Development
1 2 3 4 5 Total
Under 3 Years 1 10 14 24 6 55
3-5 Years 1 4103 27 51 20
6-10 Years 2 6 42 82 26 158
11-15 years 2 4 37 68 16 127
16 Years and Over 0 8 40 102 28 178
Total 6 32 160 327 96 621
5 = Very Strong4 = Strong3 = Unsure2 = Weak1 = Very Weak
Chi-Square = 28.64 on 16 df (p < 0.05)
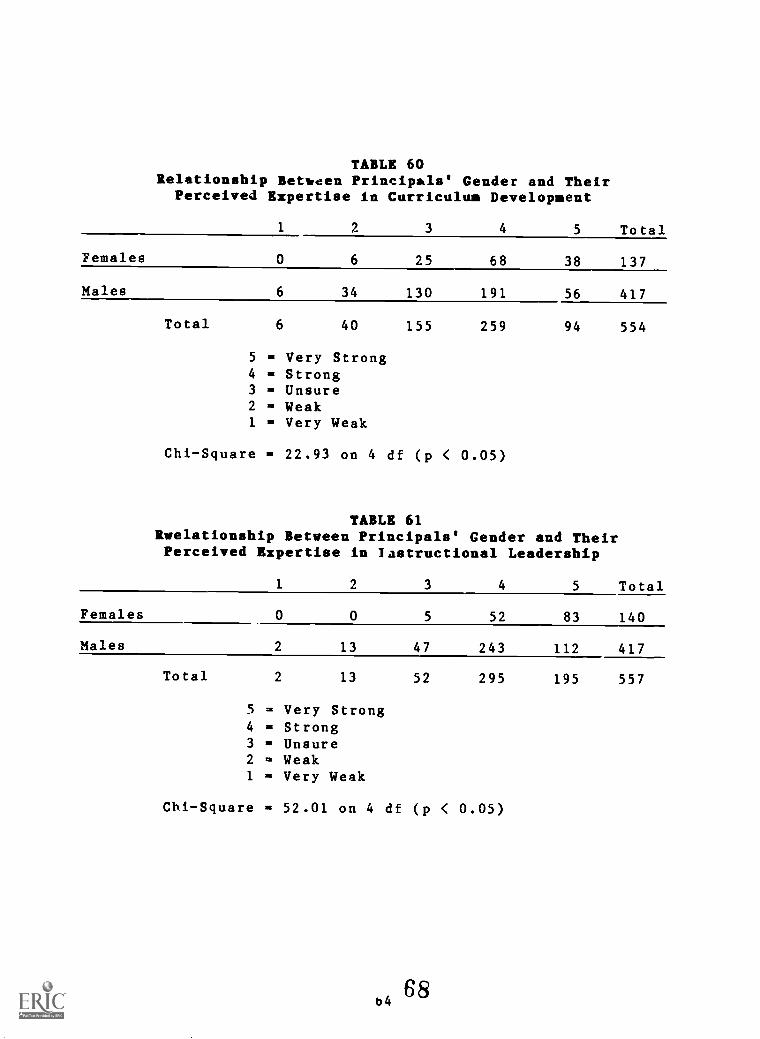
TABLE 60Relationship Between Principals' Gender and Their
Perceived Expertise in Curriculum Development
1 2 3 4 5 Total
Females 0 6 25 68 38 137
Males 6 34 130 191 56 417
Total 6 40 155 259 94 554
5 = Very Strong4 = Strong3 = Unsure2 = Weak1 = Very Weak
Chi-Square = 22.93 on 4 df (p < 0.05)
TABLE 61Rvelationship Between Principals' Gender and TheirPerceived Expertise in lastructional Leadership
1 2 3 4 5 Total
Females
Males
Total
0 0 5 52 83 140
2 13 47 243 112 417
2 13 52 295 195 557
5 = Very Strong4 = Strong3 = Unsure2 = Weak1 = Very Weak
Chi-Square = 52.01 on 4 df (p < 0.05)
68b4
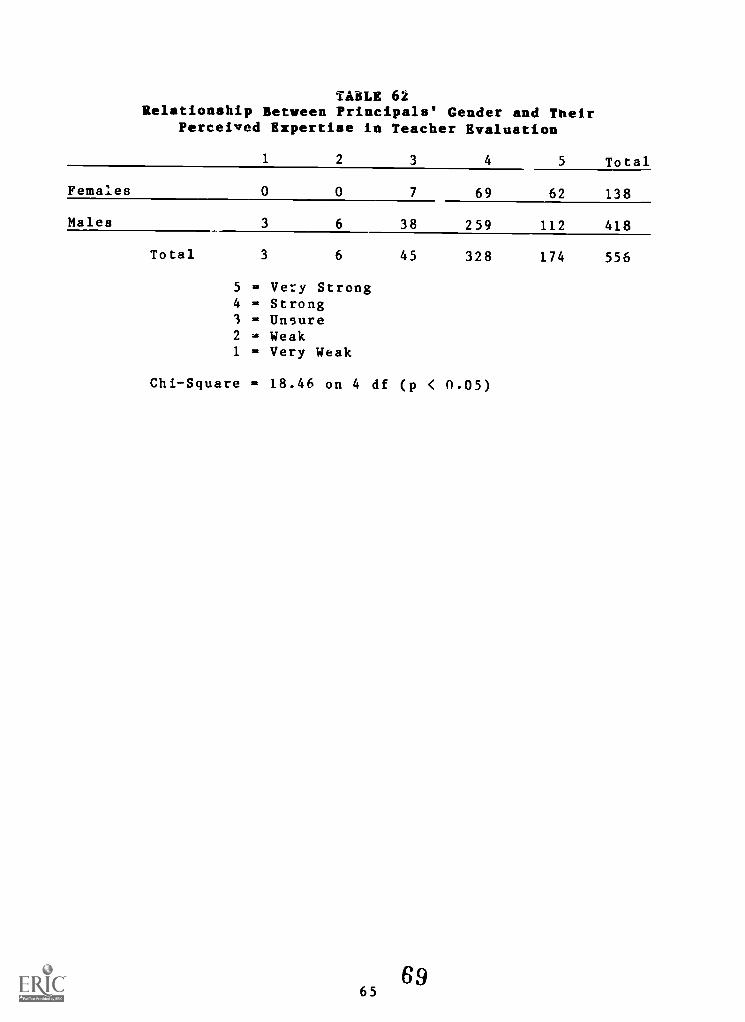
TABLE 61Relationship Between Principals' Gender and Their
Perceived Expertise in Teacher Evaluation
1 2 3 4 5 Total
Females 0 0 7 69 62 138
Males 3 6 38 259 112 418
Total 3 6 45 328 174 556
5 = Very Strong4 = Strong3 = Unsure2 = Weak1 = Very Weak
Chi-Square = 18.46 on 4 df (p < 0.05)
G965
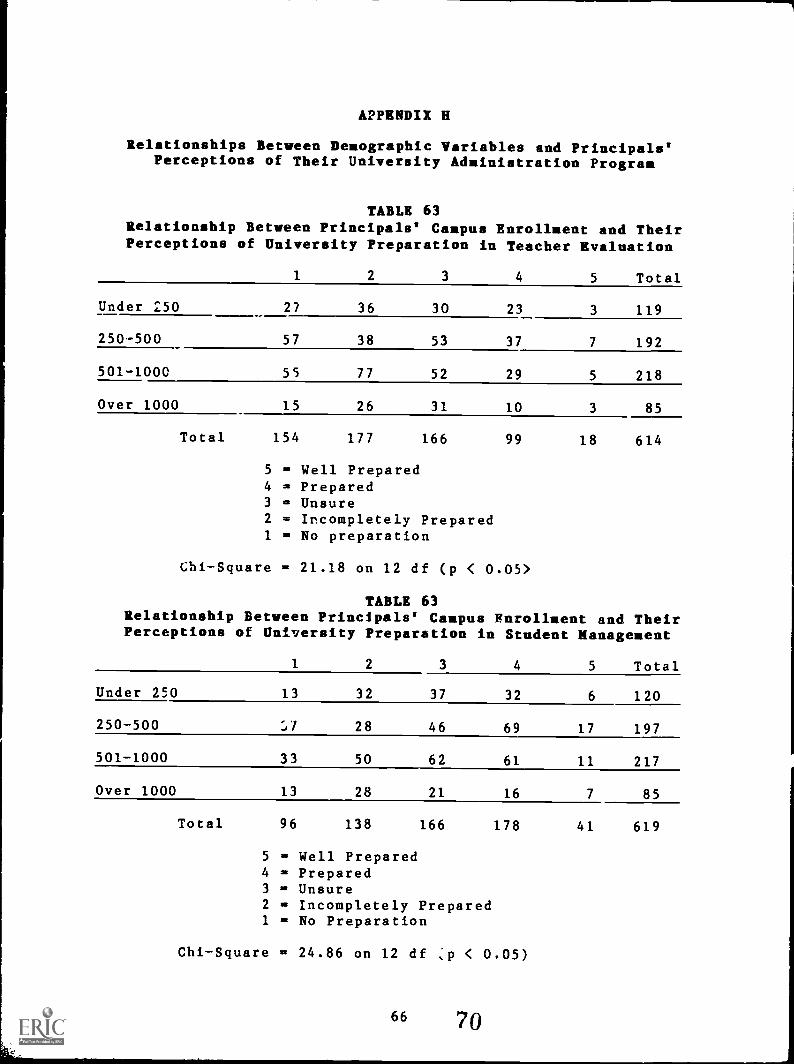
APPENDIX II
Relationships Between Demographic Variables and Principals'Perceptions of Their University Administration Program
TABLE 63Relationship Between Principals' Campus Enrollment and TheirPerceptions of University Preparation in Teacher Evaluation
1 2 3 4 5 Total
Under 250 27 36 30 23 3 119
250 500 57 38 53 37 7 192
501-1000 55 77 52 29 5 218
Over 1000 15 26 31 10 3 85
Total 154 177 166 99 18 614
5 = Well Prepared4 = Prepared3 = Unsure2 = Incompletely Prepared1 = No preparation
Chi-Square = 21.18 on 12 df (p < 0.05>
TABLE 63Relationship Between Principals' Campus Enrollment and TheirPerceptions of University Preparation in Student Management
1 2 3 4 5 Total
Under 250 13 32 37 32 6 120
250-500 :J7 28 46 69 17 197
501-1000 33 50 62 61 11 217
Over 1000 13 28 21 16 7 85
Total 96 138 166 178 41 619
5 = Well Prepared4 = Prepared3 = Unsure2 = Incompletely Prepared1 = No Preparation
Chi-Square = 24.86 on 12 df ;1) < 0.05)
66 70
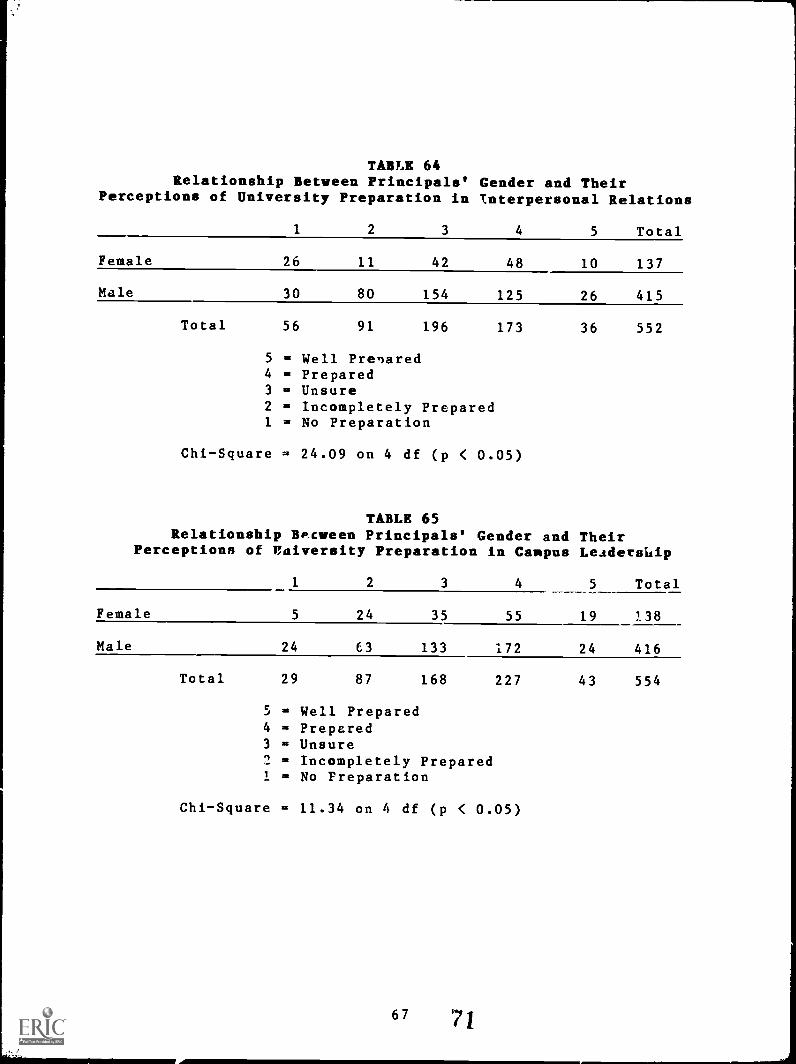
TABLE 64Relationship Between Principals'
Perceptions of University Preparation in
1 2 3
Gender and Theirinterpersonal Relations
4 5 Total
Female 26 11 42 48 10 137
Male 30 80 154 125 26 415
Total 56 91 196 173 36 552
5 = Well Prenared4 = Prepared3 = Unsure2 = Incompletely Prepared1 = No Preparation
Chi-Square = 24.09 on 4 df (p < 0.05)
TABLE 65Relationship Between Principals' Gender and Their
Perceptions of University Preparation in Campus Leadersilip
1 2 3 4 5 Total
Female 5 24 35 55 19 138
Male 24 63 133 172 24 416
Total 29 87 168 227 43 554
5 = Well Prepared4 = Prepared3 = Unsure2 = Incompletely Prepared1 = No Preparation
Chi-Square = 11.34 on 4 df (p < 0.05)
67 71
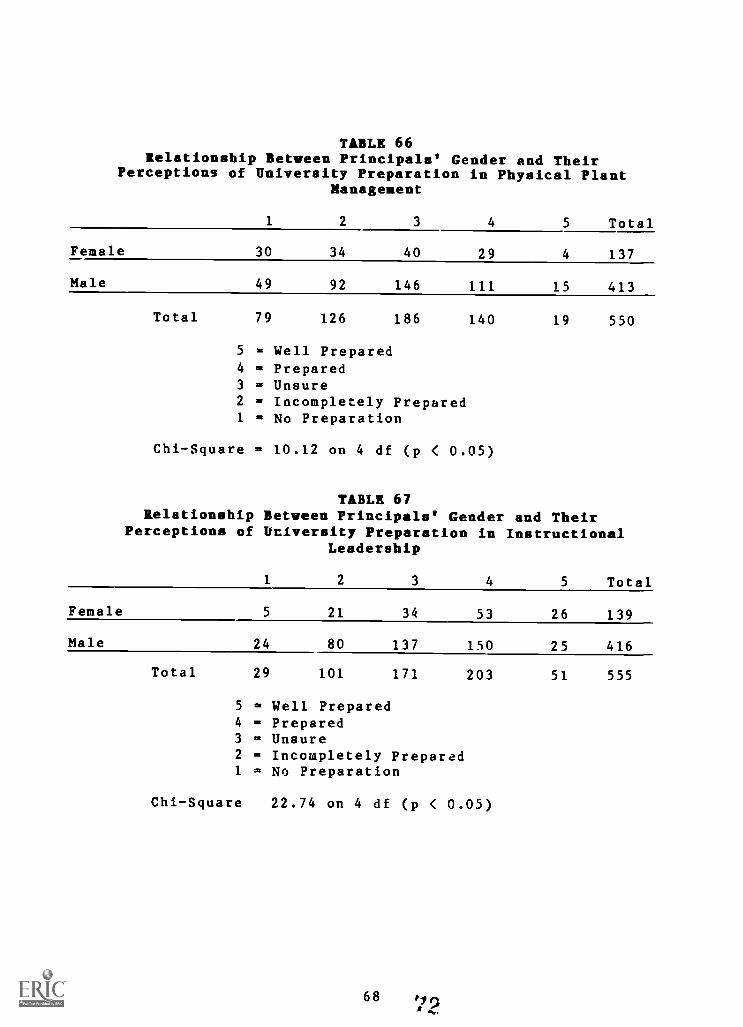
TABLE 66Relationship Between Principals' Gender and Their
Perceptions of University Preparation in Physical PlantManagement
1 2 3 4 5 Total
Female
Male
30 34 40 29 4 137
49 92 146 111 15 413
Total 79 126 186 140 19 550
5 = Well Prepared4 = Prepared3 = Unsure2 = Incompletely Prepared1 = No Preparation
Chi-Square = 10.12 on 4 df (p < 0.05)
TABLE 67Relationship Between Principals' Gender and Their
Perceptions of University Preparation in InstructionalLeadership
1 2 3 4 5 Total
Female 5 21 34 53 26 139
Male 24 80 137 150 25 416
Total 29 101 171 203 51 555
5 = Well Prepared4 = Prepared3 = Unsure2 = Incompletely Prepared1 = No Preparation
Chi-Square 22.74 on 4 df (p < 0.05)
68
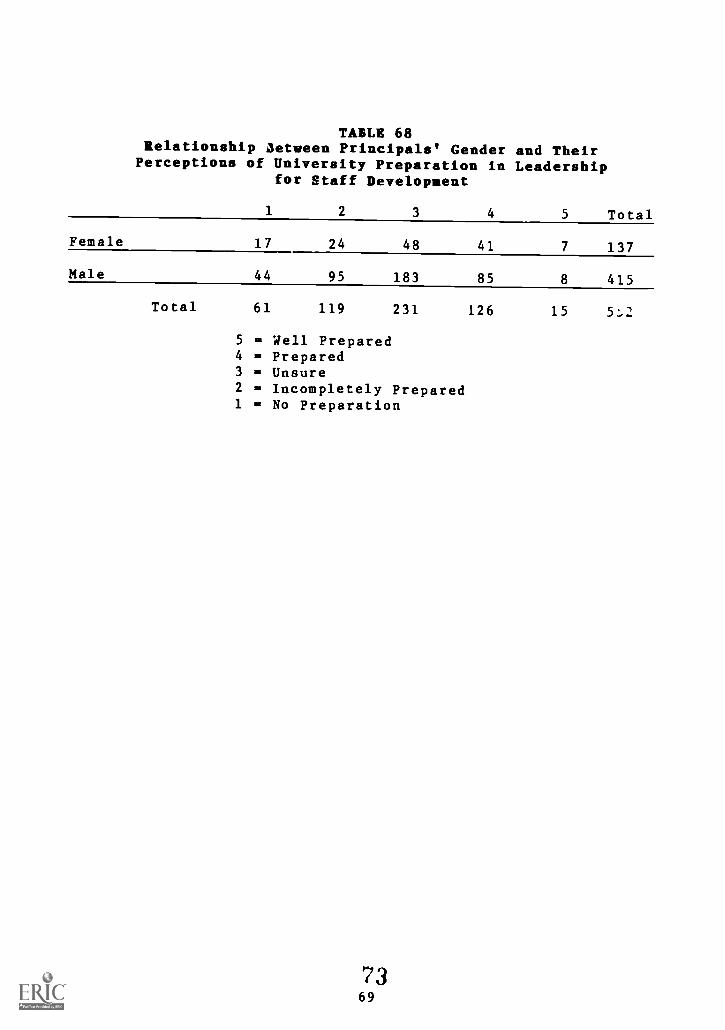
TABU 68Relationship Between Principals' Gender and Their
Perceptions of University Preparation in Leadershipfor Staff Development
1 2 3
Female 17 24 48
Male 44 95 183
Total 61 119 231
5 = Well Prepared4 = Prepared3 = Unsure2 = Incompletely Prepared1 = No Preparation
7369
4 5 Total
41 7 137
85 8 415
126 15 5::,2