Embed Size (px)
Citation preview
ED 361 140
AUTHORTITLE
INSTITUTIONSPONS AGENCY
PUB DATECONTRACTNOTEPUB TYPE
EDRS PRICEDESCRIPTORS
DOCUMENT RESUME
RC 019 268
Mines, Richard; And OthersFindings from the National Agricultural WorkersSurvey (NAWS) 1990. A Demographic and EmploymentProfile of Perishable Crop Farm Workers. ResearchReport No. 1.
Aguirre IntPrnational, San Mateo, CA.Department of Labor, Washington, DC. Office ofProgram Economics.Jul 91J-9-M-8-0040108p.
Reports Research/Technical (143) StatisticalData (110)
MFOI/PC05 Plus Postage.*Agricultural Laborers; Agricultural Trends;*Demography; Educational Attainment; ElementarySecondary Education; *Employment Patterns; FarmOccupations; Illiteracy; Immigrants; *Labor Force;Language Proficiency; *Migrant Workers; OccupationalSurveys; *Seasonal Employment
IDENTIFIERS Immigration Reform and Control Act 1986; *NationalAgricultural Workers Survey
ABSTRACTThis report provides information on the
characteristics and work patterns of United States agriculturalworkers performing seasonal agricultural services (SAS) during fiscalyear 1990. SAS crops include the majority of nursery products, cashgrains, field crops, and all fruits and vegetables. More than 2,000personal interviews with SAS workers were conducted by the NationalAgricultural Workers Survey (NASW) . Data on personal characteristicsof seasonal agricultural workers include: (1) age; (2) gender; (3)
marital status; (4) national origin and ethnicity; (5) the effect ofthe Immigration Reform and Control Act 1986 (IRCA) on legal status;(6) literacy, schooling, and English skills; (7) family residence andwork-site household composition; and (8) income, assets, and use ofgovernment programs. Information on employment patterns and jobcharacteristics include employment history and labor supply,characteristics and patterns of SAS employment, characteristics andpatterns of non-SAS employment, and characteristics and patterns ofnonwork periods and periods spent abroad. Regional differences inworker characteristics, job characteristics, and employment patternsare outlined. The appendix describes statistical procedures used.This report contains 41 figures, 3 tables, and 3 maps. (LP)
***********************************************************************
Reproductions supplied by EDRS are the best that can be madefrom the original document.
**********************************************************************

U.S. DEPARTMENT OF EDUCATIONOffice of Educational Research and ImprovementEDUCATIONAL RESOURCES INFORMATION
CENTER (ERIC)Ttus document has been reproduced asreceived from the person or organizationoriginating it.
0 Minor changes have been made to improvereproduction quality
Points of view or opinions stated in this docu-ment do not necessarily represent official0E141 position or policy
"PERMIU;;ON TO REPRODUCE THISMATERIAL HAS BEEN GRANTED BY
TO THE EDUCATIONAL RESOURCESINFORMATION CENTER (ERIC)."

1This rcipon publi5:11,,ib by the Once of PlocramEconomics. Officb ct the AsistArit Sec+ y forPolicv tAatenal contained in tins publical lotin the public domain rind may b4. 1Pc LThcf
Source credit is requested.
BEST COPY AVAILABLE

Findings From theNational AgriculturalWorkers Survey(NAWS) 1990
A Demographic andEmployment Profileof Perishable CropFarm Workers
Office of Program EconomicsResearch Report No. 1
U.S. Department of LaborLynn Martin, Secretary
Office of the Assistant Secretary for PolicyDebra R. Bow land, Acting Assistant SecretaryJuly 1991
Prepared by Aguirre International, San Mateo,California, under the supervision of the Officeof Program Economics.
This report was researched and written byRichard Mines, Susan Gabbard, and BeatrizBoccalandro.
The authors acknowledge the invaluablecontributions of the office, field staff andmanagement of Aguirre International to thesuccess of this project. The survey wasconducted under contract no. J-9-M-8-0040.
The views expressed herein are the authorsand do not necessarily reflect the officialposition of the U.S. Department of Labor.
NAWS FINDINGS 1990
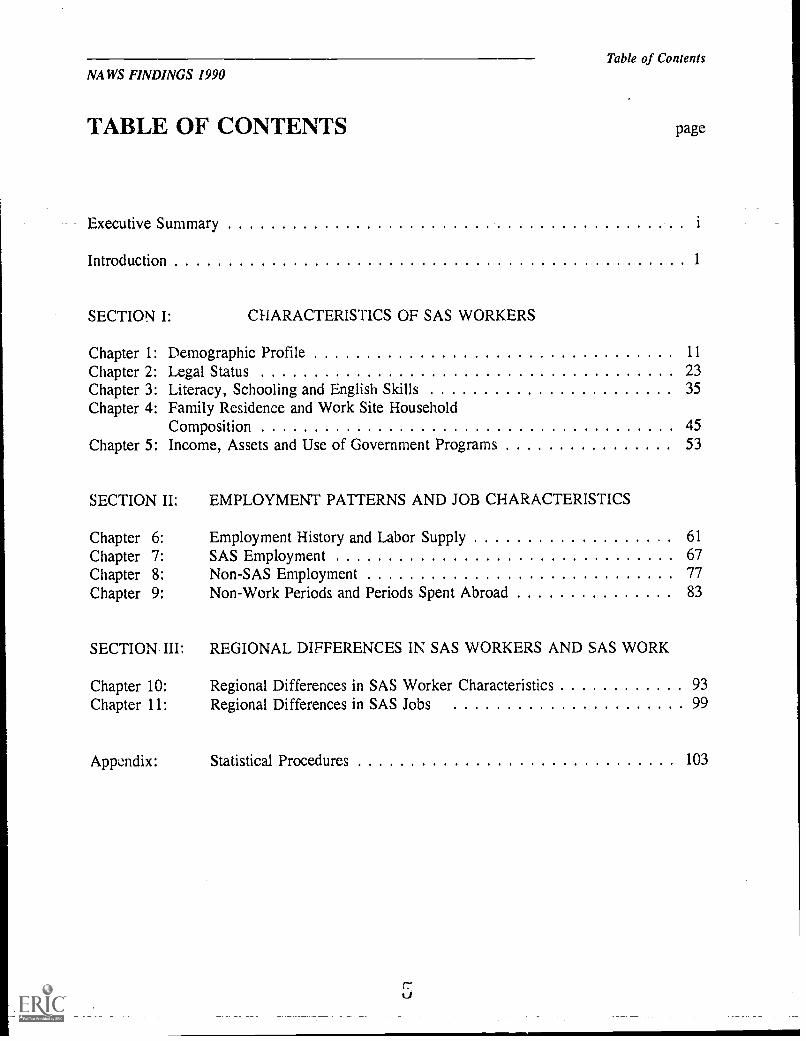
TABLE OF CONTENTS
Table of Contents
page
Executive Summary
Introduction 1
SECTION I: CHARACTERISTICS OF SAS WORKERS
Chapter 1: Demographic Profile 11
Chapter 2: Legal Status 23Chapter 3: Literacy, Schooling and English Skills 35Chapter 4: Family Residence and Work Site Household
Composition 45Chapter 5: Income, Assets and Use of Government Programs 53
SECTION II: EMPLOYMENT PATTERNS AND JOB CHARACTERISTICS
Chapter 6: Employment History and Labor Supply 61
Chapter 7: SAS Employment 67Chapter 8: Non-SAS Employment 77Chapter 9: Non-Work Periods and Periods Spent Abroad 83
SECTION III: REGIONAL DIFFERENCES IN SAS WORKERS AND SAS WORK
Chapter 10: Regional Differences in SAS Worker Characteristics 93
Chapter 11: Regional Differences in SAS Jobs 99
Appendix: Statistical Procedures 103

NAWS FINDINGS 1990
LIST OF GRAPHICS
List of Graphics
FIGURES page
1.1 Profile of Individual Performing SAS Work 12
1.2 Age Distribution of All SAS Workers 13
1.3 Gender of All SAS Workers 14
1.4 Marital Status and Gender of All SAS Workers 15
1.5 Ethnicity and Place of Birth of All SAS Workers 17
1.6 Hispanic Origins of All SAS Workers 19
1.7 Years in the United States for Foreign Born SAS Workers 21
1.8 Years in the United States by Place of Birth for Foreign-BornSAS Workers 22
2.1 Legal Status of All SAS Workers 262.2 Legal Status by Place of Birth for All SAS Workers 272.3 Workers in the United States Five or More Years for Foreign-Born
SAS Workers 282.4 Eligibility for Citizenship of Legal Permanent Resident SAS
Workers 292.5 IRCA Legalization by Type for SAS Workers Who Applied 31
2.6 Legal Status of RAW Applicant SAS Workers 33
2.7 Native Language of All SAS Workers 363.2 Level of Education by Language Sub-Groups for All SAS Workers 383.3 Distribution of Level of Education of All SAS Workers 393.4 Adult Education by Type for All SAS Workers 41
3.5 English Fluency by Ethnic Sub-Groups for All SAS Workers 434.1 Family Type by Accompanied for All SAS Workers 474.2 Work Site Family Residence by Gender for All SAS Workers 494.3 Family Residence by Place of Birth for All SAS Workers 504.4 Number of Children Residing with Worker for Parent SAS Workers 51
5.1 Poverty Rate by Number in Family for All SAS Workers 55
5.2 Needs-Based Services by Type for All SAS Workers 575.3 Contribution-Based Services by Type for All SAS Workers 586.1 Time Allocation of the Average SAS Worker 627.1 SAS Crop Breakdown for All SAS Workers 687.2 SAS Task Breakdown for All SAS Workers 697.3 Type of Employer for All SAS Workers 70
NAWS FINDINGS 1990List of Graphics
page
7.4 Benefits by Type for All SAS Workers 74
7.5 Facilities at Work Site by Type for All SAS Workers 75
8.1 Length of Time in Non-SAS Work for All SAS Workers 78
8.2 Non-SAS Employment by Area for SAS Workers Who Took Non-SASWork 80
9.1 Total Time Spent Not Working in the United States and Abroadfor All SAS Workers 85
9.2 Length of Time Not Working in the United States for All SASWorkers 87
9.3 Reasons for Not Working in the United States for SAS Workerswith Non-Working Period 88
9.4 Length of Time Abroad for All SAS Workers 89
10.1 SAS Work by Region for All SAS Workers 9610.2 Poverty Rate by Region for All SAS Workers 9811.1 Non-SAS Employment by Region for All SAS Workers 101
TABLES
1.1 Ethnicity of SAS Workers 16
10.1 Regional Definitions 94
A.1 Confidence Intervals for Continuous Variables 105
MAPS
Map 1: Sampled Counties 6
Map 2: Agricultural RegionsMap 3: NAWS Regions 95
7
NAWS FINDINGS 1990
EXECUTIVE SUMMARY
Executive Summary
BACKGROUND
This report provides information on the characteristics and work patterns of U.S.
agricultural workers performing Seasonal Agricultural Services (SAS) during fiscal year
1990 (October 1, 1989 September 31, 1990). The information presented was gathered
during more than 2,000 personal interviews with SAS workers conducted by the National
Agricultural Workers Survey (NAWS) during fiscal year 1990.
As part of the Immigration Reform and Control Act (IRCA) of 1986, the Secretaries of
Agriculture and Labor are charged annually with determining if there is a shortage of
SAS workers. To respond to this legislative requirement, the U.S. Department of Labor
(DOL) contracted Aguirre International to conduct the National Agricultural Workers
Survey (NAWS). The NAWS collects comprehensive job history information on SAS
workers to estimate fluctuations in the labor supply. Only farm workers employed in
SAS labor are interviewed for the NAWS.
In fiscal year 1990, 2,115 randomly selected SAS workers were interviewed. To ensure
regional coverage, the NAWS uses site area sampling to obtain a nationally
representative cross section of SAS workers. To ensure seasonal sensitivity, three six
to ten week cycles are conducted. One cycle begins in January, one in May, and one in
September. Site selection and interview allocations are proportional to seasonal payroll
size.
Employer names are obtained from various government sources and a random sample of
SAS employers is generated for each of the selected sites. NAWS Regional Coordinators
contact selected employers to obtain access to the work site. Interviewer: visit the work

NAWS FINDINGS 1990Executive Summary
site and ask a random sample of workers to participate. Interviews in five languages take
place at the worker's home or at worker selected locations.
The report is divided into three sections. Section I covers characteristics of SAS
workers; Section II reviews SAS workers' patterns of employment and Section III
presents some regional differences among SAS workers and SAS work. The major
findings for each section are summarized below.
CHARACTERISTICS OF SAS WORKERS
The SAS labor force is comprised mainly of young workers, men, Hispanics and
immigrants.
The impact of employer sanctions has been mixed. Most SAS workers have work
authorization, but a significant minority are unauthorized. One out of every five
foreign-born workers continues to be unauthorized. One half of the foreign-born SAS
workers applied for legalization through IRCA programs. More than one-fourth of the
unauthorized SAS workers have signed up for the RAW (Replinishment Agricultural
Workers) program.
Most SAS workers have low levels of education and do not speak or read English.
More than one-half of SAS workers have completed eight or fewer years of formal
education. Spanish is the primary language for two out of three SAS workers. Only
two in five workers say that they can speak or read English well. More than one-third
of SAS workers have tried to improve their skills by taking an adult education class.
English is the most popular type of class.
The majority of SAS workers are married and/or have children. Two in five SAS
workers live away from their families while performing SAS work. Men and foreign-
born workers are most likely to be living away from their families.
9
NAWS FINDINGS 1990
Executive Summary
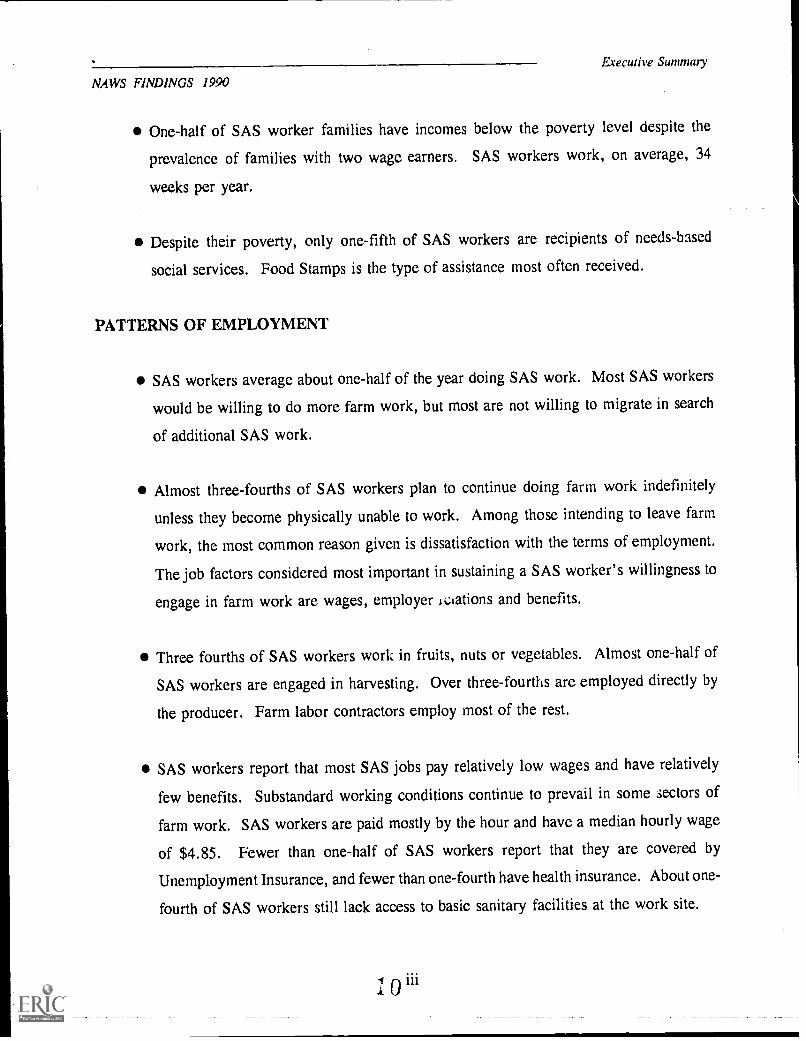
One-half of SAS worker families have incomes below the poverty level despite the
prevalence of families with two wage earners. SAS workers work, on average, 34
weeks per year.
Despite their poverty, only one-fifth of SAS workers are recipients of needs-based
social services. Food Stamps is the type of assistance most often received.
PATTERNS OF EMPLOYMENT
SAS workers average about one-half of the year doing SAS work. Most SAS workers
would be willing to do more farm work, but most are not willing to migrate in search
of additional SAS work.
Almost three-fourths of SAS workers plan to continue doing farm work indefinitely
unless they become physically unable to work. Among those intending to leave farm
work, the most common reason given is dissatisfaction with the terms of employment.
The job factors considered most important in sustaining a SAS worker's willingness to
engage in farm work are wages, employer Lelations and benefits.
Three fourths of SAS workers work in fruits, nuts or vegetables. Almost one-half of
SAS workers are engaged in harvesting. Over three-fourths are employed directly by
the producer. Farm labor contractors employ most of the rest.
SAS workers report that most SAS jobs pay relatively low wages and have relatively
few benefits. Substandard working conditions continue to prevail in some sectors of
farm work. SAS workers are paid mostly by the hour and have a median hourly wage
of $4.85. Fewer than one-half of SAS workers report that they are covered by
Unemployment Insurance, and fewer than one-fourth have health insurance. About one-
fourth of SAS workers still lack access to basic sanitary facilities at the work site.
NAWS FINDINGS 1990Executive Summary
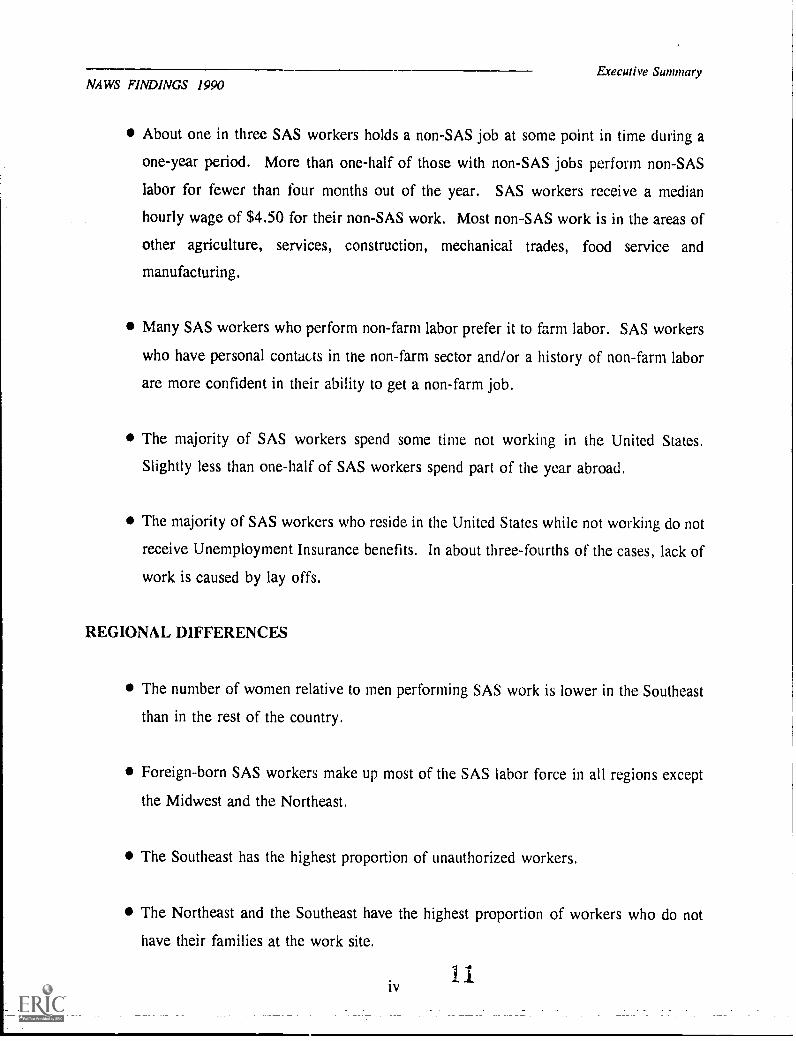
About one in three SAS workers holds a non-SAS job at some point in time during a
one-year period. More than one-half of those with non-SAS jobs perform non-SAS
labor for fewer than four months out of the year. SAS workers receive a median
hourly wage of $4.50 for their non-SAS work. Most non-SAS work is in the areas of
other agriculture, services, construction, mechanical trades, food service and
manufacturing.
Many SAS workers who perform non-farm labor prefer it to farm labor. SAS workers
who have personal contacts in the non-farm sector and/or a history of non-farm labor
are more confident in their ability to get a non-farm job.
The majority of SAS workers spend some time not working in the United States.
Slightly less than one-half of SAS workers spend part of the year abroad.
The majority of SAS workers who reside in the United States while not working do not
receive Unemployment Insurance benefits. In about three-fourths of the cases, lack of
work is caused by lay offs.
REGIONAL DIFFERENCES
The number of women relative to men performing SAS work is lower in the Southeast
than in the rest of the country.
Foreign-born SAS workers make up most of the SAS labor force in all regions except
the Midwest and the Northeast.
The Southeast has the highest proportion of unauthorized workers.
The Northeast and the Southeast have the highest proportion of workers who do not
have their families at the work site.
iv11
NAWS FINDINGS 1990
The Southeast has the highest proportion of poor SAS workers.
Executive Summary
Field crop SAS jobs are most predominant in the Midwest and in the Western Plains,
while SAS jobs in fruits and nuts are most common in the Northwest, the Southwest,
and the Northeast. Vegetable SAS jobs are most predominant in the Southeast.
The Southeast has the highest concentrations of hand-harvesting SAS jobs and the
lowest frequency of semi-skilled SAS jobs.
On average, SAS workers in the Southwest and Southeast spend less time in non-SAS
work than those in the rest of the country; SAS workers from the Midwest and the
Western Plains spend less time per year abroad than those in other regions; and
Southeastern SAS workers spend less time not working while in the United States than
those in other regions.
The highest concentration of SAS workers employed by farm labor contractors is in the
Southeast.
According to worker respondents, SAS employers in the Southeast rarely offer workers'
compensation or Unemployment Insurance.
1

NAWS FINDINGS 1990
INTRODUCTION
PURPOSE OF THE REPORT
Imroduction
The Findings from the National Agricultural Workers Survey is a new publication series
intended to provide the public with information on the characteristics and work patterns
of seasonal agricultural workers. Its aim is to provide a basic reference for individuals
needing current national statistics on seasonal farm workers. It is hoped that this report
will be useful to policy makers, researchers, agricultural employers, employer
organizations, and groups providing services to seasonal farm workers.
The report provides an overview of the data collected by the National Agricultural
Workers Survey (NAWS). It includes responses of 2,115 SAS workers interviewed by
the NAWS during fiscal year 1990. The text and tables in this report depict the
frequencies with which these SAS workers selected specific responses to interview
questions. For example, the report details what percentage of the individuals were
married, what percentage were single and what percentage were divorced, separated or
widowed. In some policy areas, data have been broken down further by important
subgroups of the population. For example, English language proficiency is reported by
country of origin. All analysis in this report conforms to statistical conventions (see
Appendix). More in depth analysis of the NAWS data will be presented through
occasional reports on specific topics.
These findings display information for individual respondents in the NAWS regardless of
how much SAS work they perform. If we were to report our results in terms of hours
worked rather in terms of percent of individuals, certain groups would become more
important contributors to the SAS labor force. Some important demographic groups
slighted by this approach are men, participants in IRCA's Special Agricultural Workers
1
1 3
NAWS FINDINGS 1990Introduction
(SAW) authorization program, and immigrants from Latin America. Each of these groups
works proportionately more hours than the percent of the labor force they represent.
A similar report will be produced annually, contingent on continued funding for the
NAWS. This report covers interviews from fiscal year 1990, the second year of the
NAWS. The volume covering fiscal year 1989 interviews is forthcoming. The 1990
report is being published before the 1989 report in order to make the most recent
information available as soon as possible.
Interested individuals are invited to make comments and suggestions for improving the
report. Communication should be directed to Rick Mines, U.S. Department of Labor,
Room S-2114, 200 Constitution Avenue, N.W., Washington, D.C. 20210.
TOPICS COVERED IN THIS REPORT
The report is divided into three sections. Section I provides national level information on
the personal characteristics of seasonal agricultural workers. It covers legal status,
schooling, language proficiency and literacy, family residence and U.S. household
composition, and income and use of government programs.
Section II provides information on f;mployment patterns and job characteristics at the
national level. It covers employment history and labor supply, characteristics and patterns
of SAS employment, characteristics and patterns of non-SAS employment, and
characteristics and patterns of non-work periods and periods spent abroad.
Section III provides information on regional differences in worker characteristics, job
characteristics and employment patterns.
214
NAWS FINDINGS 1990
THE SURVEY
Introduction
The NAWS is a national survey of perishable crop field workers that has been
commissioned by the Department of Labor (DOL) in response to the Immigration Reform
and Control Act of 1986 (IRCA). IRCA requires the Secretaries of Agriculture and Labor
to determine annually if there is a shortage of seasonal agricultural service (SAS) workers.
The Secretaries also must identify how seasonal agricultural wages and working conditions
have changed since the passage of IRCA.
To respond to DOL's legislative needs, the NAWS collects a variety of data from SAS
workers. Data from an extensive work history are used to measure changes in SAS labor
supplied by employed SAS workers. The NAWS also collects basic demographic
information, as well as information on legal status, education, family size and household
composition. To monitor wages and working conditions, the NAWS asks workers a series
of questions on their current SAS job. In addition, the NAWS asks workers about non-
SAS work, non-work periods and time spent abroad.
Although the NAWS interviews only workers currently performing seasonal agricultural
services, it should be remembered that the USDA has defined SAS quite broadly. SAS
crops include the vast majority of nursery products, cash grains, and field crops, in
addition to all fruits and vegetables. SAS work does not include livestock or poultry
production, nor does it include work in silage or other crop activities dedicated exclusively
to producing animal fodder. The NAWS surveys all field workers involved in SAS crops
even though they may work for the same employer year round. The definition of field
work, of course, excludes secretaries and mechanics who work for SAS employers.
However, field packers, supervisors and all other field workers are included.
The NAWS does not sample unemployed agricultural workers. Workers can only be
interviewed for the NAWS when they are actively employed in SAS work.
3 t:
NAWS FINDINGS 1990
METHODOLOGY
Introduction
Each year, the NAWS conducts personal interviews with over 2,000 randomly selected
U.S. SAS workers. The sample is designed to be sensitive to seasonal and regional
fluctuations in the amount of SAS work performed. The NAWS uses site area sampling
to obtain a nationally representative sample of SAS workers while at the same time
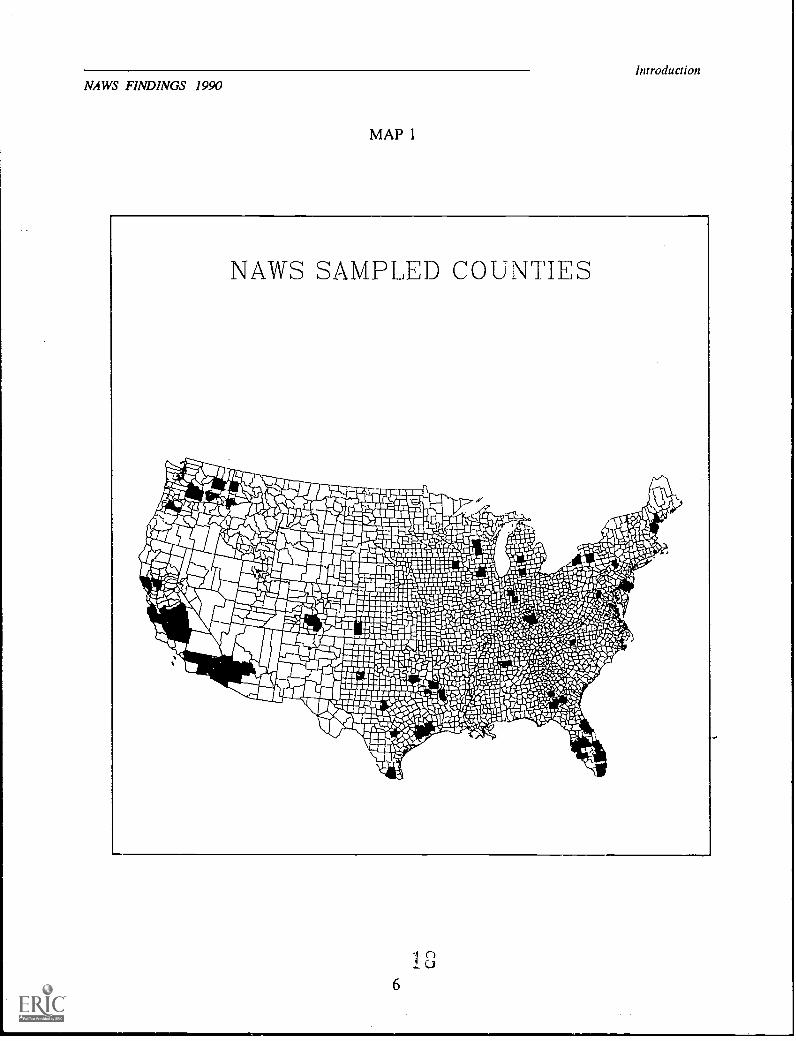
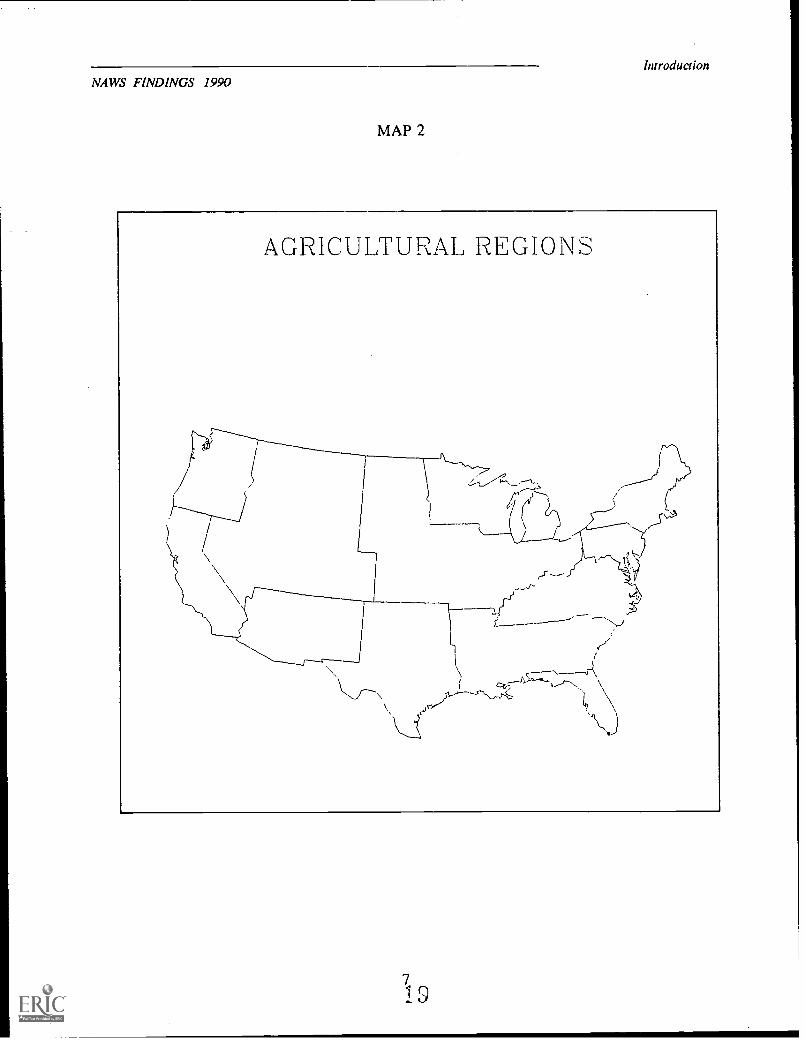
containing travel costs. A sample of seventy-two counties covering twenty-five states was
selected (see map I). The seventy-two counties were chosen to represent twelve distinct
agricultural regions (see map 2). No fewer than four counties are selected for each
region.
To ensure that data collection is sensitive to seasonal fluctuations in the agricultural work
force, interviewing cycles lasting six to ten weeks are conducted three times a year: one
cycle begins in January, one begins in May and one begins in September. The number
of interviews conducted during a cycle is proportionate to the amount of SAS activity
conducted at that time of the year.
Multi-stage sampling is used to select SAS workers for each cycle. For each four- month
cycle, approximately thirty of the seventy-two counties are selected randomly as
interviewing sites. Site selection is sensitive to the size of the seasonal agricultural
payroll. A random sample of SAS employers is generated for each of the selected county
sites. Employer names are obtained from the Bureau of Labor Statistics, the Agricultural
Soil and Conservation Service, Farm Labor Contractor Registration lists and other
sources.
NAWS Regional Coordinators contact the selected employers, explain the purpose of the
survey and obtain access to the work site in order to schedule interviews. Interviewers
then go to the farm, ranch or nursery, explain the purpose of the survey to the workers,
and ask a random sample of them to participate. Interviews then are conducted in the SAS
worker's home or at another location of the SAS worker's choice.
416
NAWS FINDINGS 1990
Imroduction
This report includes data from 2,115 personal interviews which were conducted by the
NAWS between October 1, 1989 to October 1, 1990.
5
NAWS FINDINGS 1990
MAP I
Introduction
1 3
6
NAWS FINDINGS 1990
MAP 2
Introduction
AGRICL LTURAL REGIONS
Jr(>
-----/
r7ri- 17 \\J
SECTION I: CHARACTERISTICS OF SAS WORKERS
20
NAWS FINDINGS 1990
CHAPTER 1DEMOGRAPHIC PROFILE
INTRODUCTION
Chapter 1
This chapter reports basic demographic characteristics of SAS workers. It covers age, gender
and marital status as well as national origin and ethnicity.
SUMMARY OF FINDINGS
Most SAS workers are:
Young (65%). Almost two-thirds of SAS workers are under thirty-five years of age.
Male (71%). Over two-thirds of SAS workers are men.
Married (64%). Almost two-thirds of SAS workers are married.
Foreign-born (62%). Almost two-thirds of SAS workers are foreign-born. The
majority (51%) of workers have been in the United States longer than eight years.
Hispanic (71%). Over two-thirds of SAS workers are of Hispanic origin.
NAWS FINDINGS 1990
Chapter 1
Under 35
Male
Married
Foreignborn
Hispanic0
Source: NAWS
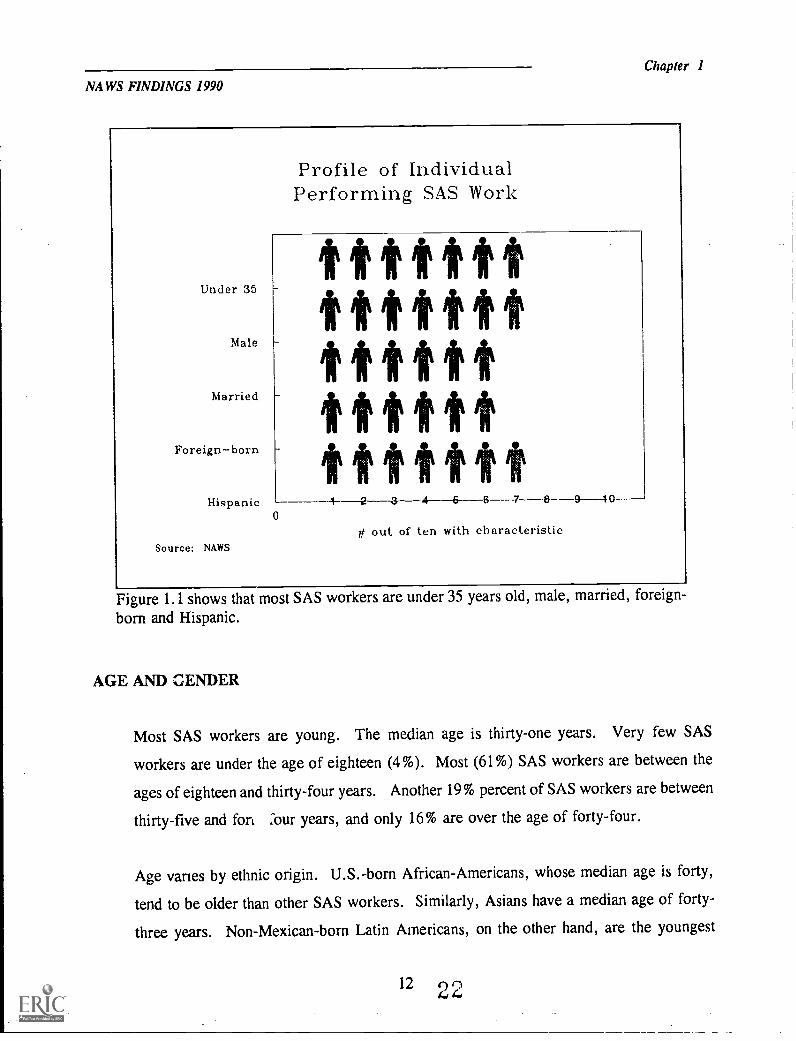
Profile of IndividualPerforming SAS Work
4 2-- 3 4 --6---S 7--8
# out of ten with characteristic
Figure 1.1 shows that most SAS workers are under 35 years old, male, married, foreign-
born and Hispanic.
AGE AND GENDER
Most SAS workers are young. The median age is thirty-one years. Very few SAS
workers are under the age of eighteen (4%). Most (61%) SAS workers are between the
ages of eighteen and thirty-four years. Another 19% percent of SAS workers are between
thirty-five and fort :our years, and only 16% are over the age of forty-four.
Age varies by ethnic origin. U.S.-born African-Americans, whose median age is forty,
tend to be older than other SAS workers. Similarly, Asians have a median age of forty-
three years. Non-Mexican-born Latin Americans, on the other hand, are the youngest
12
NAWS FINDINGS 1990Chapter 1
SAS workers, with a median age of twenty-four years. The median ages of U.S.-born
whites (31), U.S.-born Hispanics (35), and Mexicans (31), are similar to the median age
of the entire population (31).
40%
30%
20%
10%
0%
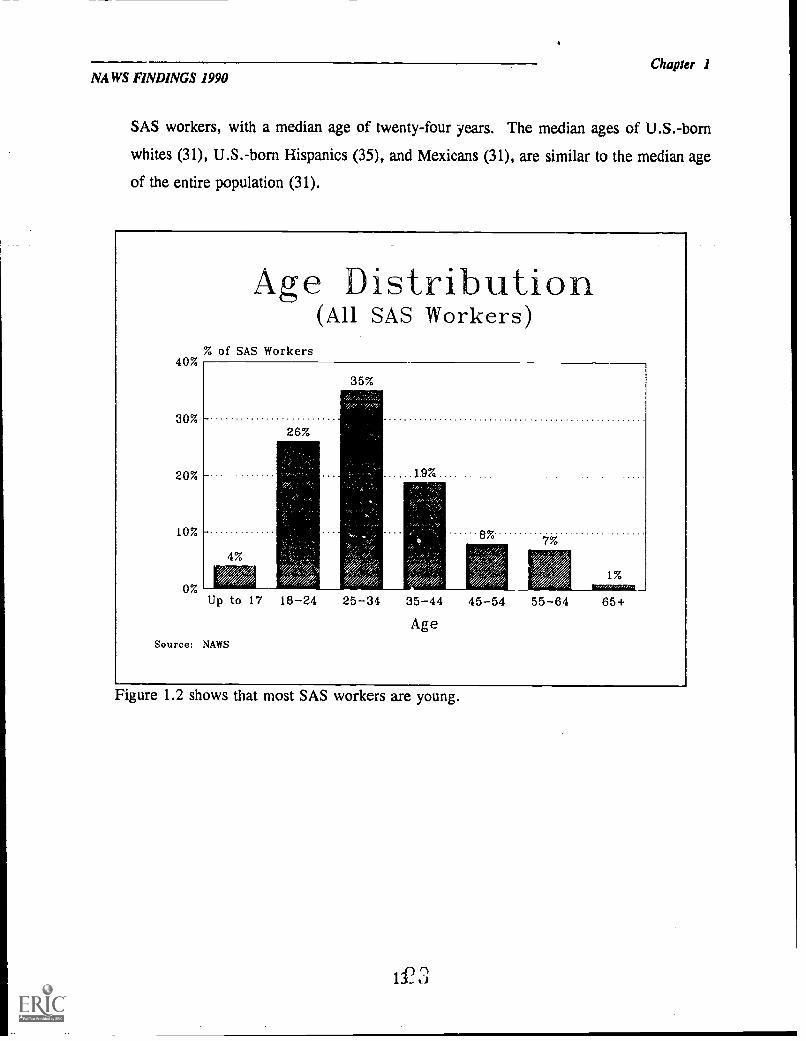
Age Distribution(All SAS Workers)
% of SAS Workers
Up to 17 18-24
Source: NAWS
25-34 35-44
Age
45-54 55-64 65+
Figure 1.2 shows that most SAS workers are young.
12.3
NAWS FINDINGS 1990
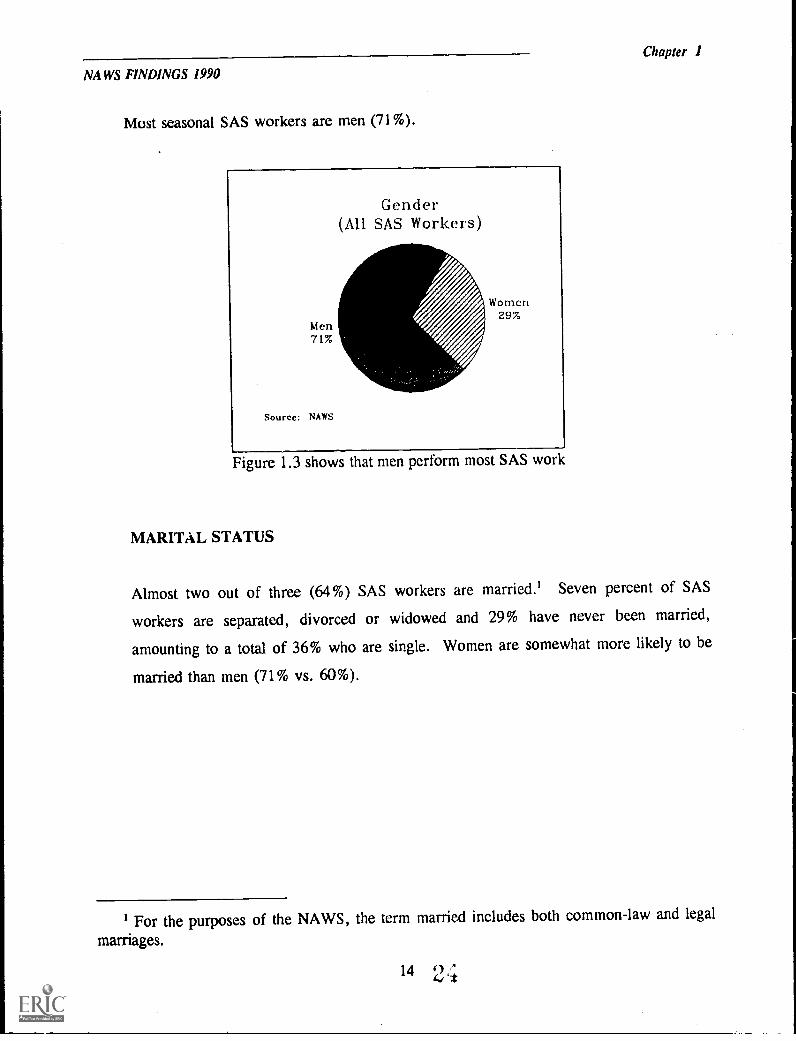
Most seasonal SAS workers are men (71%).
Figure 1.3 shows that men perform most SAS work
MARITAL STATUS
Chapter 1
Almost two out of three (64%) SAS workers are married.' Seven percent of SAS
workers are separated, divorced or widowed and 29% have never been married,
amounting to a total of 36% who are single. Women are somewhat more likely to be
married than men (71% vs. 60%).
1 For the purposes of the NAWS, the term married includes both common-law and legal
marriages.
14 441
NAWS FINDINGS 1990
80%
70%
60%
50% .....40% 36%
30%
20%
10%
0%
Marital Status and Gender(All SAS Workers)
% of SAS Workers
Chapter
64%
Single Married
Men M Women
Source: NAWS
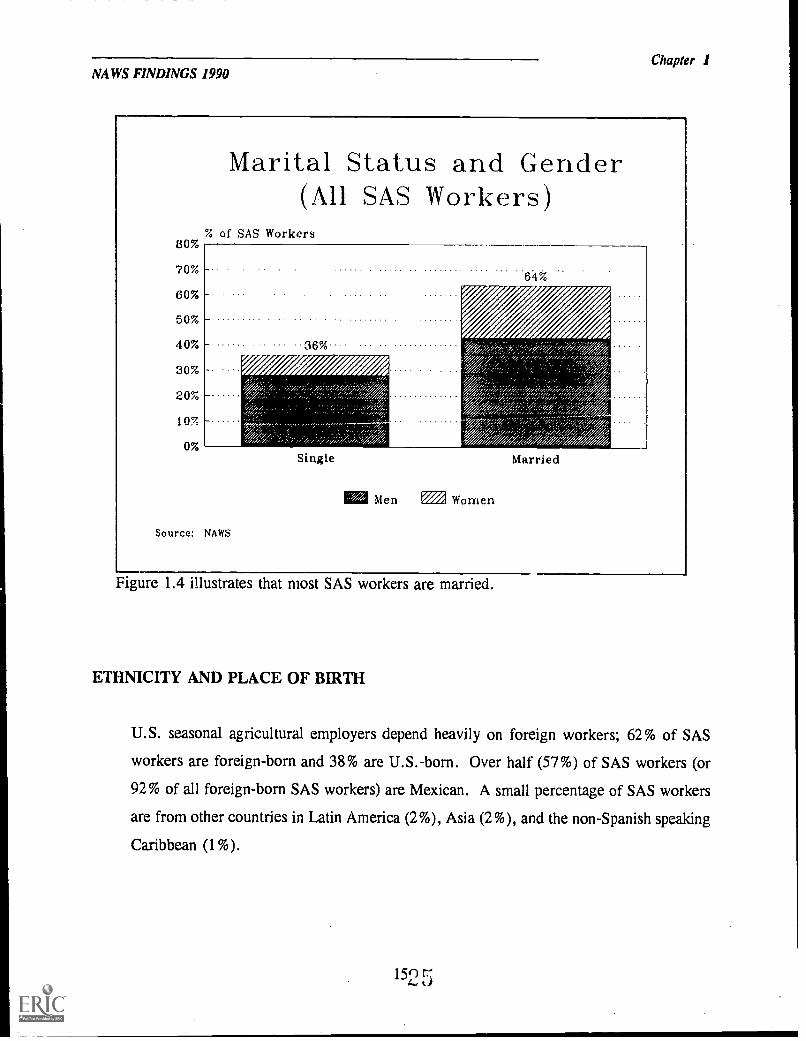
Figure 1.4 illustrates that most SAS workers are married.
ETHNICITY AND PLACE OF BIRTH
U.S. seasonal agricultural employers depend heavily on foreign workers; 62% of SAS
workers are foreign-born and 38% are U.S.-born. Over half (57%) of SAS workers (or
92% of all foreign-born SAS workers) are Mexican. A small percentage of SAS workers
are from other countries in Latin America (2%), Asia (2%), and the non-Spanish speaking
Caribbean (1%).
NAWS FINDINGS 2990
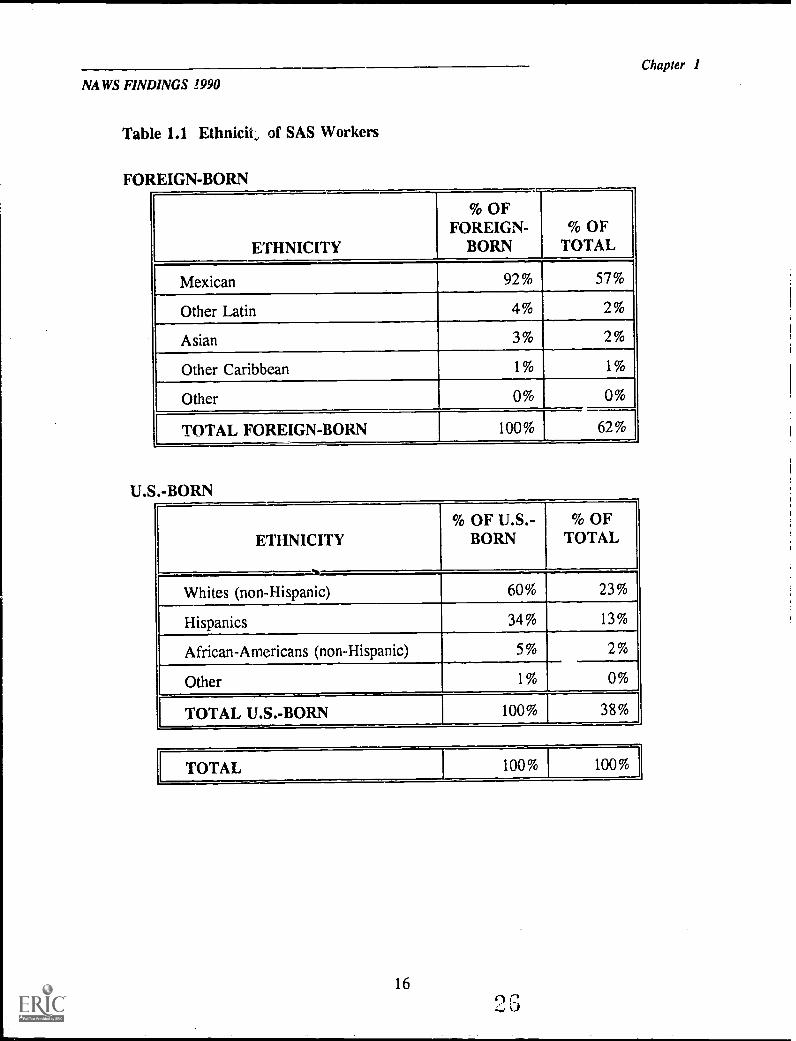
Table 1.1 Ethnick of SAS Workers
FOREIGN-BORN
ETHNICITY
% OFFOREIGN-
BORN% OF
TOTAL
Mexican 92% 57%
Other Latin 4% 2%
Asian 3% 2%
Other Caribbean 1% 1%
Other 0% 0%
TOTAL FOREIGN-BORN 100% 62%
U.S -BORN
ETHNICITY
-6
% OF U.S.-BORN
% OFTOTAL
Whites (non-Hispanic) 60% 23%
Hispanics 34% 13%
African-Americans (non-Hispanic) 5% 2%
Other 1% 0%
TOTAL U.S.-BORN 100%,
38%
TOTAL 100% 100%]
16
Chapter 1

NAWS FINDINGS 1990Chapter 1
9ttgi svibb. 1%Other Latin 4%
Figure 1.5 shows most SAS workers are members of a minority group.
Using ethnicity labels is highly sensitive. It involves making somewhat arbitrary
divisions in a multi-dimensional continuum of identification which is based on
cultural heritage, nationality and racial background. As shall be shown, self-
identification, societal identification and the sociologist's identification of ethnicity can
vary. In this report, we describe major national, cultural, and linguistic differences
among U.S. SAS workers that are useful in understanding seasonal labor supply.
In asking about ethnicity, originally the NAWS attempted to use standard questions
about racial identity and Hispanic origin that would conform to U.S. Census
definitions and allow for comparison to other surveys. Based on advice and
experience, the NAWS questions were modified slightly. Despite these changes,
17
27

NAWS FINDINGS 1990
Chapter 1
many SAS workers still found it difficult to identify themselves using the categories in
these questions. This is probably because many SAS workers come from countries
where race and ethnicity are defined differently than they are defined in the United
States.
The question on Hispanic-origin was modified to include more answers. The
questionnaire asks workers to identify themselves as Mexican-American, Mexican,
Chicano, Puerto Rican, Other Hispanic or "none of the above." Once a variety of
responses was available, SAS workers had little difficulty answering this question.
Tne question on racial identity was more difficult. That question asks SAS workers
to indicate whether they are white; black; Asian or Pacific Islander; Native American,
Alaskan native or Indigenous; or "Other." In examining the answers to this question,
it betame clear that many SAS workers (almost 40%) do not identify with U.S. racial
categories and answered "Other." Almost all workers who rejected the categories
listed in the NAWS were Hispanic, many of whom would be classified as white using
the usual U.S. racial divisions. This problem of identification with pre-set categories
is common in these types of surveys. Those conducting the 1990 U.S. Census report
that they have this difficulty.
Where does that leave us in trying to identify the ethnicity of SAS workers?
First, we can say that over three quarters (77%) of SAS workers identify themselves
as part of one minority group. Only 23% of SAS workers identify themselves as
white and non-Hispanic.
Second, 71% of SAS workers are Hispanic. Fifty-seven percent are Mexicans, 8%
are Mexican-Americans, 3% are Puerto Ricans, and 1% are Chicanos. Two percent
identified themselves as Other Hispanics.
18 2ri

NAWS FINDINGS 1990Chapter I
While workers are clear about their Hispanic origins, analyzing the question on race
is less meaningful as almost 40% of SAS workers choose the "Other" category.
Thus, they indicate that they do not consider themselves white, African-American,
Asian, or Native or Indigenous American. The question on race identification was
more useful in identifying U.S.-born SAS workers who are more familiar with thecategories.2
His anic Ori insAll SAS Workers
Mexican 57% Mexican-American 8%
r'uerto Rican 3%Chicano 1%Other Hispanic 2%
Non-Hispanic 29%
Source: MAWS
Figure 1.6 illustrates that most SAS workers are Hispanic.
2For those who desire information on racial background, the following data are provided.Combining race and Hispanic origin, it appears 68% of SAS workers are Hispanics whoidentify themselves as either white or "Other," including those who identify themselves asPuerto Rican. Another 24% are white non-Hispanics. Three percent are African-Americans,of whom a small percentage also identified themselves as Hispanic. Asians and PacificIslanders comprise another 2% of SAS workers, of whom a small number are bothAsian/Pacific Islanders and Hispanic (less than 1%). The remaining 3% of SAS workers areIndigenous Mexicans and Central Americans, or Native Americans. Most (51%) members ofthis category are Indigenous Mexicans and Central Americans who also identify themselvesas Hispanic.
19
0 9
NAWS FINDINGS 1990
Chapter 1
Interestingly, among U.S.-born SAS worKers, the majority (66%) are non-Hispanic:
60% of U.S.-born SAS workers are non-Hispanic whites, 5% are non-Hispanic
blacks, and 1% are Native Americans or Asians. U.S.-born Hispanics make up 34%
of the domestic SAS labor force.
NUMBER OF YEARS FOREIGN-BORN WORKERS SPENT IN THE UNITEDSTATES
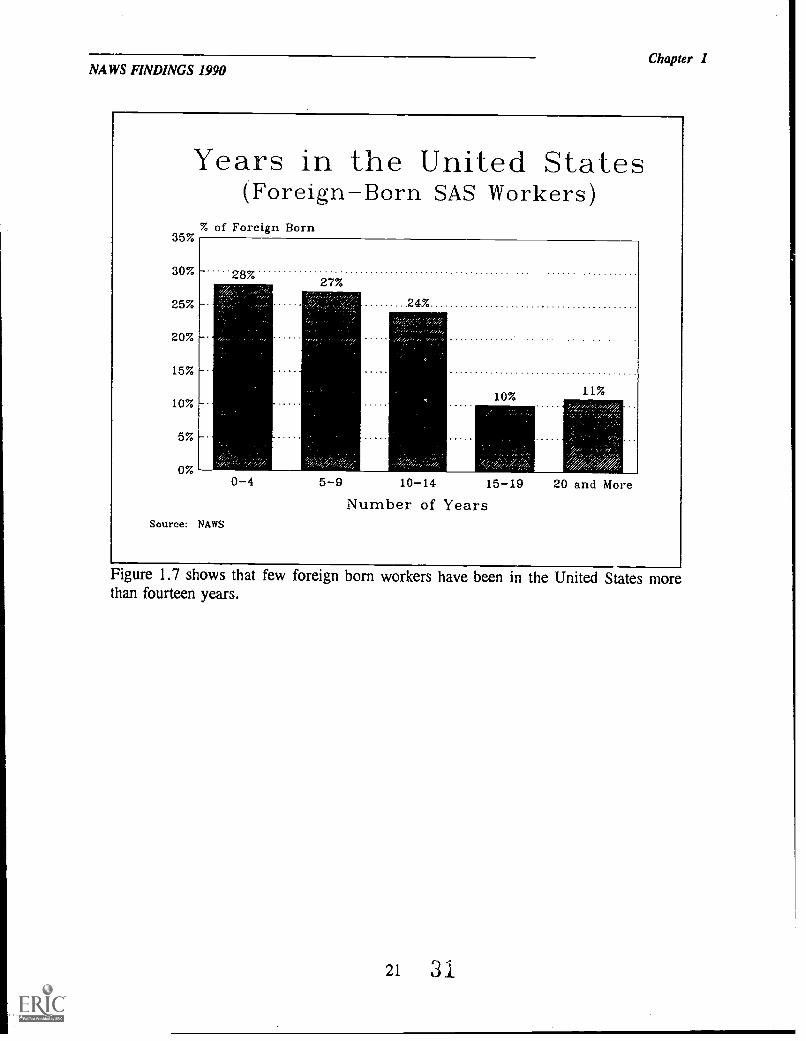
Most (55%) foreign-born SAS workers have lived in the United States fewer than ten
years. Twenty-eight percent of these workers have been here under five years, 27%
between five and nine years, 24% between ten and fourteen years, 10% between
fifteen and nineteen years, and 11% twenty years or longer.
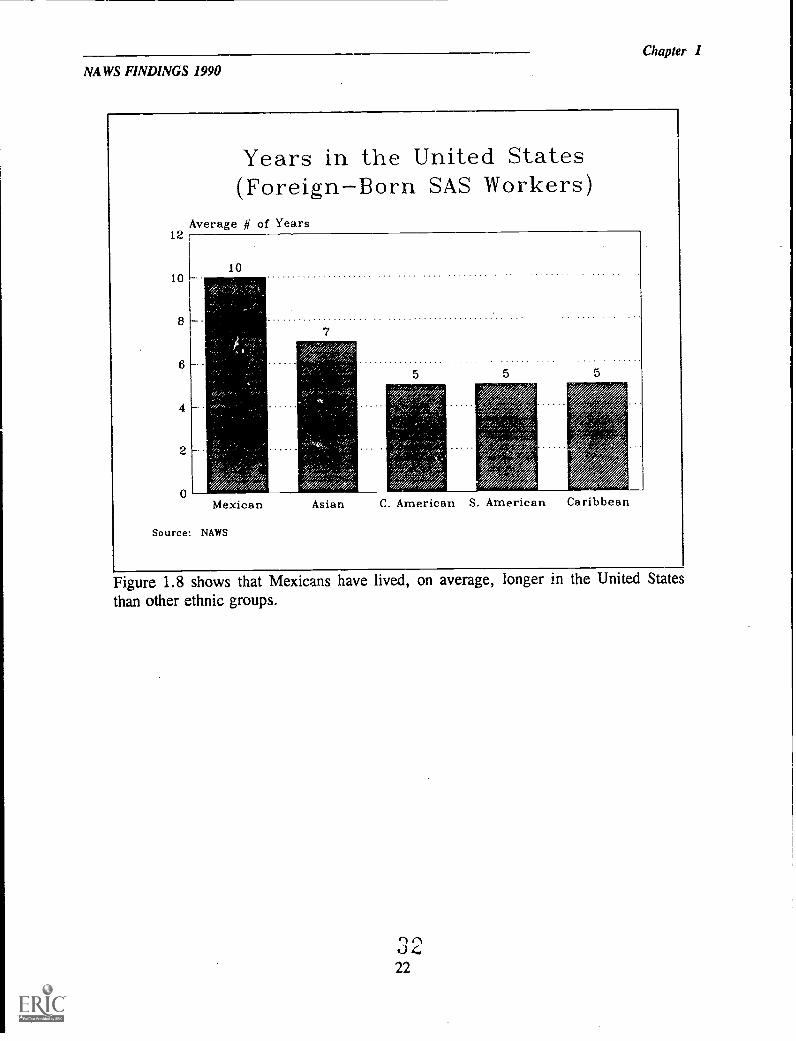
The number of years in the United States for foreign-born workers varies across
ethnic groups. Mexicans have, on average, been in the United States the longest (ten
years). Asians have been in the United States, on average, seven years. Central and
South Americans, and those from the Caribbean, have an average of five years in the
United States.
20
NAWS FINDINGS 1990Chapter 1
Years in the United States(ForeignBorn SAS Workers)
% of Foreign Born35%
30%
25%
20%
15%
10%
5%
0%0-4 5-9 10-14 15-19
Number of YearsSource: NAWS
20 and More
Figure 1.7 shows that few foreign born workers have been in the United States morethan fourteen years.
21 31
NAWS FINDINGS 1990
Chapter 1
12
Years in the United States(ForeignBorn SAS Workers)
Average # of Years
..................... ........
Mexican
Source: NAWS
Asian C. American S. American Caribbean
Figure 1.8 shows that Mexicans have lived, on average, longer in the United States
than other ethnic groups.
3222
NAWS FINDINGS 1990
CHAPTER 2LEGAL STATUS
INTRODUCTION
Chapter 2
This chapter discusses some impacts of IRCA on farm laborers. It begins with a brief
introduction to IRCA and some background on legal status terminology. It then covers
compliance with employer sanctions, the legal status of foreign-born workers, the impact of
legalization programs, and the various groups who applied for the Replenishment Agricultural
Worker (RAW) programs.
SUMMARY OF FINDINGS
Impact of the legalization program and of employer sanctions has been mixed.
- Twelve percent of SAS workers, amounting to one in five (19%) foreign-born
workers, are unauthorized.
Three out of ten (29%) SAS workers are SAW program applicants.
Over half (53%) of foreign-born SAS workers have applied for legalization through
IRCA programs.
More than one-fourth (28%) of unauthorized SAS workers have signed up for the RAW
program.
NAWS FINDINGS 1990
BACKGROUND ON IRCA AND LEGAL STATUS TERMINOLOGY
Chapter 2
In its attempt to control the employment of unauthorized foreign workers, the Immigration
Reform and Control Act of 1986 (IRCA) brought changes to employer-employee
relationships in agriculture. The act requires employers, including agricultural employers,
to verify employee work authorization. Those who knowingly hire unauthorized workers
face the threat of legal sanctions, including heavy fines and jail sentences.
To ease the impact of employer sanctions on both workers and employers, IRCA included
several legalization programs. These programs allowed qualifying undocumented
individuals to become United States temporary residents, and ultimately, legal permanent
residents. The IRCA programs are described later in this chapter.
Before examining the impact of IRCA on the agricultural labor force, it is necessary to
define the different types of legal statuses. The Immigration and Naturalization Service
(INS) issues a variety of visas to foreign nationals, not all of which confer work
authorization. Authorized workers include all U.S. citizens, as well as all foreign
nationals who have been granted work authorization by the INS. For purposes of this
analysis, authorized workers are broken down into four categories. The first category
consists of all U.S. citizens, either naturalized citizens or citizens by birth. The second
category is made up of foreign nationals who have become U.S. legal permanent residents
(LPR's). These workers are sometimes referred to as "green card" holders. The third
category consists of all workers who have been granted temporary residency through one
of IRCA's legalization programs. The final category is a residual category that contains
all other work-authorized foreign nationals. This includes workers who have obtained
work authorization through pending legalization applications, family unity cases, as well
as other foreign nationals who have obtained work authorization as part of an INS
proceeding or visa application.
24
NAWS FINDINGS 1990Chapter 2
Unauthorized workers include all foreign nationals who have not been granted work
authorization by INS. For this analysis, unauthorized workers are broken down further
into documented and undocumented workers. Not all documents that permit foreign
nationals to enter or remain in the United States allow the possessors to work in the
United States. For example, tourist visas and some types of student visas allow
individuals to enter the United States legally, but do not authorize the bearer to work in
this country. Such individuals are unauthorized but not undocumented. Undocumented
individuals have neither valid visas nor work authorization.
IMPACT OF [RCA ON SEASONAL LABOR SUPPLY
The impact of employer sanctions on agriculture has been mixed. The number of
unauthorized workers employed in agriculture may have declined, but unauthorized
workers still comprise an important component of the seasonal labor supply. Twelve
percent of SAS workers, amounting to about two in ten (19%) foreign-born workers, are
unauthorized. This means that about one in every five (19%) foreign-born workers is
unauthorized. Because of the tendency of unauthorized workers to avoid inclusion in
government surveys or to conceal the fact that they are unauthorized, these numbers
should be considered as minimums.
IRCA legalization programs have been successful in cushioning the impact of employer
sanctions by expanding the supply of authorized SAS workers. Almost one-third (32%)
of SAS workers are IRCA authorized.
LEGAL STATUS OF SAS LABOR SUPPLY
Eighty-eight percent of SAS workers are authorized to work in the United States. This
includes 40% who are citizens, 15% who are legal permanent residents (LPR's), 23% who
are temporary residents, and 10% who hold other work-authorized visas.

NAWS FINDINGS 1990Chapter 2
Despite employer sanctions, 12% of SAS workers are unauthorized. Most (95%) of these
unauthorized workers also are undocumented. In other words, fewer than 1% (5% of
12%) of all SAS workers were legally admitted to the United States but are working
without authorization.
Legal Status(All SAS Workers)
Citizens40%
Legal Permanent15%
Source: NMI'S
Unauthorized12%
Other Authorized10%
Temporary Res23%
Figure 2.1 shows that most SAS workers are authorized.
LEGAL STATUS OF FOREIGN-BORN WORKERS
Most (81%) foreign-born SAS workers are individuals who are authorized to work in the
United States. Authorized foreign-born workers make up 49% of all SAS laborers.
Foreign-born SAS workers can be broken down as follows: naturalized citizens, 2%; legal
permanent residents, 25%; temporary residents, 38%; workers who obtained work
authorization through other visas, 16%; and unauthorized workers 19%.
26 3G
NAWS FINDINGS 1990Chapter 2
U.S.-Born38%
Legal Status(All SAS Workers)
Source: NAWS
Foreign-Born62%
------------------------------z
Naturalized 2%Legal Perm. 25%
Temp. Res. 38%
Other Legal 16%
Unauthor. 19%
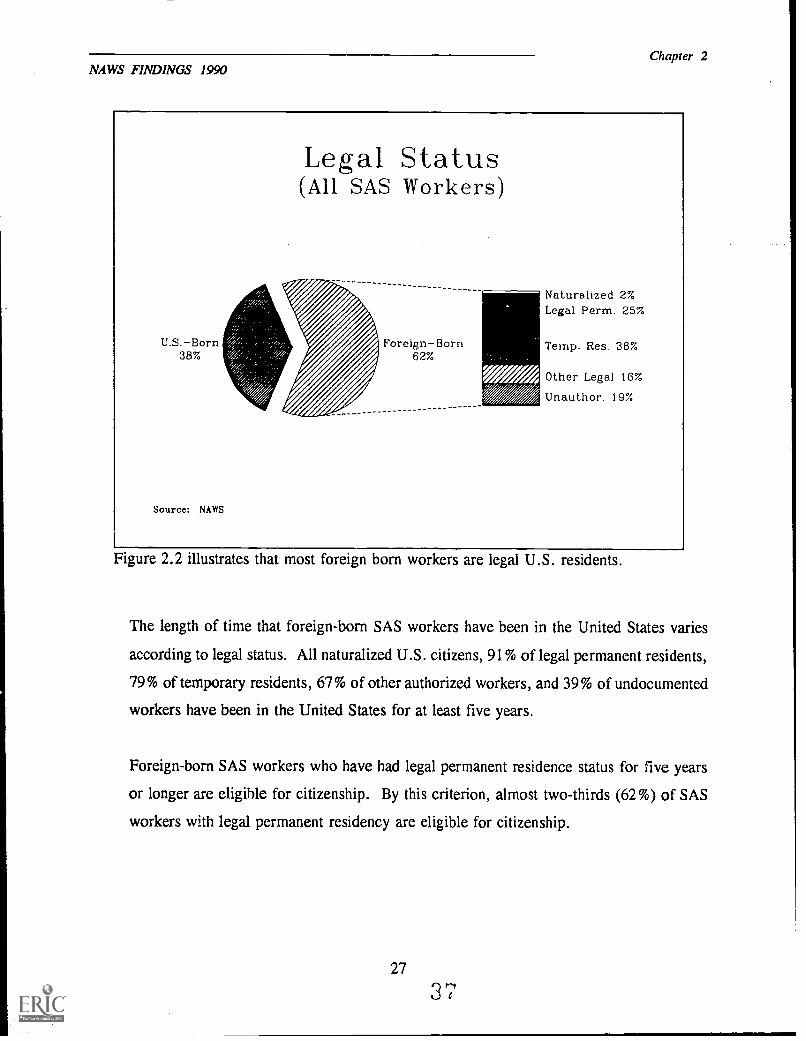
Figure 2.2 illustrates that most foreign born workers are legal U.S. residents.
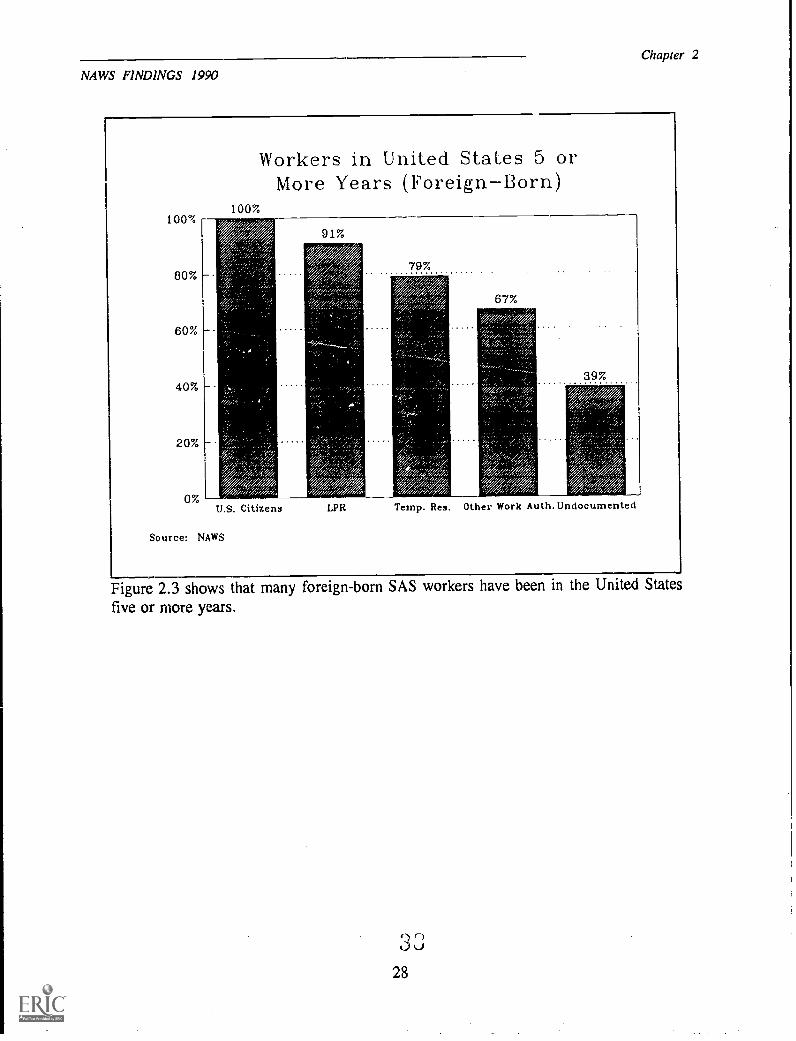
The length of time that foreign-born SAS workers have been in the United States varies
according to legal status. All naturalized U.S. citizens, 91% of legal permanent residents,
79% of temporary residents, 67% of other authorized workers, and 39% of undocumented
workers have been in the United States for at least five years.
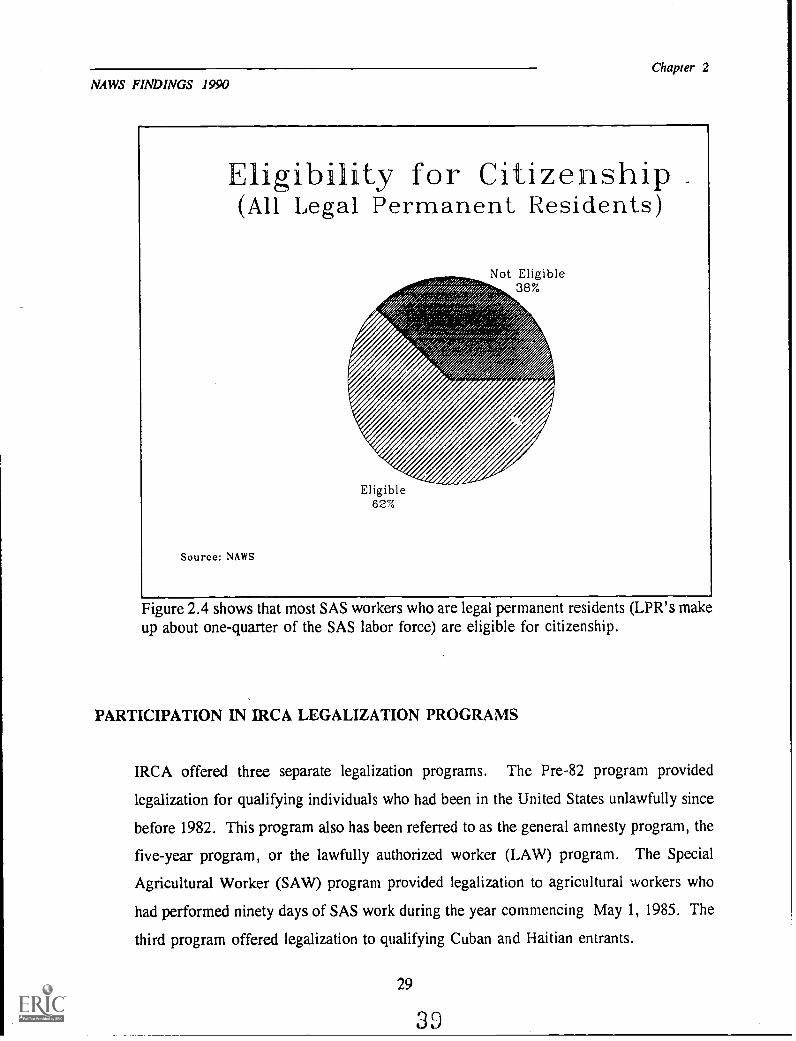
Foreign-born SAS workers who have had legal permanent residence status for five years
or longer are eligible for citizenship. By this criterion, almost two-thirds (62%) of SAS
workers with legal permanent residency are eligible for citizenship.
NAWS FINDINGS 1990
Chapter 2
Workers in United States 5 orMore Years (ForeignBorn)
100%
U.S. Citizens
Source: NAWS
LAR
79%
67%
39%
Temp. Res. Other Work Auth. Undocumented
Figure 2.3 shows that many foreign-born SAS workers have been in the United Statesfive or more years.
1") n0
28
NAWS FINDINGS 1990Chapter 2
Eligibility for Citizenship .
(All Legal Permanent Residents)
Not Eligible38%
Eligible62%
Source: NAWS
Figure 2.4 shows that most SAS workers who are legal permanent residents (LPR's makeup about one-quarter of the SAS labor force) are eligible for citizenship.
PARTICIPATION IN IRCA LEGALIZATION PROGRAMS
IRCA offered three separate legalization programs. The Pre-82 program provided
legalization for qualifying individuals who had been in the United States unlawfully since
before 1982. This program also has been referred to as the general amnesty program, the
five-year program, or the lawfully authorized worker (LAW) program. The Special
Agricultural Worker (SAW) program provided legalization to agricultural workers who
had performed ninety days of SAS work during the year commencing May 1, 1985. The
third program offered legalization to qualifying Cuban and Haitian entrants.
29
3D
NAWS FINDINGS 1990Chapter 2
Nationally, the legalization programs were very popular. Over 1.3 million individuals
applied for the SAW program alone. Another 70,000 agricultural workers applied under
the Pre-82 program.'
More than three years after their inception, IRCA legalization programs continue to be
successful in increasing the supply of authorized agricultural workers. Thirty-two percent
of SAS workers are IRCA authorized workers. These workers have SAS experience and
have been in the United States for at least five years.
About one-third of SAS workers are SAW program participants (29%). Pre-82 applicants
comprise 3% of the SAS work force, and Cuban-Haitian entrants constitute less than 1%.
The legalization process has several steps, and the timing of each step varies by program.
Legalization applications had to be submitted before May 7, 1988 for Pre-82s and Cuban-
Haitian entrants and before November 30, 1988 for SAWs. The INS began reviewing
pending applications as they were submitted. Approved applicants were granted temporary
resident status. Applicants who were rejected could enter an appeals process. After a
waiting period, those with temporary resident status could apply for permanent residency.
The waiting period was eighteen months for Pre-82s and Cuban-Haitian entrants. SAWs
who could prove three years of work experience could receive permanent residency as of
December 1, 1989. SAWs with less work experience could receive permanent resident
status as of December 1, 1990.
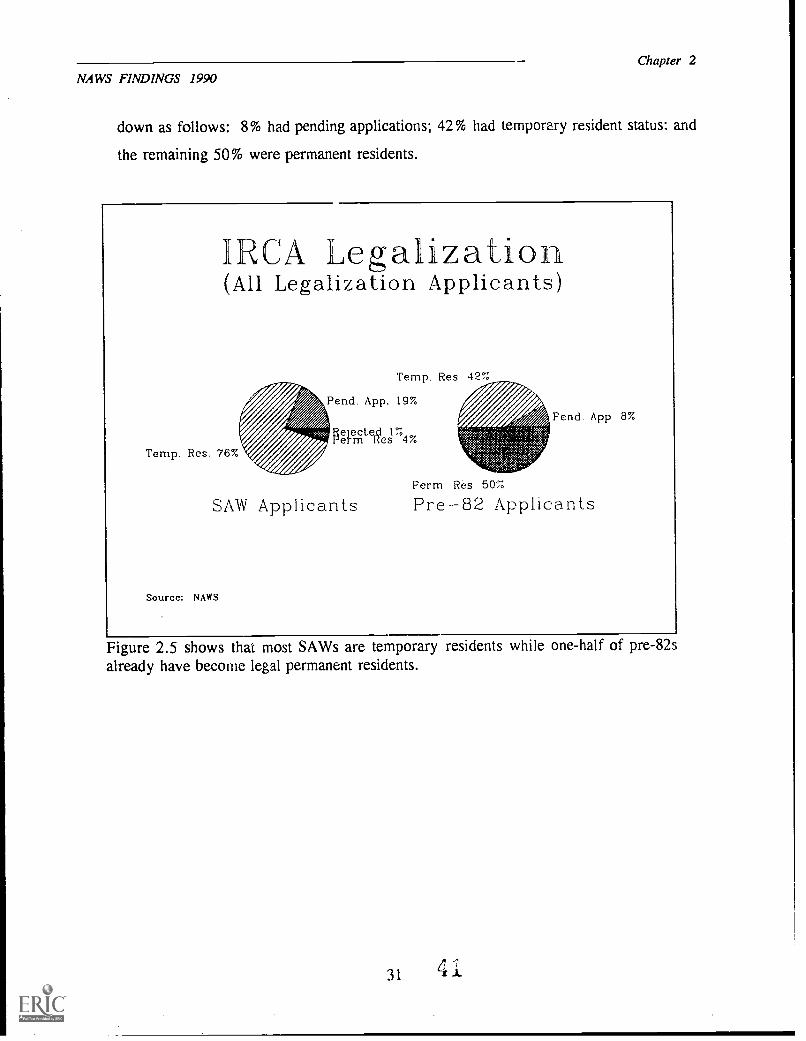
The NAWS asked legalization applicants about the status of their applications. At the time
of their interviews, SAW applicants could be divided as follows: 19% had pending
applications, 76% were temporary residents, 4% were permanent residents, and 1% had
been rejected. Applicants for the Pre-82 and the Cuban-Haitian program could be broken
'Information provided by the Department of Justice. SAW figure as of August 1990, Pre-82information as of December 1990.
30 40
NAWS FINDINGS 1990Chapter 2
down as follows: 8% had pending applications; 42% had temporary resident status: and
the remaining 50% were permanent residents.
RCA Legalization(All Legalization Applicants)
Temp. Res. 76%
SAW Applicants
Source: NAWS
Res 42%
Pend. App 8%
Perm Res 50%
Pre-82 Applicants
Figure 2.5 shows that most SAWs are temporary residents while one-half of pre-82salready have become legal permanent residents.
31

NAWS FINDINGS 1990
RAW APPLICANTS4
Chapter 2
IRCA provides agricultural employers with a safety net in the form of the Replenishment
Agricultural Workers (RAW) program. If the Secretaries of Agriculture and Labor
determine that there is a shortage of SAS workers, the INS can admit RAWs. During the
fall of 1989, interested individuals signed up for the RAW program. However, registrants
are not assured of an eventual U.S. visa. They can be admitted to the United States only
when a SAS labor shortage is declared and will be chosen by lottery from among those
who qualify. Despite the uncertainty of the program, over 600,000 foreign nationals
registered for this program.'
The NAWS asked employed SAS workers whether they had registered for the RAW
program. In FY 1990 approximately 18% of the foreign-born SAS workers had registered
for the RAW program. These registrants come from many sources. Overall, more than
one-fourth (28%) of the unauthorized SAS workers applied for the RAW program. The
remaining SAS workers who hut applied for the RAW program were legally authorized
workers who were not yet permanent residents. This group included legalization
applicants who had pending applications, temporary residents, and individuals with other
visa statuses. Thirteen percent of SAW applicants registered for the RAW program as did
27% of those who were not temporary residents, but held other work authorized visas.
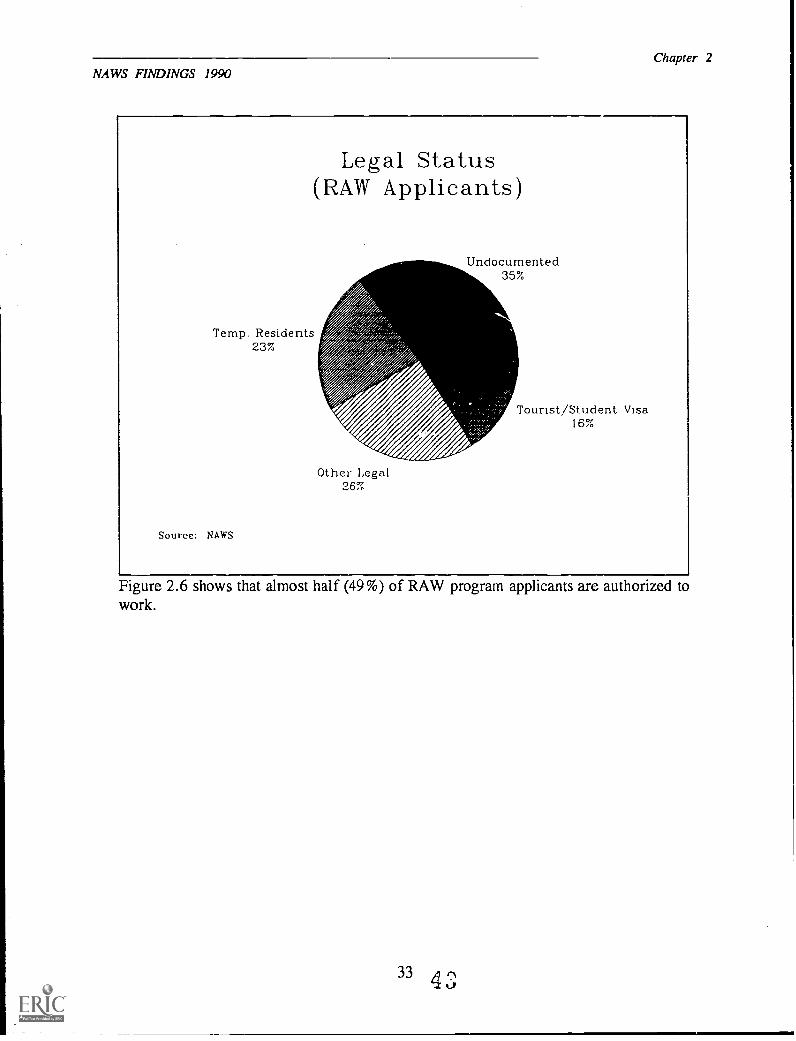
Over one-third (35%) of those who registered for the RAW program are currently
undocumented. Twenty-three percent are temporary residents, 26% have other legal
status, and 16% have a tourist or student visa.
4 Since the fall interviewing cycle coincided with the RAW application period, respondentsinterviewed during that period were not asked if they had applied for the RAW program.However, SAS workers interviewed in the winter and spring/summer cycles were asked abouttheir participation in the RAW program.
5 Information provided by the U.S. Department of Justice.
324 2
NAWS FINDINGS 1990Chapter 2
Legal Status(RAW Applicants)
Temp. Residents23%
Source: NAWS
Undocumented35%
Other Legal26%
Tourist/Student Visa16%
Figure 2.6 shows that almost half (49%) of RAW program applicants are authorized towork.
33 43
NAWS FINDINGS 1990
CHAFFER 3LITERACY, SCHOOLING AND ENGLISH SKILLS
INTRODUCTION
Chapter 3
This chapter covers native language and home-country education, followed by adult school
enrollment and English language proficiency and literacy. The NAWS results are used to
present some indicators of the language proficiency of adults doing SAS work. This
analysis contributes to larger efforts being made in the United States to define and measure
the litelacy levels of both native English speakers and those who have limited proficiency
in English.
SUMMARY OF FINDINGS
Most (53%) SAS workers have completed eight or fewer years of formal education.
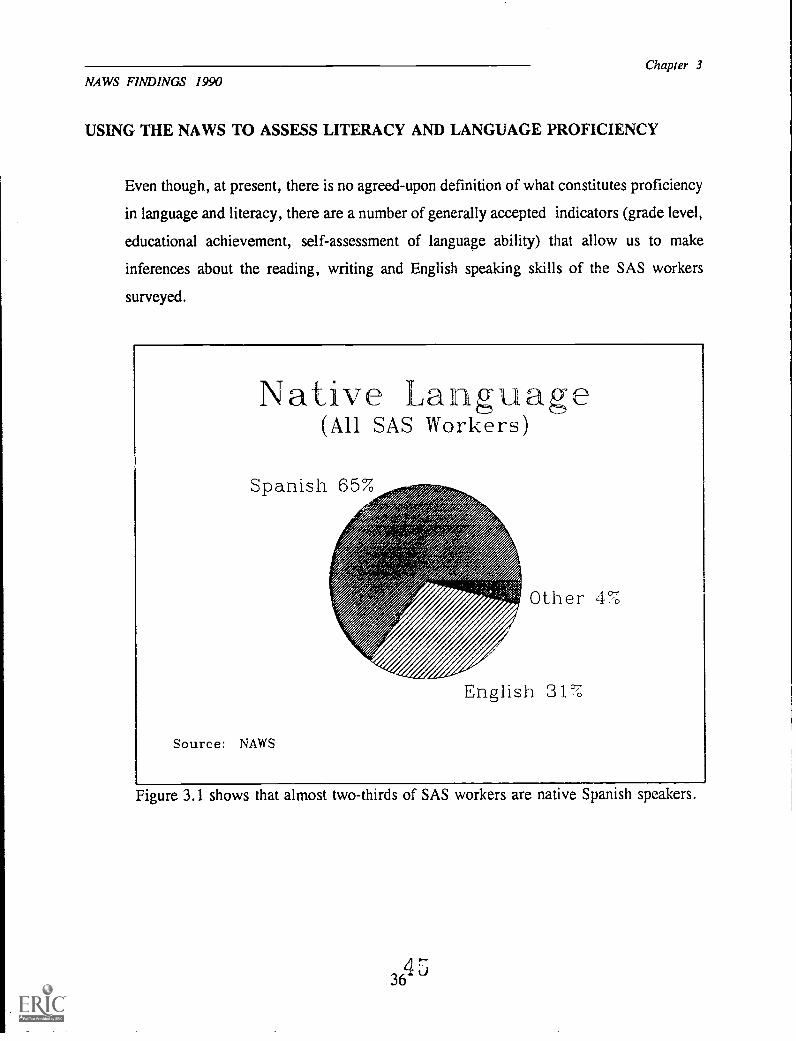
Spanish is the primary language of two out of three (65%) SAS workers.
Two out of five (40%) SAS workers say that they can speak English well: 31% are
native English speakers, and 9% are bilingual.
About one-third (36%) of SAS workers say that they can read English well.
About one-third (35%) of SAS workers have tried to improve their skills by taking an
adult education class. English is the most popular type of class.
35
NAWS FINDINGS 1990Chapter 3
USING ME NAWS TO ASSESS LITERACY AND LANGUAGE PROFICIENCY
Even though, at present, there is no agreed-upon definition of what constitutes proficiency
in language and literacy, there are a number of generally accepted indicators (grade level,
educational achievement, self-assessment of language ability) that allow us to make
inferences about the reading, writing and English speaking skills of the SAS workers
surveyed.
Native La aguage(All SAS Workers)
Source: NAWS
Other 4%
English 31°
Figure 3.1 shows that almost two-thirds of SAS workers are native Spanish speakers.
NAWS FINDINGS 1990
PRIMARY LANGUAGE AND SCHOOLING
Chapter 3
Almost all (95%) SAS workers received their highest level of formal education in their
country of origin. Consequently, almost all SAS workers received all of their education
in their primary language. An exception to this are some individuals who come from
language minority groups in their native countries. In these cases, education may be
provided not in the language spoken in the home, but in the official language of the
society, a language in which these groups may only have limited proficiency. Groups
falling into this category are U.S.-born Spanish speakers, and Mexicans and Central
Americans whose native language is not Spanish.
USING GRADE LEVELS TO MEASURE LITERACY
Though many studies report educational grade level as a measure of literacy, examinations
of census data have shown that equating literacy levels with grade levels is in many ways
problematic. School completion data are not able to measure out-of-school learning in
language and literacy. Nevertheless, the amount of schooling a worker has received can
be used as a strong indicator of level of literacy.
Most SAS workers have had little formal schooling. The median level of education is
eighth grade. This measure includes all formal schooling whether received in the United
States or abroad. On average, U.S.- educated workers have had more years of instruction
than those educated abroad. While the median level of education of SAS workers
educated in the United States is eleventh grade, the median level of education for those
educated abroad is sixth grade.
SAS workers who received schooling in their primary language have higher median levels
of education than those who were taught in a second (or third) language. Within the
United States, the median level of education is twelfth grade for native English speakers
and tenth grade for those whose native language in not English. The median level of
37
40
NAWS FINDINGS 1990Chapter 3
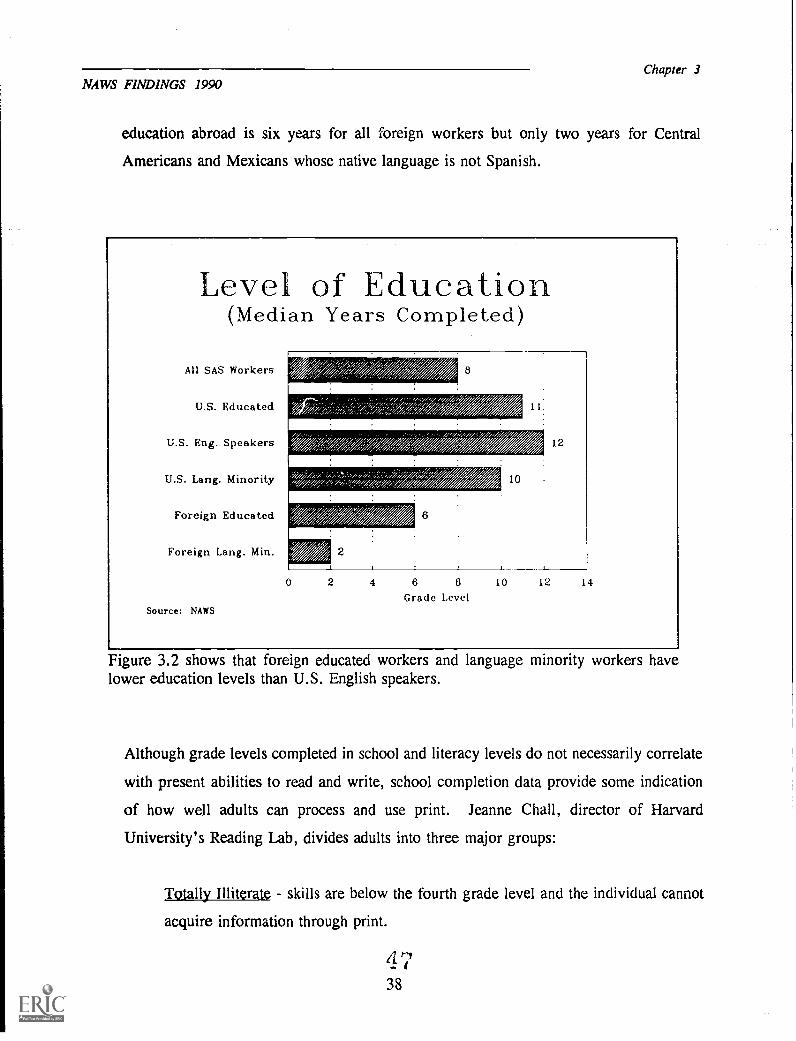
education abroad is six years for all foreign workers but only two years for Central
Americans and Mexicans whose native language is not Spanish.
Level of Education(Median Years Completed)
All SAS Workers
U.S. Educated
U.S. Eng. Speakers
U.S. Lang. Minority
Foreign Educated
Foreign Lang. Min.
Source: NAWS
iv/ ,471,
2
6
0 2 4 6 8
Grade Level
10
10 12
12
14
Figure 3.2 shows that foreign educated workers and language minority workers havelower education levels than U.S. English speakers.
Although grade levels completed in school and literacy levels do not necessarily correlate
with present abilities to read and write, school completion data provide some indication
of how well adults can process and use print. Jeanne Chall, director of Harvard
University's Reading Lab, divides adults into three major groups:
Totally Illiterate skills are below the fourth grade level and the individual cannot
acquire information through print.
4 738
NAWS FINDINGS 1990Chapter 3
Functionally Illiterate a person who can read between the fourth and seventh grade
levels.
Marginally Literate - a person who can read between the eighth and twelfth grade
levels, but lacks the twelfth grade equivalence needed in a complex technological
society.6
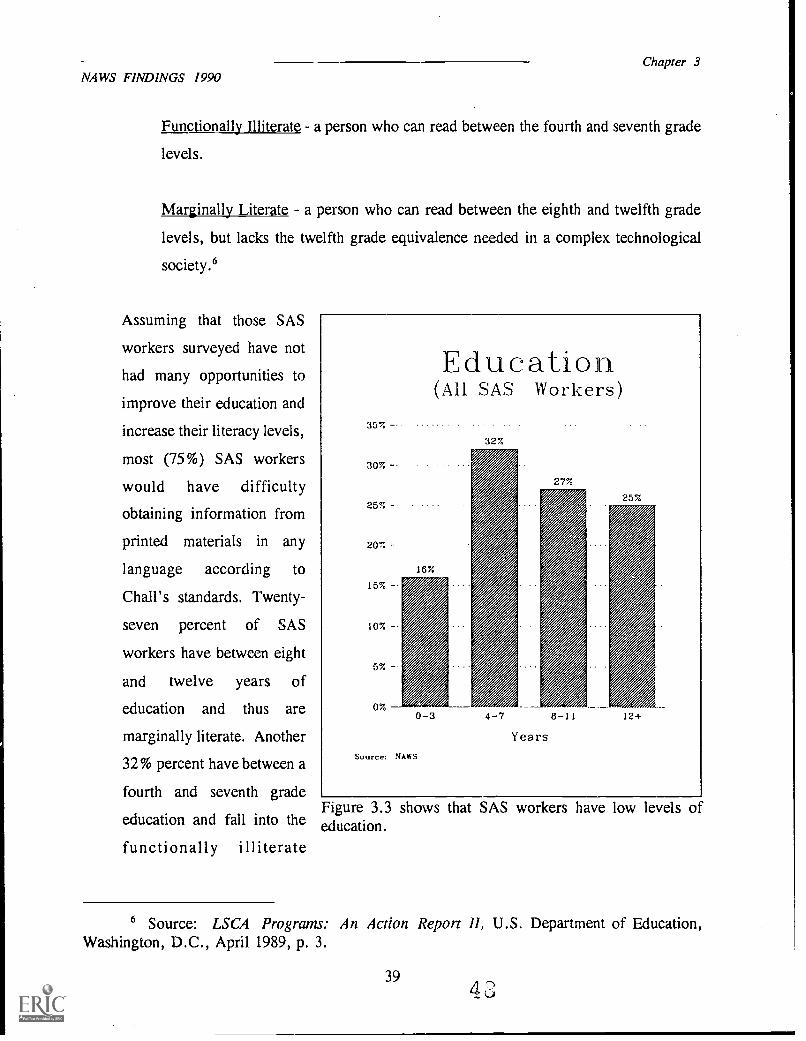
Assuming that those SAS
workers surveyed have not
had many opportunities to
improve their education and
increase their literacy levels,
most (75%) SAS workers
would have difficulty
obtaining information from
printed materials in any
language according to
Chall's standards. Twenty-
seven percent of SAS
workers have between eight
and twelve years of
education and thus are
marginally literate. Another
32% percent have between a
fourth and seventh grade
education and fall into the
functionally illiterate
35%
Education(All SAS Workers)
32%
0-3
Source: NAWS
4-7
Years8 11 12+
Figure 3.3 shows that SAS workers have low levels ofeducation.
6 Source: LSCA Programs: An Action Report II, U.S. Department of Education,Washington, D.C., April 1989, p. 3.
39
NAWS FINDINGS 1990
Chapter 3
category. Finally, 16% of SAS workers have less than a fourth grade education and are
thus considered totally illiterate.
These numbers have strong consequences in an economy in which a significant number
of employers report that many high school graduates lack the basic skills needed for entry-
level jobs. The lack of literacy may impact the effectiveness of workers in jobs which
require reading and writing. It may also severely limit the economic and social
opportunities of these adults.
It is important, however, to point out that many of these workers have strengths that are
not reflected in grade or literacy levels. NAWS data show that most adults doing SAS
work have been employed in the United States for more than fifteen years. For the most
part, they have been self-sufficient, have found housing, raised families and have managed
to "survive" in this country.
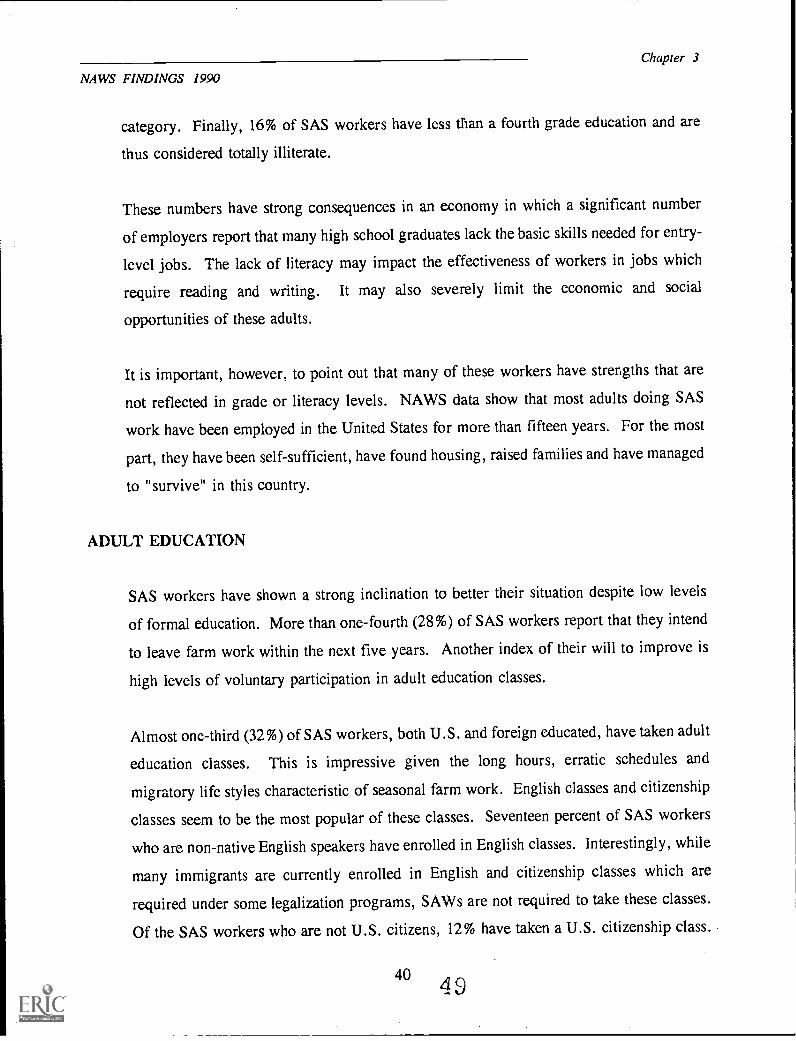
ADULT EDUCATION
SAS workers have shown a strong inclination to better their situation despite low levels
of formal education. More than one-fourth (28%) of SAS workers report that they intend
to leave farm work within the next five years. Another index of their will to improve is
high levels of voluntary participation in adult education classes.
Almost one-third (32%) of SAS workers, both U.S. and foreign educated, have taken adult
education classes. This is impressive given the long hours, erratic schedules and
migratory life styles characteristic of seasonal farm work. English classes and citizenship
classes seem to be the most popular of these classes. Seventeen percent of SAS workers
who are non-native English speakers have enrolled in English classes. Interestingly, while
many immigrants are currently enrolled in English and citizenship classes which are
required under some legalization programs, SAWs are not required to take these classes.
Of the SAS workers who are not U.S. citizens, 12% have taken a U.S. citizenship class.
404
NAWS FINDINGS 1990Chapter 3
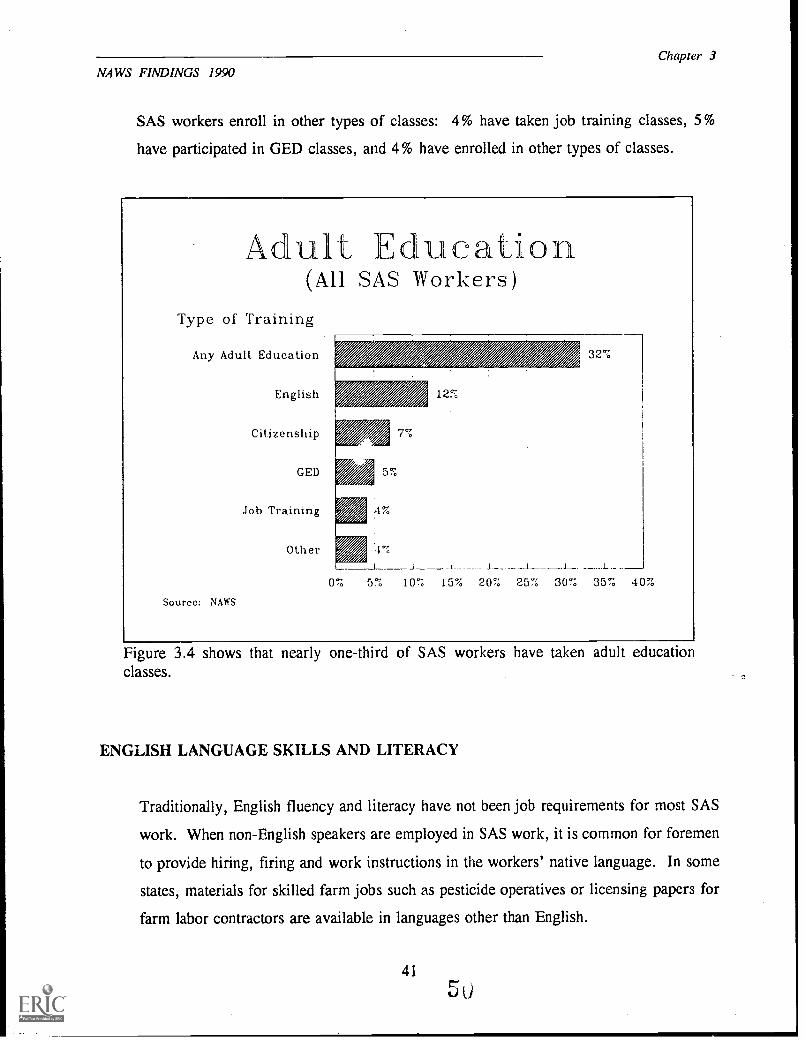
SAS workers enroll in other types of classes: 4% have taken job training classes, 5%
have participated in GED classes, and 4% have enrolled in other types of classes.
Adult Educat: on(All SAS Workers)
Type of Training
Any Adult Education
English
Citizenship
12%
GED 5%
Job Training 4%
Other
Source: NAWS
32%
4 %
1 .1 i 1 1 J L
0% 5% 10% 15% 20% 25% 30% 35% 40%
Figure 3.4 shows that nearly one-third of SAS workers have taken adult educationclasses.
ENGLISH LANGUAGE SKILLS AND LITERACY
Traditionally, English fluency and literacy have not been job requirements for most SAS
work. When non-English speakers are employed in SAS work, it is common for foremen
to provide hiring, firing and work instructions in the workers' native language. In some
states, materials for skilled farm jobs such as pesticide operatives or licensing papers for
farm labor contractors are available in languages other than English.
41
5 u
NAWS FINDINGS 1990
Chapter 3
Many workers whose native language is not English have made efforts to learn English.
As mentioned earlier, of the SAS workers whose primary language is not English, 17%
have taken an English as a Second Language (ESL) class in the United States.
Approximately 11% of SAS workers whose primary language is not English have
completed their highest grade in the United States (probably receiving some English
instruction).
Even so, most SAS workers whose first language is not English have only limited English
speaking abilities. In responding to a self-assessment question about their English
speaking capabilities, 42% of SAS workers whose native language is not English say they
speak no English, 45% speak some English, and 13% say that they speak English well.
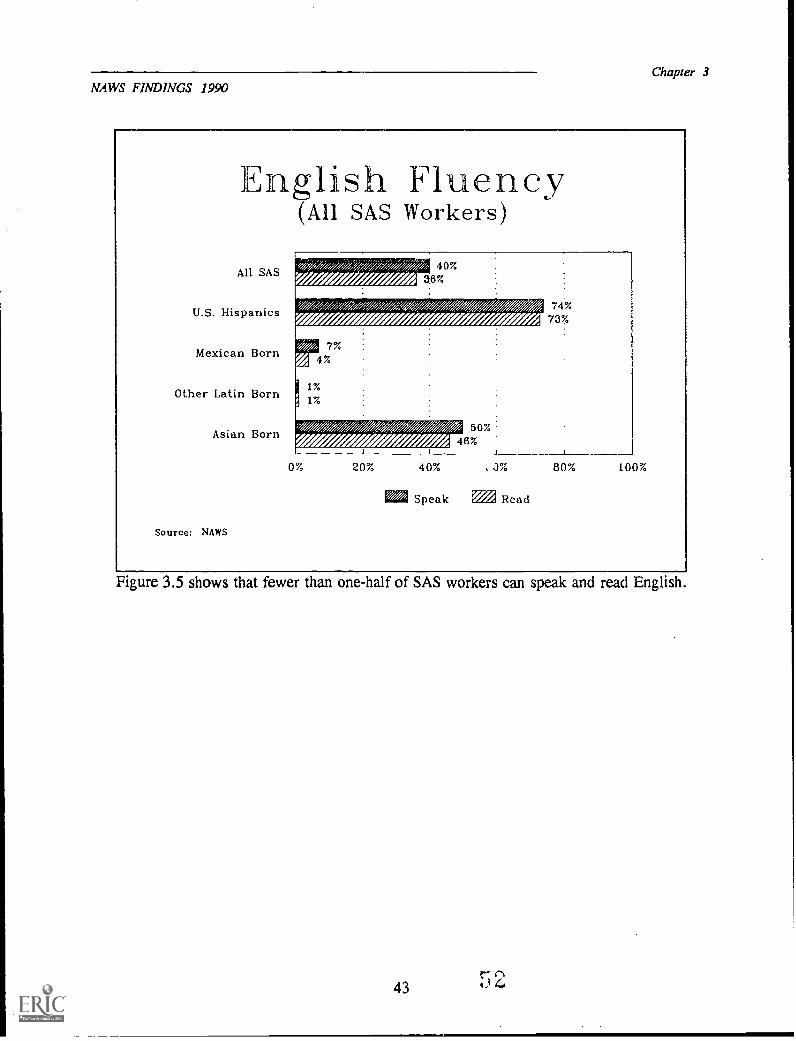
A total of 40% of the SAS labor force speaks English well.
The ability to speak and read English varies across different groups:
Of SAS workers who are U.S.-born Hispanics, 74% speak and 73% read
English fluently.
Of the Asian SAS workers, 50% speak and 46% read English fluently.
Of the Mexican SAS workers, 7% speak and 4% read English fluently.
Of the other Latin-born SAS workers, only 1% speak and 1% read English
fluently.
42
NAWS FINDINGS 1990Chapter 3
aglish Fluency(All SAS Workers)
All SAS
U.S. Hispanics
Mexican Born
Other Latin Born
Asian Born
36%40%
74%73%
7%Pied
4%
1%
1%
50%46%
Source: NAWS
0% 20% 40% 3% 80% 100%
Speak M Read
Figure 3.5 shows that fewer than one-half of SAS workers can speak and read English.
43
NAWS FINDINGS 1990
CHAPTER 4FAMILY RESIDENCE ANDWORK SITE HOUSEHOLD COMPOSITION
INTRODUCTION
Chapter 4
This chapter reports information on family residence and household composition. It
covers family type, family residence, and household size and composition.
SUMMARY OF FINDINGS
The majority (70%) of SAS workers are married and/or have children.
More than one-half (57%) of SAS workers reside with their families at the work site.
Men (46%) and foreign-born (47%) workers are the least likely to reside with family
at the work site.
4 Between two and four people live in most SAS worker households.
The vast majority (85%) of adults in households of SAS worker parents or married
couples hold jobs. Three-quarters (75%) of the adults in households of single SAS
workers who live with parents work, as do 97% of the adults in households of single
SAS workers who live away from parents.
Two out of five (41%) of children over the age of fourteen in SAS worker households
hold a job.
45
NAWS FINDINGS 1990
FAMILY TYPE
Chapter 4
For the purposes of this analysis, families of SAS workers have been divided into three
types: families headed by parents (whether married or single); married individuals without
children; and single individuals.
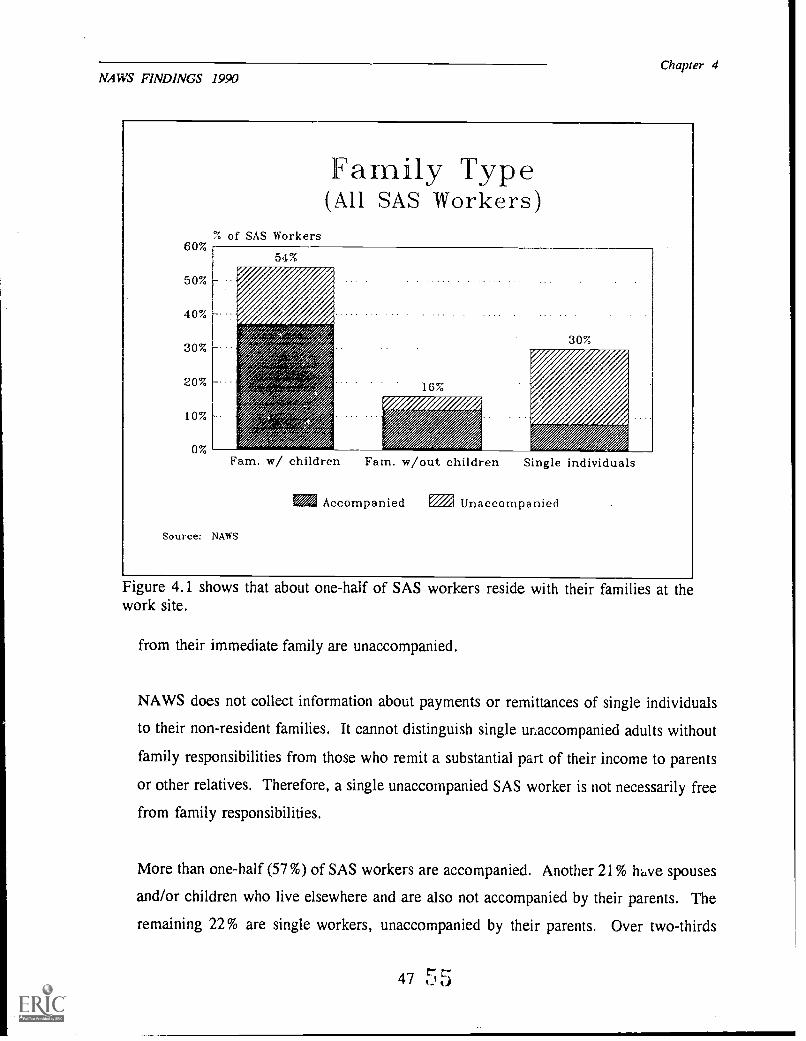
The majority (54%) of SAS workers are parents. Sixteen percent are married with no
children, and 30% are single.'
WORK SITE FAMILY RESIDENCE AND HOUSEHOLD COMPOSITION
It is common for SAS workers to live away from their immediate families while they are
doing SAS work. These "unaccompanied" SAS workers may have distinct behaviors and
special needs. This distinction, therefore, has been a subject of analysis. Unaccompanied
SAS workers work away from their parents, spouse and children. If a parent SAS worker
lives with his or her children or spouse, a married SAS worker lives with his or her
spouse, or a SAS worker of any kind lives with a parent while doing SAS work, then we
classify that SAS worker as accompanied. Others are unaccompanied.
An unaccompanied SAS worker should not be confused with a migrant worker. Families
residing together at a work site may be follow-the-crop migrants, who move from work
site to work site. They may also be shuttle migrants, who move away from their home
base to a farm work area where they settle for the work year. On the other hand, SAS
worker families may not be migrants, but rather settled families living within commuting
distance of the work site. The SAS worker is not unaccompanied in any of these cases.
On the other hand, SAS workers who do not migrate to perform SAS work, but live away
The definition of single here is different from the definition in chapter 2. It excludes those
SAS workers whose marital status is single but have children. These SAS workers are
categorized as parents.
46
NAWS FINDINGS 1990Chapter 4
60%
50%
40%
30%
20%
10%
0%
Family Type(All SAS Workers)
% of SAS Workers
Fam. w children Fam. w out children Single individuals
Accompanied M Unaccompanied
Source: NAWS
Figure 4.1 shows that about one-half of SAS workers reside with their families at thework site.
from their immediate family are unaccompanied.
NAWS does not collect information about payments or remittances of single individuals
to their non-resident families. It cannot distinguish single unaccompanied adults without
family responsibilities from those who remit a substantial part of their income to parents
or other relatives. Therefore, a single unaccompanied SAS worker is not necessarily free
from family responsibilities.
More than one-half (57%) of SAS workers are accompanied. Another 21% hi,ve spouses
and/or children who live elsewhere and are also not accompanied by their parents. The
remaining 22% are single workers, unaccompanied by their parents. Over two-thirds
47 5 5

NAWS FINDINGS 1990
Chapter 4
(68%) of SAS workers with children are accompanied; 75% of married SAS workers
without children are accompanied; and 26% of single individuals are accompanied.
Almost one-third (30%) of SAS workers who are married and/or have children live away
from their families. Eighty percent of these individuals have family abroad. More than
one-half of SAS workers who have children and/or spouses abroad have children (65%)
and/or spouses (73%) living in Mexico; 28% have children and 18% have spouses in the
United States; 3% have children and 3% have spouses in Central America; 1% have
children and 1% have spouses in the Caribbean; 1% have children and 1% have spouses
in Asia. The remaining 2% have children elsewhere and 4% report having spouses who
live elsewhere.
One out of four (26%) single workers lives with their U.S. resident parents, and three out
of four (74%) live on their own, away from their U.S. or foreign resident parents.
GENDER AND WORK SITE FAMILY RESIDENCE
While less than one-half (46%) of male SAS workers are accompanied, 83% of women
SAS workers are accompanied.
This pattern occurs in all family types. Almost all (97%) of SAS worker mothers reside
with their spouse, children and/or parents. Only 56% of fathers, on the other hand, reside
with their spouse, children and/or parents. Among married couples without children, only
66% of the men reside with their wives and/or parents at the work site, while 86% of the
women reside with their husbands and/or parents. Finally, 38% percent of single women
live with their parents, compared to 23% of single men.
48

NAWS FINDINGS 1990Chapter 4
Work Site Family Residence by Gender(All SAS Workers)
100%
80%
60%
40%
20%
0%
% Ace. by Family at U.S. Work Site
Fam. w/ children
Source: NAWS
Fam. w/out children Single individuals
Women MI Men
1
Figure 4.2 shows that men are less likely than women to reside with their families whileworking.
PLACE OF BIRTH AND FAMILY RESIDENCE
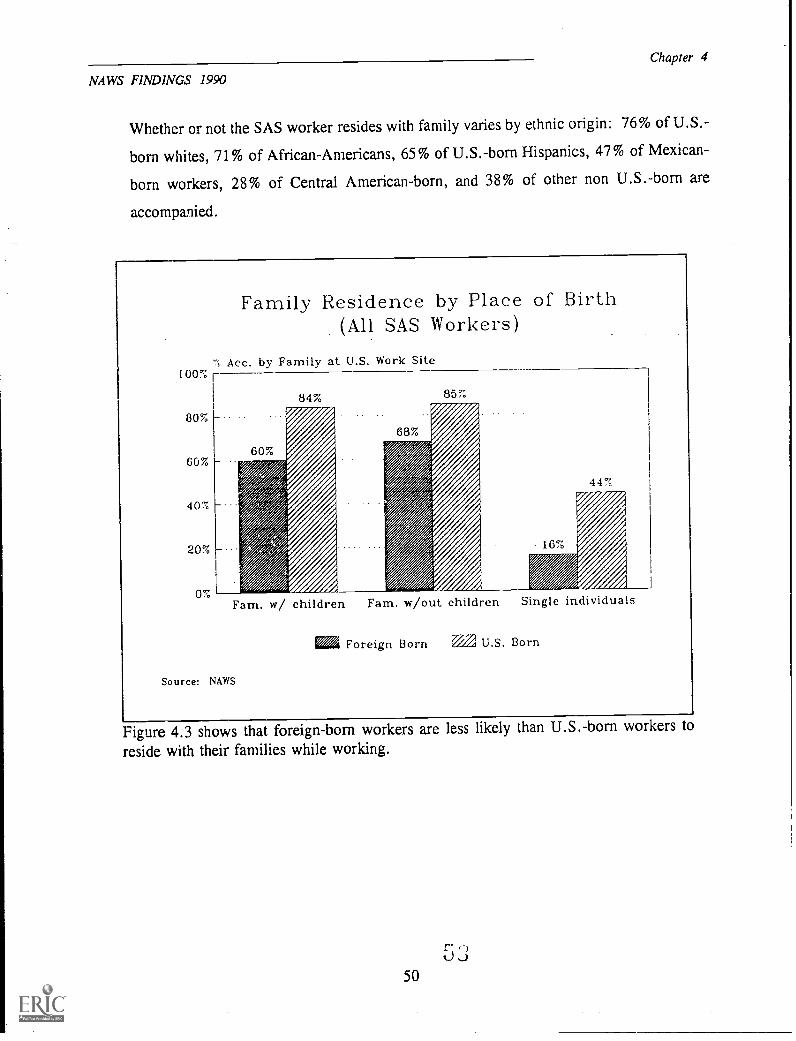
U.S.-born workers are more likely to reside with their families than foreign-born workers
(72% vs. 47%). This is true across all family types. U.S-born parents are more likely
to be accompanied than foreign-born parents (84% vs. 60%). Similarly, 85% of U.S.-
born married SAS workers without children are accompanied, compared to 68% of those
who are foreign-born. Finally, with regard to single SAS workers without children, 44%
of those who are U.S.-born and 16% of those who are foreign-born are accompanied by
parents.
NAWS FINDINGS 1990
Chapter 4
Whether or not the SAS worker resides with family varies by ethnic origin: 76% of U.S.-
born whites, 71% of African-Americans, 65% of U.S.-born Hispanics, 47% of Mexican-
born workers, 28% of Central American-born, and 38% of other non U.S.-born are
accompanied.
100%
80%
60%
40%
20%
0%
Family Residence by Place of Birth(All SAS Workers)
`". Ace. by Family at U.S. Work SRe
Fam. w children Fam. w out children Single individuals
,
Source: NAWS
Foreign Born U S. Born
Figure 4.3 shows that foreign-born workers are less likely than U.S.-born workers toreside with their families while working.
r50
NAWS FINDINGS 1990
HOUSEHOLD SIZE AND COMPOSITION
Chapter 4
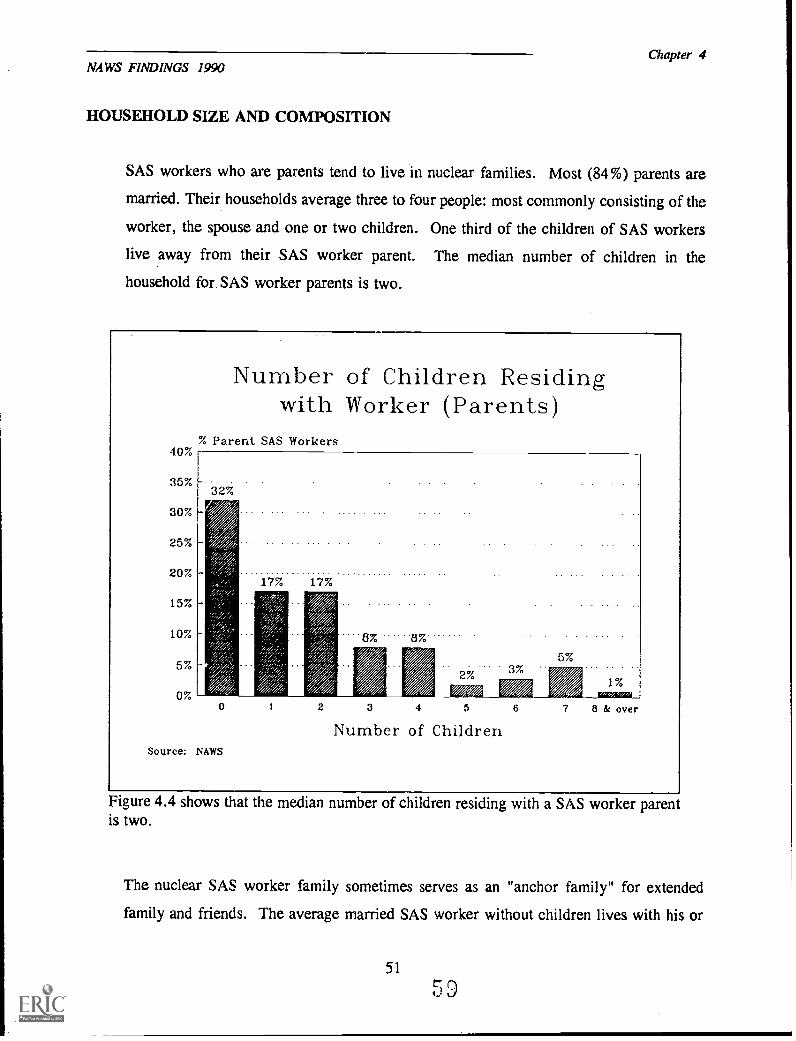
SAS workers who are parents tend to live in nuclear families. Most (84%) parents are
married. Their households average three to four people: most commonly consisting of the
worker, the spouse and one or two children. One third of the children of SAS workers
live away from their SAS worker parent. The median number of children in the
household for SAS worker parents is two.
Number of Children Residingwith Worker (Parents)
% Parent SAS Workers40%
35%
30%
25%
20%
15%
10%
5%
0%
17% 17%
''8% 8%
8 & over
Number of ChildrenSource: NAWS
Figure 4.4 shows that the median number of children residing with a SAS worker parentis two.
The nuclear SAS worker family sometimes serves as an "anchor family" for extended
family and friends. The average married SAS worker without children lives with his or
51

NAWS FINDINGS 1990
Chapter 4
her spouse and one other person in a three-person household. Non-family and extended
family members are sometimes found in households headed by SAS worker parents or
SAS worker married couples. One sibling or extended family member is present, on
average, in one-quarter (25%) of these households. One non-family member is present,
on average, in about one-half (46%) of these households.
Single (and childless) SAS workers residing with their parents live in households that
average four immediate family members over the age of fourteen: the respondent, two
parents, and one sibling. These families at times also have extended family or non-family
members living with them averaging one extended family member in eight households and
one non-family member in one out of ten households.' The households of single SAS
workers who live away from parents average five people, including one sibling.
EMPLOYMENT OF HOUSEHOLD MEMBERS
In households of SAS worker parents and married SAS workers without children, 85% of
household members aged fifteen or older work. Almost one-half (41%) of the children
aged fifteen and older work, one-half of them in non-SAS jobs.
In households where the SAS workc: is a cingle (and childless) adult living with his or her
parents, about three out of four (74%) adults work. On average, one of the three workers
is engaged in a non-SAS job. Single SAS workers who live away from their parents
typically live in a household of workers. On average, two of the four house-mates work
in SAS work and the other two work in non-SAS work.
Averages do not include siblings who are under the age of fifteen.
52 Cu
NAWS FINDINGS 1990Chapter 5
CHAPTER 5INCOME, ASSETS AND USE OF GOVERNMENTPROGRAMS
INTRODUCTION
This chapter reports information on SAS workers' incomes, assets and use of social
services. It covers personal income, family income, assets in the United States and home
country, as well as family poverty status, and use of government and private social
services.
SUMMARY OF FINDINGS
One-half (50%) of SAS workers earn less than $7,500 per year.
One-half (50%) of SAS worker families have incomes below the poverty level, despite
the prevalence of families with multiple wage earners.
Fewer than one-fifth (18%) of SAS workers are recipients of needs-based social
services. Food Stamps is the type of assistance most often received.
Fewer than one-third (29%) of SAS workers receive income from worker or employer
supported government programs.
A small minority (6%) of SAS workers receive aid from private organizations.
53

NAWS FINDINGS 1990
PERSONAL INCOME
Chapter 5
The median annual income for a SAS worker is between $5,000 and $7,500. Authorized
workers have a median annual income of $5,000 $7,500, compared to $2,500 $5,000
for unauthorized workers.
FAMILY INCOME AND POVERTY STATUS
The median family income for SAS workers in all family types is between $7,500 and
$10,000. One-half (50%) of SAS workers live in poverty, as defined by the U.S. Census
Bureau.' Larger SAS families are more likely to live in poverty.
Married SAS workers without children are the least likely (30%) to live in poverty. A
higher number of SAS workers with children (54%) and single workers (53%) are poor.
Foreign-born SAS workers are twice as likely as U.S.-born SAS workers to live in
poverty (62% vs. 31%).
'Money Income and Poverty Status in the United States (CENSUS, Series P-60, No. 168,
1989) defines poverty as an annual income below $6,452 for one individual, below $8,343 for
two, below $9,885 for three, below $12,675 for four, below $14,990 for five, below $16,921
for six, below $19,162 for seven, below $21,328 for eight and below $25,480 for nine or more.
54
6'
NAWS FINDINGS 1990Chapter 5
100
80
60
40
20
Poverty Rate(All SAS Workers)
% of SAS Households that Are Poor
2 3 4 5 6
Number in FamilySource: NAWS
/7 8 9 +
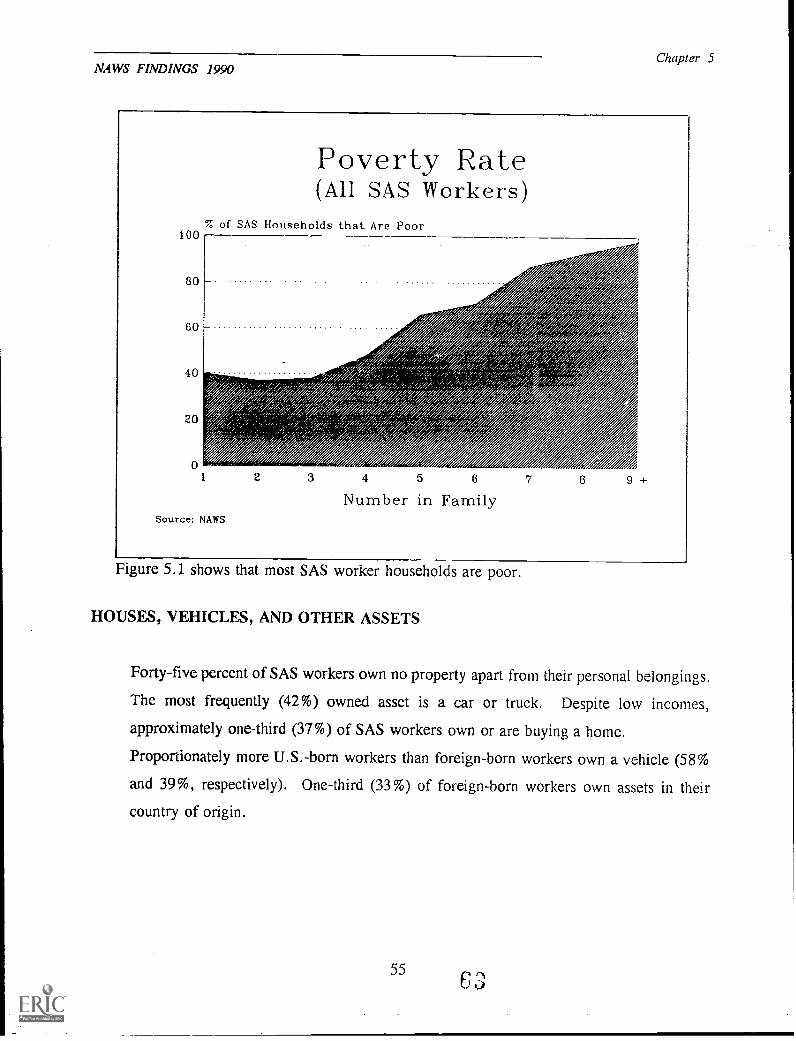
Figure 5.1 shows that most SAS worker households are poor.
HOUSES, VEHICLES, AND OTHER ASSETS
Forty-five percent of SAS workers own no property apart from their personal belongings.
The most frequently (42%) owned asset is a car or truck. Despite low incomes,
approximately one-third (37%) of SAS workers own or are buying a home.
Proportionately more U.S.-born workers than foreign-born workers own a vehicle (58%
and 39%, respectively). One-third (33%) of foreign-born workers own assets in their
country of origin.
5563
NAWS FINDINGS 1990
SOCIAL SERVICES
Chapter 5
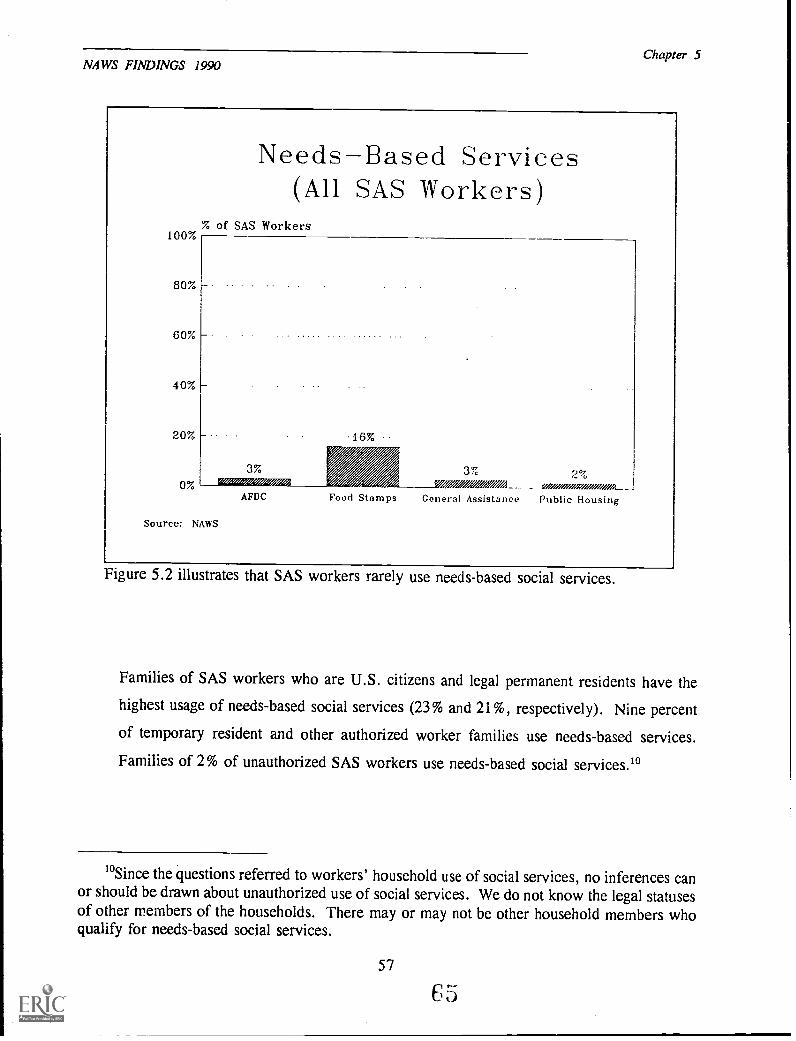
Despite the low levels of income and limited assets of SAS workers, few (18%) SAS
workers report that their households received any type of needs-based assistance from
government operated social service programs during the two years preceding the
interview. The most frequently used social service is Food Stamps, which is used by
almost 16% of SAS worker households.
SAS workers whose households received needs-based government social services within
the last two years can be broken down as follows: Aid to Families with Dependent
Children; (3%), Food Stamps (16%); General Assistance [local welfare] (3%); and public
housing (2%). In some cases, households used more than one service.
56 6 4
NAWS FINDINGS 1990Chapter 5
100%
80%
60%
40%
NeedsBased Services(All SAS Workers)
% of SAS Workers
20% 1.6%
0%
3%://40/47. ///'
Source: NAWS
AFDC Food Stamps
3% 2%. 4_ _
General Assistance Public Housing
Figure 5.2 illustrates that SAS workers rarely use needs-based social services.
Families of SAS workers who are U.S. citizens and legal permanent residents have the
highest usage of needs-based social services (23% and 21%, respectively). Nine percent
of temporary resident and other authorized worker families use needs-based services.
Families of 2% of unauthorized SAS workers use needs-based social services.'
'Since the questions referred to workers' household use of social services, no inferences canor should be drawn about unauthorized use of social services. We do not know the legal statusesof other members of the households. There may or may riot be other household members whoqualify for needs-based social services.
57
NAWS FINDINGS 1990
Chapter 5
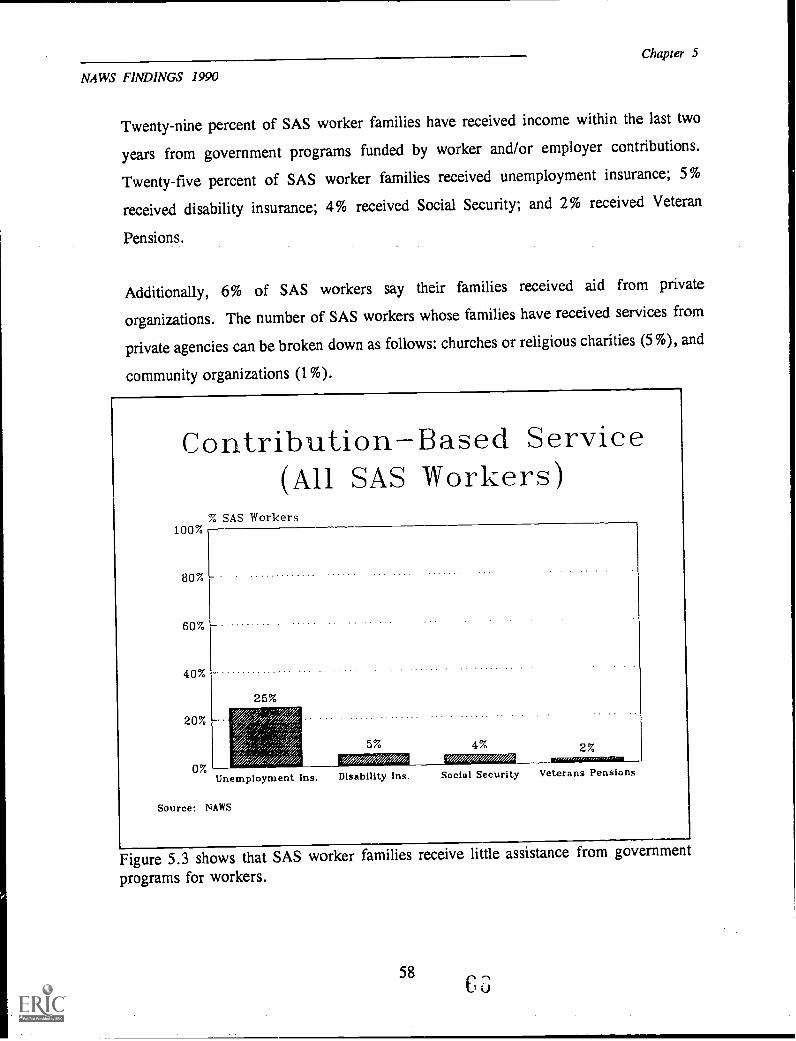
Twenty-nine percent of SAS worker families have received income within the last two
years from government programs funded by worker and/or employer contributions.
Twenty-five percent of SAS worker families received unemployment insurance; 5%
received disability insurance; 4% received Social Security; and 2% received Veteran
Pensions,
Additionally, 6% of SAS workers say their families received aid from private
organizations. The number of SAS workers whose families have received services from
private agencies can be broken down as follows: churches or religious charities (5%), and
community organizations (1%).
ContributionBased Service(All SAS Workers)
% SAS Workers100%
80%
60%
40%
20%
0%
26%
5%
Unemployment Ins. Disability Ins.
Source: NAWS
4%
Social Security
2%
Veterans Pensions
Figure 5.3 shows that SAS worker families receive little assistance from government
programs for workers.
58

SECTION II: EMPLOYMENT PATTERNS AlTD JOBCHARACTERISTICS
NAWS FINDINGS 1990
CHAPTER 6EMPLOYMENT HISTORY AND LABOR SUPPLY
Chapter 6
INTRODUCTION
This chapter reports information on SAS worker employment patterns and their
relationship to working conditions.
SUMMARY OF FINDINGS
SAS workers spend about one-half (49%) of the year doing SAS work.
Most (74%) SAS workers would be willing to do more SAS work, but the majority
(59%) are not willing to migrate in search of additional work.
Most (72%) SAS workers plan to continue doing SAS work indefinitely unless they
become physically unable.
Among those intending to leave SAS work, the most common (38%) reason given is
dissatisfaction with the terms of employment.
In order of decreasing importance, the job factors ranked as important in sustaining
SAS workers' willingness to engage in SAS work are wages, good relations with the
employer, benefits and job stability.
PREVIOUS YEAR'S WORK HISTORY
In order to qualify for the NAWS, all workers had to have been employed in a SAS job
at the time of the interview, and hence, at some time in the year before the interview. in
611 3
NAWS FINDINGS 1990Chapter 6
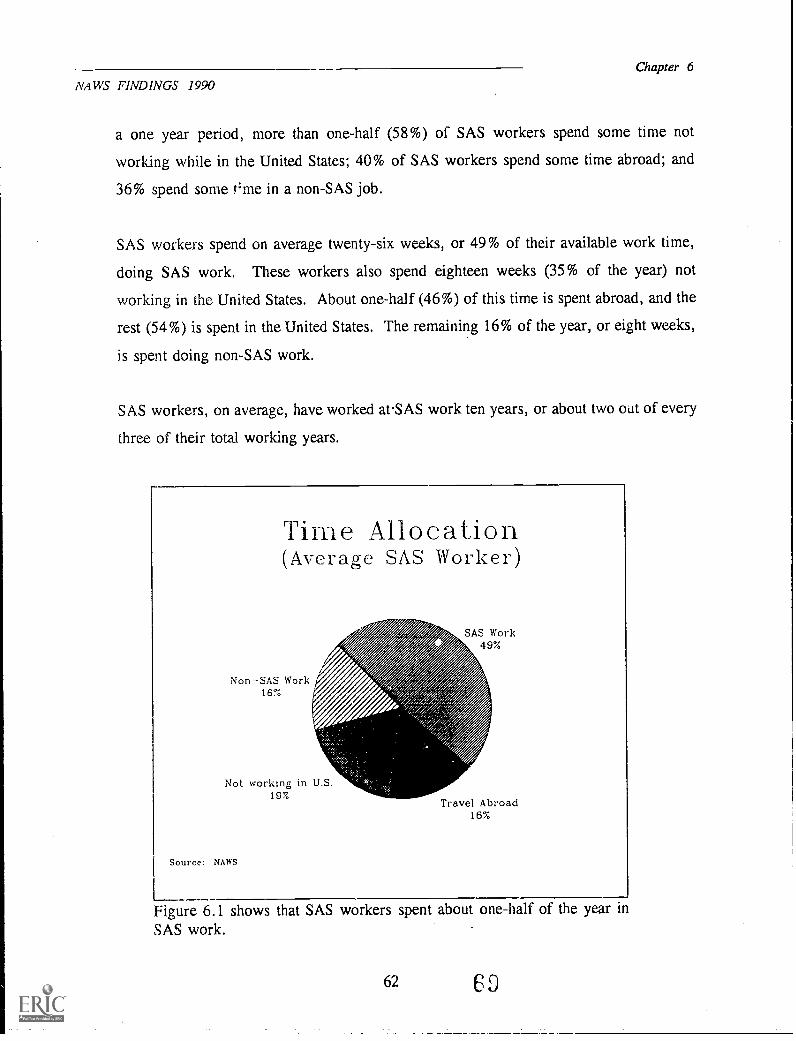
a one year period, more than one-half (58%) of SAS workers spend some time not
working while in the United States; 40% of SAS workers spend some time abroad; and
36% spend some t'rne in a non-SAS job.
SAS workers spend on average twenty-six weeks, or 49% of their available work time,
doing SAS work. These workers also spend eighteen weeks (35% of the year) not
working in the United States. About one-half (46%) of this time is spent abroad, and the
rest (54%) is spent in the United States. The remaining 16% of the year, or eight weeks,
is spent doing non-SAS work.
SAS workers, on average, have worked at-SAS work ten years, or about two oat of every
three of their total working years.
Time Allocation(Average SAS Worker)
Non-SAS Work16%
SAS Work49%
Not working in U.S.19%
Source: NAWS
Travel Abroad16%
Figure 6.1 shows that SAS workers spent about one-half of the year inSAS work.
62 60
NAWS FINDINGS 1990
WILLINGNESS TO DO SAS WORK
Chapter 6
Almost three-quarters (74%) of the SAS work force would do more SAS work during the
year, were it available. Most (72%) SAS workers plan to continue in SAS work for at
least five years, providing that they remain physically able. Twelve percent expect to
leave field work within one year; 10% expect to leave within three years; and 6% expect
to leave within five years.
Forty percent of SAS workers who say they expect to leave SAS work within une year cite
dissatisfaction with the terms of employment as their reason for wanting to leave.
Twenty-one percent are dissatisfied with the working conditions, 12% are dissatisfied with
the pay, and 7% are dissatisfied with the benefits. An additional 34% of SAS workers
expect to leave SAS work within one year because they wish to do some other kind of
work. Another 9% expect to leave because they dislike the seasonal nature of the work.
The remaining 17% have other reasons for wanting to leave SAS work.
Of SAS workers desiring to leave SAS work within one year, 20% would seek
employment in construction. Manufacturing work is the choice of 13% of SAS laborers
who want to leave within a year; maintenance and mechanical work is preferred by 12%;
and clerical, health or professional work is preferred by 13%.
TRANSPORTATION TO WORK
Transportation to work is an important issue since fewer than one-half of SAS workers
own a car. Twelve percent of SAS workers are charged by their employers for rides.
Five times more workers employed by farm labor contractors (30%) report this practice
than workers employed by growers (6%).
63 7
NAWS FINDINGS 1990Chapter 6
Driving is the most popular means of getting to work for those who have access to a
vehicle. However, more workers say they drive to work (45%) than own a vehicle
(42%), implying that some workers drive vehicles of friends or relatives.
Over one-half (55%) of SAS workers do not drive a car or truck to work. One-third
(33%) ride with others, 11% ride a labor bus, 8% walk, and the remaining 3% take other
forms of transportation.
MIGRATION AND LABOR AVAILABILITY
Most (58%) SAS workers say they are not willing to travel more than commuting distance
from home to secure work. However, a sizable minority (41%) say they would be willing
to travel in search of work. This consists of 2% of SAS workers willing to stay away
from home overnight; another 15% willing to relocate temporarily; and another 24%
willing to move permanently.
IMPORTANCE OF WAGES AND WORKING CONDITIONS TO LABOR SUPPLY
SAS workers were asked to indicate whether various factors were very important,
somewhat important, or not important to their willingness to continue doing SAS work.
Most (82%) SAS workers consider higher wages very important. Those working for
contractors consider them very important more often than those who work directly for
growers (95% vs. 79%).
Good employer relations are very important to 79% of SAS workers. Ninety-three percent
of those working for contractors find this issue very important, compared to 76% of those
hired directly.
64 .t.
NAWS FINDINGS 1990Chapter 6
Seventy-nine percent of SAS workers regard improved benefits as very important. Ninety
percent of those working for farm labor contractors consider this issue very important,
compared to 68% of those who work directly for the grower.
Seventy-two percent of SAS workers consider employer commitment to a certain minimum
amount of work very important. Ninety-two percent of those working for farm labor
contractors find this issue very important while 71% of those hired directly find it very
important.
Fifty-seven percent of SAS workers regard better job information as very important.
Those working for farm labor contractors consider it very important more often (84%)
than those who work directly for growers (51%).
In addition, the majority of SAS workers report that free or low cost housing, paid
transportation to work, child care and employer provided meals are somewhat important.
65 1..) r%i 4;
NAWS FINDINGS 1990
CHAPTER 7SAS EMPLOYMENT
INTRODUCTION
Chapter 7
This chapter reports information on the characteristics of SAS jobs. It covers crop, task,
wages, hours per week, benefits, and working conditions.
SUMMARY OF FINDINGS
Almost one-half (49%) of SAS workers perform harvest work.
Three-quarters (75%) of SAS workers work in fruits, nuts or vegetables.
More than three-quarters (77%) of SAS workers are employed directly by producers
or packing houses.
SAS laborers work an average of 37 hours per week, are usually (71%) paid by the
hour and most often (51%) earn $4.85 or less per hour.
SAS workers are usually not covered by Unemployment Insurance (53%), Worker's
Compensation (59%), or health insurance (79%).
Almost one-quarter (24%) of SAS workers do not have access to water for washing at
the work site. Twelve percent do not have access to drinking water and twelve percent
do not have access to toilets.
67
73
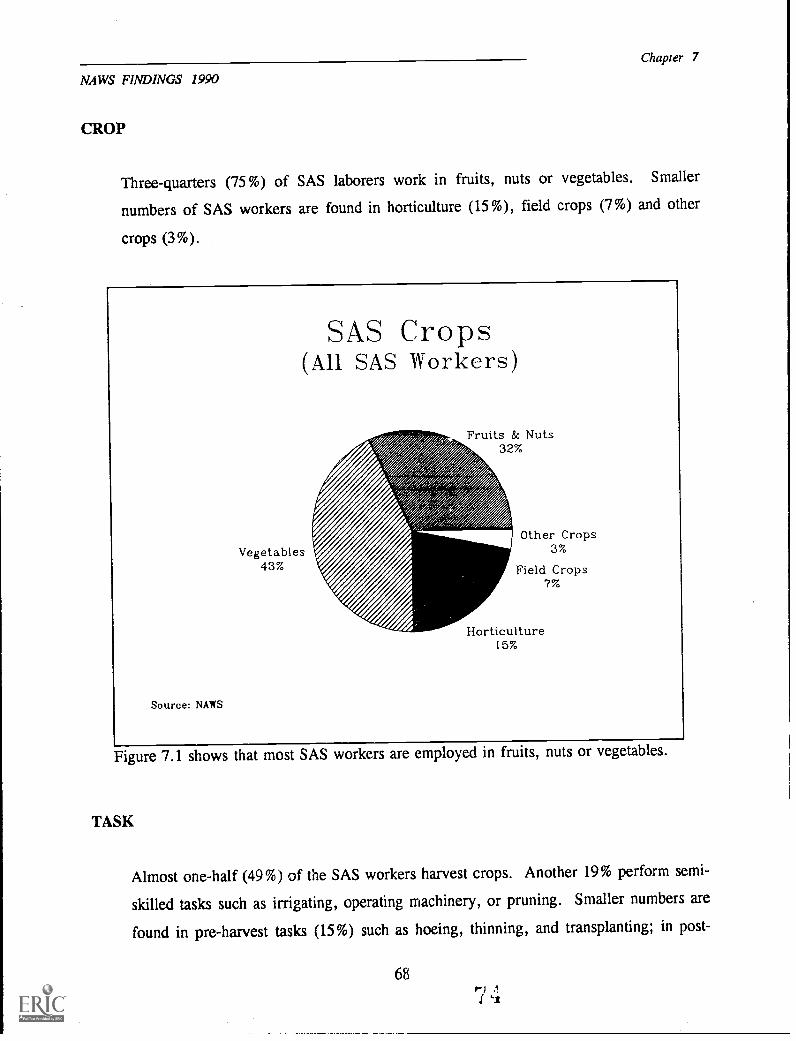
NAWS FINDINGS 1990
CROP
Chapter 7
Three-quarters (75%) of SAS laborers work in fruits, nuts or vegetables. Smaller
numbers of SAS workers are found in horticulture (15%), field crops (7%) and other
crops (3%).
Source: NAWS
Vegetables43%
SAS Crops(All SAS Workers)
Fruits & Nuts32%
Other Crops3%
Field Crops7%
Horticulture15%
Figure 7.1 shows that most SAS workers are employed in fruits, nuts or vegetables.
TASK
Almost one-half (49%) of the SAS workers harvest crops. Another 19% perform semi-
skilled tasks such as irrigating, operating machinery, or pruning. Smaller numbers are
found in pre-harvest tasks (15%) such as hoeing, thinning, and transplanting; in post-
68
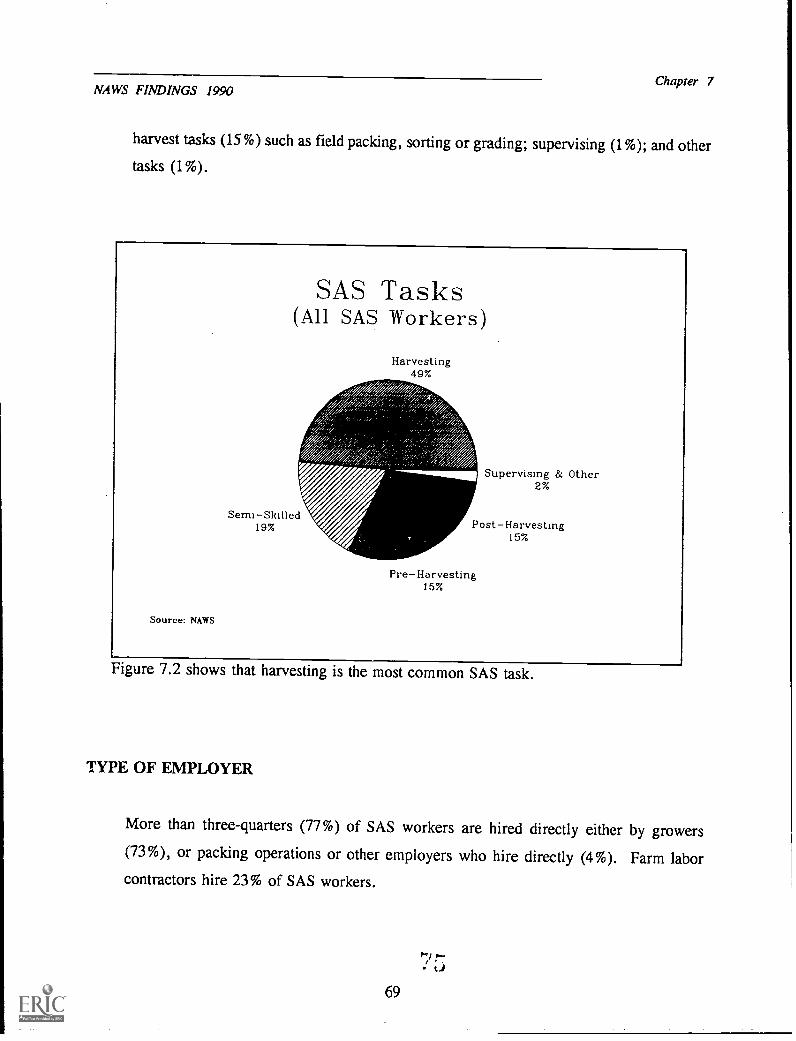
MAWS FINDINGS 1990Chapter 7
harvest tasks (15%) such as field packing, sorting or grading; supervising (1%); and othertasks (1%).
Figure 7.2 shows that harvesting is the most common SAS task.
TYPE OF EMPLOYER
More than three-quarters (77%) of SAS workers are hired directly either by growers(73%), or packing operations or other employers who hire directly (4%). Farm labor
contractors hire 23% of SAS workers.
69
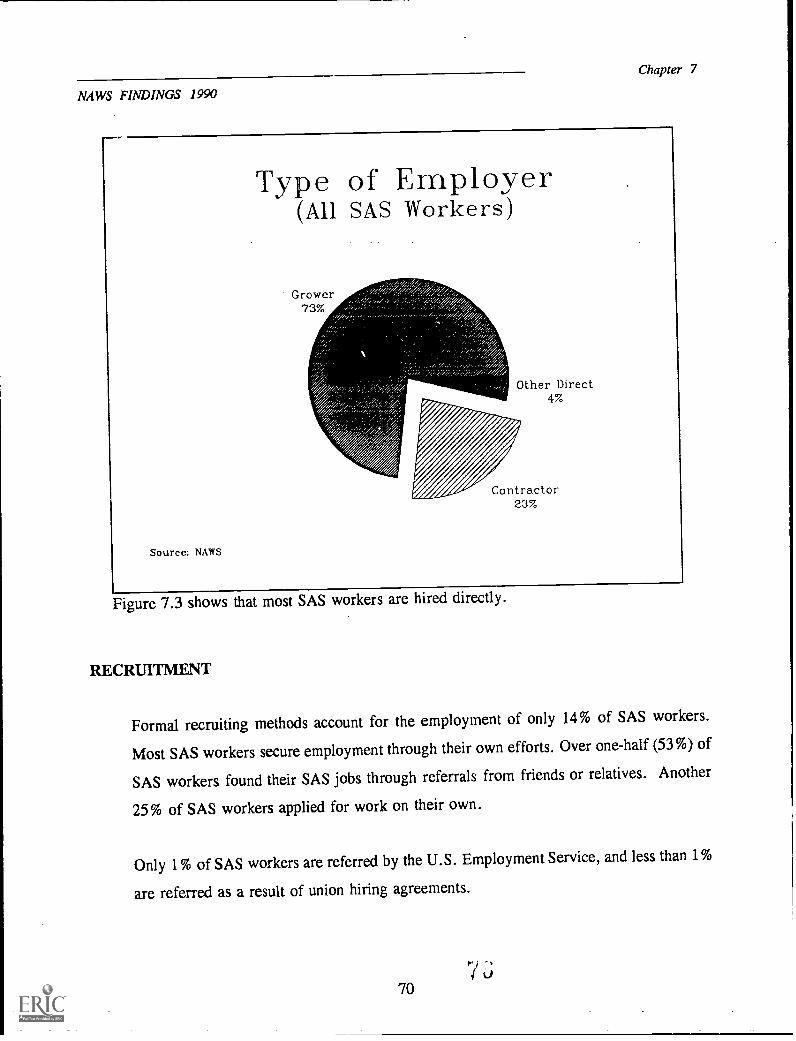
NAWS FINDINGS 1990
Chapter 7
Figure 7.3 shows that most SAS workers are hired directly.
RECRUITMENT
Formal recruiting methods account for the employment of only 14% of SAS workers.
Most SAS workers secure employment through their own efforts. Over one-half (53%) of
SAS workers found their SAS jobs through referrals from friends or relatives. Another
25% of SAS workers applied for work on their own.
Only 1% of SAS workers are referred by the U.S. Employment Service, and less than 1%
are referred as a result of union hiring agreements.
;
I 070

NAWS FINDINGS 1990Chapter 7
Employers play a more active role in retaining workers than they do in initial recruitment.
While only 14% of SAS workers are actively recruited by their employers, 42% report
that their employers have a worker retention program. Confining responses to the 64%of SAS workers who are regularly laid off at the end of the season, 66% are employed
by growers with active worker retention programs.
Among workers who are regularly laid off at the end of the season, the typical means of
encouraging worker retention include talking with the workers at the end of each season
(17%); writing to the worker (5 %); telephoning the worker (33%); and having someone
else contact the worker (16%). Some growers employ more than one method.
WAGES
Often SAS workers perform more than one task for the same employer. Accordingly,
information on wages and method of payment was collected on the most important task
the worker was engaged in during the week prior to the interview. The median wage forthis is $4.85/hour.
Those who work with fruits and nuts have a higher median wage ($5.25/hr) than those
who work with other crops ($4.40/hr).
SAS workers are paid in one of three ways: by the hour, by the piece (in which pay is
directly related to productivity), or in some combination of the two. Seventy-one percent
of SAS workers are paid by the hour, 28% by the piece and 1% in some combination.
Different types of workers are paid in different ways. Fifty-five percent of harvesters are
paid by the piece compared to 11% of post-harvest workers, 6% of pre-harvest workers
and 6% of semi-skilled laborers. Similarly, work in some crops is more likely to be paid
by the piece. Over one-third of SAS workers in fruits and nuts, and vegetables (37% and
35%, respectively) are paid by the piece. Horticulture workers (9%) and field crop
71 '1'1
NAWS FINDINGS 1990
Chapter 7
workers (1%) rarely are paid by the piece. Workers hired by farm labor contractors are
more likely to be paid by the piece (37%) than those hired by growers (25%).
Piece rate workers are less likely to receive benefits than workers paid by the hour. Forty-
nine percent of workers who are paid by the hour report that they are covered by
Worker's Compensation compared to 24% of those paid by the piece. Similarly, workers
paid by the hour are more likely to be covered by Unemployment Insurance (56%) than
workers who are paid by the piece (41%).
Undocumented workers more often are paid by the piece (45%) than documented workers
(33%). Of all the legal statuses, American citizens are the least likely to be paid by the
piece (12%).
HOURS
A week of SAS work is, on the average, thirty-seven hours long.
BONUSES
Paying cash bonuses does not appear to be standard procedure for either farm labor
contractors or agricultural producers. Bonuses are given to one-fourth (25%) of SAS
workers. Of workers who receive bonuses, 4% receive bonuses dependent on grower
profit; 39% receive end-of-season bonuses; 15% receive incentive bonuses; 33% receive
holiday bonuses; and 11% receive other types of bonuses. Some SAS workers receive
more than one type of bonus.
72
NAWS FINDINGS 1990
BENEFITS
Chapter 7
The NAWS asked SAS workers what benefits they were aware of receiving at their job.In some cases, SAS workers are entitled to benefits (particularly state mandated benefits)of which they may not be conscious and, therefore, are unlikely to claim.
Forty-seven percent of SAS workers report being covered by Unemployment Insurance.Forty-one percent of workers hired by farm labor contractors and 49% percent of thoseworkers hired directly are covered by Unemployment Insurance.
Forty-one percent of SAS workers report being covered by Worker's Compensation.
Twenty-seven percent of employees who work for farm labor contractors are coveredwhile 46% of those hired directly are covered.
In addition to state mandated benefits, 21% of SAS workers are covered by off-the-jobhealth insurance. Workers who are hired directly are over four times more likely toreceive health insurance than workers hired by farm labor contractors (26% versus 6%).SAS workers receive paid vacations 13% of the time. Growers' employees receive paidvacations more often than farm labor contractors' employees (16% vs. 2%).
Twenty-eight percent of SAS workers live in employer provided housing. Twenty-onepercent of SAS workers are furnished with employer-owned housing free of charge. Only2% of SAS workers are provided free housing for their families, the remaining 5% paytheir employers for family housing. In contrast to the pattern for other benefits,employees of farm labor contractors are more likely to live in housing provided by their
employer than are workers employed by agricultural producers (40% vs. 24%).
73 9
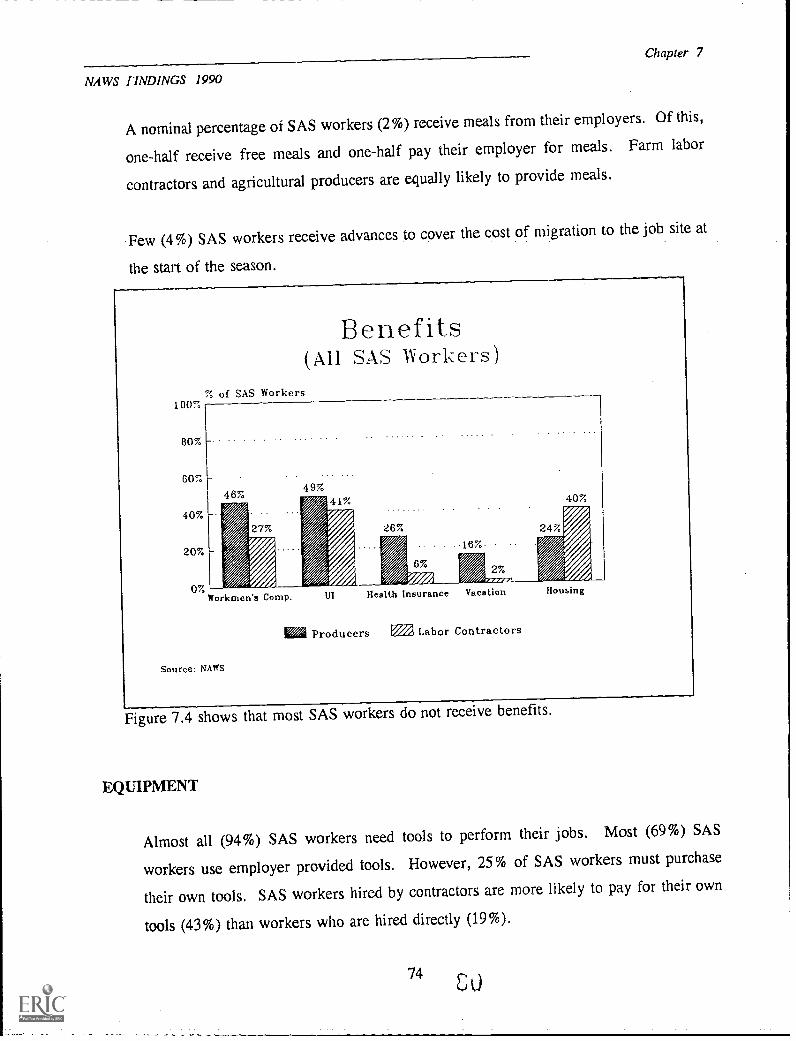
NAWS FINDINGS 1990
Chapter 7
A nominal percentage oi SAS workers (2%) receive meals from their employers. Of this,
one-half receive free meals and one-half pay their employer for meals. Farm labor
contractors and agricultural producers are equally likely to provide meals.
Few (4%) SAS workers receive advances to cover the cost of migration to the job site at
the start of the season.
1.00%
80%
60%
40%
20%
0%
Benefits(All SAS Workers)
% of SAS Workers
Workmen's Comp.
Source: NAWS
UI Health Insurance Vacation
Ira Producers F2a1 Labor Contractors
Housing
Figure 7.4 shows that most SAS workers do not receive benefits.
EQUIPMENT
Almost all (94%) SAS workers need tools to perform their jobs. Most (69%) SAS
workers use employer provided tools. However, 25% of SAS workers must purchase
their own tools. SAS workers hired by contractors are more likely to pay for their own
tools (43%) than workers who are hired directly (19%).
74
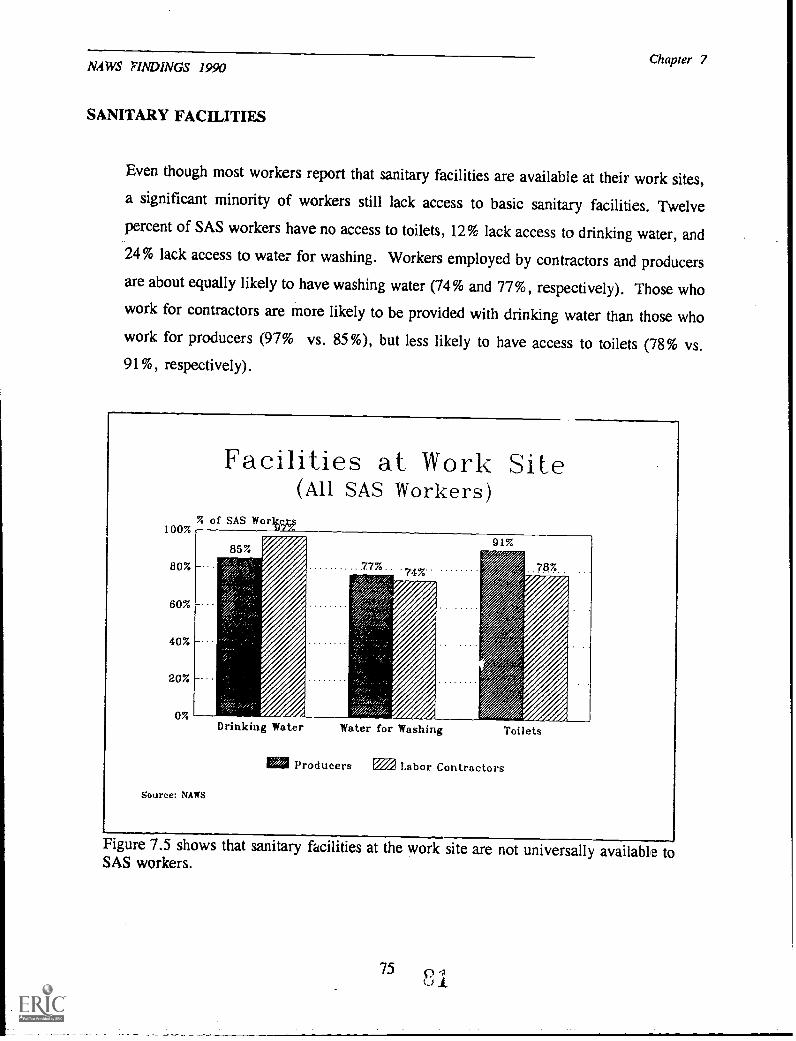
NAWS FINDINGS 1990
SANITARY FACILITIES
Chapter 7
Even though most workers report that sanitary facilities are available at their work sites,a significant minority of workers still lack access to basic sanitary facilities. Twelve
percent of SAS workers have no access to toilets, 12% lack access to drinking water, and24% lack access to water for washing. Workers employed by contractors and producersare about equally likely to have washing water (74% and 77%, respectively). Those whowork for contractors are more likely to be provided with drinking water than those whowork for producers (97% vs. 85%), but less likely to have access to toilets (78% vs.91%, respectively).
100%
80%
60%
40%
20%
0%
Facilities at Work Site(All SAS Workers)
% of SAS Worim
Source: NAWS
Drinking Water Water for Washing Toilets
Producers IM Labor Contractors
Figure 7.5 shows that sanitary facilities at the work site are not universally available toSAS workers.
75
NAWS FINDINGS 1990
CHAPTER 8NON-SAS EMPLOYMENT
INTRODUCTION
Chapter 8
This chapter reviews SAS worker experience in non-SAS work. It covers time spent in non-SAS
employment, characteristics of SAS workers who perform non-SAS work, non-SAS wages, areas
of non-SAS work and SAS worker attitude toward non-SAS work.
SUMMARY OF FINDINGS
The ay.:rage SAS worker spends between one and two months per year performing non-
SAS labor.
About one in three (36%) SAS workers performs non-SAS labor during a one-year
period.
The majority (61%) of SAS workers who perform non-SAS labor do this for fewer than
four months out of the year.
The median wage SAS workers receive for non-SAS labor is $4.50/hr.
Most (74%) SAS workers who perform non-SAS work do it in the area of agricultural
work, services, construction, mechanics, food service and manufacturing.
It appears that many SAS workers who perform non-SAS labor prefer it to SAS labor.
77
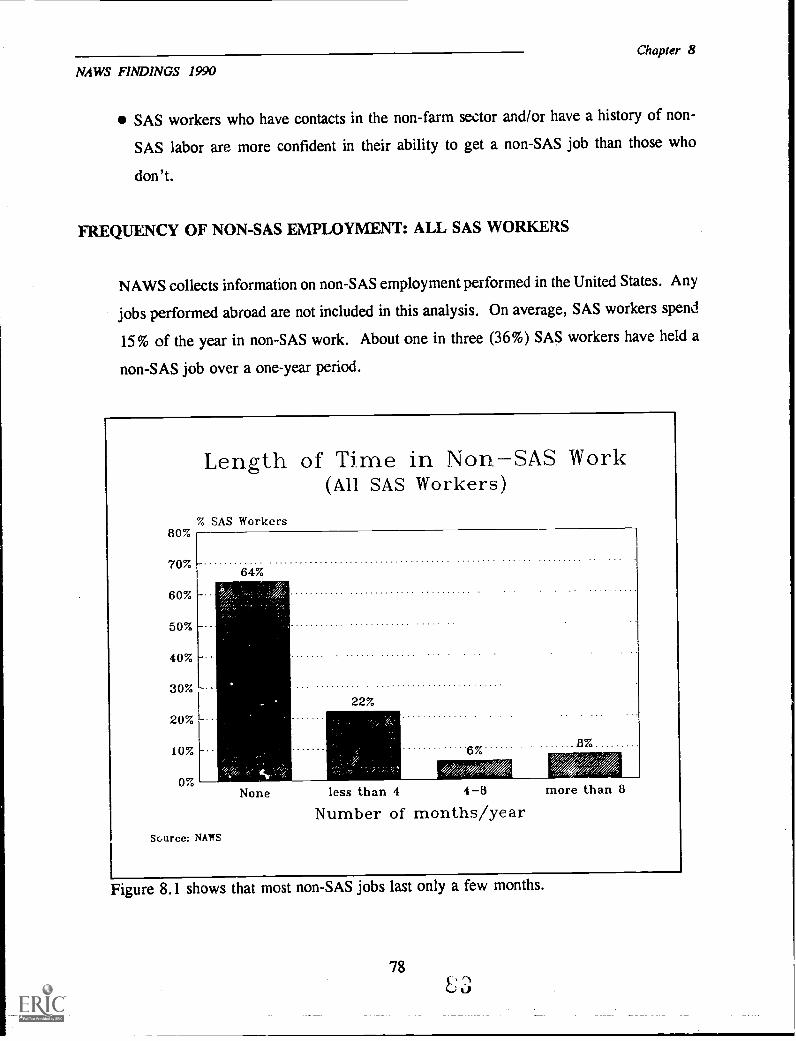
NAWS FINDINGS 1990
Chapter 8
SAS workers who have contacts in the non-farm sector and/or have a history of non-
SAS labor are more confident in their ability to get a non-SAS job than those who
don't.
FREQUENCY OF NON-SAS EMPLOYMENT: ALL SAS WORKERS
NAWS collects information on non-SAS employmentperformed in the United States. Any
jobs performed abroad are not included in this analysis. On average, SAS workers spend
15% of the year in non-SAS work. About one in three (36%) SAS workers have held a
non-SAS job over a one-year period.
Figure 8.1 shows that most non-SAS jobs last only a few months.
78L 3
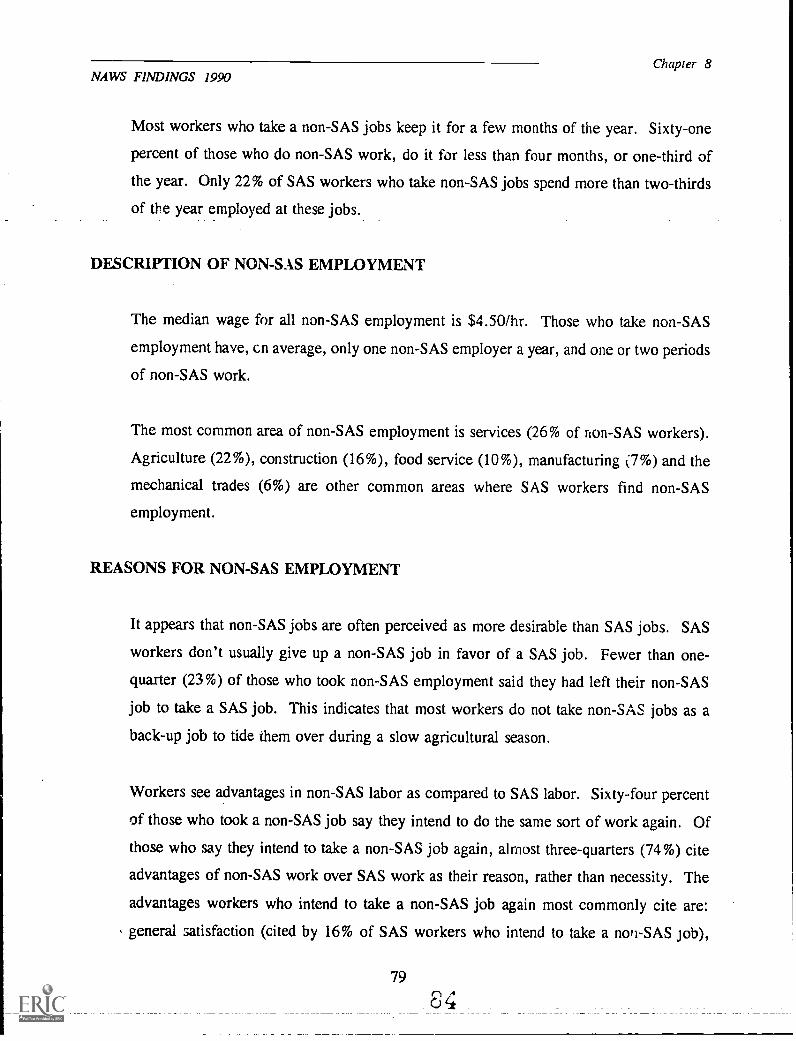
NAWS FINDINGS 1990Chapter 8
Most workers who take a non-SAS jobs keep it for a few months of the year. Sixty-one
percent of those who do non-SAS work, do it for less than four months, or one-third of
the year. Only 22% of SAS workers who take non-SAS jobs spend more than two-thirds
of the year employed at these jobs.
DESCRIPTION OF NON-SAS EMPLOYMENT
The median wage for all non-SAS employment is $4.50/hr. Those who take non-SAS
employment have, cn average, only one non-SAS employer a year, and one or two periods
of non-SAS work.
The most common area of non-SAS employment is services (26% of non-SAS workers).
Agriculture (22%), construction (16%), food service (10%), manufacturing (7%) and the
mechanical trades (6%) are other common areas where SAS workers find non-SAS
employment.
REASONS FOR NON-SAS EMPLOYMENT
It appears that non-SAS jobs are often perceived as more desirable than SAS jobs. SAS
workers don't usually give up a non-SAS job in favor of a SAS job. Fewer than one-
quarter (23%) of those who took non-SAS employment said they had left their non-SAS
job to take a SAS job. This indicates that most workers do not take non-SAS jobs as a
back-up job to tide them over during a slow agricultural season.
Workers see advantages in non-SAS labor as compared to SAS labor. Sixty-four percent
of those who took a non-SAS job say they intend to do the same sort of work again. Of
those who say they intend to take a non-SAS job again, almost three-quarters (74%) cite
advantages of non-SAS work over SAS work as their reason, rather than necessity. The
advantages workers who intend to take a non-SAS job again most commonly cite are:
general satisfaction (cited by 16% of SAS workers who intend to take a non-SAS job),
79
84

NAWS FINDINGS 1990
Chapter 8
Non-SAS Employment(SAS Workers Who Took NonSAS Work)
Services 26%
Construction 16%
Source: NAWS
Agricultural 22%
Other 13%
Mechanical 67 Factory 7%Food Service 10%
Figure 8.2 shows that non-SAS employment is concentrated in a few sectors.
higher pay (13%), and more stable employment (10%).
Workers most commonly leave non-SAS jobs due to circumstances beyond their immediate
control. Over one-third (37%) leave their non-SAS jobs because of employer actions, i.e.
they are either laid off or fired. The remaining workers leave due to non-job related
factors, such as a move or family responsibilities.
FAMILIARITY WITH NON-SAS WORK
Those with recent employment in a non-SAS sector and those with contacts in non-SAS
jobs appear to be more capable of getting a non-SAS job. Eighty-one percent of those
who have had a non-SAS job say they could get a non-SAS job within one month while
80
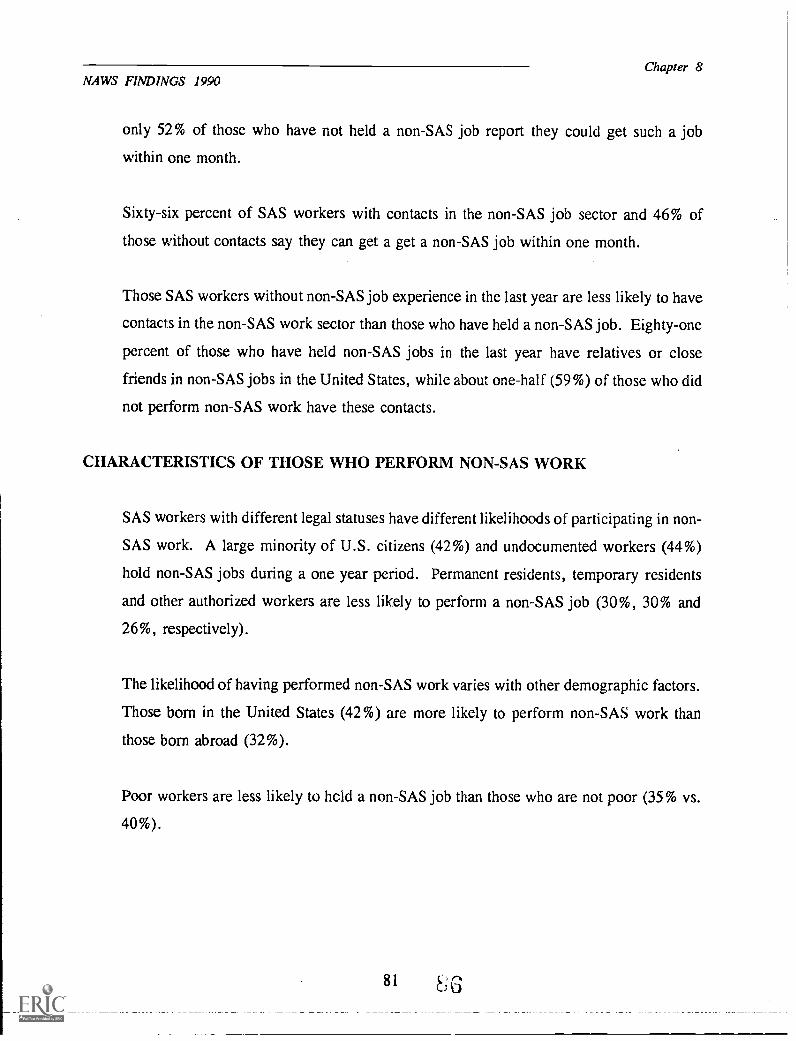
NAWS FINDINGS 1990Chapter 8
only 52% of those who have not held a non-SAS job report they could get such a job
within one month.
Sixty-six percent of SAS workers with contacts in the non-SAS job sector and 46% of
those without contacts say they can get a get a non-SAS job within one month.
Those SAS workers without non-SAS job experience in the last year are less likely to have
contacts in the non-SAS work sector than those who have held a non-SAS job. Eighty-one
percent of those who have held non-SAS jobs in the last year have relatives or close
friends in non-SAS jobs in the United States, while about one-half (59%) of those who did
not perform non-SAS work have these contacts.
CHARACTERISTICS OF THOSE WHO PERFORM NON-SAS WORK
SAS workers with different legal statuses have different likelihoods of participating in non-
SAS work. A large minority of U.S. citizens (42%) and undocumented workers (44%)
hold non-SAS jobs during a one year period. Permanent residents, temporary residents
and other authorized workers are less likely to perform a non-SAS job (30%, 30% and
26%, respectively).
The likelihood of having performed non-SAS work varies with other demographic factors.
Those born in the United States (42%) are more likely to perform non-SAS work than
those born abroad (32%).
Poor workers are less likely to held a non-SAS job than those who are not poor (35% vs.
40%).
81
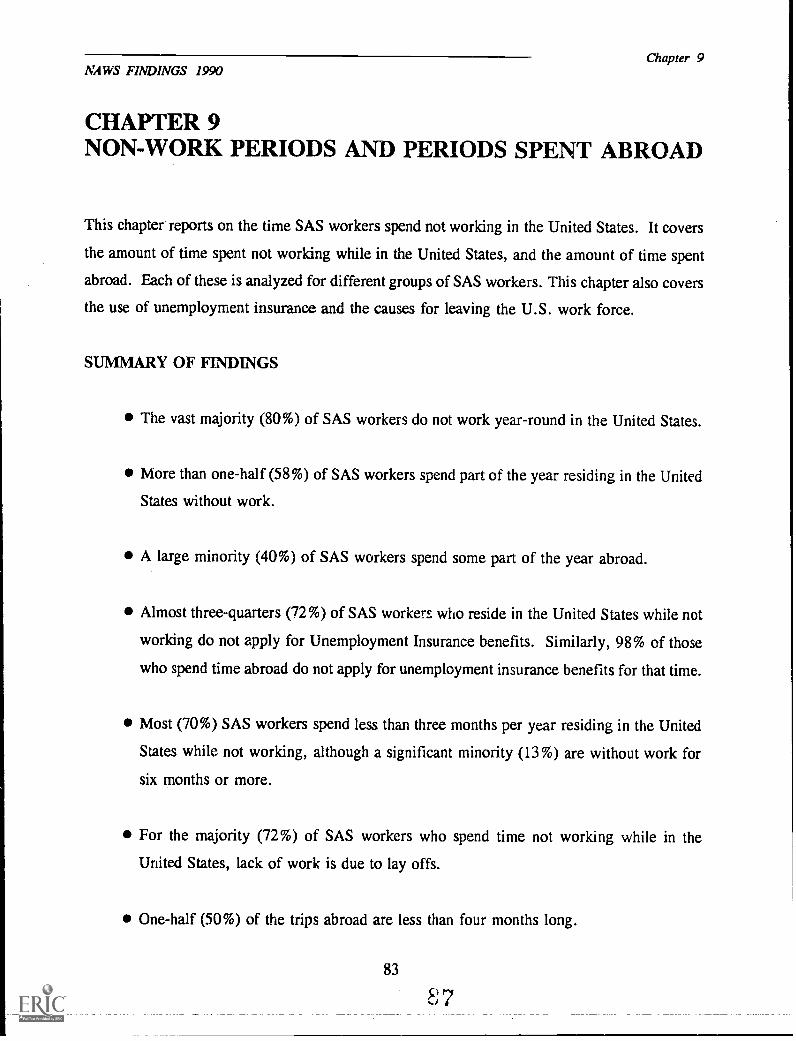
NAWS FINDINGS 1990Chapter 9
CHAPTER 9NON-WORK PERIODS AND PERIODS SPENT ABROAD
This chapter reports on the time SAS workers spend not working in the United States. It covers
the amount of time spent not working while in the United States, and the amount of time spent
abroad. Each of these is analyzed for different groups of SAS workers. This chapter also covers
the use of unemployment insurance and the causes for leaving the U.S. work force.
SIJMMARY OF FINDINGS
The vast majority (80%) of SAS workers do not work year-round in the United States.
More than one-half (58%) of SAS workers spend part of the year residing in the United
States without work.
A large minority (40%) of SAS workers spend some part of the year abroad.
Almost three-quarters (72%) of SAS workers who reside in the United States while not
working do not apply for Unemployment Insurance benefits. Similarly, 98% of those
who spend time abroad do not apply for unemployment insurance benefits for that time.
Most (70%) SAS workers spend less than three months per year residing in the United
States while not working, although a significant minority (13%) are without work for
six months or more.
For the majority (72%) of SAS workers who spend time not working while in the
United States, lack of work is due to lay offs.
One-half (50%) of the trips abroad are less than four months long.
83
S 7
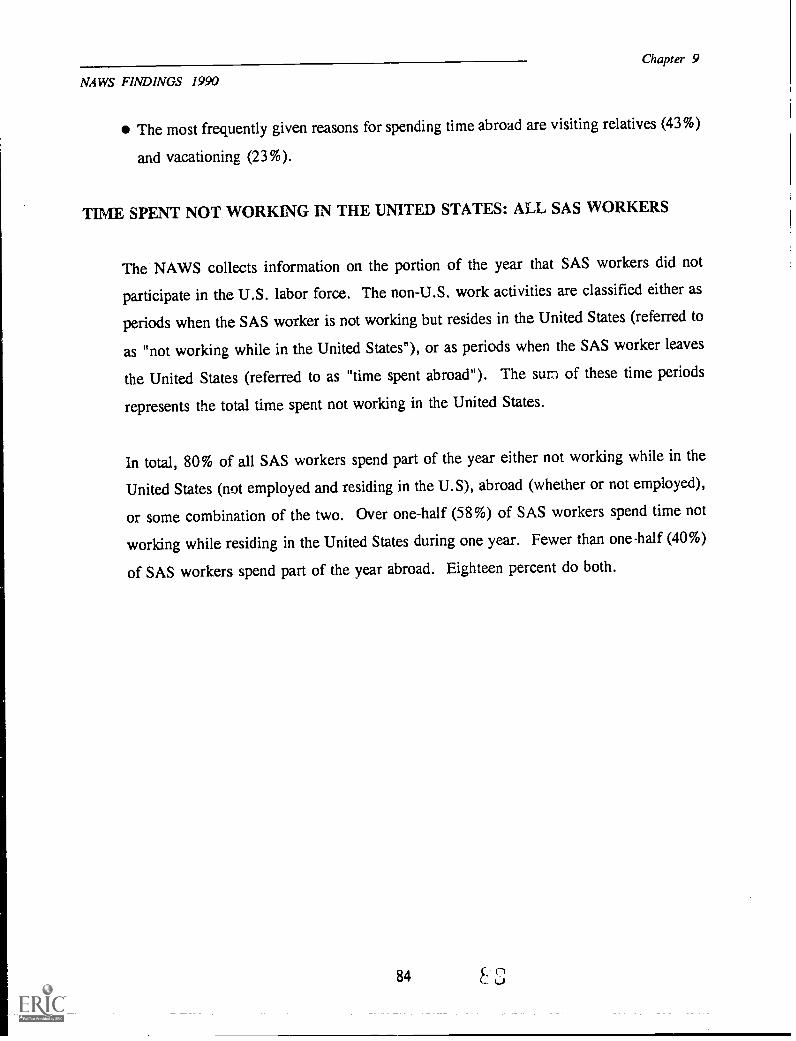
NAWS FINDINGS 1990
Chapter 9
The most frequently given reasons for spending time abroad are visiting relatives (43%)
and vacationing (23%).
TIME SPENT NOT WORKING IN THE UNITED STATES: ALL SAS WORKERS
The NAWS collects information on the portion of the year that SAS workers did not
participate in the U.S. labor force. The non-U.S. work activities are classified either as
periods when the SAS worker is not working but resides in the United States (referred to
as "not working while in the United States"), or as periods when the SAS worker leaves
the United States (referred to as "time spent abroad"). The sum of these time periods
represents the total time spent not working in the United States.
In total, 80% of all SAS workers spend part of the year either not working while in the
United States (not employed and residing in the U.S), abroad (whether or not employed),
or some combination of the two. Over one-half (58%) of SAS workers spend time not
working while residing in the United States during one year. Fewer than one-half (40%)
of SAS workers spend part of the year abroad. Eighteen percent do both.
84
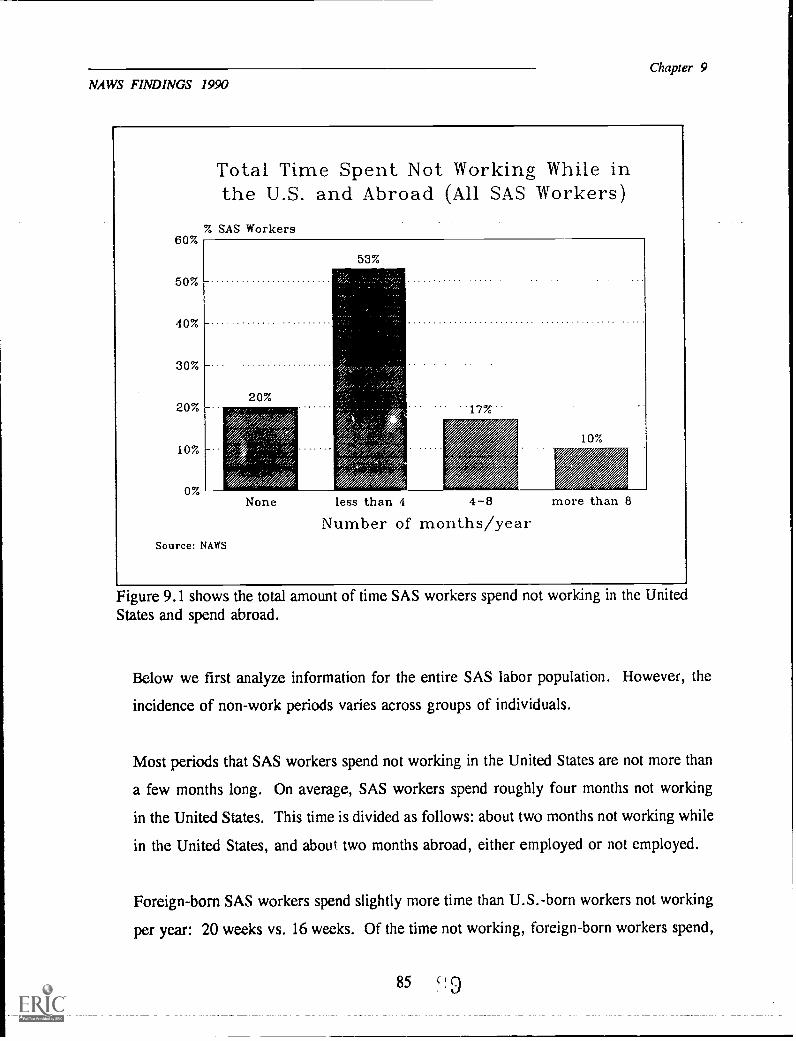
NAWS FINDINGS 1990Chapter 9
60%
50%
40%
30%
20%
10%
0%
Total Time Spent Not Working While inthe U.S. and Abroad (All SAS Workers)
% SAS Workers
53%
None
Source: NAWS
less than 4
10%
4-8Number of months/year
more than 8
Figure 9.1 shows the total amount of time SAS workers spend not working in the UnitedStates and spend abroad.
Below we first analyze information for the entire SAS labor population. However, the
incidence of non-work periods varies across groups of individuals.
Most periods that SAS workers spend not working in the United States are not more than
a few months long. On average, SAS workers spend roughly four months not working
in the United States. This time is divided as follows: about two months not working while
in the United States, and about two months abroad, either employed or not employed.
Foreign-born SAS workers spend slightly more time than U.S.-born workers not working
per year: 20 weeks vs. 16 weeks. Of the time not working, foreign-born workers spend,
85 c-!
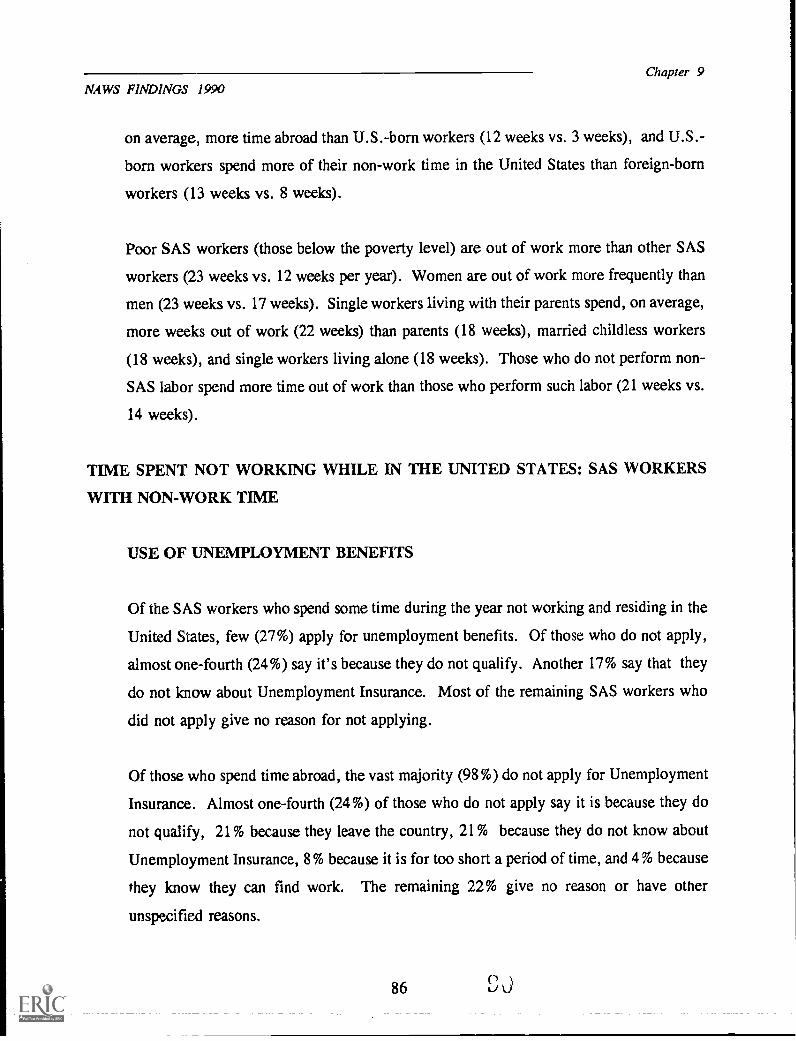
NAWS FINDINGS 1990Chapter 9
on average, more time abroad than U.S.-born workers (12 weeks vs. 3 weeks), and U.S.-
born workers spend more of their non-work time in the United States than foreign-born
workers (13 weeks vs. 8 weeks).
Poor SAS workers (those below the poverty level) are out of work more than other SAS
workers (23 weeks vs. 12 weeks per year). Women are out of work more frequently than
men (23 weeks vs. 17 weeks). Single workers living with their parents spend, on average,
more weeks out of work (22 weeks) than parents (18 weeks), married childless workers
(18 weeks), and single workers living alone (18 weeks). Those who do not perform non-
SAS labor spend more time out of work than those who perform such labor (21 weeks vs.
14 weeks).
TIME SPENT NOT WORKING WHILE IN ME UNITED STATES: SAS WORKERS
WITH NON-WORK TIME
USE OF UNEMPLOYMENT BENEFITS
Of the SAS workers who spend some time during the year not working and residing in the
United States, few (27%) apply for unemployment benefits. Of those who do not apply,
almost one-fourth (24%) say it's because they do not qualify. Another 17% say that they
do not know about Unemployment Insurance. Most of the remaining SAS workers who
did not apply give no reason for not applying.
Of those who spend time abroad, the vast majority (98%) do not apply for Unemployment
Insurance. Almost one-fourth (24%) of those who do not apply say it is because they do
not qualify, 21% because they leave the country, 21% because they do not know about
Unemployment Insurance, 8% because it is for too short a period of time, and 4% because
they know they can find work. The remaining 22% give no reason or have other
unspecified reasons.
86
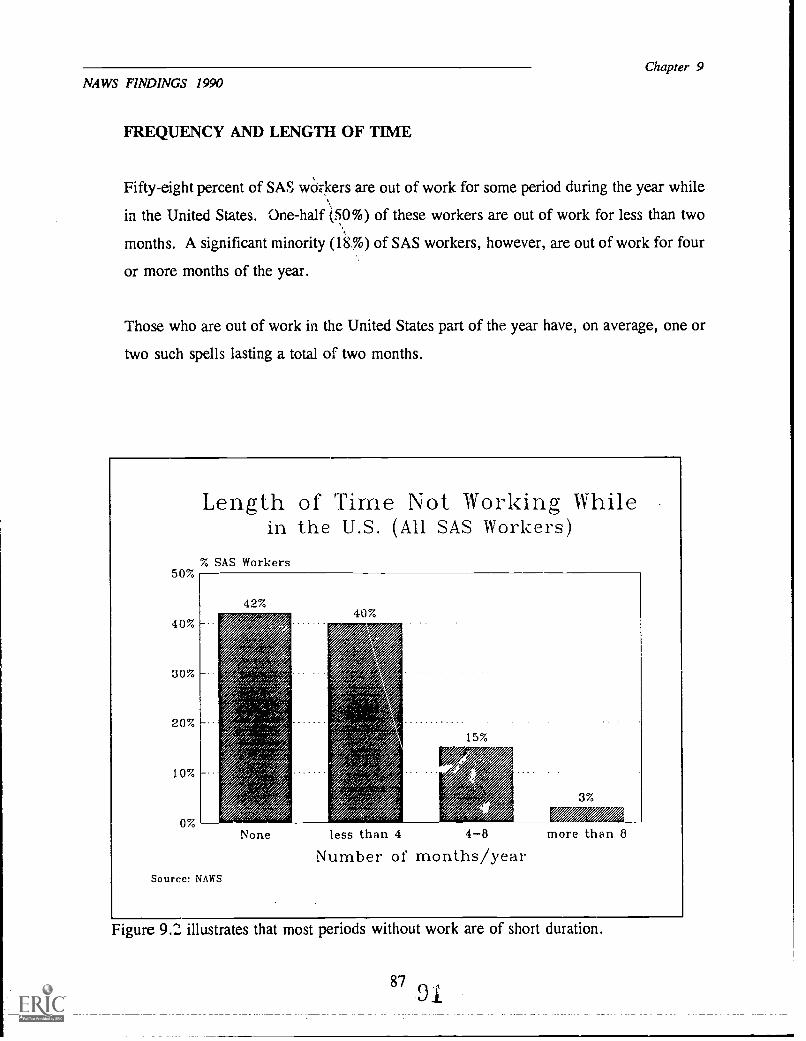
NAWS FINDINGS 1990
FREQUENCY AND LENGTH OF TIME
Chapter 9
Fifty-eight percent of SAS wCirkers are out of work for some period during the year while
in the United States. One-half (50%) of these workers are out of work for less than two
months. A significant minority (18%) of SAS workers, however, are out of work for four
or more months of the year.
Those who are out of work in the United States part of the year have, on average, one or
two such spells lasting a total of two months.
Length of Time Not Working Whilein the U.S. (All SAS Workers)
Figure 9.2 illustrates that most periods without work are of short duration.
8791
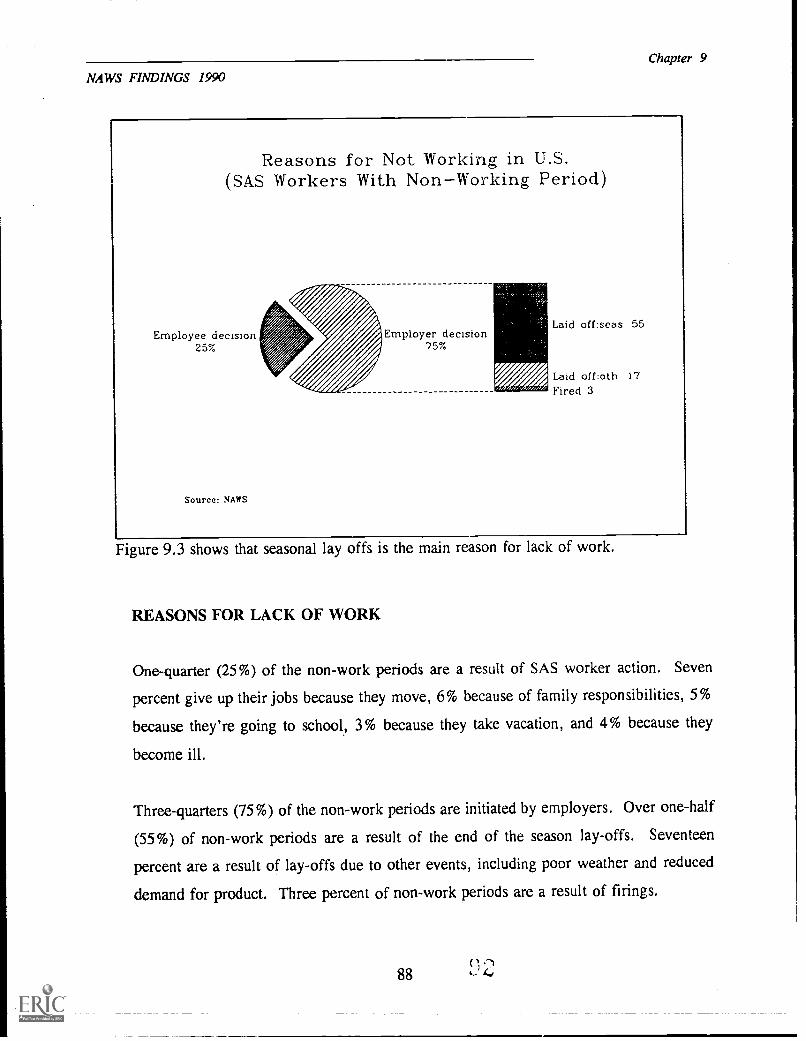
NAWS FINDINGS 1990
Chapter 9
Reasons for Not Working in U.S.(SAS Workers With NonWorking Period)
Employee decision25%
Source: NAWS
Employer decision75%
Laid off:seas 55
Laid off:oth. 17Fired 3
Figure 9.3 shows that seasonal lay offs is the main reason for lack of work.
REASONS FOR LACK OF WORK
One-quarter (25%) of the non-work periods are a result of SAS worker action. Seven
percent give up their jobs because they move, 6% because of family responsibilities, 5%
because they're going to school, 3% because they take vacation, and 4% because they
become ill.
Three-quarters (75%) of the non-work periods are initiated by employers. Over one-half
(55%) of non-work periods are a result of the end of the season lay-offs. Seventeen
percent are a result of lay-offs due to other events, including poor weather and reduced
demand for product. Three percent of non-work periods are a result of firings.
88

NAWS FINDINGS 1990
SAS WORKERS WHO SPEND TIME ABROAD
Chapter 9
Four out of every ten (40%) SAS workers spend time abroad during the year. Most of
those who spend time abroad still reside the bulk of the year in the United States. On
average, those who spend time abroad have one stay, and stay for an average of 19 weeks.
Of those who spend time abroad, the majority (53%) are there for less than three months.
Length of Time Abroad(All SAS Workers)
Figure 9.4 shows that SAS workers spend most of their time in the United States.
The most common reasons for leaving the United States are visiting relatives (43%) and
vacationing (23%). Only 9% of those who leave the United States do so because they are
laid off or fired.
89
CI 3
SECTION III: REGIONAL DIFFERENCES IN SASWORKERS AND SAS WORK
NAWS FINDINGS 1990
CHAPTER 10REGIONAL DIFFERENCES IN SAS WORKERCHARACTERISTICS
INTRODUCTION
Chapter 10
This chapter reports regional differences in seasonal farm workers' characteristics. It
covers differences in demographic characteristics, legal status, family residence and
poverty status.
SUMMARY OF FINDINGS
SAS worker characteristics vary by region.
The percentage of women in the SAS labor force in the Southeast (15%) is about half
that of the rest of the country (33%).
The Northeast (29%) and the Midwest (29%) have the lowest percentage of foreign-
born SAS workers. In the rest of the country, 81% of the SAS workers are foreign-
born.
Minority workers make up more than one-half of the SAS labor force in all regions
except the Midwest, where they make up 43% of the SAS labor force. In the
Southeast, Northwest and Southwest minorities make up over 90% of the SAS work
force.
The Southeast has the highest proportion (25%) of unauthorized SAS workers.
Elsewhere in the country, on average, fewer than 10% of SAS workers are unauthorized.
9
_
1 CI-L. ki
_
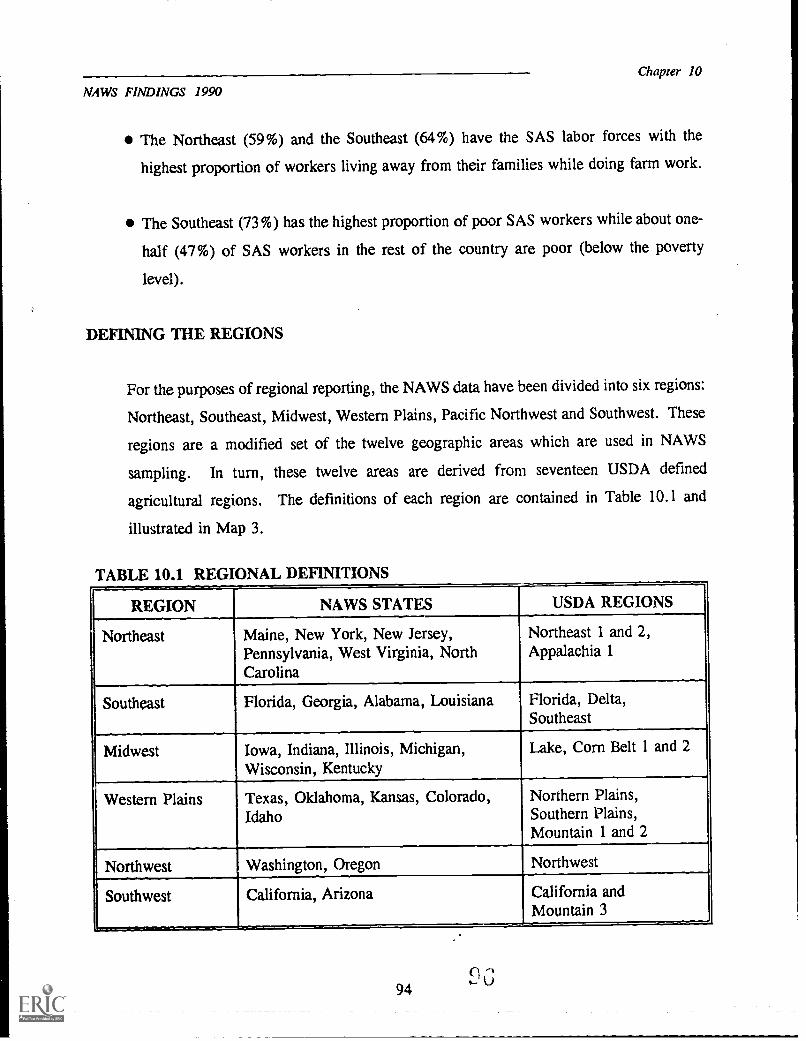
MAWS FINDINGS 1990
Chapter 10
The Northeast (59%) and the Southeast (64%) have the SAS labor forces with the
highest proportion of workers living away from their families while doing farm work.
The Southeast (73%) has the highest proportion of poor SAS workers while about one-
half (47%) of SAS workers in the rest of the country are poor (below the poverty
level).
DEFINING THE REGIONS
For the purposes of regional reporting, the NAWS data have been divided into six regions:
Northeast, Southeast, Midwest, Western Plains, Pacific Northwest and Southwest. These
regions are a modified set of the twelve geographic areas which are used in NAWS
sampling. In turn, these twelve areas are derived from seventeen USDA defined
agricultural regions. The definitions of each region are contained in Table 10.1 and
illustrated in Map 3.
TABLE 10.1 REGIONAL DEFINITIONS
REGION NAWS STATES USDA REGIONS
Northeast Maine, New York, New Jersey,Pennsylvania, West Virginia, NorthCarolina
Northeast 1 and 2,Appalachia 1
Southeast Florida, Georgia, Alabama, Louisiana Florida, Delta,Southeast
Midwest Iowa, Indiana, Illinois, Michigan,Wisconsin, Kentucky
Lake, Corn Belt 1 and 2
Western Plains Texas, Oklahoma, Kansas, Colorado,Idaho
Northern Plains,Southern Plains,Mountain 1 and 2
Northwest Washington, Oregon Northwest
Southwest California, Arizona California andMountain 3
94
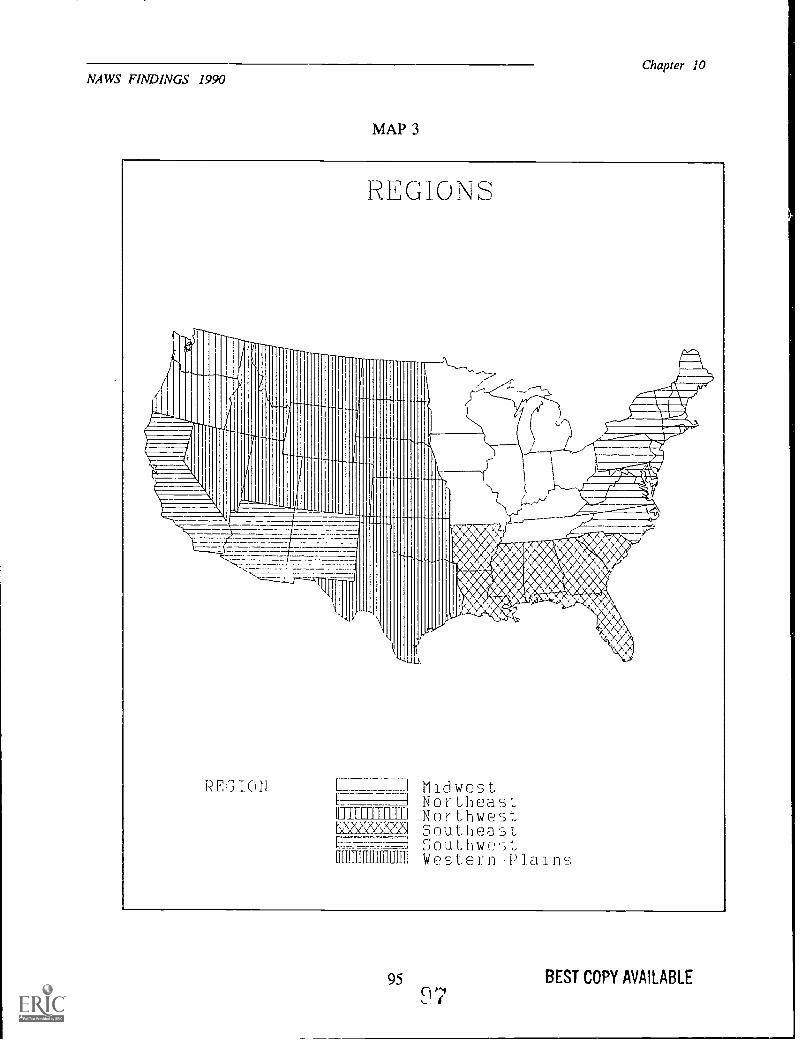
NAWS FINDINGS 1990Chapter 10
PF,(310N Li MidwestNortheast
MTh-MTh Nor thwestE=_WWS1 Southeast
Southwe.stMT= Western -Pla1ns
95 BEST COPY AVAILABLE

NAWS FINDINGS 1990
Chapter 10
The proportion of data that falls in each region is pre-determined as part of the sampling
and weighting process. They are based on 1990 USDA information on the number of SAS
workers in each region.
The region with the most SAS workers is the Southwest (26%), followed by the Midwest
(25%), the Southeast (19%), the Northeast (13%), the Western Plains (7%), and du,
Northwest (8%).
GENDER
SAS Work by Region(An SAS Workers)
Midwest25:
Southeast197.
Northeast13:
Ylestern Plains97.
Northwest87.
Source: USDA.
Southwest267.
Figure 10.1 shows that the majority (51%) of SAS workers
are in the Midwest and Southwest.
In most regions women comprise 25% to 35% of the SAS labor force. However, in the
Southeast, only 15% of SAS workers are women.
96
NAWS FINDINGS 1990
ETHNICITY AND PLACE OF BIRTH
Chapter 10
In all regions of the United States, except the Midwest, the majority of SAS workers are
foreign-born workers or U.S.-horn minority workers. More than one-half (57%) of all
Midwestern SAS workers, however, are U.S.-born wl.:tes.
The highest concentrations of foreign-born SAS workers are in the Southwest (91%),
Southeast (81%), and Pacific Northwest (75%). In contrast, immigrants make up only
29% of Midwestern SAS workers and 29% of Northeastern SAS workers.
LEGAL STATUS
The percentage of unauthorized workers is highest in the Southeast (25%). In the rest of
the country, on average, fewer than 10% of SAS workers are without work authorization.
The percent of foreign-born workers who are SAWs is highest in the Northeast, where
79% of the foreign-born workers are SAW applicants. The Midwest has the lowest
proportion (17%) of foreign-born workers who are SAWs. Elsewhere, roughly one-half
of the foreign workers are SAW applicants: 45% in the Southeast; 42% in the Western
Plains; 49% in the Southwest and 64% in the Northwest.
FAMILY RESIDENCE
Whether or not SAS workers are accompanied by their families when performing SAS
work varies by region. Western Plains SAS workers are most frequently accompanied by
their families (74%). On the other hand, Northeastern and Southeastern SAS workers are
the least likely to reside with their families while performing farm labor (40% and 36%
respectively). In the Northwest (61%), Midwest (68%) and Southwest (62%), more than
one-half of SAS workers reside with their families.
97
()
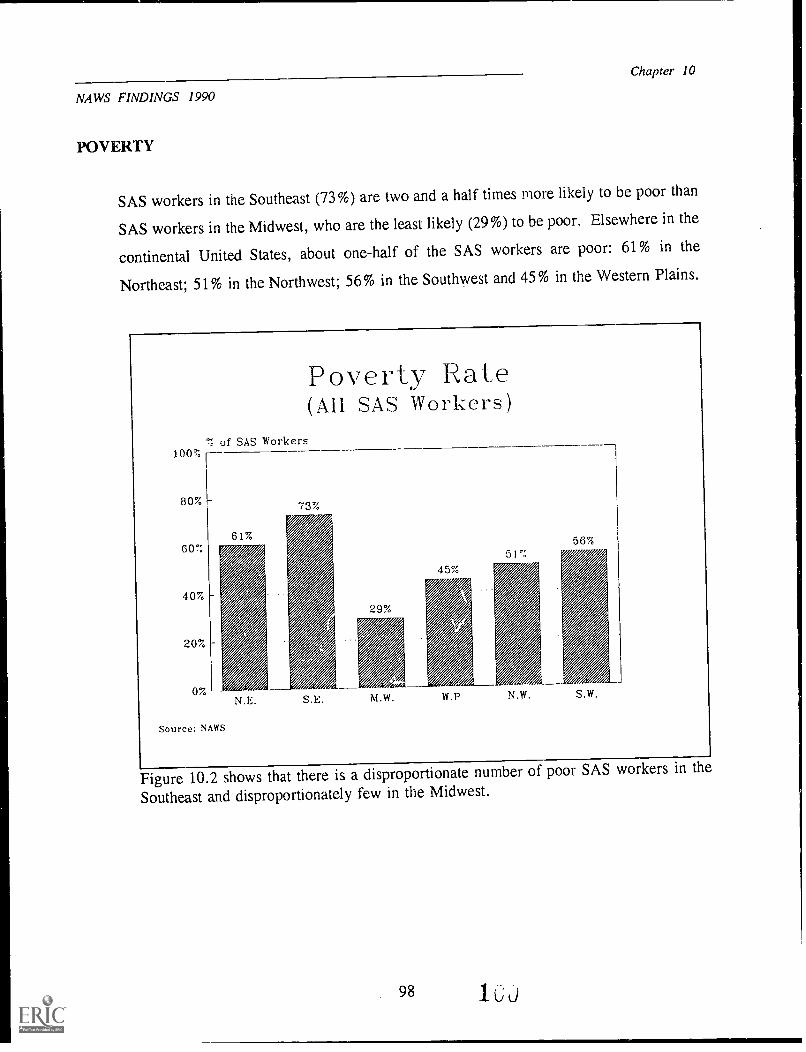
NAWS FINDINGS 19%
POVERTY
Chapter 10
SAS workers in the Southeast (73%) are two and a half times more likely to be poor than
SAS workers in the Midwest, who are the least likely (29%) to be poor. Elsewhere in the
continental United States, about one-half of the SAS workers are poor: 61% in the
Northeast; 51% in the Northwest; 56% in the Southwest and 45% in the Western Plains.
% of SAS Workers100%
80%
60%
40%
20%
0%
Source: NAWS
Poverty Rate(All SAS Workers)
73%
56%
N.E. S.E. M.W. W.P N.W. S.W.
Figure 10.2 shows that there is a disproportionate number of poor SAS workers in the
Southeast and disproportionately few in the Midwest.
98
NAWS FINDINGS 1990
CHAPTER 11REGIONAL DIFFERENCES IN SAS JOBS
INTRODUCTION
Chapter 11
This chapter covers regioual variations in job characteristi,:s. It covers crop, task, patterns of
employment, type of SAS employer and benefits.
SUMMARY OF FINDINGS
SAS work varies across regions:
The highest percentages rf field crop SAS workers are in the Midwest (11%) and
Western Plains (12%).
SAS workers in fruits and nuts are most common in the Northwest (67%), Southwest
(60%) and Northeast (57%).
SAS workers in vegetables are most common (76%) in the Southeast.
The Southeast has the highest percentage (78%) of hand-harvesting SAS jobs and the
lowest percentage (6%) of semi-skilled jobs.
SAS workers in the Southwest and Southeast spend, on average, less time in non-SAS
work than those in the rest of the country.
SAS workers from the Midwest and the Western Plains spend, on average, less time
abroad than those in other regions.
99 1 )
NAWS FINDINGS 1990
Chapter 11
Southeastern SAS workers spend, on average, less time not working while in the United
States than those in other ,:egions.
The highest concentration of SAS workers employed by farm labor contractors is in the
Southeast (64%).
According to respondents, SAS employers in the Southeast rarely offer workers'
compensation (15%) or Unemployment Insurance (16%).
CROP
The proportion of SAS workers employed in different crops varie across regions. The
Midwest and Western Plains have the highest percentage of SAS workers in field crops
(11% and 12%, respectively). The other regions have, on average, 4% of their SAS labor
force in field crops. The Midwest and Western Plains also have the smallest percentages
of workers in fruit and nut production (2% and 8%, respectively, compared to 38% in the
rest of the country).
The Northwest, Southwest and Northeast have high percentages of fruit and nut SAS
workers: 67% in the Northwest, 60% in the Southwest, and 57% in the Northeast. This
compares to 16% in the rest of the country.
The Southeast has the highest percentage of SAS workers in vegetables (76% vs. 34% in
the rest of the country).
100 if -)
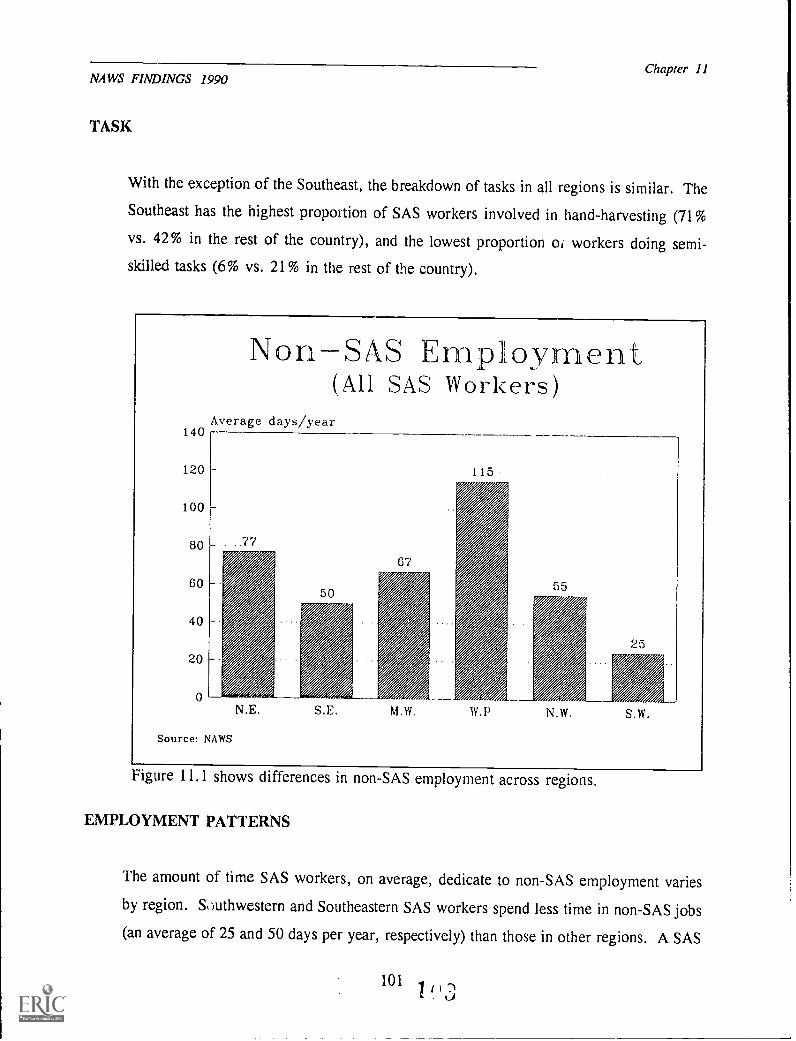
NAWS FINDINGS 1990
TASK
Chapter 11
With the exception of the Southeast, the breakdown of tasks in all regions is similar. The
Southeast has the highest proportion of SAS workers involved in hand-harvesting (71%
vs. 42% in the rest of the country), and the lowest proportion 01 workers doing semi-
skilled tasks (6% vs. 21% in the rest of the country).
140
120
100
80
60
40
20
\on-SAS Emp oyment(All SAS Workers)
Average days/year
N . E .
Source: NAWS
S . E M . W N . W .
Figure 11.1 shows differences in non-SAS employment across regions.
EMPLOYMENT PATTERNS
The amount of time SAS workers, on average, dedicate to non-SAS employment varies
by region. S,Aithwestern and Southeastern SAS workers spend less time in non-SAS jobs
(an average of 25 and 50 days per year, respectively) than those in other regions. A SAS
101 1 117)
NAWS FINDINGS 1990
Chapter 11
worker in the Western Plains does an average of 115 days of non-SAS employment a year,
a SAS worker in the Northeast an average of 77 days, a SAS worker in the Midwest an
average of 67 days, and a SAS worker in the Northwest an average of 55 days.
SAS workers in the Midwest and the Western Plains spend, on average, fewer days (40
and 20, respectively) pe- year abroad than those in other regions. On average, 66 days
of the year are spent abroad for Northeastern SAS workers, 118 for Southeastern SAS
workers, 50 for Northwestern SAS workers, and 55 for Southwestern SAS workers. On
average, Southeastern SAS workers spend less time (25 days per year) not working while
in the United States than those in other regions. A SAS worker in the Western Plains
spends an average of 63 days not working while in the United States, a SAS worker in the
Northeast spends 70 days, a SAS worker in the Northwest spends 78 days, a SAS worker
in the Southwest spends 85 days, and a SAS worker in the Midwest spends 89 days.
TYPE OF EMPLOYER
SAS workers employed by farm labor contractors are concentrated in a few regions. Farm
labor contractors are the most common SAS employers in the Southeast, where 64% of
SAS laborers work for them. In the Southwest, 34% of SAS workers are employed by
farm labor contractors, as are 7% of SAS workers in the Western Plains. Fewer than 5%
of workers in any of the other three regions work for farm labor contractors.
BENEFITS
Employers in the Southeast appear to offer the least benefits to SAS workers. Only 15%
of the SAS workers say that they are covered by workers compensation. In other regions,
coverage is provided to between 35% and 58% of the workers. Similarly, in the
Southeast, 16% of SAS workers are covered by Unemployment Insurance. In the
Midwest 26% of SAS workers have unemployment insurance. In the other regions,
between 49% and 85% of the SAS workers have Unemployment Insurance.
102
NAWS FINDINGS 1990
APPENDIX: STATISTICAL PROCEDURES
BACKGROUND
Appendix
In order to make the findings of this report accessible to a broad range of readers, the discussion
of the statistical methodology was reserved for this appendix. This appendix provides
information on the statistical conventions observed in this report. Further information on
statistical procedures used in reporting NAWS data c..n be obtained by writing to Rick Mines
at the address listed in the introduction.
DETERMINING THE CONFIDENCE INTERVALS
A confidence interval is an estimated range of values with a given high probability of covering
the true population value. This section provides the reader with the information necessary to
calculate confidence intervals associated with reported figures.
For categorical variables, such as gender, ethnicity, and legal status, we report the proportion
or percentage of workers falling into any specific category. In this situation, confidence
intervals are based on the normal approximation to the binomial distribution. This method
implies that, with a 99% confidence interval, reported figures vary at most four percentage
points from the true value. Hence, if 75% of SAS workers are reported to fall into some
category, we have 99% confidence that between 71% and 79% of the SAS workers fall in that
category.
When reporting on continuous variables such as age, number of years of schooling, or wages,
information is usually presented using measures of central tendency such as averages or medians.
Confidence intervals for the averages of continuous variables are based on standard errors.
Standard errors provide a measure of the variability of the average value in repeated random
NAWS FINDINGS 1990
Appendix
samples from the same population. Small standard errors mean that the average would not vary
much in repeated samples and large standard errors indicate that the average has greater
variance. A 99% confidence interval fol ,Lny sample average corresponds to roughly three times
the standard error. For example, for a variable with a reported average of 31 and a standard
error of 1, we are 99% confident that the population average falls between 28 and 34.
Table A.1 contains all the continuous variables in the report. It provides the means for the SAS
worker population, the standard errors and the range with 99% probability of covering the true
population value.
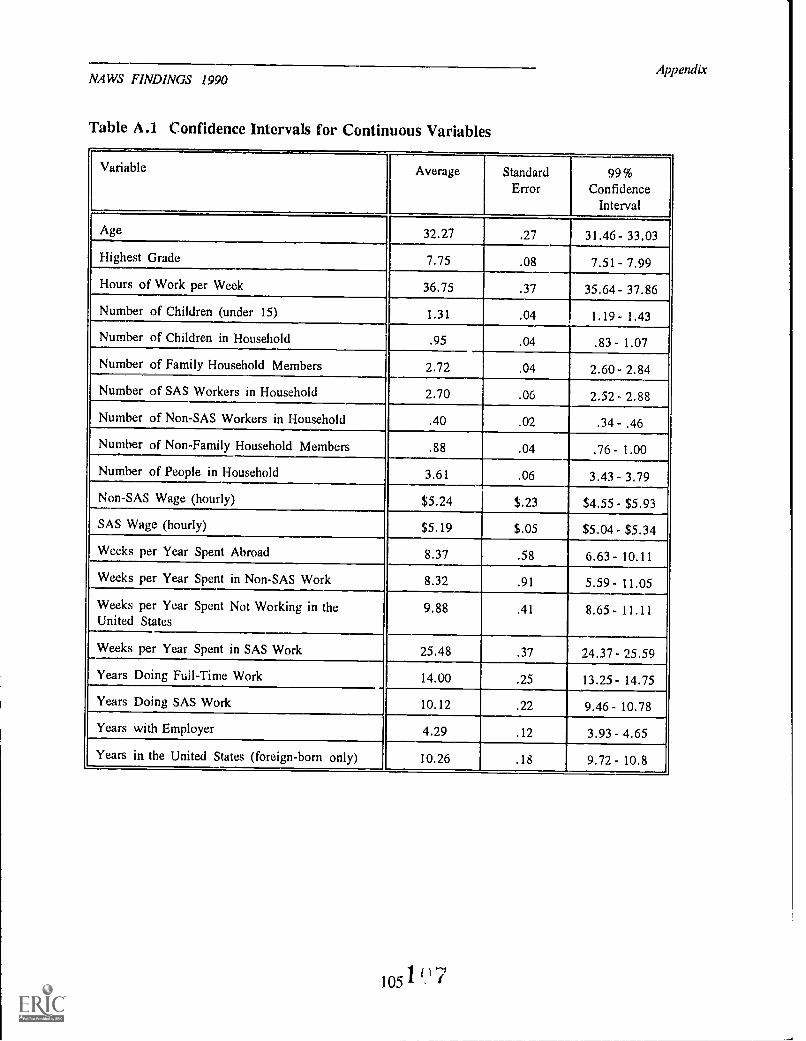
NAWS FINDINGS 1990
Table A.1 Confidence Intervals for Continuous Variables
Appendix
Variable Average StandardError
99%Confidence
Interval
Age 32.27 .27 31.46- 33.03
Highest Grade 7.75 .08 7.51- 7.99
Hours of Work per Week 36.75 .37 35.64- 37.86
Number of Children (under 15) 1.31 .04 1.19 - 1.43
Number of Children in Household .95 .04 .83 - 1.07
.04 2.60 - 2.84Number of Family Household Members 2.72
Number of SAS Workers in Household 2.70 .06 2.52 - 2.88
Number of Non-SAS Workers in Household .40 .02 .34 - .46
Number of Non-Family Household Members .88 .04 .76 - 1.00
Number of People in Household 3.61 .06 3.43- 3.79
Non-SAS Wage (hourly) $5.24 $.23 $4.55- $5.93
SAS Wage (hourly) $5.19 $.05 $5.04- $5.34
Weeks per Year Spent Abroad 8.37 .58 6.63 - 10.11
Weeks per Year Spent in Non-SAS Work 8.32 .91 5.59 - 11.05
Weeks per Year Spent Not Working in theUnited States
9.88 .41 8.65 - 11.11
Weeks per Year Spent in SAS Work 25.48 .37 24.37- 25.59
Years Doing Full-Time Work 14.00 .25 13.25- 14.75
Years Doing SAS Work 10.12 .22 9.46 - 10.78
Years with Employer 4.29 .12 3.93 - 4.65
Years in the United States (foreign-born only) 10.26 .18 9.72- 10.8
1051" 7
NAWS FINDINGS 1990
DIFFERENCES BETWEEN GROUPS OF SAS WORKERS
Appendix
All reported differences in averages or proportions for different groups of SAS workers are
statistically significant at the p< .05 level. Differences between continuous variables,
including differences that are reported through medians, were verified using the t-test of
means. Relationships among categorical variables were checked using the Pearson Chi-
Square test.
It should be noted that the Chi-Square test checks for distributional differences in the value
being analyzed among all groups in the test. It should not be assumed that every group is
significantly different from every other group.
In order to minimize the complexity of the report, statistical tests that resulted in
insignificant differences (at the p < .05 level) or that were inconclusive are not mentioned
in the text.
106