Embed Size (px)
Citation preview

ED 319 811
AUTHORTITLE
INSTITUTION
SPONS AGENCY
PUB DATECONTRACTNOTEPUB TYPE
EDRS PRICEDESCRIPTORS
DOCUMENT RESUME
TM 015 132
Carpenter, Patricia A.; And OthersWhat One Intelligence Test Measures: AAccount of the Processing in the RavenMatrices Test.Carnegie-Mellon Univ., Pittsburgh, Pa.Psychology.National Inst. of Mental Health (DHEW), Rockville,Md.; Office of Naval Research, Arlington, Va.3 Apr 90MH-00661; MH-00662; N00014-89-J-1218Ap.Reports - Research/Technical (143)
TheoreticalPte.. eL=zsive
Dept. of
MF01/PC04 Plus Postage.Abstract Reasoning; Cognitive Measurement; *CognitiveProcesses; *College Students; Computer AssistedTesting; Higher Education; *Intelligence Tests;*Nonverbal Tests; Problem Solving; PsychologicalTesting; Simulation
IDENTIFIERS Analytic Ability; BETTERAVEN Computer Program;FAIRAVEN Computer Program; *Raven ProgressiveMatrices; Tower of Hanoi Problem
ABSTRACTThe cognitive processes in a widely used, non-verbal
test of analytic intelligence--the Raven Progressive Matrices Test(J. C. Raven, 1962)--were analyzed. The analysis determined whichprocesses distinguished between higher-scoring and lower-scoringsubjects and which processes were common to all subjects and allitems on the test. The analysis was based on detailed performancecharacteristics on the Tower of Hanoi puzzle such as verbalprotocols, lye fixation patterns, and errors. The theory wasexpressed as a pair of computer simulation models--FAIRAVEN andBETTERAVEN--that performed like the median or best subjects in thesamples of 12 and 22 college students. The processing characteristiccommon to all subjects was an incremental, reiterative strategy forencoding and inducing tie regularities in each problem. The processesthat distinguished among individuals were primarily the ability toinduce abstract relations and the ability to manage dynamically alarge set of problem-solving goals in working memory. Five sampletest items, 3 tables, 12 figures, an appendix summarizing correctsolutions by the models, and a 59-item list of references areincluded. (SLD)
* Reproductions supplied by EDRS are the best that can be made *
* from the original document. *
****** * ********* ****************** ********** ***************** ***** *****

WHAT ONE INTELLIGENCE TEST MEASURES:
A THEORETICAL ACCOUNT OF THE PROCESSING
IN THE RAVEN PROGRESSIVE MATRICES TEST
Patricia A. Carpenter
Marcel Adam Just
Peter Shell
Psychology Department
Carnegie Mellon University
In Press
Psychological Review
The research reported here was supported in part by Contract N00014 _,J-1218 with theCognitive Science Program of the Office of Naval Research. Approved for public release;distribution unlimited. Reperduction in whole or in part is permitted for any purpose of theUnited bta,,es Government.

E trZTIWW33TAIUTWIWdillSPA
REPORT DOCUMENTATION PAGE41.1MIIMM
la. REPORT SECURITY CLASSIFICATION
Unclassifiedlb. RESTRIC.IVE MARKINGS
2a. SECURITY CLASSIFICATION AUTHORITY 3. DISTRIBUTION /AVAILABILITY OF REPORT
2b. DECLASSIFICATION /DOWNGRADING SCHEDULE .Approved for public release;distribution unlimited
4. PERFORMING ORGANIZATION REPORT NUMBER(S)
ONR90-1
S. MONITORING ORGANIZATION REPORT NUMBERS)
6a. NAME OF PERFORMING ORGANIZATION
Carnegie Mellon University
6b. OFFICE. SYMBOL(If applicable)
7a. NAME OF MONITORING ORGANIZATIONCognitive Science ProgramOffice of Naval Research (Code 1142PT)
6c. ADDRESS (Gty, State, and ZIP Code)
Department of PsychologyPittsburgh, PA 15213
7b. ADDRESS (City, State, and ZIP Code)
800 North Quincy StreetArlington, VA 22217-5000
Ba. NAME OF FUNDING /SPONSORINGORGANIZATION
61,. OFFICE SYMBOL(If applicable)
9. PROCUREMENT INSTRUMENT IDENTIFICATION NUMBER
N00014-89-J-12188c. ADDRESS (City, State,and ZIP Code) 10. SOURCE C- ':UNDING NUMBERS
PROGRAMELEMENT NO.
0602233N
PROJECTNO.
RM33M20
TASKNO.
9
WORK UNITACCESSION NC
4428017-11. TITLE (Include Security Classification)
What One Intelligence Test Measures: A Theoretical Account of the Processing in theRaven Progressive Matrices Test (Unclassified)
t ----------12. PERSONAL AUTHOR(S)
Patricia A. Carpenter, Marcel Adam Just, & Peter Shell13a. TYPE OF REPORT
Technical13b. TIME COVERED
FROM TO14. DATE OF REPORT (Year, Month, Day)
90, 04, 0315. PAGE COUNT
7016. SUPPLEMENTARY NOTATION
.
..
17. COSATI CODES 18. SUBJECT TERMS (Continue on reverse if necessary and identify by block numbe-)
Measurement of intelligence, reasoning,problem-solving, individual differences
FIELD GROUP SUB-GROUP
05 09
19. ...ABSTRACT (Continue on reverse if necessary and identify by block number)
This paper analyzes the cognitive processes in a widely used, non-verbal test of analytic intelligence, theRaven Progressive Matrices Test (Raven, 1962). The analysis determines which processes distinguishbetween higher-scoring and lower-scoring subjects and which processes are common to all subjects andall items on the test. The analysis is based on detailed performance characteristics such as verbalprotocols, eye fixation patterns and errors. The theory is expressed as a pair of computer simulationmodels that perform like the median or best college students in the sample.
The processing characteristic that is common to all subjects is an incremental, reiterative strategy forencoding and inducing the regularities in each problem. Tha processes that distinguish amongindividuals are primarily the ability to induce abstract relations and the ability to dynamically manage alarge set of problem-solving goals in working memory.
,........20. DISTRIBUTION / AVAICABIUTY.DF ABSTRACT 1517 ABSTRACT SECURITY CLASSIFICATION
121UNCLASSIFIEWUNLIMITED SAME AS RPT. OTIC USERS22a. NAME OF RESPONSIBLVINDIVIDUAL
Dr. Susan Chipman11111111.
DD rollm1473;84mpa''
Unclassified22b. TELEPHONE (Indude Area Code)
202-696-4318
83 APR edition may be used until exhausted.All other editions are obsolete.
22c. OFFIcE SYMBOLONR1142CS
SECURITY CLASSIMTION OF THIS PAGE
1
Abstract
This paper analyzes the cognitive processes in a widely used, non-verbal test of
analytic intelligence, the Raven Progressive Matrices Test (Raven, 1962). The analysis
determines which processes distinguish between higher-scoring and lower-scoring subjects and
which processes are common to all subjects and all items on the test. The analysis is
based on detailed performance characteristics such as verbal protocols, eye fixation patterns
and errors. The theory is expressed as a pair of computer simulation models that perform
like the median or best college students in the sample.
The processing characteristic that is common to all subjects is an incremental, re-
iterative strategy for encoding and inducing the regularities in each problem. The processes
that distinguish among individuals are primarily the ability to indur-, abstract relations and
the ability to dynamically manage a large set of problem-solving goals in working memory.

2
This paper analyzes a form of thinking that is prototypical of what psychologistsconsider to be analytic intelligence. We will use the term "analytic intelligence" to refer tothe ability to reason and solve problems involving new information, without relyingextensively on an explicit base of declarative knowledge derived from either schooling orprevious experience. In the theory of R. Cattell (1963). this form of intelligence has beenlabeled fluid intelligence and has been contrasted with crystallized intelligence. which moredirectly reflects the previously acquired knowledge and skills that have been crystallized withexperience. Thus, analytic int.1ligence refers to the ability to deal with novelty. to adaptone's thinking to a new cognitive problem. In this paper. we provide a theoretical accountof what it means to perform well on a classic test of analytic intelligence. the RavenProgressive Matrices test (Raven. 1962).
This paper describes a detailed theoretical model of the processes in solving theRaven test. contrasting the performance of college students who are less successful insolving the problems to those who are more successful. The model is based on multipledependent measures. including verbal reports. eye fixations and patterns of errors ondifferent types of problems. The experimental investigations led to the development ofcomputer simulation models that test the sufficiency of our analysis. Two computersimulathins. FAIRAVEN and BETTERAVEN. express the differences between good andextremely good performance on the test. FAIRAVEN performs like the median collegestudent in our sample: BETTERAVEN performs like one of the very best. BETTERAVENdiffers from FAIRAVEN in two major ways. BETTERAVEN has the ability to inducemore abstract relations than FAIRAVEN. In addition. BETTERAVEN has the ability tomanage a larger set of goals in working memory and hence can solve more complexproblems. The two models and the contrast between them specify the nature of theanalytic intelligence required to perform the test and the nature of individual differences inthis type of intelligence.
There are several reasons why the Raven test provides an appropriate test bed toanalyze analytic intelligence. First. the size and stability of the individual differences thatthe test elicits. even among college students. suggest that the underlying differences incognitive processes are susceptible to cognitive analysis. Second, the relatively largenumber of items on the test (36 problems) permits an adequate data base for thetheoretical and experimental analyses of the problem-solving behavior. Third, the visualformat of the problems makes it possible to exploit the fine-grained, process-tracingmethodology afforded by eye fixation studies (just & Carpenter, 1976). Finally, thecorrelation between Raven test scores and measures of intellectual achievement suggeststhat the underlying processes may be general, rather than specific to this one test (Court &
Raven. 1982), although like most correlations, this one must be interpreted with caution.
The Raven test. including the simpler Standard Progressive Matrices Test and theColoured Progressive Matrices Test. is also widely used in both research and clinicalsettings. The test is used extensively by the militar! in several western countries (forexample. see Belmont & Merolla. 1973). Also. because of its non-verbal format. it is acommon research tool used with children, the elderly. and patient populations for whom itis desirable to minimize the processing of language. The wide usage means that there is agreat deal of information about the performance profiles of various populations. But moreimportantly. it means that a cognitive analysis of the processes and structures that underlieperformance has potential practical importance in the domains in which the test is usedeither for research or classification.
Several different research approaches have converged on the conclusion that the Raven
6

3
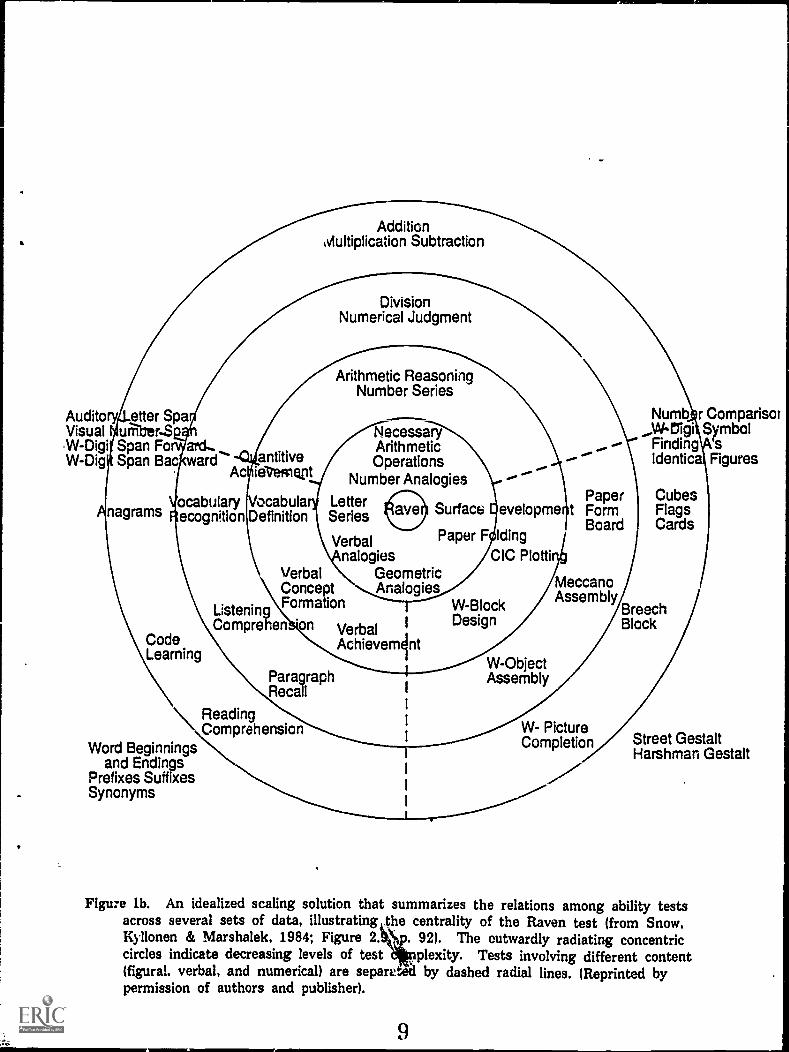
test measures processes that are central to analytic intelligence. Individual differences inthe Raven correlate highly with those found in other complex, cognitive tests (see Jensen,1987). The centrality of the Raven among psychometric tests is graphically illustrated inseveral nonmetric scaling studies that examined the interrelatioi.. among ability test scoresobtained both from archival sources and more recently collected data (Snow, Kyllonen &Marshalek. 1984). The scaling solutions for the different data bases showed remarkablysimilar patterns. The Raven and other complex reasoning tests were at the center of thesolution. Simpler tests were located towards the periphery and they clustered according totheir content. as shown in Figure la. This particular scaling analysis is based on theresults from a v Iriety of cognitive tests given to 241 high school students (Marshalek,Lohman & Snow. 1983). Snow et al. constructed an idealized space to summarize theresults of their numerous scaling solutions. in which they placed the Raven test at thecenter. as shown in Figure lb. In this idealized solution, task complexity is maximal nearthe center and decreases outward toward the periphery. The tests in the anonlussurrouricling the Raven test involve abstract reasoning. induction of relations. and deduction.For tests of intermediate or low complexity only. there is a clustering as a function of thetest content. with separate clusters for verbal. numerical and spatial tests. By contrast, themore complex tests of reasoning at the center of the space were highly intercorrelated inspite of differences in specific content.
Insert Figure la and lb - Marshalek et al results
One of the sources of the Raven test's centrality, according to Marshalek, Lohmanand Snow was that "... more complex tasks may require mote involvement of executiveassembly and control processes that structure and analyze the problem. assemble a strategyof attack on it. monitor the performance process. and adapt these strategies as performanceproceeds..." 11983. p. 124). This theoretical interpretation is based on the outcome of thescaling studies. Our research also converges on the importance of executive processes. butthe conclusions are derived from a process analysis of the Raven test.
Although there has been some dispute among psychometricians about which tests inthe larger space might be said tc reflect analytic intelligence. the Raven test is central withrespect to either interpretation. In one view, intelligence refers to a construct underlying asmall range of tests. in particular. those at the center of the space. This view isassociated with Spearman. although Spearman himself avoided the term "intelligence" andinstead used the term g to refer to the determinants of shared variance among tests ofintellectual ability (Jensen, 1987; Spearman, 1927). An alternative view, associated withThurstone, applies the term "intelligence" to a large set of diverse mental abilities,including quite domain specific abilities, such as those in the periphery of the space(Thurston, 1938). Although the two views differ in the size of the spaces which theyassociate with intelligence, the centrality of the Raven test emerges in either case. Thecentrality of the Raven test indicates not only that it is a good measure of intelligence, butalso that a theory of the processing in the Raven test should account for a good deal ofthe reasoning in the other tests in the center of the space as well.
This paper has four parts. Part I describes the structure of the problems. focusingon the problem characteristics that are likely to tax the psychological processes. Part I alsoreports two studies that examine the processes empirically. determining which processesdistinguish between high scoring subjects and lowf I-scoring subjects and which processes arecommon to all subjects in their attempts to solve all problems. Part II describes the twosimulation models that perform like the median subject or like the best subject. Part IIIcompares the performance of the human subjects and the theoretical models in detail. PartIV generalizes the theory and examines its implications for a theory of intelligence.

/ 0 Film Memory
I
Number1 Comparison
0
Identical Pictures0
wrm.
Finding A'sHidden Form BoW-Digit Symbol / Figures
0 Uses
W-PictureCompletion
0
Paperand
// Word Surface/ Trans. Develop. A
Comouflaged /Words /
Nec. Arith. N LeterPaper
Cper.
Word Beg.Series1
1 & End. tAcmhieveD.0. Te rm an
1 Vis. Numb.1 Aud. Letter Span 0\ Span
0 W-Digit SpanForward
Achieve. V. sW-Vocab.
W-InformationW-Arith. A
A A W-Similarities0 W-Digit Span\ .. W-Comprehension
Backward
Har.hmanGestalt 0
A \W-Object Assembly
1
W-Block DesignFolding I
1
1
S. . ...
1
0 1
StreetGestalt
1
I
o W-PictureArrangement //
Figure in. A nonmetric scaling of the intercorrelations among various ability tests, showingthe centrality of the Raven (from Marshalek, Lohman & Snow, 1983, Figure 2, p.122). The tests near the center of the space, such as the Raven and Letter SeriesTests, are. the most complex and share variance despite their differences in content(figural versus verbal). The outwardly radiating concentric circles indicate .'ecreasinglevels of test complexity. The shapes of the plotted points also denote testcomplexity: squares (most complex), triangles (intermediate complexity), and circles(least complex). The shading of the plotted points indicates the content of the test:white (figural), black (verbal) and dotted (numerical). (Reprinted by permission ofauthors.)
8
AuditoVisualW-DigiW-Dig*
Addition,v1ultiplication Subtraction
DivisionNumerical Judgment
etter Spaunitrer-SSpan FoSpan Bac
nagrams
and.ward
AcantitiveieVemept
Arithmetic ReasoningNumber Series
NecessaryArithmeticOperations
Number Analogies
ocabulary Vocabula Letterecognition Definition Series
Verbalnalogies
Verbal GeometricConcept AnalogiesFormation
CodeLearning
ListeningCompre hen
itt Surface
Paper F
on Verbal 1
Achievemint
ParagraphRecall
\ ReadingComprehension
Word Beginningsand Endings
Prefixes SuffixesSynonyms
evelopme
!ding
CIC Plotti
I
to
W-BlockDesign
W-ObjectAssembly
Papert Form
Board
MeccanoAssembly
W- PictureCompletion
Numb r Comparisor_..W -Digi Symbol
Finding 'sIdentica Figures
CubesFlagsCards
BreechBlock
Street GestaltHarshman Gestalt
Figure lb. An idealized scaling solution that summarizes the relations among ability testsacross several sets of data, illustrating the centrality of the Raven test (from Snow,
''*ielKyllonen & Marshalek, 1984; Figure 2.4, . 92). The outwardly radiating concentriccircles indicate decreasing levels of test ,plexity. Tests involving different content(figural, verbal, and numerical) are separvted by dashed radial lines. (Reprinted bypermission of authors and publisher).
9

4
PART I: PROBLEM STRUCTURE AND HUMAN PERFORMANCE
A task analysis of the Raven Progressive Matrices Test suggests some of thecognitive processes that are likely to be implicated in solving the problems. The testconsists of a set of visual analogy problems. Each problem consists of a 3 x 3 matrix, inwhich the bottom right entry is missing and must be selected from air g eight responsealternatives arranged below the matrix. (Note that the word entry ref to each of thenine cells of the matrix). Each entry typically contains ( le to five figural elements, suchas geometric figures. lines. or background textures. The test instructions tell the test-takerto look across the rows and then look down the columns to determine the rules and thento use the rules to determine the missing entry. The problem in Figure 2 illustrates theformat.1
Insert Figure 2 -sample problem
The variation among the entries in a row and column of this problem can bedescribed by three rules:
Rule A. Each row contains three geometric figures (a diamond, a triangle and a
square) distributed across its three entries.
Rule B. Each row contains three textured lines (dark, striped and clear)
distributed across its three entries.
Rule C. The orientation of the lines is constant within a row, but varies between
rows (vertical. horizontal. then oblique).
The missing entry can be generated from these rules. Rule A specifies that theanswer should contain a square (since the first two columns of the third row contain atriangle and diamond). Rule B specifies it should contain a dark line. Rule C specifies thatthe line orientation should be oblique, from upper left to lower right. These rules convergeon the correct response alternative, #5. Some of the incorrect response alternatives aredesigned to satisfy an incomplete set of rules. For example, if a subject induced Rule Abut not B or C he might choose alternative #2 or #8. Similarly, inducing Rule B butomitting A and C leads to alternative #3. This sample problem illustrates the generalstructure of the test problems, but corresponds to one of the easiest problems in the test.The more difficult problems entail more rules or more difficult rules, and more figuralelements per entry.
Our research focuses on a form of the Raven test that is widely used for adults ofhigher ability, the Raven Advanced Progressive Matrices. Sets I and H. Set I. consistingof 12 problems. is often used as a practice test or to obtain a rough estimate of asubject's ability. It has been pointed out that the first several problems in Set I can besolved by perceptually-based algorithms such as line continuation (Hunt. 1974). However,the later problems in Set I and most of the 36 problems comprising Set II which ourres: arch examines cannot be solved by perceptually-based algorithms, as Hunt noted. Likethe sample problem in Figure 2, the more difficult problems require that subjects analyzethe variation in the problem in order to induce the rules that generate the correct solution.The problems requiring an analytic strategy can be used to discriminate among individualswith higher education, such as college students (Raven, 1965).
10

1
a
[g] 11#in
5 6 7 a
Figure 2. A problem to illustrate the format of the Raven items. The variation amongthe three geometric forms (diamond. square, triangle) and three textures of the line(dark, striped, clear) is each governed by a distribution-of-three-values rule. Theorientation of the line is governed by a constant in a row rule. (The correct answeris #5).
11

5
Problem difficulty. Although all of the Raven problems share a similar format. thereis substantial variation among them in their difficulty. The magnitude of the variation isapparent from the error rates (shown in Figure 3) of 2256 British adults. includingtelephone engineering applicants. students at a teacher training college and British RoyalAir Force recruits (Forbes. 1964). There is an almost monotonic increase in difficulty fromthe initial problems. which have negligible error rates. to the last few problems. which haveextremely high error rates. (The error rates on the final problems reflect failures toattempt these problems in the testing period as well as failures to solve them correctly.The considerable range of error rates among problems leads to the question of whatpsychological processes account for the differences in problem difficulty and for thedifferences among people in their ability to solve them.
Insert Figure 3 - Forbes data
The test's origins provide a clue to what the test was intended to measure. TheRaven Progressive Matrices test was developed by John Raven, a student of Spearman. Aswe previously mentioned. Spearman (192) believed that there was one central intellectualability (which he referred to as e. as well as numerous specific abilities. What g consistedof was never precisely defined. but it was thought to involve "the eduction of relations".John Raven's conception of what his progressive matrices test measured was somewhatmore articulated. His personal notes. generously made available to us by his son, J. Raven.indicate that he wanted to develop a series of overlapping, homogeneous problems whosesolutions required different abilities. However, the descriptions of the abilities that Ravenintended to measure are primarily characteristics of the problems, and hot specifications ofthe requisite cognitive processes. John Raven constru..ted problems that focused c, each ofsix different problem characteristics, which approximately correspond ti, the different typesof rules that we describe below. He used his intuition and clinical experience to rank orderthe .difficulty of the six problem types. Many years later. normative data from Forbes.shown in Figure 3, became the basis for selecting problems for retention in newer versionsof the test. and for arranging the problems in order of increasing difficulty. without regardto any underlying processing theory. Thus, the version of the test that is examined in thisresearch is an amalgam of John Raven's implicit theory of the components of reasoningability and subsequent item selection and ordering done on an actuarial basis.
."yule taxonomy
Across the Raven problems that we have examined, we have found that five differenttypes of rules govern the variation among the entries. Many problems involve multiplerules. which may all be different rule types or several instances or tokens of the same typeof rule. The problems in Figures 2, 4a. 4b and 4c illustrate the five different types ofrules that are described in Table 1. Almost all of the Raven problems in Sets I and IIcan be classified with respect to which of these rule types govern its variation. as shown inAppendix A.2
Insert Table 1. Figure 4a. b. c
One qualification to this analysis is that sometimes the set of rules describing thevariation in a problem is not unique. For example, quantitative pairwise progression isoften interchangeable with a distribution-of-three-values. Consider a row consisting of anarrow pointing to twelve o'clock. four o'clock. and eight o'clock. This variation can bedescribed as a distribution-of-three-values or in terms of a quantitative progression in whichthe arrow's orientation is progressively rotated 120 degrees clockwise. beginning at twelve
12

MO
90
80
70
60
50
40
30
20
10
1 _I_ 1 1 1 t.__. 1 1 1
2 4 6 8 10 12 14 16 18 20 22 24 26 28 30 32 34 36
Problem Number
Figure 3. The percentage error for each problem in Set II of the Raven AdvancedProgressive Matrices shows the large variation in difficulty among problems withvery similar formats. The data are from 2256 British adults, including telephoneengineering applicants, students at a teacher training college, and British Royal AirForce recruits (Forbes. 19641.
13

Table 1: A Taxonomy of Rules in the Raven Test
Constant in a row - the same value occurs throughout a row. but changes down acolumn. (See Figure 4b. where the location of the dark component is constant within eachrow: in the top row. the location is the upper half of the diamond: in the middle row, it isthe bottom half of the diamond: and in the bottom row. it is both halves).
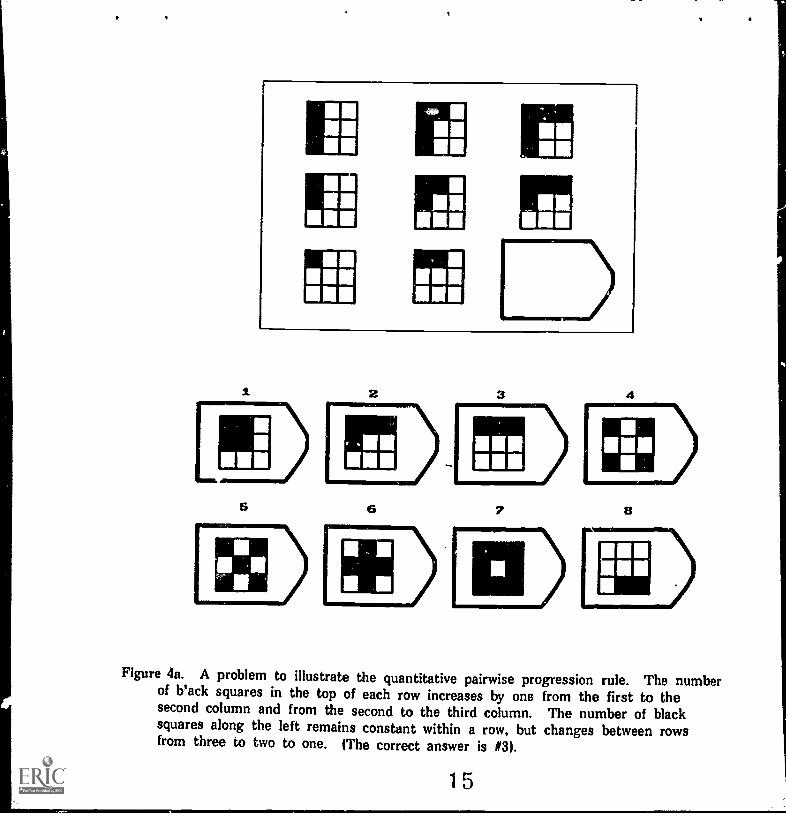
Quantitative pairwise progression - a quantitative increment or decrement betweenadjacent entries in an attribute such as size, position, or number. (See Figure 4a, where thenumber of black squares in each entry increases along a row from 1 to 2 to 3).
Figure addition or subtraction - a figure from one column is added to (juxtaposed orsuperimposed) or subtractA from another figure to produce the third. (See Figure 4b. wherethe figural element in (..,:lumn 1 juxtaposed to the element in column 2 produces theelement in column 31.
Distributioof-three-values - three values from a categorical attribute (such as figure
type) are distributed through a row. (See Figure 2. where the three geometric forms(diamond. square. triangle) follow a distribution rule and the three line textures (black,striped, clear) also follow a distribution rule).
Distribution-of-two-values - two values from a categorical attribute are distributedthrough a row: the third value is null. (See Figure 4c. where the various figural elements(such as the vertical line. the horizontal line, and the V in the first row) follow adistribution-of-two-values).
14
5 6 7
Figure 4a. A problem to illustrate the quantitative pairwise progression rule. The numberof back squares in the top of each row increases by one from the first to thesecond column and from the second to the third column. The number of blacksquares along the left remains constant within a row, but changes between rowsfrom three to two to one. tThe correct answer is NU
15

.4. 4 44> 4 I )
i 2 3 4
L-') FJDD I O )
TLi...)
Figure 4b. A problem to illustrate the figure addition rule. The figural element in thefirst column is superimposed on the figural element in the second column tocomprise the figural element in the third column. The position of the darkenedelement remains constant in a row, but changes between rows from top to bottomto both. (The correct answer is #81.
16

i. 4
5 6 7 13
Figure 4c. A problem to illustrate the distribution-of-two-values rule. Each figuralelement, such as the horizontal line, the vertical line. the V, and so on, occurs twicein a row and the third value is null. IThe correct answer .3 #5).
1r

6
o'clock. Similarly, the variation described by a distribution-of-two-values rule may bealternatively described by a figure-addition-modulo-2 rule. In the case of alternative rules,Appendix A lists the rules most often mentioned by the highest scoring subjects inExperiment la.3
Finding corresponding elements. In problems with multiple rules, the problem solvermust determine which figural elements or attributes in the three entries in a row aregoverned by the same rule. a process that will be called correspondence finding. Forexample. given a shaded square in one entry. the problem solver might have to decidewhich figure :n another entry. either a shaded triangle or an unshaded square. is governedby the same rule. Do the squares correspond to each other. or do the shaded figures? Inthis example. and in some of the Raven problems. the cues to the correspondence areambiguous. making it difficult to tell a priori which figural elements correspond to eachother. The correspondence finding process is a subtle source of difficulty because manyproblems seem to have been constructed by conjoining the figural elements governed byse veral rules. without much reg. 3 for the possible difficulty of conceptually segmenting theconjunction.
The difficulty in correspondence finding can be illustrated with an adaptation of one ofthe problems (#28. Set II). shown in Figure 5. A first plausible hypothesis about thecorrespondences is that the rectangles are governed by one rule, the dark curves by anotherrule. and the straight lines by a third rule. This hypothesis reflects the use of amatching-names heuristic. namely. that figures with the same name might correspond toeach other. If this hypothesis is pursued further, it becomes clear that although each rowdoes contain two instances of each figure type. the number and orientation of the figuresvary unsystematically. The matching-names heuristic produces an unfruitful hypothesisabout the correspondences in this problem. A subject who has tried to apply the heuristicmust backtrack and consider other correspondences bizsed on some other feature. eithernumber or orientation. Number, like figure identity. does not result in any economical andcomplete rule that governs location or orientation. Orientation. the remaining attribute. isthe basis for two economical. complete rules. The horizontal elements in each row can bedescribed in terms of two distribution-of-three-values rules, one governing number (1. 2 and3 elements) and the second governing figure type (line, curve and rectangle). Similarly. thevertical elements in each row are governed by the same two rules. This example illustratesthe complexity of correspondence finding, which along with the type of rule in a problemand the number of rules. can contribute to the difficulty of a problem.
Insert Figure 5 - correspondence problem
In addition to variation among problems in the difficulty of correspondence finding,the problems also vary in the number of rules. Although John Raven intended to evaluatea test taker's ability to induce relations, he apparently tried to make the induction processmore difficult in some problems by including more examples or tokens of rules. A majorclaim of the current analysis is that the presence of a larger number of rule tokens taxesnot so much the processes that induce the rules. but the goal management processes thatare required to construct. execute and maintain a mental plan of action during the solutionof those problems containing multiple rule tokens as well as difficult correspondence finding.
18
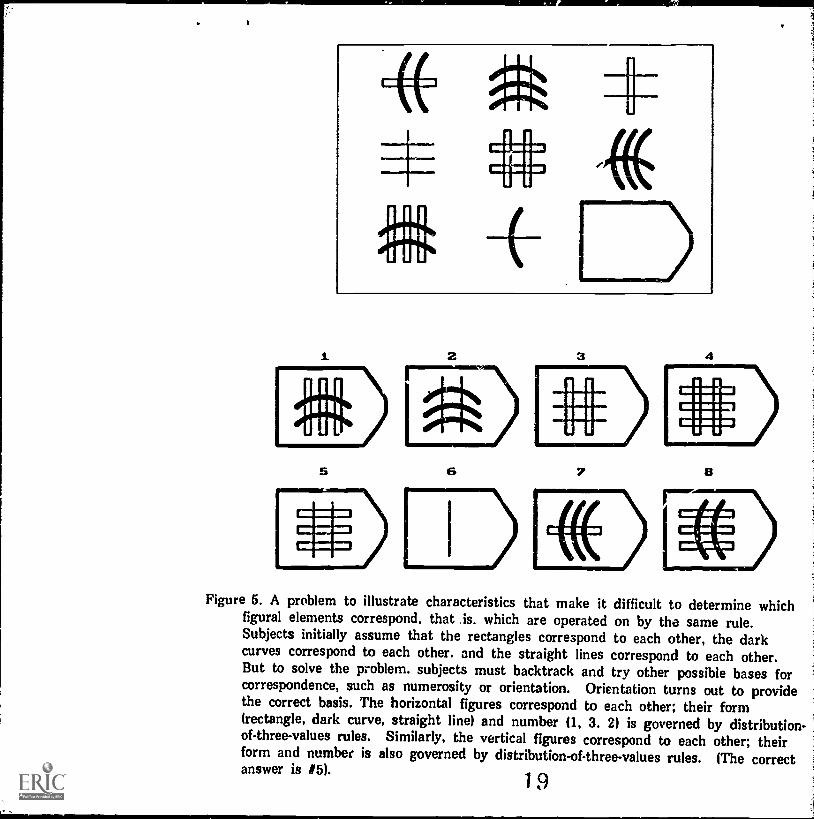
Figure 5. A problem to illustrate characteristics that make it difficult to determine whichfigural elements correspond. that is. which are operated on by the same rule.Subjects initially assume that the rectangles correspond to each other, the darkcurves correspond to each other. and the straight lines correspond to each other.But to solve the problem. subjects must backtrack and try other possible bases forcorrespondence, such as numerosity or orientation. Orientation turns out to providethe correct basis. The horizontal figures correspond to each other; their form(rectangle, dark curve, straight line) and number (1, 3. 2) is governed by distribution-of-three-values rules. Similarly, the vertical figures correspond to each other; theirform and number is also governed by distribution-of-three-values rules. (The correctanswer is #5).
19

7
Experiment 1: Performance in the Raven test
The purpose of Experiment 1 was to collect more detailed data about the performancein the Raven test to reveal more about the process and the content of thought during thesolving of each Raven problem. Experiments la and lb examined Raven test performancewhile obtaining somewhat different measures of performance. Three types of measuresprovide the basis for the quantitative evaluation of the theory.
The first measure is the frequency and pattern of errors. which were obtained in bothExperiments la and lb. The simulation models account not only for the number of errorsthat a person of a given ability will make, but also predict which types of problems he willfail to solve.
The second type o5 measure, obtained in Experiment la reflects on-line processesused during problem solution. One such on-line measure assessed how the entries insuccessive rows were visually examined. In particular. measures of the eye-fixation patternsassessed the number of times a subject scanned a row of entries and the nuriber of timeshe looked back and forth (made paired comparisons) between entries. Another on-linemeasure was the time between the successive statements of rules uttered by subjects whowere talking aloud while solving the problems. These on-line measures constrain the typeof solution processes postulated in the simulations.
A third measure. obtained in Experiment lb. is the subjects' descriptions of the rulesthat they induced in choosing a response to each problem. The subjects' rules arecompared to the rules induced by the simulation models.
Method
Procedure for Experiment la. In Experiment la. the subjects were presented withproblems from the Raven test while their eye fixations were recorded. They were asked totalk out loud while they solved the problems. describing what they noticed and whathypotheses they were entertaining. The subjects were given the standard psychometricinstructions and shown two simple practice problems. One deviation from standardpsychometric procedure was that subjects were told to pace themselves so as to ay.t. ..,. , allof the problems in the standard 40 minute time limit.
Stimuli. Experiment la used 34 of the 48 problems in Sets I and II that could berepresented and displayed within the raster graphics resolution of our display system, whichwas 512 x 512 pixels (see Just & Carpenter, 1979, for a description of the videodigitization and display characteristics). The stimuli were created by digitizing the videoimage of each problem in the Raven test booklet. Appendix A shows the sequence numberin the Raven test of the problems that were retained. The problems that could not beadequately digitized were those with very high spatial frequencies in their depiction, such assmall grids or cross-hatching (Set II #2. 11, 15. 20, 21, 24. 25. 28, 30). There was littlerelation between the presence of high spatial frequencies and z problem's difficulty asindicated by the normative error rate from Forbes 11964) shoi in in Figure 3.
Eye fixations. The subjects' eye fixations were monitcr,-Prl remotely with an AppliedScience Laboratories corneal and pupil-centered eye-tracker that sampled at 60 Hz.ultimately resulting in an x-y pair of gaze coordinates expressed in the coordinate system ofthe display. The individual x-y coordinates were later aggregated into fixations. Then,successive fixations on the same one of the nine entries in the problem matrix or on asingle response alternative were aggregated tigether into units called gazes. which constitutethe main eye-fixation data base.
Procedure for Experiment lb. Unlike Experiment la. in which subjects gave verbalprotocols while they solved each problem, in Experiment lb subjects were asked to work
20
8
silently. make their response, and then describe the rules that motivated their finalresponse. This change in procedure was intended to provide more complete informationabout what rules the subjects induced. These rule statements were then compared to therules induced by FAIRAVEN and iiETTERAVEN. Subjects were given 40 problems,approximately half of which were from the Raven Progressive Matrices test and half fromthe Standard Progressive Matrices Test. involving similar rule types. to increase the numberof problems involving more difficult rules. The subjects in Experiment lb were tested intwo sessions separated by about a week with 20 items in each session.
Subjects. In Experiment la. the subjects were 12 Carnegie Mellon students whoparticipated for course credit. In Experiment lb, the subjects were 22 students fromCarnegie Mellon and the University of Pittsburgh who participated for a $10 payment.Data were not included from three additional subjects who did not return for the secondsession to complete Experiment lb.
Overview of Results
Errors. eye fixations and verbal reports. This overview presents the general patternsof results. particularly results that influenced the design features of the simulation models.This overview. presented in preliminary and qualitative terms. will be followed by a moreprecise analysis of the data in Part III. after the presentation of the models.
In Experiment la. over all 34 problems. the number of errors per subject rangedfrom 2 to 20. with a mean of 10.5 (31%). and a median of 10.3. Although our collegestudent subjects had a lower mean error rate than Forbes' more heterogeneous sample, thecorrelation between the error rates of our sample and Forbes' on the 27 problems in Set IIwas high. r(25) = .91. In Experiment lb. the mean number of errors for the 40 Ravenproblems was 11.1 128%). with a median of 10 errors.4
The error rate on a given problem was related to the types of rules it involved, andthe number of tokens of each rule type. A simple linear regression whose singleindependent variable was the total number of rules in a problem (irrespective of whetherthey were of similar or different types. and not counting any constant rules) accounted for57% of the variance among the mean error rates in Experiment la for the 32 problemsclassified within our taxonomy. (If any constant rules are counted in with th,, number ofrule tokens in a problem. then the percentage of variance accounted for declines to 45%).The median and mean response times for correct responses were generally longer for theproblems that had higher error rates (with a correlation of .87 between the mean times andthe errors) suggesting that problem difficulty affected both performance measures.
Perhaps the most striking facet of the eye fixations and verbal protocols was theuemonstrably incremental nature of the processing. The way that the subjects solved aproblem was to decompose it into successively smaller subproblems, and then proceed tosolve each subproblem. The induction of the rules was incremental. in two respects. Firstof all. in problems containing more than one rule. the rules were described one at a time.with long intervals between rule descriptions. suggesting that they were induced one at atime. Second. the induction of each rule consisted of many small steps. reflected in thepairwise comparison of elements in adjoining entries. These aspects of incrementalprocessing were ubiquitous characteristics of the problem-solving of all of the subjects. anddo not appear to be a source of individual differences. Consequently. the incrementalprocessing played a large role in the design of both simulation models.
A typical protocol from one of the subjects illustrates the incremental processing.Table 2 shows the sequence of gazes and verbal comments made by an average subject141% errors) solving a problem involving two distribution-of-three-values rules and a constantin a row rule (Set II #1, which is isomorphic to the problem depicted in Figure 2). The
21
9
subject's comments are transcribed adjacent to the gazes that occurred during the utterance.(The subject's actual comments were translated to refer to the isomorphic attributesdepicted in Figure 2.) The location of each gaze is indicatKi by labeling the rows in thematrix from top to bottom as row J. 2 and 3, and the columns from left to right as 1, 2and 3. such that (1.2) designates the entry in the top row and middle column. The bracesencompassing a sequence of gazes indicate how the gazes were classified in the analysisthat counted the number of scans of rows and columns. The duration of each gaze isindicated in milliseconds next to the location of the gaze.
Insert Figure 6 and Table 2 below it
The verbal report shows that the subject mentioned one attribute at a time, withsome + ae interval between the mentions. suggesting that the representation of the entrieswas being constructed incrementally. Also. the subject described the rules one at a time,typically with several seconds elapsing between rules. The subject seemed to construct acomplete representation attribute by attribute. and induced the rules one at a time.
The incremental nature of the process is also apparent in the pattern of gazes.particularly the multiple scans of rows and columns and the repeated fixations of pairs ofrelated entries. These scans are apparent in the sequence of gazes shown in Figure 6.(The numbers indicating the sequence of gazes have been placed in columns to the right ofthe fixated entries and lines have been drawn to connect the successive fixations of entrieswithin rows). 'This protocol indicates the large amount of pairwise and row-wise scanning.For example. like most of the eye fixation protocols. this one began with a sequence ofpairwise gazes on first two entries in the top row. The subject was presumably encodingsome of the figural elements in these two entries and comparing their attributes. Then, thesubject went on to compare middle and right-most entries of the top row. followed byseveral scans of the complete row.
The general results. then. are that the processing is incremental, that the number ofrule tokens affects the error rates. and that there is a wide range of differences amongindividuals in their performance on this test.
Experiment 2: Goal management in other tasks
The finding that error rates increase with the number of rule tokens in a problemsuggests that the sheer keeping track of figural attributes and rules might be a substantialsource of individual differences in the Raven test. "Keeping track" refers to the ability togenerate subgoals in working memory, record the attainment of subgoals, and set newsubgoals as others are attained. Subjects who are successful at goal management in taeRaven test should also perform well on other cognitive tasks involving extensive goalmanagement. One such task is a puzzle called the Tower of Hanoi, which can be solvedusing a strategy that requires considerable goal management. Most research on the Towerof Hanoi puzzle has focused on how subjects induce a correct strategy. By contrast. in thecurrent study. the inductive aspect of the puzzle was minimized by teaching subjects astrategy beforehand. with extensive instructions and practice. Errors on the Tower ofHanoi puzzle should correlate with errors on the Raven test. to the extent that bothrequire goal management.
The Tower of Hanoi puzzle consists of three pegs and three or more disks ofincreasing size arranged on one of the pegs in the form of a pyramid. with the largest diskon the bottom and smallest disk on the top, as shown in the top part of Figure 7. Thesubject's task is to reconstruct the pyramid. moving one disk at a time. on another peg(called the goal peg), without ever putting a larger disk on a smaller disk. One of the
22

<t.
2 14 3----.1.1--
1520 (to 2,1)
680
124
16 (to 2, 3)1928 (to 2, 2)53 (to 2,1)
5
21 2225 (to 3,1) 24
29 (to 3, 3)II--.40 (to 3,1)42 (to 3, 2)50 (to 1, 3)54 (to 3, 2)
26
3337 (to 2, 3)41 (to 2, 2)4449 (to 2, 2)52 (to 1, 2)56
18 (to 1, 2)27 (to 1, 2)30 (to 2, 3)32343639 (to 2, 2
348
55
51 (to 3,1)
17 (to 3, 2)23
31 (to 3, 2)38 (to 3,2)
Figure 6. The sequence of gazes shown in the protocol in Table 2. Gazes within thesame row are connected. The numbers in parentheses indicate the location of agaze that followed if it was in a different row.
23
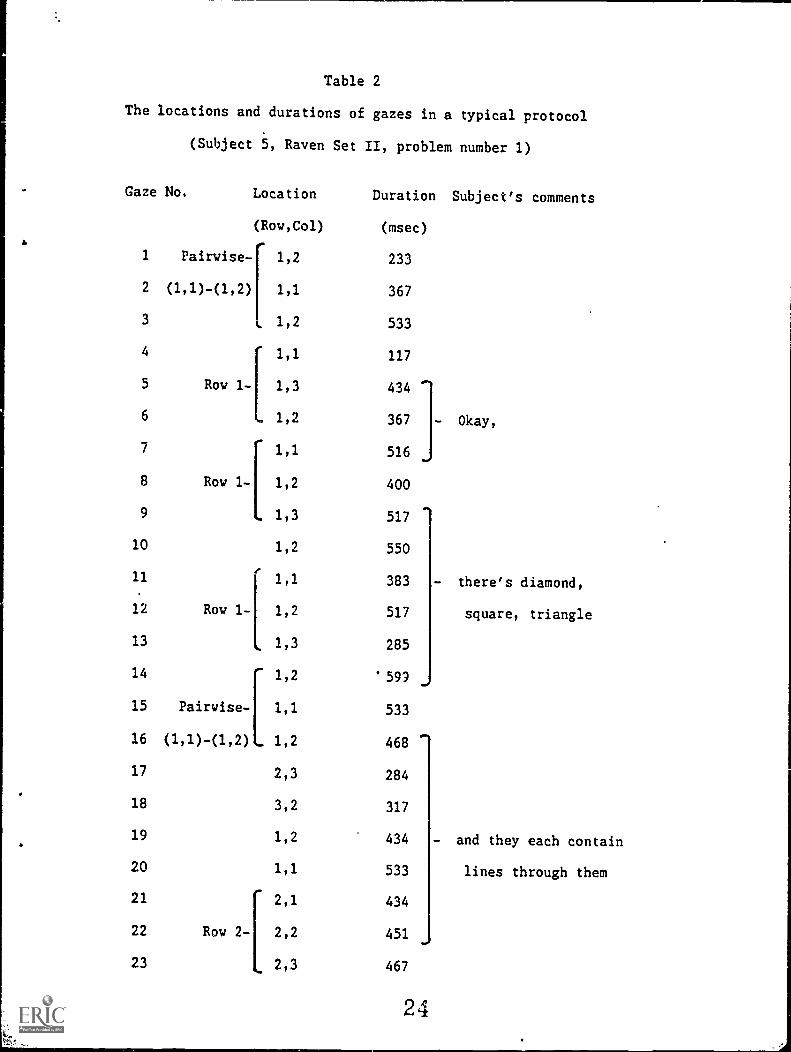
Table 2
The locations and durations of gazes in a typical protocol
(Subject 5, Raven Set II, problem number 1)
Gaze No. Location
(Row,Col)
1 Pairwise- 1,2
Duration Subject's comments
(msec)
233
2 (1,1)-(1,2) 1,1 367
3 1,2 533
4 117
5
6
Row 1- 1,3
1,2
434
367 Okay,
7 1,1 516
8 Row 1- 1,2 400
411,
9 1,3 517
10 1,2 550
11r
1,1 383 - there's diamond,
12 Row 1- 1,2 517 square, triangle
13 1,3 285
14 1,2 '599
15 Pairwise- 1,1 533
16 (1,1)-(1,2) 1,2 468
17 2,3 284
18 3,2 317
19 1,2 434 - and they each contain
20 1,1 533 lines through them
21 2,1 434
22 Row 2-[ 2,2 451
23 2,3 467
24
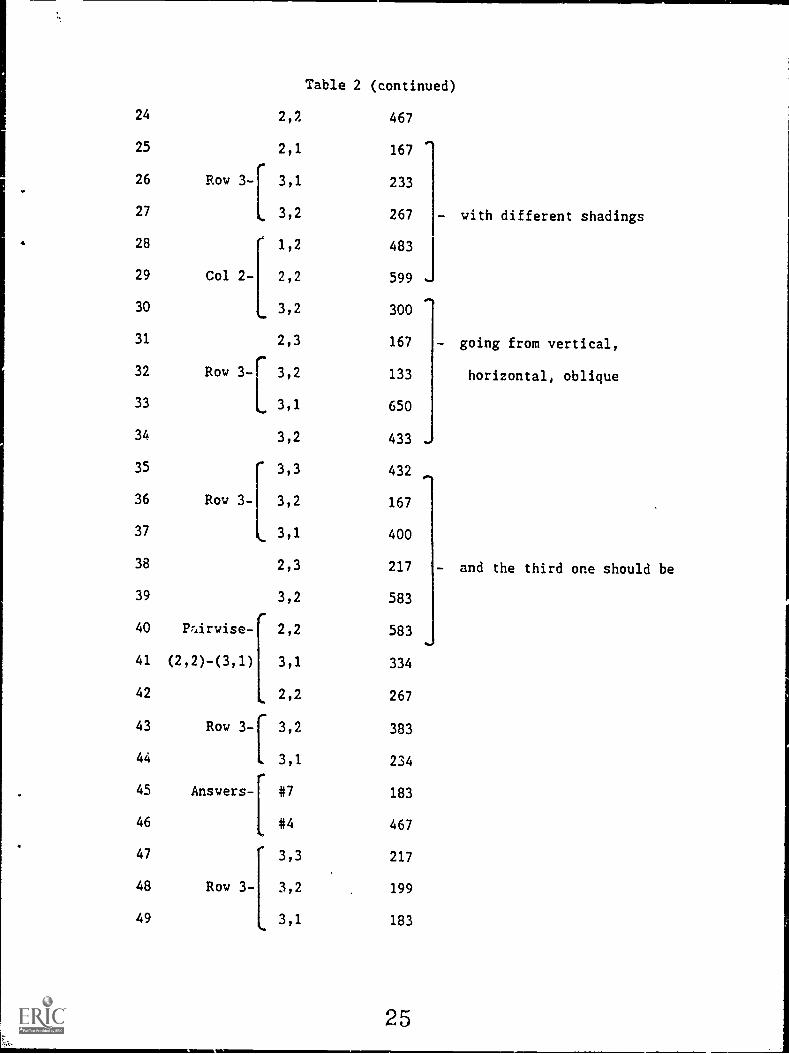
Table 2 (continued)
24
25
2,2
2,1
467
167
26
27
Row 3- 3,1
[ 3,2
233
267 - with different shadings
28 1,2 483
29 Col 2- 2,2 599
...
30 3,2.. 300
31 2,3 167 - going from vertical,
32 Row 3- 3,2
[
133 horizontal, oblique
33 3,1 650
34 3,2 433 _
35 3,3 432 .-
36 Row 3,2 167
37 3,1 400
38 2,3 217 - and the third one should be
39 3,2 583
40 PrArwise- 2,2 583...
41 (2,2)-(3,1) 3,1
[
334
42 2,2 267
43 Row 3-[ 3,2 383
44 3,1 234
45 Answers- #7
[
183
46 #4 467
47 3,3 217
48 Row 3- 3,2 199
49 3,1 183
25
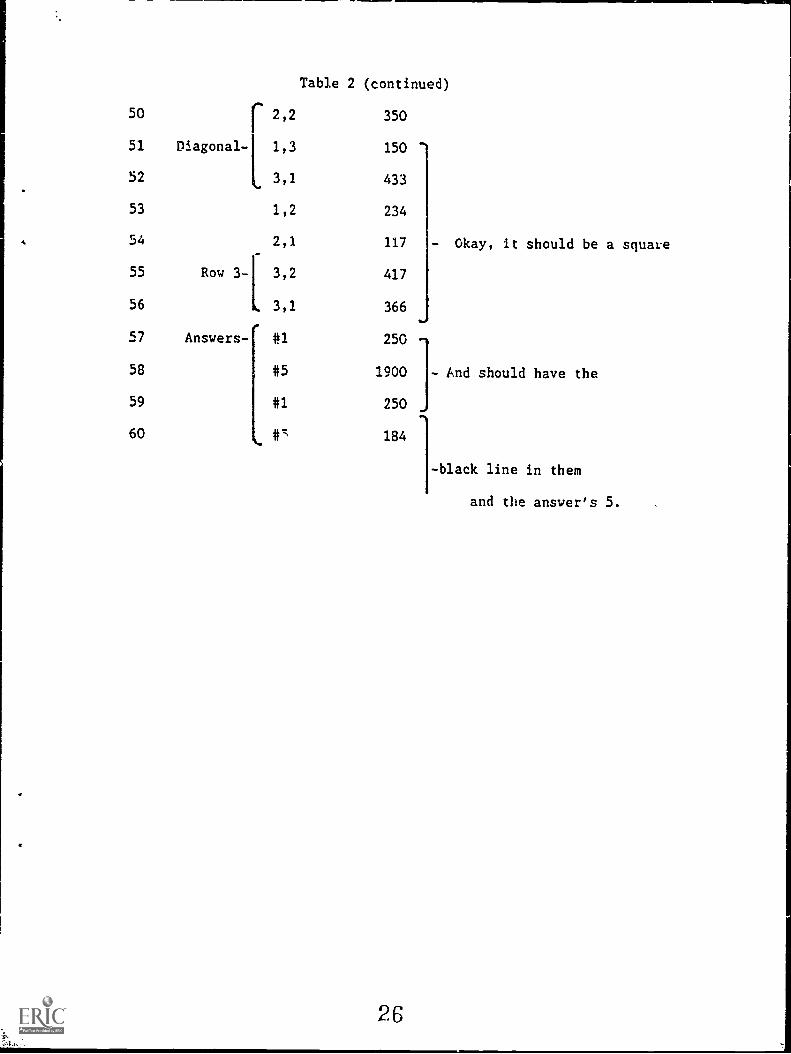
Table 2 (continued)
50 2,2 350
51 Diagonal- 1,3 150
52 3,1 433
53 1,2 234
54 2,1 117 - Okay, it should be a square
55 Row 3- 3,2
[
417
56 3,1 366
57 Answers- r #1 250
58 #5 1900 - And should have the
59 #1 250
60.. 4t's
184
-black line in them
and the answer's 5.
26
10
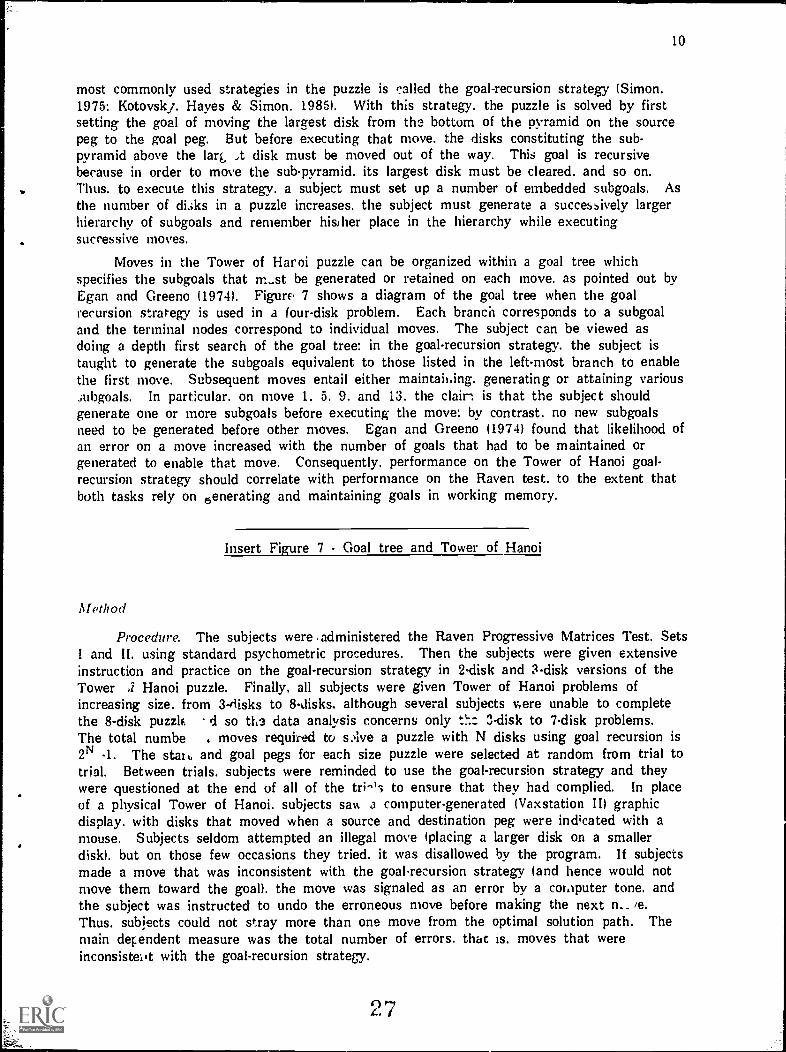
most commonly used strategies in the puzzle is called the goal-recursion strategy (Simon.1975: Kotovskj. Hayes & Simon. 19851. With this strategy. the puzzle is solved by firstsetting the goal of moving the largest disk from the bottom of the pyramid on the sourcepeg to the goal peg. But before executing that move. the disks constituting the sub-pyramid above the lari A disk must be moved out of the way. This goal is recursivebecause in order to move the sub. pyramid. its largest disk must be cleared. and so on.Thus. to execute this strategy. a subject must set up a number of embedded subgoals. Asthe number of disks in a puzzle increases. the subject must generate a successively largerhierarchy of subgoals and remember hisi her place in the hierarchy while executingsuccessive moves.
Moves in the Tower of Hanoi puzzle can be organized within a goal tree whichspecifies the subgoals that m_st be generated or retained on each move. as pointed out byEgan and Greeno 119741. Figurf. 7 shows a diagram of the goal tree when the goalrecursion strategy is used in a four-disk problem. Each branch corresponds to a subgoaland the terminal nodes correspond to individual moves. The subject can be viewed asdoing a depth first search of the goal tree: in the goal-recursion strategy. the subject istaught to generate the subgoals equivalent to those listed in the left-most branch to enablethe first move. Subsequent moves entail either maintaining. generating or attaining varioussubgoals. In particular. on move 1. 5. 9. and 13. the clair. is that the subject shouldgenerate one or more subgoals before executing the move: by contrast. no new subgoalsneed to be generated before other moves. Egan and Greeno 11974) found that likelihood ofan error on a move increased with the number of goals that had to be maintained orgenerated to enable that move. Consequently. performance on the Tower of Hanoi goal-recursion strategy should correlate with performance on the Raven test. to the extent thatboth tasks rely on 6enerating and maintaining goals in working memory.
Insert Figure 7 - Goal tree and Tower of Hanoi
Afethod
Procedure. The subjects were administered the Raven Progressive Matrices Test. SetsI and II. using standard psychometric procedures. Then the subjects were given extensiveinstruction and practice on the goal-recursion strategy in 2-disk and 3-disk versions of theTower i Hanoi puzzle. Finally, all subjects were given Tower of Hanoi problems ofincreasing size, from 3-disks to 8-disks, although several subjects were unable to completethe 8-disk puzzlf d so the data analysis concerns only 3-disk to 7-disk problems.The total numbe , moves required to s Ave a puzzle with N disks using goal recursion is2N -1. The start, and goal pegs for each size puzzle were selected at random from trial totrial. Between trials. subjects were reminded to use the goal-recursion strategy and theywere questioned at the end of all of the tri^'s to ensure that they had complied. In placeof a physical Tower of Hanoi. subjects saw a computer-generated (Vaxstation III graphicdisplay. with disks that moved when a source and destination peg were ind;ca ted with amouse. Subjects seldom attempted an illegal move (placing a larger disk on a smallerdisk). but on those few occasions they tried. it was disallowed by the program. If subjectsmade a move that was inconsistent with the goal-recursion strategy (and hence would notmove them toward the goal). the move was signaled as an error by a coraputer tone. andthe subject was instructed to undo the erroneous move before making the next n. te.
Thus. subjects could not stray more than one move from the optimal solution path. Themain dependent measure was the total number of errors. that is. moves that wereinconsistent with the goal-recursion strategy.
27

MOVE I
PYRAMID-2
CREATE PYRAMID-4ON GOAL PEG
MOVEDISK 4
MOVEDI SK 3
CLEARDISK 3
MOVEPYRAMID-2
MOVEDISK 3
MOVEDI SK 4
CLEARGOAL PEG
MOVEAPYRAMID-2
ALLCREATE PYRAMID -3ON GOAL PEG
MOVEDISK 3
CLEAR\RISK 3
MOVE MOVE MOVEDISK 4 PYRAMID-2
I
DISK 3[
1 2 3 4 5 6 7 8 9 10 11
MOVE NUMBER
CREATE PYRAMID-2ON GOAL PEG
A12 13 14 15
Figure 7. The goal tree generated by the goal-recursion strategy for the four-disk Tower-of-Hanoi puzzle. The tree is traversed depth-first, from left to right, generating the15 moves.
28
11
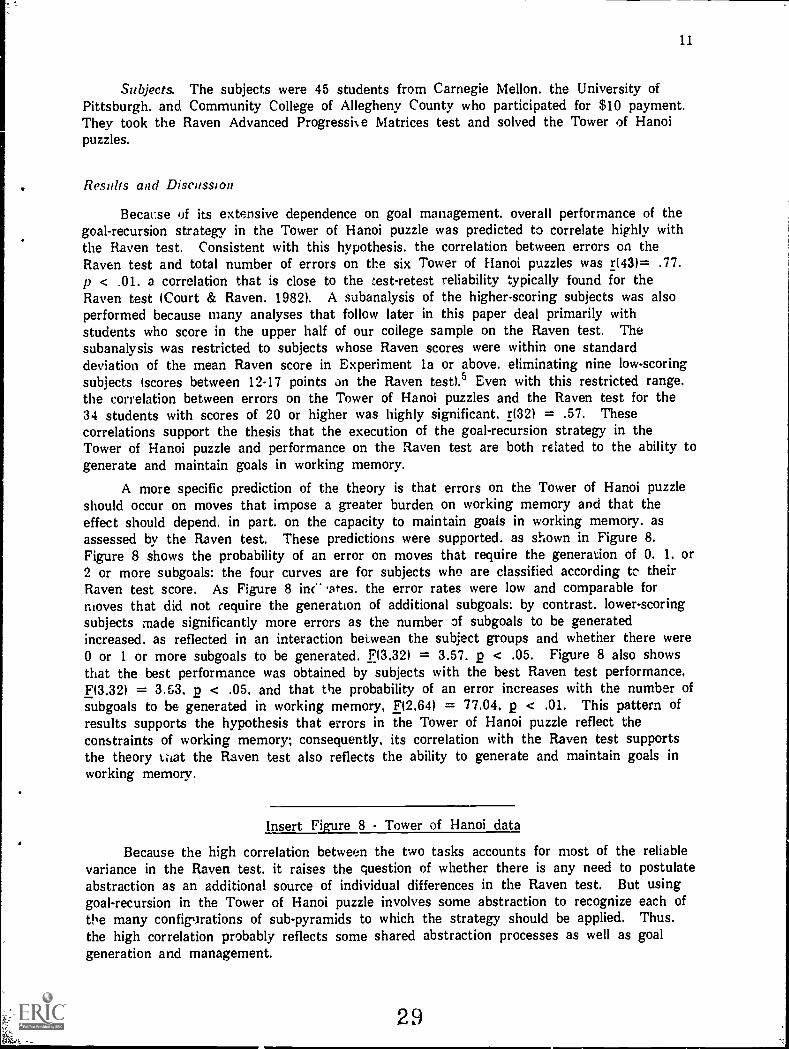
Subjects. The subjects were 45 students from Carnegie Mellon. the University ofPittsburgh. and Community College of Allegheny County who participated for $10 payment.They took the Raven Advanced Progressi% e Matrices test and solved the Tower of Hanoipuzzles.
. Results and Discussion
Because of its extensive dependence on goal management. overall performance of thegoal-recursion strategy in the Tower of Hanoi puzzle was predicted to correlate highly withthe Raven test. Consistent with this hypothesis. the correlation between errors on theRaven test and total number of errors on the six Tower of Hanoi puzzles was r(43)= .77.p < .01. a correlation that is close to the test-retest reliability typically found for theRaven test (Court & Raven. 19821. A subanalysis of the higher-scoring subjects was alsoperformed because many analyses that follow later in this paper deal primarily withstudents who score in the upper half of our college sample on the Raven test. Thesubanalysis was restricted to subjects whose Raven scores were within one standarddeviation of the mean Raven score in Experiment la or above. eliminating nine low-scoringsubjects (scores between 12-17 points on the Raven test).5 Even with this restricted range.the correlation between errors on the Tower of Hanoi puzzles and the Raven test for the34 students with scores of 20 or higher was highly significant. r(32) = .57. Thesecorrelations support the thesis that the execution of the goal-recursion strategy in theTower of Hanoi puzzle and performance on the Raven test are both related to the ability togenerate and maintain goals in working memory.
A more specific prediction of the theory is that errors on the Tower of Hanoi puzzleshould occur on moves that impose a greater burden on working memory and that theeffect should depend. in part. on the capacity to maintain goals in working memory. asassessed by the Raven test. These predictions were supported. as shown in Figure 8.Figure 8 shows the probability of an error on moves that require the generation of 0. 1. or2 or more subgoals: the four curves are for subjects who are classified according to theirRaven test score. As Figure 8 inc" Safes. the error rates were low and comparable formoves that did not require the generation of additional subgoals: by contrast. lower-scoringsubjects made significantly more errors as the number of subgoals to be generatedincreased. as reflected in an interaction between the subject groups and whether there were0 or 1 or more subgoals to be generated. F(3.32) = 3.57. p < .05. Figure 8 also showsthat the best performance was obtained by subjects with the best Raven test performance,F(3.32) = 3.53, p < .05, and that the probability of an error increases with the number ofsubgoals to be generated in working memory, F(2,64) = 77.04, p < .01. This pattern ofresults supports the hypothesis that errors in the Tower of Hanoi puzzle reflect theconstraints of working memory; consequently, its correlation with the Raven test supportsthe theory ti-tat the Raven test also reflects the ability to generate and maintain goals inworking memory.
Insert Figure 8 - Tower of Hanoi data
Because the high correlation between the two tasks accounts for most of the reliablevariance in the Raven test. it raises the question of whether there is any need to postulateabstraction as an additional source of individual differences in the Raven test. But usinggoal-recursion in the Tower of Hanoi puzzle involves some abstraction to recognize each ofthe many configurations of sub-pyramids to which the strategy should be applied. Thus.the high correlation probably reflects some shared abstraction processes as well as goalgeneration and management.
29

0.6
0.5 //
0.4 // .fa30-32
/0.3 / // // / 33-36/0.2 A /// /// /0.1 xi
.......,...-
Raven Score
20-24
7 25-29
t!".".
0 1 2+
NUMBER OF GENERATED ,,UBGOALS
Figure 8. The probability of an error for moves in the Tower of Hanoi puzzle as afunction of the number of subgoals that are generated to enable that move. Thecurves represent subjects in Experiment 2 sorted according to their Raven testscores. from best (33-36 points) to low-medisn (20-25 points) performance.
30

12
The Raven test correlates with other cognitive tests that differ from it in form andcontent. but like the Raven test. appear to require considerable goal management. Oneexample of such a test is an alphanumeric series completion test, which requires the subjectto determine which letter or number should occur next in a series, as in:
1B3D5G7K?? (The answer is 9 P)Such correlations may reflect the fact that both tasks involve considerable goal
generation and management. A theoretical analysis of the series completion task byKotovsky & Simon (1973: Simon & Kotovsky. 1963: Williams. 1972) indicated that theseries completion test. like the Raven test. requires correspondence finding. pairwisecomparison of adjacent corresponding elements, and the induction of rules based on patternsof pairwise similarities and differences. The general similarity of the underlying processesleads to the prediction of correlated performance in the two tasks despite the minimalvisuo/spatial pattern analysis in the series completion task. This construal of the correlationis further supported by the fact that some of the sources of individual differences in theseries completion task are known and converge with our analysis of individual differences inthe Raven test. Applying the Simon and Kotovsky (1963. 1973) model to analyze theworking memory load imposed by different types of series completion problems. it wasfound that problems involving larger working memory loads differentiated between brightand average-IQ children mere than easier problems: this difference suggests that the abilityto handle larger memory loads in the series completion task correlates with IQ (Holzman,Pellegrino & Glaser. 1983). These correlations. as well as the correlation between theRaven test and the Tower of Hanoi puzzie. strongly suggest that a major source ofindividual differences in the Raven test is due to the generation and maintenance of goalsin working memory.
PART II: THE SIMULATION MODELS
In this section. we first describe the FAIRAVEN model which performs comparably tothe median college student in our sample. already a rather high level of performancerelative to the population norms. Then. we will describe the changes required to improveFAIRAVEN's performance to the highest level attained by our subjects. as instantiated bythe BETTERAVEN model.
Overview. The primary goal in developing the simulation models was to specify theprocesses :equired to solve the Raven problems. In particular, the simulations should makeexplicit what distinguishes easier problems from harder problems, and correspondingly, whatdistinguishes among individuals of different ability levels. The simulations were designed toperform in a manner indicated by the performance characteristics observed in Experimentla. namely incremental, re-iterative representation and rule induction.
The general outline of how the model should perform is as follows. The modelencodes some of the figures in the first row of entries, starting with the first pair ofentries. The attributes of the corresponding figures are compared. the remaining entry isencoded and compared with one of the other entries, and then the pattern of similaritiesand differences that emerges from the pairwise comparisons is recognized as an instance ofa rule. In problems involving more than one rule. the model must determine which figuralelements are governed by a common rule. The representation is constructed incrementallyand the rules are induced one by one. This process continues until a set of rules has beeninduced that is sufficient to account for all the variation among the entries in the top row.The second row is processed similarly, and in addition, a mapping is found between therules for the second row and their counterparts in the first row. The rules for the top tworows are expressed in a generalized form and applied to the third row to generate the
31

13
figural elements of the missing entry, and the generated missing entry is selected from theresponse alternatives.
The programming architecture. Both FAIRAVEN and BETTERAVEN are written asproduction systems. a formalism that was first used for psychological modeling by Newelland Simon and their colleagues (Newell. 1973: Newell & Simon. 1972). In a productionsystem. procedural knowledge is contained in modular units called productions. each ofwhich specifies what actions are to be taken when a given set of conditions arises inworking memory. Those productions whose conditions are met by the current contents ofworking memory are enabled to execute their actions. and they thereby change the contentsof working memory (by modifying or adding to the contents). The new status of workingmemory then enables another set of productions. and so another cycle of processing starts.All production systems share these control principles. although they may differ along manyother dimensions (see Klahr. Langley & Neches. 1987).
The particular production system architecture used for these simulations is CAPS (forConcurrent. Activation-based Production System) (Just & Carpenter. 1987: Just & Thibadeau.1984: Thibadeac. Just & Carpenter. 1982). Even though CAPS was constructed on top of aconventional system. OPS4 (Forgy & McDermott. 1977). it deviates in several ways fromconventional production systems. One distinguishing property is that on any given cycle.CAPS permits all the productions whose conditions are satisfied to be enabled in parallel
with each other. Thus CAPS has the added capability of parallelism, in addition to theinherent seriality of a production system. By contrast. conventional production systemsenable only one production per cycle, regardless of how many of them have had theirconditions met. requiring some method for arbitrating among satisfied productions. Anotherdistinguishing property of CAPS is that knowledge elements can have varying degrees ofactivation. whereas in conventional systems. elements are either present or absent fromworking memory. Other properties of CAPS. not used in the present applications, aredescribed elsewhere (Just & Thibadeau. 1984: Thibadeau. Just & Carpenter. 1982).
FAIRAVEN
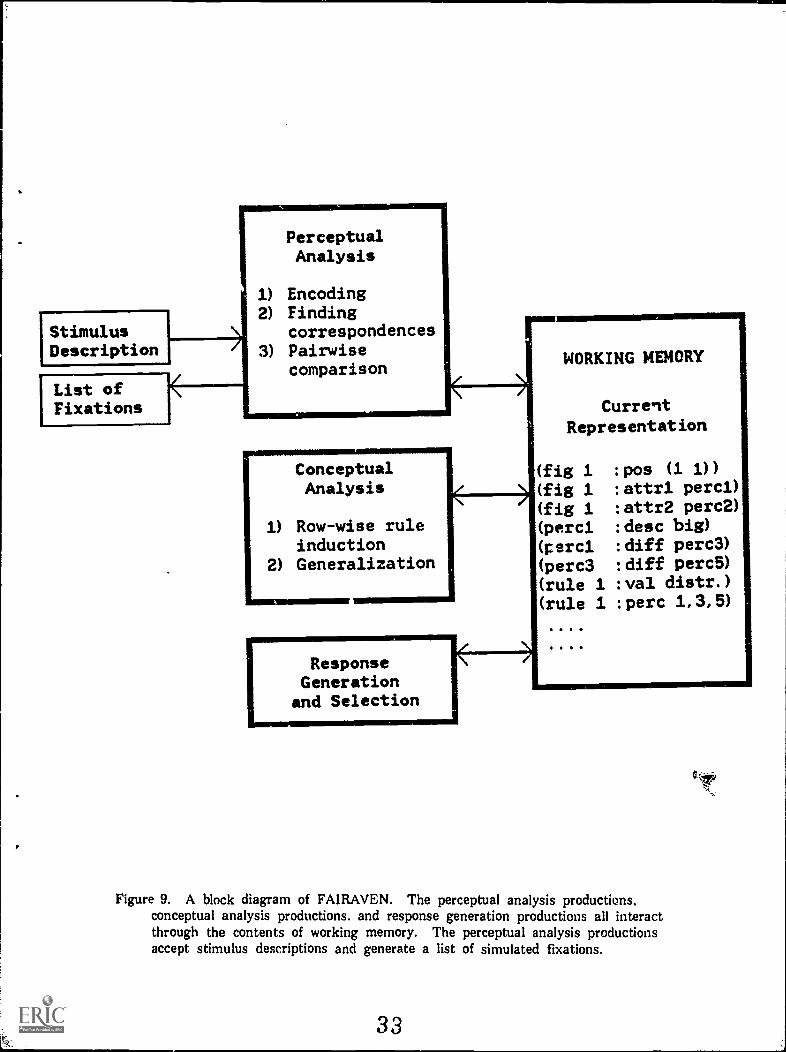
FAIRAVEN consists of 121 productions which can be roughly divided into threecategories: perceptual analysis. conceptual analysis and responding. These three categories,which respectively account for approximately 48%. 40% and 12% of all the productions, areindicated in the block diagram in Figure 9. The productions that constitute the perceptualanalyzer simulate some aspects of the visual inspection of the stimulus. These productionsaccess information about the visual display from a stimulus description file and bring thisinformation into working memory as percepts. These productions also notice some relationsamong percepts. The productions in the conceptual analyzer try to account for thevariation among the entries in one or more rows by inducing rules that relate the entries.The responder uses the induced rules to generate a hypothesis about what the missingmatrix entry should be and it then determines which of the eight response alternatives bestfits that hypothesis. The next sections describe each of the three categories in more detail.This description is followed by a example of how FAIRAVEN solved the problem shown in
Figure 2.
Insert Figure 9 - FAIRAVEN modules
Perceptual analysis
FAIRAVEN operates on a stimulus description that consists of a hand-coded. symbolicdescription of each matrix entry. Thus. the visual encoding processes that generate thesymbolic representation lie outside the scope of the model. This incompleteness does not
32
StimulusDescription
List ofFixations
PerceptualAnalysis
1) Encoding2) Finding
correspondences3) Pairwise
comparison
11110111111.01111011111111111111111M
ConceptualAnalysis
1) Row-wise ruleinduction
2) Generalization
ResponseGenerationGeneration
and Selection
WORKING MEMORY
CurrentRepresentation
(fig 1 :pos (1 1))
(fig 1 :attrl percl)
(fig 1 : attr2 perc2)
(percl :desc big)
(percl :diff perc3)(perc3 :diff perc5)(rule 1 :val distr.)(rule 1 :perc 1,3,5)
Figure 9. A block diagram of FAIRAVEN. The perceptual analysis productions,conceptual analysis productions. and response generation productions all interactthrough the contents of working memory. The perceptual analysis productionsaccept stimulus descriptions and generate a list of simulated fixations.
33
14
compromise our analysis of individual differences, for three reasons. First, the highcorrelations between the Raven t,s-t and other non-visual tests (such as alphanumeric seriescompletion and verbal analogies. shown in Figure la) indicate that visual encoding processesare not a major source of individual differences. Second, our protocol studies of the Raventest suggest that subjects have no difficulty perceiving and encoding the figures in eachentry of a problem. such as squares. lines. angles. and so on. Third, the protocols indicatethat the subjects do have difficulty determining the correspondences among figures andtheir attributes. a process that lies within the scope of the model.
Stimulus descriptions. The perceptual analysis productions operate on a symbolicdescription of each matrix entry and response alternative. To generate these descriptions, anindependent group of subjects was asked to describe the entries in each problem. one entryat a time. without any problem-solving goal. The modal verbal descriptions served as thebasis for the stimulus descriptions. The typical descriptions were in terms of basic-levelfigures (Rosch. 1975) and their attributes. such as a square. a line, striped, and so on. Forexample, the entry in the upper left of the matrix shown in Figure 2 would be describedas a concatenation of two figures. a diamond and a line. with the line having the attributesof orientation (vertical) and texture (dark). The stimulus description of some figurescontained an additional level of detail that was accessed if the base-level description wasinsufficient to establish correspondences. as in the case of embedded figures.
The perceptual analysis is done by three subgroups of productions that 11) encode theinformation about the figures, (2) determine the correspondences and (3) compare the figuresin adjacent entries to obtain a pattern of pairwise similarities and differences. Eachsubgroup is described in turn.
Encoding productions. These productions, the only access path to the stimulusinformation. transfer some or all of the information from the description file into workingmemory when such information is requested. If the entries in a given problem containfigures with several attributes, then FAIRAVEN will go through multiple cycles ofperceptual analysis of the entries in a row, until all the attributes have been analyzed.This behavior of the model was intended to express the incremental processing and re-iterative scanning of the entries that was evident in the human eye fixation patterns.Some of the simulated inspections of the stimulus. like the initial inspection of an entry,are data-driven. If an entry's position in the matrix is specified, one of the encodingproductions returns the names of each figure in that entry and the number of figures, butnot any attribute information. Other inspections can be driven by a specific conceptualgoal, such as the need to determine attributes of a particular figure. If an entry's positionand the name of a figure are specified, one of the encoding productions returns an attributeof the figure and if requested, its value. These encoding productions, which are moreconceptually driven, are evoked after hypotheses are formulated in the course of inducingand verifying rules.
Finding correspondences between figures. In most problems, because more than onerule is operating, it is necessary to conceptually group the figures in a row that areoperated on by each rule. The main heuristic procedure that subjects seem to use is tohypothesize that figures having the same name le.g. line) should be grouped together.Similarly. FAIRAVEN uses a matching- names heuristic, which hypothesizes that figureshaving the same name correspond to each other. A second heuristic rule used byFAIRAVEN is the matching-leftovers heuristic. which hypothesizes that if all but one of thefigures for attributes) in two adjacent entries have been grouped. then those leftover figures(or attributes) correspond to each other. For example, for the problem depicted in Figure2, the matching-names heuristic hypothesizes the correspondence among the three lines andthe matching-leftovers heuristic hypothesizes correspondence among the geometric figuresthat are leftover in each entry.
34
15
FAIRAVEN also tries to establish correspondences between the figures in differentrows by expressing how the rules from a previous row account for the variation in the newrow. usually by generalizing the rule.
Pairwise comparison. The pairwise comparison productions perform the fundamentalperceptual comparisons between figures or attributes that are hypothesized to correspond toeach other. and thus provide the data-base for the conceptual processing. These productionsdetermine whether the elements are the same or different with respect to one of theirattributes. For example. consider a row of three entries consisting of successive sets ofcircles: o 00 000. By comparing the circle in the first entry with the two circles in thesecond entry. these productions would establish that they differ in the attribute ofnumerosity such that the second entry has one more circle. These productions would thendetermine that this difference also characterizes the relation between the second and thirdentries. Both of these differences would be noted in working memory. and would serve asthe input to a production that hypothesizes a systematic variation in the numerosity of thecircles across the three columns. The human counterpart of the pairwise comparisonprocesses may be responsible for the one or more pairs of gazes between two relatedentries in the eye fixation protocols.
Conceptual analysis
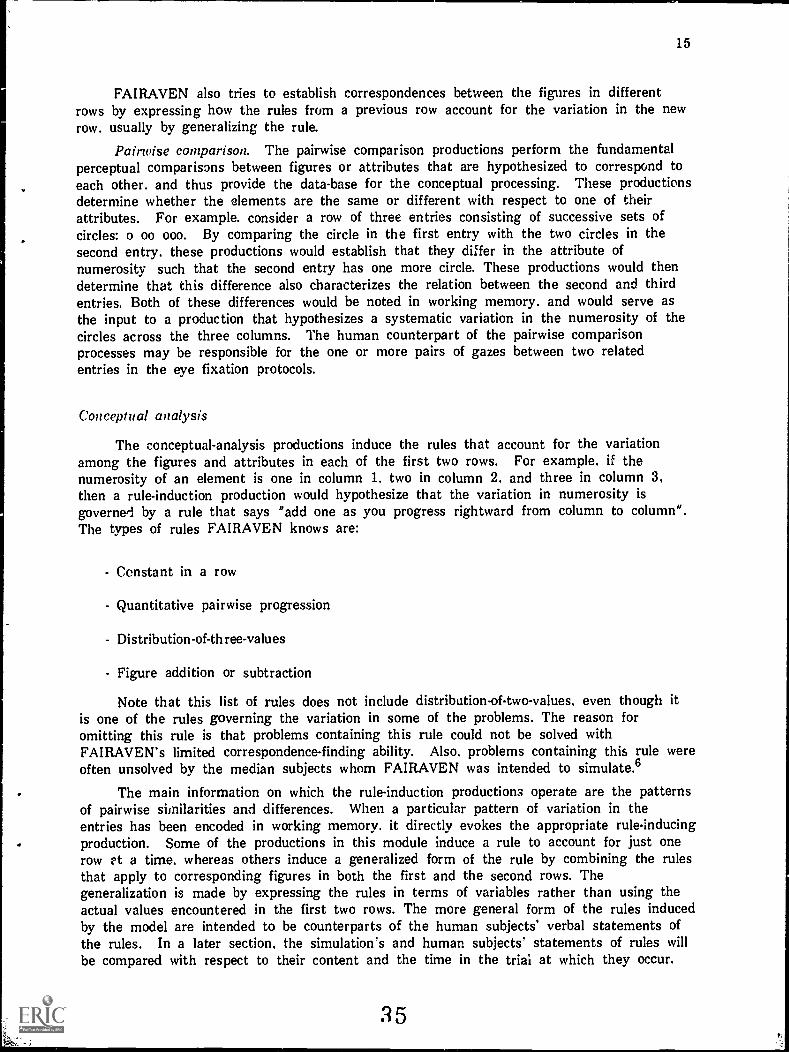
The conceptual-analysis productions induce the rules that account for the variationamong the figures and attributes in each of the first two rows. For example. if thenumerosity of an element is one in column 1. two in column 2. and three in column 3,then a rule-induction production would hypothesize that the variation in numerosity isgoverned by a rule that says "add one as you progress rightward from column to column".The types of rules FAIRAVEN knows are:
- Constant in a row
- Quantitative pairwise progression
- Distribution-of-three-values
- Figure addition or subtraction
Note that this list of rules does not include distribution-of-two-values, even though itis one of the rules governing the variation in some of the problems. The reason foromitting this rule is that problems containing this rule could not be solved withFAIRAVEN's limited correspondence-finding ability. Also, problems containing this rule wereoften unsolved by the median subjects whom FAIRAVEN was intended to simulate.6
The main information on which the rule-induction productions operate are the patternsof pairwise similarities and differences. When a particular pattern of variation in theentries has been encoded in working memory. it directly evokes the appropriate rule-inducingproduction. Some of the productions in this module induce a rule to account for just onerow Pt a time. whereas others induce a generalized form of the rule by combining the rulesthat apply to corresponding figures in both the first and the second rows. Thegeneralization is made by expressing the rules in terms of variables rather than using theactual values encountered in the first two rows. The more general form of the rules inducedby the model are intended to be counterparts of the human subjects' verbal statements ofthe rules. In a later section, the simulation's and human subjects' statements of rules willbe compared with respect to their content and the time in the trial at which they occur.
35
16
The perceptual analysis and the conceptual analysis are applied to the second rowmuch as to the first row. except that the processing of the second row includes oneadditional step. namely establishing correspondences between the figures in the first andsecond rows. The perceptual analysis of the first two entries in the third row is similar tothe analysis of the second row. including encoding. finding correspondences, and doingpairwise comparisons to determine which figures or values vary and which are constant inthe first two entries. When this processing has been done. the response-generationproductions take uver.
Response generation and selection
The productions in this module use the hypothesized rules and the information in thefirst two columns of the third row to generate the missing entry in the third column. Thegeneral form of the rule that applies to the first two rows must be instantiated in terms ofthe specific values encountered in the first two entries in the third row. In problemscontaining more than one rule. the inter-row correspondence between figures indicates whichrules to associate with which figures. Then the instantiated rule (or rules) is applied togenerate the missing entry. FAIRAVEN searches through the response alternatives for onethat adequately matches the generated missing entry.
FAIRAVEN's strategy of generating the figures and attributes of the missing entryand then finding it among the alternatives closely corresponds to what the higher-scoringsubjects die. The lower-scoring subjects sometimes scanned the response alternatives beforeinducing the rules. particularly in the case of the more difficult problems. Otherresearchers have also found that lower-scoring suhjects are more likely to use responseelimination strategies for geometric analogy problems. whereas higher-scoring subjects aremore likely to determine the properties of the desired response before examining theresponse alternatives (Bethell-Fox. Lohman & Snow. 1984: Dillon & Stevenson-Hicks. 1981).
An example of FAIRAVEIV's performance
FAIRAVEN's processes ran be illustrated by describing how the model solves theproblem depicted in Figure 2. FAIRAVEN starts by examining the top row. The variationamong the three entries in a row is found by examining the pairwise similarities anddifferences between the figures and attributes found in adjacent columns. The fiist pairwisecomparison is between the entries in the first and second columns of the top row. Theencoding productions determine that the first entry contains a diamond and line and thesecond entry contains a square and line. The productions that find correspondences use thematching-names heuristic to postulate a correspondence between the lines that occur in thetwo entries. Once a correspondence is found between the lines, the matching-leftoversheuristic is used to postulate a second correspondence between the diamond and the square.FAIRAVEN then compares the entries in the second and third columns. The lines in thesecond and third columns are postulated to correspond to each other. and the square ispostulated to correspond to the triangle. The pattern of variation among the lines evokesthe induction of a rule requiring that each entry in a row contain a line. Note that this isnot the final form of the rule. The pattern of variation among the other figures incorrespondence. namely the diamond. square and triangle. evokes the induction of adistribution-of-three-values rule. such that each row contains one each of a diamond, squareand triangle in its three entries.
After these two rules have been induced, there is a second iteration of inspecting theentries in the first row. In the second iteration, the variation in the texture of the lines isnoted and this evokes the rule that each set of lines in a row has a texture that is eitherblack. striped or clear. On this second and subsequent iterations, one attribute (and its
36

17
value) per figure is perceived. Thus. the total number of iterations on a row depends onthe maximum number of attributes possessed by any of the figures. As the variation ineach additional attribute is discovered. one or more additional rules are induced to accountfor the variation. Thus. the perceptual and conceptual analyses are temporally interwoven.
The order in which the various attributes are processed is determined by the order inwhich they are encoded, which in turn is letermined by their order in the stimulusdescription file. which in turn was guided by their order of mention by the subjects whoonly described the entries. So on the next iteration. FAIRAVEN encodes the orientation ofthe line. The value is vertical for each line. so FAIRAVEN hypothesizes a constant in arow rule. The final (null) iteration reveals no further percepts to be accounted for. soFAIRAVEN proceeds to the second row. Note the similarity of FAIRAVEN's processing tothe protocol of the human subject shown in Table 2, reflecting the incremental re-iterativenature of the processing. For both the model and the subject. there are multiple visualscans of the first row. and in both cases. there is a considerable time interval between theinduction of the different rules.
The processing of the second row closely resembles that of the first row. in that thelines and geometric shapes are encoded. and the correspondence among the lines and amongthe shapes is noticed. The rules governing the geometric shapes. line textures and lineorientation are induced. In addition. the correspondences between the geometric shapes inthe first two rows is noticed. as is the correspondence between the lines, and a mapping ismade between the rules for the two rows. It is noted that the rules governing lineorientation are different in the two rows (constant vertical orientation in the first row,horizontal in the second row). Note that the subject's eye fixation protocol in Table 2 showsa scan of Row 2 interspersed with scattered inspections of Row 1. which may reflect themappings from one row to another.
FAIRAVEN proceeds to Row 3 having formulated a generalized form of the rules,namely distribution of the three geometric shapes. distribution of the three line textures,and a constant orientation of lines in all the entries in a row. The inspection of thegeometric figures in the first two columns of Row 3 indicates which one of the triplet ofshapes is missing (the square). Inspection of the line textures indicates which is missingIthe black). Finally, the orientation of the lines in the first two columns indicates that theconstant value of line orientation will be slanted from upper left to lower right.
The application of the three rules to the knowledge about the first two entries of Row3 is sufficient to correctly generate the missing entry: a square and a line. Only the threeresponse alternatives that c'mtain a square and line (#2, #5, and #8) are given any furtherconsideration. The generated missing entry contains a black slanted (from upper left tolower right) line which matches alternative #5, which is chosen as the answer.
FAIRAVEN solved 23 of the 34 problems it was given, the same as the median scoreof the 12 Carnegie Mellon students in Experiment la. Like the median subjects it isintended to simulate. FAIRAVEN solved the easier problems and could not solve most ofthe harder problems. The point-biserial correlation between the error rate for each problemin Experiment la and a dichotomous coding of FAIRAVEN's success or failure on theproblem was r(32) = .67. p <.01. indicating that the model was more likely to succeed onthe same problems that were solved by more of the human subjects. FAIRAVEN'sperformance on each problem is given in Appendix A. However. we will postpone a detailedanalysis of the errors until Part III.
For the present purposes. the important point is that FAIRAVEN performed credibly.but at the same time, it had several limitations that prevented it from solving moreproblems. rirst. FAIRAVEN had no ability to induce rules that cld not containcorrespont...,g arguments (figures or attributes) in all three columns. Consequently,FAIRAVEN could not solve the problems involving the distribution-of-two-values rule.
37
18
Second, FAIRAVEN had difficulty in problems in which the correspondence among figuralelements is not found by either the matching-names heuristic nor the matching-leftoversheuristic. such as correspondences based on location or texture. In these cases, the initiallyhypothesized correspondences based on figure names did not result in a correct rule, butFAIRAVEN had no way to backtrack. Third. FAIRAVEN had difficulty when too manyhigh-level goals arose at the same time. and FAIRAVEN tried to pursue them concurrently.This situation occurred in problems with three or four rule tokens. when the perceptualevidence to support the multiple rules emerged simultaneously. FAIRAVEN tried toconfirm all the rules in parallel. as CAPS permits. but the resulting bookkeeping load wasunmanageable. In spite of these limitations. it is important to note that this program wasable to perform on an intelligence test as well as some college students. using strategiessimilar to theirs. and exhibiting similar behavior to theirs.
BETTERAVEN
The higher-scoring subjects in our experiments performed better than FAIRAVEN:what psychological processes distinguish them from the median-scoring subjects and fromFAIRAVEN? The BETTERAVEN model is our best current answer. The development ofBETTERAVEN used FAIRAVEN as a starting point and did as little reorganization andaddition as possible. The resulting model. BETTERAVEN. exercises more direct strategiccontrol over its processes. Also. BETTERAVEN can induce more abstract rules based onmore abstract correspondences (permitting null arguments).
BETTERAVEN's improved strategic control necessitated the addition of a fourthcategory of productions. as shown in the block diagram in Figure 10. The new category isa goal monitor that sets strategic and tactical goals. monitors progress towards them. andadjusts the goals if necessary. In addition, the control structure of BETTERAVEN, asgoverned by the goal monitor, is somewhat changed. In BETTERAVEN. only one categoryof productions can be operating at a given time. BETTERAVEN also had some changesmade to the perceptual and conceptual analyzers. The correspondence-finding processes aremore sophisticated. allowing BETTERAVEN to handle rules applying to null arguments,such as a distribution-of-two-values rule. The conceptual analyzer also has more rules in itsrepert; and uses the goal monitor to control the order in which rules are induced. Theresponder is effectively ur inged from FAIRAVEN.
Insert Figure 10 - BETTERAVEN modules
The goal monitor
A module containing 15 productions sets main goals and subgoals for the model. Themain purposes of the goal monitor are to ensure that higher-level processes (namely, ruleinduction) occur serially and not concurrently. to provide an effective serial order forinducing rules (i.e. conflict resolution). to maintain an accounting of the model's progresstowards its goals. and to appropriately modify its path to the solution when a difficulty isencountered. The goal monitor has a knowledge base that contains the goal structure forthis task. For example, when starting to work a new problem. the goal monitor might setthe following goals and subgoals. and keep a record of their satisfaction or non-satisfaction:

StimulusDescription
wW!IIRIMO7
GOAL MONITOR
List ofFixations
PerceptualAnalysis
1) Encoding2) Finding
correspondences3) Pairwise
comparison
WORKING MEMORY
Goal Memory
4 ConceptualAnalysis.
1) Row-wise ruleinduction
2) Generalization
ResponseGenerationand Selection
CurrentRepresentation
(fig 1 :pos (1 1) )
(fig 1 :attrl perci)(fig 1 : attr2 perc2)
(perci :desc big)
(perci :diff perci)(perc3 :diff perc5)(rule 1 :val distr.)(rule 1 :perc 1,3,5)
Figure 10. A block diagram of BETTERAVEN. The distinction from FAIR.AVEN visiblefrom the block diagram is the inclusion of a goal monitor that generates and keepstrack of progress in a goal tree.
3 9
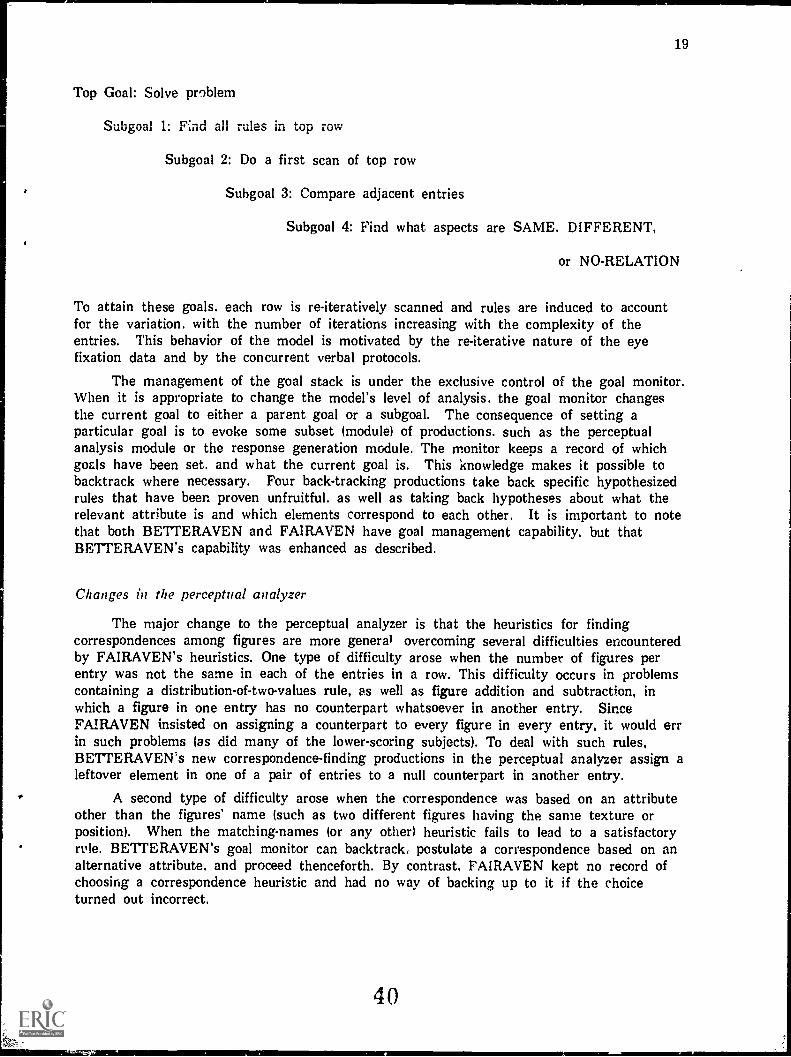
19
Top Goal: Solve problem
Subgoal 1: Find all rules in top row
Subgoal 2: Do a first scan of top row
Subgoal 3: Compare adjacent entries
Subgoal 4: Find what aspects are SAME. DIFFERENT,
or NO-RELATION
To attain these goals. each row is re-iteratively scanned and rules are induced to accountfor the variation. with the number of iterations increasing with the complexity of theentries. This behavior of the model is motivated by the re-iterative nature of the eyefixation data and by the concurrent verbal protocols.
The management of the goal stack is under the exclusive control of the goal monitor.When it is appropriate to change the model's level of analysis. the goal monitor changesthe current goal to either a parent goal or a subgoal. The consequence of setting aparticular goal is to evoke some subset (module) of productions. such as the perceptualanalysis module or the response generation module. The monitor keeps a record of whichgoals have been set. and what the current goal is. This knowledge makes it possible tobacktrack where necessary. Four back-tracking productions take back specific hypothesizedrules that have been proven unfruitful. as well as taking back hypotheses about what therelevant attribute is and which elements correspond to each other. It is important to notethat both BETTERAVEN and FAIRAVEN have goal management capability, but thatBETTERAVEN's capability was enhanced as described.
Changes in the perceptual analyzer
The major change to the perceptual analyzer is that the heuristics for findingcorrespondences among figures are more general overcoming several difficulties encounteredby FAIRAVEN's heuristics. One type of difficulty arose when the number of figures perentry was not the same in each of the entries in a row. This difficulty occurs in problemscontaining a distribution-of-two-values rule, as well as figure addition and subtraction, inwhich a figure in one entry has no counterpart whatsoever in another entry. SinceFAIRAVEN insisted on assigning a counterpart to every figure in every entry, it would errin such problems (as did many of the lower-scoring subjects). To deal with such rules,BETTERAVEN's new correspondence-finding productions in the perceptual analyzer assign aleftover element in one of a pair of entries to a null counterpart in another entry.
A second type of difficulty arose when the correspondence was based on an attributeother than the figures' name (such as two different figures having the same texture orposition). When the matching-names (or any other) heuristic fails to lead to a satisfactoryrtIle. BETTERAVEN's goal monitor can backtrack. postulate a correspondence based on analternative attribute. and proceed thenceforth. By contrast. FAIRAVEN kept no record ofchoosing a correspondence heuristic and had no way of backing up to it if the choiceturned out incorrect.
40

20
Rule induction
BETTERAVEN's rule-induction was improved over FAIRAVEN's by virtue of serialrule induction (imposed by the goal monitor). the presence of a new rule (distribution-of-two-values). and more general rules for figure addition and possible (enabled by the improvedcorrespondence finding). Furthermore. the goal monitor permits BETTERAVEN tobacktrack when a postulated rule fails to account for the variation.
Enforcing seriality in rule induction. In FAIRAVEN's solving of the easier problems.it did no harm to hypothesize all the rules concurrently. because the rules were differentenough and few enough that the processing consequences were manageable. However. inproblems containing more difficult rules and a larger number of rules. the concurrentpostulation of several rules led to several Jifficulties. First. the-?. were competing attemptsto simultaneously account for the same variation with two or more rules. which made thebookkeeping requirements unacceptably large in FAIRAVEN. Second. in problems withmany figures. there w-As so much variation in figures that some of the more arcanevariation did not become evident unless the more mundane variation was first accounted for.or. in some sense. removed. For example. in one of the problems containing two rules. itis much easier for the program land human subjects) to induce a distribution-of-two-valuesrule after the other figures have been accounted for with a figure addition rule. Finally.
man verbal protocols strongly suggested that the subjects attempted to fit only onerules c a ti, :e to the figures. Although CAPS permits parallelism at all levels. attemrt-sparallelism at FAIRAVEN's higher conceptual levels (namely rule induction) wreaked havoc.while parallelism at the lower perceptual levels caused no difficulty.
To improve BETTERAVEN's performance. BETTERAVEN was per 'A to induceonly one rule at a time. and furthermore. productions from the diffeee.: dules were notpermitted to fire concurrently. So the perceptual and conceptual modules BETTERAVENdiffer from each othe. in two respects: the time at which they dominate (early in the trialfor the perceptual module. versus late for the conceptual) and whether they can tolerateconcurrence (concurrence for the perceptual. seriality for the conceptual).
The seriality of rule-induction and consequent processing in BETTERAVEN is enforcedby conflict-resolution rules that arbitrate between any of the rule types that arehypothesized concurrently. The priorities prevent the later rules from firing until the earlierrules have had a chance to try to account for the variation. The priority among the ruletypes in the model is the following.
1. Constant in a row
2. Quantitative pairwise progression
3. Distribution-of-three-values
4. Figure addition or subtrat Jn
5 Distribution-of- two - values
BETTERAVEN's design required that there be an ordering. so that only one rulewould be induced at a time. as it was in the human performance. However.BETTERAVEN's design did not dictate what that ordering should be. Three partialorderings were derived, based largely on several empirical results and logical considerations.First. the priority accorded to the constant in a row rule is based on the fact that itaccounts for the most straightforward. null variation, and is so relatively easy that itsometimes goes unmentioned in the human protocols. However, recall that the data do not
41

21
elim:nat a the possibility that this rule can be induced in parallel with others, so theorclerinp, of this rule type should not be over interpreted. Second. figure addition/subtractionhcc priority over distribution-of-two-values because it accounts for more figures in a row(ea:h of the addends plus the sum. for a total of four figural components), whiledistribution-of-two-values accounts for only two figural components. Finally, quantitativepairwise progression is given priority over the distribui m-of-two-values by human subjects.as we learned from a study briefly described below.
Jan Maarten Schraagen performed a study in our laboratory that compared therelative time of mention of quantitative nairwise progression rules versus distribution-of-two-values rules. To control for the possibility that the order in which rules are induceddepends primarily on the relative salience of the figural components to which they apply,cwo isomorphs of each problem were constructed, differing in which rule applied to whichfigura! elements. For example, in one isomorph a quantitative pairwise progression rulemight apply to the numerosity of lines, and a distribution-of-two-values rule might apply tosome triangles. In the other isomorph. the quantitative pairwise progression rule wouldapply to the triangles. whereas the distribution-of-two-values rule would apply to thenumerosity of lines. There were 86 observations (interpretable verbal protocols in correctlysolved problems). and in 83% of these observations. the pairwise quantitative rule wasinduced before the distribution-of-two-values rule. This empirical finding confirms that atleast part of the order in which the simulation induces the rules corresponds to the orderin which people do.
PART III: COMPARING HUMAN PERFORMANCE TO THE THEORY
In this section. we compare the human performance to the simulation models forthree types of performance measures: (1) error patterns. (2) the content of the rules thatwere induced. and (3) on-line measures. specifically. patterns of eye fixations and verbalreports.
I. Error patterns
As described earlier. FAIRAVEN solved 23 of the 34 problems. which is the medianscore of the 12 subjects in Experiment la. (Recall that only 32 of the problems wereclassifiable within our taxonomy). BETTERAVEN lived up to its name, solving all but thetwo unclassifiable nroblems, similar to the performance of the best subject in Experimentla. Thus, the performance of FAIRAVEN and BETTERAVEN resembles the median andbest performance respectively. The patterns of human errors will be analyzed in more detailbelow, to determine what characteristics of + e problems are associated with the variation inerror rates. Following this analysis, a more detailed comparison will be made between thehuman error patterns and those of the simulation models.
Interpretable patterns of errors emerge when the problems are grouped according tothe properties in our taxonomy. The error rates of problems grouped this way are given inTat:, 3. The rows of the table correspond to different problem types that are distinguishedby the type of rule involved. the number of different types of rules, and the total numberof rules (of any type) and whether some of the problems in that group involved difficultcorrespondence-finding. The error patterns in Experiments la and lb are generallyconsistent with each other. even though the two experiments are not exact replications,because only half of the problems in Experiment lb are from the Raven AdvancedProgressive Matrices test and half are similar problems from the Standard ProgressiveMatrices test.
42
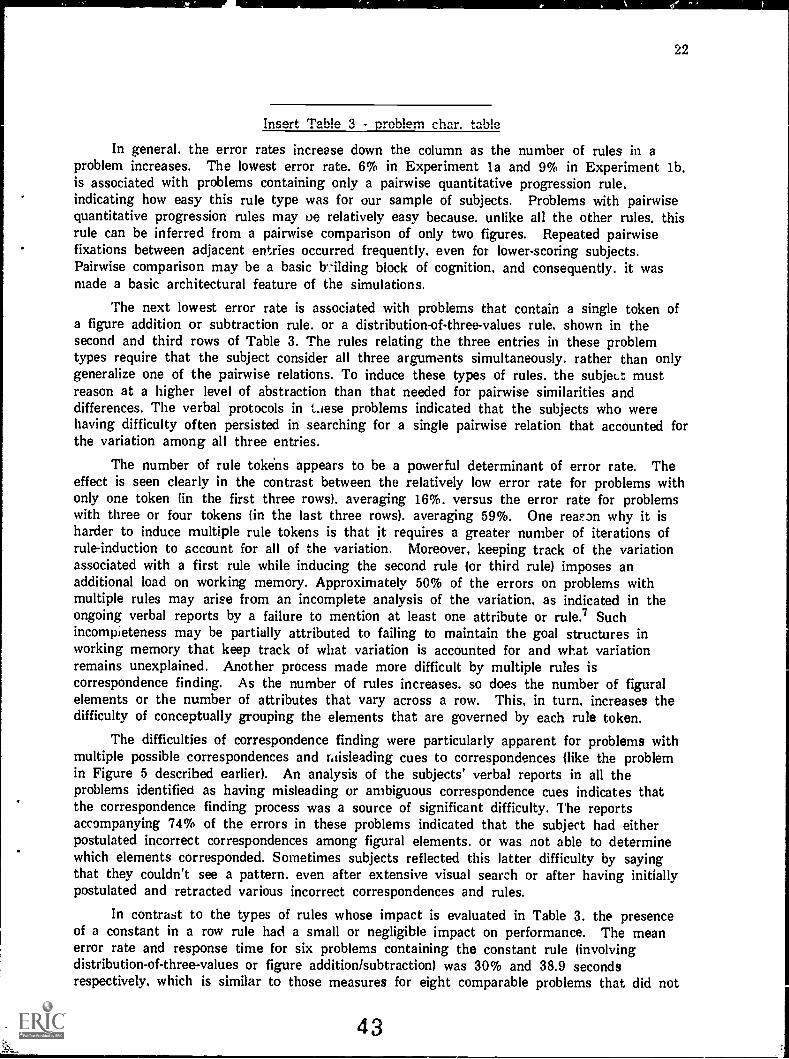
22
Insert Table 3 - problem char. table
In general. the error rates increase down the column as the number of rules in aproblem increases. The lowest error rate. 6% in Experiment la and 9% in Experiment lb,is associated with problems containing only a pairwise quantitative progression rule,indicating how easy this rule type was for our sample of subjects. Problems with pairwisequantitative progression rules may oe relatively easy because. unlike all the other rules, thisrule can be inferred from a pairwise comparison of only two figures. Repeated pairwisefixations between adjacent entries occurred frequently, even for lower-scoring subjects.Pairwise comparison may be a basic b:ilding block of cognition, and consequently. it wasmade a basic architectural feature of the simulations.
The next lowest error rate is associated with problems that contain a single token ofa figure addition or subtraction rule. or a distribution-of-three-values rule. shown in thesecond and third rows of Table 3. The rules relating the three entries in these problemtypes require that the subject consider all three arguments simultaneously. rather than onlygeneralize one of the pairwise relations. To induce these types of rules. the subject mustreason at a higher level of abstraction than that needed for pairwise similarities anddifferences. The verbal protocols in Liese problems indicated that the subjects who werehaving difficulty often persisted in searching for a single pairwise relation that accounted forthe variation among all three entries.
The number of rule tokens appears to be a powerful determinant of error rate. Theeffect is seen clearly in the contrast between the relatively low error rate for problems withonly one token lin the first three rows). averaging 16%. versus the error rate for problemswith three or four tokens lin the last three rows). averaging 59%. One reason why it isharder to induce multiple rule tokens is that it requires a greater number of iterations ofrule-induction to account for all of the variation. Moreover, keeping track of the variationassociated with a first rule while inducing the second rule for third rule) imposes anadditional load on working memory. Approximately 50% of the errors on problems withmultiple rules may arise from an incomplete analysis of the variation, as indicated in theongoing verbal reports by a failure to mention at least one attribute or rule.? Suchincompleteness may be partially attributed to failing to maintain the goal structures inworking memory that keep track of what variation is accounted for and what variationremains unexplained. Another process made more difficult by multiple rules iscorrespondence finding. As the number of rules increases. so does the number of figuralelements or the number of attributes that vary across a row. This, in turn, increases thedifficulty of conceptually grouping the elements that are governed by each rule token.
The difficulties of correspondence finding were particularly apparent for problems withmultiple possible correspondences and rdisleading cues to correspondences (like the problemin Figure 5 described earlier). An analysis of the subjects' verbal reports in all theproblems identified as having misleading or ambiguous correspondence cues indicates thatthe correspondence finding process was a source of significant difficulty. The reportsaccompanying 74% of the errors in these problems indicated that the subject had eitherpostulated incorrect correspondences among figural elements. or was not able to determinewhich elements corresponded. Sometimes subjects reflected this latter difficulty by sayingthat they couldn't see a pattern. even after extensive visual search or after having initiallypostulated and retracted various incorrect correspondences and rules.
In contrast to the types of rules whose impact is evaluated in Table 3. the presenceof a constant in a row rule had a small or negligible impact on performance. The meanerror rate and response time for six problems containing the constant rule (involvingdistribution-of-three-values or figure addition/subtraction) was 30% and 38.9 secondsrespectively, which is similar to those measures for eight comparable problems that did not
43

Table 3
Error rate (X) for different problem types
Numberof RuleTypes
Numberof RuleTokens Rule Type
Experiment
la lb
(n =12) (n =22)
1 1 Pairwise progression 6 9
1 1 Addition/Subtraction 17 13
1 1 Distribution of 3 values 29 25
1 2 Distribution of 3 values 29 21
2 2 Two different rules1'2 48 54
1 3,4 Distribution of 2 values2 56 42
2 4 Distribution of 2, 3 values2 59 54
,1 3 DiLtribution of 3 values2 66 77
1This category is a miscellany of problems that contain two different
rule types, such as addition and distribution-of-three-values, or
quantitative pairwise progression and distribution-of-three-values.
2Corresponding elements are ambiguous or misleading for some or all of the
problems in these categories.
44
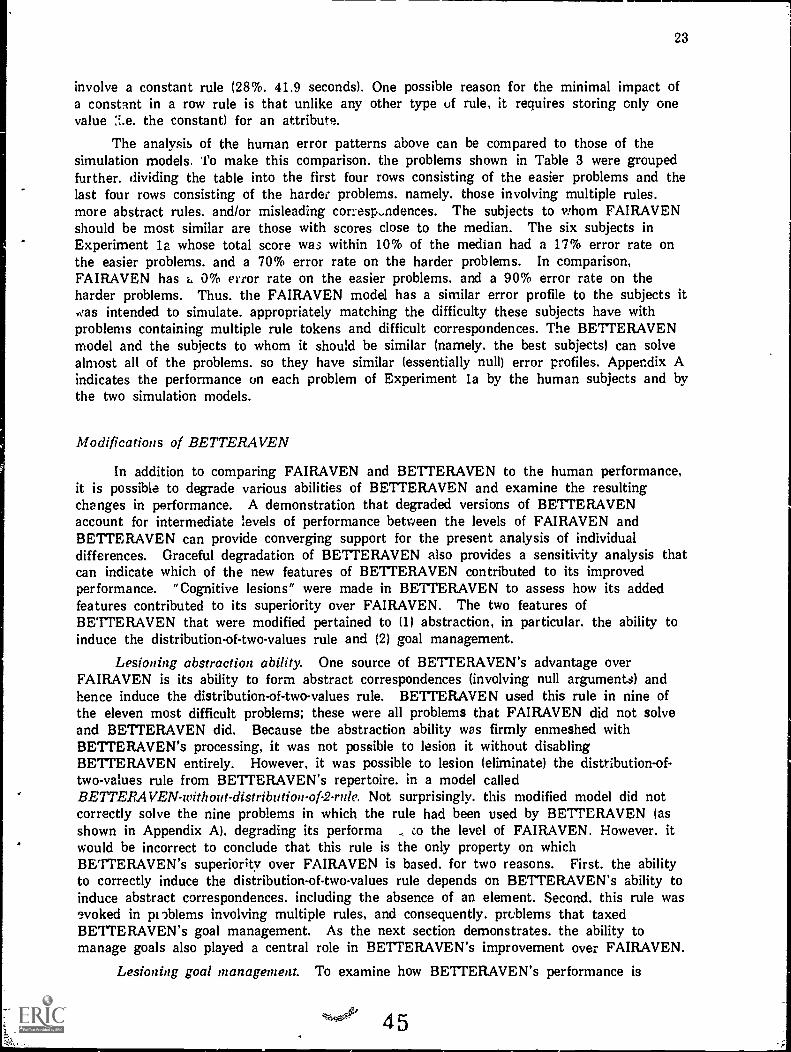
23
involve a constant rule (28%. 41.9 seconds). One possible reason for the minimal impact ofa constant in a row rule is that unlike any other type of rule, it requires storing only onevalue :i.e. the constant) for an attribute.
The analysis of the human error patterns above can be compared to those of thesimulation models. To make this comparison, the problems shown in Table 3 were groupedfurther. dividing the table into the first four rows consisting of the easier problems and thelast four rows consisting of the harder problems. namely. those involving multiple rules.more abstract rules. and/or misleading corresp,ndences. The subjects to whom FAIRAVENshould be most similar are those with scores close to the median. The six subjects inExperiment la whose total score was within 10% of the median had a 17% error rate onthe easier problems. and a 70% error rate on the harder problems. In comparison,FAIRAVEN has i.. 0% error rate on the easier problems. and a 90% error rate on theharder problems. Thus. the FAIRAVEN model has a similar error profile to the subjects it4as intended to simulate. appropriately matching the difficulty these subjects have withproblems containing multiple rule tokens and difficult correspondences. The BETTERAVENmodel and the subjects to whom it should be similar (namely. the best subjects) can solvealmost all of the problems. so they have similar (essentially null) error profiles. Appendix Aindicates the performance on each problem of Experiment la by the human subjects and bythe two simulation models.
Modifications of BETTERAVEN
In addition to comparing FAIRAVEN and BETTERAVEN to the human performance,it is possible to degrade various abilities of BETTERAVEN and examine the resultingchanges in performance. A demonstration that degraded versions of BETTERAVENaccount for intermediate levels of performance between the levels of FAIRAVEN andBETTERAVEN can provide converging support for the present analysis of individualdifferences. Graceful degradation of BETTERAVEN also provides a sensitivity analysis thatcan indicate which of the new features of BETTERAVEN contributed to its improvedperformance. "Cognitive lesions" were made in BETTERAVEN to assess how its addedfeatures contributed to its superiority over FAIRAVEN. The two features ofBETTERAVEN that were modified pertained to (1) abstraction, in particular. the ability toinduce the distribution-of-two-values rule and (2) goal management.
Lesioning abstraction ability. One source of BETTERAVEN's advantage overFAIRAVEN is its ability to form abstract correspondences (involving null arguments) andhence induce the distribution-of-two-values rule. BETTERAVEN used this rule in nine ofthe eleven most difficult problems; these were all problems that FAIRAVEN did not solveand BETTERAVEN did. Because the abstraction ability was firmly enmeshed withBETTERAVEN's processing, it was not possible to lesion it without disablingBETTERAVEN entirely. However, it was possible to lesion (eliminate) the disttibution-of-two-values rule from BETTERAVEN's repertoire. in a model calledBETTERAVEN- without- distribution -of 2 -rule. Not surprisingly. this modified model did notcorrectly solve the nine problems in which the rule had been used by BETTERAVEN (asshown in Appendix A). degrading its performa , co the level of FAIRAVEN. However. itwould be incorrect to conclude that this rule is the only property on whichBETTERAVEN's superiority over FAIRAVEN is based. for two reasons. First. the abilityto correctly induce the distribution-of-two-values rule depends on BETTERAVEN's ability toinduce abstract correspondences. including the absence of an element. Second. this rule wasevoked in pi lblems involving multiple rules, and consequently. problems that taxedBETTE RAVEN's goal management. As the next section demonstrates. the ability tomanage goals also played a central role in BETTERAVEN's improvement over FAIRAVEN.
Lesioning goal management. To examine how BETTERAVEN's performance is
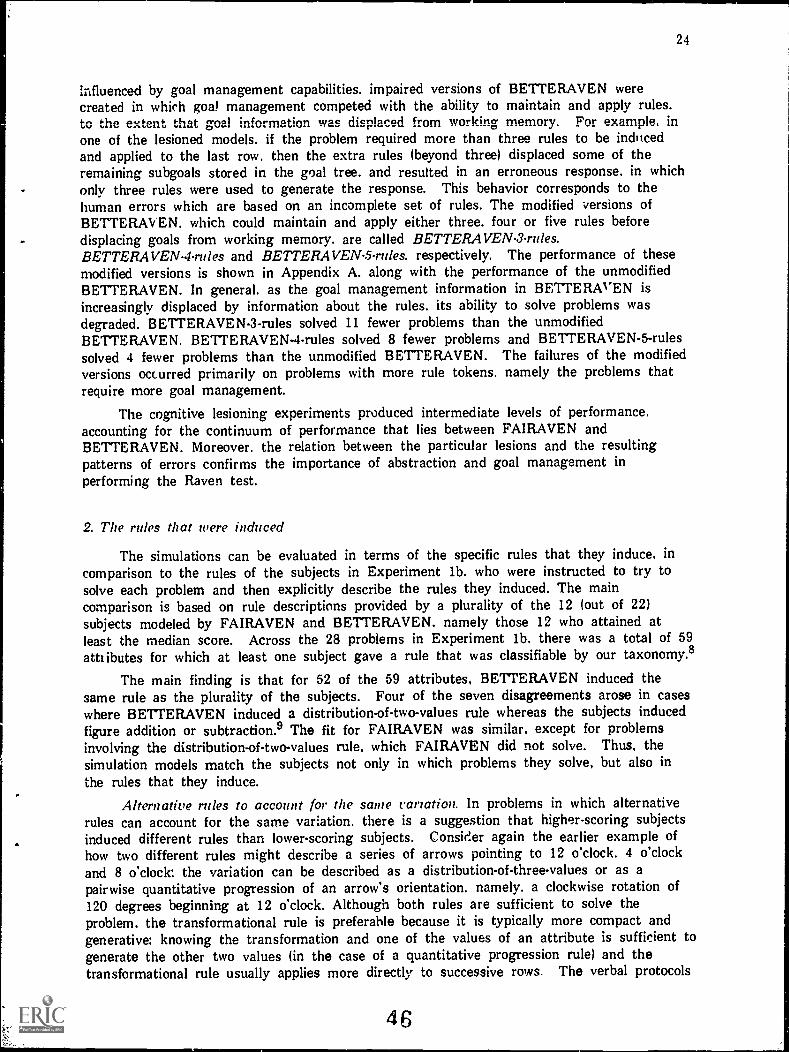
24
influenced by goal management capabilities. impaired versions of BETTERAVEN werecreated in which goal management competed with the ability to maintain and apply rules.to the extent that goal information was displaced from working memory. For example, inone of the lesioned models. if the problem required more than three rules to be inducedand applied to the last row. then the extra rules (beyond three) displaced some of theremaining subgoals stored in the goal tree. and resulted in an erroneous response. in whichonly three rules were used to generate the response. This behavior corresponds to thehuman errors which are based on an incomplete set of rules. The modified versions ofBETTERAVEN. which could maintain and apply either three. four or five rules beforedisplacing goals from working memory. are called BETTERAVEN-3-rules.BETTERAVEN-4-rules and BETTERAVEN-5rules. respectively. The performance of thesemodified versions is shown in Appendix A. along with the performance of the unmodifiedBETTERAVEN. In general. as the goal management information in BETTERAVEN isincreasingly displaced by information about the rules. its ability to solve problems wasdegraded. BETTERAVEN-3-rules solved 11 fewer problems than the unmodifiedBETTERAVEN. BETTERAVEN-4-rules solved 8 fewer problems and BETTERAVEN-5-rulessolved 4 fewer problems than the unmodified BETTERAVEN. The failures of the modifiedversions occurred primarily on problems with more rule tokens. namely the problems thatrequire more goal management.
The cognitive lesioning experiments produced intermediate levels of performance.accounting for the continuum of performance that lies between FAIRAVEN andBETTERAVEN. Moreover. the relation between the particular lesions and the resultingpatterns of errors confirms the importance of abstraction and goal management inperforming the Raven test.
2. The rules that were induced
The simulations can be evaluated in terms of the specific rules that they induce, incomparison to the rules of the subjects in Experiment lb. who were instructed to try tosolve each problem and then explicitly describe the rules they induced. The maincomparison is based on rule descriptions provided by a plurality of the 12 lout of 22)subjects modeled by FAIRAVEN and BETTERAVEN. namely those 12 who attained atleast the median score. Across the 28 problems in Experiment lb. there was a total of 59attributes for which at least one subject gave a rule that was classifiable by our taxonomy.8
The main finding is that for 52 of the 59 attributes, BETTERAVEN induced thesame rule as the plurality of the subjects. Four of the seven disagreements arose in caseswhere BETTERAVEN induced a distribution-of-two-values rule whereas the subjects inducedfigure addition or subtraction.9 The fit for FAIRAVEN was similar, except for problemsinvolving the distribution-of-two-values rule, which FAIRAVEN did not solve. Thus, thesimulation models match the subjects not only in which problems they solve, but also inthe rules that they induce.
Alternative rules to account for the same variation. In problems in which alternativerules can account for the same variation. there is a suggestion that higher-scoring subjectsinduced different rules than lower-scoring subjects. Consider again the earlier example ofhow two different rules might describe a series of arrows pointing to 12 o'clock. 4 o'clockand 8 o'clock: the variation can be described as a distribution-of-three-values or as apairwise quantitative progression of an arrow's orientation. namely. a clockwise rotation of120 degrees beginning at 12 o'clock. Although both rules are sufficient to solve theproblem. the transformational rule is preferable because it is typically more compact andgenerative: knowing the transformation and one of the values of an attribute is sufficient togenerate the other two values (in the case of a quantitative progression rule) and thetransformational rule usually applies more directly to successive rows. The verbal protocols
46
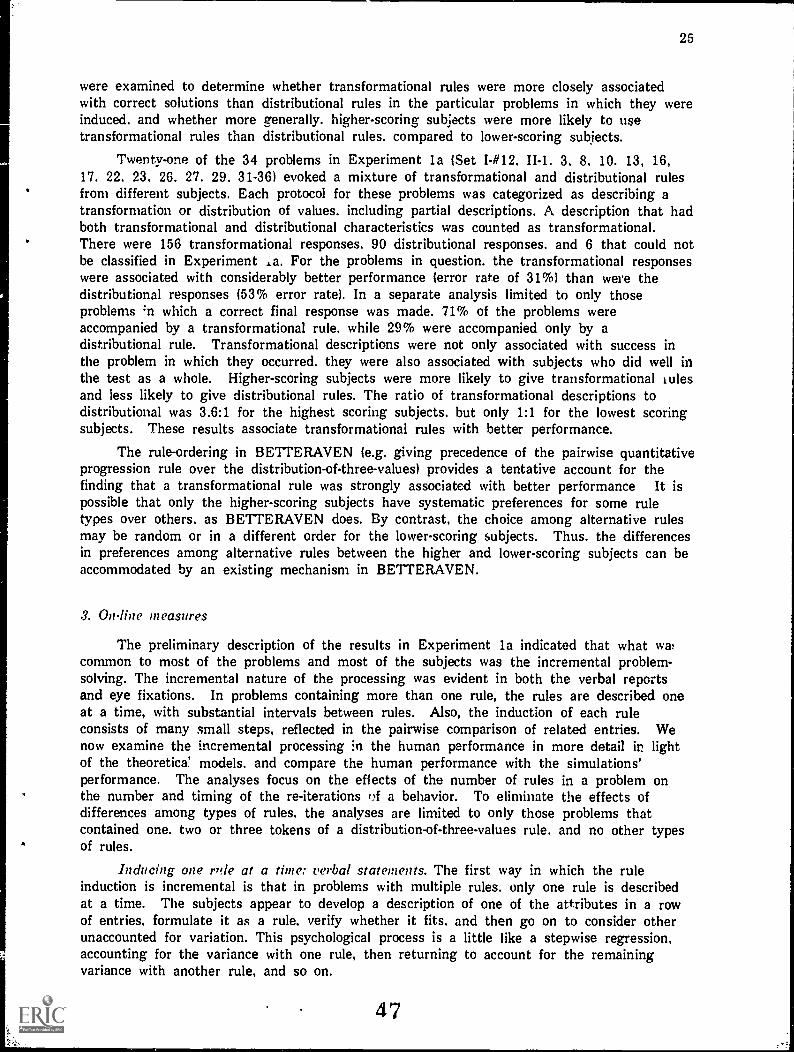
25
were examined to determine whether transformational rules were more closely associatedwith correct solutions than distributional rules in the particular problems in which they wereinduced. and whether more generally. higher-scoring subjects were more likely to usetransformational rules than distributional rules. compared to lower-scoring subjects.
Twenty-one of the 34 problems in Experiment la (Set I-#12. II-1. 3. 8. 10. 13, 16,17. 22. 23. 26. 27. 29. 31-36) evoked a mixture of transformational and distributional rulesfrom different subjects. Each protocol for these problems was categorized as describing atransformation or distribution of values. including partial descriptions. A description that hadboth transformational and distributional characteristics was counted as transformational.There were 156 transformational responses. 90 distributional responses. and 6 that could notbe classified in Experiment La. For the problems in question. the transformational responseswere associated with considerably better performance (error rate of 31%) than were thedistributional responses 153% error rate). In a separate analysis limited to only thoseproblems 'n which a correct final response was made. 71% of the problems wereaccompanied by a transformational rule. while 29% were accompanied only by adistributional rule. Transformational descriptions were not only associated with success inthe problem in which they occurred. they were also associated with subjects who did well inthe test as a whole. Higher-scoring subjects were more likely to give transformational rulesand less likely to give distributional rules. The ratio of transformational descriptions todistributional was 3.6:1 for the highest scoring subjects. but only 1:1 for the lowest scoringsubjects. These results associate transformational rules with better performance.
The rule-ordering in BETTERAVEN (e.g. giving precedence of the pairwise quantitativeprogression rule over the distribution-of-three-values) provides a tentative account for thefinding that a transformational rule was strongly associated with better performance It ispossible that only the higher-scoring subjects have systematic preferences for some ruletypes over others. as BETTERAVEN does. By contrast, the choice among alternative rulesmay be random or in a different order for the lower-scoring subjects. Thus. the differencesin preferences among alternative rules between the higher and lower-scoring subjects can beaccommodated by an existing mechanism in BETTERAVEN.
3. On-line measures
The preliminary description of the results in Experiment la indicated that what waycommon to most of the problems and most of the subjects was the incremental problem-solving. The incremental nature of the processing was evident in both the verbal reportsand eye fixations. In problems containing more than one rule, the rules are described oneat a time, with substantial intervals between rules. Also, the induction of each ruleconsists of many small steps, reflected in the pairwise comparison of related entries. Wenow examine the incremental processing in the human performance in more detail in lightof the theoretical models. and compare the human performance with the simulations'performance. The analyses focus on the effects of the number of rules in a problem onthe number and timing of the re-iterations of a behavior. To eliminate the effects ofdifferences among types of rules. the analyses are limited to only those problems thatcontained one. two or three tokens of a distribution-of-three-values rule. and no other typesof rules.
Inducing one rule at a time: verbal statements. The first way in which the ruleinduction is incremental is that in problems with multiple rules. only one rule is describedat a time. The subjects appear to develop a description of one of the attributes in a rowof entries, formulate it as a rule, verify whether it fits, and then go on to consider otherunaccounted for variation. This psychological process is a little like a stepwise regression,accounting for the variance with one rule, then returning to account for the remainingvariance with another rule, and so on.
47
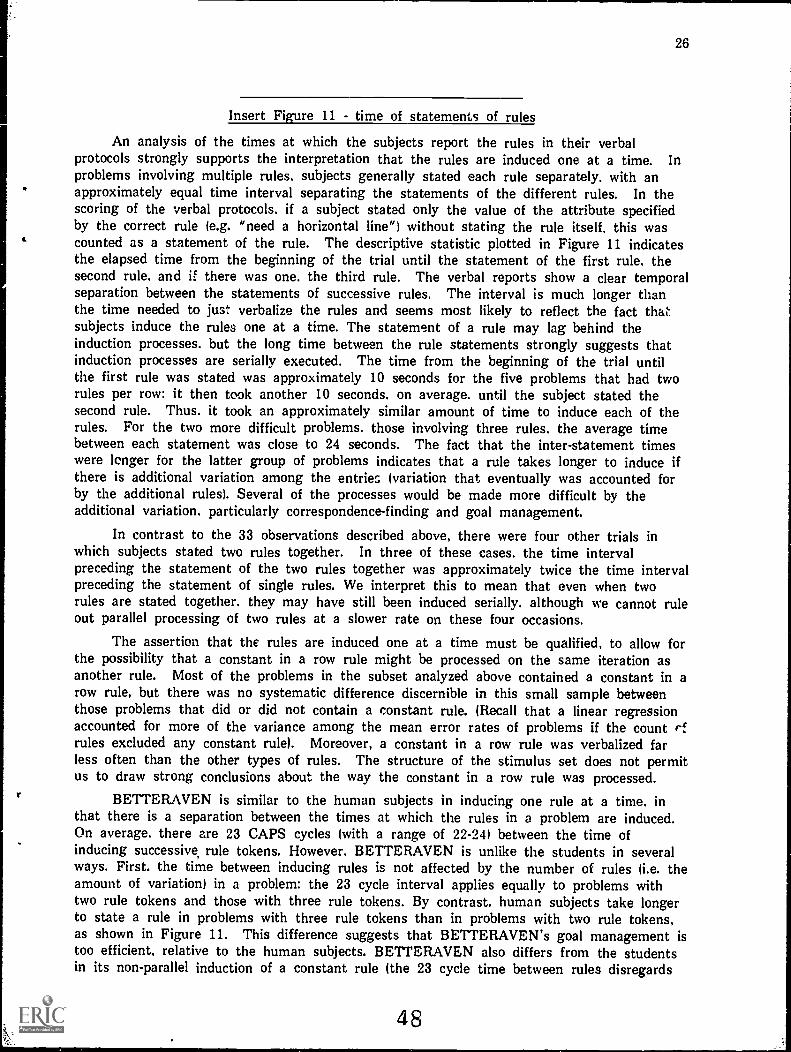
26
Insert Figure 11 - time of statements of rules
An analysis of the times at which the subjects report the rules in their verbalprotocols strongly supports the interpretation that the rules are induced one at a time. Inproblems involving multiple rules. subjects generally stated each rule separately, with anapproximately equal time interval separating the statements of the different rules. In thescoring of the verbal protocols. if a subject stated only the value of the attribute specifiedby the correct rule (e.g. "need a horizontal line") without stating the rule itself, this wascounted as a statement of the rule. The descriptive statistic plotted in Figure 11 indicatesthe elapsed time from the beginning of the trial until the statement of the first rule, thesecond rule. and if there was one. the third rule. The verbal reports show a clear temporalseparation between the statements of successive rules. The interval is much longer thanthe time needed to just verbalize the rules and seems most likely to reflect the fact thaisubjects induce the rules one at a time. The statement of a rule may lag behind theinduction processes. but the long time between the rule statements strongly suggests thatinduction processes are serially executed. The time from the beginning of the trial untilthe first rule was stated was approximately 10 seconds for the five problems that had tworules per row: it then took another 10 seconds. on average. until the subject stated thesecond rule. Thus. it took an approximately similar amount of time to induce each of therules. For the two more difficult problems. those involving three rules. the average timebetween each statement was close to 24 seconds. The fact that the inter-statement timeswere longer for the latter group of problems indicates that a rule takes longer to induce ifthere is additional variation among the entries (variation that eventually was accounted forby the additional rules). Several of the processes would be made more difficult by theadditional variation, particularly correspondence-finding and goal management.
In contrast to the 33 observations described above, there were four other trials inwhich subjects stated two rules together. In three of these cases. the time intervalpreceding the statement of the two rules together was approximately twice the time intervalpreceding the statement of single rules. We interpret this to mean that even when tworules are stated together. they may have still been induced serially. although we cannot ruleout parallel processing of two rules at a slower rate on these four occasions.
The assertion that the rules are induced one at a time must be qualified, to allow forthe possibility that a constant in a row rule might be processed on the same iteration asanother rule. Most of the problems in the subset analyzed above contained a constant in arow rule, but there was no systematic difference discernible in this small sample betweenthose problems that did or did not contain a constant rule. (Recall that a linear regressionaccounted for more of the variance among the mean error rates of problems if the count rfrules excluded any constant rule). Moreover, a constant in a row rule was verbalized farless often than the other types of rules. The structure of the stimulus set does not permitus to draw strong conclusions about the way the constant in a row rule was processed.
BETTERAVEN is similar to the human subjects in inducing one rule at a time, inthat there is a separation between the times at which the rules in a problem are induced.On average, there are 23 CAPS cycles (with a range of 22-24) between the time ofinducing successive, rule tokens. However. BETTERAVEN is unlike the students in severalways. First. the time between inducing rules is not affected by the number of rules (i.e. theamount of variation) in a problem: the 23 cycle interval applies equally to problems withtwo rule tokens and those with three rule tokens. By contrast. human subjects take longerto state a rule in problems with three rule tokens than in problems with two rule tokens,as shown in Figure 11. This difference suggests that BETTERAVEN's goal management istoo efficient, relative to the human subjects. BETTERAVEN also differs from the studentsin its non-parallel induction of a constant rule (the 23 cycle time between rules disregards
48
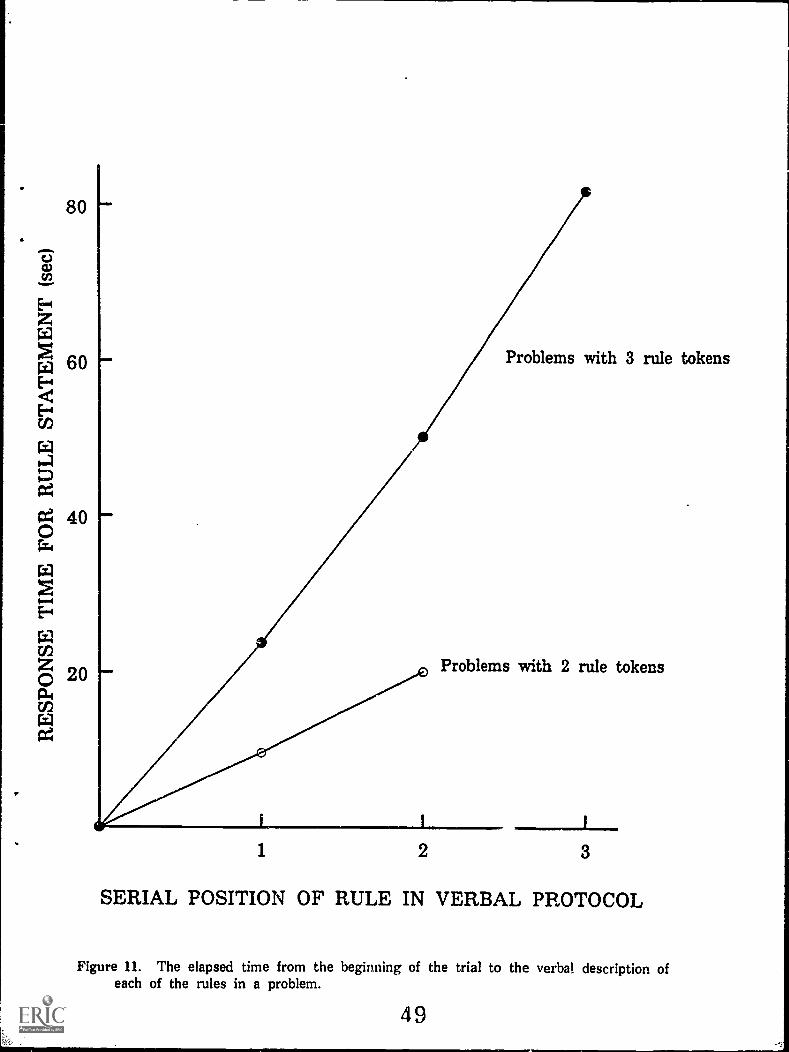
80
60
40
20
Problems with 3 rule tokens
Problems with 2 rule tokens
1 2 3
SERIAL POSITION OF RULE IN VERBAL PROTOCOL
Figure 11. The elapsed time from the beginning of the trial to the verbal description ofeach of the rules in a problem.
49

27
any induction of constant rules). In this respect. BETTERAVEN seems less efficient thanthe human subjects, who may be able to induce a constant rule in parallel with anotherrule.
Inducing one rule at a time: Eye fixation patterns. Another way to demonstrate thatthe rules are induced one at a time is to compare the eye-fixation performance on problemscontaining increasing numbers of rules. looking for evidence of re-iterations for problemswith different numbers of rules. One of the most notable properties of the visual scan wasits row-wise organization. consisting of repeated scans of the entries in a row. There was astrong tendency to begin with a scan of the top row and to proceed downward tohorizontally scan each of the other two rows. with only occasional looks back to apreviously scanned row. (This description applies particularly well to problems involvingquantitative pairwise progression rules or addition or subtraction rules. and slightly less wellto the problems in the subset that is being analyzed here. involving multiple distribution-of-three-values rules. In the latter problems. subjects also used a row organization. but theysometimes looked back to previously scanned rows). So it is reasonable to ask whetherthere is a dependence between the number of scans through the rows and the number ofrules.
The data indicate that in general. the number of times that subjects visually scanneda row (or a column. or occasionally. a diagonal) increased with the number of rules in theproblem. A scan of a row was defined as any uninterrupted sequence of gazes on all threeof the entries in that row. allowing re-fixation of any of the entries (and was similarlydefined for a column scan)1°. The analysis showed that as the number of rule tokens in aproblem increases from 1 to 2 to 3. the number of row scans increases from 7.2 to 11 to25. as shown in the upper panel of Figure 12. It is likely that during the multiple scansassociated with each rule. the rule is being induced and verified.
Insert Figure 12 -row scans and pairwise scans
Incremental processing in inducing a rule. There are many small steps in inducingeach rule. For example. in a problem containing a quantitative pairwise progression rule,BETTERAVEN can induce the rule in a tentative form after a pairwise comparison betweenthe entries in the first two columns in the row. Then the second and third columns canbe compared and a tentative rule induced, followed by a higher-order comparison thatverifies or disconfirms the correctness of the tentative rules. In the case ofdisconfirmations, all of the preceding processes must be re-executed, generating additionalpairwise comparisons. Thus, there are re-iterative cycles of encoding stimulus properties,comparing properties between entries, inducing a rule, and verifying the rule's adequacy.
As the number of rules increases, so should the number of pairwise similarities anddifferences to be encoded, and consequently, the number of pairwise comparisons. The eyefixation data provide clear evidence supporting this prediction. A pairwise scan was definedas any uninterrupted sequence of at least three gazes alternating between any two entries,excluding those that were pai',, of a row or column scan because they had already beenincluded in the row-scanning measures described above. Consistent with the theoreticalprediction, as the number of rule tokens in a problem increased from 1 to 2 to 3. themean number of pairwise scans (of any length) increased from 2.3 instances to 6 to 16.2,as shown in the upper panel of Figure 12.
We can also determine whether the difficulty of making a pairwise comparison (asindicated by the sequence length of a pairwise scan) also increases in the presence ofadditional variation between the entries (as indicated by the number of rules). As shown inthe lower panel of Figure 12, the number of rules in the problem had no effect on themean sequence length of the pairwise scans. Thus, the pairwise scans may reflect some
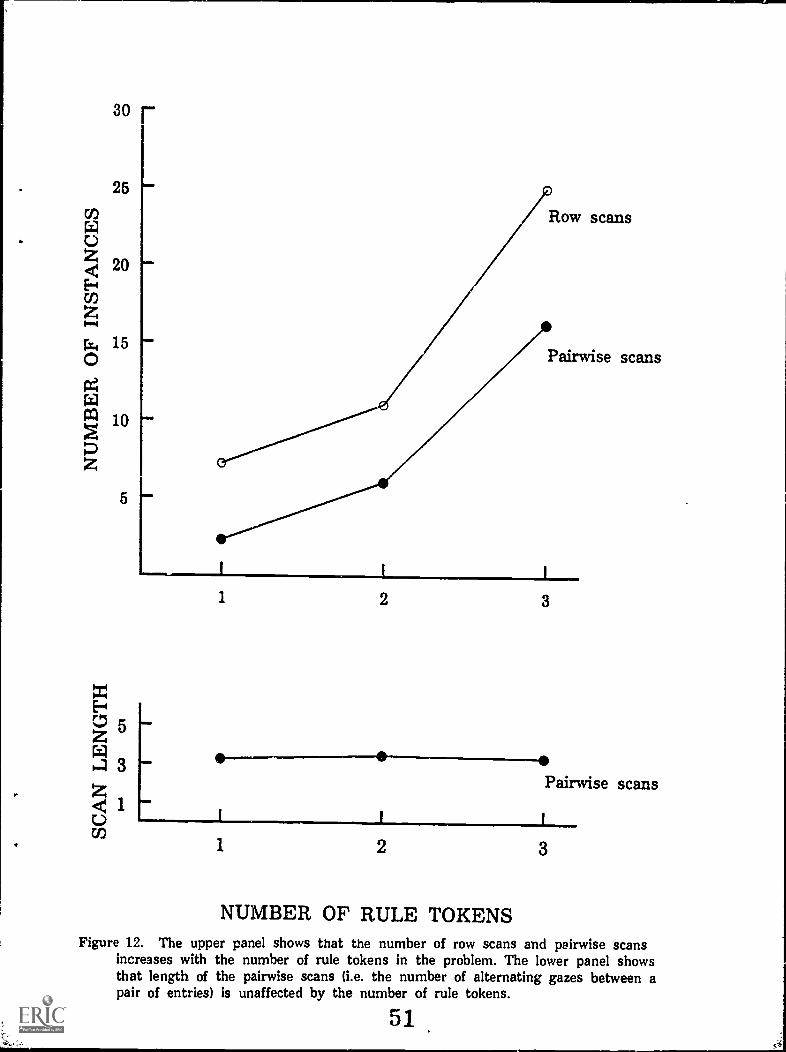
30r
25
CoW0
20ElCo
4r., 150gW
104Z
z5
Z
4 10 1 1
cn
1 2 3
Pairwise scans
1 2 3
NUMBER OF RULE TOKENSFigure 12. The upper panel shows that the number of row scans and pairwise scans
increases with the number of rule tokens in the problem. The lower panel showsthat length of the pairwise scans tie. the number of alternating gazes between apair of entries) is unaffected by the number of rule tokens.
51

28
primitive comparison process that pertains to the induction of a single rule token and isuninfluenced by the presence of additional variation between the entries. This result isconsistent with a theory that says that difficult problems are dealt with incrementally, bydecomposing the solution into simple subprocesses. So some subproce;ses, like thecomparison of attributes of two elements. should remain simple in the face of complexitylas shown in the lower panel of Figure 121. even as other performance measures do showcomplexity effects (as shown in the upper panel). The decomposition implied by the variousforms of incremental processing observed here is probably a common way of dealing withcomplexity.
Limitations of the model
At both the micro and macro levels. FAIRAVEN and BETTERAVEN performcomparably to the college students that they were intended to model. They solveapproximately the same subsets of problems as the corresponding students. and they inducesimilar sets of rules. Also. the simulations resemble the students in their reliance onpair wise comparisons and in their sequential induction of the rules. The simulations areboth sufficient and plausible descriptions of the organization of processes needed to solvethese types of problems. The commonalities oi the two programs. namely, the incremental.re-iterative processing. express some of the fundamental characteristics of problem solving.The differences between the programs. namely. the nature of the goal management andabstraction, express the main differences among the individuals with respect to theprocessing tapped by this task. Although the simulations match the human data alongmany dimensions of performance. there are also differences. In this section. we addressfour such differences and their possible relation to individual differences in analyticintelligence.
Perhaps the most obvious difference between the simulations and the humanperformance is that the simulations lack the perceptual capabilities to visually encode theproblems. However, as we argued earlier, this does not compromise our analysis of thenature of individual differences because numerous psychometric studies suggest that thevisual encoding processes are not sources of individual differences in the Raven test. Thisis not to say that visual encoding and visual parsing processes do not contribute to theRaven test's difficulty, but only that such processet:' are not a primary source of individualdifferences. In addition. the success of the simulation models suggests that the strictlyvisual quality of the problems is not an important source of individual differences: analogousproblems in other modalities containing haptic or verbal stimuli would be expected tosimilarly tax goal management and abstraction.
A second di _fence is that the simulations, unlike the students, don't read theinstructions and organize their processes to solve the problems. Although this mobilizationof processes is clearly an important part of the task and an important part of intelligence,it is an unlikely source of individual differences for this population. All of the collegestudents could perform this task sufficiently well to solve the easier. quantitative pairwisecomparison problems. Moreover, even though the meta-processes that assemble andorganize the processes lie outside the scope of the current simulation. they could beincorporated without fundamentally altering the programs or their architecture (see. forexample. Williams. 19721. .
A third feature that might appear to differentiate the simulations from humansubjects is the difference between rule induction and rule recognition. FAIRAVEN andBETTERAVEN are given a set of possible rules and they only have to recognize whichones are operating in a given problem. rather than induce the rules "from scratch."However, with the notable exception of the distribution-of-two-values rule. the other rules arecommon forms of variation that were correctly verbally described by all subjects in some
52

.
`7
29
problems. Hence. the individual differences were not in the knowledge of a particular ruleso much as in recognizing it among other variation in problems with multiple rule tokens.By contrast. knowledge of the distribution-of-two-values rule did appear to be a source ofindividual differences. We account for its unique status in terms of its abstractness andunfamiliarity. In fact. we express the better abstraction capabilities of BETTERAVEN bothin terms of its ability to handle a larger set of patterns of differences and in its explicitknowledge of this rule. Thus. the difference between the two simulations expresses onesense in which knowledge of the rules distinguishes among individuals. On the other hand.BETTERAVEN does not have the generative capability of inducing all of the various typesof abstract rules that one might encounter in these types of tasks: in this sense. it fallsfar short of representing the full repertoire of human induction abilities.
A fourth limitation of the models is that they are based on a sample of collegestudents who represent the upper end of the distribution of Raven scores and so thetheoretical analysis cannot be assumed to gene:alize throughcut the distribution. We wouldargue. however. that the characteristics which differentiate college students, namely, goalmanagement and abstraction. probably continue to characterize individual difference>throughout the population. But there is also evidence that low-scoring subjects sometimesuse very different processes on the Raven test. which could obscure the relationshipbetween Raven test performance and working memory for such individuals. For example.as mentioned previously, low-scoring subjects rely more on a strategy of eliminating some ofthe response alternatives. fixating the alternatives much sooner than high-scoring subjectsIBethell-Fox. Lohman & Snow. 1984: Dillon & Stevenson-Hicks. 1981). Moreover. the typesof errors made by low-scoring adults frequently differ from those made by high-scoringsubjects (Forbes. 1964) and may reflect less analysis of the problem.
If such extraneous processes are decreased and low-scoring subjects are trained to usethe analytic strategies of high-scoring subjects. the validity of the Raven test increases.The study. with 425 Navy recruits. found that for low-scoring subjects. the correlationbetween the Raven test and a wide-ranging aptitude battery increased significantly (from .08to .43) when the Raven problems were presented in a training program that was designedto reduce non-analytic strategies (Larson. Alderton & Kaupp. 1990). The training did notalter the correlation between the Raven test and the aptitude battery for subjects in theupper half of the distribution. The fad that the performance of the trained low-scoring andall of the high-scoring subjects correlated with the same aptitude battery suggests that aftertraining, the Raven test drew on similar processes for each group. Thus, it is plausible tosuppose that the current model could be generalized to account for the performance ofsubjects in the lower half of the distribution if they are given training to minimize theinfluence of extraneous processes.
Part IV: COGNITIVE PROCESSES AND HUMAN INTELLIGENCE
This section discusses the implications of the model for analytic intelligence. Thefirst sections examine how abstraction and goal management are realized in other cognitivetasks. These sections focus primarily on goal management rather than abstraction. in partbecause abstraction is implicitly or explicitly incorporated into many theories of analyticintelligence. whereas goal management has received less attention. The final sectionexamines what the Raven simulations suggest about processes that are common acrosspeople and across different domains.
53

30
Abstraction
Most intuitive conceptions of intelligence include an ability to think abstractly, andcertainly solving the Raven problems involves processes that deserve that label. Abstractreasoning consists of the construction of representations that are only loosely tied toperceptual inputs. and instead are more dependent on high-level interpretations of inputsthat provide a generalization over space and time. In the Raven test. more difficultproblems tended to involve more abstract rules than the less difficult problems.(Interestingly. it intuitively seems as though the level of abstraction of even the motdifficult rule. distribution-of-two-values. is not particularly great compared to the abstractionsthat are taught and acquired in various academic domains. such as physics or politicalscience). The level of abstraction also appears to differentiate the tests intended forchildren from those intended for adults. For example. one characterization of the easyproblems found in the practice items of Set I and in the Colored Progressive Matrices isthat the solutions are closely tied to the perceptual format of the problem and,consequently. can be solved by perceptual processes (Hunt. 1974). By contrast, theproblems that require analysis. including most of the problems in Set II of the AdvancedProgressive Matrices. are not as closely tied to the perceptual format and require a moreabstract characterization in terms of dimensions and attributes.
Abstract reasoning has been a component of most formal theories of n,telligence.including those of traditional psychometricians. such as Thurstone 11938). and more recentindividual difference researchers (Sternberg. 1985). Also, Piaget's theory of intelligencecharacterizes childhood intellectual development as the progression from the concrete to thesymbolic and abstract. We can now see precisely where the Raven test requires abstractionand how people differ in their ability to reason at various levels of abstraction in the Ravenproblems.
Goal management
One of the main distinctions between higher-scoring subjects and lower-scoring subjectss the ability of the better subjects to successfully generate and manage their problem-
solving goals in working memory. In this view, a key component of analytic intelligence isgoal management. the process of spawning subgoals from goals. and then tracking theensuing successful and unsuccessful pursuits of the suor is on the pafli to satisfyinghigher-level goals. Goal management enables the problem-solver to construct a stableintermediate form of knowledge about his progress (Simon, 1969). In Simon's words "...complex systems will evolve from simple systems much more rapidly if there are stableintermediate forms than if there are not. The resulting complex forms in the former casewill be hierarchic ..." (p. 98). The creation and storage of subgoals and their interrelationspermit a person to pursue tentative solution paths while preserving any previous progresshe has made. The decomposition of the complexity in the Raven test and many otherproblems consists of the recursive creation of solvable subproblems. The benefit of thedecomposition is that an incremental iterative attack can then be applied to the simplifiedsubproblems. A failure in one subgoal need not jeopardize previous subgoals that weresuccessfully attained. Moreover. the record of failed subgoals minimizes fruitless re-iterationalong previously failed paths. But the cost of creating embedded subproblems. each withtheir own subgoals. is that they require the management of a hierarchy of goals.
Goal management probably interacts with another determinant of problem difficulty,namely the novelty of the problem. A novel task may require the organization of high-levelgoals. whereas the goals in a routine task have already been used to compile a set ofprocedures to satisfy them, and the behavior can be much more stimulus-driven (Anderson,1987. The use or organization of goals is a strategic level of thought, possibly involving

31
meta-cognition. or requiring reflection. In the BETTERAVEN model. additional goalmanagement mechanisms like selection among multiple goals, a goal monitor. and backupfrom goals. had to be ;ncluded to solve the more difficult problems. However. if peoplehad extensive practice or instruction on Raven problems. the goal management wouldbecome routine. and the problems thereby easier. Instruction of sixth graders in the use ofthe type of general strategy used by FAIRAVEN and BETTERAVEN improves their scoreson Set I of the Raven test (Lawson & Kirby. 1981).
This analysis of the source of individual differences in Raven test should apply toother complex cognitive tasks as well. The generality of the analysis is supported byExperiment 2. which found a large correlation between the Laven test and the execution ofa Tower of Hanoi puzzle strategy that places a large burden on goal generation and goalmanagement. The present analysis is also consistent with the high correlations amongcomplex reasoning tasks with diverse content. such as the data cited in the introduction(Snow. Kyllonen & Marshalek. 1984: Marshalek. Lohman & Snow. 1983). These researchersand others have suggested that the correlations among reasoning tasks may reflect higher-level processes ,,hat are shared. such as executive assembly and control processes (see alsoCarroll. 1976: Fteraberg. 1985). The contribution of the current analysis is to specify thesehigher-level processes and instantiate them in the context of a widely used and complexpsychometric test.
The RAVEN test's relation to other analogical reasoning tasks
The analogical nature of the Raven problems suggests that the Raven processingmodels should bear some resemblance to other models of analogical reasoning. One of theearliest such AI projects was Evans' ANALOGY program (1968). which solved geometricanalogies of the form (A:B :: Clfive choices]). Evans' program had three main steps.The program computed the spatial transformation that would transform A into B usingspecific knowledge of analytic geometry. It then determined the transformation necessaryto transform C into each of the five possible answers. Finally, it compared and identifiedwhich solution transformation was most similar to that for transforming A into B. andreturned the best choice. A major contribution of ANALOGY was that it specified thecontent of the relations and processes that were sufficient to solve problems from theAmerican Council on Education examination. Although ANALOGY was not initiallyintended to account for human performance, Mulholland. Pellegrino & Glaser (1980) foundaspects of the model did account for the pattern of response times and errors in solving 2x 2 geometric analogies. Both errors and response times increased with the number ofprocessing operations, which Mulholland et al. attributLI to the increased burden on workingmemory incurred by tracking elements and transformations. Thus, much simpler analogicalreasoning tasks can reflect working memory constraints.11
Analogical reasoning in the context of simple 2 x 2 matrices has also been analyzedfrom the perspective of individual differences. The theoretical issue has been whetherindividual differences in the speed of specific processes (such as inferentng, mapping.verifying) account for individual differences in more complex induction tasks. like the Raventest. For example. Sternberg and Gardner 11983) found that a speed measure based on avariety of inference processes used in simple analogical and induction tasks was correlatedwith psychometrically-assessed reasoning ability. However, several other studies have failedto find significant correlations between the speed of specific inference processes andperformance in a more complex reasoning task (Mulholland et al. 1980: Sternberg. 1977).The overall pattern of results suggests that the speed of any specific inference process isunlikely to be a major determinant of goal management. This conclusion is also supportedby the high correlation between the Raven test and the Tower of Hanoi puzzle, a task thatrequired very little induction. ;evertheless, some degree of iiiciency in the more task-
55

32
specific processes may be a necessar, (if not sufficient) condition to free up working-memoryresources for goal generation and management. The analysis of reasoning in simpleanalogies illuminates the task-specific inference processes. but is unlikely to account for theindividuai differences in the more complex reasoning tasks.
What aspects of intelligence are common to everyone?
The Raven test grew out of a scientific tradition that emphasizes the analysis ofintelligence through the study of individual differences. The theoretical goal of thepsychometric or differential approach (in contrast to its methodological reliance on factoranalysis) is to account for individual performance. not simply some statistical average ofgroup performance. The negative consequence of this approach is that it can conceptuallyand empirically exclude those processes that are necessary for intelligent behavior, but arecommon to all people. and hence not the source of significant differences among individuals.Computational models such as the Raven simulations must include both the processes thatare common across individuals and those that are sources of significant differences.Consequently. the models provide insights into some of the important aspects of intelligence,such as the incremental and re-iterative nature of reasoning.
Cognitive accounts of other kinds of ability, such as models of sp tiai ability fe.g. Just& Carpenter. 1985: Kosslyn. 1980: Shepard & Cooper. 1982) and language ability (e.g. Just& Carpenter. 1987: van Dijk & Kintsch. 1983) also contribute to the characterizations ofintelligence. Newell has argued that psychology is sufficiently mature to warrant theconstruction of unified theories of cognition that encompass all of the kinds of thinkingincluded in intelligence (as well as some others). and offers the SOAF nodel as hiscandidate (Newell. 1987). Although the collection of models for diverse tasks that we havedeveloped is far more modest in scope. all of the models have been expressed in the sametheoretk'ai language (the CAPS production system). making the commonalities anddifferoncts relatively discernible. All of these models share a production-system controlstructure. a capacity for both seriality and parallelism, a representational scheme thatpermits different activation levels, and an information accumulation function (effectively, anactivation integrator), One interesting difference among tasks is that some types ofprocesses are easy to simulate with parallelism, while others are not (easy in the sense thatthe models can perform the task and still retain essential human performancecharacteristics). The processes that seem to operate well in parallel in the simulation modelsare highly practiced processes and lower-level perceptual processes. The simulation ofhigher-level conceptual processes is accomplished more easily with seriality, unless extensiveincrements to goal management are included.
What the theory postulates about the commonalities of different people and differenttasks reflects some of the observed performance commonalities. Many of the performancecommons Ides occur at the microstructure of the processing. which is revealed in the eyefixation patterns. The time scale of this analysis is about 300-700 milliseconds per gaze.Such processes are too fast for awareness or for including in a verbal report. The eyefixation analysis reveals iterations through small units of processing: the task is ^omposedinto manageable units of processing. each governed by a subgoal. Then. the subgoals areattacked one at a time. The problem decomposition and subgoaling reflect how peoplehandle complexity beyond their existing operators in a number of domains, including textcomprehension. spatial processing and problem solving. For example. in a mental rotationtask. subjects decomposed a cube into smaller units that they then rotated one unit at atime (Just & Carpenter. 1985). Similarly, in the Raven test. even the simplest types offigural analogies were decomposed and incrementally processed through a sequence ofpairwise comparisons. This segmentation appears to be an inherent part of problem-solving,and a facet of thinking that is common across domains in various tasks requiring analytic
5 6

intelligence.
Thus. what one intelligence test measures. acccrding to the current theory. is tcommon ability to decompose problems into manageable segments and iterate throughthe differential ability to manage the hierarchy of goals and subgoals generated by thiproblem decomposition. and the differential ability to form higher-level abstractions.
33
hethans
57

34
References
Anderson. J. R. (1987). Skill acquisition: Compilntion of weak-method problem solutions.Psychological Review. 94. 192-210.
Becker. J. D. (1969). The modeling of simple analogic and inductive processes in asemantic memory system. IJCAI. 655-668.
Belmont. L.. & Merolla. F. A. 11973) Birth order. family size. & intelligence. Science. 182.1096-1101.
Bethell-Fox. C. E.. Lohman. D.. & Snow. R. E. 11984). Adaptive reasoning: Componentialand eye movement analysis of geometric analogy performance. Intelligence. 8.205-238.
Binet. A.. & Simon. T. 11905). The development of intelligence in children. L'AnneePsychologique. 163-191: (Also in T. Shipley (Ed). 11961). Classics in psychology.New York: Philosophical Library.)
Burke. H. R. (1958). Raven's progressive matrices: A review and critical evaluation.Journal of Genetic Psychology. 93. 199-228.
Carroll. J. B. 11976). Psychometric tests as cognitive tasks: A new "structure ofintellect". In L. Resnick (Ed.). The Nature of Intelligence. Hillsdale. NJ: Erlbaum.
Cattell. R. B. 11963). Theory of fluid and crystallized intelligence: A critical experiment.Journal of Educational Psychology. 54. 1-22.
Court. J. H.. & Raven. J. 11982). Manual for Raven's Progressive Matrices andVocabulary Scales (Research Supplement No. 2. and Part 3. Section 71. London:Lewis & Co.
Cronbach. L. J. 11957). The two disciplines of scientific psychology. AmericanPsychologist. 12. 671-684.
Dillon. R. F.. & Stevenson-Hicks. R. 11981). Effects of item difficulty and method of testadministration on eye scan patterns during analogical reasoning. UnpublishedTechnical Report (No. 1): Department of Psychology. Southern Illinois University atCarbondale.
Egan. D. E.. & Greeno. J.(1974). Theory of rule induction: Knowledge acquired inconcept learning. serial pattern learning, and problem solving. In L. W. Gregg (Ed.),Knowledge and cognition. Hillsdale. NJ: Erlbaum, 43-103.
Evans, T. G. (1968). A program for the solution of a class of geometric analogyintelligence test questions. In M. Minsky (Ed.), Semantic information processing.MIT Press: Cambridge, Mass., 271-353.
Forbes. A. R. 11964). An item analysis of the advanced matrices. British Journal ofEducational Psychology. 34. 1-14.
Forgy. C.. & McDermott. J. 11977). OPS: A domain-independent production systemlanguage. Proceedings of the 5th International Joint Conference on ArtificialIntelligence. 933-939.
Gentner. D. 11983). Structure-mapping: A theoretical framework for analogy. CognitiveScience. 7. 155-170.
Click. M. L.. & Holyoak. K. J. (1983). Scheme induction and analogical transfer. CognitivePsychology, 15. 1-38.
Hall. R. P. 11989). Computational approaches to analogical reasoning: A comparativeanalysis. Artificial Intelligence. 39, 39-120.
Holzman. T. G., Pellegrino, J. W., & Glaser, R. 11983). Cognitive variables in series
58

35
completion. Journal of Educational Psyczy,logy. 75. 603-618.
Hunt. E. B. (1974). Quote the raven? Nevermore! In L. W. Gregg (Ed.). Knowledge andcognition (pp. 129-158). Hillsdale. NJ: Erlbaum.
Jacobs. P. I.. & Vandeventer. M. (1972). Evaluating the teaching of intelligence.4'4 Educational and Psychological MPasurenzent.32. 235-248.
Jacobs. P. I.. & Vandeventer. M. (197C:. Information in wrong responses. PsychologicalReports. 26. 311-315
Jensen. A. R. (1987). The g beyond factor analysis. In R. R. Ronning. J. A. Glover,J. C. Conoley. & J. C. Witt (Eds.). The influence of cognitive psychology on testing(pp. 87-142). Hillsdale. NJ: Erlbaum.
Just. M. A.. & Carpenter. P. A. (1976). Eye fixations and cognitive processes. CognitivePsychology. 8. 441-480.
Just. M. A.. & Carpenter. P. A. (1979). The computer and eye processing pictures: Theimplementation of a raster graphics ddvice. Behavioral Research & Instrumentation.11. 172-176.
Just. M. A.. & Carpenter. P. A. (1985). Cognitive coordinate systems: Accounts of mentalrotation and individual differences in spatial ability. Psychological Review. 92,137-172.
Just. M. A.. & Carpenter. P. A. (1987). The psychology of reading and languagecomprehension. Newton. MA: Allyn and Bacon.
Just. M. A.. & Thibadeau. R. H. (1984). Developing a computer model of reading times.In D. E. Kieras & M. A. Just (Eds.), New methods in reading comprehensionresearch (pp. 349-364). Hillsdale. NJ: Erlbaum.
Klahr. D.. Langley. P.. & Neches. R. (Eds.). (1987). Production system models of learningand development. Cambridge. MA: The MIT Press.
Kosslyn. S. M. (1980). Image and mind. Cambridge. MA: Harvard University Press.
Kotovsky. K.. Hayes. J. R.. & Simon, H. A. (1985). Why are some problems hard?Evidence from Tower of Hanoi. Cognitive Psychology. 17. 243-294.
Kotovsky. K.. & Simon. H. A. !1973). Empirical tests of a theory of human acquisition ofconcepts for sequential patterns. Cognitive Psychology, 4. 399-424.
Laird, J. E., Newell, A., & Rosenbloom. P. S. (in press). Soar: An architecture for generalintelligence. Artificial Intelligence.
Larson. G. E., Alderton, D. L., & Kaupp, M. A. (1990). Construct validity of Raven'sProgressive Matrices as a function of aptitude level and testing procedures.Unpublished manuscript. Testing Systems Department. Navy Personnel Research andDevelopment Center. San Diego. CA 92152.
Lawson. M. J.. & Kirby. J. R. (1981). Training in information processing algorithms.British Journal of Educational Psychology. 51. 321-335.
Marshalek. B.. Lohman. D. F.. & Snow. R. E. ( 1983). The complexity continuum in theradex and hierarchical models of intelligence. Intelligence. 7. 107-127.
Matarazzo. J. D. (1972). Wechsler's measurement and appraisal of adult intelligence (5thed.), New York: Oxford University Press.
McDermott. J. (1979). Learning ro use analogies. IJCAI. 568-576.
Mulholland, T. M., Pellegrino, J. W.. & Glaser. R. (t980). Components of geometricanalogy solution. Cognitive Psychology. 12. 252-284.

36
Newell. A. (1973). Production system: Models of control structures. In W. G. Chase(Ed.). Visual information processing (pp. 463-526). New York: Academic Press.
Newell. A. (1987). Unified theories of cognition. The 1987 William James Lectures,Harvard University.
Newell. A.. & Simon H. A. 11972). Human problem solving. Englewood Cliffs. NJ:Prentice-Hall.
Raven. J. C. (1962). Advanced Progressive Matrices. Set II. London: H. K. Lewis & Co.Distributed in the USA by The Psychological Corporation. San Antonio, Texas.
Raven. J. C. (1965). Advanced Progressive Matrices. Sets I and II. London: H. K. LewisCo. Distributed in the USA by The Psychological Corporation. San Antonio,
Texas.
Rosch, E. 11975). Cognitive representations of semantic categories. Journal ofExperimental Psychology: General. 104. 192-233.
Shepard. R. N.. & Cooper. L. A. (1982). Mental images and their transformations.Cambridge. MA: The MIT Press.
Simon. H. A. (1969). The sciences of the artificial. Cambridge. MA: The MIT Press.
Simon. H. A. (1975). The functional equivalence of problem solving skills. CognitivePsychology. 7. 268-288.
Simon. H. A.. & Kotovsky. K. (1963). Human acquisition of concepts for sequentialpatterns. Psychological Review. 70. 534-546.
Snow. R. E.. Kyllonen. P. C.. & Marshalek. B. (1984). The topography of ability andlearning correlations. In R. J. Sternberg (Ed.). Advances in the psychology of humanintelligence. Vol. 2 (pp. 47-103). Hillsdale. NJ: Erlbaum.
Spearman. C. (1927). The abilities of man. New York: MacMillan.
Sternberg. R. J. (1977). Intelligence. information processing and analogical reasoning: Thecomponential analysis of human abilities Hillsdale, NJ: Erlbaum.
Sternberg. R. J. (1985). Beyond IQ: A triarchic theory of human intelligence. New York:Cambridge University Press.
Sternberg. R. J.. & Gardner. M. K. (1983). Unities in Inductive Reasoning. Journal ofExperimental Psychology: General. 112. 80-116.
Thibadeau, R., Just, M. A., & Carpenter, P. A. (1532). A model of the time ccurse andcontent of reading. Cognitive Science, 6, 157-203.
Thurstone, L. L. (1938). Primary mental abilities. Chicago, IL: The University ofChicago Press.
Thurstone. L. L.. & Thurstone. T. G. (1941). Factorial studies of intelligence. Chicago:UniverAy of Chicago Press.
van Dijk. T. A.. & Kintsch. W. (1983). Strategic. of discourse comprehension. NewYork: Academic Press.
Williams. D. S. (1972). Computer program organization induced from problem examples.In H. A. Simon & L. Siklossy (Eds.). Representation and meaning: Experiments withinformation processing systems. Englewood Cliffs. NJ: Prentice-Hall.
60

Appendix A
37
Correct solution by model
% Error Lesioned Models
Number Experiment WorkingNo Memory
Raven Taxonomy of Rules of Rule la lb FAIR- BETTER- Distri. Limit
of-
Number in a row Tokens (n= 12)(n =22) AVEN AVEN 2-Rule 3 4 5
I- 2 Pairwise, Constant 2 0 N/A + + + + + +
I- 6 Pairwise, Constant 2 8 N/A + + + + + +
I- 7 Dist. of 3, Constant 2 42 14 + + + - - +
I- 8 Dist. of 3 2 17 18 + + + + + +
I- 9 Dist. of 3, Constant 3 42 5 p + + + + +
I-10 Addition, Constant 2 25 14 + + + + + +
1-12 Subtraction 1 42 9 + + + + + +
II- 1 Dist. of 3, Constant 3 8 9 + + + - - +
II- 3 Pairwise, Constant 2 0 9 + + + - - +
II- 4 Pairwise, Constant 2 8 5 + + + + + +
II- 5 Pairwise, Constant 2 8 0 + + + + + +
II- 6 Pairwise, Constant 2 0 0 + + + + + +
II- 7 Addition 1 17 14 + + + - - +
II- 3 Dist. of 3 2 17 18 + + + - + +
61
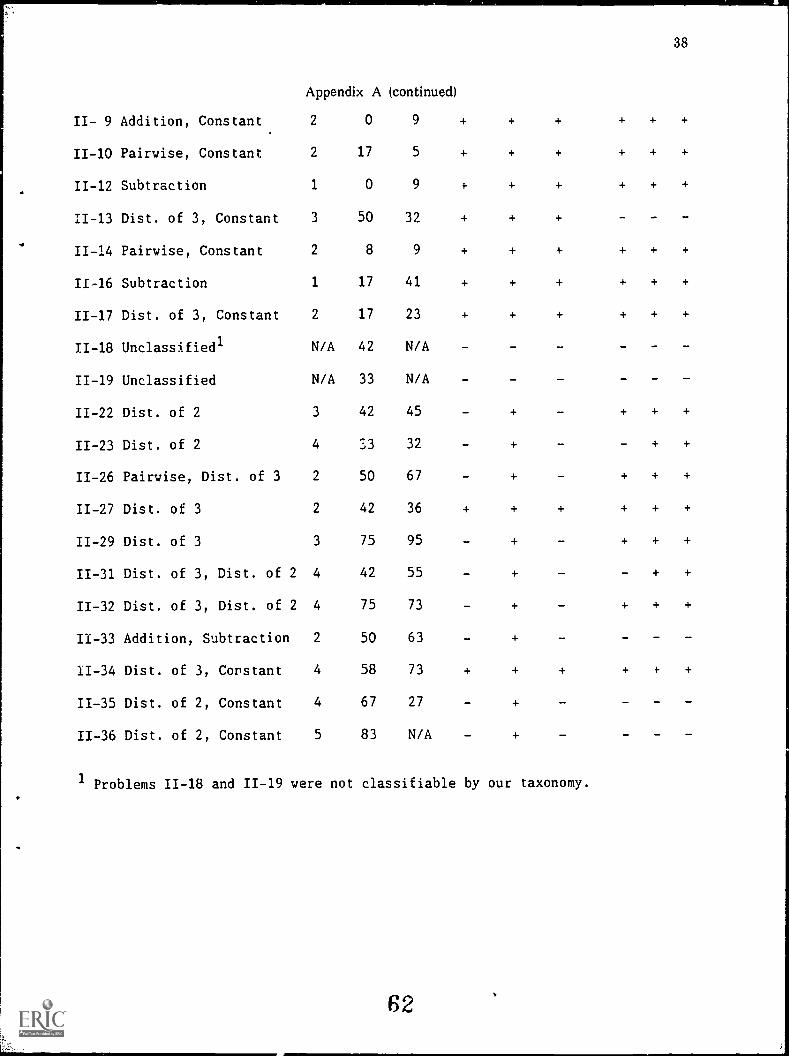
38
Appendix A (continued)
II- 9 Addition, Constant 2 0 9 + + + + + +
II-10 Pairwise, Constant 2 17 5 + + + + + +
11-12 Subtraction 1 0 9 4- + + + + +
11-13 Dist. of 3, Constant 3 50 32 + + + - - -
11-14 Pairwise, Constant 2 8 9 + + + + + +
11-16 Subtraction 1 17 41 + + + + + +
11-17 Dist. of 3, Constant 2 17 23 + + + + + +
11-18 Unclassified' N/A 42 N/A - - - - - -
II-19 Unclassified N/A 33 N/A - - - - - -
II-22 Dist. of 2 3 42 45 - + - + + +
11-23 Dist. of 2 4 33 32 - + - - + +
11-26 Pairwise, Dist. of 3 2 50 67 - + - + + +
11-27 Dist. of 3 2 42 36 + + + + + +
11-29 Dist. of 3 3 75 95 - + - + + +
11-31 Dist. of 3, Dist. of 2 4 42 55 - + - - + +
11-32 Dist. of 3, Dist. of 2 4 75 73 - + - + + +
11-33 Addition, Subtraction 2 50 63 - +
11-34 Dist. of 3, Constant 4 58 73 + + + + 4- +
11-35 Dist. of 2, Constant 4 67 27 - +
11-36 Dist. of 2, Constant 5 83 N/A - +
1 Problems 11-18 and 11-19 were not classifiable by our taxonomy.
52

.
39
Author Notes
This work was supported in part by contract number N00014-89-J-1218 from ONR, andResearch Scientist Development Awards MH-00661 and MH-00662 from NIMH. Thesimulation models described in the paper were programmed by Peter Shell and CraigBearer. Requests for reprints should be addressed to. Dr. Patricia A. CarpenterDepartment of Psychology. Carnegie-Mellon University, Pittsburgh, Pa. 15213.
We are grateful to Earl Hunt, David Klahr, Kenneth Kotovsky, Allen Newell, JamesPellegrino. Herbert Simon, and Robert qternberg for their constructive comments on earlierdrafts of the manuscript. We also want to acknowledge the help of David Fallside inimplementing and analyzing the Tower of Hanoi experiment,

40
Footnotes
1. To protect the security of the Raven problems. none of the actual prnhlems from thetest are depicted here or elsewhere in this paper. Instead. the test problems are illustratedwith isomorphs that use the same rules but different figural elements and attributes. Theactual problems that were presented to the subjects are referred to by their number in thetest. which can be consulted by readers.
2. This analysis is row oriented. In most problems. the rule types are the same regardlessof whether a row or column organization is applied: in our experiments. we found mostsubjects analyzed the problems by rows. Two of the problems on the test wereunclassifiable within our taxonomy because the nature of their rules differed from all others.
3. This taxonomy finds some converging support from an analysis of the relations used infigural analogies (both 2 x 2 and 3 x 3 matrices) from 166 intelligence tests (Jacobs &Vandeventer. 1972). Jacobs and Vandeventer found that 12 relations accounted for many ofthe analogical problems. Five of their relations are closely related to rules we found in theRaven: addition and added element (addition/subtraction). elements of a set (distribution of3 values). unique addition (distribution of 2 values) and identity (constant in a row). Someof the remaining relations. such as numerical series and movement in a plane, map ontoour quantitative progression rule. The Jacobs and Vandeventer analysis suggests thatrelatively few relations are needed to describe the visual analogies in a large number ofsuch tests.
4. A control study showed that the deviations from conventional administration did notalter the basic processing in Experiment la. A separate group of 19 college students wasgiven the test without recording eye fixations or requiring concurrent verbal protocols. Thiscontrol group produced the same pattern of errors (r(25) = .93) and response times (r(25)= .89) as the subjects in Experiment la. for the 27 problems from Set II that both groupswere presented. Furthermore. the error rate was slightly higher in Experiment la (33%)than in the control group (25%). demonstrating that the lower rate in Experiment la (andlb) than in Forbes' sample is likely due to our sample being comprised exclusively ofcollege students. rather than to increased accuracy in Experiment la because of eye fixationrecording or generation of verbal protocols.
5. As expected. subjects with low Raven test scores (between 12-17 points) made moreerrors than other groups as the number of subgoals to be generated increased ( their errorrate was .13, .66 and .59, for moves involving the generation of 0, 1, and 2 or moresubgoals, respectively). Their data was better fit by a model that assumed a more limitedcapacity working memory and more goal generation, even for the smallest sub-pyramid.Also. the lowest-scoring subjects were mon.. likely to make multiple errors at a single movethan other subject groups. The lowest-scoring subjects made an average of 17.2 whilesolving the 5 puzzles. compared to only 4 such errors by the next lowest-scoring group(those with Raven test scores between 20-24 points). Multiple errors at a move suggestconsiderable difficulty in executing the strategy because only two errors were possible ateach move and one of the two consisted of retracting the previous correct move. Later inthe paper we will discuss evidence that subjects in the bottom half of the distribution aremore influenced than those in the upper half by extraneous processes while performing theRaven test as well.
6. This list also omits another rule, so obvious as to be overlooked in our task analysesand the subjects' verbal reports, but not by the simulation model. The overlooked rule thatis a constant everywhere rule. An example of this rule can be found in the problE m shownin Figure 4b. in which every entry contains a diamond outline. In this particular example,

41
the constant everywhere rule does not discriminate among the response alternatives becausethey all contain a diamond outline. Both FAIRAVEN and BETTERAVEN used a constanteverywhere rule where applicable. but we wily not discuss it further because of the minorrole it plays in problem difficulty and individual differences.
7. This estimate is based on problems containing either two or three tokens of thedistribution-3f-three-values rule. On 20% of the correct trials and 59% of the error trials.the verbal reports contained no evidence of the subject having noticed at least one of thecritical attributes: that is, neither the rule itself nor any attribute or value associated withthat rule was mentioned. We assume that 20% is an estimate of how often the verbalreports don't reflect an encoded attribute. Consequently. we can estimate that 80% (thecomplement of 20%) of the 59% of the error trials with incomplete verbal reports forapproximately 50%) may be attributed to incomplete encoding or analysis, not just anomission in the verbal report.
8. The 12 subjects fully described a classifiable rule in only 51% of the 708 (12x59) cases.The agreement among those subjects who described a rule for a given attribute was veryhigh (only 7% of the 708 cases were disagreements with a plurality): however. in 37% ofthe cases. the rule descriptions were absent or incomplete. so the pluralities are sometimessmall.
9. The reason for BETTERAVEN not using figure addition or subtraction in these cases isthat they required a more general form of addition or subtraction than BETTERAVEN'scould handle. In one problem. the horizontal position of the figural element that was beingsubtracted was also being changed (operated on by another rule) from one column to thenext. In the other problem. some figural elements had to be subtracted in one row, butadded in another row. so both types of variation would have to have been recognized as aform of a general figure addition/subtraction. Because BETTERAVEN's addition andsubtraction rules were too specific to apply to these two situations, its distribution-of-two-values rule applied instead. The human subjects' ability to use an addition or subtractionrule testifies to the greater generality of their version of the rule compared toBETTERAVEN.
10. The gaze analyses of the problems containing different numbers of tokens ofdistribution-of-three-values rules was applied to the protocols of 6 of 7 scorable subjects (whohappened to be the higher-scoring subjects), eliminating those trials on which subjects madean error, or when the eye fixation data were lost due to measurement noise. The seventhscorable eye fixation protocol was excluded because it came from the lowest scoring subject,who had too few correct trials to contribute. The data in Figure 12 are from 10observations of problems Set I-#7, Set II-#17. each of which contains 1 rule. 25observations of problems Set I-#8. 9, Set II-#1, 13 and 27. which contain 2 rule tokens,and 5 observations of problems Set 11-#29 and 34. which contain 3 rule tokens.
11. Although there has been a large amount of subsequent artificial intelligence researchon analogical reasoning, most of the work has focused on knowledge representation.knowledge retrieval and !:nowledge utilization rather than inferential and computationalprocesses (see the summary by Hall. 1989). Analogical reasoning is viewed as abootstrapping process to promote learning and the application of old information in newdomains (Becker, 1969; McDermott. 1979). In psychology, this view of analogical reasoninghas resulted in research that examines the conditions under which subjects ..ecognizeanalogous problem solutions (Dick & Holyoak, 1983) and the contribution of analogicalreasoning to learning (Gentner, 1983).
65

Dr. Keith Rayner, Department of Psychology, Tobin Hall, Univ. of Massachusetts, Amherst, MA 01003Dr. Charles Clifton, Department of Psychology, Univ. of Massachusetts, Amherst, MA 01003Dr. Neil R. Carlson, Department of Psychology, Tobin Hall, Univ. of MassachusettsDr. Hariharan Swaminathan, Laboratory of Psychometric and, Evaluation Research, School of Education, University of Massachusetts, AmhDr. Janice Gifford, University of Massachusetts, School of Education, Amherst, MA 01003Dr. Ronald K. Hambleton, University of Massachusetts, Laboratory of Psychometric, and Evaluative Research, Hills South, Room 152, AmhDr. Allan W. Collins, Bolt, Beranek and Newman, 50 Moulton St., Cambridge, MA 02138Dr. W. K. Estes, Department of Psychology, William James Hall, Harvard University, Cambridge, MA 02138Dr. Howard Gardner, Harvard Project Zero, Harvard University, Cambridge, MA 02138Dr. Stephen M. Kosslyn, Department of Psychology, Harvard University, Cambridge, MA 02138Dr. Maryellen MacDonald, Department of Psychology, M.I.T., Cambridge, MA 02139Dr. Susan Carey, Mass Inst. of Tech., Department of Psychology, Cambridge, MA 02139Dr. Mary C. Potter, Department of Brain, and Cognitive Sciences, Room E10-032, M.I.T., Cambridge, Mass. 02139Dr. Steven Pinker, Dept. of Brain &, Cognitive Science, E10-016, M.I.T., Cambridge, MA 02139Dr. Marilyn J. Adams, BBN Laboratories, 70 Fawcett St., Cambridge, MA 02238Dr. Peter Eimas, Department of Psychology, Brown University, Providence, RI 02912Library, Naval War College, Newport, RI 02940Dr. Michael Gazzaniga, Department of Psychiatry, Dartmouth Medical School, Pike House, Hanover, NH 03756Dr. Karl Haberlandt, Department of Psychology, Trinity College, Hartford, CT 06106Dr. Robert J. Sternberg, Department of Psychology, Box 11A Yale Station, New Haven, CT 06520Dr. Robert G. Crowder, Department of Psychology, Yale University, New Haven, Connecticut 06520Dr. Dennis Egan, Bell Telephone Laboratories, 600 Mountain Ave., Murray Hill, NJ 07974Dr. T. K. Landauer, Bell Laboratories, 600 Mountain Ave., Murray Hill, NJ 07974Dr. Gary Marco, Stop 31-E, Educational Testing Service, Princeton, NJ 08451Dr. Roy 0. Freedle, Research Division, Educational Testing Service, Princeton, NJ 08540Dr. Sam Glucksberg, Department of Psychology, Princeton University, Princeton, NJ 06540Dr. Tom Donlan, Measurement Dev. Group, Educational Testing Service, Princeton, NJ 08540Dr. George A. Miller, Dept. of Psychology, Green Hall, Princeton University, Princeton, NJ 08540Dr. Kentaro Yamamoto, 03-T, Educational Testing Service, Rosedale Road, Princeton, NJ 08541Dr. Grant Henning, Senior Research Scientist, Division of Measurement, Research and Services, Educational Testing Service, Princeton,Dr. Martha Stocking, Educational Testing Service, Princeton, NJ 08541Dr. Robert McKinley, Educational Testing Service, Princeton, NJ 08541Dr. Peter J. Pashley, Educational Testing Service, Rosedale Road, Princeton, NJ 08541Dr. Robert Mislevy, Educational Testing Service, Princeton, NJ 08541Dr. Paul W. Holland, Educational Testing Service, 21-T, Rosedale Road, Princeton, NJ 08541Dr. Lawrence J. Stricker, Educational Testing Service, Princeton, NJ 08541Dr. Drew Gitomer, Educational Testing Service, Princeton, NJ 08541Dr. Ming-Mei Wang, Educational Testing Service, Mail Stop 03-T, Princeton, NJ 08541Dr. Frederic M. Lord, Educational Testing Service, Princeton, NJ 08541Dr. Howard Wainer, Educational Testing Service, Princeton, NJ 08541Dr. Kikumi Tatsuoka, Educational Testing Service, Mail Stop 03-T, Princeton, NJ 08541Dr. Charles Lewis, Educational Testing Service, Princeton, NJ 08541-0001Dr. Isaac Bejar, Mail Stop: 10-R, Educational Testing Service, Rosedale Road, Princeton, NJ 08541Dr. George A. Miller, Department of Psychology, Green Hall, Princeton University, Princeton, NJ 08544Dr. Douglas H. Jones, 1280 Woodfern Court, Toms River, NJ 08753Dr. Hei-Ki Dong, Bell Communications Research, 6 Corporate Place, PYA-1K226, Piscataway, NJ 08854Dr. Arnold L. Glass, Department of Psychology, Rutgers University, Busch Campus, New Brunswick, NJ 08903Dr. Edith Neimark, Rutgers University, 319 Tillett, Kilmer Campus, Dept. of Psychology, New Brunswick, NJ 08903Dr. Milton S. Katz, European Science Coordination, Office, U.S. Army Research Institute, Box 65, FPO New York 09510-1500Dr. Barbara C. Malt, Department of Psychology, Univ. of Massachusetts, Amherst, MA 01003Dr. Martin D. S. Braine, Department of Psychology, New York University, 6 Washington Place, New York, NY 10003Dr. Jerome Bruner, New School for Social Research, Graduate Psychology Department, 65 Fifth Avenue, New York, NY 10003Dr. Murray Glanzer, Department of Psychology, New York University, 6 Washington Place, 8th Floor, New York, NY 10003Dr. Doris Aaronson, Department of Psychology, New York University, 6 Washington Place, New York, NY 10003Ms. Julia S. Hough, Cambridge University Press, 40 West 20th Street, New York, NY 10011Dr. George Wong, Biostatistics Laboratory, Memorial Sloan-Kettering, Cancer Center, 1275 York Avenue, New York, NY 10021Dr. John B. Black, Box 8, Teachers College, Columbia Univ, New York, NY 10027Dr. Ernst Rothkopf, Dept. of Telecommunications, and Education, Teachers College, Columbia University, New York, NY 10027Dr. Herbert Ginsburg, Box 184 Teachers College, Columbia University, 525 West 121st Street, New York, NY 10027
66 67

qi
Dr. Lynn A. Cooper, Department of Psychology, Schermerhorn Hall, Colut. is University, New York, NY 10027i)r. Julian Hochberg, Department of Psychology, Columbia University, New York, NY 10027Dr. David Swinney, CUNY Graduate Center, Psychology of Linguistics, Room 1403, 33 W. 42nd Street, New York, NY 10036Dr. John M. Carroll, IRV. Watson Research Center, User Interface Institute, P.O. Box 704, Yorktown Heights, NY 10598Dr. Leon J. Kamin, Department of Psychology, Northeastern University, 360 N. Huntington Ave., Boston, NA 12115Dr. Margaret Matlin, Department of Psychology, State Univ. of New York, Geneseo, NY 14454Dr. Michael K. Tanenhaus, Department of Psychology, Meliora Hall, University of Rochester, Roch, .ter, NY 14627Dr. Sharon Carver, Graduate School of Education, University of Rochester, Rochester, NY 14627Dr. Frank C. Keil, Department of Psychology, Cornell University, Ithaca, New York 14853Dr. James E. Cutting, Department of Psychology, Uris Hall, Cornell University, Ithaca, NY 14853-7601Dr. Clark Glymour, DeLartment of Philosophy, Carnegie-Mellon University, Pittsburgh, PA 15213M. Diane Langston, Information Technology, Center, Carnegie-Mellon University, Schenley Park, Pittsburgh, PA 15213Dr. Robert Glaser, LRDC Building, 3939 O'Hara St., Pittsburgh, PA 15260Dr. Walter Schneider, LRDC, Univ. of Pittsburgh, 3939 O'Hara St., Pittsburgh, PA 15260Dr. Alan M. Lesgold, LRDC Building, University of Pittsburgh, 3939 O'Hara Street, Pittsburgh PA 15260Dr. Lauren Resnick, LRDC Building, 3939 O'Hara St., Pittsburgh, PA 15260Dr. Saul Sternberg, Department of Psychology, University of Pennsylvania, 3815 Walnut Street, Philadelphia, PA 19104Dr. Henry Gleitman, Department of Psychology, 3815 Walnut St., Univ. of Pennsylvania, Philadelphia, PA 19104
Dr. Jonathan Baron, Department of Psychology, Univ. of Pennsylvania, Philadelphia, PA 19174Dr. S. Farnham-Diggory, Dept. Educational, Foundations, College of Education, University of Delaware, Newark, DE 19711Dr. James Hoffman, Department of Psychology, University of Delaware, Newark, DE 19711Dr. Ratna Nandakumar, Educational Studies, Willard Hall, Room 213E, University of Delaware, Newark, DE 19716Carol Weissbrod, Chair, Department of Psychology, The American University, Washington DC 20015German Military Representative, ATTN: Wolfgang Wildgrube, Streitkraefteamt, D-5300 Boan 2, 4000 Brandywine Street, NW, Washington, DC 1
Wayne M. Patience, American Council on Education, GED Testing Service, Suite 20, One Dupont Circle, NW, Washington, DC 20036Dr. Anit_ Lancaster, Accession Policy, OASD/MILL/MPLFM/AP, Pentagon, Washington, DC 20301Assistant for Training and, Personnel Technology, Office of the Under Secretary of, Defense for Research 4 Engrg., 3D129, The Pentago
Dr. Myron Fischl, U.S. Army Headquarters, DAPE-MRR, The Pentagon, Washington, DC 20310-0300Personnel Analysis Division AF/MPXA, 5C360, The Pentagon, Washington, DC 20330Dr. Alfred R. Fregly, AFCSR/NL, Bldg. 410, Bolling AFB, CC 20332-6448Dr. John Tangney, AFOSR/NL, Bldg. 410, Bolling AFB, DC 20332-6448Assistant for Manpower, and Training, Office of the CNO (OP- 987H), 5E683, The Ponta )n, Washington, DC 20350
Assistant for Planning and, Technology Development, Office of the DCNO(MPT) (OP- 01B2), Department of the Navy, Washington, DC 20350-2Dr. Clessen J. Martin, Office of Chief of Naval, Operations (OP 13 F), Navy Annex, Room 2832, Washington, DC 20350OASD(Manpower a Reserve Affairs), 5D800, The Pentagon, Washington, DC 20350-1000Assistant for Training Technology, and Human Factors, Office of the DCNO(MPT) (0p-11111), Department of the Navy, Washington, DC 20350Head, Manpower, Personnel and Training Branch, Office of the CNO (OP-813), 4A478, The Pentagon, Washington, DC 20350-1000Dr. Robert M. Carroll, Chief of Naval Operations, OP-01B2, Washington, DC 20350LCDR Frank C. Petho, Office of the Chief of, Naval Operations, OP-111J1, Washington, DC 20350Deputy' Director Manpower Personnel and Training Div., Naval Sea Systems Command, ATTN: Code CEL-MP63, Washington, DC 20362Deputy Director Military, Personnel Policy Division, Office of the DCNO(MPT) (OP -13B), Depa-tment of the Navy, Washington, DC 20370-2Head, Leadership Bran,-h, Naval Military Personnel Command, ATTN: LCDR E. Merits, NMPC-621, Department of the Navy, Washington, DC 203Head, Military Compensvtion, Policy Branch, Office of the DCNO(MPT) (OP-134), Department of the Navy, Washington, DC 20370-2000
Deputy Director Total Force, Training and Education Div., Office of the DCNO(MPT) (OP -11B), Department of the Navy, Washington, DC 20
Dr ,andall Shumaker, Nasal Research Laboratory, Code 5510, 4555 Overlook Avenue, S.W., Washington, DC 20375-5000Li':,:arian, Naval Center for Applied Research, in Artificial Intelligence, Naval Research Laboratory, Code 5510, Washington, DC 20375 -
Headquarters U.S. Marine Corps, Code MA, Washington, DC 20380-0001Headquarters Marine Corps, Code MPI-20, Washington, DC 20380Commanding Officer Naval Research Labora. ry, Code 2627, Washington, DC 20390Science and Technology Division, Library of Congress, Washington, DC 20540Dr. Joseph L. Young, National Science Foundation, Room 320, 1800 G Street, N.W., Washington, DC 20550Dr. Hilda Wing, Federal Aviation Administration, 800 Independence Ave, SW, Washington, DC 20591Dr. C. M. Dayton, Department of Measurement, Statistics 4 Evaluation, College of Education, University of Maryland, College Park, HDDr. Ralph J. DeAyala, Measurement, Statistics and Evaluation, Ben3amin Bldg., Rm. 4112, University of Maryland, College Park, MD 20
Dr. John Eliot, Institu e for Child Study, University of Maryland, College Park, MD 20742Dr. George B. Macready, Department of Measurement, Statistics a Evaluation, College of Educe ln, University of Maryland, College ParNaval School of Health Sciences, National Naval Medical Center, Bldg. 141, ATTN: CDR J.M. Lal .:co, Washington, DC 20814-5033ERIC Facility-Acquisitions, 2440 Research Blvd, Suite 550, Rockville, MD 20850-3238Dr. Dennis F. Fisher, Behavioral Research Directorate, U.S. Army Human Engineering Lab., Aberdeen Proving Ground, MD 2.1)05
f8 69
Dr. Richard A. Monty, Behavioral Research, Human Engineering Lab, Averdoen PRVG GD, MD 21005Dr. Alfonso Caramazza, Department of Psychology, Johns Hopkins University, Baltimore, MD 21218Ms. Carolyn R. Crone, Johns Hopkins University, Department of Psychology, Charles & 34th Street, Baltimore, MD 21218Mr. Thomas J. Thomas, 7ohns Hopkins University, Department of Psychology, Charles & 34th Street, Baltimore, MD 21218Dr. Howard Egeth, Department of Psychology, Johns Hopkins University, Baltimore, MD 21218Dr. Bert F. Green, Department of Psychology, Johns Hopkins University, Baltimore, MD 21218Dr. Louis Buffardi, Department of Psychology, George Mason University, 4400 University Drive, Fairfax, VA 22030Director, Research fi Analysis Div., Navy Recruiting Command (Code 223), 4015 Wilson Blvd., Room 215, Arlington, VA 22203-1991
Dr. Marshall J. Farr, Consultant, Cognitive fi Instructional Sciences, 2520 North Vernon Street, Arlington, VA 22207Dr. Jerry Lehnus, Defense Manpower Data Center, Suite 400, 1600 Wilson Blvd, Rosslyn, VA 22209Chief, Survey and Market, Analysis Division, Defense Manpower Data Center, 1600 Wilson Blvd., 4400, Arlington, VA 22209Director. Rec. Services Dept., Naval Military Personnel Command, N-651C, 1300 Wilson Blvd., Room 932, Arlington, VA 22209
Head Family Support Program Branch., OP 156, 1300 Wilson Blvd., Room 828, Arlington, VA 22209Office of Naval Research Code 114205, 800 N. Quincy Street, Arlington, VA 22217-5000, (6 Copies)
Director, Applied Research Division, Code 17.1, OCNR, Arlington, Va 22217-5000Dr. Steven Zornetzer, Office of Naval Research, Code 114, 800 N. Quincy St., Arlington, VA 22217-5000Office of Naval Research Code 1142PS, 800 %. Quincy Street, Arlington, VA 22217-5000Chairman, MPT R4D Committee, Office of the Ctgief, of Naval Research (Code 2:2), 800 N. Quincy Street, Arlington, VA 22217-5000
Office of Naval Research Code 114281, 800 N. Quincy Street, Arlington, VA 22217-5000Dr. Stanley Collyer, Office of Naval Technology, Code 222, 800 N. Quincy Street, Arlington, VA 22217-5000Office of Naval Research Code 1142, 800 N. Quincy St., Arlington, VA 22211 -5000Director of Research Programs, Office of Naval Research (Code 11), 800 North Quincy Street, Arlington, VA 22217-5000Dr. Charles Davis, Office of Naval Research Code 442, 800 N. Quincy St., Arlington, VA 22217Program Manager, Statistics and, Probability (Code 1111SP), Office of Naval Research, 800 North Quincy Street, Arlington, VA 22217-50Dr. Peter Stoloff, Center for Naval Analysis, 4401 Ford Avenue, P.O. Box 16268, Alexandria, VA 22302-0268Dr. Dattprasad Divgi, Center for Naval Analysis, 4401 Ford Avenue, P.O. Box 16268, Alexandria, VA 22302-0268Dr. Robert Lockman, Center for Naval Analysis, 4401 Ford Avenue, P.O. Box 16268, Alexandria, VA 22302-0268Asst. for Long Range Regts., CNO Executive Panel (OP -OOK), 4401 Ford Avenue, Alexandria, VA 22302-0268Director, Manpower Program, Center for Naval Analyses, 4401 Ford Avenue, P.O. Box 16268, Alexandria, VA 22202 -0268Director Manpower Support and, Readiness Program, Center for Naval Analysis, 2000 North Beauregard Street, Alexandria, VA 223a1
Dr. Jesse Orlansky, Institute for Defense Analyses, 1801 N. Beauregard St., Alexandria, VA 22311Defense Techn'..cal, Information Center, Cameron Station, Bldg 5, Alexandria, VA 22314, (12 Copies)
Dr. Brian Waters, HumRRO, 1100 S. W4shington, Alexandria, VA 22314Dr. H. Wallace Sinaiko, Manpower Research, and Advisory Services, Smithsonian Institution, 801 North Pitt Street, Suite 120, AlexandrDr. Judith Orasanu, Basic Research Office, Army Research Institute, 5001 Eisenhower Avenue, Alexandria, VA 22333
Dr. Michael Kaplan, Office of Basic Research, U.S. Army Research Instituts, 5001 Eisenhower Avenue, Alexandria, VA 22333-5600
Technical Director, ARI, 5001 Eisenhower Avenue, Alexandria, VA 22333Dr. Michael Kubovy, Department of Psychology, Gilmer Hall, University of Virginia, Charlottesville, VA 22903-2477Dr. Marcy Lansman, University of North Carolina, The L. L. Thutstone Lab., Davie Hall CB 43270, ChPgael Hill, NC 27514
Dr. Samuel Fillenbaum, Department of Psychology, Univ. North Carolina, Davie Hall 013 A, Chapel Hill, NC 27514Dr. Jack Carroll, 409 Elliott Rd. North, Chapel Hill, NC 27514Dr. Lynn Hasher, Department of Psychology, Duke University, Durham, NC 27706Dr. Ruth Day, Department of Psychology, Duke University, Durham, NC 27706Dr. Gregory Lockheed, Department of Psychology, Duke University, Durham, NC 27706Dr. J. Ryan, Department of Education, University of South Carolina, Columbia, SC 29208Dr. Robert Jannarone, Elec. and Computer Eng. Dept., University of South Carolina, Columbia, SC 29208
Dr. Huynh Huynh, College of Education, Univ. of South Carolina, Columbia, SC 29208Dr. Steven IL'nka, 3-104 Educ. N., University of Alberta Edmonton, Alberta, CANADA T6G 2G5Dr. William F. Johnson, Search Technology, Inc., 4725 Peachtree Corners Circle, Norcross, GA 30092
Dr. George Eqglehard, Jr., Division of Educational Studies, Emory University, 210 Fishburne Bldg., Atlanta, GA 30322Dr. Lawrone W. Barsalou, School of Psychology, Georgia Institute of Technology, Atlanta, GA 30332Dr. T. Govindara], Georgia Institute of, Technology, School of Industrial, and Systems Engineering, Atlanta, GA 30332-0205Director, Instructional Development 4, Educational Program Support Dept., NETPMSA, Pensacola, FL 32509Dr. James Algina, 1403 Norman Hall, University of Florida, Gainesville, FL 32605Dr. Ira Fischler, Department of Psychology, University of Florida, Gainesville, FL 32611Dr. Arthur S. Blaiwes, Code N712, Naval Training Systems Center, Orlando, FL 32813-7100Library, Naval Training Systems Center, Orlando, FL 32813Head, Human Factors Laboratory, Naval Training Systems Center, Code 71, Orlando, FL 32813-7100Dr. Eduardo Salas, Human Factors Division (Code 712), Naval Training Systems Center, Orlando, FL 32813-7100
70 71

Dr. Kent E. Williams, Inst. for Simulation and Training, University of Central Florida, P.O. Box 25000, Orlando, FL 32816-0544Attn: Dr. David E. Daniel, Deputy Director, R&D Department, NTSC (Code 7A), 12350 Research Parkway, Orlando, FL 32826-3224
Dr. Robert Breaux, Code 281, Naval Training Systems Center, Orlando, FL 32826-3224Dr. Stephen K. Reed, Department of Psychology, Florida Atlantic University, Boca Raton, Florida 33431Dr. Isaac I. Behar, RT 3, Box 418, Enterprise, AL 36330Dr. Susan 6:sldman, Department of Psychology, Peabody College, Box 45, Vanderbilt University, Nashville, TN 37203
Dr. James Pellegrino, Department of Psychology, Peabody College, Box 45, Nashville, TN 37203Dr. John D. Bransford, Department of Psychology, 134 Wesley, Vanderbilt University, Nashville, TN 37240Dr. Timothy P. Mciamara, Department of Psychology, 301 Psychology Bldg., Vanderbilt University, Nashville, TN 37240Dr. Fumiko Same]ima, Department of Psychology, University of Tennessee, 3108 Austin Peay Bldg., Knoxville, TN 37916-0900Academic Progs. 4 Research Branch, Naval Technical Training Command, Code N-625, NAS Memphis (75), Millington, TN 38054
Dr. Arthur Gracsser, Department of Psychology, Memphis State University, Memphis, TN 38152Dr. Lester E. Krueger, Human Performance Center, 4048 W 17th Ave., Columbus, OH 43210Dr. Neal F. Johnson, Department of Psychology, Ohio State University, Columbus, Ohio 43210Dr. Laura L. Barnes, College of Education, University of Toledo, 2801 W. Bancroft Street, Toledo, OH 436)6Dr. Douglas K. Detterman, Department of Psychology, Case Western Reserve Univ., Cleveland, OH 44106Dr. D. James Dooling, Department of Psychology, Kent State University, Kent, Ohio 44242Dr. Joseph H. Danks, Department of Psychology, Kent State University, Kent, Ohio 44242Dr. Richard J. Koubek, Department of Biomedical, 4 Human Factors, 139 Engineering 4 Math Bldg., Wright State University, Dayton, OH 4Dr. Margaret J. Peterson, Department of Psychology, Indiana University, Bloomington, IN 47401Dr. David B. Pisoni, Department of Psychology, Indiana University, Bloomington, :N 47401Dr. Paul Cobb, Purdue University, Education Building, W. Lafayetta, IN 47907Dr. Gary M. Olson, Department of Psychology, University of Michigan, Ann Arbor, MI 48104Dr. John Jonides, Department of Psychology, University of Michigan, Ann Arbor, MI 48104Dr. David E. Meyer, Department of Psychology, University of Michigan, Ann Arbor, MI 48104Dr. Edward E. Smith, Department of Psychology, University of Michigan, Ann Arbor, MI 48104Dr. Douglas Medin, Department of Psychology, University of Michigan, Perry Building, 330 Packard Load, Ann Arbor, MI 48104Dr. David Kieras, Program in Technical Communication, College of Engineering, 1223 E. Engineering Building, University of Michigan, ADr. J. Kathryn Bock, Department of Psychology, Michigan State University, East Lansing, MI 48824Dr. Meg Gerrard, Psychology Department, Iowa State University, Ames, IA 50010Dr. James V. Hinrichs, Department of Psychology, University of Iowa, Iowa City, IA 52240Dr. Stephen Dunbar, 224B Lindquist Center, for Measurement, University of Iowa, Iowa City, IA 52242Dr. Frank L. Schmidt, Department of Industrial, Relations and Human Resources, College of Business, University of Iowa, Iowa City, IALowell Schoer, Psychological 4 Quantitative, Foundations, College of Education, University of Iowa, Iowa City, IA 52242Dr. Leonard Feldt, Lindquist Center, for Measurement, University of Iowa, Iowa City, IA 52242Dr. I. Gormazano, Department of Psychology, University of Iowa, Iowa City, IA 52242Dr. Judy Spray, ACT, P.O. Box 168, Iowa City, IA 52243Dr. Mark D. Reckase, ACT, P. 0. Box 168, Iowa City, IA 52243Dr. Robert Brennan, American College Testing, Programs, P. O. Box 168, Iowa City, IA 52243Dr. Timothy Davey, American College Testing Program, P.O. Box 168, Iowa City, IA 52243Dr. Richard L. Ferguson, American College Testing, P.O. Box 168, Iowa City, IA 52243Dr. Michael T. Waller, University of Wisconsin-Milwaukee, Educational Psychology Department, Box 413, Milwaukee, WI 53201Dr. Thomas Leonard, University of Wisconsin, Department of Statistics, 1210 West Dayton Street, Madison, WI 53705Dr. Joel R. Levin, Department of Educational Psychology, Educational Sciences Building, 1025 West Johnson Street, Madison, WisconsinDr. Arthur M. Glenberg, Department of Psychology, University of Wisconsin, Madison, WI 53706Dr. David Vale, Assessment Systems Corp., 2233 University Avenue, Suite 440, St. Paul, MN 55114Dr. Charles R. Fletcher, Department of Psychology, University of Minnesota, 75 East River Road, Minneapolis, MN 55455Dr. Paul van den Brcuk, Department of Education, Burton Hall, 1789 Pillsbury Drive S. E., Minneapolis, MN 55455Prof. David W. Johnson, Cooperative Learn,rig Center, University of Minnesota, 150 Pillsbury Drive, S.E., Minneapolis, MN 55455Hr. Steve Reiss, N660 Elliott Hall, University of Minnesota, 75 E. River Road, Minneapolis, MN 55455-0344Dr. William M. Bart, University of Minnesota, Dept. of Educ. Psychology, 330 Burton Hall, 178 Pillsbury Dr., S.E., Minneapolis, MN 55Dr. Iry Biederman, Department of Psychology, University of Minnesota, 75 East River Road, Minneapolis, MN 55455Dr. David J. Weiss, N660 Elliott Hall, University of Minnesota, 75 E. River Road, Minneapolis, MN 55455-0344Dr. Phillip L. Ackerman, Department of Psychology, Elliott Hall, University of Minnesotta, Minneapolis, MN 55455D. Michael Maratsos, Department of Psychology, University of Minnesota, Minneapolis, MN 55455Dr. Clarence C. McCormick, HQ, USHEPCOM /MEPCT, 2500 Green Bay Road, North Chicago, IL 60064Dr. Carl Ross, CNET-PDCD, Building 90, Great Lakes NTC, IL 60088Dr. Gail McKoon, Department of Psychology, Northwestern University, Dresge Hall, Evanston, IL 60201Dr. Roger Ratcliff, Department of Psychology, Northwestern University, 1859 Sheridan Road, Evanston, IL 60202
7773

Mr. Anthony R. Zara, National Council of State, Boards of Nursing, Inc., 625 North Michigan Avenue, Suite 1544, Chicago, IL 60611
Dr. Robert D. Gibbons, Illinois State Psychiatric Inst., Rm 529W, 1601 W. Taylor Street, Chicago, IL 60612
Dr. Tom Trabasso, Department of Psychology, University of Chicago, 5835 S. University Avenue, Chicago, IL 60c37
Dr. Nancy Stein, Department of Psychology, University of Chicago 5835 S. University Avenue, Chicago, IL 60637
Dr. Lance Rips, Department of Behavioral, Sciences, 5848 S. University Ave., University of Chicago, Chicago, IL 60637
Dr. Janellen Huttenlocher, Department of Education, University of Chicago, 5600 S. Kimbark Ave., Chicago, IL 60637
Dr. Kenneth D. Forbus, Department of Computer Science, University of Illinois, 1304 West Springfield Avenue, Urbana, IL 61801
Dr. Bruce Williams, Department of Educational, Psychology, University of Illinois, Urbana, IL 61801
Dr. Michael Levine, Educational Psychology, 210 Educaticn Bldg., University of Illinois, Champaign, IL 61801
Dr. Terry Ackerman, Educational Psychology, 210 Education Bldg., University of Illinois, Champaign, IL 61801
Mr. Alan Mead, c/o Dr. Michael Levine, Educational Psychology, 210 Education Bldg., University of Illinois, Champaign, IL 61801
Dr. Maurice Tatsuoka, 220 Education Bldg, 1310 S. Sixth St., Champaign, IL 61820Dr. Ledyard Tucker, University of Illinois, Department of Psychology, 603 E. Daniel Street, Champaign, IL 61820
Mr. Christopher McCusker, University of Illinois, Department of Psychology, 603 E. Daniel St., Champaign, IL 61820
Dr. Fritz Drasgow, University of Illinois, Department of Psychology, 603 E. Daniel St., Champaign, IL 61820Dr. Csorge McConkie, Ctr. for Study of Reading, University of Illinois, 51 Gerty Drive, Champaign, II '1820
Dr. Richard C. Anderson, Center for the Study, oil Reading, 51 Gerty Drive, University of Illinois, Champaign, IL 61820
Dr. Robin Shealy, University of Illinois, Department of Statistics, 101 Illini Hall, 725 South Wright St., Champaign, IL 61820
Mr. Gary Thomasson, University of Illinois, Educational Psychology, Champaign, IL 61820
Dr. Delwyn Harnlsch, University of Illinois, 51 Gerty Drive, Champaign, IL 61820Mr. Rodney Lim, University of Illinois, Department of Psychology, 603 E. Daniel St., Champaign, IL 61820Dr. Lloyd Humphreys, University of Illinois, Department of Psychology, 603 East Denial Street, Champaign, IL 61820
Dr. Ed Shoben, Department of Psychology, 603 E. Daniel Street, University of Illinois, Champaign, IL 61820
Mr. Hua Hua Chung, University of Illinois, Department of Statistics, 101 Illinx Hall, 725 South Wright St., Champaign, IL 61820
Dr. William F. Brewer, Psychology Building, University of Illinois, Champaign, IL 61820Dr. William Stout, University of Illinois, Department of Statistics, 101 Illini Hall, 725 South Wright St., Champaign, IL 61820
Dr. Bri%n Junker, University of Illinois, Department of Statistics, 101 Illini Hall, 725 South Wright St., Champaign, IL 61820
Dr. Dedre Gentner, University of Illinois, Department of Psychology, 603 E. Daniel Street, Champaign, IL 61320
Dr. Gary S. Dell, Department of Psychology, University of Illinois, 603 E. Daniel St., Champaign, IL 61820
Dr. John B. Best, Department of Psychology, Eastern Illinois Univ., Charleston, IL 61920
Dr. Paul Feltovich, Southern Illinois University, School of Medicine, Medical Education Department, P.O. Box 3926, Springfield, IL 62
Dr. Robert Tsutakawa, University of Missouri, Department of Statistics, 222 Math. Sciences Bldg., Columbia, MO 65211
Dr. David Thissen, Department of Psychology, University of Kansas, Lawrence, KS 66044
Dr. James Juola, Department of Psychology, University of Kansas, Lawrence, KS 66045
Dr. Susan Embtetson, Department of Psychology, University of Kansas, Lawrence, KS 66045
Dr. Janet McDonald, Psychology Department, Louisiana State University, Baton Rouge, LA 70803
Dr. Frank Durso, Department of Psychology, University of Oklahoma, Norman, OK 73019Dr. Thomas A. Warm, ;AA Academy AAC934D, P.O. Box 25082, Oklahoma City, OK 73125
Dr. Jeffery L. Kennington, School of Engr. 1.Applied Sciences, Southern Methodist University, Dallas, TX 75275
Dr. Roy Lachman, Department of Psychology, University of Houston, Houston, TX 77004Major John Welsh, AFHRL/MOAN, Brooks AFB, TX 78223Dr. Benjamin A. Fairbank, Operational Technologies Corp., 5825 Callaghan, Suite 225, San Antonio, TX 78228
LT COL Bill Ercoline, AFHRL/MOE, Brooks AFB, TX 78235Dr. Sherrie Gott, AFHRL/MOMJ, Brooks AF3, TX 78235-5601Dr. James A. Earles, Air Force Human Resources Lab, Brooks AFB, TX 78235
Dr. William Howell, Chief Scientist, AFHRL/CA, Brook AFB, TX 78235-5601Dr. Patrick Kyllonen, AFHRL/MOEL, Brooks AFB, TX 78235Dr. Raynond E. Christal, UES LAMP Science Advisor, AFHRL/MOEL, Brooks AFB, TX 78235
Dr. Malcclm Ree, AFHRL/MOA, Brooks AFB, TX 78235Technical. Director Air Force Human Resources Lab., Brooks AFB, TX 78236-5601
Dr. William Koch, Box 7246, Meas. and Eval. Ctr., University of Texas-Austin, Austin, TX 78703
Dr. Donald J. Foss, Department of Psychology, Mezes 312, University of Texas, Austin, TX 78712
Dr. Philip B. Gough, Department of Psychology, University of Texas, Austin, TX 78712
Dr. George R. Potts, Department of Psychology, University of Denver, Denver, CO 80208
Dr. Janice Keenan, Department of Psychology, University of Denver, Denver, CO 80208
Dr. Patricia Baggett, Department of Psychology, University of Denver, 2030 S. York, Denver, CO 80208
Dr. Marshall Haith, Department of Psychology, University of Denver, Denver, Colorado 80210
Dr. Anders Ericsson, Psychology Department, University of Colorado, Boulder, CO 80309Dr. Stephanie Doane, Institute of Cognitive Science, Campus Box 345, Boulder, CO 80309-0345
74 75

Dr. Robert L. Linn, Campus Box 249, University of Colorado, Boulder, Co 80309-0249Dr. Peter G. Poison, Department of Psychology, University of Colorado, Boulder, CO 80309Dr. James B. Olsen, WICAT Systems, 1875 South State Street, Orem, UT 84058Dr. Nancy Eldredge, College of Education, rivision of Special Education, The Univorsity of Arizona, Tucson, AZ 85721Dr. Kenneth Forster, Department of Psychology, University of Arizona, Tucson, AZ 85721Dr. Patricia Cheng, Department of Psychology, University of California, Los Angeles, CA 90024Dr. Eva t. Baker, UCLA Center for the Study, of Evaluation, 145 Moore Hall, University of California, Los Angeles, CA 90024
Dr. Keith Holyoak, Department of Psychology, University of California, Los Angeles, CA 90024Dr. Donald G. MacKay, Department of Psychology, University of California, Los Angeles, CA 90024Dr. Harold F. O'Neil, Jr., School of Education - WPH 801, Department of Educational, Psychology & Technology, University of SouthernDr. Rand R. Wilcox, University of Southern, California, Department of Psychology, Los Angeles, CA 90089-1061Dr. Norman Cliff, Department of Psychology, Univ. of So. California, Los Angeles, CA 90089-1061Dr. Diane Demos, Dept. of Human Factors, ISSM, Univ. of Southern California, Los Angeles, CA 90089-0021Dr. William P. Banks, Department of Psychology, Pamona College, Claremont, CA 91711Dr. Mary Schratz, 905 Orchid Way, Carlsbad, CA 92009Dr. Paul Horst, 677 G Street, *184, Chula Vista, CA 92010Dr. Elizabeth Bates, Department of Psychology, University of California, San Diego, La Jolla, California 92093Dr. George Mandler, Department of Psychology, University of California, La Jolla, CA 92093Dr. Marta Kutas, Department of Neuroscionces, M-008, University of California, San Diego, La Jolla, CA 92093
Dr. Donald A. Norman, Department of Psychology, Univorsity of California, La Jolla, CA 92093Dr. R. C. Atkinson, Chancellor, University of California, San Diego, La Jolla, California 92093Dr. Jean Mandler, Department of Psychology, University of California, La Jolla, CA 92093Dr. James R. McBride, The Psychological Corporation, 1250 Sixth Avenue, San Diego, CA 92101Technical Director Navy Health Research Ctr., P.O. Box 85122, San Diego, CA 92138Dr. James McMichael, Technical Director, Navy Personnel R&D Center, San Diego, CA 92152-6800Head, Training Technology Department, NPRDC (Code 15), San Diego, CA 92152-6800Mr. Paul Foley, Navy Personnel R &D Center, San Diego, CA 92152-6800Mr. John H. Wolfe, Navy Personnel R &D Center, San Diego, CA 92152-6800Dr. Leonard Kroeker, Navy Personnel R &D Center, Code 62, San Diego, CA 92152-6800Library, NPRDC, Code P201L, San Diego, CA 92152-6800Dr. William E. Montague, U.S. Naval Personnel &, Training Research Laboratory, San Diego, CA 92152head, Fleet Liaison Department, NPRDC (Code 03), San Diego, CA 92152-6800Dr. Wallace Wulfeck, II:, Navy Personnel R &D Center, Code 51, San Diego, CA 92152-6800Mr. Brad Sympson, Navy Personnel R &D Center, Code-62, San Diego, CA 92152-6800Mr. Joe Silverman, Code 61, Navy Personnel R &D Center, San Diego, CA 921i:2-6800Ms. Kathleen Moreno, Navy Personnel R &D Center, Code 62, San Diego, CA 92152-6800Dr. P-A. Federico, Code 51, NPRDC, San Diego, CA 92152-6800Naval Ocean Systems Center, Command Support Technology Division, Attn: Mr. J. Grossman, 440_, Bldg. 334, san Diego, CA 92152-500Head, Personnel Systems Department, NPRDC (Code 12), San Diego, CA 92152-6800Technical Director Navy Personnel R &D Center, San Diego, CA 92152-6800Head, Testing Systems Department, NPRDC (Code 13), San Diego, CA 92152-6800Commanding Officer Navy Personnel R &D Center, San Diego, CA 92152-6800Head, Manpower Systems Department, NPRDC (Code 11), San Diego, CA 92152-6800Dr. Frank L. Vicino, Navy Personnel R &D Center, San Diego, CA 92152-6800Dr. Douglas Wetzel, Cod, 51, Navy Personnel R &D Center, San Diego, CA 92152-6800Dr. Dan Segall, Navy Personnel R&D Center, San Diego, CA 92152Dr. Gerald E. Larson, Navy Personnel Research, and Development Center, Testing Systems Dept., San Diego, CA 92152Dr. Richard C. Sorensen, Navy Personnel R &D Center, San Diego, CA 92152-6800Ms. Rebecca Metter, Navy Personnel R &D Center, Code 63, San Diego, CA 92152-6800Mr. Drew Sands, NPRDC Code 62, San Diego, CA 92152-6800Head, Training Systems Department, NPRDC (Code 14), San Diego, CA 92152-6800Dr. Richard Mayer, Department of Psychology, Univ. of California, Santa Barbara, CA 93106Dr. Russell Revlin, Department of Psychology, University of California, Santa Barbara, CA 93106Mr. Richard J. Shavelson, Graduate School of Education, University of California, Santa Barbara, CA 93106Dr. Roberta Klatzky, Department of Psychology, University of California, Santa Barbara, CA 93106Dr. Mary Hagerty, Department of Psychology, University of California, Santa Barbara, CA 93106Dr. Ronald A. Weitzman, Box 146, Carmel, CA 93921Dr. Martin F. Wiskoff, PERSEREC, 99 Pacific St., Suite 4556, Monterey, CA 93940Director, Center for Personnel, Security Research, Suite E, Building 455, 99 Pacific Street, Monterey, CA 93940-2481
76 77

Dr. Wendy Yen, CTB/McGraw Hill, Del Monte Research Patk, Monterey, CA 93940
Department of Operations Research Naval Postgraduate School,, Monterey, CA 93940
Dept. of Administrative Sciences, Code 54,, Naval PostgiA.'uate School, Monterey, CA 93943-5026
Dr. Bruce Bloxom, Defense Manpower Data Center, 99 Pacific St., Suite 155A, Monterey, CA 93943-3231
Prof. Edward Haertel, School of Education, Stanford University, Stanford, CA 94305
Dr. David Rumelhart, Department of Psychology, Stanford University, Stanford, CA 94305
Dr. Roger Shepard, Department of Psychology, Stanford University, Stanford, CA 94305
Dr. Robert Calfee, School of Education, Stanford University, Stanford, CA 94305
Dr. Jim Greeno, Department of Education, Stanford University, Stanford, CA 94305
Dr. Gordon H. Bower, Department of Psychology, Stanford University, Stanford, California 94305
Dr. Richard E. Snow, School of Education, Stanford University, Stanford, CA 94305
Dr. Herbert H. Clark, Department of Psychology, Stanford University, Stanford, California 94305
Dr, Amos Tversky, Department of Psychology, Stanford University, Stanford, CA 94305
Dr. Barbara Tversky, Department of Psychology, Stanford University, Stanford, CA 94305
Dr. Daniel Kahneman, Department of Psychology, Univ. of Calif., Berkely, Berkeley, CA 94720
Dr. Stephen E. Palmer, Department of Psychology, University of California, Berkeley, CA 94720
Dr. Andrea A. diSessa, School of Education, University of California, Berkeley, CA 94720
Dr. Perry W. Thorndyke, FMC Corporation, Central Engineering Labs, 12C5 Coleman Avenue, Box 580, Santa Clara, CA 95052
Dr. Patricia Goldman-Rakic, Neuroanatomy Department, Yale Medical School, 333 Cedar St., Now Haven, CT 96510
Dr. James Paulson, Department of Psychology, Portland State University, P.O. Box 751, Portland, OR 97207
Dr. G. Gage Kingsbury, Portland Public Schools, Research and Evaluation Department, 501 North Dixon Street, P. 0. Box 3107, Portland,
Dr. M. I. Posner, Department of Psychology, University of Oregon, Eugene, OR 97403
Dr, Douglas Hintzman, Department of Psychology, University of Oregon, Eugene, Oregon 97403
Dr. Morton A. Gernsbacher, Department of Psychology, University of Oregon, Eugene, OR 97403-1227
Dr. Geoffrey Loftus, Department of Psychology, University of Washington, Seattle, WA 98195
Dr. Earl B. Hunt, Department of Psychology, University of Wasnington, Seattle, WA 98195
Dr. Wallace E. Lambert, Department of Psychology, McGill University, Montreal, Quebec, Canada H3A 1BI
Dr. Alinda Friedman, Department of Psychology, University of Alberta, Edmonton, Alberta T6G 2E9, CANADA
Dr. Fernanda Ferreira, Department of Psychology, University of Alberta, Edmonton, Alberta T6G2E1, CANADA
Dr. Albert S. Btegman, Department of Psychology, 1205 McGregor Ave., Montreal, Quebec, CANADAProf. John A. Keats, Department of Psychology, University of Newcastle, N.S.W. 2308, AUSTRALIA
Prof. Donald Fitzgerald, University of New England, Dep...tment of Psychology,, Armidale, New South Wales 2351, AUSTRALIA
Dr. Gerhard Fischer, Llebiggasse 5/3, A 1010 Vienna, AUSTRIA
Dr. Norman Segalowitz Department of Psychology, Concordia University, 7141 Sherbrooke St. West, Montreal, Quebec, CANADA H4B 1R6
Cdt. Arnold Bohrer, Sectie Psychologisch Onderzoe.c, Rekruterings-En Selectiecentrum, Kwartier Koningen Astrid, Bruijnstreat, 1120 Bru
Dr. Erling B. Andersen, Department of Statistics, Studiestraede 6, 1455 Copenhagen, DENMARK
Dr. Peter Dixon, Department of Psychology, University of Alberta, Edmonton, Alberta, Canada T6G 2E9
Michael Habon, DORNIER GMBH, P.O. Box 1420, D-7990 Friedrichshafen 1, WEST GERMANY
Dr. Menucha Birenbaum, School of Education, Tel Aviv University, Ramat Aviv 69978, ISRAEL
Dr. Jane Oakhill, Experimental Psychology Department, University of Sussex, Brighton BN1 9QG, GREAT BRITAIN
Dr. Alan Garnham, Experimental Psychology Department, University of Sussex, Brighton BN1 9QG,, GREAT BRITAIN
Dr. Kazuo Shigemasu, 7-9-24 Kugenuaa-Kaigan, Fujisawa 251, JAPAN
Mr. John F. Hodgkiss, SP(N), Room 429A, ABS, Old Admiralty Buildings, Spring Gardens, London SWIA 2BE, UNITED KINGDOM
Dr. MeredyPh Daneman, Department of Psychology, University of Toronto, Erindale Campus, Mississauga, Ontario,, Canada L5L 106
Dr. Neil Charness, Psychology Department, University of Waterloo, Waterloo, Ontario Canada N2L 3G1
Dr. Erik De Corte, Educational Psychology Dept., Vesalivsstraat 2 B-3000, Leuven, BELGIUM
Dr. Hans F. Crombag, Faculty of Law, University of Limburg, P.O. Box 616, Maastricht, The NETHERLANDS 6200 MD
Dr. Gustav M. Habermann, Budapest 13, P.O. Box PF/65, 1253 HUNGARY
Dr. Lesley Hall, School of Education, Deakin University, Vines Road North Geelong, Victoria 3217 AUSTRALIA
Dr. Helmut M. Niegemann, Bayernstrasse 12, D-6670 St. Ingbert, WEST GERMANY
Dr. Reyes Vazquez L.:1Z°, Colegio Universitario de, La Coruna, Seccion de Psicologia, Campus de La Zapateira s /n,, 15008, La Coruna, ESP
Dr. Murray Singer, Department of Psychology, University of Manitoba, P'05 Duff Roblin, Winnipeg, Manitoba, Canada R3T 2N2
Dr. Alan D. Baddeley, MRC Applied Psychology Unit, 15 Chaucer Road, Cambridge, ENGLAND CB2 2EF
Prof. G. Flores d'Arcais, Psychology Department, University of Leiden, The Netherlands
Dr. Willem Levelt, Max-Planck Institute, for Psycholinguistics, Wundtlaan 1, NL-6525 XD Nijmegen, The Netherlands
Dr. G. d'Ydewalle, Department of Psychology, University of Leuven, D-3000 Leuven, Belgium
Dr. Heinz Mandl, Deutsches Institut, fur Fernstudien, der Universitet Tubingen,, Bei der Fruchtschranne 6, 7400 Tubingen, West Germany
Professor Dr. G. Lust-, Psychology Institute, Georg-August University, Gosslerstrasse 14, D 3400 Gottingen,, West Germany
78 7S