Embed Size (px)
Citation preview
DOCUMENT RESUME
ED 268 511 CS 008 417
AUTEOR Massaro, Dominic W.; And OthersTITLE Frequency, Orthographic Regularity, and Lexical
Status in Letter and Word Perception. TechnicalReport No. 550.
INSTITUTION Wisconsin Univ., Madison. Research and DevelopmentCenter for Individualized Schooling.
SPONS AGENCY National Inst. of Education (ED), Washington, DC.PUB DATE Aug 80GRANT OB-NIE-G-80-0117NOTE 117p.; A report from the Project on Studies in
Language: Reading and Communication.PUB TYPE Reports - Research/Technical (143)
EDRS PRICE MF01/PC05 Plus Postage.DESCRIPTORS *Cognitive Processes; English; Higher Education;
*Letters (Alphabet); *Orthographic Symbols; *ReadingResearch; Spelling; Visual Learning; *Word Frequency;*Word Recognition; Word Study Skills
IDENTIFIERS *Orthographic Stricture
ABSTRACTA study assessed the role of orthographic structure
in college students' perceptual recognition and judgment of letterstrings. Lexical status, word frequency, bigram frequency, log bigramfrequency, and regularity of letter sequencing were orthogonallyvaried across a series of experiments. Six - letter words and theiranagrams were used as test stimuli in a target-search task. Resultsshowed that words were recognized better than their correspondingequally well-structured anegrams, but that word frequency had littleeffect. Orthographically regular anagrams were recognized better thanirregular anagrams, whe:eas log bigram frequency did net have aneffect. In contrast, pest hoc correlations revealed that log bigramfrequency did correlate significantly with individual itemperformance. In a final experiment, subjects judged which of a pairof letter strings most resembled English in terms of either thefrequency or the regularity of letter sequences. Findings repealed aninfluence of essentially the same dimensions of orthographicstructure as that revealed by the perceptual recognition task. Theoverall results provided evidence for lexical status, regularity ofletter sequencing, and frequency of letter sequencing as importantdimensions in the psychologically real description of orthographicstructure. (Author/FL)
******************
Reproductions*
******************
*************
supplied byfrom the
*************
******************
EDRS are the bestoriginal document.******************
**********************that can be made
*
**********************
et
Technical Report No. 550
FREQUENCY, ORTL' ""HIC REGULARITY,
AND LEXICAL S IN LETTER
AND WORD PERCEPTION
by
Dominic Massaro, James Jastrzembski and Peter Lucas
Report from the Project onStudies in Language: Reading and Communication
Dominic W. MassaroFaculty Associate
Wisconsin Research and DEvelopment Centerfor Individualized SchcolingThe University of Wisconsin
Madison, Wisconsin
August 1980
Published by the Wisconsin Research and Development Center for Individualized Schooling.
The prc.;cct presented or reported herein was performedpursuant to a grant from the
National Institute of Education, Department of Health, Education, and Welfare. However,
the opinions expressed nerein do not necessarily reflect the position or policy of the
National Institute of Education, and no official endorsement by the National Institute
of Education should be in!erred.
Center Grant No. OD-NIE-G-60-0117
" 4
ti
-4
MISSION STATEMENT
The mission of the Wisconsin Research and Development Center
is to improve the quality of education by addressing the full
range of issues and problems related to individualized schooling.
Teaching, learning, and the problems of individualization are
given concurrent attention in the Center's efforts to discover
processes and develop strategies and materials for use in the
schools. The Center pursues its mission by
conducting and synthesizing research to clarify the
processes of school-age children's learning and
development
conducting and synthesizing research to clarify effective
approaches to teaching students basic skills and concepts
developing and demonstrating improved instructional strategies,
processes, and materials for students, teachers, and school
administrators
providing assistance to educators which helps transfer theoutcomes of research and development to improved practice
in local schools and teacher education institutions
The Wisconsin Research and Development Center is supported
with funds from the National Institute of Education and the
University of Wisconsin.
WISCONSIN RESEARCH AND DEVELOPMENTCENTER FOR INDIVIDUALIZED SCHOOLING
Abstract
The present research assessed the role of orthographic
structure in the perceptual recognition and the judgment of
letter strings. Lexical status, word frequency, bigram
frequency, log bigram frequency, and regularity of letter
sequencing were orthogonally varied across a series of
experiments. Six-letter words and their anagrams were used
as test stimuli in a target-search task. Words were
recognized better than their corresponding equally well-
structured anagrams but word frequency had little effect.
Orthographically regular anagrams were recognized better
than irregular anagrams whereas log bigram frequency did not
have an effect. In contrast, post hoc correlations revealed
that log bigram frequency did correlate significantly with
individual item performance. In a final experiment,
subjects judged which of a pair of letter strings most
resembled English in terms of either the frequency or the
regularity of letter sequences. The results revealed an
influence of essentially the same dimensions of orthographic
structure as was revealed by the perceptual recognition
task. The results provide evidence for lexical status,
regularity of lettter sequencing, and frequency of letter
sequencing as important dimensions in the psychologically -
real description of orthographic structure.
v
Orthographic structure and visual
processing of letters and words.
It is widely acknowledged that the reader contributes
as much or more to reading than does the "information" on
the printed page. One compelling issue in reading research
is how the reader's higher-order knowledge of the language
interacts with lower-level perceptual analyses during
reading. The specific question addressed in the present
paper is how the reader's knowledge about orthographic
structure is combined with the information derived from
visual featural analysis in letter and word recognition.
Orthographic structure refers to the spelling constraints in
a written language. Visual featural analysis refers to the
evaluation of component properties of letters leading to
letter and word recognition. Given the considerable amount
of predictability in English writing, we ask how the reader
utilizes this orthographic structure in word recognition.
Evaluation of the contributions of visual features and
orthographic structure to word recognition can be
facilitated by a detailed .description of the processes
involved in reading. The description we use is part of a
more general model of language processing model (Massaro,
1975, 1973, 1979a; Massaro, Taylor, Venezky, Jastrzembski &
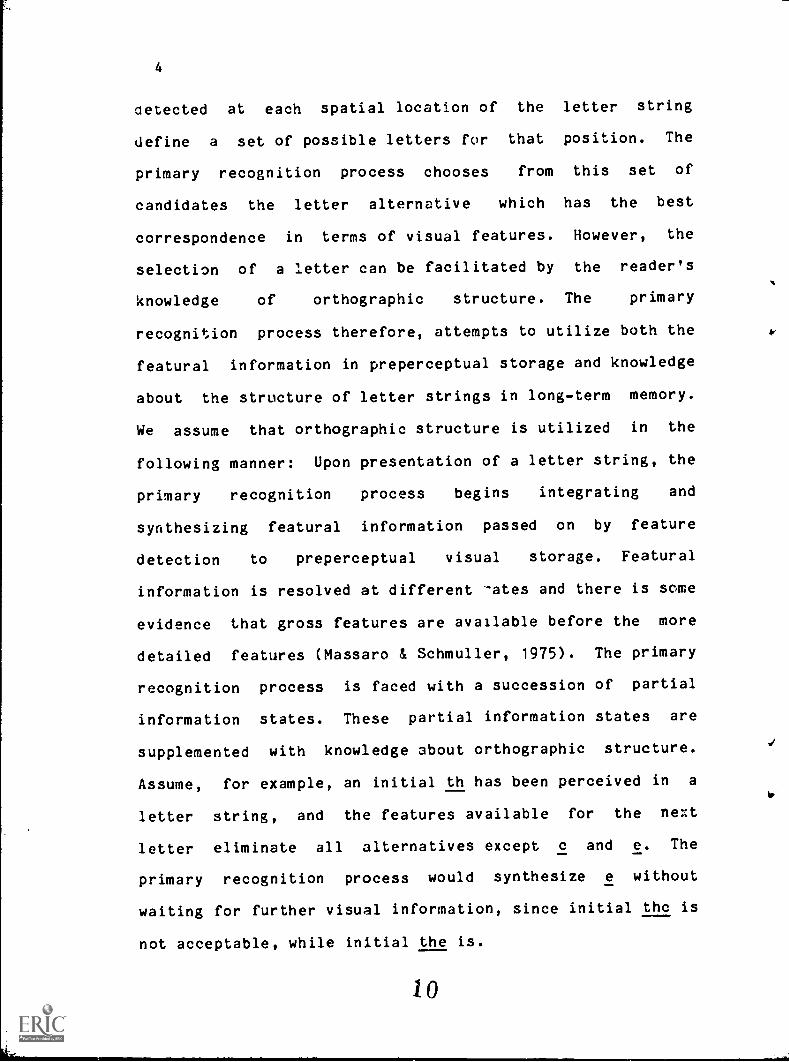
Lucas, 1930). According to the model, reading can be viewed
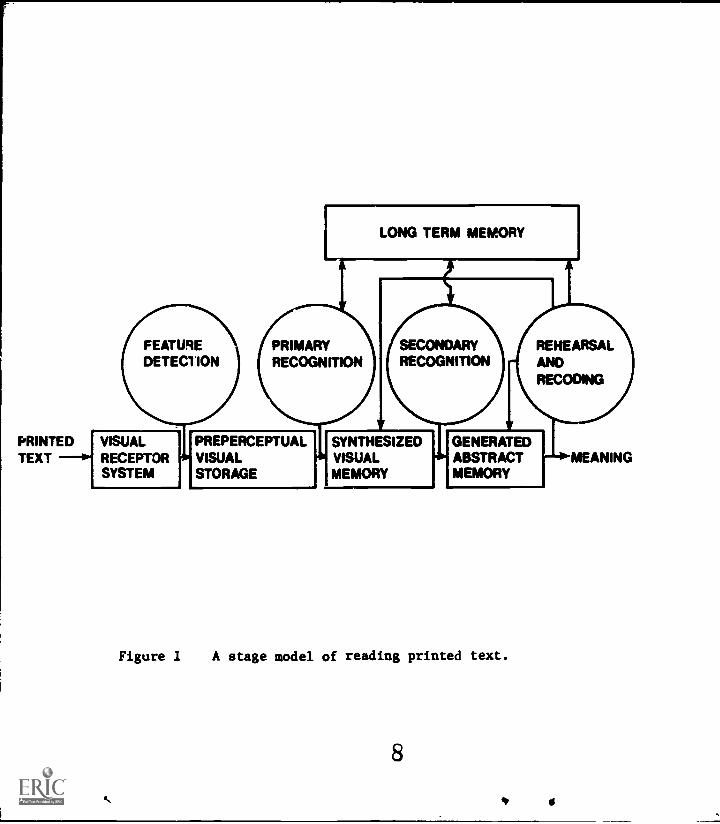
as a sequence of processing stages. Figure 1 presents a
schematic representation of the stages of processing; at
each stage of processing, memory and process components are
7
LONG TERM MEMORY
FEATUREDETECTION
PRIMARYRECOGNITION
SECONDARYRECOGNITION
REHEARSALANDRECODING
VISUALRECEPTORSYSTEM
PREPERCEPTUAL SYNTHESIZEDVISUAL VISUALSTORAGE MEMORY
GENERATEDABSTRACTMEMORY
Figure 1 A stage model of reading printed text.
8
4
3
represented. Each memory component (indicated by a
rectangle) corresponds to the information available at a
particular stage of processing. Each process component
(indicated by a circle) corresponds to the operations
applied to the information held by the memory component.
The memory components are temporary storages except for
long-term memory which is relatively permanent. It is
assumed that long-term memory supplements the information at
some of the processing stages.
During reading, the light pattern reflected from a
display of letters is transduced by the visual receptors as
the feature detection process detects and transmits visual
features to preperceptual visual storage (see Figure 1). As
visual features enter in preperceptual visual storage, the
primary recognition process attempts to transform these
isolated features into a sequence of letters and spaces in
synthesized visual memory. To do this, the primary
recognition process can utilize information held in long-
term memory. For the accomplished reader this includes a
list of features for each letter of the alphabet along with
information about the orthographic structure of the
language. Accordingly, the primary recognition process uses
both the visual features in preperceptual storage and
knowledge of orthographic structure in long-term memory
during the synthesis of letter strings.
The primary recognition process operates on a number of
letters simultaneously (in parallel). The visual features
4
oetected at each spatial location of the letter string
define a set of possible letters for that position. The
primary recognition process chooses from this set of
candidates the letter alternative which has the best
correspondence in terms of visual features. However, the
selection of a letter can be facilitated by the reader's
knowledge of orthographic structure. The primary
recognition process therefore, attempts to utilize both the
featural information in preperceptual storage and knowledge
about the structure of letter strings in long-term memory.
We assume that orthographic structure is utilized in the
following manner: Upon presentation of a letter string, the
primary recognition process begins integrating and
synthesizing featural information passed on by feature
detection to preperceptual visual storage. Featural
information is resolved at different -ates and there is some
evidence that gross features are available before the more
detailed features (Massaro & Schmuller, 1975). The primary
recognition process is faced with a succession of partial
information states. These partial information states are
supplemented with knowledge about orthographic structure.
Assume, for example, an initial th has been perceived in a
letter string, and the features available for the next
letter eliminate all alternatives except c and e. The
primary recognition process would synthesize e without
waiting for further visual information, since initial the is
not acceptable, while initial the is.
10
5
The primary recognition process transmits a sequence of
recognized letters to synthesized visual memory. Figure 1
shows how the secondary recognition process transforms this
synthesized visual percept into a meaningful form in
generated abstract memory. We assume secondary recognition
attempts to close off the letter string into a word. The
secondary recognition p.ocess makes this transformation by
finding the best match between the letter string and a word
in the lexicon in longterm memory. Each word in the
lexicon contains both perceptual and conceptual codes. The
word which is recognized is the one whose perceptual code
gives the best match and whose conceptual code is most
appropriate in that particular context. Knowledge of
orthographic structure can also contribute to secondary
recognition; word recognition can occur without complete
recognition of all of the component letters. Given the
letters bea and the viable alternatives 1 and t in final
position, only t makes a word, and therefore word
identification (lexical access) can be achieved (Massaro,
Note 1).
Our goals in the present series of experiments are to
provide a better understanding of the primary and secondary
recognition process and to evaluate which aspect of
orthographic structure the reader knows and uses. To assess
how readers utilize knowledge about the structure of written
language, it is necessary to state various descriptions of
this structure and then to determine how well these
11
6
descriptions capture reading performance. Venezky and
Massaro (1979), Massaro, Venezky, & Taylor (1979) and
Massaro et al. (1930) have distioguished between two broad
categories of orthographic structure: statistical
redundancy and rule-governed regularity. The first category
includes all descriptions derived solely f .3111 the frequency
of letters and letter sequences in written texts. The
second category includes all descriptions derived from the
phonological constraints in English and scribal conventions
for the sequences of letters in words. Since a change in
one category vould not affect the other, the two categories
were viewed as nonoverlapping. The task then was to first
decide which general category seemed to reflect the manner
in which reader's store knowledge of orthographic structure
and second, to determine precisely which specific
description within that catrgory han the most psychological
reality.
Massaro et al. (1979a, 1980) contrasted a specific
statistical-redundancy description with a specific rule-
governed description by comparing letter strings that varied
orthogonally with respect to these descriptions. The
statistical redundancy measure was summed token singly- -
letter frequency. The rule-governed regularity measure was
a preliminary set of rules similar to those presented in
Table 2 of the present paper. Letter strings were selected
which represented the four combinations formed by a
factorial arrangement of high and low frequency and regular
12
7
or irregular. In a series of experiments utilizing a
target-search task, subjects were asked to indicate whether
a target letter wes present in these letter strings. Both
accuracy and reactin-time measures indicated psychological
reality for both the frequency and the regularity
description of orthographic structure.
Massaro et al. (1980) formalized the language
processing model to provide a quantitative description of
the facilitative effect of orthographic structure on task
accuracy. The basic assumption of the model is that
knowledge of orthographic structure contributes an
independent source of information about the letter string.
By an independent source of information, we mean that
knowledge of orthographic structure does not modify or
direct the feature detection process. Rather, information
about visual features and orthographic structure accumulates
from sources that do not interact. Since information about
structure adds to featural information, fewer visual
features are necessary to resolve well-structured than
poorly-structured strings. The model was applied to the
target-search task by formalizing a decision algorithm
assumed to be used by the subject when faced with partial
information. The model provided a good quantitative
description of the accuracy results. The parameters of the
model were psychologically meaningful and the parameter
values corresponding to the number of letters seen in the
test string provided a quantitative measure of the
8
contribution of orthographic structure. According to the
model, readers were able to recognize two additional letters
in brief presentations of well-structured strings compared
to poorly-structured strings. This is a substantial effect
considering that two letters represent one-third of the
six-letter test string. These results indicate that we had
developed good initial approximations of both a description
of orthographic structure and the means by which structure
and visual features combine during word recognition. This
bolstered our hope that a precise description of
orthographic structure can eventually be determined and that
a thorough understanding of the word recognition processes
in reading can eventually be obtained.
Massaro et al. (1980) also conducted a series of overt
judgment experiments to assess which descriptions of
orthographic structure are consciously available. We asked
whether subjects could descriminat# among the items on the
basis of rule-g vcrned regularity or on the basis of
statistical redundancy. Subjects were presented pairs of
letter strings and asked to choose the member of each pair
which most resembled written English. The instructions
Emphasized either a regularity or a statistical - redundancy
criterion. Subjects' judgments appeared to be more
accurately described by rule-governed regularity than by
statistical redundancy. In this way, the results from the
overt judgment task paralleled the results from the target-
search task. Evidently, readers not only use their
14
9
knowledge of orthographic structure during the word
recognition process, but also are aware of this knowledge
and can use it in tasks requiring decisions after the word
recognition processes have been completed. As suggested by
the model, orthographic structure appears to exert an
influence on several stages of language processing (Massaro,
1980).
The factorial design of the Massaro et al. (1980)
experiments contrasted just one measure of rule-governed
regularity with one measure of statistical redundancy.
Therefore, a large number of post hoc correlational analyses
was conducted to evaluate a wide range of measures of
orthographic structure. This was a first step towards
refining our initial measures of orthographic structure.
Through these correlations, it might be possible to
determine the necessary refinements to reach our goal of a
psychologically real description of orthographic structure.
The dependent measure was the performance on each of 200
test items. Position-sensitive summed log bigram frequency
provided the best statistical-redundancy description of
performance on the individual items. Furthermore, an
improved rule-based regularity measure also provided a very
good description. However, the regularity measure
correlated very highly with the best frequency-based
measure. For this reason, it was not possible in these
experiments to make a definitive choice between rule-
15
10
governed and statistical-redundancy descriptions of
structure.
Since Massaro et al. (1980) were not successful in
choosing between rule-governed regularity and statistical
redundancy descriptions, the next step is tc refine our
measures of structure in a further attempt to select a
single measure of structure. Given the best statistical-
redundancy measure, it is possible to develop a new set of
test iterrs to contrast this measure with an improved rule-
governed regularity measure. We follow this logic in the
present studies by factorially contrasting bigram frequency
and regularity measures in target search and overt judgment
tasks. Although bigram frequency and regularity are highly
correlated, a design involving orthogonal contrasts might be
sufficient to distinguish between them. As with the
previous experiments (Massaro et al. 1980), it again will be
necessary to examine post hoc correlations to determine
whether some other measure might provide even a better
description. By refining and repeatedly testing measures of
structure, we hope to arrive at a single description that
best reflects the reader's knowledge of orthographic
structure.
Method
Experiments 1 and 2
16
11
Subjects. Nine subjects were used in the first
experiment and eleven were used in the second. All were
Introductory Psychology student volunteers who received
credit toward their course grade for participating.
Additionally, they were all native English speakers, right-
handed, had normal or corrected to normal vison, and had not
participated in any of the other experiments.
Stimuli and apparatus. A sample of high-frequency
words was obtained from a list of all six-letter words from
Kucera and Francis (1967), subject to the constraints that
the words had a frequency greater than or equal to 50, were
net proper nouns, and did not have repeated letters. A
similar list of words with a frequency of exactly three was
used to obtain low-frequency words. For each word in these
two lists, all possible 720 anagrams were generated and each
of their summed-positional bigram frequencies was
calculated. The bigram frequencies were based on counts
given by Massaro et al. (1980) which were derived from the
Kucera and Francis (1967) word list. Forty high-frequency
and 40 low-frequency words were selected along with four
anagrams of each word. The anagrams were selected so that
they formed a factorial arrangement of high and low summed-
positional bigram frequency and of being orthographically
regular and irregular. Orthographic regularity was
manipulated in the same manner as in previous experiments
(Massaro et al., 1979, 1930). The rules for choosing
12
Table 1
The Rules for Choosing Regular and Irregular Letter Str
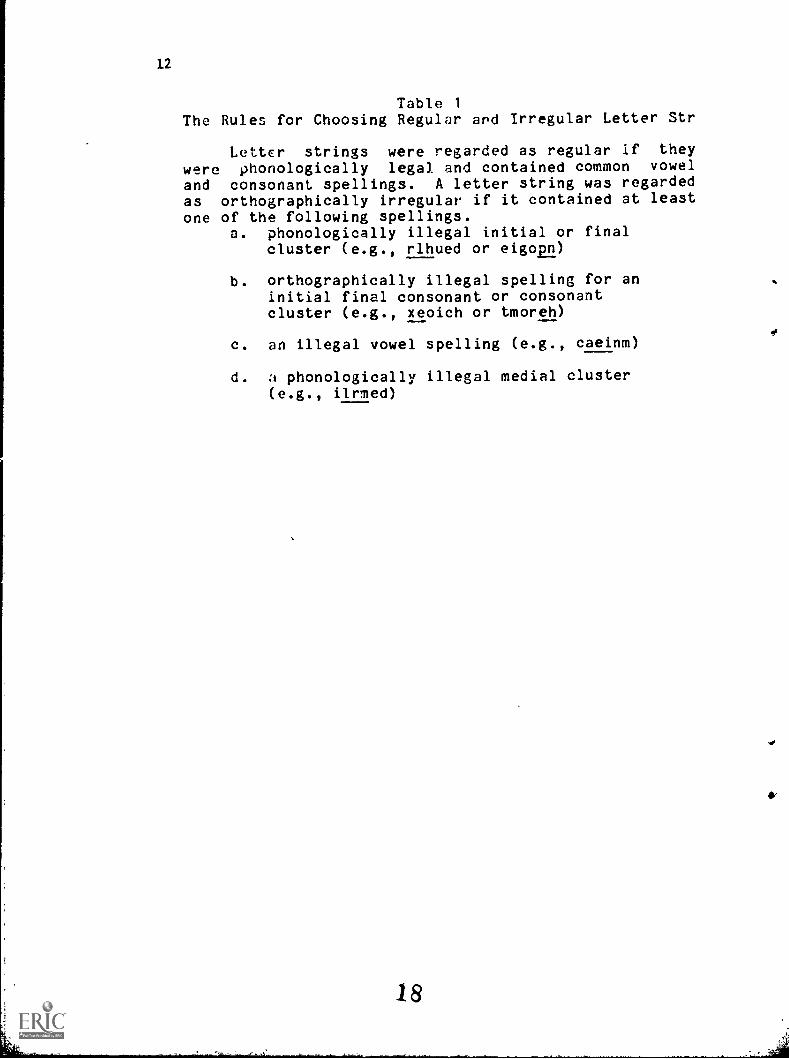
Letter strings were regarded as regular if they
were phonologically legal and contained common vowel
and consonant spellings. A letter string was regardedas orthographically irregular if it contained at leastone of the following spellings.
a. phonologically illegal initial or finalcluster (e.g., rlhued or eigom)
b. orthographically illegal spelling for aninitial final consonant or consonantcluster (e.g., xeoich or tmoreh)
c. an illegal vowel spelling (e.g., caeinm)
d. a phonologically illegal medial cluster(e.g., ilrmed)
ii
13
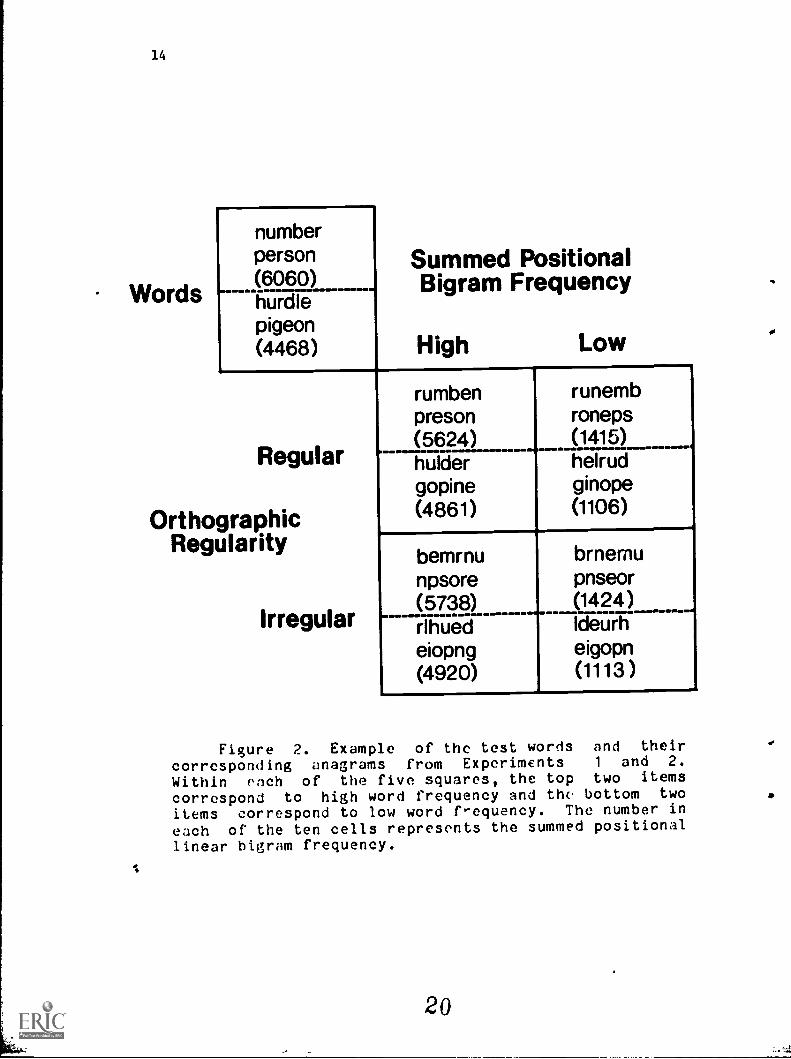
regular and irregular strings are given in Table 1. Some
examples of the words and their respective anagrams are
presented in Figure 2. Number and person have high word
frequencies while hurdle and pigeon have low frequencies.
The letter string rumben is a regular-high anagram of the
word number, and helrud is a regular-low anagram of hurdle.
The number in each cell gives the average summed-positional
bigram frequency for the items of that class. For example,
the irregular-high anagrams of high frequency words have an
average count of 5738.
Twenty arbitrarily chosen high-frequency wards and
their anagrams as well as 20 low-frequency words and their
anagrams were selected as stimuli for the first experiment.
The remaining 20 high- and 20 low-frequency anagrams were
used with new subjects in the second experiment. The letter
strings for the two experiments are presented in Appendices
1 and 2.
The visual displays were generated by a DEC LSI-11
computer under software control and presented on Tektronix
Monitor 604 oscilloscope (Taylor, Klitzke, & Massaro, 1978a,
1978b). These monitors employ a P31 phosphor which decays
to .1% of stimulated luminance within 32 msec of stimulus
offset. The alphabet consisted of lower-case nonserfied
letters resembling the type font Univers 55. For an
observer seated comfortably at an experimental station, the
six-letter displays subtended about 1.9 degrees of visual
angle horizontally and the distance from the top of an
19
14
Words
numberperson(6060)hurdlepigeon(4468)
Summed PositionalBigram Frequency
High Low
Regular
OrthographicRegularity
Irregular
rumben runembpreson roneps(56_ 24) (1415)_ _ ______.hulder helrudgopine ginope(4861) (1106)
bemrnu brnemunpsore pnseor(5738) (1424)rlhued ldeurheiopng eigopn
-
(4920) (1113)
Figure 2. Example of the test words and their
corresponding anagrams from Experiments 1 and 2.
Within rach of the five squares, the top two items
correspond to high word frequency and the bottom two
items correspond to low word frequency. The number in
each of the ten cells represents the summed positional
linear bigram frequency.
20
15
ascender to the bottom of a descender was about .4 degree.
Up to four subjects could be tested in parallel in separate
rooms.
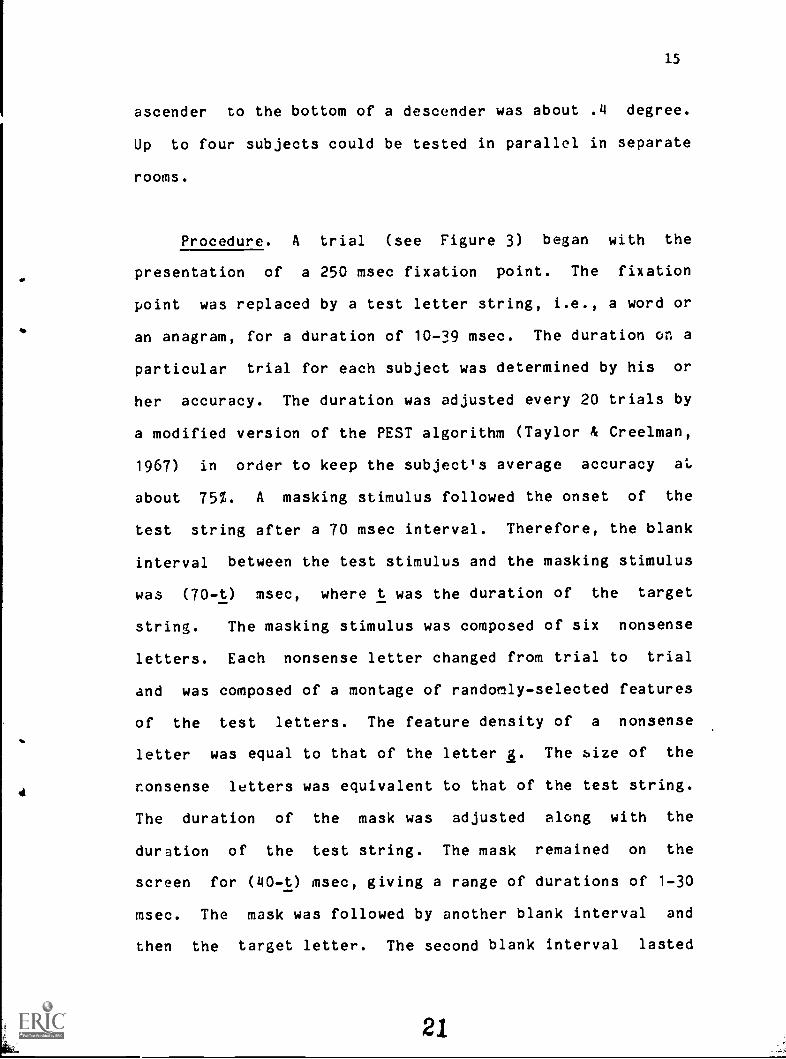
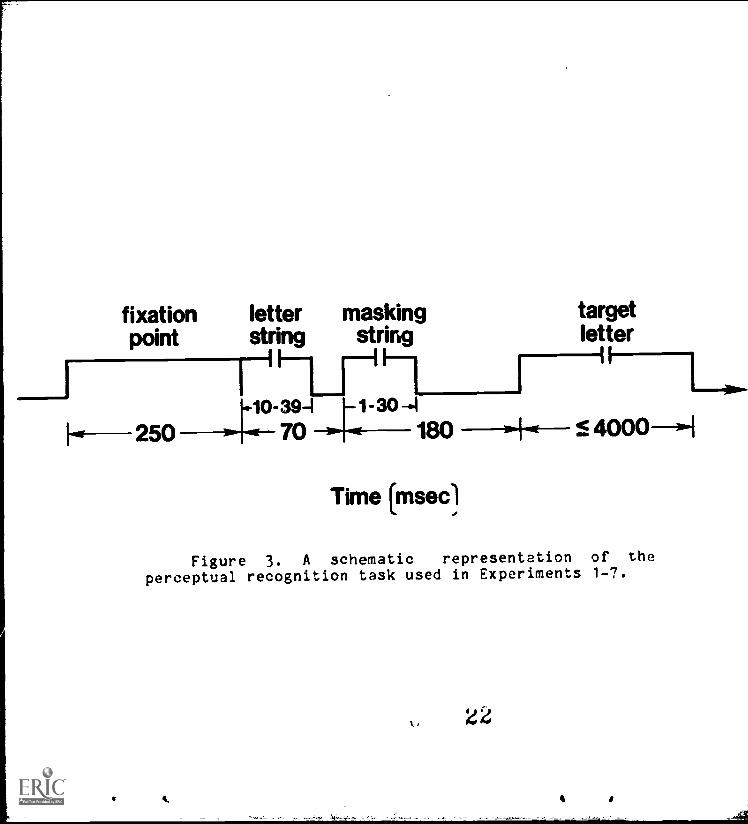
Procedure. A trial (see Figure 3) began with the
presentation of a 250 msec fixation point. The fixation
point was replaced by a test letter string, i.e., a word or
an anagram, for a duration of 10-39 msec. The duration on a
particular trial for each subject was determined by his or
her accuracy. The duration was adjusted every 20 trials by
a modified version of the PEST algorithm (Taylor & Creelman,
1967) in order to keep the subject's average accuracy at
about 75%. A masking stimulus followed the onset of the
test string after a 70 msec interval. Therefore, the blank
interval between the test stimulus and the masking stimulus
was (70-t) msec, where t was the duration of the target
string. The masking stimulus was composed of six nonsense
letters. Each nonsense letter changed from trial to trial
and was composed of a montage of randomly-selected features
of the test letters. The feature density of a nonsense
letter was equal to that of the letter z. The size of the
nonsense letters was equivalent to that of the test string.
The duration of the mask was adjusted along with the
duration of the test string. The mask remained on the
screen for (40-t) msec, giving a range of durations of 1-30
msec. The mask was followed by another blank interval and
then the target letter. The second blank interval lasted
21
fixation letter masking targetpoint string string letter
I I HLF"--1250
4-39-1 .V-30 -.I70 180 41 5. 4000---0-1
Time (msecl
Figure 3. A schematic representation of theperceptual recognition task used in Experiments 1-7.
22
17
180 msec minus the duration of the mask. Therefore, the
interval between the onset of the test letter string and the
target letter was always 250 msec. The target letter
remained on the screen until all subjects responded or for a
maximum of four seconds. Finally, the interval between
trials was 500 msec.
Subjects were instructed to indicate whether the target
letter was present in the test string and to be as accurate
as possible. The experiment consisted of a session of 100
practice trials with a practice list that was comparable to
the experimental list and two sessions of 100 experimental
trials each. Within each session, each item was tested once
as a target string and once as a catch string. On target
trials, the target letter was selected randomly with
replacement from the six letters in the test string. For
catch trials, a target was selected randomly from the set of
26 letters weighted by their probability of occurrence in
the stimulus set. If the selected letter was present in the
test string, additional drawings with replacement were made
until an appropriate target letter was selected. Some
letters did not occur in the test strings and therefore were
never tested. A short rest break intervened between the two
experimental sessions. The total time for the three
sessions and the rest break was about 75 minutes. Both
exporinents were conducted in exactly the same manner except
that different subjects and different items were used in
each.
23
18
Results
Two analyses of variance were performed on the
percentage accuracy scores In the first analysis, word
frequency,type of test letter string, target or catch trial,
and subjects were factors. In the second analysis, the word
data were eliminated and regularity and bigram frequency
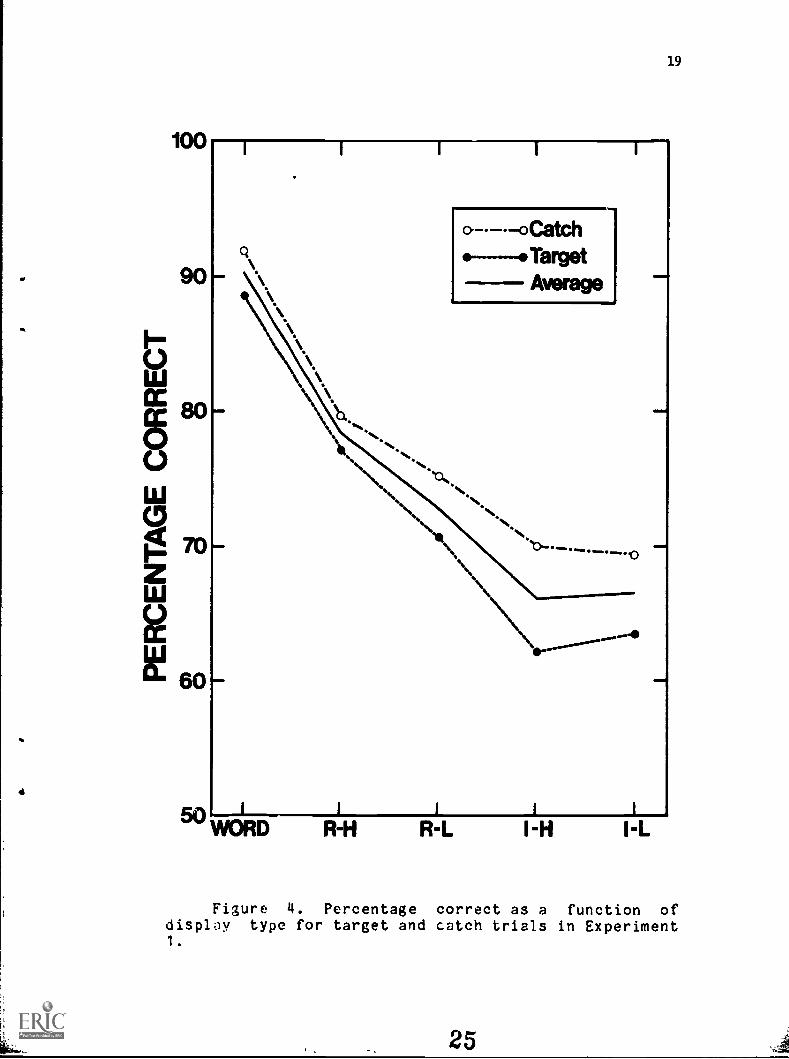
were factors in the design. Figure 4 shows the average
percentage correct on target and catch trials as a function
of letter-string type in Experiment 1. There were large
differences among the various types of letter strings, F (4,
32) = 130.7, 2 < .001. Regular items resulted in a 9.3%
accuracy advantage over irregular items F (1, 8) = 74.7, 2 <
.001, while items of high summed-positional bigram frequency
had 2.5% advantage over items of low summed-positional
bigram frequency, F (1, 8) = 11.4, 2 < .01. The advantage
of high bigram frequency was limited to regular items, F (1,
8) = 10.0, 2 < .05. The difference in accuracy between
words and the regular-high anagrams was 12.0%, F (1, 32) =
23.3 2 < .001. There was no difference in accuracy between
target (72.4%) and catch (77.2%) trials, F < 1, and this
variable did not interact with letter-string type, F< 1.
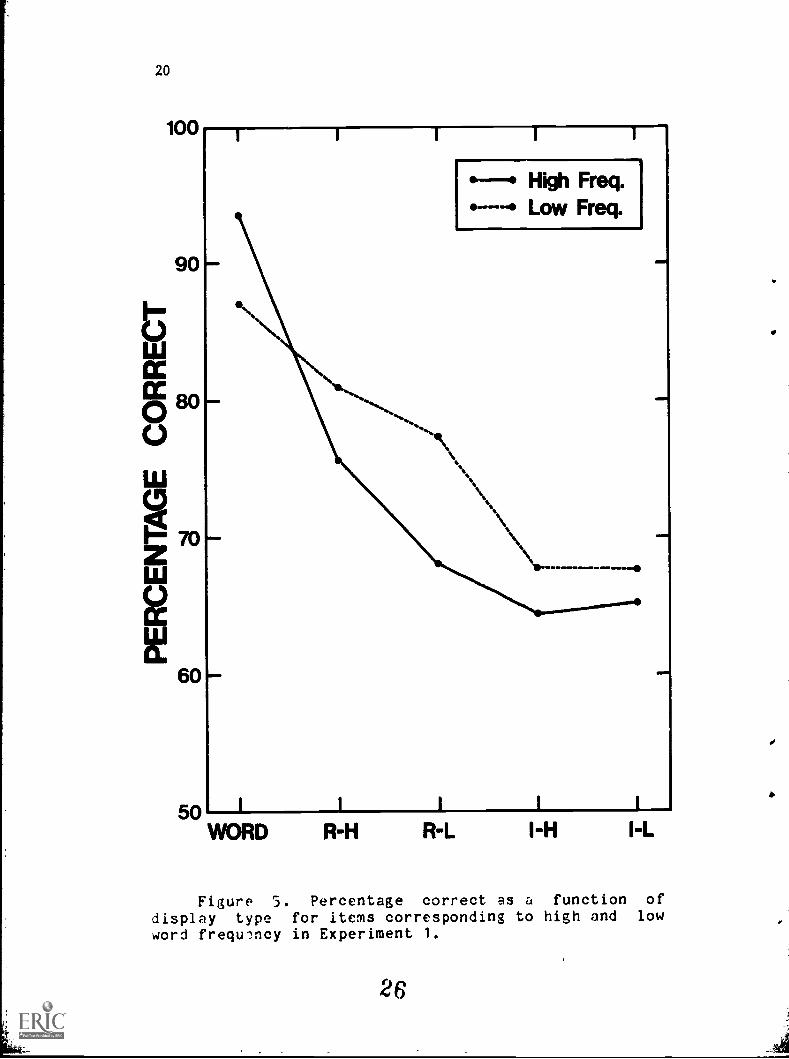
Figure 5 gives the average percentage correct for the
high and low word frequency words and their anagrams as a
function of letter string type. There was an overall 2.7%
advantage for the low-frequency words and their anagrams, F
(1, 8) = 9.86, 2 < .015, and word frequency also interacted
24
N5
gpI0IIIMO0
MIMI
-0---.------*---
--Cr
4
20
90
imm
LUCCCC0 800LU
imm 70
Liu
60
R-H R-L I-L
Figure 5. Percentage correct as a function ofdisplay type for items corresponding to high and lowword frequ-mcy in Experiment 1.
26
21
with letter-string type, F (4, 32) = 6.18, 2 < .Onl. The
overall effect of letter-string ty,)e was 28.3% for the
high-frequency words and their anagrams and 19.5% for the
low-frequency words and their anagrams. This difference
reflected the fact that high-frequency words were more
accurate than low-frequency words, but that the reverse was
the case for the four types of anagrams. Word frequency did
not interact with target vs. catch trials nor was there a
three-way interaction with these variables and letter-string
type (Fs < 1).
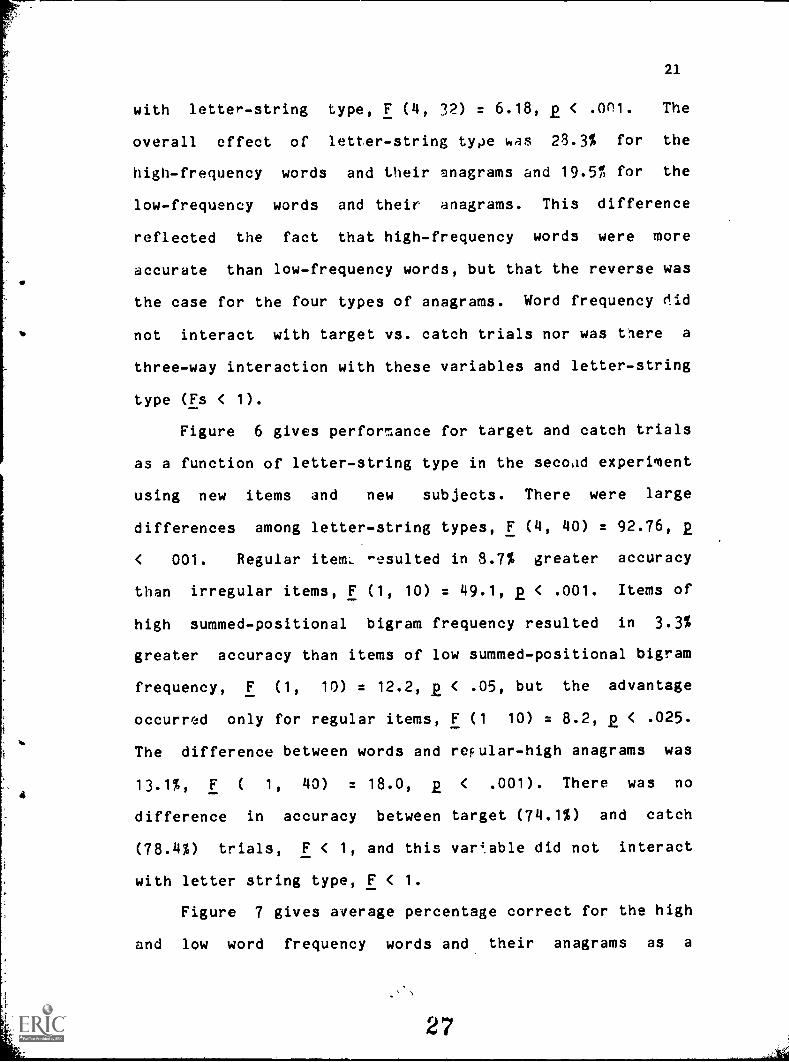
Figure 6 gives performance for target and catch trials
as a function of letter-string type in the second experiment
using new items and new subjects. There were large
differences among letter-string types, F (4, 40) = 92.76, 2
< 001. Regular item. resulted in 8.7% greater accuracy
than irregular items, F (1, 10) = 49.1, 2 < .001. Items of
high summed-positional bigram frequency resulted in 3.3%
greater accuracy than items of low summed-positional bigram
frequency, F (1, 10) = 12.2, 2 < .05, but the advantage
occurred only for regular items, F (1 10) = 8.2, 2 < .025.
The difference between words and regular -high anagrams was
13.1%, F ( 1, 40) = 18.0, 2 < .001). There was no
difference in accuracy between target (74.1%) and catch
(78.4%) trials, F < 1, and this var".able did not interact
with letter string type, F < 1.
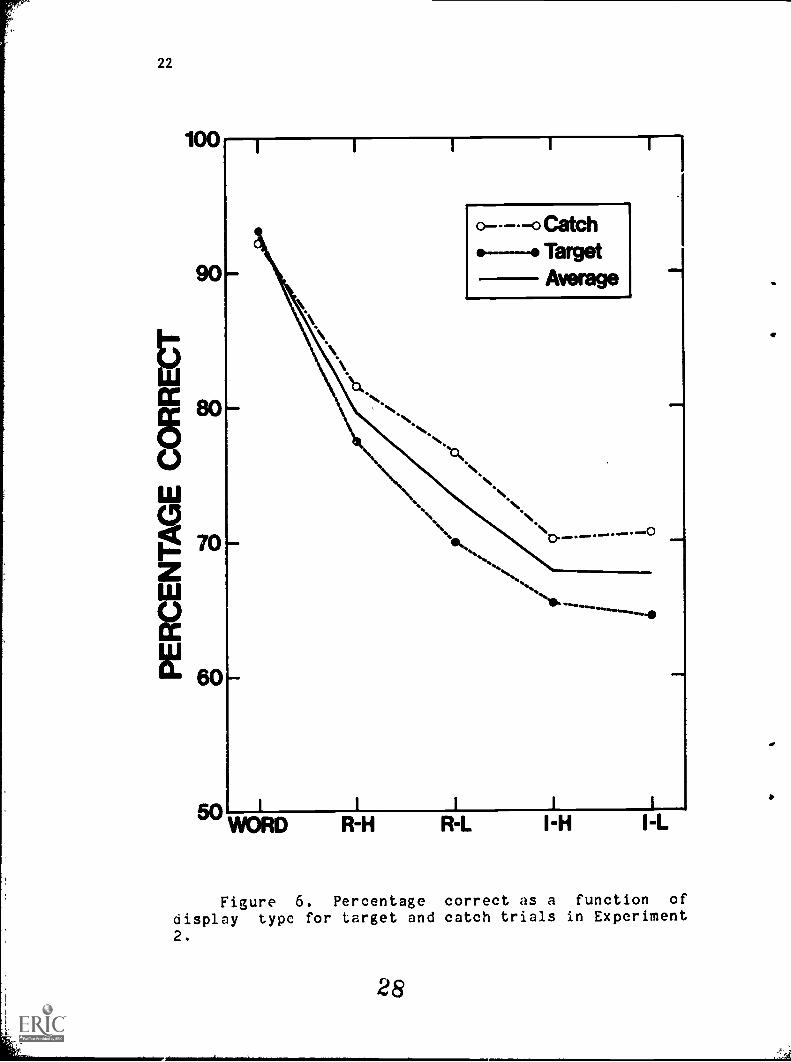
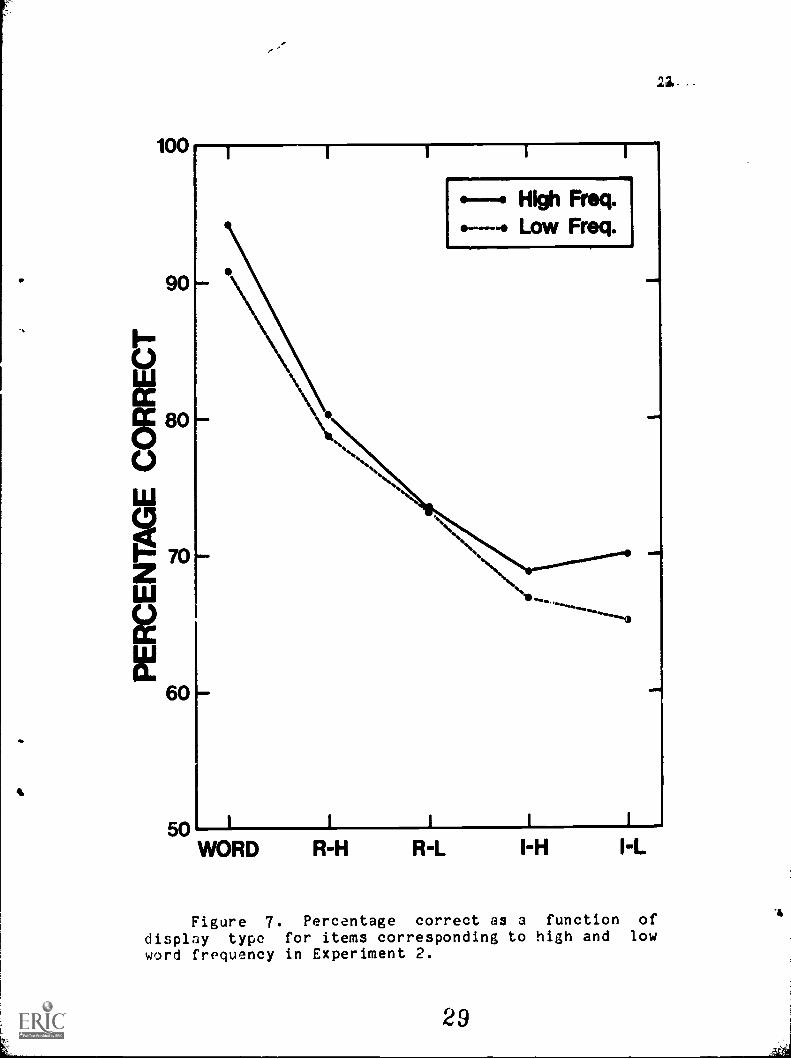
Figure 7 gives average percentage correct for the high
and low word frequency words and their anagrams as a
27
100
NOM
WORD R-H R-L I-H I-L
Figure 6. Percentage correct as a function of
display type for target and catch trials in Experiment2.
28
100
90
ccg 80
0
7 0
60
WINO
I11
---e High Freq.Low Freq.
50 I
WORD R-H R-L I-H I-L
WNW
Figure 7. Percentage correct as a function ofdisplay type for items corresponding to high and lowword frequency in Experiment 2.
24
function of letter string type. There was a 2.5% advantage
for items of the high-frequency words, F (1, 10) = 4.87, Q <
.052, but word frequency did not enter into any
interactions. The overall effect of letter-string type was
24.3% for high-frequency items and 25.8% for low-frequency
items. The interaction of word frequency and letter-string
type found in the first experiment and shown it Figure 4 was
not replicated in the second experiment, F (4, 40) = 1.15,
> .25.
Correlational analysis
The factorial design is limited in terms of providing a
quantitative assessment of the importance of frequency and
regularity measures of orthographic structure. The present
design contrasted just one frequency measure against just
one regularity measure. Therefore, post hoc correlational
analyses were carried out to provide an analysis of a range
of descriptions of orthographic structure. The independent
variables used in this analysis included a number of
measures based on frequency counts for letters, n-grams, and
words, in addition to a few quantitative measures based on
ortnographic rules. The dependent measure in all cases was
average accuracy for each six-letter test item. The
a curacy scores were obtained by averaging across subjects
and across target and catch trials. Each of the two
experiments used 40 words, 20 each of high and low word
frequency, and four corresponding anagrams for a total of
30
4
25
200 stimulus items per experiment. Each subject had been
presented with each item twice as a target trial and twice
as a catch trial. Accordingly, the accuracy score for each
item in the first experiment was based on 36 observations (4
replications x 9 subjects) while the accuracy score for the
second experiment was based on 44 observations (4
replications x 11 subjects).
Frequency Measures
The source of the frequency measures is based on a word
corpus compiled by Kucera and Francis (1967). This corpus
consisted of 500 samples of approximately 2,000 words each
selected from 15 categories. A description of the corpus,
its selection, and its processing are presented by Kucera
and Francis (1967, pp. xvii-xxv). Massaro et al. (1980)
used these words to derive the frequencies of occurrence of
single letters, bigrams, and trigrams. A magnetic tape of
the word count produced from the corpus (i.e., the "Rank
List" in Kucera & Francis) was obtained. The words were
sorted into 10 lists consisting of 1- to 10-letter words,
respectively. Words longer than 10 characters were deleted
as were items containing numbers, punctuation, or special
codings for capitalizations, foreign alphabets, and unusual
graphic features or symbols. This resulted in 10 lists of
words, one for each letter length. These word lists formed
the basis for counts of single letters, bigrams, and
trigrams.
31
26
Tables were prepared by counting the occurrence of each
n-gram at the position it occurred in words of a given
length. The counts were token counts based upon the total
number of occurrences of the words containing the n-gram. A
position-insensitive count (but still word length dependent)
was also obtained for each n-gram by summing across the
position-dependent counts. Because Kucera and Francis
maintained a faithful count of the actual graphic patterns
found in the corpus, their liE contains rare words,
typographic errors, foreign person and place names, and
other ideosyncratic items. To limit the impact of such
items on these tabulations, cut-off limits were established
for both word frequency and number of samples. The cut-offs
were a minimum of one occurrence in each of at least three
samples. Thus, unusual words and usages, regardless of
their frequency, were ignored unless they occurred in three
or more separate samples. Although this limit was
arbitrary, inspection of the word list in the low frequency
range indicated that these were reasonable cut-offs. The
single-letter tables au' bigram tables for word lengths 3
through 7 are presented in Massaro et al. (1980).
Type counts are based on the number of word types that
contain a given n-gram and these counts may also be relevant
descriptors of frequency-based measures of orthographic
structure (Solso & King, 1976). However, Massaro et al.
(1980) found that the correlations between comparable type
measures and token measures were very high. Measures based
32
27
on single letters, bigrams, and trigrams, both position
sensitive and position insensitive, correlated between .8/4
and .99. With such high correlations no meaningful
discrimination between type and token measures can be made
unless test items are selected with this contrast in mind.
For this reason we will uiscuss only measures based on the
token counts derived by Massaro et al. (1980).
The present analysis will be restricted to position-
sensitive counts. Massaro et al. (1930) foun' that
position-sensitive counts give consistently better
descriptions of performance than do position-insensitive
counts. For single-letter frequency, for example, th,2
correlation with average accuracy was only .2 for position-
insensitive counts but .62 for position-sensitive counts.
The advantage of position sensitivity was attenuated,
however, as the length of the n-gram increased.
While the effects of frequency seem to be
psychologically real, it is not necessary that the mental
representations of frequency directly reflect the frequency
of objective counts. One alternative scale that has been
successful in other research is a logarithmic (base 10)
scale. !lot only are there some data to suggest the
possibility of a logarithmic representation (Massaro et, al.
1980; Solomon & Postman, 1952; Travers & Olivier, 19n;
Taylor, Noe° but also a logzrithmic representation is
consistent with recent studies of number representation
(Shepard ' Podgorny, 1973) and with many other psychological
33
Maramam.6..., aa....anaora a.m.. rm.
28
scales. Therefore, we computed all of our frequency
measures based upon both regular linear frequencies and log
frequencies. Since counts were sometimes zero, the log of
zero was defined as zero. Therefore, the two sets of
measures being correlated were sums of position-dependent
single letters, bigrams, and trigrams derived from either
linear-frequency or log-frequency tables.
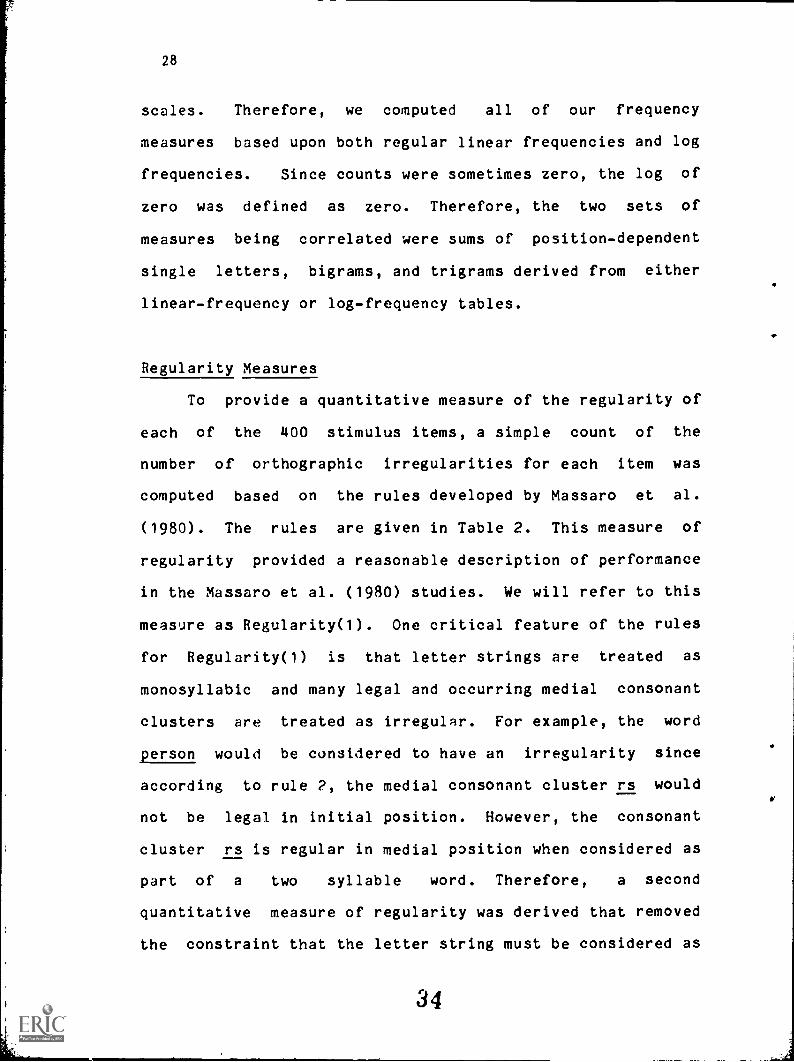
Regularity Measures
To provide a quantitative measure of the regularity of
each of the 400 stimulus items, a simple count of the
number of orthographic irregularities for each item was
computed based on the rules developed by Massaro et al.
(1980). The rules are given in Table 2. This measure of
regularity provided a reasonable description of performance
in the Massaro et al. (1980) studies. We will refer to this
measure as Regularity(1). One critical feature of the rules
for Regularity(1) is that letter strings are treated as
monosyllabic and many legal and occurring medial consonant
clusters are treated as irregular. For example, the word
person would be considered to have an irregularity since
according to rule 2, the medial consonant cluster rs would
not be legal in initial position. However, the consonant
cluster rs is regular in medial position when considered as
part of a two syllable word. Therefore, a second
quantitative measure of regularity was derived that removed
the constraint that the letter string must be considered as
34
29
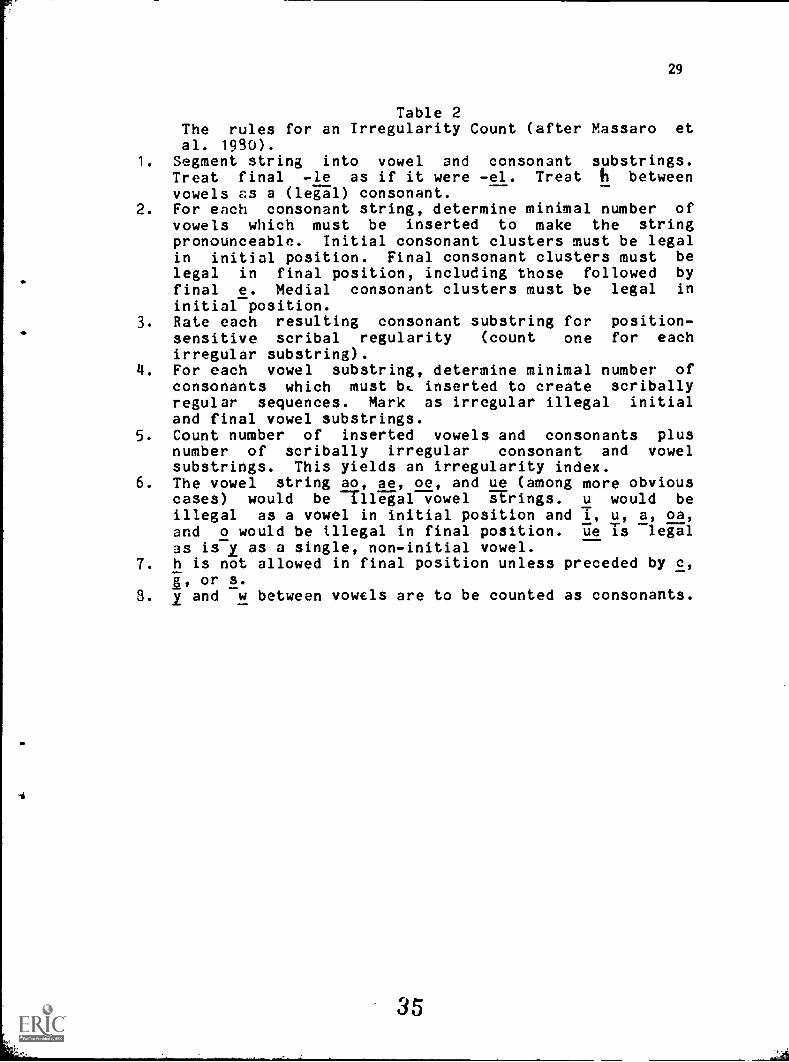
Table 2The rules for an Irregularity Count (after Massaro etal. 1990).
1. Segment string into vowel and consonant substrings.Treat final -le as if it were -el. Treat h between_vowels ES a (legal) consonant.
2. For each consonant string, determine minimal number ofvowels which must be inserted to make the stringpronounceable. Initial consonant clusters must be legalin initial position. Final consonant clusters must belegal in final position, including those followed byfinal e. Medial consonant clusters must be legal in
initial position.3. Rate each resulting consonant substring for position-
.sensitive scribal regularity (count one for eachirregular substring).
4. For each vowel substring, determine minimal number ofconsonants which must bg_ inserted to create scriballyregular sequences. Mark as irregular illegal initialand final vowel substrings.
5. Count number of inserted vowels and consonants plusnumber of scribally irregular consonant and vowelsubstrings. This yields an irregularity index.
6. The vowel string ao, ae, oe, and ue (among more obviouscases) would be illegal vowel strings. u would beillegal as a vowel in initial position and i, u, a, oa,and o would be illegal in final position. ue is legalas is i as a single, non-initial vowel.
7. h is not allowed in final position unless preceded by c,or s.1
8. i and w between vowels are to be counted as consonants.
35
30
a monosyllabic string. This measure is referred to as
Regularity(2).
The rules for Regularity(2) were identical to those for
the first measure except that the application of the rules
and the counting of the violations were carried out in order
to minimize the number of violations for any given letter
string. When possible, a syllable boundary was assumed in
order to avoid a given violation. As an example, the medial
consonant cluster md in the string limder would be an
illegal consonant cluster in the same syllable because of
the phonological rule governing the place of articulation of
nasals followed by stops in a single syllable. The nasal
and the following stop must share place of articulation;
therefore mb and nd are possible but not md or nb. A
syllable boundary between m and d in limder is possible,
however, resulting in a perfectly legal two-syllable string
with no violations. Similarly, in the string nurdgi the
medial consonant cluster rdg is legal with a syllable
boundary between d and 1. The only violation is i in final
position.
Frequency vs. Regularity
The correlations of several measures with average
accuracy are presented in Table 3. The correlation needed
for statistical significance at 2 .1 .01 with 198 degrees of
freedom is .18. Of central interest is the relative ability
of bigram frequency and regularity measures of orthographic
AP
IN
i-
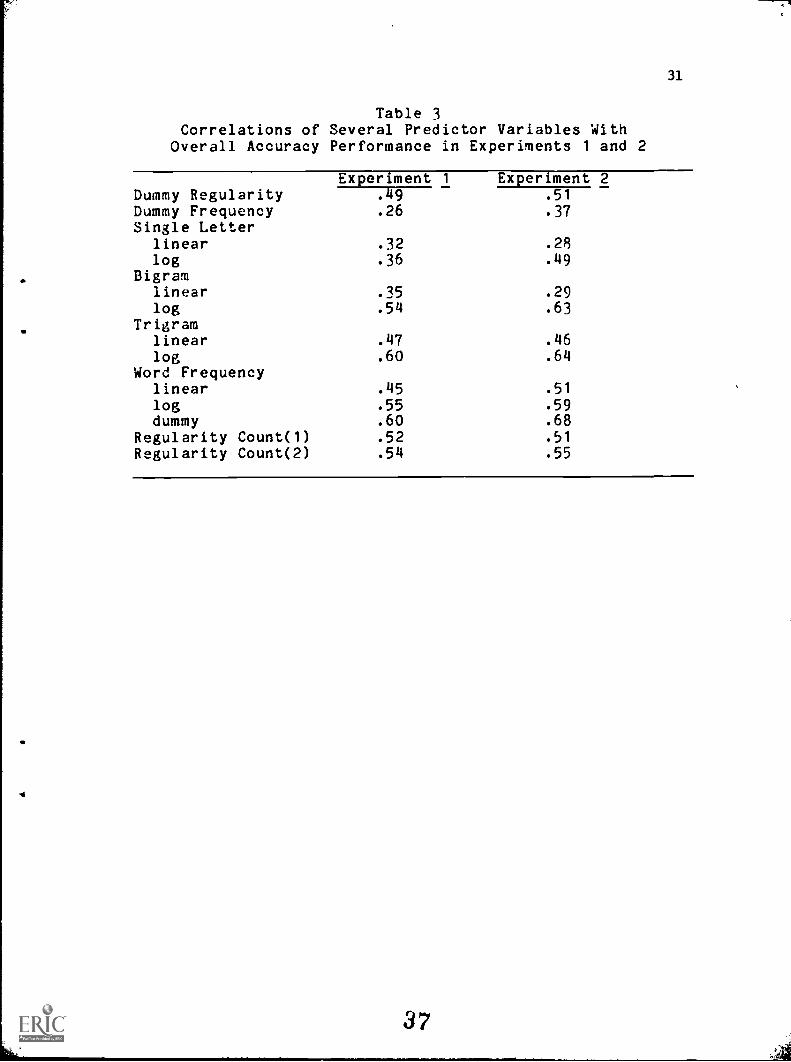
Table 3Correlations of Several Predictor Variables With
Overall Accuracy Performance in Experiments 1 and 2
Experiment 1 Experiment 2Dummy Regularity .49 .51
Dummy Frequency .26 .37Single Letter
linear .32 .28log .36 .49
Bigramlinear .35 .29log .54 .63
Trigramlinear .47 .46log .60 .64
Word Frequencylinear .45 .51
log .55 .59dummy .60 .68
Regularity Count(1) .52 .51
Regularity Count(2) .54 .55
31
4
32
structure to predict performance. Two dummy variables were
created to contrast these two measures while equating for
the range and levels of each measure. The dummy regularity
variabli. assigned a 1 to words and regular nonwords, and a 0
to irregular nonwords. The dummy frequency variable
assi'Aed a 1 to words and high bigram frequency nonwords,
and a 0 to low bigram frequency nonwords. In both
experiments the regularity variables correlated much higher
(.49, .51) with performance than did the frequency variable
(.26, .37).
It is not possible to choose between regularity and
frequency measures of orthographic structure. Although the
regularity counts do better than linear frequency counts and
log single letter counts, log bigram and log trigram counts
do better than regularity. Both measures account for a
significant portion of the variance in performance.
Regularity and frequency measures are positively correlated
with each other. As an example, log trigram frequency and
Regularity(2) correlate .47 and .46 for the items in
Experiments 1 and 2, respectively. A multiple regression
was carried out treating the summed frequency counts and the
irregularity counts as independent variables. The best
combination of predictors was log trigram frequency and
Regularity(2), which accounted for 45% of the variance in
Experiment 1 and 49% in Experiment 2.
Word Frequency
38
33
Linear word frequency correlated .45 and .51 while log
word frequency correlated .55 and .59 with performance in
the two experiments. The correlation with performance on
just the 40 word items were .46 and .51 for linear and log
frequencies in the first experiment and, .34 and .35 in the
second experiment. Log word frequency was highly correlated
with both log bigram frequency (.50, .52) and log trigram
frequency (.77, .74). A dummy word frequency variable which
assigned a 1 to words and a 0 to nonwords was more highly
correlated (.60, .68) with performance than was log word
frequency. Although it is possible that lexical status
makes an independent contribution to performance, the high
correlations between word frequency and sublexical
orthographic structure measures preclude resolution of this
issue.
Serial Positon
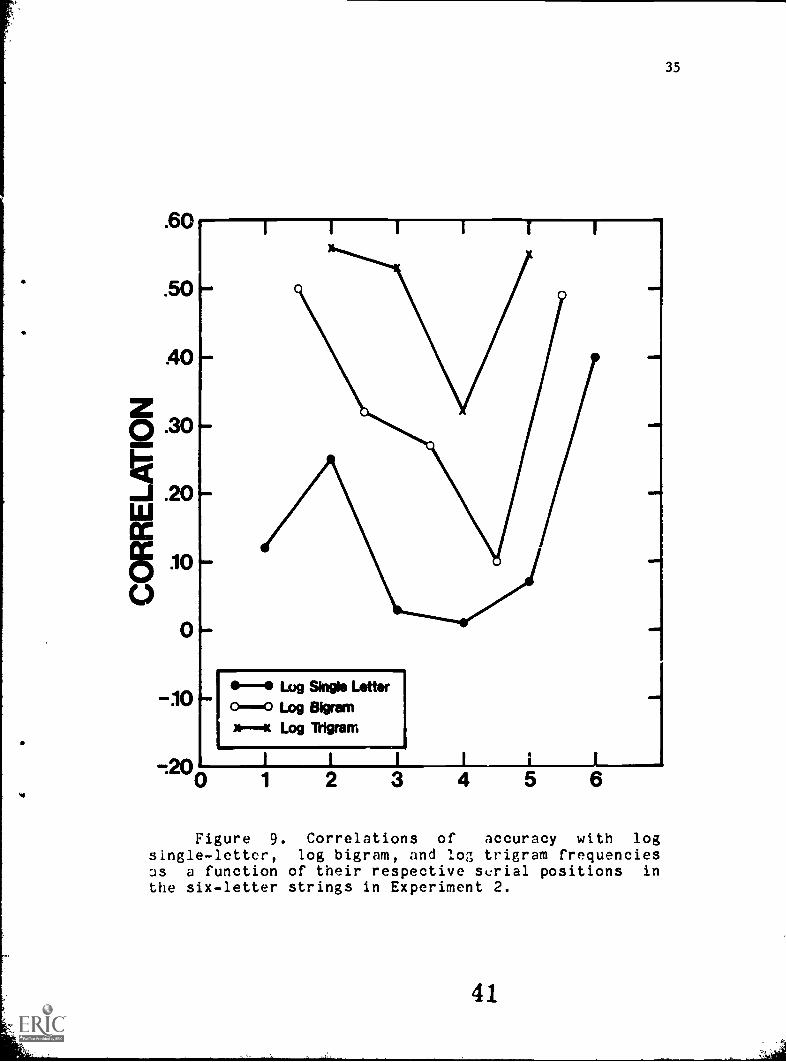
The correlations between the three log frequency
measures at each serial position and overall performance
are shown in Figures 8 and 9. In general, the frequency of
n-grams at the beginning and end of the items predicts
performance better than n-grams in the middle. To evaluate
whether this effect is due to the informational constraints
in the stimuli themselves, we derived a measure of
redundancy or predictability for each serial position. The
variance of letter occurrences at each serial position was
computed based on the table of frequencies given by Massaro
39
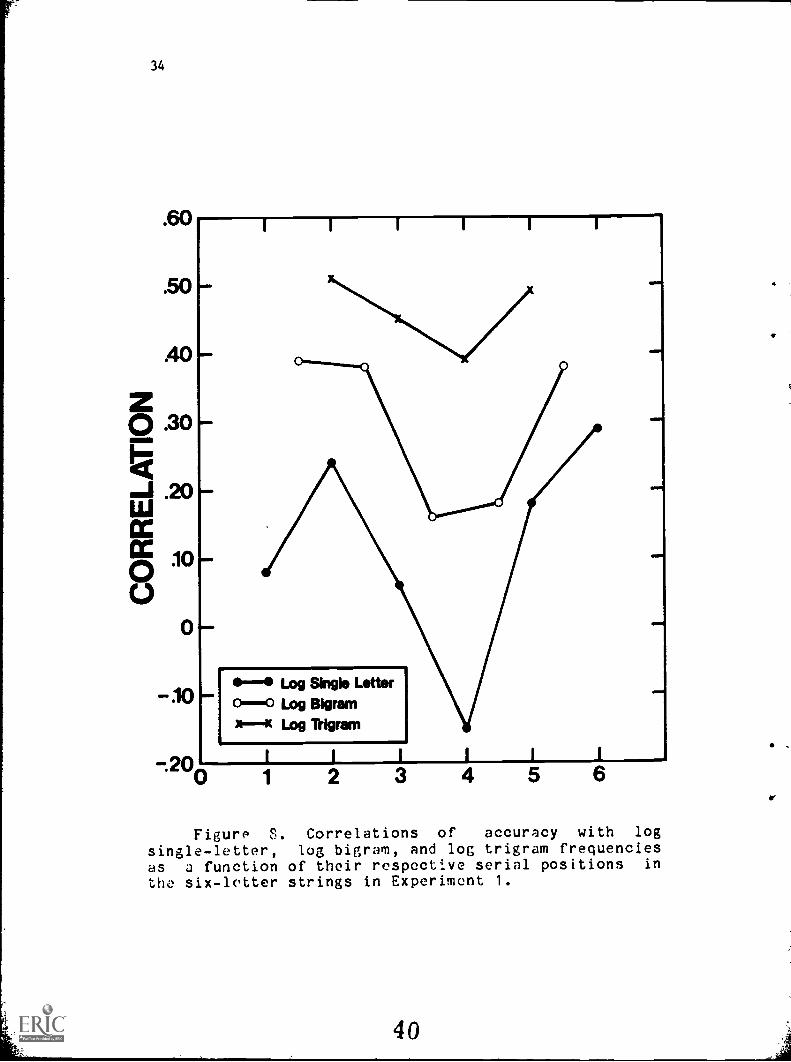
34
Figure S. Correlations of accuracy with log
single-letter, log bigram, and log trigram frequenciesas a function of their respective serial positions in
the six-letter strings in Experiment 1.
.60
.50
40
Z0 .30I-I
...II .20UJcc
,0(.)
0
-10
NMI
MI.
Me
NM
IMO
MID
I I 1 I i 1
-0 Lea Single Letter0-0 Log Bigram
X'"'ll Log 'Ingram
-.2001 2 3 4 5 6
Figure 9. Correlations of accuracy with logsingle-letter, log bigram, and log trigram frequenciesDS a function of their respective serial positions inthe six-letter strings in Experiment 2.
41
35
36
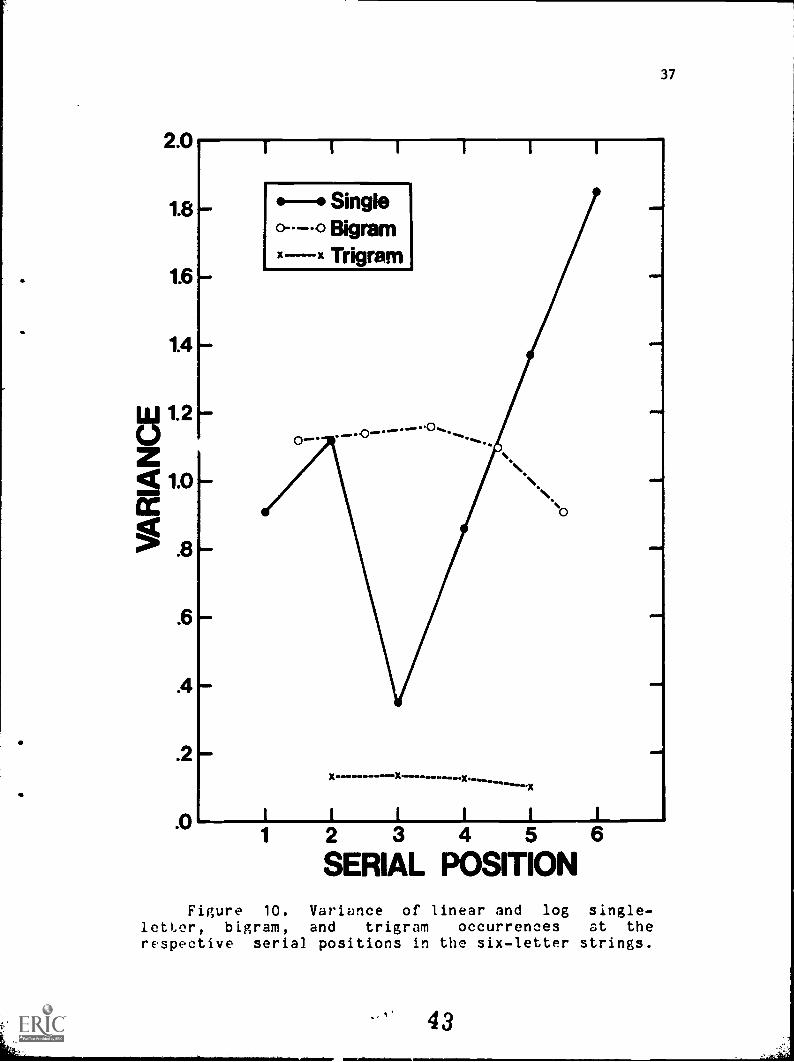
et al. (1980). High variance occurs to the extent that some
letters occur more often and, therefore, are more
predictable than others. These variance measures for the
log single-letter, log bigram and log trigram counts are
shown in Figure 10. For single letters there is less
redundancy at the middle positions relative to the end
positions. There is very little change in redundancy across
serial positions for the bigram and trigram measures. The
redundancy and performance measures are nicely correlated
for single letters, but uncorrelated for bigrams and
trigrams.
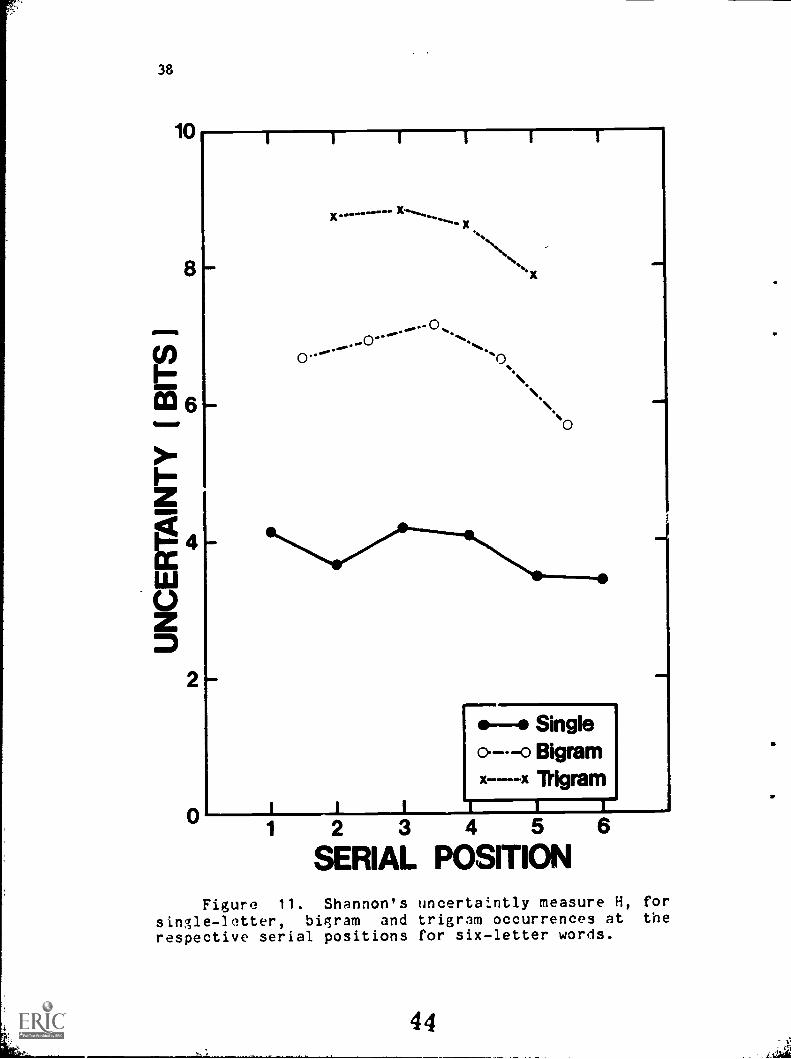
A second measure of redundancy was calculated by taking
an average uncertainty measure H, based on Shannon's (1948,
1951) equation,
H = 5P log(1/P )1
where P is the probability of occurrence of a letter or
letter cluster at a given position and, N is the total
number of letters or letter clusters that occur at that
position. These uncertainty measures are presented in
Figure 11. Uncertainty measures the :egree to which letters
or letter clusters are unpredictable; we might expect better
correlations with performance at those serial positions with
small values of uncertainty.
As can be seen Figure 11, the uncertainty measures do a
good job of predicting the performance measures for single
letters. The only discrepancy is in the ^ifth letter
position where subjects failed to exploit the redundancy at
42
2.0
1.8
1.6
1.4
37
Mr
.6
.4
.2
.0
NM
IMP
MO
1X X X ,.............x
111_1111 2 3 4 5 6
SERIAL POSITIONFigure 10. Variance of linear and log single-
letter, bigram, and trigram occurrences at therEspective serial positions in the six-letter strings.
38
10
CO 6
>ENIZ44W0ZD
2
0
NM
NM
.11111
0-- Single0.----0 Bigramx---( anram
1 2 3 4 5 6
SERIAL POSITIONFigure 11. Shannon's uncertaintly measure H, for
single-letter, bigram and trigram occurrences at therespective serial positions for six-letter words.
44
39
this position. There is also a reasonable correspondence
for the bigram counts. However, the initial bigram predicts
performance better than the final bigram even though the
latter has less uncertainty. There is no correspondence
between the uncertainty measures and the performance
correlations for the trigram counts.
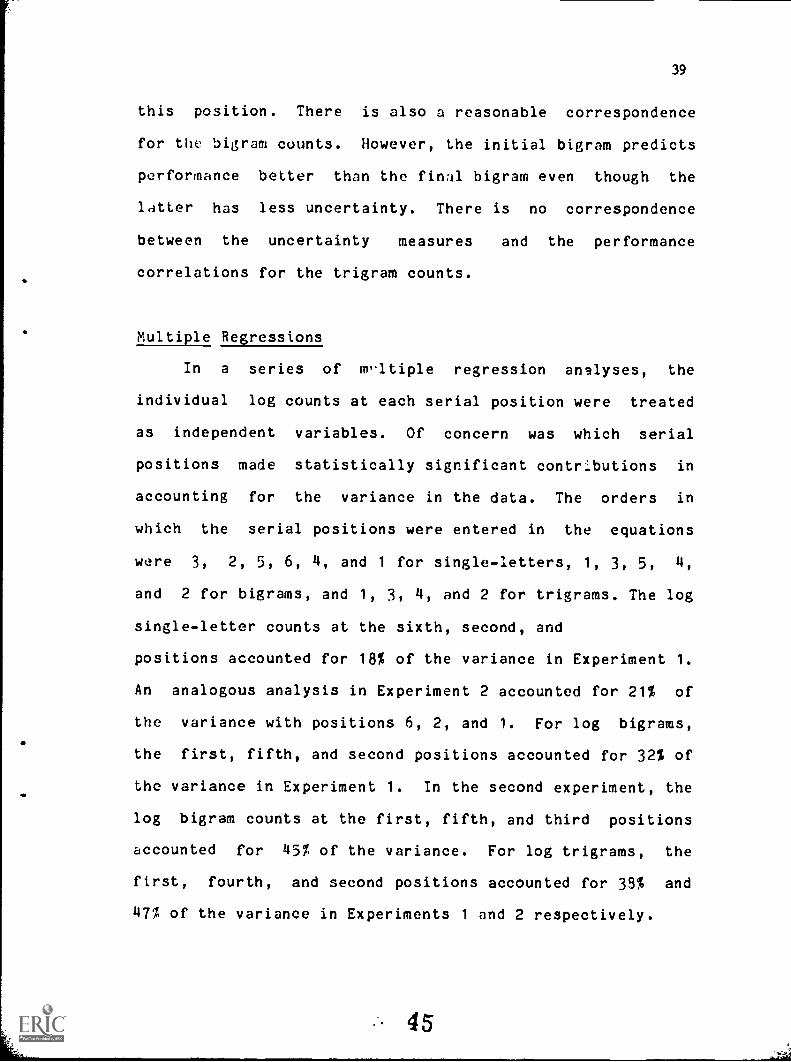
Multiple Regressions
In a series of miltiple regression analyses, the
individual log counts at each serial position were treated
as independent variables. Of concern was which serial
positions made statistically significant contributions in
accounting for the variance in the data. The orders in
which the serial positions were entered in the equations
were 3, 2, 5, 6, 4, and 1 for single-letters, 1, 3, 5, 4,
and 2 for bigrams, and 1, 3, 4, and 2 for trigrams. The log
single-letter counts at the sixth, second, and
positions accounted for 18% of the variance in Experiment 1.
An analogous analysis in Experiment 2 accounted for 21% of
the variance with positions 6, 2, and 1. For log bigrams,
the first, fifth, and second positions accounted for 32% of
the variance in Experiment 1. In the second experiment, the
log bigram counts at the first, fifth, and third positions
accounted for 457 of the variance. For log trigrams, the
first, fourth, and second positions accounted for 33% and
47% of the variance in Experiments 1 and 2 respectively.
45
40
Regressions were also conducted for summed log single-
letter, bigram, and trigram frequencies and regularity.
Summed log bigram frequency dnd regularity were always
entered into the equation first. For the first experiment,
bigram frequency and regularity accounted for 35% of the
variance. With these two variables in the regression
equation, the partial correlations for the log single-letter
and trigram frequencies were -.05 and .39, respectively.
For the second experiment, bigram frequency and regularity
accounted for 42; of the v.zriances and the partial
correlations for log single-letter and trigram frequencies
were .08 and .36, respectively.
Experiment 3
The creation of the stimulus set for Experiment 3 was
identical to that of the previous experiments except that
log bigram rather than linear bigram counts were used and
the strings were controlled more exactly for regularity.
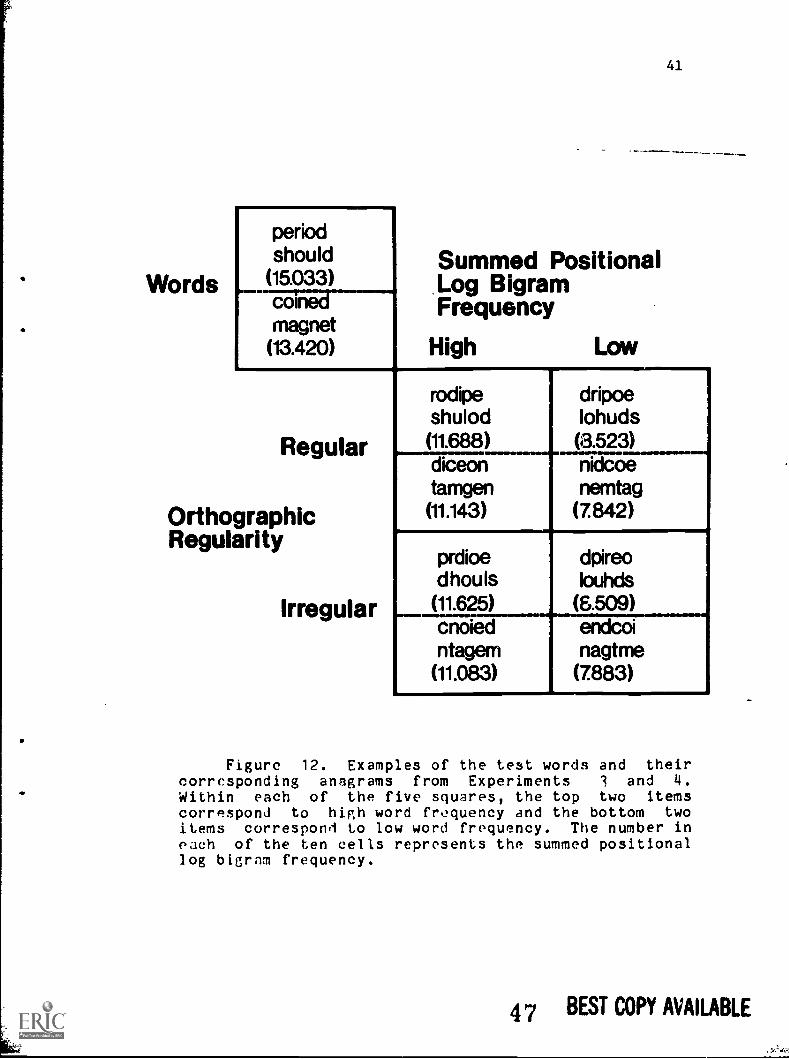
Figure 12 gives examples of the five classes of items and
the average log bigram frequency for each class. The
complete list of letter strings is presented in Appendix 3.
In the studies of Massaro et al. (1990) and Experiments
1 and 2 log-frequency measures gave consistently better
descriptions of performance than did linear-frequency
measures. Furthermore, Massaro et al. (1980) found that the
log counts were superior to a range of power-function
transformations of the linear counts. This result provides
Words
periodshould
(15.033)--661--magnet
(13.420)
Summed PoLog BigramFrequency
High
sitional
Low
41
Regular
OrthographicRegularity
Irregular
rodipeshulod
(11.688)diceontamgen
(11.143)
dripoelohuds
(3.523)nidcoenemtag
(7.842)
prdioedhouls
(11.625)cnoiedntagem
(11.083)
dpireolouhds
(6.509)endcoinagtme
(7883)
Figure 12. Examples of the test words and theircorresponding anagrams from Experiments 3 and 4.
Within each of the five squares, the top two itemscorrespond to high word frequency and the bottom twoitems correspond to low word frequency. The number ineach of the ten cells represents the summed positionallog biv.am frequency.
4 7 BEST COPY AVAILABLE
42
additional evidence that if frequency of occurrence is
important, log frequency appears to be the best descriptor
of this variable.
A count of the number of irregularities in each letter
string was determined using the rules for Regularity(3)
presented in Table 4. The rules for Regularity(3) were the
same as for Regularity(2) except that vowels as initial
letters violated one of the rules and therefore were counted
as irregularities. Given this formula, it was now possible
to equate the number of irregularities for the anagrams that
differed only in log bigram frequency. In our previous
studies, the number of irregularities tended to correlate
negatively with frequency and some of the effect of
frequency could have been due to differences in regularity.
This possibility was eliminated in the present study by
equating the high- and low-frequency anagrams of a given
test word for the number of irregularities. Consider the
test word period shown in Figure 12. The regular high and
regular low anagrams (rodipe and dripoe) do not have any
irregularities. The irregular high and irregular low
anagrams (prdioe and dpireo) have 2 irregularities each.
This design might provide a more definitive contrast between
frequency and regularity.
Method
Subjects. Nine University of Wisconsin summer school
student volunteers were used as subjects and paid $9.00 for
48
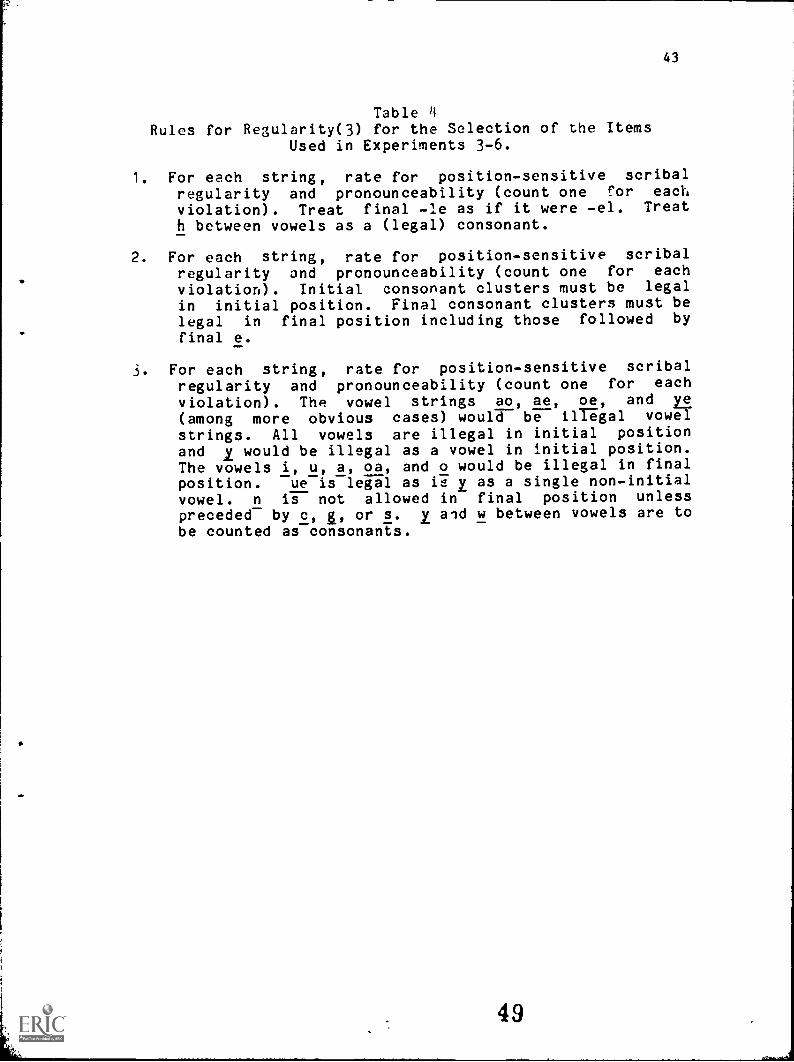
43
Table 4Rules for Regularity(3) for the Selection of the Items
Used in Experiments 3-6.
1. For each string, rate for position-sensitive scribalregularity and pronounceability (count one for each
violation). Treat final -le as if it were -el. Treath between vowels as a (legal) consonant.
2. For each string, rate for position-sensitive scribalregularity and pronounceability (count one for eachviolation). Initial consonant clusters must be legal
in initial position. Final consonant clusters must belegal in final position including those followed by
final e.
3. For each string, rate for position-sensitive scribalregularity and pronounceability (count one for each
violation). The vowel strings ao, ae, oe, and ye(among more obvious cases) would be illegal vowel
strings. All vowels are illegal in initial positionand i would be illegal as a vowel in initial position.The vowels i, u, a, oa, and o would be illegal in finalposition. ue is legal as is z as a single non-initialvowel. n is not allowed in final position unlesspreceded by c, I, or s. z aid w between vowels are tobe counted as consonants.
44
their participation. All were native English speakers, had
normal or corrected vision, and had not participated in any
of the other experiments.
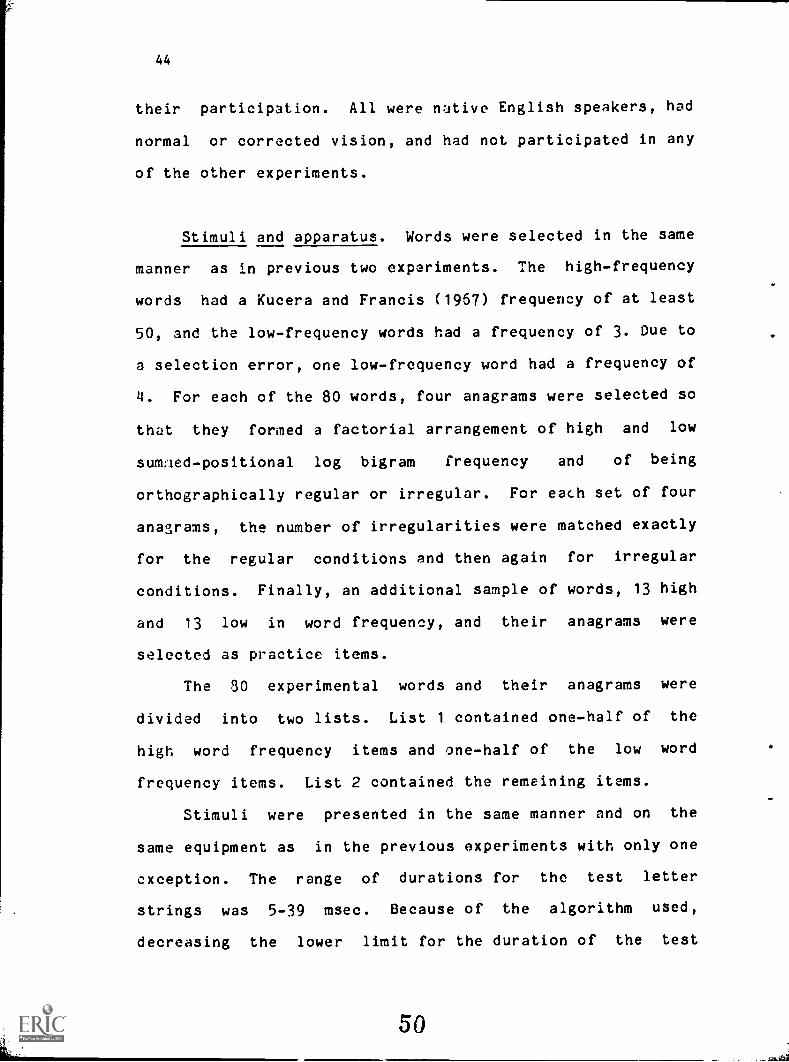
Stimuli and apparatus. Words were selected in the same
manner as in previous two experiments. The high-frequency
words had a Kucera and Francis (1957) frequency of at least
50, and the low-frequency words had a frequency of 3. Due to
a selection error, one low-frequency word had a frequency of
4. For each of the 80 words, four anagrams were selected so
that they formed a factorial arrangement of high and low
sum:'ied- positional log bigram frequency and of being
orthographically regular or irregular. For each set of four
anagrams, the number of irregularities were matched exactly
for the regular conditions and then again for irregular
conditions. Finally, an additional sample of words, 13 high
and 13 low in word frequency, and their anagrams were
selected as practice items.
The 80 experimental words and their anagrams were
divided into two lists. List 1 contained one-half of the
high word frequency items and one-half of the low word
frequency items. List 2 contained the remaining items.
Stimuli were presented in the same manner and on the
same equipment as in the previous experiments with only one
exception. The range of durations for the test letter
strings was 5-39 msec. Because of the algorithm used,
decreasing the lower limit for the duration of the test
50
45
string increased the maximum duration of the mask to 35
msec.
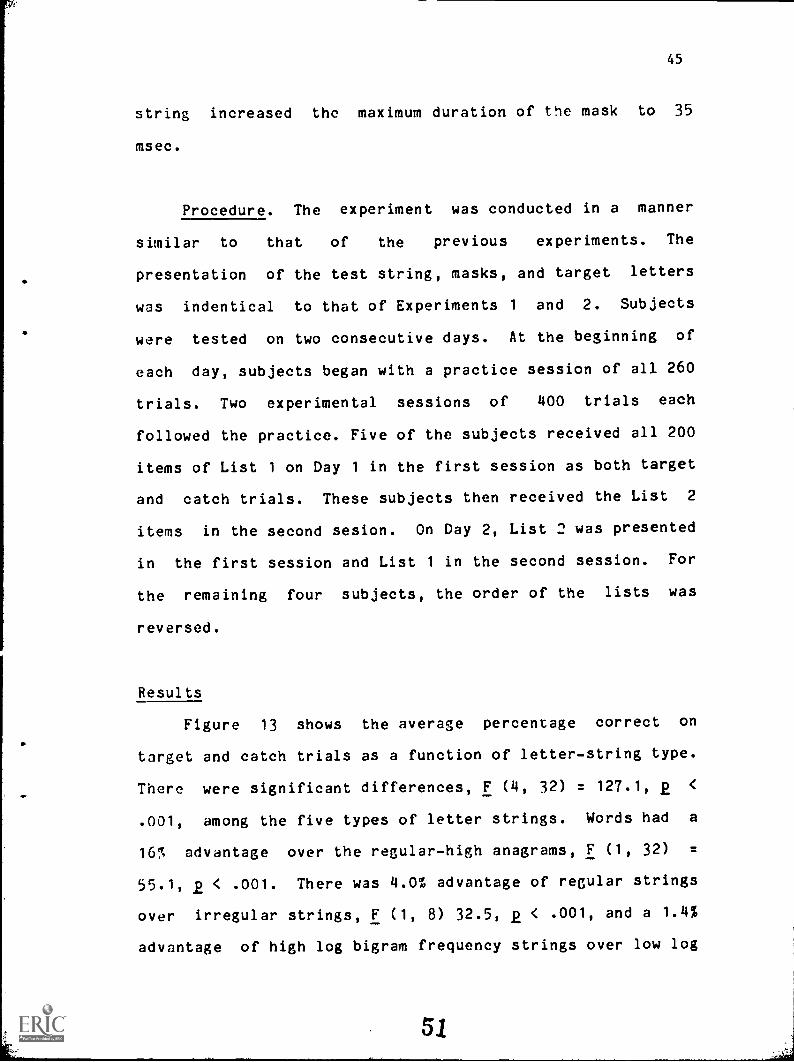
Procedure. The experiment was conducted in a manner
similar to that of the previous experiments. The
. presentation of the test string, masks, and target letters
was indentical to that of Experiments 1 and 2. Subjects
were tested on two consecutive days. At the beginning of
each day, subjects began with a practice session of all 260
trials. Two experimental sessions of 400 trials each
followed the practice. Five of the subjects received all 200
items of List 1 on Day 1 in the first session as both target
and catch trials. These subjects then received the List 2
items in the second sesion. On Day 2, List 2 was presented
in the first session and List 1 in the second session. For
the remaining four subjects, the order of the lists was
reversed.
Results
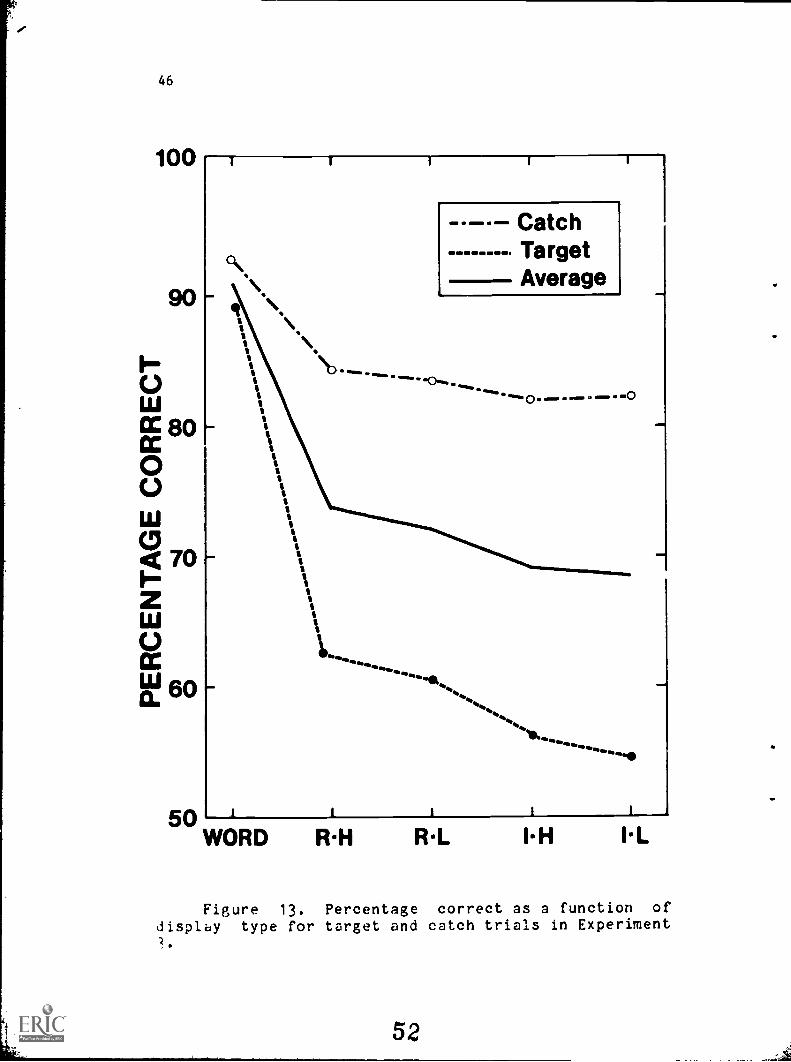
Figure 13 shows the average percentage correct on
target and catch trials as a function of letter-string type.
There were significant differences, F (4, 32) = 127.1, 2 <
.001, among the five types of letter strings. Words had a
167, advantage over the regular-high anagrams, F (1, 32) =
55.1, 2 < .001. There was 4.0% advantage of regular strings
over irregular strings, F (1, 8) 32.5, 2 < .001, and a 1.4%
advantage of high log bigram frequency strings over low log
46
100
0is Woo WOO WOO 113
'at.50*ORD
figure 13.Percentage
correct 35 3 fUnCtiOT1 of
displ.cil type for target and catch trials in Experiment
5 2
47
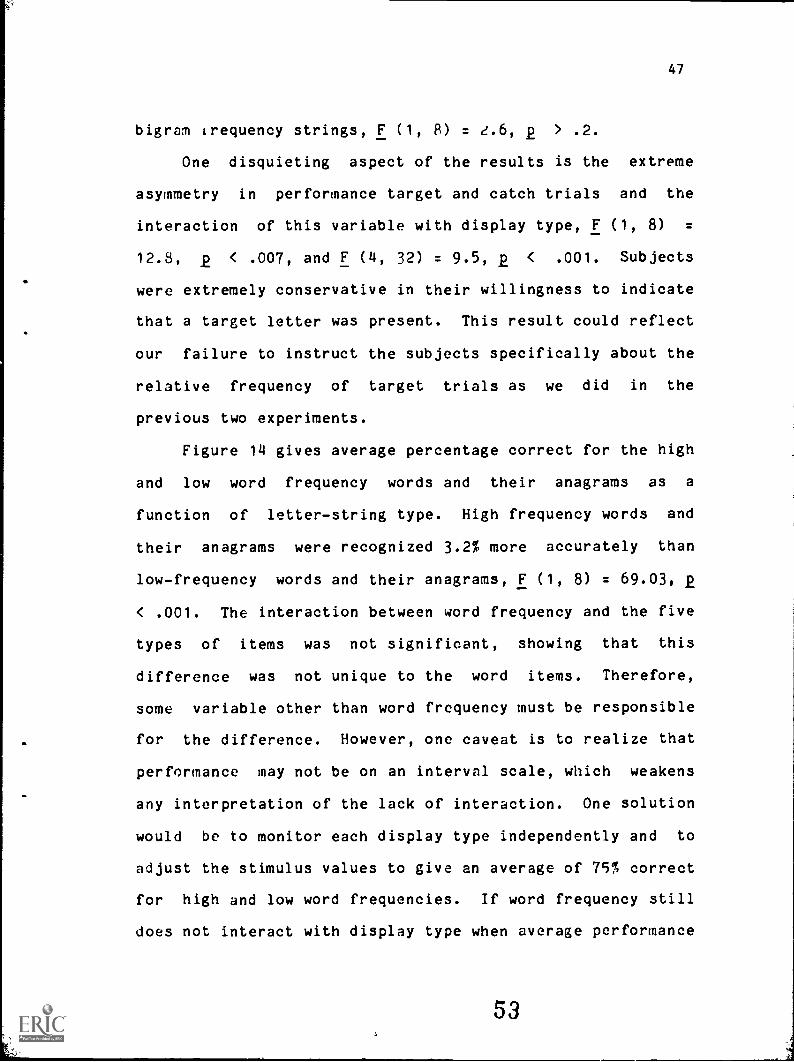
bigram frequency strings, F (1, 8) = 2.6, E > .2.
One disquieting aspect of the results is the extreme
asymmetry in performance target and catch trials and the
interaction of this variable with display type, F (1, 8) =
12.8, 2 < .007, and F (4, 32) = 9.5, 2 < .001. Subjects
were extremely conservative in their willingness to indicate
that a target letter was present. This result could reflect
our failure to instruct the subjects specifically about the
relative frequency of target trials as we did in the
previous two experiments.
Figure 14 gives average percentage correct for the high
and low word frequency words and their anagrams as a
function of letter-string type. High frequency words and
their anagrams were recognized 3.2% more accurately than
low-frequency words and their anagrams, F (1, 8) = 69.03, 2
< .001. The interaction between word frequency and the five
types of items was not significant, showing that this
difference was not unique to the word items. Therefore,
some variable other than word frequency must be responsible
. for the difference. However, one caveat is to realize that
performance may not be on an interval scale, which weakens
any interpretation of the lack of interaction. One solution
would be to monitor each display type independently and to
adjust the stimulus values to give an average of 75% correct
for high and low word frequencies. If word frequency still
does not interact with display type when average performance
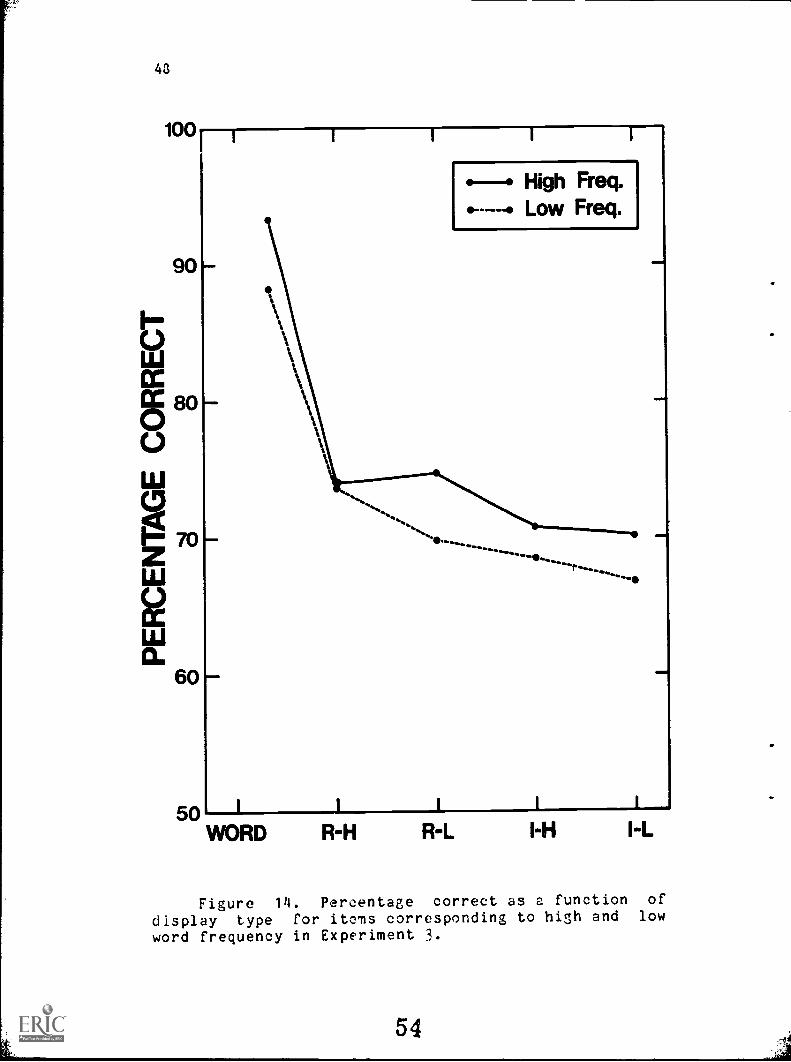
49
is about 75% correct at each display type, then the
conclusion reached here would be r:inforced.
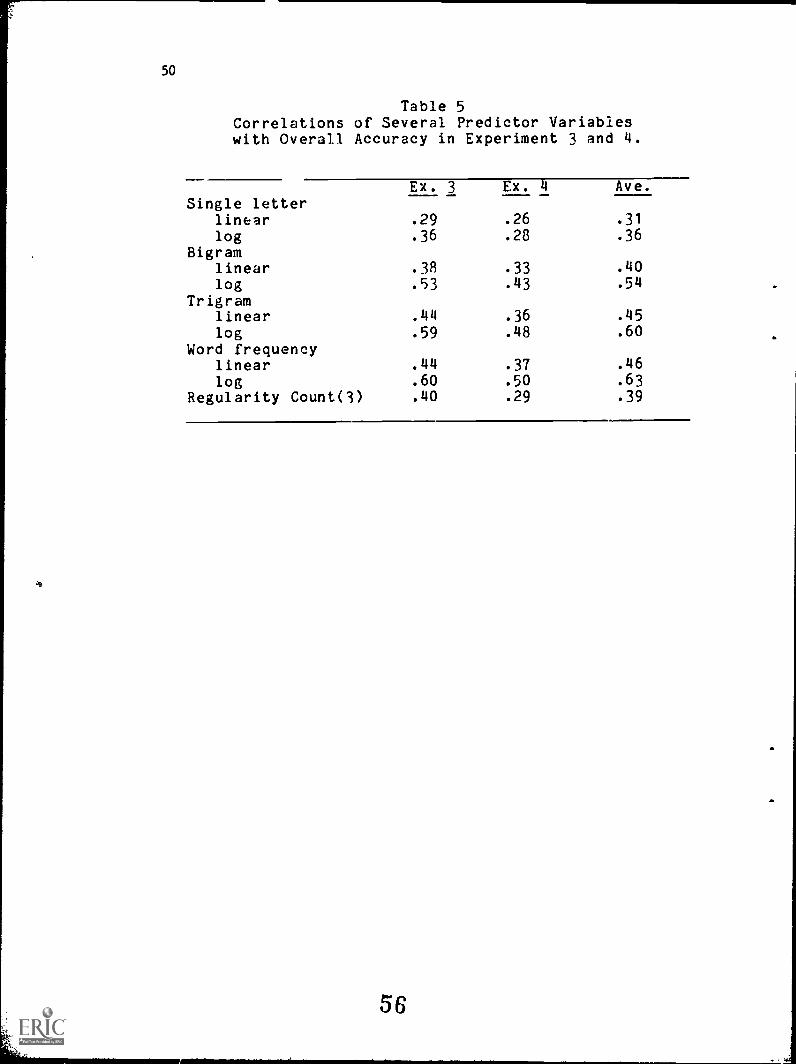
Correlational analysis
The correlations of several variables with overall
performance presented in Table 5. For all frequency
measures, the log measures correlated more highly with
performance than did the linear measures. Log trigram
frequency predicted performance better than the other
sublexical measures. Log word frequency was correlated with
accuracy (.60), but also was correlated with log bigram
frtquency (.61) and log trigram frequency (.80). Among just
the high- frequency words the correlation with performance
was -.05 and -.13, respectively, for linear and log dord
frequencies. (Correlations among the low-frequency words
would not be meaningful since all the items had the same
Kucera and Francis frequency of occurrence). The lack of a
significant correlation between performance and word
frequency within the class of words .eplicates previous
results (Manelis, 1974) and makes it unlikely that word
frequency can account for the effects of orthcgraphic
structure. Lexical status alone might be an important
variable, howeve,.. The dummy variable of word or nonword
gave a highly significant correlation of .60 with
performance.
Multiple Regressions
55
50
Table 5Correlations of Several Predictor Variableswith Overall Accuracy in Experiment 3 and 4.
Single letterEx. 3 Ex. 4 Ave.
linear .29 .26 .31
log .36 .28 .36
Bigramlinear .38 .33 .40
log .53 .43 .54
Trigramlinear .44 .36 .45
log .59 .48 .60
Word frequencylinear .44 .37 .46
log .60 .50 .63
Regularity Count(3) .40 .29 .39
56
51
Multiple regressions were carried out as in Experiments
1 and 2. The log single-letter counts at the sixth, second,
and first letter positions accounted for 12% of variance in
Experiment 3. For the log bigi-;:lm counts, the first, fifth,
and second positions accounted for 28% of the variance.
Finally, for the log trigram counts, 36% of the variance was
accounted for by the first, fourth, and second serial
positions.
For the regressions with summed log bigram frequency
and Regularity(3) entered into the equation, 35% of the
variance was accounted for. The partial correlations for
log single-letter and log trigram frequencies were -.07 and
.28, respectively.
Experiment 4
Method
Eight new University of Wisconsin undtrgraduates from
Introductory Psychology who met the same requirements as in
the previous experiments were used as subjects. Experiment
4 was an exact, replication of Experiment 3 with one
exception. The instructions were modified to inform
subjects that a target letter would appear in the test
string on 50% of the trials. It was expected that this
manipulation would attenuate the asymmetry in the number of
positive and negative responses.
Results
52
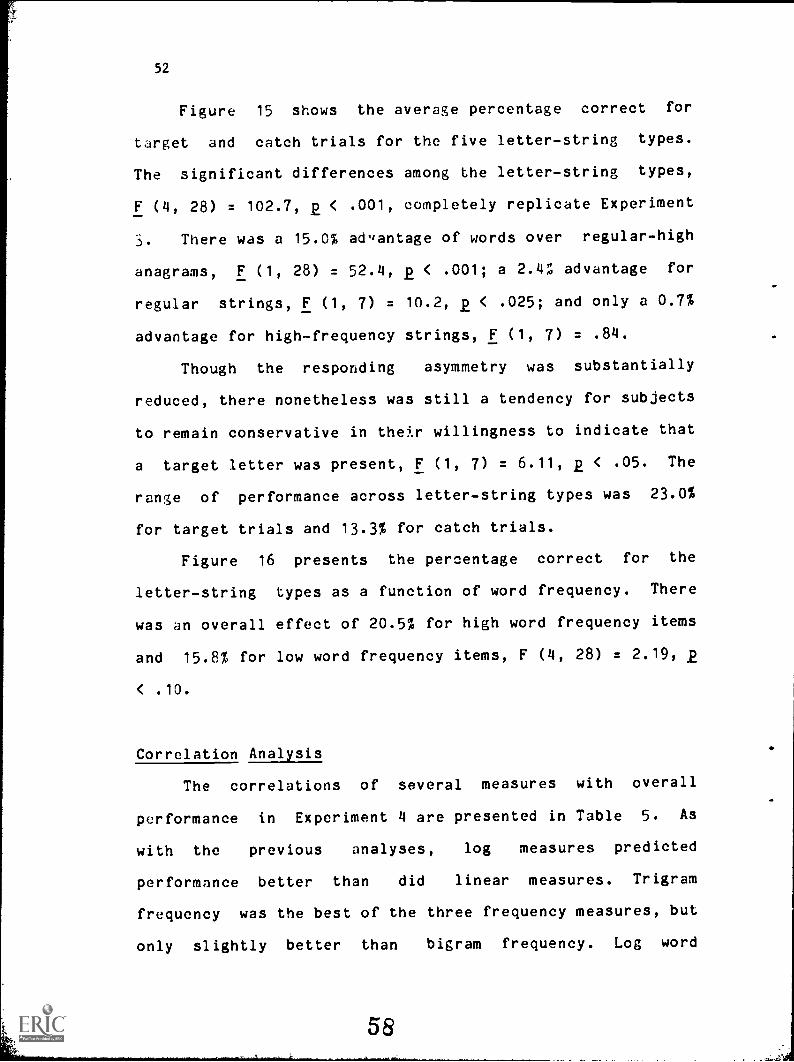
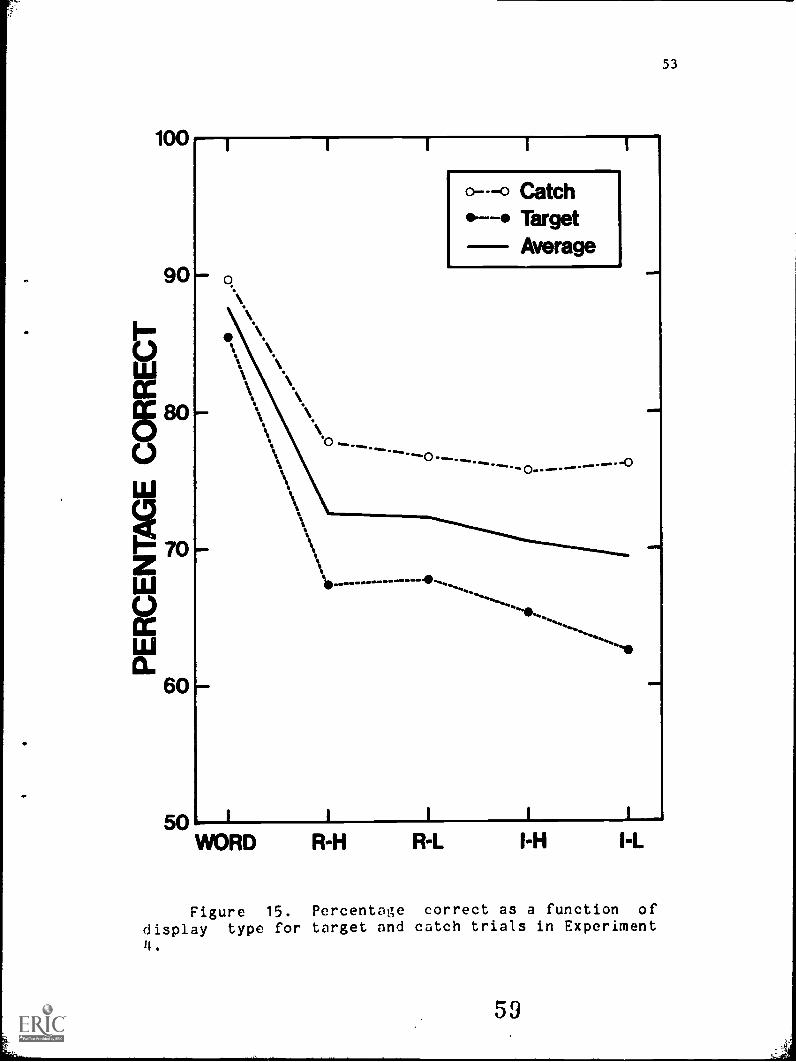
Figure 15 shows the average percentage correct for
target and catch trials for the five letter-string types.
The significant differences among the letter-string types,
F (4, 28) = 102.7, 2 < .001, completely replicate Experiment
3. There was a 15.0% advantage of words over regular-high
anagrams, F (1, 28) = 52.4, 2 < .001; a 2.4; advantage for
regular strings, F (1, 7) = 10.2, 2 < .025; and only a 0.7%
advantage for high-frequency strings, F (1, 7) = .84.
Though the responding asymmetry was substantially
reduced, there nonetheless was still a tendency for subjects
to remain conservative in their willingness to indicate that
a target letter was present, F (1, 7) = 6.11, P < .05. The
range of performance across letter-string types was 23.0%
for target trials and 13.3% for catch trials.
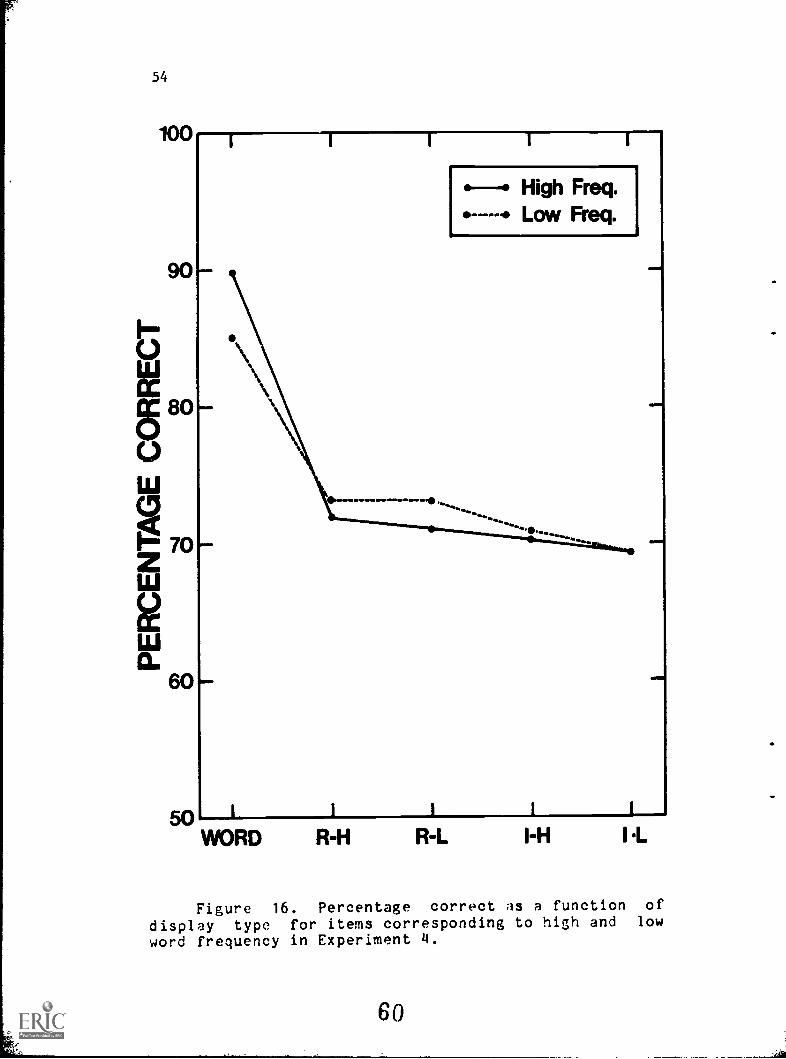
Figure 16 presents the percentage correct for the
letter-string types as a function of word frequency. There
was an overall effect of 20.5% for high word frequency items
and 15.8% for low word frequency items, F (4, 28) = 2.19,
< .10.
Correlation Analysis
The correlations of several measures with overall
performance in Experiment 4 are presented in Table 5. As
with the previous analyses, log measures predicted
performance better than did linear measures. Trigram
frequency was the best of the three frequency measures, but
only slightly better than bigram frequency. Log word
58
53
R-H
Figure 15. Percentage correct as a function of
display type for target and catch trials in ExperimentII.
54
100
90
6 80
70
60
MEP
MEM
NNW
50 I
WORD
1
-- High Freq.Low Freq.
1
R-H R-L I-H I t
Figure 16. Percentage correct as a function of
display type for items corresponding to high and low
word frequency in Experiment 4.
60
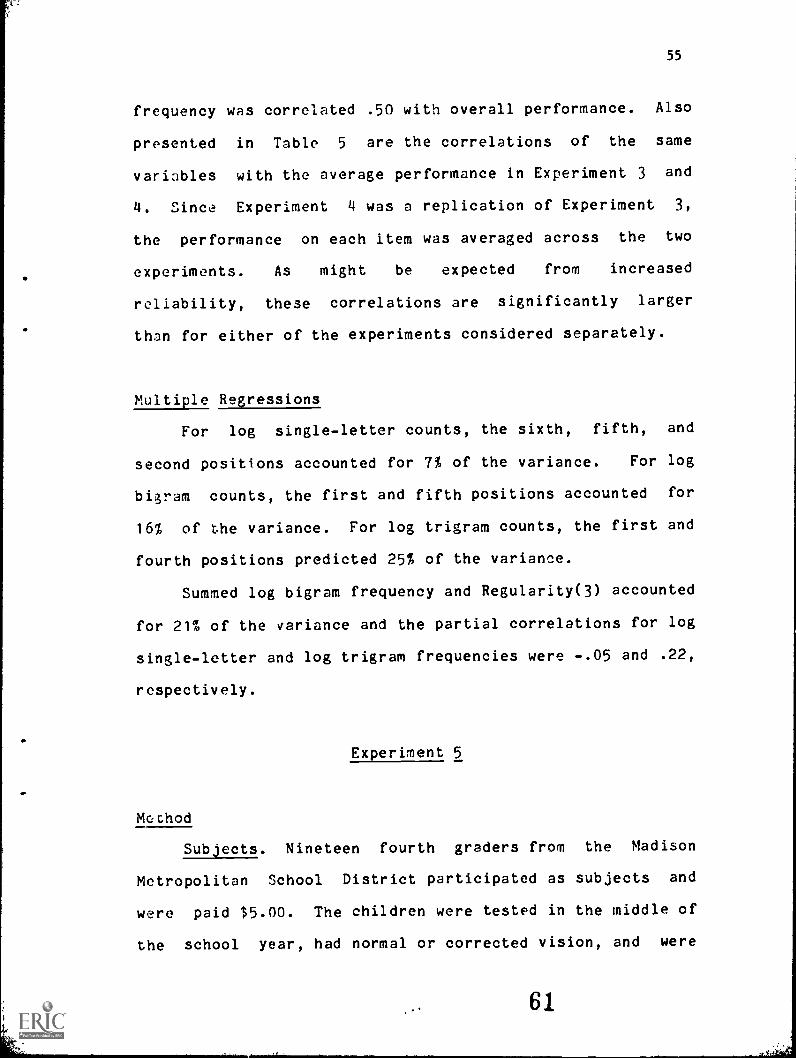
55
frequency was correlated .50 with overall performance. Also
presented in Table 5 are the correlations of the same
variables with the average performance in Experiment 3 and
4. Since Experiment 4 was a replication of Experiment 3,
the performance on each item was averaged across the two
experiments. As might be expected from increased
reliability, these correlations are significantly larger
than for either of the experiments considered separately.
Multiple Regressions
For log single-letter counts, the sixth, fifth, and
second positions accounted for 7% of the variance. For log
bigram counts, the first and fifth positions accounted for
16% of the variance. For log trigram counts, the first and
fourth positions predicted 25% of the variance.
Summed log bigram frequency and Regularity(3) accounted
for 21% of the variance and the partial correlations for log
single-letter and log trigram frequencies were -.05 and .22,
respectively.
Experiment 5
Method
Subjects. Nineteen fourth graders from the Madison
Metropolitan School District participated as subjects and
were paid $5.00. The children were tested in the middle of
the school year, had normal or corrected vision, and were
61
56
administered the STEP (1979) reading test at the end of
third grade. Of the 19, all but five had scored at or above
their grade level on the STEP reading test. The STEP scores
ranged from 25 to 50 with an average score of 43.
Stimuli and apparatus. The 200 items used were those
of List 1 from Experiment 3. Accordingly, one-half of the
items were of high word frequency and one-half were of low
word frequency. The anagrams represented a factorial
arrangement of high or low frequency and regular or
irregular. The same practice list as in Experiment 3 also
was used.
The stimuli were presented in the same manner and on
the same equipment as in Experiment 3 with one exception.
The range of durations of the test string presentation was
increased to accommodate the less developed processing
capabilities of fourth-grade subjects.
Procedure. Subjects were tested in groups of 1-4. Upon
arrival for the experiment, the fourth graders spent about
10 minutes in various activities to allow them to adjust to
our laboratory. They were then instructed as a group about
what the experiment involved. This instruction proceeded in
two steps. First, the children listened and watched the
experimenter simulate the target search task using* index
cards. The experimenter showed cards printed with a test
string and a target letter and the children responded "Yes"
or "No" aloud. After some coaching and about six of these
57
trials, the children performed the task without error. The
second step involved explaining the task using the computer
equipment. This also was performed as a group and each
child attempted about 15 computer-generated trials while the
remaining children watched. All adapted to the equipment
readily and were able to perform the task. The children
were then taken to their individual subject stations in
separate rooms and tested on the practice list.
As the children were responding, the computer displayed
to the experimenter in an isolated room each child's average
accuracy after each trial. This allowed the experimenter to
monitor each child's progress, and, if necessary, to adjust
the range of durations for the test letter string. The
range was adjusted if any subject was not able to achieve
75% accuracy even when the test string appeared for the
maximum duration allowed by the range of durations. The
nineteen subjects participated in six different groups. The
six groups differed in terms of the range of durations that
was used and whether a mask appeared. As in Experiments 3
and 4, the minimum string duration for all groups was 5
msec. For three groups, the maximum string duration ranged
from 59 to 179 msec. For these groups a mask was used. The
minimum mask duration was always 1 msec. The maximum amount
of time that the mask remained on the CRT was increased by
i
exactly the same amount that the test-string maximuffiw
duration was increased. Accordingly, the maximum mask
duration ranged from 55 to 175 msec for the three groups.
63
58
The stimulus onset asynchrony (SOP) between the test string
and the mask always was equal to the maximum strii.g duration
plus 31 msec. As a result, the SOAs ranged from 90 to 210
msec. For all groups the interval between the onset of the
test string and the onset of the target letter was increased
by exactly the same amount as the increase in the maximum
duration of the test letter string (see Figure 1). For
example, when the string duration was increased 20 msec, the
time between the onset of the string and the onset of the
target was lengthened 20 msec. For the ,remaining three
groups of subjects, the maximum string durations ranged from
249 to 499 msec and the mask was eliminated. The target
letter followed the test string after an interval equal to
the maximum duration of the test string.
Following the 100 practice trials, the subjects were
presented with each of the 200 items twice in each of two
sessions. Thus, each subject was presented with each item
twice on target trials and twik.! on catch trials. The
children were given a fiveminute rest period after the
practice trials and after every 200 experimential trials.
The entire experiment lasted about 90 minutes.
Results
Despite the widely varying test durations, the six
groups of subjects exhibited a similar pattern of results.
Therefore, no distinction among the groups was included in
the data analysis. One subject was eliminated because his
64
59
overall accuracy was at chance.
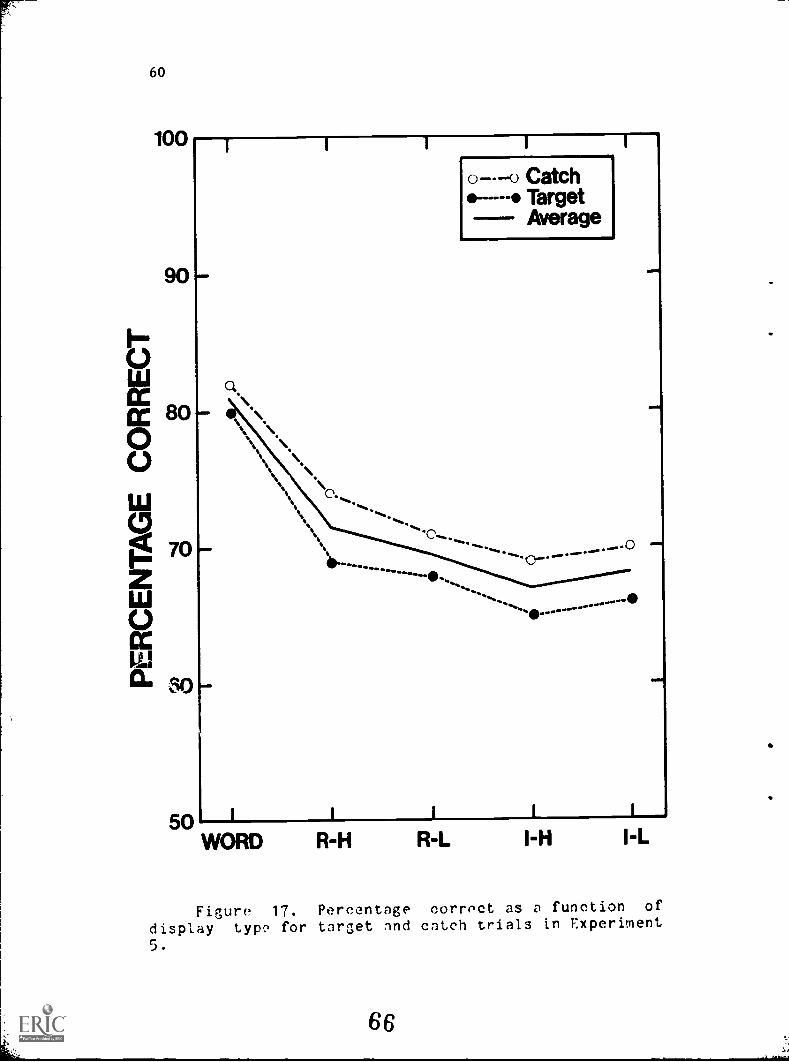
Figure 17 presents the results for the fourth-grade
subjects as a function of display type for target and catch
trials. Accuracy was higher for better structured letter
strings, F ( 4, 18) = 40.2, p < .001. Words were recognize%
9.9'.4 better than the regular-high anagrams, F (1, 17) =
15.5, 2 < .005. There was a 3.0% advantage of regular over
irregular anagrams, F (1, 17) - 9.2, Q < .01. Log bigram
frequency had only a .2% effect, F < 1.
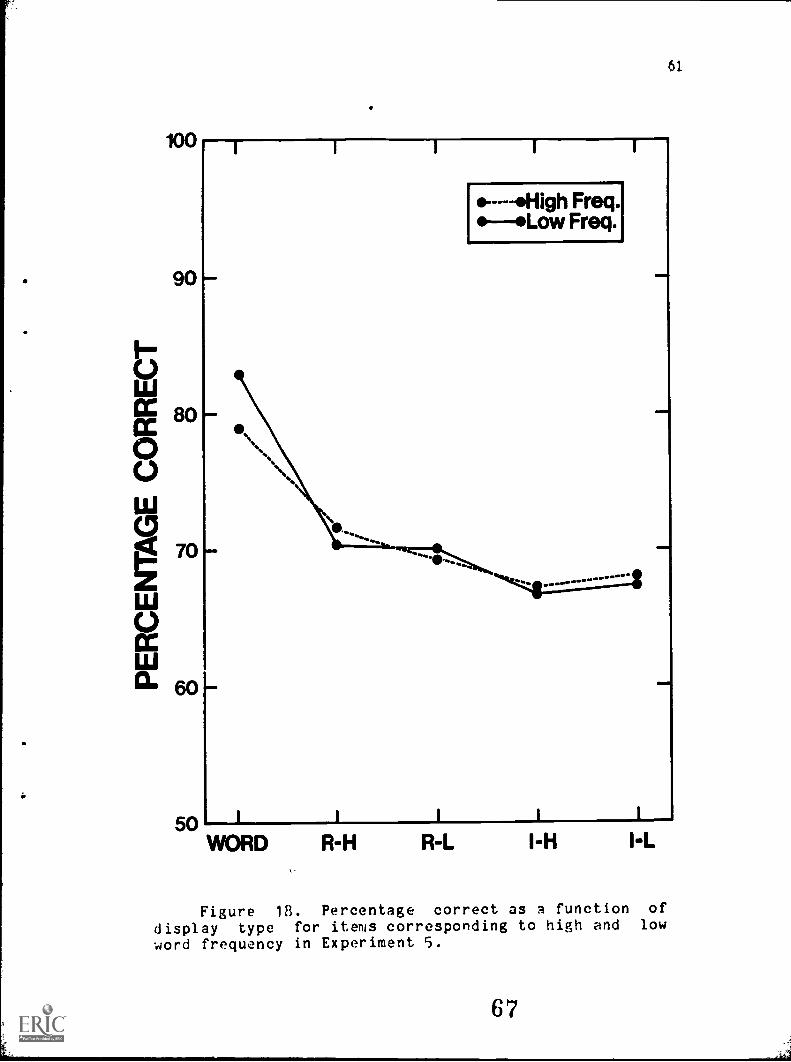
Figure 18 reveals the interaction of display type and
word frequency, F 68) = 2.5, p = .05. This effect
reflected a 4.0% advantage of high frequency words over low
frequency words, F (1, 68) = 4.6, E < .05.
The slight difference between target (66.9%) and catch
(70.8%) trials was not significant, F < 1, and this variable
did not interact with letter-string type, F < 1.
Correlation Analysis
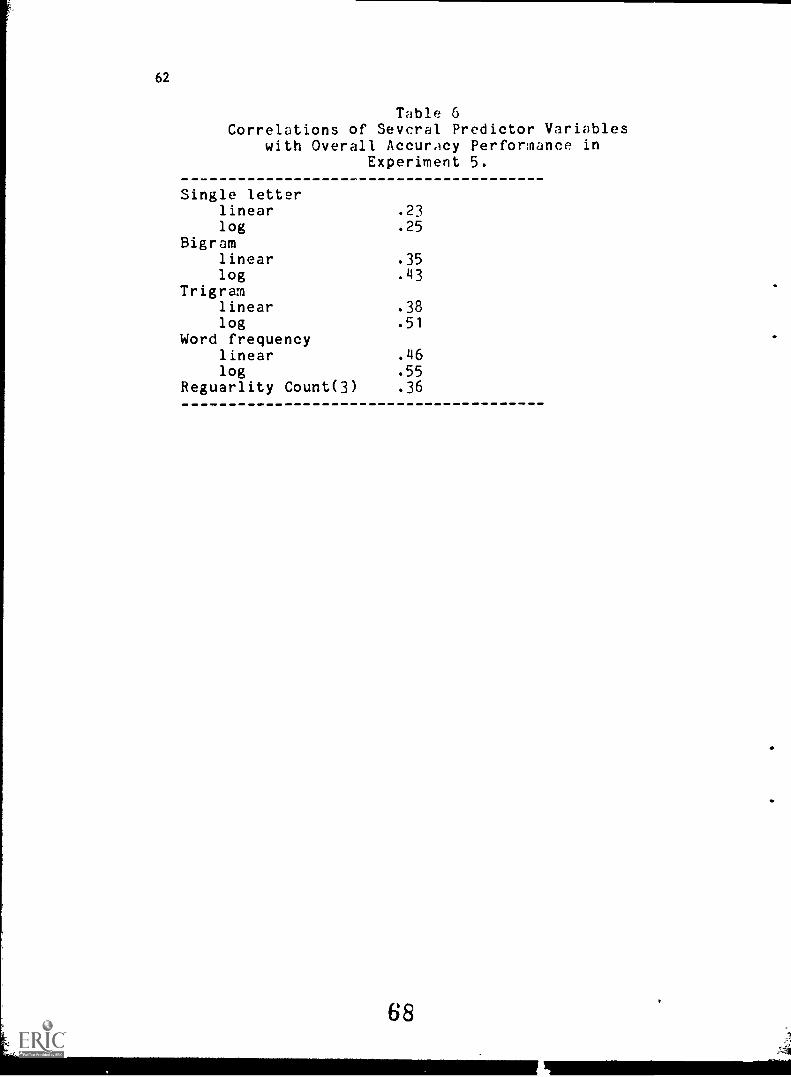
Table 6 presents the correlations of performance with
several predictor variables. Correlations increased from
linear to log counts and with increases in the size of the
frequency measure. Overall, the pattern of results obtained
for the fourth graders is similar to that found for adult
subjects.
Multiple Regressions
60
100
90
EA)
NOM R -44
tar het nnd catch trials in PAperiment
000,0'".......
.....
R-t. 141
Percentagecorrect as a function of
Figure 1/.
display typc for).
66
100
90
80
70
60
61
Om*
MO
MB
.----*High Freq.--Low Freq.
50 I
WORD
eml
OWN
R-H R-L I-H I-L
Figure 18. Percentage correct as a function of
display type for items corresponding to high and low
word frequency in Experiment 5.
62
Table 6Correlations of Several Predictor Variables
with Overall Accuracy Performance inExperiment 5.
Single letterlinear .23log .25
Bigramlinear .35log .143
Trigramlinear .38log .51
Word frequencylinear .46log .55
Reguarlity Count(3) .36
68
63
In a series of multiple regres3ion analyses, the
individual log counts at each position were treated as
independent variables. The log single-letter counts at the
sixth and first serial positions accounted for 7% of the
variance. For log bigrams, the first, fifth, second, and
fourth positions accounted for 22% of the variance. For log
trigrams, the first and fourth positions accounted for 31%.
Summed log bigram frequency and Regularjty(3) accounted
for 24% of the variance. The partial correlations for
summed log single-letter and trigram frequencies were -.08
and .28, respectively.
Experiment 6
In Experiments 1-5, large effects were found for words
as compared to the best anagrams (regular-high). One way to
account for the effect is by the lexical status of the
words. Since words are represented in the reader's lexicon,
they may be retrieved on the basis of partial visual
information. For example, the partial information shoji_
might lead to recognition of the word should. Lexical
access would allow determination of the two unknown letters.
On the other hand, the partial information shu_o_ can not
access any lexical entry and the missing letters can not be
determined. Consequently, on a word trial there is a better
chance that all of the component letters will be available
for comparison c:gainst the target letter. In contrast, the
same partial information about an anagram will not lead to
64
recognition of all of the letters in the test string. As a
result, fewer letters of anagrams will be available for
comparison against the target letter. This account is
consistent with the model articulated in the Introduction;
the secondary recognition process can lead to word
recognition without complete recognition of all of the
component letters.
A second explanation of the word advantage is that
words differ from even the best anagrams with respect to
sutlexical orthographic -tructure. For example, the bigram
frequency of the words in Experiments 3 and 4 averaged
almost three log units more than that for the regular-high
anagrams (see Figure 12). Perhaps accuracy was greater for
words because words contained more frequent bigrams.
To choose between these two explanations in Experiment
6, the words of Experiments 3, 4, and 5 were replaced with
regular anagrams which were matched with the words on log
bigram frequency. If log bigram frequency was the basis of
the word advantage, then a similar advantage should be
observed for these regular-very high (R-VH) anagrams.
Method
Experiment 6 was conducted in the same manner as the
previous experiments with adult subjects. Regular 'ry high
anagram:, with similar log bigram frequencies to the words of
Experiments 3 and 4 were used a]ong with all the anagrams of
Experiments 3 and 4. The summed 1.,6ram frequencies for the
65
regular-very high anagrams were 1,-940 and 13.407
respectively, almost identical to those of the words (see
Figure 12). The regular-very high anagrams are listed in
Appendix 4. The experiment was identical to Experiment 4
except that the regular-very high anagrams were used in
place of the word items. Seven new subjects obtained from
the same Introductory Psychology subject pool used in the
previous experiments participated in exchange for course
credit. They were informed that a target would occur on 50%
of the trials and that none of the letter strings were
words.
Results
Figure 19 shows the differences among the five types of
letter strings, F (4, 24) = 3.3, p < .05. There was a 0.3%
advantage of regular very-high anagrams over regular-high
anagrams, F (1, 6) < 1. Regular anagrams gave a 3.6%
advantage over irregular anagrams, F (1, 24) = 13.8, 2 <
.005. There was ri -0.2% effect for log bigram frequency, F
(1, 6) < 1.
There was only a 3.0% advantage of catch over target
trials, F (1, 6) < 1, but this variable interacted with the
type of letter string, F (4, 24) = 3.3, 2 < .05. This test
reflects the presence of 7.4% increase in accuracy from the
worst to the best structured strings for target trials, but
an absence of an effect of orthographic structure for catch
trials (Figure 19).
71
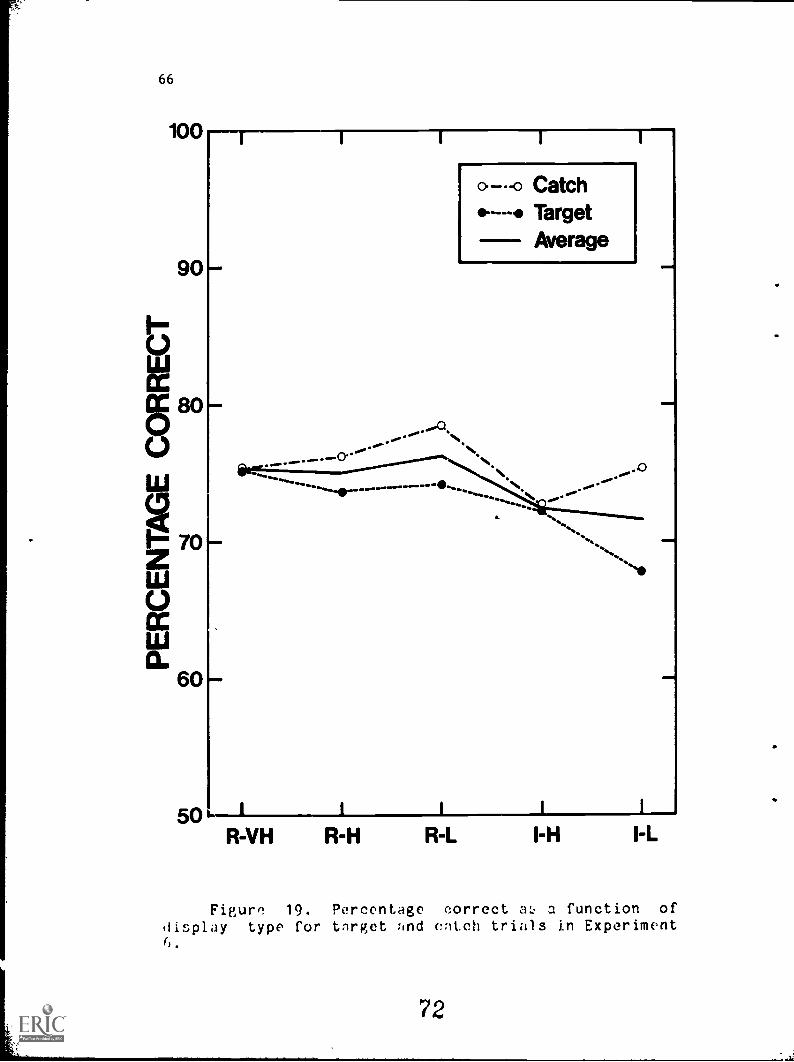
66
100
90iilJCCCC 8000..I 70ZLIJ
CCLIJCL
60
ligrZ--...a...ft ... aml.. ... fffffff
o -0 Catch--- Target
Average
...CI...0 ,....
N.
.
50 I .1 I I I
R-VH R-H R-L I-H I-L
4I
Figure 19. Percentage correct a!: a function ofdisplay type for target and catch trials in Experiment6.
72
67
Figure 20 presents the average accuracy as a function
of letter string type according to whether the items
correspond to nigh or low word frequency. Neither the 0.6%
difference nor the interaction with display type was
statistically signifiCant.
The results of Experiment 5 support the idea that
lexical status makes a significant contribution to
perceptual recognition in the target search task. The
contribution of lexical status in the earlier experiments
can not be attributed to sublexical orthographic structure
differences in log bigram frequency. That is to say, the
reader takes into account not only the frequency of
occurrence of letter sequences and the regularity of these
sequences, but also whether or not a particular sequence is
represented in a word. Frequency and regularity allow
well-structured anagrams to be better recognized than poorly
structured anagrams and, in addition, lexical status allows
a perceptual advantage of words over equally well-structured
anagrams.
Correlation Analysis
Table 7 presents the correlations of several variables
with overall performance. The correlations, while
attenuated, exhibit a pattern similar to the previous
experiments. Log measures are better than linear measures;
the regularity measure does about as well as the best
frequency measure.
73
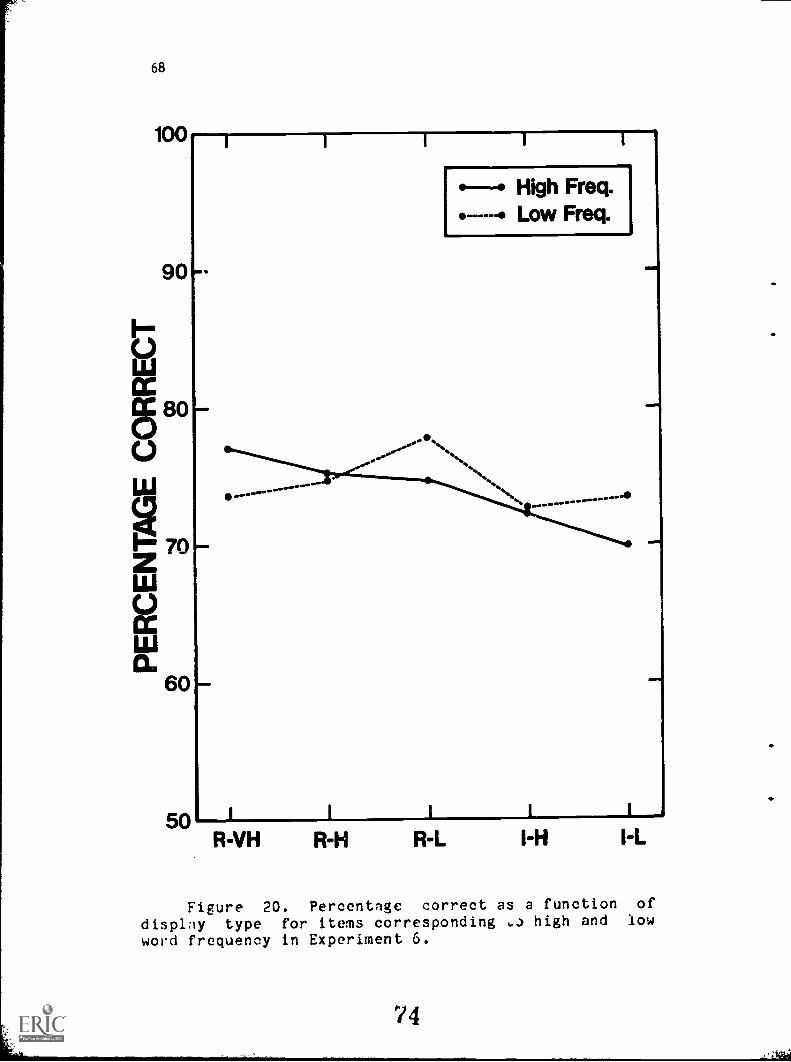
68
100
90 MOS
I
I
I 1 I
-- High Freq.Low Freq.
50 IR-VH
I I I I
R-H R-L I-H I-L
Figure 20. Percentage correct as a function of
display type for items corresponding ,..) high and low
word frequency in Experiment 6.
74
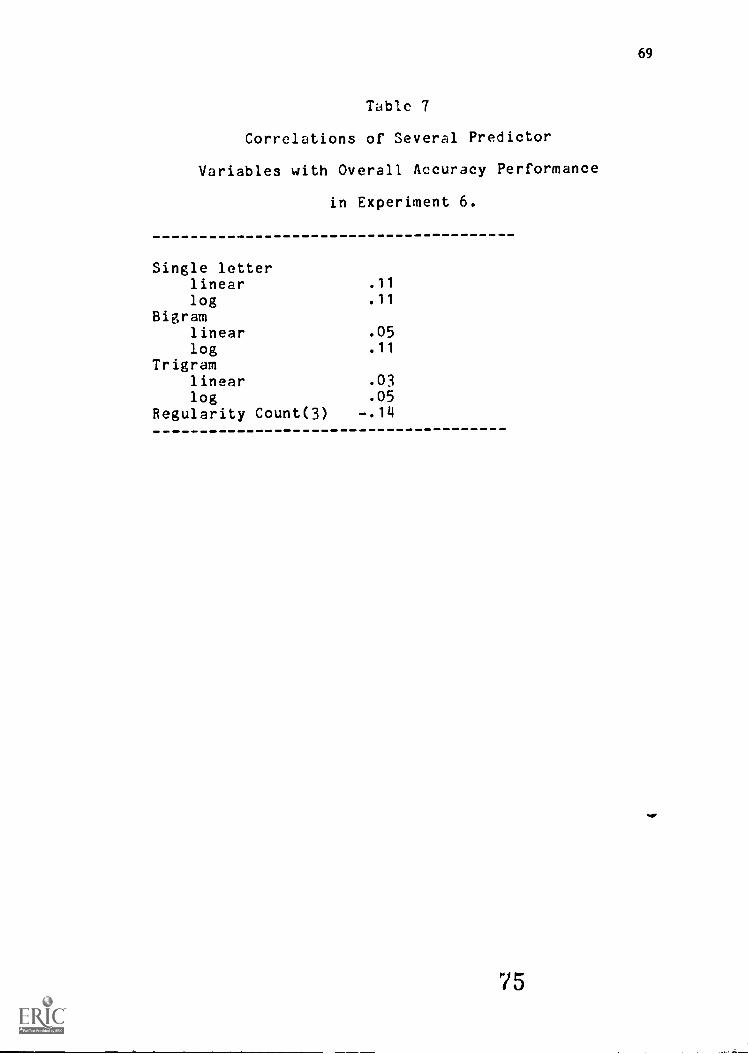
69
Table 7
Correlations of Several Predictor
Variables with Overall Accuracy Performance
in Experiment 6.
Single letterlinear .11
log .11
Bigramlinear .05log .11
Trigramlinear .03log .05
Regularity Count(3) -.14
75
70
Multiple Regressions
Summed log bigram frequency and Regularity(3) accounted
for 3% of the variance. The partial correlations for summed
log single-letter and trigram frequencies were .01 and -.06,
respectively.
Experiment 7
Experiments 1-6 were not successful in choosing between
frequency and regularity measures of orthographic structure.
In a final evaluation of these measures, the perceptual
recognition task was replicated with five display types.
The display types were chosen to give a large range of
regularity and frequency. The comparisons among display
types and the post hoc correlations will be used to evaluate
the relative contributions of lexical status, regularity,
and frequency in perceptual recognition.
Method
The R-VH anagrams from Experiment 5 and the words,
regular-low anagrams, and irregular-high anagrams from
Experiment 3 were used as items along with a new type of
anagram that was both very irregular and very low in log
bigram frequency. The very irregular, very low (VI-VL)
anagrams mostly had three or four irregularities and
average log bigram frequencies of 4.845 and 4.971 for the
high and low word frequency items, respectively. The VI-VL
.
71
anagrams are listed in Appendix 4. The procedure of
Experiment 4 was replicated exactly. Eleven new subjects
from the Introductory Psychology subject pool were used.
Results
As can be seen in Figure 21, accuracy uniformly
increased with better structured letter strings; F (4, 40) =
69.4, 2 < .001. Words had a 10.8% advantage over the
regular-very high anagrams, F (1, 40) = 15.9, 2 < .001.
Regular-very high anagrams gave a performance advantage of
4.9% over regular-low anagrams, F (1, 40) = 3.1, 2 < .086; a
7.61 advantage over irregular-high anagrams, F (1, 40)
7.9, 2 < .01; and a 8.9% aavantage over very irregular-very
low anagrams, F (1, 40) = 10.7, 2 < .005.
The 6.91 advantage of catch over target trials was not
significant, F (1, 10) = 1.5, 2 > .25, and this difference
did not interact with diplay type, F < 1.
Figure 22 reveals a 2.7% difference between levels of
word frequency, F (1, 10) = 32.17, 2 < .001, but the
advantage of high word frequency occurred only for the words
and the regular anagrams.
Correlations and Regressions
The correlations of several predictor variables with
overall performance are presented in Table 8. As usual the
log measures predict performance better than the linear
measures. Bigrams and trigrams were similar in predictive
77
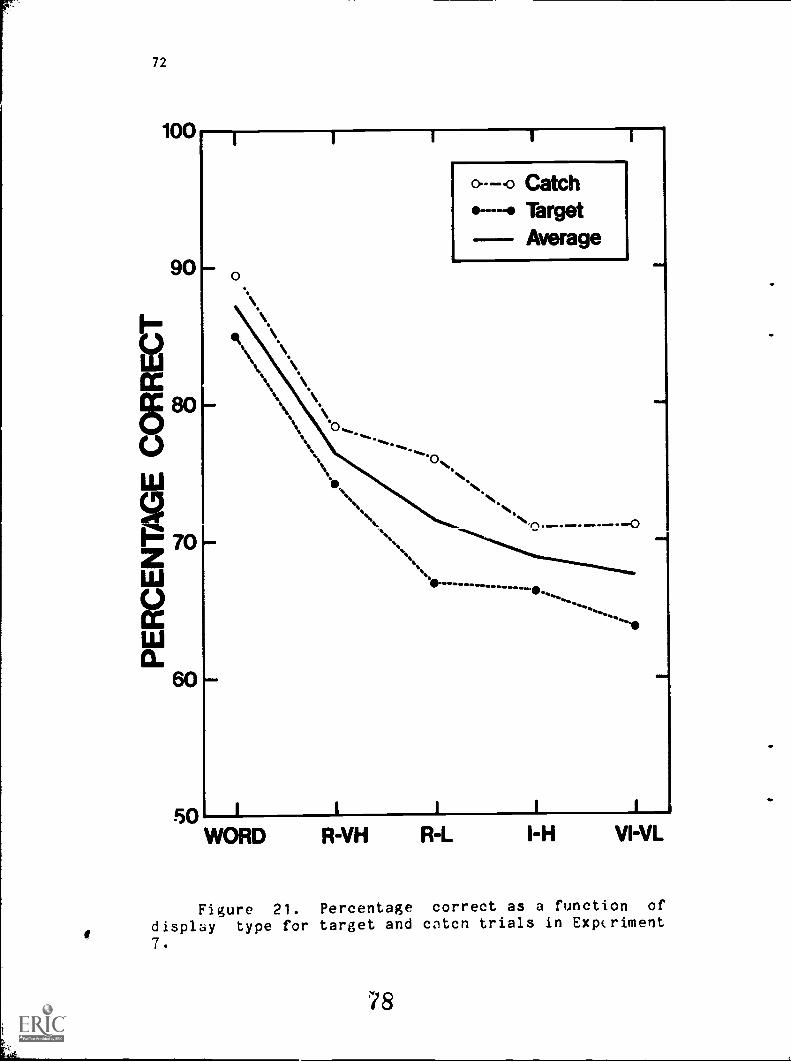
72
100
90
I
50' I
WORD
s
...
I
0. -.0 Catch---- Target
Average
cl."S..
S,.\.. ............... -...
MIN
WNW
I I I I ,
R-VH R-L I-H VI-VL
Figure 21. Percentage correct as a function of
display type for target and eaten trials in Experiment7I
78
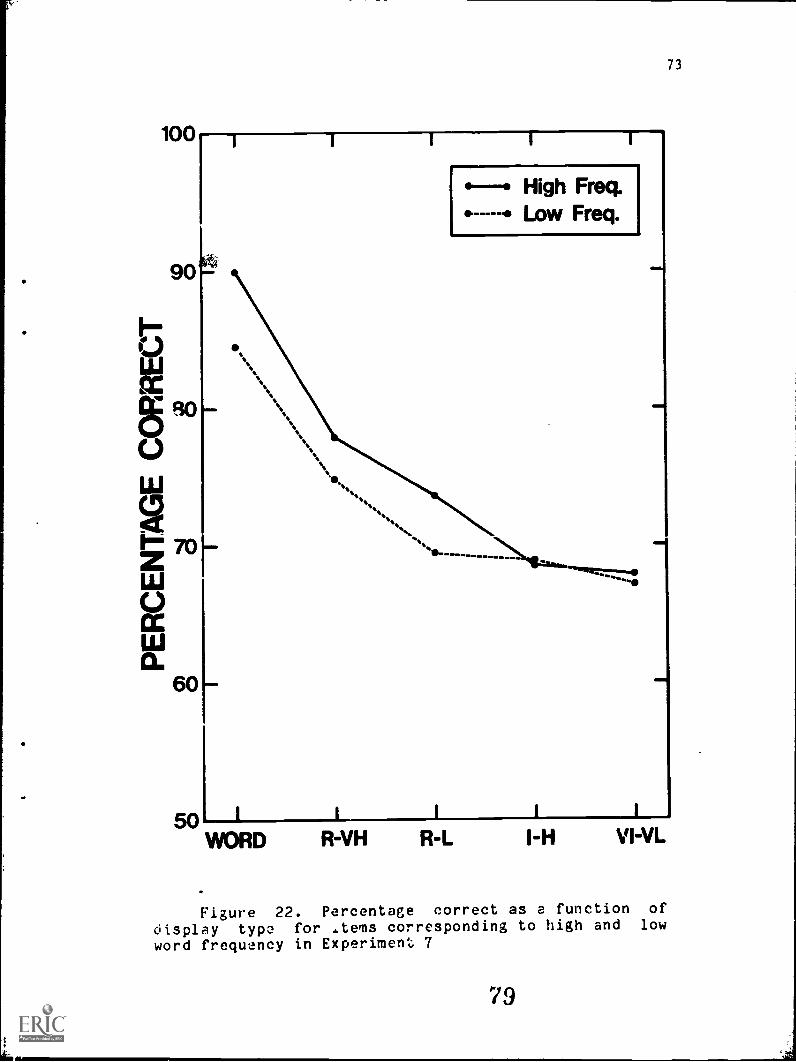
100
90
73
-- High Freq.Low Freq.
....
may------- - - - -
MM
50WORD
AWN
awl
R-VH R-L I-H VI-VL
Figure 22. Percentage correct as a function of
display typo for ..terns corresponding to high and low
word frequency in Experiment 7
79
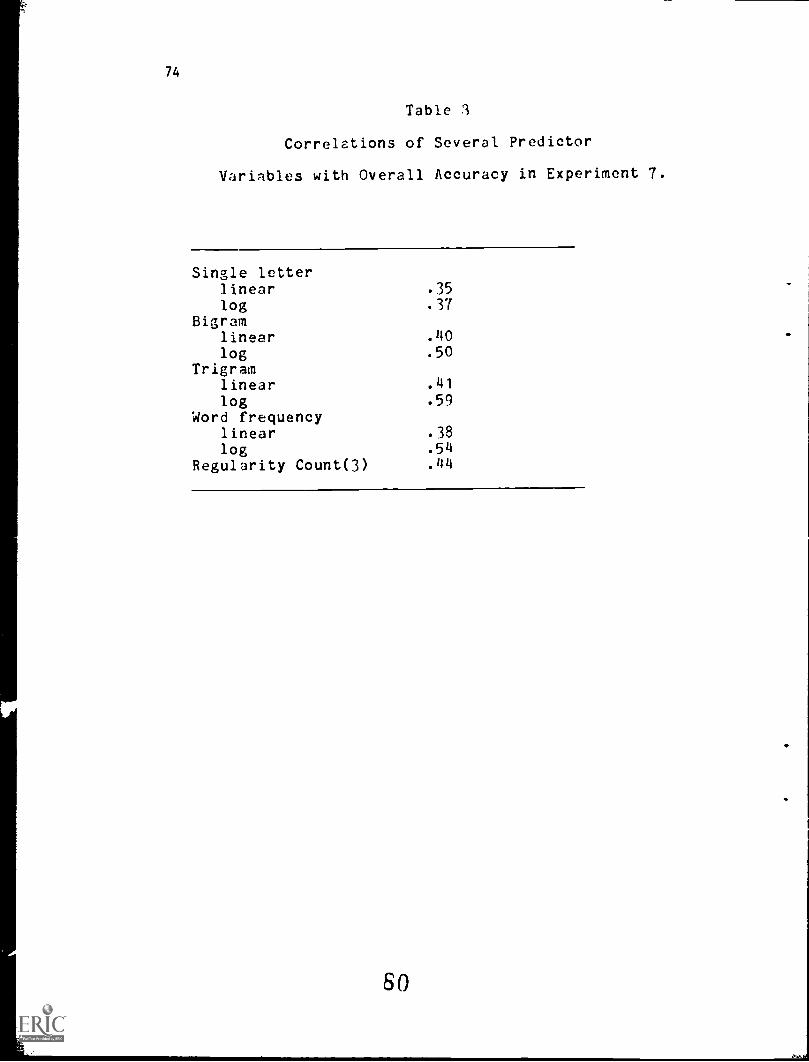
74
Table 3
Correlations of Several Predictor
Variables with Overall Accuracy in Experiment 7.
Single letterlinear .35log .37
Bigramlinear .40log .50
Trigralinear .41
log .59Word frequency
linear .38log .54
Regularity Count(3) .44
SO
75
ability. Log word frequency correlated .42 with overall
perforance, but also correlated .48 with summed log bigram
frequency and .75 with summed log trigram frequency.
Considered together, the results of Experiment 7 replicate
previous experiments.
Summed log bigram frequency and Regularity(3) accounted
for 27% of the variance. The partial correlations for log
single-letter and log trigram frequencies were -.04 and .36,
respectively.
Experiment 8
The perceptual recognition task assesses the degree to
which readers utilize orthographic structure in visual
processing of letter strings. An over judgment task has
also been used to assess the degree to which ibis knowledge
is available for a conscious report (Maasaro et al., 1980;
Rosinski & Wheeler, 1972). An overt judgment task is used
in the present experiment to assess the degree to which
regularity and frequency are consciously available.
Subjects are given pairs of letter strings and asked to
choose which letter strinK most resembles English r-elling.
Some subject. are instructed to nase their decision on the
frequency of occurrence of letter sequences in English
spelli g; o.her subjects are instructed to respond on the
basis of t ,, regularity of letter sequencing. The se.ten
types of letter strings varying .n lexical status,
regularity, and log bigram frequency were paired with each

76
other in the task. The degree to which subjects can follow
instructions and discriminate among the types of items
should reveal which aspect(s) of orthographic structure is
(are) consciously available and capable of report.
Method
Subjects. Sixteen Introductory Psychology students who
met -e same requirements as in the first .ix experiments
were used as subjects.
Stimuli and apparatus. The 280 letter strings
represented all seven categories of items used in the
previous experiments. Accordingly, 40 words and their
corresponding R-H, R-L, I-H, and I-L anagrams of Experiment
3, HO R-VH anagrams of Experiment 6, and 40 VI-VL anagrams
of Experiment 7 were selected. The irregular items chosen
from Experiment 3 had two irregularities. Sever categories,
and allowing the two letter strings of a pair to be from the
same category, result in 28 unique pairs of categories,
'',ese 28 pairs were sampled randomly without replacement in
each block of 28 trials. The actual items from each of the
categories for each pair were randomly selected with
replacement for each group of subjects. Eventually, each
subject was presented with 840 pairs for judgment, resulting
in a total of 30 observations for each pair. The two
s',.rIngs of each pair were arranged side-by-side on the CRT.
The horizontal visual angle cf each letter string was 1.9
82
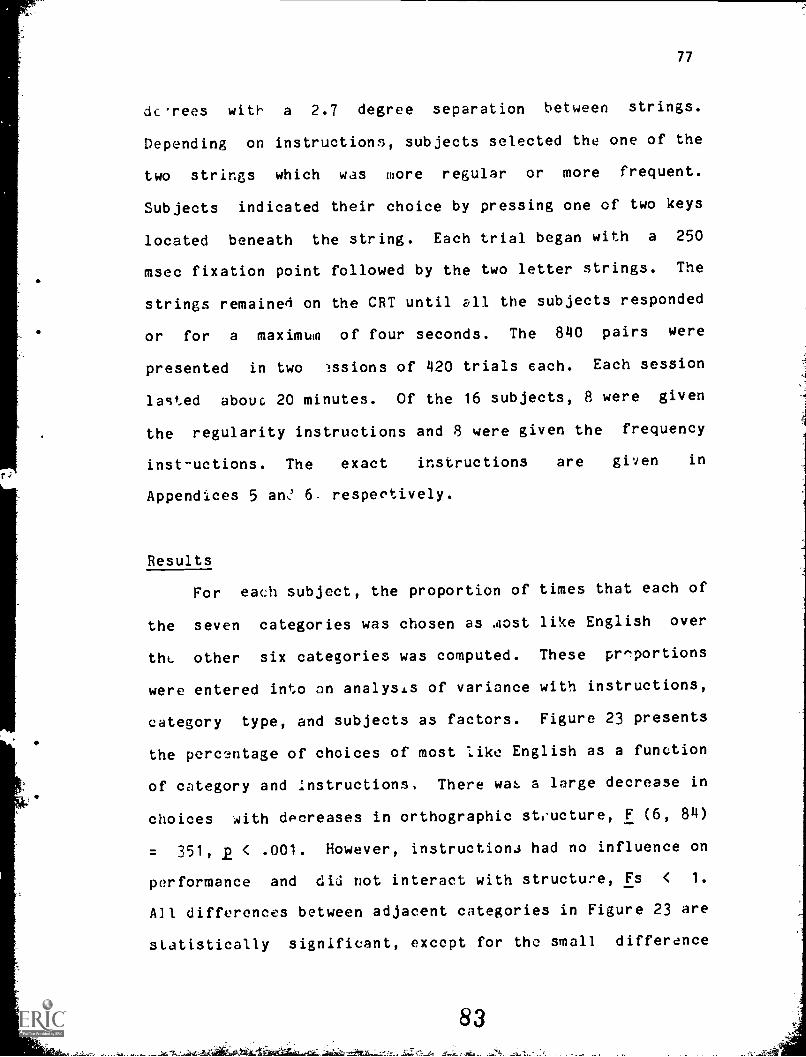
77
dcrees with a 2.7 degree separation between strings.
Depending on instructions, subjects selected the one of the
two strings which was more regular or more frequent.
Subjects indicated their choice by pressing one of two keys
located beneath the string. Each trial began with a 250
msec fixation point followed by the two letter strings. The
strings remained on the CRT until all the subjects responded
or for a maximum of four seconds. The 840 pairs were
presented in two -!ssions of 420 trials each. Each session
lasted about 20 minutes. Of the 16 subjects, 8 were given
the regularity instructions and 8 were given the frequency
inst '-uctions. The exact instructions are given in
Appendices 5 an: 6. respectively.
Results
For each subject, the proportion of times that each of
the seven categories was chosen as .cost like English over
the. other six categories was computed. These pr,!portions
were entered into on analysis of variance with instructions,
category type, and subjects as factors. Figure 23 presents
the percentage of choices of most like English as a function
of category and instructions. There wat. a large decrease in
choices with decreases in orthographic structure, F (6, 84)
= 351, 2 < .001. However, instructions had no influence on
performance and did not interact with structure, Fs < 1.
An differences between adjacent categories in Figure 23 are
statistically significant, except for the small differdnce
83r&dLk.e ;Am.1
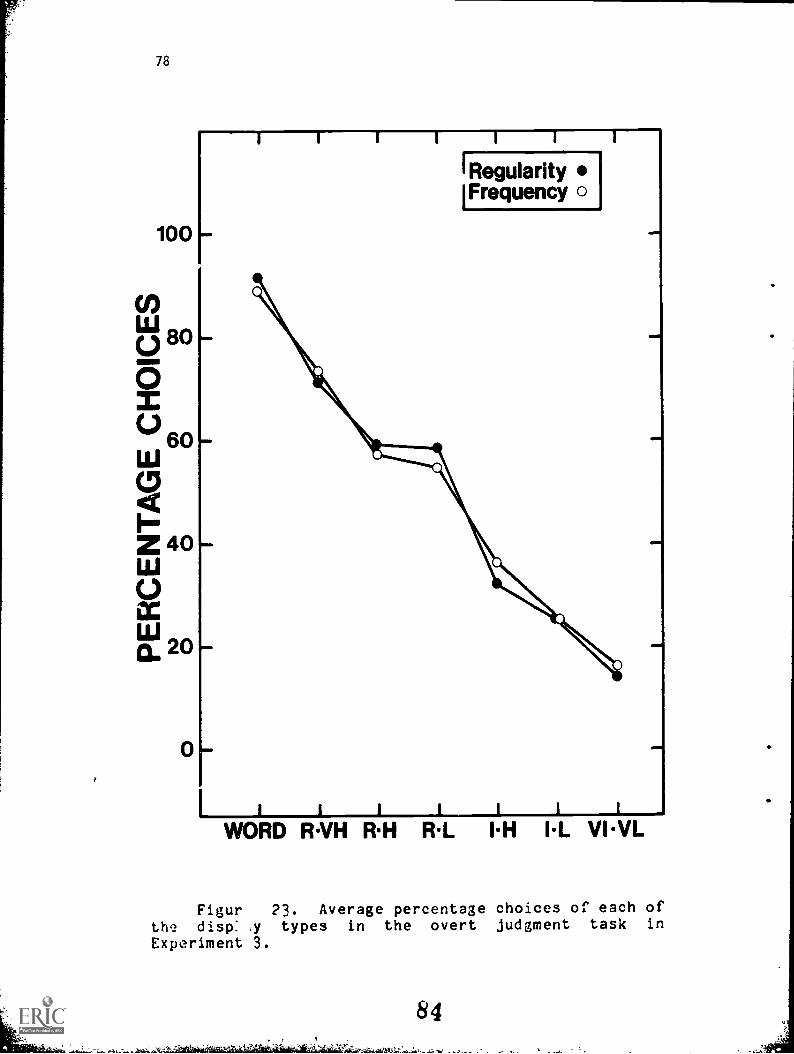
78
100
(/)Lk' 80()0I0 60IliC./4I='Z 401110IWci. 20
0
I I
I RegularityFrequency o
I
wol
MEI
WORD RVH Rill RI. IH IL. VI I_
Figur 23. Average percentage choices of each ofthe disp: ,y types in the overt judgment task in
Experiment 3.
84
79
between R-H and R-L items.
Table 9 presents the proportion of times each of the
seven classes of items was chosen over the other six
classes. Some effects of instructions not apparent in the
average proportions shown in Figure 23 are seen in these
results. The R-H items were picked over the R-VH items 39%
of the time ..r regularity instructions and 25% of the time
for frequency instructions. The three classes of irregular
items (I-H, I-L, and VI-VL) were chosen an average of 13% of
the time over the R-L items with regularity instructions and
an average of 181 of the time with frequency instructions.
Regular-very high items were chosen over words 17% of the
time for regularity instructions and 25% of the time for
frequency instructions. All of these results are consistent
with the idea that frequency carries somewhat more weight in
the overt judgment task b.ith frequ,,ncy instructions than
with regularity instructions.
An analysis of variance also was conducted on the
reaction times of the choice responses. Response type was
included as a factor to assess the differences in reaction
times between choosing a given category as most like English
relative t the average reaction time for choosing the other
six categories. Figure 24 presents the reaction times as a
function of instructions, response type, and category.
Overall reaction times were 232 msec longer for frequency
than for regularity instructions, F (1, 14) = 6.9, 2 < .025.
Reaction times increased with decreasing orthographic
b 85
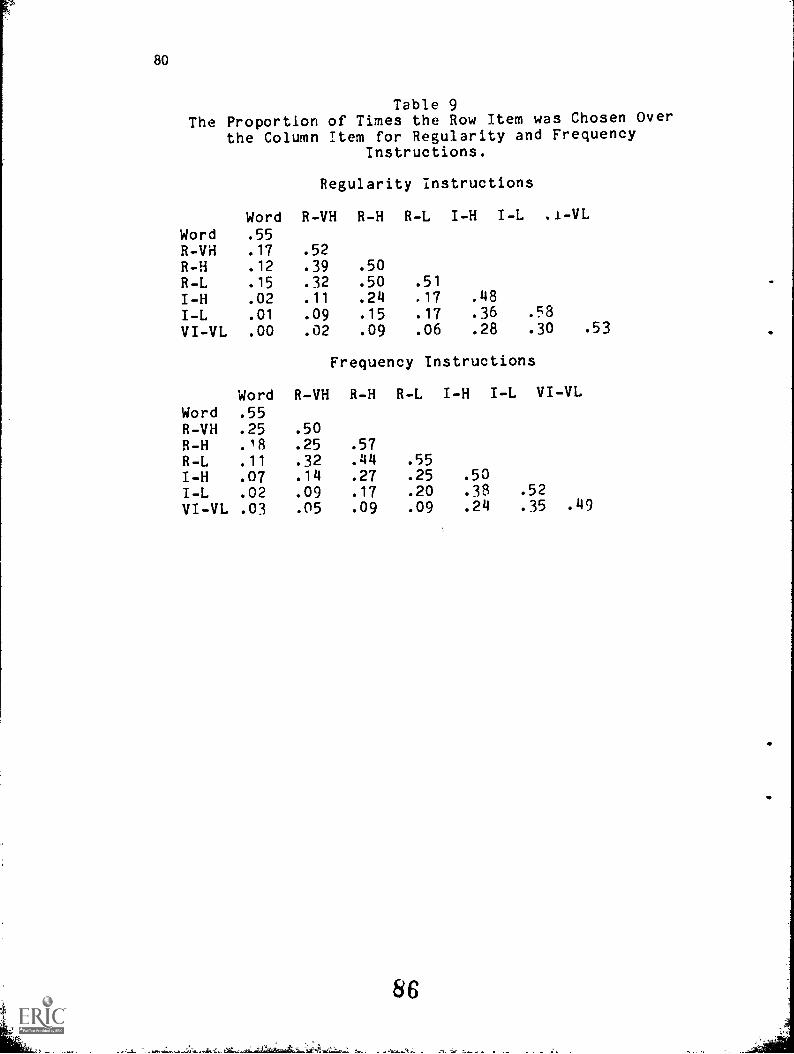
80
Table 9The Proportion of Times the Row Item was Chosen Over
the Column Item for Regularity and Frequency
WordWord.55
Instructions.
Regularity Instructions
R-VH R-H R-L I-H I-L .1-VL
R-VH .17 .52R-H .12 .39 .50R-L .15 .32 .50 .51
I-H .02 .11 .24 .17 .48
I-L .01 .09 .15 .17 .36 .58
VI-VL .00 .02 .09 .06 .28 .30 .53
Frequency Instructions
Word R-VH R-H R-L I-H I-L VI-VL
Word .55R-VH .25 .50R-H .18 .25 .57R-L .11 .32 .44 .55I-H .07 .14 .27 .25 .50
I-L .02 .09 .17 .20 .38 .52
VI-VL .03 .05 .09 .09 .24 .35 .49
86
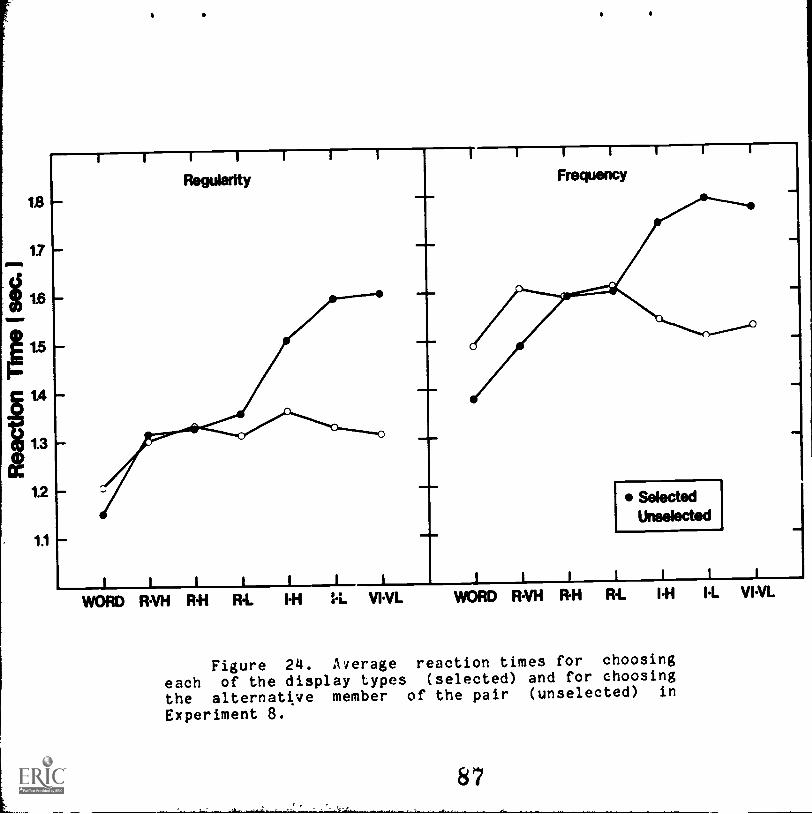
I I I I I I I III I r I I
Regularity Frequency
SelectedUnselected
WORD RAIN RH R. 11 1_ VII. WORD 14/H 111 R4. PH I. VL
Figure 24. Average reaction times for choosing
each of the display types (selected) and for choosing
the alternative member of the pair (unselected) in
Experiment 8.
87
82
structure, but only when that category was chosen as the
item most like English, F (6, 84) = 12.7 and 21.0, ks <
.001.
A comparison between the perception task and overt
judgment task shows that the latter is a much more sensitive
measure of the reader's knowledge of orthographic structure.
Subjects are able to discriminate among certain classes of
items in the overt judgment task that are responded to
equivalently in the perceptual accuracy task. For example,
R-VH and R-H were differentiated in the overt judgment task
but were responded to equivalently in the perceptual
accuracy task of Experiment 6. The same was true of the T-H
vs T-L and the I -P. vs VI -!'L lontrasts. Other results were
exactly parallel in the two tasks: Words have an advantage
over regular items and regular items have an advantage over
irregular items.
Discussion
In summary, the orthogonal contrasts of lexical s.atus,
word frequency, position-sensitive frequency, and regularity
provide evidence for the following conclusions. Lexical
status provides a perceptual advantage of words over equally
well-structured anagraws. Word frequency appears to add
very little, if anything, beyond that accounted for by
lexical status. Regular anagrams are recognized
significantly better than irregular anagrams whereas log
bigram freqeuncy has no influence when regularity is
controlled. However, the post hoc correlations of thest
r
e
R3
measures of orthographic structure with perceptual
recognition of each of the 400 test items complicate these
conclusions somewhat. Log bigram frequency usually
correlates positively with performance on letter strings
even after the influence of lexical status and regularity
has been removed. In this regard, frequency measures allow
a fine-grained description of orthographic structure that
provides a good index of performance on individual letter
strings. The binary classification of lexical status and
the small range of the number of irregularities limit the
usefulness of these measures as descriptions of a relatively
continuous variation in orthographic structure. Some
frequency weighting of regularity description might lead to
a improved measure of structure. Until such a description
is developed, it appears necessary to include lexical
status, frequency, and regularity to account for those
components of orthographic structure that are
psychologically real. The results of the present studies
also are relevant to previous studies cf orthographic
structut e.
The utilization of orthographic structure in reading
was first studied by Miller, Bruner, and Postman (1c'5P), who
had subjects reproduce letter sequences presented
tachistoscopically. The strings were all eight lettes and
corresponded to different approximations to English, Lased on
Shannon's (1948, 1951) algorithms. Miller et Al. found that
performance improved with better approximations to English.
84
By correcting for the relative information per letter in the
strings, the amount of information transmitted was shown to
be equal for the various approximations. This result is
consistent with more recent empirical and theoretical work
demonstrating that orthographic structure provides an
independent source of information to the reader (Massaro,
1979a, b; Massaro et al. 1980). In fact, the
approximation-to-English algorithms may be viewed as early
descriptions of orthographic structure. Accordingly, the
more recent studies replicate and extend the Miller et al.
results. The major advances in the recent studies are the
more precise descriptions of structure (see Massaro et al.,
1980, Chapter 3) and the quantitative modeling of the
processes by which visual information combines with
structure during word recognition (Massaro, 1979a, b).
Related research by Gibson and her colleagues evaluated
the role of word length and pronounceability in a full
report of letter strings by both hea-ing and deaf readers
(Gibson, Pick, Osser, & Hammond, 1962; Gibson, Shurcliff, &
Yonas, 1970). They found that the number of errors
increased with increases in word length and decreased with
increases in pronounceability. In the post hoc regression
analyses, word length accounted for 72% of the variance and
pronounceability accounted for another 15%. Position-
sensitive and word length specific bigram and trigram
i'requeneies were significantly poorer predictors of
performance. However, these counts can not be used in any
85
straightforward manner for items of various letter lengths.
Words of different lengths do not occur with equal frequency
and the less frequent word lengths will naturally have
bigrams and trigrams with smaller counts. Therefore, this
comparison can not be considered an adequate test between
pronounceability and frequency measures of orthographic
structure. The finding that deaf and hearing readers were
influenced similarly by pronounceability argues that
orthographic structure rather than pronounceability is the
important structural variable.
Manelis (1974) found an advantage of four-letter words
over pseudowords in tachistoscopic recognition, but failed
to find a significant correlation between recognition and
summed linear bigram and trigram frequencies, as measured by
Mayzner and Tresselt (19G5) and Mayzner, Tresselt and Wolin,
(1965). In a more recent study, McClelland and Johnston
(1977) independently varied position-sensitive bit, Al
frequency and lexical identity in four-letter strings in a
Reicher-Wheeler forced-choice task (Reicher, 1969; Wheeler,
1970). In addition, a full report of the four letters
either preceded or followed the forced-choice response. The
forced-choice responses revealed no eft'ect of either bigram
frequency or an advantage of words over orthographically
regular pseudowords. Forced-choice responses also showed a
13% advantage of words and pseudowords over single letters,
replicating the word-letter difference of Reicher (1969).
The full report score replicated the absence of a bigram
91
86
frequency effect found for the forced-choice task, but
showed an advantage of words over pseudowords. Also, the
full report score revealed a large word frequency effect.
In ps)st hoc analyses, McClelland and Johnston report that
bigram frequency did not correlate with perceptual accuracy
whereas, single-letter position frequency was highly
correlated with accuracy.
Using a different task, Henderson and Chard (1930)
presented items either high or low in both position-
sensitive single-letter and bigram frequencies in a lexical
decision task. Their results indicate that second and
fourth graders were faster in rejecting low-frequency than
high-frequency six-letter nonwords. In a rela,,ed study,
Bouwhis (Note 3) found that single-letter positional
frequency correlated with lexical decisions for three-letter
itt-s in Dutch. Reaction times to words decreased while
reaction times to pseudowords increased with increases in
single-letter frequency. Similarly, subjects tended to
respond "word" more often to both words and pseudowords if
the items were of high single-letter frequency. In
contrast, these correlations were considerably diminished
'Then bigram positional frequency was used as the predictor
variable. Bouwhis' results when compared with those of
Henderson and Chard (1930), imply that the power of the
bigram frequency measure with our six-letter items may not
generalize completely to smaller letter-string lengths.
That is, bigram frequency appears to have more predictive
87
power than single-letter frequency when the items are six
letters in length, but the reverse is indicated when the
items are three or four letters in length. However, such a
conclusion is tenuous for two reasons. First, single-letter
and bigrams measures are highly correlated even for small
letter-string lengths. Second, experiments demonstrating
the predictive power of single-letter frequencies have used
linear rather than log counts. Since log counts are
uniformly better predictors of the data, it will first have
to be shown that log counts do not change the relative power
of the two frequency measures. Of the several studies
(McClelland & Johnston, 1977; Bouwhis, Note 3) investigating
the relative contributions of single - letter and bigram
frequencies, only the present studies directly compare
linear and log single-letter and bigram counts. The present
studies found that log counts are consistently better than
linear counts and that bigram counts are better than
single-letter counts.
In the first of two experiments investigating other
structural variables, Spoehr (1978) showed that report
accuracy in the Reicher-Wheeler task was lower for five-
letter, one-syllable strings made up of five phonem,1 than
those made up of four phonemes. Performance for words such
as thump and pseudowords such as sherk averaged 76% correct
wuereas, performance was 4% worse for words such as s ank
and pseudowords such as crost. Average accuracy on words
Was 7$ greater than on pseudowords. In the second
93
88
experiment, tvo-yliable words were recognized 13% more
poorly than one-syllable words when phoneme length was
equated. Although Spoehr (1978) showed that position-
sensitive bigram frequency of the letters could not account
for the observed differences, log counts might have been
more appropriate. Furthermore, since our counts were
derived from the considerably larger Kucera and Francis
(1967) corpus, they are likely more reliable than the
Mayzner and Tresselt (1965) counts that Spoehr employed.
Accordingly, Spoehr's results are not necessarily
inconsistent with the present results.
In conclusion, a number of recent experiments have
failed to find significant effects of position sensitive
bigram frequency in the perceptual recognition of letter
strings. However, these .,udies all used linear rather than
log counts and we have found much larger effects with the
lcg counts. Linear and log counts correlate .84 and .66 for
single letter and bigram, position sensitive counts for four
letter words, .86 and .76 for five letter words and .85 and
.75 for six letter words in the Kucera-Francis corpus
Therefore, there is sufficient room for improvement of log
over linear counts in accounting for percept:;?1 recognition.
Previous studies and analyses of completed experiments
shou.d evaluate log as well as linear counts to provide a
sufficient test of frequency measures of perceptual
recognition.
94
89
Reference Notes
1. Massaro, D. W. Reading and 3istening (Technical ReportNo. 423). Madison: Wisconsin Research and DevelopmentCenter for Individualized Schooling, December 1977.
2. Taylor, G. A. The contribution of orthographic
structure to the perception of letter strings.
Unpublished doctoral dissertation, University of
Kansas, 1977.
3. Bouwhis, D. G. Visual recognition in words.
Unpublished doctoral dissertation, KathollekeUniversiteit, Nijmegen, Holland, 1979.
91
References
Gibson, E. J., Pick, A., Osser, H., & Hammond, M. The roleof grapheme-phoneme correspondence in the perception ofwords. American Journal of Psychology, 1962, 75,
554-570.
Gibson, E. J., Shurcliff, A., & Yonas, A. A utilization ofspelling patterns used by deaf and hearing subjects.In H. Levin and J. P. Williams (Eds.), Basic studies onreading. New York: Basic Books, 1970.
Henderson L. & Chard, J. The reader's implicit knowledge oforthographic structure. In U. Frith (Ed.), Cognitiveprocesses in spelling. London: Academic Press, 1980.
Kucera, H., & Francis, W. N. Computational analysis of
present-day American English. Providence: BrownUniversity Press, 1967.
Manelis, L. The effect of meaningfulness in tachistoscopicword perception. Perception & Psychophysics, 1974, 16,
182-192.
Massaro, D. W. Primary and secondary recognition in
reading. In D. W. Massaro (Ed.), Understandinglanguage: An information processing analysis of s eechperception, readin and psycholinguistics. New ork:
Academic Press, 7
Massaro, D. W. A stage model of reading and listening.Visible Language, 1978, 12, 3-26.
..assbro, D. W. Letter information and orthographic contextin word perception. Journal of ExperimentalPsychology: Human Perception and Performance, 1979, 5,595-609. (a)
Massaro, D. W. Reading and listening (Tutorial paper). In
P. A. Kolers, M. Wrolstad, & H. Bouma. (Eds.),
Processing of visible language I. New York: Plenum,
1979. (b
Mass:Iro, D. W. How does orthographic structure facilitatereading? In J. F. Kavanagh, & R. L. Venezky (Eds.),Orthography, reading, and dyslexia. Baltimore:University Park Press, 1980.
Massaro, D. W., & Schmuller, J. Visual features, percev, 1storage, and processing CI:TITTN reading. In D. W.
Massaro (fa), Understanding language: An informationprocessing analysis of s eech perception, reading, andpsycholinguistics. New ork: Academic Press, 1975.
96
92
Massaro, D. W., Taylor, G. A., Venezky, R. L., Jastrzembski,J. E., & Lucas, P. A. Letter and word perception:Orthographic structure and visual processing in
reading. Amsterdam: North Holland, 1980.
Massaro, D. W., Venezky, R. L., & Taylor, G. A.
Orthographic regularity, positional frequency, and
visual processing of letter strings. Journal ofExperimental Psychology: General, 1979, 108, 107-121T.
Mayzner, M. S., & Tresselt, M. E. Tables of single-letterand digram frequency counts for various word-length and
letter-position combinations. Psychonomic MonographSupplements, 1955, 1, 13-32.
Mayzner, M. S., Tresselt, M. E., & Wolin, B. R. Tables of
trigram frequency counts for various word-length and
letter-position combinations. Psychonomic MonographSupplemets, 1965, 1, 33-7E.
McClelland, J. L., & Johnston, J. C. The role of familiar
units in perception of words and nonwords. Perception& Psychophysics, 1977, 22, 249-261,
Miller, G. A., Bruner, J. S., & Postman, L. Familiarity ofletter sequences and tachistoscopic identification.Journal of General Psychology, 1954, 50, 129-139.
Reicher, G. M. Perceptual recognition as a function of
meaningfulness of stimulus material. Journal ofExperimental Psychology, 1969, 81, 275-280.
Rosinski, R. R., & Wheeler, K. E. Children's use of
orthographic structure in word discrimination.Psychonomic Science, 1972, 25, 97-98.
Shannon, C. E. A mathematical theory of communication.Bell System Technical Journal, 1948, 27, 379-423;623 -556.
Shannon, C. E. Prediction and entropy of printed English.Bell System Technical Journal, 1951, 30, 50-64.
Shepard, R. N., & Podgorny, P. Cognitive processes thatresemble perceptual processes. In W. K. Estes (Ed.),
Handbook of learning and cognitive processes: Humaninformation processing TTOTT---77 Hillsdale, N.J.:Yrlbaum, 1978.
S7
93
Solomon, R. L., & Postman, L. Frequency of usage as a
determinant of recognition thresholds for words.
Journal of Experimental Psychology, 1952, 3, 195-201.
Solso, R. L., & King, J. F. Frequency and versatility of
letters in the English language. Behavior ResearchMethods & Instrumentation, 1976, 8, 283-286.
Spoehr, K. T. Phonological encoding in visual word
recognition. Journal of Verbal Learning and Verbal
Behavior, 19787177T27-141.
STEP (Sequential Tests of Educational Progress), Reading,Mass.: Addison-Wesley, 1979.
Taylor, G. A., Klitzke, D., & Massaro, D. W. A visual
display system for reading and visual perceptionresearch. Behavior Research Methods & Instrumemtation,1978, 10, 141-153. (T)---
Taylor, G. A., Klitzke, D., & Massaro, D. W. Correlations
in software character generation. Behavior Methods &
Instrumentation, 1978, 10, 737-788. (b)
Taylor, M. M. & Creelman, C. D. PEST: Efficient estimates
of probability functions. Journal of the AcousticalSociety of America, 1967, 41, 782-787.
Travers, J. R., & Olivier, D. G. Pronounceability and
statistical "Englishness" as determinants of letter
identification. American Journal of Psychology, 1978,91, 523 -5'38.
Venezky, R. L., & Massaro, D. W. The role of orthographicregularity on word recognition. In L. Resnick & P.
Weaver (Eds.), Theory practice of early reading.Hillsdale, N. J.: Eribaum, 1979.
'Wheeler, D. D. Processes in word recognition. Cognitive
Psychology, 1970, 1, 59-85.
,-
98
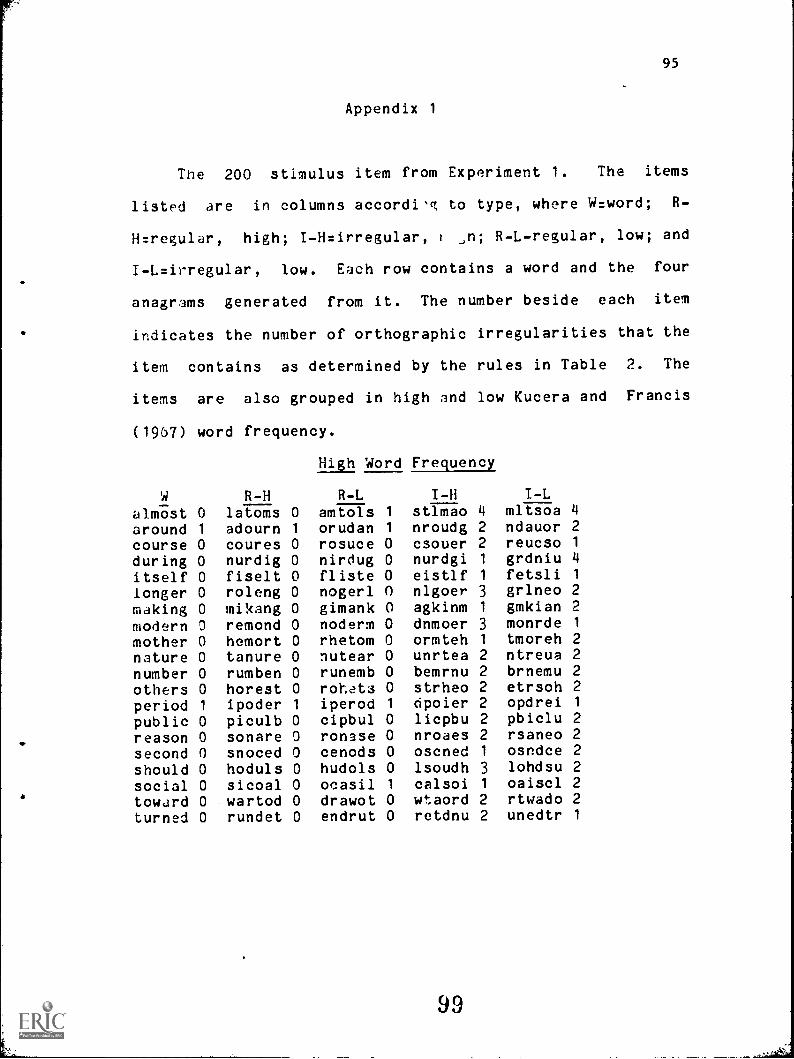
95
Appendix 1
The 200 stimulus item from Experiment 1. The items
listed are in columns accordi'c to type, where W.:word; R-
H= regular, high; I-H=irregular, t ,n; R-L-regular, low; and
I-L=irregular, low. Each row contains a word and the four
anagrams generated from it. The number beside each item
indicates the number of orthographic irregularities that the
item contains as determined by the rules in Table 2. The
items are also grouped in high and low Kucera and Francis
(1967) word frequency.
High Word Frequency
W
almost 0around 1
course 0during 0itself 0longer 0making 0modern 0mother 0nature 0number 0others 0period 1public 0reason 0second 0should 0social 0toward 0turned 0
R-Hlatoms 0adourn 1coures 0nurdig 0fiselt 0roleng 0mikang 0remond 0hemort 0tanure 0rumben 0horest 0ipoder 1
piculb 0sonare 0snoced 0hoduls 0sicoal 0wartod 0rundet 0
R-Lamtols 1
orudan 1rosuce 0nirdug 0fliste 0nogerl 0gimank 0noderm 0rhetom 0nutear 0runemb 0rohets 0iperod 1
cipbul 0ronase 0cenods 0hudols 0ocasil 1
drawot 0endrut 0
I-Hstlmao 4nroudg 2csouer 2nurdgi 1
eistlf 1nlgoer 3agkinm 1
dnmoer 3ormteh 1
unrtea 2bemrnu 2strheo 2cipoier 2licpbu 2nroaes 2oscned 1
lsoudh 3calsoi 1
wtaord 2retdnu 2
99
I-Lmltsoa 4ndauor 2reucso 1grdniu 4fetsli 1
grineo 2gmkian 2monrde 1
tmoreh 2ntreua 2brnemu 2etrsoh 2opdrei 1
pbiclu 2rsaneo 2osndce 2lohdsu 2oaiscl 2rtwado 2unedtr 1
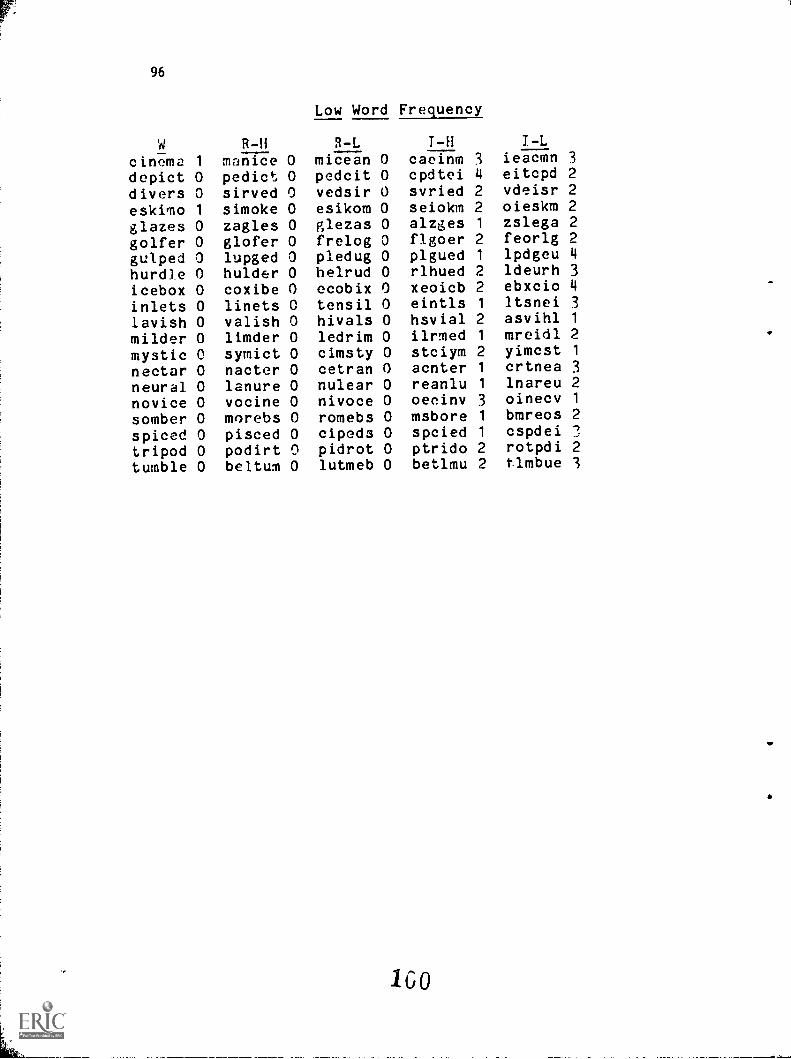
96
?i
cinema 1
depict 0divers 0eskimo 1
glazes 0golfer 0gulped 0hurdle 0icebox 0inlets 0lavish 0milder 0mystic 0nectar 0neural 0novice 0somber 0spiced 0tripod 0tumble 0
R-Hmanice 0pedict 0sirved 0simoke 0zagles 0glofer 0lupged 0hulder 0coxibe 0linets 0valish 0limder 0symict 0nacter 0lanure 0vocine 0morebs 0pisced 0podirt 0beltum 0
Low Word Frequency
R-Lmicean 0pedcit 0vedsir 0esikom 0glezas 0
frelog 0pledug 0
helrud 0ecobix 0
tonsil 0
hivals 0ledrim 0cimsty 0cetran 0nulear 0nivoce 0romebs 0cipeds 0pidrot 0lutmeb 0
T-Hcaeinm 3cpdtei 4svried 2seiokm 2alzges 1
flgoer 2plgued 1
rlhued 2xeoicb 2eintls 1
hsvial 2limed 1stciym 2acnter 1
reanlu 1
oeeinv 3msbore 1spcied 1
ptrido 2betlmu 2
I-Lieacmn 3eitcpd 2vdeisr 2oieskm 2zslega 2feorlg 21pdgeu 4ldeurh 3ebxcio 4ltsnei 3asvihl 1mreidl 2yimcst 1crtnea 3lnareu 2oinecv 1bmreos 2cspdeirotpdi 2tlmbue 3
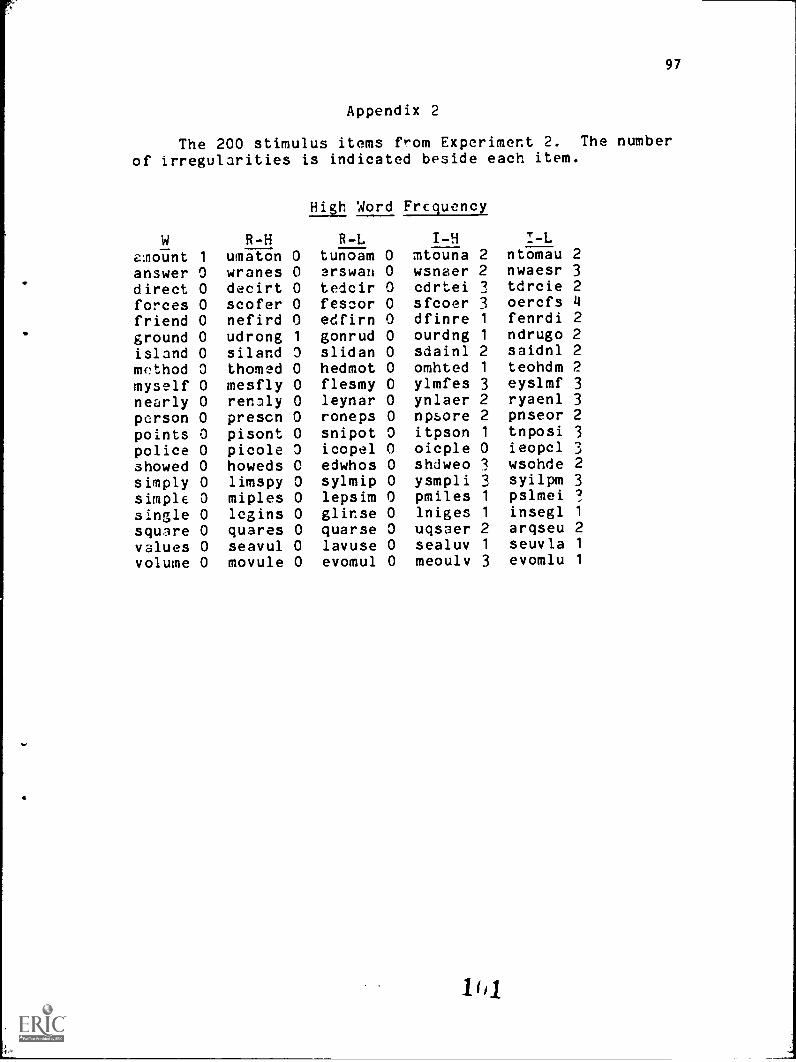
97
Appendix 2
The 200 stimulus items from Experiment 2. The numberof irregularities is indicated beside each item.
Wamount 1
answer 0direct 0forces 0friend 0ground 0island 0method 0myself 0nearly 0person 0points 0police 0showed 0simply 0simple 0single 0square 0values 0volume 0
R-Hutnaton 0wranes 0decirt 0scoter 0nefird 0udrong 1siland 0thorned 0mesfly 0renaly 0prescn 0pisont 0picole 0howeds 0limspy 0miples 0legins 0quares 0seavul 0movule 0
High Word Frequency
R-Ltunoamerswantedcirfeseoredfirngonrudslidanhedmotflesmyleynarronepssnipoticopeledwhossylmiplepsimglinsequarselavuseevomul
I-H I-L0 mtouna 2 ntomau 2
0 wsnaer 2 nwaesr 3
0 cdrtei 3 tdrcie 2
0 sfcoer 3 oercfs 4
0 dfinre 1 fenrdi 2
0 ourdng 1 ndrugo 2
0 sdainl 2 saidnl 2
0 omhted 1 teohdm 2
0 ylmfes 3 eyslmf 3
0 ynlaer 2 ryaenl 3
0 npsore 2 pnseor 2
0 itpson 1 tnposi 3
0 oicple 0 ieopcl 3
0 shdweo 3 wsohde 2
0 ysmpli 3 syilpm 3
0 pmiles 1 pslmei ?
0 lniges 1 insegl 1
0 uqsaer 2 arqseu 2
0 sealuv 1 seuvla 1
0 meoulv 3 evomlu 1
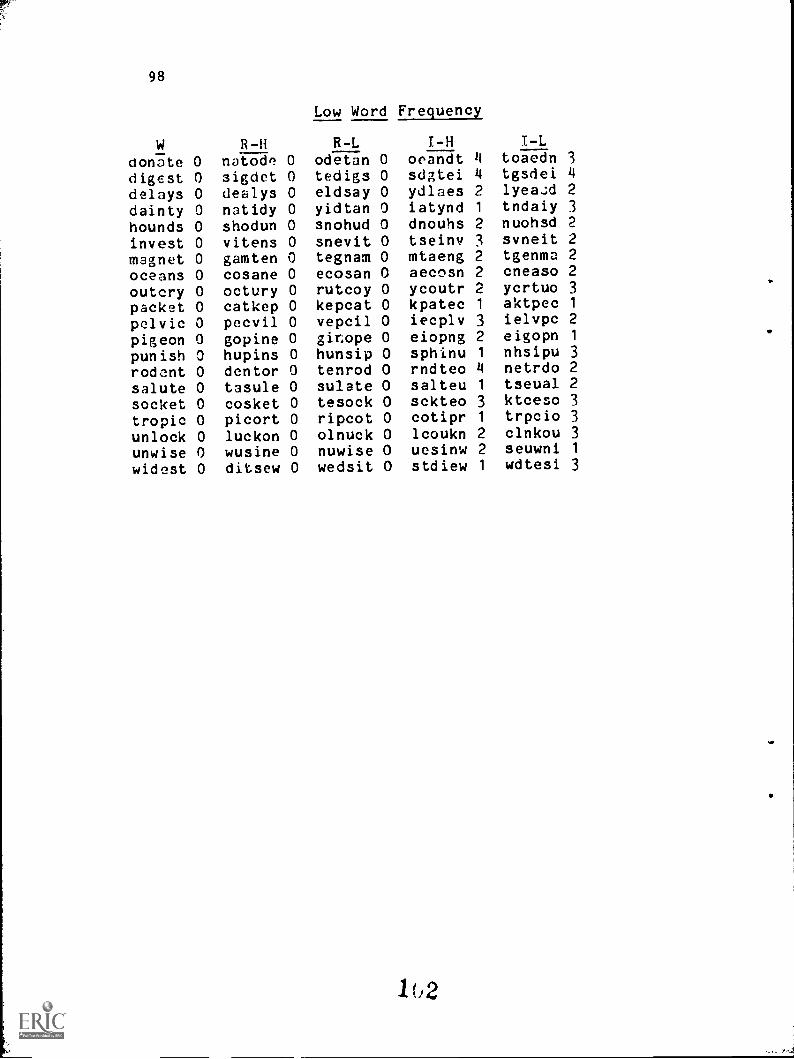
98
Wdonate 0digest 0delays 0dainty 0hounds 0invest 0magnet 0oceans 0outcry 0packet 0pelvic 0pigeon 0punish 0rodent 0salute 0socket 0tropic 0unlock 0unwise 0widest 0
R -H
natode 0sigdet 0dealys 0natidy 0shodun 0vitens 0gamten 0cosane 0octury 0catkep 0pecvil 0gopine 0hupins 0dentor 0tasule 0cosket 0picort 0luckon 0wusine 0ditsew 0
Low Word Frequency
R -L
odetan 0tedigs 0eldsay 0yidtan 0snohud 0snevit 0tegnam 0ecosan 0rutcoy 0kepcat 0vepcil 0ginope 0hunsip 0tenrod 0sulate 0tesock 0
ripcot 0
olnuck 0nuwise 0
wedsit 0
1-Hoeandt 4sdgtei 4ydlaes 2iatynd 1
dnouhs 2tseinv 3mtaeng 2aecosn 2ycoutr 2kpatec 1
iecplv 3eiopng 2sphinu 1
rndteo 4salteu 1
sckteo 3cotipr 1
lcoukn 2uesinw 2stdiew 1
I-Ltoacdn 3tgsdei 4lyeazd 2tndaiy 3nuohsd 2svneit 2tgenma 2cneaso 2ycrtuo 3aktpec 1ielvpc 2eigopn 1
nhsipu 3netrdo 2tseual 2ktceso 3trpcio 3clnkou 3seuwni 1
wdtesi 3
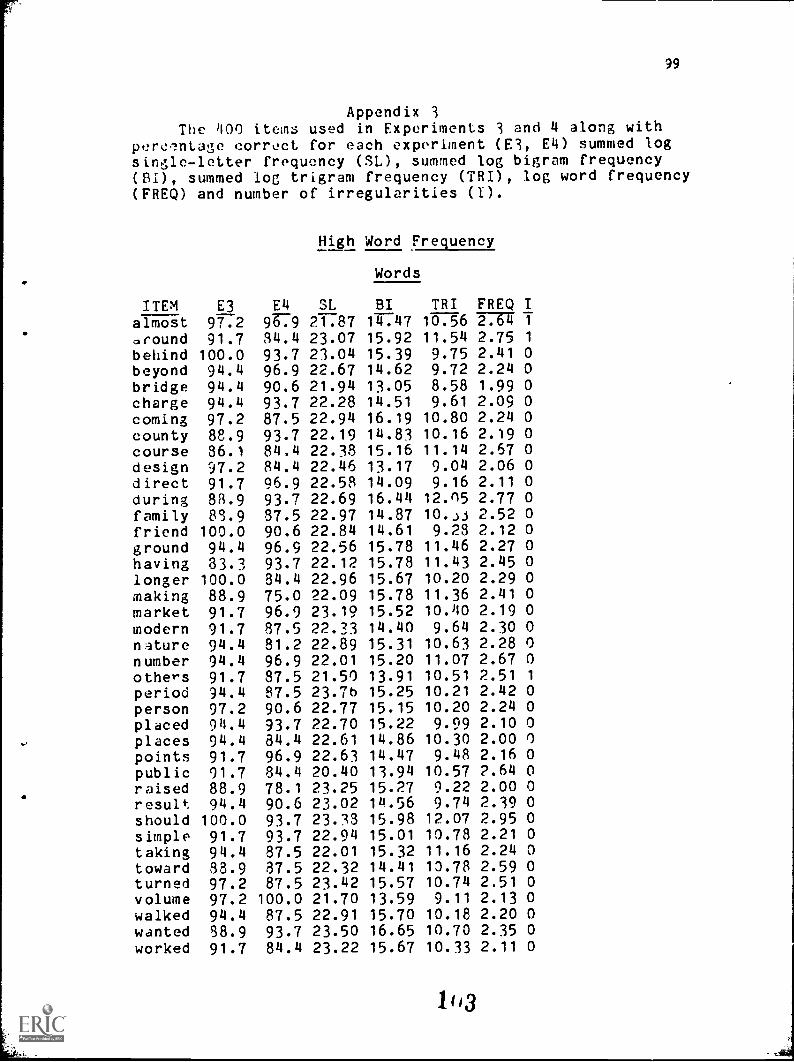
99
Appendix 3The 400 items used in Experiments 3 and 4 along with
pere -mtage correct for each experiment (Es, E4) summed logsingle-letter frequency (SL), summed log bigram frequency(BI), summed log trigram frequency (TRI), log word frequency(FREQ) and number of irregularities (I).
ITEM E3 E4
High
SL
Word Frequency
Words
TRI FREQ IBI
almost 97.2 9T.-9 21.87 14.47 10.56 22764 T
around 91.7 84.4 23.07 15.92 11.54 2.75 1
behind 100.0 93.7 23.04 15.39 9.75 2.41 0beyond 94.4 96.9 22.67 14.62 9.72 2.24 0bridge 94.4 90.6 21.94 13.05 8.58 1.99 0charge 94.4 93.7 22.28 14.51 9.61 2.09 0coming 97.2 87.5 22.94 16.19 10.80 2.24 0county 88.9 93.7 22.19 14.83 10.16 2.19 0course 36.1 84.4 22.38 15.16 11.14 2.57 0design 97.2 84.4 22.46 13.17 9.04 2.06 0direct 91.7 96.9 22.58 14.09 9.16 2.11 0during 83.9 93.7 22.69 16.44 12.n5 2.77 0family 88.9 87.5 22.97 14.87 10..5j 2.52 0friend 100.0 90.6 22.84 14.61 9.28 2.12 0ground 94.4 96.9 22.56 15.78 11.46 2.27 0having 33.3 93.7 22.12 15.78 11.43 2.45 0longer 100.0 84.4 22.96 15.67 10.20 2.29 0making 88.9 75.0 22.09 15.78 11.36 2.41 0market 91.7 96.9 23.19 15.52 10.40 2.19 0modern 91.7 87.5 22.33 14.40 9.64 2.30 0nature 94.4 81.2 22.89 15.31 10.63 2.28 0number 94.4 96.9 22.01 15.20 11.07 2.67 0others 91.7 87.5 21.50 13.91 10.51 2.51 1
period 94.4 87.5 23.76 15.25 10.21 2.42 0person 97.2 90.6 22.77 15.15 10.20 2.24 0placed 94.4 93.7 22.70 15.22 9.99 2.10 0places 94.4 84.4 22.61 14.86 10.30 2.00 0points 91.7 96.9 22.63 14.47 9.48 2.16 0public 91.7 84.4 20.40 13.94 10.57 2.64 0raised 88.9 78.1 23.25 15.27 9.22 2.00 0result 94.4 90.6 23.02 14.56 9.74 2.39 0should 100.0 93.7 23.33 15.98 12.07 2.95 0simple 91.7 93.7 22.94 15.01 10.78 2.21 0taking 94.4 87.5 22.01 15.32 11.16 2.24 0toward 88.9 87.5 22.32 14.41 10.78 2.59 0turned 97.2 87.5 23.42 15.57 10.74 2.51 0volume 97.2 100.0 21.70 13.59 9.11 2.13 0walked 94.4 87.5 22.91 15.70 10.18 2.20 0wanted 88.9 93.7 23.50 16.65 10.70 2.35 0worked 91.7 84.4 23.22 15.67 10.33 2.11 0
103
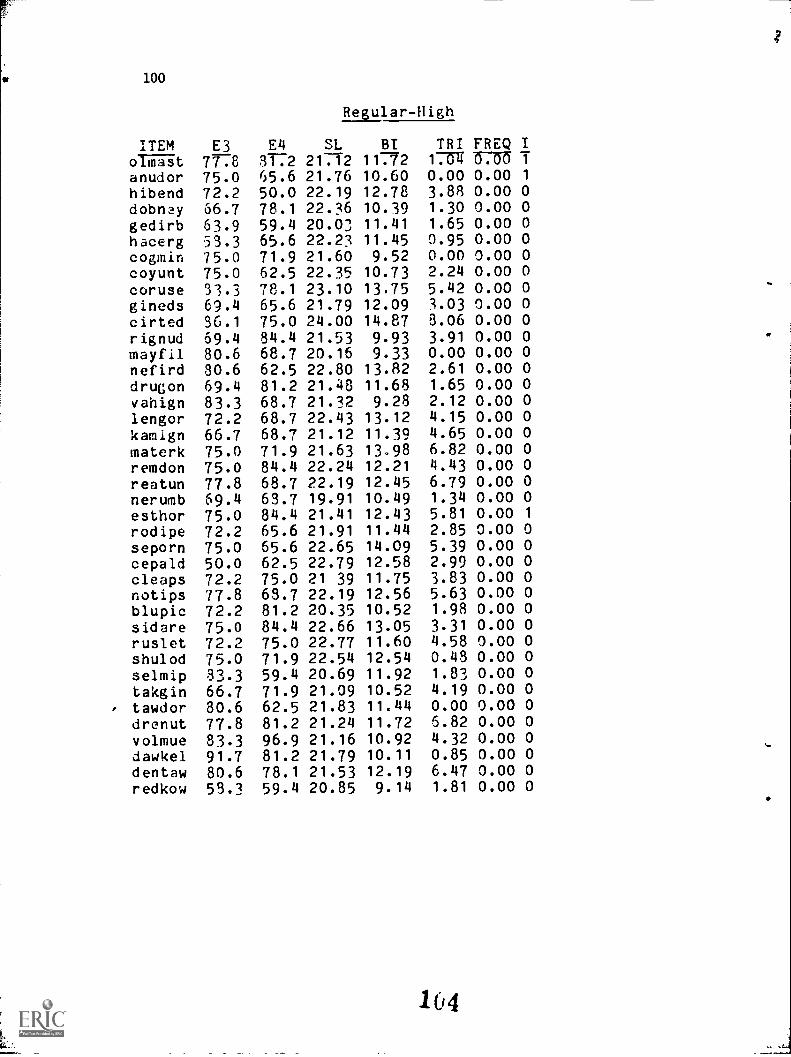
100
ITEM E3 E4
Regular-High
FREQ ISL BI TRIdriTit 77.8 3172 21712 11772 17r4 0.00 1
anudor 75.0 65.6 21.76 10.60 0.00 0.00 1
hibend 72.2 50.0 22.19 12.78 3.88 0.00 0
dobney 66.7 78.1 22.36 10.39 1.30 0.00 0
gedirb 63.9 59.4 20.03 11.41 1.65 0.00 0
hacerg 53.3 65.6 22.23 11.45 0.95 0.00 0
cogmin 75.0 71.9 21.60 9.52 0.00 0.00 0
coyunt 75.0 62.5 22.35 10.73 2.24 0.00 0
coruse 31.3 78.1 23.10 13,75 5.42 0.00 0
gineds 69.4 65.6 21.79 12.09 3.03 0.00 0
cirted 36.1 75.0 24.00 14.87 8.06 0.00 0
rignud 69.4 54.4 21.53 9.93 3.91 0.00 0
mayfil 80.6 68.7 20.16 9.33 0.00 0.00 0
nefird 80.6 62.5 22.80 13.82 2.61 0.00 0
drugon 69.4 81.2 21.48 11.68 1.65 0.00 0
vahign 83.3 68.7 21.32 9.28 2.12 0.00 0
lengor 72.2 68.7 22.43 13.12 4.15 0.00 0
kamign 66.7 68.7 21.12 11.39 4.65 0.00 0
materk 75.0 71.9 21.63 13.98 6.82 0.00 0
remdon 75.0 84.4 22.24 12.21 4.43 0.00 0
reatun 77.8 68.7 22.19 12.45 6.79 0.00 0
nerumb 69.4 63.7 19.91 10.49 1.34 0.00 0
esthor 75.0 84.4 21.41 12.43 5.81 0.00 1
rodipe 72.2 65.6 21.91 11.44 2.85 0.00 0
seporn 75.0 65.6 22.65 14.09 5.39 0.00 0
cepald 50.0 62.5 22.79 12.58 2.99 0.00 0
cleaps 72.2 75.0 21 39 11.75 3.83 0.00 0
notips 77.8 63.7 22.19 12.56 5.63 0.00 0
blupic 72.2 81.2 20.35 10.52 1.98 0.00 0
sidare 75.0 84.4 22.66 13.05 3.31 0.00 0
ruslet 72.2 75.0 22.77 11.60 4.58 0.00 0
shulod 75.0 71.9 22.54 12.54 0.43 0.00 0
selmip 83.3 59.4 20.69 11.92 1.83 0.00 0
takgin 66.7 71.9 21.09 10.52 4.19 0.00 0
tawdor 80.6 62.5 21.83 11.44 0.00 0.00 0
drenut 77.8 81.2 21.24 11.72 6.82 0.00 0
volmue 33.3 96.9 21.16 10.92 4.32 0.00 0
dawkel 91.7 81.2 21.79 10.11 0.85 0.00 0
dentaw 80.6 78.1 21.53 12.19 6.47 0.00 0
redkow 53.3 59.4 20.85 9.14 1.81 0.00 0
104
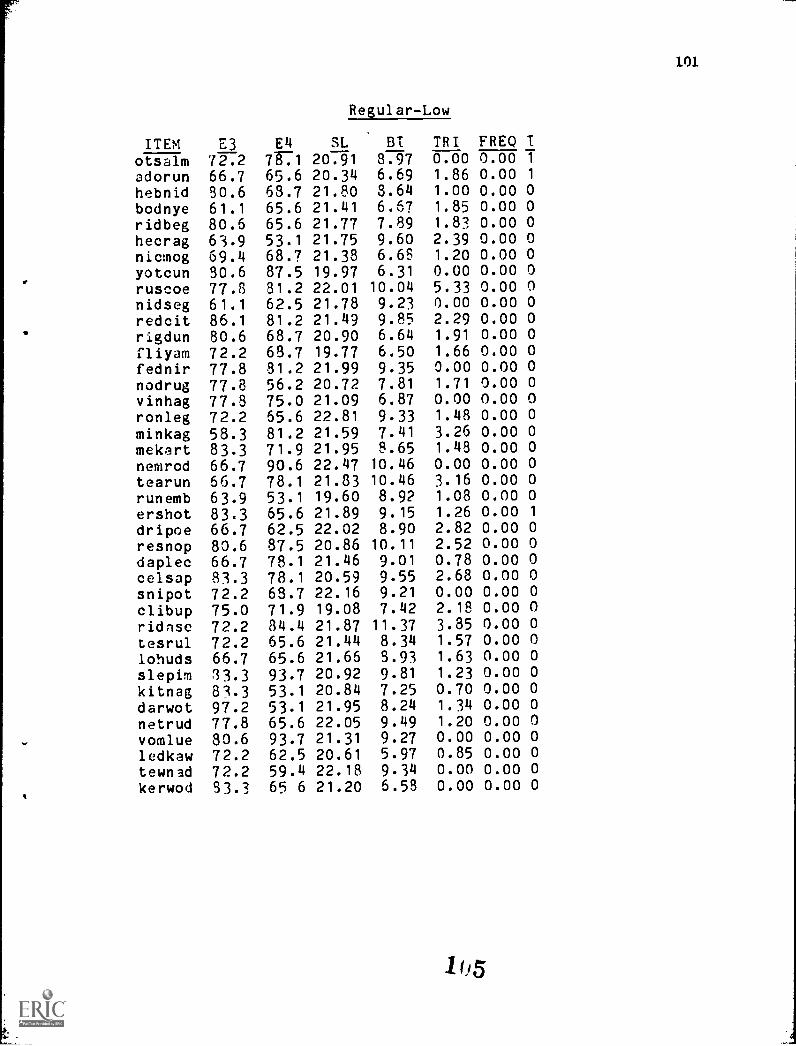
101
ITEM E3 E4
Regular-Low
FREQ ISI, III TRI
7T.-1 20.91 1otsalm 72.2 8.97 0.00 0.00adorun 66.7 65.6 20.34 6.69 1.86 0.00 1
hebnid 30.6 68.7 21.80 8.64 1.00 0.00 0
bodnye 61.1 65.6 21.41 6.67 1.85 0.00 0
ridbeg 80.6 65.6 21.77 7.89 1.83 0.00 0
hecrag 63.9 53.1 21.75 9.60 2.39 0.00 0
nicmog 69.4 68.7 21.38 6.65 1.20 0.00 0
yotcun 30.6 87.5 19.97 6.31 0.00 0.00 0
ruscoe 77.8 81.2 22.01 10.04 5.33 0.00 0
nidseg 61.1 62.5 21.78 9.23 0.00 0.00 0
redcit 86.1 81.2 21.49 9.85 2.29 0.00 0
rigdun 80.6 68.7 20.90 6.64 1.91 0.00 0
fliyam 72.2 68.7 19.77 6.50 1.66 0.00 0
fednir 77.8 31.2 21.99 9.35 0.00 0.00 0
nodrug 77.8 56.2 20.72 7.81 1.71 0.00 0
vinhag 77.8 75.0 21.09 6.87 0.00 0.00 0
ronleg 72.2 55.6 22.81 9.33 1.48 0.00 0
minkag 58.3 81.2 21.59 7.41 3.26 0.00 0
mekart 83.3 71.9 21.95 8.65 1.48 0.00 0
nemrod 66.7 90.6 22.47 10.46 0.00 0.00 0
tearun 66.7 78.1 21.83 10.46 3.16 0.00 0
runemb 63.9 53.1 19.60 8.92 1.08 0.00 0
ershot 83.3 65.6 21.89 9.15 1.26 0.00 1
dripoe 66.7 62.5 22.02 8.90 2.82 0.00 0
resnop 80.6 87.5 20.86 10.11 2.52 0.00 0
daplec 66.7 78.1 21.46 9.01 0.78 0.00 0
celsap 83.3 78.1 20.59 9.55 2.68 0.00 0
snipot 72.2 68.7 22.16 9.21 0.00 0.00 0
clibup 75.0 71.9 19.08 7.42 2.18 0.00 0
ridnse 72.2 84.4 21.87 11.37 3.35 0.00 0
tesrul 72.2 65.6 21.44 8.34 1.57 0.00 0
lohuds 66.7 65.6 21.65 3.93 1.63 0.00 0
slepim 33.3 93.7 20.92 9.81 1.23 0.00 0
kitnag 83.3 53.1 20.84 7.25 0.70 0.00 0
darwot 97.2 53.1 21.95 8.24 1.34 0.00 0
netrud 77.8 65.6 22.05 9.49 1.20 0.00 0
vomlue 80.6 93.7 21.31 9.27 0.00 0.00 0
ledkaw 72.2 62.5 20.61 5.97 0.85 0.00 0
tewnad 72.2 59.4 22.18 9.34 0.00 0.00 0
kerwod 53.3 65 6 21.20 6.58 0.00 0.00 0
11)5
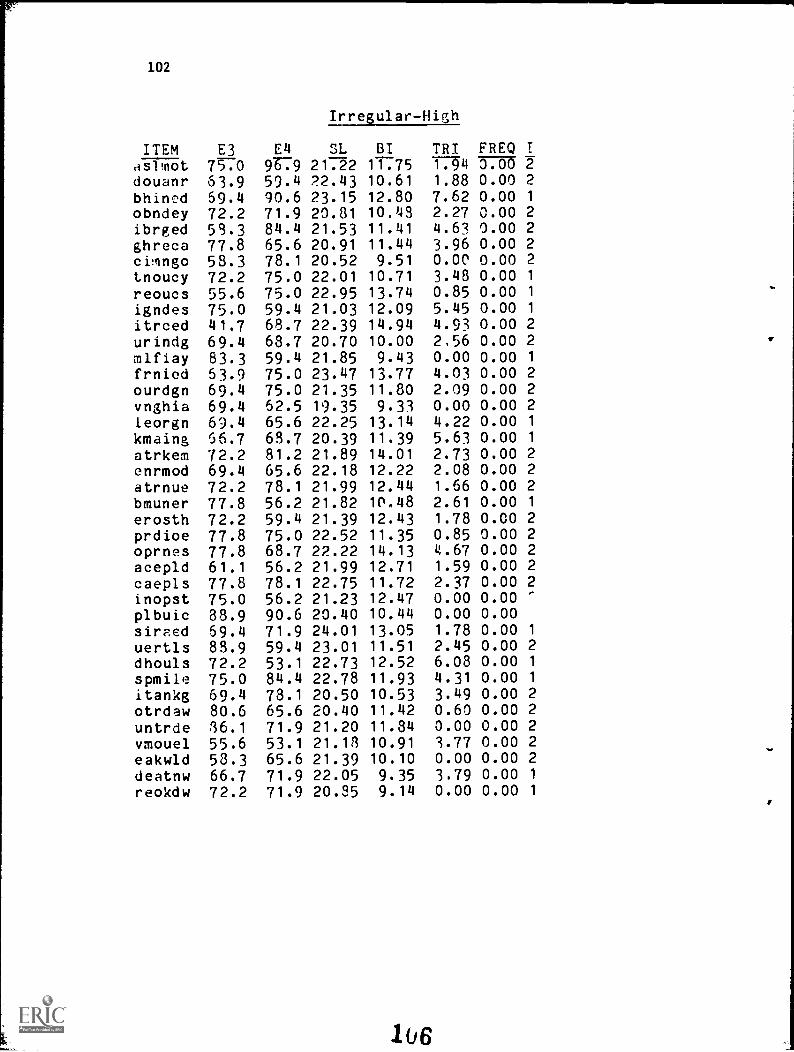
102
ITEM E3 E4
Irregular-High
ISL BI TRI EREQaslmot 75.0 9T79 21.22 11.75 T74 3.00douanr 63.9 59.4 22.43 10.61 1.88 0.00 2
bhined 59.4 90.6 23.15 12.80 7.62 0.00 1
obndey 72.2 71.9 20.81 10.43 2.27 0.00 2
ibrged 59.3 84.4 21.53 11.41 4.61 0.00 2
ghreca 77.8 65.6 20.91 11.44 3.96 0.00 2
cimngo 58.3 78.1 20.52 9.51 0.00 0.00 2
tnoucy 72.2 75.0 22.01 10.71 3.48 0.00 1
reoucs 55.6 75.0 22.95 13.74 0.85 0.00 1
igndes 75.0 59.4 21.03 12.09 5.45 0.00 1
itrced 41.7 68.7 22.39 14.94 4.93 0.00 2
urindg 69.4 68.7 20.70 10.00 2,56 0.00 2
mlfiay 83.3 59.4 21.85 9.43 0.00 0.00 1
frnied 53.9 75.0 23.47 13.77 4.03 0.00 2
ourdgn 69.4 75.0 21.35 11.80 2.09 0.00 2
vnghia 69.4 52.5 1,3.35 9.33 0.00 0.00 2
leorgn 69.4 65.6 22.25 13.14 4.22 0.00 1
kmaing 56.7 68.7 20.39 11.39 5.63 0.00 1
atrkem 72.2 81.2 21.89 14.01 2.73 0.00 2
enrmod 69.4 65.6 22.18 12.22 2.08 0.00 2
atrnue 72.2 78.1 21.99 12.44 1.56 0.00 2
bmuner 77.8 56.2 21.82 10.48 2.61 0.00 1
erosth 72.2 59.4 21.39 12.43 1.78 0.00 2
prdioe 77.8 75.0 22.52 11.35 0.85 0.00 2
oprnes 77.8 68.7 22.22 14.13 4.67 0.00 2
acepld 61.1 56.2 21.99 12.71 1.59 0.00 2
caepls 77.8 78.1 22.75 11.72 2.37 0.00 2
inopst 75.0 56.2 21.23 12.47 0.00 0.00pibuic 88.9 90.6 20.40 10.44 0.00 0.00siraed 59.4 71.9 24.01 13.05 1.78 0.00 1
uertls 83.9 59.4 23.01 11.51 2.45 0.00 2
dhouls 72.2 53.1 22.73 12.52 6.08 0.00 1
spmile 75.0 84.4 22.78 11.93 4.31 0.00 1
itankg 59.4 78.1 20.50 10.53 3.49 0.00 2
otrdaw 80.6 65.6 20.40 11.42 0.60 0.00 2
untrde 36.1 71.9 21.20 11.84 0.00 0.00 2
vmouel 55.6 53.1 21.13 10.91 3.77 0.00 2
eakwld 53.3 65.6 21.39 10.10 0.00 0.00 2
deatnw 66.7 71.9 22.05 9.35 3.79 0.00 1
reokdw 72.2 71.9 20.35 9.14 0.00 0.00 1
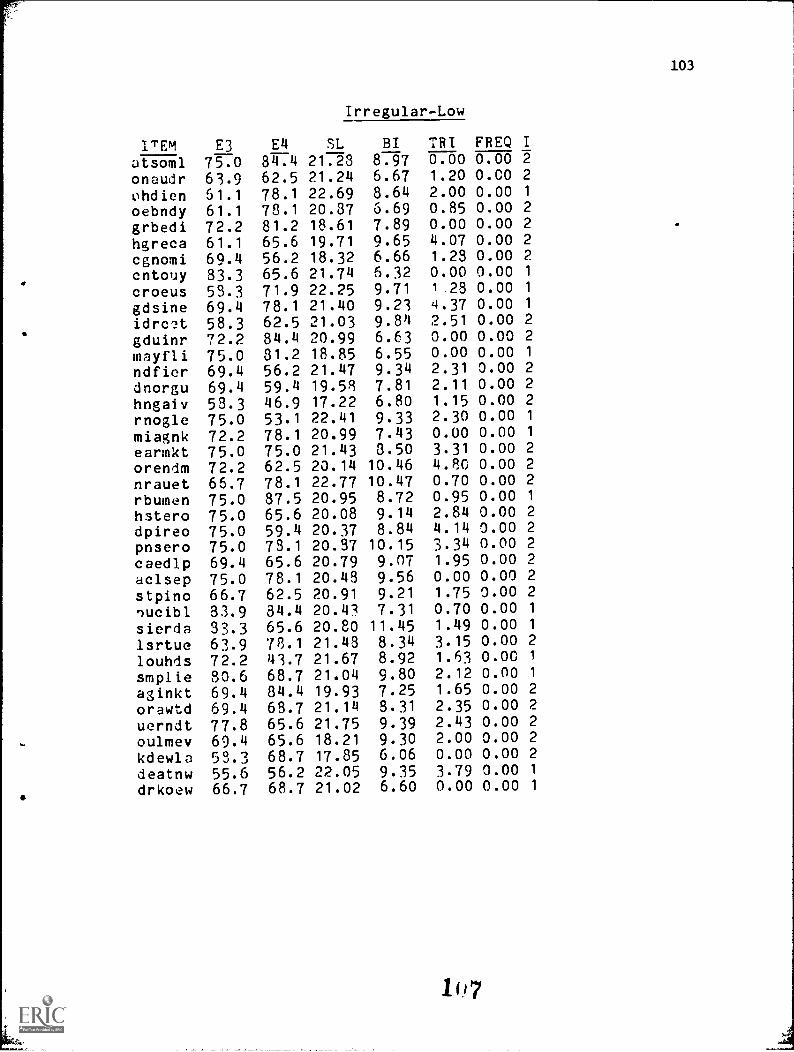
ITEMatsomlonaudrohdienoebndygrbedihgrecacgnomicntouycroeusgdsineidrcltgduinrmayflindfierdnorguhngaivrnoglemiagnkearmktorendmnrauetrbumenhsterodpireopnserocaedlpaclsepstpino',uciblsierdaIsrtuelouhdssmplieaginktorawtduerndtoulmevkdewladeatnwdrkoew
E3 E4
Irregular-Low
FREQ ISL BI ;RI
75.0 84.4 21.23 8.97 0.00 0.00 2
63.9 62.5 21.24 6.67 1.20 0.00 2
61.1 78.1 22.69 8.64 2.00 0.00 1
61.1 73.1 20.87 6.69 0.85 0.00 2
72.2 81.2 18.61 7.89 0.00 0.00 2
61.1 65.6 19.71 9.65 4.07 0.00 2
69.4 56.2 18.32 6.66 1.28 0.00 2
83.3 65.6 21.74 6.32 0.00 0.00 1
53.3 71.9 22.25 9.71 1 28 0.00 1
69.4 78.1 21.40 9.23 4.37 0.00 1
58.3 62.5 21.03 9.34 2.51 0.00 2
72.2 84.4 20.99 6.63 0.00 0.00 2
75.0 31.2 18.85 6.55 0.00 0.00 1
69.4 56.2 21.47 9.34 2.31 0.00 2
69.4 59.4 19.58 7.81 2.11 0.00 2
58.3 46.9 17.22 6.80 1.15 0.00 2
75.0 53.1 22.41 9.33 2.30 0.00 1
72.2 78.1 20.99 7.43 0.00 0.00 1
75.0 75.0 21.43 3.50 3.31 0.00 2
72.2 62.5 20.14 10.46 4.80 0.00 2
65.7 78.1 22.77 10.47 0.70 0.00 2
75.0 87.5 20.95 8.72 0.95 0.00 1
75.0 65.6 20.08 9.14 2.84 0.00 2
75.0 59.4 20.37 8.84 4.14 0.00 2
75.0 78.1 20.37 10.15 3.34 0.00 2
69.4 65.6 20.79 9.07 1.95 0.00 2
75.0 78.1 20.48 9.56 0.00 0.00 2
66.7 62.5 20.91 9.21 1.75 0.00 2
83.9 84.4 20.43 7.31 0.70 0.00 1
33.3 65.6 20.80 11.45 1.49 0.00 1
63.9 713.1 21.48 8.34 3.15 0.00 2
72.2 43.7 21.67 8.92 1.63 0.00 1
80.6 68.7 21.04 9.80 2.12 0.00 1
69.4 84.4 19.93 7.25 1.65 0.00 2
69.4 68.7 21.14 8.31 2.35 0.00 2
77.8 65.6 21.75 9.39 2.43 0.00 2
69.4 65.6 18.21 9.30 2.00 0.00 2
58.3 68.7 17.85 6.06 0.00 0.00 2
55.6 56.2 22.05 9.35 3.79 0.00 1
66.7 68.7 21.02 6.60 0.00 0.00 1
107
103
.
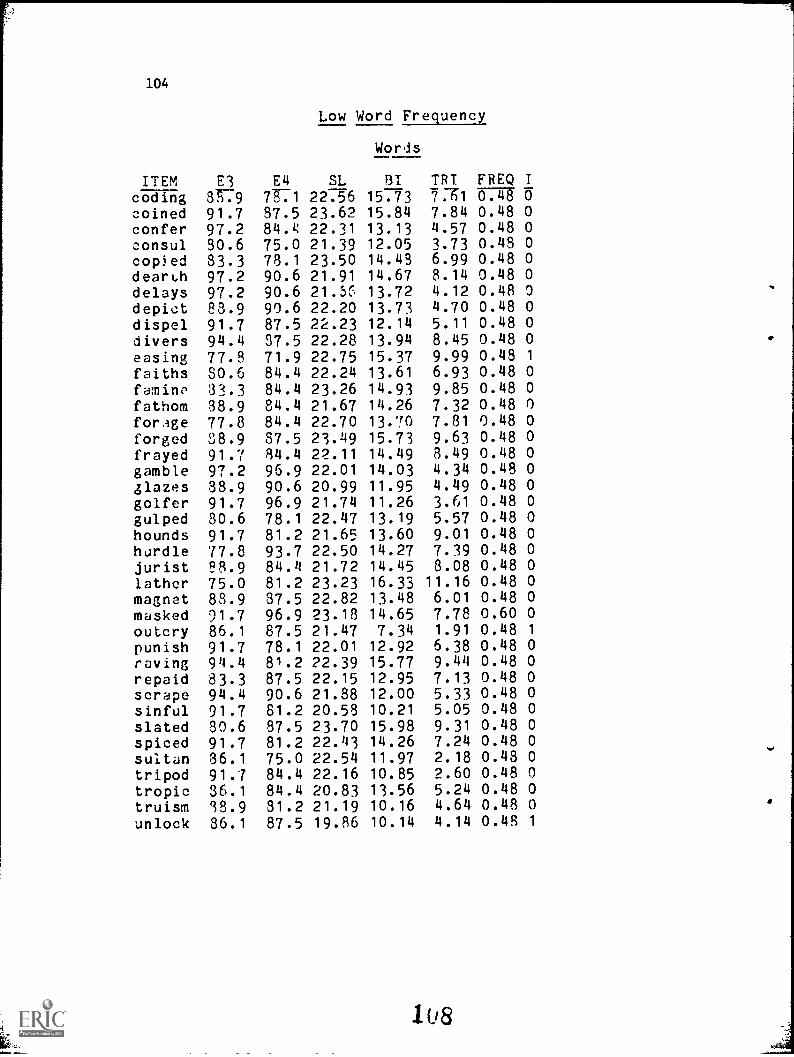
104
ITEM E3 E4
Low Word Frequency
ISL
Words
TRI FREQBTcoding 8;79 7771 22.56 15.73 771 1574 8 Ucoined 91.7 87.5 23.62 15.84 7.84 0.48 0
confer 97.2 84.4 22.31 13.13 4.57 0.48 0
consul 30.6 75.0 21.39 12.05 3.73 0.48 0
copjed 83.3 78.1 23.50 14.43 6.99 0.48 0
dearth 97.2 90.6 21.91 14.67 8.14 0.48 0
delays 97.2 90.6 21.5C 13.72 4.12 0.48 0
depict 83.9 90.6 22.20 13.73 4.70 0.48 0
dispel 91.7 87.5 22.23 12.14 5.11 0.48 0
divers 94.4 87.5 22.28 13.94 8.45 0.48 0
easing 77.8 71.9 22.75 15.37 9.99 0.43 1
faiths 30.6 84.4 22.24 13.61 6.93 0.48 0
famine 33.3 84.4 23.26 14.93 9.85 0.48 0
fathom 38.9 54.4 21.67 14.26 7.32 0.48 0
forage 77.8 84.4 22.70 13.70 7.81 0.48 0
forged 88.9 87.5 23.49 15.73 9.63 0.48 0
frayed 91.7 84.4 22.11 14.49 8.49 0.48 0
gamble 97.2 96.9 22.01 14.03 4.34 0.48 0
glazes 38.9 90.6 20.99 11.95 4.49 0.48 0
golfer 91.7 96.9 21.74 11.26 3.61 0.48 0
gulped 80.6 78.1 22.47 13.19 5.57 0.48 0
hounds 91.7 81.2 21.65 13.60 9.01 0.48 0
hurdle 77.8 93.7 22.50 14.27 7.39 0.48 0
jurist 98.9 84.4 21.72 14.45 8.08 0.48 0
lather 75.0 81.2 23.23 16.33 11.16 0.48 0
magnet 88.9 37.5 22.82 13.48 6.01 0.48 0
masked 91.7 96.9 23.18 14.65 7.78 0.60 0
outcry 86.1 87.5 21.47 7.34 1.91 0.48 1
punish 91.7 78.1 22.01 12.92 6.38 0.48 0
raving 94.4 81.2 22.39 15.77 9.44 0.48 0
repaid 83.3 87.5 22.15 12.95 7.13 0.48 0
scrape 94.4 90.6 21.88 12.00 5.33 0.48 0
sinful 91.7 81.2 20.58 10.21 5.05 0.48 0
slated 80.6 87.5 23.70 15.98 9.31 0.48 0
spiced 91.7 81.2 22.'13 14.26 7.24 0.48 0
sultan 36.1 75.0 22.54 11.97 2.18 0.48 0
tripod 91.7 84.4 22.16 10.85 2.60 0.48 0
tropic 36.1 84.4 20.83 13.56 5.24 0.48 0
truism 18.9 31.2 21.19 10.16 4.64 0.48 0
unlock 86.1 87.5 19.86 10.14 4.14 0.48 1
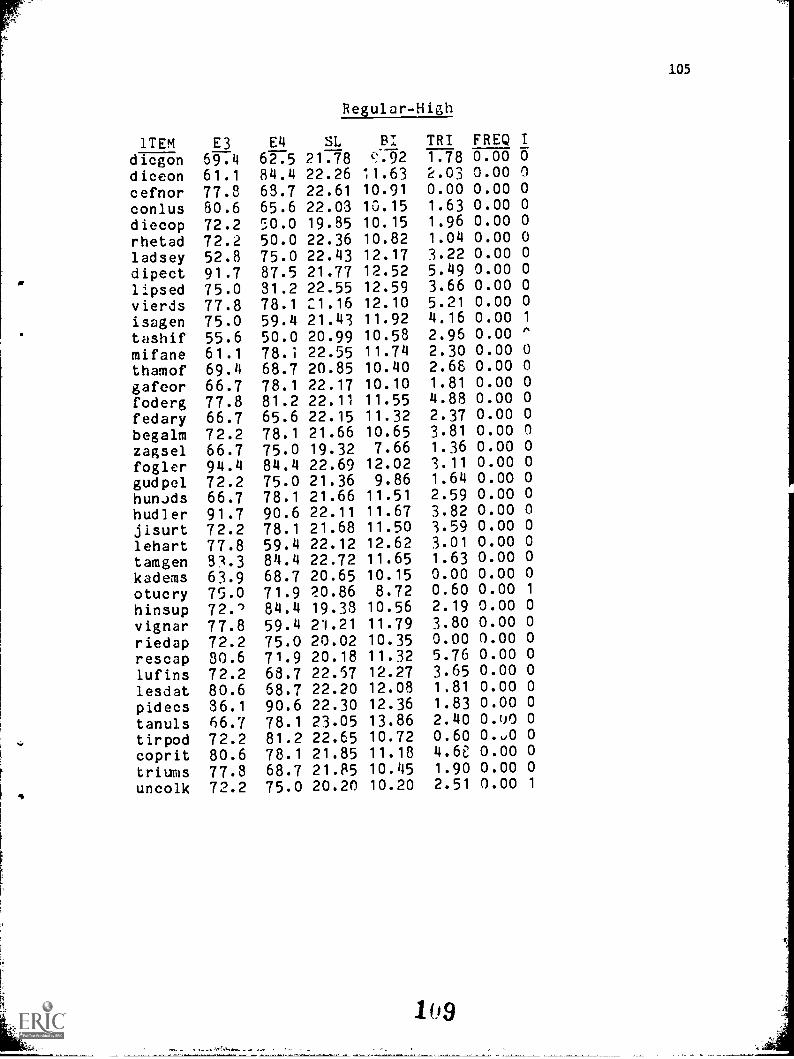
ITEMdicgondiceoncefnorconlusdiecoprhetadladseydipectlipsedvierdsisagentashifmifanethamofgafcorfodergfedarybegalmzagselfoglergudpelhunJelshudlerjisurtleharttamgenkademsotucryhinsupvignarriedaprescaplufinslesdatpidecstanulstirpodcoprittriumsuncolk
E3 E4
Regular-High
FREQ ISL AI TRI
69.4 62.5 21.78 c;.72 1.78 0.00 0
61.1 84.4 22.26 11.63 2.03 0.00 0
77.8 63.7 22.61 10.91 0.00 0.00 0
80.6 65.6 22.03 10.15 1.63 0.00 0
72.2 50.0 19.85 10.15 1.96 0.00 0
72.2 50.0 22.36 10.82 1.04 0.00 0
52.8 75.0 22.43 12.17 3.22 0.00 0
91.7 87.5 21.77 12.52 5.49 0.00 0
75.0 31.2 22.55 12.59 3.66 0.00 0
77.8 78.1 21.16 12.10 5.21 0.00 0
75.0 59.4 21.43 11.92 4.16 0.00 1
55.6 50.0 20.99 10.58 2.95 0.00
61.1 78.i 22.55 11.74 2.30 0.00 0
69.4 68.7 20.85 10.40 2.68 0.00 0
66.7 78.1 22.17 10.10 1.81 0.00 0
77.8 81.2 22.11 11.55 4.88 0.00 0
66.7 65.6 22.15 11.32 2.37 0.00 0
72.2 78.1 21.66 10.65 3.81 0.00 0
66.7 75.0 19.32 7.66 1.36 0.00 0
94.4 84.4 22.69 12.02 3.11 0.00 0
72.2 75.0 21.36 9.86 1.64 0.00 0
66.7 78.1 21.66 11.51 2.59 0.00 0
91.7 90.6 22.11 11.67 3.82 0.00 0
72.2 78.1 21.68 11.50 3.59 0.00 0
77.8 59.4 22.12 12.62 3.01 0.00 0
83.3 84.4 22.72 11.65 1.63 0.00 0
63.9 68.7 20.65 10.15 0.00 0.00 0
75.0 71.9 20.86 8.72 0.60 0.00 1
72.1 84.4 19.33 10.56 2.19 0.00 0
77.8 59.4 21.21 11.79 3.80 0.00 0
72.2 75.0 20.02 10.35 0.00 0.00 0
80.6 71.9 20.18 11.32 5.76 0.00 0
72.2 68.7 22.57 12.27 3.65 0.00 0
80.6 68.7 22.20 12.08 1.81 0.00 0
36.1 90.6 22.30 12.36 1.83 0.00 0
66.7 78.1 23.05 13.86 2.40 0.u0 0
72.2 81.2 22.65 10.72 0.60 0...0 0
80.6 78.1 21.85 11.18 4.6E 0.00 0
77.8 68.7 21.85 10.45 1.90 0.00 0
72.2 75.0 20.20 10.20 2.51 0.00 1
109
105
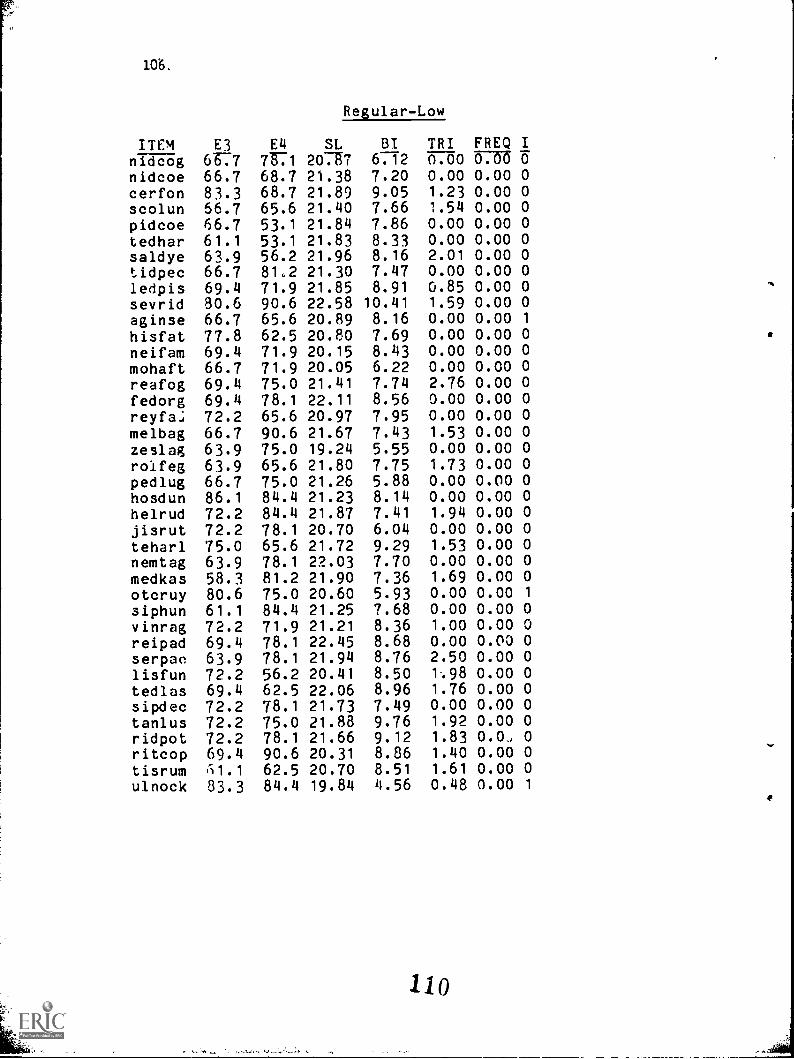
ITEM E3 E4
Regular-Low
FREQ ISL BI TRInidcog 6077 7071 2077 6.12 0.00 0.00 0
nidcoe 66.7 68.7 21.38 7.20 0.00 0.00 0
cerfon 83.3 68.7 21.89 9.05 1.23 0.00 0
scolun 56.7 65.6 21.40 7.66 1.54 0.00 0
pidcoe 66.7 53.1 21.84 7.86 0.00 0.00 0
tedhar 61.1 53.1 21.83 8.33 0.00 0.00 0
saldye 63.9 56.2 21.96 8.16 2.01 0.00 0
tidpec 66.7 81,2 21.30 7.47 0.00 0.00 0
ledpis 69.4 71.9 21.85 8.91 0.85 0.00 0
sevrid 80.6 90.6 22.58 10.41 1.59 0.00 0
aginse 66.7 65.6 20.89 8.16 0.00 0.00 1
hisfat 77.8 62.5 20.80 7.69 0.00 0.00 0
neifam 69.4 71.9 20.15 8.43 0.00 0.00 0
mohaft 66.7 71.9 20.05 6.22 0.00 0.00 0
reafog 69.4 75.0 21.41 7.74 2.76 0.00 0
fedorg 69.4 78.1 22.11 8.56 0.00 0.00 0
reyfa.: 72.2 65.6 20.97 7.95 0.00 0.00 0
melbag 66.7 90.6 21.67 7.43 1.53 0.00 0
zeslag 63.9 75.0 19.24 5.55 0.00 0.00 0
roifeg 63.9 65.6 21.80 7.75 1.73 0.00 0
pedlug 66.7 75.0 21.26 5.88 0.00 0.00 0
hosdun 86.1 84.4 21.23 8.14 0.00 0.00 0
helrud 72.2 84.4 21.87 7.41 1.94 0.00 0
jisrut 72.2 78.1 20.70 6.04 0.00 0.00 0
teharl 75.0 65.6 21.72 9.29 1.53 0.00 0
nemtag 63.9 78.1 22.03 7.70 0.00 0.00 0
medkas 58.3 81.2 21.90 7.36 1.69 0.00 0
otcruy 80.6 75.0 20.60 5.93 0.00 0.00 1
siphun 61.1 84.4 21.25 7.68 0.00 0.00 0
vinrag 72.2 71.9 21.21 8.36 1.00 0.00 0
reipad 69.4 78.1 22.45 8.68 0.00 0.00 0
serpac 63.9 78.1 21.94 8.76 2.50 0.00 0
lisfun 72.2 56.2 20.41 8.50 1.98 0.00 0
tedlas 69.4 62.5 22.06 8.96 1.76 0.00 0
sipdec 72.2 78.1 21.73 7.49 0.00 0.00 0
tanlus 72.2 75.0 21.88 9.76 1.92 0.00 0
ridpot 72.2 78.1 21.66 9.12 1.83 0.0, 0
ritcop 69.4 90.6 20.31 8.86 1.40 0.00 0
tisrum 61.1 62.5 20.70 8.51 1.61 0.00 0
ulnock 83.3 84.4 19.84 4.56 0.48 0.00 1
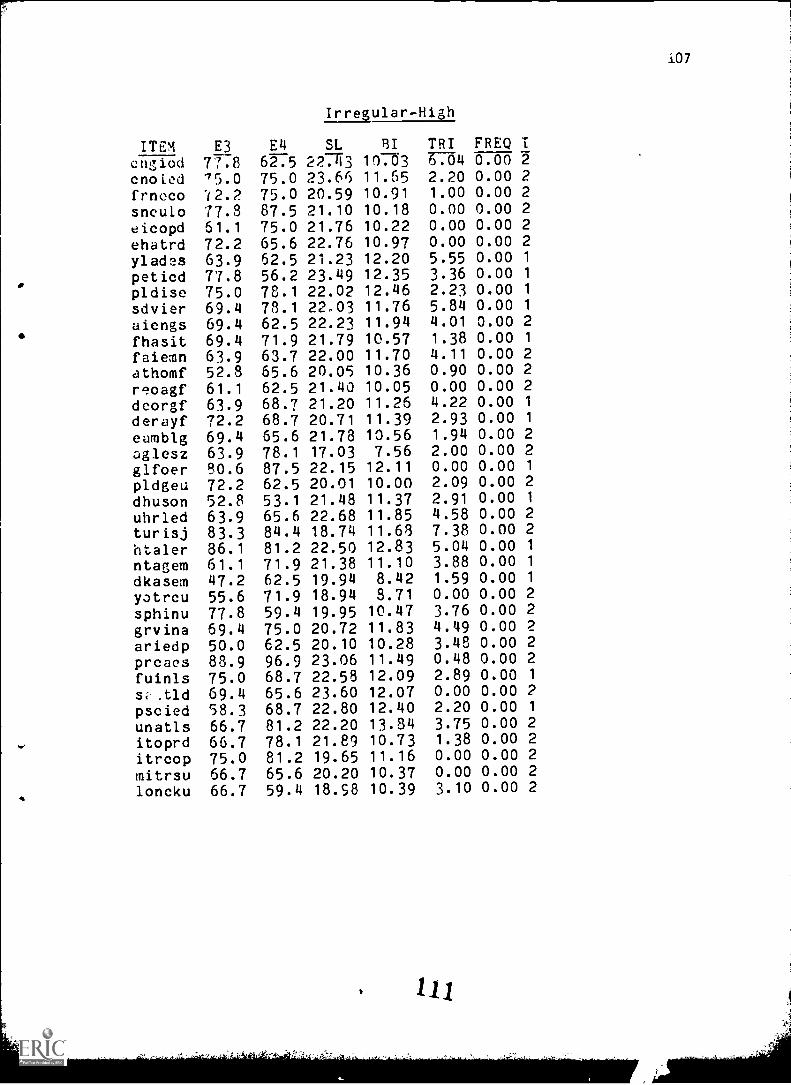
ITEM E3 E4
Irregular-High
FREQ I-ff
SL BI TRIcngiod 77.8 62.5 22.43 10.03 7764 0.00cnoied 75.0 75.0 23.6'5 11.65 2.20 0.00 2frneco 72.2 75.0 20.59 10.91 1.00 0.00 2
snculo 77.8 87.5 21.10 10.18 0.00 0.00 2eicopd 51.1 75.0 21.76 10.22 0.00 0.00 2
ehatrd 72.2 65.6 22.76 10.97 0.00 0.00 2ylades 63.9 52.5 21.23 12.20 5.55 0.00 1
peticd 77.8 56.2 23.49 12.35 3.36 0.00 1
pldise 75.0 78.1 22.02 12.46 2.23 0.00 1
sdvier 69.4 78.1 22.03 11.76 5.84 0.00 1
aiengs 69.4 62.5 22.23 11.94 4.01 0.00 2
fhasit 69.4 71.9 21.79 10.57 1.38 0.00 1
faiemn 63.9 63.7 22.00 11.70 4.11 0.00 2athomf 52.8 65.6 20.05 10.36 0.90 0.00 2
reoagf 61.1 62.5 21.40 10.05 0.00 0.00 2dcorgf 63.9 68.7 21.20 11.26 4.22 0.00 1
derayf 72.2 68.7 20.71 11.39 2.93 0.00 1
eamblg 69.4 65.6 21.78 10.56 1.94 0.00 2aglesz 63.9 78.1 17.03 7.56 2.00 0.00 2glfoer 80.6 87.5 22.15 12.11 0.00 0.00 1
pldgeu 72.2 62.5 20.01 10.00 2.09 0.00 2
dhuson 52.8 53.1 21.48 11.37 2.91 0.00 1
uhrled 63.9 65.6 22.68 11.85 4.58 0.00 2
turisj 83.3 84.4 18.74 11.68 7.38 0.00 2
haler 86.1 81.2 22.50 12.83 5.04 0.00 1
ntagem 61.1 71.9 21.38 11.10 3.88 0.00 1
dkasem 47.2 62.5 19.94 8.42 1.59 0.00 1
yatrcu 55.6 71.9 18.94 3.71 0.00 0.00 2
sphinu 77.8 59.4 19.95 10.47 3.76 0.00 2
grvina 69.4 75.0 20.72 11.83 4.49 0.00 2ariedp 50.0 62.5 20.10 10.28 3.48 0.00 2prcaes 88.9 96.9 23.06 11.49 0.48 0.00 2fuinls 75.0 68.7 22.58 12.09 2.89 0.00 1
s.t1c1 69.4 65.6 23.60 12.07 0.00 0.00 2
pscied 58.3 68.7 22.80 12.40 2.20 0.00 1
unatis 66.7 81.2 22.20 13.84 3.75 0.00 2
itoprd 66.7 78.1 21.89 10.73 1.38 0.00 2
itrcop 75.0 81.2 19.65 11.16 0.00 0.00 2
mitrsu 66.7 65.6 20.20 10.37 0.00 0.00 2
loncku 66.7 59.4 18.S8 10.39 3.10 0.00 2
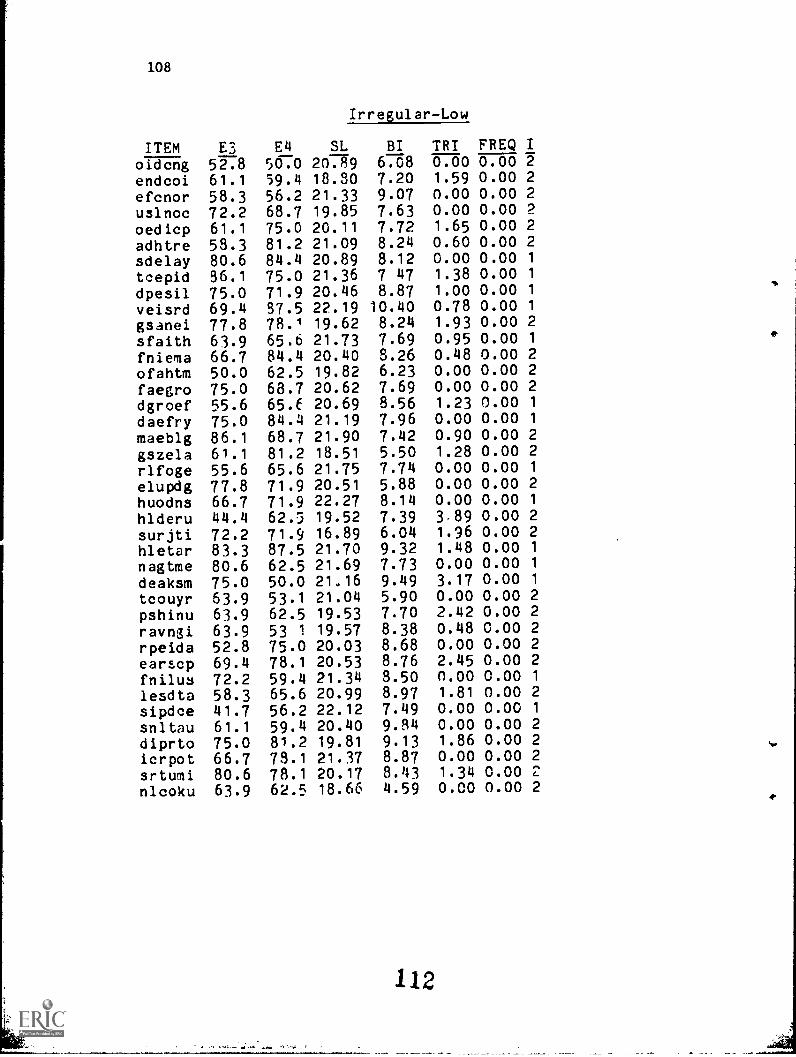
108
ITEM E3 E4
Irregular-Low
FREQ ISL BI TRI50.0 2079 6.08 2oidcng 52.8 0.00 0.00
endcoi 61.1 59.4 18.80 7.20 1.59 0.00 2
efcnor 58.3 56.2 21.33 9.07 0.00 0.00 2
uslnoc 72.2 68.7 19.85 7.63 0.00 0.00 2
oedicp 61.1 75.0 20.11 7.72 1.65 0.00 2
adhtre 58.3 81.2 21.09 8.24 0.60 0.00 2
sdelay 80.6 84.4 20.89 8.12 0.00 0.00 1
tcepid 96.1 75.0 21.36 7 47 1.38 0.00 1
dpesil 75.0 71.9 20.46 8.87 1.00 0.00 1
veisrd 69.4 87.5 22.19 10.40 0.78 0.00 1
gsanei 77.8 78.1 19.62 8.24 1.93 0.00 2
sfaith 63.9 65,6 21.73 7.69 0.95 0.00 1
fniema 66.7 84.4 20.40 8.26 0.48 0.00 2
ofahtm 50.0 62.5 19.82 6.23 0.00 0.00 2
faegro 75.0 68.7 20.62 7.69 0.00 0.00 2
dgroef 55.6 65.f 20.69 8.56 1.23 0.00 1
daefry 75.0 84.4 21.19 7.96 0.00 0.00 1
maeblg 86.1 68.7 21.90 7.42 0.90 0.00 2
gszela 61.1 81.2 18.51 5.50 1.28 0.00 2
rlfoge 55.6 65.6 21.75 7.74 0.00 0.00 1
elupdg 77.8 71.9 20.51 5.88 0.00 0.00 2
huodns 66.7 71.9 22.27 8.14 0.00 0.00 1
hlderu 44.4 62.5 19.52 7.39 3.89 0.00 2
surjti 72.2 71.9 16.89 6.04 1.96 0.00 2
hletar 83.3 87.5 21.70 9.32 1.48 0.00 1
nagtme 80.6 62.5 21.69 7.73 0.00 0.00 1
deaksm 75.0 50.0 2116 9.49 3.17 0.00 1
tcouyr 63.9 53.1 21.04 5.90 0.00 0.00 2
pshinu 63.9 62.5 19.53 7.70 2.42 0.00 2
ravngi 63.9 53 1 19.57 8.38 0.48 0.00 2
rpeida 52.8 75.0 20.03 8.68 0.00 0.00 2
earscp 69.4 78.1 20.53 8.76 2.45 0.00 2
fnilus 72.2 59.4 21.34 8.50 0.00 0.00 1
lesdta 58.3 65.6 20.99 8.97 1.81 0.00 2
sipdce 41.7 56.2 22.12 7.49 0.00 0.00 1
snitau 61.1 59.4 20.40 9.84 0.00 0.00 2
diprto 75.0 81.2 19.81 9.13 1.86 0.00 2
icrpot 66.7 73.1 21.37 8.87 0.00 0.00 2
srtumi 80.6 78.1 20.17 8.43 1.34 0.00 2
nlcoku 63.9 62.5 18.66 4.59 0.00 0.00 2
112
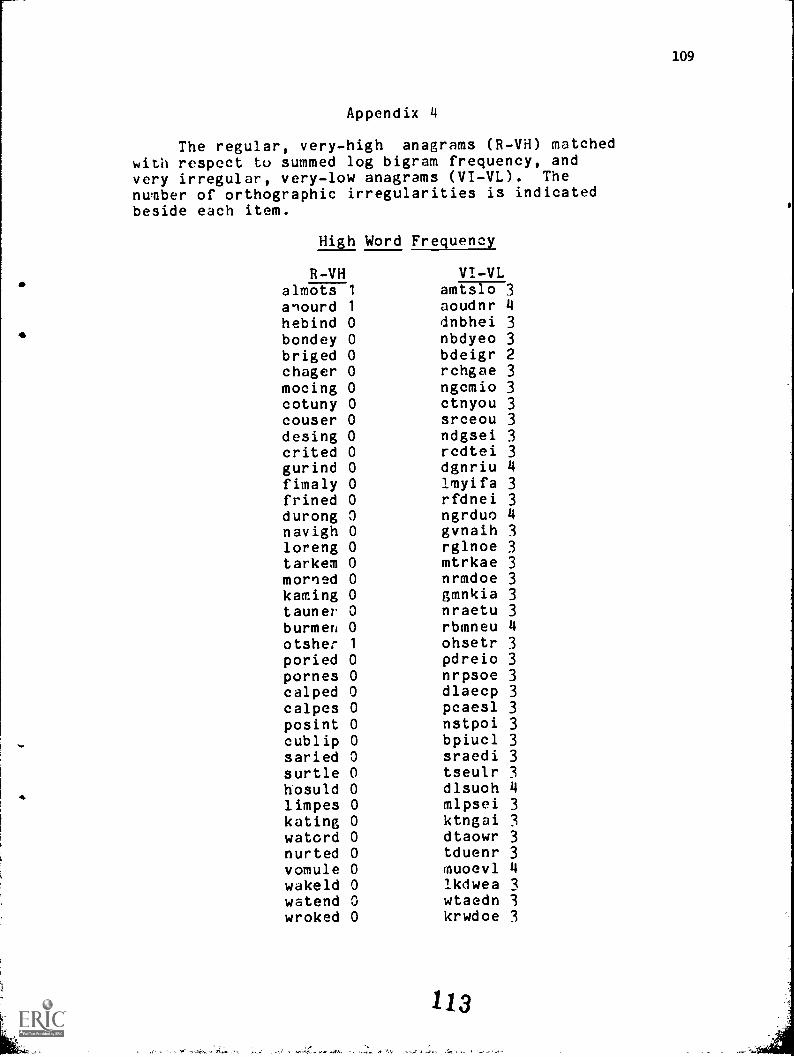
109
Appendix 4
The regular, very-high anagrams (R-VH) matchedwith respect to summed log bigram frequency, andvery irregular, very-low anagrams (VI-VL). Thenumber of orthographic irregularities is indicatedbeside each item.
High Word Frequency
R-VH VI-VLalmots 1 amtslo 3anourd 1 aoudnr 4hebind 0 dnbhei 3bondey 0 nbdyeo 3briged 0 bdeigr 2chager 0 rchgae 3mocing 0 ngcmio 3cotuny 0 ctnyou 3couser 0 srceou 3desing 0 ndgsei 3crited 0 rcdtei 3gurind 0 dgnriu 4fimaly 0 lmyifa 3frined 0 rfdnei 3durong 0 ngrduo 4navigh 0 gvnaih 3loreng 0 rglnoe 3tarkern 0 mtrkae 3morned 0 nrmdoe 3kerning 0 gmnkia 3tauner 0 nraetu 3burmen 0 rbmneu 4otsher 1 ohsetr 3poried 0 pdreio 3pornes 0 nrpsoe 3calped 0 dlaecp 3calpes 0 pcaesl 3posint 0 nstpoi 3cublip 0 bpiucl 3saried 0 sraedi 3surtle 0 tseulr 3hosuld 0 dlsuoh 4limpes 0 mlpsei 3kating 0 ktngai 3watord 0 dtaowr 3nurted 0 tduenr 3vomule 0 muoevl 4wakeld 0 lkdwea 3
wwatend 0 wtaedn 3wroked 0 krwdoe 3
113
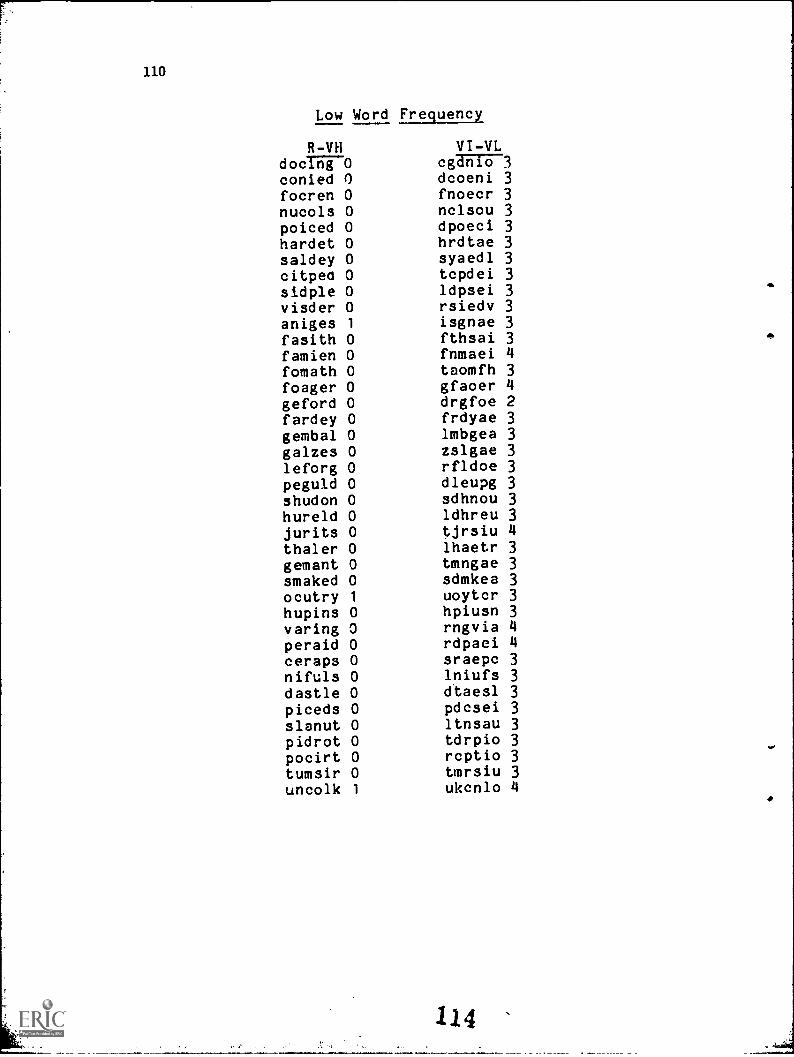
110
Low Word Frequency
R-VHdocUi-0
VI-VLagain63
conied 0 dcoeni 3focren 0 fnoecr 3
nucols 0 nclsou 3
poiced 0 dpoeci 3
hardet 0 hrdtae 3
saldey 0 syaedl 3
citpea 0 tcpdei 3
sidple 0 ldpsei 3
visder 0 rsiedv 3
aniges 1 isgnae 3
fasith 0 fthsai 3
famien 0 fnmaei 4
fomath 0 taomfh 3
foager 0 gfaoer 4
geford 0 drgfoe 2
fardey 0 frdyae 3
gembal 0 lmbgea 3
galzes 0 zslgae 3
leforg 0 rfldoe 3
peguld 0 dleupg 3
shudon 0 sdhnou 3
hureld 0 ldhreu 3
jurits 0 tjrsiu 4
thaler 0 lhaetr 3
gemant 0 tmngae 3
smaked 0 sdmkea 3
ocutry 1 uoytcr 3
hupins 0 hpiusn 3
varing 0 rngvia 4
peraid 0 rdpaei 4
ceraps 0 sraepc 3
nifuls 0 lniufs 3
dastle 0 dtaesl 3
piceds 0 pdcsei 3
slanut 0 ltnsau 3
pidrot 0 tdrpio 3
pocirt 0 rcptio 3
tumsir 0 tmrsiu 3
uncolk 1 ukcnlo 4
114
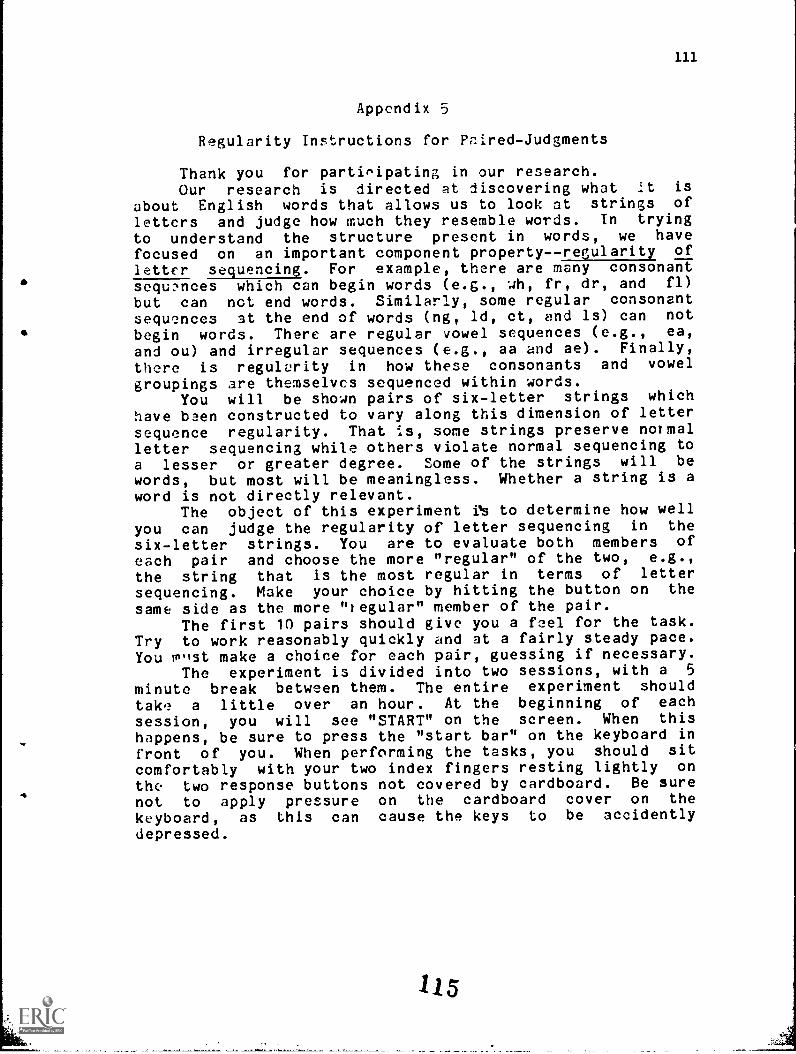
111
Appendix 5
Regularity Instructions for Paired- Judgments
Thank you for participating in our research.Our research is directed at discovering what It is
about English words that allows us to look at strings of
letters and judge how much they resemble words. In trying
to understand the structure present in words, we have
focused on an important component property--regularity of
letter sequencing. For example, there are many consonantsequences which can begin words (e.g., -A, fr, dr, and fl)
but can not end words. Similarly, some regular consonantsequences at the end of words (ng, ld, ct, and 1s) can not
begin words. There are regular vowel sequences (e.g., ea,
and ou) and irregular sequences (e.g., as and ae). Finally,
there is regularity in how these consonants and vowelgroupings are themselves sequenced within words.
You will be shown pairs of six-letter strings whichhave been constructed to vary along this dimension of letter
sequence regularity. That is, some strings preserve normalletter sequencing while others violate normal sequencing toa lesser or greater degree. Some of the strings will be
words, but most will be meaningless. Whether a string is aword is not directly relevant.
The object of this experiment PS to determine how wellyou can judge the regularity of letter sequencing in the
six-letter strings. You are to evaluate both members of
each pair and choose the more "regular" of the two, e.g.,
the string that is the most regular in terms of letter
sequencing. Make your choice by hitting the button on the
same side as the more "regular" member of the pair.The first 10 pairs should give you a feel for the task.
Try to work reasonably quickly and at a fairly steady pace.You trI,Ist make a choice for each pair, guessing if necessary.
The experiment is divided into two sessions, with a 5
minute break between them. The entire experiment should
take a little over an hour. At the beginning of eachsession, you will see "START" on the screen. When thishappens, be sure to press the "start bar" on the keyboard infront of you. When performing the tasks, you should sit
comfortably with your two index fingers resting lightly on
the two response buttons not covered by cardboard. Be surenot to apply pressure on the cardboard cover on the
keyboard, as this can cause the keys to be accidentlydepressed.
115
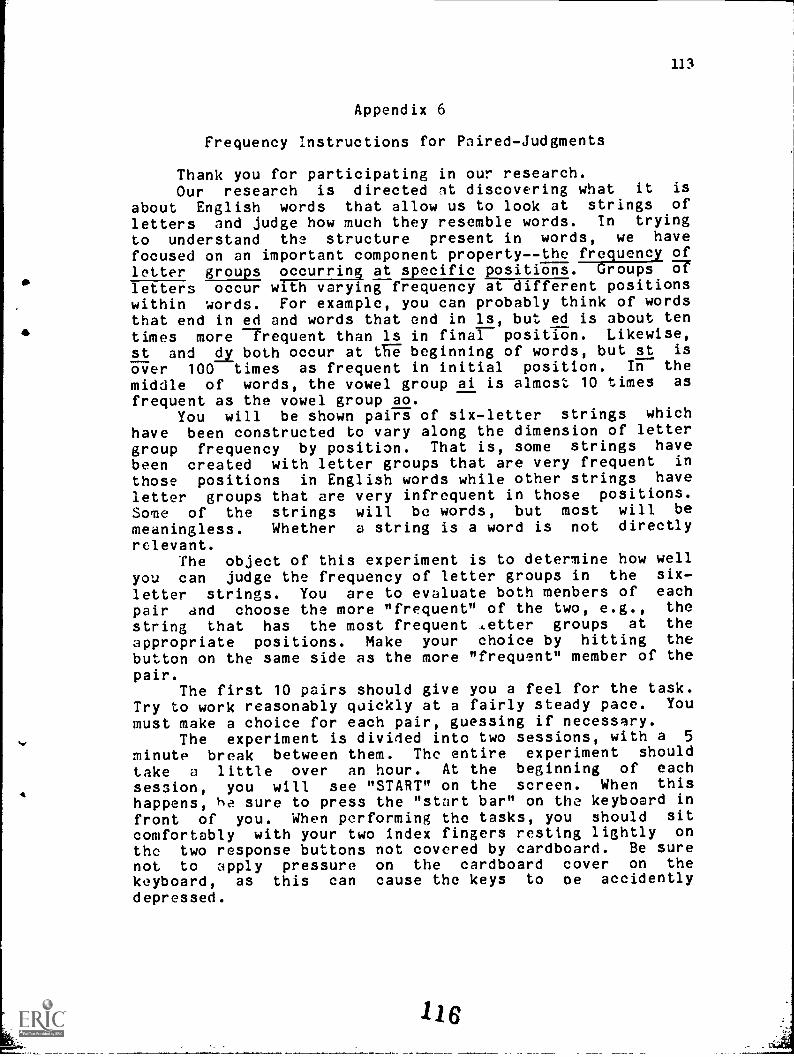
113
Appendix 6
Frequency Instructions for Paired-Judgments
Thank you for participating in our research.Our research is directed at discovering what it is
about English words that allow us to look at strings of
letters and judge how much they resemble words. In tryingto understand the structure present in words, we havefocused on an important component property--the frequency ofletter groups occurring at specific positions. Groups UTletters occur with varying frequency at different positionswithin words. For example, you can probably think of wordsthat end in ed and words that end in ls, but ed is about tentimes more frequent than ls in final position. Likewise,st and Ix both occur at t1 beginning of words, but st is
over 100 times as frequent in initial position. In themiddle of words, the vowel group ai is almost 10 times as
frequent as the vowel group ao.You will be shown pairs of six-letter strings which
have been constructed to vary along the dimension of lettergroup frequency by position. That is, some strings havebeen created with letter groups that are very frequent in
those positions in English words while other strings have
letter groups that are very infrequent in those positions.Some of the strings will be words, but most will be
meaningless. Whether a string is a word is not directlyrelevant.
The object of this experiment is to determine how wellyou can judge the frequency of letter groups in the six-
letter strings. You are to evaluate both menbers of each
pair and choose the more "frequent" of the two, e.g., the
string that has the most frequent ,etter groups at the
appropriate positions. Make your choice by hitting the
button on the same side as the more "frequent" member of thepair.
The first 10 pairs should give you a feel for the task.Try to work reasonably quickly at a fairly steady pace. Youmust make a choice for each pair, guessing if necessary.
The experiment is divided into two sessions, with a 5
minute break between them. The entire experiment should
take a little over an hour. At the beginning of each
session, you will see "START" on the screen. When thishappens, he sure to press the "start bar" on the keyboard infront of you. When performing the tasks, you should sit
comfortably with your two index fingers resting lightly on
the two response buttons not covered by cardboard. Be surenot to apply pressure on the cardboard cover on thekeyboard, as this can cause the keys to oe accidentlydepressed.
:14-Director
D.- Johnson
:Chairpersontes in- .Language:
`'Oni and CCemunication
wa.gruth
itiiihAmplosentstionfidiuidUalised
m* L. AllenorthpogY.
itteePenelope-L. PetersonArea ChairpersonStudies of Instructional Programmingfor the Individual Student
James N. Liplhmm
Area Chairperson,.Studies of Administration andOrganisation fof. Instruction
*an Swiss. daira 4 444041#:
Admiiistration1444( Adiinistration,.
ro,v. cavoqtter)ciate Professor:iculist- an puitruction
*414k ,DicluionLstant Professor4 and-taimily. Studies
'Watt) Piaeloos.ukt,tonia AdikiniStration,',
ns -Fred
MassaroProlsOMmr.,_
1;PirS11:01ait rf
Dc41,1-,11.;,141CISaao-
' 4#0,01or-,EdieweienelvAdministration.
7-
Profempor.OurriCtiun and
Richard A. RossmiXiOrProfessorEducational Adminietr
Peier46-SChpaibimAssocitto ProfessorShgliSh and LingUiA
thibitahnif
-Pr cifestior.ZimitrUction _Curriculum and initr
Garr G.- %Shim*Professor