Embed Size (px)
Citation preview

DOCUMENT RESUME
ED 047 500 EM 008 700
AUTHORTITLE
INSTITUTIONSPORE) AGENCYPUB DATENOTE
EDRS PRICE_DESCRIPTORS
Korotkin, krthur L.; And OthersA Survey of Computing Activities in SecondarySchools. Final Report.American Institutes for Research, Silver Spring, Md.National Science Foundation, Washington, D.C.Oct 70157p.
EDRS Price MF-$0.65 HC-$6.56*Computer Oriented Programs, Electronic Dataprocessi.ifg;-1Uterviews, Mathematics Instruction,Problem Solving, Programing Languages, SchoolDemography, School Funds, *School Surveys,*Secondary Schools, Statistical Surveys
ABSTRACTResults of a survey of secondary schools indicate
that the use et computers, especially for instructional purposes, hasgrown rapidly. However, the diversity of use is still limited. Themost prevalent applications are problem solving and Electronic DataProcessing (EDP) skills training. The major emphasis of computerapplication is on teaching students to use a computer as a tool inlearning. Most instructional applications occur in the mathematicscourses. Local sources provide the majority of funds forinstructional computer use. Plans for future use generally call forexpansion of present applications. The survey was conducted by mailand by interview. Appendices include survey instruments, a list ofschools called and visited, and sources of data for basic questions.(Author/MF)

Survey of Computing Activities
in Secondary Schools
Cbaiii-s A. Darby,
Arthur L Korotkin
Tania Romashko
U.S. DEPARTMENT OF HEALTH, EDUCATION& WELFARE
OFFICE OF EDUCATIONTHIS DOCUMENT HAS BEEN REPRODUCEDEXAUTLY AS RECEIVED FROM THE PERSON ORORGANIZATION ORIGINATING IT. POINTS OFVIEW OR OPINIONS STATED DO IOi 14tl.tb-SARILY REPRESENT OFFICIAL OFFICE OF EDUCATION POSITION OR POLICY
Final ReportOCTOBER 1970
1.11!1111 a. .. !HP IV "nil"'11! 11 a! 51 11.11F
1
011,11.1 C.w ic 11,1 1chgktIN Pa e; Lisl!VL
!!
.4: or 64 0: 41 4t .45t5 1.1 r.Si. mi. AIL fa II!
This document was processed for the ERIC Document Reproduction Service bythe ERIC Clearinghouse'at Stanford. We are aware that some pages probablywill not be readable-in microfiche or in a hardcopy enlargement. However,this is the best available copy, and we feel that the document should notbe withheld from interested readers on the basis of these unreadable pages alone.

AMERICAN INSTITUTES FOR RESEARCHWASHINGTON OPPICS
EDWIN A. FLEISHMAN, PhD, DIRECTORArthur L. Korotkin, PhD, Assistant Director
INSTITUTE FOR COMMUNICATION RESEARCHGeorge H. Johnson, PhD, Director
Rosoarch on lnstructiorni, communication and information systems and theireffectiveness in meeting individual and social needs.
COMMUNICATION SKILLS RESEARCH PROGRAMHeibert L. Friedman, PM), Director
EDUCATIONAL RESEARCH AND EVALUATION PROGRAMGeorge H. Johnson, PhD, Director
INFORMATION AND COMPUTER SCIENCES PROGRAMArthur L. Korotkin, PhD, Director
INSTITUTE FOR RESEARCH ON ORGANIZATIONAL BEHAVIORAlbert S. Glickman, PhD, Director
Research on individual, interpersonal, and group behavior as they relate toorganizational functioning. and effectiveness of. social systems.
HUMAN RESOURCES RESEARCH PROGRAM-leliffcrd P. Hain, MS, Director
MANAGEMENT RESEARCH PROGRAMAlbert S. Glickman, PhD, Director.
URBAN DEVELOPMENT. RESEARCH PROGRAMRobert H. Fosen, PhD, Director
INSTITUTE FOR RESEARCH IN ,PSVCHOBIOLOGYWarren H .Teichner, -PhD, Director'
Human and..:anirnal.pSyCtipphySiologice) and betiSviOral research ralated io:theareas (it PerfOrnOnOe thep stress;rand:teChnOlOgidal Systems...
I RESEARCH BORATORY .
10TESH ,,:RFSg.F3C17VgABPF0kTPRY.AN PERFORMANCE' REBEARPH,,LABORATORY,
.1
Ia

AIR-852-10/70-FR
A SURVEY OF COMPUTING ACTIVITIES IN SECONDARY SCHOOLS
Charles A. Darby, Jr.
Arthur L. Korotkin
Tania Romashko
FINAL REPORT
Prepared under a grant from theNational Science Foundation
Washington, D. C.
Principal Investigator: Arthur L. Korotkin
Grant No. NSF-0584
American Institutes for ResearchWashington Office
Institute for Communication Research
October 1970
:3

ABSTRACT
A mail survey of 23,033 public secondary schools in the con-
tinental United States was conducted to gather information regarding
primarily instructional use of computers. In addition, interviews were
conducted at 90 selected schools throughout the country.
The study concluded that .the use of computers, especidily in
in instruction in secondary schools, has grown rapidly. However, the
diversity of use is still limited. The most prevalent applications are
problem solving and EDP skills training. The major emphasis of computpr
application is on teaching students to use a computer as a tool in learn-
ing more about the subject area in which the computer is being applied.
Most instructional applications occur in the mathematics courses. Local
sources provide the majority of funds for instructional computer use.
Plans for future use generally call for expansion of present applicatiov-
4

ACKNOWLEDGIMENTS
The authors of this report are indebted to the following
individuals Fur their contributions which include ouesliuoodire
development, interviewia9, advice, report review and typing:
Miss Sally Barnett, Mr. Erwin Bedarf, Dr. Ronald Carver,
Dr. John Connolly, Mrs. Doris Donohue, Mrs. Frances Economos,
Miss Classie Foat, Mrs. Mary Hoaglund, Dr. George Johnson,
Miss Stephanie Jordan, Mrs. Mary Kalis, Mr. Thomas Lambert,
Mrs. Elizabeth Roberts, Mr. Christopher Sieger, Mrs. Jeanne Shepherd,
Mrs. Patricia Smyke, and Mrs. Sally Stein.
In addition, we thank the following. individuals who
Participated in the pilot testing of the questionnaire:
Mr. Charles McCormick and Mr. Thornton Lauriat, Wheaton High School
(Wheaton, Maryland); Mr. Thomas Conlon, Albert Einstein High School
(Kensington, Maryland); Mr. Shirly Brown and Mrs. Jean Dumas,
Roosevelt High School (Washington, D. C.), and Mrs. Jesse Jackson,
F.rancis Junior High School (Washin9ton, D. 17,.).
ii
9

TABLE OF CONTENTS
Pa_ge
List of Tables and Figures iv
introduction 1
Purpose 5
Summary of Results 9
Procedure 15
Results and Discussion 27
Conclusions 119
References 127
Appendices
1. Survey Instruments '29
2. Interviews 145
3. Sources of Data for Basic Questions ...... . 151
iii

LIST OF TABLES AND FIGURES
Table Page
1 Response Rates to Various Survey Mailings 28
2 Basic Questions and Corresponding Respondent GroupsProviding Information 30
3 Respondents to Questionnaire and Postal CardInquiries Categorized by Use, Nonuse, and Typeof Use 31
4 Extent of Use Among Nonrespondents Follow-up 33
5 Extent of Computer Use for Instructional andAdministrative Purposes 36
6 Computer Users by State 39
7 Computers Being Used by Administrative and InstructionalUsers for Various Types of Use 42
8 Schools in Each User Category Using Specified Numberof Computers 44
9 Arrangement for Use of Computers by User Category 46
10 Schools Reporting Each Number of Applications byUser Categories 47
11 Measures of Central Tendency and Dispersion forVariables Reflecting Student/Teacher Involvementin Instructional Applications 49
12 Measures of Central Tendency and Dispersion forVariables Reflecting Amount of Computer Use for aSingle Instructional Application 52
13 Schools Reporting Each Instructional Application andPercentages of Total Applications Represented by EachApplication by User Category 54
14 Instructional Users Reporting Various Combinationsof Applications 57
15 Instructional Users Responding to Each $tudentActivity Category by Application 61
16 Schools Responding with the Purpse Listed for EachApplication Shown 64
17 Schools Listing Each Subject Area for Each Application 69
iv

LIST OF TABLES AND FIGURES
(Continued)
Table Page
18 -5chuois Reporting Each Grade in Which Each Applicationis Introduced 74
19 Involvement of Students and Teachers in EachInstructional Application 76
20 Schools Indicating Each Software Preparer for EachApplication 82
21 Schools Indicating Each Programming Language forEach Application 84
22 Nature of Computer Running Time for Five InstructionalApplications 86
23 Contributions by Source/ of Funds for InstructionalComputer Budget Reported 88
24 The Median Percentage: per School Contributed toComputer Budget by Each Source 90
25 Schools Reporting Each Source of Support for EachApplication 91
26 Amount of Annual Support for Types of Applications 94
27 Computer Users Reporting Number of Staff Trainedin Computer Use 97
28 User Schools Reporting the Type of Organization WhichConducted and Sponsored Training 98
29 Demographic Characteristics of School With and WithoutInstructional Applications 100
30 Type of School 102
31 Level of School 103
32 Performance on National Tests 104
33 Schools by User /Nonuser Indicating Type of ApplicationTerminated 107
34 Reasons for Stopping (Number and Percent Respondingto Each Category) 108
35 Schools Indicating Type of Use by Respondent Categoryof Intended Application if Any 112

LIST OF TABLES AND FIGURES
(Continued)
Table
36 Anticipated Sources of Support
FIGURES
114
Page_Figure
1 Geographic Distribution of All Users 37
2 Geographic Distribution of Instructional Users 38
vi
INTRODUCTION
Education, more than any other single institution, has been called
upon to meet the demands of our pluralistic society. The diversity of
these demands has kept education from establishing a set of specific and
clearly defined and universally accepted goals. From this mass of diversity,
only two goals appear to enjoy general acceptance. First, our society be-
lieves that all individuals should have access to education commensurate
with their desires and abilities. This goal has not been reached and still
guides the educational effort of our society.
Secondly, we are committed to providing instruction which is sensitive
to the individual differences of students in ability and interest. The
necessity of utilizing different instructional techniques with students who
deviate from normal ("the gifted" and "the slow learner") has been recognized
for some time. The advent of individualized instruction goes one step fur-
ther by suggesting that even "normal" childrin differ sufficiently from one
another to warrant instruction which is designed to meet individual needs.
Individualization of instruction has not progressed very far in practice,
and it too remains a goal of American education.
Meeting one of these goals without endangering the other presents
a formidable challenge to our educational system. Educating the masses
would be easier if all students were taught in a uniform manner and differed
only in how much education they received. Likewise, individualizing in-
struction would be easier if the range of individuals or the numbers of
individuals taught could be reduced. But we are committed to an educational
policy which precludes any either/or choice. We cannot truly educate all
students unless we educate each student.
The problem of accomplishing both goals is compounded by the
explosion of population and knowledge. There are more people to whom
more must be taught. Educators, striving to meet this demand, have
embraced innovational teaching techniques, particularly technology.
10

Some have mistakenly become dependent upon technology as the solution to
all educational problems. Most have applied technology as one of several
powerful tools useful in the solution of these problems. The last decade
has seen the rapid spread of computer use for a great variety
of applications in business, industry, the military, and science. The
educational system, traditionally conservative, started later in applying
computer technology. However, under tremendous pressure to exploit this
country's tremendous technological resources, educators have begun to
utilize computers at a rapidly increasing rate. Earlier surveys have
documented the use of computers in education (Goodlad, O'Toole & Tyler,
1963 and Bangs & Hillstad, 1970). At first, compute,- applications were
limited to the administrative functions performed in schools. However,
computers were soon introduced into the instructional process. It is in this
latter area where the greatest growth is taking place.
The acceleration of movement in this direction is evidenced by the
proliferation of books, articles and conferences concerning the use of
computers in education. Such a trend is not limited to the United States
but is obviously international in scope. Just recently the International
Federation for Information Processing held a "World Conference on Computer
Education, 1970" in Amsterdam with the use of computers in education a
major theme.
Both the National Science Founuation and the United States Office
of Education, under existing federal legislation and appropriations, have
missions in support of the nation's schools. As a basis for establishing
policy, projecting needs, and accomplishing realistic planning, these
agencies need factual information on present activities and state-of-the-
art in the use of computers within the current educational system.
Many of the more widely known current educational applications of
computers are aimed at elementary education, and at higher and continuing
education. Little has been known concerning the extent and nature of
educational computer use in the secondary schools. In order to provide
the needed information, the American Institutes for Research conducted a
survey sponsored by the National Science Foundation and concerned with the
2
11
- t
educational and administrative uses of computers in public secondary schools.
The principal focus of the study was on instructional, rather than
administrative, computer use.
3
12

PURPOSE
Most simply stated,the purpose of this survey is to describe the
application of computers in secondary schools in the continental United
States. The description is brief and general in those cases where the
computer is used for administrative purposes. On the other hand, the
description of instructional applications is detailed and comprehensive.
The study reports several categories of information about these applications.
For administrative applications:
Extent of use in total population
Degree of use among computer users
For instructional applications:
Extent of use in total population
Degree of use among computer users
Nature and purpose of use
Type of source and level of support
School characteristics and use
Previous use
Plans for future use
To further define these general categories of information about
computer applications, a number of basic questions were asked. These
questions are listed below arranged by the categories shown above except
that the first two categories deal in part with both administrative and
instructional applications.
Extent. of Administrative anCftstructional Applications
1. How many secondary schools are using computers for administrativepurposes?
2. How many schools are using computers for instructional purposes?
Degree of Administrative and Instructional Use Among Computer Users
3. How many computers are being used for administrative purposes?
4. What is the nature of the arrangement for the administrative
5

use of computers?
5. How many computers are being used for instructional purposes?
6. What are the arrangements for the instructional use of com-puters?
7. How many different instructional applications are there perschool?
8. What is the degree of student and teacher involvement perschool in instructional applications?
9. What is the amount and frequency of use of computers forinstruction?
Nature and Purpose of Instructional Use
10. How many schools are involved in each of the various typesof instructional applications?
11. What are the patterns of instructional applications in theschools?
12. What do the students and teachers actually do when they areparticipating in the applications?
13. What are the overall purposes of the applications?
14. To what degree are various subject areas involved?
15. To what degree are computers integrated into the curriculum?
16. At which grade level are various applications introduced?
17. What is the student's and teacher's involvement in eachapplication?
18. What is the degree of student/computer and teacher/computerinteraction?
19. What level of proficiency are students expected to achieve?
20. What do computers contribute to the learning process in theschool setting?
21. Who prepares software for the applications?
22. Which programming languages are used?
23. What is the nature of computer running time?
Level and Source of Support of Instructional Use
24. What are the costs of instructional computer applications?
25. What is the degree of support from various levels ofgovernment and other sources?
26. What are the sources and level of support for specificapplications?
6
14

27. What cooperative arrangements exist for supporting anddeveloping computer applications?
28. What commitment do schools have to instructional applicationsin terms of the number of trained staff, organizationalacceptance, and integration into the curriculum?
29. Which organizations provided training for teachers andother personnel?
School Characteristics and Use
30. What characteristics about a school are related to computeruse?
Previous Use
31. Hcw do schools get started in the instructional use ofcomputers?
32. What type of applications now discontinued did schools havepreviously?
33. What reasons are given for terminating previous computer use?
Plans for Future Use
34. How permanent are present applications?
35. What type of applications do schools intend to initiate?
36. When do they plan to implement these applications and fromWhich organizations do they anticipate seeking support?
37. What problems are associated with the use of computers inschools?
38. What do schools need for future expansion of instructionalapplications and how can outside sources best help?
7
15
SUMMARY OF RESULTS
The information resulting from the survey of computer use in public
secondary schools is summarized below. Detailed information is reported
later in the RESULTS AND DISCUSSION section. The page numbers listed beside
each major heading indicate where the reader can find more detailed infor-
mation in the RESULTS AND DISCUSSION section. Interpretations drawn from
the survey data are reported later in the CONCLUSIONS section.
Extent of Administrative and Instructional Applications (Pp. 26-32)
Of the schools responding to the survey, 3,776 (30.5%) were using
computers for administrative purposes.
There were 1,599 (12.9%) schools surveyed which reported instruc-
tional computer use.
Overall, 4,259 schools, 34.4% of those responding, reported
some type of computer use.
The geographic dispersion of these user schools showed cluster-
ing around major metropolitan areas.
Degree of Administrative and Instructional Use Among Computer Users(Pp. 32-50)
39.8% of computers used by administrative users were leased and
36.1% were used on purchased time basis.
Of the computers used by instructional users, 41.3% were leased
and 28% used on purchased time basis.
Almost 30% of user schools reported using more than one computer
for their applications.
Just over half of the computer users reported more than one
application and about one-third reported more than two applica-
tions in the schools.
9
16
In a "typical application," there was a median of 50 students,
each of whom participated on the average of about 10 hours per
month.
On the average, two teachers each spent about 20 hours per month
in a "typical application."
Nature and Purpose of Instructional Use (Pp. 50-82)
The instructional applications listed in order of frequency of
mention in the mail survey were: EDP skills training, problem
solving, guidance/counseling, gaming/simulation, computer assisted
instruction, management of instruction, other classroom instruc-
tional applications, mediated instruction, and other instructional
applications. Follow-up interviews confirmed the domination of
applications by EDP skills and problem solving, but indicated
that computer assisted instruction and guidance and counseling are
not as prevalent as reported in the mail survey.
A variety of patterns of combinations of applications emerged,
clustered around two cores of applications. These were a guidance-
administrative cluster and a problem-solving-EDP skills cluster
or core.
The most frequently mentioned student activity was writing and
running programs with teachers assisting.
Although the overall purposes of the applications varied widely,
there was a general emphasis on using the computer as a tool to
accomplish subject matter goals rather than on learning about
the computer as an end in itself.
Applications of computers to mathematics instruction dominated.
Almost three-quarters of all computer applications were in-
volved with mathematics instruction.
There was very little formal integration of computers into the
curriculum except in mathematics where there was a little more
integration.
10

The modal grade in which instructional computer applications
were introduced was gradd 10 with some variation across applica-
tions within grades 9-11'.
Hard data were difficult to find regarding the effect of computers
on the learning process in the school setting. However, teachers
testified to a significant effect of computers. Most frequently
mentioned was the motivational influence of computers on students
participating in the applications.
Teachers, computer specialists and students, in that order, most
frequently prepared software for instructional applications re-
ported by schools.
Overall the most frequently mentioned programming language used
for instructional applications was FORTRAN; second was BASIC;
third,a combination of "other" languages, the largest proportion
of which was machine language; and fourth, assembly languages.
Level and Source of Support of Instructional Use (Pp. 82-96)
The median cost per school for instructional computing was
$14,000 but there were 'considerable variations in the costs.
The median percentage of the annual operating budgets of the
instructional users as represented by their annual instructional
computer budget, was .4%.
More schools (32.3%) indicated that each of their applications
cost between $1,000 and $5,000, on the average, than any other
range of cost.
Schools reported that 80% of their computer budget conies from
local sources. It is suspected, however, that those providing
these data were not fully aware of the initial source of their
funds.
The reported domination by local sources of support generally
held up across individual applications. Non-local sources
mentioned most frequently were: National Science Foundation,
11
18
Office of Education, state governments and college and universities.
' A wide variety of different types of cooperative arrangements ex-
ist for supporting and developing computer applications between
secondary schools and other schools, school systems, colleges and
universities, commercial networks and formal networks.
' A serious commitment to the use of computers outside the mathematics
departments was not evident.
' Colleges and universities were mentioned most frequently and com-
puter manufacturers second most frequently as the conductors and
sponsors of teacher training for computer use.. The National
Science Foundation was listed third most frequently as the sponsor
of computer training for teachers.
School Characteristics and Use (Pp. 96-101)
Schools which reported instructional applications tended to be
larger in enrollment and teaching staff, to send more graduates
to college and junior college, and to be more predominately com-
prehensive senior high schools when compared to those schools not
reporting instructional use.
Previous Use (Pp.102-107)
' Instructional computer use frequently developed independently of
administrative use.
Most computer applications which schools reported terminating were
administrative (56.8%).
' A broad range of reasons were given for terminating earlier com-
puter applications. The most frequently mentioned reasons were
concerned with lack of funding and space.
Plans for Future Use (Pp. 107-114)
' Although funding for computer applications is sometimes a year-
to-year proposition, teachers generally appeared confident that
12
'19

the applications will continue indefinitely.
Users indicated a greater intention to initiate new ,Ipplications
than did nonusers. There was a tendency for users to initiate
applications similar to those in which they were already involved.
Local and state were mentioned most frequently as anticipated
sources where support would be sought for new applications in the
future.
There was a general satisfaction among computer users regarding
instructional applications. However, problems did exist. Most
frequently mentioned problems dealt with insufficient access to
computers.
Needs for future expansion of computer use among instructional
users typically involved one or more of the following: funding,
training of staff and information.
13
20

PROCEDURE
The survey was conducted in the following ten phases:
1. Development of operational definitions
2. Questionnaire development
3. Questionnaire dissemination
4. Processing of questionnaire returns
5. Postal card follow-up
6. Interview sample identification
7. Development of interview
8. Conduct of interviews
9. Data analysis
10. Nonrespondent follow-up
1. Development of operational definitions
The first step was to establish operational definitions for the
several terms critical to the study. It is particularly important in
mail surveys to provide clear, concise definitions. If meaningful data
are to be gathered, there must be a reasonable consistency to the
interpretation respondents give to the terms in their questionnaires. AIR
drafted a set of definitions to be used and submitted these to NSF for
consideration. After some discussion, NSF and AIR agreed upon the
definitions which follow. These definitions provide a frame of reference
for interpreting the results of this study.
a. Computers
Computers which are of interest in the present survey are those
general purpose computers which operate under the control of a stored
program. The term computer refers to the integral system which includes
the central processing unit, auxiliary storage, communication links,
and all peripheral equipment. To be considered a computtr a machine
must be capable of producing more than routine mathematical computation
as the end product of its operation. The programmable desk top calcu-
lator is included only when it is operated with a stored program.
15
21.

Electronic accounting machines are specifically excluded.
b. Application
Two general categories of computer use, instructional and
administrative, were described. Applications (1) through (9) listed
below are instructional. Application (10) is administrative.
(1) Computer-assisted-instruction, including drill and
practice, tutorial and dialogue modes using program-
med instructional techniques.
(2) Computer used as a computational aid to problem
solving in classes and laboratories for science,
mathematics, accounting, economics, etc.
(3) Teaching electronic data processing skills to
students, including the preparation of input, machine
operation, programming and systems analysis skills.
The instruction must include the running of a program
on a computer.
(4) Gaming and simulation of real life situations using a
computer.
(5) Computer-mediated instruction involving TV, film,
etc., including the use of a computer to control the
presentation of media in the classroom or other
learning situation, or to analyze multi-media classroom
responses.
(6) Any other classroom or laboratory learning applications.
(7) Management of instruction, including individual
instructional diagnosis through the analysis on a
computer of student learning needs and progress
and the prescription of individual instruction.
(8) Guidance and counseling, including academic guidance,
occupational counseling, and personal adjustment
counseling. A computer might be used to score and
16
22

analyze, or retrieve information concerning such
assessment measures as ability and achievement
tests, personality profiles, occupacional interest
data, etc.. (When test scoring and analysis are
performed by a commercial test publisher, they should
not be reported here as a computer application in
the school.)
(9) Any other application of a computer for instructional
management, guidance and counseling.
(10) Administrative applications including:
Student accounting: to arrange student schedules;
to keep student records, such as educational history,
attendance, and grades; or to prepare report cards,
etc.
Resource management: to schedule transportation,
classrooms, etc.; to maintain personnel and financial
records; or to allocate materials.
o Planning: to plan for future resource allocation
by projection of enrollment, census-taking, educational
system simulation, etc.
o Research and evaluation: to study and evaluate teach-
ing methods, the learning process, curriculum,
instructional materials, etc.
c Access to the Computer
To be included in this survey, it was not necessary that a computer
application involve a computer which was located in the school. Access
to a computer might be classified as any one of the following:
Immediate access - Computer physically present in school
or school system, either owned or leased.
Remote access - Terminal in school, connecting with computer
at any location (e.g., a network of schools or time-shared
system).
17

Periodic access - Computer located close enough to school
that visits could be made to use the computer.
d. Funding
Schools were asked to report in this survey only those computer
applications in which the school or school system was responsible for
some portion of the cost of the application. That is, some part of
the cost of the application must be covered by the operating budget of
the school rr school system, regardless of the source of the support
and nature of the investment. The investment, for instance, might take
the form of staff time devoted to the application, just as long as the
cost of that staff time was part of the operating budget.
2. Questionnaire development
After the definitions had been established, the instrument for
data collection was developed. This development entailed the construction
and testing of a pilot questionnaire.
a. Construction of the pilot questionnaire
The guidelines for the questionnaire required that it be (a)
modular, thus requiring a minimum of effort on the part of those not using
computers; (b) primarily designed to gather information about instructional
computer uses; (c) -as brief, clear, and explicit as possible while
still obtaining the needed information; and (d) able to gather responses
in a mode amenable to accurate compilation, analysis and interpretation.
From the above guidelines, the questionnaire was constructed to
collect information including:
Demographic data about the school (grades, enrollment, staff
size, type, percentage of graduates going on to post-secondary
education, etc.).
Previous and anticipated use of computers.
Present use of computers (which application(s) presently
involved in).
School budget and the portion of the budget allocated to
18
24

to instructional application of computers.
Computer -ystems in use.
Detailed information regarding each instructional application,
such as: purpose, subject areas covered, number of student
and teacher participants, hours of student and teacher use
per month, computer time used per month, software preparers
for the system, programming language(s) used, description of
the actual tasks performed by students, sources of support
and amount contributed by each source.
b. Pilot testing the questionnaire
Foil- secondary schools in the Washington, D. C. area which agreed
to participate in a pilot test were sent the draft questionnaire, with
instructions for completing it. Project staff visited these schools
and interviewed those individuals who had filled out the questionnaire.
Purposes of the interview were to uncover any ambiguities in the question-
niare, to identify any difficulty in providing the requested information,
to determine the amount of time and effort required to gather the data,
and to evaluate the degree of reliability and validity which might be
expected from the data.
Following the interviews, the questionnaire was revised a final
time and submitted to NSF for final approval. A copy of the final
instrument is included in Appendix 1-B.
3. Questionnaire dissemination
NSF specified at the outset that the survey would involve the
total population of public secondary schools (schools with one or more of
grades 9-12) in the continental U.S. rather than a sample of these
schools. The total population survey was preferred because NSF wished
to gather as much information as possible, particularly about the
instructional application of computers. In this context, information
was needed about the atypical applications as well as the typical
applications. Suspecting that only a small percentage of the schools
were using computers instructionally, a very large sample of schools
19

would have had to be drawn in order to gather the information desired about
the wide range of instructional computer applications.
If the primary purpose had been only to make statistical descrip-
tions of the extent and use of computers in the population, NSF would
have specified that a small sample of schools be drawn from the
population. This approach would have permitted intensive follow-up
to assure an extremely high rate of return. However, the enlightening
information gathered about the range of computer applications, including
many exemplary programs of computer use, may have been lost. The total
population survey approach used 'n this project is more difficult to
follow-up due to the large number of schools, but is more likely to
uncover more useful information.
Arrangements were made with the National Association of Secondary
School Principals (NASSP) for the use of a magnetic tape file of the
names and addresses of all secondary schools in the United States.
Details were worked out for the printing and automated mailing of the
questionnaires. Procedures for the efficient receipt, processing, and
coding of the questionnaires were developed.
When final approval of the questionnaire was received, 23,500
copies were printed and mailed, addressed to the principal of the school.
The first mailing occurred near the end of January, 1970. A follow-up
mailing to nonrespondents was made one month later. The final version
of the questionnaire contained a cover letter, questionnaire booklet
and answer sheet. The questionnaire with different cover letters used
for the two mailings appears in Appendices 1-A and 1-B.
4. Processing of questionnaire returns
As each questionnaire was received, it was edited and coded.
Coders made sure that the school had at least one or more of grades 9-12
and was located in the continental United States (requirement for
inclusion in the survey). Although the NASSD file was as accurate and
up-to-date as possible, there were schools in the file which did not
meet the geographic and grade level requirements of the study.
20
26

Those which could be identified were eliminated from the survey. The
number of these type of responses and their effect on the size of the
overall sample will be described later in the RESULTS AND DISCUSSION
section.
The questionnaires were then stamped with an identifying
sequence number and responses checked for clarity and readability. Coders
resolved any ambiguities in the questionnaires which might result in
distortion in later data analysis. For example, some respondents
accidently reversed their answers to the teacher and enrollment questions,
thus reporting more teachers than students.
Coders then proceeded with the coding of several items on the
questionnaire. The data collection device had been constructed to
require as little coding as possible. The items which were coded were:
A-13 Reasons given for stopping an earlier computer application
in the school.
c-2 (Column 3) The names of the computers and terminals listed
as being used by the schools.
D-1 The "Purpose" and "Activity" statements provided for each
application.
D-3 Subject area, such as mathematics, English, biology.
D-14 and D-15 The "Software Preparer" and "Programming Language(s)"
D-16 "Source" of support and "Amount" of support for each
application.
The questionnaires were sent in batches for keypunching and
verifying. Samples of cards punched and verified for the first few
hundred questionnaires were checked to assure that the punching was being
performed as intended. Almost all of the data on the questionnaire were
keypunched, exceptions being:
A-13 Reason for stopping.
D-1 Purpose and Activities.
21
27

0-16 Source and Amount.
These items were copied on 3 x 5 cards. They were manually ...oded
and analyzed after all responses had been received so that appropriate
coding categories could be developed.
When the questionnaires were returned from keypunching, they were
separated into four mutually exclusive groups: (a) nonusers (those not
using computers), (b) administrative only users (those with adminis-
trative use only), (c) instructional only users (those with instructional
use only), (d) combined users (those with both administrative and
instructional use). Each school reporting one or more computer applica-
tions was represented on a large 4' x 6' zip code map of the United
States by a pin stuck in the area on the map corresponding to the
geographic location of the school. The pins were color-coded to represent
each of the three mutually exclusive categories of computer use
(administrative only users, instructional only users and combined users).
This technique provided a graphic display of the geographic dispersion
of computer users.
5. Postal card follow-up
Based on previous knowledge of administrative computer use, it
was suspected that the true extent of administrative applications was
not being reflected in the questionnaire data. Therefore in April it
was decided to send nonrespondents to the first and second mailing of
the questionnaire an additional probe consisting of a brief postal card
questionnaire. This third mailing included only four questions designed
primarily to determine the existence and level of administrative and
instructional use among the remaining nonrespondents. The postal
card was prepared and approved by NSF and mailed during the third week
in May. A sample of the postal card is included in Appendix 1-C.
As these cards were returned, they were stamped with a sequence
number, edited, keypunched and verified.
6. Interview sample identification
As indicated earlier, a map of the United States which represented
22
28

the location of schools reporting computer uses had been prepared. Pins
were placed in the area serviced by a Sectional Center of the United
States Post Office. This area is defined by the first three digits of
the zip code. A pin representing a particular school was placed in the
area whose first three zip code digits corresponded to those in the
school's address.
The plan originally called for the NSF Office of Computing Activities
to review the map in order to select clusters of computing activities.
As an aid to selecting these clusters, AIR identified 19 clusters of
computer activities as candidates for follow-up interviewing. (Selected
candidate clusters appear in the RESULTS AND DISCUSSION section and
Appendices 2-A and 213.) After a preliminary report had been presented
to NSF in April, the plan was changed in order to select schools from
nonclustered areas as well as clustered areas. This new plan provided
broader geographic coverage and avoided any systematic bias in data
gathered only from schools closely nested together near large metropolitan
areas. The design was further modified to expand interview coverage
by adding telephone interviews. This technique permitted wide geographic
coverage while keeping down the cost of interviewing.
The design for the on-site and telephone interviews was as
follows:
Cluster Noncluster Total
Visited 30 20 50
Telephoned 15 25 40
TOTAL 45 45 90
NSF selected the clusters of schools with instructional applications
which should be visited and those which should be telephoned. Within
each cluster, individual schools were selected by AIR so as to
adequately represent each cluster. AIR also selected the noncluster
schools with the intention of providing adequate geographic coverage.
The actual schools visited and their locations appear in Appendix 2.
7. Development of interview
The purpose of the interview was to validate the data provided
23

on the questionnaire and to gather supplementary data. Thirty-two
questions were included in the interview. The interview questions
appear in Appendix 1-D. At the end of each interview, the questionnaire
was to be reviewed with the interviewee to determine why items on the
questionnaire, if any, were left blank and to ascertain what interpreta-
tion had been given to each question. This information allows for an
evaluation of the degree to which respondents interpreted the question-
naire as it was designed to be interpreted.
8. Conduct of interviews
After approval of the interview plan, the schools to be visited
were contacted and an interview schedule was set up. During April and
May, the interviews were conducted. Two-man teams travelled to the
locations where the interviews were to be conducted in the schools.
The Project Director and one other senior staff member performed the
first site visit to five schools in Chicago. Upon their return, they
briefed other members of the staff who would be conducting subsequent
interviews.
The individuals to be interviewed by telephone were mailed a
card on which they were asked to indicate three time periods during
which they could be interviewed. When these cards were returned,
telephone interviews were scheduled. Each interview was conducted by
one interviewer. All of the interviews were completed during May
and June.
For both personal and telephone interviews at each school, the
interviewer talked with the individual(s) most involved with the
instructional computer applications to assure that the best information
available would be acquired. All interviews were tape recorded. This
technique provided a verbatim record of the interview as well as freeing
the interviewer to fully interact with each interviewee.
9. Data analysis
The data analysis phase of this project actually began with the
identification of the candidate cluster and noncluster areas described
24

earlier. In addition, two other large data analyses were performed to
provide answers to the 38 basic questions posed in the PURPOSE section.
The data related to each question appear in tabular form in Appendix 3.
There are only two major items of information which relate to the
total population of schools. These are concerned with the extent of computer
use as measured by the number of schools reporting computer uses and the
basic characteristics of the schools (enrollment, type, etc.). Still other
information was gathered from user schools only (budget, computers, etc.).
The rest of the information representing approximately 90% of the mail survey
data was gathered only from those schools using the computer for instructional
purposes. It is this small subpopulation of schools to which the other
basic questions address themselves.
a. Questionnaire/Postal Card
The items on the questionnaire and postal card yielded a number of
both discrete and continuous variables. Each discrete variable was
analyzed to produce frequency and percentages of responses in each category
of the item. For example, the number and percent answering yes or no to
whether or not they use computers (Questionnaire item A-17) was determined.
Each continuous variable was analyzed to produce a mean, standard deviation,
range and frequency distribution. For example, the mean, etc. of the enroll-
ment variable were computed. These analyses were performed for almost all
of the items using a set of computer programs. A few remaining items were
analyzed manually.
b. Interview
As noted earlier, the purpose of the interviews was to gather
verifying and supplemental information. The questions asked in the
interview appear in Appendix 1-D. Completion of both site visit and
telephone interviews yielded approximately 70 hours of taped interviews.
To capture the richness of the interviews, project staff listened to
the tapes and extracted the essence of the responses using the inter-
viewee's words and frame of reference. These extractions were then
typed onto continuous form 3 x 5 cards, one extraction per card. These
25
31

cards were then grouped so that all responses to a particular interview
question were together. Project staff then summarized the responses
to each question. The summaries were written to reflect the patters
of responses emerging from the analysis without masking the contributions
of unique and especially thought provoking answers. Stated another way
the analysis and summarization of responses avoided the establishment
of response categories and the reporting of the number of responses
which were placed in each category.
10. Nonrespondent follow-up
As a final step a follow-up of nonrespondents was performed.
This follow-up was performed in order to estimate the degree of bias
among nonrespondents, if any, in terms of extent of computer use. A
random sample of 100 nonrespondents was selected. These schools were
telephoned and asked whether they were using the computer for instructional
purposes and/or administrative purposes during the school year 1969-70.
26

RESULTS AND DISCUSSION
In this section, the results of the analysis of data from all
survey instruments (questionnaire, postal card, and interviews)
will be reported and discussed. After describing the population
surveyed and the sample which responded, each of the 38 basic questions
listed earlier will be addressed in turn.
A. Population
As indicated earlier, the survey involved mailings to every
public school with one or more of grades 9-12 located within the
continental United States. This population totals 23,033 secondary
schools.
B. Sample
The response rate to each of the three survey mailings is
depicted 'in Table 1. The percentages shown indicate the proportion of
the total population falling in each category.
Of the 23,033 schools in the population, 12,396 (53.8%) responded
in some form. Total respondents consist of 3,770 (16.3%) of the total
population who responded to the questionnaire and 8,62.6 (37.5%) who
responded to the postal card.
The major purpose of this survey was to gather detailed,
descriptive information about the instructional uses of computers in
secondary schools. Although other data were gathered regarding the
general extent of use of computers, the emphasis was not on making
projections about computer activities in the total population in secondary
schools. Instead, the emphasis was on accurately and comprehensively
describing the computer use of respondents, particularly instructional
users. In this regard not all of the 38 basic questions enumerated
in the PURPOSE section apply to all secondary schools. In fact, most
questions apply to only a portion of them, most frequently to the
instructional users.
27

Table 1.
Response Rates to Various Survey Mailings
Total eligible population = 23,033
Percenta es based on total population
1st
2nd
mailing
mailing
question-
response
naire
response
op op1920
1850
Postal card respondents
Questionnaire
Response
3,770
(16.3%)
8,626
37.5%)
Total Respondents
12,396
(53.8%)
Nonrespondents
10,637
(46 2%)

Table 2 shows the respondent group which provided information
relevant to each of the 38 basic questions. For example the group of
all postal card and questionnaire respondents, totalling 12,396
schools, provided information regarding extent of use (basic questions
1 and 2). Each group is designated by a letter for future reference.
Information related to each of the 38 basic questions is discussed
below. Appendix 3 lists the number of each of the 38 basic questions
and the identification of the corresponding items on the survey
instruments from which relevant information was gathered. The basic
questions are discussed generally in the order presented in the PURPOSE
section arranged in the categories given in that section. The numbers
of the basic questions being addressed in each section are listed in
parentheses at the end of the section title. The respondent groups
which provided information relevant to the basic question under
discussion is designated by its reference letter shown in Table 2.
C. Results
1. Extent of computer use (Basic questions 1 & 2)
a. Overall computer use
The extent of computer use is indicated here by the number
of schools reporting use on the questionnaire and postal card (Group A).
Table 3 reports these data.
Of the total respondents, 4,259 or 34.4% indicated some use
of a computer for either administrative or instructional purposes or
both. From Table 3, it can be seen that the ratio of user to nonuser
remained relatively constant from the questionnaire to postal card
returns (32.4% and 35.2% users). The consistency of the response pro-
vides evidence that the overall extent of use measure of 34.4% is an
accurate one and probably reflects the extent of computer use in the
total population fairly well. Unfortunately, no evidence from earlier
surveys is available for comparison purposes.
It was suspected that 34% was an overestimate since computer
users were probably more motivated to return the questionnaires than
nonusers. Earlier survey work reports that recipients of questionnaires
29
25

Basic Question
ReferenceLetter
Respondent Group
Composition
Extent of use (1 and 2)
Previous use (31-33)Future use (34-36, 38)School characteristics(30)
Degree of administrativeuse (3 and 4)
Degree of instructionaluse (5-9)Nature and purpose(10-23)Level and source ofsupport (24-29)Previous use (31-33)
Nature and purpotq(12-15, 17-21, 23).Level and source ofsupport (24-29)Previous and future use(31-38)
Extent of use (1 and 2)Degree of use (9)Nature and purpose (15)
Table 2. Basic Questions and Corresponding Respondent Groups ProvidingInformation
A
B
C
D
E
F
All postal card and questionnairerespondents (12,396)
All questionnaire respondents(3,770)
Just administrative users amongquestionnaire respondents (1,026)
Just instructional users amongquestionnaire respondents (666)
Just instructional user schoolsresponding to questionnaire whereinterview conducted (90)
Just instructional users amongpostal card respondents (933)
30
:16

Table 3.
Respondents to Questionnaire and Postal Card
Inquiries Categorized by Use, Nonuse, and
Tyne of Use
Respondents
Category of Use
Questionnaire
respondents % of
NRqspondents
Postal Card
respondents % of
N.
Respondents
1.
Nonuser
2,549
67.6
5,588
64.8
2.
User
1,221
32.4
3,038
35.2
(a) Instructional
only
(b) Administrative
only
(c) Combined
195
555
471
5.2
14.7
12.5
288
2,105
645
3.3
24.4
7.5
(d) All instructional
(a) and (c)
(e) All administrative
(b) and (c)
666
1,026
17.7
27.2
933
2,750
10.8
31.9
3.
Total respondents
3,770
100.0
8,626
100.0
Total
respondents % of
NRespondents
8,137
65.6
4,259
34.4
483
3.9
2,660
21.5
1,116
9.0
1,599
12.9
3,776
30.5
12,396
100.0

who have something positive to report are more likely to re trn question-
naires than those who do not. To test this notion, a random sample of
100 nonrespondent schools were telephoned. In order to estimate the
extent of use among the nonrespondents, staff in these 100 schools were
asked whether the school used computers for instructional purposes and/or
for administrative purposes during the 1969-70 schocl year. Table 4
contains the results of the nonrespondent follow-up.
It appears from the nonrespondent data that approximately 35%
is a good estimate of the extent of use in the total population. The
consistency of responses received regarding extent of use (32.4%, 35.2%
and 35.0%) provides considerable credence to the estimate of about 35%.
The other data in this table will be discussed later in the report.
It appears that the majority of secondary schools are not using
a computer. At the same time, use of a computer in 4,259 of the schools
responding to the survey is probably a large increase over what existed
even five years ago.
b. Administrative use
Some interesting observations are evident among the types of
users. The overall percentage of schools reporting use of a computer
for administrative purposes only was 21.5%. The percentage reporting
such use on the postal card was 24.4%, as compared to only 14.7% on the
questionnaire. As already indicated, it was suspected that many schools
which were using a computer for administrative purposes only had not
responded to the questionnaire since they thought the survey emphasized
instructional applications. The large discrepancy in the percentages
of returns from these users supports this notion. In all probability,
the actual percentage of use is somewhere between 15% and 25%. Results
from the nonrespondents' survey show 19% users for administrative
purposes only. Therefore, the extent of this type of use may very
well be near the midpoint of the two estimates obtained.
The percentage of schools using a computer for administrative
purposes (regardless of other use) was 30.5% and was relatively stable
32

Table 4. Extent of Use Among Nonrespondents Follow-up
Category of UseSample
N Percent
1. Nonuser 65 65
2. User 35 35
(a) Instructional only 10 10
(b) Administrative only 19 19
(c) Combined 6 6
(d) All instruction (a) and(c)
(e) All administrative (b)and (c)
16
25
16
25
3. Total 100 100
J.1
39

from both the questionriaire and postal card (27.2% and 31.9% respectively).
Nonrespondent follow-up shows 25% frequency of administrative use. Thus,
it is reasonable to conclude that the percentage of schools using a
computer for administrative purposes is around 25% to 30%.
c. Combined use
Combined uses (aoministrative and instructional) reported by 12.5%
of the questionnaire respondents was reported by only 7.5% of the postal
card respondents. Ine overall percentage was 9%. The extent of both
administrative and instructional use among nonrespondents was 6%. It
is felt that the lower figure, 7.5% from the postal card survey, is
probably the best estimate of the occurrence of combined users in the
population. It appear7, at least, that the percentage of schools which
use a computer for both administrative and instructional purposes is
probably between 5% to 10%.
d. Instructional use
Data reported for instructional users show 12.9% of the
respondents as instructional users, (17.7% from the questionnaire and
10.8% from the postal cards). The nonrespondents survey shows 16% of
the schools reporting instructional use. It appears that about 10% to
15% of the schools use computers for instructional purposes. Most
likely, the extent of instructional use in the population probably
falls somewhere closer to the lower end of this range. It is suspected
that the questionnaire data produced an overestimate of the number
of instructional users since those with instructional use were more
likely to respond.
The only previous data come from two earlier surveys. Goodlad,
O'Toole and Tyler (1963) estimated a total of 300 secondary schools
using computers or electronic accounting machines for instructional
applications. In a study done in 1966, Bangs and Hillstad (1970)
surveyed roughly 11,000 public secondary schools in the United States.
They reported 181 instructional computer users or 1.7% usage. The
estimate from the present study of 10% to 15% suggests a marked increase
over the past four years.
40

e. Computer use by category of user
Table 5 reports additional information regarding the
extent of computer use as it relate,: to selected user categories
(Group A). Among computer users, administrative use predominates over
instructional use. This observation is supported by the following
information:
The large proportion of all users are administrativeusers (88.6%) and administrative only users (62.4%)
The corresponding small proportion of all users areinstructional users (37.5%) and instructional onlyusers (11.3%)
The preponderence of instructional users are alsousing a computer for administrative purposes (69.8%)
The small percentage of administrative users who alsohave instructional application (29.6%)
f. Geographic dispersion
Of considerable interest is the geographic spread of computer
use. Figures 1 and 2 geographically display the spread of computer use.
Each dot in Figure 1 represents a school which reported computer use
and in Figure 2, each school reporting instructional use in the question-
naire (Groups C & D). Table 6 reports the number of using schools in
each state by user category.
The spread of computer use is highly similar for instructional
users and all users. The schools using computers tend to cluster around
metropolitan areas. Therefore, the density of computer use corresponds
closely to the density of population.
2. Degree of administrative and instructional use among computer
users (Basic questions 3-9)
With the extent of computer usage in secondary schools established,
the discussion will now be directed to the degree of computer involvement
within the using schools (Groups C and D).
35
41

Table 5.
Extent of Computer Use for Instructional and Administrative Purposes
Respondents
Category of user
N% of Total
respondents
% of User
respondents
% of
Instructional
respondents
% of
Administrative
respondents
1.
Nonuser
8,137
65.6
--
--
2.
User
(a) Instructional
only
(b) Administra-
tive only
4,259
483
2,660
34.4
3.9
21.5
100.0
11.3
62.4
--
30.2
--
--
70.4
(c) Combined
1,116
9.0
26.2
69.8
29.6
(d) All instruc-
tional (a)
and (c)
(e) All adminis-
trative (b)
and (c)
1,599
3,776
12.9
30.5
37.5
88.6
100.0
--
--
100.0
3.
Total respon-
dents
2,396
100.0
--
--

"A D
A
lam
mE
SO
'f
(1)
X z-
4°
M
Z
C 1 r< nl 3
ME
Xic
o
T. "
'IVIh
,, ..f
1,3,
1., O
UP
. 0, m
l P0,
T.0
0 ffi
ft.a
0/ a
ny m
etho
d. ir
o tu
tting
offi
ceco
py,0
0 ...
Noo
k 10
1 pm
y000
.1 c
ompa
ny01
1 01
ttial
t rith
Out
illit
Per
nniO
nIs
Mew
l.
n 50
ion
zoo
Figu
re 1
.G
eogr
aphi
c D
istr
ibut
ion
ofA
ll U
sers
.

Figu
re 2
.G
eogr
aphi
c D
istr
ibut
ion
of I
nstr
uctio
nal U
sers
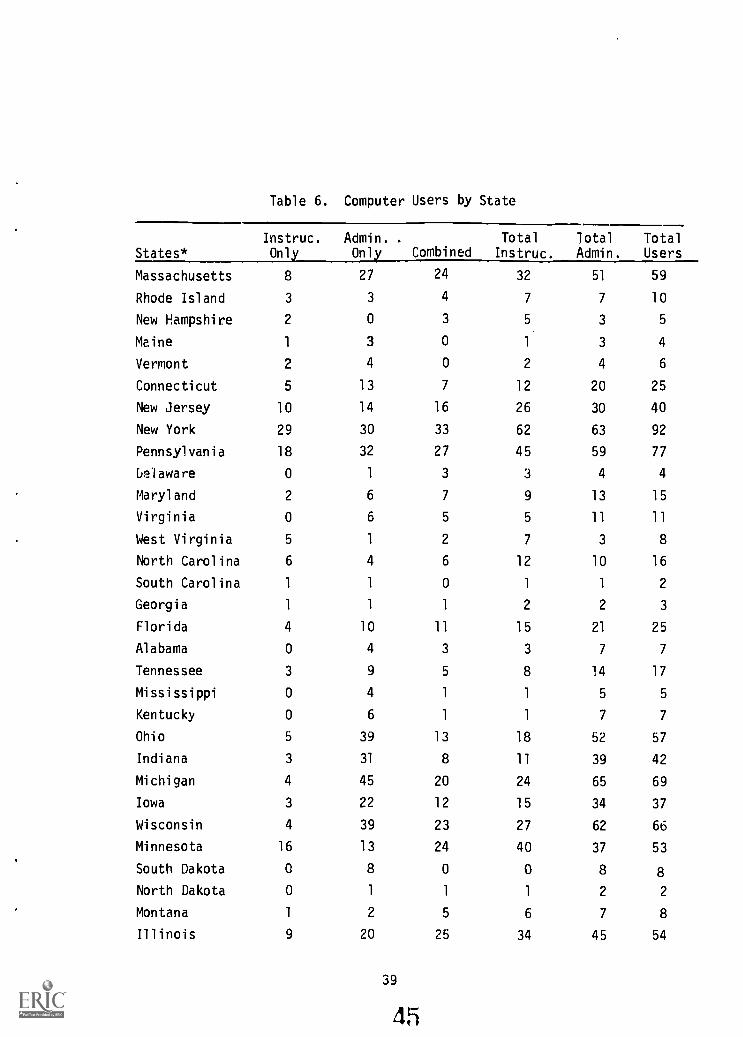
Table 6. Computer Users by State
States*Instruc.Only
Admin. .
Only CombinedTotalInstruc.
Total
Admin.
TotalUsers
Massachusetts 8 27 24 32 51 59
Rhode Island 3 3 4 7 7 10
New Hampshire 2 0 3 5 3 5
Maine 1 3 0 1 3 4
Vermont 2 4 0 2 4 6
Connecticut 5 13 7 12 20 25
New Jersey 10 14 16 26 30 40
New York 29 30 33 62 63 92
Pennsylvania 18 32 27 45 59 77
Delaware 0 1 3 3 4 4
Maryland 2 6 7 9 13 15
Virginia 0 6 5 5 11 11
West Virginia 5 1 2 7 3 8
North Carolina 6 4 6 12 10 16
South Carolina 1 1 0 1 1 2
Georgia 1 1 1 2 2 3
Florida 4 10 11 15 21 25
Alabama 0 4 3 3 7 7
Tennessee 3 9 5 8 14 17
Mississippi 0 4 1 1 5 5
Kentucky 0 6 1 1 7 7
Ohio 5 39 13 18 52 57
Indiana 3 31 8 11 39 42
Michigan 4 45 20 24 65 69
Iowa 3 22 12 15 34 37
Wisconsin 4 39 23 27 62 66
Minnesota 16 13 24 40 37 53
South Dakota 0 8 0 0 8 8
North Dakota 0 1 1 1 2 2
Montana 1 2 5 6 7 8
Illinois 9 20 25 34 45 54
39
45

Table 6. Computer Users by State(Cont'd.)
States*Instruc.Only
Admin.Only Combined
TotalInstruc.
TotalAdmin.
TotalUsers
Missouri 1 7 1 2 8 9
Kansas 1 3 16 17 19 20
Nebraska 2 6 4 6 10 12
Louisiana 0 5 3 3 8 8
Arkansas 0 1 1 1 2 2
Oklahoma 2 3 27 29 30 32
Texas 3 23 9 12 32 35
Colorado 8 7 7 15 14 22
Wyoming 0 2 3 3 5 5
Idaho 1 0 1 2 1 2
Utah 1 8 6 7 14 15
Arizona 2 17 4 6 21 23
New Mexico 0 1 2 2 3 3
Nevada 1 4 1 2 5 6
California 17 34 58 75 92 109
Oregon 8 16 19 27 35 43
Washington 3 19 19 22 38 41
195 555 471 666 1026 1221
*Arranged in zip code order to represent regional concentration of computer
use.
40.
46

a. Number of computers
Table 7 shows the number of computers reported by adminis-
trative and instructional users for each of the types of use. Also
shown is the percentage of the total computers reported by user groups
for which use was specified represented by each type of use.
Table 7, of course, includes only those computers reported
by using schools. A number of the computer users did not specify which
computer was being used. In fact, 434 schools did not report the name
of the specific computer in their questionnaires. By definition of this
survey, a school is a computer user only if it actually uses a computer.
Therefore, it could be assumed that these 434 schools use at least one
computer. In turn then, it could be concluded that the 1,221 users
included in the survey use at least 1,287 computers (853 reported and
434 projected). Data discussed here, however, will pertain to just
those schools reporting which computer was being used and in some
instances only those computers for which category of use was reported.
Furthermore, in interpreting these results, two points must
be kept in mind. First, some of the schools included in this analysis
may be sharing a computer with each other. Therefore, the number of
computers listed does not represent separate, unique computers in use.
Rather, it represents the number of school-computer relationships which
exist, with some schools involved in more than one such relationship.
For ease of discussion these relationships will be referred to as
computers being used. Second, some of the computers counted here are
located in the schools, while others are located at remote sites where
they are used through a telecommunications hook-up, or material is
taken to the site to be run.
The last column of Table 7 shows a total of 853 computers.
However, the type of use was specified for only 815 of these computers.
Therefore, of the 815 for which use was specified 63.21 were being used
for instructional purposes and 58.6% for administrative purposes. In
the last column for (d) instructional use it is reported that 515
41

Table 7. Computers Being Used by Administrativeand Instructional Users for VariousTypes of Use*
Type of iiserInstructional users Administrative users All users
Type of use N % N % N %
(a) Instructionalonly
337 55.5 160 25.1 337 41.3
(b) Administrativeonly
92 15.2 300 47.0 300 36.8
(c) Combined 178 29.3
__178 27.9 178 21.8
(d) Instructional(a) and (c)
515 84.8 338 53.0 515 63.2
(e) Administrative(b) and (c)
270 '4.5 478 74.9 478 58.6
Total for whichuse specified
607 -- 638 -- 815 --
Total for whichuse omitted
38 5.9 23 3.5 38 4.4
Total 645 661 853
*Based on response of 787 users providing data regarding type of computerused (612 Instructional and 583 Administrative).
42
48

computers were being used for instructional purposes and 478 for (e) adminis-
trative purposes. Some of these computers,178 (21.9%),were being used
for both purposes. Schools reported that 36.8% of the computers were
being used for administrative purposes only and 41.3% for instructional
purposes only. These data indicate slightly higher instructional use
than administrative use. This information is in contrast to the dominance
of administrative users in terms of the number of schools reporting computer
applications. This turn around is attributable to the greater number of
computers which are used for instructional purposes only (337) than those
used for administrative purposes only (300). In this regard, it is
interesting to note that of the computers used by administrative users,
25.1% are used for instructional only purposes. At the same time, only 15.2
of the computers used by instructional users are used for administrative pur-
poses only.
Other data from questionnaires returned by schools with more
than one computer indicate a dominance of instructional uses among those
computers beyond the first computer.
This information is supported by the results of school inter-
views. Teachers frequently indicated that although their schools first
used a computer for administrative purposes, a subsequent computer was
secured for instructional applications.
Before leaving the discussion of the number of computers being
used, another item of information is relevant. Table 8 represents the
number and percentage of schools in each user category using a specified
number of computers ( Groups C & D).
Almost 30% of all schools reporting computer use indicated that
they are using more than one computer. From Table 3 it is evident that
computer use has not spread to a majority of schools: however, th r.e is
a significant percentage of user schools which are involved enough with
computers to use more than one. Most observers would be ,,urprised by
this degree of use.
Although the degree of use does not generally vary much across
user types, one important difference should he noted about schools
43
49
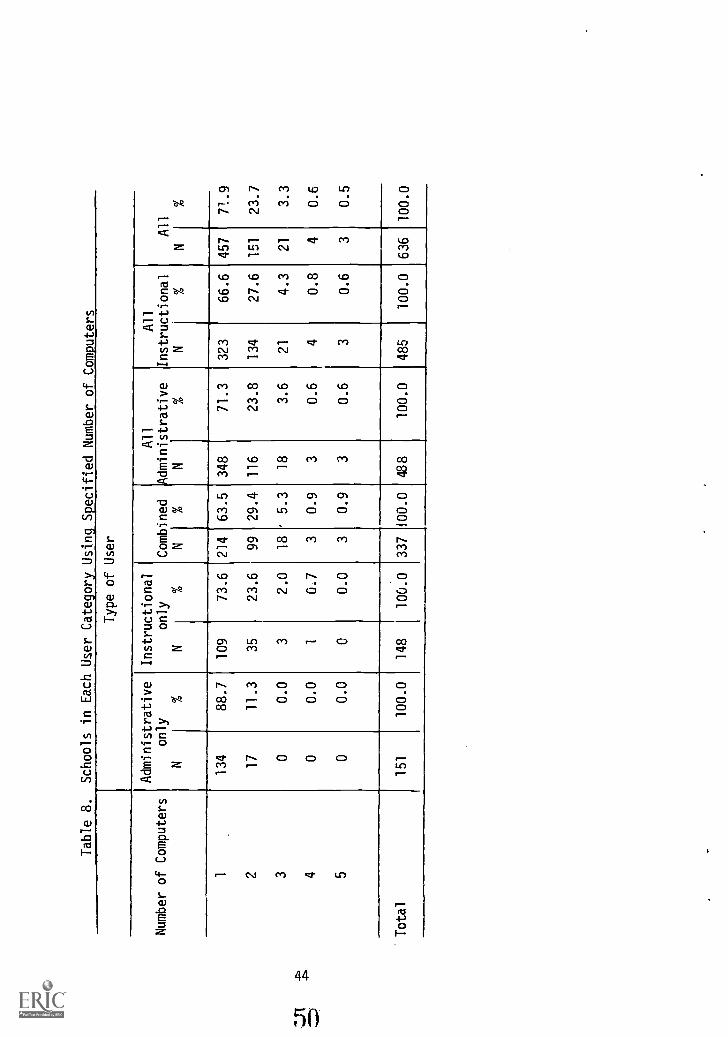
Table 8.
Schools in Each User Category Using Specified Number of
Computers
Type of User
Administrative
Instructional
All
All
Number of Computers
only
only
Combined
Administrative
Instructional
All
N%
N%
Ni%
NZ
N%
N%
1134
88.7
109
73.6
214
63.5
348
71.3
323
66.6
457
71.9
217
11.3
35
23.6
99
29.4
116
23.8
134
27.6
151
23.7
30
0.0
32.0
18
'
5.3
18
3.6
21
4.3
21
3.3
40
0.0
10.7
30.9
30.6
40.8
40.6
50
0.0
00.0
30.9
30.6
30.6
30.5
Total
151
100.0
148
100.0
337
100.0
488
100.0
485
100.0
636
100.0
reporting only administrative use. Just 11.3% have more than one computer
and none have more than two. Among instructional only users, on the other
hand, 26.4% are using more than one computer and 2.7% report use of more
than two. Those reporting both uses show the greatest tendency to have
more than one computer (36.5%)4 as might well be expected. In summary,
data from this table show a higher degree of use of multiple computers
among instructional users than among administrative users.
b. Arrangements for computer use
Table 9 reports data regarding the arrangements for use of
computers by the various types of users ( Groups C & D). The predominant
arrangements for use are through leasing and purchasing time. However,
it is interesting that almost one-fifth of the computers are owned by
using schools and approximately one-tenth of the computers are used on
a donated time basis. Instructional users, led by instructional only
users, own a greater proportion of the computers they use than do other
users and also have a greater proportion of computers being used on a donated
time basis than other users.
c. Number of computer applications
Another measure of degree of use is the number of uses reported
by each school ( Groups C and D). Table 10 shows the number and percentage
of 5cFools reporting each number of applications by user category.
Among all users, almost half (590 schools) had only one appli-
cation. Of course, this high rate is attributed toLthe large number of
ach:..nistrative only users. Therefore, when just the schools which
reported instructional use are considered, a very different picture is
revealed. Only 5.3% (35) of the schools report only one application.
Conversely, 94.7% (631) report more than one application, 62.1% (414)
report more than two applications, 33.3% (222) more than three, 15.4%
(113) more than four, and 4.0% (26) more than five. One school reported
nine applications.
Follow-up interviews at school sites suggested respondents
tended to over estimate the number of applications in their schools:
45
51

Table 9.
Arrangement for Use of Computers by User Category
Users
Arrangemt.
for use
Admin.
I
only
N%
Instruct.
only
N%
Both
N%
All
admin.
N%
All
instruct.
N%
Total
N%
Owned
26
15.5
50
26.0
77
15.6
103
15.6
127
18.5
153
17.9
Leased
34
20.2
54
28.1
229
1.6.5
263
39.8
283
41.3
317
37.2
Purchased
time
100
59.5
53
27.6
139
28.2
239
36.1
192
28.0
292
34.2
Donated
time
84.7
35
18.2
48
9.7
56
8.5
83
12.1
91
10.7
Total
168
100.0
192
100.0
493
100.0
661
100.0
685
100.0
853
00.0

Table 10.
Schools Reporting Each Number of
Applications
(10 Possible Applications) by User Categories
Number of
Applications
Administrative
only
N'
io
Instructional
only
Combined
N
All
administrative
N
All
instructional
Total
N
1555
100.0
35
17.9
555
54.1
35
5.3
590
48.3
266
33.8
151
32.1
151
14.7
217
32.6
217
17.8
354
27.7
138
29.3
138
13.5
192
28.8
192
15.7
435
17.9
84
17.8
84
8.2
119
17.9
119
9.7
52
1.0
75
15.9
75
7.3
77
11.6
77
6.3
63
1.5
17
3.6
17
1.7
20
3.0
20
1.6
70
40.8
40.4
40.6
40.3
80
10.2
10.1
10.2
10.1
90
10.2
0.1
10.2
10.1
10
00
00
0
Total
555
100.0
195
100.0
471
100.0
1026
100.0
666
100.0
1221
100.0

however, it is difficult to determine to what degree the number of
applications was overestimated.
d. Student/ teacher involvement
Still another indication of the degree of computer use is
reflected in the amount of student and teacher involvement in instructional
applications (Group D). Data regarding the number of students and teachers
participating in these applications, as well as the amount of time spent
by each group in this regard, are presented in Table 11 (Group D).
Measures of central tendency and dispersion are shown in Table
11. These are based on sums across applications, therefore, pertaining
to each application. For example, the mean shown for student participants
reflects the average number of student participants per application. This
mean is not the average number of student participants per school since,
as seen earlier, many schools have more than one application. This will be
discussed later in more detail.
Table 11 reports both median and semi-interquartile range
statistics, as well as mean and standard deviation statistics. Both types
of statistics were reported to reflect the nature of the distribution of
these variables. The distributions of all six of these variables were
highly skewed in a position direction. This skewness results from a number
of extremely high values being reported.
High positive skewness of this nature tends to distort the
mean as a measure of central tendency in the direction of the high end
of the distribution. Notice that in every case, the median of the distri-
bution is lower than the mean. In essence, these distributions show that
a large number of the schools reporting instructional applications are
fairly closely grouped together at the lower end of continuum on each
variable with a minority of the rest of schools spread over the rest of
the continuum. They also show that 75% of 949 applications for which
the number of students participating was given, report under 117 student
participants, the remaining 25% report between 117 an 4,000 student
48
54
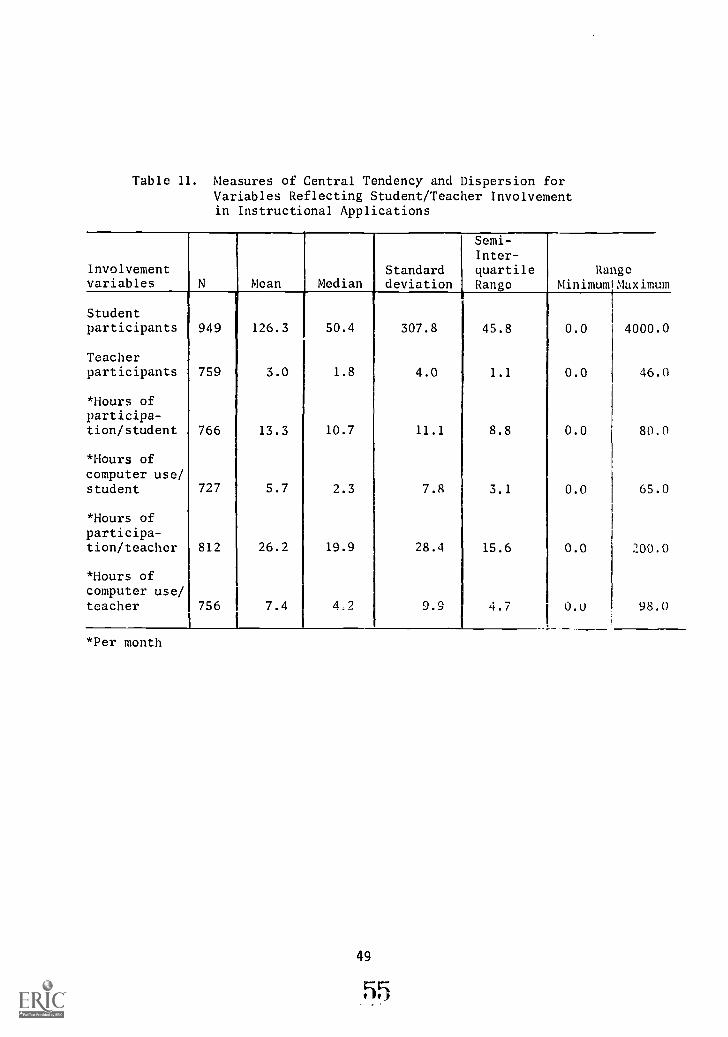
Table 11. Measures of Central Tendency and Dispersion forVariables Reflecting Student/Teacher Involvementin Instructional Applications
Involvementvariables N Mean Median
Standarddeviation
Semi-Inter-quartileRange
RangeMinimum Maximum
Studentparticipants 949 126.3 50.4 307.8 45.8 0.0 4000.0
Teacherparticipants 759 3.0 1.8 4.0 1.1 0.0 46.0
*Hours ofparticipa-tion/student 766 13.3 10.7 11.1 8.8 0.0 80.0
*Hours ofcomputer use/student 727 5.7 2.3 7.8 3.1 0.0 65.0
*Hours ofparticipa-tion/teacher 812 26.2 19.9 28.4 15.6 0.0 200.0
*Hours ofcomputer use/teacher 756 I 7.4 4.9 9.9 4.7
I0.0 98.0
*Per month
49
55

participants. To a slightly varying degree, the same is true of the
other variables.
A good deal of variation exists within each distribution.
This is largely due to the extremely high cases discussed earlier.
It should also be noted that these statistics are reported
for all types of applications. The distributions for these variables
differ widely from application to application. In addition, there is
considerable variation within application types. Both factors account for
the large dispersion for each variable.
The median number of student participants per application is
50.4 with about half (49.6%) reporting less than 50 participants. At the
same time, 50% of all schools report at least 1.8 teacher participants
per application with 1 .1.eacher participant being mentioned most frequently
(42.5%).
To extend the assessment of the degree of student/teacher
involvement in instructional applications, schools were asked to report
the amount of time devoted by each group. Schools reported the median
of 10.7 hours of participation per month per student. Estimated roughly,
the average student probably spends between 4-6 hours per day in class
or approximately 90-120 hours per month. Therefore, a student participating
in a computer application and falling at the median participant hours
per month will spend about 10% of his time at the application.
It is interesting to note that although more schools (22.6%) report
between 0 and 3 hours of participation per month per student, an almost
equal number of schools report participation in each of the following
ranges: 4-7 (19.3%), 8-11 (15.0%), and 20-23 (16.2%) hours per student
per month.
The median number of hours of total participation during which
each student actually uses a computer is 2.3 hours per month, with most
schools reporting between 0-2 hours (53.4%). It is worth noting that
some schools (2.5%) reported as much as 30-32 hours per student per month
of actual computer use.
56

Participation among teachers shows a median of 19.9 hours per
month per teacher with a modal response of 0-9 (29.4%). However, about
2/3 as many reported either 10-19 (19.8%) or 20-29 (17.2%). The hours of
actual computer use by teachers are represented by a median response of
4.2 hours per teacher per month. Responses most frequently (53.4%) fell
within the 0-4 hours per month range.
Both in hours of participation and hours of actual computer
use, there is a 2-1 ratio of teacher hours to student hours. As the data
reported here are based on a large number of schools, the skewness and
wide dispersion noted in the distribution of all the participation
variables is probably representative of the population of all schools using
computers instructionally. In turn, the measure of central tendency is
quite likely to be an accurate estimate.
These data were reported by single application rather than
by school because, in a number of instances, many of the same students and
teachers were involved in more than one application per school. Therefore,
to sum the number of teachers and participants across applications within
a school and report these data by school would have overestimated the
number involved per school.
e. Computer time
Still another indicator of the degree of computer use is the
amount of computer time being used. Questionnaire respondents ( Group D)
provided data regarding the total computer hours available to them each
month and the number of hours per month during which they were actually
running a program on a computer. In addition, postal card respondents
indicated the frequency with which they used the computer ( Group F).
Table 12 reports on the questionnaire data related to avail-
ability of computer time and actual computer running time (Group D).
Comments regarding the shape of the distribution of the student/
teacher involvement variables shown in Table 11 also apply to the two
computer use variables displayed in Table 12.
51
57

Table 12. Measures of Central Tendency and Dispersion forVariables Reflecting Amount of Computer Use for aSingle Instructional Application
Computerusevariables N Mean Median
Standarddeviation
Semi-Inter-quartilerange Minimum Maximum
*Computerhoursavailable 648 96.3 69.9 114.4 59.6 1.0 900.0
*Hours ofcomputerrunningtime 722 50.6 25.8 67.9 28.2 1.0 740.0
*Per month
52
Schools report a median of 69.9 hours per month available per
application, with many (35.3%) reporting between 1 and 39 hours. Addition-
ally, they show a median number of hours of actual running time per month
per application of 25.8. The distribution of this variable is bimodal,
with the largest number of schools reporting computer running hours at
two extreme ends of the continuum. Many schools (20.4%) report 95 or
more hours per month and others (15.1%) report between 1 and 4 hours per
month. Although comparison of these two medians does not provide an
exact ratio of proportion of computer time available which is utilized, it
reflects roughly a 40% usage of available time.
From the postal card survey ( Group F) there are data from
the 877 of the 933 instructional users who provided the information
concerning frequency of use of a computer. Of these 877, there were
633 (72.2%) using a computer at least once a week, 109 (12.4%) once a
month and 134 (15.4%) once during the school year.
3. Nature and purpose of instructional applications
(Basic Questions 10-23)
a. Instructional applications
This section deals with the major focus of the study--the instructional
applications of computers ( Groups D, E, F).
First, to place the discussion in context, Table 13 illustrates
the number and percentage of schools reporting each instructional applica-
tion and the percentage of total instructional applications represented
by each (Grou,: D).
Problem solving and EDP skills applications are by far the
most popular among instructional users. The dominance of these two
applications was confirmed during follow-up interviews (Group E ). Quite
frequently, these two applications occur together, even as part of the
same course. The EDP skills training which was reported is basically of
two types. First, the EDP skills training which occurs along with problem
solving, aims at providing students with enough programming skills to
solve mathematics, science and sometimes other types of problems. The
53
59

Table 13. Schools Reporting Each Instructional Application and Percentagesof Total Applications Represented by Each Application by UserCategory
UsersInstructional All
only Both instructional
LApplication chool Application N chool Application N School Application
Computerassistedinstruction 60 30.8 12.1 74 15.7 6.7 134 20.1 8.4
Problemsolving 162 83.1 32.6 277 58.9 25.1 439 65.9 27.4
EDPskills 161 82.6 32.4 303 64.3 27.5 464 69.7 29.0
Gaming/Simulation 62 31.8 12.5 108, 22.9 9.9 170 25.5 10.6
Mediatedinstruction 4 2.1 0.8 7 1.5 0.6 11 1.7 0.7
Otherclassroom 11 5.6 2.2 16 3.4 1.5 27 4.1 1.7
Management ofinstruction 16 8.2 3.2 82 17.4 7.4 98 14.7 6.1
Guidance andcounseling 19 9.7 3.8 233 49.5 21.1 252 37.9 15.8
Other 2 1.0 0.4 3 0.6 0.3 5 0.8 0.3
Total schools 195 471 - - 666 - -
Totalapplications 497 1,103 1,600
_
54
60

second form of EDP skills training occurs less frequently and involves
vocational training for students who wish to enter data processing
careers.
Guidance and counseling applications were mentioned third most
frequently. Follow-up interviews indicated that defining guidance
applications which are instructional versus guidance-like administrative
applications is a difficult task. It appears that many of the guidance
applications reported may actually be more administrative in nature,
involving class scheduling, grade reporting, etc. For guidance, the line
between administrative and instructional applications is exceedingly fine.
For example, there are a number of guidance applications which involve
computer updating of student cumulative records. Determining whether
such an application is an administrative record-keeping function or a
computer-based academic and career counseling system may depend more
on the ultimate use of the information rather than the functioning of
the computer in the system. This same confusion exists with management
of instruction applications. Here the question normally revolves around
distinguishing between computer assisted scheduling and management of
individualized instruction.
Fourth most frequently mentioned category was gaming and simu-
lation. These applications involve both programs commercially produced
and those produced by students and teachers for simulating such activity
as baseball games, financial planning, space ship docking, etc.. Most
of the gaming and simulation was done as part of the mathematics instruction
in the school. More will be said about the purpose of these applications
later.
Reported fifth most frequently was computer-assisted-instruction.
Follow-up interviews revealed considerable confusion regarding this term.
Schools tended to interpret CAI in a very general sense, thinking of it
as any situation where the computer supports instruction. The definition
provided with the questionnaire was considerably more restricted and
followed closely the widely accepted interpretation of CAI. Interpreted
in this way, CAI is programmed instruction on a computer, involving drill,
55
61

tutoring and dialogue between student and computer.
As a consequence of the broader interpretation given CAI by
the respondents, it is likely that the number of CAI applications was
cverreported. However, CAI is probably still the fifth most popular
instructional application in public secondary schools in the continental
United States.
Next comes management of instruction, alternately referred
to as computer managed instruction. Although there are indications
from interviews that management of instruction is a rapidly increasing
application, the number of these is not yet very large.
Mediated instruction was mentioned by only eleven schools.
Follow-up interviews at several schools reporting mediated instruction
failed to confirm the presence of this application. Mediated instruction,
involving computer monitored and guided classroom instruction, may exist
only at the college level. Appplications mentioned in the "other class-
room" and "other" categories occurred infrequently. Nature of these
applications will be discussed later in the report.
b. Combinations of applications
It is revealing to analyze the frequency with which various
applications occur together. Table 14 reports on the most frequently
mentioned computer application combinations (Group D). Administrative
applications reported by instructional users have been included in this
analysis.
The most frequently mentioned combination is guidance-
administrative (14.1%). In light of the earlier discussions regarding
the close relationship between these two types of application, this is
not surprising. This combination forms the core of the non-classroom
instructional/administrative grouping of applications.
The second most frequent combination is problem solving, EDP
skills-administrative (12.0%). Looking at other combinations, one can
see the high rate of co-occurrence of problem solving and EDP skills.
As mentioned earlier, this combination dominates instructional use.
56
62

Table 14. instructional Users Reporting VariousApplications
*Combinations
Combinations
N
of
% of Schools
Guidance, Administrative 94 14.1
Problem solving, EDP skills 50 7.5
EDP skills, Administrative 34 5.1
Problem solving, Administrative 9 1.4
CAI, Problem solving 7 1.1
Problem solving, EDP skills, Administrative 80 12.0
Problem solving, EDP skills, Gaming / Simulation 25 3.8
Management of instruction, Guidance, Administra-tive 24 3.6
CAI, Problem solving, EDP skills 20 3.1
EDP skills, Guidance, Administrative 8 1.2
EDP skills, Gaming /Simulation, Administrative 7 1.1
Problem solving, Guidance, Administrative 5 0.8
Problem solving, EDP skills, Gaming/Simulation,Administrative 31 4.7
Problem solving, EDP skills, Guidance, Admin-istrative 25 3.8
CAI, Problem solving, EDP skills, Gaming/Simu-lation 15 2.2
CAI, Problem solving, EDP skills, Administrative 12 1.8
Problem solving, EDP skills, Management of in-struction, Guidance, Administrative 27 4.1
CAI, Problem solving, EDP skills, Gaming/Simulation, Administrative 18 2.7
Problem solving, EDP skills, Gaming/Simulation,Guidance, Administrative 13 1.0
57
63

Table 14. Continued
*Combinations % of Schools
CA1, Problem solving, EDP skills, Guidance,Administrative 8 1.2
CAI, Problem solving, EDP skills, Gaming/Simulation, Guidance, Administrative 6 0.9
Problem solving, EDP skills, Gaming/Simulation,Management of instruction, Guidance, Administra-tive 5 0.8
Subtotal of schools reporting thesecombinations 523 78.5
Schools reporting all other combinations 143 21.5
Total 666 100.0
*Those that appear 5 or more timers are listed
58
64

Problem solving and EDP skills form the core of classroom instructional
applications. Additionally, schools reporting this combination of
problem solving and EDP skills along with other instructional applications
also have administrative use.
Another popul-'r combination includes gaming and simulation,
problem solving and EDP skills. If problem solving and EDP skills form
the core of instructional applications, gaming and simulation applications
are just outside this core.
CAI appears with considerable frequency in these combinations.
However, as indicated earlier, school interviews did not confirm the
high level of CAI applications reported on questionnaires. Therefore,
it probably plays a less important role than is suggested by the data in
Table 14.
The greater frequency of the combination of EDP skills-
administrative over the problem solving-administrative combination may
at first appear puzzling. However, two factors explain the more frequent
occurrence of the former. First, EDP skills t;.aining occurs more
frequently without problem solving than problem solving occurs without
EDP skills. Students who are using the computer for problem solving
will normally learn EDP skills first. Those receiving vocational EDP
skills however, will probably not do problem solving unless they are
involved in it in mathematics or science classes. Therefore, EDP
skills is reported more frequently as the only instructional application
than is problem solving. Consequently, there are more opportunities for
EDP skills to be linked with administrative than for problem solving to
be linked with administrative. Additionally, in numerous schools, some
administrative functions (attendance, record keeping, etc.) are performed
on computers by business students receiving EDP skills training. Therefore,
these two types of applications occur together in those situations.
One other combination warrants comment. Management of
instruction-guidance-administrative occur in combinations with other
applications as well as a combination of three applications. This
combination forms the non-classroom instructional-administrative
59
65
group of combinations.
It can be concluded then, that there are two primary groups
of applications. Problem solving-EDP skills form the core of a classroom
instructional group and guidance-administrative form the core of a non-
classroom instructional-administrative group. Each core combines with
other secondary applications. Problem solving-EDP skills combine most
frequently with gaming/simulation and CAI. Guidance-administrative
combine with management of instruction. In turn, these cores and their
accompanying secondary applications combine with one another with varying
degrees of frequency. The two longest combinations of applications most
frequently reported are listed as the last two combinations in Table 14.
These two combinations represent linking of the two primary cores along
with their secondary applications. These popular combinations (occurring
at least five times) account for the 78.5% of all combinations reported.
With a common understanding of what is meant by each application
(definitions provided in PROCEDURE section), knowing how many schools
are involved in each and how the applications occur in combination gives
a fairly clear idea of the emphases in computer use in secondary schools.
However, one can only draw inferences from this information about what
students actually do when they participate in these applications and the
purpose of the applications.
c. Active versus passive role
Through the questionnaires and interviews, information was
gathered about activity and purpose for each application. Table 15
reports the frequency and percentage of schools which described the
activity of students, categorized as shown for each classroom application
( Group D).
Categories were constructed after analyzing responses. These
responses describe predominantly- active participation. As a result,
only a few of the categories det::loped from these responses are even semi-
passive (introduced to computer uses, learns a programming language). The
more passive categories are highly general in nature. The active
60
66

Table 15.
Instructional Users Responding to Each Student Activity
Category by Application
IStudent Activity
%
CAI
Problem solving
N%
EDP 5kills
N%
Gaming/
Simulation
a%
et er
classroom
N%
Total
N%
Writes and runs programs
156
74.3
1E9
53.'
29
28.4
28.6
350
53.2
Runs programs
30
100.0
25
11.9
23
7.
15
14.7
14.3
96
14.6
Writes programs
39
18.6
39
13.4
13
12.7
838.1
99
15.0
Debugs/analyzes programs
83.8
20
6.1
22.0
14.8
31
4.7
Keypunches
62.9
39
13.1
11.0
46
7.0
Flow charts
62.9
12
:4.1
32.9
419.0
25
3.8
Introduced to computer uses
20
6.8
20
5.0
1
Learns programming
21.0
18
6.1
14.8
21
3.2
Operates EDP equipment
21
7.1
21
3.2
Plays games or simulates
62
60.8
62
9.4
Drills and practices
826.7
81.2
Observes and demonstrates
41.9
20.7
22.0
81.2
t
Analyzes systems
41.41
40.6
Subtotal (Respondents)
30
210
295
102
21
658
Omits
104
77.6
229
52.1
169
36.4
68
40.0
622.2
576
46.7
Total
1134
439
464
170
27
1234
*Some application types excluded because of insufficient responses
other hand, describe specific behaviors.
'sive categories, if described more specifically,
olve at least semi-active participation. For example,
roduced to computer uses" probably involves behavior
lectures, studying computer texts, etc.
!
RIWS at schools confirm this emphasis on active partici-
emphasis on writing and running programs (Group E).
ications, there is some lecturing during which students
However, teachers normally have students writing
bs as soon as possible.
a few schools visted was there no formal course for
ogram and solve problems on the computer. In these
old read the materials on their own, and receive informal
in their spare time.
in the typical situation, there was a formal course
e the computer. In these situations, the role of the
;i1 some cases, the teacher would lecture for several
students started interacting with the computer by running
had written. In other situations, the students started
t week in their interactions with the computer. Usually
acher and student varied with the degree of access the
e computer. For a desk-top calculator or a terminal
nts could learn the basics and begin interacting with
tter of days or weeks. However, with a school that only
rge expensive machine, which was paid for by the hour
ble exclusively for the students use, the instructor
1 months lecturing, and the students would spend many
extbook exercises prior to their first interaction with
er the interactions started the students had a great
ity in what they did and Shen they did it. In most
ecific problems that they had to solve. Yet, when and
the problems was up to them and the assistance
plying the problems was largely informal and on an
62
f8
individual basis. Also, students :;11 many cases were encouraged to create
and solve their own problems. Usually students worked on their own
rather than in groups.
In a very few situations, students actually learned to operate
the computer. Normally, the students learn to program and use the computer
while someone else operates the computer to run their programs. It is
common in these latter situations for the students to have a hands-on
experience at least one time during the course. In many situations,
students communicated with a computer through a terminal. It seems safe
to say that most of the students who are involved in learning how to use
a computer spend most of their learning time actually writing out programs,
having them run, and revising them until they are correct.
Two situations do not fit into the above description and are
both CAI applications. In these situations, the teacher helps the student
learn a few basic skills on how to interact "on line" with the computer
and the remainder of the time the student interacts completely with the
computer terminal. Responses given for CAI applications on the question-
naire provide little information for describing the activity involved
because they do not provide specific descriptions.
Overallywriting and running programs dominate student activities.
Furthermore, this activity to a large extent, occurs in problem solving
applications.
d. Purpose of computer application
The purposes given for the computer applications varied widely.
They vary within applications as well as across applications. Some of
the purposes given are very specific (reinforce arithmetic skills); most
are relatively general (teach science, individualize instruction). At
the same time, some responses were oriented toward subject matter (facili-
tate problem solving, teach programming). Others were concerned with
teaching methodology or approach (motivate student, provide enrichment).
Table 16 gives the number and percentage of schools responding
with the purposes listed for each of five classroom applications ( Group
63
69

Table 16. Schools Responding with the Purpose Listed fur EachApplication shown
CAIN
3519
9
0
8
2
1
*%
40.221.810.310.39.22.3
1,1
Teach programming, other EDP skillsReinforce arithmetic skillsDrill, practice and provide tutorial assistanceIndividualize instrueticu6CAIRemedial workTeach scienceTeach businessMotivate specialeducation students 1 1,1
Other 3 3.4
Total responses 87Problem solving
Teach problem solving 102 31.9Facilitate problem solving using computer as a
computational aid 65 20.3Teach and practice programming and computer operation 46 14.4Develop logical approach to problem solving through
computer operation 37 11.6Introduce computers 20 6.2Teach math, science 13 4.1Motivate and stimulate students' creativity 11 3.4
Other 26 8.1
Total responses 320
EDP skills
Teach computer programming 120 35.9Teach computer concepts, an introduction to EDP 83 24.8Teach computer operation 48 14.3
EDP skills (general response) 48 14.3Provide vocational training 10 3.0Motivate students in math and provide enrichment in math 10 3.0
Solve problems 6 1.8Teach keypunching 5 1.5Other 4 1.2
Total responses 334
Gaming/Simulation
Teach theory, techniques of gaming, simulation,simulation of math models 26 25.7
Teach business and industrial operations, economic,social, other real-life situations through simulation 25 24.g
Motivate students and promote interest in computers 18 17.8Teach, practice and enhance programming skills 14 13.9
64
70

Table 16 (continued)
Demonstrate capabilities and diversity of computersTeach math concepts
13 12.9
5 5.0
Total responses 101
Other classroom
EDP skills - programming, operation, etc. 14 70.0Problem solving 5 25.0Gaming/Simulation 1 5.0
Total responses 20
*Percentage of schools with the particular application who responded to the
purpose item in the questionnaire.
65

0). Only those applications shown in Table 15 are listed in Table 16.
Although many schools did not respond to the purpose questions,
there are enough responses to identify some general trends.
Purposes listed for CAI provide insight into a problem
presented earlier. Most of the schools responding (40.2%) indicated that
the purpose of CAI was to teach programming or other EDP skills. It is
possible that some of the schools may have CAI applications which teach
these skills in a programmed instructional mode, but these are rare.
Most of the respondents listing this purpose probably interpreted CAI
in one of two ways:
1. A broad definition including instruction assistedby a computer in any manner.
2. The learning situation in which a student entersa program he has written into a computer througha terminal and receives output back from the com-puter indicating if the program compiled orassembled and if it didn't, why not.
The first interpretation was discussed earlier. In this case,
the respondent has stretched the definition of CAI to the point that it
can include any instructional situation in which the computer plays a
role.
The second interpretation is less of a distortion of the
meaning of CAI, but nonetheless, does not meet the definition of CAI.
The student enters his problem solving program into a computer. The
computer then feeds back to him, not whether his program will solve
the problem, but rather whether his program can be operated on by the
computer and if it cannot, what is wrong with it. Thus, there is two-way
interaction between student and computer. After learning what is wrong
with his program, the student must revise his program and return at a
later time to re-enter it. In a sense, this is tutorial instruction.
However, it is not in the programmed instructional mode, inherent in CAI.
The largest number of schools reporting problem solving
applications simply stated that the purpose was to teach problem solving
66
79

(3l.9%. Another 31.9% also give teaching of problem solving as the
purpose by specifying one of two aspects: facilitating problem solving
by using computers as a computational aid or developing a logical approach
to problem solving through computer programming. The next largest
number of responses (14.4%) was concerned with teaching programming and
other computer operations. The category "Introduce computer" (6.2%)
represents the purpose which focuses on the computer as the subject of
instruction rather than as the tool of instruction as in the case with
the responses just discussed. It should be noted that since schools
gave more than one response, some of the schools which gave computer
oriented responses probably also gave teaching of problem solving as a
purpose.
All responses regarding the purpose of EDP skills center upon
teaching about the computer except 3.0% of them which deal with motivating
students and some non-categorizable responses. However, except for the
3.0% which specifically mentioned vocational training as the purpose of
teaching of EDP skills, the majority of the purposes involve preparing
the students for problem solving, gaming, etc. Other information from
school interviews (Group E) suggests that most of this teaching is in
preparation for using thr computer as a tool.
Responses dealing with the purpose of gaming and simulation
are fairly evenly distributed over six categories. Each category deals
with a slightly different area. The most popular purpose (25.7%)
emphasizes teaching of gaming and simulation theory and technique. The
next most popular (24.8%) uses the technique and the computer as a tool
to teach about real situations (business, social, etc.). Next, gaming
and simulation is used as a motivational device (17.8%). The two sub-
sequent response categories are concerned more closely with the computer:
teaching, practicing and enhancing programming skills (13.9°/) and
demonstrating capabilities and diversity of computer (12.9%). Finally,
some mentioned the teaching of mathematics concepts (5.0%).
School personnel participating in the interviews (Group E)
were asked to give the overall purpose of the use of computers in their
67
73

schools. Many respondents gave several purposes for each application.
Using the computer as a computational tool for problem solving was
given as the purpose by more respondents than any other (about one-fourth
of them). Most problem solving was stated to take place in the mathematics
and business areas. A slightly smaller number said the purpose was to
teach students an appreciation of computers. Another quarter of the
respondents emphasized the importance of developing logical thinking and
mathematical ability. A somewhat small number of respondents specified
the purpose as teaching about computers themselves. Some provided
vocational skills training and others were simply attempting to generate
an interest in computers as a career field.
Other scattered responses were concerned with preparing students
for college, motivating students, and remedial instruction in specific
school subjects (CAI applications).
The results from the interviews support the conclusion that
a computer is generally used in a supportive role in instruction. Emphasis
is on teaching the content or skills of a subject matter. The computer
is used as a computational aid, a motivator, or as an example of the
nature of logical and numerical analysis rather than as the object of
instruction.
e. Applications by subject area
The use of computers can be related to the school curriculum
as a way of illustrating the nature and purpose of the instructional
computer applications.
Respondents to the questionnaire provided information regarding
subject areas in which computers were being applied (Group D). Table 17
reports the number and percentage of schools listing each subject area
involved in each application.
The subject areas were not always listed. For example,
applications such as those in guidance do not deal with specific subject
areas.
The dominance of mathematics in computer applications is clearly
66'
'74

Table 17.
Schools Listing Each Subject Area for Each Application
Applications
Subject Area
CAI
N%
Problem
solving
N%
EDP
zkills
N%
Gaming/
Simulation
Nf
%
Mediated
instruction
N
i
1
Other
classroom
N
1Management
instruction
N
of
%
Other
N
TOTAL
N%
1.
Math
93
85.3
361
92.3
197
58.4
74
53.2
360.0
960.0
675.0
222.2
745
73.5
2.
Science
36
33.0
199
50.9
63
18.7
35
25.2
240.0
16.7
225.0
0--
338
33.3
3.
Business
education
11
10.1
65
16.6
53
15.7
19
13.7
0--
16.7
0--
1i1.1
150
14.8
4.
Data processing
15
13.8
36
9.2
132
39.2
31
22.3
120.0
426.7
337.5
222.2
224
22.1
5.
Englfsh
76.4
30.8
20.6
75.0
12.0
0--
225.0
111.1
23
2.3
6.
Social studies
21.8
71.8
51.5
25
18.0
240.0
16.7
112.5
111.1
44
4.3
7.
Foreign
languages
43.7
20.5
10.3
42.9
0--
16.7
0--
0--
12
1.2
8.
Industrial arts
and agriculture
0-
51.3
20.6
10.7
0o
--
o--
o--
80.8
9.
Music and art
10.9
20.5
10.3
10.7
00
--
0--
0--
50.5
10.
Health, safety,
physical educa-
ticn
0--
30.8
10.3
21.4
0--
0--
C--
0--
6o.6
11.
history
1.9
10.2
0--
32.2
00
--
0--
0--
50.5
12.
Other
21.8
92.3
82.4
12
8.6
0--
16.7
3--
444.4
36
3.6
Subt-.tal
109
391
337
139
515
89
..._
1013
Omits
25
18.6
48
10.9
127
27.4
31
18.2
654.5
12
44.4
90
91.8
248
96.5
586
36.6
Tctal
i134
439
464
170
11
27
98
257
1600
1

evident from Table 17. The presence of mathematics is most evident in
problem solving and CAI applications (92.3% and 85.3%). However, even in
EDP skills, mathematics is the subject area more frequently mentioned than
any otherlincluding data processing. The proportion of EDP ski'ls applied
in mathematics, sciences and social studies versus those in data processing
and business education provides an indication of the emphasis of EDP skills
training for use of the computer as a tool for learning an academic subject
area (approximately 80%) versus EDP skill training for vocational prepara-
tion (approximately 55%).
When project staff members arranged school interviews, they asked
to interview the individual in the school who was most familiar with the
instructional computer applications. With few exceptions, the individual
interviewed was a member of the mathematics department. From the history
of instructional computer applications presented by interviewees, it is
evident that these applications most frequently begin in the mathematics
departments. If they spread throughout the school (frequently they do not)
it is through the efforts of the mathematics department staff. In some
cases, applications develop independently in separate departments (mathe-
matics and business normally), but these cases are rare.
Why the applications have not spread more to other departments
within a school is not clear. Interviewees ( Group E) suggested that there
is an easier acceptance of computers among the mathematically-oriented
teachers. Teachers in other areas are frequently hesitant to undertake
computer applications because of their unfamiliarity with computers and the
assumed need for mathematical and electronic orientation to machines.
However, it seems that fewer applications have been developed in non-
mathematical subjects simply because the possible applications are not as
readily apparent as they are in mathematical subjects. To effectively
initiate a computer application in an English class, a teacher must be
considerably more motivated than a mathematics teacher who is able to turn
to a series of well established applications.
The majority of interviewees indicated that they had no problem
integrating computers into their own curriculum. However, as just indicated,
70
'7 6

when it comes to integrating computer applications into curricula outside
of mathematics, problems are encountered.
Where integration has been smooth, most frequently one particular
individual is given considerable credit. In one instance, this individual
was a bright, ambitious student teacher who got teachers interested in
computer work. Normally, the individual is the chairman of the mathematics
department or another influential mathematics teacher. One school has a
mathematics coordinator who is responsible for visiting classes and suggest-
ing ways in which teachers might use a computer in their instruction.
Teachers commented that while one individual was the motivating
force behind integrating computers into the curriculum, he was normally
aided by one or more of the following factors:
1. A favorable attitude on the part of fellow teacherstoward computers and tea%..hing innovations in general.
2. A curriculum which was either quite flexible or in theprocess of being changed at the time that computers werebeing introduced to the school.
3 A cooperative administration willing to support theintroduction of computer technology into the classroom.(Teachers commented that they had never let the adminis-tration down when it came to promises which they hadmade about computers. One business teacher attributed anincrease in enrollment in his department's business coursesto the enthusiasm generated by the presence of the com-puter. This increase in enrollment is counter to thenational trend.)
Problems in integrating computer applications were most frequently
traced to the reluctance of some teachers to initiate applications, as men-
tioned earlier. In addition, others mentioned problems with scheduling.
One scheduling problem centers around gaining sufficient access
to a computer to accommodate all students. This problem is normally
resolved by securing additional hardware. In some situations, it means
scheduling of students so that full utilization is made of existing
computer capability.
The other type of scheduling problem involves the curriculum
71

itself. Many schools indicated that they are faced with schedules for students
which are packed with required courses. These courses cannot be replaced
and there is not enough time left in the school day for any other courses.
These required courses frequently deal with content on which students will
be tested, on a standardized basis. Such lack of flexibility is particularly
prevalent in scheduling of college bound students. Several teachers
lamented the fact that they had been unable to introduce these students to
computers because of the other traditional demands on their school time.
Several approaches to solving curriculum inflexibility have been
attempted. Some schools have set up computer clubs and after school computer
activities for students. Others have developed mini-courses which are
sandwiched into the existing curriculum or given after school, for a short
duration, Still others are turning to modular scheduling in an effort to
put more flexibility into the curriculum. Modular scheduling involves short
curriculum units permitting curriculum planners more time units with which
to work and therefore more possible openings into which to introduce com-
puter applications.
f. Integration of computers into the curriculum
Of the 933 schools which indicated instructional use on the postal
card survey (Group F 919 provided information about whether they had a
formal course in which a computer was used. Of these respondents, 619
(67.4%) indicated that they did have a formal course in which they were using
a computer. This provides some indication of extent of integration into
the curriculum.
In addition, from interviews (Group E), it is apparent that the
presence of a formal course where a computer is used is not the only means
by which a computer is integrated into the curriculum. Some schools simply
use a computer as needed in a variety of courses. Others set their
computer up in a laboratory and students use it there for a variety of
course work as they desire. Despite the fact that no formal course has been
established, these schools are making considerable use of computers. In
such situations, teachers do not normally plan courses to include computers.
Rather, students are the ones who choose to use computers.
72

Information regarding frequency of use of computers provides
another indication of integration into the curriculum. Of the 933
instructional users (group F) who responled to the postal card survey,
877 indicated the frequency with which they used a computer. Of these
schools, 633 (72.2%) used a computer at least once a week, 109 (12.4%)
once a month and 135 (15.4%) once during the school year. This indicates a
fairly high frequency of use.
The grade level at which applications are introduced provides
information regarding the nature of applications and the degree to which
they are part of the overall school curriculum. Table 18 reports the
number and percentage of schools introducing computer application at each
grade level (Group D).
As a point of reference, it should be remembered that there
were schools included in this survey population which had grades in
addition to 9-12.
The modal grade in which applications are introduced varies
between grades 9-11 from application to application. the most Frequently
mentioned grade of introduction across applications is grade 10. An
encouraging sign from the standpoint of a person who might be promoting
computer use is the fact that most applications (85.0%) are introduced before
the twelfth grade. Therefore, the opportur:ty for students to be exposed
to computer use for more than one year is present.
CAI shows the greatest dispersion of introduction, with three of
the schools which most likely have grades 1-12tintroducing CAI in the first
grade.
The modal grade of introduction for EDP skills and gaming and
simulation is one grade later than for CAI and problem solving. Other
evidence indicates that when used in mathematics and science courses, EDP
skills are taught prior to,or simultaneous with problem solving. One
explanation might be that the introduction of EDP skills as vocational train-
ing may tend to occur later than EDP skills in conjunction with problem
solving. The validity of such an explanation would be interesting to test.

51
1.0
60
716
15.2
83
2.8
917
16.2
j 4N10
35
33.3
11
16
15.2
12
13
12.4
13
0
14
0
Other
0
Subtotal
105
78.4
Omits
29
21.6
Total
134
10.3
0
20.6
0
21
6.4
18
5.9
11
3.4
82.6
58
17.7
32
10.6
103
31.5
89
29.4
81
24.8
107
35.3
46
14.1
45
15.2
10.3
2 .
0.7
00
20.6
0
327
74.5
303
65.3
112
25.5
161
34.7
439
464
0 0 6 5
16
32
39
25 1 0 0
124
46
170
4.8
4.0
12.9
25.8
31.4
20.2
0.8
72.9
27.1
0 0 5 3
11 7 5 2 0 0 0
33
108
141
15.2
9.1
33.3
21.2
15.2
6.1
23.4
76.6
0 0 5 0 7 3 6 3 0 0 0
24
228
252
*So few responses were provided for mediated- instruction,m4nagement of instruction and "other"
applications are included with "Other classroom".
20.2
20.2
20.8
71
7.8
30
3.3
29.2
141
15.4
12.5
269
29.4
25.0
254
27.7
12.5
135
14.7
40.4
0 20.2
9.5
916
57.2
90.5
'84
42.8
11600
that these

Table 19 presents medians and semi-interquartile ranges for each
of six variables according to each of five instructional applications
(Group D). These are not presented due to the insufficient number of
responses for the other instructional applications. The first two variables
reflect degree of student and teacher participation, while the last four
variables are concerned with extent of student and teacher interaction with
the computer. Before discussing each of these variables in turn, it should
be stated that a good deal of variation exists within the data.
With respect to student participants, the largest median number
of students per school is reported fcr guidance relative to the other four
applications (99.5). Medians reported for teacher participants across the
five applications differ by only 0.6 indicating that the number of teachers
involved in each of the applications is relatively constant. While more
students per school are involved in guidance, students on the average spend
fewer hours per month (3,5) participating in guidance than for any of the
remaining applications. The most hours per month are spent by students in
the learning of EDP skills. The number of hours per month which each
student on the average uses the computer is similar across the five applica-
tions. In general, teachers spend more time per month than students do
irrespective of the type of application. Furthermore, the data for number
of teacher hours of participation roughly parallels the data for number of
student hours of participation. Teachers are involved more hours per month
in EDP skills and fewer hours per month in the other applications. The
fewest hours of teacher involvement per month are reported for guidance.
Medians reflecting actual hours of computer use by teachers differ only
slightly from one application to another. As would be expected, both
students and teachers spend a small proportion of the total number of hours per
month involved in an application actually using the computer.
g. Assessing computer skills
This discussion deals with the level of computer skill achievement
expected of students involved in problem solving and EDP skills applications.
In most of the schools where interviews (Group E) were conducted,
teachers have established some type of standards which they expect students
75
Si

Table 19.
Involvement of Students and Teachers in Each Instructional Application
Gaming/
CAI
Problem solving
EDP skills
Simulation
Guidance
Semi-
Semi-
Semi-
Semi-
Semi-
Inter-
Inter-
Inter-
Inter-
Inter-
quartile
quartile
quartile
quartile
quartile
Variable
Median
Range
Median
Range
Median
Range
Median
Range
Mediae
Range
Student
participants
63.0
72.0
60.0
60.5
44.5
34.4
42.3
32.6
99.5
323.3
Teacher
participants
2.1
1.6
2.0
1.4
1.5
1.2
1.6
0.6
1.7
3.0
*Hours of
participation/
students
8.0
7.3
10.8
5.4
15.2
8.3
6.3
5.6
3.5
10.0
*Hours of actual
computer use/
students
2.7
4.6
2.4
3.2
2.2
3.4
2.1
2.2
1.7
1.9
*Hours of
participation/
teachers
17.4
16.8
21.5
13.6
25.6
15.9
9.7
1.1
6.7
4.4
*Hours of actual
computer use/
teachers
4.1
3.5
4.6
5.0
4.5
5.2
3.4
3.3
2.7
1.6
*Per month

to meet. Some teachers indicate that students are expected to learn just
the basics about computers. Other teachers indicated that students should
appreciate both the capabilities and limitations of the computer and
generally feel comfortable with it.
In the majority of the schools where the computer is used in
mathematics and science classes, programming is taught as a tool for solving
problems and as a vehicle for studying the logical approach to problem
solving. Students learn just enough programming to aid them in solving
problems. This is not to say that this is the maximum performance obtained
from all students. According to every teacher interviewed, some of the
students go far beyond what is expected of them in terms of programming.
Many, in fact, develop programming skills far superior to those of the
teachers. In these situations, teachers must have enough self-confidence
in their ability and knowledge as mathematics or science teachers not to
be disturbed by students who know more than they do about programming.
Some teachers are probably unable to face such a situation and this may
explain why they do not utilize a computer in their teaching.
Some schools offer courses designed to provide vocational
training in keypunching, machine operation and programming. There are
students completing these programs who do get jobs as keypunchers and
beginning machine operators. A few students even obtain jobs as junior
programmers.
More than one teacher said that some students in college preparatory
courses become so engrossed with programming that their performance in
other courses suffers. In addition, some are diverted from attending
college by the attractive salaries paid in the computer industry. This
effect on overall achievement is an important one and will be described in
more detail later.
In a fair number of schools where interviews were conducted, no
specific or formal computer achievement level was set for students. The
computer was provided as a tool for students to use as needed or as an
enrichment to their basic subject areas (normally in mathematics). In
these cases, students were at liberty to spend as little or as much time
77

with a computer as they cared to. Achievement level therefore, was largely
determined by the student himself. In these situations and others, where
the computer was used more systematically in class work, it was common for
some students to spend many free periods and after school hours with a
computer.
The most frequent achievement standard for a student is to be able
to write a program, debug it and have it run successfully on a computer. In
addition, they frequently are required to document their programs with a
flowchart.
h. The effect of the use of computers
Because there is a general lack of systematic evaluation of
computer involvement in instruction it is difficult to assess the effect
on student achievement (interview results, Group E). One notable exception
is one mathematics teacher who plans to perform a controlled study over the
next two years to empirically determine the effect of a computer on the
achievement of students in mathematics classes in his school. Most teachers
have a feeling that it brings improvement to this instruction. Thoir claim,
it must be said, is impressively supported by logical and anecdotal evidence.
For example, they point out that it is only reasonable to expect a student
to grasp the concepts behind a solution to a problem if he has written a
program to produce the solution. He spends his time analyzing the problem
and developing a solution; not in the tedious task of performing the
arithmetic required to arrive at an answer. A computer does the arithmetic
for him. Anecdotal evidence comes from interviewees who were asked to
identify what the computer contributed to the learning process in the
school setting. Teachers told many stories about students whom they had
tried to reach or motivate many times, and in many ways. They had failed
until they introduced the students to computers. From this point on, these
students not only learned a lot about computers, but they learned more
about the subject matter of the course,
One teacher cited the dramatic case of one young individual
classified as an educable mentally retarded student, who advanced three
years in mathematics skills in one semester of working on a computer. There
78
84

are other examples of students who teach themselves programming languages
other than those taught in their courses, students who have won national
awards for their programs, and a student who wrote a software manual while
at home nursing a broken leg.
These and other stories illustrate the motivational effect that
a computer has on some students. It is important to remember that this
effect is not universal. There are students left uninspired by the computers
or even negatively affected. At many schools, interviewers were told that
in courses in which a computer was used extensively, students either became
deeply involved and excited about computers or completely rejected computers
and asked for a transfer to a non-computer oriented course. How and why such
a dichotomy occurs in some instances is an interesting question for psychol-
ogists and educators to study.
Some teachers warned that the motivational effect of computers may
be temporary, lasting only as long as the novelty lasts. Others see a more
permanent motivational effect. The latter group points to the "hands-on-
experience" as the important feature of computer work which motivates students.
Several teachers indicated that the computer as a motivator had gone a long
way to cure "senioritis" in their school (the tendency for students to
regress in achievement during their senior year.)
Other features of computers which contribute to the learning
process are closely linked to the motivational aspects. The feedback, for
instance, which students get from their computer interaction seems to be
an important factor in the learning process. As the student works, he
receives immediate feedback from the computer which he can use to assess
his progress and determine what he is doing wrong. Frequently in traditional
classroom situations, such feedback is not evident. Feedback of this type
may be particularly important to the so-called "slow" learner. For the
first time he can see the results of his work and is reinforced for
accomplishing something.
For many students, especially the very bright ones, the computer
presents a challenge, possibly the first challenge they have faced since
entering school. The students soon learn as much as possible about the
79.
85

tremendous capabilities of computers. In soil schools surveyed the challenge
posed by computers was met in misdirected but interesting ways. For example,
in one school, students discovered a way to manipulate the functioning of
terminals at other schools through their own terminal. They were then able
to turn other terminals on and off at will. Although this creativity was
misdirected, it nonetheless was creativity, required in large measure to
perform such an act.
The computer contributes to learning of problem solving, logic,
and decision making. The logical assumption is that if a student can
write a computer program to solve a problem or simulate a situation on a
computer, he will understand the problem or situation better. This notion
is borne out by casual observations of teachers interviewed. The degree
of understanding required to write a successful computer program to solve a
problem is far greater than that required to carry out the hand calculation
necessary to solve the same problem.
In addition, the computer as a computational aid takes the drudgery
out of mathematics and provides more time for learning the more important
concepts and developing the capacity to think through and analyze
problems logically. In this regard, one teacher commented that computers
make mathematics relevant. The opportunity for the student to tackle real
problems which may require huge amounts of calculation is available
because of the capacity of computers to perform these calculations.
With CAI, the capacity to individualize instruction is available.
Students can work at their own pace and with considerable individualized
attention. The "slow" student does not have to face the embarrassment of
competing in the group and the fast student is not held back by the group.
One final comment, which may raise more interesting research
questions, concerns competition and cooperation in instruction. Some
teachers pointed to the learning benefits gained when students compete with
one another in programming their computer. Still others pointed out that
students cooperate and help one another more in working with the computer
than in any other instructional activities. In several cases, this has led
to students becoming teacher assistants even to the point in one school
80
RC

where students develop and administer computer programming achievement tests
to other less advanced students. The dynamics which lead to competition or
cooperation in these classes, plus the effect of each, appears worthy of
further study.
i. Sources of software
Two other questions also concern the nature of instructional use.
These deal with who prepares software for applications and which programming
language(s) are used. In Table 20 the number and percentage of schools
indicating each software preparer for each application are reported (Group
D).
Overall, teachers most frequently (39.2%) participate in the
preparation of software for computer applications. Mentioned second most
frequently (26.8%) is a computer specialist outside of the school. These
situations normally involve applications in which "canned programs" are
used. Next most frequently mentioned (19.4%) is the student. No other
preparer of software comes close to matching the involvement of these three
top categories.
Except for guidance applications, where computer specialists out-
side of the school do most of the software preparation, teachers, computer
specialists outside of school, and students occupy the same relative
position for all applications.
In problem solving and EDP skills, the most common activity among
students, as we saw in Table 15, was the writing and running of programs.
Software preparation by teachers and outside specialists involves, in most
cases, development of curriculum materials, as well as some programs which
are used as samples of problem solving. There are also some problem solving
and EDP skills applications in which students do not write programs but may
run others generally written by teachers or outside specialists.
In the interview (Group E), teachers were asked whether curriculum
materials were developed in the school or outside. Their responses indicate
that materials used in any one school tend to come from a wide variety of
sources.
81

Table 20.
Schools Indicating Each Software Preparer for Each Application.
Application
Preparer
*CAI
N%
Problem
solving
N%
EDP
skills
N%
Gaming/
Simulation
N%
Other
classroom
N%
Manage-
17.ent
N%
Guidance
N%
Total
N%
Student
18
18.0
96
33.2
76
28.2
37
31.4
416.6
218.2
13.4
234
27.8
Teacher
55
55.0
170
58.8
169
62.8
59
50.0
11
44.0
545.4
413.8
473
56.2
Administration
77.0
11
3.8
14
5.2
32.5
312.0
19.1
517.2
44
5.2
Computer special-
ist in school
55.0
11
3.8
13
4.8
5.9
28.0
218.2
31.0
49
5.8
Computer special-
ist out of school
39
39.0
115
39.8
104
38.7
46
39.0
624.0
327.3
11
37.9
324
38.5
Other-out of school
11.0
31.0
20.7
21.7
0__
19.1
13.4
10
1.2
Unspecified computer
specialist
44.0
13
4.5
12
4.5
11
9.3
520.0
0__
45
5.4
Other
44.0
10
3.5
83.0
43.4
0--
02
6.9
28
3.3
Subtotal
100
289
269
118
:25
11
29
841
Omits
31
25.4
150
34.2
195
42.0
52
30.6
18
41.9
87
88.8
223
88.5
759
47.4
Total
134
439
464
170
43
98
252
1600
*So few responss were provided for mediated instruction and "other" that these applications
are included with
"Other classroom".
About two-thirds of those interviewed had developed some of their
own curriculum matevials. The majority of the material from the outside had
come from hardware companies. Other sources included school systems
(through curriculum projects), students, NSF institutes and projects,
universities, and other public and private sources.
j. Programming languages
The next issue concerns the programming languages which are used
for the various applications. Table 21 displays the number and percentage
of schools reporting programming languages for each of the applications
( Group 0).
Table 21 shows that overall, FORTRAN is the most popular
programming language (49.7%). BASIC ranks second (38.2%). Other programming
languages, including CPL, Coursewriter, regional variations on compiler
languages and machine languages, are next (29.2%). Unspecified assembly
languages for various computers were reported for 13.4% of the applications
and Autocoder for 5.8%. These latter two taken together account for a total
of 19.2% of the applications for which an assembly language is used.
There are important variations from application to application
which deserve comment. For CAI applications, a wide variety of programming
languages are reported. BASIC and FORTRAN are reported most frequently
for CAI (39.8%,and 38.8%). As seen from Table 20, these programs are most
frequently written by teachers and computer specialists.
With problem solving, gaming and simulation, and EDP skills
applications, students do a fair share of the programming. For problem
solving and gaming and simulation, FORTRAN and BASIC dominate. For EDP
skills, FORTRAN, BASIC and "other" are most prevalent. In each of these
cases, the fourth most prevalent language is an assembly language, either
Autocoder or "unspecified."
There is a controversy among schools regarding whether students
just learning to program should start with an assembly language or a
compiler language. Those who favor the compiler languages claim that
learning an assembly language takes too long for their purposes. These
83
89

Tat)le 21.
.-chools Indicating Each
Programming
I*CA,_
.,,
i!. ing
Language
1
l'ORTRAN
:38
1.'-.:
,131
52.5
Coift
..I.
10.,
2.3
ALGOL
11
.0
f,
1.7
Pl./1
0i
;2.0
ihsoeciffed
assembly
20
2u.4
42
112.2
Oti13r
3;-.:1
,...
,!.
83
124.1
Subtot..1:
',,S
345
I i
=Total
134
43994
121.4
.40
Omits
:6.9
36
EDP
skills
1
168
94 26 3 5
10 44
96
173
464
57.7 t
64
i
32.31
49
1
8.9!
5
I
,
1.0
1
4.5
'-..!
.
-1.
,si
":,
3.4
2f
!
,
116.,1
15.2
20
0
;
37.3
i48
22
I
-,,,
-.
170
.
43
1
! S8
96
L
32..0
89.8
1=
252
1
*So few responses were provided for mediated instruction and "other" that these applications
are included with "Other
classroom".

teachers are normally involved in problem solving applications and want
students to learn the necessary programming skills to solve problems as
quickly as possible since the object of instruction is learning problem
solving, rather than learning about computers. Teachers favoring assembly
languages on the other hand are focusing upon the computer as the object of
instruction.
It is true that those involved in problem solving emphasize the
importance of learning logical solution methodology, but they feel that the
logic of compiler language provides the needed understanding of systematic
solution of problems.
k. Use of computer time
Medians and semi-interquartile ranges are shown in Table 22 for
two variables concerned with the nature of computer running time for the
same five instructional applications which are included in Table 19
(Gr.up U). Again, a fair amount of variation is present in these data.
Consideration of actual computer running time in hours per month
by application indicates that more time is spent proportionately for CAI,
problem solving and EDP skills than for gaming and simulation and guidance.
The computer is used the fewest hours per month for guidance. Of the total
amount of time the computer is running, some lesser amount of time is
devoted to use of the CPU. For CAI, the percentage of CPU time is the
largest while for both EDP skills and gaming and simulation applications
the lower percentages are reported.
4. Level and source of support of instructional use
a. Estimated costs
It is generally believed that a good deal of money is being spent
on computer applications in secondary schools in the United States. At the
same time, it is very difficult to get an accurate estimate of this cost.
This difficulty is reflected in the fact that only 322 of the 933 instruc-
tianal users who completed the questionnaire ;Group D) were willing or able
to provide information regarding the cost of computer use. During
interviews (Group E), most teachers indicated that budgetary matters
85
Si

lee of Computer Running Time for Five InstructionalApplications
Variable
*Actual Computer Running Time *Percent CPU Time
Median
Semi-interquartile
range Median
Semi-interquartile
range
32.0 26.8 53.7 37.0
31.5 34.4 44.1 32.6
30.7 32.8 28.9 31.5
18.9 22.6 29.9 40.4
12.0 16.8 37.0 9.5
86
92
concerned with computing costs were dealt with by administrators, many of whom
were not located in the school. Therefore, even when costs are given, they
frequently are estimates.
These estimates will vary in terms of exactly what is included as
a relevant cost item. Most frequently, the personnel cost of a teacher
is not included. Individuals reporting these data frequently reasoned that
since teachers were already being paid out of the regular school budget, their
time could not be charged to any computer application.
In any event, schools did report their "Total annual budget for
instructional applications of computers" (Group D). The median cost reported
was $13,999.50. Considerable variation in this item was shown. The lowest
computer budget reported was $0.00 (costs considered were covered by an
outside source). The highest computer budget reported was $840,000. How
these costs would change, if all schools had included teacher and other staff
costs, is difficult to estimate. It is interesting to observe that the 322
instructional user schools providing their computer budgets report a grand
total of just over $5 million in expenditures for instructional computer use
compared to the approximately $3 billion in expendiutres for the total
annual operating budgets of these schools. Therefore, out of every $100
educational dollars spent by these schools, less than 20 cents goes toward
instructional computer use. For each school reporting these data, the total
annual operating budget was divided into the annual computer budget. The
median percentage of the total annual operating budget represented by the
annual computer budget was .4%. This percentage ranged from .06% to 20% for
all schools which reported a computer budget. This is a small expenditure
particularly when it is considered that these figures are for only those
schools using computers for instructional purposes.
b. Sources of support
In addition, the questionnaire was designed to gather information
about where the funds come from. Based on information reported by 322
schools, Table 23 shows the amount and percentage of the total computer budget
contributed by each source shown ( Group 0).
A strong dominance of local funding of instructional computer
, 87
93

Table 23. Contributions By Source of Funds
for Instructional Computer Budget Reported
Source of support Amount Percentage
Local 4,080,000 80.3
State 260,000 5.1
Federal 340,000 6.7
Other 400,000 7.9
TOTAL 5,080,000 --
88
94
applications (80.3%) is illustrated. From discussions with teachers
(Gyoup E) who provided some of these data, it is possible that they may have
attributed some funds to local sources when in fact the funds originally came
from state, federal or "other" sources. However, data related to sources of
support for the school total annual operating budget show a mean response
of 66.5% contributed by local sources. This percentage is not far from the
53.7% contribution attributed to local sources for all public elementary
and secondary schools in the U. S. in 196869 (Simon and Grant, 1968).
Teachers' estimates of local contributions to computer budgets probably is
not far off the mark.
Table 24 shows the median percentage per school computer budget
contribution by each source. ( Group 0). These data show that per school
the median percentage of the computer budget contributed by state sources
slightly exceeds the median federal and "other" contributions. On the other
hand, the federal and "other" contributions account for a larger percentage
of the total dollars for instructional computer use reported by all 322
schools (Table 23). This difference is due to the larger contributions of
federal and "other" funds to large instructional computer budgets and the
larger contributions of state funds to smaller schools. Therefore, although
the median federal contribution is only 2.4% per school computer budget, it
is contributing larger percentages to the larger computer budgets. In other
words, there is a greater tendency for schools with large instructional
computer budgets to be receiving federal and "other" support than schools
with small instructional computer budgets. It may be that the differences in the
computer budgets of these schools can largely be attributed to federal and
"other" support.
Data were also gathered about the source and amount of support
for specific application types. Table 25 shows the number and percentage
of schools reporting each source of support for each application.
For all applications, combined local sources of funding account
for 63.5% of the sources named. In discussing sources of funding earlier,
it was pointed out that the school staff does not always realize that funds
provided by local sources may have come originally from state, federal, or
89
95
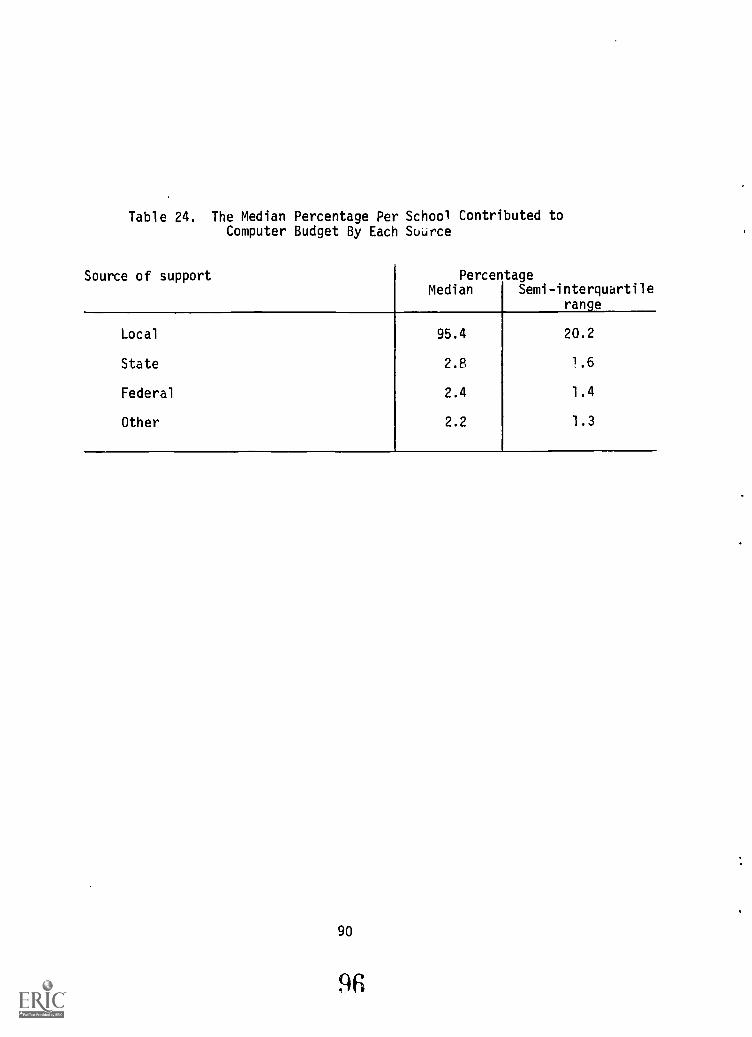
Table 24. The Median Percentage Per School Contributed toComputer Budget By Each Source
Source of support Percen,tageMedian Semi-interquartile
range
Local 95.4 20.2
State 2.8 1.6
Federal 2.4 1.4
Other 2.2 1.3
90
96

Table 25.
Schools Reporting Each Source of Support for Each Application
Source
4t-lication
Local
State
Title
III
Manufac-
turer
Title
INSF
Coll.
1
or
Univ.
Local
Bus
ESEA
Voc.
Educ.
Act
BOCES
PLAN
Other
TOTAL
0,1.=
40
25
11
10
3- --
51
11
171
*10.4/
6.9/
11.9/
7.7/
11.1/
23.8/
9.7/
---
31.2/
10.0/
20.0/
33.3/
6.6/
**56.3
2.8
7.0
1.4
1.4
14.1
4.2
---
7.0
1.4
1.4
1.4
1.4
11.85
ProbLem
143
10
13
44
17
16
36
33
4226
sz.Iving
37.3/
34.5/
31.0/
30.8/
44.4/
40.5/
.1.6/
6o.o/
37.5/
30,0/
60.0/
26.6/
63.3
4.4
5.8
1.8
1.8
7.5
7.1
1.3
2.6
1.
1.3
1.8
37.5'5
EDP skills
127
13
15
53
78
12
4___
5190
33.2/
44.8/
35.7/
38.5/
33.3/
16.7/
25.8/
20.0/
12.5/40.0/
---
33.3/
66.8
6.8
7.9
2.6
1.6
3.7
4.2
0.5
1.0
2.
---
2.6
31.55
Gaming/
50
37
11
44
22_
13
78
Simulation
13.0/
10.3/
16.7/
7.7/
11.1/
9.5/
12.9/
12.5/
20 .0r
.2o o/
-20.0/
64.1
3.8
9.0
1.3
1.3
5.1
5.1
2.6
2.6
2.6
- --
3.8
12.5
Other
***23
12
2---
41
- --
238
classroom
6.0/
3.4/
4.8/
15.4/
---
9.5/
---
20.0/
6.2/
---
---
66.7/
1.3/
6c.5
2.6
5.3
5.3
- --
10,5
---
2.6
2.6
- --
---
5.3
5.3
7:-..3%
Total
383
29
42
13
942
31
516
10
53
15
603
/63.5
/4.8
/7.0
/2.2
/1.5
/7.0
/5.1
/0.8
/2.6
/1.6
/o.8
/0.5
/2.5
*Percentage of to*al times application mentioned for each source.
** Percentage sf total times source mentioned for each application.
***5'Jther[ combines other application for which sources are mentioned.

private sources. However, the dominance of local support is sti'l quite
impressive. The next four most frequently mentioned sources are NSF (7.0%),
Title III of the Elementary and Secondary Education Act (7.0%), colleges and
universitites (5.1%), state (4.8%). These sources dominate the non-school
system sources.
Looking next at the total sources mentioned for each application,
the greatest number of sources mentioned are for problem solving (37.5%) and
EDP skills (31.5%). These results reflect the dominance of these applications
in secondary schools.
The next point to consider is whether the pattern of sources of
support for specific applications differs from the overall patterns just
described. Analysis of Table 25 indicates that if the sources of support
are ranked separately for each application,the rank order of sources would
coincide closely with the rank order of each source. for all applications
combined. That is, for each application, local is named as the source of
support most frequently, NSF next, Title III third, etc. In fact, the
percentage of schools which named these sources for each application closely
corresponds to the three percentages shown for all applications.
In addition, the rank order of applications remains fairly constant
from source to sourc,.!. For example, the dominance of problem solving and
EDP skills is as prevalent among local sources of support as among college
and university sources. The conclusion then is that generally the pattern
of emphasis on specific applications, in terms of number of times sources
are mentionedydoes not vary much with the source of funds.
Three minor exceptions to this general conclusion should be noted.
There is a greater percentage of schools receiving support for
EDP skills training and problem solving from state and Title III sources
than is generally found for all sources combined; the emphasis on problem
solving is even greater than the general pattern among NSF, college and
university sources, and the number of schools listing NSF as the of support
for CAI applications is greater than the general trend for this type of
application.92
98

c. Level of support
Discussion turns now to the level of support for specific
instructional applications. Table 26 presents the frequency distribution
for amount of support for each type of application (Group D), i.e., the
annual level of support for specific type of application. These data show
level of support per application for all sources of support listed for the
application. When all application types are combined, the median funding
level from sources given for a single application is $977.20. Therefore, a
typical application is receiving approximately $1,000 in support from the
sources listed. It should be indicated that schools may not have listed all
of the sources from which funds were received. A check of the data however
reveals that this median of approximately $1,000 is a fair estimate of the
support being received for a single application.
Analysis of individual application medians shows some variation
from the overall median. The median for problem solving applications is
somewhat higher than the general median. The funding of single applications
is gererally dominated by fairly small amounts of money, about $1,000 per
application. It is noted however that 16.3% of the applications are receiving
support above $5,000,8.4% above $10,000, and 1.8% above $50,000. The large
majority of these cases involve problem solving and EDP skills applications.
d. Cooperative computer use
Another means of supporting computer use is through some type of
cooperative arrangement. Cooperative arrangements for supporting and
developing computer applications exist throughout the country. These
arrangements may support computer operations through funding, by providing
computer facilities or by sharing information. These cooperative arrange-
ments exist between secondary schools and each of the following:
School systems
Colleges and universities
Commercial networks
Formal networks centered around a university
93
99

Table 26.
Amount of Annual Support for Types of Applications
Amount of Support
Application
1S100
N%
101-500
N%
501-1,000
N%
1,001-5,000
N%
5,001-1,0000
N%
10,001-50,000
N%
Sub
Total
Omits
Total
Median
Semi-
inter-
quartile
Range
cAI
517.9
414.3
725.0
932.1
13.6
27.1
28
106
134
857.63
1,461.10
Problem
Solving
78.o
16
18.4
13
14.9
34
39.1
910.3
89.2
87
352
439
1882.90
1,986.20
EDP
Skills
68.6
17
24.3
15
21.4
18
25.7
68.6
811.9
7o
394
464
900.5o
1,945.80
Gaming/
Simulation
620.0
620.0
620.0
930.0
26.7
13.3
30
140
170
750.50
1,400.00
Other
Classroom
17.7
538.5
215.4
538.5
--
--
--
13
126
139
625.50
1,060.00
Total
25
11.0
48
21.0
43
18.8
75
32.9
18
7.9
19
8.3
228
1118
1346
977.20
1.783.30

or some other facility
Other schools
The financial support coming out of these cooperative arrangments
was touched on earlier in this section. Other cooperative arrangements also
exist where schools are sharing computer facilities, staff, information or
all three. The nature of these cooperative arrangements is varied. In those
cases where cooperation involves sharing of a computer, the arrangments tend
to be formal. These formal arrangements are normally known as computer
networks. Quite frequently they are being funded by a common source. Other
networks are less formal and often may involve only the sharing of informa-
tion.
During school interviews, teachers were asked about the cooperative
arrangements in which they were involved (Group E). About 52% of the
schools are involved in no formal cooperative arrangements.
Approximately 18% do belong to one or more formal networks. These
can be divided into two basic categories--those which emphasize computer
usage and those which include computer usage as one aspect of their overall
program. Those falling into the first category include: computer complexes
with other schools, Districtwide Computer Education Committee, Computer
Instruction Education Committee, Computer Instruction Network (CIN), BOCES,
TIES, Project LOCAL, Computer Usage for Suburban and Coastal Connecticut,
Huntington Park Project, Dartmouth Network, and Digital Equipment Corporation
Computer Usage (DECUS). The second category is primarily educational organ-
izations which include sharing information about computer applications.
Those mentioned are: subsidiary groups of the Connecticut Educational Assoc-
iation, Association of Business Education and State Department of Education
Advisory Committee. A somewhat different arrangement is made possible by
Public Law 28 in California, which allows high school students to take
courses at junior colleges and receive high school credit.
Nearly 75% of the respondents have cooperated at least once with
outside sources to share information on at least an informal basis. In
some cases, schools have given out course materials and advice and shown
95 101

their installation to others. In other instances, school officials have
sought information by visiting other schools, through arrangemerts with
local colleges, and through visiting business representatives. Personnel
at one school helped in the creation of an intermediate educational
district which is designed to coordinate activities among schools in the
area. A number of schools got together to write proposals for original
funding of their applications. Schools in Nassau and Suffolk Counties in
New York State are beginning to set up facilities for sharing information.
The preceding discussion is not exhaustive. It includes
just examples of cooperative arrangements which exist throughout the U. S.
which were mentioned by staff at visited schools.
e. Commitments to computer use
Besides the financial investments of schools discussed earlier,
there are other means for assessing the commitments which schools have made
to computer use. Commitments involve the degree to which computers have
been integrated in the curriculum, the number of members of the staff who
are trained for computer use,and the degree to which the computer has been
accepted organizationally by the school.
Earlier, data regarding the integration of computers into the
curriculum was discussed. It is evident from data presented in Table 17
that the computer has been quite thoroughly integrated into the mathematics
curriculum. However, beyond the mathematics curriculum the acceptance of
computers has been considerably less rapid and thorough.
Respondents to the questionnaire cited the number of teachers
on the staff of each school who had received training in computer use
(Groups C and D). From a reading of Table 27, it is evident that generally
there are a limited number of teachers trained in computer use per school.
Interviewees indicated that training of teachers was one of their greatest
needs in order to continue their applications (Group E).
The training which teachers have obtained was sponsored and
conducted by a variety of sources. Table 28 presents data relevant to this
point (Groups C and D).
96
10?

Table 27. Computer Users Reporting Number ofStaff Trained in Computer Use
Number of Staff Trainedin Computer Use
Schools Reporting
0-4 954 86.8
5-9 111 10.1
10-14 22 2.0
15-19 8 0.7
20-24 3 0.3
Over 24 1 0.1
Subtotal 1099
Omits 122 10.0
Total 1221
Median 2.83
Semi-inter. range 1.44
97 1 03

8. User Schools Reporting The Type of Organizationwhich Conducted and Sponsored Training
Conducted Sponsored
a
ar
r
57
403
220
113
655
566
1221
8.7
61.5
33.6
17.3
46.4
37 5.2
222 31.3
170 24.0
154 21.7
28 3.9
22 3.1
102 14.4
709
512 41.9
1221
98
104

Most schools reported that colleges and universities conducted
and sponsored the training of teachers in their schools. The next most
frequently mentioned conductor and sponsor was computer manufacturers. NSF
and computer manufacturers are very close in the rankings as sponsors of
computer training. It should be noted that in many cases, the training
conducted by colleges and universities is sponsored by other organizations,
frequently federal goverment agencies.
Users of computers responding to the questionnaire indicated
whether they had a center or focus of responsibility for coordinating
computing activities in their schools. Of those providing this information,
763 (63.4%) indicated that they did have a center of responsibility. This
high percentage of affirmative responses indicates a high level of organiza-
tional support of computer use.
5. School Characteristics and Use of Computers
Before discussing rrevious use of computers reported by schools, the
instructional users of computers will be compared to those schools which
do not use computers instructionally (administrative only users and nonusers)
( Group B).
Table 29 reports data regarding certain demographic characteristics
of the two school samples under discussion. For the variables of enrollment
(size of school), number of teachers, percent of high school graduates
attending college, and percent attending junior college, medians are higher
for schools with instructional applications than for schools without
instructional applications. For both the enrollment and teacher variables,
medians for instructional user schools are roughly twice the size of the
medians for other schools. There is a tendency for a higher percentage of
graduates of schools with instructional applications to attend college and
junior college. The differences in median size on these variables between
the two school samples however is not large. The percentage of students
continuing their education in technical school is similar for both school
samples. The schools which use computers seem to be characterized by a
higher enrollment and more teachers as compared to schools which do not
use computers.
99 105

Table 29. Demographic Characteristics of Schools With andWithout Instructional Applications
All Instructional Other
Characteristicsof School Median
Semi-interquartilerange Median
Semi-interquartileranee
Studentenrollment 1347.4 576.8 636.0 400.0
Number ofteachers 69.2 27.2 33.6 16.3
Percentage of graduatesgoing onto:
College 40.3% 14.4 35.0% 12.2
Junior College 14.7% 8.8 11.3% 7.8
Technical School 7.9% 5.5 8.8% 5.9
100106

Additional data regarding demographic characteristics of the school
types "all instructional" and "other" (administrative only users and nonusers)
are presented in Tables 30, 31, and 32 (Group B). Table 30 shows frequency
and percent of respondent schools which fall into each of the six school type
categories as well as the number and percent of "omits" relative to the total.
FJr both "all instructional" and "other" samples, most schools are compre-
hensive. However, more instructional user schools are comprehensive than
non-instructional user schools. Conversely, academic school type is mentioned
more frequently by "other" schools than "all instructional" user schools.
Academic and comprehensive school types together comprise the overwhelming
majority of school types reported by the two school samples under consider-
ation here. Minimal mention is made of business, vocational, technical or
"other" categories by either school sample. The percentage of "omits" for
both school samples is relatively close.
School level descriptors are considered in Table 31 for the same school
samples. Again, frequency and percentages are presented for each school
level category as well as the omit category. It can be seen that instructional
user schools are predominantly senior high schools while "other" schools
are divided fairly evenly into the two categories of senior and combination
high schools primarily. Nevertheless, the senior high school category is
still mentioned most frequently for "other" schools as well as for instructional
user schools. For instructional user schools, the categories of junior and
combination are used by approximately equal percentages of respondents. For
"other" schools, the junior category is least frequently mentioned. The
percentage of omits for both school samples is relatively small.
Table 32 presents test performance data for these two school samples.
The vast majority of both school samples report test performance equal to
or above the national averages for such tests. Both school samples report
small and similar percentages for the two categories of "below average" and
"tests not used". Again, omit percentages are comparable for the two school
samples.
101
1 07
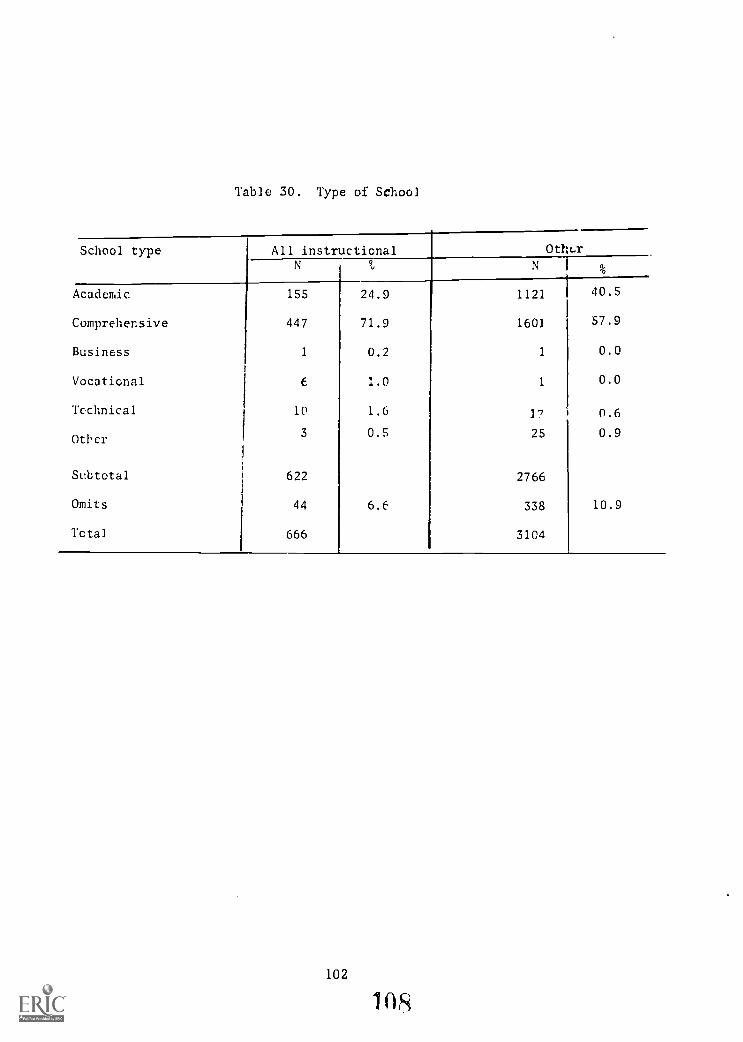
School type
Table 30. Type of School
All instructionalN
Academic 155
Comprehensive 447
Business 1
Vocational 6
Tcchnical 10
Otl,cr3
Subtotal 622
Omits 44
Total 666
24.9
71.9
0.2
1.0
1.6
0.5
6.6
3104
102
s

Table 31. Level of School
School levelAll instructional Other
N N
Senior 493 74.7 1402 46.9
Junior 86 13.0 555 18.6
Combination 81 I 12.3 1031 34.5
Subtotal 660 2988
Omits 6 0.9 116 3.7
Total 666 3104
103 119

Table 32. Performance on National Tests
Test performanceAll instructional
..--, -----,---
N
Other
% N %
Above Average 213 37.4 579 21.6
Equal. to the Average 299 52.5 1795 66.9
Below Average 39 6.8 224 8.3
Tests not used 19 3.3 85 3.2
Subtotal 570 2683
Omits 96 14.4 421 13.6
Total 666 --- 3104 ---
104
1.0

6. Previous Use of Computers
The preceding results and discussion in this report have focused on
present applications of computers in secondary schools. This section will
relate previous use of computers by schools surveyed. The next section will
explore plans for future use among the sampled schools.
a. Initiating the use of computers
School personnel interviewed were asked to describe how they got started
using computers for instructional purposes (Group E).
Teachers indicated that they had initiated interest in the uses of
computers for instructional purposes in 37% of the cases. Often, they
participated in data processing courses over the summer. Most of the time,
these courses were NSF sponsored institutes. Other teachers took advantage
of courses offered by projects which were NSF funded. Some teachers took
courses at a local college or those offered by a computer manufacturer.
Interest of other teachers resulted from attending a computer conference
or seeing a computer installation.
After the interest was created in the teachers , they pursued a variety
of avenues to obtain a computer or computer time. Efforts ranged from writing
proposals for federal funding or participating in NSF funded projects,through
acquiring computer time through the state or local school board or university,
to obtaining donated time or equipment from a computer manufacturer or
business concern. In some cases, a number of manufacturers were contacted
for information about their facilities with the goal of purchasing equipment
on time.
In 27, of the cases, members of the local school board or the state
board of education provided the impetus, primarily by making computer time
available to the schools. In a few cases, the idea to use computers
originated in an educational committee. School boards also wrote proposals
for federal funding. They invited teachers to a manufacturer's demonstration,
aided in getting a manufacturer to donate equipment, solicited participation
in a research project, and in one case, built a computer installation into
a new high school. In several cases, the passage of state education bills
created the positive climate for action.
105 1 1 1

For about 12% of the respondents, funding came from the federal
government in some way (ESEA or NSF funded projects). In one rather unique
case, the terminal was funded by the Atomic Energy Commission because the
school was able to provide space for the equipment. Because of security
clearance requirements, the equipment could not be located at the AEC
installation.
About 12Y, cf the responses credited the principal with originating the
use of computers in their schools. In a few cases, funds were set aside
to participate in a federal project or cooperative school arrangement, but
they fell through, so the schools went ahead on their own. Principals
coordinated their activities with the boards of education, hired teachers
with computer training, sent teachers to be trained or contacted manu-
facturers to donate equipment.
Community influence was responsible for schools acquiring usage of
computers about of the time. Businesses were the predominant source.
A few schools began using computers through action initiated by educational
councils.
b. Former uses
Respondents to the questionnaire provided data regarding previously
terminated applications of computers ( Croup B). Table 33 reports the
number and percentage of schools indicating various types of applications
which they have terminated.
Schools indicate a large number of previous uses which they have since
terminated. The majority (56.8%) of all previous applications stopped by
all respondents were administrative in nature. Users and nonusers differ
in terms of the types of uses stopped in that users report a greater per-
centage of computer applications which were both administrative and
instructional, and lesser percentages of those which were only administrative.
Respondents were also asked to indicate why they had stopped the
computer uses. Table 34 summarizes the reasons given (Group B). The number
and percentage of responses placed in each category appear in the column
106
112
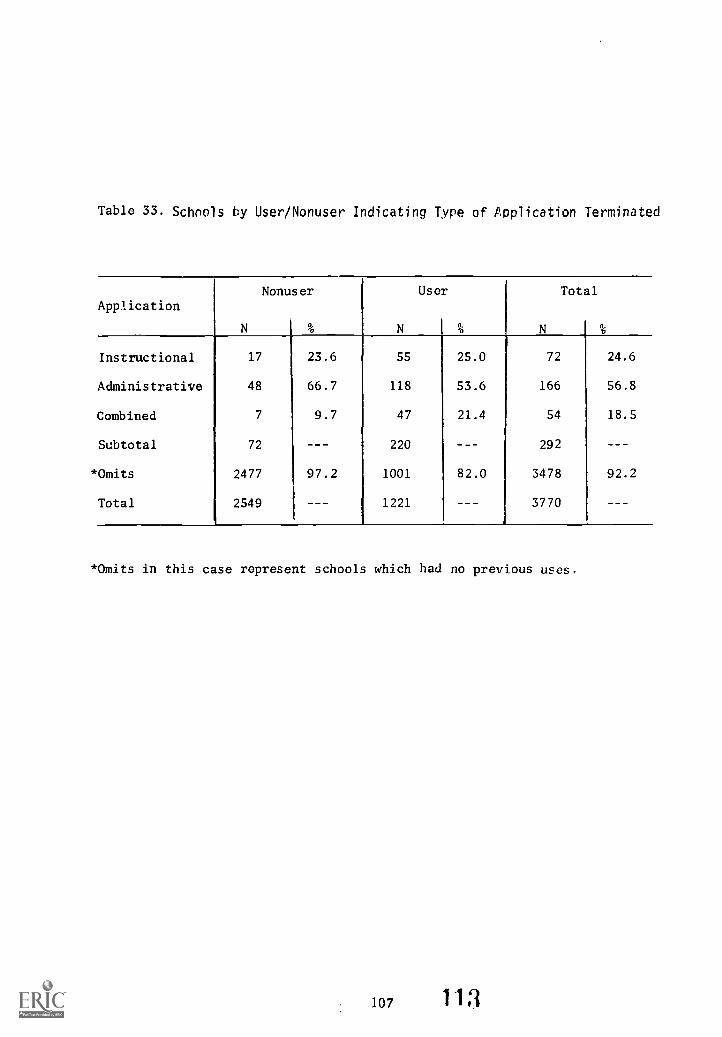
*
Table 33. Schools by User/Nonuser Indicating Type of Application Terminated
ApplicationNonuser
N %
User
N %
Total
N %
Instructional 17 23.6 55 25.0 72 24.6
Administrative 48 66.7 118 53.6 166 56.8
Combined 7 9.7 47 21.4 54 18.5
Subtotal 72 --- 220 --- 292 - --
Omits 2477 97.2 1001 82.0 3478 92.2
Total 2549 1221 --- 3770
*Omits in this case represent schools which had no previous uses.
107 113

Table 34. Reasons for Stopping (Number and Percent Respondingto Each Category)
1. Lack of funds or space
Lack of moneyCost prohibitiveLack of spaceTerminated due to budget restrictionsFunds withdrawnToo expensiveNot worth cost
2. Computer ineffective
Too long to correct mistakeInaccuratr resultsResults to variantLate in deliverySome bugsPupil accounting done better by handPoor results in schedulingPoor communication and late deliveryInadequate computer for needsDifficult to operate and maintain
3. General dissatisfaction
Too much troubleDidn't likeIncompatible with existing programsToo much work and too many problemsLoss of control
4. Experimental projects
Had computer for only 1 month. 3 weeks, etc.Experimental program no money to continue
5. Lack of qualified instructors or EDP staff
No more qualified instructors left at schoolLack of knowledgeDifficulty getting operator and knowledge personnelInadequate staff
6. Miscellaneous
City unified all computer work under city's jurisdictionTwo computers stolen-not replaced this yearPoor attendance
108
1 .1
0
34 36.5
16 17.2
10 1Q.8
7 7.5
7 7.5
5 5.4

Table 34 Continued
6. Miscellaneous (continued)
Converted to another systemNo keypunch
7. Service
Administration was not satisfied with the serviceService could not meet all desired requirementsService discontinued by supplierAdministrative use stopped because service was not reliable
8. Inaccessibility of computer
Too far awayAccess to computer was too slow for instructional uses
9. Characteristics of school
School not large enoughUnable to work into school schedule
due to size and nature of school
No current applications for computer usage
10. Overload on someone else's computer
Junior college can no longer handle work loadService center computers were unable to schedule the school
109115
Total
N
4 4.3
4 4.3
3 3.2
3 3.2
93

title for each category. Within each category are
nses.
lently mentioned reasons (36.5%) are concerned with lack
(which is probably also lack of funding). It appears
:king for the computer use for various reasons. Either
:al restrictions which no longer permitted the expense
it had been decided that the computer was not worth
cases, the abandonment of computer use because of lack
1r for both reasons. The school realized that the budget
;he computer use was not considered cost-effective enough
,ion (17.2%) of the schools responding indicated that the
!ctive in the work performed. These schools indicated
as either unreliable, inaccurate, too slow, produced no
as generally inadequate, or too difficult to operate. A
ght indicate that many of these problems probably involve
is may be true. But it is interesting to note that the
center of the blame for the failure of these applications.
were generally dissatisfied, indicating that the computer
Irk, incompatible, too problem-plagued and took control
.y from administrators.
frequently mentioned reason (7.5%) is not actually a
:o the computer. These schools simply had experimental
out and could not be continued for one reason or another.
(7.5%) gave up computers because of lack of qualified
included: inaccessibility of the computer, poor service,
an outside source.
.e Use
ID DISCUSSION section concludes with a short exploration
schools intend to go with computer applications.

During interviews, teachers ( Group E) indicated that their applications
were relatively permanent. About 40% said they were permanent with no
qualifications. Those who were not absolutely certain about continuance
of their computer use, attributed their doubts to the uncertainity of funding.
Although most were confident of continued funding, they faced the reality
that school budgeting is a year-to-year proposition and that one can never
be sure that funding will continue. In this regard, several teachers mentioned
that local funding was more secure than federal funding. They indicated that
federal funding is necessary to launch computer projects and get them accepted
by local school funding agencies. After that point, continued funding is
more assured through local than through federal sources.
About one quarter of the interviewees stated that instructional computer
use was a permanent feature of the schools' program. Almost all
predicted that all or some of their applications would expand and new applica-
tions would be added. A few also felt that some of their present applications
might be dropped. Only small numbers, about 10%, believed that their present
application would be dropped during the following school year.
Questionnaire recipients were asked to indicate whether they planned
to initiate new applications during the next year and if so, the type of
applications that they planned (Group B). Table 35 summarizes their
responses by respondent category.
Of all respondents, 25.3% intend to initiate one or more new applications.
The largest percentage of these (44.2%) anticipate new applications in both
administrative and instructional areas. A much larger percentage of users
(50.0%) than nonusers (13.1%) intend to start new applications. The
largest percentage of users (44.8%) and nonusers (43.0%) alike state that
they will initiate both administrative and instructional applications. How-
ever, users place more emphasis on new instructional applications and less
emphasis on new administrative applications than do nonusers.
Those schools in the three user categories tend to indicate further
expansion of the same type of applications. That is, the largest proportion
of instructional only users (58.6%) intends to initiate instructional only
111 117

Table 35. Schools Indicating Type of Use by
Respondent
Category of Intended Application if Any
Respondent Tyne
Type of
Application
Intended
Nonusers
N%
Instruc.
Only
N%
Admin.
Only
N%
Both
N%
All
Instruc.
N%
All
Admin.
N%
All
Users
N%
Total
N.%
Admin. only
116
34.6
43.6
115
48.9
32
11.8
36
9.4
147
29.0
151
24.4
267
28.0
Instruc. only
75
22.4
65
58.6
43
18.3
82
30.1
147
38.4
125
24.6
190
30.7
265
27.8
Combined
144
43.0
42
37.8
77
32.8
158
58.1
200
52.2
235
46.4
277
44.8
421
44.2
Total
intending new
applications
335
13.1
111
56.9
235
42.3
272
57.7
383
57.5
507
49.4
618
50.6
953
25.3
No new
applications
intended
2214
86.8
84
43.1
320
57.6
199
42.2
283
42.5
519
50.6
603
49.4
2817
74.7
Total
2549
195
555
471
666
1026
1221
3770

applications, 48.9% of administrative only users anticipate starting only
administrative applications and 58.1% of both users indicate an intention
of beginning both instructional and administrative applications.
Interviewees were asked to dream about what they would want in computer
applications if there were no cost restrictions ( Group E). Most of the
interviewees indicated they would like to have their own in-house computer
system. Others wished for a more modern system than they were presently
using. Many would like to add auxiliary equipment, everything
from discs, tape drives, CRT's, closed circuit TV, to teletypes, keypunches,
etc.. Many teachers indicated that the one thing they needed most was a
keypunch and if they got that they would be set. It is interesting that
the lack of something as minor and inexpensive as a keypunch is standing in
the way of these schools accomplishing their instructional computer goals.
The second most common response centered around the desire to expand
the present program. Changes which were indicated ranged from the addition
of one course to the use of computers in all courses in the school.
Teachers at most schools indicated during interviews that they had
actually made plans for implementation of new applications. Of these,
about two-thirds plan to implement new programs in the Fall of 1970, about
one-sixth sometime during the next five years and the remainder during their
1970 summer programs. Other schools had only tentative plans.
The next logical question is "Where do these schools anticipate
receiving support?" Table 36 indicates the number and percentages of
schools intending to initiate a new application which anticipate seeking
support from the sources listed.
It is obvious that schools anticipate turning to local sources for
funding to a great degree. Again, it is possible that these local sources
will in turn seek support from government agencies or private foundations.
a. Problem areas
The problems which schools are having with present computer applications
provide insight into some of the directions these schools will be taking
113 119

Table 36. Anticipated Sources of Support forPlanned Application
SourceSchools
USOt 63 6.6
NSF 39 4.1
Other federal agencies 61 6.4
Private foundations 37 3.9
State 245 25.7
Local 719 75.4
Total schools intendingto initiate new applications 953
*Total is more 'Lan 100% because some schools anticipateseeking support from more than one source.
114
120

in order to solve their problems.
The problem most frequently mentioned by interviewees ( Grc.up E) dealt
with equipment and normally centered around insufficient access to equipment,
insufficient computer time available, or limited equipment. Remoteness of
equipment causes transportation problems and slow turn-around time. Other
problems with the equipment concerned noise generated from the computer,
time lost in repair, and expense of the computer or terminal.
Personnel was another source of problems. More teacher training is
needed. Oftentimes, students become more proficient than their teachers.
This can happen because the teacher does not have enough time to keep up
with his own programming skills.
Over-involvement of students was cited by many as being a problem or
potential problem. Some students get extremely involved and neglect their
other classes. This causes friction with other teachers and makes it even
more difficult o convince them that the computer should be integrated
into their curriculum. Another source of friction occurs between the math
and business teachers. Each believes the computer's proper place should
be in his department.
The interest shown by students can also be viewed as positive. Helping
students to receive the fullest benefit from thejr experience presents a
challenge to teachers. Many teachers may feel uicomfortaile with this
challenge. Teachers' main problems concern the effort anA energy required
to teach computer programming and the lack of time. They:point to the
extreme lack of quality texts geared for the high school ''student and the
tedious aspect of teaching error analysis. Some teachers are concerned that
the math courses are turning into computer classes. They believe the computer
should play a subordinate role in the curriculum.
There are some problems that are nearly impossible to solve. Curbing
student involvement might be one of these. No one is going to stop a student
from pursuing his interest. Money problems probably will not disappear and
teachers will have to work with what they have until more money is found.
115
121

b, User needs
The largest number of respondents were very satisfied with Heir computer
applications. Others were satisfied but pointed to changes they would like
to see, e.g., expansion and improvement of their courses, better texts, etc.
A small percentage were not satisfied with their applications. They listed
equipment wants, frustration in expanding the program and limited effective-
ness as reasons for discontent. Respndents expressed the desire to have
more students involved in using the computer as well as making access time
overall as long as possible. Also, in order to expand, it is necessary to
get more teachers interested in using the computer.
The remaining responses cover a variety of wants. They include: an
independent non-school-paid evaluator, computers serving some library
functions (e.g., encyclopedia type references), a grant to study EDP needs
state-wide and research on EDP needs in industry.
The firm plans of these schools were pretty much of the same nature
as their dreams, only more modest in most areas. Expansion in a variety of
ways was the most frequently mentioned response. These ways included adding:
new courses, new applications (frequently CAI or management of instruction),
new departments to those already participating (normally science), more
students, new equipment and more training for teachers.
The two most common needs expressed for continuation or expansion of
computer applications are money and equipment. This accounts for over 50%
of those responding to this question.
Personnel training was another important need as was program development
and materials. Other schools mentioned lack of space, need for additional
time to devote to the program, reduction of administrative opposition, etc..
The majority of teachers felt that their training was adequate, but only
for their existing applications. Some respondents felt that while their
own training was adequate, other teachers involved did not have enough
background and training. Those who felt that their training was not adequate
enough for plans they had for the future, desired training in the following:
other computer languages, more advanced programming, partic.Otion in
116 122
courses tailor-made for teaching at the high school level. They also
expressed a great interest in obtaining more hands-on experience. Several
teachers mentioned the desirability of summer institutes. Others wanted
to visit industries to see what is going on so they can advise students
vocationally.
Respondents felt that there were many ways in which outside sources
could help them. Money was the most typical response offered. Many
respondents were concerned with information acquisition. Information about
curriculum development and what other schools were doing with computers was
most wanted. One suggestion was a curriculum program library where programs
would be available to anyone expressing interest in them. Several suggestions
were made as to how the community and businesses in the area could help.
Commonly mentioned was the desire to see different computer applications
in operation and the opportunity to work on computers in the community and
local industry.
Other suggestions were made for sponsoring research on the value of the
computer in the classroom and the establishment of an independent agency
to make information available on ways of using the computer for various
purposes.
117
1 23

CONCLUSIONS
Extent of Administrative and Instructional Applications
From the 12,396 responses received from the 23,033 secondar , schools
in the continental United States, it can be concluded that more schools are
not using computers than are. The ratio of nonusers to users is roughly 2 to 1.
Among those schools that are using computers, administrative applications
dominate. This domination of administrative over instructional use is of an
approximate 2 1/2 to 1 ratio. Although no other survey of this nature and
scope has ever been performed, some previous studies provide a rough esti-
mate of instructional use of computers in secondary schools. Comparison of
the present survey with these earlier studies indicates that instructional
use of computers is growing rapidly in the secondary schools in the United
States. In order to chart this growth, future surveys are necessary to pro-
vide additional data points. A set of computer use indicators,similar to
the economic indicator, used by government,might be developed to chart com-
puter use. Educational planners at all levels would find such information
quite useful.
Degree of Administrative and Instructional Use Among Computer Users
Although the number of schools using computers is still in the
minority, the degree of computer use in these schools is quite high. There
is, of course, wide variation in the degree of use among these schools.
However, indicants, such as number of computers used, number of applications,
number of students involved, amount of computer time used, and frequency of
use show a fairly high degree of computer use.
Nature and Purpose of Instructional Use
At the same time, the diversity of applications and subject areas in
which computers are being used instructionally is not at the same high level
on the average. Problem solving and EDP skills training applications domin-
ate instructional use of computers in secondary schools. EDP skills train-
ing is of two types. Some EDP skills training is provided to students in
preparation for entering a career in the computer field. More frequently,
119
1 24
EDP skills training is provided to students in conjunction with the use
of a computer in problem solving applications. Problem solving and EDP
skills training form the core of classroom instructional uses. Occuring
somewhat less frequently are CAI and gaming and simulation applications.
The other core of computer use centers on guidance and administration
applications. Management of instruction applications occur less frequently
in conjunction with these core applications.
The dominance of computer applications by the mathematics curriculum
is even more marked than that of problem solving and EDP skills training.
In most of the schools surveyed, computer applications have been well inte-
grated into the mathematics curriculum. However, applications have very
rarely spread to other subject matter areas to any extent.
Most typically, instructional use of computers starts with mathematics
departments in the schools. If use does spread to other departments, it is
normally through the efforts of mathematics teachers. Why computer use has
not spread more rapidly is very difficult to determine. Mathematics teachers
indicated that they have met with considerable resistance when attempting to
encourage colleagues in other departments to develop computer applications.
It is evident that the computer quite readily lends itself to use in the
mathematics courses. On the other hand, applications in areas such as
social studies, English, etc., are less obvious, and probably require con-
siderable imagination and interest on the part of teachers in these subject
areas.
It is known that the computer can be threatening from the standpoint
that students frequently learn more about it than teachers do. Therefore,
a teacher undertaking a computer application must have sufficient confidence
in himself not to be bothered by such an occurrence. Possibly, training
programs designed to encourage computer use among teachers in subject areas
other than mathematics, as well as among mathematics teachers might help break
down some of the resistance to the spread of computer use.
At least one other factor which stands in the way of computers being
used more throughout the entire curriculum is concerned with the structure
and content of the curriculum. The curricula of most schools, as presently
120
725

constituted, make it difficult to introduce innovations. In many schools,
the schedule is already packed with traditionally required courses, par-
ticularly for college bound students. Several teachers stated the need
for modular curriculum scheduling. This approach divides the school day
into smaller time periods than the common 50 minute class sessions presently
used in most schools. With these additional units of time, the curriculum
planners have more flexibility to introduce curriculum innovations. A
number of computer users have gone to modular scheduling quite successfully.
Providing short so-called mini courses or introducing modular
scheduling permits the inclusion of computer uses in their tight schedules.
It may be concluded that merely introducing computers into a school does not
automatically cause innovation to take place. Many schools, in fact, may be
realizing less than full benefit from instructional computer use because of
the structure of the class schedules.
It is safe to conclude that the computer is more frequently used as
a tool in instruction rather than as the object of instruction. Therefore,
the purposes of the computer applications tend to concern themselves with
the subject matter such as mathematics, science, and economics. The com-
puter simply aids the student in accomplishing the content goals of the sub-
ject area. Another way of describing the nature of computer applications
is to describe what students actually do in these applications. Most
typically, students write and run programs on computers, using it as a tool
to accomplish the goals of the course they are taking.
A number of interesting controversies surround the instructional use
of computers in secondary schools. One of these deals with the mode of use
of the computer. At one end of the continuum is the mode in which the com-
puter is used in the classroom on a highly formalized basis. At the other
end of the continuum appears the use of the computer in a laboratory setting
in a very informal way. In the former mode, the use of the computer is
normally planned by teachers and scheduled for use on homework and class-
room assignments. When used more informally, the computer is simply made
available to students. They are instructed how to use the computer if and
when they come to the laboratory to use it. In this way, students may use
the computer in a variety of classes as they feel they have a need to use it.
121
126

In this latter mode of operation, it is the students,rather than the
teachers,who spread the use of the computer into various subject areas.
Schools and individual applications may fall at various points along this
continuum. Which mode of use is most effective for which educational
settings and objectives is a question worthy of investigation.
Another controversy concerns the necessity of actually having a com-
puter present in the school. Some schools actually do have a computer in
the school, others use the computer through a terminal or take their com-
puter programs to an off-site location to be run. Still other schools use
both on-site and off-site computers. Some teachers feel that it is impor-
tant that the computer be present in the schools so that students can actually
see the computer and interact with it on a direct hands-on basis. Others
feel that this is not as critical as having access to a large scale, sophis-
ticated computer which is probably too expensive to actually have on-site
in the school.
Many schools have introduced the use of a mini computer, which
normally is a small scale inexpensive machine which can be used in the
school. The controversy here centers around the instructional merits of the
small scale computer versus the large scale computer discussed in the con-
text of cost-effectiveness. Regarding this controversy, it was interesting
to note that one can not judge the sophistication and educational signifi-
cance of a school's computer use simply on the basis of the sophistication
of the computer being used. A more important factor determining the quality
of the instructional application is the expertise and imagination of the
teachers involved in the application. This is not to say that more
sophisticated computers in the hands of competent and motivated teachers
will not improve the quality of instructional applications. However,
good teachers can produce good instructional applications without the use
of sophisticated computer equipment. Conversely, access to sophisticated
computers will not result in effective instructional applications unless
used by competent and motivated teachers.
One additional, particularly interesting controversy centers around
the type of computer languages which students should be taught. At one
end of the continuum are those who believe that students should be taught
122
12?

assembly language. At the other end are thosc! wh f'eni students should be
taught compiler language. The reason set forth by most assembly language
proponents suggests that student:, learn about the logical operation of the
computer more thoroughly when using an assembly language. On the other
hand, advocates of the compiler language indicate that understanding the
logic of the computer is less important than understanding the logic of
programming evident in compiler larguages. Assembly languages are used most
frequently by teachers who wish students to learn about the computer itself,
i.e., EDP skills training for vocational purposes. Compiler languages are
frequently taught to students who 1.4111 use programming in the solution of
problems. Teachers of compiler languages can teach the essentials of such
a language fairly quickly. This permits them to turn to what they consider
to be the most important aspect of the computer use, that is, actually using
it for the solution of problems. Each approach seems appropriate when used
in the way described here.
One of the greatest benefits derived from tl-v- use of computers in
instruction results from its capacity to motivate students. Why the com-
puter is so effective in motivating students is not easy to answer. This
question provides an excellent area for further research. Some have suggested
that it is the hands-on experieNce that computers provide. Others suggested
that it could be that computers make the subje;:t relevant. This may be
particularly true of mathematics. Whatever the reason, investigation into
this area should prove fruitful for continuing to improve computer based
instruction, as well as instruction which is not computer-oriented.
In general, it appears that computers have not been introduced into
the school curriculum after a careful and systematic evaluation of the in-
structional needs within schools. As indicated before, someone in the
mathematics department frequently initiates the use of computers. If the
use spreads, it does so in a relatively uv:5Thnr,.d ;anner. Introduction
and spread of computers in this fashion has resulted in a large number of
worthwhile computer applications. However, there still i. a need for the
development of a means of systematically determining educational needs and
objectives and applying computers where they can be most effective. As
123
12R
part of the systematic application of computers in the instructional
process, there is a need for evaluating the effectiveness of computers.
Based on such an evaluation, computer applications can then be revised and
improved.
Level and Source of Support of Instructional Use
Information regarding the level and source of support of instructional
computer applications indicates that even within the sample of schools which
are using computers for instructional purposes, only a minute percentage of
the educational dollar is being spent on instructional applications. The
overwhelming bulk of the money being spent comes from local sources. There
are also a variety of cooperative arrangements which have been developed for
the sharing of computers and information about computer applications. Many
schools see the need for developing these types of cooperative arrangements,
although there is some difference of opinion as to whether these cooperative
arrangements should involve sharing of computer facilities. There are some
schools that prefer to have sole access to a computer rather than share one.
Previous Use
Possibly the most revealing finding regarding previous use of com-
puters concerns itself with how instructional applications develop. Many
have been of the opinion that instructional applications have developed as
a way of getting more use out of a computer which is already being used for
administrative purposes. Information from the schools surveyed indicated
that this is probably not the case. Most instructional applications have
developed independently of administrative applications within the schools.
Future Use
Regarding future use, schools tend to show preference for expanding
present applications further rather than initiating new types of applica-
tions. In addition, they report the intention of continuing to turn to
local sources for the bulk of their support in the future. To some degree,
this may be due to the lack of knowledge as to where one can obtain funds
for computer applications. Information regarding source of funds might
prove useful. Teachers may be inclined to continue their present applica-
tions because they indicate that they are generally satisfied with the
124
12

applications that they have. They do,however, point out that there are
problems and that they have certain needs which should be filled to enable
them to continue to expand instructional use of computers. These needs
must frequently concern funding, space, and training, in addition to a need
for information. Money, of course, is normally the largest problem. How-
ever, project staff were impressed by the fact that many teachers indicated
that fairly minor needs stand in their way of gaining full advantage from
their computer use. For instance, many are blocked by the need for an
additional keypunch. This suggests that, quite possibly, a small expenditure
of funds could significantly improve the computer use of a fairly large
number of schools. In these instances,there is a need for funds to be made
available in small amounts.
One problem which schools have with their computer applications re-
sults, in part, from solutions to these problems. Frequently teachers who
receive training in the use of computers will leave the educational com-
munity to take jobs in industry where they can be rewarded more handsomely.
Such an occurrence only makes the need for trained teachers more severe.
Teachers must be rewarded more for developing and implementing computer use
in order to keep them employed in the schools.
With the heavy emphasis on teaching programming, one specific prob-
lem takes on considerable importance. Several teachers mentioned the in-
adequacy of diagnostics produced by compilers and assemblers. Present
program diagnostics are geared toward the operational programmer rather than
the student. There seems to be a need for program diagnostics which are
more instructional in nature. Some efforts along these lines have been made,
but more must be done.
Teachers mentioned that some students get so involved with computers
that they neglect their other courses. This causes tensions and jealousies
among departments within the schools and frequently has considerable
effect on the students' overall academic performance. It must be recognized
that the computer is a tool which is designed to aid instruction, not con-
trol it. At the same time, computers present a challenge to students and
teachers alike. Teachers must meet the challenge to continue to guide
125
130

students learning. If they fail to meet the challenge, students will learn
unguided and thus possibly ineffectively.
The use of computers for instructional purposes appears to be growing
rapidly. However, if it is to continue to grow and we are to continue to
derive the fullest benefit from its unique capabilities, its introduction
and use in the instructional process must be carefully and systematically
planned. Also, much more must be done so that schools can share information
about the problems and promises of computers. Finally, the effectiveness
of computer applications must be evaluated to derive the fullest benefit
from every educational dollar spent on them.
126

REFERENCES
Bangs, and Hillestad, M.C. Automated Data Processing for Education-Curricular Implications. Detroit: Management InformationServices,1970.
Goodlad, J.I., O'Toole, J.F., Jr., and Tyler, L.L. Computers andInformation Systems in Education. New York: Harcourt,Brace & World, Inc., 1966.
Scheepmaker, B. (Ed.) Proceedings of IFIP World Conference onComputer Education. Amsterdam: IFIP, 1970.
Simon, K.A. and Grant, N.V. Digest of Educational Statistics.0E-10024-68. Washington, D.C.: Office of Education,1968.
127
132

APPENDIX 1
Survey Instruments
1-A. Letter accompanying first and second questionnairemailings
1-B. Questionnaire (Instructions and answer sheet)
1-C. Postal card
1-D. Interview questions
129
133

134
1-A. Letter accompanying firstquestionnaire mailing
AMERICAN INSTITUTES FOR RESEARCHWASHINGTON OFFICES
Address: 8555 Sixteenth Street, Silver Spring, Maryland 20910Telephone: (301) 587-8201
January 26, 1970
Dear Principal:
The expanding use of computers in secondary educationis a subject of great interest to both the National ScienceFoundation and the Office of Education. Both agencies needmore current and factual information on which to base planningand policy decisions in this area. Accordingly, the Officeof Computing Activities of the National Science Foundation issponsoring a nation-wide survey to learn more about the natureand extent of computer usage in American secondary schools.
The American Institutes for Research, which is conductingthis survey, invites you to participate by completing the en-closed questionnaire. All data collected will be aggregatedfor analysis and reporting purposes and no comparisons betweenschool:; will be made.
While the questionnaire deals with both administrativeand instructional uses of computers, the emphasis is on in-structional uses. The first part of the questionnaire definesthe types of computer usage included in this survey and outlinesthe information requested. After reading this first part andsubsequent questions, you may want to assign sections of thequestionnaire to different members of your staic who are mostknowledgeable about the particular computer applications in yourschool. If this is the case, please designate one individualto coordinate the completion of the questionnaire and to beresponsible for the return of the answer sheet.
Thank you for your help in assembling this much-neededinformation. A report of the survey findings will be madeavailable to you.
Sincerely,
1124°"41.4.116.4.%--"."'
George . Joh on, Ph. D.DirectorInstitute for Communication Research
GHJ /cdeEnclosure
130Corporate Office 135 N. Bellefield Avenue, Pittsburgh, Peiskeylvania 15213 (412) 6113-71190

1-A. Letter accompanying secondquestionnaire mailing
AMERICAN INSTITUTES FOR RESEARCH
illrilli:1111111111111.mo.P.1liWASHINGTON OFFICES
Address: 8555 Sixteenth Street, Silver Spring, Maryland 20910Telephone: (301) 587-8201
23 February 1970
EVEN IF YOU DO NOT USE COMPUTERS, PLEASE READ THIS LETTERDear Principal:
Can you spare a few minutes of your time to help find out what ishappening with computers in secondary schools?
Recently, as part of a study sponsored by the National ScienceFoundation, we sent every secondary school principal in the country aquestionnaire concerning computer applications in his school. If you havealready returned that questionnaire, do not respond again. Thank youfor your participation.
If you have not returned the questionnaire, we urge you to take thetime to provide the information requested. Our early returns indicatethat many principals thought that we wanted returns only from computerusers. On the contrary, we need returns from non users, as well asusers, in order to measure the true level of computer use in Americanschools. If your school does not use a computer in any way, less than 5minutes is required to provide the general information about your schoolrequested in Section A. If your school is using computers, please com-plete all applicable sections. The questionnaire must be recel., ed by uspromptly to permit adequate time for the preparation of the report ofsurvey findings.
Unlike many such surveys in which you have participated, a report ofthis survey will be made available to all schools which respond. Thereport will give details concerning the nature and location of computer usein high schools throughout the country. In addition, both the NationalScience Foundation and the Office of Education need this information tosupport planning and policy decisions. We feel these decisions will haveconsiderable effect on future use of computers in secondary schools.
Thank you for helping us assemble this much needed information.
Sincerely,
aLACkt/r, 51,41-'it:Arthur L. Korotkin, Ph. D.Assistant DirectorWashington OfficeALK/dgd
Corporate Office 135 N. Bellefield Avenue, Pittsburgh, Pennsylvania 15213 (412) 683.7800
1311 :15

4LQuesttonnaireitstructions
; I twin Ilibi07411s11111
Ammon' 110InsetteNdiggellet .
A SURVEY OF COMPUTING ACTIVITIESiN SECONDARY SCHOOLS
This survey is being conducted by the American Institutes for Research under the sponsorshipof the Office of Computing Activities, National Science Foundation. Our objective is to obtain ac-curate information about the nature and extent of computer usage in American secondary schools.We feel this can best be accomplished by securing information directly from the schools. Your
cooperation is very much appreciated.
DEFINITION OF COMPUTER USAGE
In order that all respondents may have the same frame ofreference in answering the questionnaire, we want to discuss"computer usage" as it is defined for the purpose of this study.Hopefully, it will help you in completing the questionnaire andwill insure uniform reporting of information.
What is a Computer?For the purposes of this study, the machines defined as com-
puters are general purpose computers which operate under thecontrol of a stored program. These computers include thecentral processing unit, au, Wary storage, communication linksand all peripheral equipment. They are capable of producingmore oian routine mathematical comp: ration as the end productof their operation. The programmable les]: top calculator is tobe included only when it is operated with a stored program.Electronic accounting machines are specifically excluded in thisdefinition.
Instructional and Administrative ApplicationsUse of the computer us o tool in the instructional process is
the primary focus of this study. Two basic categories of appli-cations are involved: (1) classroom and laboratory instruction;(2) instructional management, guidance and counseling. Thestudy is secondarily concerned with the school's use of computersfor administrative or managerial purposes, i.e., for such func-tions as student 'crounting, resource management, and planning.Specific applic..Yond, both instructional and administrative, aredescribed in Section B.
Access to the ComputerTo be included in this survey, it is not necessary that a
computer application involve a comput,r which is located in theschool. We are concerned with the use of computers in any orail of the following ways:
Immediate Access Computer physically present in schoolor school system, either owned or leased.
Remote Access Terminal in school, connecting with com-puter at any location (e.g., a network of schools or time-shared system).
Periodic Access Computer located close enough to schoolthat visits can be made to use the computer.
FundingSchools should report in this survey only those computer
applications where the school or school system is responsible forsome portion of the cost of the application. That is, some partof the cost of the application must come from the operatingbudget of the school or school system, regardle:,s of the sourceof the support and nature of the investment. The investment, forinstance, might take the form of staff time devoted to the ap-plication, just so long as the cost of that staff time is part ofthe operating budget.
132
1 :IS

GENERAL INSTRUCTIONS
The questionnaire is divided into four sections:Section A, General Information About Your School, should
bo completed by all respondents whether or not they are involvedin the use of computers as defined above.
Section B, Checklist of Specific Computer Applications, asksyou to indicate which applications your school has.
Section C, Budget and Computer Hardware, contains twocharts on which you provide information about your school'sbudget and the computers your school is using.
Section D, Instructional Applications, asks you to proviezinformation on each instructional application of computers inthe school.
Thus, if your school has no computer usage (within the de-finition given above) you complote only Section A. If your schoolis using computcrs for administrative purposes only, you com-plete Sections A, B, and C. If your school has one or moreinstructional applications of computers, you complete all foursections.
Please note that there is an answer sheet with numberedspaces and boxes corresponding to the questions in each section.Mark "N/A" if a question is not applicable to your school orits use of computers, or if the information is not obtainable.
If you have any vestions, please call:Mr. Charles Darby, Jr.(301) 587-8201
SECTION A
General Information About Your School(To be completed by all respondents)
A-1 In the space provided oil the answer sheet, please printthe name of the individual who can be contacted regardingthe contents of this questionnaire.
A-2 Please give the complete office telephone number, includ-ing area code, of the individual in item A-1.
A-3 Please give the name and complete address of the schoolreceiving this questionnaire.
A-4 What grade levels are included in your school?A-5 What type of school is it? Check the response in each
column which is most appropriate.
A-6 What is the current enrollment in your school?A-7 How many full-time teachers are on your staff this school
year, not counting counselors and administrative person-nel? (Include full-time equivalents of part-time teachersto the nearest whole number.)
A-8 If you confer a high school diploma, what percentages ofstudents in last year's graduating class went on to college,to junior college, and to technical school?
A-9 Check the statement which best describes your students'mean performance on standardized aptitude or achieve-ment tests.
Please keep in mind in answering the following questions,the definition of "computer usage" given at the beginning ofthis questionnaire.
A-10 How many members of your teaching staff have hadformalized training in the use of computers?
A-11 Check the type(s) of organizations which have conductedor sponsored this training.
A-12 Do you have a center or locus of responsibility for co-ordinating computing activities in your school?
A-13 If your school previously used a computer but hasstopped, please state why and indicate nature of use.
A-14 Does your school intend to initiate a new computer appli-cation within the next two years?
A-15 If "YES", is the purpose of this planned application ad-ministrative, instructional or both?
A-16 Check the anticipated source(s) of support for thisapplication.
A-17 Is a computer being used by your school at this time forany instructional or administrative purpose ?
If you answered "YES" to Question A-17, please go on to thenext section.
If you answered "NO" to Question A-17, you have given usthe requested information about your school. Please fold
the answer sheet and mail it to us. Directions for mailing areprinted on the back of the answer sheet. Thank you very muchfor your cooperation.
133
127

SECTION S
Checklist of Specific Computer ApplicationsThis section describes specific instructional and administrative applications of computers in secondary schools. Please indi :ate in
Section B of the answer sheet whether or not your school is involved in each application within the limits of the definition given earlier.Simply check 'YES" or "NO" after each number corresponding to the numbers below.
Applications 13-1 through B-6 refer to classroom and labora-tory learning situations where the computer is involved in theinstruction of students.13-1 Computer-assisted-instruction, including drill and practice,
tutorial and dialogue modes using programmed instruc-tional techniques.
B-2 Computer used as a computational aid to problem solvingin classes and laboratories for science, mathematics, ac-counting, economics, etc.
B-3 Teaching electronic data processing skills to students, in-cluding the preparation of input, machine operation, pro-gramming and systems analysis skills. The instructionmust include the running of a program on a computer.
B-4 Gaming and simulation of real life situations using acomputer.
B-5 Computer-mediated instruction involving TV, film, etc.,including the use of the computer to control the presenta-tion of media in the classroom or other learning situa-tion, or to analyze multi-media classroom responses.
B-6 Any other classroom or laboratory learning applicationsnot covered above in B-1 through B-5.
Applications B-7 through B-9 deal with the management ofinstruction, guidance, and counseling, where, for the most part,the computer is involved indirectly in the instructional process byproviding information to teachers and counselors.B-7 Management of instruction, including individual instruc-
tional diagnosis through the analysis on a coi liter ofstudent learning needs and progress and the prescriptionof individual instruction.
B-8 Guidance and counseling, including academic guidance,occupational counseling, and personal adjustment coun-seling. A computer might be used to score and analyze,or retrieve information concerning such assessmentmeasures as ability and achievement tests, personalityprofiles, occupational interest data, etc. (When testscoring and analysis is performed by a commercial testpublisher, it should net be reported here as a computerapplication in sour school.)
B-9 Any other application of computers for instructionalmanagement, guidance and counseling.
Application 13-10 includes all administrative applications ofcomputers. If your school has any of these applications, check"YES" after B-10.
B-10 Administrative applications:Student accounting to arrange student schedules; tokeep student records, such as educational history, attend-ance, grades; or to prepare report cards, etc.Resource management to schedule transportation,
ssrooms, etc.; to maintain personnel and financialrecords; or to allocate materials,Planning to plan for future resource allocation by pro-jection of enrollment, census-taking, educational systemsimulation, etc.Research and Evaluation to study and evaluate teach-ing methods, the learning process, curriculum, instruc-tional materials, etc.Any other administrative application.
SECTION C
Budget and Computer HardwareIn this section you are asked to provide information about
your school budget and the computers which your school isusing for the applications described in SECTION B.C-1 In the cells provided in the table on the answer sheet,
please enter an estimate of your school's Tntal AnnualOperating Budget and its Total Annual Budget forInstructional Applications of Computers. Then in Column1 estimate the percentage of the Total Annual OperatingBudget contributed by each source shown. Do the same inColumn 2 for the Tital Annual Budget for InstructionalApplications of Computers.
C-2 A table is provided for this item on the answer sheet. For
each computer and terminal, list manufacturer and modelin Coht:rm 3 and place a check mark under the appropriateterms in Columns 4-'7.
If your school is using a computer for instructional purposes,i.e., if you answered "YES" to any -ne of items B-1 throughB-9, please go on to the next section.
If your school has no instructional applications of computers,you have given us all the requested information about yourschool. Please fold the answer sheet as directed and mail it tous. Thank you very much for your cooperation.

SECTION D
instructional Applications
In this section we are requesting details regarding eachinstructional application of computers in your school. For ex-ample, if you checked "YES" to three items in B-1 through B-9,you should provide information for each of the three applica-tions checked. Note that the answer sheet provides space forup to four sets of answers. If you checked more than fourinstructional applications, please reproduce Section D of theanswer sheet or use a plain sheet of paper numbered appro-priately to record answers for additional applicationa.
You should consider each of the items B-1 through B-9 asa single application. For example, if you have checked item B-1,computer-assisted-instruction, and CAI is used in both mathe-matics and chemistry classes in your school, this is one appli-cation. Give a combined figure representing both mathematicsand chemistry when providing answers to questions regardingthe number of students involved, etc.
If you find a question that is clearly not relevant to aparticular application or if the information is not available, indi-cate this by writing "N/A" in the answer space. Answer thefollowing for each instructional application checked; but pleasedo not use "N/A" if a meaningful response is possible.D-1 Copy the code number for one instructional application
which you checked in SECTION B. Give the purpose ofthis application. Describe briefly what the student doesin this application. (Does he write and run programs,work at a terminal, run a computer, etc.)?
D-2 Copy the code number for this application again in theblank provided at the top of the chart.
D.3 List all subject areas which are involved in this applica-tion (e.g., English, chemistry, mathematics, data pro-cessing, etc.)
D-4 Estimate how many students are participating in or aredirectly affected by this application. (Participation in-cludes such tasks as writing a program, working at aterminal, receiving instruction in computers, etc.)
D-5 Estimate how many teachers are participating in orare directly affected by this application. (Writing soft-ware, lecturing, running a program, etc.)
D-6 Estimate how many hours of participation per student areinvolved per month.
D-7 Of the number of hours per student which you estimatedin question D-6, estimate the average number of hoursof actual computer use (running a program, working ata terminal, operating a computer, etc.) per student.
D-8 Estimate how many hours of participation per teacher areinvolved per month. (Include all of the time the teacherspends, preparation time, etc.)
D-9 Of the number of hours per teacher which you estimatedin Question D-8, estimate the average number of hours ofactual computer use per teacher (running a program,working at a terminal, operating the computer, etc.)
D-10 For this application, how many total hours of computertime per month are available? (If time on more than onecomputer is available, indicate the number of hours avail-able for all computers combined.)
D-11 For this application, estimate the number of hours ofactual computer running time per month. (Include pro-gram testing time, debugging time, etc., as well as timeduring which student and teacher are using a computer.If more than one computer is used, indicate the combinedtotal number of hours of actual computer running timefor all computers.)
D-12 Of the time you gave in item D-11, what percent is actualcentral processing unit time?
D-13 At what grade level is this application introduced?
D-14 Who prepares software (programs, system documenta-tion, instructional material) for this application?
D-15 Which computer programming language(s) is /are usedfor this application?
D-16 List the sources of support for this application and theamount of support from each source. (Be as specific aspossible, but use generic names for the sources of support,such as ESEA Title III, NSF Grant, etc. Do not use localtitles or project names.)
When the questions above have been answered for each instructional application of computers in your school,please fold the answer sheet and mail it to us. If you have an additional answer sheet fold it inside. Directionsfor mailing are printed on the back of the answer sheet.
The American Institutes for Research and the National Science Foundation wish to thank you for your co-operation in providing this information. As indicated in the cover letter, a copy of the report of this survey willbe made available to your institution. We hope you will find it useful.
If you have any additional information on your school's use of computers which you think we should have,please send it to us in a separate envelope.
135
139

ANSWER SHEET
The blanks and boxes provided for answers are numbered in accordance withthe numbers in the Questionnaire Booklet
A12 Center of responsibility Yes No
A-13 Why s iopped
SECTION AGENERAL INFORMATIONABOUT YOUR SCHOOL
A-1 Indh.idual Contact
A-2 Telephone Number(area code)
A3 School
Address
(zip code)
A-4 Grades thru
A-5 School Type
(1) Academic (1) Senior
(2) Comprehensive (2) Junior
(3) Business(4) Technical
(5) Vocational(6) Other, specify
A-6 Enrollment
A-7 Teachers
A-8 College
Junior College
Technical School
N/A
A-9 Test Performance
(1) Above national norm (61st percentile or higher)(2) About equal to national norm (40-60th percentile)(3) Below national norm (39th percentile or lower)(4) Tests not used
A-10 Teaching staff computer training
A-11 Training Conductor or SponsorConducted Sponsored
N/ATechnical or Computer SchoolCollege or UniversityComputer Manufacturer or other
Source
National Science FoundationU.S. Office of EducationOther Federal Agency,
SpecifyOther, Specify
Nature of use
A-14 Initiate application Yes
A-15 Purpose:
(1) Administrative
(2) Instructional
A-16 Anticipated Sources:
N/AU.S. Office of Education
National Science Foundation
Other Federal Agencies
(1) instructional
(2) administrative
(3) both
(4) N/A
No
(3) Both
(4) N/A
Private Foundation
State
Local
A17 Use of Computer Yes No
SECTION B
CHECKLIST OF SPECIFIC COMPUTER APPLICATIONS
Instructional Yes No
CAI B-1
Problem Solving B-2
EDP Skills B-3
Gaming/Simulation B-4
Mediated Instruction B-5
Other, Specify
B-6
Management of Instruction B-7
Guidance B-8
Other, Specify
B-9
1.36
140
Admini ive
8-10

SECTION C
BUDGET AND COMPUTER HARDWARE
Sources
Total Annual Operating Budgetfor School $
Total Annual BudgetApplications of Computers
for Instroction.11
$_____ ___________
Col 1
Percent of Total Annual OperatingBudget Contributed by Each Source
Col. 2Percent of Total Annual Budget for
Instructional Applications of Computer,.Contributed by Each Source
Local
State
Federal
Others, Specify
0/0 --%0y00/0
cro 0,0
% 0/
% %
0/ %
Total 100% Total 100 %
C-2
Col.List beiow the manufacturermodel for eachterminal, if anyschool uses with
Computer
3
andcomputer and
which youreach computer,
Terminal
Applicationfororiginallyobtained
.-c
-o<
Col. 4
which
co
Application
-o<
Col. 5Present
.-
_-c.6co
scnool
6_.-
".,u
Col.Arrangementfor useschool
a,v,
6
byor
system
a,Ei=
(1,.'' n.
aEi=-0t=
06
,.0 in--6o o_c _cvi v,
This
Eia,EE
U
Col.computer
is provided
aEou E
.c
au
7
systeroby
D
(1/
U
a;
C
(AFTER COMPLE1ING THIS TAB4. PLEASE RETURN TO SECTION C
137
141_

D-1
InsertCode Number
B -
B -
SECTION D
INSTRUCTIONAL APPLICATIONS
PufPose
Activity
Purpose
Activity
Purpose
Activity
Purpose
Activity
D -2 Insert Code number B- B- B-
D -3 subject areas
0-4 student participants
0-5 teacher participants
D 6 student hours/mo.
D-7 hours of actual student use/mo.
D-B teacher hours/ mo.
D-9 hours of actual teacher use/mo.
D-10 total hours available/mo.
D-11 actual running hours/mo.
D-12 percent CPU time % % % %
D-13 grade introduced
0-14 software preparer
D-15 programminglanguage(s)
D-16source a.
amount b.
source a.
amount b.
source a.
amount b.
.
142
aioH olden
Ono 6upei sseppe Aidaa ssaupna) nog
11311VIN 4135 V SI SIHI
BUSINESS REPLY MAILNo Postage Stamp Necessary If Mailed In The United States
POSTAGE WILL BE PAID BY
Dr. George H. JohnsonProject CASSAmerican Institutes for Research8555 - 16th StreetSilver Spring, Maryland 20910
139
143
FIRST CLASSPermit No.
1008Silver Spring, Md.
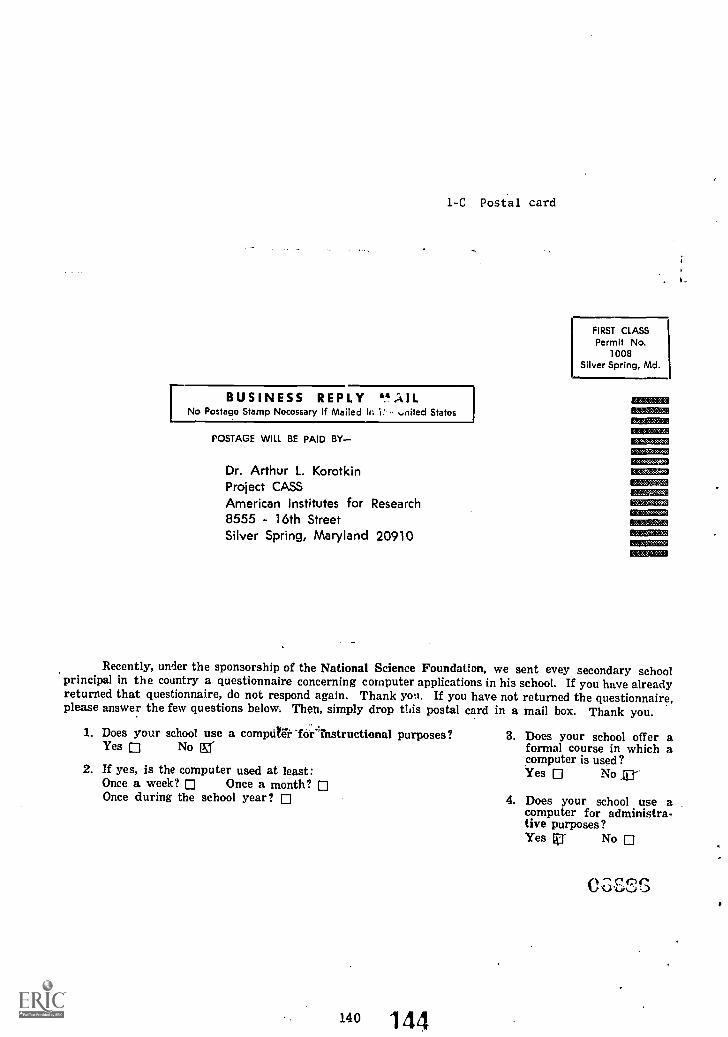
1-C Postal card
r BUSINESS REPLY .11AILNo Postage Stamp Necessary If Mailed In 1: , ..,nited States
POSTAGE WILL BE PAID BY
Dr. Arthur L. KorotkinProject CASSAmerican Institutes for Research8555 - 16th StreetSilver Spring, Maryland 20910
_ 6 -
FIRST CLASSPermit No.
1008Silver Spring, Md.
Recently, under the sponsorship of the National Science Foundation, we sent evey secondary schoolprincipal in the country a questionnaire concerning computer applications in his school. If you have alreadyreturned that questionnaire, do not respond again. Thank you. If you have not returned the questionnaire.please answer the few questions below. Then, simply drop this postal card in a mail box. Thank you.
1. Does your school use a computeir-forlbstructional purposes? 3. Does your school offer aYes o No Er formal course in which a
computer is used?2. If yes, is the computer used at least: Yes No lir
Once a week? Once a month?Once during the school year? 4. Does your school use a
computer for administra-tive purposes?Yes ii:)" No
140 144

1-D Interview Questions
Questions for Interview
1. YOU LISTED THESE APPLICATIONS. (List them.)IS THERE A SEPARATE COURSE FOR EACH OR IS THERE MORE THAN ONE APPLICATIONIN A COURSE?COULD YOU DESCRIBE HOW THESE FIT INTO YOUR COURSES?
(Purpose: To determine structure of the use of the computer in theschool.)
2. ARE YOU RESPONSIBLE FOR ALL OF THESE APPLICATIONS?
(Purpose: If no, you will want to make arrangements to talk to thoseresponsible for the other applications.)
3. CAN YOU GIVE US A BRIEF HISTORY OF THE USE OF THE COMPUTER IN YOURSCHOOL?
(Prompt: How did the school get started in using computers?)(Note: Ask for dates. May get history of one application only--if so,attempt to determine history of other uses which have stopped.)
4. WHAT CAUSED YOU TO BEGIN TO USE COMPUTERS FOR INSTRUCTION?
(Prompt: Did a colleague interest you, did the school board buy acomputer for the school, did the school receive a grant,...?)(Purpose: Self-explanatory, plus interested in whether they sought theapplication or someone convinced them. What was the impetus?)
5. IN ADDITION TO THE BRIEF DESCRIPTION WHICH YOU PROVIDED IN THE QUESTION-NAIRE, WHAT CAN YOU TELL US ABOUT THE OVERALL PURPOSE OF THIS APPLICATION?
(Prompt: What are you trying to accomplish?)
6. LIKEWISE, CAN YOU TELL US WHAT THE STUDENTS AND THE TEACHERS ACTUALLYDO WHEN PARTICIPATING IN THIS APPLICATION?
(Prompt: How much lecturing or formal classroom work is there versusindividual work? What do you and the student do when you are workingwith him individually?)
7. WHAT FACTORS, WHICH MIGHT DISTINGUISH YOUR SCHOOL FROM OTHERS NOT USINGCOMPUTERS, ARE ASSOCIATED WITH YOUR USE OF COMPUTERS FOR INSTRUCTION?
(Prompt: Is there something about the environment in this school?)(Purpose: Determine what elements are present in the school environmentwhich are associated with computer use.)
8. WHAT CAN YOU TELL US ABOUT YOUR EXPERIENCE WITH INTEGRATING COMPUTERUSE INTO THE SCHOOL CURRICULUM?
141 1

(Prompt: What problems did you have? Was it done smoothly?)(Purpose: How did he go about integrating the application in thecurriculum and is it an integral part of the curriculum?)
9. DID YOU OR YOUR STAFF PREPARE THE CURRICULUM SOFTWARE FOR THIS APPLICATIONOR DID YOU OBTAIN IT FROM AN OUTSIDE SOURCE? WHAT IS THE SOURCE?
(Note: Curriculum software in a broad sense, meaning the curriculummaterials for instruction.)
10. WHAT ASPECTS OF YOUR APPLICATION DO YOU FEEL CONTRIBUTE THE MOST TO THELEARNING BY STUDENTS?
(Prompt: What is it about the application that promotes learning?)(Purpose: Is there something about instruction which includes the useof computers which promotes learning?)
11. IF YOU WERE TRYING TO CONVINCE A COLLEAGUE TO USE COMPUTERS FOR INSTRUCTION,WHAT IMPROVEMENTS IN INSTRUCTION IN YOUR SCHOOL RESULTING FROM THE USEOF COMPUTERS MIGHT YOU POINT TO?
(Prompt: What general improvements in the instruction in the school canbe attributed to the use of computers?)(Purpose: What favorable impact does the computer have on instructionin the school?)
12. OF WHAT NEGATIVE RESULTS OF THE USE OF COMPUTERS MIGHT YOU WARN THISCOLLEAGUE?
(Prompt: What are the negative ramifications resulting from the use ofcomputers?)
13. OF WHAT PROBLEMS WOULD YOU WARN HIM?
(Prompt: What problems do you have with your application ?)
14. HOW SATISFIED ARE YOU WITH YOUR APPLICATION?
(Prompt: How would you rate your satisfaction?)
15. HOW PERMANENT IS THIS COMPUTER APPLICATION: THAT IS, HOW LONG A LIFESPAN DO YOU ENVISION FOR THIS APPLICATION?
(Prompt: Will it go on indefinitely before it stops or changes so muchthat it is different?)(Purpose: Is this a temporary or well-entrenched application?)
16. WHAT LEVEL OF ACHIEVEMENT BY YOUR STUDENTS ARE YOU SHOOTING FOR?
(Prompt: Is there a minimum standard they must achieve?)
142146

17. WHAT IS THE BREAKDOWN OF TOTAL COST OF THIS COMPUTER APPLICATION FORSUCH ITEMS AS PERSONNEL, COMPUTER TIME, MATERIALS, ETC.?
(Prompt: Can you give us a rough percentage breakdown for personnelversus hardware? Is it 60-40, 80-20?)(Note: If they can give a complete cost breakdown, fine; if not, askfor a personnel versus hardware cost.,
18. HOW HAVE THESE COSTS VARIED AS THE COMPUTER APPLICATION WAS DEVELOPED?
(Prompt: Was personnel more or less expensive than hardware in thebeginning?)
19. WOULD YOU LIST THE PERSONNEL BY TITLE THAT ARE INVOLVED WITH THISAPPLICATION PART-TIME AND THOSE INVOLVED FULL-TIME?
20. WHAT FEATURES WOULD YOU LIKE TO INCLUDE IN THE SYSTEM WHICH YOU CANNOTBECAUSE OF COST RESTRICTION?
(Prompt: What is your dream?)
21. WHAT ARE YOUR PLANS FOR EXPANDING YOUR PRESENT INSTRUCTIONAL APPLICATION(S)OR ADDING NEW ONES IN THE FUTURE?
22. WHEN WILL THIS EXPANSION OR ADDITION BE IMPLEMENTED?
(Purpose: They may discuss plans, but how firm are these plans? Canthey give a date for implementation?)
23. WHAT DO YOU NEED TO CONTINUE OR TO EXPAND YOUR APPLICATION?
(Prompt: What is your greatest need now? Is it money, training,advice, etc.?)
24. WHAT IS THE BEST WAY THAT OUTSIDE SOURCES COULD HELP YOU IN YOUR USEOF COMPUTERS?
(Note: Outside sources include government, industry, private founda-tions, any community source.)
25. ARE THE TEACHERS ON THE STAFF ADEQUATELY TRAINED IN THE INSTRUCTIONALUSES OF COMPUTERS OR IS THIS ONE OF YOUR PROBLEMS?
26. IF THE TEACHERS ARE NOT ADEQUATELY TRAINED, WHAT TYPE OF TRAINING DOTHEY NEED TO ADEQUATELY HANDLE THE APPLICATIONS AND/OR :XPAND THEAPPLICATIONS?
27. HERE IS A LIST OF SCHOOLS IN THE AREA WHICH REPORTED INSTRUCTIONALCOMPUTER USES TO US. DO YOU KNOW OF ANY OTHER SCHOOLS IN THE AREA WHICHARE USING COMPUTERS INSTRUCTIONALLY?
143
147

(Purpose: Get any we missed.)
28. WHAT COOPERATIVE ARRANGEMENTS ARE YOU INVOLVED WITH FOR DEVELOPINGOR USING COMPUTERS AT THE SECONDARY LEVEL?
29. ARE YOU INVOLVED IN ANY EFFORTS TO SHARE INFORMATION ABOUT COMPUTER USE?
30. HOW USEFUL WOULD YOU FIND INFORMATION CONCERNING INSTRUCTIONAL USES OFCOMPUTERS IN OTHER SCHOOLS?
31. WHAT KINDS OF INFORMATION WOULD YOU MOST LIKE TO SHARE?
(Prompt: Specifics about applications, curriculum materials, generalinformation about purpose?)
32. DO YOU HAVE ANY CURRICULUM MATERIALS OR OTHER INFORMATION ABOUT YOURAPPLICATION WHICH YOU CAN SHARE WITH US?
144
14©

APPENDIX 2
Interviews
2-A. Schools visited
2-B. Schools called
145
149

Hinsdale Central High SchoolHinsdale, Illinois
New Trier Township High SchoolWinnetka, Illinois
York Comm. High SchoolElmhurst, Illinois
Clenbrook South High SchoolGlenview, Illinois
Kelvvn Park High SchoolChicago, Illinois
Bucks County Technical SchoolFairless ;sills, Pennsylvania
Haverford School DistrictSenior High SchoolHavertown, Pennsylvania
Wilson High SchoolPortland, Oregon
Lincoln High SchoolPortland, Oregon
West Linn High SchoolWest Linn, Oregon
Lake Oswego High SchoolLake Oswego, Oregon
Centennial HighGresham, Oregon
Littleton High SchoolLittleton, New Hampshire
Carver Vocational High SchoolAtlanta, Georgia
146
150
2A. Schools visited
Galileo High SchoolSan Francisco, California
Half Moon Bay High SchoolHalf Moon Bay, California
San Carlos HighSan Carlos, California
San Lorenzo HighSan Lorenzo, California
Mapleton High SchoolDenver, Colorado
Broomfield Senior High SchoolBroomfield, Colorado
South High SchoolDenver, Colorado
Abraham Lincoln High SchoolBrooklyn, New York
Stuyvesant HighNew York, N. Y.
Frederick Douglas Intermediate SchoolNew York, N. Y.
Jamaica High SchoolJamaica, New York
Intermediate School 96Brooklyn, New York
Syosset High SchoolSyosset, New York
Half Hollow Hills High SchoolDix Hills, New York
Keene HighKeene, New Hampshire
Hendersonville High SchoolHendersonville, North Carolina
Harding High School(.harlotte, North Carolina

Schools Visited
Seacrest High SchoolDelray Beach, Florida
Miami Edison Senior High SchoolMiami, Florida
Antioch HighAntioch, Tennessee
Warren County Senior HighMcMinnville, Tennessee
Worthington High SchoolWorthington, Ohio
Shawnee LocalLima, Ohio
Edison Jr. Sr. High SchoolTulsa, Oklahoma
Adair High SchoolAdair, Oklahoma
Gatesville State School for BoysGatesville, Texas
Killeen High SchoolKilleen, Texas
Greun River Senior High SchoolGreen River, Wyoming
Natrona County High SchoolCasper, Wyoming
Catalina High SchoolTucson, Arizona
Sahuarita High SchoolSahuarita, Arizona
147
151
Woodrow Wilson High SchoolSan Francisco, Calif.
Irvington High SchoolFremont, Cal. 94538
Shaw Jr. High SchoolPhiladelphia, Pa.
William Penn High SchoolPhiladelphia, Pa.

Central SchoolWindsor, New York
Franklin High SchoolFranklin, Wisconsin
Lessen High SchoolSusanville, California
Fort Vancouver High SchoolVancouver, Washington
Santa Ynez High SchoolSanta Ynez, California
Trenton Central High SchoolTrenton, New Jersey
Greater Johnstown Central Senior HighJohnstown, Pennsylvania
Lyman Hall High SchoolWallingford, Connecticut
Hartford Union High SchoolHartford, Wisconsin
Memorial High SchoolBeloit, Wisconsi.1
Gook County High SchoolGrand Marais, Minnesota
Thomas Jefferson High SchoolRichmond, Virginia
Logan Junior High SchoolAltoona, Pennsylvania
Windber Area High SchoolWindber, Pennsylvania
Ft. Defiance High SchoolFt. Defiance, Virginia
Staples High SchoolWestport, Connecticut
Los Alamos High SchoolLos Alamos, New Mexico
148 '
52
2B. Schools called
Moscow High SchoolMoscow, Idaho
Chipley High SchoolChipley, Florida
Ashland Senior High SchoolAshland, Oregon
Lawrence High SchoolLawrence, Kansas
Lincoln High SchoolStockton, California
Norwich Senior High SchoolNorwich, New York
Great Falls High SchoolGreat Falls, Montana
Pleasant Grove High SchoolP.easant Grove, Utah
Eureka County High SchoolEureka, Nevada
Dedham High SchoolDedham, Massachusetts
Milton High SchoolMilton, Massachusetts
Billerica Memorial High SchoolBillerica, Massachusetts
Grtr. Law. Tech. Inst.Andover, Massachusetts
Norwood Senior High SchoolNorwood, Massachusetts
Richfield High SchoolRichfield, Minnesota
Osseo Senior HighOsseo, Minnesota
Southwest High School.nneapolis, Minnesota
Valley View Junior High
Edina, Minnesota

Schools Called
Estancia High SchoolCosta nesa, California
Norwalk High School1,orwalk, California
Azusa High SchoolAzusa, California
Morina High SchoolHuntington Beach, California
Blair High SchoolPasadena, California
149
1 53

APPENDIX 3
Sources of Data for Basic Questions
151
154

Basic Question Questionnaire Postal Card Interview
Extent Administrative & Instructional1
2
A-17, B-10A-17, B-1 thru B-9
Degree of Administrative & Instructional3
4
5
6
7
8
9
C-2 (Column 3 &5)
C-2 (Column 6)C-2 (Column 3 & 5)
C-2 (Column 6)B-1 thru B-9D-4 thru D-9D-10, D-11
4
1
2
Nature and Purpose of Instructional Applications10 B-1 thru B-911 B-1 thru B-912 D-1
13 D-1
14 D-3
15 D-3
16 D-13
17 D-4 thru D-918 D-1, D-7, D-919
20 -
21 D-14
22 D-15
23 D-12
-
2,
-
-
3
-
6
5
1
1,
1
6
16
10,
n
-
1,
8
11
6
152
155

Basic Q'aestion Questionnaire Postal Card Interview
Level & Source of Support ofInstructional Use
24 C-1 - 17, 1825 C-1 -
26 D-16 - -
27 - 28, 29
28 A-li, A-12, D-3 2, 3 1, 829 A -11 -
School Characteristics & Use30 A-4 thru A-9 -
Previous Use31
32
33
-
A-13
A-13
- 3,
- 3
- 3,
4
4
Plans for Future Use34 - - 15
35 A-14, A-15 - 20, 21
36 A-16 - 22
37 - - 12, 13, 14
38 - 23, 24, 25,26,
153
156

4 7, ,.1
AMERICAN INSTITUTES FOR IFIESEARC41
CORPORATE OFFICERS
S. Rains Wallace, PhD,PresidentBrent Baxter, PhD, Executive Vice President
Edwin A. Fleishman, PhD, Senior Vice PresidentPaul A. Schwarz, PhD, Vice President
BOARD OF DIRECTORS
John C. Flanagan, PhD, ChairmanPaul Horst, PhD
FrederiCkB. Davis, EdD
Robert L. ThOrridike, PhD
Robert M. Gagne, PhD
Brent Baxter, PhD
: Edwin A. Fleishman, PhD
: 1 James .M. Houston, LLB
S. Rains Wallace; PhD
,
.ESEARCHAOVISORS
PhD:
7and4R1,
telmeliRlifObu a 1ö21& "-,
V.; n
![MPh & SPh / MrS & SrS - BDTIC4.60].039 [1.00].047 .012 x .008 [0.3 x 0.2].039 C.181 [4.60].127 [3.25].118 [3.00].047 [1.20].120 [3.05] A B.012 [0.30] SQ. B.031 [0.80].078 [2.00] B](https://img.pdfslide.us/doc/110x75/5ae409787f8b9a7b218ddbce/mph-sph-mrs-srs-460039-100047-012-x-008-03-x-02039-c181-460127.jpg)


![Grid Magazine [#047]](https://img.pdfslide.us/doc/110x75/568bf19b1a28ab893393c06f/grid-magazine-047.jpg)