Embed Size (px)
Citation preview

Document of
The World Bank
Report No: ICR00003764
IMPLEMENTATION COMPLETION AND RESULTS REPORT
(IDA-H1830 IDA-H6950 TF-10518)
ON A
CREDIT AND GRANT
IN THE AMOUNT OF SDR 16.8 MILLION
(US$24.99 MILLION EQUIVALENT)
AND A GRANT IN THE AMOUNT OF US$2.4 MILLION
TO THE
LAO PEOPLE’S DEMOCRATIC REPUBLIC
FOR A
HEALH SERVICES IMPROVEMENT PROJECT
June 15, 2016
Health, Nutrition, and Population Global Practice East Asia and Pacific Region
Pub
lic D
iscl
osur
e A
utho
rized
Pub
lic D
iscl
osur
e A
utho
rized
Pub
lic D
iscl
osur
e A
utho
rized
Pub
lic D
iscl
osur
e A
utho
rized

CURRENCY EQUIVALENTS (Exchange Rate Effective April 30, 2016)
Currency Unit = Lao Kip (LAK) US$1.00 = LAK 8,114
US$1.00=SDR0.71
ABBREVIATIONS AND ACRONYMS
ADB Asian Development Bank AF Additional Financing ANC Antenatal Care CAS Country Assistance Strategy CU5 Children Under 5 years DALY Disability-adjusted Life Year DGA District Grant Allocation DHIS2 District Health Information System 2 DPF Department of Planning and Finance DPT3 Diphtheria, Pertussis, and Tetanus 3 EGDP Ethnic Group Development Plan FM Financial Management GAVI Global Alliance for Vaccines and Immunizations GDP Gross Domestic Product GNI Gross National Income HEF Health Equity Fund HGNDP Health Governance and Nutrition Development Project HMIS Health Management Information System HRITF Health Results Innovation Fund HSIP Health Services Improvement Project ICHC Integrated Community Health Center ICR Implementation Completion and Results Report IDA International Development Association IEC Information, Education, and Communication IMR Infant Mortality Rate JICA Japan International Cooperation Agency LiST Lives Saved Tool LSIS Lao Social Indicator Survey M&E Monitoring and Evaluation MCH Maternal and Child Health MDG Millennium Development Goal MICS Lao Multiple Indicator Cluster Survey MMR Maternal Mortality Rate MNCH Maternal Neonatal and Child Health MOH Ministry of Health MTR Midterm Review NGO Non-Governmental Organization

NGPES National Growth and Poverty Eradication Strategy NPCO National Program Coordination Office OOP Out of Pocket PAD Project Appraisal Document PD Project Director PDO Project Development Objective PDR People’s Democratic Republic PfQ Paying for Quality PHC Primary Health Care PHO Provincial Health Office PMU Project Management Unit QER Quality Enhancement Review RBF Results-based Financing SBA Skilled Birth Attendant SRC Swiss Red Cross TT2 Tetanus Toxoid 2 U5MR Under-Five Mortality Rate UNDP United Nations Development Program UNICEF United Nations Children's Fund VHV Village Health Volunteer WHO World Health Organization
Senior Global Practice Director: Timothy Grant Evans Practice Manager: Toomas Palu
Project Team Leader ICR Team Leader/Author:
Somil Nagpal Nkosinathi Vusizihlobo Mbuya
LAO PEOPLE’S DEMOCRATIC REPUBLIC Health Services Improvement Project
CONTENTS
Data Sheet A. Basic Information ........................................................................................................ i B. Key Dates .................................................................................................................... i C. Ratings Summary ........................................................................................................ i D. Sector and Theme Codes ........................................................................................... ii E. Bank Staff ................................................................................................................... ii F. Results Framework Analysis ..................................................................................... iii G. Ratings of Project Performance in ISRs ................................................................. xiii H. Restructuring (if any) .............................................................................................. xiv
I. Disbursement Profile .............................................................................................. xiv
1. Project Context, Development Objectives, and Design .......................................................... 1
2. Key Factors Affecting Implementation and Outcomes .......................................................... 5
3. Assessment of Outcomes ...................................................................................................... 13
4. Assessment of Risk to Development Outcome ..................................................................... 24
5. Assessment of Bank and Borrower Performance ................................................................. 24
6. Lessons Learned.................................................................................................................... 27
7. Comments on Issues Raised by Borrower/Implementing Agencies/Partners....................... 28
Annex 1. Project Costs and Financing .......................................................................................... 31
Annex 2. Outputs by Component.................................................................................................. 32
Annex 3. Economic and Financial Analysis (including assumptions in the analysis) ................. 37
Annex 4. Bank Lending and Implementation Support/Supervision Processes ............................. 48
Annex 5. Beneficiary Survey Results ........................................................................................... 51
Annex 6. Stakeholder Workshop Report and Results ................................................................... 51
Annex 7. Summary of Borrower's ICR and/or Comments on Draft ICR .................................... 52
Annex 8. Comments of Cofinanciers and Other Partners/Stakeholders ...................................... 55
Annex 9. List of Supporting Documents ..................................................................................... 56
MAP ............................................................................................................................................. 57

i
A. Basic Information
Country: Lao People's Democratic
Republic Project Name:
Health Services
Improvement Project
Project ID: P074027 L/C/TF Number(s): IDA-H1830,IDA-
H6950,TF-10518
ICR Date: 05/19/2016 ICR Type: Core ICR
Lending Instrument: SIL Borrower: MINISTRY OF
FINANCE
Original Total
Commitment: US$15.00 million Disbursed Amount: US$25.74 million
Revised Amount: US$24.99 million
Environmental Category: B
Implementing Agencies:
The National Project Coordination Office
Cofinanciers and Other External Partners:
B. Key Dates
Process Date Process Original Date Revised / Actual
Date(s)
Concept Review: 10/30/2003 Effectiveness: 02/22/2006 02/22/2006
Appraisal: 06/30/2004 Restructuring(s):
06/09/2011
04/11/2012
12/23/2013
Approval: 09/13/2005 Midterm Review:
Closing: 06/30/2011 12/31/2015
C. Ratings Summary
C.1 Performance Rating by ICR
Outcomes: Moderately Unsatisfactory
Risk to Development Outcome: Moderate
Bank Performance: Moderately Satisfactory
Borrower Performance: Moderately Satisfactory
C.2 Detailed Ratings of Bank and Borrower Performance (by ICR)
Bank Ratings Borrower Ratings
Quality at Entry: Moderately Unsatisfactory
Government: Moderately Satisfactory
Quality of Supervision: Moderately Satisfactory Implementing Agency/Agencies:
Moderately Satisfactory

ii
Overall Bank Performance:
Moderately Unsatisfactory
Overall Borrower Performance:
Moderately Satisfactory
C.3 Quality at Entry and Implementation Performance Indicators
Implementation Performance
Indicators QAG Assessments (if
any) Rating
Potential Problem Project
at any time (Yes/No): No
Quality at Entry
(QEA): None
Problem Project at any
time (Yes/No): Yes
Quality of Supervision
(QSA): None
DO rating before
Closing/Inactive status:
Moderately
Satisfactory
D. Sector and Theme Codes
Original Actual
Sector Code (as % of total Bank financing)
Central government administration 5 5
Compulsory health finance 5 5
Health 90 90
Theme Code (as % of total Bank financing)
Child health 17 17
Health system performance 33 33
Malaria 17 17
Nutrition and food security 16 16
Population and reproductive health 17 17
E. Bank Staff
Positions At ICR At Approval
Vice President: Victoria Kwakwa Jemal-ud-din Kassum
Country Director: Ulrich Zachau Ian C. Porter
Practice Manager/Manager: Toomas Palu Emmanuel Y. Jimenez
Project Team Leader: Somil Nagpal Hope C. Phillips Volker
ICR Team Leader: Nkosinathi Vusizihlobo Mbuya
ICR Primary Author: Nkosinathi Vusizihlobo Mbuya

iii
F. Results Framework Analysis Project Development Objectives (from Project Appraisal Document)
The project development objective (PDO) is to assist the Lao People’s Democratic Republic (PDR) to improve the health status of its population, particularly the poor and rural population, in eight central and southern provinces. Revised Project Development Objectives (as approved by original approving authority)
To assist Lao PDR to increase utilization and quality of health services, particularly for poor women and children in rural areas in project provinces.
(a) PDO Indicator(s)
Indicator Baseline Value Original Target Values (from approval documents)
Formally Revised Targets
Actual Value Achieved at Completion or Target Years
Indicator 1 (Phase 1)
Infant mortality rate
Value (quantitative or qualitative)
82 (11/15/2003)
75 30.6 (09/30/2008)
Comments
Target surpassed. Baseline and ‘actual’ end-line values represent national figures, but target value set for the 8 project provinces. Indicator dropped at 2011 restructuring.
Indicator 2
(Phase 1)
Under-five mortality rate
Value (quantitative or qualitative)
106.9 (11/15/2003)
95 44.7 (09/30/2008
Comments
Target surpassed. Baseline and ‘actual’ end-line values represent national figures, but target value set for the 8 project provinces. Indicator dropped at 2011 restructuring.
Indicator 3
(Phase 1)
Percentage of children under 1 year of age immunized with diphtheria, pertussis, and tetanus 3 (DPT3)
Value (quantitative or qualitative)
48 (03/04/2004)
70 76 (04/30/2011)
Comments
Target surpassed. However, the project team noted persistent concerns throughout the life of the first phase of the project on the accuracy of population estimates (denominator). Baseline value and target set for 8 provinces, but actual value at closing represents 7 provinces. Revised target of 90 not met (value of 67 on 09/30/2012 is lower than baseline probably due to data quality and problems with denominator estimates. Therefore, target considered as unmet in Phase 2.
Indicator 4 (Phase 1)
Percentage of children 12–23 months immunized against measles

iv
Value (quantitative or qualitative)
41.8 (03/04/2004)
65 66 (04/30/2011)
Comments
Target surpassed. Indicator changed during the 2011 restructuring to ‘% of children 9–23 immunized against measles’. The project team noted persistent concerns throughout the life of the first phase of the project on the accuracy of population estimates (denominator). Baseline value and target set for 8 provinces, but actual value at closing represents 7 provinces.
Indicator 5
(Phase 1)
Percentage of births attended by trained health personnel
Value (quantitative or qualitative)
17.4 (03/04/2004)
25 43 (04/30/2011)
Comments
Target surpassed. Indicator dropped at the 2011 restructuring. The project team noted persistent concerns throughout the life of the first phase of the project on the accuracy of population estimates (denominator). Baseline value and target set for 8 provinces, but actual value at closing represents 7 provinces.
Indicator 6 (Phase 1)
Percentage of pregnant women receiving tetanus toxoid 2 (TT2)
Value (quantitative or qualitative)
36 (03/04/2004)
45 45 (04/30/2011)
Comments
Target achieved. Indicator dropped at the 2011 restructuring. However, the Project team noted persistent concerns throughout the life of the first phase of the project on the accuracy of population estimates (denominator). Baseline value and target set for 8 provinces, but actual value at closing represents 7 provinces.
Indicator 7 (Phase 1)
% women practicing modern contraceptive methods obtained from public health facilities
Value (quantitative or qualitative)
32.2 (03/04/2004)
40 35 (04/30/2011)
Comments
Target not achieved. Indicator dropped at the 2011 restructuring. The project team noted persistent concerns throughout the life of the first phase of the project on the accuracy of population estimates (denominator). Baseline value and target set for 8 provinces, but actual value at closing represents 7 provinces.
Indicator 8 (Phase 1)
Curative visits per capita to health centers
Value (quantitative or qualitative)
0.1 (03/04/2004)
0.2 0.26 (04/30/2011)
Comments
Target surpassed. Indicator dropped at the 2011 restructuring. Baseline value and target set for 8 provinces, but actual value at closing represents 7 provinces. The Project team also noted persistent concerns throughout the life of the first phase of the project on the accuracy of population estimates (denominator).
Indicator 9 (Phase 2)
% of children under 1 year of age immunized against DPT3
Value (quantitative or qualitative)
76 (09/30/2011)
90 67 (09/30/2012)

v
Comments
Target not achieved. Indicator added at the 2011 restructuring with additional financing (AF) and dropped as PDO indicator at the 2013 restructuring. Although indicator carried over from the previous phase, the scale of the project reduced and new target set. Since there is insufficient data for comparison with the previous phase, it is treated as a new indicator. Latest available data for the indicator are as of September 2012; however, no annual target set in the Restructuring Paper, and hence end-of-project target used to assess achievement of the target.
Indicator 10 (Phase 2)
% of children under 1 immunized against measles
Value (quantitative or qualitative)
69 (09/30/2011)
75 60 (09/30/2012)
Comments
Target not achieved. Indicator significantly changed during 2011 restructuring and dropped at 2013 restructuring. Latest available data for the indicator are as of September 2012.
Indicator 11 (Phase 2)
% of births attended by trained health personnel
Value (quantitative or qualitative)
24 (09/30/2011)
45
43 (09/30/2012)
Comments
Target substantially achieved. Although a carry-over from the Phase 1 Results Framework, the baseline for this indicator is different from the attained value in at the end of Phase 1, suggesting a change in scope of the indicator. Hence, it is treated as a new indicator. Latest available data for the indicator are as of September 2012, and hence the 2012/2013 target was used to assess achievement of target. Indicator was dropped during the 2013 restructuring.
Indicator 12 (Phase 2)
Outpatient department cases per capita at public health centers and district hospitals
Value (quantitative or qualitative)
0.3 (09/30/2011)
0.42 0.39 (09/30/2012)
Comments
Target partially achieved. Indicator added at the 2011 restructuring and AF and dropped at the 2013 restructuring. Latest available data for the indicator are as of September 2012, and hence the 2012/2013 target was used to assess achievement of target.
Indicator 13 (Phase 2)
Number of district hospitals that meet 10 minimum requirements of the Ministry of Health (MOH) for defining and monitoring the standards and quality of health services
Value (quantitative or qualitative)
Baseline Not Established (09/30/2011)
Target not set Not Evaluated (31/31/2013)
Comments Indicator Not evaluated (and hence assessed as not achieved). Indicator added at the 2011 restructuring and AF. The implementation of the Paying for Quality (PfQ) initiative had not yet begun at the time of the 2013 restructuring. As such, neither the baseline nor the target had been set.
Indicator 14 (Phase 2)
% of villages receiving outreach (through health days, integrated outreach, and/or mobile clinics) visits according to the agreed schedule
Value (quantitative or qualitative)
Baseline Not Established (09/30/2011)
Target not Set Not evaluated (03/31/2013)

vi
Comments Target not evaluated (and hence assessed as not achieved). Indicator added at the 2011 restructuring and dropped in the 2013 restructuring. Neither the baseline nor the target had been set at the time of the 2013 restructuring, and no data were available on this indicator.
Indicator 15 (Phase 2)
Number of skilled birth attendants working in health centers and district hospitals.
Value (quantitative or qualitative)
Baseline Not Established (09/30/2011)
273 Not Evaluated (09/30/2012)
Comments Target not evaluated (and hence assessed as not achieved). Indicator added at the 2011 restructuring and dropped in the 2013 restructuring. Baseline value not established, and no data available for this indicator.
Indicator 16 (Phase 3)
Percentage of deliveries occurring in a health facility
Value (quantitative or qualitative)
24 (09/01/2011)
35 39 (Oct 2014 to March 2015)
Comments Target surpassed. Indicator added at the 2013 restructuring.
Indicator 17 (Phase 3)
Child under-five inpatient discharges per capita
Value (quantitative or qualitative)
0.06 (09/01/2011)
0.08 0.09 Oct 2014 to March 2015
Comments Target surpassed. Indicator added at the 2013 restructuring.
Indicator 18 (Phase 3)
Number of people with access to a basic package of health, nutrition, or reproductive health services
Value (quantitative or qualitative)
104,762 (09/01/2011)
500,000 896,320 (Oct 2014 to March 2015)
Comments Target surpassed. Indicator added at the 2013 restructuring.
Indicator 19 (Phase 3)
Average balanced scorecard quality score among health facilities implementing PfQ
Value (quantitative or qualitative)
Baselline Not Established (07/01/2014)
85% 62% (Oct 2014 to March 2015)
Comments Target not achieved. Due to delays in the preparation of and validation of the scorecard, the service quality improvement initiative was only implemented for 6 months before project funds ran out.
Indicator 20 (Phase 3)
Number of poor households with access to a basic package of health services
Value (quantitative or qualitative)
13,185 (09/01/2011)
17,000 19,066 (Oct 2014 to March 2015)
Comments Target surpassed. Indicator added at the 2013 restructuring.
(b) Intermediate Outcome Indicator(s)
Indicator Baseline Value Original Target Values (from approval documents)
Formally Revised Targets
Actual Value Achieved at Completion or Target Years
vii
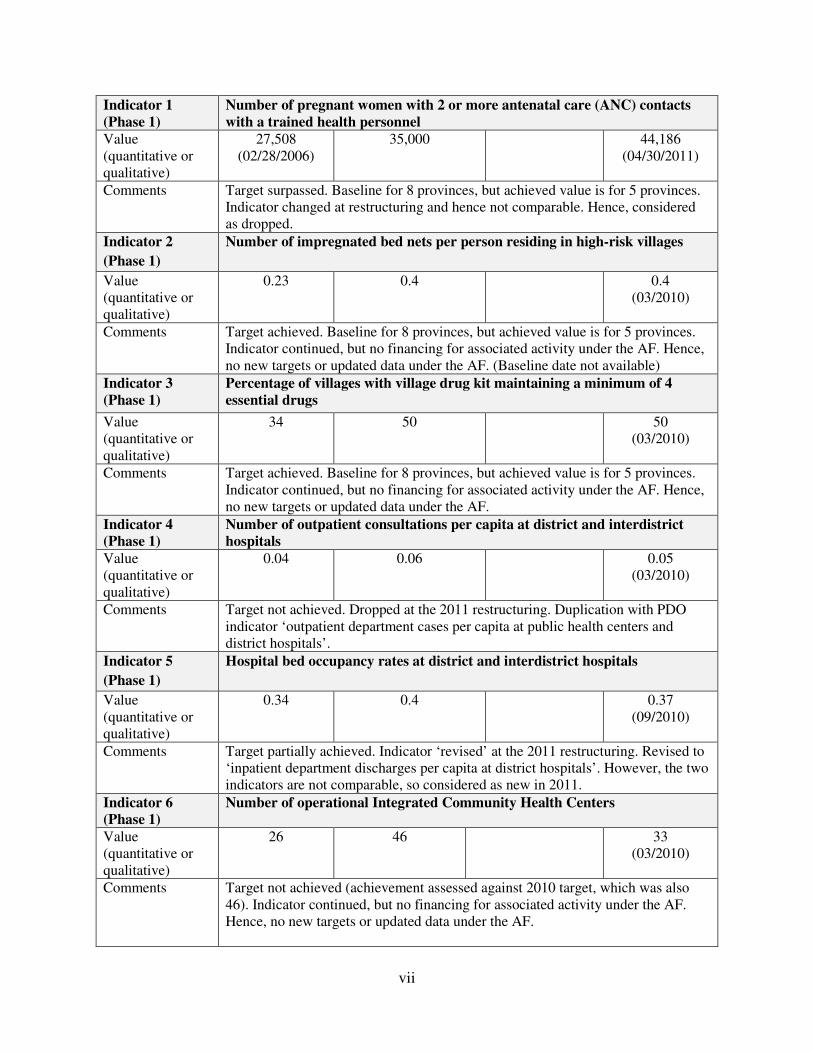
Indicator 1 (Phase 1)
Number of pregnant women with 2 or more antenatal care (ANC) contacts with a trained health personnel
Value (quantitative or qualitative)
27,508 (02/28/2006)
35,000 44,186 (04/30/2011)
Comments
Target surpassed. Baseline for 8 provinces, but achieved value is for 5 provinces. Indicator changed at restructuring and hence not comparable. Hence, considered as dropped.
Indicator 2
(Phase 1)
Number of impregnated bed nets per person residing in high-risk villages
Value (quantitative or qualitative)
0.23 0.4 0.4 (03/2010)
Comments
Target achieved. Baseline for 8 provinces, but achieved value is for 5 provinces. Indicator continued, but no financing for associated activity under the AF. Hence, no new targets or updated data under the AF. (Baseline date not available)
Indicator 3 (Phase 1)
Percentage of villages with village drug kit maintaining a minimum of 4 essential drugs
Value (quantitative or qualitative)
34 50 50 (03/2010)
Comments
Target achieved. Baseline for 8 provinces, but achieved value is for 5 provinces. Indicator continued, but no financing for associated activity under the AF. Hence, no new targets or updated data under the AF.
Indicator 4 (Phase 1)
Number of outpatient consultations per capita at district and interdistrict hospitals
Value (quantitative or qualitative)
0.04 0.06 0.05 (03/2010)
Comments
Target not achieved. Dropped at the 2011 restructuring. Duplication with PDO indicator ‘outpatient department cases per capita at public health centers and district hospitals’.
Indicator 5
(Phase 1)
Hospital bed occupancy rates at district and interdistrict hospitals
Value (quantitative or qualitative)
0.34 0.4 0.37 (09/2010)
Comments
Target partially achieved. Indicator ‘revised’ at the 2011 restructuring. Revised to ‘inpatient department discharges per capita at district hospitals’. However, the two indicators are not comparable, so considered as new in 2011.
Indicator 6 (Phase 1)
Number of operational Integrated Community Health Centers
Value (quantitative or qualitative)
26 46 33 (03/2010)
Comments
Target not achieved (achievement assessed against 2010 target, which was also 46). Indicator continued, but no financing for associated activity under the AF. Hence, no new targets or updated data under the AF.

viii
Indicator 7 (Phase 1)
No. of province hospitals rehabilitated and equipped
Value (quantitative or qualitative)
0 3 1 (2008)
1 (09/2008)
Comments
Target achieved (achievement assessed against 2008 target, which was 1). Indicator ‘revised’ at the 2011 restructuring. Revised to ‘health facilities constructed, renovated, and/or equipped’. However, the two indicators are not comparable, so considered as new in 2011.
Indicator 8 (Phase 1)
No. of district hospitals rehabilitated and equipped
Value (quantitative or qualitative)
0 5 5 (10/2010)
Comments
Target achieved. Indicator dropped at the 2011 restructuring. Included in the revised no. 7 composite indicator.
Indicator 9 (Phase 1)
No. of health centers rehabilitated and equipped
Value (quantitative or qualitative)
0 4 4 (10/2010)
Comments
Target achieved. Indicator dropped at the 2011 restructuring. Included in the revised no. 7 composite indicator.
Indicator 10 (Phase 1)
No. of districts completing at least 80% of the planned activities
Value (quantitative or qualitative)
0 60 59 59 (10/2010)
Comments
Target achieved (target reduced to 59 after no. of districts covered by the project). Indicator not found to be sensitive and reliable.
Indicator 11 (Phase 1)
No. of family medicine interns trained
Value (quantitative or qualitative)
0 160 102 (03/2010)
Comments
Target not achieved. Indicator continued, but no financing for associated activity under the AF. Hence, no new targets or updated data under the AF.
Indicator 12 (Phase 1)
No. of ethnic minorities and students from remote areas trained
Value (quantitative or qualitative)
0 172 120 (030/2010)
Comments Target not achieved. Indicator continued.
Indicator 13 (Phase 1)
Percentage of ethnic minorities and students from remote areas trained, actively working as primary health care workers in own community
Value (quantitative or qualitative)
0 50 No data
Comments Indicator was not collected during the original project. Indicator dropped.

ix
Indicator 14 (Phase 1)
Planned in-service and short-term training programs are carried out in a timely manner for provincial health office, district health office, District Hospital, Health Center, and village health volunteer personnel
Value (quantitative or qualitative)
Training plan approved
Training plan implemented
Training plan implemented
Comments Target achieved.
Indicator 15 (Phase 1)
No. of districts accredited for financial management capacity
Value (quantitative or qualitative)
0 59 42 42 (03/2011)
Comments
Target achieved. Indicator dropped. Efforts to improve capacity building on financial management will be sustained but not accreditation due to difficulties encountered during the project.
Indicator 16 (Phase 1)
Hospital bed occupancy rates at district and interdistrict hospitals
Value (quantitative or qualitative)
0.34 0.4 Not evaluated
Comments
Indicator not evaluated. No data available, and hence target assessed as not achieved. Indicator dropped.
Indicator 17 (Phase 1)
No. of poor assisted by nongovernmental organizations with payment for health care costs
Value (quantitative or qualitative)
0 20,000 78,074 (03/2010)
Comments
Target achieved. Indicator revised to ‘number of people assisted by Health Equity Funds (HEFs) for the payment of health care costs (including free outpatient care and free ANC/postnatal care pilots)’. The two indicators not comparable, so considered as new in this achievement assessment for 2011 indicators.
Indicator 18 (Phase 1)
No. of districts implementing new Health Management Information System (HMIS)
Value (quantitative or qualitative)
0 60 60 (03/2011)
Comments Target achieved. Indicator continued.
Indicator 19 (Phase 1)
No. of policy studies completed
Value (quantitative or qualitative)
0 4 0
Comments Target not achieved. Indicator dropped.
Indicator 20 (Phase 2)
Project beneficiaries: expected number of women benefiting from free deliveries
Value (quantitative or qualitative)
2,297 (09/30/2011)
39,067 2,297 (09/30/2013)

x
Comments Target not achieved. Indicator dropped at 2013 restructuring. Achievement value extracted from September 2013 Implementation Status and Results Report.
Indicator 21 (Phase 2)
Number of project beneficiaries: outreach services
Value (quantitative or qualitative)
0 (09/30/2011)
51,687 51,687 (06/30/2012)
Comments Target achieved. Indicator dropped at 2013 restructuring.
Indicator 22 (Phase 2)
Number of project beneficiaries: outreach services (female)
Value (quantitative or qualitative)
0 (09/30/2011)
36,048 36,048 (09/30/2012)
Comments
Target achieved. Indicator dropped at the 2013 restructuring. The activities of this project focus on women and children. As child beneficiaries are not disaggregated by gender, the calculations assume an equal split.
Indicator 23 (Phase 2)
Inpatient department discharges per capita at district hospitals
Value (quantitative or qualitative)
0.03 (09/30/2011)
0.06 Not Evaluated
Comments
Indicator not tracked (hence target assessed as not achieved). Indicator dropped at the 2013 restructuring.
Indicator 24 (Phase 2)
Number of operational Integrated Community Health Centers
Value (quantitative or qualitative)
34 (12/31/2010)
No target set Not Evaluated
Comments
Indicator not tracked (hence target assessed as not achieved). Indicator dropped at the 2013 restructuring. Indicator not tracked after restructuring.
Indicator 25 (Phase 2)
Health facilities constructed, renovated, and/or equipped
Value (quantitative or qualitative)
37 (09/30/2011)
100 206 (03/31/2013)
Comments Target surpassed. Indicator dropped at the 2013 restructuring.
Indicator 26 (Phase 2)
Number of pregnant women receiving ANC during a visit to a health provider
Value (quantitative or qualitative)
0 (01/04/2012)
Target not set Not Evaluated
Comments
No data available beyond June 2012. Indicator dropped at the 2013 restructuring. Therefore, target assessed as not achieved.
Indicator 27 (Phase 2)
Percentage of women practicing modern contraceptive methods obtained from public health facilities
Value (quantitative or qualitative)
57.4 (09/30/2011)
55 Not Evaluated

xi
Comments
Baseline data inaccurate (underestimate) as one province is missing. Indicator dropped at the 2013 restructuring. Indicator not tracked after restructuring. Therefore, target assessed as not achieved.
Indicator 28 (Phase 2)
Percentage of deliveries occurring in a health facility
Value (quantitative or qualitative)
25.8 (09/30/2011)
40 27.6 (09/30/2012)
Comments
Target not achieved. Baseline missing data from Savannakhet Province. Data not reported after September 2012. Indicator dropped at the 2013 restructuring.
Indicator 29 (Phase 2)
Number of children immunized
Value (quantitative or qualitative)
58,032 (09/30/2011)
140,472 203,672 (03/31/2013)
Comments Target surpassed. Indicator dropped at the 2013 restructuring.
Indicator 30 (Phase 2)
Percentage of health centers that received supervision according to the MOH-agreed model and schedule
Value (quantitative or qualitative)
Not Established Target not set Not Evaluated
Comments
No data available for this indicator (hence targed assessed as not achieved). Indicator not tracked by the project and dropped at the 2013 restructuring.
Indicator 31 (Phase 2)
Number of districts implementing free deliveries
Value (quantitative or qualitative)
0 (09/30/2011)
42 40 40 (03/31/2013)
Comments
Target achieved. Target revised as remaining two districts served by other donors. Indicator dropped at the 2013 restructuring.
Indicator 32 (Phase 2)
Number of districts implementing free inpatient care for children under 5
Value (quantitative or qualitative)
0 (09/30/2011)
42 40 0 (03/31/2013)
Comments
Target not achieved. Free child health not yet implemented and only began after the 2013 restructuring. Indicator dropped at the 2013 restructuring.
Indicator 33 (Phase 2)
Number of health personnel receiving training
Value (quantitative or qualitative)
0 (09/30/2011)
No target set 332 (09/30/2012)
Comments
Target assessed as achieved. Assessment based on the extensive training program that the project supported for a wide variety of staff. Indicator dropped at 2013 restructuring.
Indicator 34 (Phase 2)
Number of faculty at provincial training institutions with increased qualifications
Value (quantitative or qualitative)
0 09/30/2011)
No target set Not Evaluated

xii
Comments
No data available for this indicator. Indicator not tracked by the project and does not measure project activities. Target assessed as not achieved. Indicator dropped at the 2013 restructuring.
Indicator 35 (Phase 2)
Number of people assisted by HEF for the payment of health care costs (including free outpatient care and free ANC/postnatal care pilot)
Value (quantitative or qualitative)
0 (01/04/2012)
63,087 95,704 (03/31/2013)
Comments
Target surpassed. Indicator continued.
Indicator 36 (Phase 2)
Percentage of districts submitting HMIS quarterly reports on time
Value (quantitative or qualitative)
Not Established 90 Not Evaluated
Comments
No data reported on this indicator. Target assessed as not achieved. Indicator dropped at the 2013 restructuring.
Indicator 37 (Phase 3)
Number of health facilities providing free maternal health services
Value (quantitative or qualitative)
25 (09/01/2011)
2901 295 (03/2015)
Comments
Indicator surpassed.
Indicator 38 (Phase 3)
Pregnant women receiving ANC during a visit to a health provide (number)
Value (quantitative or qualitative)
0 (09/01/2011)
180,417 180,775 (03/2015)
Comments Indicator surpassed.
Indicator 39 (Phase 3)
Health facilities constructed, renovated, and/or equipped
Value (quantitative or qualitative)
37 (09/01/2011)
185 333 (03/2015)
Comments Target Surpassed.
Indicator 40 (Phase 3)
Number of supervision visits to health centers in the last quarter
Value (quantitative or qualitative)
41 (09/01/2011)
200 183 (03/2015)
Comments Indicator substantially achieved.
Indicator 41 (Phase 3)
Children immunized (number) under 12 months against DPT3 (number)
Value (quantitative or qualitative)
58,032 (09/01/2011)
309,144 218,340 (03/2015)
Comments Target not achieved.

xiii
Indicator 42 (Phase 3)
Direct project beneficiaries (number)
Value (quantitative or qualitative)
0 (09/01/2011)
350,000 351,767 (03/2015)
Comments Target surpassed.
Indicator 43 (Phase 3)
Direct project Beneficiaries of which female (percentage)
Value (quantitative or qualitative)
0 (09/01/2011)
70 81.3
Comments Target surpassed.
Indicator 44 (Phase 3)
Health personnel receiving training (number)
Value (quantitative or qualitative)
332 (09/01/2011)
1,212 1,518
Comments Target surpassed.
Indicator 45 (Phase 3)
Number of cases of HEF assistance for the payment of health care costs
Value (quantitative or qualitative)
0 (09/01/2011)
250 449,943
Comments Target surpassed.
Indicator 46 (Phase 3)
Number of districts reporting HMIS indicators using the web-based system
Value (quantitative or qualitative)
0 (09/01/2011)
42 134
Comments Target surpassed.
G. Ratings of Project Performance in ISRs
No. Date ISR Archived
DO IP Actual Disbursements
(US$, millions)
1 09/30/2005 Satisfactory Satisfactory 0.00
2 09/20/2006 Satisfactory Satisfactory 0.86
3 11/30/2006 Satisfactory Satisfactory 1.42
4 10/12/2007 Satisfactory Satisfactory 3.02
5 01/07/2009 Satisfactory Satisfactory 5.52
6 11/09/2009 Satisfactory Satisfactory 9.48
7 01/08/2011 Satisfactory Satisfactory 13.60
8 02/25/2012 Satisfactory Satisfactory 16.36
9 02/02/2013 Moderately Satisfactory Moderately Unsatisfactory 17.51
10 09/14/2013 Moderately Satisfactory Moderately Satisfactory 20.26
11 05/17/2014 Moderately Satisfactory Moderately Satisfactory 23.05
12 11/23/2014 Moderately Satisfactory Satisfactory 25.35
13 06/05/2015 Moderately Satisfactory Satisfactory 25.66

xiv
14 12/30/2015 Moderately Satisfactory Satisfactory 25.74
H. Restructuring (if any)
Restructuring Date(s)
Board Approved PDO
Change
ISR Ratings at Restructuring
Amount Disbursed at
Restructuring in US$, millions
Reason for Restructuring and Key Changes Made
DO IP
06/09/2011 Y S S 14.43
Level one restructuring with AF to revise the PDO, Results Framework, and implementation arrangements. Extension of the closing date by one year
04/11/2012 – S S 16.36 Extension of the closing date by one year to complete activities and to reallocate funds
12/23/2013 N MS MS 21.60
Revision of the Results Framework and implementation arrangements. Extension of the closing date by 18 months
If PDO and/or Key Outcome Targets were formally revised (approved by the original approving body) enter ratings below:
Outcome Ratings
Against Original PDO/Targets Moderately Unsatisfactory
Against Formally Revised PDO/Targets Moderately Unsatisfactory
Overall (weighted) rating Moderately Unsatisfactory
I. Disbursement Profile


1
1. Project Context, Development Objectives, and Design
1.1 Context at Appraisal
1. Country context. At the time of project appraisal in 2005, the Lao People’s Democratic Republic (PDR) was ranked as one of the poorest countries in Asia, with a gross national income per capita of US$340 (2003) and with about 40 percent of the population living below the national poverty line (less than US$200 per capita per year). The country had the lowest ranking on the United Nations Development Program (UNDP) Human Development Scale in East Asia, where it was placed at 135 out of a total of 177 countries globally.
2. Sector context and the Government’s response. Despite numerous constraints on both demand and supply sides, some progress had been recorded on key health indicators. Life expectancy had increased from less than 50 years before the 1990s to 55 years. Infant mortality rates (IMRs) and under-five mortality rates (U5MR) had decreased from 108 and 170 per 1,000 live births in 1995 to 107 in 2003. Maternal mortality rates (MMRs) had also decreased from 656 per 100,000 live births in 1995 to 530 in 2000. However, challenges still remained. Communicable diseases of public health significance in the country included malaria, diarrhea, cholera, dengue fever, intestinal parasites, TB and acute respiratory infections. Geographical, income, ethnic, and urban-rural differentials remained marked with respect to most health indicators, including access to good quality health services. For example, remote villages (approximately 40 percent of all villages did not have access to good quality essential drugs, and more than half of the rural population aged 15-59 were illiterate, with even higher rates among women. The Government’s strategy for the health sector was contained in its Health Strategy up to 2020, the Primary Health Care Policy, and the National Poverty Eradication Plan. These documents consistently reiterated the Government’s objective of providing a full range of health services to its population and particularly the poor.
3. Rationale for the World Bank’s involvement. The Lao PDR Government had articulated ambitious plans in its National Growth and Poverty Eradication Strategy (NGPES) and Health Strategy for meeting the Millennium Development Goals (MDGs) and reducing poverty through improved health services. However, financing for the sector was inadequate to meet these goals and the sector also faced substantial constraints with regard to human resources capacity, infrastructure, and incentives for performance. A master plan for health services development had identified 30 high-priority programs1 (out of 50 high-priority programs) for the Government to implement to realize its health sector goals. The Health Services Improvement Project (HSIP) would support 82 of these strategic priorities and also provide financing to promote and improve planning and delivery of basic services particularly at the district level, while also focusing on equity and meeting the needs of the poor. Moreover, the Bank brought added value through its
1 The identified programs cover health planning and management, human resources development, health finance, health education, infectious diseases control, primary health care (PHC), maternal and child health (MCH), nutrition, hospital services, lab technology, essential drugs, and research. 2 Expansion of the rural health service network; information, education, and communication (IEC); upgrading the capacity of the health workers; MCH; immunization; communicable disease control; village drug revolving funds; and sustainable health financing.

2
expertise in decentralized services and health financing, both of which were of particular interest to the Lao PDR Government.
4. Strong links to the Country Assistance Strategy (CAS). The project had strong alignment to the second objective of the CAS (March 2005), which was to “improve social outcomes and reduce vulnerability through strengthened public financial management and service delivery capacities and targeted poverty reduction programs.” The project would also contribute to and benefit the third CAS objective to “adopt a strategic approach to capacity development and partnerships for better NGPES result.”
1.2 Original Project Development Objectives (PDO) and Key Indicators (as approved)
5. The original PDO as stated in the Project Appraisal Document (PAD) was “to assist Lao PDR to improve the health status of its population, particularly the poor and rural population, in eight central and southern provinces.” Even though the official PDO in the Development Credit Agreement was largely similar to the above, the Development Credit Agreement PDO made an explicit reference to the names of the eight provinces.
6. The key indicators referred to in the PAD as ‘impact/outcome indicators’ were as follows: impact indicators are the IMR and U5MR. Outcome indicators are (a) percentage of children 9–23 months of age immunized against measles; (b) percentage of children under 1 year of age immunized with diphtheria, pertussis, and tetanus 3 (DPT3); (c) percentage of pregnant women receiving tetanus toxoid 2 (TT2); (d) percentage of births attended by trained health personnel; (e) percentage of women practicing modern contraceptive methods obtained from public health facilities; (f) curative visits per capita to health centers. However, the PAD acknowledged that with the “problems of coverage and attribution associated with the implementation of the project,” only the outcome indicators were more directly related to project interventions. The key outcome indicators, 18 of them, are presented in the Implementation Completion and Results Report (ICR) data sheet.
1.3 Revised PDO (as approved by original approving authority) and Key Indicators, and reasons/justification
7. The 2011 restructuring of the project, in conjunction with the approval of additional financing (AF), adjusted the formulation of the PDO to reflect the scale-up of some activities, and modifications to implementation arrangements aimed at enhancing the Ministry of Health (MOH) ownership of the project. The PDO was changed to focus on coverage and utilization of key health services and interventions, which made the PDO more amenable and was intended to reflect more accurately what the project supported. The revised PDO as stated in the Financing Agreement was “to assist Lao PDR to increase utilization and quality of health services, particularly for poor women and children in rural areas in project provinces.” The project geographic coverage was also reduced from eight to five project provinces.
8. The revised set of PDO indicators included (a) percentage of children under 1 year of age immunized against measles; (b) percentage of children under 1 year of age who have received DPT3; (c) percentage of births attended by trained health personnel; (d) outpatient department cases per capita at public health centers and district hospitals; (e) number of district hospitals that

3
meet 10 minimum requirements; and (f) percentage of villages receiving outreach (through health days, integrated outreach, and/or mobile clinic) visits according to agreed schedule. It is noteworthy that at the time of this restructuring, the project team recognized the ‘insufficiency’ of the PDO indicators. However, after lengthy negotiations with the client to update the indicators, there was recognition by both parties that it might take longer to reach agreement on the issue. As such, a decision was made to proceed with the restructuring and that once agreement was reached on the Results Framework indicators, another restructuring will be done to accommodate these changes.
9. In 2013, the project was restructured again to (a) strengthen the Results Framework so that it better links the activities to the development objectives and to use indicators that are better aligned with Government monitoring systems and (b) extend the project closing date to December 31, 2015, from June 30, 2014. The new ‘PDO level results indicators’ were (a) percentage of deliveries occurring in health facility; (b) child under-five inpatient discharges per capita; (c) people with access to a basic package of health, nutrition, or reproductive health services (number); (d) average balanced scorecard quality score among health facilities implementing Paying for Quality (PfQ); and (e) number of poor households with access to basic package of health services.
1.4 Main Beneficiaries
10. The principal beneficiaries of the project as defined in the PAD were the populations of the 60 districts in which the capacity to deliver a core package of health services was to be strengthened. The general population, especially the poor, would benefit from the new approaches for health financing that were to be piloted. The 2011 restructuring reduced the primary beneficiaries to only those populations, especially poor women and children, residing in the rural areas of the five project provinces. Nonetheless, the general population still stood to benefit were the results-based financing (RBF) pilots prove to be successful.
1.5 Original Components (as approved)
11. The project had three components (project costs are shown in parentheses).
(a) Component 1: Improving the Quality and Utilization of Health Services (original allocation US$5.12 million). The activities in this component were aimed at improving the accessibility and quality of basic package of health services in eight southern and central provinces (60 districts—11 ranked as poor and 14 very poor). The main activities planned included: district grant allocations to support the provision of a core package of preventive and curative health services, and; improvements to key infrastructure, upgrading of utilities, and provision of equipment, drugs, and medical consumables (Details in Annex 2)
(b) Component 2: Strengthening Institutional Capacity for Health Service Provision (original allocation US$8.59 million). This component had the overall aim of improving the quality of the health workforce. The main activities planned were as follows: short- and long-term training of key staff; capacity building for medical education; strengthening project management, including financial and procurement management at all levels of the health system (Details in Annex 2).

4
(c) Component 3: Improving Equity, Efficiency, and Sustainability of Health Care Financing (original allocation US$1.29 million). Activities in this component were meant to prepare the Lao PDR health system to effectively use the expected increases in government funding to the health sector. The main activities planned were as follows: strengthening the existing Health Management Information System; strengthening the Government’s health care financing, and through provision of equity sub-grants to selected nongovernmental organizations, provide support for implementation of a minimum package of health services (Details in Annex 2)..
1.6 Revised Components
12. The project restructuring approved by the Board in 2011 and which included AF in the amount of US$10 million and an RBF subcomponent (with funding totaling US$2.4 million from the Health Results Innovations Trust Fund (HRITF)) and the subsequent restructurings in 2012 and 2013 retained the same components. However, with the change of the PDO in 2011, the following activities were added:
(a) Component 1 (additional allocation of US$5.03 million). (i) Expansion of RBF for ‘free deliveries’ and piloting as well as scaling up of free inpatient services for children under five years old (CU5) in five districts (Nong, Thapanthong, Sanxay, Phouvong, and Bachieng); (ii) a pilot to provide higher-level payments for free MCH for district hospitals would be undertaken; (c) financing of village drug kits were to be discontinued and, instead, support would be provided for training of village health volunteers to support the implementation of the free Maternal Neonatal and Child Health (MNCH) program.
(b) Component 2 (additional allocation of US$3.69 million). (i) Training of new health staff—registered midwives, community midwives, primary health care workers, and nurses—contingent on guarantees that they will be posted in facilities serving their ‘own’ communities to achieve the MOH’s targets related to equity and ethnic diversity and gender balance and (ii) three training institutions (the College of Health Sciences in Savannakhet and one in Champsak and the training center in Salavan Province) were to be supported with minor renovations and equipped with essential training equipment.
(c) Component 3 (additional allocation of US$1.28 million). (i) Support for additional surveys and/or information gathering activities if needed and (ii) piloting various options for financing ‘free’ antenatal care (ANC) and prenatal and child outpatient care, with the aim of scaling them up in non-Health Equity Fund (HEF) districts should they prove to be successful
1.7 Other Significant Changes
13. Changes in scale of the project. In the original design of the project, the HSIP would cover 60 districts in eight of the central and southern Provinces (Attapeu, Bolikhamxay, Champsak, Khammouane, Salavan, Savannakhet, Special Region Xaysomboun, and Xekong). After the Government’s ‘restructuring’ of the provinces, Xaysomboun Special Zone was disbanded and

5
based on the amendment of the Development Grant Agreement on September 18, 2006, the HSIP would cover 59 districts in the seven other provinces. In 2009, it was agreed that the NGO, Lao-Luxemburg, would extend its development support to Lao PDR to cover the provinces of Bolikhamxay and Khammouane and Xaysomboun District of Vientiane Province. In this regard, from September 2009 onwards, HSIP support would only cover five provinces (Attapeu, Champsak, Salavan, Savannakhet, and Xekong) and one district (Thathom) in Xiengkhouang Province.
14. Cofinancing added. In 2011, Lao PDR successfully competed for a grant from the Health Results Innovation Trust Fund (HRITF)3 of US$2.4 million to implement RBF activities. Although the RBF approach had been used in the original design under the HEF and ‘free delivery’ pilots, the additional funds would also be used to improve the responsiveness and quality of MCH services and to expand coverage of services provided through outreach.
15. Funding reallocations. Minor reallocations of the IDA Credit/AF and the HRITF Grant were made on three occasions (September 2006, June 2011, and April 2012) to move funds across components and expenditure categories (see annex 1 for initial and final allocation of funds by components).
16. Changes in implementation arrangements. The implementation arrangements put in place at the time of the design of the project took into account the capacity constraints faced by the MOH. However, during the 2011 restructuring, for the project to be better aligned to the Paris and Vientiane Declarations, project management and coordination changed from a PMU-based structure to being the responsibility of the Ministry of Health.
2. Key Factors Affecting Implementation and Outcomes
2.1 Project Preparation, Design, and Quality at Entry
17. Strong Bank team and development partners’ technical inputs. The original project was prepared in about four years,4 which enabled extensive consultations with the client and key stakeholders. Project preparation also benefited from contributions from experts of the World Health Organization (WHO), UNDP, Japan International Cooperation Agency (JICA), and Asian Development Bank (ADB); and a technical quality enhancement review (QER) panel of the Bank in June 2004, shortly before appraisal. However, while the team composition was relatively strong, the team could have benefitted from the expertise of a monitoring and evaluation (M&E) expert
3 The HIRTF is a multi-donor trust fund, financed mostly by Norway and the United Kingdom that promotes a results-based approach to health system strengthening., 4 The project identification mission took place in August 2001, appraisal in June 2004, negotiations in June 2005, Board approval in September 2005, and effectiveness in February 2006. The lengthy project preparation period was due to the “de-prioriization” of the project which led to suspension of project preparation activities for a while. Moreover, the project had initially been designed and appraised based on a US$25 million IDA allocation, but the design had to be scaled down and the project reappraised for the US$15 million when the IDA allocation was reduced.

6
for formulating an appropriate set of indicators for the Results Framework and the overall M&E content of the project.
18. Benefits of key lessons incorporated in project formulation. The project formulation was guided by lessons learned from the previous IDA-funded project in Lao PDR – the Health Sector Reform and Malaria Conrol Project -, from pilots that had been implemented in the country, and from experiences of other donors in Lao PDR (ADB, technical assistance from the Swiss Red Cross (SRC), Belgian technical assistance, and Japan International Cooperation Agency), and by lessons learned in neighboring countries. For example, on the basis of experience gained in neighboring countries, the project implemented mechanisms of strengthening the Government’s ability to protect the poor by promoting village-level services and piloting equity funds.
19. Strong Government commitment. The MOH identified and appointed a core team of national experts familiar with the Government’s 2020 Health Strategy and Health Master Plan to lead the preparation of the project. The project Components were thus fully consistent with and were part of the MOH strategy, and the Government was firmly committed to its implementation. Moreover, the components of the project had been developed considering the Minister of Health’s firm views on the need for Bank support in the areas of health infrastructure, capacity building, and health financing.
20. Lack of country-level presence was a significant constraint. None of the core team members were based in-country during project preparation and the first 2–3 years of the project. The absence of a country-based team member (local or international) made it difficult to navigate the country and institutional complexities that were challenging during project preparation. This created challenges in identifying potential bottlenecks in project design and implementation, for example, poor coordination within the MOH departments and between donors, both of which became significant constraints during the early stages of the project.
21. Project design weaknesses. A few key design-related issues are likely to have affected the effectiveness of the project. First, although the original PDO was, to a large extent, aligned with the Government of Lao PDR’s health strategy, it was rather overambitious and was unlikely to be responsive to project components/activities. It was not clear from project documentation how exactly the choice of activities, though relevant, was linked to the epidemiological profile of the country and how they would lead to improvements in health status of the Lao population. Second, although the project activities were relevant to the sector context as described in the PAD, they were focused mostly on factors likely to affect service utilization, which is a necessary but insufficient antecedent to health status. As such, there was some disconnect between the PDO and the choice of project components.
22. Third, the project’s strong focus was on the supply side at the expense of demand-side issues. This concern was raised during the project decision meeting and also highlighted in the QER report. The absence of non-financial demand-side interventions was a key constraint to service utilization in remote, ethnic villages throughout the life of the project.
23. Standard practice. The identification and early preparation of the HSIP took place in 2001–2002, and almost 15 years later, the ICR for the project is being prepared, and the project is ‘evaluated’ based on the current context and state of knowledge. At the time of project design, the

7
‘standard practice’ for formulation of the majority of Bank health projects objectives was largely driven more by ‘aspirational’ considerations, that is, improvement in health status, rather than focused on attribution or a project’s ‘locus of control’, as is currently the case. Equally, the choice of indicators reflected these ‘aspirations’, of which health-related MDGs indicators (for example, infant mortality, under-five mortality, and immunization-related indicators) were the recommended indicators for projects focused on health systems improvements. Therefore, even though the state of the Lao PDR Health Sector in 2001 (that is, inadequate Government funding for the health sector, very insufficient availability of health services at the district and community levels, poorly trained and poorly motivated health staff, inefficient managers and ineffective supervision) drove the selection of priority activities for the HSIP, the formulation of project objectives and choice of indicators were largely driven by the Bank (Health Sector) ‘standard practice’ at that time. Hence, what are now perceived as ‘weaknesses’ in project design (paragraph 23) could actually be a reflection of ‘standard practice’ during the HSIP design.
2.2 Implementation
24. Although the project suffered from initial delays, implementation progressed relatively well especially after the midterm review (MTR) in 2008. Overall, the project was largely successful in implementing most of the planned activities under the three components and in achieving its expected outputs. There were numerous factors encountered during the course of the project that (positively or negatively) affected its implementation. They are detailed in the following paragraphs.
25. Continuity and responsiveness of the Bank team. There was good continuity in task team leadership from the Bank side, with task team members working on the project taking over team leaderships at different stages of the project. Implementation support missions visited regularly and included technical experts and procurement and financial management (FM) specialists who were also available in-country to provide support and guidance between missions.
26. Thorough MTR. The 2008 MTR was a thorough assessment of the project which identified challenges (and potential solutions) related to project design, leadership, implementation, and coordination. Following the MTR and based on its findings and need for additional resources, a decision was then made to restructure the project to: (a) adjust project objectives, scope, and activities; (b) reallocate funds across components and expenditure categories, and; (c) make other minor changes to the description of project activities or project procedures to reflect developments during project implementation.
27. Complex donor support for health coupled with poor coordination among donors resulted in significant delays in the implementation of several project activities. After the project became effective, many more donors began supporting the MOH including district-level activities, which potentially overlapped with some project activities and created additional burdens on the time of MOH, PHO, and district health office staff. Although most of the duplications and gaps were identified and recommendations made during the MTR, it is noteworthy that ‘donor coordination’ was one of the areas for which the team had received advice from the QER panel to support the government in strengthening donor coordination in the sector.

8
28. Several changes in Government policies throughout the course of the project affected the implementation of some of the Project activities, including the following:
• Disbanding of Xaysomboun Special Zone Province. During project preparation, three districts, Phoun, Thathom, and Xaysomboun, were to receive project support under Xaysomboun Special Zone Province. However, after the disbanding of the Xaysomboun Special Zone and the districts came under the control of other provinces not part of the Project, it became necessary to make changes to the District Grant Allocation Formula (Component 1). However, contracting a consultant to revise the sub-grant allocation formula and district grant allocation (DGA) for 2006/2007 was delayed by almost 9 months.
• Increase in daily subsistence allowance increased project costs and necessitated reallocation of funds across expenditure categories.
• Between 2008 and 2009, the MOH developed and endorsed the Skilled Birth Attendants (SBAs) Development Plan, with the view to increase the number of SBAs countrywide. Even though this activity was not included in the original training plan of the Master Plan of the HSIP, it was nevertheless strongly aligned with project objectives, and hence the project incorporated the training of community midwives in the HSIP’s five provinces in its work program.
• To ‘boost’ the number of women giving birth in health facilities, the MOH made a decision to eliminate user fees for facilities-based childbirth. Given the importance of this activity to project objectives and outcomes, the HSIP supported the piloting of free deliveries in two project districts, and this activity was scaled up after a Bank review reported positive results with regard to the number of pregnant women using services.
29. Inadequate capacity. Initial capacity and personnel gaps (especially at district levels) were noted in early Aide Memoires—and also later on during the course of the project—and these contributed to some of the delays in implementation during the early phases of the project. Attempts to address this challenge included expedited recruitment and training of the required personnel. However, the project continued to experience different types of capacity challenges throughout the ‘life’ of the project, which the project team made concerted efforts to address. Toward the end of the project, recruitment of technical assistance and external verification agencies took longer than planned and as a result, the implementation of scaled-up ‘free’ MCH, ‘free’ child health and Payment for Services, and PfQ under RBF was delayed significantly, leaving insufficient time to fully implement these activities before the project closure.
30. Project costs and cost overrun. Although the project was extended by 18 months in 2013 to allow for full implementation of the RBF activities, the project did not have sufficient budget to implement the activities beyond December 2014. The underestimation of intervention costs, as well as (more than anticipated) increases in utilization/uptake of services, contributed to project cost overrun. Implementation of activities nonetheless continued with funding from the Government and other donors.

9
31. Other factors that influenced overall project implementation included the following:
(a) Strong Government commitment to improve the health sector performance. Despite relatively weak capacity and, at times, poor coordination between the different departments involved in the project, the Government continuously displayed a long-term strategic vision and commitment toward improving the performance of the sector.
(b) Flexibility of the project to respond to implementation issues. Both the Government and the Bank revealed flexibility during different project implementation, which enabled addition of activities that would contribute to meeting project objectives and outcomes (for example, inclusion of free-facility-based delivery and training of SBAs).
2.3 Monitoring and Evaluation (M&E) Design, Implementation, and Utilization
32. There are three parts to the M&E of this project: the original Results Framework, the Results Framework after the 2011 restructuring, and the Results Framework used after the 2013 restructuring.
Design
33. The design of the M&E was weak for the original project and weaker after the 2011 restructuring but improved considerably after the 2013 restructuring. The original PDO indicators (PDO Indicators 1-8 in Data Sheet) as described in the PAD were not a good measurement of progress toward the PDO for various reasons. First, the long-term indicators, IMRs and U5MRs, were beyond the influence of the project, and this was duly acknowledged by the team during the early phases of the project. Second, the outcome/intermediate indicators (PDO Indicators 3-7 in Data Sheet) primarily focused on service coverage/utilization, whereas the PDO sought to improve the health status of the population. Therefore, none of the PDO indicators that were under the purview of the project measured the health status of the population.
34. Third, the two child immunization indicators included as PDO indicators (Indicators 3 and 4 in Data Sheet) were largely beyond the control of the project. The project did not directly support the country’s expanded program of immunization, which was critical for achievement of these indicator targets. The procurement of vaccines and their distribution to health facilities were fully financed by other donors. The project only supported the payments related to outreach activities—which constituted a very small portion of the DGA budget, with most of the DGA budgets were used by province- and district-level officials for meetings, supervision, and administration. Fourth, the PDO sought to pay special attention to the poor and rural population, yet none of the PDO indicators were disaggregated by wealth status nor compared project areas to the rest of the country. It is noteworthy, however, that the target beneficiaries were from largely poor districts, but even then, it would have been appropriate to compare utilization rates or health status of the poor to the less poor.
35. Although the design of the M&E, and especially the choice of PDO indicators in relation to the PDO, is assessed as being very weak, paragraph 24 expounds the caveat for this assessment.

10
36. The 2011 restructuring changed the PDO to focus on utilization and quality of services, which was also meant to better align the PDO to the Result Framework indicators. However, project outcome and also output indicators were still not under the overall ‘control’ of the project. Moreover, data for some of the output indicators that were retained after restructuring were no longer being tracked even at the time of the restructuring. For example, the project stopped tracking “percentage of villages with village drug kit maintaining a minimum of 4 essential drugs,” (IO Indicator 3) yet it was retained in the project Results Framework. One of the rationales for the 2013 restructuring was that “the proposed revision of the Results Framework strengthens the links
between activities and development objectives and uses indicators that are better aligned with the
Government monitoring systems.” This was indeed the case, and project indicators were much better aligned to the PDO and to project activities
37. Most of the indicators—PDO and output-level—were to be derived from the newly designed HMIS, which was expected to be rolled out over the first 18–24 months. This was a risky choice, given that it was not possible to anticipate the quality of the data for the new system, and no alternative sources of data were identified should progress with the new HMIS prove to be slow, or the data quality poor. This proved to be the case, as the quality of the HMIS data was reported (by the team) to be questionable, and it took much longer to fully set up the system. As such, there were problems with quality and reliability of the HMIS-generated monitoring data through all three phases of the project.
Implementation
38. Considering that strengthening of implementation of the HMIS was also one of the subcomponents of Component 3 of the project, for the larger portion of project implementation, there was a strong focus on data collection of M&E indicators to monitor progress in project implementation during all three phases of the project. This is confirmed by attempts by the team to improve on the Results Framework in 2011 and completely revising the Results Framework in 2013. These improvements were intended to address the disconnect between the PDOs and the indicators.
39. However, data quality was a persistent problem, and this was acknowledged by the team during the MTR. Although the team made concerted efforts throughout the project to build capacity of relevant staff to strengthen the HMIS and to make the HMIS functional for decision-making purposes, challenges related to data collection, reliability of the information, and capacity of the HMIS remained through the 2013 restructuring.
40. When the project was restructured in 2013, a decision was made to transform the HMIS from a paper and Microsoft Excel-based system to a largely web-based data reporting system, the District Health Information System (DHIS2), which would also enable reporting on the RBF component of the restructured project. Nonetheless, despite these changes in the HMIS platform, several challenges in its implementation remained. Internet connectivity was unstable and slow, and this hindered the ability to submit reports timely, especially at the district level. Data quality still remained questionable due to lack of data checks and data definitions. Management capacity to ensure timely reporting and assignment of responsibilities to the right staff remained a persistent challenge

11
Utilization
41. Despite concerns with HMIS data quality for the large part of the project, the data were extensively used to monitor project implementation and progress toward the PDO and to ‘evaluate’ the free MCH services. Unfortunately, and more so given the team’s concerns with data quality, no effort was made to use external sources of data or independent surveys to verify the accuracy of the HMIS. Nonetheless by the end of the project, the quality of the data in DHSI2 had improved substantially, and the first-ever National Health Statistics Report for FY2013–2014 used the DHIS2 data.
Sustainability
42. The project made substantial investments to build the capacity of central-, Provincial-, and district-level MOH personnel on both the paper-/Excel-based HMIS as well as on the web-based DHSI2. With technical support of the Health Information System Program of Vietnam, the project’s National Program Coordination Office (NPCO) successfully built the capacity on management and implementation of DHSI2 for the central MOH DHIS2 core team. Subsequently, and again with the support of the Health Information System Program of Vietnam, the NPCOxpanded DHIS2 beyond the five HISP provinces to a total of 15 provinces by the end of 2014. More recently, with support from IDA, the follow-on project to the HSIP, the Lao Health Governance and Nutrition Development Project (HGNDP) (2015–2020) is supporting the further expansion and continued improvements to DHIS2. All these factors bode well for the sustainability of DHIS2 beyond the HSIP’s implementation period.
2.4 Safeguard and Fiduciary Compliance
Safeguards
43. The project triggered two of the Bank safeguards policies: OP/BP 4.01 relating to Environment Assessment and OP/BP 4.20 (later revised to OP 4.10) relating to Indigenous Peoples. Both were rated Satisfactory consistently in ISRs, and the project was found to be in full compliance with IDA safeguards requirements throughout its course.
(a) Environmental Assessment
44. A sound and comprehensive environmental assessment was completed during project preparation to ensure that potential impacts of the project on environmental and human health issues were fully understood and appropriate mitigation measures identified and agreed on. Mitigation measures to be adopted by the Government were detailed in an Environmental Management Plan. The plan ensured that even with the new constructions and renovations, the local ecosystems were protected, there was no harm to local sensitive species and habitats, there was proper disposal of constructions wastes, and pollution of watercourses and drinking water aquifers was avoided. Appropriate health care waste management was also safeguarded throughout the project.
(b) Indigenous Peoples

12
45. To examine the potential impact of the project on the indigenous peoples and other vulnerable groups, a Social Impact Assessment was conducted. The assessment concluded that while the project was unlikely to have any negative impacts, the positive impacts would depend on the degree of effort to include ethnic group participation in the health system. In this regard, an Ethnic Group Development Plan (EGDP) was prepared to ensure that the different ethnic groups are afforded equal opportunities to participate in, and benefit from, the project in culturally appropriate way. For example, a special program was established to waive educational requirements and also to recruit more ethnical minority health personnel, especially at the lower levels of the health care system, for developing and disseminating health information and communication in local languages.
Procurement
46. A comprehensive assessment of the MOH’s capacity to implement procurement was carried out during project preparation (2003–2004) and was updated in 2005. The assessment found that the MOH, through a PMU arrangement, had prior experience (from a prior project) in carrying out procurement under IDA guidelines and procedures. Hence, procurement arrangements for the project were carried out by the MOH through the PMU that was staffed by consultants recruited through a competitive process. After changes in the management structure of the project, qualified consultants still handled procurement activities.
47. There were early delays in the procurement, and these took time to be resolved. The procurement of civil works was delayed significantly due to the need to adjust project activities to account for new donor support for civil works in the sector. Also, during the early stage of the project, there were a couple of allegations of potential corruption and conflict of interest in procurement of civil works and services, but these were quickly resolved through an action plan for strengthening transparency and accountability in the procurement process to mitigate such risks. Overall, procurement was mostly rated Moderately Satisfactory throughout the project, and the procuring entities’ handling of procurement, contract management, documentation, and filing systems were found to be largely satisfactory.
Financial Management
48. The FM arrangements were similar to those of procurement at the central level. An FM assessment had found the MOH to have gained considerable experience from the previous project. However, provincial and district capacities were relatively weak as a result of lack of skilled and experienced FM staff. As a result, the project instituted a strong capacity-building initiative, which included FM, to develop sustainable capacity. During and after project implementation, no major issues in the area of FM were identified. Quarterly financial reports were prepared and submitted on time, providing reliable financial information, and financial statements were regularly audited by independent auditors. As such, FM was rated Satisfactory throughout the project.
2.5 Postcompletion Operation/Next Phase
49. Preparation for a follow-on operation, the HGNDP began and became effective before the closure of the HSIP. Hence, the transition between the two operations was very smooth. Most of the HSIP activities have been continued in 14 provinces under the HGNGP, including

13
strengthening and expansion of DHIS2 and the use of an RBF mechanism (as disbursement-linked indicators). The HEFs are no longer financed by IDA but still continue with ADB financing.
3. Assessment of Outcomes
50. The assessment of project outcomes is based on the analysis of the three phases of the project: Phase 1 (2005–2011) covers the original project design before the level one restructuring; Phase 2 (2011–2013) after the PDO was changed and AF from IDA and funds from the HRITF were made available; and finally, Phase 3 (2013–2015) when the Results Framework was extensively revised.
3.1 Relevance of Objectives, Design, and Implementation
51. The project relevance for the three phases is Substantial for objectives and implementation and Modest for design.
52. Objectives. The objectives of the project under the three project phases were directly relevant and consistent with the NGPES (2004) and the National Socio-Economic Development Plan (2006–2010). The original and revised PDOs are both still fully aligned with the country’s Health Sector Reform Strategy (2013–2025), which aims to (a) improve access to basic health care by 2020 and (b) achieve universal health coverage by 2025. They are also fully aligned with health-related MDGs and Sustainable Development Goals and the National Nutrition Strategy of 2025 and Plan of Action (2016–2020), which seeks to accelerate multisector actions (including health) to address the country’s malnutrition crisis.
53. The project objectives are also relevant to the Bank’s Country Partnership Strategy (2012–2016), which in turn is aligned with the country’s Seventh and Eighth National Socio-Economic Development Plans. With the Country Partnership Strategy, the project is fully aligned with Outcome 3.1 of the third strategic objective (inclusive development) which aims for “increased utilization and quality of essential maternal and child health services.”
54. Design. The project components and activities for all three phases of the project were, and remain, relevant to date and are fully aligned with the five priority areas of the Health Sector Reform Strategy: (a) human resources for health; (b) health financing; (c) governance, organization, and management; (d) health service delivery; and (e) health information systems. The 2011 restructuring of the project to focus on utilization and quality of health services enabled the project to better accommodate the Government’s ‘new’ policies aimed at removing financial barriers that were preventing poor people from accessing health services (for example, the free MCH policy introduced in 2012). However, the project’s more pronounced focus on the supply of health inputs and less so on the non-financial demand-side constraints was a significant weakness in its design, and lower utilization of essential health service by the poor still remains an issue of concern to date.
55. Implementation. The changes in management of the project made during the 2011 restructuring ensured that the arrangements remain relevant to date. The change in overall responsibility for coordination and management of the project to be the responsibility of the DPF in the MOH with the MOH’s technical departments as implementers of activities under their purview resulted in greater ownership of the project by the relevant departments in the ministry.

14
The follow-on project, the HGNDP, is following similar institutional and implementation arrangements.
56. The project also responded appropriately and at reasonable speed to changes in the health sector and changing needs and opportunities. For example, when the Lao PDR Government approved a new policy to provide free services to pregnant women and CU5, this necessitated an expansion to the scope of the free delivery pilots with continued support to human resource development and service delivery capacity.
Table 1. ICR Assessment of Project Relevance
Objectives Design
Phase 1 Substantial Modest
Phase 2 Substantial Moderate*
Phase 3 Substantial Moderate
* Moderate = Modest/Substantial
3.2 Achievement of Project Development Objectives
57. The assessment of whether the HSIP achieved its development objectives is largely based on four main questions. First, “did the health status of the population?” (Phase 1); second, “did
service utilization improve?” (Phases 2 and 3); third, “did service quality improve?” (Phases 2 and 3), and; fourth, “did health outcomes and/or service utilization improve among rural and
poor populations?” (phases 1, 2 and 3). An assessment of whether the targets of the project indicators were achieved was done based on whether the Results Framework indicator targets were met. It is noteworthy that there were significant problems with the comparability (with baseline data), reliability, accuracy, and consistency of the HMIS data used to monitor project indicators, especially before the 2013 restructuring. As a result, and also given the inadequacy of the results framework in assessing achievement of Phase I and II PDOs, this assessment is primarily based on ‘external’ sources of data and information where available.
58. Based on the assessment of whether the Results Framework indicator targets were met/achieved, project performance of the phases was mixed. Of the eight Phase 1 PDO indicator targets, six were surpassed, one was fully achieved, and one was not achieved (table 2). However, achievement of the Results Framework indicator targets between 2011 and 2013 (Phase 2) was negligible. A key challenge in assessing Phase 2 of the project was the lack of data to measure achievement of indicator targets since the project did not track some Results Framework indicators, no targets had been set, and/or no data were available for some of the indicators. For the assessment of Phase 3 of the project, the revised Results Framework applies. Of the five PDO indicators, four were surpassed and only one was not achieved (the quality indicator). Based on this assessment, performance of Phase 3 of the project was largely satisfactory.
Table 2. Summary Table for Indicator Achievement
Phase 1 Phase 2 Phase 3
PDO Indicators
Surpassed 6 0 4
Achieved 1 1 0
Partially Achieved 0 1 0
Not achieved 1 5 1

15
Assessment of achievement PDO indicators
Substantial Negligible Substantial
IO/Output Indicators Surpassed 6 4 8
Achieved 7 1 1
Partially achieved 1 0 0
Not achieved 5 15 1
Assessment of achievement of IO indicators
Modest Negligible Substantial
Overall Assessment of Achievement of Results Framework Indicators*
Substantial Negligible Substantial
*PDO Indicator given greater weighting in overall assessment of indicator achievement
59. Did the health status of the population improve as a result of project activities? (Phase 1) Although the Results Framework assessment of whether Phase 1 of the project achieved its PDO is rated as Substantial, this is not an accurate assessment of project contributions to the PDO for various reasons. Of the eight PDO indicators of the original project, only two indicators measured health status, that is, infant and under-five child mortality—whose targets were considered as ‘surpassed’. However, the 2011–12 Lao Social Indicator Survey (LSIS) results indicated that child mortality rates had been on a steady decline since the 1990s. For example, the IMR had declined from 124 deaths per 1,000 live births in the late 1990s to 91 deaths per 1,000 live births in the mid-2000s and continued to decline to 68 deaths per 1,000 live births in 2010–11. Similarly, the U5MR almost halved from around 164 deaths per 1,000 live births in the mid-1990s to 79 deaths per 1,000 live births in 2010–11 (figure 1). The long term trend in reductions in IMR and U5MR throw doubt that the contribution of the project to these improvements was likely to be modest. Figure 1. Trends in the IMR and U5MR
Figure 2. Trends in the IMR and U5MR
60. According to the UNDP,5 the two leading causes of child mortality in Lao PDR are pneumonia and diarrhea. Malnutrition, according to global evidence, is also an underlying cause of up to a third of under-five mortality—that is, children suffering from repeated diarrheal episodes or pneumonia are more likely to die if they are malnourished compared to well-nourished children.
5 http://www.la.undp.org/content/lao_pdr/en/home/post-2015/mdgoverview/overview/mdg4.html.
0
20
40
60
80
100
120
140
160
180
Infant Mortality Rate Under-five Mortality Rate

16
Malnutrition in Lao PDR, as stated in the PAD, is one of five factors that “continue to be important obstacles to improved health” (pp. 14). Therefore, the following assessment focuses on indicators of child nutritional status, which, although these were not part of the Results Framework, are more proximate indicators of health status and would have been under the influence of the project.
61. Between 2006 and 2011/12, there were significant reductions in the prevalence of underweight (low weight for age, an indicator for malnutrition associated with adverse health outcomes) and stunting (low height for age, indicator of chronic malnutrition) in the project (south) province. However, similar patterns (magnitude of reduction) were also observed in the northern and central regions where, although HSIP activities were not being implemented, there were other donors—ADB in the north and Lao-Luxemburg in the central region—who were supporting the health sector in those regions (Figure 3). Therefore, it is likely that project activities, as well as those of ADB and Lao-Lux in the other regions, could have contributed to improvements in nutritional outcomes in Lao. However, HSIP’s contribution to these improvements is likely to have been even more modest given that the project’s support to nutrition-related activities was also modest, i.e., outreach activities constituted less that 5% of project financing.
Figure 3. Child Nutritional Outcomes: 2006 and 2011–2012
Sources: 2005 Multiple Indicator Cluster Survey (MICS); 2011–2012 LSIS.
62. The other six Phase 1 PDO indicators measured utilization/coverage of key preventive and curative health services (but not health status). The choice of health service utilization/coverage indicators was likely under the presupposition that improvements in use of health services will result in improvements in status. For example, if Lao PDR’s large burden of disease is attributed to diseases that can be averted by immunization, then increase in immunization coverage would result in improvements in the health status of Lao children. However, this might not always be the case, especially when other important dimensions of health services, for example, the poor quality of health services in Lao PDR, are also limiting. Hence, though necessary, improvements in health service utilization should not presuppose improvements in health status.
63. Of the immunization indicators used by the project, the percentage of pregnant women receiving TT2 was largely under the purview of project activities, mainly through utilization of ANC services. Based on the 2006 MICS as ‘baseline’ and the 2011/2012 LSIS as ‘end line’ (both
0
10
20
30
40
50
60
South
Stunting
Central
Stunting
North
Stunting
South
Underweight
Central
Underweight
North
Underweight
2006 2011-2012

17
surveys had similar sampling frames and design) protection against neonatal tetanus 6 (TT2) (Error! Reference source not found.) actually decreased slightly in the project areas, whereas it improved in the other two regions.
64. A review of project outputs shows that the project did, however, succeed in supporting some key elements of the health system that might, in the long term, contribute to improving the health status of the Lao population. With project support, the country was able to strengthen institutional capacity for health service provision through short-term training (less than three weeks duration), longer-term training (more than 3 weeks), and strengthening of faculty and nurses/doctors training programs. In total, 4,655 (150 from ethnic groups) health staff received short-term training and 771 received long-term training (9 postgraduates were trained abroad). Most of trained health staff (existing and new) were from health centers and district hospitals, and it has been reported that most returned to their workstation.
Figure 3. Percentage of Women Protected against Neonatal Tetanus: 2006 and 2012
65. In summary, even though all but one of the original PDO indicator targets were reported as having been “achieved”, the contribution of project activities to the health status of the Lao population was modest at best. Nonetheless, the project supported HEFs, the piloting and eventual scale-up of free maternal health services which was eventually scaled up, and the construction (4), rehabilitation, and/or equipping of ICHCs, which all bode well for the Government of Lao PDR’s efforts to improve the health status of the Lao population in the near future.
66. Did service utilization of improve? (Phase 2 and 3). Project data from phase 2 of the project is inadequate to determine whether phase 2 of the project contributed to improving service utilization in the target population. Moreover, there in corresponding “external” data to enable this determination. However, phase 3 of the project of the project likely contributed to substantial
6 The definition of the indicator differs slightly in the two surveys. For the 2006 MICS, protection against neonatal tetanus was defined as “percentage of women with a live birth in the last 12 months who are protected against neonatal tetanus.” For the 2011–2012 LSIS, “percentage of women age 15–49 years with a live birth in the last 2 years protected against neonatal tetanus.”
0
10
20
30
40
50
60
70
SouthProvince
CentralProvince
NorthProvince
2006 20011-20012

18
improvements in the utilization of key MCH services.7 In 2009, with financing from the HSIP, the Lao PDR Government contracted with the Lao Red Cross to initiate, manage, and administrate the HEF and free MNCH services in the nine districts: Champhone, Phalanxay, Sepone Sukhuma Taoy District, Thateng, Lamam, Kalum, and Dakchung Districts. From 2013, and with funding from HSIP AF, the Lao Red Cross was contracted to build the capacity and to co-manage the social health protection schemes (free maternal health, free under-five health care) and RBF pilots (payment-for-quality and payment-for-preventive service) in the same districts. This assessment is based on the final report of these initiatives.
67. After the introduction of HEFs, there was a gradual year-to-year increase in institutional deliveries in the nine project districts. Between 2008 (before the HEF) and 2015, the HEF and free maternal, neonatal, and child health initiatives boosted institutional deliveries threefold (figure 4). By the time the project closed, the total number beneficiaries for the combined HEF and free MNCH services had reached 163,602 people.
Figure 4. Utilization before/after HEF and Free MNCH
Source: SRC. 2015. Final Report of the Implementation of HEFs and Free MNCH in 9 Districts of the South (HSIP AF), IDA Grant No: H-659- LA/HRI-TF010518-LA, Project ID: P129906, SSS-COF-01).
68. Using data generated from the HMIS on health facility deliveries, a similar pattern emerges in that there were improvements in proportion of deliveries in health facilities (figure 5). According to these data, before the project started in 2012, the proportion of births in health facilities in the 5 project provinces was lower than the 13 non-project provinces, but in the following year, when project activities started, the proportion of infants delivered in health facilities in the 5 project provinces increased considerably and was slightly higher than the 13 non-project provinces; this trend continued through 2015. Even though institutional deliveries increased in both groups of provinces, the magnitude of the increase was higher in project provinces (10.6 percentage points) compared to non-project Provinces (7 percentage points).
7 No further analyses are carried out for Phase 2 of the Project as it is evident from the results framework analysis and choice of indicators that the achievement of the PDO for this phase is negligible
0%
10%
20%
30%
40%
50%
60%
70%
80%
90%
100%
OPD IPD (x10) DELIVERY
2008 Before
2009 HEF
2010 HEF
2011 HEF
2012 HEF-
FMAT2013 HEF-
FMNCHPoor
3X
2X

19
Figure 5. % Births in Health Facilities in Project Provinces Compared with Non-project Provinces
69. From January 2013, the policy of free-of-charge health services for all CU5 was implemented in the nine districts. Since then, there was a gradual and marked increase in the use of both outpatient as well as inpatient child health services. By 2015, the free CU5 had assisted 115,035 outpatient curative cases, 20,021 baby checkup consultations (not reported regularly), 9,601 inpatients cases, and 86 surgeries (27 major and 59 medium) (figure 6). Unlike institutional deliveries, there were no major differences between CU5 service utilization by the poor and CU5 non-poor. Based on these findings, this ICR concludes that utilization of CU5 health service improved substantially as a result of project activities. Utilization of these services also improved substantially among the poor children.
Figure 6. Utilization of CU5’s Inpatient Department Services by Eligible Population
Source: SRC. 2015. Final Report of the Implementation of HEFs and Free MNCH in 9 Districts of the South (HSIP AF), IDA Grant No: H-659-LA/HRI-TF010518-LA, Project ID: P129906, SSS-COF-01).
70. The analyses of the impact of HEF and free MCH on health service utilization is supporting evidence that validates the assessment of achievement of project objectives (specifically utilization) according to the project documentation (table 2). Based on these analyses, this ICR
28.6
3336.5
39.2
31.4 3234.3
38.4
0
5
10
15
20
25
30
35
40
45
2012 2013 2014 2015
Facility Births in 5 Project Provinces (%)
Facility Births in non-Project Provinces (%)
0%
2%
4%
6%
8%
10%
12%
Y2011 Y2012 Y2013 Y2014

20
assessment concludes that the contribution of the project to service utilization was negligible during phase 2 and substantial during phase 3.
71. Did service quality improve? (phases 2 and 3) Project data from phases 2 and 3 of the project is inadequate to determine whether phase 2 of the project contributed to improving service utilization in the target population. However, it is noteworthy that the Lao People’s Democratic Republic Service Availability and Readiness Survey conducted in 2014 assessed the availability of key health services as well as the functionality and readiness of amenities, basic equipment, diagnostic tools, and other critical inputs needed for provision of services in the country. The survey found that “within the country, overall service readiness (for health centers) was generally higher in the central region and lowest in the south.” Only 56 percent health centers in the south and less than 58 percent of district hospitals in the south (which also ranked lowest) were in a position to provide basic health services. All this was despite significant investments by the project in renovations of health centers and procurement of medical equipment and supplies for health facilities in the southern region of the country.
72. Moreover, the RBF-supported PfQ scheme was only implemented during two quarters from July to December 2014. The scheme was then stopped during the first quarter of 2015 when funding from the HSIP AF had been fully used. Based on the available evidence, this ICR assessment concludes that the contribution of the project to quality of services was modest for phases 2 and 3 of the project. Although this assessment rates the project’s contribution to service quality as modest, it is noteworthy that some project activities have laid a good foundation for the Government of Lao to build on in its efforts to improve quality of health services. For example, the construction/refurbishment and equipping of key health infrastructure and building the capacity of health staff and medical training are all essential “ingredients for good quality of health services in the future.
73. Did health outcomes and/or service utilization improve among rural and poor populations? (phases 1, 2 and 3). Although both project PDO sought to pay special attention to the poor and rural population, none of the PDO indicators were disaggregated by wealth status nor compared project areas to the rest of the country. It is noteworthy, however, that the target beneficiaries were from largely poor rural. Therefore based on this and the evidence presented in the preceding sections, the impact of project activities among rural and poor was modest for phase1 and substantial for utilization of services by the poor (phases 2 and 3). Specifically for the latter conclusion, figure 4 shows that though lower than threefold general increase, institutional deliveries for the poor doubled.
Table 3. Summary of Outcome Achievement
Efficacy Phase 1 Phase 2 Phase 3
Health outcomes Modest
Service utilization Modest Substantial
Service quality Modest Modest
Targeting the poor & rural Modest Modest Substantial
Modest Modest Moderate (=MS)

21
3.3 Efficiency
74. The original project and AF demonstrated the strong economic justification with focus on the pro-poor nature of activities and interventions. Due to lack of data and solid estimates of social benefits and costs of project interventions, the cost-benefit analysis was not performed at the time of the original project appraisal in 2005 nor at the time of project restructuring with AF in 2011.
75. The designs of the original project and AF were to directly address major challenges facing the health sector in Lao PDR. In 2005, 15.6 percent of total disability-adjusted life years (DALYs) lost and 11.5 percent of total deaths were caused by neonatal and maternal conditions, which was higher than the regional average of 8.8 percent of total DALYs lost and 4.9 percent of total deaths in Southeast Asia. Poor MCH outcomes in the country resulted from low levels of coverage for key MCH services indicators such as ANC, skilled birth attendance, and immunization for measles and DPT3. Low quality of health care and financial barriers to access to health services remain major challenges facing the health sector. Health interventions/activities, including support for immunization uptake and deliveries by skilled birth attendance at facilities supported by the project, proved to be cost-effective with the international evidence and had direct influence on reducing OOP expenditures for MCH services.
76. Implementation efficiency improved during the project period despite some challenges. The project fully disbursed its funds at 100 percent for both IDA and HRITF Grants, while underestimation of service uptake and utilization under RBF activities resulted in the project cost overrun. At the start, the project used the implementation arrangements by contracting to experienced entities for project management and FM, and later, a more sustainable approach was adopted by integrating project management under the existing structure of the MOH, which resulted in increasing responsibility and ownership of the project activities. With the AF in 2012, after successful piloting, RBF was applied to service delivery at the facility level. Despite the shortfall of the project funds, the implementation of the project activities continued with Government budget support and also key interventions were integrated into the subsequent HGNDP, which ensured continuity and sustainability.
77. Given the limitation with the data and lack of a proper impact evaluation, it is not possible to measure the real impact and improvements in health outcomes among the poor and rural population that are attributed to the project. However, this economic analysis attempts to assess the ranges of plausible impact that the project has contributed by quantifying the potential benefits of the project. In this analysis, two main benefits were quantified: (a) reduced infant and child deaths through increased coverage for immunization and increased utilization of maternal health services and (b) reduced OOP expenditures for maternal health services among the project beneficiaries. It is important to note that project benefits were measured only on interventions to increase coverage and utilization of MCH services and not on other interventions and activities financed by the project such as capacity building of health workforce, PfQ, and improvement of health facilities and the HMIS. Furthermore, the analysis focused only on economic benefits of the reduced infant and child deaths, excluding reduced maternal deaths, and social benefits that could be gained from lives saved through project interventions were not estimated. Therefore, it underestimates the overall benefits to a large extent.

22
78. Based on the most plausible assumptions used for the analysis, the results indicate that each U.S. dollar invested by the project generated up to US$1.39 in benefits, assuming that 5 percent of increase in coverage rates were attributed to the project. Under this scenario, the project has generated the total economic value between US$12.7 million to US$38.0 million from reduced child mortality (for details, see annex 3).
79. According to the WHO criteria, an intervention that averts one additional DALY at a cost of less than gross domestic product (GDP) per capita is considered as ‘very cost-effective’ and an intervention that averts one additional DALY at a cost of between one and three times GDP per capita is deemed ‘cost-effective’ and representing ‘good value for money’.8 Using these criteria the project would be classified as ‘cost-effective’ if it had averted at least 121 child deaths and ‘very cost-effective’ if it had averted at least 362 child deaths, corresponding to around 4 percent or 11 percent of coverage rates increase attributable to the project, respectively.
80. Furthermore, the project contributed to reduction in OOP expenditures for MCH services (nearly US$820,000) among beneficiary households. While differentiating benefits taken by poor and non-poor is not possible because of data constraints, from the level of financial protection, it can be estimated that more than 2,000 households (with OOP expenditure exceeding 40 percent of the average monthly total household expenditure) have avoided catastrophic health spending because of the free MCH services supported by the project. The economic analysis conducted for this ICR demonstrates that the project is likely to have generated positive returns on the investment over the project period.
81. Efficiency of the project is considered Substantial.
3.4 Justification of Overall Outcome Rating Rating: Moderately Unsatisfactory
Table 4. Overall Outcome Rating Summary
Phase 1
(2005–2011) Phase 2
(2012–2013) Phase 3
(2013–2015) Overall Rating
Relevance Moderate Moderate Substantial -
Efficacy Modest Modest Substantial -
Efficiency Substantial Substantial Substantial -
Outcome Rating Moderately
Unsatisfactory Moderately
Unsatisfactory Satisfactory -
Rating value 3 3 5 -
% Disbursed 57.9 24 18.1 -
Weight value 1.7 0.72 0.91 3.33 Note: HU (1); U (2); MU (3); MS (4); S (5); HS (6). * Moderate = Modest/substantial.
82. While quality at entry was less than satisfactory, the project performance significantly improved during project supervision, especially after the 2013 restructuring. However, significant shortcomings in the design of the project and the persistent M&E weaknesses could not be completely bridged until the last two years of the project. Hence, given these considerations and the above analyses by the project’s three phases, the final outcome rating is Moderately
8 WHO. 2002. The World Health Report 2002: Reducing Risks, Promoting Healthy Life. Geneva: WHO.

23
Unsatisfactory. Despite the MU rating however, it is noteworthy that the project was initiated at a time of inadequate Government funding in the health sector, poorly trained and motivated staff inefficient management and inadequate supervision and difficulties in making services accessible to populations residing in remote areas. As such, project activities did contribute to addressing these challenges, and thereby to strengthening the health system. Moreover, the project also brought 10 years of engagement with the government of Lao PDR which influenced policies in the sector. Unfortunately the project was not able to bridge the ‘weaknesses’ in project design - which were partly a reflection of ‘standard practice’ at that time (paragraph 23) - and which likely contributed to the MU rating.
3.5 Overarching Themes, Other Outcomes and Impacts
(a) Poverty Impacts, Gender Aspects, and Social Development
83. The project addressed poverty and vulnerability by reducing inequity in access to preventive and curative health services by the poor. The HEFs initiative was one of the first large-scale targeting schemes to provide actual benefits to households based on their poverty status in a socioeconomic context of growing inequities. To increase access to and utilization of health services by the poor, the project reimbursed eligible health care providers directly for select health services and drugs provided to the poor, including the cost of care at district, interdistrict, provincial, or regional hospitals on referral.
84. While the project results matrix set no specific results targets for gender equity or social inclusion, the activities implemented by the project sought to remove barriers to gender and social inclusion. The HEF and the free MCH policy, endorsed by the prime minister (Decree Number 178/PM), exempts all pregnant women and CU5 from fees related to deliveries and child health at all health centers and public hospitals. This policy was designed to remove any financial barriers that would prevent women from accessing maternal and reproductive health service. The EGDP ensured that the different ethnic groups are afforded equal opportunities to participate in, and benefit from, project activities. A special program was established to waive educational requirements and also to recruit more ethnical minority health personnel, especially at the lower levels of the health care system, for developing and disseminating health information and communication in local language.
(b) Institutional Change/Strengthening
85. The project had a significant impact on institutional development and building both short- as well as long-term capacity. Interviews carried out during the ICR mission, which included officials from the MOH and other project stakeholders, clearly highlighted the important impacts that the project investments in capacity building had on institutional development. The project supported a large number of technical and administrative trainings and in total, 4,655 health staff received short-term training and 771 received long-term training (9 faculty of medicine staff received project support for postgraduate training abroad). The project also provided training in procurement, financial, and project management, trainings that will have positive impact beyond the life of the project as staff apply their skills and expertise outside the project and/or MOH.

24
86. The project also supported the development of a new HMIS, the DHIS2, which is now used by the country’s 18 provinces for regular reporting on preventive and curative health care. The first National Health Statistic Report for FY 2013–2014 used DHIS2 data, and the report has since been endorsed and approved by the MOH.
(c) Other Unintended Outcomes and Impacts (positive or negative)
87. Not applicable.
3.6 Summary of Findings of Beneficiary Survey and/or Stakeholder Workshops
88. Not applicable.
4. Assessment of Risk to Development Outcome Rating: Moderate
89. The Government has demonstrated strong commitment throughout the life of the project toward achieving and maintaining the development outcomes and, more broadly, supporting the overall strengthening of the health sector. In addition, key project-supported investments that is, the new HMIS, DIHS2, and free maternal health) have been institutionalized.
90. However, a key risk identified at appraisal is still relevant: “continued poor utilization of health services by the poor and vulnerable groups despite improvements in quality and strengthening of medical education.” A recent analysis of the health sector9 reported that despite marked improvements over the years, coverage of key MNCH utilization indicators such as ANC, skilled birth attendance, DPT, and immunization rates was still low, particularly among the poor. There still is significant variation in health indicators by income and across provinces (DPT immunization levels in some provinces are even comparable to developed countries).
5. Assessment of Bank and Borrower Performance
5.1 Bank Performance
(a) Bank Performance in Ensuring Quality at Entry Rating: Moderately Unsatisfactory
91. The Bank helped prepare the project by drawing on lessons learned from previous engagement in the sector and the country and also from experiences in the East Asia and Pacific region. The Bank team was also successful in identifying key bottlenecks in the system that needed to be addressed. In this regard, the project was fully aligned with the Government and Bank priorities as well as with the global development goals (MDGs).
92. However, there were several shortcomings during the preparation and appraisal of the original project. More thoughtful design and especially M&E arrangements were needed. The choice of PDO indicators for the Results Framework was poor. The indicators were either beyond the influence of the project (infant and under-five child mortality) or were not a good measurement
9 PAD of the Lao HNDP (P151425).

25
of progress toward the PDO—measuring service utilization instead of health status. Moreover, no mechanism was put in place for verifying the outcome-level PDO results extracted from the self-reported data of the HMIS, which itself was to be developed with support from the project.
93. The QER panel raised a key concern about the project design, which was not addressed during project implementation. The project was too supply driven and household behavior and demand issues had not been adequately addressed. The absence of adequate demand-side interventions proved to be a key constraint to service utilization in remote, ethnic villages throughout the life of the project. The panel had also advised the team to ensure that they use the existing donor coordination mechanism to also ensure more transparency in “health sector financing and institutional issues, and greater harmonization of practices where it might be appropriate.” This guidance was not adequately heeded by the team, and poor donor coordination was responsible for the delays in implementation of civil works and other activities during the early stages of the project.
(b) Quality of Supervision
Rating: Moderately Satisfactory
94. The project was supervised by a very high-caliber and proactive task team that adequately supervised and closely monitored the project. After the 2008 MTR, the task team leader relocated to Vientiane, which enabled a deeper understanding of the country context and dynamics and easy access to and for the client. Implementation support missions visited regularly and included technical experts and procurement and FM specialists who were also available in-country to provide support and guidance between missions. The comprehensive Aide Memoires provided evidence of regular supervision and advice given by the Bank’s experts throughout the life of the project.
95. The Bank team was quite flexible in making adjustments, which led to project restructuring in 2011, 2012, and 2013. Following the restructuring, the team was commendably proactive in identifying constraints in the project’s management arrangements, when project management was changed from the PMU-based structure to using the MOH’s technical departments as implementers of activities under their purview. The Bank’s team displayed its responsiveness to changing policy environments it incorporated into the project SBA training and also the piloting and scaling-up of free deliveries, activities that could contribute significantly to achievement of the PDOs but did not exist during project preparation.
96. A noteworthy shortcoming in the Bank/s supervision happened during the first 2–3 years of the project. None of the core members of the Bank task team was based in the country, which contributed to the delays in resolving some early problems faced by the project, especially the problem related to poor coordination among the numerous donors supporting the health sector. Another significant shortcoming was the delayed restructuring of the project. After acknowledging of the inadequacy of the results framework during the MTR in 2008, it took three more years before the project was restructured. Even then, the RF remained inadequate and the project had to be restructured once again two years late.
(c) Justification of Rating for Overall Bank Performance Rating: Moderately Unsatisfactory

26
97. Although quality at entry was less than satisfactory, the Bank team is commended for its efforts to address some of the deficiencies in project design. Nonetheless, due to some shortcomings, largely in initial project and M&E design, these shortcomings could not be completely bridged. Therefore, overall performance of the Bank is rated as Moderately Unsatisfactory.
5.2 Borrower Performance
(a) Government Performance Rating: Moderately Satisfactory
98. The Government’s ownership and commitment to the overall project objective was clear and strong. The MOH identified and appointed a core team of national experts familiar with the Government’s 2020 Health Strategy and Health Master Plan to lead the preparation of the project. The Government’s support to the project was evidenced by having put in place an MOH Steering Committee to provide guidance and oversight to the HSIP. The Steering Committee was chaired by the minister of Health and comprised the vice ministers and directors of the MOH departments. The Government also provided a supportive policy environment for the project, most notably the Free Delivery and Free Health Care for CU5 years old, policies that contributed to substantial increases in health services utilization.
99. A significant shortcoming of the Government’s performance was related to the poor coordination among donors that resulted in significant delays in the implementation of several project activities during the early stages of project implementation. Strong leadership from the Government was required to facilitate coordination of donor activities in the health sector to leverage the synergies and also prevent duplication/overlap of activities, especially at the district and lower levels. The lack of leadership in this area made it difficult for the team to collate information on ‘who was supporting what’ in civil works, short-term training, IEC, outreach, and supervision, and this created numerous delays in project activity implementation as the project team sought to avoid duplication in support with other organizations, for example, Lao-Luxemburg.
(b) Implementing Agency or Agencies Performance Rating: Moderately Satisfactory
100. The original project was implemented by the MOH through its departments, PHOs, and district health offices, with a PMU acting as the executing agency at the central level and provincial PMUs and district PMUs at their respective levels. After the 2011 restructuring, project management changed from the PMU-based structure to using the MOH’s technical departments as implementers of activities under their purview. The overall responsibility for coordination and management of the project would be the responsibility of the DPF in the MOH.
101. The PMU managed to get the project up and running and had specialized staff working on various aspects of project oversight. The PMU and MOH ensured the achievement of the majority (though not all) of the project planned outputs and demonstrated much flexibility while working in a changing policy environment.
102. The ‘PMU approach’ to managing the implementation of the project, though relatively successful, had some unintended consequences. The approach ‘alienated’ the MOH’s technical
27
department, and as a result, they were initially not actively engaged in planning, monitoring, and supporting HSIP-supported activities and tended to view it as a parallel project rather than as a support to their core functions. However, after the 2011 restructuring of the project and the resultant change in management structure, project activities became streamlined into the existing technical departments of the MOH, and the departments took responsibility for their implementation with the technical backstopping and coordination provided by the NPCO.
103. Capacity constraints, especially those of FM capacity at the district levels, adversely affected project implementation during both the PMU and the MOH management phases, despite concerted efforts by the project to build the capacity of relevant staff through various training initiatives. Even at the central level, as recorded by the team in the June 2013 Aide Memoire, implementation and management capacity at the central level remained, following the Government’s decision to downgrade departmental consultants from technical consultant positions to project assistant positions due to concerns over salary, and to divide the DPF into two separate departments, DPIC and DF.
(c) Justification of Rating for Overall Borrower Performance Rating: Moderately Satisfactory
104. The Moderately Satisfactory performance of the Government and the Moderately Satisfactory performance of the implementing agency yield an overall rating of Moderately Satisfactory according to ICR guidelines.
6. Lessons Learned
105. Strong Government leadership in facilitating close coordination among development partners is very important. For greater complementarity and harmonization of district plan support, it would be better if the district plans supported a clearly defined government strategy/program to ensure that the entire population receives a standardized package of service, with similar delivery modalities. As for the HSIP, the lack of effective coordination among key donors involved in the sector resulted in significant delays in the implementation of some project activities.
106. Bank task team presence in-country was crucial to ensure adequate project preparation and enable smooth implementation of project activities. While there was adequate time for project preparation, the process lacked adequate team presence in-country. The team’s absence in-country made it difficult to navigate the country and institutional complexities that were challenging during project preparation and the early stages of implementation. This likely could have contributed to the delays in resolving some early problems faced by the project, especially the problem related to poor coordination among the numerous donors.
107. A weak results chain linking PDO, activities and results as measured through appropriate indicators can raise serious questions and doubts about overall quality of project identification and of project implementation and success. This is in addition to making project monitoring a real challenge and making it difficult to demonstrate whether and to what extent the project achieved its PDO. The misalignment of PDO indicators to the PDO and to project activities can raise questions as to how specific activities were identified to be the focus of the project
28
because one needs an analytical base on which to anchor a project. The original Results Framework before the 2011 restructuring was not only misaligned but also designed to measure achievements that were not under the full control or influence of the project.
108. Demand-side interventions are critical to persuade households to use health services. A stronger focus on social behavioral change and communication, greater community involvement in health service provision and/or management, and interventions to address social and cultural barriers to health service utilization—in addition to the demand-side financing activities employed by the project—are necessary to ensure households, especially poor households, know when and why to seek and actually access health care when needed. Moreover, physical access to remote communities that can be challenging and costly, especially during the rainy season, and decision-making autonomy of women and gender mismatches between health providers and patients are important factors that need to be addressed to improve service utilization.
109. Pro-poor project design does not necessarily lead to a reduction of inequalities in health service utilization (and ultimately health outcomes). Despite key project design features associated with intentionally targeting the poor, some inequalities in health service utilization may have actually widened during the project duration (as evidenced by higher utilization of free MNCH services by non-poor compared with the poor). A key lesson for future projects may nevertheless be to specifically analyze the determinants’ health outcomes/health service utilization inequality, including indicators in the monitoring framework for the tracking and monitoring of inequality.
110. In contexts where the level of education is low, ‘one-off’ trainings might not be sufficient for staff to absorb and retain technical knowledge from the training. Competency-based training and retraining as well as frequent supportive supervision are all necessary to ensure more sustained improvements in relevant competences and, ultimately, quality of services.
111. Flexibility of project design is important to respond on time to changes in the Government policy and health sector environment. The Government of Lao PDR made important decisions to enact new policies related to SBAs, free facility-based delivery, and free health services for CU5. Activities/interventions associated with these new policies were readily incorporated into the project and were eventually instrumental for the project to achieve its (Phase 3) objectives.
7. Comments on Issues Raised by Borrower/Implementing Agencies/Partners
(a) Borrower/implementing agencies
Overall, the Ministry of Health accepted that the ICR captures the key issues related to project design and implementation, and the government agrees with all ratings proposed in the ICR. With the implementation of HSIP the Government of Lao PDR had learned a lot of lessons most of which are captured in this document, and the capacity of health staff at all levels of the system had improved significantly in the areas of project management, financial management and procurement. Moreover, the project had contributed substantially to the development of the country’s key health infrastructure though building and renovation of hospitals and health centers,

29
provision of medical equipment, and in the development of the web-based health information system, all of which have significantly enhanced the current project (see detailed comments in Annex 7)
(b) Cofinanciers
N/A
(c) Other partners and stakeholders
N/A


31
Annex 1. Project Costs and Financing
(a) Project Cost by Component (in US$, million equivalent)
Components
Appraisal Estimate
(US$, millions)
Additional Financing
(June 2011) (US$,
millions)
HIRTF Grant
(June 2011) (US$,
millions)
Total Final Estimate by Component
(US$, millions)
Percentage of Appraisal (Of total estimate)
Improving the Quality and Utilization of Health Services
5.12 5.03 0.00 10.15 198
Strengthening Institutional Capacity for Health Service Provision
8.59 3.69 0.00 12.28 142
Improving Equity, Efficiency, and Sustainability of Health Care Financing
1.29 1.28 2.4 4.97 385
Total Baseline Cost 15.00 10.00 2.4 27.4 –
Physical Contingencies 0.00 0.00 0.00 – –
Price Contingencies 0.00 0.00 0.00 – –
Total Project Costs 0.00 0.00 – – –
Project Preparation Fund 0.00 0.00 0.00 – –
Front-end fee IBRD N/A N/A N/A – –
Total Financing Required 15.00 10.00 2.4 27.4 –
(b) Financing
Source of Funds Type of
Cofinancing
Appraisal Estimate
(US$, millions)
Actual/Latest Estimate
(US$, millions)
Percentage of Appraisal
Borrower – 0.00 0.00 0
IDA – 10.00 0.00 0
IDA Grant – 15.00 0.00 0
RBF – 2.40 0.00 0

32
Annex 2. Component Summary and Outputs
Component 1: Improving the Quality and Utilization of Health Services
The activities in this component were aimed at improving the accessibility and quality of basic package of health services in eight southern and central provinces (60 districts—11 ranked as poor and 14 very poor). The main activities planned were as follows:
• Through district grants, support the provision of a core package of preventive and curative health services necessary to achieve target health outcomes, for which no other sources of funding were available. Costs associated with implementation, supervision, and operating costs were included in these grants.
• Upgrading of health centers to the level of Integrated Community Health Centers (ICHC) in project districts, including staff training (for new and existing ICHCs), renovation of infrastructure, upgrading of utilities, and provision of equipment, drugs, and medical consumables.
• Improvements to key infrastructure including upgrading and equipping of three provincial hospitals, five district hospitals and construction of four health centers.
Key Outputs
Subcomponent 1.1: Support for Implementation of the Minimum Package of Health
Services
• US$3,360,543 of project funds transferred to provinces and district as the DGA
• 224,603 pregnant women had ANC contacts with trained health personnel
• 218,340 children under 12 months received DPT3 immunization
• 451 village drug kits distributed to project areas
• 20,582 villages received IEC activities
Subcomponents 1.2 and 1.3: Improvements to Key Infrastructure
• Four new ICHCs built and equipped including Nongkok HC in Thateng District (US$43,000), Lakhonsy HC in Lakhonpheng District ($43,000), Sakea HC in Saysetha District ($57,000), Oudomsuk HC in Samakkisay District ($57,000)
• 268 HCs health centers supported with minor repairs and/or received basic medical equipment

33
• 21 district hospitals supported with basic medical equipment (see table 1 for details)
• Constructed and equipped 5 new district hospitals at a total cost of US$ 492,000 - Bachieng ($94,000), Soukhoumma ($103,000), Phouvong ($50,000), Thapangthong ($100,000), Champasack ($145,000)
• One provincial hospital rehabilitated and equipped - Salavan Provincial Hospital ($ 200,521)
• In support of medical education, medical training facilities at a total cost of $3, 297,377: renovations at the University of Health Sciences ($460,899); construction of a Surgery wing and waste water treatment system at Mahosot Hospital ($1,207,240), and; roof and waste water treatment system at Mittaphab Hospital ($1,629,248) - all these facilities are located in Vientiane.
Table 1. District hospitals supported with basic medical equipment.
District Hospital Cost(KIP) USD Outhoumphone 11,960,000 1,471
Ardsaphangthong 11,960,000 1,471
Phin 11,960,000 1,471
Songkhone 11,960,000 1,471
Champhone 11,960,000 1,471
Ardsaphone 11,960,000 1,471
Saybouly 11,960,000 1,471
Sayphouthong 11,960,000 1,471
Phalanxay 13,160,000 1,619
Sonbouly 11,960,000 1,471
Nong 13,160,000 1,619
Thapangthong 11,960,000 1,471
Vilabouly 13,160,000 1,619
Xepon 12,760,000 1,569
Salavanh 70,150,000 8,629
Samuaoi 53,811,000 6,619
Taoiy 94,183,000 11,585
Toumlan 48,699,000 5,990
Vapy 41,900,000 5,154
Lakhonepheng 1,400,000 172
Khongsedon 36,475,000 4,486
Total 518,458,000 63,771
Component 2. Strengthening Institutional Capacity for Health Service Provision
This component had the overall aim of improving the quality of the health workforce. The main activities planned were as follows:

34
(i) Training
• Provision of short-term training in project districts: (1) training of village, health center, and district-level staff on service delivery, management, and outreach and (2) training-of-trainer courses to ensure quality of health services training
• Provision of longer-term specialized training at central and large provincial hospitals for medical staff
• Provision of training at nursing schools in Champsak, Khammouane, and Savannakhet Provinces
(ii) Capacity building for medical education
• Strengthening the Family Medicine Internship Program at the Faculty of Medical Sciences in Vientiane through the provision of a two-year postgraduate specialty training program for doctors prepared to return to, and work at, the district level
• Provision of the master’s degree training in basic sciences to lecturers and provision of short courses in curriculum management to faculty members of the Faculty of Medical Sciences in Vientiane
• Construction of lecture rooms and a library and renovation of the main building of the Faculty of Medical Sciences in Vientiane. Renovation of the main building of Mittaphab (Friendship Hospital in Vientiane) and construction of a technical block at Mahosot Hospital in Vientiane
• Strengthen project management, including financial and procurement management at central, provincial, and district health officers, including provision of technical assistance
Key Outputs
Subcomponent 2.1: Training and Subcomponent 2.2: Capacity Building for Medical
Education
• In total, 4,655 (150 from ethnic group) health staff received short-term training and 771 received long-term training (and 9 postgraduates were trained abroad)
• 356 village health committees trained in health promotion and supervision of the operation of village drug kits
• 451 village health volunteers from 451 villages trained in village drug kit servicing

35
• 455 Traditional Birth Attendants trained
• 822 health center staff and district managers received training on health center management and 746 district and health center staff trained in the MNCH package and outreach activities
• 453 nurses, 121 community midwives, and 29 registered midwives received long-term training (of at least one year)
• 151 medical assistants and 217 medical associates received long-term training in PHC (one year for assistants and two years for associates
• 90 medical doctors received specialized training in family medicine, 6 in obstetrics and gynecology, 4 in pediatrics, 10 in anesthesiology and resuscitation, 14 in surgery, 2 in internal medicine, and 2 in cardiology
• 12 medical faculty received masters-level training in various disciplines
Component 3. Improving Equity, Efficiency, and Sustainability of Health Care Financing
Activities in this component were meant to prepare the Lao PDR health system to effectively use the expected increases in government funding to the health sector. The main activities planned were as follows:
• Strengthening the existing Health Management Information System (HMIS) and extending the HMIS to each of the project areas for the collection and consolidation of health information from villages to provincial health offices (PHOs).
• Strengthening the Government’s health care financing policies through (1) carrying out four policy studies and dissemination on selected health financing issues; (2) financing workshops, training, two study tours, and attendance at conferences for the MOH project staff concerned with health financing policy; and (3) provision of technical assistance to the Project Management Unit (PMU) for the preparation of the policy studies.
• Providing support for implementation of a minimum package of health services. Through provision of equity fund sub-grants to selected nongovernmental organizations (NGOs) in about five selected project districts with ICHCs, the project planned to finance (1) provision of a core package of preventive and curative services (and drugs) as defined by the MOH; (2) transportation and related costs for the poor to access health centers and hospitals; and (3) incremental administrative costs incurred by the selected NGOs.
Key Outputs

36
Subcomponent 3.1 Implementation of the HMIS
• 631 district-level staff and 647 health center-level staff trained in HMIS data collection and reporting (first phase 2005–2012)
• Excel-based HMIS developed and implemented (first phase)
• Web-based HMIS using open source DHIS2 software developed and implemented (second phase)
• By March 2015, all 18 provinces taking part in introductory training on the new system
• All 18 provinces in the country implementing the new web-based HMIS
• The first-ever National Health Statistic Report for FY2013–2014 applied DHIS2 data
Subcomponent 3.2: Implementation of HEFs
• Between 2009 and 2011, a pilot of HEF established in 6 districts of the HSIP province with membership of 39,447 beneficiaries
• By end of April 2015, 110,127 beneficiaries (72 percent representing non-urban population) pre-identified for HEF membership
• Total beneficiaries of combined HEF and free MNCH reached 152,923 at the end of April 2015
• Provision of free MNCH available in four provincial hospitals and all 8 district hospitals and 67 health centers covered by the project
• Between 2009 and April 2015, HEF and free MNCH schemes paid benefits for 580,760 health events
Subcomponent 3.3: Health Financing Policy Review
• Draft Health Financing Strategy 2011–2015 completed and submitted to the Government for approval
• The EGDP developed and implemented to ensure that ethnic groups are afforded equal opportunities to participate in, and benefit from, the project

37
Annex 3. Economic and Financial Analysis (including assumptions in the analysis)
Context
1. Lao PDR has made steady and significant progress on several key population health outcomes over the past few decades. Life expectancy has increased steadily to almost 68 years in 2013, up from 49 years in 1980. The U5MR and IMR have also declined significantly over the same period: the U5MR declined from 201 per 1,000 live births in 1980 to 67 per 1,000 live births in 2015. Although there is some uncertainty regarding exact numerical values, the MMR declined from 1,600 per 100,000 live births in 1990 to 197 per 100,000 live births in 2015. Lao PDR’s MMR, however, remains high (figure 3.1). Despite notable progress, Lao PDR continues to have some of the worst MCH outcome indicators, both globally as well as in the East Asia and Pacific region.
Figure 3.1. MMR and U5MR in Lao PDR, 1990–2015
2. About a third of all CU5 remain underweight and almost half are stunted. Underlying poor MCH outcomes include low levels of coverage for key MCH services indicators such as ANC, skilled birth attendance, and immunization for measles and DPT and contribute toward suboptimal growth conditions during the crucial first 1,000 days of life, beginning at conception. Low quality of health care remains a key challenge facing the health sector. Lao PDR is considered to be one of the most inequitable countries for maternal, newborn, and child health interventions including immunization.
3. From a health financing perspective, Lao PDR is characterized by low levels of government spending, associated with high levels of OOP spending. Based on WHO National Health Accounts estimates, general government spending on health (MOH budget and social security expenditures on health) as a share of GDP in 2014 was only 1.0 percent in Lao PDR, as against 2.6 percent in Nepal, 3.6 percent in Thailand, and 2.5 percent in Vietnam (figure 3.2).

38
Figure 3.2. Government Health Share of GDP and OOP vs. Government Health Share, 2014
4. While the health sector in Lao PDR continues to be challenged by low Government spending on health and high OOP expenditures, key health outcome and coverage indicators have improved throughout the period from 2005 to 2015 (table 3.1).
Table 3.1. Key Health Outcome and Coverage Indicators in Lao PDR, 2005–2014
Year MMR IMR U5M OOP Share
Measles Coverage (%)
BCG Coverage (%)
2005 418 70.2 97.2 62 41 65
2006 392 67.8 93.5 54 48 61
2007 366 65.5 89.8 56 40 56
2008 341 63.2 86.2 35 52 68
2009 316 61.0 82.8 30 59 67
2010 294 59.0 79.7 42 64 72
2011 271 57.1 76.7 52 69 77
2012 250 55.4 74.0 52 72 81
2013 230 53.7 71.3 41 82 82
2014 213 52.3 69.1 39 82 87
Source: World Development Indicators and WHO. Note: BCG = Bacillus Calmette-Guerin.
5. This trend of improvements in coverage indicators is also confirmed at the regional level. Findings from the 2006 MICS and the 2011/2012 LSIS indicate that significant improvements in child immunization rates were observed across the regions including the region where the project was implemented. For example, the percentage of children with no vaccination dropped from 21.7 percent in 2005 to 7.3 percent in 2012 in the south (Figure 3.3). In the five project provinces (Attapeu, Champasak, Salavanh, Savannakhet,
ChinaFiji
Indonesia
Malaysia
Solomon Islands
Thailand
Lao PDR
Myanmar
Philippines
Cambodia
Mongolia
PNG
Vietnam
02
46
810
Govern
me
nt h
ealth s
pe
ndin
g s
hare
of G
DP
(%)
250 25001000 500010000 25000 75000GDP per capita, US$
Fiji
Cambodia
Myanmar
Mongolia
Philippines
Thailand
Vietnam
Solomon Islands
Malaysia
China
Indonesia
Lao PDR
PNG
02
040
60
80
100
OO
P s
ha
re o
f to
tal h
ea
lth
spend
ing (
%)
0 2 4 6 8 10Government health spending share of GDP (%)
Source: WHO and WDI

39
and Sekong),10 the percentage of live births attended by skilled birth attendance in facilities increased from 2008 to 2014 across all provinces (figure 3.4).
Figure 3.3. Immunization Coverage Rates by Region
Figure 3.4. % Live Births Attended by SBAs in Facilities by Province
Source: MICS 2006; LSIS 2011/12. Source: DHIS2.
Economic Analysis
6. By supporting institutional capacity building and cost-effective interventions with large externalities, the project aimed to assist the country to increase utilization and quality health services, particularly for poor women and children in rural areas in the project provinces. As discussed throughout the ICR, these improvements in health outcomes cannot be directly attributed to the project’s interventions. The extent to which the project can explain the improvements observed in the health outcomes can only be assessed through an impact evaluation. Neither such an evaluation nor proper data collection was available for assessing the overall project impact.
7. Due to lack of data and solid estimates of social benefits and costs, the cost-benefit analysis was not performed at the time of the original project appraisal in 2005. No separate economic analysis was carried out at the time of project restructuring with AF in 2011.
8. Given the limitation of the data and lack of a proper impact evaluation, it is not possible to measure the real impact and improvements in health outcomes among the poor and rural population that can be attributed to the project. However, this economic analysis attempts to assess the ranges of plausible impact that the project has contributed by quantifying the potential benefits of the project. Estimates of the project’s benefits were based on the set of conservative assumptions. In this analysis, two main benefits were quantified: (a) reduced infant and child deaths through increased coverage for immunization and increased utilization of maternal health services and (b) reduced OOP expenditures for maternal health services among the project beneficiaries.
10 The project initially covered 60 districts in 8 provinces in the south (Attapeu, Bolikhamxay, Champasack, Khammouane, Salavanh, Savannakhet, Sekong, and Xaysomboun). However, due to the Government restructuring of provinces and expanded support from other donors, the project has been restructured to focus on 5 provinces (Attapeu, Champasack, Salavanh, Savannakhet, and Sekong) in the south since 2009.

40
9. The following sets of assumptions and scenarios were used to estimate the project benefits:
(a) The benefits of the project were measured against the utilization and coverage indicators for immunization (BCG, polio 3, DTP3, and measles) as well as maternal health services, including ANC, skilled birth attendance, and birth in health facility.
(b) Using the 2005 census data, the population distributions and underlying mortality rates at the national level were applied to the project provinces in the south region.
(c) A baseline scenario was constructed using the actual coverage rates as reported in the 2006 MICS and 2011/12 LSIS.
(d) Five scenarios constructed to estimate the impact of the project with 5 percent to 80 percent of the coverage increase between 2005 and 2012 are attributed to project interventions.
10. The Lives Saved Tool (LiST) was used to model the impact of the MCH interventions that were implemented by the project. LiST is a part of the spectrum software suite and was developed to model the impact of interventions on maternal, neonatal, and child health. LiST is based on the initial work of the Bellagio Child Survival Study Group, the Child Health Epidemiology Reference Group, and the International Child Development Steering Group. It was developed by a consortium of academic and international organizations led by the Institute for International Programs at the Johns Hopkins Bloomberg School of Public Health.
11. The assumptions on the effectiveness of interventions used for this analysis are set in accordance with the current academic literature and are summarized in Table 3.2.11 Coverage rates for ANC, skilled birth attendance, and share of births at health facilities are assigned no direct impact by themselves but are used to calculate the availability of other interventions during pregnancy (syphilis detection and treatment; management of hypertension, pre-eclampsia, and malaria) or at giving birth (clean birth practices; labor and delivery management; neonatal resuscitation; immediate assessment and stimulation of the newborn; active management of the third stage of labor; induction of labor for pregnancies lasting more than 41 weeks; antibiotics in case of premature rupture of the membranes; and so on).
11 Assumptions on the effectiveness of interventions are documented in the LiST manual; see http://livessavedtool.org/images/documents/training/LiSTmanualfeb2016.pdf.

41
Table 3.2. Assumptions on Effectiveness of Interventions Used in the LiST Model
Effectiveness Affected Fraction TT vaccination (maternal) 0.980 0.005
TT vaccination (< 1 month) 0.940 1.000
Oral rehydration solution < 1 month 0.930 1.000
Oral rehydration solution 1–59 months 0.930 0.900
Measles vaccination 0.850 1.000
DPT (pertussis mortality only) 0.840 1.000
Source: LiST manual 2016.
12. Table 3.3 summarizes the estimated impact of the project on maternal and child mortality, assuming different shares of the increase in coverage rates had not been achieved without the project.
Table 3.3. Deaths Averted 2005–2015, Different Proportion of Increase in Coverage Attributed to the Project
5% 10% 20% 50% 80% Neonatal (> 1 months) 111 223 446 1,126 1,818
Infant (1–59 months) 58 116 228 571 911
Maternal 1 4 8 23 37
Total 170 343 682 1,720 2,766
Source: LiST projections.
13. Table 3.4 summarizes the estimated economic benefit from reduced child mortality. Deaths averted are converted into DALYs gained by multiplying the number of deaths averted by the average remaining life expectancy at age 1 for neonatal deaths and by the remaining life expectancy at age 3 for infant deaths in Lao PDR. The economic value of the reduction on child mortality is calculated as DALYs saved multiplied by the country’s GDP per capita (conservative estimate) and by three times the GDP per capita as the parameters recommended by the WHO Commission on Macroeconomics and Health.
Table 3.4. Economic Benefit Analysis (from Reduced Child Mortality) by Scenario
5% 10% 20% 50% 80%
Death Averted
Neonatal (> 1 months) 111 223 446 1,126 1,818
Infant (1–59 months) 58 116 228 571 911
DALYs averted 11,319 22,705 45,147 113,677 182,822
Economic Value (US$)
DALY = one time GDP per capita
12,676,765
25,429,309
50,564,461 127,318,26
2 204,760,79
7
DALY = 3 times GDP per capita 38,030,29
4 76,287,92
6 151,693,38
2 381,954,78
7 614,282,39
0
Benefit-cost Ratio
DALY = one time GDP per capita
0.46 0.93 1.85 4.65 7.47
DALY = 3 times GDP per capita 1.39 2.78 5.54 13.94 22.42
Source: Author's calculations.

42
14. The results indicate that each U.S. dollar invested by the project generated between US$0.49 and US$1.39 in benefits, assuming that 5 percent of increase in coverage rates was attributed to the project. Under this scenario, the project has generated the total economic value between US$12.7 million and US$38.0 million from reduced child mortality.
15. In addition to interventions to increase coverage of immunization rates among children, the project supported the HEF and free MCH services in nine districts of four southern provinces of Lao PDR. A report by the SRC12 analyzed the impact of the HEF and free MCH services in the project provinces.
16. The utilization rate for CU5 showed a substantial increase compared to before the introduction of ‘Free CU5’. ‘Free maternity for all’ has led to a progressive increase in births at health facilities. However, utilization by the poor was far lower than utilization by the non-poor. Apparently money is not the most important barrier for utilization of free deliveries by the poor population and other obstacles need to be addressed too (presence of midwives, language and trust barriers). Nearly 466,000 people benefited from the HEF throughout the project implementation period. The annualized (2015) cost of the program was US$3.5 per HEF member per year, US$14 for free maternity services per targeted pregnant women, and US$3.9 per child under 5 years. Eighty-seven percent of the expenses were on treatment costs.
17. Before the implementation of the free MCH policy, a survey on OOP expenditure for maternal health services among high priority and poor districts was carried out and analyzed by the Bank.13 OOP payments for deliveries proved to be substantial, highly variable (depending on the choice of institutional vs. non-institutional birth, health facility level, and mode of delivery) and therefore difficult for households to predict in advance, and inequitable (with regard to socio-economic status as well as to access). Maternal OOP payments were more than 13 times higher at LAK 489,000 (US$60.37) when deliveries were in facility compared to non-institutional deliveries.14
18. The mean OOP expenditure amounted to 26 percent of average monthly household expenditure for a pregnant women delivering at a district hospital, 52 percent for deliveries in provincial hospitals, 12 percent for deliveries in health centers, and 3 percent for non-institutional births. About 10 percent of households had to borrow money to pay for the fees for delivery at hospitals (the mean amount borrowed was LAK 1,219,000 or US$150.50 and LAK 1,634,000 or US$201.73 for district and provincial hospitals, respectively); 6 percent of households had to borrow when delivery took place at health
12 SRC Co-Management and Capacity Building Agency/MOH/HSIP AF. 2015. Contract between the MOH, in the frame of the HSIP AF, IDA Grant No: H-659-LA/HRI-TF010518-LA, Project ID: P129906, SSS-COF-01, for the implementation of HEFs and free MNCH in 9 districts of the south with co-funding MOH-HSIP AF and SRC - Final Report. 13 A survey sampling 2,981 households with at least one child under two years of age was conducted in high priority and poor communities in the southern provinces of Lao PDR in 2010. 14 World Bank. 2013. Maternal Health OOP Expenditure and Service Readiness in Lao PDR: Evidence for
the National Free Maternal and Child Health Policy from a Household and Health Center Survey. Washington, DC: World Bank.

43
centers (mean amount of LAK 651,000 or US$80.37); and 3 percent of households borrowed for non-institutional deliveries (mean amount of LAK 556,000 or US$68.64).
Table 3.5. Financial Protection without and with National Free MHC Policy
Percent of households where mean OOP exceeds 20% or 40% of monthly household expenditure
Non-institutional
Health Center
District Hospital
Provincial Hospital
Without the national free MCH policy
20% of monthly household expenditure 1.8 17.6 52.9 70.2
40% of monthly household expenditure 0.5 3.7 21.9 50.7
With the national free MCH policy
20% of monthly household expenditure 0.5 1.5 2.6 6.9
40% of monthly household expenditure 0.0 0.0 1.6 3.2
Source: World Bank 2013.
19. The number of free deliveries in the five project provinces increased rapidly from 10,927 in 2013 to 24,647 in 2014 and declined slightly in 2015 (when funding of some services was discontinued) to 24,106. Table 3.6 provides a rough estimate of OOP payments avoided by the free MCH policy assuming the same unit costs as before the introduction of the policy and no change in utilization patterns. Average maternal OOP payments were reported as LAK 111,047 (US$13.71) in 2010. Between 2013 and 2015 almost 60,000 births were given under the free MCH services in the five project provinces, avoiding maternal OOP payments of about US$820,000.15
Table 3.6. Maternal OOP Avoided by Free MCH Supported by the Project
2013 2014 2015 Total
Beneficiaries 10,927 24,647 24,106 59,680
OOP spending avoided (LAK) 1,213,410,569 2,736,975,409 2,676,898,982 6,627,284,960
OOP spending avoided (US$) 149,832 337,962 330,543 818,337
Source: Author’s calculations.
Discussion
20. In this analysis, a set of plausible assumptions were made to estimate benefits of the project. However, it is important to note that the analysis was able to estimate benefits of only part of the interventions and activities that were supported by the project. The project has contributed to the capacity building of the health workforce through short-term training for 4,655 health staff and long-term training for 771 health personnel and improvements of key health infrastructure, including the HMIS. However, economic benefits of these interventions/activities were not quantified in the analysis due to lack of data and methodical limitations. Therefore, this analysis underestimates the overall benefits to a large extent.
21. Based on the analysis that aimed to quantify the two main benefits of the project, the project is likely to have generated positive return. According to the WHO criteria, an
15 This likely is an underestimation as the share of more expensive institutional births has increased in the meantime.

44
intervention that averts one additional DALY at a cost of less than GDP per capita is considered as ‘very cost-effective’ and an intervention that averts one additional DALY at a cost of between one and three times GDP per capita is deemed ‘cost-effective’ and representing ‘good value for money’.16 Using these criteria, the project would be classified as ‘cost-effective’ if it had averted at least 121 child deaths and ‘very cost-effective’ if it had averted at least 362 child deaths, corresponding to around 4 percent or 11 percent of coverage rates increase attributable to the project, respectively (figure 3.5).
Figure 3.5. Projected Deaths Averted among CU5 by Scenario (2005–2015)
Source: LiST projections and author’s calculations.
22. Furthermore, the project contributed to reduction in OOP expenditures for MCH services (nearly US$820,000) among beneficiary households. While differentiating benefits taken by poor and non-poor is not possible because of data constraints, from the level of financial protection (table 3.5), it can be estimated that more than 2,000 households (with OOP expenditure exceeding 40 percent of the average monthly total household expenditure) have avoided catastrophic health spending because of the free MCH services supported by the project.
23. Finally, a number of interventions during this project are likely to result in benefits that will only become measurable in the future—and thereby documented as benefits for the follow-on project. One such example is the training of community midwives. One of the likely reasons for consistent relatively low rates of institutional deliveries is the limited number of trained midwives posted to the health centers. Following the financing for a two-year midwifery training course during the restructuring of the project in 2012, 332 community midwives were positioned at health centers in 2015 and 424 in 2016. This substantial increase in qualified staff at the health center level is highly likely to positively affect the ANC attendance as well as the delivery with assistance of an SBA. Other examples include the use of the supervisory checklist for qualitative improvement of service delivery that was developed for use in a few selected districts during the AF for the project but is now being scaled up for use in 14 provinces during the follow-on project.
16 WHO. 2002. The World Health Report 2002: Reducing Risks, Promoting Healthy Life. Geneva: WHO.

45
Likewise, DHIS2, which was first introduced under the project in an Excel-based version and subsequently in a web-based version, is now being used in the entire country.

46
Table 3.7. Projection Results of Child and Maternal Deaths Averted by Scenario Using the LiST Model
2005 2006 2007 2008 2009 2010 2011 2012 2013 2014 2015
Infant and under 5 deaths 7,792 7,692 7,807 7,849 7,865 8,042 8,321 8,594 8,582 8,574 8,689
Infant 3,109 3,140 3,127 3,114 3,094 3,126 3,168 3,196 3,313 3,387 3,454
Under 5 4,683 4,552 4,680 4,735 4,771 4,915 5,152 5,398 5,269 5,188 5,236
Maternal deaths 342 349 357 365 372 386 402 410 425 434 443
Scenario 1 (5% of coverage increase attributed to the project): Lao PDR south region, total child and maternal deaths 2005 2006 2007 2008 2009 2010 2011 2012 2013 2014 2015
Infant and under 5 deaths 7,792 7,694 7,813 7,859 7,877 8,056 8,342 8,620 8,607 8,600 8,716
Infant 3,109 3,142 3,132 3,121 3,102 3,136 3,182 3,212 3,329 3,403 3,471
Under 5 4,683 4,552 4,681 4,738 4,774 4,920 5,160 5,409 5,278 5,197 5,245
Maternal deaths 342 349 357 365 372 386 402 410 425 435 443
Additional deaths averted at 5% of coverage increase attributed to the project 2005 2006 2007 2008 2009 2010 2011 2012 2013 2014 2015 Total Infant and under 5 deaths 0 2 6 10 12 14 21 26 25 26 27 169
Infant 0 2 5 7 8 10 14 16 16 16 17 111
Under 5 0 0 1 3 3 5 8 11 9 9 9 58
Maternal deaths 0 0 0 0 0 0 0 0 0 1 0 1
Scenario 2 (10% of coverage increase attributed to the project): Lao PDR south region, total child and maternal deaths 2005 2006 2007 2008 2009 2010 2011 2012 2013 2014 2015
Infant and under 5 deaths 7,792 7,697 7,819 7,866 7,889 8,072 8,363 8,647 8,631 8,626 8,743
Infant 3,109 3,144 3,136 3,127 3,111 3,148 3,196 3,227 3,345 3,420 3,488
Under 5 4,683 4,553 4,682 4,740 4,778 4,925 5,167 5,420 5,286 5,206 5,255
Maternal deaths 342 349 357 365 373 387 402 410 425 435 444
Additional deaths averted at 10% of coverage increase attributed to the project 2005 2006 2007 2008 2009 2010 2011 2012 2013 2014 2015 Total
Infant and under 5 deaths 0 5 12 17 24 30 42 53 49 52 54 338
Infant 0 4 9 13 17 22 28 31 32 33 34 223
Under 5 0 1 2 5 7 10 15 22 17 18 19 116
Maternal deaths 0 0 0 0 1 1 0 0 0 1 1 4
Scenario 3 (20% of coverage increase attributed to the project): Lao PDR south region, total child and maternal deaths 2005 2006 2007 2008 2009 2010 2011 2012 2013 2014 2015
Infant and under 5 deaths 7,792 7,703 7,830 7,885 7,913 8,104 8,403 8,701 8,680 8,677 8,795
Infant 3,109 3,149 3,144 3,140 3,129 3,170 3,221 3,259 3,378 3,453 3,522
Under 5 4,683 4,554 4,685 4,745 4,784 4,934 5,182 5,442 5,302 5,223 5,273

47
Maternal deaths 342 349 357 365 373 387 403 411 426 436 444
Additional deaths averted at 20% of coverage increase attributed to the project 2005 2006 2007 2008 2009 2010 2011 2012 2013 2014 2015 Total
Infant and under 5 deaths 0 11 23 36 48 62 82 107 98 103 106 676
Infant 0 9 17 26 35 44 53 63 65 66 68 446
Under 5 0 2 5 10 13 19 30 44 33 35 37 228
Maternal deaths 0 0 0 0 1 1 1 1 1 2 1 8
Scenario 4 (50% of coverage increase attributed to the project): Lao PDR south region, total child and maternal deaths 2005 2006 2007 2008 2009 2010 2011 2012 2013 2014 2015
Infant and under 5 deaths 7,792 7,719 7,866 7,939 7,983 8,198 8,529 8,863 8,828 8,832 8,956
Infant 3,109 3,162 3,172 3,181 3,181 3,236 3,302 3,354 3,477 3,555 3,625
Under 5 4,683 4,557 4,694 4,758 4,802 4,962 5,227 5,508 5,351 5,277 5,331
Maternal deaths 342 350 358 366 374 388 405 413 428 438 446
Additional deaths averted at 50% of coverage increase attributed to the project 2005 2006 2007 2008 2009 2010 2011 2012 2013 2014 2015 Total
Infant and under 5 deaths 0 27 59 90 118 156 208 269 246 258 267 1,698
Infant 0 22 45 67 87 110 134 158 164 168 171 1,126
Under 5 0 5 14 23 31 47 75 110 82 89 95 571
Maternal deaths 0 1 1 1 2 2 3 3 3 4 3 23
Scenario 5 (80% of coverage increase attributed to the project): Lao PDR south region, total child and maternal deaths 2005 2006 2007 2008 2009 2010 2011 2012 2013 2014 2015
Infant and under 5 deaths 7,792 7,735 7,901 7,992 8,056 8,293 8,656 9,026 8,978 8,988 9,118
Infant 3,109 3,175 3,199 3,220 3,235 3,304 3,385 3,452 3,578 3,658 3,731
Under 5 4,683 4,560 4,703 4,772 4,821 4,989 5,271 5,574 5,400 5,330 5,387
Maternal deaths 342 350 358 367 375 390 406 415 430 440 449
Additional deaths averted at 80% of coverage increase attributed to the project 2005 2006 2007 2008 2009 2010 2011 2012 2013 2014 2015 Total
Infant and under 5 deaths 0 43 94 143 191 251 335 432 396 414 429 2,728
Infant 0 35 72 106 141 178 217 256 265 271 277 1,818
Under 5 0 8 23 37 50 74 119 176 131 142 151 911
Maternal deaths 0 1 1 2 3 4 4 5 5 6 6 37
Note: Baseline: Lao PDR south region, total child and maternal deaths.

48
Annex 4. Bank Lending and Implementation Support/Supervision Processes
(a) Task Team members Names Title Unit
ICR
Emiko Masaki Senior Economist GHNDR
Lending and Supervision
Jayshree Balachander Senior Human Resources Specialist EASHD
Rosario Aristorenas Senior Program Assistant GED01
Peter Bachrach Consultant GHN07
James Chamberlain Consultant EASHD
Darren Dorkin Program Coordinator LLIKO
Daniel Duperty Consultant EASHD
Nina Eejima Senior Counsel LEGS
Abdul Haji Consultant EASHD
Svend Jensby Senior Social Development Specialist OPSPF
Boun Oum Inthaxoum Operations Officer EASHD
James Knowles Consultant EASHD
Jennica Larrison Consultant EASHD
Roch Levesque Senior Counsel LEGEA
Benjamin Loevinsohn Lead Public Health Specialist GHN07
Sergiu Luculescu Consultant EASHD
Rosa Muletu Finance Officer LOAG3
Emiko A. Naka Consultant GED02
Hoi-Chan Nguyen Senior Counsel LEGEA
Karin Nordlander Lead Counsel LEGEA
Bekir Onursal Consultant OPSPF
Hung Kim (Dominic) Phung Senior Finance Officer LOAGI
Juliana Riparip Consultant EASHD
Nipa Siribuddhamas Financial Management Specialist EACPO
Raj Soopramanien Senior Counsel LEGEA
Agnes Soucat Lead Health Economist GHN07
Iain Watson Consultant EASHD
Lingzhi Xu Senior Operations Officer GHN03
Brian Yates Consultant EASHD
Loraine Hawkins Consultant EASHD
Bengt Jacobson Consultant EASHD
Sutayut Osornprasop Human Development Specialist GHN02
Kathryn Sweet Consultant EASHD
Khamphet Chanvongnaraz Procurement Specialist GGO08
Malarak Souksavat Financial Management Analyst GG020
Timothy Johnston Program Leader ECCU4
Pema Lhazom Senior Operations Officer GHN02
Anna Lorenza Pigazzini Junior Profession Associate GHN02
Helene Carlsson Rex Senior Social Development Specialist GSU02

49
Vannaphone Soumpholphakdy Program Assistant GHN02
Ajay Tandon Senior Economist GHN02
Wei Aun Yap Consultant GHN02
Maya Gabrielle Villaluz Senior Environmental Engineer GEN02
Boualamphan Phouthavisouk Team Assistant EACLF
Sybounheung Phandanouvong Senior Social Development Specialist GSU02
Satoshi Ishihara Senior Developmental Specialist GSU02
Chantelle Boudreaux HQ Consultant ST GHNDR
Phetdara Chanthala Health Specialist GHN02
Chinnakorn Chantra Procurement Specialist EASRP-HIS
Boun Oum Inthaxoum Operations Officer GEDDR
Magnus Lindelow Practice Manager GHN01
Donald Herrings Mphande Lead Financial Management Spec GGO31
Toomas Palu Practice Manager GHN02
Nipa Siribuddhamas Financial Management Specialist EASFM - HIS
Sirirat Sirijaratwong Procurement Specialist GGO08
Souphanthachak Sisaleumsak Procurement Specialist EASR2 - HIS
Sophavanh Thitsy Consultant GHN02
Siriphone Vanitsaveth Sr Financial Management Specialist GGO20
Hope C. Phillips Volker Consultant GHNDR
(b) Staff Time and Cost
Stage of Project Cycle
Staff Time and Cost (Bank Budget Only)
No. of Staff Weeks* US$, thousands (including
Travel and Consultant Costs)
Lending
FY02 – 53.09
FY03 – 95.71
FY04 – 207.46
FY05 – 111.54
FY06 – 40.01
Total: – 507.81
Supervision/ICR – –
FY06 19 29.29
FY07 32.4 85.95
FY08 45.5 96.98
FY09 37.2 98.23
FY10 31.9 99.26
FY11 36.4 153.62
FY12 48.7 174.26
FY13 61.8 112.15
FY14 66.4 128.48
FY15 33.6 71.91
FY16 15.6 68.96
Total: 428.5 1,119.09

50
*Data not available for FY02-FY06

51
Annex 5. Beneficiary Survey Results
N/A
Annex 6. Stakeholder Workshop Report and Results
N/A

52
Annex 7. Summary of Borrower's ICR and/or Comments on Draft ICR
Overall, the Ministry of Health accepts that the ICR captures the key issues related to project design and implementation, and the government agrees with all ratings proposed in the ICR. With the implementation of HSIP the Government of Lao PDR has learned a lot of lessons most of which are captured in this document, and the capacity of health staff at all levels of the system has improved significantly in the areas of project management, financial management and procurement. Moreover, the project has contributed substantially to the development of the country’s key health infrastructure though building and renovation of hospitals and health centers, provision of medical equipment, and in the development of the web-based health information system, all of which have significantly enhanced the current project. However, the government is also cognizant of the fact that the project was more than 10 years old at the time of the preparation of this ICR. And even though the ICR has been well informed through the review of existing documentation, visitation of project sites, key interviews, government policy, the needs of the people and overall environment has changed in the country since 2005 when the project was approved. The PDO and overall project design may have been suitable for that time, but we do acknowledge that the poor link between the PDO, indicators and project activities was a significant oversight during project preparation. A design constraints that continued through both phases of the project was in the utilization of services by the poor. For example, the PDO of HSIP-AF was “to assist the Lao PDR to increase utilization and quality of health services, particularly for
the poor women and children in rural areas of Project Provinces” but the project activities on free maternal and child covered all pregnant women in all project provinces - because at that time the first priority was to get pregnant women deliver in health facilities. However, even though these service are free, women from poor households were still reluctant to use the services. Lessons Learned The following key lessons were learned during the 2005 to 2012 phase of the project:
• In the future, and in order to avoid a gap or ensure a continuation of key services, preparation of a follow-on project should commence at least one to two years prior to completion of the other project. Of importance, is also ensuring that capacities related financial management, planning and budgeting of the Project are in place
• In order to avoid delay in starting project implementation, project structures and key project staff should be in place before a project is declared as effective.
• The WB should provide No objection on time, in particular procurement of goods or civil works using ICB method.
• Support from HSIP in the activity of expansion of ICHC was very valuable and worthwhile. The same model supported by Nam Theun II project and Lao-Lux Project has proved that this is a good approach to improve functioning of the health system and in improving quality, integrated curative, preventive and promotive care to the populations in its catchment area. This is a model of PHC that the MOH/Lao Government would like to see implemented nation-wide.
• In order to reduce maternal mortality, specifically during delivery, encouraging pregnant women to give birth at health facilities free of charge is a good approach

53
and it meets the policy of Lao Government. However, training of skilled midwives and provision of necessary medical equipment, furniture, clean water system, clean delivery room, in order to facilitate performance of clean and safe delivery is also critical.
• Changing World Bank task team leaders might be un-avoidable, however, it should not be too frequent.
• Collaboration between IDA and international partners who are working in Lao PDR is essential, but it should be facilitated by staff from MOH, and in particular the staff who are directly responsible for the implementation of the Project.
During the project implementation from 2013 to 2015 (third phase HSIP-AF) the following lessons have been drawn from this experience: - Referral system should be strictly applied in order to prevent by-passing primary health
cernters - Regular (verification) fied visits by the central implementing agency team to provinces
and districts is essentially, and especially where indication of sudden increases in the utilization of services and increased requests for reimbursements are reported
- Reimbursements to the health facilities (provincial and district hospitals) should only be made after verification has been completed
- External consultants should be could engaged very early, and especially for those initiatives where the country has not previous experiences (for example, RBF) in order to avoid extended delays in project implamentation..
- The procurement process of international consultants for the design and implementation of such initiatives should not take more than 3 months to get consultants onboard.
- Changes in key procedures, for example, stopping payment of administrative costs, etc should not happen in the middle of project implementation as they are likely to have negative impact to overall project implementation
- It is important to conduct regula health facility surveys in project provinces availabilities of services, medical equipment and staff capacity before decided on what to procure, and also in order to avoid duplication and use of project resources more effectively and efficiency
- DGA or input based funding is difficult to make it sustain after project is faced out, therefore budget forecasting for this intervention is more important so that request support from other source of funding could be prepare in advance to avoid the gap
- Convincing national and sector leaders to support project activities is crucial and a priority. Legal agreements should involve all essential stakeholders to align with the new system. The key word here is “System” which means that all different components of, for example, the Health Information System, are interlinked and different people can play different roles, functions in order to support a common goal and objectives of timely.
- A functional health information system is essential for evidence-based policies, planning, policy and decision making.
List the names and titles of staff who contributed to the summary

54
1. Dr. Prasongsidh BOUPHA, Director of Planning and International Cooperation Department
2. Dr. Chansaly PHOMMAVONG Deputy Director of HGNDP 3. Mr. Phanthanou Luangxay, Procurement consultant 4. Mr. Phisit Xayxomphou, Financial Management Specilaist 5. Dr Chanphomma VongsmphanhF Director Gerneral of DHC 6. Dr. Somchan Xaysida, Acting Director General of DTR 7. Dr Kotxaythoun Phimmasone, Deputy Director of DoF 8. Dr Kaisone Chouramany, Deputy Director of DHHP 9. Mr Khampiou Sihakhang, Director of MCHC 10. Dr Manivanh Savathdy, Head of Devision, DHC 11. Dr Chanthakhat Prapatsalang, Head of Division, DTR 12. Ms Kongmany Souphamixay, Deputy head of Administration Division 13. Dr Xayavone Khounorath, Health of training Division, MCHC 14. Ms. Sengmontha Ouphengvong, Technical staff, DOF

55
Annex 8. Comments of Cofinanciers and Other Partners/Stakeholders
N/A
56
Annex 9. List of Supporting Documents
1. Project Concept Note, October 21, 2003 2. Quality Enhancement Report, July 2, 2004 3. Project Appraisal Document, August 16, 2005 4. Development Grant Agreement, November 8, 2005 5. Multiple Indicator Cluster Survey 2006, September 2008 6. Project Paper, Restructuring, May 2011 7. Financing Agreement, October 11, 2011 8. Health Results Innovation Grant Agreement, October 11, 2011 9. Lao Social Indicator Survey 2011-2012, December 2012 10. Government of Lao-PDR Project Completion Report, March 2012 11. Restructuring Paper, November 28, 2013 12. Aide Memoires (2005-2015) 13. Implementation Progress Reports (2006-2015) 14. World Health Report, 2002 15. Lao-PDR Maternal Health Out-of-Pocket Expenditure and Service Readiness (WB),
2013 16. Lao-PDR Health Systems Review, 2014 17. Lao People’s Democratic Republic Service Availability and Readiness Survey, 2014 18. Swiss Red Cross Final Report of the Implementation of Health Equity Funds and Free
MNCH in 9 District of the South, 2015 19. Health Governance and Nutrition Development Project PAD, April 27, 2015 20. Government of Lao-PDR Project Completion Report, 2016

57


![FOI 208-1011 document 1 - Therapeutic Goods Administration · "Jut of i 1 September 2003 Hazard ratio of multiple event 3 -10.7 0.68 [0.51, 0.91] -7.7 0.60 [0.39, 0.92] NA The 95%](https://img.pdfslide.us/doc/110x75/601047175b838120333ba0ed/foi-208-1011-document-1-therapeutic-goods-administration-jut-of-i-1-september.jpg)


![Untitled Document [cdn-pays.bnpparibas.com]...2010/06/30 · G 5/30 G 49,997 48,802 1,195 49,997 48,802 1,195 193 129 64 0.39% 0.26% 0.12% 193 129 64 0.39% 0.26% 0.12% 152 0 152 0.30%](https://img.pdfslide.us/doc/110x75/5ec62933d096b02d616671c5/untitled-document-cdn-pays-20100630-g-530-g-49997-48802-1195-49997.jpg)