Embed Size (px)
Citation preview
i
Document of
The World Bank
FOR OFFICIAL USE ONLY
Report No. 68697-PL
INTERNATIONAL BANK FOR RECONSTRUCTION AND DEVELOPMENT
PROGRAM DOCUMENT
ON A PROPOSED LOAN
IN THE AMOUNT OF EURO 750.0 MILLION
(US$991.4 MILLION EQUIVALENT)
TO THE REPUBLIC OF POLAND
FOR THE
FIRST PUBLIC FINANCE DEVELOPMENT POLICY LOAN
May 21, 2012
Poverty Reduction and Economic Management
Europe and Central Asia Region
This document has a restricted distribution and may be used by recipients only in the performance
of their official duties. Its contents may not otherwise be disclosed without World Bank
authorization.
Pub
lic D
iscl
osur
e A
utho
rized
Pub
lic D
iscl
osur
e A
utho
rized
Pub
lic D
iscl
osur
e A
utho
rized
Pub
lic D
iscl
osur
e A
utho
rized
Pub
lic D
iscl
osur
e A
utho
rized
Pub
lic D
iscl
osur
e A
utho
rized
Pub
lic D
iscl
osur
e A
utho
rized
Pub
lic D
iscl
osur
e A
utho
rized
ii
REPUBLIC OF POLAND
CURRENCY EQUIVALENTS
(Exchange Rate Effective as of March 28, 2012)
EUR 1.00: USD 1.332: PLN 3.1867
ABBREVIATIONS, ACRONYMS & TERMS
AAA Analytic and Advisory Activities
CP Convergence Program
CPI Consumer Price Index
CPS Country Partnership Strategy
CTC Child Tax Credit
DC Defined Contribution
DPL Development Policy Loan
EC European Commission
ECA Europe and Central Asia Region
ECB European Central Bank
ERM2 Exchange Rate Mechanism (2nd
phase)
ESA European System of Accounts
ESF European Social Fund
EU European Union
FCL Flexible Credit Line
FDI Foreign Direct Investments
GDP Gross Domestic Product
Gmina Municipality/commune administrative
unit (2,478)
GNI Gross National Income
GUS National Statistical Office
HBS Household Budget Survey
IBRD International Bank for Reconstruction
and Development
IFIs International Financial Institutions
IMF International Monetary Fund
KNF Financial Supervision Authority
KRUS Farmers’ Insurance Fund
LFS Labor Force Survey
LM Labor Market
MIC Middle-Income Country
MLSP Ministry of Labor and Social Policy
MOF Ministry of Finance
MOH Ministry of Health
MTEF Medium-Term Expenditure
Framework
MTO Medium Term Objective
MYSFP Multi-Year State Financial Plan
NBP National Bank of Poland
NDC Notional Defined Contribution
NHF National Health Fund
NUTS Nomenclature of Territorial Units for
Statistics
OECD Organization for Economic
Cooperation and Development
OPF Open Pension Fund
PARSP Post-Accession Rural Support Project
PBB Performance-Based Budgeting
PER Public Expenditure Review
PFA Public Finance Act
PFM Public Finance Management
PIT Personal Income Tax
Powiat County administrative unit (379)
PLN Polish Zloty
PPP Public Private Partnerships
PTE Pension Fund Association
RER Regular Economic Report
SGP Stability and Growth Pact
SME Small and Medium Enterprises
TA Technical Assistance
VAT Value-Added Tax
Voivodeships Province administrative unit (16)
ZUS Social Insurance Institution
Vice President:
Country Director:
Sector Director:
Sector Manager:
Task Team Leaders:
Co-Task Team Leader:
Philippe Le Houerou
Peter Harrold
Yvonne Tsikata
Satu Kahkonen
Gallina A. Vincelette, Pablo Saavedra, Kaspar Richter
Emilia Skrok
iii
FOR OFFICIAL USE ONLY
REPUBLIC OF POLAND
FIRST PUBLIC FINANCE DEVELOPMENT POLICY LOAN (DPL1)
TABLE OF CONTENTS
LOAN AND PROGRAM SUMMARY .......................................................................... iv I. INTRODUCTION..................................................................................................... 1
II. COUNTRY CONTEXT............................................................................................ 2 2.1. POLITICAL DEVELOPMENTS ........................................................................................ 2 2.2. RECENT ECONOMIC DEVELOPMENTS ....................................................................... 3 2.3. MACROECONOMIC OUTLOOK AND DEBT SUSTAINABILITY ............................... 6 2.4. RELATIONS WITH THE IMF ......................................................................................... 10
III. THE GOVERNMENT’S REFORM PROGRAM ............................................ 11 3.1. CONSOLIDATING PUBLIC FINANCES ....................................................................... 13 3.2. STRENGTHENING FISCAL INSTITUTIONS ............................................................... 15 3.3. ADVANCING LONG-TERM FISCAL REFORMS ......................................................... 19 3.4. CONSULTATIONS ........................................................................................................... 25
IV. BANK SUPPORT TO THE GOVERNMENT’S PROGRAM ........................ 26 4.1. LINK TO THE COUNTRY PARTNERSHIP STRATEGY ............................................. 26 4.2. COLLABORATION WITH THE IMF AND THE EUROPEAN COMMISSION .......... 26 4.3. RELATIONSHIP TO OTHER BANK OPERATIONS .................................................... 26 4.4. ANALYTICAL UNDERPINNINGS ................................................................................. 27 4.5. LESSONS LEARNED ....................................................................................................... 28
V. THE PROPOSED POLICY LOAN ......................................................................... 29 5.1. OPERATION DESCRIPTION .......................................................................................... 29 5.2. CONSOLIDATING PUBLIC FINANCES ....................................................................... 30 5.3. STRENGTHENING FISCAL INSTITUTIONS ............................................................... 30 5.4. ADVANCING LONG-TERM FISCAL REFORMS ......................................................... 31
VI. OPERATION IMPLEMENTATION ................................................................ 33 6.1. POVERTY AND SOCIAL IMPACT ................................................................................ 33 6.2. ENVIRONMENTAL ASPECTS ....................................................................................... 35 6.3. IMPLEMENTATION MONITORING AND EVALUATION ......................................... 35 6.4. FIDUCIARY ASPECTS AND PROCUREMENT............................................................ 35 6.5. DISBURSEMENT AND AUDITING ............................................................................... 37 6.6. RISKS AND MITIGATION .............................................................................................. 37 ANNEX 1: POLICY MATRIX ................................................................................................ 39 ANNEX 2: LETTER OF DEVELOPMENT POLICY ............................................................. 41 ANNEX 3: IMF ASSESSMENT .............................................................................................. 44 ANNEX 4: POLAND AT A GLANCE .................................................................................... 45 ANNEX 5: MAP OF POLAND ................................................................................................ 48
This loan was prepared by an IBRD team comprising John Balafoutis, Mukesh Chawla, Agnès Couffinhal, Joseph
Formoso, Herwig Immervoll, Ewa Korczyc, Kirsten Burghardt Propst, Kaspar Richter (former TTL), Marc
Robinson, Pablo Saavedra (former TTL), Emilia Skrok (co-TTL), Kenneth Simler, Emily Sinnott, Victoria
Strokova, Anita Schwarz, Gallina A. Vincelette (TTL) and Iwona Warzecha. Malgorzata Michnowska provided
essential support.

iv
LOAN AND PROGRAM SUMMARY
REPUBLIC OF POLAND
FIRST PUBLIC FINANCE DEVELOPMENT POLICY LOAN
Borrower REPUBLIC OF POLAND
Implementation Agency MINISTRY OF FINANCE
Financing Data Amount: EUR 750 million
Terms: IBRD Flexible Loan in EUR with final maturity of 20 years including a
grace period of 9 years.
Front end fee: 0.25% of loan amount to be financed from own resources
Operation Type Programmatic (1st of 2), single-tranche
Main Policy Areas Public finance, pensions, health and social assistance
Key Outcome Indicators 1. By the end of 2013, public debt-to-GDP ratio (national definition) is stabilized
at around the 2011 level (not higher than 54 percent of GDP).
2. By the end of 2013, local governments’ debt-to-GDP ratio (ESA’95 definition)
is stabilized at around the 2011 level (not higher than 4.3 percent of GDP).
3. By the end of 2013, the social security funds’ deficit-to-GDP ratio (ESA’95
definition) is reduced compared to 2010 (lower than 0.8 percent of GDP).
4. Hospital arrears are reduced by 8 percent by end-2013 compared to end-2011.
5. The last-resort minimum income benefit for a ―typical‖ poor family is increased
in 2013 compared to 2010.1
Program Development
Objective(s) and
Contribution to CPS
This is the first in a proposed series of two development policy loans supporting
Poland’s goal of strengthening public finances. The proposed DPL program is
central to the Bank’s engagement in the country in the area of public finance reform,
as described in the Country Partnership Strategy Progress Report (CPSPR) presented
to the Board on June 7, 2011. The CPSPR highlights that the DPL program is
expected to support Poland’s fiscal consolidation agenda, while strengthening fiscal
institutions and improving the efficiency and sustainability of social spending.
The programmatic DPL is structured around three pillars with the following
development objectives: (i) consolidating public finances to ensure a steady decline
of the fiscal deficit to stabilize and over the medium-term reduce public debt to
maintain favorable access to financial markets; (ii) strengthening fiscal institutions
through the introduction of fiscal rules to ingrain a prudent fiscal stance over the
medium term; and (iii) advancing long-term fiscal reforms to secure the
sustainability of social spending in view of Poland’s demographic challenge. The
measures proposed to be supported under each pillar are as follows:
Pillar 1 Consolidating Public Finances: Sizable fiscal consolidation is a key policy
priority for 2012. Building on the progress made in 2011, a further reduction in the
fiscal deficit is crucial to adhere to Poland’s commitment under the Excessive
Deficit Procedure, to stay clear of the 55 percent of GDP national public debt limit,
and to protect priority spending.
Pillar 2 Strengthening Fiscal Institutions: Through the introduction of fiscal rules,
the Government aims to ensure that once the fiscal deficit has come down after the
initial consolidation process, it remains at prudent levels over the business cycle. The Government plans to introduce controls on local government finances in the
form of an annual aggregate deficit ceiling. In addition, a new national level fiscal
1 A ―typical poor‖ family is defined as a two-parent household with two children with a benefit package comprised of
minimum income social assistance benefit plus family benefit and no other income sources.
v
rule would limit the growth of national government expenditures to a rate not
exceeding the trend growth rate of GDP. These rules would safeguard against the re-
emergence of excessive structural budget deficits in the medium and long term.
Pillar 3 Advancing Long-Term Fiscal Reforms: Strengthening public finances also
requires Poland to initiate structural reforms across various sectors. These reforms
are focused on helping to secure the sustainability of pension transfers and public
health care services, while improving the coverage and generosity of social
assistance for the most vulnerable. In addition, introducing a regular income
accounting for farmers will enable moving to a system of regular taxation of the
agriculture sector based on income, including for the payment all social insurance
contributions over the medium term.
These policies aim to enhance Poland’s economic resilience in the face of adverse
times. These policies also aim at protecting fiscal space for key growth-enhancing
investments.
Risks This operation faces three risks: macroeconomic, financial sector and reform
implementation risks:
Macroeconomic risks stem from potential further instability in the euro area. A
severe event affecting the core and/or the periphery of the euro area could
undermine economic growth in Poland and jeopardize fiscal outcomes. The euro
area is Poland’s largest market and source for foreign investment, and as such euro
area problems could be transmitted to Poland through weaker export demand and
investment.
Financial sector risks stem from Poland’s vulnerabilities to external debt
deleveraging through parent bank funding of local subsidiaries and tighter access to
capital for firms and households. A deterioration of macroeconomic conditions
could also lead to an increase in non-performing loans.
The key mitigating factors against macroeconomic and financial sector risks include
a stepped-up utilization of EU funds and the flexibility of the exchange rate as a
shock absorber. In addition, Poland’s financial sector has demonstrated strong
fundamentals, benefitting from continued strengthening of regulation and
supervision and access to liquidity support from the European Central Bank (ECB)
and the National Bank of Poland (NBP). Lastly, the authorities could draw on the
Flexible Credit Line with the IMF, which has so far been treated as strictly
precautionary.
Reform implementation risks stem from potential public discontent with reforms.
This could reduce the Government’s political ability to implement and sustain the
needed fiscal and structural reforms. Ensuring support for the proposed reform
agenda within the coalition government will continue to be key for successful
implementation of the reforms.
Mitigating factors against this risk include: the Government’s strong electoral
mandate in recent parliamentary elections and thus the window of opportunity to
proceed with reforms prior to next general elections in 2015; the Government’s
strong commitment to strengthening public finances as articulated in the Prime
Minister’s opening speech to Parliament in November 2011; and the broadly
recognized need for fiscal reform in view of the national and EU public debt limits
and market pressures to improve fiscal balances.
Operation ID Number P127433
1
IBRD PROGRAM DOCUMENT FOR A PROPOSED
FIRST PUBLIC FINANCE DEVELOPMENT POLICY LOAN
TO THE REPUBLIC OF POLAND
I. INTRODUCTION
1. This proposed first loan in a programmatic series of two development policy loans
(DPLs) aims to strengthen Poland’s public finances. In the view of the authorities,
strengthening public finances is critical for Poland to maintain its economic resilience in the
context of the current external headwinds, protect fiscal space for strategic growth-enabling
investments, and secure fiscal sustainability. The proposed DPL series supports these objectives.
The DPL series is central to the Bank’s engagement in the country, as described in the Country
Partnership Strategy Progress Report (CPSPR) presented to the Board on June 7, 2011. The
proposed amount for the first loan (DPL1) is EUR 750 million.
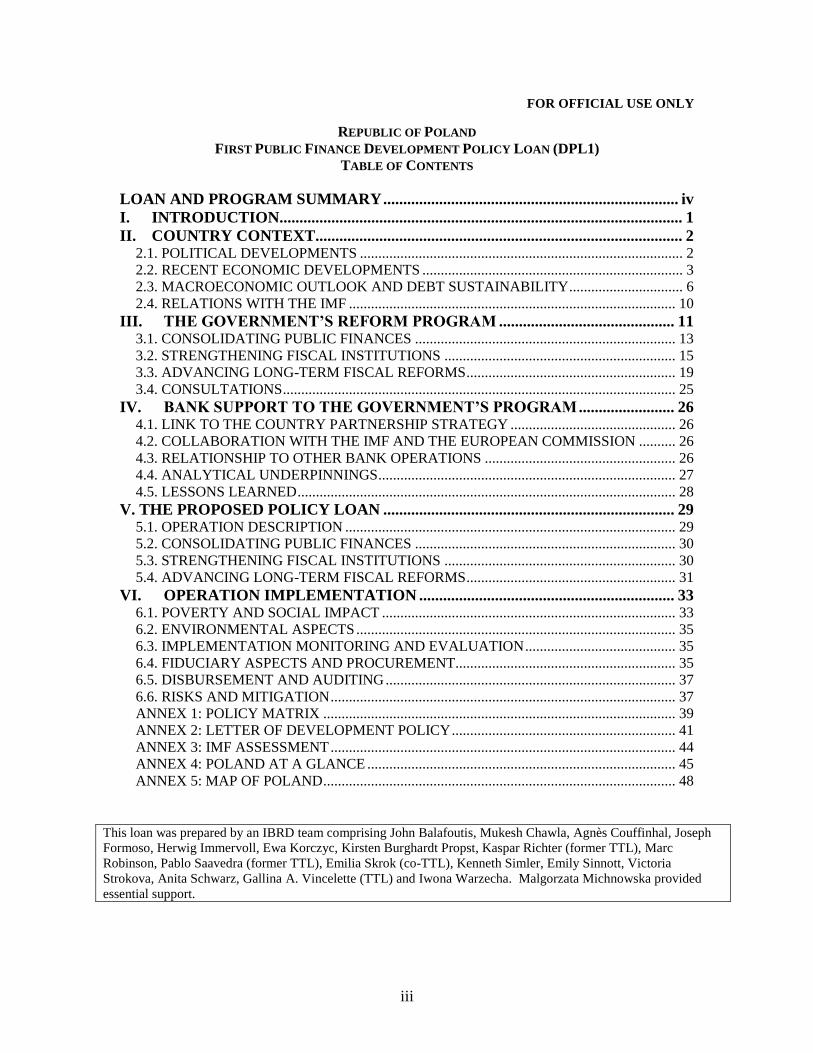
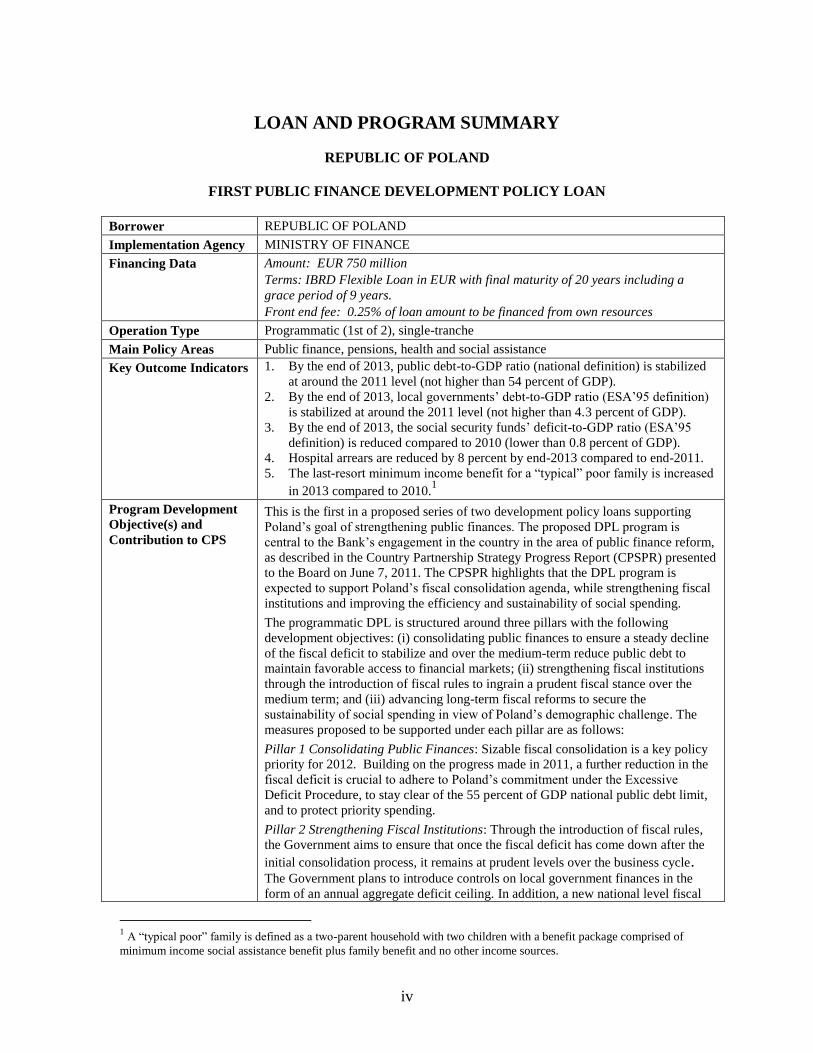
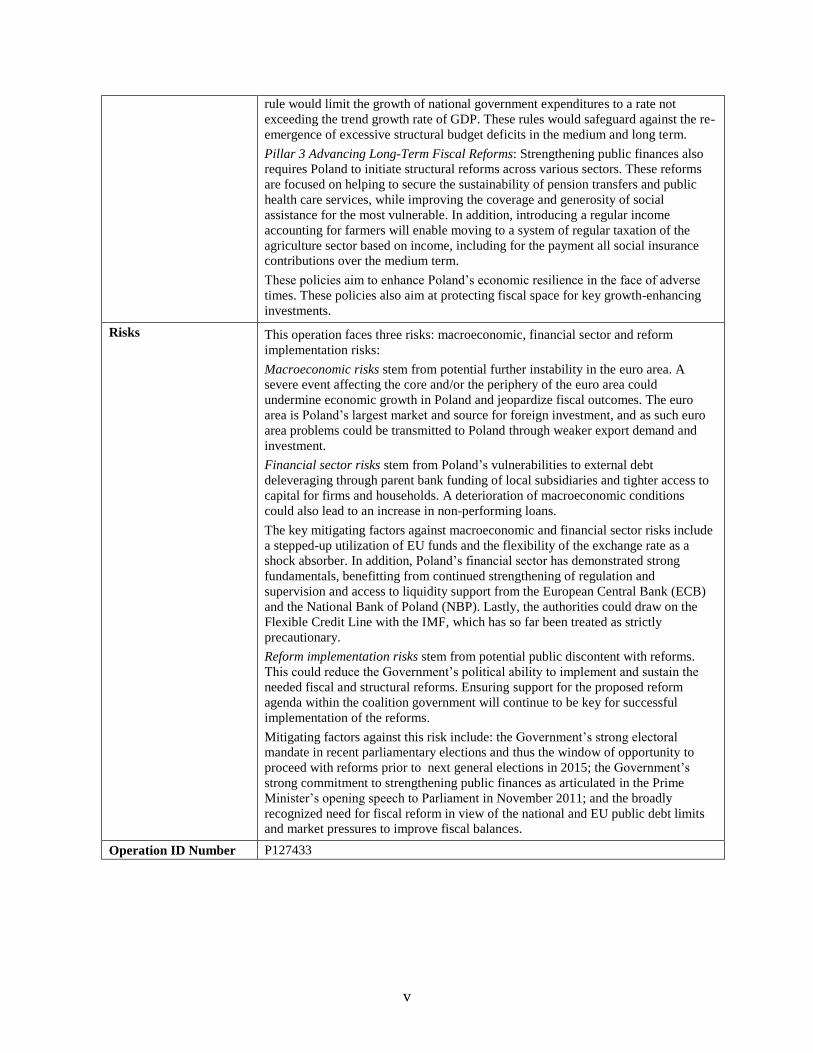
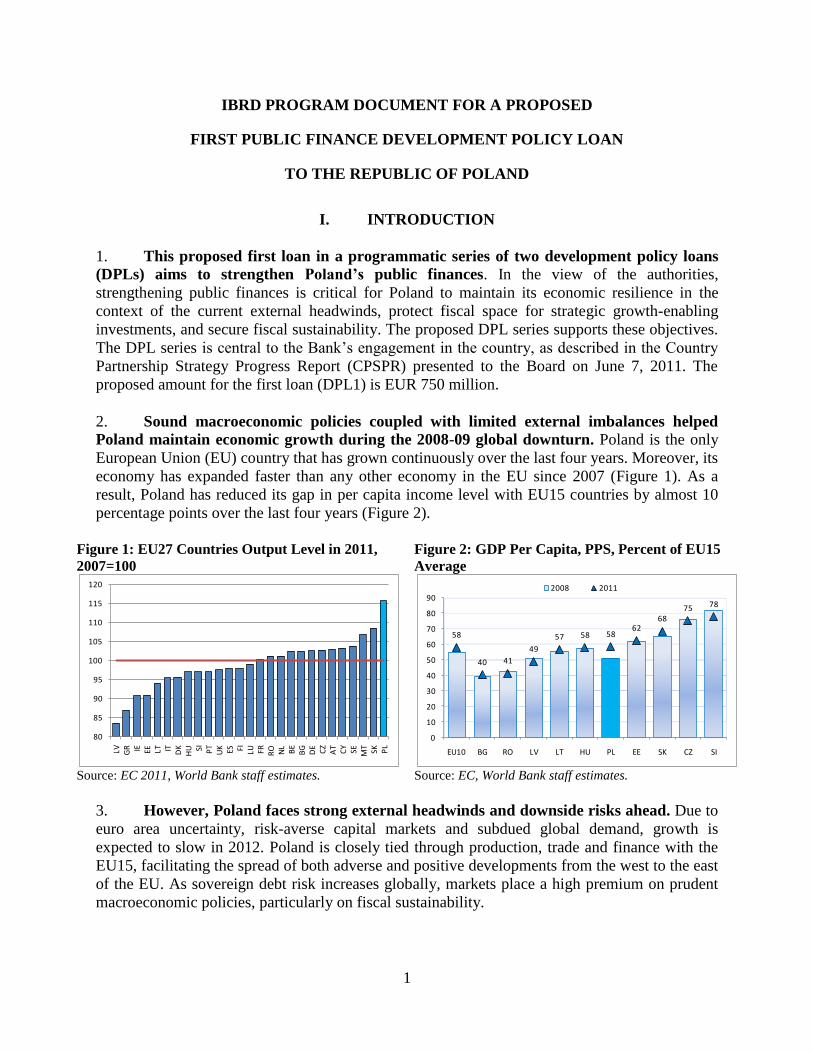
2. Sound macroeconomic policies coupled with limited external imbalances helped
Poland maintain economic growth during the 2008-09 global downturn. Poland is the only
European Union (EU) country that has grown continuously over the last four years. Moreover, its
economy has expanded faster than any other economy in the EU since 2007 (Figure 1). As a
result, Poland has reduced its gap in per capita income level with EU15 countries by almost 10
percentage points over the last four years (Figure 2).
Figure 1: EU27 Countries Output Level in 2011,
2007=100
Figure 2: GDP Per Capita, PPS, Percent of EU15
Average
Source: EC 2011, World Bank staff estimates. Source: EC, World Bank staff estimates.
3. However, Poland faces strong external headwinds and downside risks ahead. Due to
euro area uncertainty, risk-averse capital markets and subdued global demand, growth is
expected to slow in 2012. Poland is closely tied through production, trade and finance with the
EU15, facilitating the spread of both adverse and positive developments from the west to the east
of the EU. As sovereign debt risk increases globally, markets place a high premium on prudent
macroeconomic policies, particularly on fiscal sustainability.
80
85
90
95
100
105
110
115
120
LV GR IE EE LT IT DK
HU SI PT
UK ES FI LU FR RO NL
BE
BG
DE CZ
AT
CY
SE MT
SK PL
58
40 41
49
57 58 5862
6875 78
0
10
20
30
40
50
60
70
80
90
EU10 BG RO LV LT HU PL EE SK CZ SI
2008 2011
2
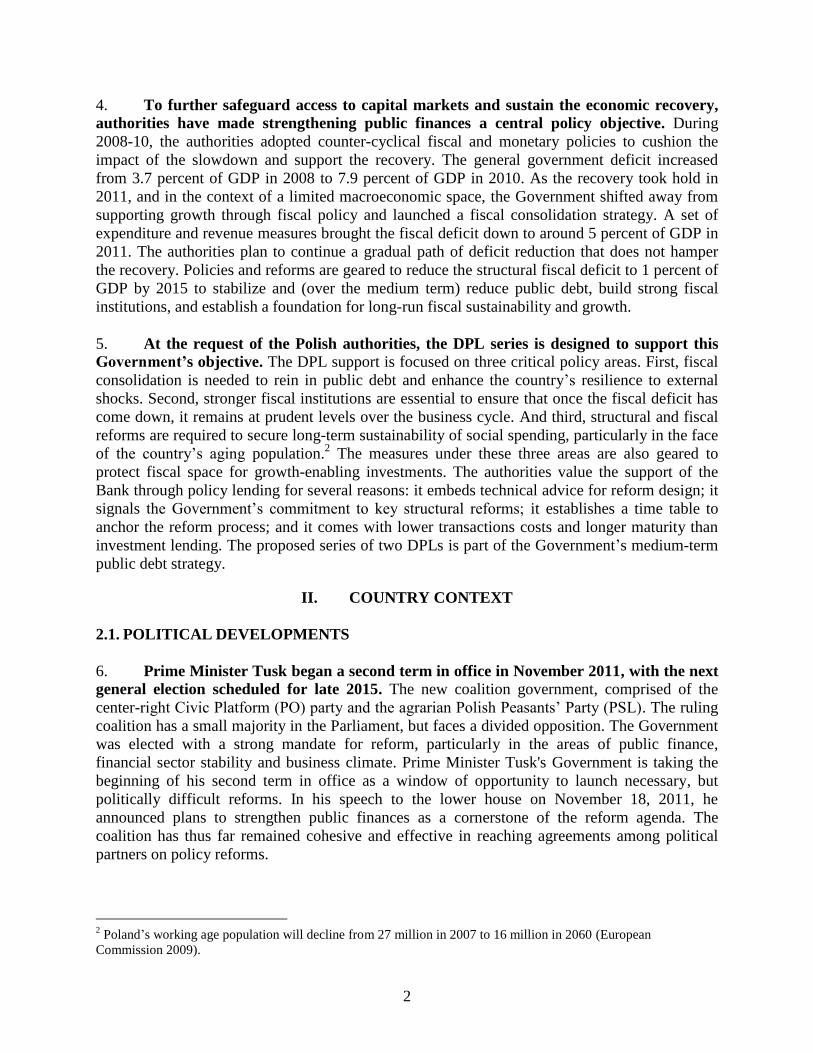
4. To further safeguard access to capital markets and sustain the economic recovery,
authorities have made strengthening public finances a central policy objective. During
2008-10, the authorities adopted counter-cyclical fiscal and monetary policies to cushion the
impact of the slowdown and support the recovery. The general government deficit increased
from 3.7 percent of GDP in 2008 to 7.9 percent of GDP in 2010. As the recovery took hold in
2011, and in the context of a limited macroeconomic space, the Government shifted away from
supporting growth through fiscal policy and launched a fiscal consolidation strategy. A set of
expenditure and revenue measures brought the fiscal deficit down to around 5 percent of GDP in
2011. The authorities plan to continue a gradual path of deficit reduction that does not hamper
the recovery. Policies and reforms are geared to reduce the structural fiscal deficit to 1 percent of
GDP by 2015 to stabilize and (over the medium term) reduce public debt, build strong fiscal
institutions, and establish a foundation for long-run fiscal sustainability and growth.
5. At the request of the Polish authorities, the DPL series is designed to support this
Government’s objective. The DPL support is focused on three critical policy areas. First, fiscal
consolidation is needed to rein in public debt and enhance the country’s resilience to external
shocks. Second, stronger fiscal institutions are essential to ensure that once the fiscal deficit has
come down, it remains at prudent levels over the business cycle. And third, structural and fiscal
reforms are required to secure long-term sustainability of social spending, particularly in the face
of the country’s aging population.2 The measures under these three areas are also geared to
protect fiscal space for growth-enabling investments. The authorities value the support of the
Bank through policy lending for several reasons: it embeds technical advice for reform design; it
signals the Government’s commitment to key structural reforms; it establishes a time table to
anchor the reform process; and it comes with lower transactions costs and longer maturity than
investment lending. The proposed series of two DPLs is part of the Government’s medium-term
public debt strategy.
II. COUNTRY CONTEXT
2.1. POLITICAL DEVELOPMENTS
6. Prime Minister Tusk began a second term in office in November 2011, with the next
general election scheduled for late 2015. The new coalition government, comprised of the
center-right Civic Platform (PO) party and the agrarian Polish Peasants’ Party (PSL). The ruling
coalition has a small majority in the Parliament, but faces a divided opposition. The Government
was elected with a strong mandate for reform, particularly in the areas of public finance,
financial sector stability and business climate. Prime Minister Tusk's Government is taking the
beginning of his second term in office as a window of opportunity to launch necessary, but
politically difficult reforms. In his speech to the lower house on November 18, 2011, he
announced plans to strengthen public finances as a cornerstone of the reform agenda. The
coalition has thus far remained cohesive and effective in reaching agreements among political
partners on policy reforms.
2 Poland’s working age population will decline from 27 million in 2007 to 16 million in 2060 (European
Commission 2009).

3
2.2. RECENT ECONOMIC DEVELOPMENTS
7. Poland was the only economy in the EU to avoid recession during the 2008-09 global
financial crisis. The country’s deep economic integration with Europe and other global markets
made it vulnerable to the collapse in capital flows and trade. Yet in 2009, Poland’s GDP grew by
1.6 percent, while the EU’s output declined by 4.2 percent. This performance stemmed from a
number of factors. First, Poland’s relatively large and diversified domestic economy mitigated
the negative effect of the sharp decline in global demand. Second, the country had limited
external imbalances in the years prior to the crisis. Third, adequate macroeconomic policies both
prior to and during the crisis helped to support output growth and protect the financial sector.
Monetary policy was accommodative in the context of the downturn, and automatic fiscal
stabilizers were allowed to operate. Solid banking regulation and supervision and relatively
moderate credit growth in the pre-crisis period (compared to the rest of Central and Eastern
Europe) strengthened the resilience of the financial sector.
8. Poland’s economy rebounded in 2010 and 2011, but growth is expected to slow in
2012. Real GDP growth accelerated to close to 4 percent in 2010 on the back of strong domestic
demand, improved labor market conditions and credit growth. At the same time, fiscal policy
continued to support the economy as public demand compensated for faltering private demand.
In 2011, despite a worsening external environment, financial market volatility and the launch of
fiscal consolidation, GDP growth remained strong at 4.3 percent. Good performance in industry
and construction, the absorption of EU funds and spending for the Euro 2012 soccer
championships contributed to this outcome. Growth also became more balanced in 2011, with
domestic fixed investments recovering from moderate declines in 2009 and 2010, and positive
net exports contributing in the second half of the year. The unemployment rate declined from a
peak of 10.6 percent in the first quarter of 2010 to 9.8 percent in the fourth quarter of 2011. In
late 2011, the unfavorable external environment started to weigh down Poland’s growth. Growth
in retail sales turnover eased from 16.3 percent in October 2010 to 2.1 percent in December
2011, and new orders for industry slid from 16.6 percent to 5.5 percent in the same period (year-
on-year, 3-month moving average). While this did not translate into weaker GDP growth in the
third and fourth quarters, reduced consumer and business confidence suggest that consumption,
investment and exports will be impacted by weak EU and global demand and increased risk
aversion in capital markets in 2012.
9. The current account deficit narrowed in 2011 and was financed mostly by FDI
inflows and capital transfers from the EU. The current account deficit is estimated to have
declined from 4.7 percent of GDP in 2010 to 4.3 percent of GDP in 2011, mainly due to
improvements in services and current transfers. The trade deficit is projected to have widened
somewhat in 2011 due to strong import demand—fuelled by investment and consumption—as
well as moderating export demand. Net FDI (around 1.8 percent of GDP in 2011) and EU capital
transfers (around 2.2 of GDP in 2011) covered over 90 percent of the current account deficit. As
a result of exchange rate depreciation in late 2011, the external debt-to-GDP ratio dropped to
around 63 percent of GDP (calculated in USD terms) by the end of 2011. The share of external
debt-to-GDP calculated in Polish zloty terms was around 70 percent of GDP. The share of short-
term debt in total debt dropped to around 22 percent in 2011 from around 25 percent in 2007-
2010. The level of international reserves remained broadly adequate. Although the ratio of forex
4
reserves to short-term debt plus current account deficit was around 70 percent, reserves covered
5.2 months of imports in 2011.
10. Monetary and exchange rate policies helped the adjustment in 2008-09 and
anchored inflation expectations in 2010-11. During the global financial crisis, the flexible
exchange rate facilitated the economy’s adjustment to external shocks. Monetary policy was
accommodative with cuts in policy rates and liquidity provision. Inflation pressures increased in
early 2011, fueled by higher international commodity prices, stronger domestic demand and the
increase in the statutory value-added tax (VAT) rate. In response, the Monetary Council
increased the key policy rate four times between January and June 2011, each time by 0.25
percentage points. Subsequently, the policy rate was maintained at 4.5 percent as inflationary
pressures eased. Headline inflation has already decreased from its peak of 5.0 percent in May
2011 to 4.1 percent in January 2012, but still slightly above the National Bank of Poland’s (NBP)
tolerance band of 1.5 percent to 3.5 percent.
11. The financial sector has been resilient to the shocks of the global crisis. The banking
sector has not required public support and remains well capitalized, liquid and profitable. The
solid position of the financial sector reflects: (i) strong fundamentals, such as low leverage and
high profitability of the corporate sector; (ii) lack of significant exposure to ―toxic‖ assets in both
the US and in the euro area and well-managed credit growth in the years prior the crisis; (iii)
continued improvements in regulation and supervision; (iv) continued capital and liquidity
support from international parent banks to domestic subsidiaries; and (v) the decision of several
banks to retain the majority of profits during 2008-2011 to improve capital adequacy ratios.
12. But vulnerabilities have increased and deleveraging and other risks remain. The
capital adequacy ratio at the end of 2011 was 13.1 percent, and the level of non-performing loans
(NPLs) was around 8.3 percent of assets, down from 8.8 percent in 2010. However, Poland
remains exposed to European banks. Foreign banks and branches (most of which are European)
account for about two-thirds of Poland’s banking system. In addition, the NPL nominal stock
continued growing. Further, there is still a large stock of FX-denominated loans among
unhedged borrowers, including in the construction industry. This highlights the existing
vulnerabilities of the banking sector. Thus, the authorities will need to remain vigilant about
financial sector policies to cope with these risks and those of deleveraging of local subsidiaries
of euro area banks.
13. The Government pursued counter-cyclical fiscal policies that cushioned the
slowdown in 2008-09 and supported the recovery in 2010. The general government deficit
increased from 3.7 percent of GDP in 2008 to 7.3 percent of GDP in 2009 and 7.9 percent of GDP
in 2010. The increase in fiscal imbalances resulted in a rise of public debt from 47.1 percent of
GDP in 2008 to 54.9 percent of GDP in 2010—a more moderate increase than in other EU
countries. The rise was contained by strong public debt and liquidity management, stable interest
rates due to Poland’s macroeconomic policies and stepped up privatization.
14. With the growth rebound in 2011, the Government embarked on a fiscal adjustment
path and initiated a process of fiscal consolidation. The general government deficit declined to
around 5.1 percent of GDP in 2011 (fiscal outturn proved to be better than expected by 0.5

5
percent of GDP) through a combination of revenue and expenditure measures. On the revenue
side, the main measures were: (i) a change in the pension system that shifted 5 percentage points
of the contribution from the funded second pillar to the first pillar; (ii) a 1 percentage point
increase in the VAT statutory rate; (iii) a 4 percentage point increase in excise duties on tobacco;
(iv) the abolition of VAT exemptions on company cars and fuel as well as exemptions on excise
duties on bio-fuels; and (v) no change in personal income tax thresholds. In parallel, faster GDP
growth and improved corporate income tax annual settlements3 aided revenue growth. On the
expenditure side, the growth in government spending was contained by: (i) a temporary fiscal
rule4 limiting increases in all newly enacted and existing discretionary expenditure items to 1
percentage point over the rate of inflation (CPI); and (ii) a nominal freeze of the budgetary
sphere wage bill.5
15. The structural reforms initiated by the Government are critical to ensure long-term
fiscal sustainability in Poland. Spending on pensions, health, education and other services
remains large relative to other emerging economies. At the same time, Poland’s aging population
presents significant challenges for long-term growth potential and fiscal sustainability.
According to EC projections, Poland’s working age population will decline from close to 27
million in 2010 to only 16 million in 2060. The pension reform of 1999 has a positive effect on
fiscal sustainability, but further reforms are needed, such as increasing retirement age for both
men and women and dealing with special pension schemes. The drop in the working age
population will also have an effect on fiscal sustainability through lower GDP growth and lower
revenues—including social insurance contributions. Further, the aging population will place
fiscal pressures on public services and programs, especially burdening the public health care
system (including long-term care) and social assistance. In education, quality needs to be
improved to build up skills demanded by the changing economy, but without spending additional
resources. Instead, existing inefficiencies need to be weeded out (see PER 20106). If action is not
taken, social spending will crowd out fiscal space for critical infrastructure and other capital
investments needed to sustain growth. On the revenue side, a main challenge is to continue
expanding the tax base, including bringing in sectors that are currently outside the tax net. Over
time, this will generate space to consider fiscally responsible reductions in marginal tax rates.
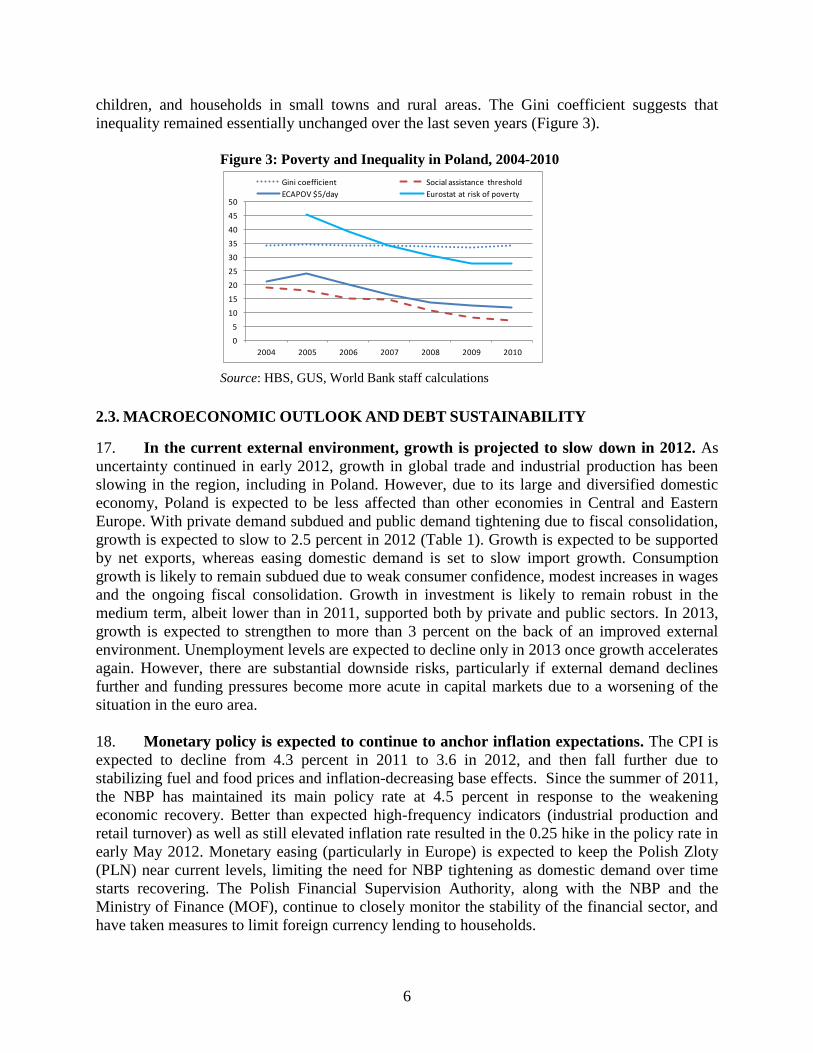
16. Despite the 2008-09 global financial crisis, poverty has remained low. Taking the
minimum social assistance threshold as a poverty line, poverty was halved from 14.6 percent in
2007 to 7.3 percent in 2010. Alternative measures of poverty confirm this trend (Figure 3). The
rate of poverty reduction (percentage points per year) has slowed down only slightly since 2008
and 2009. The poverty profile remained broadly unchanged. The incidence of poverty is high
among the unemployed, families with household heads with low education, families with many
3 The revenue from the corporate income tax rebounded in 2011 as companies ceased to deduct losses incurred as a
result of the global financial crisis in 2008-09. The loss carry-over provisions in Poland apply for a period of
maximum five years. Since companies are allowed to deduct at most 50 percent of their losses in a given year, in
practice, most companies deduct all the losses within two years. 4 The temporary fiscal rule was introduced as an amendment to the Public Finance Act in December 2010. The rule
is automatically enforced when Poland is under the Excessive Deficit Procedure (EDP). 5 The 475,000 employees of the state budgetary sphere are public sector employees directly under the control of the
central government. 6 Public Expenditure Review, Analysis of Social Sectors and Public Wages, World Bank 2010.
6
children, and households in small towns and rural areas. The Gini coefficient suggests that
inequality remained essentially unchanged over the last seven years (Figure 3).
Figure 3: Poverty and Inequality in Poland, 2004-2010
Source: HBS, GUS, World Bank staff calculations
2.3. MACROECONOMIC OUTLOOK AND DEBT SUSTAINABILITY
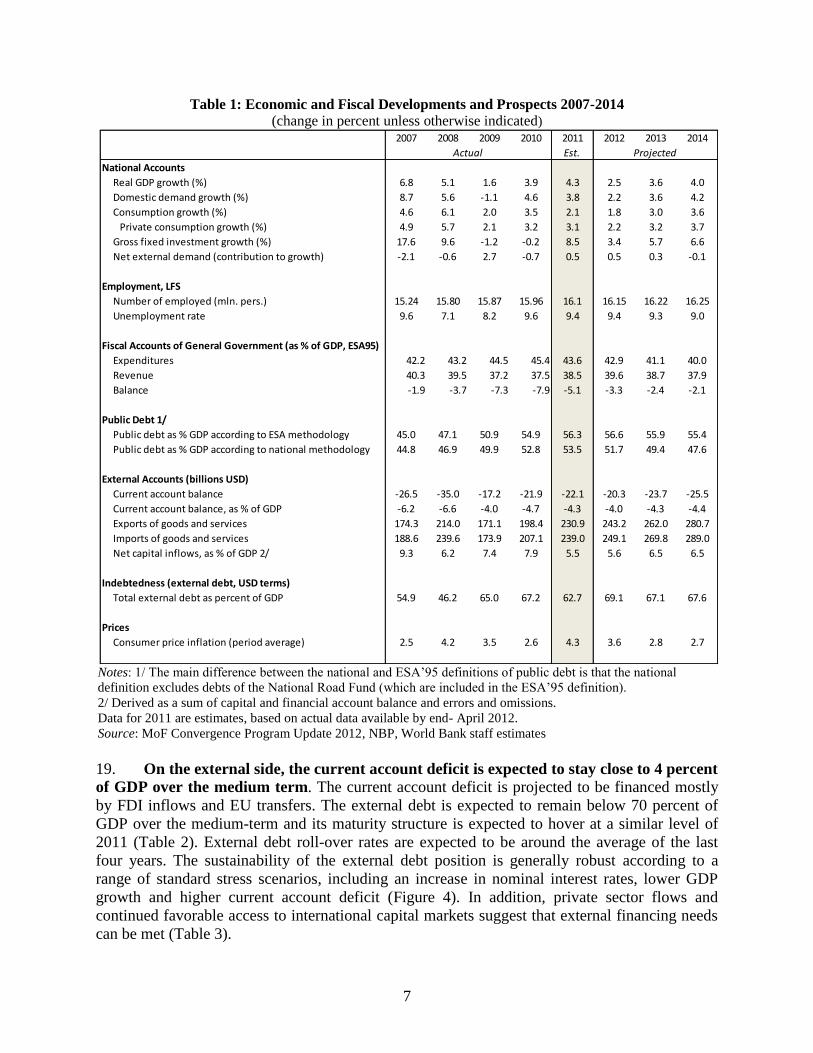
17. In the current external environment, growth is projected to slow down in 2012. As
uncertainty continued in early 2012, growth in global trade and industrial production has been
slowing in the region, including in Poland. However, due to its large and diversified domestic
economy, Poland is expected to be less affected than other economies in Central and Eastern
Europe. With private demand subdued and public demand tightening due to fiscal consolidation,
growth is expected to slow to 2.5 percent in 2012 (Table 1). Growth is expected to be supported
by net exports, whereas easing domestic demand is set to slow import growth. Consumption
growth is likely to remain subdued due to weak consumer confidence, modest increases in wages
and the ongoing fiscal consolidation. Growth in investment is likely to remain robust in the
medium term, albeit lower than in 2011, supported both by private and public sectors. In 2013,
growth is expected to strengthen to more than 3 percent on the back of an improved external
environment. Unemployment levels are expected to decline only in 2013 once growth accelerates
again. However, there are substantial downside risks, particularly if external demand declines
further and funding pressures become more acute in capital markets due to a worsening of the
situation in the euro area.
18. Monetary policy is expected to continue to anchor inflation expectations. The CPI is
expected to decline from 4.3 percent in 2011 to 3.6 in 2012, and then fall further due to
stabilizing fuel and food prices and inflation-decreasing base effects. Since the summer of 2011,
the NBP has maintained its main policy rate at 4.5 percent in response to the weakening
economic recovery. Better than expected high-frequency indicators (industrial production and
retail turnover) as well as still elevated inflation rate resulted in the 0.25 hike in the policy rate in
early May 2012. Monetary easing (particularly in Europe) is expected to keep the Polish Zloty
(PLN) near current levels, limiting the need for NBP tightening as domestic demand over time
starts recovering. The Polish Financial Supervision Authority, along with the NBP and the
Ministry of Finance (MOF), continue to closely monitor the stability of the financial sector, and
have taken measures to limit foreign currency lending to households.
0
5
10
15
20
25
30
35
40
45
50
2004 2005 2006 2007 2008 2009 2010
Gini coefficient Social assistance threshold
ECAPOV $5/day Eurostat at risk of poverty
7
Table 1: Economic and Fiscal Developments and Prospects 2007-2014
(change in percent unless otherwise indicated)
Notes: 1/ The main difference between the national and ESA’95 definitions of public debt is that the national
definition excludes debts of the National Road Fund (which are included in the ESA’95 definition).
2/ Derived as a sum of capital and financial account balance and errors and omissions.
Data for 2011 are estimates, based on actual data available by end- April 2012.
Source: MoF Convergence Program Update 2012, NBP, World Bank staff estimates
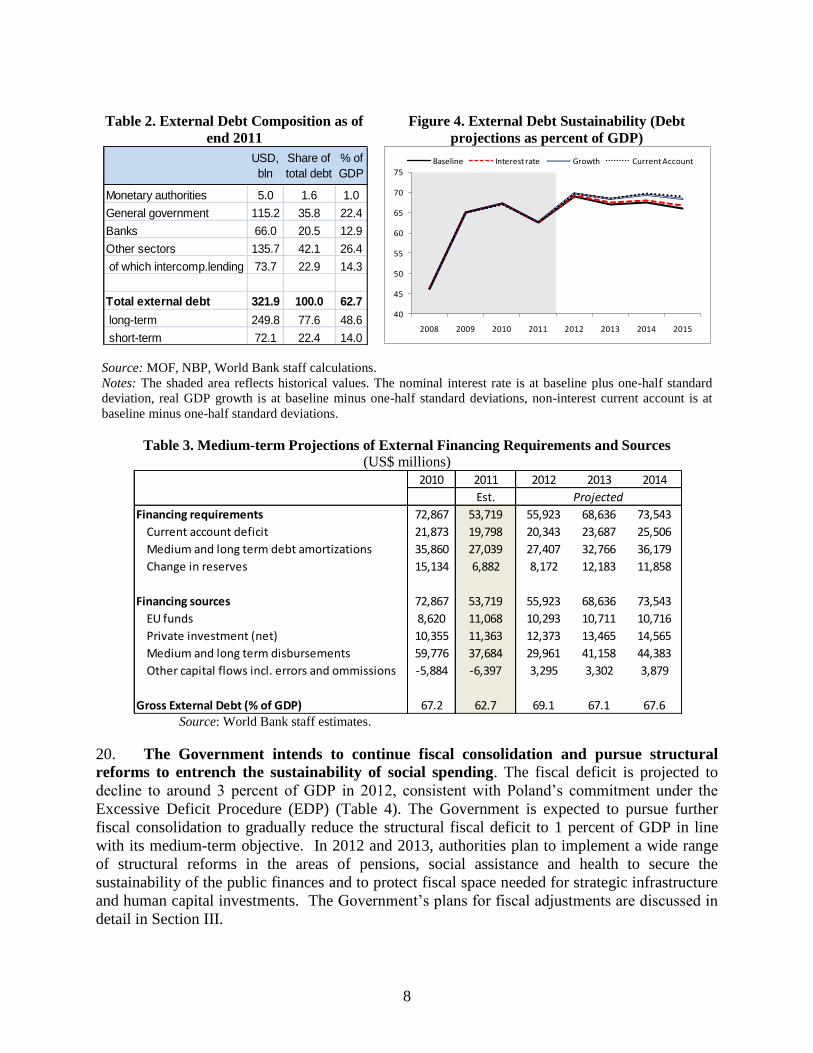
19. On the external side, the current account deficit is expected to stay close to 4 percent
of GDP over the medium term. The current account deficit is projected to be financed mostly
by FDI inflows and EU transfers. The external debt is expected to remain below 70 percent of
GDP over the medium-term and its maturity structure is expected to hover at a similar level of
2011 (Table 2). External debt roll-over rates are expected to be around the average of the last
four years. The sustainability of the external debt position is generally robust according to a
range of standard stress scenarios, including an increase in nominal interest rates, lower GDP
growth and higher current account deficit (Figure 4). In addition, private sector flows and
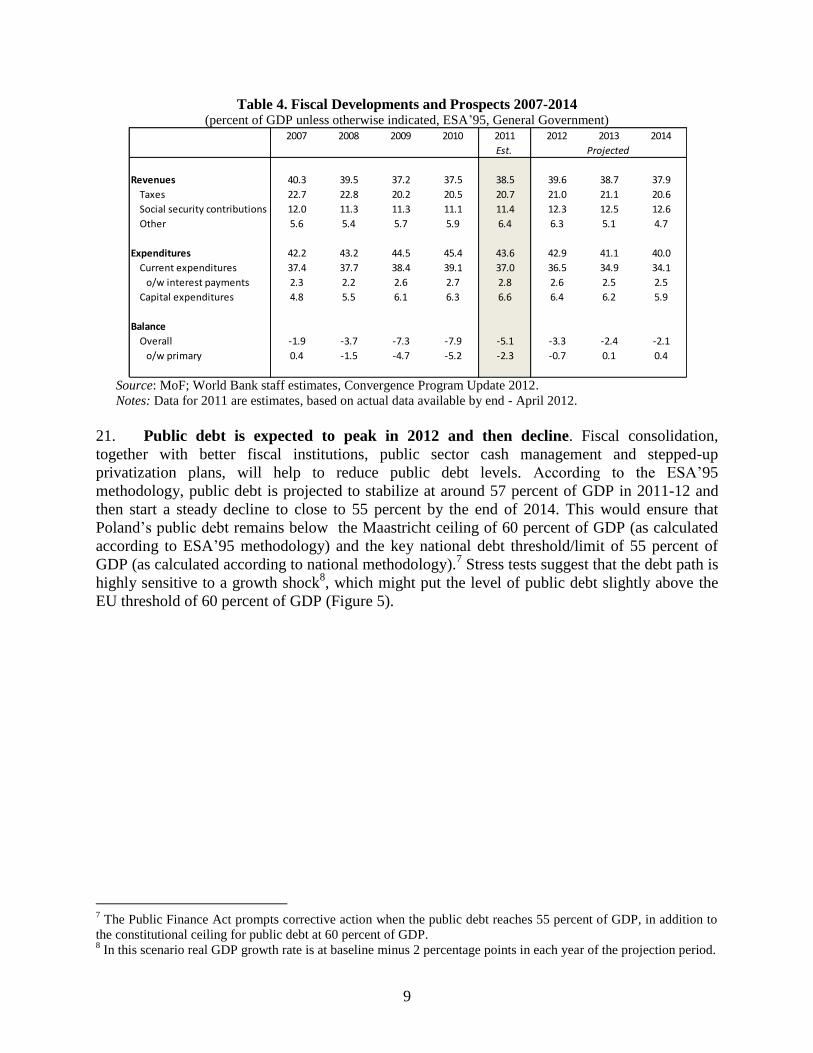
continued favorable access to international capital markets suggest that external financing needs
can be met (Table 3).
2007 2008 2009 2010 2011 2012 2013 2014
Est.
National Accounts
Real GDP growth (%) 6.8 5.1 1.6 3.9 4.3 2.5 3.6 4.0
Domestic demand growth (%) 8.7 5.6 -1.1 4.6 3.8 2.2 3.6 4.2
Consumption growth (%) 4.6 6.1 2.0 3.5 2.1 1.8 3.0 3.6
Private consumption growth (%) 4.9 5.7 2.1 3.2 3.1 2.2 3.2 3.7
Gross fixed investment growth (%) 17.6 9.6 -1.2 -0.2 8.5 3.4 5.7 6.6
Net external demand (contribution to growth) -2.1 -0.6 2.7 -0.7 0.5 0.5 0.3 -0.1
Employment, LFS
Number of employed (mln. pers.) 15.24 15.80 15.87 15.96 16.1 16.15 16.22 16.25
Unemployment rate 9.6 7.1 8.2 9.6 9.4 9.4 9.3 9.0
Fiscal Accounts of General Government (as % of GDP, ESA95)
Expenditures 42.2 43.2 44.5 45.4 43.6 42.9 41.1 40.0
Revenue 40.3 39.5 37.2 37.5 38.5 39.6 38.7 37.9
Balance -1.9 -3.7 -7.3 -7.9 -5.1 -3.3 -2.4 -2.1
Public Debt 1/
Public debt as % GDP according to ESA methodology 45.0 47.1 50.9 54.9 56.3 56.6 55.9 55.4
Public debt as % GDP according to national methodology 44.8 46.9 49.9 52.8 53.5 51.7 49.4 47.6
External Accounts (billions USD)
Current account balance -26.5 -35.0 -17.2 -21.9 -22.1 -20.3 -23.7 -25.5
Current account balance, as % of GDP -6.2 -6.6 -4.0 -4.7 -4.3 -4.0 -4.3 -4.4
Exports of goods and services 174.3 214.0 171.1 198.4 230.9 243.2 262.0 280.7
Imports of goods and services 188.6 239.6 173.9 207.1 239.0 249.1 269.8 289.0
Net capital inflows, as % of GDP 2/ 9.3 6.2 7.4 7.9 5.5 5.6 6.5 6.5
Indebtedness (external debt, USD terms)
Total external debt as percent of GDP 54.9 46.2 65.0 67.2 62.7 69.1 67.1 67.6
Prices
Consumer price inflation (period average) 2.5 4.2 3.5 2.6 4.3 3.6 2.8 2.7
Actual Projected
8
Table 2. External Debt Composition as of
end 2011
Figure 4. External Debt Sustainability (Debt
projections as percent of GDP)
Source: MOF, NBP, World Bank staff calculations. Notes: The shaded area reflects historical values. The nominal interest rate is at baseline plus one-half standard
deviation, real GDP growth is at baseline minus one-half standard deviations, non-interest current account is at
baseline minus one-half standard deviations.
Table 3. Medium-term Projections of External Financing Requirements and Sources
(US$ millions)
Source: World Bank staff estimates.
20. The Government intends to continue fiscal consolidation and pursue structural
reforms to entrench the sustainability of social spending. The fiscal deficit is projected to
decline to around 3 percent of GDP in 2012, consistent with Poland’s commitment under the
Excessive Deficit Procedure (EDP) (Table 4). The Government is expected to pursue further
fiscal consolidation to gradually reduce the structural fiscal deficit to 1 percent of GDP in line
with its medium-term objective. In 2012 and 2013, authorities plan to implement a wide range
of structural reforms in the areas of pensions, social assistance and health to secure the
sustainability of the public finances and to protect fiscal space needed for strategic infrastructure
and human capital investments. The Government’s plans for fiscal adjustments are discussed in
detail in Section III.
USD,
bln
Share of
total debt
% of
GDP
Monetary authorities 5.0 1.6 1.0
General government 115.2 35.8 22.4
Banks 66.0 20.5 12.9
Other sectors 135.7 42.1 26.4
of which intercomp.lending 73.7 22.9 14.3
Total external debt 321.9 100.0 62.7
long-term 249.8 77.6 48.6
short-term 72.1 22.4 14.0
40
45
50
55
60
65
70
75
2008 2009 2010 2011 2012 2013 2014 2015
Baseline Interest rate Growth Current Account
2010 2011 2012 2013 2014
Est.
Financing requirements 72,867 53,719 55,923 68,636 73,543
Current account deficit 21,873 19,798 20,343 23,687 25,506
Medium and long term debt amortizations 35,860 27,039 27,407 32,766 36,179
Change in reserves 15,134 6,882 8,172 12,183 11,858
Financing sources 72,867 53,719 55,923 68,636 73,543
EU funds 8,620 11,068 10,293 10,711 10,716
Private investment (net) 10,355 11,363 12,373 13,465 14,565
Medium and long term disbursements 59,776 37,684 29,961 41,158 44,383
Other capital flows incl. errors and ommissions -5,884 -6,397 3,295 3,302 3,879
Gross External Debt (% of GDP) 67.2 62.7 69.1 67.1 67.6
Projected
9
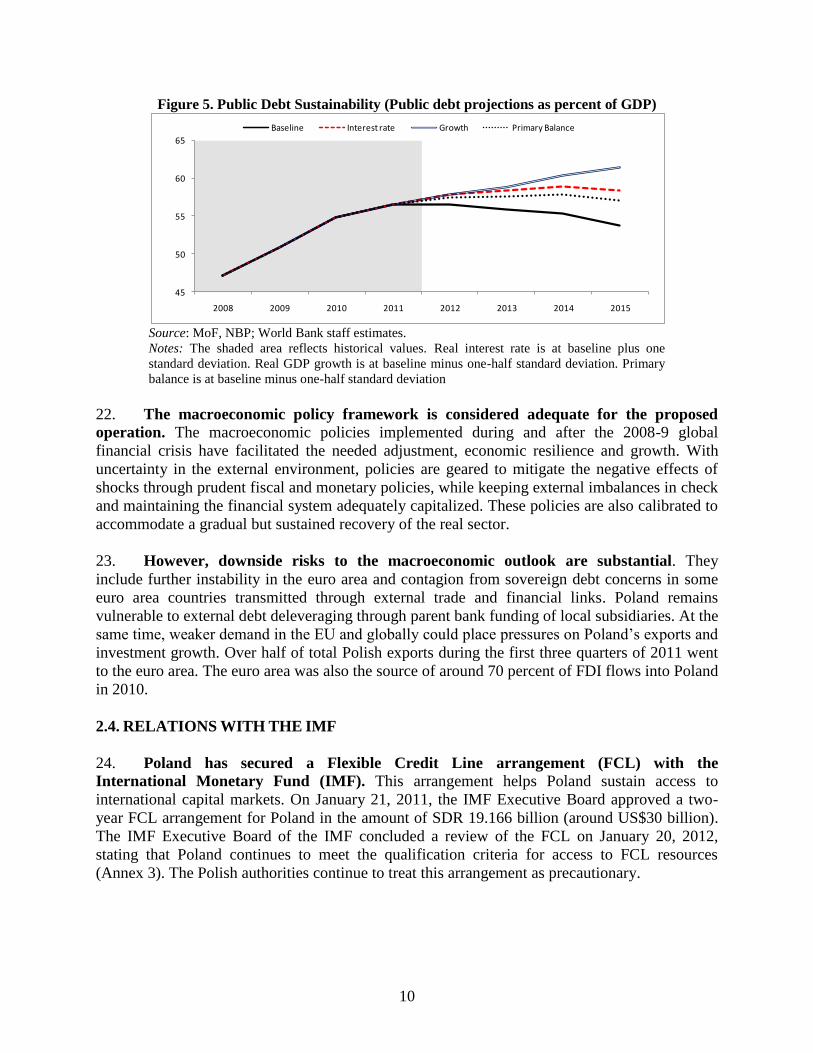
Table 4. Fiscal Developments and Prospects 2007-2014 (percent of GDP unless otherwise indicated, ESA’95, General Government)
Source: MoF; World Bank staff estimates, Convergence Program Update 2012.
Notes: Data for 2011 are estimates, based on actual data available by end - April 2012.
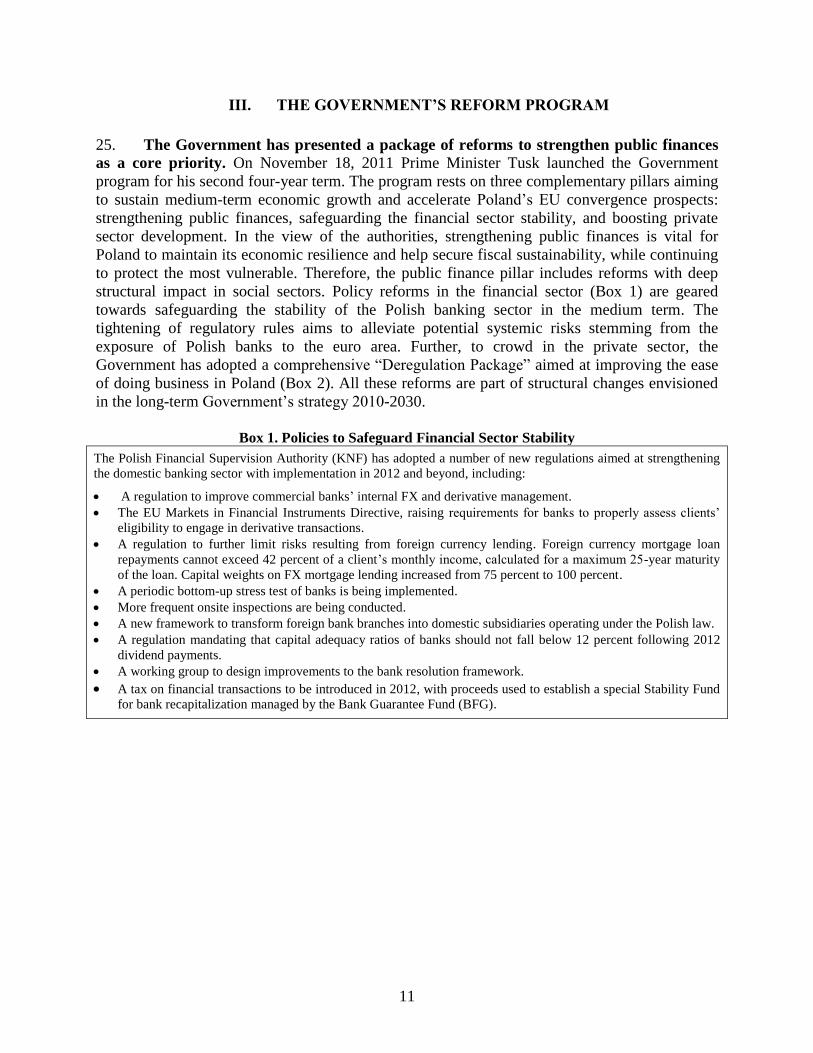
21. Public debt is expected to peak in 2012 and then decline. Fiscal consolidation,
together with better fiscal institutions, public sector cash management and stepped-up
privatization plans, will help to reduce public debt levels. According to the ESA’95
methodology, public debt is projected to stabilize at around 57 percent of GDP in 2011-12 and
then start a steady decline to close to 55 percent by the end of 2014. This would ensure that
Poland’s public debt remains below the Maastricht ceiling of 60 percent of GDP (as calculated
according to ESA’95 methodology) and the key national debt threshold/limit of 55 percent of
GDP (as calculated according to national methodology).7 Stress tests suggest that the debt path is
highly sensitive to a growth shock8, which might put the level of public debt slightly above the
EU threshold of 60 percent of GDP (Figure 5).
7 The Public Finance Act prompts corrective action when the public debt reaches 55 percent of GDP, in addition to
the constitutional ceiling for public debt at 60 percent of GDP. 8 In this scenario real GDP growth rate is at baseline minus 2 percentage points in each year of the projection period.
2007 2008 2009 2010 2011 2012 2013 2014
Est.
Revenues 40.3 39.5 37.2 37.5 38.5 39.6 38.7 37.9
Taxes 22.7 22.8 20.2 20.5 20.7 21.0 21.1 20.6
Social security contributions 12.0 11.3 11.3 11.1 11.4 12.3 12.5 12.6
Other 5.6 5.4 5.7 5.9 6.4 6.3 5.1 4.7
Expenditures 42.2 43.2 44.5 45.4 43.6 42.9 41.1 40.0
Current expenditures 37.4 37.7 38.4 39.1 37.0 36.5 34.9 34.1
o/w interest payments 2.3 2.2 2.6 2.7 2.8 2.6 2.5 2.5
Capital expenditures 4.8 5.5 6.1 6.3 6.6 6.4 6.2 5.9
Balance
Overall -1.9 -3.7 -7.3 -7.9 -5.1 -3.3 -2.4 -2.1
o/w primary 0.4 -1.5 -4.7 -5.2 -2.3 -0.7 0.1 0.4
Projected
10
Figure 5. Public Debt Sustainability (Public debt projections as percent of GDP)
Source: MoF, NBP; World Bank staff estimates.
Notes: The shaded area reflects historical values. Real interest rate is at baseline plus one
standard deviation. Real GDP growth is at baseline minus one-half standard deviation. Primary
balance is at baseline minus one-half standard deviation
22. The macroeconomic policy framework is considered adequate for the proposed
operation. The macroeconomic policies implemented during and after the 2008-9 global
financial crisis have facilitated the needed adjustment, economic resilience and growth. With
uncertainty in the external environment, policies are geared to mitigate the negative effects of
shocks through prudent fiscal and monetary policies, while keeping external imbalances in check
and maintaining the financial system adequately capitalized. These policies are also calibrated to
accommodate a gradual but sustained recovery of the real sector.
23. However, downside risks to the macroeconomic outlook are substantial. They
include further instability in the euro area and contagion from sovereign debt concerns in some
euro area countries transmitted through external trade and financial links. Poland remains
vulnerable to external debt deleveraging through parent bank funding of local subsidiaries. At the
same time, weaker demand in the EU and globally could place pressures on Poland’s exports and
investment growth. Over half of total Polish exports during the first three quarters of 2011 went
to the euro area. The euro area was also the source of around 70 percent of FDI flows into Poland
in 2010.
2.4. RELATIONS WITH THE IMF
24. Poland has secured a Flexible Credit Line arrangement (FCL) with the
International Monetary Fund (IMF). This arrangement helps Poland sustain access to
international capital markets. On January 21, 2011, the IMF Executive Board approved a two-
year FCL arrangement for Poland in the amount of SDR 19.166 billion (around US$30 billion).
The IMF Executive Board of the IMF concluded a review of the FCL on January 20, 2012,
stating that Poland continues to meet the qualification criteria for access to FCL resources
(Annex 3). The Polish authorities continue to treat this arrangement as precautionary.
45
50
55
60
65
2008 2009 2010 2011 2012 2013 2014 2015
Baseline Interest rate Growth Primary Balance
11
III. THE GOVERNMENT’S REFORM PROGRAM
25. The Government has presented a package of reforms to strengthen public finances
as a core priority. On November 18, 2011 Prime Minister Tusk launched the Government
program for his second four-year term. The program rests on three complementary pillars aiming
to sustain medium-term economic growth and accelerate Poland’s EU convergence prospects:
strengthening public finances, safeguarding the financial sector stability, and boosting private
sector development. In the view of the authorities, strengthening public finances is vital for
Poland to maintain its economic resilience and help secure fiscal sustainability, while continuing
to protect the most vulnerable. Therefore, the public finance pillar includes reforms with deep
structural impact in social sectors. Policy reforms in the financial sector (Box 1) are geared
towards safeguarding the stability of the Polish banking sector in the medium term. The
tightening of regulatory rules aims to alleviate potential systemic risks stemming from the
exposure of Polish banks to the euro area. Further, to crowd in the private sector, the
Government has adopted a comprehensive ―Deregulation Package‖ aimed at improving the ease
of doing business in Poland (Box 2). All these reforms are part of structural changes envisioned
in the long-term Government’s strategy 2010-2030.
Box 1. Policies to Safeguard Financial Sector Stability
The Polish Financial Supervision Authority (KNF) has adopted a number of new regulations aimed at strengthening
the domestic banking sector with implementation in 2012 and beyond, including:
A regulation to improve commercial banks’ internal FX and derivative management.
The EU Markets in Financial Instruments Directive, raising requirements for banks to properly assess clients’
eligibility to engage in derivative transactions.
A regulation to further limit risks resulting from foreign currency lending. Foreign currency mortgage loan
repayments cannot exceed 42 percent of a client’s monthly income, calculated for a maximum 25-year maturity
of the loan. Capital weights on FX mortgage lending increased from 75 percent to 100 percent.
A periodic bottom-up stress test of banks is being implemented.
More frequent onsite inspections are being conducted.
A new framework to transform foreign bank branches into domestic subsidiaries operating under the Polish law.
A regulation mandating that capital adequacy ratios of banks should not fall below 12 percent following 2012
dividend payments.
A working group to design improvements to the bank resolution framework.
A tax on financial transactions to be introduced in 2012, with proceeds used to establish a special Stability Fund
for bank recapitalization managed by the Bank Guarantee Fund (BFG).
12
Box 2. Policies to Strengthen Private Sector Development
A comprehensive ―Deregulation Package‖ has been adopted by the Government aimed at improving the business
climate, with implementation in 2012 and beyond, including:
A new Bankruptcy and Reorganization Law to simplify court procedures and extend increasing rights to secured
creditors in businesses closures.
A second deregulation package, which entered into force in early 2012. Among other measures it: (i) abolishes
the costly requirement for companies to publish their financial reports; (ii) reduces the frequency with which
companies must inform their employees in writing about mandatory health and social insurance payments; (iii)
eases health and safety requirements accompanying the construction or adaptation of buildings; (iv) extends the
deadline for the submission of real estate tax declarations; (v) gives taxpayers the power to request general tax
interpretations from the MOF; and (vi) shortens the required period for storing past social insurance declarations
and notices from 10 to 5 years.
A 24-hour online registration of new limited liability companies, based on standard agreements and with no need
for notary authorization.
26. Reigning in the fiscal deficit and stabilizing debt dynamics through fiscal-structural
reforms are key priorities in the Government’s strategy. The authorities are focusing their
reform efforts on fiscal-structural agenda for at least three reasons:
Following the global financial crisis of 2008-09, markets pay increasing attention to fiscal
vulnerabilities, particularly as regards to sovereign debt. While government bond spreads in
the EU had a limited correlation with public debt prior to the crisis, bond spreads are now
closely tied with growth and pressures in sovereign debt. The public debt level in 2011 is
estimated to be at 53.5 percent of GDP (according to national methodology), that is, close to
Poland’s Public Finance Act threshold of 55 percent of GDP. Stabilizing and later reducing
public debt to maintain its favorable capital market access remains critical to Poland’s
medium-term growth. Moreover, public debt has to be reduced to keep public finances on a
solid footing to withstand future shocks.
Poland needs fiscal space to continue investments in infrastructure and human capital to
support growth while making social transfers sustainable for future generations. Post-crisis
growth is likely to remain weaker than before the global crisis. Moreover, in the coming
decade, the decline in the labor force due to population aging will drag growth and place
added fiscal pressure in pensions and social services. If deep reforms are not implemented,
these expenditures will reduce the fiscal space for investments critical to spur growth.
Public spending reached almost 44 percent of GDP in 2011. Reducing gradually the public
sector footprint in the economy would help to crowd in private sector growth.
27. The authorities have developed a plan to consolidate public finances and undertake
fiscal-structural reforms. The measures are structured around three broad objectives: (i) to
ensure a steady decline in the fiscal deficits and public debt; (ii) to strengthen fiscal institutions;
and (iii) to secure the sustainability of social spending in view of Poland’s demographic
challenge. The measures under these three areas would also help protecting fiscal space for
growth-enabling expenditures. The Government views these policies as not only a way to keep
Poland resilient in the face of adverse times, but also to improve the ability of the budget to
facilitate growth over the medium and long term.
13
3.1. CONSOLIDATING PUBLIC FINANCES
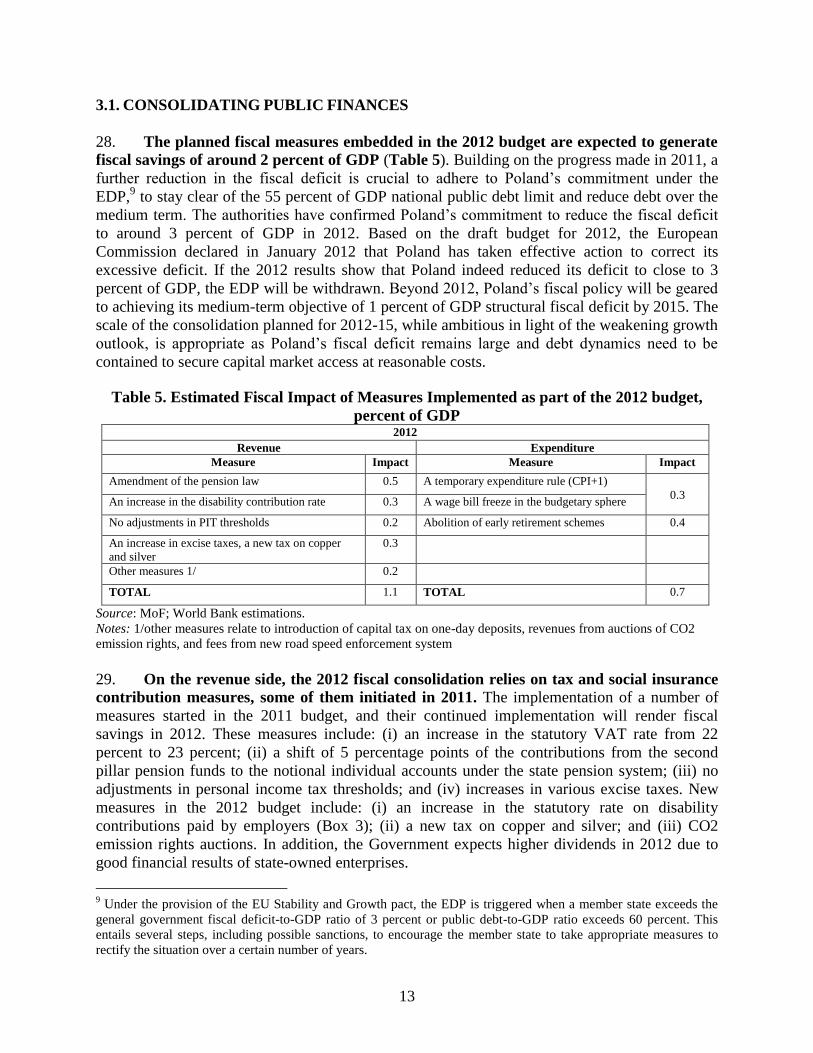
28. The planned fiscal measures embedded in the 2012 budget are expected to generate
fiscal savings of around 2 percent of GDP (Table 5). Building on the progress made in 2011, a
further reduction in the fiscal deficit is crucial to adhere to Poland’s commitment under the
EDP,9 to stay clear of the 55 percent of GDP national public debt limit and reduce debt over the
medium term. The authorities have confirmed Poland’s commitment to reduce the fiscal deficit
to around 3 percent of GDP in 2012. Based on the draft budget for 2012, the European
Commission declared in January 2012 that Poland has taken effective action to correct its
excessive deficit. If the 2012 results show that Poland indeed reduced its deficit to close to 3
percent of GDP, the EDP will be withdrawn. Beyond 2012, Poland’s fiscal policy will be geared
to achieving its medium-term objective of 1 percent of GDP structural fiscal deficit by 2015. The
scale of the consolidation planned for 2012-15, while ambitious in light of the weakening growth
outlook, is appropriate as Poland’s fiscal deficit remains large and debt dynamics need to be
contained to secure capital market access at reasonable costs.
Table 5. Estimated Fiscal Impact of Measures Implemented as part of the 2012 budget,
percent of GDP 2012
Revenue Expenditure
Measure Impact Measure Impact
Amendment of the pension law 0.5 A temporary expenditure rule (CPI+1)
0.3 An increase in the disability contribution rate 0.3 A wage bill freeze in the budgetary sphere
No adjustments in PIT thresholds 0.2 Abolition of early retirement schemes 0.4
An increase in excise taxes, a new tax on copper
and silver
0.3
Other measures 1/ 0.2
TOTAL 1.1 TOTAL 0.7
Source: MoF; World Bank estimations.
Notes: 1/other measures relate to introduction of capital tax on one-day deposits, revenues from auctions of CO2
emission rights, and fees from new road speed enforcement system
29. On the revenue side, the 2012 fiscal consolidation relies on tax and social insurance
contribution measures, some of them initiated in 2011. The implementation of a number of
measures started in the 2011 budget, and their continued implementation will render fiscal
savings in 2012. These measures include: (i) an increase in the statutory VAT rate from 22
percent to 23 percent; (ii) a shift of 5 percentage points of the contributions from the second
pillar pension funds to the notional individual accounts under the state pension system; (iii) no
adjustments in personal income tax thresholds; and (iv) increases in various excise taxes. New
measures in the 2012 budget include: (i) an increase in the statutory rate on disability
contributions paid by employers (Box 3); (ii) a new tax on copper and silver; and (iii) CO2
emission rights auctions. In addition, the Government expects higher dividends in 2012 due to
good financial results of state-owned enterprises.
9 Under the provision of the EU Stability and Growth pact, the EDP is triggered when a member state exceeds the
general government fiscal deficit-to-GDP ratio of 3 percent or public debt-to-GDP ratio exceeds 60 percent. This
entails several steps, including possible sanctions, to encourage the member state to take appropriate measures to
rectify the situation over a certain number of years.

14
Box 3. Disability Contribution Rates
Starting in 2012, the disability contribution rate has been increased by 2 percentage points—from 6 percent to 8
percent of gross wage. This fiscal measure is a partial correction of the large reduction in the disability contribution
rate that started in 2007, lowering that statutory rate from 13 percent to 6 percent. That initial reduction had the
objective of reducing the tax wedge in the country. However, while that reduction was a move in the right direction
and supported by the World Bank, the size of the reduction was too large, in particular in the context of the global
economic crisis and resulting fiscal pressures. The rate reduction moved the disability system from a close to
balanced position in 2007 to a deficit of 1.1 percent of GDP in 2011. With the increase in the contribution rate in
2012, the disability contributions will cover over 90 percent of paid benefits, compared to only 73 percent before
(prior to the reduction in the disability contribution rate in 2007, contributions covered 115 percent of paid benefits).
With this upward correction, Poland’s tax wedge (at 35 percent) will still remain below the EU average (39 percent)
and be the lowest among the EU10 countries, along with Bulgaria and Slovakia.
The authorities believe that the rate increase to 8 percent—still significantly below the pre-2007 level of 13
percent—would have a negligible effect on labor market outcomes. An important objective of the earlier disability
contributions rate reduction was the potential positive effect on labor markets. However, recent data suggests that
these rate reductions were not behind improvements in some labor market outcomes. For example, higher
employment participation rates among the elderly, which is driving improvements in aggregate labor participation,
increased from 29 percent in 2007 to 37 percent in 3Q 2011, mostly on the back of the phasing-out of early
retirement pensions schemes rather than on the reduction in tax wedge.
However, several structural and parametric issues of the disability insurance need to be addressed over the medium
term. Total expenditures of the disability fund are exceptionally high relative to other countries, where disability and
survivors can be covered by wage contributions of 2-3 percent. The relatively high disability contribution rate in
Poland can be explained by the following reasons. First, there is a very large stock of disabled pensioners. While
there have been significant improvements in the screening system and eligibility criteria for disability have been
tightened, the number of beneficiaries remains high. In addition, the current disability benefit formula (if
maintained) may create incentives for people to opt for disability rather than old-aged pensions, especially as old-
aged pension levels are expected to decline under the notional accounts formula. Second, there is hardly any outflow
from disability into the labor market. While 64.2 percent of beneficiaries have partial incapacity to work, they have
limited options for retraining and tend to stay in disability until they reach retirement age. Third, the generous
survivors’ pensions (at the level of 85 percent of spouses’ old-age pension compared to 60-70 percent in other
OECD countries) and the relatively low eligibility age (50 years, 10 years below the current statutory retirement age
for woman) tend to raise the expenditures of the disability fund.
30. On the expenditure side, the fiscal consolidation in 2012 is based on containment
measures. Overall, the plan envisages a gradual decline of the overall expenditure envelope in
2012-14. Similar to the revenue side, a number of measures were legislated and their
implementation started in the context of the 2011 budget, but their continued implementation
will render fiscal savings in 2012 (Table 5). They include: (i) the temporary ―CPI +1‖ rule that
limits the growth rate of discretionary expenditures to 1 percentage point over the CPI rate; (ii)
the phasing-out of early retirement schemes; and (iii) the nominal freeze of the wage bill in the
state budget, extended for the first time to include judges and prosecutors. The composition of
expenditure measures ensures that social safety nets remain adequate to protect the most
vulnerable.
15
3.2. STRENGTHENING FISCAL INSTITUTIONS
31. The Government is planning to introduce fiscal rules and budget reforms to ensure
a prudent fiscal stance over the medium term. By 2015, the Government aims to achieve a
structural fiscal deficit of 1 percent of GDP, in line with the medium-term objective (MTO) of
the EU Stability and Growth Pact. Once the MTO is achieved, the authorities plan to rely on a
permanent expenditure rule (to be enacted by 2013) to keep a prudent fiscal stance over the
medium and long term. In parallel, a sub-national fiscal rule is being established to facilitate
consolidation over the next three years, and thereafter to control local government finances. The
Government is also continuing to pursue reforms to strengthen the medium-term orientation of
the budget, legislate and implement program-based budgets and make public sector pay more
efficient.
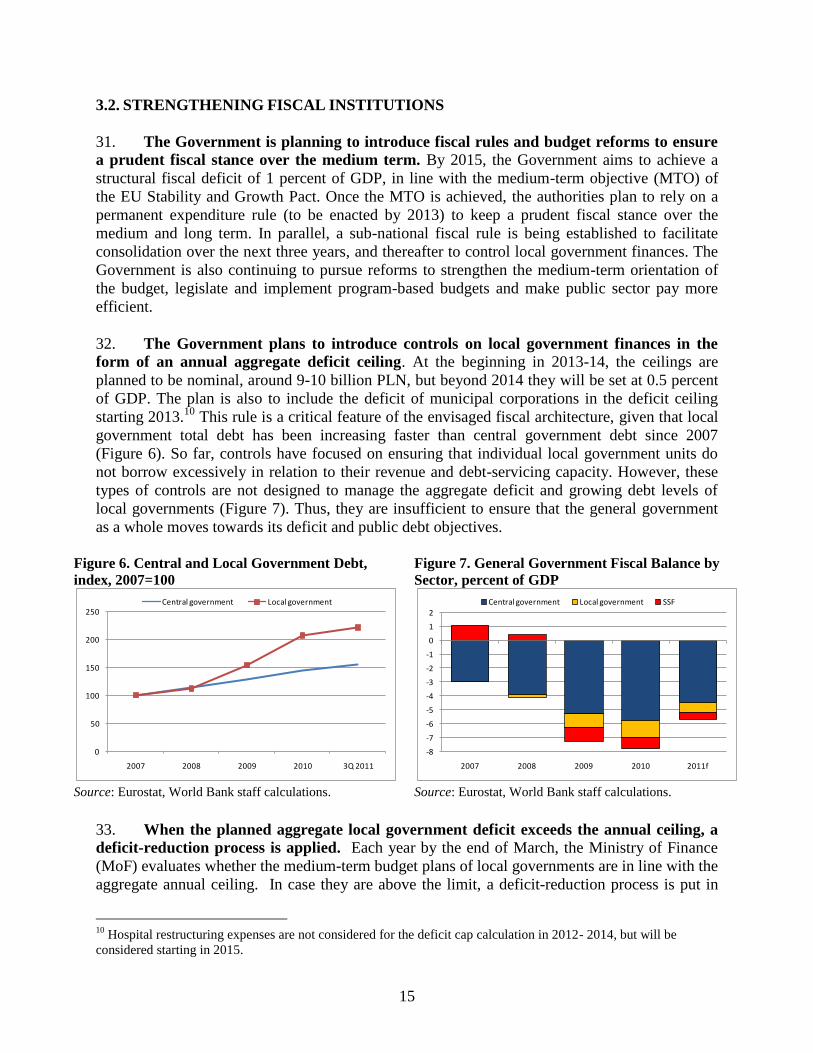
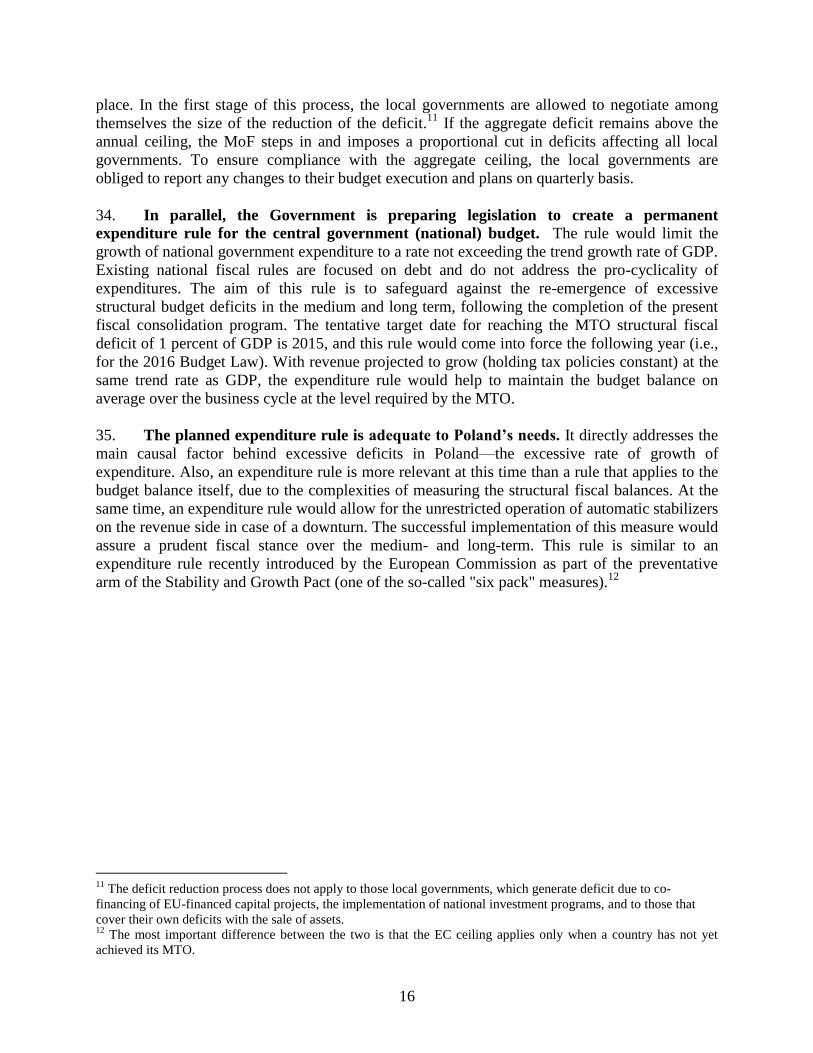
32. The Government plans to introduce controls on local government finances in the
form of an annual aggregate deficit ceiling. At the beginning in 2013-14, the ceilings are
planned to be nominal, around 9-10 billion PLN, but beyond 2014 they will be set at 0.5 percent
of GDP. The plan is also to include the deficit of municipal corporations in the deficit ceiling
starting 2013.10
This rule is a critical feature of the envisaged fiscal architecture, given that local
government total debt has been increasing faster than central government debt since 2007
(Figure 6). So far, controls have focused on ensuring that individual local government units do
not borrow excessively in relation to their revenue and debt-servicing capacity. However, these
types of controls are not designed to manage the aggregate deficit and growing debt levels of
local governments (Figure 7). Thus, they are insufficient to ensure that the general government
as a whole moves towards its deficit and public debt objectives.
Figure 6. Central and Local Government Debt,
index, 2007=100
Figure 7. General Government Fiscal Balance by
Sector, percent of GDP
Source: Eurostat, World Bank staff calculations. Source: Eurostat, World Bank staff calculations.
33. When the planned aggregate local government deficit exceeds the annual ceiling, a
deficit-reduction process is applied. Each year by the end of March, the Ministry of Finance
(MoF) evaluates whether the medium-term budget plans of local governments are in line with the
aggregate annual ceiling. In case they are above the limit, a deficit-reduction process is put in
10
Hospital restructuring expenses are not considered for the deficit cap calculation in 2012- 2014, but will be
considered starting in 2015.
0
50
100
150
200
250
2007 2008 2009 2010 3Q 2011
Central government Local government
-8
-7
-6
-5
-4
-3
-2
-1
0
1
2
2007 2008 2009 2010 2011f
Central government Local government SSF
16
place. In the first stage of this process, the local governments are allowed to negotiate among
themselves the size of the reduction of the deficit.11
If the aggregate deficit remains above the
annual ceiling, the MoF steps in and imposes a proportional cut in deficits affecting all local
governments. To ensure compliance with the aggregate ceiling, the local governments are
obliged to report any changes to their budget execution and plans on quarterly basis.
34. In parallel, the Government is preparing legislation to create a permanent
expenditure rule for the central government (national) budget. The rule would limit the
growth of national government expenditure to a rate not exceeding the trend growth rate of GDP.
Existing national fiscal rules are focused on debt and do not address the pro-cyclicality of
expenditures. The aim of this rule is to safeguard against the re-emergence of excessive
structural budget deficits in the medium and long term, following the completion of the present
fiscal consolidation program. The tentative target date for reaching the MTO structural fiscal
deficit of 1 percent of GDP is 2015, and this rule would come into force the following year (i.e.,
for the 2016 Budget Law). With revenue projected to grow (holding tax policies constant) at the
same trend rate as GDP, the expenditure rule would help to maintain the budget balance on
average over the business cycle at the level required by the MTO.
35. The planned expenditure rule is adequate to Poland’s needs. It directly addresses the
main causal factor behind excessive deficits in Poland—the excessive rate of growth of
expenditure. Also, an expenditure rule is more relevant at this time than a rule that applies to the
budget balance itself, due to the complexities of measuring the structural fiscal balances. At the
same time, an expenditure rule would allow for the unrestricted operation of automatic stabilizers
on the revenue side in case of a downturn. The successful implementation of this measure would
assure a prudent fiscal stance over the medium- and long-term. This rule is similar to an
expenditure rule recently introduced by the European Commission as part of the preventative
arm of the Stability and Growth Pact (one of the so-called "six pack" measures).12
11
The deficit reduction process does not apply to those local governments, which generate deficit due to co-
financing of EU-financed capital projects, the implementation of national investment programs, and to those that
cover their own deficits with the sale of assets. 12
The most important difference between the two is that the EC ceiling applies only when a country has not yet
achieved its MTO.
17
Box 4. Fiscal Rules in Poland
International experience with fiscal rules implementation has been mixed. In many cases fiscal rules have
had a positive impact on fiscal outcomes, particularly in countries with effective fiscal institutions and the
political will for successful implementation.13
However, some rules have resulted in pro-cyclical
tendencies. For example, strong revenues in cyclical upturns have enabled expenditures to grow more
rapidly within a nominal deficit limit. Nonetheless, numerical fiscal rules have generally played an
important role in containing spending and deficit biases by guiding or imposing constraints on
policymakers’ discretion. They are particularly effective when established by laws and higher level
legislation such as the Constitution.
Poland has had a positive experience with fiscal rules: fiscal rules, enshrined in the Constitution and the
Public Finance Act (PFA), have been effective in preventing the breach of debt limits. Poland's
Constitution sets an upper limit for public sector debt (based on a national definition) at 60 percent of
GDP. It prohibits both borrowing and the provision of guarantees that would exceed this limit. In
addition, the PFA sets two lower debt thresholds for national public sector debt, at 50 and 55 percent of
GDP. If the 50 percent threshold is exceeded in year (t – 1), the Parliament may not in year t approve a
budget for the following year (t + 1) with a central government budget deficit/revenue ratio that is higher
than the deficit/revenue ratio in the approved budget for year t. If the 55 percent threshold is exceeded, the
budget for year (t + 1) must be balanced or provide for a reduction of the central government debt to GDP
ratio as compared to t-1. The PFA also mandates deficit-reducing actions to be taken by local
governments. If the 55 percent limit for general government debt is exceeded, local governments may
generate a deficit only due to co-financing of EU funded projects. If the debt ratio exceeds 60 percent of
GDP, they are required to balance their budgets. The PFA sets also a temporary expenditure-based fiscal
rule (effective since 2010) that limits the annual growth rate of discretionary expenditure and newly
enacted mandatory spending to 1 percent above inflation. This temporary measure is planned to be in
force until the EDP procedure is abrogated.
As regards to local governments, the PFA lays out the following rules: (i) the debt of individual local
government units may not exceed 60 percent of its revenue (it does not cover debt issued for pre-
financing–bridge financing— projects co-financed from EU funds); (ii) the debt service (which includes
debt repayment plus interest paid and guarantees due in a current year) may not exceed 15 percent of the
local government revenue; (iii) local government units may not run current budget deficits; (iv) in
addition, starting in 2014, new borrowing will be regulated by the local governments’ capacity to service
debt (a debt-servicing ratio).
In addition to its own national rules, Poland is subject to the European Union's 60 percent of GDP debt
limit and 3 percent of GDP deficit limits, as according to ESA’95 methodology. The European Council
Regulation of 2011 allows to take into account the cost of systemic pension reform (in Poland’s case it
was above 0.6 percent of GDP in 2012) when assessing compliance with the Stability and Growth Pact.
36. The new permanent rule will also include a correction mechanism to reinforce the
link between the expenditure ceiling and the MTO.14
Under the correction mechanism, when
the actual budget balance differs from the MTO, the difference between the two will be added to
a "notional account", which will record the cumulative value of such deviations. If the amounts
added to the notional account exceed a defined threshold, equivalent automatic expenditure cuts
will be required. Similar to the new EU expenditure rule, the Polish permanent expenditure rule
13
For a recent review of international experience with fiscal rules, see IMF. 2009. ―Fiscal Rules—Anchoring
Expectations for Sustainable Public Finances‖, at http://www.imf.org/external/np/pp/eng/2009/121609.pdf 14
This correction mechanism is similar to the Swiss "debt brake" and to a mechanism that operates under the
German balanced budget rule.
18
is intended to apply to expenditures net of discretionary measures on the revenue side.15
Unlike
the EU rule, the Polish fiscal rule will cover essentially all national government expenditure
(including spending on unemployment benefits and interest payments), other than EU-funded
capital expenditure.16
Because the rule is to be enshrined in legislation it can be expected to raise
the political and market access costs of non-compliance.
37. Beyond fiscal rules, Poland is committed to developing program-based budgeting.
An indicative performance budget—including a programmatic breakdown of expenditures,
program objectives and key performance indicators—has been presented to the Parliament for
information alongside the traditional annual budget since 2008. The coverage and details of this
indicative program budget have been gradually increased. The 2012 indicative budget covers the
whole central government. The aim of this has been to eliminate pure input and process
indicators and focus on output and outcome indicators. The Government’s plan over the medium
term is the implementation of a program-based budget where appropriations are also approved
by the Parliament, in parallel to the traditional budget. If the move to a program-based budget is
accompanied by appropriate supporting measures and information infrastructure (including
continued development of performance information, strengthening of budget preparation
processes and integrated information systems for policy making), it would help to improve the
efficiency of public expenditure in Poland.
38. Poland has also been taking steps towards medium-term budgeting. The
development of the Multi-Year State Financial Plan (MYSFP) is the most recent example. The
MYSFP is a four-year rolling fiscal plan presented to the Parliament that includes fiscal policy
goals, revenue and expenditure projections as well as deficit and debt projections. The
expenditure projections contained in the MYSFP represent indicative (as opposed to fixed)
ceilings for the ministries and other entities. The authorities plan to further strengthen this
process in tandem with the implementation of the fiscal rules.
39. Finally, the Government plans to proceed in the coming years with pay reforms in
the public sector. While Poland’s public sector is not large in regional comparison from a fiscal
or employment perspective, the system has a number of structural problems. The Government
has difficulties recruiting and retaining staff with adequate skills. The civil service population is
aging (which is raising salaries due to seniority payments), the pay is rigid, fragmented, non-
transparent and likely to be inequitable, and payroll administration is expensive and marked by
weak financial controls. In November 2011, the Government announced the creation of a new
Ministry of Public Administration and Digitalization. This ministry will be in charge of reforms
15
Thus if, for example, new tax measures were introduced that permanently increased government revenues by 1
percent of GDP, the maximum level of expenditure permitted by the expenditure rule would also increase by 1
percent of GDP. The same principle would apply in the opposite direction in the event of permanent tax cuts, which
is of particular importance in Poland given that in the longer term governments need to act to reduce Poland's
unduly high tax rates. 16
The inclusion of unemployment benefits is justified in the Polish case by the relatively short duration of benefit
eligibility, which is a key reason why expenditure-side automatic stabilizers are very small in Poland. The exclusion
of EU-funded capital expenditure reflects the fact that such capital expenditure adds neither to deficits nor debt, and
therefore has no bearing on the achievement of the MTO. Poland's own financial contribution ("co-financing") to
these projects—which does contribute to deficits and debt—will, appropriately, be covered by the expenditure rule.
19
to make public administration more efficient and to use modern technology to improve public
service delivery. These objectives are also central to the Government’s Vision 2030 strategy.
3.3. ADVANCING LONG-TERM FISCAL REFORMS
40. Strengthening public finances also requires initiating long-term structural reforms
to secure sustainability across sectors. The Government intends to focus on long-term reforms
to sustain current transfers (such as pensions) and public services (such as health care). It also
intends to pursue reforms to improve social safety nets and broaden the tax base by bringing to
the tax net income that so far has been under-taxed. These reforms tackle the aging demographic
profile of the country, with the working age population projected to shrink by about one-third
between 2010 and 2050.
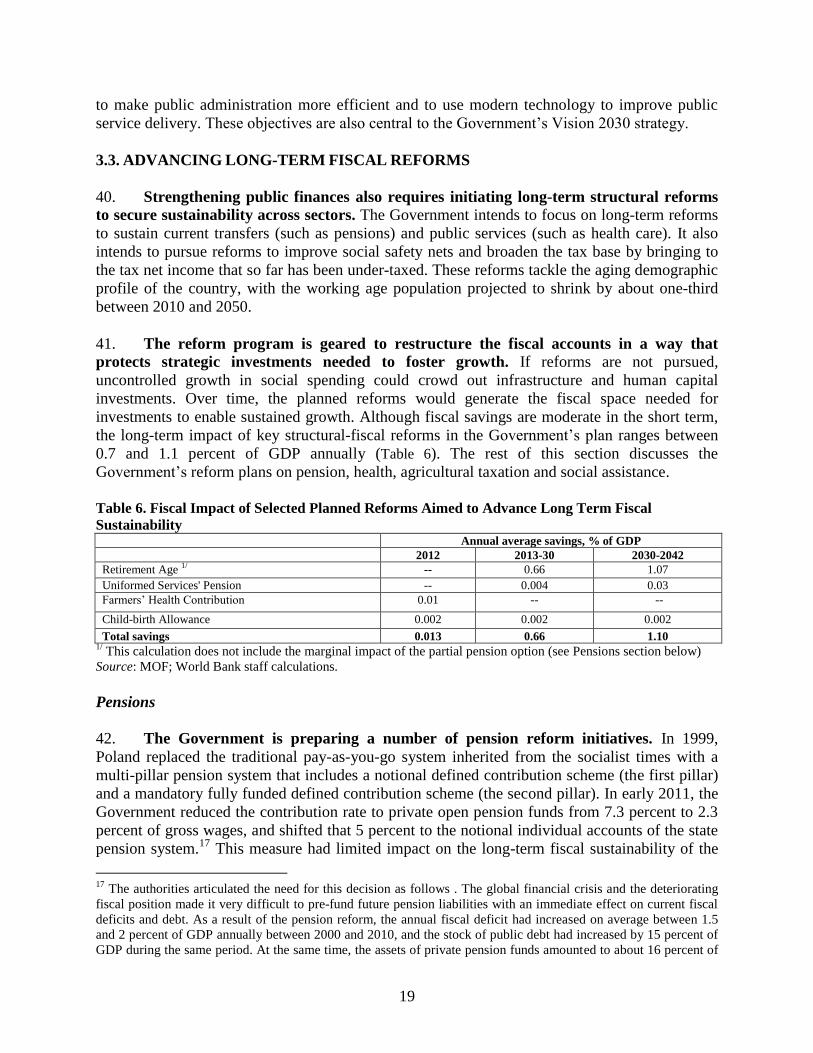
41. The reform program is geared to restructure the fiscal accounts in a way that
protects strategic investments needed to foster growth. If reforms are not pursued,
uncontrolled growth in social spending could crowd out infrastructure and human capital
investments. Over time, the planned reforms would generate the fiscal space needed for
investments to enable sustained growth. Although fiscal savings are moderate in the short term,
the long-term impact of key structural-fiscal reforms in the Government’s plan ranges between
0.7 and 1.1 percent of GDP annually (Table 6). The rest of this section discusses the
Government’s reform plans on pension, health, agricultural taxation and social assistance.
Table 6. Fiscal Impact of Selected Planned Reforms Aimed to Advance Long Term Fiscal
Sustainability Annual average savings, % of GDP
2012 2013-30 2030-2042
Retirement Age 1/ -- 0.66 1.07
Uniformed Services' Pension -- 0.004 0.03
Farmers’ Health Contribution 0.01 -- --
Child-birth Allowance 0.002 0.002 0.002
Total savings 0.013 0.66 1.10 1/
This calculation does not include the marginal impact of the partial pension option (see Pensions section below)
Source: MOF; World Bank staff calculations.
Pensions
42. The Government is preparing a number of pension reform initiatives. In 1999,
Poland replaced the traditional pay-as-you-go system inherited from the socialist times with a
multi-pillar pension system that includes a notional defined contribution scheme (the first pillar)
and a mandatory fully funded defined contribution scheme (the second pillar). In early 2011, the
Government reduced the contribution rate to private open pension funds from 7.3 percent to 2.3
percent of gross wages, and shifted that 5 percent to the notional individual accounts of the state
pension system.17
This measure had limited impact on the long-term fiscal sustainability of the
17
The authorities articulated the need for this decision as follows . The global financial crisis and the deteriorating
fiscal position made it very difficult to pre-fund future pension liabilities with an immediate effect on current fiscal
deficits and debt. As a result of the pension reform, the annual fiscal deficit had increased on average between 1.5
and 2 percent of GDP annually between 2000 and 2010, and the stock of public debt had increased by 15 percent of
GDP during the same period. At the same time, the assets of private pension funds amounted to about 16 percent of
20
pension system given the nature of the notional account system, but significantly improved short-
and medium-term fiscal deficits. At the same time, it is estimated that this measure would
generate a future reduction in the expected pension benefit as percent of the average wage (i.e.,
the replacement rate). Nonetheless, this potential loss would be more than offset by the gain from
the retirement age increase reform being prepared now (Box 5). Also, the authorities plan to
increase the contribution to private open pension funds to 3.5 percent of gross wages in 2017. In
2012, the Government also provided a flat increase in pension benefits instead of an increase
proportional to the previous pension in an effort to raise the benefits of the lowest income
beneficiaries. The Government will revert to proportional indexation in 2013.
43. The Government plans to gradually increase the statutory retirement age for men
and women to 67 years old. Currently, retirement ages for women and men are 60 and 65,
respectively. Starting in 2013, the statutory retirement age will increase by one month every four
months (or three months per year). Following this gradual path, men will reach the retirement
age of 67 by the end of 2020 and women by the end of 2040. In addition, the Government plans
to introduce a partial pension retirement option available prior to the proposed statutory
retirement age, but with a large discount and tight qualification criteria. Men will have the option
to retire at 65 provided they have at least 40 years of contributions and women at 62 provided
they have 35 years of contributions. Moreover, the criteria also states that the amount of partial
pension benefit will be determined based on 50 percent of the accumulated pension capital.
Starting in 2013, the retirement age for farmers will also increase in line with the provisions in
the general scheme. Farmers with more than 30 years of contribution before December 2017 will
be able retire earlier (i.e., at the age of 55 for women and 60 for men). After 2017 retirement age
for all farmers will be fully in line with the retirement age under the general scheme.
44. The estimated impact of the gradual increase in the retirement age on the pension
system deficit is significant over the medium and long term (Table 6). The proposed
retirement age reforms are expected to generate fiscal savings between 0.7 and 1.1 percent of
GDP annually over the next 30 years. Moreover, the reforms are expected to improve the long-
term adequacy of pensions, especially for women (Box 5).
45. The Government is also preparing reforms to special pensions. A key reform in this
area is for the uniformed services pension scheme. A separate pension system covers the military
(under the Ministry of Defense) and police, border security, fire-fighting services and
government security (under the Ministry of Interior). The reform will institute a minimum
retirement age of 55 for these special pension groups instead of allowing them to retire after
completing the required years of service, regardless of age. The mandatory length of service for
these groups will also be increased from 15 to 25 years. Should an individual complete his/her 25
years before reaching age 55, he/she would still have to wait until reaching the new statutory
GDP by end-2010. In addition, private pension funds have high administrative costs and fees, little diversification in
investment profiles and lack of life-cycle portfolios.
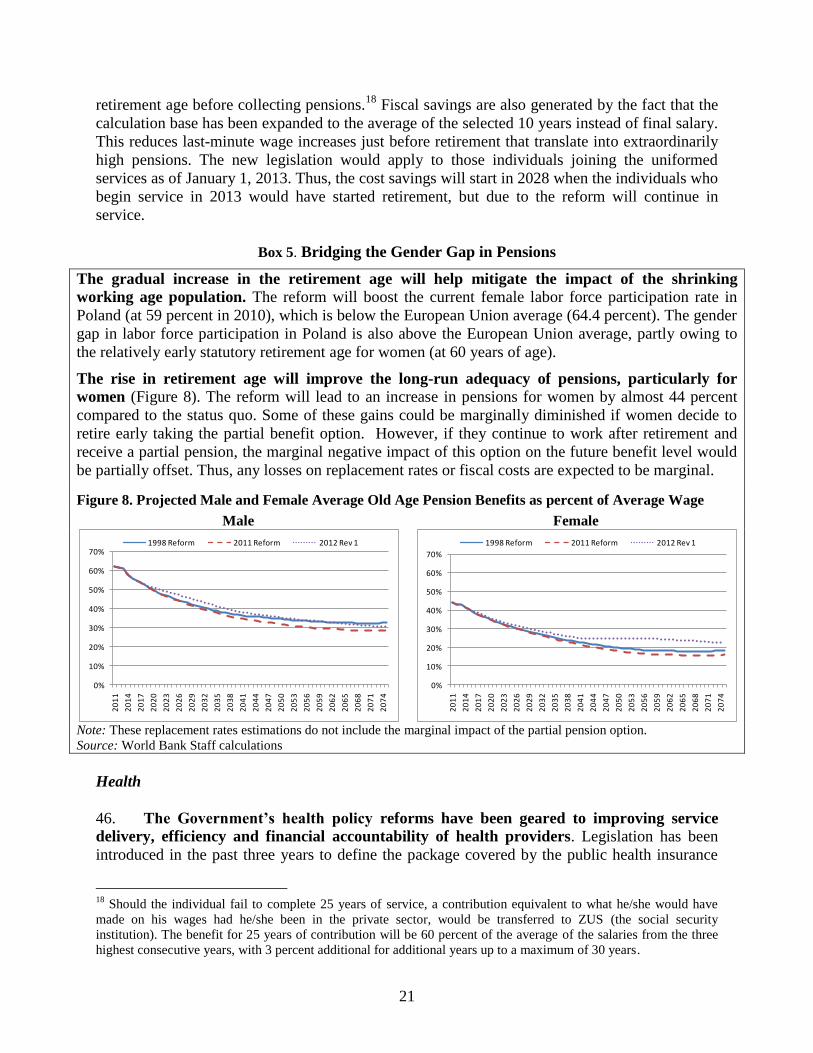
21
retirement age before collecting pensions.18
Fiscal savings are also generated by the fact that the
calculation base has been expanded to the average of the selected 10 years instead of final salary.
This reduces last-minute wage increases just before retirement that translate into extraordinarily
high pensions. The new legislation would apply to those individuals joining the uniformed
services as of January 1, 2013. Thus, the cost savings will start in 2028 when the individuals who
begin service in 2013 would have started retirement, but due to the reform will continue in
service.
Box 5. Bridging the Gender Gap in Pensions
The gradual increase in the retirement age will help mitigate the impact of the shrinking
working age population. The reform will boost the current female labor force participation rate in
Poland (at 59 percent in 2010), which is below the European Union average (64.4 percent). The gender
gap in labor force participation in Poland is also above the European Union average, partly owing to
the relatively early statutory retirement age for women (at 60 years of age).
The rise in retirement age will improve the long-run adequacy of pensions, particularly for
women (Figure 8). The reform will lead to an increase in pensions for women by almost 44 percent
compared to the status quo. Some of these gains could be marginally diminished if women decide to
retire early taking the partial benefit option. However, if they continue to work after retirement and
receive a partial pension, the marginal negative impact of this option on the future benefit level would
be partially offset. Thus, any losses on replacement rates or fiscal costs are expected to be marginal.
Figure 8. Projected Male and Female Average Old Age Pension Benefits as percent of Average Wage
Male Female
Note: These replacement rates estimations do not include the marginal impact of the partial pension option.
Source: World Bank Staff calculations
Health
46. The Government’s health policy reforms have been geared to improving service
delivery, efficiency and financial accountability of health providers. Legislation has been
introduced in the past three years to define the package covered by the public health insurance
18
Should the individual fail to complete 25 years of service, a contribution equivalent to what he/she would have
made on his wages had he/she been in the private sector, would be transferred to ZUS (the social security
institution). The benefit for 25 years of contribution will be 60 percent of the average of the salaries from the three
highest consecutive years, with 3 percent additional for additional years up to a maximum of 30 years.
0%
10%
20%
30%
40%
50%
60%
70%
20
11
20
14
20
17
20
20
20
23
20
26
20
29
20
32
20
35
20
38
20
41
20
44
20
47
20
50
20
53
20
56
20
59
20
62
20
65
20
68
20
71
20
74
1998 Reform 2011 Reform 2012 Rev 1
0%
10%
20%
30%
40%
50%
60%
70%
20
11
20
14
20
17
20
20
20
23
20
26
20
29
20
32
20
35
20
38
20
41
20
44
20
47
20
50
20
53
20
56
20
59
20
62
20
65
20
68
20
71
20
74
1998 Reform 2011 Reform 2012 Rev 1
22
(2009), strengthen patients’ rights (2009) and improve information systems (2011). Current
efforts are geared towards the hospital system, for which restructuring and modernization are
incomplete. The Government intends to strengthen the financial accountability of hospital
owners and expand information available to the health insurance fund to purchase care
efficiently and thus contain costs.
47. Despite progress in rationalizing the system, hospitals have been a large source of
inefficiency and hidden deficits. Poland still has relatively large supply side inefficiencies. For
example, it had 665 hospital beds per 100,000 inhabitants in 2010, whereas the average for the
EU15 countries was 531. A key manifestation of inefficiency has been the accumulation of debt
and debt arrears by public hospitals owned by various entities (mostly local governments and
public universities). Arrears amount to a quarter of the overall hospital debt, which in turn
represents around 0.7 percent of GDP. The management of the debt of autonomous yet public
hospitals, for which no one is genuinely accountable, has been a perennial concern for successive
governments. In 2009, the Government started tackling the issue through a phased program to
increase financial and performance accountability of the public owners of hospitals. Through
―Plan B‖, the Government opened the possibility for public hospital owners to transform
hospitals into entities operating under commercial law with state support for repayment of part of
hospital debt. This is expected to ensure that hospital arrears are treated as those of any
commercial enterprise that faces the possibility of bankruptcy if it cannot pay its bills. Under the
first phase of this program, which concluded in December 2011, this corporatization was
undertaken on a voluntary basis and incentives were provided in the form of public debt relief.
48. The Law on Therapeutic Activities addresses the issue of hospital deficits. This law
will expand the scope of the corporatization scheme and further increase the accountability of
hospital owners for the financial results of their facilities. As of 2012, all hospital owners must
cover any deficit incurred within three months of the end of a fiscal year. Hospitals (and their
owners) that choose to not address their deficit problems are required by this law to initiate, and
complete within 12 months, a corporatization or a liquidation process during which the existing
debt of the facility will be absorbed and/or restructured. In case of a transformation, the newly
created entity’s debt must not represent more than 50 percent of its revenues. To support the
process, a public debt relief plan of 1.4 billion PLN is available on a first-come first-serve basis
until the end of 2013. Irrespective of the number of corporatizations that ultimately happen, the
law ensures that the management of hospital debts and arrears will be more responsible.
Authorities plan to implement this policy while safeguarding access to health facilities across the
country.
49. The Government is also planning to establish a tariff agency to adequately price
procedures and contain excessive costs. When the majority of health providers are
autonomous, the entity that purchases care on behalf of the insured in Poland, the National
Health Fund (NFZ), needs tools to steer the system and provide the right incentives. Payments
that bundle services for given episodes of treatment, such as diagnosis-related groups (DRGs),
incentivize providers to combine resources efficiently. Poland introduced DRGs in the hospital
sector in 2008 and in the ambulatory sector in 2011. However, to be effective DRGs need to be
economically homogenous and fair. The Health Insurance Fund has put in place ad-hoc
mechanisms to correct some of the most obvious biases, but the system is in need of efficiency
23
improvements that would also help to contain costs. The Ministry of Health (MOH) has
developed draft legislation that would create and empower a tariff agency to remedy this issue.
Through this agency, the evidence base for the Health Insurance Fund to elaborate tariffs would
expand, and consequently the efficiency of the use of public funds in the system. The passing
and implementation of this legislation would also help to pave the way to performance-based
payments. In preparation for the implementation of this legislation, the Ministry has developed
an accounting system for healthcare providers and is training providers. The Ministry has also
started the analysis of providers’ cost-reporting systems and the costing model for the Agency.
Reforms in Social Insurance Contribution (including Health Insurance) and Taxation of
Farmers
50. The Government has started reforms to the special social security system for
farmers to improve its financial sustainability. This system, administered by the Farmers’
Social Insurance Fund (KRUS), covers pension, healthcare, disability and other benefits. It is an
unfunded defined benefit scheme, with no correspondence between the size of paid contributions
and the level of benefits. The gap between benefits and contributions is financed by subsidies
from the state budget that cover around 90 percent of KRUS’s expenditure and amount to 1.2
percent of GDP. In February 2012, the Government stopped subsidies for and started collecting
health insurance contributions for farmers with landholdings above six hectares.
51. The Government plans to reform the taxation of the agriculture sector. In the
coming years, the aim is to link farmers’ tax and social contribution payments with their
incomes. Agriculture in Poland is taxed through a presumptive norm-based levy on land. All
farmers pay local property taxes, including agricultural land tax and forestry tax. Incomes of
individual farmers are generally exempt from personal income tax, with the exception of
incomes from special agricultural productions and of farms registered as companies (subject to
corporate income tax). The Government intends to gradually phase in a regular income
accounting of farmers. This will enable to subsequently move to a system of regular taxation and
social contributions in the agriculture sector based on income.
Social Assistance
52. In 2010, Poland spent 1.3 percent of GDP on family and children social assistance
programs19
. According to the 2010 Household Budget Survey (HBS), only two-thirds of the
poor (defined as those in the poorest quintile based on pre-transfer per capita consumption) were
receiving at least one social assistance benefit. Coverage of benefits explicitly targeted at the
poor varies between a relatively good coverage for family benefits, which cover about half of the
poorest quintile, to low coverage for the minimum income programs (social assistance benefit),
which only reach 19 percent of the poor. The generosity of these benefits is limited, accounting
for just 16.7 and 27.5 percent of the post-transfer consumption of the poor, respectively.
53. The Government plans to strengthen the targeting of the child-birth allowance
benefit. A universal child-birth allowance in the form of a PLN 1,000 lump-sum payment per
child has been available since 2006. This payment is part of the legislation on family benefits
19
According to the general government expenditure by function (COFOG), function GF1004 -family and children.

24
and its overall cost is moderate. The benefit can be supplemented with further benefits at the
local government (gmina) level. The Government proposes restricting eligibility for the child-
birth allowance to families whose income per capita is below PLN 1,922, which is equivalent to
the income-tax threshold of PLN 85,000 per year. This measure takes away the benefit from the
highest income earners and keeps the status quo for the rest. Partially re-targeting this program
would free up resources for strengthening or maintaining spending in other areas without
affecting low-income earners.
54. The Government also plans to improve the coverage of the last-resort minimum-
income social assistance benefits for the poorest. The Government foresees raising the
applicable income thresholds for social assistance minimum-income and family benefits in
November 2012 to increase benefit levels and coverage. The income thresholds used for
calculating entitlements to social assistance minimum-income and family benefits have not been
increased since 2006 and 2004, respectively, and beneficiary incomes are low, both by national
and by international standards. Families in Poland who receive only the social assistance
minimum-income benefits have one of the lowest income levels in the OECD. For all types of
households (except for singles), the mandated income threshold is currently also below the
subsistence minimum. The low-income thresholds partly explain the very low coverage of the
poorest by these benefits. At the same time, the targeting of minimum income benefits is good,
with 81 percent of all benefits going to the poorest quintile. Raising income thresholds and
benefits level for the minimum-income benefit would result in more effective protection for poor
households.
55. To further improve targeting of social assistance programs, the benefit for care-
givers of disabled dependants will become partially income-tested. The benefit supports
people who do not work in order to care for a disabled dependant (a child or a severely disabled
adult). The benefit amounts to PLN 520 per month, and currently the benefit is not conditional
on income. The number of people claiming the care-giver benefit has roughly doubled since the
beginning of 2009 (from around 67,900 to 161,400 recipients), while the number of disabled has
remained largely unchanged. Therefore, the Government intends to strengthen the eligibility
criteria. Those recipients who are not taking care of disabled children but disabled adults will
become subject to a household income threshold . The objective of this change is to improve
targeting by limiting entitlements to families of disabled individuals with relatively high income.
Depending on the income threshold, the planned introduction of an income criterion can be
expected to save around PLN 340 million in 2012, PLN 1.12 billion in 2013 and PLN 1.39
billion in 2014, which could finance an increase in minimum-income social assistance benefits.
56. A marginal re-targeting of the Child Tax Credit (CTC) is planned for 2013. The
Government plans to introduce legislation in 2012 that would stop the benefit for some high-
income families (those with one child earning more than PLN 85,000). At the same time, CTC
amounts per child would be made more generous for the third and further children, regardless of
family income. The proposed measure essentially redistributes from high-income to middle-
income families without impacting the poor. Because low-income working families pay little
income tax, they would not have a net positive increment in the benefit of the revised CTC. Over
the medium term, this tax expenditure could be re-evaluated to make a more efficient use of the
resources.
25
3.4. CONSULTATIONS
57. All legislative measures and reforms in Poland are subject to a thorough
consultation process with social partners, civil society and groups likely to be impacted. The
consultation process is an important institutional feature of Poland’s process of government.
Public consultations are compulsory by law for all new policy initiatives. According to the
regulatory guidelines for this process,20
stakeholders need to be involved throughout the policy-
making and legislation preparation processes. The Government uses various methods to consult
the public, including public hearings and meetings, citizen’s panels, surveys, consultations
through electronic means (e.g., government websites) and media. In addition, the rules on public
consultation set the minimum period for inter-ministerial consultations of 21 days and for
external consultations with the public of 30 days. Regular legislative procedures ensure careful
scrutiny during consideration by Parliament, and hearings and debate in Parliament receive large
coverage by the news media.
58. The authorities have consulted with a wide range of stakeholders on the specific
measures supported by this programmatic DPL series. In particular, on the measures related
to structural changes in social transfers, the authorities held consultations with a wide range of
social partners, civil society and affected groups. In addition, changes to the retirement age and
family support have been discussed in the ―forum for public debate‖ established by the
Presidential Administration. Regular updates to the process are posted in government websites.
59. Specific examples of social sector consultations concerning measures supported by
this DPL include:
Amendments to the pension law to increase statutory retirement age have been widely
debated and consulted with trade unions, employer organizations, women's organizations,
farmers’ unions, the tripartite committee21
as well as with NGOs and think tanks. The
consultation was extended beyond the period provided by the guidelines to more than two
months. Inputs of this consultation are being reflected in the final draft of the
amendments.
Amendments to the pension legislation on uniformed services were submitted for public
consultations on January 10, 2011. Within 30 days of public consultations, around 260
comments were received, most from unions.
A draft of the amendment to Public Finance Law introducing a cap on the sub-national
deficit was consulted with the different associations of local governments, the tri-party
committee between late December 2011 and March 2012. The draft was discussed at the
meeting with the presence of local governments and the tripartite committee on March
26, 2012.
20
The Ministry of Economy has developed guidelines called Principles of Consultations Carried out upon
Preparation of Government Documents. 21
Tripartite Commission (Komisja Trójstronna) was established as a forum for national social dialogue in 1994,
under a 'State Enterprise Pact'. It includes representatives of the trade unions, employers and the Government.
26
IV. BANK SUPPORT TO THE GOVERNMENT’S PROGRAM
4.1. LINK TO THE COUNTRY PARTNERSHIP STRATEGY
60. The proposed DPL series is central to the Bank’s engagement in Poland, as
emphasized in the 2009-13 Country Partnership Strategy Progress Report (CPSPR). The
CPSPR—discussed by the Board on June 7, 2011—highlights that fiscal consolidation is among
Poland’s main economic policy challenges, and states that this process has to be supported by
further improvements to fiscal institutions and structural reforms to help secure sustainability in
social programs. The CPSPR tasks the strategic policy dialogue between the Bank and the
authorities in these areas to the DPL series.
61. The public finance reforms supported by the DPL series and their expected
outcomes are fully aligned with the current CPS. The Bank’s strategic partnership with
Poland is based on four pillars: (i) Social and Spatial Inclusion; (ii) Public Sector Reform; (iii)
Growth and Competitiveness; and (iv) Regional and Global Public Goods. It is also organized
around three themes: (i) Making Europe work for Poland; (ii) Policy Reform for Europe 2020
and Convergence; and (iii) Complementing the EU Agenda. The public finance reforms
supported by the DPL series are central elements of the first three pillars of the CPS, and to the
second and third policy themes. The outcomes expected under the DPL series are aligned with
those envisaged by the CPS, including fiscal consolidation, strengthened fiscal institutions, and
fiscally sustainable transfers and social spending.
4.2. COLLABORATION WITH THE IMF AND THE EUROPEAN COMMISSION
62. The Bank has collaborated closely with the IMF and the European Commission
(EC) on this program. The staff of the Bank and the Fund collaborated closely, with exchanges
on macroeconomic, fiscal and structural reforms. The measures under the proposed DPL
program have been discussed with both the IMF and the EC to ensure that they reinforce and
complement their support to Poland. Since May 2009, the IMF has supported Poland through
FCL arrangements. The new FCL for around US$30 billion was approved in January 2011 for a
period of two years. The IMF Board of Executive Directors concluded a review of the
arrangement in January 2012 (see Section 2.4).
4.3. RELATIONSHIP TO OTHER BANK OPERATIONS
63. The current DPL series is a natural continuation of the IBRD’s prior lending
engagement in Poland. The DPL program series of 2008-10 charted a first stage of the current
policy engagement with the authorities in the area of public finances. That program supported
reform efforts to: (i) start addressing challenges related to securing the long-term fiscal
sustainability of the pension system; (ii) improve the incentives for better economic and medical
performance of health care providers; and (iii) strengthen the social assistance system to protect
the most vulnerable. In addition, the current operation builds on the policy support under the
Post-Accession Rural Support Project (PARSP, approved by the Bank in 2005), which provided
assistance to 500 rural gminas to enhance the capacity of local governments to identify, plan and
27
execute social protection strategies and monitor the use of resources and social transfers. In
2006, the Bank provided support to the agricultural insurance fund (KRUS) reform to strengthen
its administrative and analytic capacities, management and decision-making processes.
64. The proposed programmatic DPL constitutes the bulk of new lending in the later
years of the CPS. In addition, a project is being considered to provide long-term financing in
support of local governments’ development strategies.
4.4. ANALYTICAL UNDERPINNINGS
65. The Bank has undertaken extensive analytical work underpinning the policy areas
and prior actions covered by the proposed operation. In 2010, the Bank published the first
Public Expenditure Review (PER) since Poland’s accession to the EU. This report provides a
comprehensive assessment of fiscal policy, fiscal institutions, and social spending. Several of
the reforms supported by this operation were informed by the PER recommendations and the
subsequent policy dialogue around it. As part of the regular macroeconomic monitoring, the
Bank team discusses macroeconomic and fiscal policies in a comparative regional perspective in
the EU New Member States Regular Economic Reports (RERs). These reports have highlighted
the need for a gradual fiscal consolidation process in the country. In 2010, the Bank team also
completed a sub-national PER on the Mazowieckie voivodship, highlighting the fiscal pressures
on local governments’ budgets, which are directly connected to the needed fiscal controls and
fiscal reforms supported by this operation, including in the area of health care. The Bank is also
finalizing a regional study that focuses on lessons learned on fiscal consolidation and social
sector reform, including on pensions. The Bank recently collaborated with the MOF on the first
ever tax expenditure report in Poland, that provides analytical support to the proposed measures
on social contributions and taxation of the agriculture sector. Table 7 contains a detailed account
of AAA activities between 2009 and 2012 and their linkages to prior actions supported by this
operation.
66. The Bank’s policy dialogue, including in the context of this operation, has informed
the design of fiscal reforms. In the area of fiscal institutions, the Bank carried out expert
discussions and prepared policy notes with recommendations to enhance the design and
implementation of fiscal rules at the national and sub-national levels. In the area of pensions, the
Bank conducted in 2010 a workshop on the Bank’s pension simulation toolkit with the
Government to foster the dialogue on pension reform. In 2012, the Bank prepared a policy note
on social assistance related to in-work support through tax credits and cash benefits to improve
the targeting of safety net programs. The policy dialogue around this note is reflected in the prior
actions and expected outcomes on social assistance supported by this operation. In the area of
health care, the Bank conducted workshops on the fiscal implications of demographic changes on
long-term care in Poland.
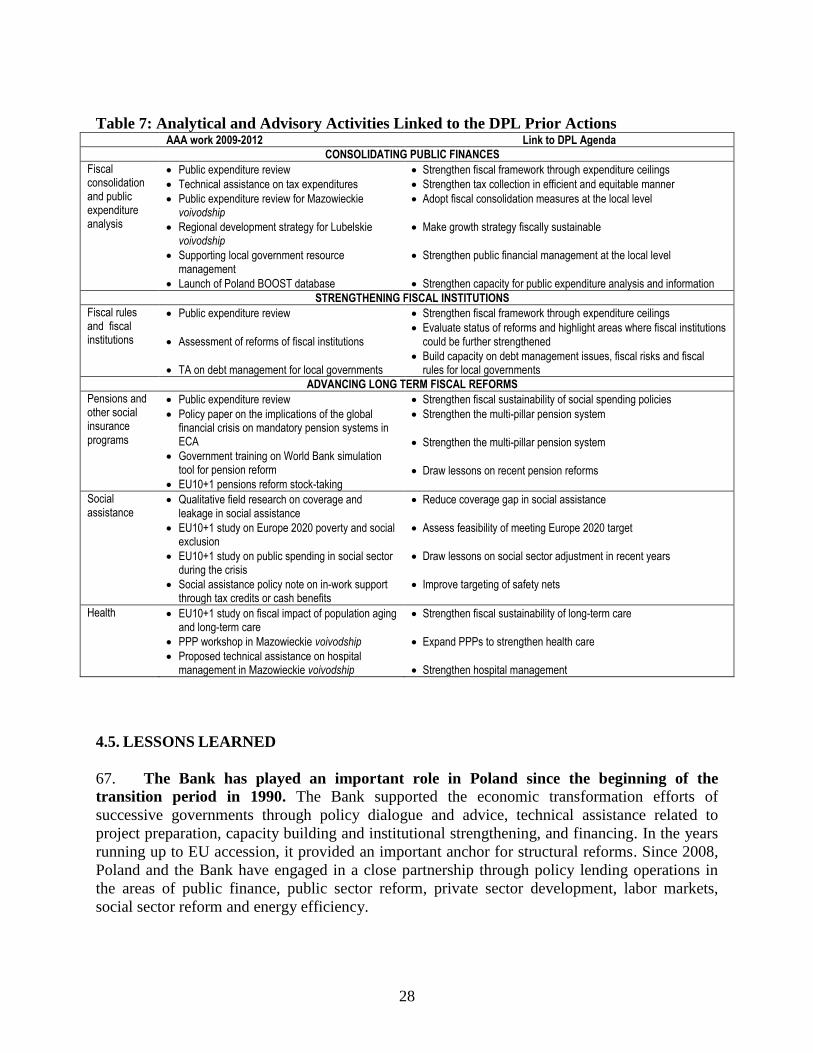
28
Table 7: Analytical and Advisory Activities Linked to the DPL Prior Actions AAA work 2009-2012 Link to DPL Agenda
CONSOLIDATING PUBLIC FINANCES
Fiscal consolidation and public expenditure analysis
Public expenditure review
Technical assistance on tax expenditures
Public expenditure review for Mazowieckie voivodship
Regional development strategy for Lubelskie voivodship
Supporting local government resource management
Launch of Poland BOOST database
Strengthen fiscal framework through expenditure ceilings
Strengthen tax collection in efficient and equitable manner
Adopt fiscal consolidation measures at the local level
Make growth strategy fiscally sustainable
Strengthen public financial management at the local level
Strengthen capacity for public expenditure analysis and information
STRENGTHENING FISCAL INSTITUTIONS
Fiscal rules and fiscal institutions
Public expenditure review
Assessment of reforms of fiscal institutions
TA on debt management for local governments
Strengthen fiscal framework through expenditure ceilings
Evaluate status of reforms and highlight areas where fiscal institutions could be further strengthened
Build capacity on debt management issues, fiscal risks and fiscal rules for local governments
ADVANCING LONG TERM FISCAL REFORMS
Pensions and other social insurance programs
Public expenditure review
Policy paper on the implications of the global financial crisis on mandatory pension systems in ECA
Government training on World Bank simulation tool for pension reform
EU10+1 pensions reform stock-taking
Strengthen fiscal sustainability of social spending policies
Strengthen the multi-pillar pension system
Strengthen the multi-pillar pension system
Draw lessons on recent pension reforms
Social assistance
Qualitative field research on coverage and leakage in social assistance
EU10+1 study on Europe 2020 poverty and social exclusion
EU10+1 study on public spending in social sector during the crisis
Social assistance policy note on in-work support through tax credits or cash benefits
Reduce coverage gap in social assistance
Assess feasibility of meeting Europe 2020 target
Draw lessons on social sector adjustment in recent years
Improve targeting of safety nets
Health EU10+1 study on fiscal impact of population aging and long-term care
PPP workshop in Mazowieckie voivodship
Proposed technical assistance on hospital management in Mazowieckie voivodship
Strengthen fiscal sustainability of long-term care
Expand PPPs to strengthen health care
Strengthen hospital management
4.5. LESSONS LEARNED
67. The Bank has played an important role in Poland since the beginning of the
transition period in 1990. The Bank supported the economic transformation efforts of
successive governments through policy dialogue and advice, technical assistance related to
project preparation, capacity building and institutional strengthening, and financing. In the years
running up to EU accession, it provided an important anchor for structural reforms. Since 2008,
Poland and the Bank have engaged in a close partnership through policy lending operations in
the areas of public finance, public sector reform, private sector development, labor markets,
social sector reform and energy efficiency.
29
68. The DPL series incorporates a number of lessons from the Bank’s previous
engagements, and from Bank work with other upper middle-income and high-income
countries. First, the program series is focused on areas of strategic relevance for the country’s
stated priorities and where the Bank has an established track record of strong technical capacity
and cross-country experience. Second, instead of covering an extensive array of measures across
reform areas, the policy lending operation is focused on a core specific agenda, providing more
value-added to the client. This operation is focused solely on public finance issues. Third,
creditworthy emerging countries benefit most from programs that permit adequate flexibility to
account for rapid responses to changing circumstances, especially during periods of uncertainly
in external markets. The policy lending instrument is appreciated by the counterparts as it can be
tailored to address priority reforms. The DPLs allow for fast disbursement, and come with lower
transaction costs than traditional investment lending. Policy lending is a part of the
Government’s medium-term debt strategy and financing plan, helping to extend the maturity of
public debt. Fourth, the design and implementation of a policy lending operation is facilitated by
the close engagement of the Bank with Poland on its economic reform agenda in recent years.
Finally, and critically important, the proposed program supports the Government’s own reform
plan, priorities and commitments.
V. THE PROPOSED POLICY LOAN
5.1. OPERATION DESCRIPTION
69. This is the first of two lending operations in a proposed series supporting the
Government’s policy program aimed at strengthening Poland’s public finances. The
proposed DPL series supports selected reforms of the Government program discussed in Section
III. These measures are encapsulated in three core areas of action: (i) consolidating public
finances in the short term; (ii) strengthening fiscal institutions to ensure a prudent fiscal stance
over the medium term; and (iii) advancing long-term structural-fiscal reforms. These reforms are
aimed at stabilizing and subsequently reducing public debt levels to secure access to financial
markets at reasonable costs, and thus ensuring the resilience of the economy to shocks. These
reforms are also geared to securing the fiscal sustainability of social programs, including in the
context of an aging population. Lastly, these reforms will help create the needed fiscal space to
maintain and increase investments in infrastructure and human capital to support sustained
growth.
70. The remainder of this section presents the policy areas and actions supported by the
proposed operation. It presents the expected prior actions for the first operation and the
indicative triggers for the second operation. Further information on the Government’s reform
program in these areas can be found in Section III.

30
5.2. CONSOLIDATING PUBLIC FINANCES
DPL1 Prior Action: Enact a Budget Law for 2012 in line with the requirements of the EU
Excessive Deficit Procedure.
71. Based on the fiscal measures included in the budget, the general government fiscal
deficit is projected to decline from around 5 percent of GDP in 2011 to around 3 percent of GDP
in 2012. The 2012 budget act is consistent with Poland’s ongoing EU Excessive Deficit
Procedure as well as the law on public finance. It includes a separate budget for EU funds and is
subject to the enhanced debt safety procedures if public debt exceeds 55 percent of GDP. If
needed, the Government remains committed to taking additional actions beyond those stated in
the budget to keep the deficit within the committed level. The 2012 budget protects key priority
investments.
DPL2 Trigger: Enact a Budget Law for 2013 in line with the requirements of the EU Stability
and Growth Pact.
72. The general government fiscal deficit is projected to decline from around 3 percent of
GDP in 2012 to around 2.5 percent of GDP in 2013. The path of fiscal consolidation is consistent
with Poland’s aim of meeting its MTO of a structural fiscal deficit of 1 percent of GDP by 2015.
The 2013 budget act is expected to be consistent with the law on public finance.
5.3. STRENGTHENING FISCAL INSTITUTIONS
DPL1 Prior Action: CoM adopts plans for gradual implementation of deficit limitations of
local governments as indicated in its Convergence Program Update 2012.
73. Debt of local governments has been growing faster than that of the central government. It
is critically important to limit local governments’ deficits to support the process of short- and
medium-term fiscal consolidation and stabilize the local government debt level. Failure to tackle
sub-national deficits and debt may result in crowding out fiscal space at the national level for
strategic investments in infrastructure and human capital. The sub-national rule will help achieve
this objective by capping the aggregate deficit of sub-national governments at 0.5 percent of
GDP.
DPL2 Trigger: Enact amendments to the Public Finance Act to introduce a cap on the
aggregate deficit of local governments.
74. The Government expects that the amendments to the Public Finance Act to introduce a
cap on aggregate deficit of local governments will be enacted in late 2012 or early 2013.
DPL2 Trigger: Enact a permanent fiscal rule to limit growth of public expenditures to trend
GDP growth.
31
75. The Government expects the enactment of the law on the permanent expenditure rule by
early 2013. The tentative target date for reaching a structural fiscal deficit of 1 percent of GDP is
2015, and the permanent public expenditure rule would come into force the following year. The
rule is intended to ensure that Poland maintains a prudent fiscal stance (around its MTO) over the
business cycle.
5.4. ADVANCING LONG-TERM FISCAL REFORMS
DPL1 Prior Action: CoM adopts and submits to Parliament draft amendments to the Law on
Pensions for the increase of the statutory retirement age.
76. The amendments to the pensions law will mandate an increase in the statutory
retirement age of women from 60 to 67 years old. This increase would take place gradually: one
month increase in retirement age every four months (or three months per year). The amendments
would also increase the retirement age for men from 65 to 67 at the same gradual pace. This is a
critical reform to help secure the fiscal sustainability of the pension system in the long term. The
prior action supported is the adoption by the CoM of these amendments to the pension law and
its submission to Parliament.
DPL2 Trigger: Enact amendments to the Law on Pensions to increase statutory retirement age
and start implementation.
77. The Government expects that the amendments to the pensions law on the retirement age
increase will be enacted in the second half of 2012. The law’s implementation will start in
January 2013.
DPL1 Prior Action: CoM adopts and submits to Parliament draft amendments to the pension
legislation on uniformed services to increase length of service and introduce minimum
retirement age.
78. The statutory retirement age for uniformed services, including the military (under the
Ministry of Defense) and police, border security, fire-fighting services and government security
(under the Ministry of Interior) will be increased to 55 years. The mandatory length of service
for these groups will also be increased from 15 to 25 years. This is an important reform to
continue bridging the gap between special pensions and the general pension system.
DPL2 Trigger: Enact amendments to the pension legislation on uniformed services to increase
length of service and introduce minimum retirement age.
79. The Government expects the enactment of the law on uniformed services’ pensions in the
first quarter of 2013.
DPL1 Prior Action: Enact the Law on Farmers Health Insurance Contributions.
32
80. This legislation requires farmers to pay health insurance contributions. Until early 2012
farmers did have access to the benefits of health insurance, but without making direct
contributions like other citizens (see Section 3.3). This is a first reform step in a broader reform
agenda of taxation in the agriculture sector.
DPL2 Trigger: Enact legislation to introduce income accounting for farmers for tax purposes.
81. As part of the reforms on taxation in the agricultural sector, new legislation will introduce
regular income accounting for farmers. This is a critical reform step in designing and
implementing income taxation in the agriculture sector.
DPL1 Prior Action: Enact the Law on Therapeutic Activity to (i) make local governments and
other public entities that own health facilities accountable for their financial results; and (ii)
advance the agenda of hospital corporatization and restructuring.
82. The Law on Therapeutic Activity lays out the legal framework for hospital restructuring
to improve financial and performance accountability of hospitals, with important fiscal
implications. This reform stipulates that the owner of a health care facility (i.e., the local
government, public university or other public entities) has the legal obligation to cover the
annual deficit incurred by the health facility within three months after the approval of its
financial statement. In case this does not occur, the public owner of the health care facility is
obliged to corporatize/restructure it or wind it down.
DPL2 Trigger: Enact a law establishing a tariff agency to adequately price health procedures.
83. The establishment of a tariff agency will help to adequately price the procedures/services
undertaken by health facilities. In the context of Poland’s health insurance system, this agency
will be instrumental to contain costs and improve transparency and financial planning at all
levels of the system.
DPL1 Prior Action: CoM adopts and submits to Parliament draft amendments to the Law on
Family Benefits to improve targeting of the child-birth allowance.
84. Despite being a small program, the reform measure to tighten the eligibility criteria on
the child-birth allowance signals a path to improve the targeting of the resources spent on social
assistance. The amendment is adopted by the CoM and is expected to be approved by Parliament
in 2012.
DPL2 Trigger: Enact amendments to social assistance and family benefits legislations to: (i)
increase the income threshold for the last-resort minimum-income social assistance benefit that
tops up the incomes of the poorest; and (ii) improve targeting of the benefit for caregivers of
disabled dependents.
85. The overall objective of these measures is to improve targeting in the social assistance
system in fiscally prudent way. Increasing the income threshold in last-resort minimum-income
social assistance program would improve generosity and expand coverage of the benefit. This
33
policy would be partly financed by savings through income testing measure, limiting the
budgetary impact. A law to improve the targeting of the benefit for caregivers is to be approved
by the CoM and Parliament by late 2012. The objective is to reduce or stop caregiver benefits for
disabled people who already have sufficient income, and thus free up resources to better support
those in more need.
VI. OPERATION IMPLEMENTATION
6.1. POVERTY AND SOCIAL IMPACT
86. The poverty and social impacts of policy measures supported under this DPL series
are expected to be either positive or negligible. Several of the policy measures will improve
the living standards of the poor, both directly through reforms to social protection programs and
indirectly through improved stability and solvency of public finances.
87. The DPL1 prior action in the policy area of consolidating fiscal balances is likely to
support poverty reduction. The proposed operation supports fiscal consolidation, which is
critical to maintaining capital market access and thus to support investments and employment.
Key components of social safety net spending are excluded from measures underpinning fiscal
consolidation, thereby maintaining support to the most vulnerable.
88. The DPL1 prior actions in the policy area of strengthening fiscal institutions are
likely to be neutral or favorable for poverty reduction over time. The sub-national fiscal rule
is intended to ensure that local governments as a whole limit aggregate borrowing. This is
unlikely to have a detrimental effect on poverty. First, poverty is concentrated in rural areas and
small towns, where local government borrowing is low. Second, local governments receive
funding from the state budget for social assistance payments.
89. The DPL1 prior actions in the area of advancing long term fiscal reforms have the
following poverty and social impacts:
Increasing the retirement age is expected to reduce poverty. The increase in retirement age
will increase the lifetime income of individuals, leading to higher pensions at old age and
hence reduce poverty among pensioners. The higher pensions will have a positive impact
particularly on retired women, given the relatively higher life expectancy for women
compared to men (see Box 5). Keeping workers in the labor force longer has the potential for
exerting downward pressure on wages, but this is mitigated by several factors, especially the
slow phase-in of the increased retirement age, the shrinking size of working age population
under the current retirement ages and the fact that it is not retroactive, so that current retirees
are not forced back into the labor force. Older workers who cannot find employment or who
are too disabled to work have safety nets in the form of social assistance and disability
pensions, respectively. Other mitigating considerations are that many pensioners are already
working in retirement, and tend to have different skill sets from younger workers, so are
unlikely to be competing with new entrants for jobs.22
22
A regional study covering Poland and due to be published in mid-2012 will include a qualitative assessment to
find out why people choose to retire or if retirement is involuntary.
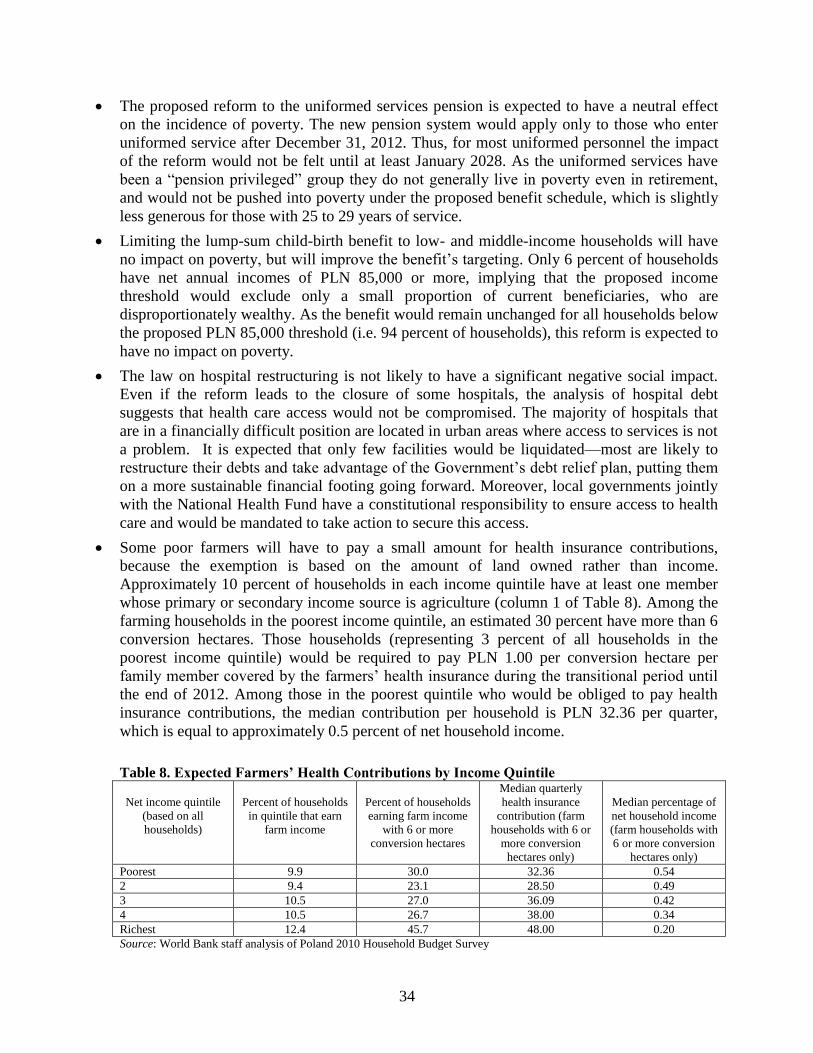
34
The proposed reform to the uniformed services pension is expected to have a neutral effect
on the incidence of poverty. The new pension system would apply only to those who enter
uniformed service after December 31, 2012. Thus, for most uniformed personnel the impact
of the reform would not be felt until at least January 2028. As the uniformed services have
been a ―pension privileged‖ group they do not generally live in poverty even in retirement,
and would not be pushed into poverty under the proposed benefit schedule, which is slightly
less generous for those with 25 to 29 years of service.
Limiting the lump-sum child-birth benefit to low- and middle-income households will have
no impact on poverty, but will improve the benefit’s targeting. Only 6 percent of households
have net annual incomes of PLN 85,000 or more, implying that the proposed income
threshold would exclude only a small proportion of current beneficiaries, who are
disproportionately wealthy. As the benefit would remain unchanged for all households below
the proposed PLN 85,000 threshold (i.e. 94 percent of households), this reform is expected to
have no impact on poverty.
The law on hospital restructuring is not likely to have a significant negative social impact.
Even if the reform leads to the closure of some hospitals, the analysis of hospital debt
suggests that health care access would not be compromised. The majority of hospitals that
are in a financially difficult position are located in urban areas where access to services is not
a problem. It is expected that only few facilities would be liquidated—most are likely to
restructure their debts and take advantage of the Government’s debt relief plan, putting them
on a more sustainable financial footing going forward. Moreover, local governments jointly
with the National Health Fund have a constitutional responsibility to ensure access to health
care and would be mandated to take action to secure this access.
Some poor farmers will have to pay a small amount for health insurance contributions,
because the exemption is based on the amount of land owned rather than income.
Approximately 10 percent of households in each income quintile have at least one member
whose primary or secondary income source is agriculture (column 1 of Table 8). Among the
farming households in the poorest income quintile, an estimated 30 percent have more than 6
conversion hectares. Those households (representing 3 percent of all households in the
poorest income quintile) would be required to pay PLN 1.00 per conversion hectare per
family member covered by the farmers’ health insurance during the transitional period until
the end of 2012. Among those in the poorest quintile who would be obliged to pay health
insurance contributions, the median contribution per household is PLN 32.36 per quarter,
which is equal to approximately 0.5 percent of net household income.
Table 8. Expected Farmers’ Health Contributions by Income Quintile
Net income quintile
(based on all
households)
Percent of households
in quintile that earn
farm income
Percent of households
earning farm income
with 6 or more
conversion hectares
Median quarterly
health insurance
contribution (farm
households with 6 or
more conversion
hectares only)
Median percentage of
net household income
(farm households with
6 or more conversion
hectares only)
Poorest 9.9 30.0 32.36 0.54
2 9.4 23.1 28.50 0.49
3 10.5 27.0 36.09 0.42
4 10.5 26.7 38.00 0.34
Richest 12.4 45.7 48.00 0.20
Source: World Bank staff analysis of Poland 2010 Household Budget Survey
35
6.2. ENVIRONMENTAL ASPECTS
90. The specific policies supported by the DPL series are not likely to have significant
effects on Poland’s environment, forests, water resources, habitats or other natural
resources. The risk of unanticipated adverse effects to the environment and natural resources is
very small. Credible scenarios for any significant, direct or indirect negative impacts appear very
unlikely. Poland has adequate environmental controls in place and environmental legislation and
regulations are closely aligned with EU environmental directives (e.g. EIA Directive
85/337/EEC, as amended by Council Directive 97/11/EC). Poland has adopted the EU’s
guidelines on integration of environmental assessments into the planning and programming of
projects (June 2001) and the EU’s Environmental Liabilities Directive setting out liability for
damage to properties and natural resources (April 2007). Since the country's accession to the EU
in 2004, Polish environmental authorities have rapidly developed technical skills and
administrative structures required for effective licensing, monitoring and enforcement. Thus any
impacts potentially caused by measures in the DPL operation would be captured by the
established processes for screening and assessing projects, and for ensuring that appropriate
responses for impact minimization, mitigation and management are included in project designs.
6.3. IMPLEMENTATION MONITORING AND EVALUATION
91. The Bank continues to work closely with the MOF, Prime Minister’s Office and
sector ministries to monitor and assess reform progress and impacts during the course of
the program. Monitoring and evaluation will be supported by the various ministries as well as
budgetary, legislative and economic data provided by the authorities and verified in official
disclosures, directives and regulations. Baseline and updated data are provided by the respective
specialized agencies and tracked according to the indicators and outcome measures shown in the
monitoring and results framework of the policy matrix (Annex 1.). Where applicable, gender-
informed analyses will be carried out to assess and monitor the impact of the proposed reforms
and identify appropriate mitigation measures as needed.
6.4. FIDUCIARY ASPECTS AND PROCUREMENT
92. The fiduciary risk to this operation arising from Poland’s public financial
management system and use of budget resources is moderate. As part of its accession process
to the EU, Poland has achieved significant progress in reforming its public financial management
(PFM) system. The status of the PFM was derived from the World Bank’s ongoing monitoring of
PFM reform and diagnostic work conducted by the Bank and other organizations including the
IMF. It has upgraded its legislative framework in line with the EU acquis, introduced an internal
audit function and prepared for the EU accreditation process of fund-managing agencies. Poland
has also made significant improvements related to the public availability and coverage of fiscal
information, provision of statistical data in ESA’95 format and regularity of reconciliations of
bank accounts.
93. The PFM reform agenda, based on the 2009 law on public finance with an
additional amendment in 2010, enhanced budget transparency, predictability and
36
performance orientation over the medium term. It introduced performance-oriented four-year
rolling budget planning with binding annual budget (still on cash basis), integrated most of the
extra budgetary funds within the state budget and strengthened internal control via new
regulations on corrective actions triggered by debt thresholds.
94. Other areas of ongoing reform include cash management. The 2010 amendment of
the law on public finance introduced further consolidation of cash management by compulsory
or voluntary depositing temporary free cash resources of public sector entities to MOF accounts.
This aims at more efficient cash liquidity management and limiting public debt. The current
computerized system of the state budget TREZOR linked with the NBP’s accounting system
encompasses all tier state budget holders, allowing for direct coordination of pending payment
orders and cash availability. The MOF plans to integrate TREZOR with the newly planned
central IT system, which will support reporting in PBB format.
95. In the area of external audit, Poland has a reasonably well-functioning public
financial accountability and assurance mechanism for the legislature and the public. Poland
is advanced in the availability of the audit reports to the public, independence of the Supreme
Audit Office (NIK) from the executive and control of the NIK budget. The law on the Supreme
Audit Office, amended in December 2010, introduces further enhancement in documenting
results of audits, functional organization, rotation and recruitment of directors, requirement of
external audit covering the execution of the NIK’s budget and its financial management. The
2009 law on public finance also requires that annual financial statements prepared by large local
governments be audited by independent statutory auditors.
96. Although PFM is overall acceptable, the sovereign debt crisis highlights that further
reforms are needed. The cash-based information commonly used for budgeting and accounting
is no longer sufficient to make well-informed decision in the long run. Further PFM reforms
should include introducing accrual-based budgeting, appropriations and reporting, transparency
of financial and fiscal reporting (including further integration of the remaining extra budgetary
funds and state entities within the budget) and phased introduction of consolidated balance sheet
of the state budget and public finance sector based on the International Public Sector Accounting
Standards (IPSAS). This would enhance the monitoring of the financial position, including all
assets and liabilities, in the long run. Ideally the reforms on the country level should be
coordinated on European level by the EU.
97. The MOF makes the annual budget and its execution publicly available through its
website and reports. The Budget Act, with figures and all the relevant annexes, are published
and accessible through the web, as are monthly and quarterly state budget execution reports
based on the national cash methodology. The MOF also publishes quarterly aggregate reports on
budget execution of sub-national governments. Annual reports on the central state budget
execution are published after being audited, usually six months after the end of the year. Budget
data and execution, based on the ESA’95 methodology for the general government, is available
on quarterly basis and published in the website of MOF, the Central Statistical Office and
Eurostat.
37
98. NBP accounting and reporting policies are defined by the Monetary Policy Council,
and are in line the guidelines of the European Central Bank. Its financial management and
operations are transparently disclosed and presented on its website. An independent auditor
selected by the Monetary Policy Council regularly audits the NBP’s annual financial statements.
The most recently available audit reports (2004-2010) have unqualified audit opinions and were
approved by the Monetary Policy Council. In 2010 the Monetary Policy Council introduced
changes into NBP’s accounting policy related to valuation of foreign currency transactions, debt
securities’ discounts and premiums and reserves to cover the fluctuation risk of polish zloty
against foreign currencies. No significant issues emerged from the review of the IMF latest
limited scope safeguards report of 2009.
99. Overall, the fiduciary risk to this operation arising from Poland’s PFM system, use
of budget resources, and foreign exchange environment as controlled by the Central Bank
is moderate.
100. The legislation on public procurement is fully compatible with EU Directives. On
June 2001, a new Public Procurement Law was enacted, which took into consideration most of
the World Bank’s CPAR recommendations. To fully align the public procurement system with
EU requirements, the Public Procurement Law was enacted on January 2004 and amended
substantially five times until January 2010 (in 2006, 2007, 2008 and twice in 2009) based on
experience gained with the implementation of the law.
6.5. DISBURSEMENT AND AUDITING
101. Loan proceeds will be disbursed in one single tranche to the foreign currency
national budget account at the NBP, as requested by the MOF. This account forms part of
the foreign currency reserves of the country. Disbursement will be made upon declaration of loan
effectiveness and submission of a withdrawal application to IBRD. The proposed loan will
follow the Bank’s disbursement procedures for development policy lending. Disbursements will
not be linked to specific purchases, thus no procurement requirements will be necessary. The
Government shall maintain accounts and records with respect to the deposit of loan proceeds in
the NBP. If the loan proceeds are used for ineligible purposes as defined in the loan agreement,
IBRD will require the borrower to refund the amount directly to IBRD.
102. No additional fiduciary arrangements are required. The Bank will not require an
audit of the deposit account but will require the Government to provide confirmation to the Bank
in the form of an official letter from the MOF on the amounts deposited in the foreign currency
account within 30 days of receiving the funds.
6.6. RISKS AND MITIGATION
103. Macroeconomic risks are substantial and stem from potential further deterioration
of the euro area economic outlook. Euro area problems can transmit to Poland through weaker
global investment and export demand. The euro area constitutes Poland’s largest market,
receiving over a half of Poland’s total exports in the first three quarters of 2011. A severe tail-
risk event, affecting the core and/or the periphery of the euro area, could undermine economic

38
growth in Poland, and jeopardize fiscal outcomes. Moreover, public debt is highly sensitive to a
shock in output (see section 2.3).
104. Mitigating factors against downside macroeconomic risks include relatively lower
levels of stress in key trading partners, a flexible exchange rate, and a stepped-up
utilization of EU funds. Germany, one of the countries best-placed in the euro area to withstand
the headwinds, remains Poland’s most important trading partner, accounting for 26 percent of
Poland’s exports. Flexible monetary policy instruments, especially flexible exchange rate,
continue to be successful in cushioning the impact of external shocks and support the recovery.
Strong record of utilization of EU structural funds through 2013 will continue to support
investment and growth. The overall solid track record of macroeconomic management will help
to shore up market confidence and secure access to international financial markets, as long as
credible commitment and implementation of medium-term fiscal and structural reforms is
observed.
105. Vulnerabilities in the Polish financial sector remain, reflecting uncertainties from
the sovereign stress in the rest of Europe. With net foreign liabilities at over 10 percent of
GDP, Poland remains vulnerable to external debt deleveraging through parent bank funding of
local subsidiaries and tighter access to capital. Further, the nominal stock of NPLs continued
growing over the last year, particularly within the forex-denominated mortgage loan books.
Forex-denominated NPLs are also prevalent among unhedged borrowers, including in the
construction industry.
106. Adequately capitalized, liquid, and profitable banks as well as effective and strong
financial supervision are among the key mitigating factors against financial sector risks. Poland’s financial sector has reasonable capital adequacy ratios (13.1 percent at end 2011) and a
moderate (and declining) level of NPLs (8.3 percent of assets at end 2011). Also, a
comprehensive regulatory framework is helping to preserve financial stability, as well as access
to liquidity support from the ECB and the NBP and continued strengthening of the regulation
and supervision of the financial sector. Further, the authorities could draw on the Flexible Credit
Line with the IMF (US$30 billion), which so far has been treated as strictly precautionary.
107. Public discontent with reforms could undermine support for the Government’s
agenda. This could reduce the Government’s political ability to implement and sustain the
needed fiscal and structural reforms. Ensuring support within the coalition Government for the
proposed bold fiscal-structural reforms will be key for the successful implementation of the
envisioned reform agenda.
108. The Government’s strong electoral mandate from the parliamentary elections in
late 2011 is the key mitigating factor against this risk. Albeit with a small majority, the ruling
coalition has been effective in securing political support for its reform agenda. Moreover, it faces
a fractured opposition. Additional mitigating factors include: the Government’s strong
commitment to strengthening public finances as articulated in the Prime Minister’s opening
speech to the Parliament in November 2011 and the swift preparation and implementation of
reforms; next major elections will be held only in 2015; and the broadly recognized need in
Poland (including among civil society) for fiscal reform.
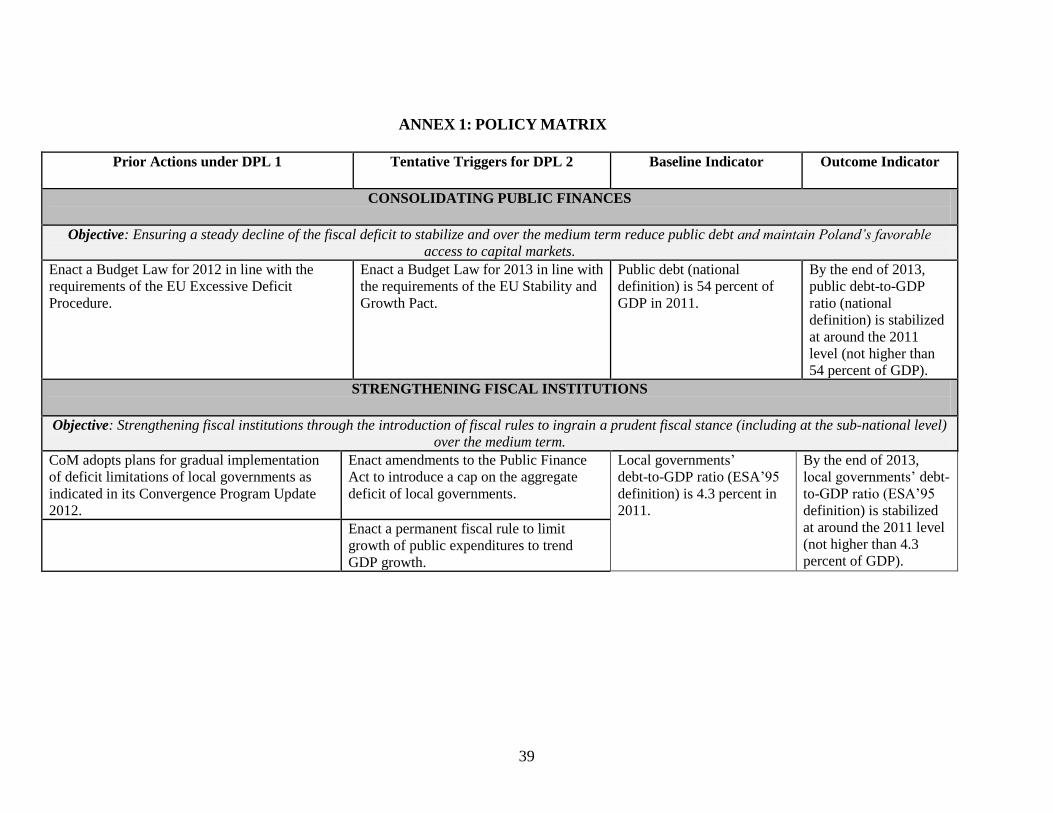
39
ANNEX 1: POLICY MATRIX
Prior Actions under DPL 1
Tentative Triggers for DPL 2 Baseline Indicator Outcome Indicator
CONSOLIDATING PUBLIC FINANCES
Objective: Ensuring a steady decline of the fiscal deficit to stabilize and over the medium term reduce public debt and maintain Poland’s favorable
access to capital markets.
Enact a Budget Law for 2012 in line with the
requirements of the EU Excessive Deficit
Procedure.
Enact a Budget Law for 2013 in line with
the requirements of the EU Stability and
Growth Pact.
Public debt (national
definition) is 54 percent of
GDP in 2011.
By the end of 2013,
public debt-to-GDP
ratio (national
definition) is stabilized
at around the 2011
level (not higher than
54 percent of GDP).
STRENGTHENING FISCAL INSTITUTIONS
Objective: Strengthening fiscal institutions through the introduction of fiscal rules to ingrain a prudent fiscal stance (including at the sub-national level)
over the medium term.
CoM adopts plans for gradual implementation
of deficit limitations of local governments as
indicated in its Convergence Program Update
2012.
Enact amendments to the Public Finance
Act to introduce a cap on the aggregate
deficit of local governments.
Local governments’
debt-to-GDP ratio (ESA’95
definition) is 4.3 percent in
2011.
By the end of 2013,
local governments’ debt-
to-GDP ratio (ESA’95
definition) is stabilized
at around the 2011 level
(not higher than 4.3
percent of GDP).
Enact a permanent fiscal rule to limit
growth of public expenditures to trend
GDP growth.
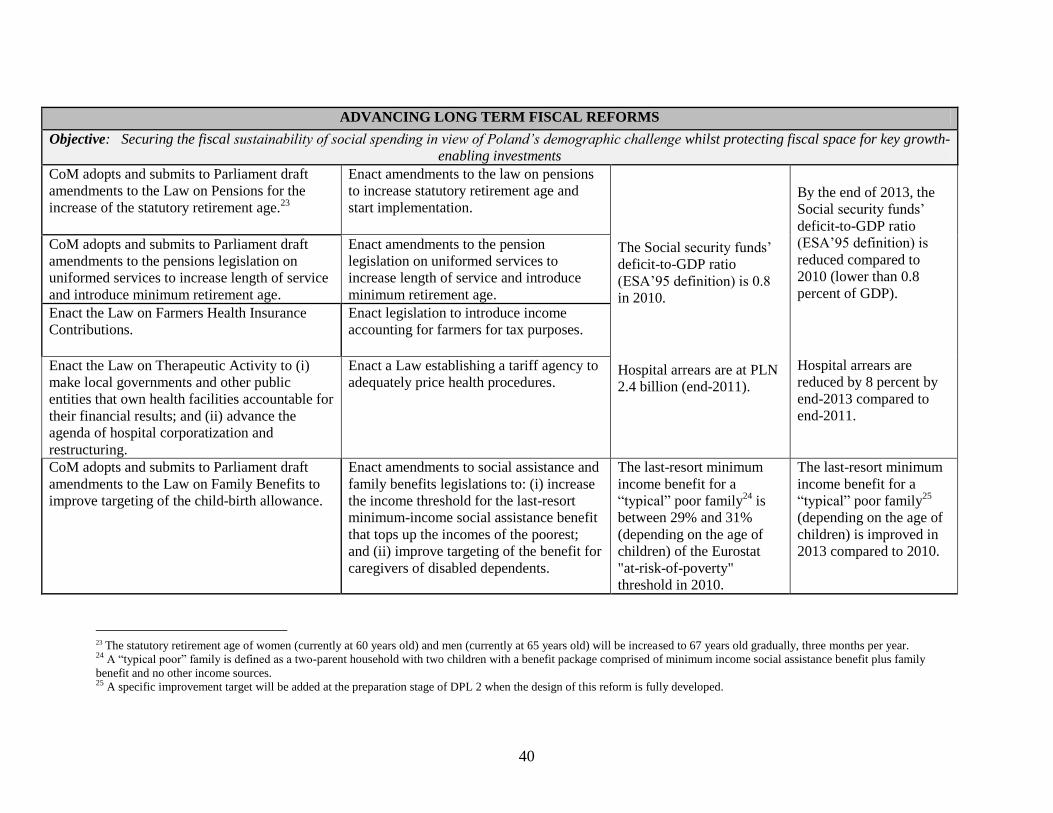
40
ADVANCING LONG TERM FISCAL REFORMS
Objective: Securing the fiscal sustainability of social spending in view of Poland’s demographic challenge whilst protecting fiscal space for key growth-
enabling investments
CoM adopts and submits to Parliament draft
amendments to the Law on Pensions for the
increase of the statutory retirement age.23
Enact amendments to the law on pensions
to increase statutory retirement age and
start implementation.
The Social security funds’
deficit-to-GDP ratio
(ESA’95 definition) is 0.8
in 2010.
Hospital arrears are at PLN
2.4 billion (end-2011).
By the end of 2013, the
Social security funds’
deficit-to-GDP ratio
(ESA’95 definition) is
reduced compared to
2010 (lower than 0.8
percent of GDP).
Hospital arrears are
reduced by 8 percent by
end-2013 compared to
end-2011.
CoM adopts and submits to Parliament draft
amendments to the pensions legislation on
uniformed services to increase length of service
and introduce minimum retirement age.
Enact amendments to the pension
legislation on uniformed services to
increase length of service and introduce
minimum retirement age.
Enact the Law on Farmers Health Insurance
Contributions.
Enact legislation to introduce income
accounting for farmers for tax purposes.
Enact the Law on Therapeutic Activity to (i)
make local governments and other public
entities that own health facilities accountable for
their financial results; and (ii) advance the
agenda of hospital corporatization and
restructuring.
Enact a Law establishing a tariff agency to
adequately price health procedures.
CoM adopts and submits to Parliament draft
amendments to the Law on Family Benefits to
improve targeting of the child-birth allowance.
Enact amendments to social assistance and
family benefits legislations to: (i) increase
the income threshold for the last-resort
minimum-income social assistance benefit
that tops up the incomes of the poorest;
and (ii) improve targeting of the benefit for
caregivers of disabled dependents.
The last-resort minimum
income benefit for a
―typical‖ poor family24
is
between 29% and 31%
(depending on the age of
children) of the Eurostat
"at-risk-of-poverty"
threshold in 2010.
The last-resort minimum
income benefit for a
―typical‖ poor family25
(depending on the age of
children) is improved in
2013 compared to 2010.
23 The statutory retirement age of women (currently at 60 years old) and men (currently at 65 years old) will be increased to 67 years old gradually, three months per year. 24 A ―typical poor‖ family is defined as a two-parent household with two children with a benefit package comprised of minimum income social assistance benefit plus family
benefit and no other income sources. 25 A specific improvement target will be added at the preparation stage of DPL 2 when the design of this reform is fully developed.
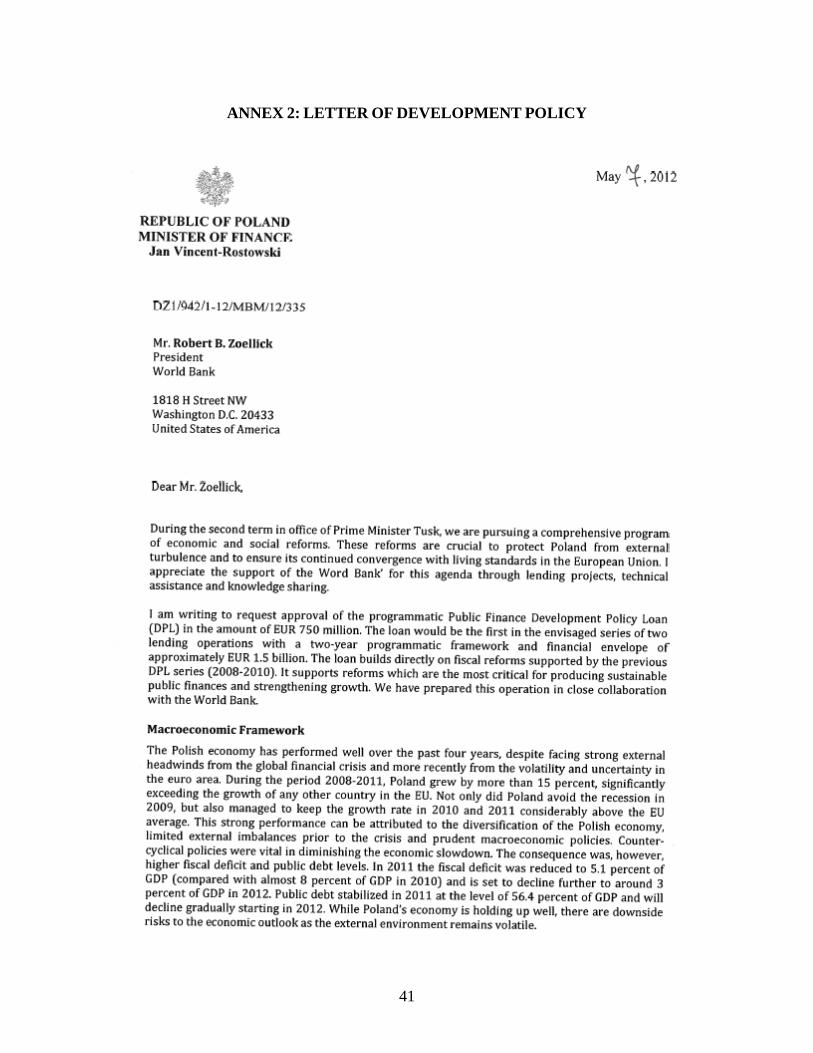
41
ANNEX 2: LETTER OF DEVELOPMENT POLICY
42
43
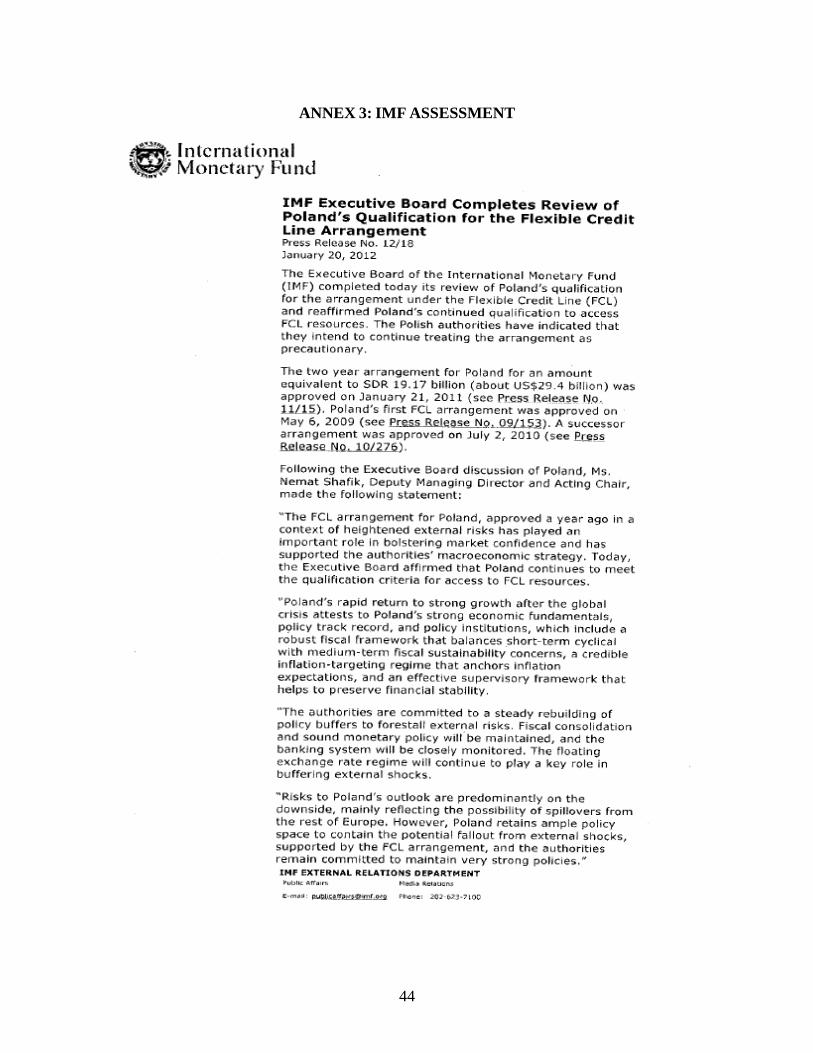
44
ANNEX 3: IMF ASSESSMENT

45
ANNEX 4: POLAND AT A GLANCE
Poland at a glance 3/30/12
Key D evelo pment Indicato rs High
Poland income
(2010)
Population, mid-year (millions) 38.0 1,117
Surface area (thousand sq. km) 313 35,727
Population growth (%) -0.3 0.6
Urban population (% of to tal population) 61 77
GNI (Atlas method, US$ billions) 475.3 42,418
GNI per capita (Atlas method, US$) 12,500 37,990
GNI per capita (PPP, international $) 18,290 36,213
GDP growth (%) 3.9 -3.3
GDP per capita growth (%) 4.3 -3.9
(mo st recent est imate, 2004–2010)
Poverty headcount ratio at $1.25 a day (PPP, %) <2 ..
Poverty headcount ratio at $2.00 a day (PPP, %) <2 ..
Life expectancy at birth (years) 76 80
Infant mortality (per 1,000 live births) 5 6
Child malnutrition (% of children under 5) .. ..
Adult literacy, male (% of ages 15 and o lder) 100 99
Adult literacy, female (% of ages 15 and o lder) 99 98
Gross primary enro llment, male (% of age group) 98 101
Gross primary enro llment, female (% of age group) 97 101
Access to an improved water source (% of population) 100 100
Access to improved sanitation facilities (% of population) 90 99
N et A id F lo ws 1980 1990 2000 2010
(US$ millions)
Net ODA and official aid – 1,320 1,393 –
Top 3 donors (in 2008):
n.a. – – – –
n.a. – – – –
n.a. – – – –
Aid (% of GNI) – 3.1 0.8 –
Aid per capita (US$) – 35 36 –
Lo ng-T erm Eco no mic T rends
Consumer prices (annual % change) .. 70.3 10.1 2.6
GDP implicit deflator (annual % change) .. 55.3 7.3 1.4
Exchange rate (annual average, local per US$) .. 0.9 4.3 3.0
Terms of trade index (2000 = 100) .. 105 100 93
1980–90 1990–2000 2000–10
Population, mid-year (millions) 35.6 38.1 38.5 38.0 0.7 0.1 -0.1
GDP (US$ millions) .. 64,550 171,263 469,331 .. 4.7 4.3
Agriculture .. 8.3 4.9 3.8 .. 0.5 0.6
Industry .. 50.1 31.1 32.0 .. 6.7 6.0
M anufacturing .. .. 17.2 16.8 .. 8.1 8.8
Services .. 41.6 64.0 64.3 .. 5.2 3.5
Household final consumption expenditure .. 48.3 64.1 61.4 .. 5.2 3.7
General gov't final consumption expenditure .. 20.8 17.4 18.9 .. 3.2 4.3
Gross capital formation .. 24.3 24.8 21.0 .. 10.6 5.8
Exports o f goods and services .. 26.2 27.1 42.3 .. 11.3 8.7
Imports of goods and services .. 19.7 33.5 43.5 .. 16.7 7.9
Gross savings .. .. 18.8 16.9
Note: Figures in italics are for years other than those specified. 2010 data are preliminary. Group data are for 2009. .. indicates data are not available.
Development Economics, Development Data Group (DECDG).
(average annual growth %)
(% of GDP)
6 4 2 0 2 4 6
0-4
15-19
30-34
45-49
60-64
75-79
percent of total population
Age distribution, 2009
Male Female
0
10
20
1990 1995 2000 2009
Poland High income
Under-5 mortality rate (per 1,000)
-10
-8
-6
-4
-2
0
2
4
6
8
95 05
GDP GDP per capita
Growth of GDP and GDP per capita (%)
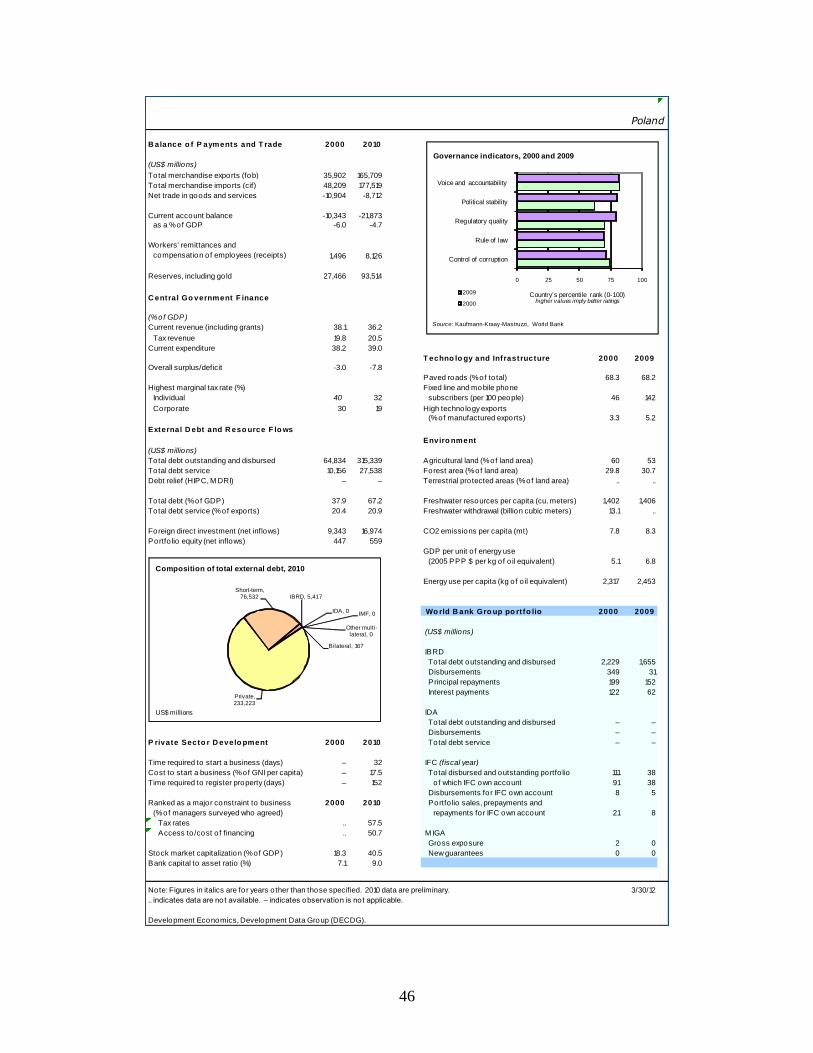
46
Poland
B alance o f P ayments and T rade 2000 2010
(US$ millions)
Total merchandise exports (fob) 35,902 165,709
Total merchandise imports (cif) 48,209 177,519
Net trade in goods and services -10,904 -8,712
Current account balance -10,343 -21,873
as a % of GDP -6.0 -4.7
Workers' remittances and
compensation of employees (receipts) 1,496 8,126
Reserves, including gold 27,466 93,514
C entral Go vernment F inance
(% of GDP)
Current revenue (including grants) 38.1 36.2
Tax revenue 19.8 20.5
Current expenditure 38.2 39.0
T echno lo gy and Infrastructure 2000 2009
Overall surplus/deficit -3.0 -7.8
Paved roads (% of to tal) 68.3 68.2
Highest marginal tax rate (%) Fixed line and mobile phone
Individual 40 32 subscribers (per 100 people) 46 142
Corporate 30 19 High technology exports
(% of manufactured exports) 3.3 5.2
External D ebt and R eso urce F lo ws
Enviro nment
(US$ millions)
Total debt outstanding and disbursed 64,834 315,339 Agricultural land (% of land area) 60 53
Total debt service 10,156 27,538 Forest area (% of land area) 29.8 30.7
Debt relief (HIPC, M DRI) – – Terrestrial protected areas (% of land area) .. ..
Total debt (% of GDP) 37.9 67.2 Freshwater resources per capita (cu. meters) 1,402 1,406
Total debt service (% of exports) 20.4 20.9 Freshwater withdrawal (billion cubic meters) 13.1 ..
Foreign direct investment (net inflows) 9,343 16,974 CO2 emissions per capita (mt) 7.8 8.3
Portfo lio equity (net inflows) 447 559
GDP per unit o f energy use
(2005 PPP $ per kg of o il equivalent) 5.1 6.8
Energy use per capita (kg of o il equivalent) 2,317 2,453
Wo rld B ank Gro up po rtfo lio 2000 2009
(US$ millions)
IBRD
Total debt outstanding and disbursed 2,229 1,655
Disbursements 349 31
Principal repayments 199 152
Interest payments 122 62
IDA
Total debt outstanding and disbursed – –
Disbursements – –
P rivate Secto r D evelo pment 2000 2010 Total debt service – –
Time required to start a business (days) – 32 IFC (fiscal year)
Cost to start a business (% of GNI per capita) – 17.5 Total disbursed and outstanding portfo lio 111 38
Time required to register property (days) – 152 o f which IFC own account 91 38
Disbursements for IFC own account 8 5
Ranked as a major constraint to business 2000 2010 Portfo lio sales, prepayments and
(% of managers surveyed who agreed) repayments for IFC own account 21 8
Tax rates .. 57.5
Access to /cost o f financing .. 50.7 M IGA
Gross exposure 2 0
Stock market capitalization (% of GDP) 18.3 40.5 New guarantees 0 0
Bank capital to asset ratio (%) 7.1 9.0
Note: Figures in italics are for years other than those specified. 2010 data are preliminary. 3/30/12
.. indicates data are not available. – indicates observation is not applicable.
Development Economics, Development Data Group (DECDG).
0 25 50 75 100
Control of corruption
Rule of law
Regulatory quality
Political stability
Voice and accountability
Country's percentile rank (0-100)higher values imply better ratings
2009
2000
Governance indicators, 2000 and 2009
Source: Kaufmann-Kraay-Mastruzzi, World Bank
IBRD, 5,417
IDA, 0IMF, 0
Other multi-lateral, 0
Bilateral, 167
Private, 233,223
Short-term, 76,532
Composition of total external debt, 2010
US$ millions

47
Millennium Development Goals Poland
With selected targets to achieve between 1990 and 2015(estimate closest to date shown, +/- 2 years)
Go al 1: halve the rates fo r extreme po verty and malnutrit io n 1990 1995 2000 2009
Poverty headcount ratio at $1.25 a day (PPP, % of population) <2 <2 <2 <2
Poverty headcount ratio at national poverty line (% of population) .. 14.7 14.8 ..
Share of income or consumption to the poorest qunitile (%) 9.2 8.2 7.8 7.6
Prevalence of malnutrition (% of children under 5) .. .. .. ..
Go al 2: ensure that children are able to co mplete primary scho o ling
Primary school enro llment (net, %) .. .. 97 96
Primary completion rate (% of relevant age group) 98 94 95 96
Secondary school enro llment (gross, %) 88 95 100 100
Youth literacy rate (% of people ages 15-24) .. 100 .. 100
Go al 3: e liminate gender disparity in educat io n and empo wer wo men
Ratio of girls to boys in primary and secondary education (%) 101 99 98 99
Women employed in the nonagricultural sector (% of nonagricultural employment) .. 47 47 48
Proportion of seats held by women in national parliament (%) 14 13 13 20
Go al 4: reduce under-5 mo rtality by two -thirds
Under-5 mortality rate (per 1,000) 17 14 10 6
Infant mortality rate (per 1,000 live births) 15 12 8 5
M easles immunization (proportion of one-year o lds immunized, %) 95 96 97 98
Go al 5: reduce maternal mo rtality by three-fo urths
M aternal mortality ratio (modeled estimate, per 100,000 live births) 17 14 8 6
B irths attended by skilled health staff (% of to tal) .. .. 100 100
Contraceptive prevalence (% of women ages 15-49) 73 .. .. ..
Go al 6: halt and begin to reverse the spread o f H IV/ A ID S and o ther majo r diseases
Prevalence of HIV (% of population ages 15-49) 0.1 0.1 0.1 0.1
Incidence of tuberculosis (per 100,000 people) 49 48 33 23
Tuberculosis case detection rate (%, all forms) 81 82 81 84
Go al 7: halve the pro po rt io n o f peo ple witho ut sustainable access to basic needs
Access to an improved water source (% of population) 100 100 100 100
Access to improved sanitation facilities (% of population) .. .. 90 90
Forest area (% of land area) 29.2 .. 29.8 30.7
Terrestrial protected areas (% of land area) .. .. .. ..
CO2 emissions (metric tons per capita) 9.1 9.0 7.8 8.3
GDP per unit o f energy use (constant 2005 PPP $ per kg of o il equivalent) 3.0 3.5 5.1 6.8
Go al 8: develo p a glo bal partnership fo r develo pment
Telephone mainlines (per 100 people) 8.6 14.8 28.5 25.0
M obile phone subscribers (per 100 people) 0.0 0.2 17.5 116.8
Internet users (per 100 people) 0.0 0.6 7.3 58.8
Personal computers (per 100 people) 0.8 2.9 6.9 16.9
Note: Figures in italics are for years other than those specified. .. indicates data are not available. 3/30/12
Development Economics, Development Data Group (DECDG).
P o land
0
25
50
75
100
125
2000 2005 2009
Primary net enrollment ratio
Ratio of girls to boys in primary & secondary education
Education indicators (%)
0
20
40
60
80
100
120
140
160
2000 2005 2009
Fixed + mobile subscribers Internet users
ICT indicators (per 100 people)
0
25
50
75
100
1990 1995 2000 2009
Poland High income
Measles immunization (% of 1-year olds)
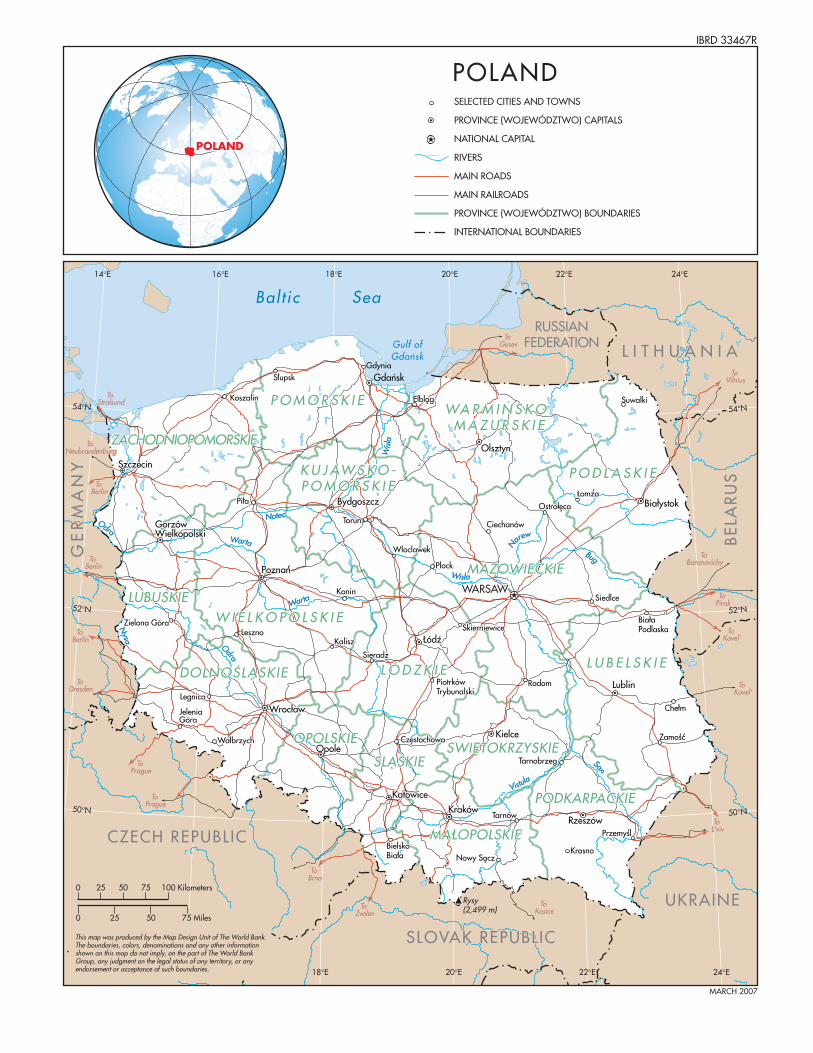
Wisla
San
Notec
Warta
Vistula
Odra
Odra
Nysa
Warta
Wis
la
Bug
N
arew
K U J AW S K O -K U J AW S K O -P O M O R S K I EP O M O R S K I E
L Ó D Z K I EL Ó D Z K I E L U B E L S K I EL U B E L S K I E
LUBUSKIELUBUSKIE
MAZOWIECKIEMAZOWIECKIE
OPOLSKIEOPOLSKIE
PODKARPACKIEPODKARPACKIE
P O D L A S K I EP O D L A S K I E
P O M O R S K I EP O M O R S K I E
W I E L K O P O L S K I EW I E L K O P O L S K I E
ZACHODNIOPOMORSKIEZACHODNIOPOMORSKIE
WA R M I N S K O -WA R M I N S K O -M A Z U R S K I EM A Z U R S K I E
SWIETOKRZYSKIESWIETOKRZYSKIESLASKIESLASKIE
DOLNOSLASKIEDOLNOSLASKIE
MALOPOLSKIEMALOPOLSKIE
RadomRadom
KoninKonin
PlockPlock
TorunTorun
KrosnoKrosno
TarnówTarnów
KaliszKaliszLesznoLeszno
LegnicaLegnica
SieradzSieradz
SiedlceSiedlce
SuwalkiSuwalkiKoszalinKoszalin
WloclawekWloclawek
CiechanówCiechanów
TarnobrzegTarnobrzeg
JeleniaJeleniaGóraGóra
Zielona GóraZielona Góra SkierniewiceSkierniewice
PiotrkówPiotrkówTrybunalskiTrybunalski
PilaPila
SlupskSlupsk
ElblagElblag
OstrolecaOstroleca
CzestochowaCzestochowa
Nowy SaczNowy Sacz
LomzaLomza,
BialaBialaPodlaskaPodlaska
ChelmChelm
ZamoscZamosc, ,
PrzemyslPrzemysl,
Bielsko-Bielsko-BialaBiala
WalbrzychWalbrzychOpoleOpole
KrakówKraków
KielceKielce
LublinLublin
RzeszówRzeszów
OlsztynOlsztyn
KatowiceKatowice
SzczecinSzczecin
BydgoszczBydgoszcz BialystokBialystok
GorzówGorzówWielkopolskiWielkopolski
LódzLódz
PoznanPoznan,
WroclawWroclaw
WARSAWWARSAW
RUSSIANRUSSIANFEDERATIONFEDERATION L I T H U A N I AL I T H U A N I A
UKRAINEUKRAINE
CZECH REPUBLICCZECH REPUBLIC
SLOVAK REPUBLICSLOVAK REPUBLIC
BEL
AR
US
BEL
AR
US
GE
RM
AN
YG
ER
MA
NY
To To BerlinBerlin
To To BerlinBerlin
To To BerlinBerlin
To To DresdenDresden
To To PraguePrague
To To PraguePrague
To To BrnoBrno
To To ZvolenZvolen
To To KosiceKosice
To To L'vivL'viv
To To Kovel'Kovel'
To To Kovel'Kovel'
To To VilniusVilnius
To To GusevGusev
To To PinskPinsk
To To BaranavichyBaranavichy
To To NeubrandenburgNeubrandenburg
K U J AW S K O -P O M O R S K I E
L Ó D Z K I E L U B E L S K I E
LUBUSKIE
MAZOWIECKIE
OPOLSKIE
PODKARPACKIE
P O D L A S K I E
P O M O R S K I E
W I E L K O P O L S K I E
ZACHODNIOPOMORSKIE
WA R M I N S K O -M A Z U R S K I E
SWIETOKRZYSKIESLASKIE
DOLNOSLASKIE
MALOPOLSKIE
Radom
Konin
Plock
Torun
Krosno
Tarnów
KaliszLeszno
Gdynia
Legnica
Sieradz
Siedlce
SuwalkiKoszalin
Wloclawek
Ciechanów
Tarnobrzeg
JeleniaGóra
Zielona Góra Skierniewice
PiotrkówTrybunalski
Pila
Slupsk
Elblag
Ostroleca
Czestochowa
Nowy Sacz
Lomza,
BialaPodlaska
Chelm
Zamosc, ,
Przemysl,
Bielsko-Biala
WalbrzychOpole
Kraków
Kielce
Lublin
Rzeszów
Olsztyn
Katowice
Szczecin
Bydgoszcz Bialystok
GorzówWielkopolski
Gdansk´
Lódz
Poznan,
Wroclaw
WARSAW
RUSSIANFEDERATION L I T H U A N I A
UKRAINE
CZECH REPUBLIC
SLOVAK REPUBLIC
BEL
AR
US
GE
RM
AN
Y
Wisla
San
Notec
Warta
Vistula
Odra
Odra
Nysa
Warta
Wis
la
Bug
N
arew
Bal t ic Sea
Gulf ofGdansk
To Stralsund
To Berlin
To Berlin
To Berlin
To Dresden
To Prague
To Prague
To Brno
To Zvolen
To Kosice
To L'viv
To Kovel'
To Kovel'
To Vilnius
To Gusev
To Pinsk
To Baranavichy
To Neubrandenburg
Rysy(2,499 m)
54°N
52°N
50°N 50°N
52°N
54°N
18°E 20°E 22°E 24°E
16°E14°E 18°E 20°E 22°E 24°E
POLAND
This map was produced by the Map Design Unit of The World Bank. The boundaries, colors, denominations and any other informationshown on this map do not imply, on the part of The World BankGroup, any judgment on the legal status of any territory, or anyendorsement or acceptance of such boundaries.
0 25 50 75
0 25 50 75 Miles
100 Kilometers
IBRD 33467R
MARCH 2007
POLANDSELECTED CITIES AND TOWNS
PROVINCE (WOJEWÓDZTWO) CAPITALS
NATIONAL CAPITAL
RIVERS
MAIN ROADS
MAIN RAILROADS
PROVINCE (WOJEWÓDZTWO) BOUNDARIES
INTERNATIONAL BOUNDARIES