Embed Size (px)
Citation preview
Document of
The World Bank
Report No: ICR1717
IMPLEMENTATION COMPLETION AND RESULTS REPORT
(IDA-41700,TF-90200, IDA-42940, IDA-45260, IDA-46350, IDA-46830, TF-94420,IDA-48130)
SERIES OF CREDITS
TOTALING
IN THE AMOUNT OF SDR 679.9 MILLION
(US$ 1,025 MILLION EQUIVALENT)
TO THE
UNITED REPUBLIC OF TANZANIA
FOR A
THE SECOND SERIES OF
POVERTY REDUCTION SUPPORT CREDITS (PRSCs 4 through 8)
September 1, 2011
Poverty Reduction and Economic Management 2
Africa Region
Pub
lic D
iscl
osur
e A
utho
rized
Pub
lic D
iscl
osur
e A
utho
rized
Pub
lic D
iscl
osur
e A
utho
rized
Pub
lic D
iscl
osur
e A
utho
rized
Pub
lic D
iscl
osur
e A
utho
rized
Pub
lic D
iscl
osur
e A
utho
rized
Pub
lic D
iscl
osur
e A
utho
rized
Pub
lic D
iscl
osur
e A
utho
rized

TANZANIA - GOVERNMENT FISCAL YEAR
July 1 – June 30
CURRENCY EQUIVALENTS
(Exchange Rate Effective as of September 1, 2011)
Currency Unit Tanzania Shilling (T Sh)
US$1.00 T Sh 1,619
Weights and Measures
Metric System
ABBREVIATIONS AND ACRONYMS
ACGEN Accountant General ADB African Development Bank AML Anti–Money Laundering APL Adaptable Programmatic Loan AR Annual Review ART ASDP
Antiretroviral Therapy Agriculture Sector Development Program
ASDS Agriculture Sector Development Strategy ASLMs Agriculture Sector Lead Ministries BARA BEST
Business Activities Registration Act Business Environment Strengthening in Tanzania
BG Budget Guidelines BoT Bank of Tanzania BRELA Business Registration and Licensing Authority CAG CAS
Controller and Auditor General Country Assistance Strategy
CBG CCRO
Capacity Building Grant Certificates of Customary Rights of Occupancy
CDG CEM CFS
Council Development Grant Country Economic Memorandum Consolidated Funds Service
CIDA Canadian International Development Agency CPIA CRW CSO
Country Policy and Institutional Assessment Crisis Response Window Civil Society Organization
CU Customs Union DAWASCO D by D
Dar es Salaam Water and Sewerage Cooperation Decentralization by Devolution
DC District Council DFID DP
Department for International Development Development Partner
DPG Development Partners Group DSA Debt Sustainability Analysis EAC East African Community EIA Environment Impact Assessment EITI EMA
Extractive Industries Transparency Initiative Environmental Management Act
ESF ESW EU
Exogenous Shock Facility Economic and Sector Work European Union
EWURA Energy Water Utility and Regulatory Authority FDI Foreign Direct Investment FEWS Food Early Warning System FIAS FQ
Foreign Investment Advisory Service Financial Quarter
FY Fiscal Year GBS General Budget Support GDP Gross Domestic Product GNFS GNI GoT
Good and Non-Factor Services Gross National Income Government of Tanzania
GWG Governance Working Group HBS Household Budget Survey HIPC HIV/AIDS
Heavily Indebted Poor Countries Human Immunodeficiency Virus/Acquired Immune Deficiency Syndrome
IAS International Accounting Standards ICR ICT IDA IEG IFMIS (IFMS)
Implementation Completion and Results Report Information and Communication Technologies International Development Association Independent Evaluation Group Integrated Financial Management Information System
IMF International Monetary Fund IMR INTOSAI IPT ISA IT
Infant Mortality Rate International Organization of Supreme Audit Intermittent Preventive Therapy International Standard on Auditing Information Technology
JAST JEBS
Joint Assistance Strategy for Tanzania Joint Evaluation of Budget Support
JICA Japan International Cooperation Agency JPD Joint Programming Document JSC Joint Steering Committee KFW Kreditanstalt fuer Wiederaufbau (KfW Development Bank) LGAs Local Government Authorities LGRP Local Government Reform Program LSMS LSRP
Living Standards Measurement Study Legal Sector Reform Program
MAIR MKUKUTA Annual Implementation Review M&E Monitoring and Evaluation MC Municipal Council MDAs Ministry Departments and Agencies MDRI Multilateral Debt Relief Initiative MEFMI Macro Economic Financial Management Institution MFI Microfinance Institution MEVT Ministry of Education and Vocational Training MLEYD Ministry of Labour, Employment and Youth Development MMMP MKUKUTA Monitoring Master Plan MMS MKUKUTA Monitoring System MoFEA Ministry of Finance and Economic Affairs MoJCA Ministry of Constitutional Affairs and Justice
MoU Memorandum of Understanding MoID MNRT
Ministry of Infrastructure Development Ministry of Natural Resources and Tourism
MTEF MTPP
Medium-Term Expenditure Framework Medium Term Pay Policy
MYR Mid-Year Review NACSAP National Anti-Corruption Strategy and Action Plan NAO National Audit Office NBS National Bureau of Statistics NDMC National Debt Management Committee NDS National Debt Strategy NEMA National Environmental Management Act NGOs Non-Governmental Organizations NGSRP National Strategy for Growth and Reduction of Poverty NMSF NRM
National Multi-Sectoral Framework Natural Resource Management
NSPS National Social Protection Strategy OC Other Charges (Non salary recurrent expenditure) OCGS Office of the Chief Government Secretary PAF PCCA
Performance Assessment Framework Prevention and Combating of Corruption Act
PCCB PE PE PEAP PEDP
Prevention and Combating of Corruption Bureau Public Enterprise Personal Emoluments Poverty Eradication Action Plan Primary Education Development Program
PEFAR Public Expenditure and Financial Accountability Review PER Public Expenditure Review PETS PFM PFM
Public Expenditure Tracking Survey Partnership Framework Memorandum Public Financial Management
PFMRP Public Financial Management Reform Program PHDR Poverty and Human Development Report PMO Prime Minister’s Office PMUs Procurement Management Units PO-PSM President’s Office—Public Service Management PMO-RALG Prime Minister’s Office—Regional Administration and Local Government PPP PPRA
Public Private Partnership Public Procurement Regulatory Authority
PRBS Poverty Reduction Budget Support PRGF PRS
Poverty Reduction and Growth Facility Poverty Reduction Strategy
PRSC Poverty Reduction Support Credit PS Permanent Secretary PSI PSC
Policy Support Instrument Public Service Commission
PSD Private Sector Development PSDS Private Sector Development Strategy PSIA PSM PSPIP
Poverty and Social Impact Analysis Public Service Management Public Service Pay and Incentive Policy
PSRC Parastatal Sector Reform Commission PSRP Public Service Reform Program
PwC PricewaterhouseCoopers QAG SA SASE
Quality Assurance Group Safeguard Assessment Selected Accelerated Salary Enhancement
SBAS Strategic Budget Allocation System SDS Service Delivery Surveys SEA SUMATRA SME
Strategic Environment Assessment Surface and Maritime Regulatory Authority Small and Medium Enterprises
SMP Statistical Master Plan SWAp Sectorwide Approach TANESCO TANROADS TB TG
Tanzania Electric Supply Company Ltd. Tanzania National Roads Agency Tuberculosis Thematic Group
THIS TIB
Tanzania HIV/AIDS Indicator Survey Tanzania Investment Bank
TSIP Transport Sector Investment Plan TMP Tax Modernization Program ToR Terms of Reference TPA TPA TRA
Tanzania Ports Authority Temporary Process Action Tanzania Revenue Authority
TWG Technical Working Group UK United Kingdom UNDP United Nations Development Programme USD United States Dollars VAT Value Added Tax VLC WGI
Village Land Certificate Worldwide Governance Indicator
Vice President:
Acting Country Director:
Sector Manager:
Task Team Leaders:
ICR Task Team Leader:
ICR Primary Author:
Obiageli Katryn Ezekwesili
Mercy Miyang Tembon
J. Humberto Lopez
Robert Johann Utz, Paolo B. Zacchia
Yutaka Yoshino
Peter Miovic


i
UNITED REPUBLIC OF TANZANIA
POVERTY REDUCTION SUPPORT CREDITS (PRSCs 4 through 8)
CONTENTS
Data Sheet
A. Basic Information
B. Key Dates
C. Ratings Summary
D. Sector and Theme Codes
E. Bank Staff
F. Results Framework Analysis
G. Ratings of Program Performance in ISRs
1. Program Context, Development Objectives and Design ................................................ 1 2. Key Factors Affecting Implementation and Outcomes ................................................ 10
3. Assessment of Outcomes .............................................................................................. 17 4. Assessment of Risk to Development Outcomes ........................................................... 22
5. Assessment of Bank and Borrower Performance ......................................................... 24 6. Lessons Learned............................................................................................................ 28 7. Comments on Issues Raised by Borrower/Implementing Agencies/Partners............... 30
Annex 1. Bank Lending and Implementation Support/Supervision Processes ................. 31
Annex 2. Program Performance ........................................................................................ 37 Annex 3. Tanzania PRSC 4-8 Series Reform Support Matrix (by PDO Areas for each
PRSC) ............................................................................................................... 41 Annex 4. Tanzania PRSC 4-8 Series Results Framework and Results at the time of
completion ........................................................................................................ 48
Annex 5. Beneficiary Survey Results .............................................................................. 51 Annex 6. Stakeholder Workshop Report and Results ..................................................... 51
Annex 7. Summary of Borrower's ICR and/or Comments on Draft ICR ....................... 51
Annex 8. Comments of Co-financiers and Other Partners/Stakeholders ........................ 51 Annex 9. List of Supporting Documents ........................................................................ 52
MAP .......................................................................................................................... 53

ii
Data Sheet
A. Basic Information
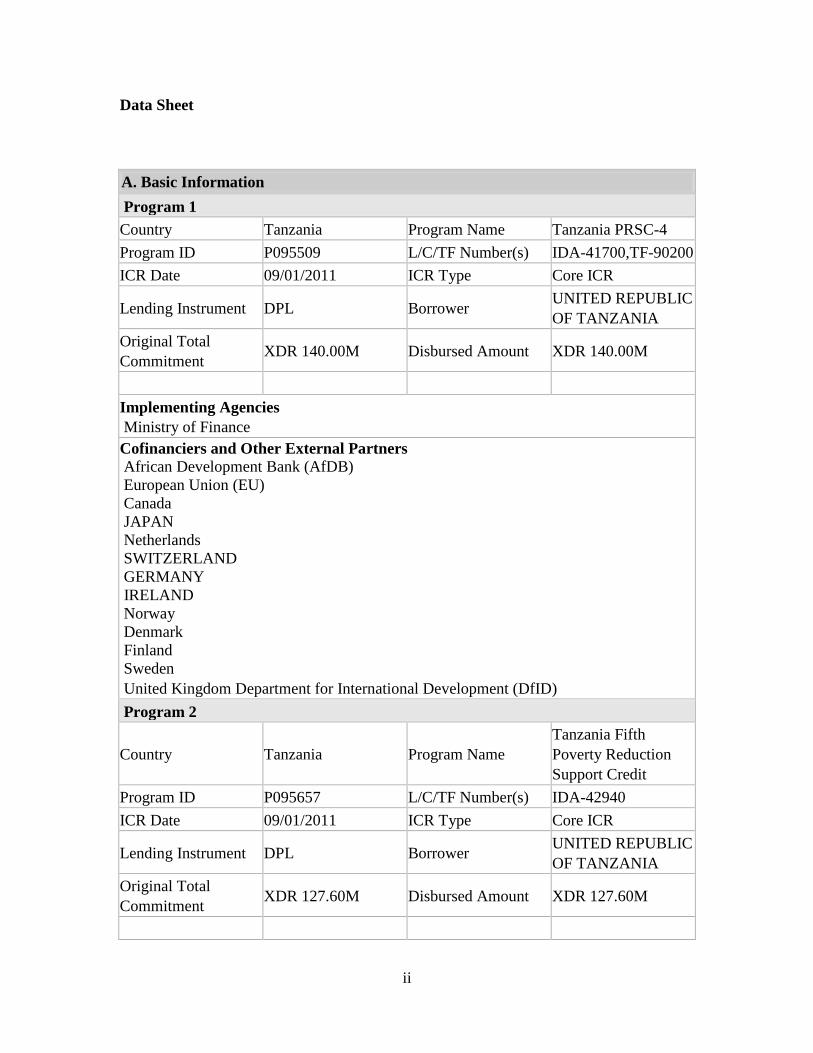
Program 1
Country Tanzania Program Name Tanzania PRSC-4
Program ID P095509 L/C/TF Number(s) IDA-41700,TF-90200
ICR Date 09/01/2011 ICR Type Core ICR
Lending Instrument DPL Borrower UNITED REPUBLIC
OF TANZANIA
Original Total
Commitment XDR 140.00M Disbursed Amount XDR 140.00M
Implementing Agencies
Ministry of Finance
Cofinanciers and Other External Partners African Development Bank (AfDB)
European Union (EU)
Canada
JAPAN
Netherlands
SWITZERLAND
GERMANY
IRELAND
Norway
Denmark
Finland
Sweden
United Kingdom Department for International Development (DfID)
Program 2
Country Tanzania Program Name
Tanzania Fifth
Poverty Reduction
Support Credit
Program ID P095657 L/C/TF Number(s) IDA-42940
ICR Date 09/01/2011 ICR Type Core ICR
Lending Instrument DPL Borrower UNITED REPUBLIC
OF TANZANIA
Original Total
Commitment XDR 127.60M Disbursed Amount XDR 127.60M
iii
Implementing Agencies
Ministry of Finance
Cofinanciers and Other External Partners African Development Bank (AfDB)
European Union (EU)
Canada
JAPAN
Netherlands
SWITZERLAND
GERMANY
IRELAND
Norway
Denmark
Finland
Sweden
United Kingdom Department for International Development (DfID)
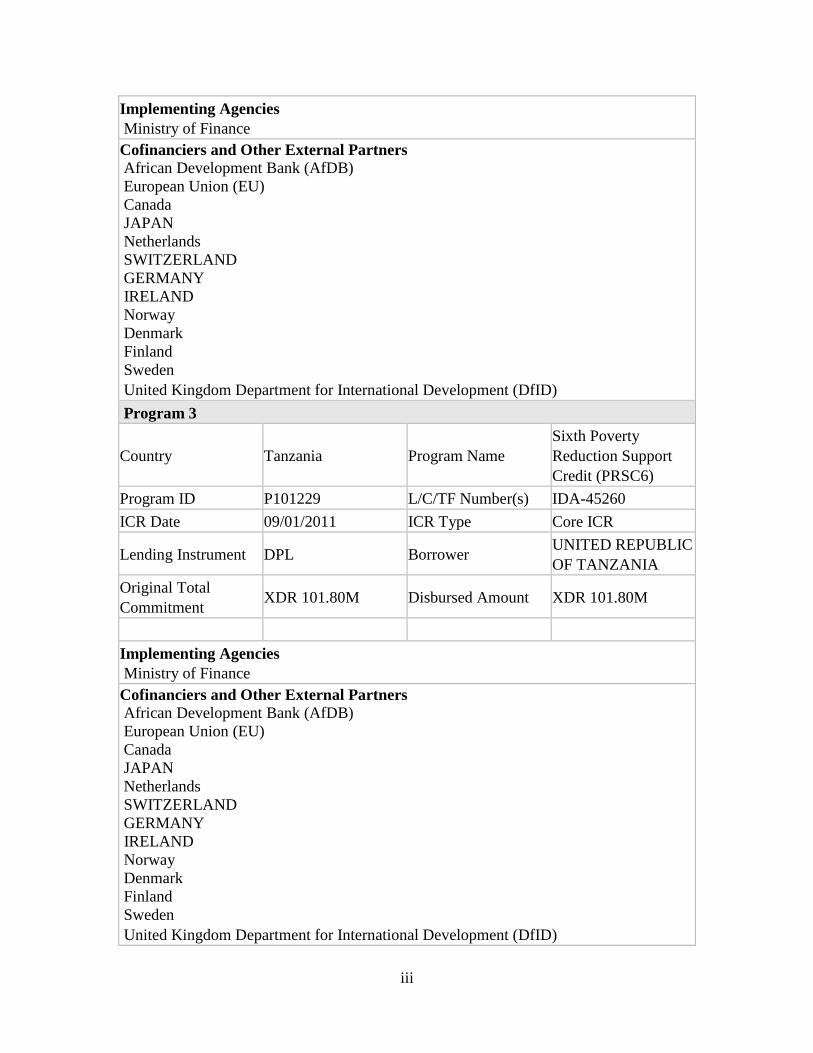
Program 3
Country Tanzania Program Name
Sixth Poverty
Reduction Support
Credit (PRSC6)
Program ID P101229 L/C/TF Number(s) IDA-45260
ICR Date 09/01/2011 ICR Type Core ICR
Lending Instrument DPL Borrower UNITED REPUBLIC
OF TANZANIA
Original Total
Commitment XDR 101.80M Disbursed Amount XDR 101.80M
Implementing Agencies
Ministry of Finance
Cofinanciers and Other External Partners African Development Bank (AfDB)
European Union (EU)
Canada
JAPAN
Netherlands
SWITZERLAND
GERMANY
IRELAND
Norway
Denmark
Finland
Sweden
United Kingdom Department for International Development (DfID)
iv
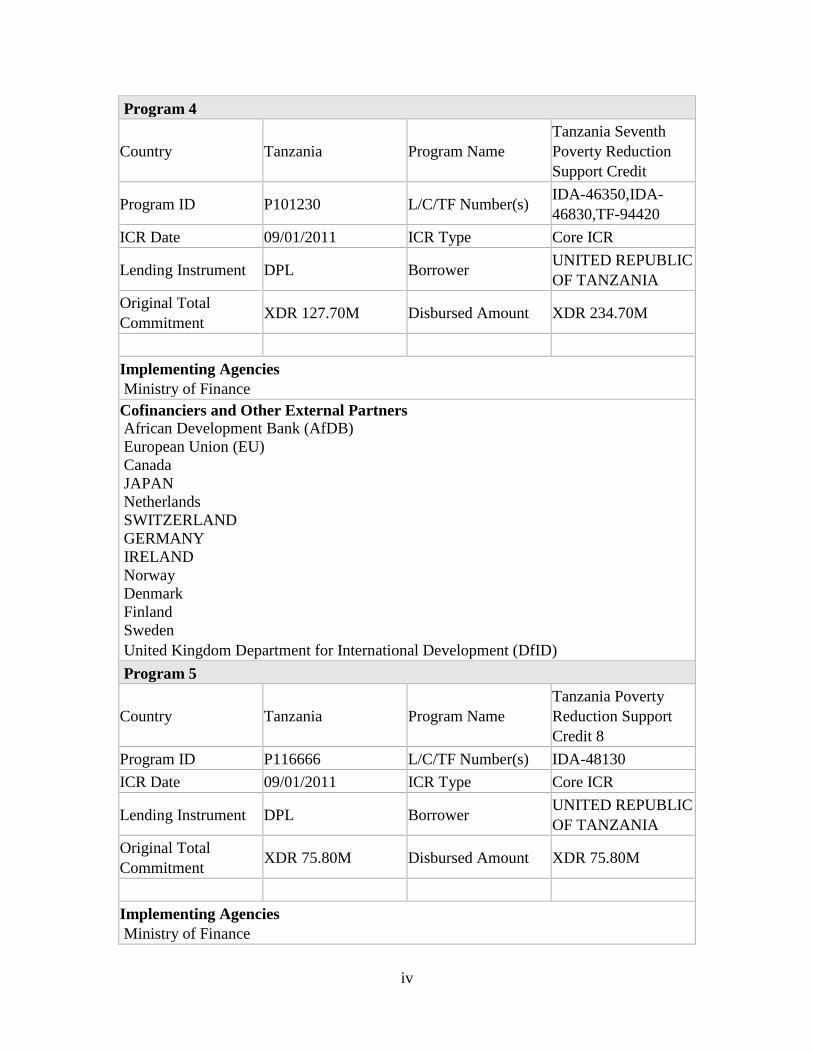
Program 4
Country Tanzania Program Name
Tanzania Seventh
Poverty Reduction
Support Credit
Program ID P101230 L/C/TF Number(s) IDA-46350,IDA-
46830,TF-94420
ICR Date 09/01/2011 ICR Type Core ICR
Lending Instrument DPL Borrower UNITED REPUBLIC
OF TANZANIA
Original Total
Commitment XDR 127.70M Disbursed Amount XDR 234.70M
Implementing Agencies
Ministry of Finance
Cofinanciers and Other External Partners African Development Bank (AfDB)
European Union (EU)
Canada
JAPAN
Netherlands
SWITZERLAND
GERMANY
IRELAND
Norway
Denmark
Finland
Sweden
United Kingdom Department for International Development (DfID)
Program 5
Country Tanzania Program Name
Tanzania Poverty
Reduction Support
Credit 8
Program ID P116666 L/C/TF Number(s) IDA-48130
ICR Date 09/01/2011 ICR Type Core ICR
Lending Instrument DPL Borrower UNITED REPUBLIC
OF TANZANIA
Original Total
Commitment XDR 75.80M Disbursed Amount XDR 75.80M
Implementing Agencies
Ministry of Finance
v
Cofinanciers and Other External Partners African Development Bank (AfDB)
European Union (EU)
Canada
JAPAN
Netherlands
SWITZERLAND
GERMANY
IRELAND
Norway
Denmark
Finland
Sweden
United Kingdom Department for International Development (DfID)
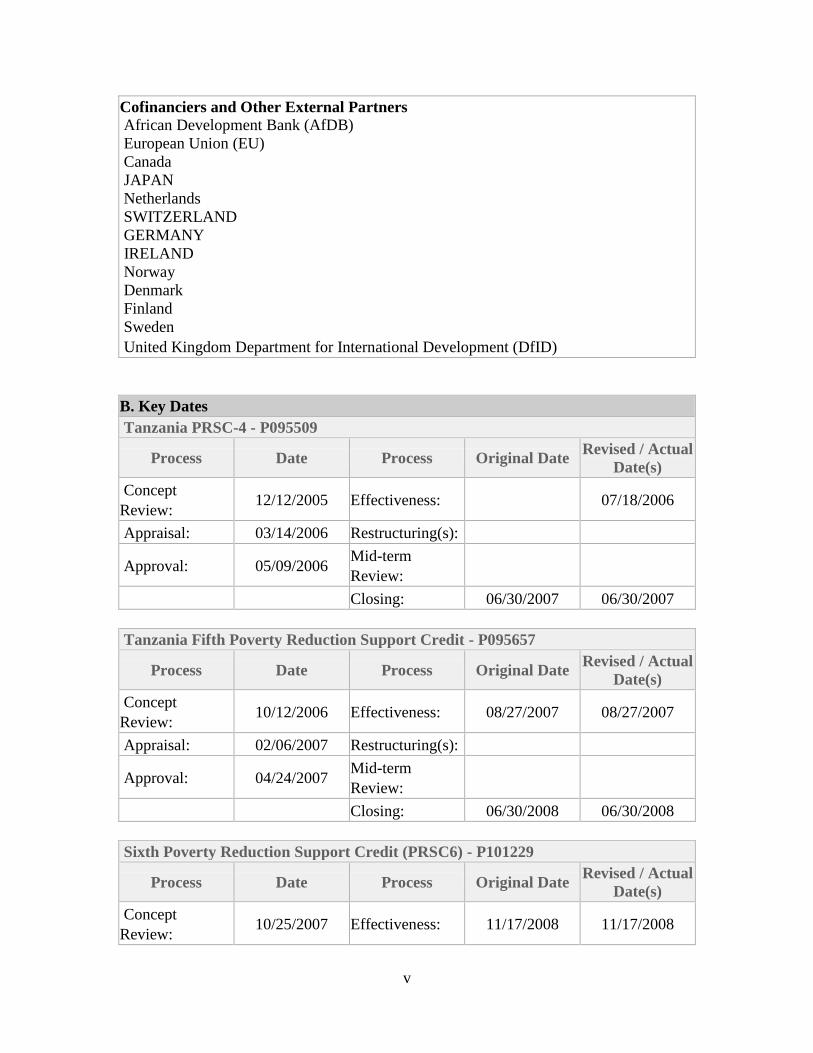
B. Key Dates
Tanzania PRSC-4 - P095509
Process Date Process Original Date Revised / Actual
Date(s)
Concept
Review: 12/12/2005 Effectiveness: 07/18/2006
Appraisal: 03/14/2006 Restructuring(s):
Approval: 05/09/2006 Mid-term
Review:
Closing: 06/30/2007 06/30/2007
Tanzania Fifth Poverty Reduction Support Credit - P095657
Process Date Process Original Date Revised / Actual
Date(s)
Concept
Review: 10/12/2006 Effectiveness: 08/27/2007 08/27/2007
Appraisal: 02/06/2007 Restructuring(s):
Approval: 04/24/2007 Mid-term
Review:
Closing: 06/30/2008 06/30/2008
Sixth Poverty Reduction Support Credit (PRSC6) - P101229
Process Date Process Original Date Revised / Actual
Date(s)
Concept
Review: 10/25/2007 Effectiveness: 11/17/2008 11/17/2008
vi
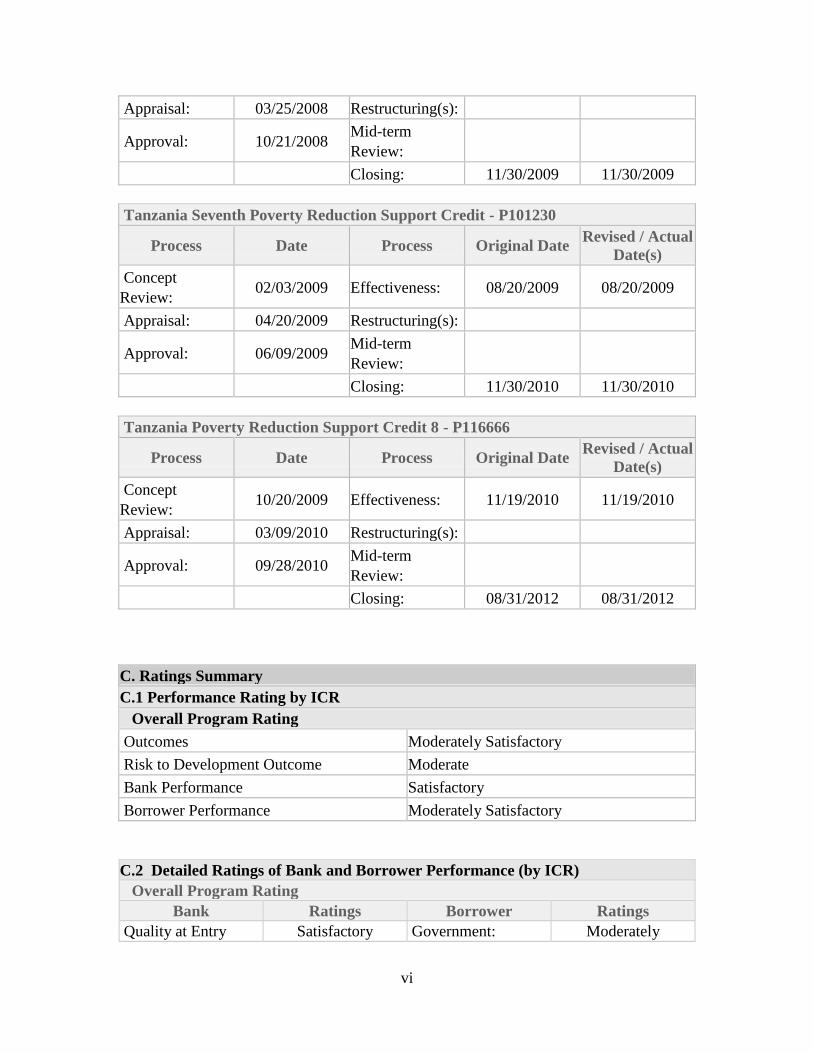
Appraisal: 03/25/2008 Restructuring(s):
Approval: 10/21/2008 Mid-term
Review:
Closing: 11/30/2009 11/30/2009
Tanzania Seventh Poverty Reduction Support Credit - P101230
Process Date Process Original Date Revised / Actual
Date(s)
Concept
Review: 02/03/2009 Effectiveness: 08/20/2009 08/20/2009
Appraisal: 04/20/2009 Restructuring(s):
Approval: 06/09/2009 Mid-term
Review:
Closing: 11/30/2010 11/30/2010
Tanzania Poverty Reduction Support Credit 8 - P116666
Process Date Process Original Date Revised / Actual
Date(s)
Concept
Review: 10/20/2009 Effectiveness: 11/19/2010 11/19/2010
Appraisal: 03/09/2010 Restructuring(s):
Approval: 09/28/2010 Mid-term
Review:
Closing: 08/31/2012 08/31/2012
C. Ratings Summary
C.1 Performance Rating by ICR
Overall Program Rating
Outcomes Moderately Satisfactory
Risk to Development Outcome Moderate
Bank Performance Satisfactory
Borrower Performance Moderately Satisfactory
C.2 Detailed Ratings of Bank and Borrower Performance (by ICR)
Overall Program Rating
Bank Ratings Borrower Ratings
Quality at Entry Satisfactory Government: Moderately
vii
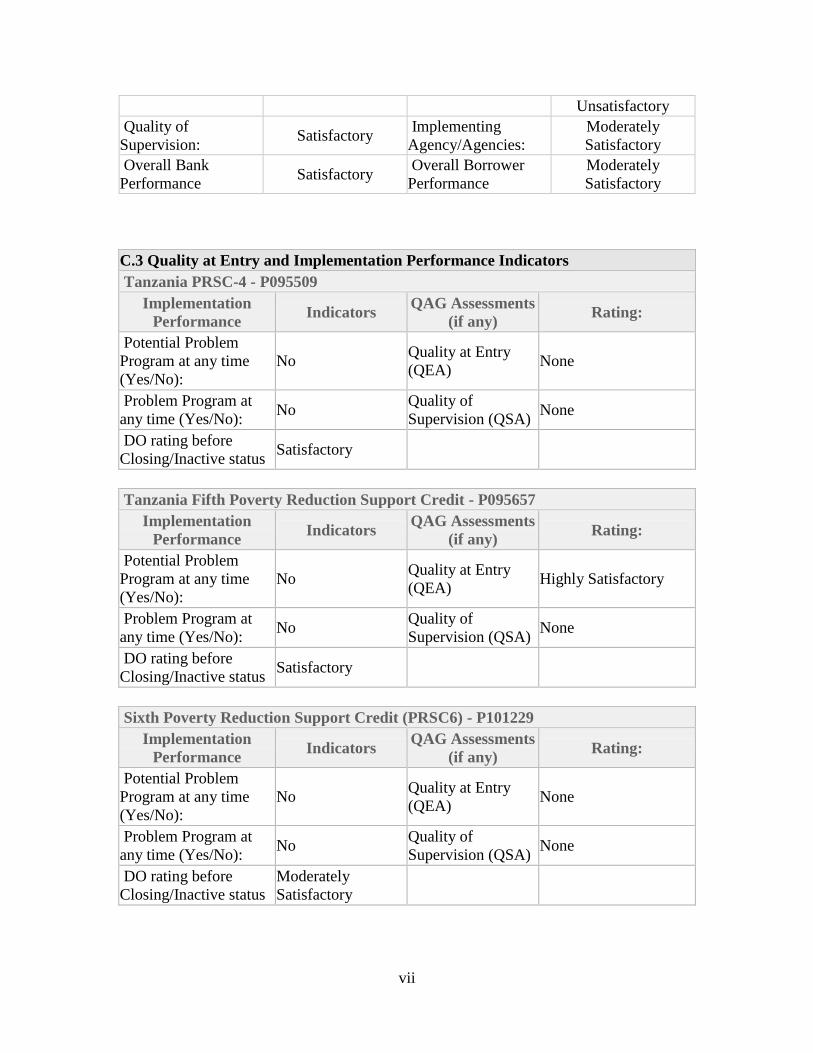
Unsatisfactory
Quality of
Supervision: Satisfactory
Implementing
Agency/Agencies:
Moderately
Satisfactory
Overall Bank
Performance Satisfactory
Overall Borrower
Performance
Moderately
Satisfactory
C.3 Quality at Entry and Implementation Performance Indicators
Tanzania PRSC-4 - P095509
Implementation
Performance Indicators
QAG Assessments
(if any) Rating:
Potential Problem
Program at any time
(Yes/No):
No Quality at Entry
(QEA) None
Problem Program at
any time (Yes/No): No
Quality of
Supervision (QSA) None
DO rating before
Closing/Inactive status Satisfactory
Tanzania Fifth Poverty Reduction Support Credit - P095657
Implementation
Performance Indicators
QAG Assessments
(if any) Rating:
Potential Problem
Program at any time
(Yes/No):
No Quality at Entry
(QEA) Highly Satisfactory
Problem Program at
any time (Yes/No): No
Quality of
Supervision (QSA) None
DO rating before
Closing/Inactive status Satisfactory
Sixth Poverty Reduction Support Credit (PRSC6) - P101229
Implementation
Performance Indicators
QAG Assessments
(if any) Rating:
Potential Problem
Program at any time
(Yes/No):
No Quality at Entry
(QEA) None
Problem Program at
any time (Yes/No): No
Quality of
Supervision (QSA) None
DO rating before
Closing/Inactive status
Moderately
Satisfactory
viii
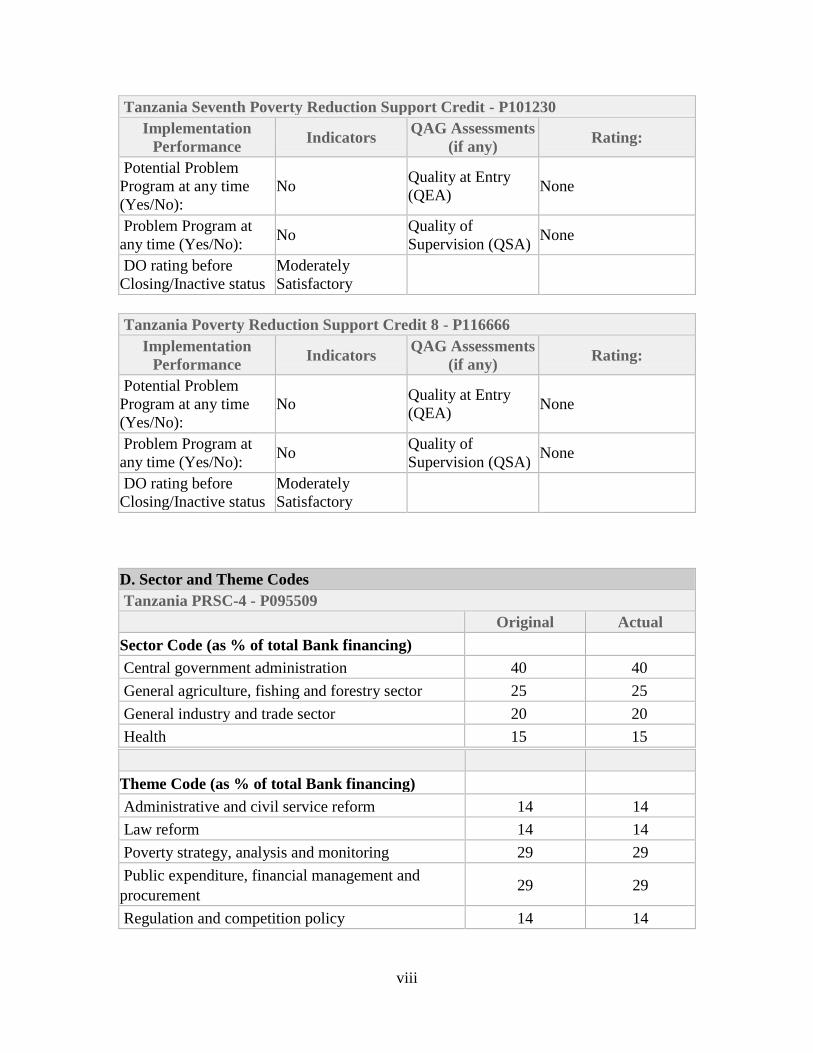
Tanzania Seventh Poverty Reduction Support Credit - P101230
Implementation
Performance Indicators
QAG Assessments
(if any) Rating:
Potential Problem
Program at any time
(Yes/No):
No Quality at Entry
(QEA) None
Problem Program at
any time (Yes/No): No
Quality of
Supervision (QSA) None
DO rating before
Closing/Inactive status
Moderately
Satisfactory
Tanzania Poverty Reduction Support Credit 8 - P116666
Implementation
Performance Indicators
QAG Assessments
(if any) Rating:
Potential Problem
Program at any time
(Yes/No):
No Quality at Entry
(QEA) None
Problem Program at
any time (Yes/No): No
Quality of
Supervision (QSA) None
DO rating before
Closing/Inactive status
Moderately
Satisfactory
D. Sector and Theme Codes
Tanzania PRSC-4 - P095509
Original Actual
Sector Code (as % of total Bank financing)
Central government administration 40 40
General agriculture, fishing and forestry sector 25 25
General industry and trade sector 20 20
Health 15 15
Theme Code (as % of total Bank financing)
Administrative and civil service reform 14 14
Law reform 14 14
Poverty strategy, analysis and monitoring 29 29
Public expenditure, financial management and
procurement 29 29
Regulation and competition policy 14 14
ix
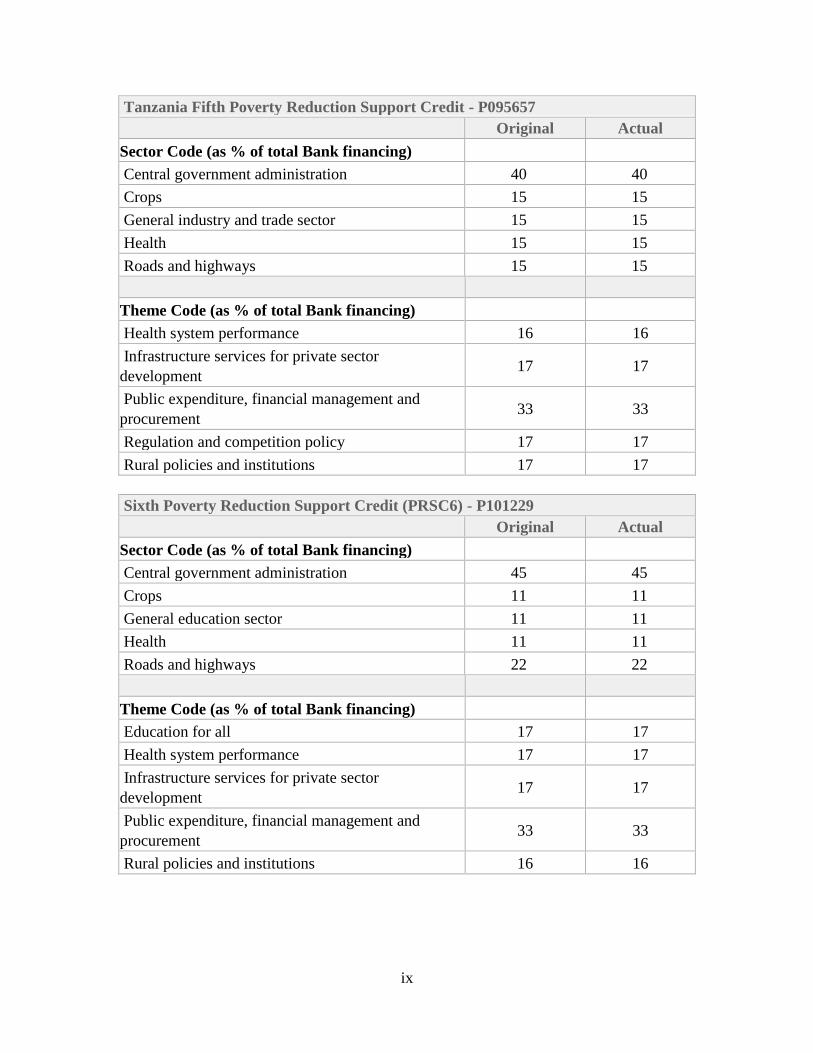
Tanzania Fifth Poverty Reduction Support Credit - P095657
Original Actual
Sector Code (as % of total Bank financing)
Central government administration 40 40
Crops 15 15
General industry and trade sector 15 15
Health 15 15
Roads and highways 15 15
Theme Code (as % of total Bank financing)
Health system performance 16 16
Infrastructure services for private sector
development 17 17
Public expenditure, financial management and
procurement 33 33
Regulation and competition policy 17 17
Rural policies and institutions 17 17
Sixth Poverty Reduction Support Credit (PRSC6) - P101229
Original Actual
Sector Code (as % of total Bank financing)
Central government administration 45 45
Crops 11 11
General education sector 11 11
Health 11 11
Roads and highways 22 22
Theme Code (as % of total Bank financing)
Education for all 17 17
Health system performance 17 17
Infrastructure services for private sector
development 17 17
Public expenditure, financial management and
procurement 33 33
Rural policies and institutions 16 16

x
Tanzania Seventh Poverty Reduction Support Credit - P101230
Original Actual
Sector Code (as % of total Bank financing)
Central government administration 40 40
General agriculture, fishing and forestry sector 20 20
General education sector 15 15
General energy sector 20 20
Health 5 5
Theme Code (as % of total Bank financing)
Administrative and civil service reform 20 20
Education for all 10 10
Health system performance 10 10
Other public sector governance 30 30
Public expenditure, financial management and
procurement 30 30
Tanzania Poverty Reduction Support Credit 8 - P116666
Original Actual
Sector Code (as % of total Bank financing)
Central government administration 25 25
General agriculture, fishing and forestry sector 25 25
General industry and trade sector 25 25
General public administration sector 25 25
Theme Code (as % of total Bank financing)
Administrative and civil service reform 14 14
Environmental policies and institutions 14 14
Other financial and private sector development 14 14
Poverty strategy, analysis and monitoring 29 29
Public expenditure, financial management and
procurement 29 29
xi
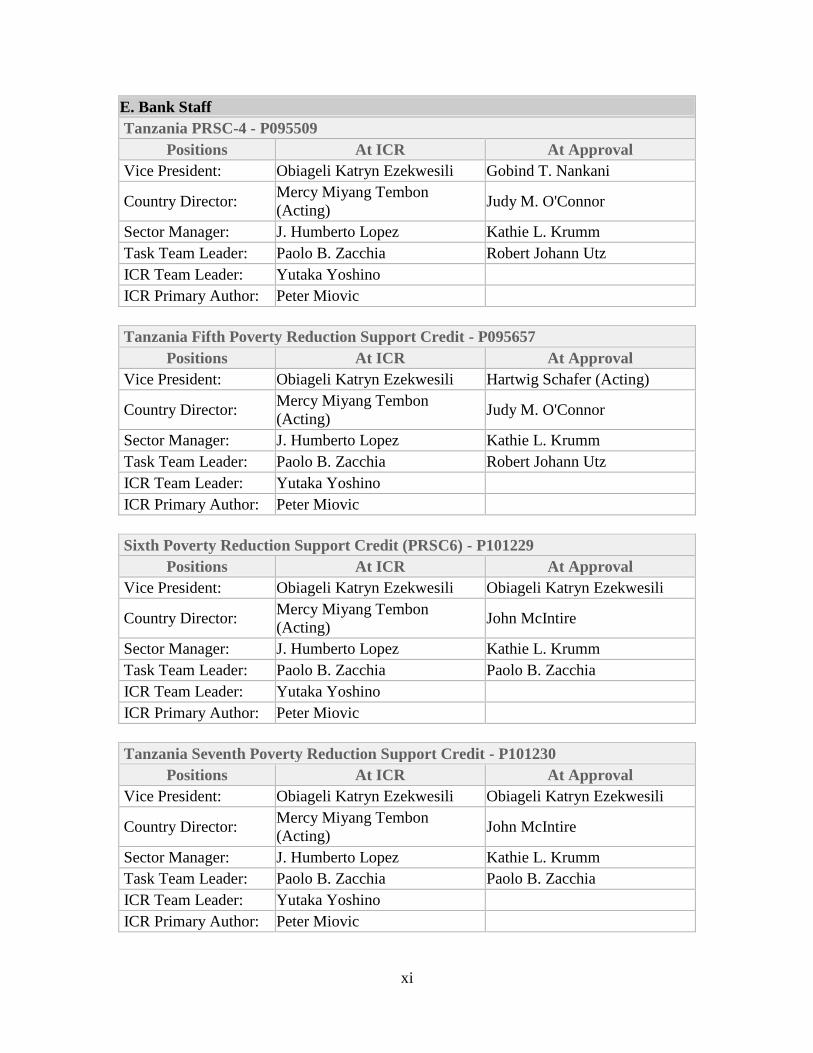
E. Bank Staff
Tanzania PRSC-4 - P095509
Positions At ICR At Approval
Vice President: Obiageli Katryn Ezekwesili Gobind T. Nankani
Country Director: Mercy Miyang Tembon
(Acting) Judy M. O'Connor
Sector Manager: J. Humberto Lopez Kathie L. Krumm
Task Team Leader: Paolo B. Zacchia Robert Johann Utz
ICR Team Leader: Yutaka Yoshino
ICR Primary Author: Peter Miovic
Tanzania Fifth Poverty Reduction Support Credit - P095657
Positions At ICR At Approval
Vice President: Obiageli Katryn Ezekwesili Hartwig Schafer (Acting)
Country Director: Mercy Miyang Tembon
(Acting) Judy M. O'Connor
Sector Manager: J. Humberto Lopez Kathie L. Krumm
Task Team Leader: Paolo B. Zacchia Robert Johann Utz
ICR Team Leader: Yutaka Yoshino
ICR Primary Author: Peter Miovic
Sixth Poverty Reduction Support Credit (PRSC6) - P101229
Positions At ICR At Approval
Vice President: Obiageli Katryn Ezekwesili Obiageli Katryn Ezekwesili
Country Director: Mercy Miyang Tembon
(Acting) John McIntire
Sector Manager: J. Humberto Lopez Kathie L. Krumm
Task Team Leader: Paolo B. Zacchia Paolo B. Zacchia
ICR Team Leader: Yutaka Yoshino
ICR Primary Author: Peter Miovic
Tanzania Seventh Poverty Reduction Support Credit - P101230
Positions At ICR At Approval
Vice President: Obiageli Katryn Ezekwesili Obiageli Katryn Ezekwesili
Country Director: Mercy Miyang Tembon
(Acting) John McIntire
Sector Manager: J. Humberto Lopez Kathie L. Krumm
Task Team Leader: Paolo B. Zacchia Paolo B. Zacchia
ICR Team Leader: Yutaka Yoshino
ICR Primary Author: Peter Miovic

xii
Tanzania Poverty Reduction Support Credit 8 - P116666
Positions At ICR At Approval
Vice President: Obiageli Katryn Ezekwesili Obiageli Katryn Ezekwesili
Country Director: Mercy Miyang Tembon
(Acting) John McIntire
Sector Manager: J. Humberto Lopez Kathie L. Krumm
Task Team Leader: Paolo B. Zacchia Paolo B. Zacchia
ICR Team Leader: Yutaka Yoshino
ICR Primary Author: Peter Miovic
F. Results Framework Analysis
Program Development Objectives (from Program Document) This PRSC series supports the implementation of the Country Assistance Strategy and
contributes to the achievement of Tanzania’s Growth and Poverty Reduction Strategy
(MKUKUTA) objectives in several ways: by funding MKUKUTA implementation; by
fostering policy reform and institutional changes in the outcome areas; and by supporting
the development of government systems for the implementation and monitoring of
MKUKUTA. The PRSC focuses on the following development objectives: (i) reduce
income poverty, (ii) improve key human development objectives, and (iii) improve the
capacity of the Government to design and implement development policies in a
transparent and efficient manner.
(a) PDO Indicator(s)
Tanzania PRSC-4 - P095509
Indicator Baseline
Value
Original Target
Values (from
approval
documents)
Formally
Revised
Target
Values
Actual Value
Achieved at
Completion or
Target Years
Indicator 1 : Credit to Private Sector (% of GDP)
Value
(quantitative or
Qualitative)
7.9 % 13% 17%
Date achieved 12/31/2005 12/31/2010 12/31/2010
Comments
(incl. %
achievement)
Fully achieved
xiii
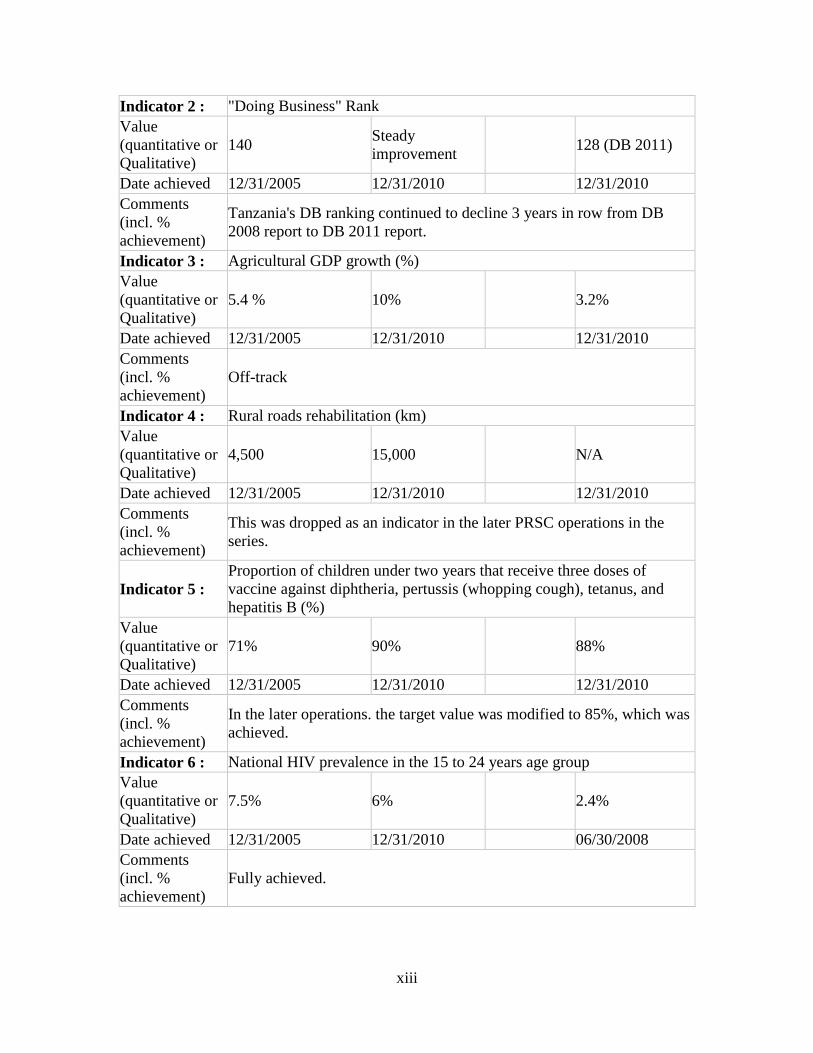
Indicator 2 : "Doing Business" Rank
Value
(quantitative or
Qualitative)
140 Steady
improvement 128 (DB 2011)
Date achieved 12/31/2005 12/31/2010 12/31/2010
Comments
(incl. %
achievement)
Tanzania's DB ranking continued to decline 3 years in row from DB
2008 report to DB 2011 report.
Indicator 3 : Agricultural GDP growth (%)
Value
(quantitative or
Qualitative)
5.4 % 10% 3.2%
Date achieved 12/31/2005 12/31/2010 12/31/2010
Comments
(incl. %
achievement)
Off-track
Indicator 4 : Rural roads rehabilitation (km)
Value
(quantitative or
Qualitative)
4,500 15,000 N/A
Date achieved 12/31/2005 12/31/2010 12/31/2010
Comments
(incl. %
achievement)
This was dropped as an indicator in the later PRSC operations in the
series.
Indicator 5 :
Proportion of children under two years that receive three doses of
vaccine against diphtheria, pertussis (whopping cough), tetanus, and
hepatitis B (%)
Value
(quantitative or
Qualitative)
71% 90% 88%
Date achieved 12/31/2005 12/31/2010 12/31/2010
Comments
(incl. %
achievement)
In the later operations. the target value was modified to 85%, which was
achieved.
Indicator 6 : National HIV prevalence in the 15 to 24 years age group
Value
(quantitative or
Qualitative)
7.5% 6% 2.4%
Date achieved 12/31/2005 12/31/2010 06/30/2008
Comments
(incl. %
achievement)
Fully achieved.
xiv
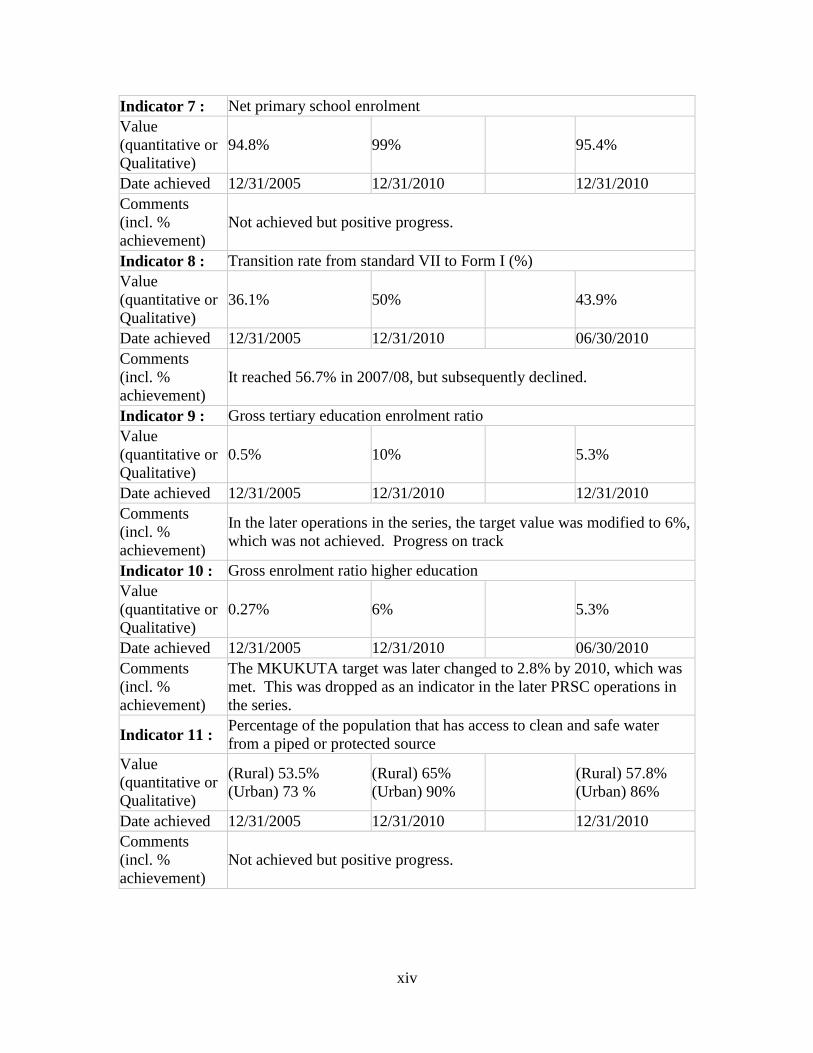
Indicator 7 : Net primary school enrolment
Value
(quantitative or
Qualitative)
94.8% 99% 95.4%
Date achieved 12/31/2005 12/31/2010 12/31/2010
Comments
(incl. %
achievement)
Not achieved but positive progress.
Indicator 8 : Transition rate from standard VII to Form I (%)
Value
(quantitative or
Qualitative)
36.1% 50% 43.9%
Date achieved 12/31/2005 12/31/2010 06/30/2010
Comments
(incl. %
achievement)
It reached 56.7% in 2007/08, but subsequently declined.
Indicator 9 : Gross tertiary education enrolment ratio
Value
(quantitative or
Qualitative)
0.5% 10% 5.3%
Date achieved 12/31/2005 12/31/2010 12/31/2010
Comments
(incl. %
achievement)
In the later operations in the series, the target value was modified to 6%,
which was not achieved. Progress on track
Indicator 10 : Gross enrolment ratio higher education
Value
(quantitative or
Qualitative)
0.27% 6% 5.3%
Date achieved 12/31/2005 12/31/2010 06/30/2010
Comments
(incl. %
achievement)
The MKUKUTA target was later changed to 2.8% by 2010, which was
met. This was dropped as an indicator in the later PRSC operations in
the series.
Indicator 11 : Percentage of the population that has access to clean and safe water
from a piped or protected source
Value
(quantitative or
Qualitative)
(Rural) 53.5%
(Urban) 73 %
(Rural) 65%
(Urban) 90%
(Rural) 57.8%
(Urban) 86%
Date achieved 12/31/2005 12/31/2010 12/31/2010
Comments
(incl. %
achievement)
Not achieved but positive progress.
xv
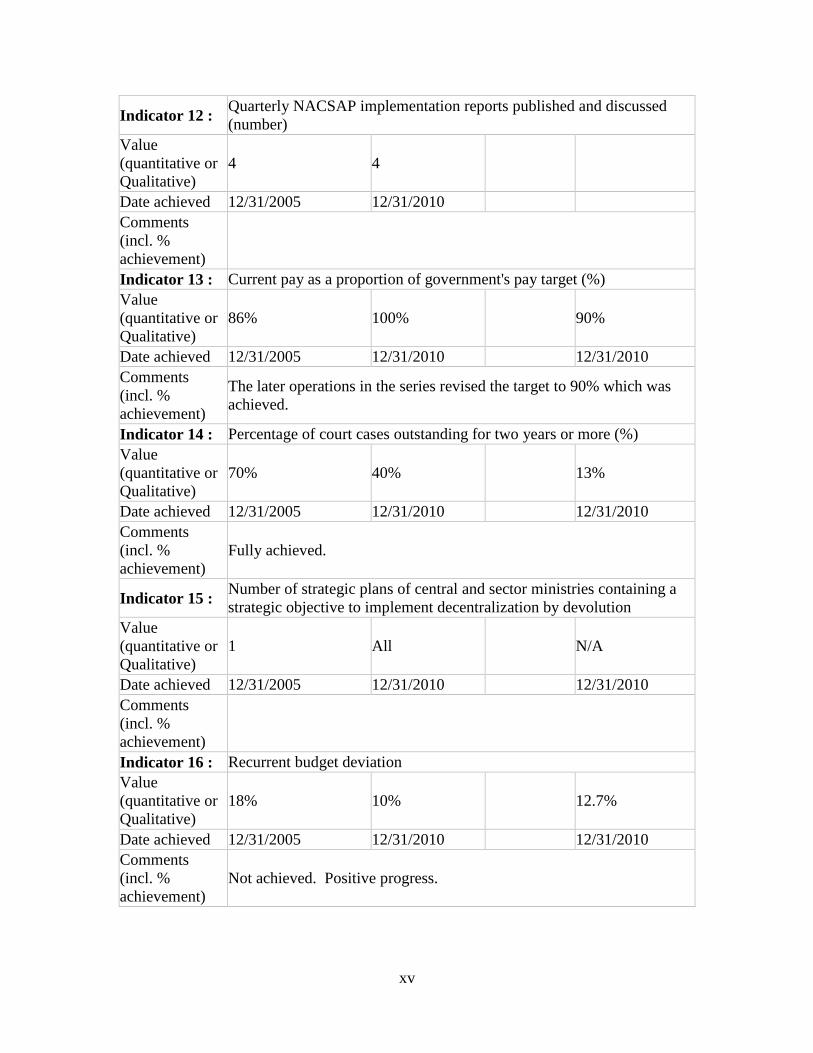
Indicator 12 : Quarterly NACSAP implementation reports published and discussed
(number)
Value
(quantitative or
Qualitative)
4 4
Date achieved 12/31/2005 12/31/2010
Comments
(incl. %
achievement)
Indicator 13 : Current pay as a proportion of government's pay target (%)
Value
(quantitative or
Qualitative)
86% 100% 90%
Date achieved 12/31/2005 12/31/2010 12/31/2010
Comments
(incl. %
achievement)
The later operations in the series revised the target to 90% which was
achieved.
Indicator 14 : Percentage of court cases outstanding for two years or more (%)
Value
(quantitative or
Qualitative)
70% 40% 13%
Date achieved 12/31/2005 12/31/2010 12/31/2010
Comments
(incl. %
achievement)
Fully achieved.
Indicator 15 : Number of strategic plans of central and sector ministries containing a
strategic objective to implement decentralization by devolution
Value
(quantitative or
Qualitative)
1 All N/A
Date achieved 12/31/2005 12/31/2010 12/31/2010
Comments
(incl. %
achievement)
Indicator 16 : Recurrent budget deviation
Value
(quantitative or
Qualitative)
18% 10% 12.7%
Date achieved 12/31/2005 12/31/2010 12/31/2010
Comments
(incl. %
achievement)
Not achieved. Positive progress.

xvi
Indicator 17 : Quality of NAO Audit Report
Value
(quantitative or
Qualitative)
NAO starting to
introduce INTOSAI
and ISA
Fully compliant
with
international
standards
9 out of 10
Afrosai 2
conditions were
met
Date achieved 12/31/2005 12/31/2010 12/31/2010
Comments
(incl. %
achievement)
Not fully achieved, but on track.
Indicator 18 : Delay in submission of NAO Audit Report to Parliament
Value
(quantitative or
Qualitative)
6 months 0 month 0 month
Date achieved 12/31/2005 12/31/2010 12/31/2010
Comments
(incl. %
achievement)
Fully achieved.
Indicator 19 : Number of procuring entities complying with the Public Procurement
Act 2004
Value
(quantitative or
Qualitative)
10% 80% 73%
Date achieved 12/31/2005 12/31/2010 12/31/2010
Comments
(incl. %
achievement)
Not achieved. But positive progress.
Tanzania Fifth Poverty Reduction Support Credit - P095657
Indicator Baseline
Value
Original Target
Values (from
approval
documents)
Formally
Revised
Target
Values
Actual Value
Achieved at
Completion or
Target Years
Indicator 1 : Credit to Private sector
Value
(quantitative or
Qualitative)
Tsh 1.2 bn
30% annual
increase (Tsh 4.5
bn by 2010)
Tsh 5.2 bn
Date achieved 06/30/2005 12/31/2010 06/30/2010
Comments
(incl. %
achievement)
Fully achieved.
xvii
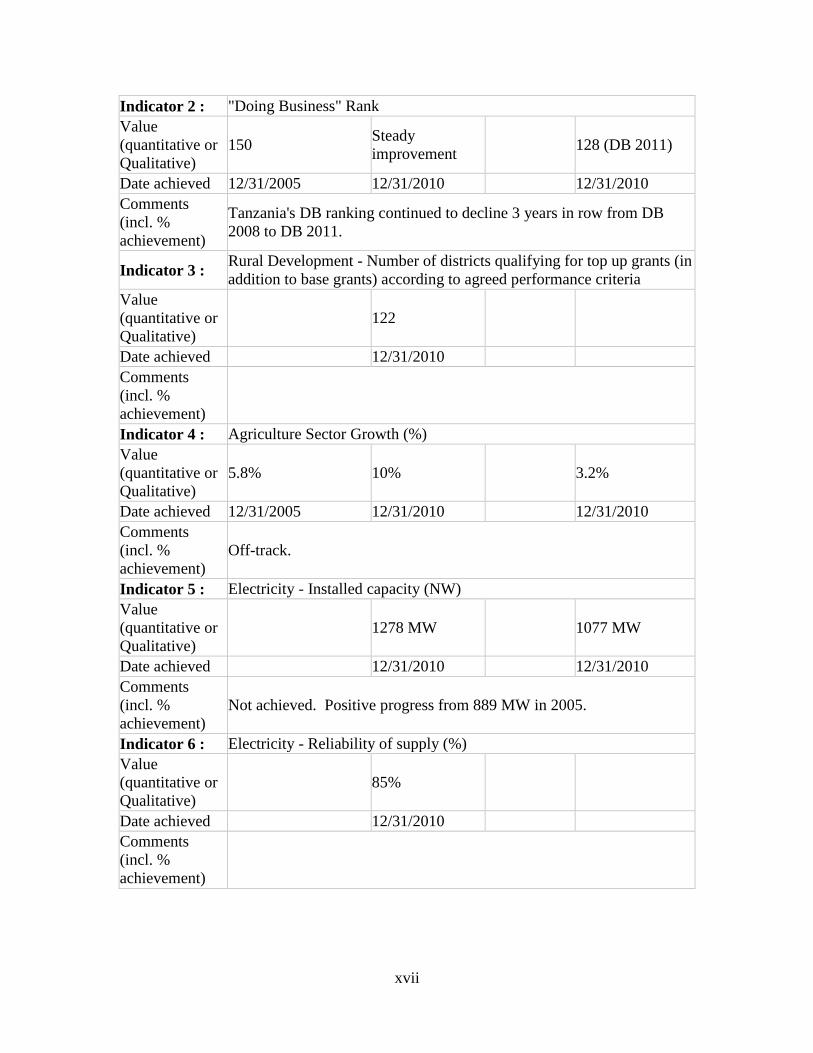
Indicator 2 : "Doing Business" Rank
Value
(quantitative or
Qualitative)
150 Steady
improvement 128 (DB 2011)
Date achieved 12/31/2005 12/31/2010 12/31/2010
Comments
(incl. %
achievement)
Tanzania's DB ranking continued to decline 3 years in row from DB
2008 to DB 2011.
Indicator 3 : Rural Development - Number of districts qualifying for top up grants (in
addition to base grants) according to agreed performance criteria
Value
(quantitative or
Qualitative)
122
Date achieved 12/31/2010
Comments
(incl. %
achievement)
Indicator 4 : Agriculture Sector Growth (%)
Value
(quantitative or
Qualitative)
5.8% 10% 3.2%
Date achieved 12/31/2005 12/31/2010 12/31/2010
Comments
(incl. %
achievement)
Off-track.
Indicator 5 : Electricity - Installed capacity (NW)
Value
(quantitative or
Qualitative)
1278 MW 1077 MW
Date achieved 12/31/2010 12/31/2010
Comments
(incl. %
achievement)
Not achieved. Positive progress from 889 MW in 2005.
Indicator 6 : Electricity - Reliability of supply (%)
Value
(quantitative or
Qualitative)
85%
Date achieved 12/31/2010
Comments
(incl. %
achievement)
xviii
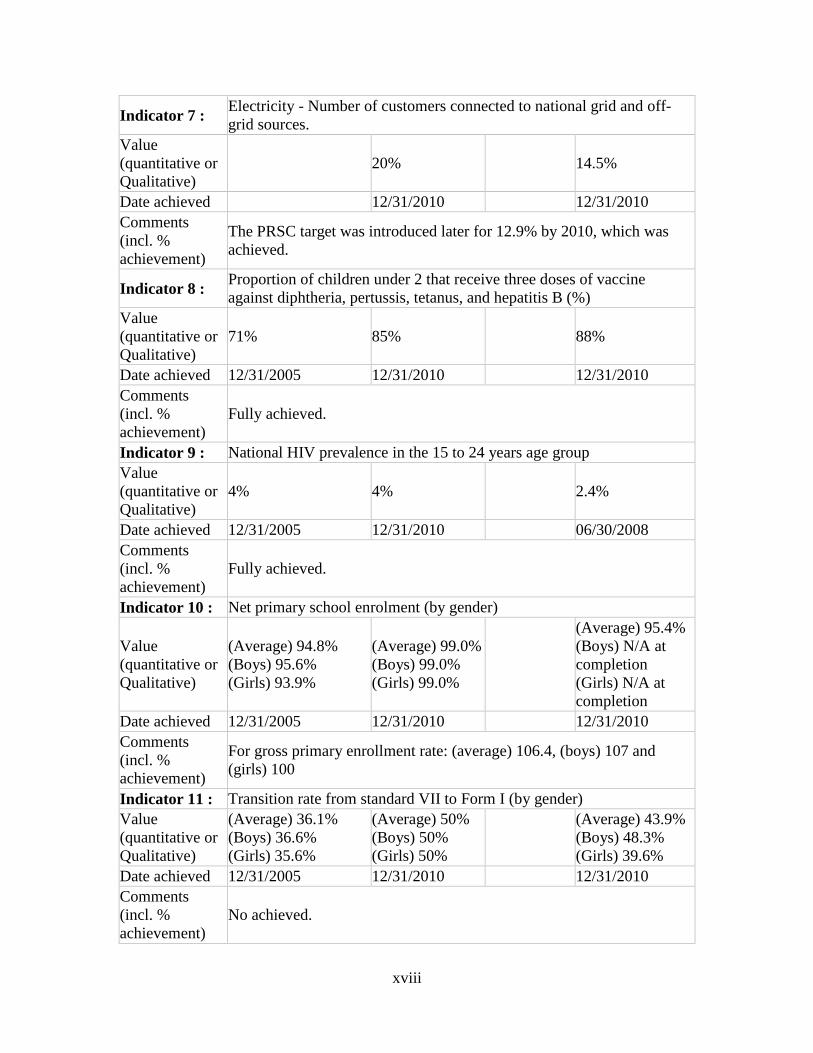
Indicator 7 : Electricity - Number of customers connected to national grid and off-
grid sources.
Value
(quantitative or
Qualitative)
20% 14.5%
Date achieved 12/31/2010 12/31/2010
Comments
(incl. %
achievement)
The PRSC target was introduced later for 12.9% by 2010, which was
achieved.
Indicator 8 : Proportion of children under 2 that receive three doses of vaccine
against diphtheria, pertussis, tetanus, and hepatitis B (%)
Value
(quantitative or
Qualitative)
71% 85% 88%
Date achieved 12/31/2005 12/31/2010 12/31/2010
Comments
(incl. %
achievement)
Fully achieved.
Indicator 9 : National HIV prevalence in the 15 to 24 years age group
Value
(quantitative or
Qualitative)
4% 4% 2.4%
Date achieved 12/31/2005 12/31/2010 06/30/2008
Comments
(incl. %
achievement)
Fully achieved.
Indicator 10 : Net primary school enrolment (by gender)
Value
(quantitative or
Qualitative)
(Average) 94.8%
(Boys) 95.6%
(Girls) 93.9%
(Average) 99.0%
(Boys) 99.0%
(Girls) 99.0%
(Average) 95.4%
(Boys) N/A at
completion
(Girls) N/A at
completion
Date achieved 12/31/2005 12/31/2010 12/31/2010
Comments
(incl. %
achievement)
For gross primary enrollment rate: (average) 106.4, (boys) 107 and
(girls) 100
Indicator 11 : Transition rate from standard VII to Form I (by gender)
Value
(quantitative or
Qualitative)
(Average) 36.1%
(Boys) 36.6%
(Girls) 35.6%
(Average) 50%
(Boys) 50%
(Girls) 50%
(Average) 43.9%
(Boys) 48.3%
(Girls) 39.6%
Date achieved 12/31/2005 12/31/2010 12/31/2010
Comments
(incl. %
achievement)
No achieved.
xix
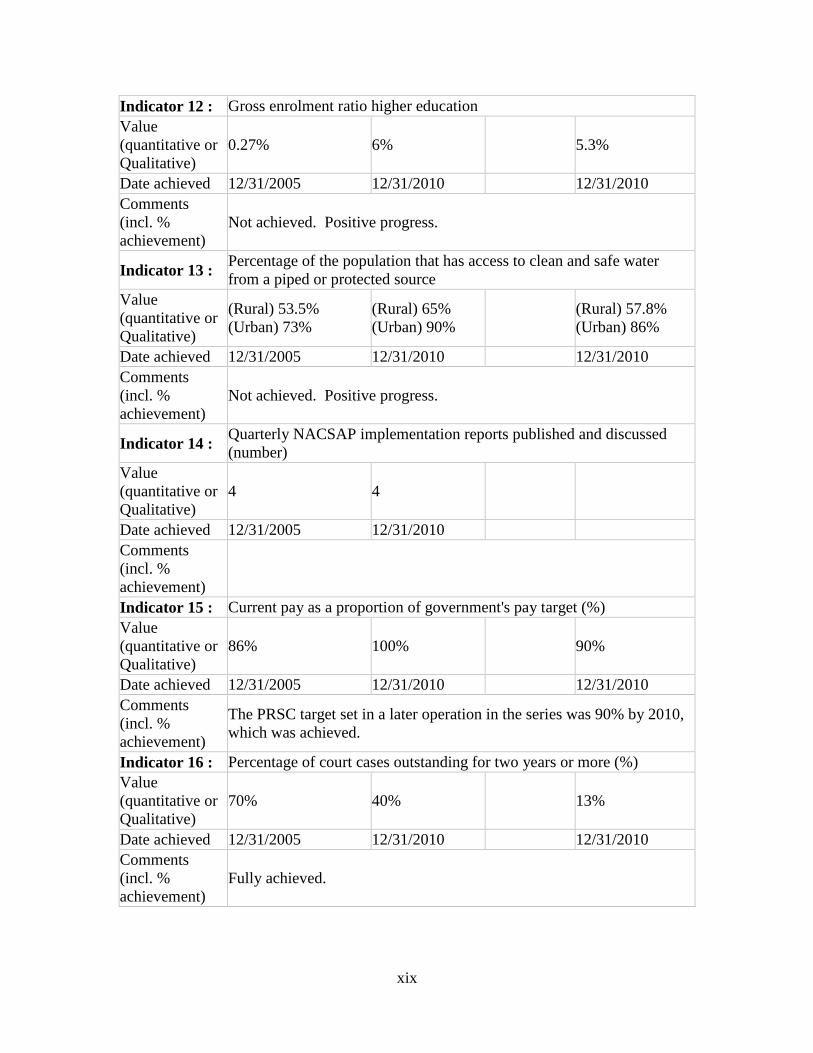
Indicator 12 : Gross enrolment ratio higher education
Value
(quantitative or
Qualitative)
0.27% 6% 5.3%
Date achieved 12/31/2005 12/31/2010 12/31/2010
Comments
(incl. %
achievement)
Not achieved. Positive progress.
Indicator 13 : Percentage of the population that has access to clean and safe water
from a piped or protected source
Value
(quantitative or
Qualitative)
(Rural) 53.5%
(Urban) 73%
(Rural) 65%
(Urban) 90%
(Rural) 57.8%
(Urban) 86%
Date achieved 12/31/2005 12/31/2010 12/31/2010
Comments
(incl. %
achievement)
Not achieved. Positive progress.
Indicator 14 : Quarterly NACSAP implementation reports published and discussed
(number)
Value
(quantitative or
Qualitative)
4 4
Date achieved 12/31/2005 12/31/2010
Comments
(incl. %
achievement)
Indicator 15 : Current pay as a proportion of government's pay target (%)
Value
(quantitative or
Qualitative)
86% 100% 90%
Date achieved 12/31/2005 12/31/2010 12/31/2010
Comments
(incl. %
achievement)
The PRSC target set in a later operation in the series was 90% by 2010,
which was achieved.
Indicator 16 : Percentage of court cases outstanding for two years or more (%)
Value
(quantitative or
Qualitative)
70% 40% 13%
Date achieved 12/31/2005 12/31/2010 12/31/2010
Comments
(incl. %
achievement)
Fully achieved.
xx
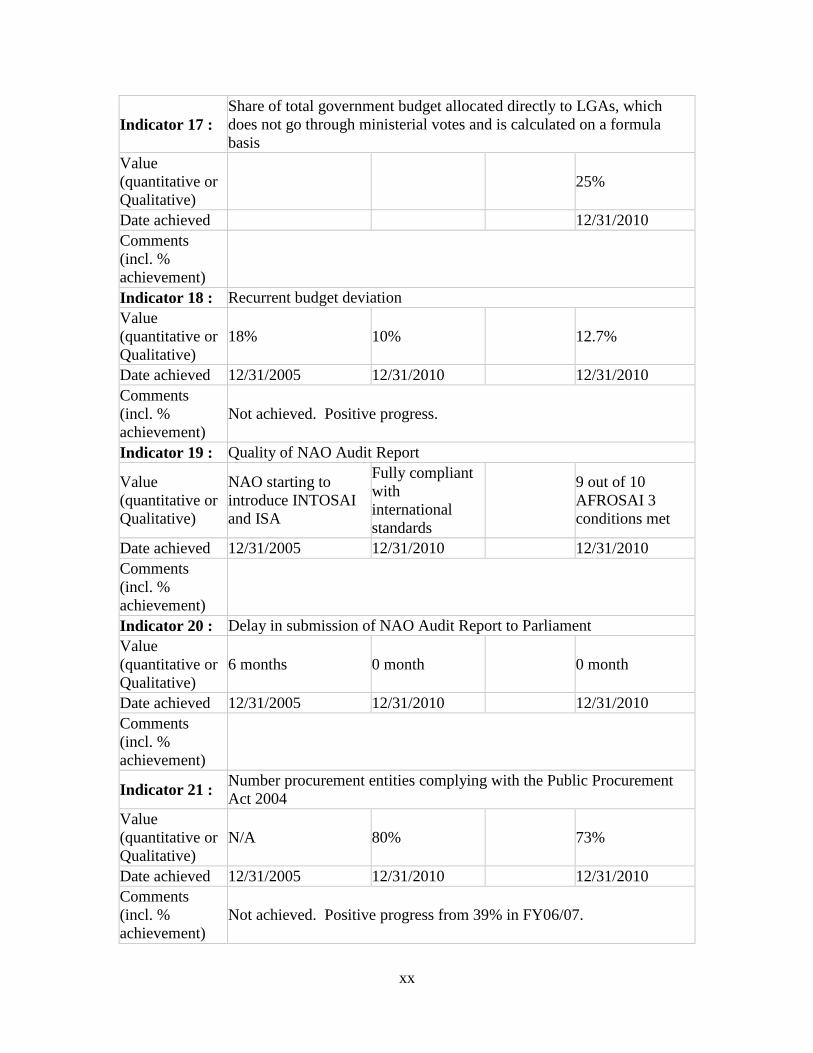
Indicator 17 :
Share of total government budget allocated directly to LGAs, which
does not go through ministerial votes and is calculated on a formula
basis
Value
(quantitative or
Qualitative)
25%
Date achieved 12/31/2010
Comments
(incl. %
achievement)
Indicator 18 : Recurrent budget deviation
Value
(quantitative or
Qualitative)
18% 10% 12.7%
Date achieved 12/31/2005 12/31/2010 12/31/2010
Comments
(incl. %
achievement)
Not achieved. Positive progress.
Indicator 19 : Quality of NAO Audit Report
Value
(quantitative or
Qualitative)
NAO starting to
introduce INTOSAI
and ISA
Fully compliant
with
international
standards
9 out of 10
AFROSAI 3
conditions met
Date achieved 12/31/2005 12/31/2010 12/31/2010
Comments
(incl. %
achievement)
Indicator 20 : Delay in submission of NAO Audit Report to Parliament
Value
(quantitative or
Qualitative)
6 months 0 month 0 month
Date achieved 12/31/2005 12/31/2010 12/31/2010
Comments
(incl. %
achievement)
Indicator 21 : Number procurement entities complying with the Public Procurement
Act 2004
Value
(quantitative or
Qualitative)
N/A 80% 73%
Date achieved 12/31/2005 12/31/2010 12/31/2010
Comments
(incl. %
achievement)
Not achieved. Positive progress from 39% in FY06/07.
xxi
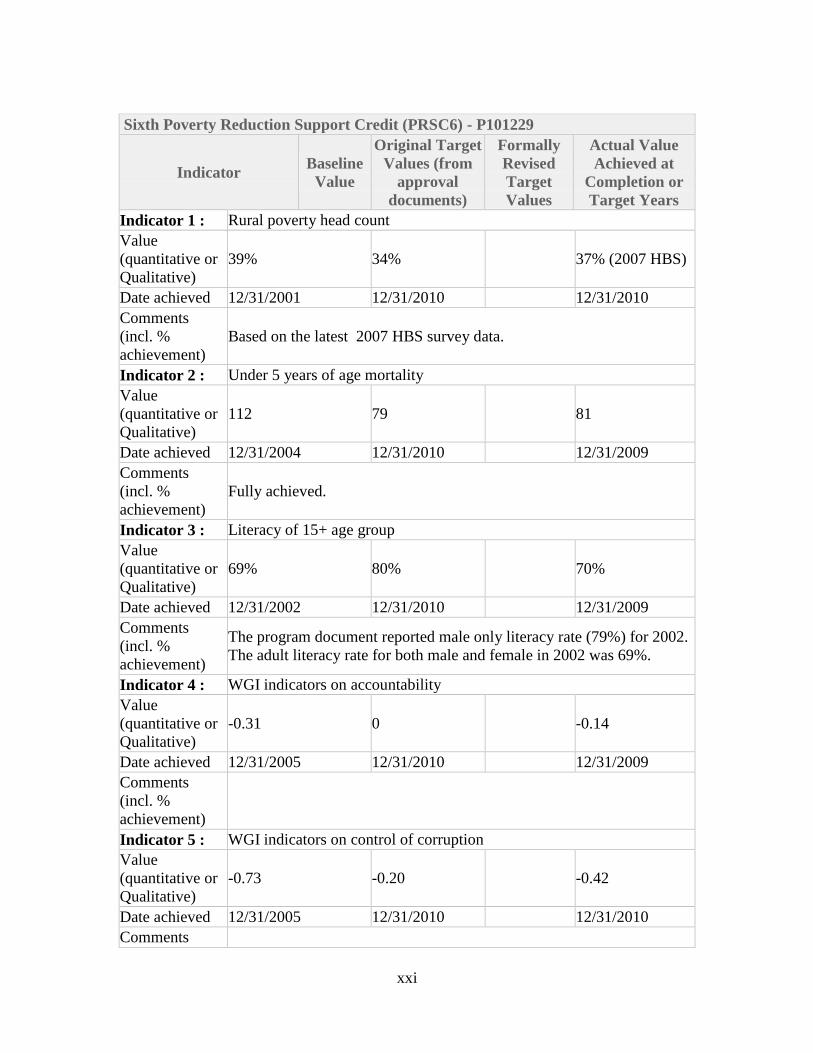
Sixth Poverty Reduction Support Credit (PRSC6) - P101229
Indicator Baseline
Value
Original Target
Values (from
approval
documents)
Formally
Revised
Target
Values
Actual Value
Achieved at
Completion or
Target Years
Indicator 1 : Rural poverty head count
Value
(quantitative or
Qualitative)
39% 34% 37% (2007 HBS)
Date achieved 12/31/2001 12/31/2010 12/31/2010
Comments
(incl. %
achievement)
Based on the latest 2007 HBS survey data.
Indicator 2 : Under 5 years of age mortality
Value
(quantitative or
Qualitative)
112 79 81
Date achieved 12/31/2004 12/31/2010 12/31/2009
Comments
(incl. %
achievement)
Fully achieved.
Indicator 3 : Literacy of 15+ age group
Value
(quantitative or
Qualitative)
69% 80% 70%
Date achieved 12/31/2002 12/31/2010 12/31/2009
Comments
(incl. %
achievement)
The program document reported male only literacy rate (79%) for 2002.
The adult literacy rate for both male and female in 2002 was 69%.
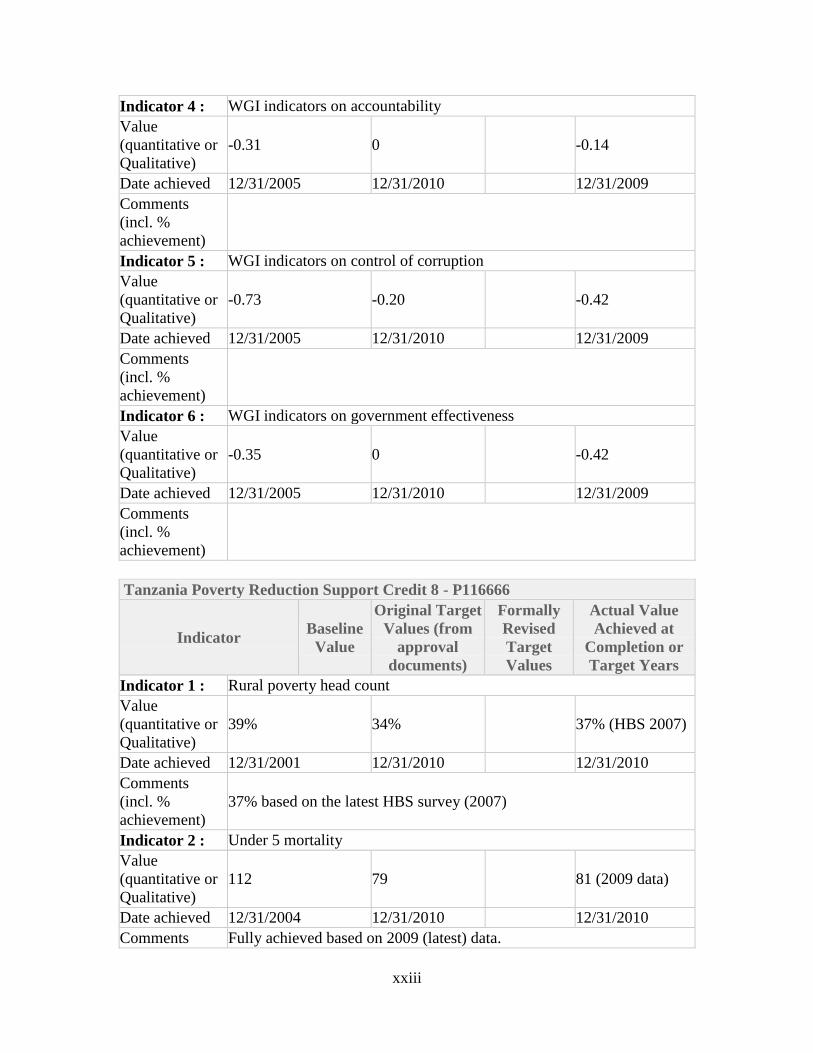
Indicator 4 : WGI indicators on accountability
Value
(quantitative or
Qualitative)
-0.31 0 -0.14
Date achieved 12/31/2005 12/31/2010 12/31/2009
Comments
(incl. %
achievement)
Indicator 5 : WGI indicators on control of corruption
Value
(quantitative or
Qualitative)
-0.73 -0.20 -0.42
Date achieved 12/31/2005 12/31/2010 12/31/2010
Comments

xxii
(incl. %
achievement)
Indicator 6 : WGI indicators on government effectiveness
Value
(quantitative or
Qualitative)
-0.35 0 -0.42
Date achieved 12/31/2005 12/31/2008 12/31/2009
Comments
(incl. %
achievement)
Tanzania Seventh Poverty Reduction Support Credit - P101230
Indicator Baseline
Value
Original Target
Values (from
approval
documents)
Formally
Revised
Target
Values
Actual Value
Achieved at
Completion or
Target Years
Indicator 1 : Rural poverty head count
Value
(quantitative or
Qualitative)
39% 34% 37% (2007 HBS)
Date achieved 12/31/2001 12/31/2010 12/31/2010
Comments
(incl. %
achievement)
37% based on the latest HBS survey data in 2007.
Indicator 2 : Under 5 mortality (out of 1000 lives)
Value
(quantitative or
Qualitative)
112 79 81
Date achieved 12/31/2004 12/31/2010 12/31/2009
Comments
(incl. %
achievement)
Fully achieved.
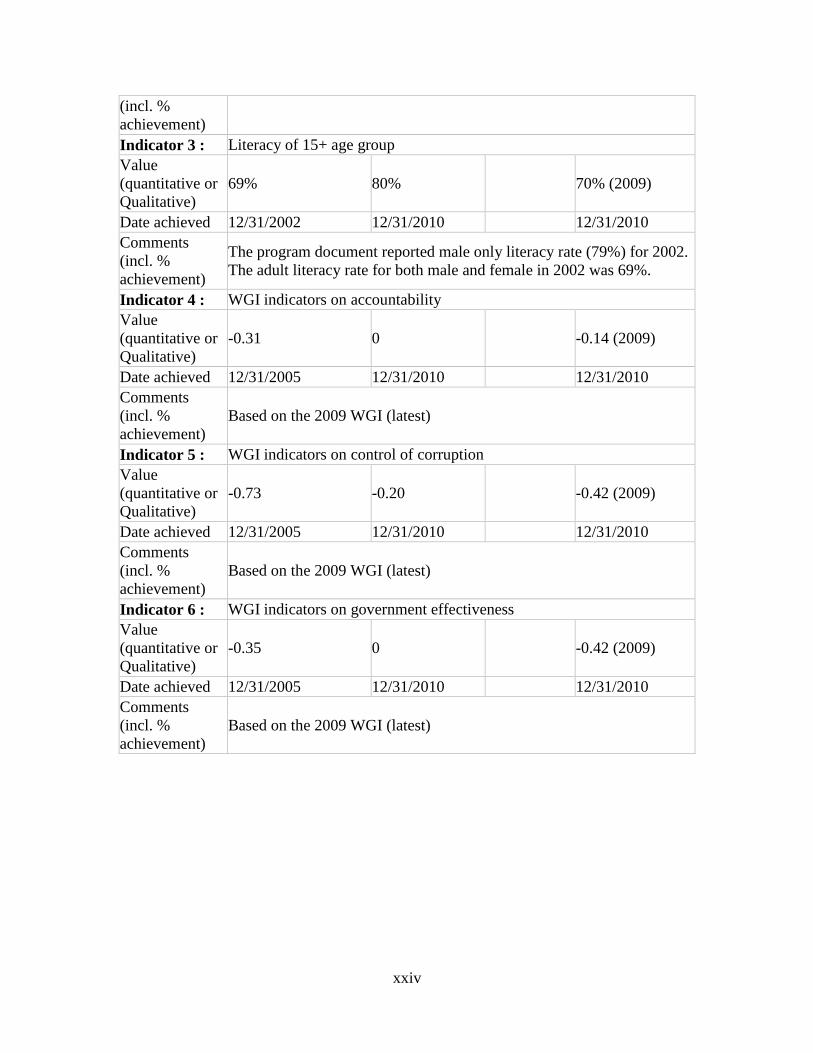
Indicator 3 : Literacy of 15+ age group
Value
(quantitative or
Qualitative)
69% 80% 70%
Date achieved 12/31/2002 12/31/2010 12/31/2009
Comments
(incl. %
achievement)
The program document reported male only literacy rate (79%) for 2002.
The adult literacy rate for both male and female in 2002 was 69%.
xxiii
Indicator 4 : WGI indicators on accountability
Value
(quantitative or
Qualitative)
-0.31 0 -0.14
Date achieved 12/31/2005 12/31/2010 12/31/2009
Comments
(incl. %
achievement)
Indicator 5 : WGI indicators on control of corruption
Value
(quantitative or
Qualitative)
-0.73 -0.20 -0.42
Date achieved 12/31/2005 12/31/2010 12/31/2009
Comments
(incl. %
achievement)
Indicator 6 : WGI indicators on government effectiveness
Value
(quantitative or
Qualitative)
-0.35 0 -0.42
Date achieved 12/31/2005 12/31/2010 12/31/2009
Comments
(incl. %
achievement)
Tanzania Poverty Reduction Support Credit 8 - P116666
Indicator Baseline
Value
Original Target
Values (from
approval
documents)
Formally
Revised
Target
Values
Actual Value
Achieved at
Completion or
Target Years
Indicator 1 : Rural poverty head count
Value
(quantitative or
Qualitative)
39% 34% 37% (HBS 2007)
Date achieved 12/31/2001 12/31/2010 12/31/2010
Comments
(incl. %
achievement)
37% based on the latest HBS survey (2007)
Indicator 2 : Under 5 mortality
Value
(quantitative or
Qualitative)
112 79 81 (2009 data)
Date achieved 12/31/2004 12/31/2010 12/31/2010
Comments Fully achieved based on 2009 (latest) data.
xxiv
(incl. %
achievement)
Indicator 3 : Literacy of 15+ age group
Value
(quantitative or
Qualitative)
69% 80% 70% (2009)
Date achieved 12/31/2002 12/31/2010 12/31/2010
Comments
(incl. %
achievement)
The program document reported male only literacy rate (79%) for 2002.
The adult literacy rate for both male and female in 2002 was 69%.
Indicator 4 : WGI indicators on accountability
Value
(quantitative or
Qualitative)
-0.31 0 -0.14 (2009)
Date achieved 12/31/2005 12/31/2010 12/31/2010
Comments
(incl. %
achievement)
Based on the 2009 WGI (latest)
Indicator 5 : WGI indicators on control of corruption
Value
(quantitative or
Qualitative)
-0.73 -0.20 -0.42 (2009)
Date achieved 12/31/2005 12/31/2010 12/31/2010
Comments
(incl. %
achievement)
Based on the 2009 WGI (latest)
Indicator 6 : WGI indicators on government effectiveness
Value
(quantitative or
Qualitative)
-0.35 0 -0.42 (2009)
Date achieved 12/31/2005 12/31/2010 12/31/2010
Comments
(incl. %
achievement)
Based on the 2009 WGI (latest)
xxv
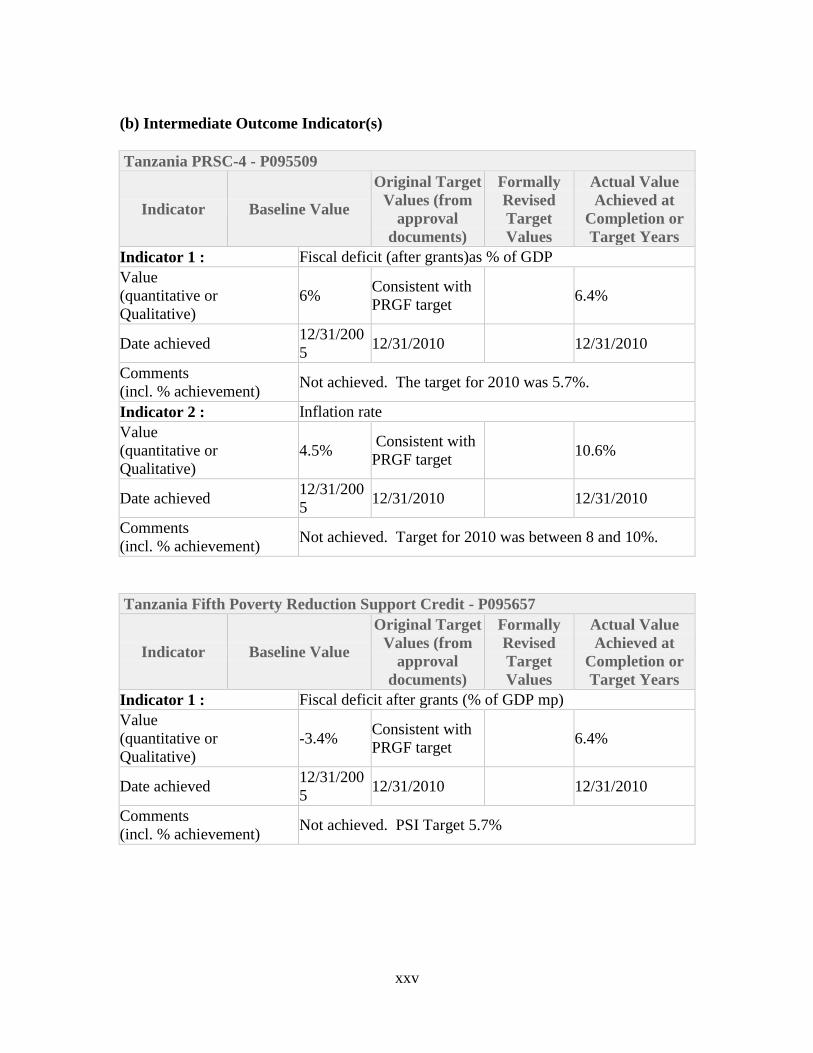
(b) Intermediate Outcome Indicator(s)
Tanzania PRSC-4 - P095509
Indicator Baseline Value
Original Target
Values (from
approval
documents)
Formally
Revised
Target
Values
Actual Value
Achieved at
Completion or
Target Years
Indicator 1 : Fiscal deficit (after grants)as % of GDP
Value
(quantitative or
Qualitative)
6% Consistent with
PRGF target 6.4%
Date achieved 12/31/200
5 12/31/2010 12/31/2010
Comments
(incl. % achievement) Not achieved. The target for 2010 was 5.7%.
Indicator 2 : Inflation rate
Value
(quantitative or
Qualitative)
4.5% Consistent with
PRGF target 10.6%
Date achieved 12/31/200
5 12/31/2010 12/31/2010
Comments
(incl. % achievement) Not achieved. Target for 2010 was between 8 and 10%.
Tanzania Fifth Poverty Reduction Support Credit - P095657
Indicator Baseline Value
Original Target
Values (from
approval
documents)
Formally
Revised
Target
Values
Actual Value
Achieved at
Completion or
Target Years
Indicator 1 : Fiscal deficit after grants (% of GDP mp)
Value
(quantitative or
Qualitative)
-3.4% Consistent with
PRGF target 6.4%
Date achieved 12/31/200
5 12/31/2010 12/31/2010
Comments
(incl. % achievement) Not achieved. PSI Target 5.7%
xxvi
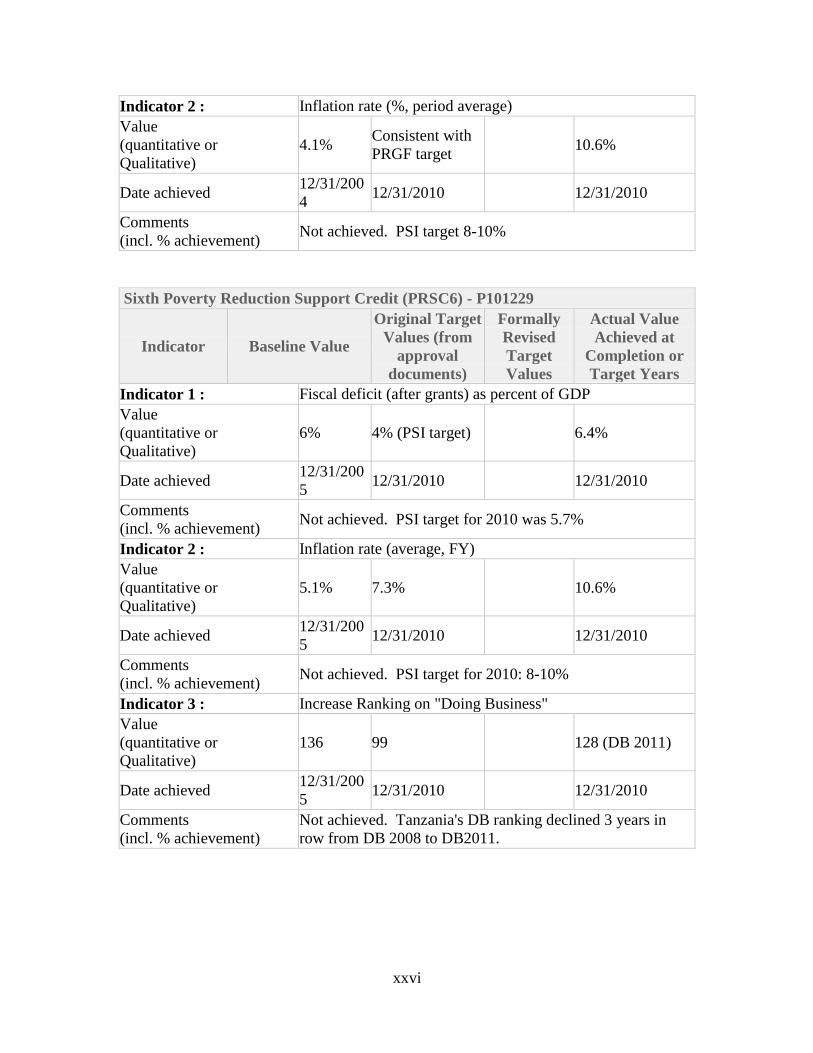
Indicator 2 : Inflation rate (%, period average)
Value
(quantitative or
Qualitative)
4.1% Consistent with
PRGF target 10.6%
Date achieved 12/31/200
4 12/31/2010 12/31/2010
Comments
(incl. % achievement) Not achieved. PSI target 8-10%
Sixth Poverty Reduction Support Credit (PRSC6) - P101229
Indicator Baseline Value
Original Target
Values (from
approval
documents)
Formally
Revised
Target
Values
Actual Value
Achieved at
Completion or
Target Years
Indicator 1 : Fiscal deficit (after grants) as percent of GDP
Value
(quantitative or
Qualitative)
6% 4% (PSI target) 6.4%
Date achieved 12/31/200
5 12/31/2010 12/31/2010
Comments
(incl. % achievement) Not achieved. PSI target for 2010 was 5.7%
Indicator 2 : Inflation rate (average, FY)
Value
(quantitative or
Qualitative)
5.1% 7.3% 10.6%
Date achieved 12/31/200
5 12/31/2010 12/31/2010
Comments
(incl. % achievement) Not achieved. PSI target for 2010: 8-10%
Indicator 3 : Increase Ranking on "Doing Business"
Value
(quantitative or
Qualitative)
136 99 128 (DB 2011)
Date achieved 12/31/200
5 12/31/2010 12/31/2010
Comments
(incl. % achievement)
Not achieved. Tanzania's DB ranking declined 3 years in
row from DB 2008 to DB2011.
xxvii
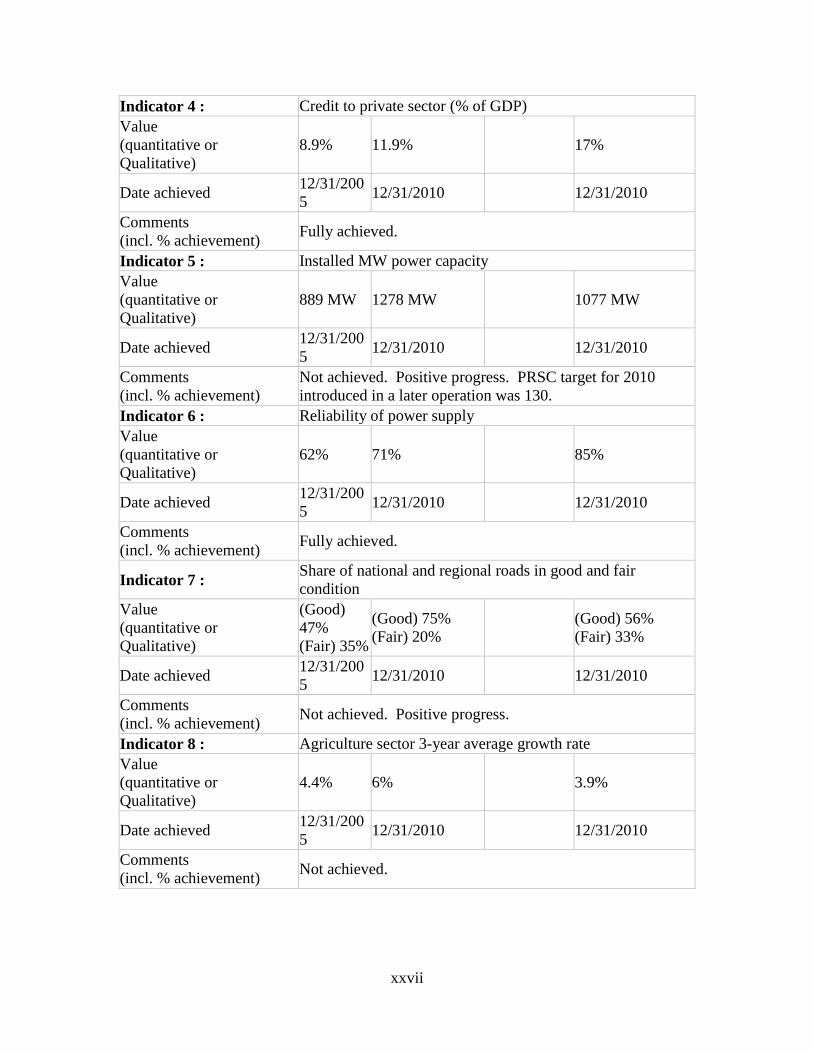
Indicator 4 : Credit to private sector (% of GDP)
Value
(quantitative or
Qualitative)
8.9% 11.9% 17%
Date achieved 12/31/200
5 12/31/2010 12/31/2010
Comments
(incl. % achievement) Fully achieved.
Indicator 5 : Installed MW power capacity
Value
(quantitative or
Qualitative)
889 MW 1278 MW 1077 MW
Date achieved 12/31/200
5 12/31/2010 12/31/2010
Comments
(incl. % achievement)
Not achieved. Positive progress. PRSC target for 2010
introduced in a later operation was 130.
Indicator 6 : Reliability of power supply
Value
(quantitative or
Qualitative)
62% 71% 85%
Date achieved 12/31/200
5 12/31/2010 12/31/2010
Comments
(incl. % achievement) Fully achieved.
Indicator 7 : Share of national and regional roads in good and fair
condition
Value
(quantitative or
Qualitative)
(Good)
47%
(Fair) 35%
(Good) 75%
(Fair) 20%
(Good) 56%
(Fair) 33%
Date achieved 12/31/200
5 12/31/2010 12/31/2010
Comments
(incl. % achievement) Not achieved. Positive progress.
Indicator 8 : Agriculture sector 3-year average growth rate
Value
(quantitative or
Qualitative)
4.4% 6% 3.9%
Date achieved 12/31/200
5 12/31/2010 12/31/2010
Comments
(incl. % achievement) Not achieved.
xxviii
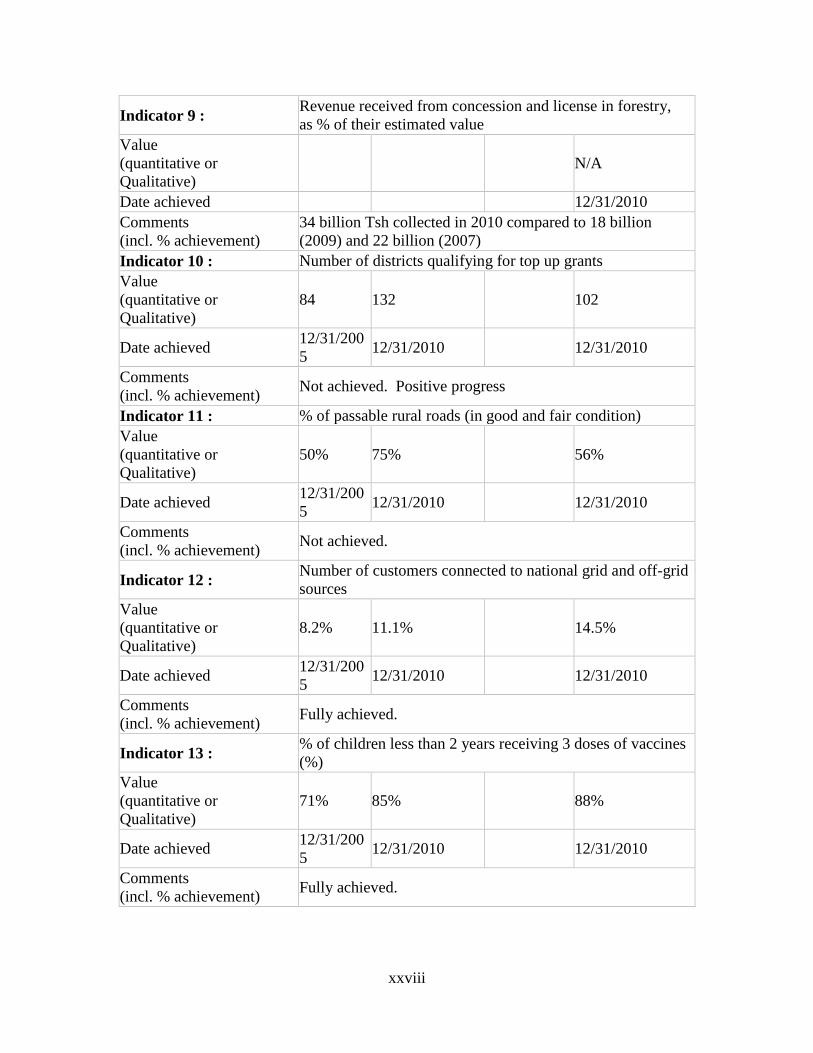
Indicator 9 : Revenue received from concession and license in forestry,
as % of their estimated value
Value
(quantitative or
Qualitative)
N/A
Date achieved 12/31/2010
Comments
(incl. % achievement)
34 billion Tsh collected in 2010 compared to 18 billion
(2009) and 22 billion (2007)
Indicator 10 : Number of districts qualifying for top up grants
Value
(quantitative or
Qualitative)
84 132 102
Date achieved 12/31/200
5 12/31/2010 12/31/2010
Comments
(incl. % achievement) Not achieved. Positive progress
Indicator 11 : % of passable rural roads (in good and fair condition)
Value
(quantitative or
Qualitative)
50% 75% 56%
Date achieved 12/31/200
5 12/31/2010 12/31/2010
Comments
(incl. % achievement) Not achieved.
Indicator 12 : Number of customers connected to national grid and off-grid
sources
Value
(quantitative or
Qualitative)
8.2% 11.1% 14.5%
Date achieved 12/31/200
5 12/31/2010 12/31/2010
Comments
(incl. % achievement) Fully achieved.
Indicator 13 : % of children less than 2 years receiving 3 doses of vaccines
(%)
Value
(quantitative or
Qualitative)
71% 85% 88%
Date achieved 12/31/200
5 12/31/2010 12/31/2010
Comments
(incl. % achievement) Fully achieved.
xxix
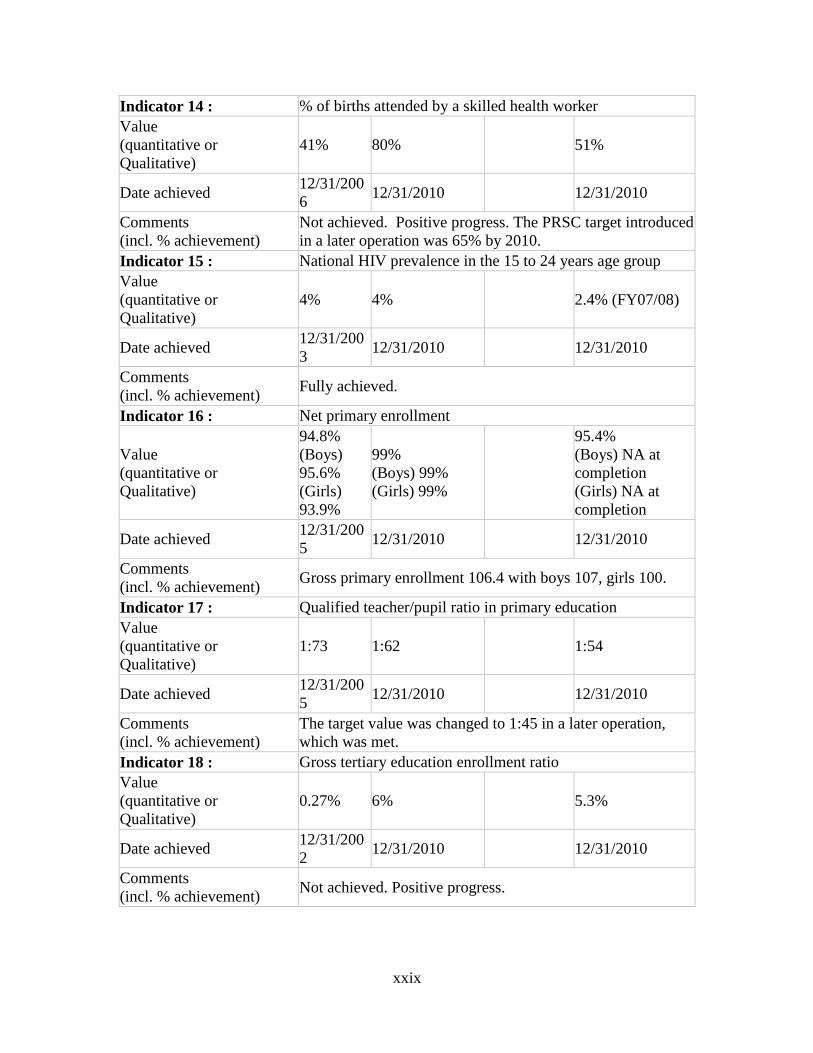
Indicator 14 : % of births attended by a skilled health worker
Value
(quantitative or
Qualitative)
41% 80% 51%
Date achieved 12/31/200
6 12/31/2010 12/31/2010
Comments
(incl. % achievement)
Not achieved. Positive progress. The PRSC target introduced
in a later operation was 65% by 2010.
Indicator 15 : National HIV prevalence in the 15 to 24 years age group
Value
(quantitative or
Qualitative)
4% 4% 2.4% (FY07/08)
Date achieved 12/31/200
3 12/31/2010 12/31/2010
Comments
(incl. % achievement) Fully achieved.
Indicator 16 : Net primary enrollment
Value
(quantitative or
Qualitative)
94.8%
(Boys)
95.6%
(Girls)
93.9%
99%
(Boys) 99%
(Girls) 99%
95.4%
(Boys) NA at
completion
(Girls) NA at
completion
Date achieved 12/31/200
5 12/31/2010 12/31/2010
Comments
(incl. % achievement) Gross primary enrollment 106.4 with boys 107, girls 100.
Indicator 17 : Qualified teacher/pupil ratio in primary education
Value
(quantitative or
Qualitative)
1:73 1:62 1:54
Date achieved 12/31/200
5 12/31/2010 12/31/2010
Comments
(incl. % achievement)
The target value was changed to 1:45 in a later operation,
which was met.
Indicator 18 : Gross tertiary education enrollment ratio
Value
(quantitative or
Qualitative)
0.27% 6% 5.3%
Date achieved 12/31/200
2 12/31/2010 12/31/2010
Comments
(incl. % achievement) Not achieved. Positive progress.
xxx
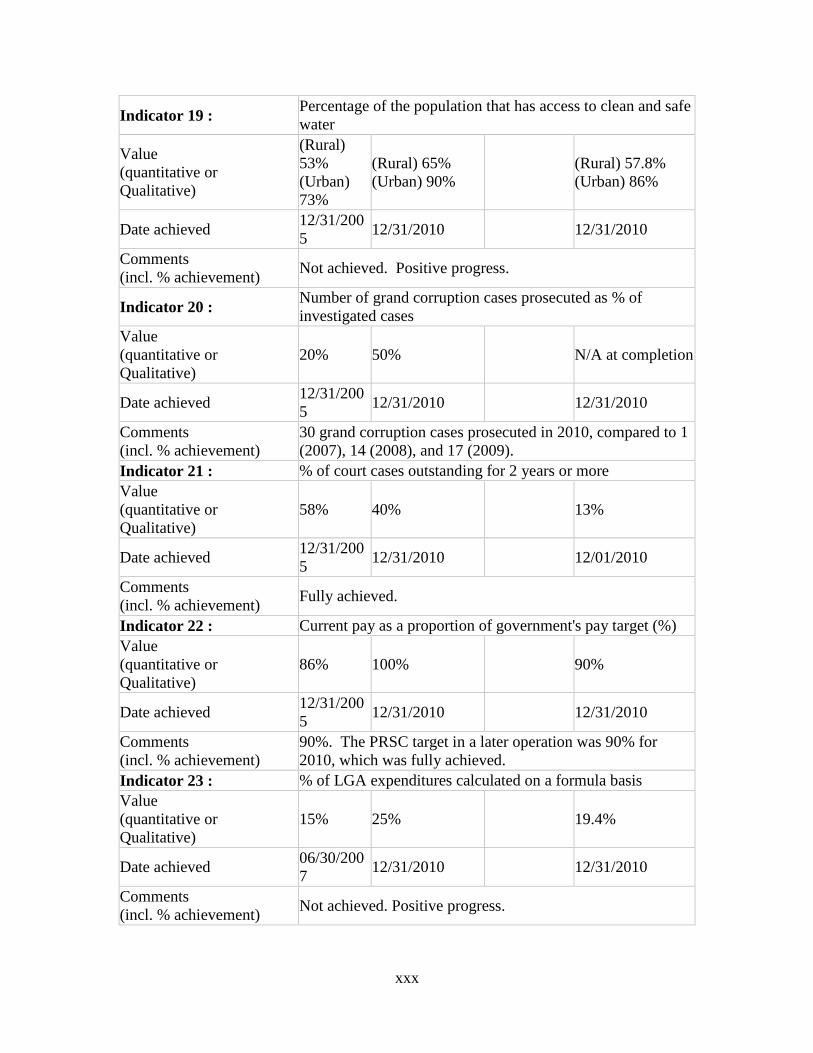
Indicator 19 : Percentage of the population that has access to clean and safe
water
Value
(quantitative or
Qualitative)
(Rural)
53%
(Urban)
73%
(Rural) 65%
(Urban) 90%
(Rural) 57.8%
(Urban) 86%
Date achieved 12/31/200
5 12/31/2010 12/31/2010
Comments
(incl. % achievement) Not achieved. Positive progress.
Indicator 20 : Number of grand corruption cases prosecuted as % of
investigated cases
Value
(quantitative or
Qualitative)
20% 50% N/A at completion
Date achieved 12/31/200
5 12/31/2010 12/31/2010
Comments
(incl. % achievement)
30 grand corruption cases prosecuted in 2010, compared to 1
(2007), 14 (2008), and 17 (2009).
Indicator 21 : % of court cases outstanding for 2 years or more
Value
(quantitative or
Qualitative)
58% 40% 13%
Date achieved 12/31/200
5 12/31/2010 12/01/2010
Comments
(incl. % achievement) Fully achieved.
Indicator 22 : Current pay as a proportion of government's pay target (%)
Value
(quantitative or
Qualitative)
86% 100% 90%
Date achieved 12/31/200
5 12/31/2010 12/31/2010
Comments
(incl. % achievement)
90%. The PRSC target in a later operation was 90% for
2010, which was fully achieved.
Indicator 23 : % of LGA expenditures calculated on a formula basis
Value
(quantitative or
Qualitative)
15% 25% 19.4%
Date achieved 06/30/200
7 12/31/2010 12/31/2010
Comments
(incl. % achievement) Not achieved. Positive progress.
xxxi
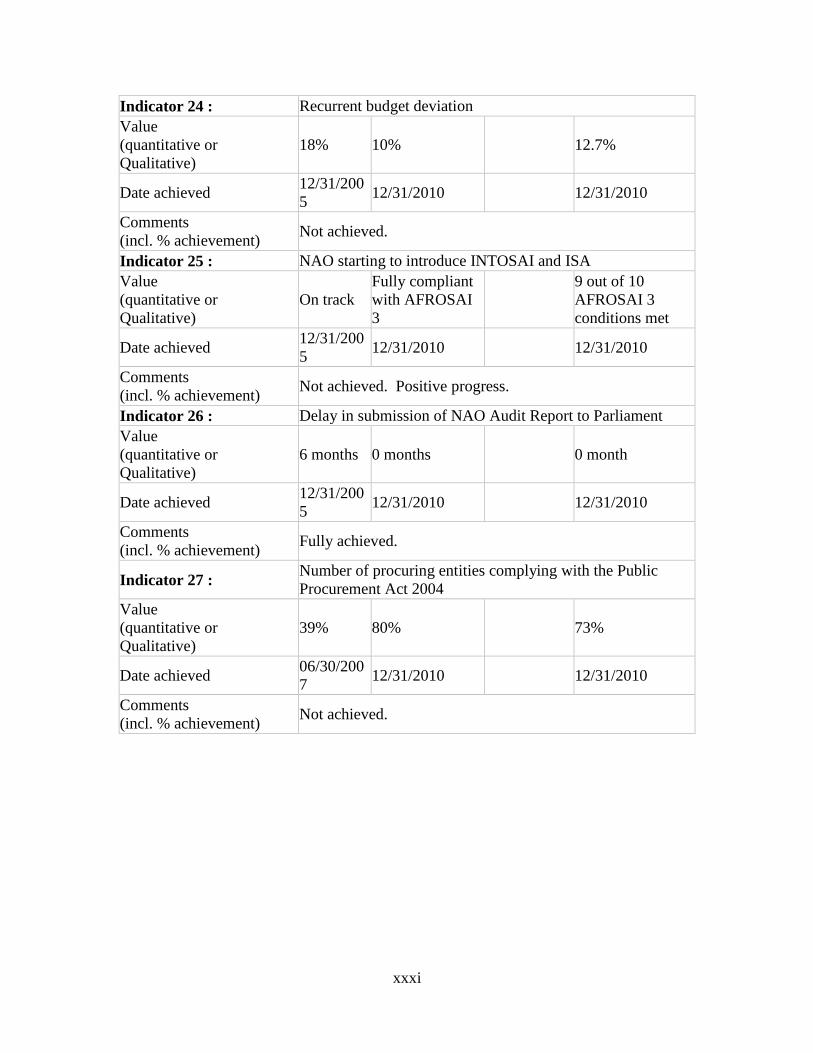
Indicator 24 : Recurrent budget deviation
Value
(quantitative or
Qualitative)
18% 10% 12.7%
Date achieved 12/31/200
5 12/31/2010 12/31/2010
Comments
(incl. % achievement) Not achieved.
Indicator 25 : NAO starting to introduce INTOSAI and ISA
Value
(quantitative or
Qualitative)
On track
Fully compliant
with AFROSAI
3
9 out of 10
AFROSAI 3
conditions met
Date achieved 12/31/200
5 12/31/2010 12/31/2010
Comments
(incl. % achievement) Not achieved. Positive progress.
Indicator 26 : Delay in submission of NAO Audit Report to Parliament
Value
(quantitative or
Qualitative)
6 months 0 months 0 month
Date achieved 12/31/200
5 12/31/2010 12/31/2010
Comments
(incl. % achievement) Fully achieved.
Indicator 27 : Number of procuring entities complying with the Public
Procurement Act 2004
Value
(quantitative or
Qualitative)
39% 80% 73%
Date achieved 06/30/200
7 12/31/2010 12/31/2010
Comments
(incl. % achievement) Not achieved.
xxxii
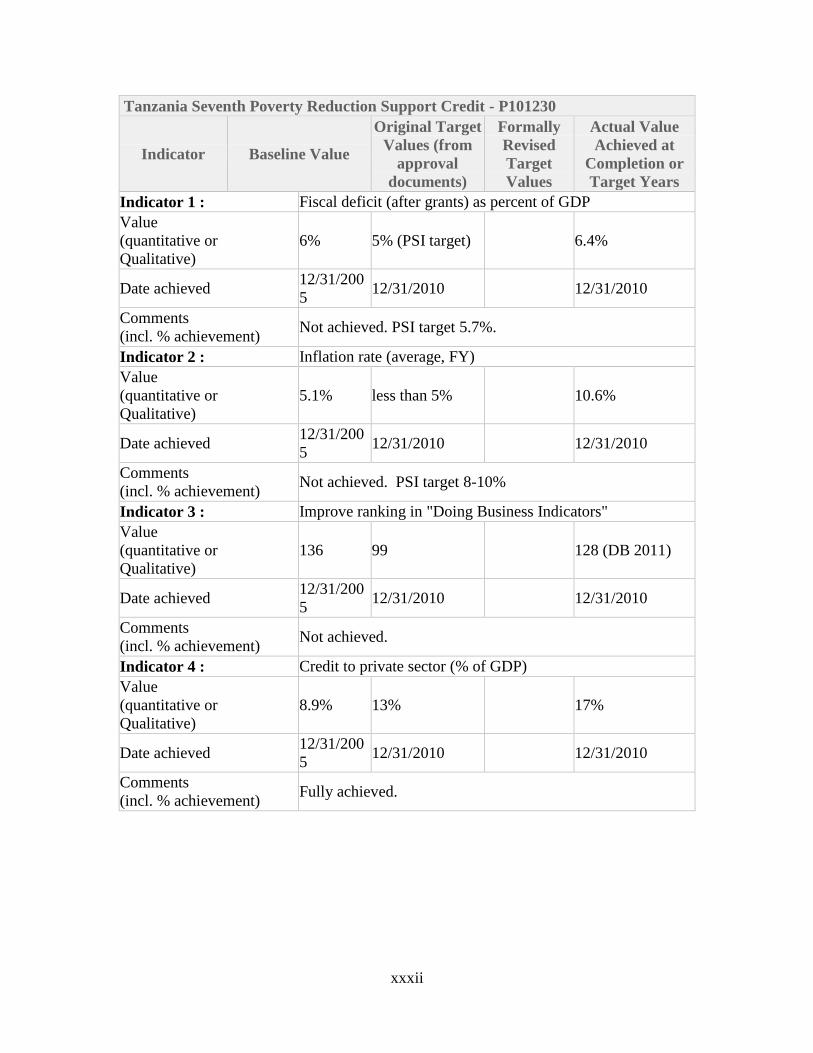
Tanzania Seventh Poverty Reduction Support Credit - P101230
Indicator Baseline Value
Original Target
Values (from
approval
documents)
Formally
Revised
Target
Values
Actual Value
Achieved at
Completion or
Target Years
Indicator 1 : Fiscal deficit (after grants) as percent of GDP
Value
(quantitative or
Qualitative)
6% 5% (PSI target) 6.4%
Date achieved 12/31/200
5 12/31/2010 12/31/2010
Comments
(incl. % achievement) Not achieved. PSI target 5.7%.
Indicator 2 : Inflation rate (average, FY)
Value
(quantitative or
Qualitative)
5.1% less than 5% 10.6%
Date achieved 12/31/200
5 12/31/2010 12/31/2010
Comments
(incl. % achievement) Not achieved. PSI target 8-10%
Indicator 3 : Improve ranking in "Doing Business Indicators"
Value
(quantitative or
Qualitative)
136 99 128 (DB 2011)
Date achieved 12/31/200
5 12/31/2010 12/31/2010
Comments
(incl. % achievement) Not achieved.
Indicator 4 : Credit to private sector (% of GDP)
Value
(quantitative or
Qualitative)
8.9% 13% 17%
Date achieved 12/31/200
5 12/31/2010 12/31/2010
Comments
(incl. % achievement) Fully achieved.
xxxiii
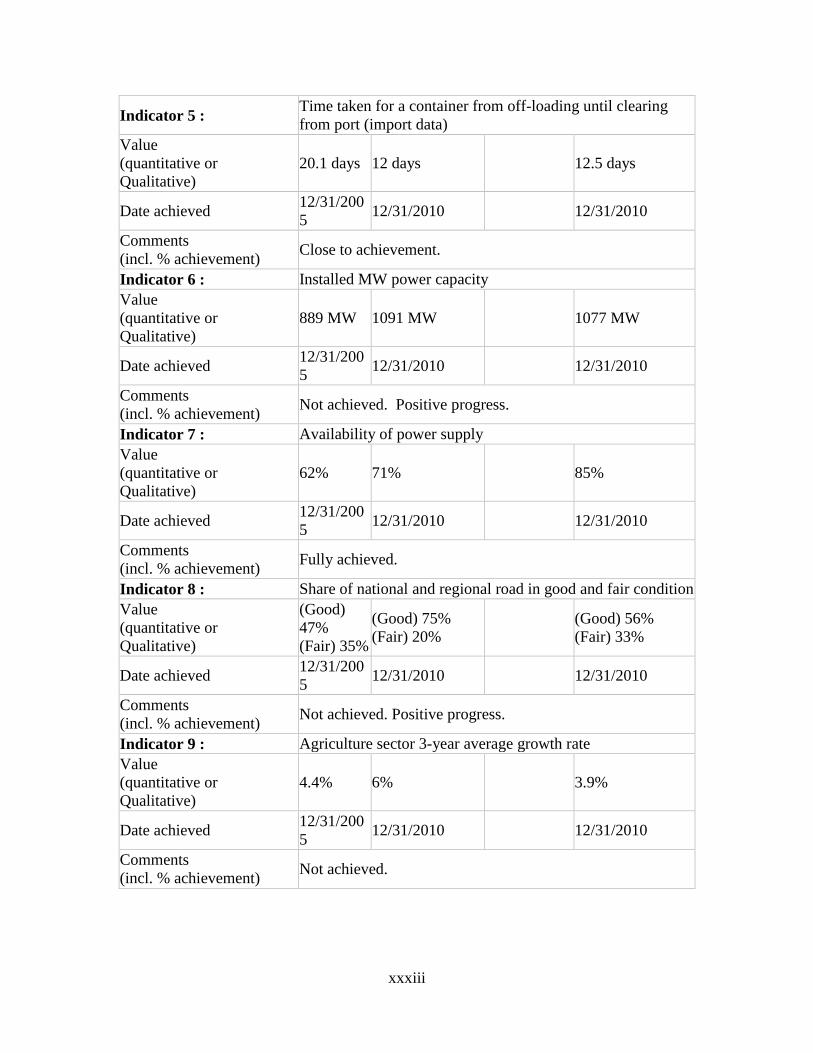
Indicator 5 : Time taken for a container from off-loading until clearing
from port (import data)
Value
(quantitative or
Qualitative)
20.1 days 12 days 12.5 days
Date achieved 12/31/200
5 12/31/2010 12/31/2010
Comments
(incl. % achievement) Close to achievement.
Indicator 6 : Installed MW power capacity
Value
(quantitative or
Qualitative)
889 MW 1091 MW 1077 MW
Date achieved 12/31/200
5 12/31/2010 12/31/2010
Comments
(incl. % achievement) Not achieved. Positive progress.
Indicator 7 : Availability of power supply
Value
(quantitative or
Qualitative)
62% 71% 85%
Date achieved 12/31/200
5 12/31/2010 12/31/2010
Comments
(incl. % achievement) Fully achieved.
Indicator 8 : Share of national and regional road in good and fair condition
Value
(quantitative or
Qualitative)
(Good)
47%
(Fair) 35%
(Good) 75%
(Fair) 20%
(Good) 56%
(Fair) 33%
Date achieved 12/31/200
5 12/31/2010 12/31/2010
Comments
(incl. % achievement) Not achieved. Positive progress.
Indicator 9 : Agriculture sector 3-year average growth rate
Value
(quantitative or
Qualitative)
4.4% 6% 3.9%
Date achieved 12/31/200
5 12/31/2010 12/31/2010
Comments
(incl. % achievement) Not achieved.
xxxiv
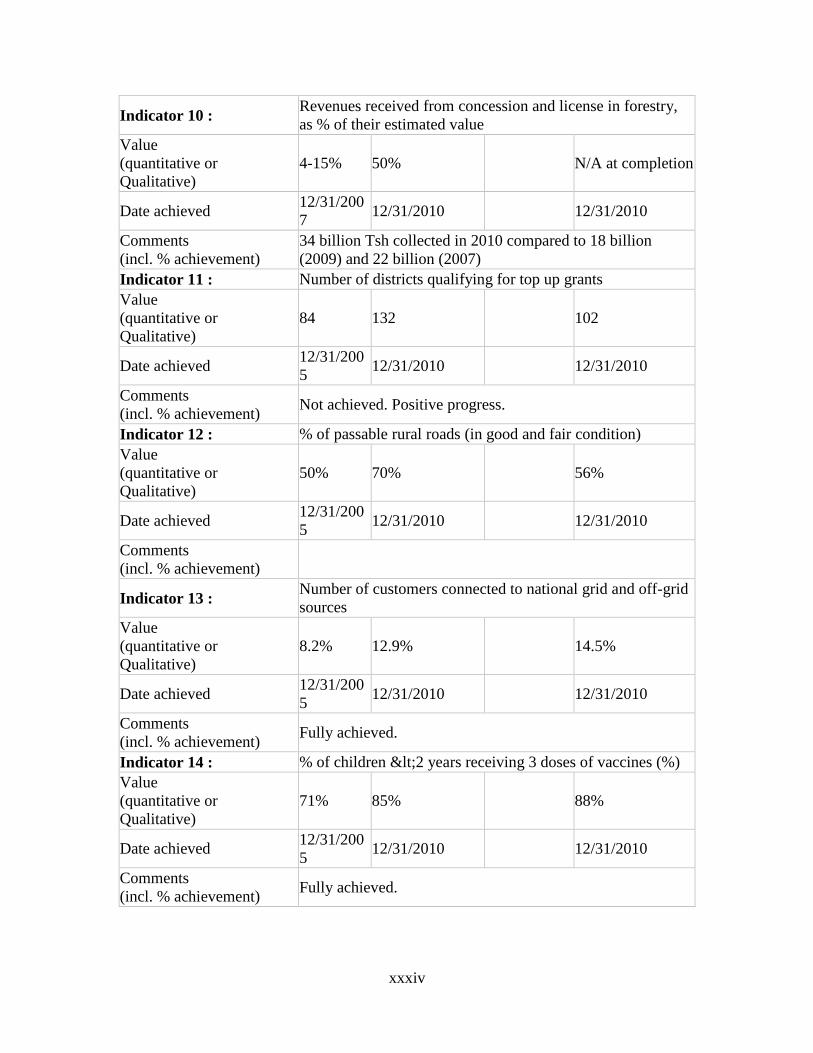
Indicator 10 : Revenues received from concession and license in forestry,
as % of their estimated value
Value
(quantitative or
Qualitative)
4-15% 50% N/A at completion
Date achieved 12/31/200
7 12/31/2010 12/31/2010
Comments
(incl. % achievement)
34 billion Tsh collected in 2010 compared to 18 billion
(2009) and 22 billion (2007)
Indicator 11 : Number of districts qualifying for top up grants
Value
(quantitative or
Qualitative)
84 132 102
Date achieved 12/31/200
5 12/31/2010 12/31/2010
Comments
(incl. % achievement) Not achieved. Positive progress.
Indicator 12 : % of passable rural roads (in good and fair condition)
Value
(quantitative or
Qualitative)
50% 70% 56%
Date achieved 12/31/200
5 12/31/2010 12/31/2010
Comments
(incl. % achievement)
Indicator 13 : Number of customers connected to national grid and off-grid
sources
Value
(quantitative or
Qualitative)
8.2% 12.9% 14.5%
Date achieved 12/31/200
5 12/31/2010 12/31/2010
Comments
(incl. % achievement) Fully achieved.
Indicator 14 : % of children <2 years receiving 3 doses of vaccines (%)
Value
(quantitative or
Qualitative)
71% 85% 88%
Date achieved 12/31/200
5 12/31/2010 12/31/2010
Comments
(incl. % achievement) Fully achieved.
xxxv
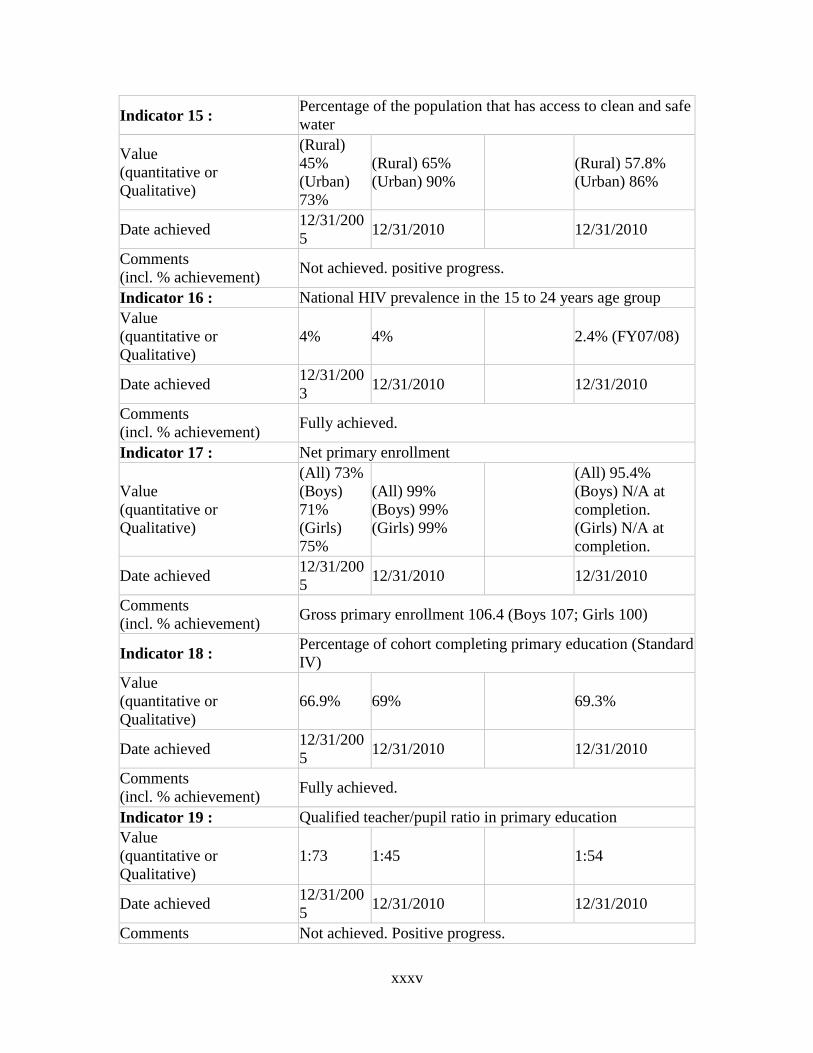
Indicator 15 : Percentage of the population that has access to clean and safe
water
Value
(quantitative or
Qualitative)
(Rural)
45%
(Urban)
73%
(Rural) 65%
(Urban) 90%
(Rural) 57.8%
(Urban) 86%
Date achieved 12/31/200
5 12/31/2010 12/31/2010
Comments
(incl. % achievement) Not achieved. positive progress.
Indicator 16 : National HIV prevalence in the 15 to 24 years age group
Value
(quantitative or
Qualitative)
4% 4% 2.4% (FY07/08)
Date achieved 12/31/200
3 12/31/2010 12/31/2010
Comments
(incl. % achievement) Fully achieved.
Indicator 17 : Net primary enrollment
Value
(quantitative or
Qualitative)
(All) 73%
(Boys)
71%
(Girls)
75%
(All) 99%
(Boys) 99%
(Girls) 99%
(All) 95.4%
(Boys) N/A at
completion.
(Girls) N/A at
completion.
Date achieved 12/31/200
5 12/31/2010 12/31/2010
Comments
(incl. % achievement) Gross primary enrollment 106.4 (Boys 107; Girls 100)
Indicator 18 : Percentage of cohort completing primary education (Standard
IV)
Value
(quantitative or
Qualitative)
66.9% 69% 69.3%
Date achieved 12/31/200
5 12/31/2010 12/31/2010
Comments
(incl. % achievement) Fully achieved.
Indicator 19 : Qualified teacher/pupil ratio in primary education
Value
(quantitative or
Qualitative)
1:73 1:45 1:54
Date achieved 12/31/200
5 12/31/2010 12/31/2010
Comments Not achieved. Positive progress.
xxxvi
(incl. % achievement)
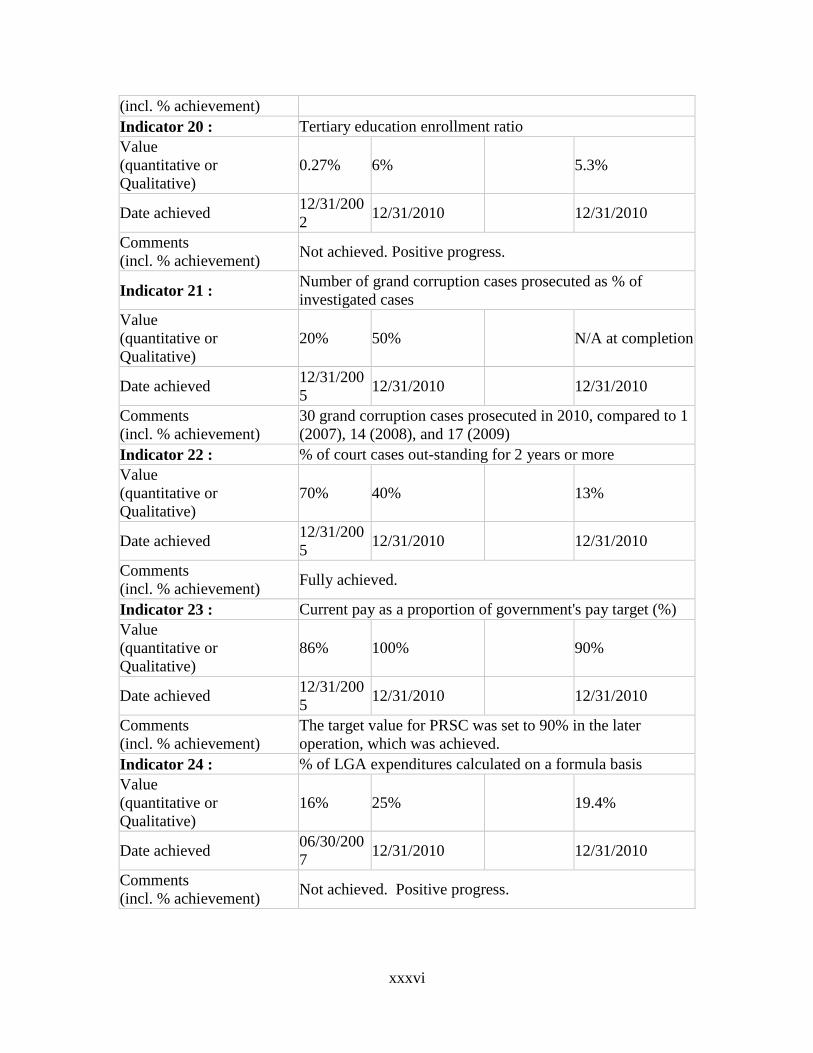
Indicator 20 : Tertiary education enrollment ratio
Value
(quantitative or
Qualitative)
0.27% 6% 5.3%
Date achieved 12/31/200
2 12/31/2010 12/31/2010
Comments
(incl. % achievement) Not achieved. Positive progress.
Indicator 21 : Number of grand corruption cases prosecuted as % of
investigated cases
Value
(quantitative or
Qualitative)
20% 50% N/A at completion
Date achieved 12/31/200
5 12/31/2010 12/31/2010
Comments
(incl. % achievement)
30 grand corruption cases prosecuted in 2010, compared to 1
(2007), 14 (2008), and 17 (2009)
Indicator 22 : % of court cases out-standing for 2 years or more
Value
(quantitative or
Qualitative)
70% 40% 13%
Date achieved 12/31/200
5 12/31/2010 12/31/2010
Comments
(incl. % achievement) Fully achieved.
Indicator 23 : Current pay as a proportion of government's pay target (%)
Value
(quantitative or
Qualitative)
86% 100% 90%
Date achieved 12/31/200
5 12/31/2010 12/31/2010
Comments
(incl. % achievement)
The target value for PRSC was set to 90% in the later
operation, which was achieved.
Indicator 24 : % of LGA expenditures calculated on a formula basis
Value
(quantitative or
Qualitative)
16% 25% 19.4%
Date achieved 06/30/200
7 12/31/2010 12/31/2010
Comments
(incl. % achievement) Not achieved. Positive progress.
xxxvii
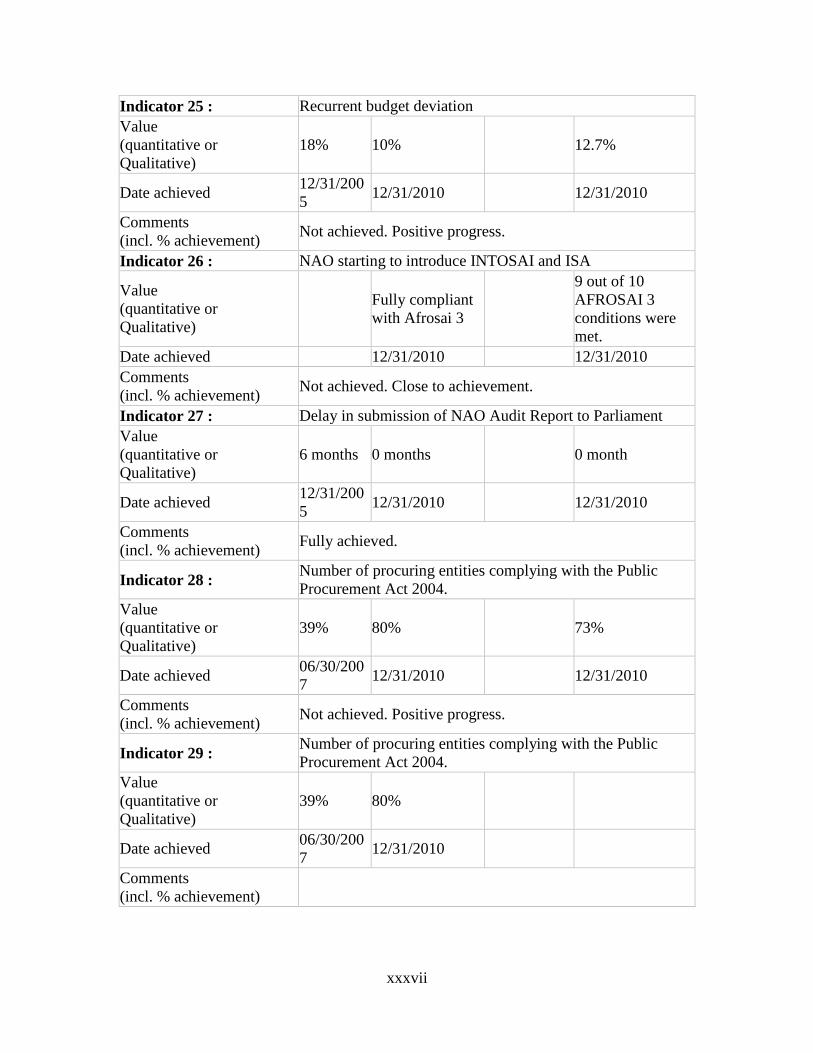
Indicator 25 : Recurrent budget deviation
Value
(quantitative or
Qualitative)
18% 10% 12.7%
Date achieved 12/31/200
5 12/31/2010 12/31/2010
Comments
(incl. % achievement) Not achieved. Positive progress.
Indicator 26 : NAO starting to introduce INTOSAI and ISA
Value
(quantitative or
Qualitative)
Fully compliant
with Afrosai 3
9 out of 10
AFROSAI 3
conditions were
met.
Date achieved 12/31/2010 12/31/2010
Comments
(incl. % achievement) Not achieved. Close to achievement.
Indicator 27 : Delay in submission of NAO Audit Report to Parliament
Value
(quantitative or
Qualitative)
6 months 0 months 0 month
Date achieved 12/31/200
5 12/31/2010 12/31/2010
Comments
(incl. % achievement) Fully achieved.
Indicator 28 : Number of procuring entities complying with the Public
Procurement Act 2004.
Value
(quantitative or
Qualitative)
39% 80% 73%
Date achieved 06/30/200
7 12/31/2010 12/31/2010
Comments
(incl. % achievement) Not achieved. Positive progress.
Indicator 29 : Number of procuring entities complying with the Public
Procurement Act 2004.
Value
(quantitative or
Qualitative)
39% 80%
Date achieved 06/30/200
7 12/31/2010
Comments
(incl. % achievement)

xxxviii
Indicator 30 : % of births attended by skilled health worker
Value
(quantitative or
Qualitative)
41% 65% 51%
Date achieved 12/31/200
6 12/31/2010 12/31/2010
Comments
(incl. % achievement) Not achieved. Positive progress.
Tanzania Poverty Reduction Support Credit 8 - P116666
Indicator Baseline Value
Original
Target
Values
(from
approval
documents)
Formally
Revised
Target
Values
Actual Value
Achieved at
Completion or
Target Years
Indicator 1 : Fiscal deficit (after grants) as percent of GDP
Value
(quantitative or
Qualitative)
6% 5% (PSI target) 6.4%
Date achieved 12/31/200
5 12/31/2010 12/31/2010
Comments
(incl. % achievement) Not achieved. PSI target 5.7%
Indicator 2 : Inflation rate (average, CY)
Value
(quantitative or
Qualitative)
5.1% Less than 5% 10.6%
Date achieved 12/31/200
5 12/31/2010 12/31/2010
Comments
(incl. % achievement) Not achieved. PSI target 8-10%.
Indicator 3 : Improve ranking in "Doing Business Indicators"
Value
(quantitative or
Qualitative)
136 130 128 (DB 2011)
Date achieved 12/31/200
5 12/31/2010 12/31/2010
Comments
(incl. % achievement)
Not achieved. Tanzania's DB ranking declined 3 years in
row from DB 2008 to DB 2011. The Tanzania’s ranking of
131th place in DB 2010 was adjusted to 125th place in DB
2011.

xxxix
Indicator 4 : Credit to private sector (% of GDP)
Value
(quantitative or
Qualitative)
8.9% 13% 17%
Date achieved 12/31/200
5 12/31/2010 12/31/2010
Comments
(incl. % achievement) Fully achieved.
Indicator 5 : Time taken for a container from off-loading until clearing
from port (import data)
Value
(quantitative or
Qualitative)
20.1 days 12 days 12.5%
Date achieved 12/31/200
5 12/31/2010 12/31/2010
Comments
(incl. % achievement) Not achieved. Close to achievement.
Indicator 6 : Installed MW power capacity
Value
(quantitative or
Qualitative)
889 MW 1091 MW 1077 MW
Date achieved 12/31/200
5 12/31/2010 12/31/2010
Comments
(incl. % achievement) Not achieved. Positive progress.
Indicator 7 : Availability of power supply
Value
(quantitative or
Qualitative)
62% 71% 85%
Date achieved 12/31/200
5 12/31/2010 12/31/2010
Comments
(incl. % achievement) Fully achieved.
Indicator 8 : Share of national and regional roads in good and fair
condition
Value
(quantitative or
Qualitative)
(Good)
47%
(Fair) 35%
(Good) 75%
(Fair) 20%
(Good) 56%
(Fair) 33%
Date achieved 12/31/200
5 12/31/2010 12/31/2010
Comments
(incl. % achievement) Not achieved. Positive progress.

xl
Indicator 9 : Agriculture sector three-year average growth rate
Value
(quantitative or
Qualitative)
4.4% 6% 3.9%
Date achieved 12/31/200
5 12/31/2010 12/31/2010
Comments
(incl. % achievement) Not achieved.
Indicator 10 : Revenues received from concession and license in forestry,
as % of their estimated value
Value
(quantitative or
Qualitative)
4-15% 50% N/A at completion
Date achieved 12/31/200
7 12/31/2010 12/31/2010
Comments
(incl. % achievement)
34 billion Tsh collected in 2010 compared to 18 billion
(2009) and 22 billion (2007)
Indicator 11 : Number of district qualifying for top up grants
Value
(quantitative or
Qualitative)
84 132 102
Date achieved 12/31/200
5 12/31/2010 12/31/2010
Comments
(incl. % achievement) Not achieved. Positive progress.
Indicator 12 : % of passable rural roads (in good and fair condition)
Value
(quantitative or
Qualitative)
50% 70% 56%
Date achieved 12/31/200
5 12/31/2010 12/31/2010
Comments
(incl. % achievement) Not achieved. Positive progress.
Indicator 13 : Number of customers connected to national grid and off-grid
sources
Value
(quantitative or
Qualitative)
8.2% 12.9% 14.5%
Date achieved 12/31/200
5 12/31/2010 12/31/2010
Comments
(incl. % achievement) Fully achieved.
xli
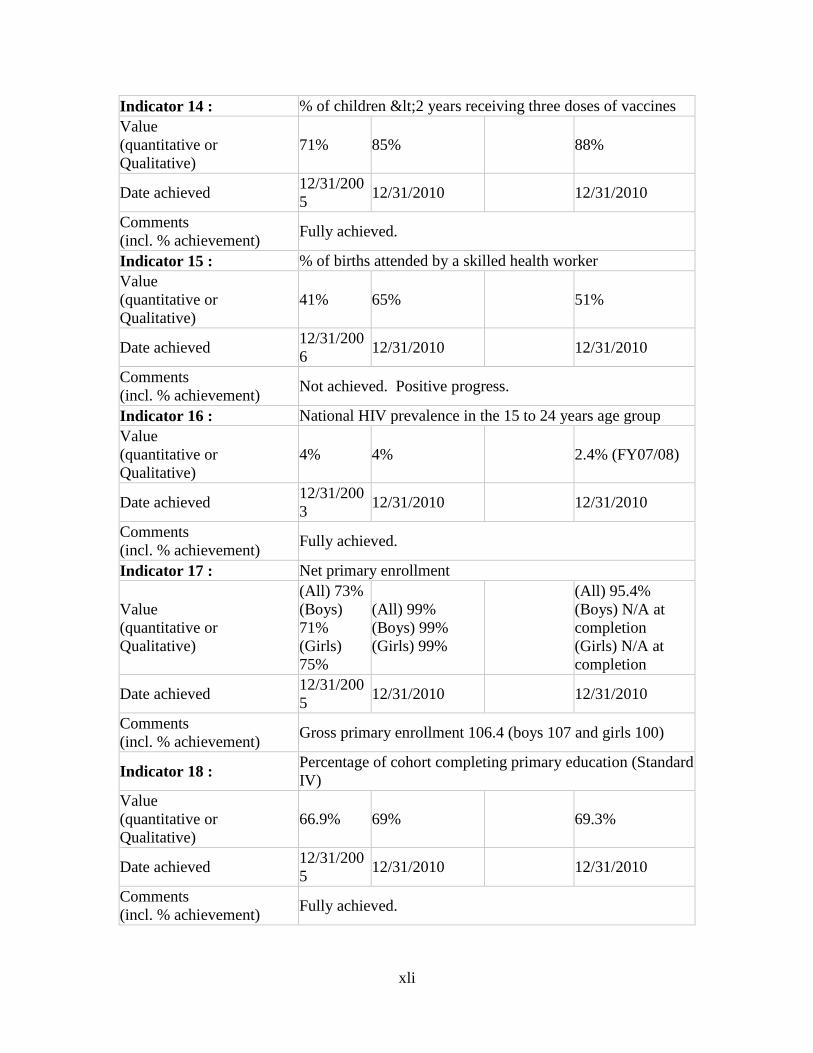
Indicator 14 : % of children <2 years receiving three doses of vaccines
Value
(quantitative or
Qualitative)
71% 85% 88%
Date achieved 12/31/200
5 12/31/2010 12/31/2010
Comments
(incl. % achievement) Fully achieved.
Indicator 15 : % of births attended by a skilled health worker
Value
(quantitative or
Qualitative)
41% 65% 51%
Date achieved 12/31/200
6 12/31/2010 12/31/2010
Comments
(incl. % achievement) Not achieved. Positive progress.
Indicator 16 : National HIV prevalence in the 15 to 24 years age group
Value
(quantitative or
Qualitative)
4% 4% 2.4% (FY07/08)
Date achieved 12/31/200
3 12/31/2010 12/31/2010
Comments
(incl. % achievement) Fully achieved.
Indicator 17 : Net primary enrollment
Value
(quantitative or
Qualitative)
(All) 73%
(Boys)
71%
(Girls)
75%
(All) 99%
(Boys) 99%
(Girls) 99%
(All) 95.4%
(Boys) N/A at
completion
(Girls) N/A at
completion
Date achieved 12/31/200
5 12/31/2010 12/31/2010
Comments
(incl. % achievement) Gross primary enrollment 106.4 (boys 107 and girls 100)
Indicator 18 : Percentage of cohort completing primary education (Standard
IV)
Value
(quantitative or
Qualitative)
66.9% 69% 69.3%
Date achieved 12/31/200
5 12/31/2010 12/31/2010
Comments
(incl. % achievement) Fully achieved.
xlii
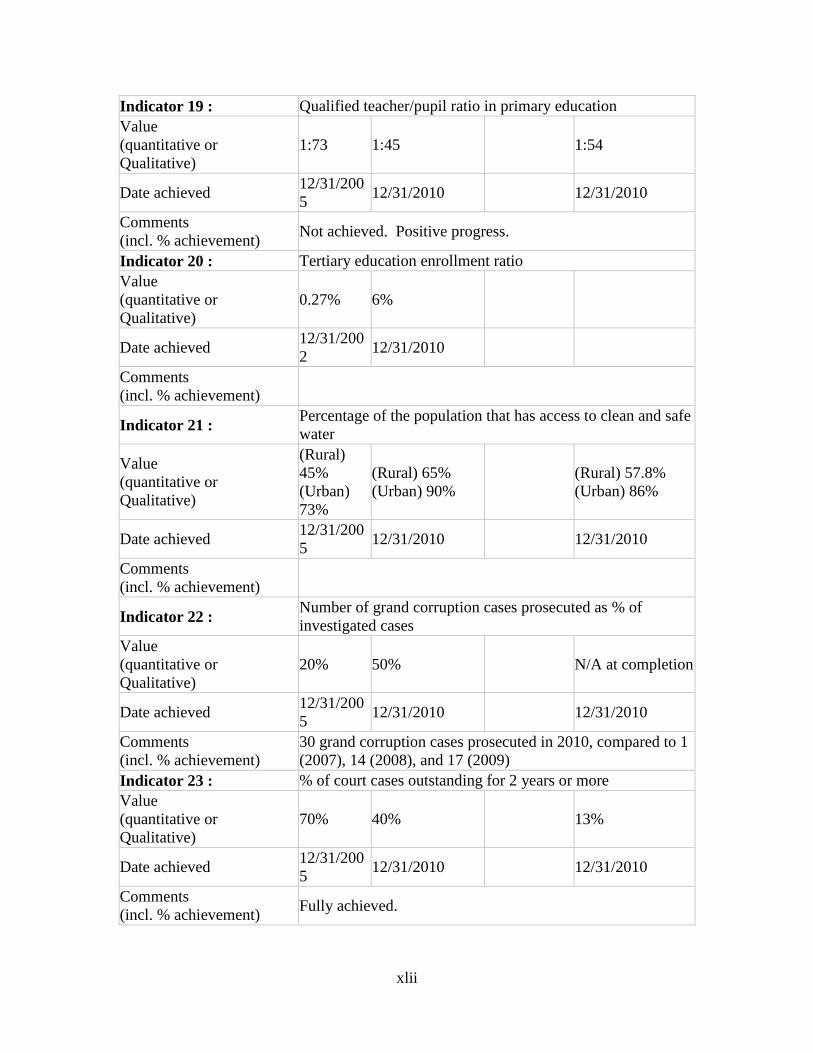
Indicator 19 : Qualified teacher/pupil ratio in primary education
Value
(quantitative or
Qualitative)
1:73 1:45 1:54
Date achieved 12/31/200
5 12/31/2010 12/31/2010
Comments
(incl. % achievement) Not achieved. Positive progress.
Indicator 20 : Tertiary education enrollment ratio
Value
(quantitative or
Qualitative)
0.27% 6%
Date achieved 12/31/200
2 12/31/2010
Comments
(incl. % achievement)
Indicator 21 : Percentage of the population that has access to clean and safe
water
Value
(quantitative or
Qualitative)
(Rural)
45%
(Urban)
73%
(Rural) 65%
(Urban) 90%
(Rural) 57.8%
(Urban) 86%
Date achieved 12/31/200
5 12/31/2010 12/31/2010
Comments
(incl. % achievement)
Indicator 22 : Number of grand corruption cases prosecuted as % of
investigated cases
Value
(quantitative or
Qualitative)
20% 50% N/A at completion
Date achieved 12/31/200
5 12/31/2010 12/31/2010
Comments
(incl. % achievement)
30 grand corruption cases prosecuted in 2010, compared to 1
(2007), 14 (2008), and 17 (2009)
Indicator 23 : % of court cases outstanding for 2 years or more
Value
(quantitative or
Qualitative)
70% 40% 13%
Date achieved 12/31/200
5 12/31/2010 12/31/2010
Comments
(incl. % achievement) Fully achieved.
xliii
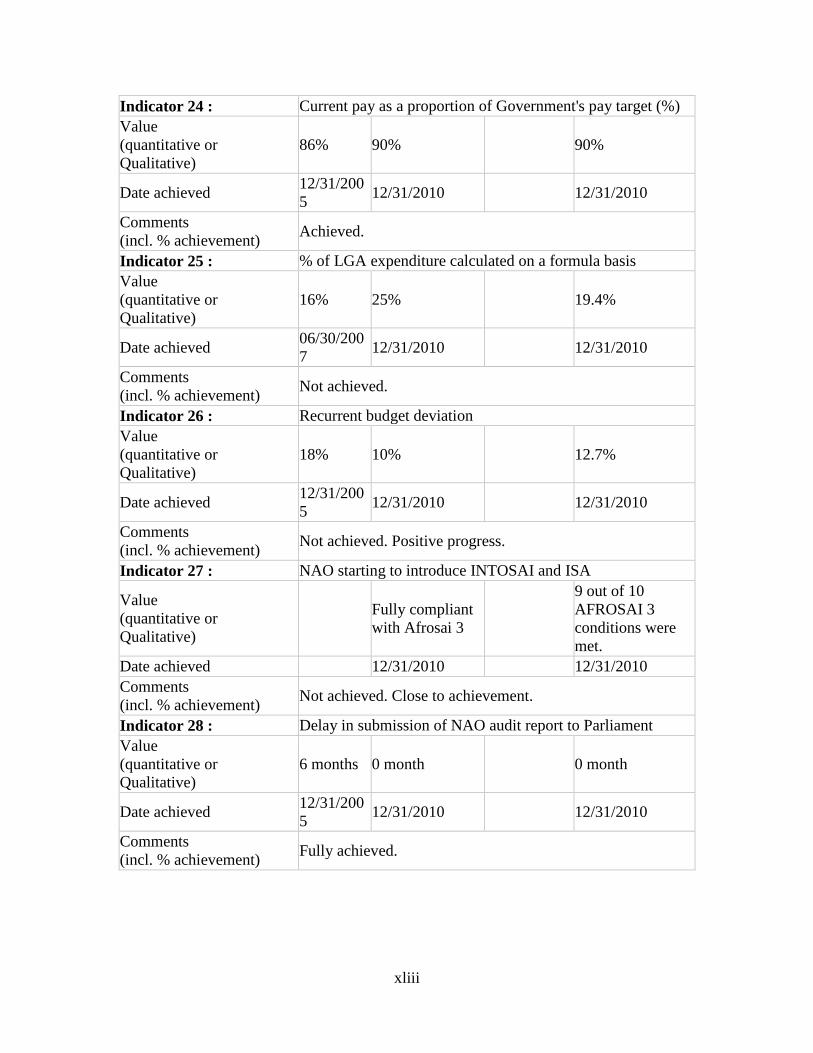
Indicator 24 : Current pay as a proportion of Government's pay target (%)
Value
(quantitative or
Qualitative)
86% 90% 90%
Date achieved 12/31/200
5 12/31/2010 12/31/2010
Comments
(incl. % achievement) Achieved.
Indicator 25 : % of LGA expenditure calculated on a formula basis
Value
(quantitative or
Qualitative)
16% 25% 19.4%
Date achieved 06/30/200
7 12/31/2010 12/31/2010
Comments
(incl. % achievement) Not achieved.
Indicator 26 : Recurrent budget deviation
Value
(quantitative or
Qualitative)
18% 10% 12.7%
Date achieved 12/31/200
5 12/31/2010 12/31/2010
Comments
(incl. % achievement) Not achieved. Positive progress.
Indicator 27 : NAO starting to introduce INTOSAI and ISA
Value
(quantitative or
Qualitative)
Fully compliant
with Afrosai 3
9 out of 10
AFROSAI 3
conditions were
met.
Date achieved 12/31/2010 12/31/2010
Comments
(incl. % achievement) Not achieved. Close to achievement.
Indicator 28 : Delay in submission of NAO audit report to Parliament
Value
(quantitative or
Qualitative)
6 months 0 month 0 month
Date achieved 12/31/200
5 12/31/2010 12/31/2010
Comments
(incl. % achievement) Fully achieved.
xliv
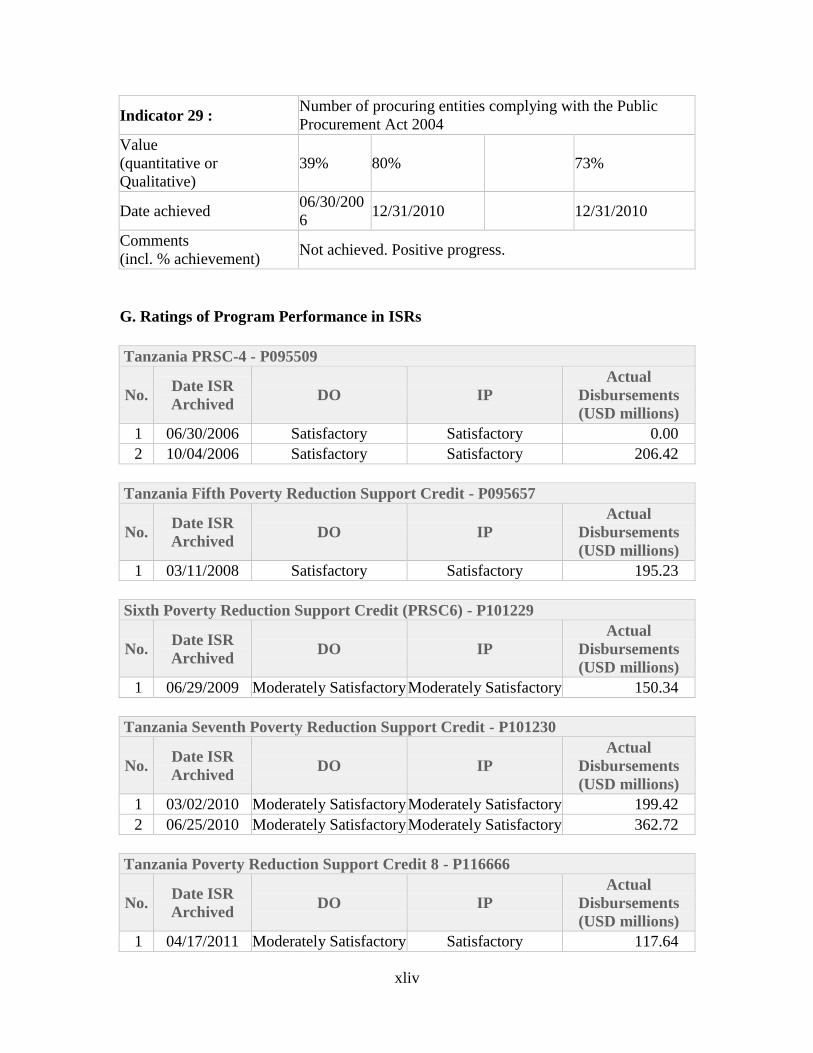
Indicator 29 : Number of procuring entities complying with the Public
Procurement Act 2004
Value
(quantitative or
Qualitative)
39% 80% 73%
Date achieved 06/30/200
6 12/31/2010 12/31/2010
Comments
(incl. % achievement) Not achieved. Positive progress.
G. Ratings of Program Performance in ISRs
Tanzania PRSC-4 - P095509
No. Date ISR
Archived DO IP
Actual
Disbursements
(USD millions)
1 06/30/2006 Satisfactory Satisfactory 0.00
2 10/04/2006 Satisfactory Satisfactory 206.42
Tanzania Fifth Poverty Reduction Support Credit - P095657
No. Date ISR
Archived DO IP
Actual
Disbursements
(USD millions)
1 03/11/2008 Satisfactory Satisfactory 195.23
Sixth Poverty Reduction Support Credit (PRSC6) - P101229
No. Date ISR
Archived DO IP
Actual
Disbursements
(USD millions)
1 06/29/2009 Moderately Satisfactory Moderately Satisfactory 150.34
Tanzania Seventh Poverty Reduction Support Credit - P101230
No. Date ISR
Archived DO IP
Actual
Disbursements
(USD millions)
1 03/02/2010 Moderately Satisfactory Moderately Satisfactory 199.42
2 06/25/2010 Moderately Satisfactory Moderately Satisfactory 362.72
Tanzania Poverty Reduction Support Credit 8 - P116666
No. Date ISR
Archived DO IP
Actual
Disbursements
(USD millions)
1 04/17/2011 Moderately Satisfactory Satisfactory 117.64

1
1. Program Context, Development Objectives and Design
1.1 Context at Appraisal
Summary of Economic and Structural Sector Background
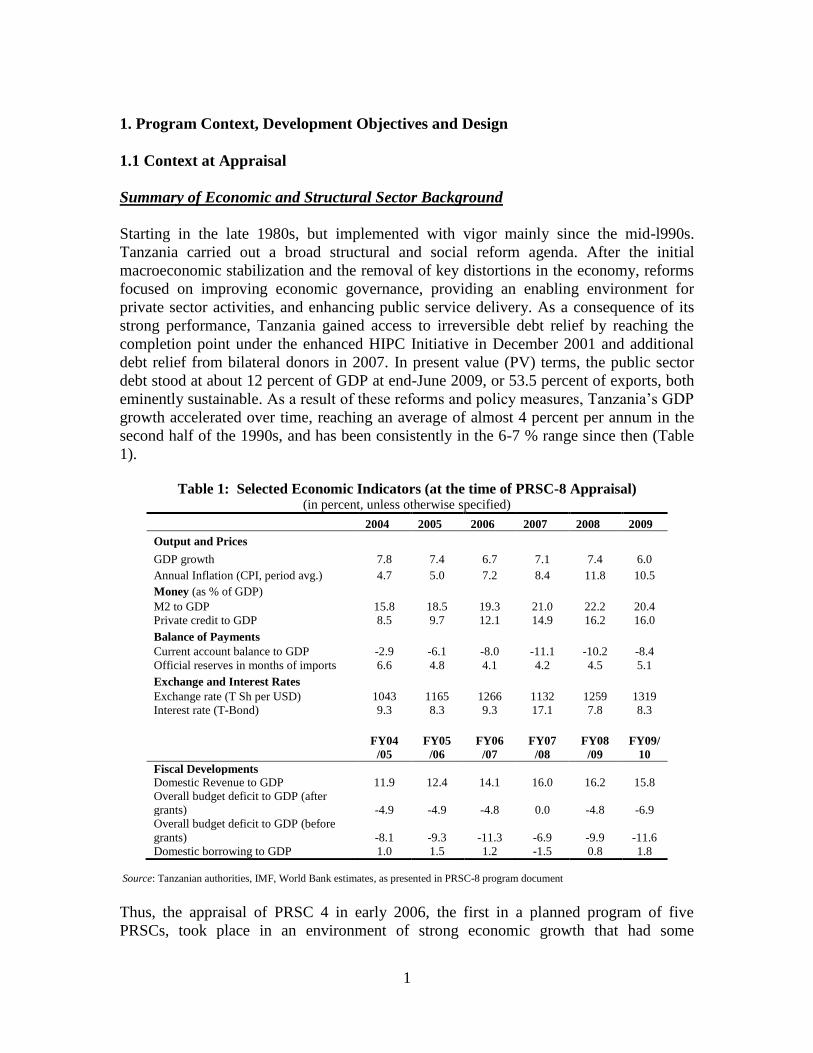
Starting in the late 1980s, but implemented with vigor mainly since the mid-l990s.
Tanzania carried out a broad structural and social reform agenda. After the initial
macroeconomic stabilization and the removal of key distortions in the economy, reforms
focused on improving economic governance, providing an enabling environment for
private sector activities, and enhancing public service delivery. As a consequence of its
strong performance, Tanzania gained access to irreversible debt relief by reaching the
completion point under the enhanced HIPC Initiative in December 2001 and additional
debt relief from bilateral donors in 2007. In present value (PV) terms, the public sector
debt stood at about 12 percent of GDP at end-June 2009, or 53.5 percent of exports, both
eminently sustainable. As a result of these reforms and policy measures, Tanzania’s GDP
growth accelerated over time, reaching an average of almost 4 percent per annum in the
second half of the 1990s, and has been consistently in the 6-7 % range since then (Table
1).
Table 1: Selected Economic Indicators (at the time of PRSC-8 Appraisal) (in percent, unless otherwise specified)
2004 2005 2006 2007 2008 2009
Output and Prices
GDP growth 7.8 7.4 6.7 7.1 7.4 6.0
Annual Inflation (CPI, period avg.) 4.7 5.0 7.2 8.4 11.8 10.5
Money (as % of GDP)
M2 to GDP 15.8 18.5 19.3 21.0 22.2 20.4
Private credit to GDP 8.5 9.7 12.1 14.9 16.2 16.0
Balance of Payments
Current account balance to GDP -2.9 -6.1 -8.0 -11.1 -10.2 -8.4
Official reserves in months of imports 6.6 4.8 4.1 4.2 4.5 5.1
Exchange and Interest Rates
Exchange rate (T Sh per USD) 1043 1165 1266 1132 1259 1319
Interest rate (T-Bond) 9.3 8.3 9.3 17.1 7.8 8.3
FY04
/05
FY05
/06
FY06
/07
FY07
/08
FY08
/09
FY09/
10
Fiscal Developments
Domestic Revenue to GDP 11.9 12.4 14.1 16.0 16.2 15.8
Overall budget deficit to GDP (after
grants) -4.9 -4.9 -4.8 0.0 -4.8 -6.9
Overall budget deficit to GDP (before
grants) -8.1 -9.3 -11.3 -6.9 -9.9 -11.6
Domestic borrowing to GDP 1.0 1.5 1.2 -1.5 0.8 1.8
Source: Tanzanian authorities, IMF, World Bank estimates, as presented in PRSC-8 program document
Thus, the appraisal of PRSC 4 in early 2006, the first in a planned program of five
PRSCs, took place in an environment of strong economic growth that had some

2
momentum behind it. Inflation, though still too variable, was in the single digit range.
Foreign exchange reserves were comfortable, although current account balance was
growing due to an import growth rate that far exceeded the rate of growth of exports.
Domestic revenue to GDP ratio was improving, although from a low level, and overall
budget deficit (after grants) was in a range that did not require domestic borrowing at a
level that would crowd out the private sector. Credit to the private sector was rising
rapidly, both in absolute terms as well as relative to GDP.
While data on income-poverty incidence at the time of appraisal of the first operation of
the series (PRSC-4) were somewhat old (the latest available year was 2001 - see Table 2
below), the trends observed from 1991-2001 were not particularly encouraging. The
increasingly strong GDP growth performance during the 1990s, had not led to a major
reduction in income poverty, except in Dar-es-Salaam. In other urban areas, and
particularly in the countryside where the vast majority of the poor lived, the declines
were within the margin of sampling error (i.e. not statistically significant). Little poverty
reduction in the countryside should have been an early sign that more attention had to be
paid to the rural sector. Still, there was hope that strong growth in the almost five years
that had elapsed between the last set of data on poverty and the appraisal of PRSC 4,
would have lifted many additional people out of poverty.
Table 2: Changes in Income-Poverty Incidence
1991 2001 2007
Dar es Salaam 28.1 17.6 16.4
Other urban 28.7 25.8 24.1
Rural 40.8 38.7 37.6
Tanzania Mainland 38.6 35.6 33.6
Source: National Bureau of Statistics and World Bank staff estimates
In the event, the Household Budget Survey (HBS) of 2007, showed a poverty picture that
was disappointing (but see caveats below). The disconnect between growth and poverty
reduction during 2001-07 was even stronger than in the preceding period. This was
attributed to four main factors. First, GDP growth was driven by sectors that were
predominantly urban or were in other ways weakly linked to the rural sector
(construction, telecommunications, financial intermediation, and mining). Second, almost
three quarters of the higher growth in the 1990s and well into the 2000s was driven by
higher foreign aid inflows feeding into the government budget. As a result, public
consumption strongly outpaced private consumption, and it is the latter that forms the
basis for measuring income poverty (WB CEM 2007). Third, the rate of growth of
agriculture did not far outpace the rate of growth of population. Fourth, the rate of growth
of agriculture may have been overestimated. If the overestimate is significant, it would
contribute to stagnation in poverty reduction in the countryside (as well as pull down the
overall rate of growth of GDP). In addition, some of the consumption increase occurred
in consumer durables over the year which are not included in the consumption basket of
the Household Budget Survey (HBS).
3
Recent re-examinations of the 2007 HBS data, embellished by data from other surveys,
show that in dimensions other than just the reduction of income poverty, Tanzania fared
better over the same period (2001-2007). Public spending was clearly pro-poor, with
affordable services benefitting the lower quintiles of the income distribution. Urban
areas realized important gains in access to non-farm employment, and earnings increased
substantially. Real gains in wealth were made by all quintiles as measured by increased
possession of consumer durables and better housing. The picture in the countryside
remained less encouraging, although there were areas that had benefitted by higher prices
of their produce or better roads. Further work is being done on improving the
methodology and processes of the HBS.
The situation in other aspects of people’s well-being was more encouraging at the time of
appraisal. Between years 2000 and 2005, net primary school enrollment increased from
57 to 95 percent. Life expectancy increased from 49 years in 1988 to 55 years in 2002.
Infant mortality dropped from 115 per 1000 in 1988 to 68 per 1000 in 2004.1 The fraction
of chronically undernourished or stunted children declined from 44 percent in 1999 to 38
percent in 2004.2 Other indicators recorded less progress. Maternal mortality which was
529 per 100,000 births in 1996 had not changed, nor had fertility which averaged 5.7
children per woman.3 The proportion of the population with access to piped or protected
water as their main source of drinking water remains very low, especially in rural areas
where, depending on the source, between 46 (census) and 52 (HBS 2007) percent had
access.
In terms of governance, the first series of PRSCs (PRSC 1-3) supported the development
of annual plans and performance budgets and service delivery surveys. Based on these,
the government published the first ―State of the Public Service‖ report. The report
showed that citizens were increasingly satisfied with a number of key public services
(like primary education). However, it also indicated that levels of dissatisfaction were
still alarmingly high. Around 25 percent of all clients were dissatisfied with central
government services and 50-75 percent with local government services. Service delivery
was still perceived as being riddled with bureaucracy and needed to improve in terms of
timeliness. There were issues with resource leakages and public financial management.
Efforts to reduce corruption were perceived as moving slowly.
Rationale for Bank Assistance
The Bank’s PRSC support to Tanzania is provided within a harmonized framework for
general budget support (GBS) with 13 other development partners (DPs), comprising a
Performance Assessment Framework (PAF), a Partnership Framework Memorandum
(PFM) for GBS for the implementation of MKUKUTA, and a joint review process which
culminates in a joint Annual Review (AR) in October/November. The framework is
1 Later, the number for infant mortality has declined further to 51 per 1000 in 2009 based on 2009/10
Tanzania Demographic and Health Survey (TDHS) 2009/10. 2 Based on TDHS 2009/10, it further dropped to 454.
3 The more recent number from 2009/10 TDHS is 454 per 100,000 live births in 2009.
4
designed to support domestic accountability, reduce transaction costs in the process, and
encourage the further development and use of Tanzania’s own systems.
The CAS approved by the Board on June 15, 2000, which covered PRSC-4, foresaw
quick-disbursing policy-based lending operations in support o f overall and sector
reforms, and a shift to budget support contingent on sufficient progress in the areas of
public expenditure management and governance. Based on these provisions in the CAS,
the Bank launched its first PRSC series in 2003. The World Bank strategy foresaw a
gradual increase in the amount of World Bank resources provided in the form of PRSC
support from the initial amount of US$ 132 million for PRSC-1 in FY04 to US$ 200
million for PRSC-4 in FY07. IDA debt relief under the enhanced HIPC initiative as well
as under the MDRI facility were projected to amount initially to about US$ 100 million,
but increased subsequently reflecting Tanzania’s debt profile.
The CAS, which was approved by the Board jointly with PRSC-5 and has been covering
up to PRSC-8, consists of the government’s Joint Assistance Strategy (JAST), the multi-
donor Joint Programming Document (JPD), and a World Bank Group-specific
supplement, with details on the WBG strategy, progress under the previous CAS, FY06-
FY 10 programs and projects, IDA financing, and a WBG-specific results matrix. The
results WBG results matrix is fully aligned and supportive of MKUKUTA objectives.
The JAST clearly identifies GBS as the preferred aid modality, as it allows for full
integration of donor support into government systems and alignment with MKUKUTA
implementation. The JPD also recognizes the benefits of GBS in terms of strengthening
ownership and domestic systems for the management and implementation o f the
MKUKUTA. The CAS thus envisaged an increase in budget support from about US$190
million in 2006/07 to as much as US$400 million in 2009/10.
1.2 Original Program Development Objectives (PDO) and Key Indicators
MKUKUTA Clusters and Program Development Objectives
The program was designed to support the Government’s reform program named
MKUKUTA (and a similar program specifically for Zanzibar called MKUZA) over the
period 2005-2010. Its proposed policy actions target cross-cutting issues that would be
difficult to address solely within the context of investment lending. The financial part of
the program is in the form of budget support through a series of five PRSCs (PRSC 4-8)
and is done jointly with 13 donors (AfDB, Canada, Denmark, European Commission,
Finland, Ireland, Japan, Germany, Netherlands, Norway, Sweden, Switzerland, and UK).
The budget support is carried out in coordination with a number of complementary
investment projects, most of which also contain elements of Technical Assistance and
Capacity Building. Various analytical studies are designed to provide the basis (evidence)
for the proposed policy actions.
The General Budget Support (GBS) framework (also called Poverty Reduction Budget
Support or PRBS), set up at the beginning of the PRSC program, includes a Partnership
5
Framework Memorandum (PFM), a Performance Assessment Framework (PAF), and an
agreed Joint Review Process. The PFM operationalizes a series of international
commitments that aim to provide more scope for government ownership, better alignment
and integration of donor support with government priorities and systems, and greater
predictability of donor support.
The PAF, a framework agreed between the Government and the DPs, is basically a
matrix of commitments consisting of three categories that are monitored in the Cluster
Working Groups throughout the year: (i) Underlying Process; (ii) Temporary Process
Actions; and (iii) Outcome Indicators. The initial PAF covered six focus areas --- the
three clusters of MKUKUTA (―Growth for Reduction of Income Poverty‖ cluster,
―Improvement of Quality of Life and Social Well-being‖ cluster, and ―Governance and
Accountability‖ cluster) , plus macroeconomic stability, resource allocation and budget
consistency, and public financial management. As the PRSC series proceeded, the last
three focus areas became folded into one, called the ―quality of the budget cluster‖. This
fourth cluster has been set up as a part of the dialogue structure between the Government
and the DPs in implementing GBS. The PAF outcome indicators are generally a subset
of a much wider set of indicators used by MKUKUTA. In turn, the PRSC series, while
using many of the PAF indicators, added a few of its own for its Results Matrix in order
to sharpen the focus on Program Development Outcomes (PDOs) agreed under the PRSC
program.
The Joint Review Process consists of one joint GBS Annual Review, typically held in
October. It is aligned with Tanzania’s budget process. The whole chain starts with Sector
and Thematic Reviews from March through September of each year, followed by
MKUKUTA and GBS Annual Reviews in October, Budget Guidelines preparation
during November through January, and ending with Budget and MTEF preparations
between February and June. The GBS dialogue is led by a rotating troika of DPs, with the
Bank as a permanent member (together referred to as Troika plus).
The set of PDOs under the PRSC series mirrors the Clusters of policies in the
Government’s MKUKUTA program with the additional cluster on public financial
management and quality of budget. Cluster 1 contains policy measures that would lead
to high growth and (income) poverty reduction. Cluster 2 groups policies targeted at
improving the quality of life and social well-being. The focus of Cluster 3, are policies
that would lead to an improvement of governance and accountability.
PDO 1: Reduce income poverty (MKUKUTA Cluster 1: ―Growth for Reduction
of Income Poverty‖)
PDO2: Improve key human development objectives (MKUKUTA Cluster 2:
―Improvement of Quality of Life and Social Well-being)
PDO 3: Improve the capacity of the Government to design and implement
development policies in a transparent and efficient manner (MKUKUTA
Cluster 3: ―Governance and Accountability‖)
PDO Indicators with Baseline and Target
6
Broad progress towards PDOs was to be measured with the following PDO Indicators:
Indicator for PDO 1:
Rural poverty head count
o Baseline 39% (2001)
o Latest 37% (2007 HBS)
o Program Target 34% (2010) (MKUKUTA target 24%)
Indicators for PDO 2:
Under five mortality
o Baseline 112 (2004)
o Latest 81 (2009/10 DHS)
o Program Target 79 (2010) (MKUKUTA target 79)
Increase literacy of 15+ age group
o Baseline 69% (2002) (78% in 2002 in Program Documents is based on
male only.)
o Latest 70.0% (2009 MKUKUTA IR)
o Program Target 80% (2010) (MKUKUTA target 80%)
Indicators for PDO 3:
WGI on accountability
o Baseline -0.31 (2005)
o Latest -0.14 (2009 WGI)
o Program Target 0 (2010)
WGI on control of corruption
o Baseline -0.73 (2005)
o Latest -0.42 (2009 WGI)
o Program Target -0.20 (2010)
WGI on government effectiveness
o Baseline -0.35 (2005)
o Latest -0.42 (2009)
o Program Target 0 (2010)
It should be noted that ―Targets‖ always refer to targets under the PRSC program. The
targets in MKUKUTA were at times (substantially) different, usually in the direction of
greater optimism. The PDOs as well as PDO Indicators are taken from the PRSC 4-8
Results Framework (Annex 4).
Program Outcomes and Intermediate/Subsidiary Indicators
7
Each cluster/PDO has a number of program outcomes, which contribute to the PDOs.
Similarly, the PDO indicators were supported by a set of intermediate indicators or
subsidiary indicators as below, which correspond to individual program outcomes.
PDO 1: reduce income poverty
Program Outcome 1.1 Improved business environment by maintaining a conducive
macro framework and reducing administrative barriers.
Intermediate/subsidiary Indicators:
Fiscal deficit (after grants) as percent of GDP
Inflation rate (average, CY)
Improve ranking in ―Doing Business Indicators‖
Program Outcome 1.2 Increased access of private sector to key inputs, in
particular credit and backbone services (electricity, roads, ICT).
Intermediate/subsidiary Indicators:
Credit to private sector (% of GDP)
Time taken for a container from off-loading until clearing from port (import data)
Installed MW power capacity
Availability of power supply
Share of national and regional roads in good and fair condition
Program Outcome 1.3 Improved livelihoods in rural areas, where the majority of
the poor work, through improved agricultural policies and expansion of rural
infrastructure.
Intermediate/subsidiary Indicators
Agriculture sector three-year average growth rate
Revenues received from concession and license in forestry, as % of their
estimated value
Number of districts qualifying for top up grants
% of passable rural roads (in good and fair condition)
Number of customers connected to national grid and off-grid sources
PDO 2: Improve key human development objectives
Program Outcome 2.1 Improved health status of the population.
Intermediate/subsidiary Indicators
% of children < 2 years receiving three doses of vaccines
% of births attended by a skilled health worker
National HIV prevalence in the 15 to 24 years age group
8
Program Outcome 2.2 Expanded enrollment and enhanced quality in all levels of
education
Intermediate/subsidiary Indicators
Net primary enrollment (all, boys, girls)
Percentage of cohort completing primary education (standard VII)
Qualified teacher / pupil ratio in primary education
Tertiary education enrollment ratio
Program Outcome 2.3 Improved well-being through better access to clean water
Intermediate/subsidiary Indicators
Percentage of the population that has access to clean and safe water
PDO 3: improve the capacity of the Government to design and implement
development policies in a transparent and efficient manner
Program Outcome 3.1 Enhanced accountability of the state
Intermediate/subsidiary Indicators
Number of grand corruption cases prosecuted as % of investigated cases
% of court cases outstanding for 2 years or more
Program Outcome 3.2 Improved effectiveness of public administration through
better incentives for public servants and decentralization,
Intermediate/subsidiary Indicators
Current pay as a proportion of Government’s pay target (%)
% of LGA expenditures calculated on a formula basis
Program Outcome 3.3 Improved public financial management.
Intermediate Indicators
Recurrent budget deviation
NAO starting to introduce INTOSAI and ISA
Delay in submission of NAO audit report to Parliament
Number of procuring entities complying with the Public Procurement Act 2004.
1.3 Revised PDO and Key Indicators, and Reasons/Justification
There was no revision to PDO or key indicators within each operation of the series. For
the series as a whole, the three PDOs, which directly correspond to MKUKUTA clusters,
were not revised.
9
However, the structure of the Results Framework (RF) linked to the PAF was firmed up
as part of PRSC-6. More specifically, the new structure introduced the two-level
structure, consisting of PDOs and PDO indicators at a high level, which were then
supported by the program outcomes and intermediate/subsidiary indicators at a lower
level. Prior to this RF structure, PDOs were measured by a set of indicators that measure
only progress in specific areas which do not have as much comprehensiveness as PDOs
have. The introduction of this new RF structure was to allow PDO indicators to measure
progress toward such comprehensive development objectives, and at the same time to
specify program outcomes that contribute to achievements of PDOs. As a result, the high-
order PDO indicators were introduced while original indicators were converted into
intermediate/subsidiary indicators including new indicators introduced with the occasion
of the new RF so as to better aligned to PAF. The new indicators introduced were taken
from the Government’s MKUKUTA outcome indicators as well as indicators to measure
the Government’s anti-corruption effort related to governance reflecting the set of grand
corruption cases from FY2005/06. The revised RF presented in Annex 4 (a)-(c) has been
in use since PRSC-6 (see more discussion 2.3 in the monitoring and evaluation section).
1.4 Original Policy Areas Supported by the Program:
• Rural Development
• Private sector Development
• Debt management
• Domestic revenue
• Budget formulation and management
• Public Service reform
• Financial Management
• Procurement
• Anti-corruption
• Aid management
• Environment
• Poverty Monitoring and Evaluation
1.5 Revised Policy Areas
Not applicable
1.6 Other significant changes
None
10
2. Key Factors Affecting Implementation and Outcomes
2.1 Program Performance (supported by a table derived from a policy matrix)
As is now fairly customary, the policy actions supported under this PRSC series were
overwhelmingly ―Prior Actions‖ in the sense that they were carried out prior to the Board
date. However, they were always a part of the Government’s broader reform program, the
MKUKUTA (MKUZA for Zanzibar), so there was some coherence to them both in terms
of covering important areas within any year, as well as in how they built up a
momentum towards the achievement of the PDOs over time. Prior Actions were typically
signaled in the preceding operation (and were at that stage often labeled as ―triggers‖).
Most of them were implemented as expected, but each year a few of the triggers were
replaced with other actions when the time came, depending on the changes ―on the
ground‖ (relevance, political considerations, delays, etc.). The list of Prior Actions
actually taken under the program series as well as actions that were dropped or amended,
along with reasons for the changes, is presented in Annex 2.
Table 3 summarizes the key policy achievements over the full cycle of the series. These
represent only a fraction of the over 50 Prior Actions taken across the entire MKUKUTA
reform program (for the full set see Annex 2). Early on in the program series there was
emphasis on: (i) reducing impediments to small businesses and farmers (new Bills on
Business Activities, operationalization of the Land Act and the Village Land Act, and
rationalization of the roles, functions, financing and accountability of the Crop Boards);
(ii) fixing a number of budget issues (timeliness, alignment of budget with policies,
deviations between budgeted amounts and outcomes, and auditing of the books); (iii)
integrating donor funding and tracking into the government cycles and processes; (iv)
annual sectoral reviews of health, education and water; and (v) a variety of issues in
governance and accountability. Later, emphasis was added on policies to remove
infrastructure constraints.
Table 3 also shows the numbers of triggers fully met, partially met or not met. There is a
clear trend from PRSC-4, when all triggers were met, to PRSC-8, when only 7 of the 11
triggers were fully met. As a result, the amounts allocated under the PRSCs also declined
over time (CAS projection was 190 million, 250 million, 300 million, and 400 million for
PRSC-5 to -8 respectively, with total US$ 1.14 billion, which is larger than the actual
total amount of US$ 825 million for PRSC5-8). Although, the ―shortfalls‖ from the
initially programmed totals to be disbursed under the PRSC 4-8 series were pretty much
made up through PRSC-7 supplemental financing, which supported the Government’s
stimulus package during FY2009/10 to mitigate negative impacts from the global
financial crisis. The impact was not as severe as initially anticipated because of the
Government’s effective interventions both in fiscal and monetary policies.
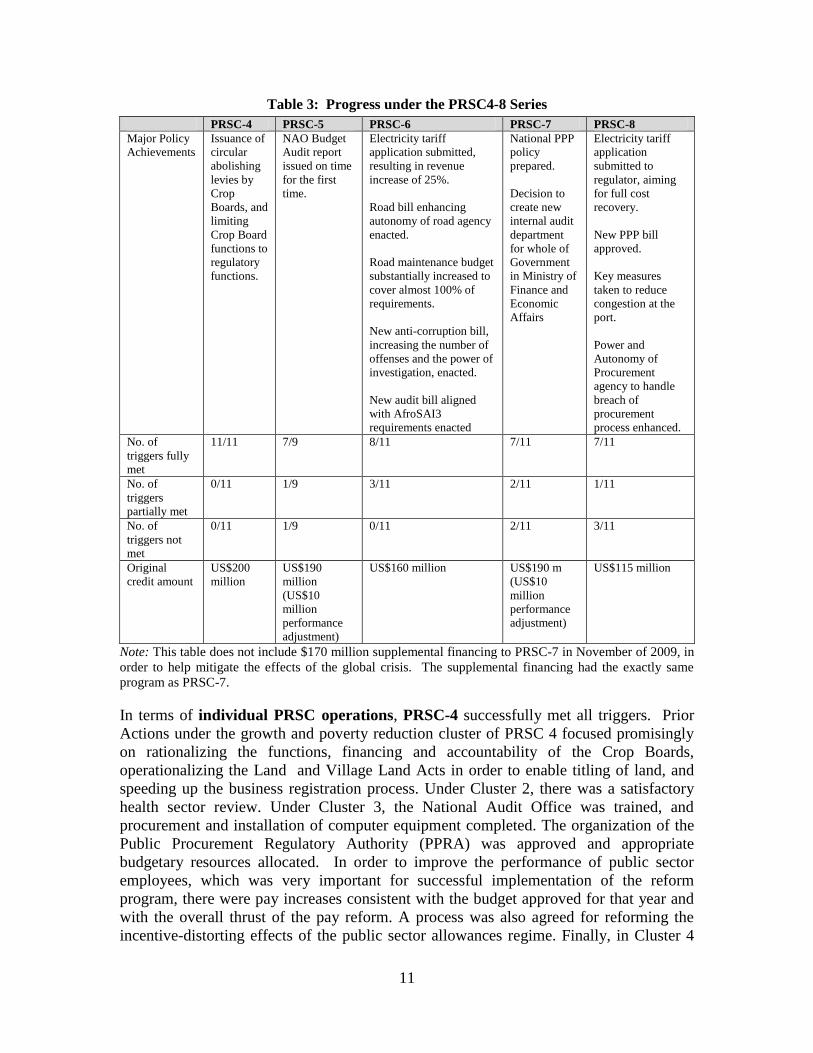
11
Table 3: Progress under the PRSC4-8 Series
PRSC-4 PRSC-5 PRSC-6 PRSC-7 PRSC-8
Major Policy
Achievements
Issuance of
circular
abolishing
levies by
Crop
Boards, and
limiting
Crop Board
functions to
regulatory
functions.
NAO Budget
Audit report
issued on time
for the first
time.
Electricity tariff
application submitted,
resulting in revenue
increase of 25%.
Road bill enhancing
autonomy of road agency
enacted.
Road maintenance budget
substantially increased to
cover almost 100% of
requirements.
New anti-corruption bill,
increasing the number of
offenses and the power of
investigation, enacted.
New audit bill aligned
with AfroSAI3
requirements enacted
National PPP
policy
prepared.
Decision to
create new
internal audit
department
for whole of
Government
in Ministry of
Finance and
Economic
Affairs
Electricity tariff
application
submitted to
regulator, aiming
for full cost
recovery.
New PPP bill
approved.
Key measures
taken to reduce
congestion at the
port.
Power and
Autonomy of
Procurement
agency to handle
breach of
procurement
process enhanced.
No. of
triggers fully
met
11/11 7/9 8/11 7/11 7/11
No. of
triggers
partially met
0/11 1/9 3/11 2/11 1/11
No. of
triggers not
met
0/11 1/9 0/11 2/11 3/11
Original
credit amount
US$200
million
US$190
million
(US$10
million
performance
adjustment)
US$160 million US$190 m
(US$10
million
performance
adjustment)
US$115 million
Note: This table does not include $170 million supplemental financing to PRSC-7 in November of 2009, in
order to help mitigate the effects of the global crisis. The supplemental financing had the exactly same
program as PRSC-7.
In terms of individual PRSC operations, PRSC-4 successfully met all triggers. Prior
Actions under the growth and poverty reduction cluster of PRSC 4 focused promisingly
on rationalizing the functions, financing and accountability of the Crop Boards,
operationalizing the Land and Village Land Acts in order to enable titling of land, and
speeding up the business registration process. Under Cluster 2, there was a satisfactory
health sector review. Under Cluster 3, the National Audit Office was trained, and
procurement and installation of computer equipment completed. The organization of the
Public Procurement Regulatory Authority (PPRA) was approved and appropriate
budgetary resources allocated. In order to improve the performance of public sector
employees, which was very important for successful implementation of the reform
program, there were pay increases consistent with the budget approved for that year and
with the overall thrust of the pay reform. A process was also agreed for reforming the
incentive-distorting effects of the public sector allowances regime. Finally, in Cluster 4
12
(improving the quality of the budget), the budget approved was deemed as supportive of
MKUKUTA’s goals and the expenditure outturn for FY04/05 (the year previous to
PRSC-4) had been consistent with the approved budget.
Under PRSC 5, the trigger of Crop Boards was not completed. Instead the government
decided to conduct consultations for all four crop Boards and sign an MOU, and amend
the crop board legislation later for all four boards simultaneously. Perhaps this was an
early indication that reforms in agriculture were not proceeding at a pace consistent with
the GoT’s stated goals for agricultural growth (MKUKUTA target was 10% annual
growth in agriculture). There was progress in the reform of the Business Activities
Registration and in the Business Regulatory Licensing Regime. On roads, the Roads Bill
was not submitted to Parliament as earlier agreed. Since rapid improvement in
infrastructure was considered very important, and in order to maintain the credibility of
the PRSC instrument, the Bank reduced the amount to be disbursed under this PRSC by
$10 million. Under Cluster 2, there were satisfactory reviews of the health, education and
water sectors. Under Cluster 3, the NAO General Report for FY04/05 was issued, as
agreed, by April 2006. The approved budget for FY06/07 was in line with the policy
objectives of MKUKUTA, and expenditure outturns for FY05/06 were consistent with
the approved budget.
There was progress across the Board in reform actions under Cluster 1 of PRSC 6. Draft
amendments to crop board legislation were submitted for stakeholder consultations and
strategic plans for all crop boards were finalized. There was progress in the
implementation of the TANESCO financial recovery plan and in the regulation of the
power sector. The Road Bill was submitted to Parliament. A prioritized Transport Sector
Investment Plan was finalized, with adequate provision for maintenance and a framework
for Public Private Partnerships (PPP). Sector reviews of health, education and water
under Cluster 2 were found to be fairly satisfactory which resulted in a ―partially
completed‖ rating of the three triggers in this area. However, the amount of the credit was
not reduced. Under Cluster 3, the Anti-Corruption an Audit bills were submitted to
Parliament. The approved budget for FY07/08 was in line with the policy objectives of
MKUKUTA, and expenditure outturns for FY06/07 were consistent with the approved
budget.
It is perhaps worth mentioning that because of concerns raised in fiduciary governance at
the Bank of Tanzania (BOT), and other allegations of corruption, specific conditions
were set by IDA prior to negotiations of the PRSC 6 Credit. In fulfillment of these
conditions, the Recipient provided the following: (a) the Government shared with the
IDA a time bound action plan describing current investigations and audit related to
potential cases of fraud involving the BOT; (b) IDA received from the BOT copies of the
audited accounts of the BOT for the FY 06/07, and IDA was made privy to the
management letter accompanying the audit; and (c) a Voluntary Country Safeguards
Assessment of the BOT was been completed, and BOT was to incorporate key
recommendations of the Voluntary Safeguard Assessment in its action plan. IDA and the
Government agreed to continue to monitor progress in the control environment in the
BOT with the PRSC and General Budget Support dialogue.
13
Progress under PRSC 7 was mixed. In Cluster 1 the Business Activities Registration Act
(BARA) trigger, which was to make regulations consistent with one-stop shop good
practice was not completed and the trigger was dropped. This was a setback to GoT’s
declared high level policy intentions to improve the relatively weak investment climate.
Instead, moving away from the one-stop shop concept was, in the opinion of Bank and
other DP experts in this area, likely to result in a system that was burdensome, prone to
manipulation and corruption, complex to manage, and potentially punitive, especially for
the smaller firms (which generate over 90 percent of all jobs). It would also represent one
more demand on the government’s management capacities that were already under strain.
The failure to meet this trigger, and to identify suitable remedial measures, led the Bank
to reduce the credit by US$10 million.
There was progress on other triggers in Cluster 1. TANESCO’s financial recovery plan
moved forward. A national PPP policy, including the infrastructure sector was prepared,
discussed with stakeholders and was on the way to obtaining Cabinet approval.
In Cluster 2, in the education sector, a performance report for 2007/08 was prepared on
the basis of an agreed sector monitoring tool. Health sector performance report for
2006/07 was updated and the one for 2007/08 produced and disseminated. Finally, a
satisfactory water sector review was carried out.
In Cluster 3, a revised Medium-Term Pay Policy was not adopted as expected. Instead the
Prior Action was watered down to ―concrete steps to be taken to prepare a revised
Medium-Term Pay policy by the government as the basis for reform of pay and
allowances‖. The trigger, in the area of managing licenses and/or concession allocations
in the natural resources area, was substantially completed. New procurement regulations
were prepared but not yet gazetted. Approval was granted to create a new Department of
Internal Audit.
In cluster 4, the expenditure outturn report for FY07/08 consistent with the approved
budget and recurrent budget deviations was not completed which reflected a broader
worsening of overall budget execution. Further actions in this area would in the future be
addressed through the PER dialogue. On the other hand, the budget for FY08/09 was
deemed to be in line with the policy objectives of MKUKUTA and was approved.
PRSC 8 was designed in an environment of flagging commitment to reforms by the GoT.
The loss of momentum had been evident for some time, but was probably accelerated by
the elections scheduled for the Fall of 2010. It was therefore no surprise that actions on
the reform front were even weaker than for PRSC 7 and that the amount of the credit was
reduced to US$115 million
Under Cluster 1, the FIAS study that was to pay particular action to regulations and local
taxes affecting agriculture was not completed and the trigger was dropped from those that
were converted to prior actions. An action plan to improve accountability and
transparency in allocating natural resource licenses and concessions was approved and
implementation initiated. There was some progress on completing the land registry. An
Energy Tariff application was successfully submitted by TANESCO to the regulator to
14
finally allow for revenue collection to meet full operational costs in 2011 and full cost
recovery by 2013. The government managed to reduce port congestion through three key
measures (i) Tanzania Ports Authority prepared a preliminary version of a time-bound
action plan for moving to Landlord Status; (ii) SUMATRA approved an increase in port
storage tariffs and a reduction in free time; and (iii) the GoT established its own area for
impounded containers. Finally, the PPP bill was approved by Parliament.
In Cluster 2, satisfactory education, health and water sector reviews were carried out,
based on an assessment of progress against agreed outcome targets, adequacy of resource
allocation, achievement of sector milestones, and adequacy of stakeholder consultations.
In Cluster 3, the trigger covering further progress on Medium-Term Pay reform for public
sector workers was not completed. The new Public Procurement Act that increases the
autonomy of PPRA and its power to enforce procurement rule, was passed by the
Parliament.
In Cluster 4, expenditure outturn for FY08/09 was found to be consistent with the
approved budget and recurrent budget deviation was reduced. The trigger was deemed
completed. However, the budget approved for FY09/10 was not found to be in line with
the policy objectives of MKUKUTA and the trigger was only partially achieved.
A full list of Triggers and Prior Actions, covering each of the PRSCs 4 through 8, is
provided in Annex 2.
2.2 Major Factors Affecting Implementation:
Government’s ownership of the program at the high policy level and its commitment to
the joint donor budget support process have by and large been strong, and have resulted
in a number of visible improvements.
As one looks at the implementation level, however, the record is much more patchy. In
some areas, like putting a school and a clinic in every ward, increasing the number of
teachers and providing more medical attendants, and in improving the trunk roads, there
are notable successes. In most areas, however, the GoT’s capacity to implement seems to
have reached its limits. In reforming the infrastructure sector, except for successes in
ports and roads, there were failures in the electricity sector, railroads, and air transport.
The investment climate has hardly improved in the past five years and reform progress in
agriculture was too slow to keep up with rapid population growth, much less to develop
Tanzania’s undoubted export potential in a number of crops. Most ICRs of the Bank’s
investment lending projects mention implementation capacity as a constraint, in some
cases to the point of giving them unsatisfactory ratings. And having one of the lowest
tertiary education graduating rates in the world, must have implications for how rapidly
complex implementation problems can be attended to. It is also possible that slow
progress in the areas of accountability and anti-corruption were hampered by increasing
government ineffectiveness. Slow implementation of pay and promotions reform in the
15
public sector, did little to resolve the implementation constraints. Last but perhaps not
least, interviews with Bank and DP staff suggested (albeit anecdotally) that powerful
vested interests may have played a role in undermining the successful implementation of
many of the high level policy pronouncements and commitments.
In retrospect it seems that the Bank’s assessment of GOT capacities was in many
instances too optimistic. Yet there were successes, and on an ex ante view it would have
been difficult to predict which of the proposed interventions were most likely to succeed.
On balance, the Bank and the cofinanciers, while aware that the reforms being
undertaken were ambitious and that the risks of underperformance in many areas were
substantial, made a reasonable judgment that progress (even if highly variable across
sectors) was likely be made.
2.3 Monitoring and Evaluation (M&E) Design, Implementation and Utilization:
The overarching arrangements for cooperation between DPs and the GoT were described
in section 1.2 above. The design, implementation and utilization of the Monitoring and
Evaluation (M&E) processes are governed by those arrangements. Specifically, the Joint
Review Process that has been established for the M&E process consists of one joint GBS
Annual Review, typically held in October. It is aligned with Tanzania’s budget process.
The whole chain starts with Sector and Thematic Reviews from March through
September of each year, followed by an MKUKUTA and GBS Annual Reviews in
October, Budget Guidelines preparation during November through January, and ending
with Budget and MTEF preparations between February and June.
Decisions about the level of GBS to be provided, are based on the progress assessed
under the PAF. The PAF is basically a matrix of commitments consisting of three
categories that are monitored by the Cluster Working Groups throughout the year: (i)
Underlying Process; (ii) Temporary Process Actions; and (iii) Outcome Indicators. The
assessment of performance under the 2009 PAF that preceded the approval of PRSC 8,
for example, showed that 15 out of 20 Underlying Processes were assessed as satisfactory
during the year, 13 out of 25 Temporary Processes were achieved, and 18 out of 34
Outcome Indicators were on track.
Outcome, output, and input indicators provide direct information on all aspects of the
reform programs supported by the PRSCs. Monitoring of these indicators is based on a
broad range of surveys and administrative data systems identified in the MKUKUTA
monitoring master plan. The Poverty and Human Development Report (PHDR), which is
published bi-annually, consolidates poverty measures from various sources, and provides
analysis of poverty trends and underlying factors. Sector reviews are key monitoring
mechanisms for outputs at the sectoral level. IMF’s PRGF and, later, PSI reviews and the
quarterly macro-financial developments report are the key sources for the assessment of
the macroeconomic situation. Progress in public expenditure management covering both
16
improvements in systems and enhanced allocative and operational efficiency in the use of
inputs is tracked by the annual PERs/PEFARs.
The choice of indicators to track PDOs was sound. The various indicators under each
PDO were mostly also sensible, although in a few cases such as for example the target for
agricultural growth, or the percentage of births attended by a skilled health worker, they
became increasingly unrealistic. Perhaps that should have been an early warning that
rural poverty and maternal mortality are not likely to decline in line with expectations and
hence a signal for more intense interventions in these areas. The Doing Business ranking
as an indicator, adopted by PAF, was slightly problematic as a time-series measure as the
Doing Business report for any specific year publishes not only rankings for the latest year
but also adjusts the previous year’s rankings reflecting new countries joins the assessment
and the methodology evolves. Therefore, the team monitored whether Tanzania made an
improvement or not based on the adjusted rankings.
As mentioned earlier (section 1.3), the comprehensive results framework (RF) for the
series was firmly set during PRSC-6 and was congruent to the PAF which was then
integrated with MKUKUTA M&E framework. The set of outcome indicators chosen in
the RF from PRSC-6 built upon the set of indicators chosen from earlier operations in the
series, introducing two levels of . The outcome indicators in the PAF were subsequently
modified every year both in terms of type of indicators as well as target values. For
example, for the case of revenue collected from concessions and licenses for forestry, the
PAF switched from an actual amount of revenue collected in Tanzanian Schilling (TSh)
from the initial indicator which is collected revenue as percentage of their estimated
value. The PAF also added two new indicators (port dwell time and primary school
completion rate) to reflect new developmental concerns in the country and dropped some
indicators based on discussion between GoT and DPs. The target values in the PAF were
also updated annually. On the other hand, to maintain consistency of the programmatic
framework in the series, the modification made to the indicators for PRSCs (after PRSC-
6) included only the two new indicators and limited number of target modifications by
setting PRSC-specific program targets where the initial target values were found
unrealistic (e.g., Doing Business ranking).
2.4 Expected Next Phase/Follow-up Operation (if any):
PRSC 9 is under preparation, which is expected to be the first operation of the next series
of PRSC operations.
17
3. Assessment of Outcomes
3.1 Relevance of Objectives, Design and Implementation
Program Development Objectives of the PRSC 4-8 series corresponded closely to those
of MKUKUTA, the Government’s overarching reform program. The PRSC support
program followed MKUKUTA in supporting policy actions in its three main clusters: (i)
Growth and Reduction of Poverty; (ii) Quality of Life and Social Well-being; and (iii)
Governance and Accountability.
At the same time the PRSC series were an integral part of the Bank’s CAS which, in
support of the main objectives of MKUKUTA, designed and implemented a mix of
budget support, sector investment, TA and analytical instruments. The Bank’s CAS was
also coordinated with the DP’s Joint Assistance Strategy for Tanzania (JAST). The JAST
clearly identifies GBS as the preferred aid modality, as it allows for a fuller integration o
f donor support into government systems and alignment with MKUKUTA
implementation.
The design of the PRSC operations followed established good practice principles in
policy-based lending. PRSC operations tended to reinforce government ownership by
supporting rather than duplicating government processes (aid harmonization among
donors, alignment of aid with the budget cycle, use of government procurement processes,
etc.). There was an accountability framework that guided both government and donors,
including the use of continuously updated result matrices. Prior Actions (as conditions of
disbursement) were few (around 10 in each operation) and were relevant to the
achievement of agreed results. Progress reviews were transparent and conducive to
performance-based, predictable budget support.
Implementation, however, often fell short of intentions expressed in the design of both
budget support and sector investment operations. Major factors affecting implementation
were discussed in Section 2.2 above. Achievement or non-achievement of agreed results
and the extent to which they were due to weaknesses in implementation are discussed in
the next section.
3.2 Achievement of Program Development Objectives
While there was clear progress towards the program development objectives (see Results
Framework in Annex 4), the PRSC program fell short of fully achieving the targets under
PDO indicators in almost all categories.
In Cluster 1 (Growth and reduction of poverty), despite strong growth in GDP over the
period of the PRSC program (2005-10), rural poverty in the 2007 HBS stood at 37% and
was unlikely to meet the program target of 34% based on the measured trend between
2001 and 2007. And it would surely not meet the MKUKUTA target of 24%. However,
18
as discussed in Section 1.1 above, there are methodological and measurement issues that
call for caution in making this judgment.
In Cluster 2 (Quality of life and social well-being) the under 5 mortality PDO of 79 is
likely to be met. On the other hand, the literacy of 15+ age group PDO target of 80% is
unlikely to be met.
In Cluster 3 (Governance and Accountability), the PDOs for accountability, corruption
and government effectiveness, as measured by the World Governance Indicators (WGI),
all remained far from the program targets, with government effectiveness actually getting
worse over the period 2005-09. These indicators may not be fully comparable across
time, but interviews with team members involved in the PRSC series and complementary
projects aimed at improving governance, corroborate that progress in these areas has been
disappointing..
It is difficult to attribute success or failure in the attainment of specific PDOs to any one
or even a group of policy actions taken under the PRSC program. Nevertheless, it would
be hard to believe that the improvements in many of the subsidiary outcome indicators
(sub-indicators) used to track progress of the reform program (see Results Framework in
Annex 4), were unrelated to policy changes.
In the macroeconomic area, for example, strong GDP growth is typically unlikely to be
sustained if the macroeconomic environment is not sound. Tanzania’s was certainly
sound, as has been documented in the IMF’s PRGF, and later PSI, reports over time.
In the area of agriculture, growth averaged 4% per year, short of the PRSC program
target of 6% and far short of the MKUKUTA target of 10%. Also, there is a considerable
doubt that the data are correct, with most knowledgeable observers arguing that the 4%
rate is too high. Even if correct, it is barely ahead of population growth, and seems
mainly to have been due to continued extension of cultivated areas rather than increases
in yields. Still, some crops and some geographic areas did much better than the average
and may hold lessons for the future. There was some progress in important policy areas
such as land registration, reduction of local government ―nuisance‖ taxes, and slow
reform of the crop boards towards regulation and away from marketing. On the other
hand, there was little progress in building all-weather rural roads which are essential for
market access, the system for getting farmers to adopt approaches known to yield results
is broken, and programs to improve access to better seeds and fertilizer are just getting
underway. On the whole, though, the progress was too slow to make a dent in rural
poverty and far too slow if Tanzania wishes to make use of its large agriculture export
potential (see Binswanger-Mkhize and Gautam, 2010).
Actions to improve accountability and transparency in allocating natural resources and
governing concessions should help ensure that growth does not undermine environmental
sustainability.

19
Tanzania’s ranking in Doing Business has declined consecutively for the past three years.
The business environment did not improve enough to make the small and medium
enterprise sector another engine of growth. One can point to some improvements, such as
the removal of various licenses, some streamlining in bureaucratic procedures, and
improvements in some areas of infrastructure (trunk roads, efficiency of port operations).
One can also point to the failure to establish one-stop-shop procedures or to follow up on
studies that suggested specific barriers that should be removed or actions taken to
improve the business environment. It is hard to say at which point a ―critical mass‖ of
policy measures will add up to conditions that would lead to faster formalization of small
informal enterprises and more rapid growth of the entire sector in the future. Nevertheless,
results suggest that much more needs to be done if income poverty is to start declining
more rapidly.
Policy actions aimed at improving trunk roads, establishing a well-functioning road fund,
increasing the quantity and quality of electric power supply, decongesting ports and
improving the framework for private public partnerships, and strong increases in credit to
the private sector, probably contributed to the strong growth in some sectors of the
economy (e.g. construction, telecoms and mining) and will be even more important in the
future. Intermediate indicators in these areas all showed improvements (see Annex 4).
In the area of health, education and better access to clean water, sectoral plans helped
formulate more effective interventions. These plans were over time, increasingly geared
to results, rather than being mostly process oriented. Larger and better targeted budget
resources also helped. Along with better policies, they allowed improvements in the
(qualified) teacher/pupil ratios, almost reaching the net enrollment targets in primary
schools, higher completion rates at primary school level, greater numbers of students at
the tertiary level, increasing the number of health workers (with the percentage of births
attended by skilled health workers increasing from 41% to 51%), better facilities,
resources for medicines, books and other needed materials and equipment, and greater
access to potable water. These are the sectors in which one can safely attribute better
outcomes to better policies. Still, the rate of improvement does not seem to be rapid
enough to make Tanzania more competitive relative to its neighbors (assuming that better
human capital makes a country a better prospect for investment). Tanzania’s HDI ranking
has not budged from its 148th
place in 10 years (UN HDR 2010). It improved absolutely,
but not relatively. It is puzzling that the issue of Tanzania’s high population growth
received scant attention, since in a poor country like Tanzania, greater fertility has
negative implications for human development and poverty.
In the areas of government accountability, anti-corruption and government effectiveness,
slow progress in the PDO indicators (and actual reversal in the effectiveness indicator)
might suggest that the policies enacted were ineffective. The number of measures
implemented in this area, however, has been quite large and the sub-indicators mostly
point in the right direction. It is thus likely, that the impact of the measures taken and yet
to be taken will cumulate over time and the policies will prove to have been more
effective than they now seem. Reforms of the incentives of public employees are difficult
and take a long time to implement. Yet over time many countries have had some success
20
in this area. Perceived corruption may be increasing, but an anti-corruption bill was
enacted. Actions have been taken to improve auditing, procurement, legal procedures,
and budgeting. And a decentralization of finances is underway that should in time better
align service delivery with people’s preferences. It is to be hoped that the combination of
all these will ―jell‖ at some point and that the WGI indicators will eventually show much
stronger progress which, in good part, will have been due to the measures that have been
put in place in the last 5 years.
3.3 Justification of Overall Outcome Rating
Ratings: The Overall Outcome Rating is Moderately Satisfactory
The rating is an average both of the PRSC operations through time and across the wide
scope of each operation.
In terms of relevance, the PRSC 4-8 series were consistent with the objectives of
MKUKUTA which in turn were reflected in the Bank’s CAS and the Joint Assistance
Strategy for Tanzania. Most of the Bank resources (combining budget support, sector
investment lending, TA and AAA) were allocated to the growth and poverty reduction
cluster. This made sense as the hope was that it would result in shared growth which
would alleviate income poverty. It also marked a shift from the first series of PRSCs 1-3
which concentrated more on Cluster 2 (Improvement of Quality of Life and Social Well-
being). In every area of reform, PRSC Prior Actions and resources were supported by
complementary sector investment operations of either the Bank or other DPs (often
through ―baskets‖ to leverage the resources). Attention was also paid to cross-links
among clusters. For example, spatial inequalities in the development of human resources
(Cluster 2) were in part to be addressed through pay policies for remote areas (Cluster 3).
And, when unexpectedly poor (income) poverty results emerged in 2007/08, the Bank
and other DPs reacted quickly, refocused their analysis and tried to figure out what can be
done to spread the benefits of strong GDP growth more widely. The urgency of
improving the performance of agriculture and the environment for doing business was
ratcheted up. At the same time the push continued to improve social well-being as well
as putting in place an apparatus needed for more accountable, more transparent and more
effective governance. The relevance rating is Satisfactory.
Achievements of the PDOs, however, were mixed. Most PDO indicators were not fully
achieved, but overwhelmingly the improvements were in the right direction. Looking at
sub-indicators, the glass is more than half full. There seemed to be some loss of reform
momentum towards the end of the series. On the other hand, the earlier operations may
have benefited from the reforms of the early 2000s. There is also some evidence that in a
number of areas (e.g. PEFA indicators and perhaps some aspects of CPIA) Tanzania may
have been over-rated at the start of the second PRSC series. This may have biased the
initial expectations upward and made subsequent progress look slower than it actually
was. On balance, the achievement of PDOs and other outcome indicators is rated as
21
Moderately Satisfactory, resulting in an Overall Outcome Rating of the PRSC 4-8
program for Tanzania as Moderately Satisfactory.
3.4 Overarching Themes, Other Outcomes and Impacts
(a) Poverty Impacts, Gender Aspects, and Social Development
Covered elsewhere
(b) Institutional Change/Strengthening
Covered elsewhere
(c) Other Unintended Outcomes and Impacts (positive or negative)
The global financial crisis, as well as the food price shock that preceded it, were two
impacts that could not have been foreseen. The Bank (as well as other DPs and the IMF)
reacted in a coherent fashion to offset the impact of the crises. The Bank quickly
processed a financing operation for $170 million, supplemental to PRSC 7 to provide
additional budget support as the Government implemented a rescue package during
FY09/10 to counter the negative macroeconomic shock from the financial crisis.
Specifically, PRSC-7 supplemental financing was provided to contribute to maintaining
the overall reform program on track and ensuring the FY09/10 budget contributions in
support of MKUKUTA can be financed and implemented during the time of the crisis.
Compared with the macroeconomic and budgetary projections at the time of PRSC-7
Negotiations, FY09/10 budget was significant higher due to additional expenditures
related to the rescue package.
3.5 Summary of Findings of Beneficiary Survey and/or Stakeholder Workshops
None
22
4. Assessment of Risk to Development Outcomes
Ratings: The risk to Development Outcomes is Moderate
If the problems of the rural and small business sectors are not addressed with more
urgency and determination, they will continue to undermine progress towards shared
GDP growth and the reduction of income poverty. The links between demography,
growth, social well-being and poverty should probably be added to the equation.
Tanzania is very aid dependent and the government is prone to slippages in its
control of the budget. Despite the increasing ratio of revenues to GDP over the past five
years, the revenues do not cover rapidly growing recurrent expenditures (a gap of 2-4%
of GDP). The overall expenditure to GDP ratio which recently reached almost 30% is
probably too high for a country at Tanzania’s level of development. One of the things
driving it up is the wage bill, which when one includes various allowances is in the range
of 9-10% of GDP. Someone has to be taxed to pay for that which almost surely
negatively affects incentives for effort. Finally, there is a risk that the donors for a variety
of reasons freeze or even cut back on budget support, forcing the government to either
curb the expenditures or raise taxes. This could disrupt both recurrent and public
investment expenditures of the government and lead to a negative impact on growth and
poverty reduction
Limited human resource capacity to implement and manage the PRSC reform agenda
represents a significant risk. It was noted earlier that the government may already be
overstretched because of the wide-ranging scope of the development agenda. A large
number of capacity-building efforts are in place. Most reform programs have capacity-
building components embedded, including the PFMRP, the LGRP, and the PSRP.
Similarly, sector programs and projects typically also contain capacity-building
components. The challenge for Tanzania is to enhance the effectiveness of capacity-
building efforts by shifting from supply-driven to demand-driven efforts and address
capacity building in a holistic way, in which the incentive structure, the education system,
and specific capacity-building efforts are organized in a mutually reinforcing manner.
One of the intentions of the redesigned GBS framework is to use domestic processes for
the assessment of progress and dialogue. This is intended to foster domestic
accountability. However, as some of the analytic work has shown, these processes are
still weak, partly because of weak incentives and capacity of civil society organizations,
NGOs, and the private sector to participate in these processes. Recent events, though,
have shown a renewed vigor in the oversight role of Parliament and of the media, and the
initial prosecutions of a number of grand corruption cases, if carried uniformly, should
make a dent in the ―culture of impunity‖. On the other hand, few of the grand corruption
cases have ended with the perpetrators being punished, and that increases the risk that
other scams may occur.
Another risk for the achievement of MKUKUTA objectives arises from the ongoing
decentralization process, which shifts responsibility for key poverty-reducing programs

23
in education, health, the water sector, and agriculture to the districts. The local
government reform program focuses on strengthening the capacity of local authorities. As
a result, there have been significant improvements in accountability processes at the local
level, and about 50 percent of local authorities now meet basic accountability standards,
compared to an estimated 10 percent only a few years ago. This should make it possible
to implement financing reforms now under way that would put greater funds in the local
hands. But this may also increase the risk of misuse or ineffective use of funds. The
PRSC program also supports actions to strengthen the watchdog role of beneficiaries at
the community level through disclosure of the flow of resources at the grassroots level
and expenditure tracking of financial flows from the central government.
The 2006 and 2008 PEFA assessments suggest that Tanzania’s financial management
system is still among the best in Africa. Nonetheless, fiduciary risks in the areas of
financial management and procurement remain. There is also the issue of arrears from
road contracts during PRSC-7 Supplementary Financing which raised a question about
the quality of the commitment control system. In recent years, the Government has
implemented measures to reduce fiduciary risks, including the approval and application
of new public finance and procurement acts, the operationalization of the electronic
Integrated Financial Management Information System (IFMIS), strengthening of the
National Audit Office, and reform of the public procurement system. The PFMRP and
actions monitored by the PRSC and PAF are designed to address weaknesses in the
Government’s financial management and procurement systems, with particular emphasis
on the integrity of IFMIS. Tight follow up of the Government’s action plan on the EPA
account audit, and of other government measures to assess eventual past fraudulent
transactions at the Central Bank are also underway.
Finally, there are some risks that come from Tanzania’s external environment. With the
global economic recovery now well underway, food and fuel prices have again increased
and are likely to worsen Tanzania’s terms of trade. Similarly, domestic shocks such as
recurrent droughts may occur. This may affect both agricultural output and hydroelectric
power generation. However, in terms of containing the fallout from such events on
development outcomes, determined actions in improving agriculture and business
environment as well as continued efforts to develop power generation that is not
dependent on the vicissitudes of weather, would go a long way towards making the
economy more flexible and thus better able to withstand shocks of various kinds.
While those risks exist, there is momentum that has not been lost. There have been
positive outcomes in all broad areas of reform including crop boards reform, road, anti-
corruption, PPP, and PFM. While progress toward achieving some PDOs had slowed
down, some momentum has been built and the chance that such momentum gets
reversed would be very small. In addition, the next series of PRSCs is likely to try to
consolidate the gains achieved from this series, while pushing into new areas of reform
and ensuring macro-fiscal stability and help the Government scale up domestic revenue
mobilization. Overall, thus, the risk that the development outcomes will not be achieved
is Moderate.
24
5. Assessment of Bank and Borrower Performance
5.1 Bank Performance
(a) Bank Performance in Ensuring Quality at Entry
Ratings: Bank Performance at Ensuring Quality at Entry was Satisfactory
The design of the PRSC series followed the best practice guidelines for PRSC operations.
PRSC 5 received a Highly Satisfactory rating for QAE and was commended for best
practice in how it went about designing the mechanisms for harmonizing aid from the
DPs. The operations focused on strategically relevant issues. As problems arose, they
were addressed in a subsequent operation. For example, when the results of the 2007
HBS only marginal improvements in rural poverty, the issue was addressed more
vigorously in the subsequent PRSC and more emphasis was put on measures that would
speed up growth in the countryside. The macroeconomic environment was always
conducive to reforms. Environmental aspects and other safeguards were covered.
Fiduciary aspects were attended to and under PRSC 6 the handling of potential fiduciary
problems stemming from alleged corruption at the BOT was made a condition of
negotiations. M&E aspects were a bit weak at the start of the series but improved over
time. Risk assessments were realistic. And Bank inputs and processes were adhered to,
including seeking advice from a wide circle of people. Quality at entry was Satisfactory.
(b) Quality of Supervision
Ratings: Quality of Supervision has been Satisfactory
While the system Tanzania has put in place for M&E of MKUKUTA is elaborate, it has
remained mainly donor oriented, producing M&E outputs of uneven relevance. The
underlying M&E system is under revision to strengthen information quality, policy
relevance, and integration with the budget process, notably by (i) implementing a new
national statistical master plan; (ii) carrying out the implementation of an annual Living
Standards Measurement Study (LSMS) panel survey, started in 2009; (iii) supporting the
strengthening of the internal reporting requirements of the Government, in particular, the
output and performance reports newly introduced in the latest budget guidelines; and (iv)
better aligning MKUKUTA’s M&E process with what the NBS and other providers of
statistics provide with some reliability on a regular basis.
Results monitoring of budget support suffers from the unavailability or low frequency of
some of the critical outcome indicators, such as poverty estimates, health outcomes, or
learning achievements. The poverty survey data in the third quarter of 2008, and
subsequently the results of the annual panel survey as well as the demographic and health
survey planned for 2009, allow a much tighter follow up on the impact of the government
policies and spending. An additional dimension of the monitoring framework covers the
25
Government-donor relationship in monitoring progress on PRSC objectives, such as
enhanced local ownership of the development process, participation by all stakeholders,
and efficiency of aid delivery mechanisms. In particular, the PRSC team has been
working with the Poverty Reduction Budget Support (PRBS) partners to enhance the
capacity of, and information flows with, Parliament, civil society, and the private sector.
In February 2010, a PER parliamentary forum was organized by the Finance and
Economic Committee of the Parliament, and the Bank was asked to contribute
extensively by presenting the results of the PER analytical work.
Under these circumstances, the DPs participating in GBS had to develop some of their
own ways of monitoring progress, which supplemented the indicators available under
MKUKUTA’s M&E system. Further, the PRSC series had to narrow the range of
indicators further and adapt them to follow the policy actions supported by the PRSC
series.
The PRSC implementation was conducted largely by field-based staff on the ground, who
were in very close touch with the Authorities bilaterally as well as through GBS cluster
working groups and sector working groups. While the harmonized GBS system has
helped the Government reduce transaction cost with DPs, coordination process within
DPs has become very complex as the system evolves with more comprehensive PAF and
the M&E framework. In such an environment, the team took leadership in formulating
directions in PAF rather than simply passively following the outcomes from the GBS
consultation process in preparing and implementing the PRSC operations. The closeness
to the client made seamless supervision possible in implementing the operations under
the series. Also, The team’s careful supervision of the program allowed the team
promptly react to the request for a supplemental financing of US$170 million to PRSC-7
to finance the Government provide a fiscal stimulus package to counter negative impacts
from the global financial crisis. The supplemental financing had contributed to
maintaining the overall reform program on track and ensuring the FY09/10 budget
contributions in support of MKUKUTA can be financed and implemented.
The rating for supervision is assessed to have been Satisfactory
(c) Justification of Rating for Overall Bank Performance
Ratings: The Overall Bank Performance was Satisfactory
Overall, the Bank performance was satisfactory, based on its sound design of the program
at the entry, as shown in the ―highly satisfactory‖ QAG rating for quality at the entry for
PRSC-5, as well as high quality of supervision supported by the solid field-presence of
the team members. The rating simply follows the ICR guidelines. The lower of the two
scores for Bank Performance determines the average rating.
26
5.2 Borrower Performance
(a) Government Performance
Ratings: Government Performance was Moderately Unsatisfactory
Note that government performance is for the overall government including sector
ministries in implementing various reforms under MKUKUTA.
Government ownership and commitment to achieving PDOs was strong throughout the
program. The language of high level policy documents, as well as the statements of
senior officials, was unequivocally in favor of continuing reforms across a broad front
with the aim of fostering rapid, broadly shared economic growth.
However, there is, on average, a wide gap between the language used in the documents
such as MKUKUTA and its implementation. As pointed out earlier in this evaluation,
there have been undeniable successes is several areas of reform, most notably in health,
education and access to potable water. Nevertheless, the movement in a number of other
areas was not strong enough to make decisive turns for the better in rural development, or
in the environment for doing business, areas in which the overwhelming majority of
Tanzanians make their living. There was also, on balance, lack of clear success in
improving the performance of entities that play critical roles in the functioning of
Tanzania’s infrastructure --- energy, transportation (road, rail, air), communications, and
ports. Some progress, yes, but slow compared to the needs. This point is supported by
ICRs of WB investment loans that in some way supported reforms in these areas, except
for the progress in improving the major road network, including the road fund, which has
been a success. Towards the end of the PRSC program period there was also progress in
the functioning of the ports, but questions were also raised about the transparency of the
deals made with the port operators. The process also continued to waste substantial public
resources, including large opportunity costs of tying up financial and human resources
that could have been put to better use elsewhere. And scandals due to corruption in the
power sector were not only damaging in terms of reputation, but more importantly,
significantly slowed down the much needed increases in power supplies. Lack of power
is now perceived as a major constraint by over 80% of Tanzania’s businesses.
Similarly, progress in the areas of accountability, anti-corruption and effectiveness of
government was too slow compared to the needs. In addition, reforms that came slowly to
begin with (triggers were in a number of significant cases watered down or delayed from
one PRSC to the next), were later eroded through amendments or delays in
implementation. This seemed to happen in some way in almost all areas of the
governance and accountability cluster. The government did try to improve its
effectiveness through various measures, including importantly its Medium-Term Pay
reform. But at the end of the day, while the wage bill had increased by several percentage
points of GDP (becoming as a proportion of GDP one of the larger ones in Africa, to the
point of threatening to undermine fiscal discipline), the pay scales were still compressed
in the middle, the spatial inequalities in the allocation of personnel were not substantially
27
reduced, and the incentive-distorting allowances continued (if by another name). The
World Governance Indicator measuring effectiveness of government was one of the few
PDO indicators that actually worsened during the period covered by PRSC 4-8.
Typically, when the reform program is broad and complex, and some of the reforms are
politically difficult to implement, there needs to be very strong coordination from the
center. In the case of Tanzania this was to come from the Prime Minister’s and/or the
President’s Office. In a number of important cases, the response was not sufficiently
aggressive. Government performance was therefore assessed as Moderately
Unsatisfactory.
(b) Implementing Agency or Agencies Performance
Ratings: Performance of the Implementing Agency was Moderately Satisfactory
Note that implementing agency is Ministry of Finance only in the narrow sense of
managing the GoT implementation of PRSC operations.
Ministry of Finance was the Bank’s main counterpart throughout the PRSC 4-8 program.
The view of the people interviewed is that its performance has been Moderately
Satisfactory. The Ministry of Finance, as the organizer of the MKUKUTA review
process, successfully managed the process of conducting the annual MKUKUTA national
policy dialogue, ensuring the process is also participatory for the civil society. It also
successfully managed the deliberations of the complex GBS annual review process,
starting from the sector review including interactions with GBS donor group (14 DPs) to
agree on assessment outcomes of current PAFs and jointly formulate contents of future
PAFs. However, due to capacity constraint, the management of the process became
slightly weak, as illustrated by a few cases of delays in completing the review process as
well as PRSC appraisal process.
(c) Justification of Rating for Overall Borrower Performance
Ratings: Overall Borrower Performance was Moderately Satisfactory
ICR Guidelines suggest that when the ratings of Government Performance and
Implementing/Coordinating Agency Performance differ, the rating of Overall Outcome
Performance of the program should be taken into account. Since the Overall Performance
was Satisfactory, the Overall Performance of the Borrower has been Moderately
Satisfactory.
28
6. Lessons Learned
There are both specific and general lessons to be learned from the PRSC 4-8 series.
Specifically, looking at the outcomes in the three clusters of MKUKUTA, the biggest
challenge is how to convert Tanzania’s relatively strong GDP growth into reduction of
(income) poverty. What stands out at the end of the second series of PRSCs is that (i)
agriculture has barely outpaced the rate of growth of population; and (ii) business
environment, particularly for small entrepreneurs, remains inadequate, with the result that
more than half of Tanzania’s GDP continues to be generated by the informal sector. And
the links between demography, growth, poverty and social well-being should not be
forgotten. Until this area is fixed, the vast majority of Tanzanians will not be able to
enjoy the fruits of rapid growth. This observation has been made repeatedly in various
donor and government documents, but has not led to convincing action. An in-depth re-
examination of the causes of this failure is in order and it should encompass everything
from the analytical findings (of which there are many), to how precisely the problems
will be handled at the technical and, most importantly, political levels.
The way forward in the other two clusters seems easier. There has been clear success in
improving the well-being of ordinary Tanzanians. Various health, education and clean,
accessible water indicators have improved, some substantially.4 One of the weaker ones
has been continued stagnation in high maternal mortality. The key ingredients to
lowering that, according to UNFPA, are attendance of qualified medical personnel at
birth, good emergency obstetrics care and family planning. The last one is crucial not
just in order to lower maternal mortality, but also because of the correlation between
slower population growth and faster GDP growth, a correlation that is likely to be
stronger in the large rural and small business segment of the population.
In the governance and accountability cluster the way forward is to build on the existing
momentum in public financial management, budgeting, anti-corruption and the reform of
the public service. Perhaps the key areas are bringing to justice the perpetrators of cases
of grand corruption (which may have positive spill-over effects on the presence of
corruption in general) and continued reform in the incentive framework as well as the
overall size of the public service. Public employees should have the incentives to ―be in
the right places doing the desirable things‖.
The coordination function at the highest level should be strengthened. When reforms flag
for whatever reason, it is only a group at the top that has the Prime Minister’s and the
President’s backing that can untangle the problems.
The GBS process which at one time was hailed as ―state of the art‖, may have become
too cumbersome at this point. A number of DPs and Bank Staff suggested that there are
4 The main problem in the education sector today is poor outcomes at primary and secondary levels.
Increases in enrollment combined with supply-side constraints (failing infrastructure, inequitable staff
allocation, and a shortage of skilled teachers and educational materials) have caused declines in quality.
29
too many groups, that the various levels do not communicate sufficiently with one
another (information coming from the DP troika to the lower levels ―gets lost‖) and that
the costs of so much coordination may outweigh the benefits. There is a sense that when
things are going well, the mechanism works, but when reforms are flagging, as seems to
be the DP view at the moment, disagreements on the way forward increase and the
harmonization mechanism becomes a constraint.
A number of general lessons also apply to the Tanzania PRSC (and DPLs in low income
countries in general). They have become generic but, if policy loans to Tanzania are to
continue, should be observed and perhaps honed.
First, there is no avoiding conditionality. Good Practice Principles of Policy-based
Lending are now routinely stated in almost every operation and have become second
nature in designing policy-based operations. Donors should reinforce government
ownership by supporting rather than duplicating government processes (aid
harmonization among donors, alignment of aid with the budget cycle, use of government
procurement processes, etc.). There should be an accountability framework that guides
both government and donors. Prior Actions (as conditions of disbursement) should be
few but critical to the achievement of agreed results. Progress reviews should be
transparent and conducive to performance-based, predictable budget support.
Second, unlike investment lending operations, PRSCs are able, in principle, to deal with
complex cross-cutting issues when the Government has the requisite technical and
coordination capacities and the operations are supplemented by sector ILs, TA and
competent analytical work. If the coordination and technical capacities are limited,
interventions in complex cross-cutting areas have to be prioritized and sequenced. Over
time, as capacities get stronger, the number of complex interventions can be increased.
This is an area in which wishful thinking often replaces hard-nosed realism, and results in
less than acceptable outcomes.
Third, committed political leadership makes a difference. Yet, even the best leadership
can only accomplish so much in a given time period. It must overcome ever-present
vested interests, old mind-sets and ingrained behaviors, even assuming that technical and
organizational capacities are adequate. This is a tricky area. There are often AAA
products (as was the case with a string of policy notes in Tanzania) that identify aspects
of these issues and there is anecdotal evidence. But the job of transforming that
knowledge into successful interventions ultimately falls to the government. The donors
can at best figure out what actions are likely to succeed and back them, or decide that the
government is unlikely to follow through and back off. It is extremely difficult to get that
balance right. Tanzania has been no exception.
Finally, measuring outcomes is important in order to increase focus and accountability.
Realistic, focused monitoring frameworks that track progress over time towards ultimate
objectives, concentrate the mind of government as well as the donors.
30
7. Comments on Issues Raised by Borrower/Implementing Agencies/Partners
Several DPs that provide financing through the GBS said that the Bank’s leading role in
the GBS process, from analytical work to financing, is important and should continue.
They acknowledged that the slow-down in the reform process in the last few years, as
well as weakening of Tanzania’s budgetary discipline last year, have been frustrating but
were hopeful that the differences between the Government and the DPs could be bridged.
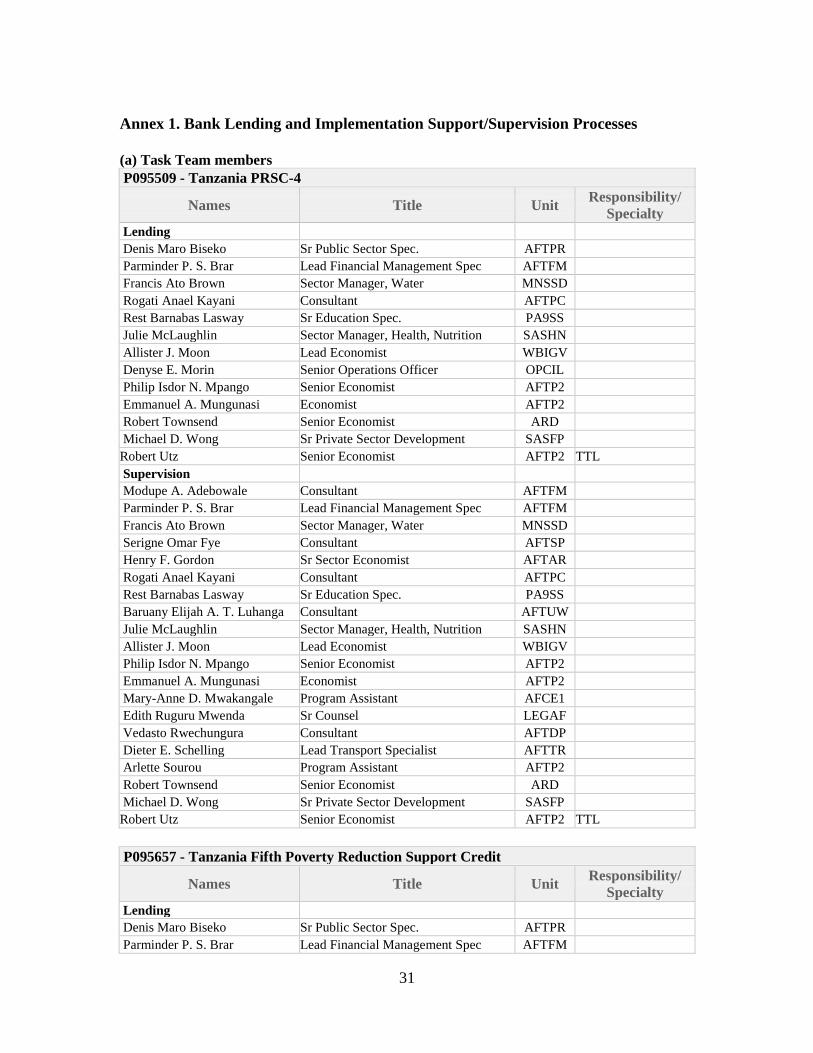
31
Annex 1. Bank Lending and Implementation Support/Supervision Processes
(a) Task Team members
P095509 - Tanzania PRSC-4
Names Title Unit Responsibility/
Specialty Lending
Denis Maro Biseko Sr Public Sector Spec. AFTPR
Parminder P. S. Brar Lead Financial Management Spec AFTFM
Francis Ato Brown Sector Manager, Water MNSSD
Rogati Anael Kayani Consultant AFTPC
Rest Barnabas Lasway Sr Education Spec. PA9SS
Julie McLaughlin Sector Manager, Health, Nutrition SASHN
Allister J. Moon Lead Economist WBIGV
Denyse E. Morin Senior Operations Officer OPCIL
Philip Isdor N. Mpango Senior Economist AFTP2
Emmanuel A. Mungunasi Economist AFTP2
Robert Townsend Senior Economist ARD
Michael D. Wong Sr Private Sector Development SASFP
Robert Utz Senior Economist AFTP2 TTL
Supervision
Modupe A. Adebowale Consultant AFTFM
Parminder P. S. Brar Lead Financial Management Spec AFTFM
Francis Ato Brown Sector Manager, Water MNSSD
Serigne Omar Fye Consultant AFTSP
Henry F. Gordon Sr Sector Economist AFTAR
Rogati Anael Kayani Consultant AFTPC
Rest Barnabas Lasway Sr Education Spec. PA9SS
Baruany Elijah A. T. Luhanga Consultant AFTUW
Julie McLaughlin Sector Manager, Health, Nutrition SASHN
Allister J. Moon Lead Economist WBIGV
Philip Isdor N. Mpango Senior Economist AFTP2
Emmanuel A. Mungunasi Economist AFTP2
Mary-Anne D. Mwakangale Program Assistant AFCE1
Edith Ruguru Mwenda Sr Counsel LEGAF
Vedasto Rwechungura Consultant AFTDP
Dieter E. Schelling Lead Transport Specialist AFTTR
Arlette Sourou Program Assistant AFTP2
Robert Townsend Senior Economist ARD
Michael D. Wong Sr Private Sector Development SASFP
Robert Utz Senior Economist AFTP2 TTL
P095657 - Tanzania Fifth Poverty Reduction Support Credit
Names Title Unit Responsibility/
Specialty Lending
Denis Maro Biseko Sr Public Sector Spec. AFTPR
Parminder P. S. Brar Lead Financial Management Spec AFTFM
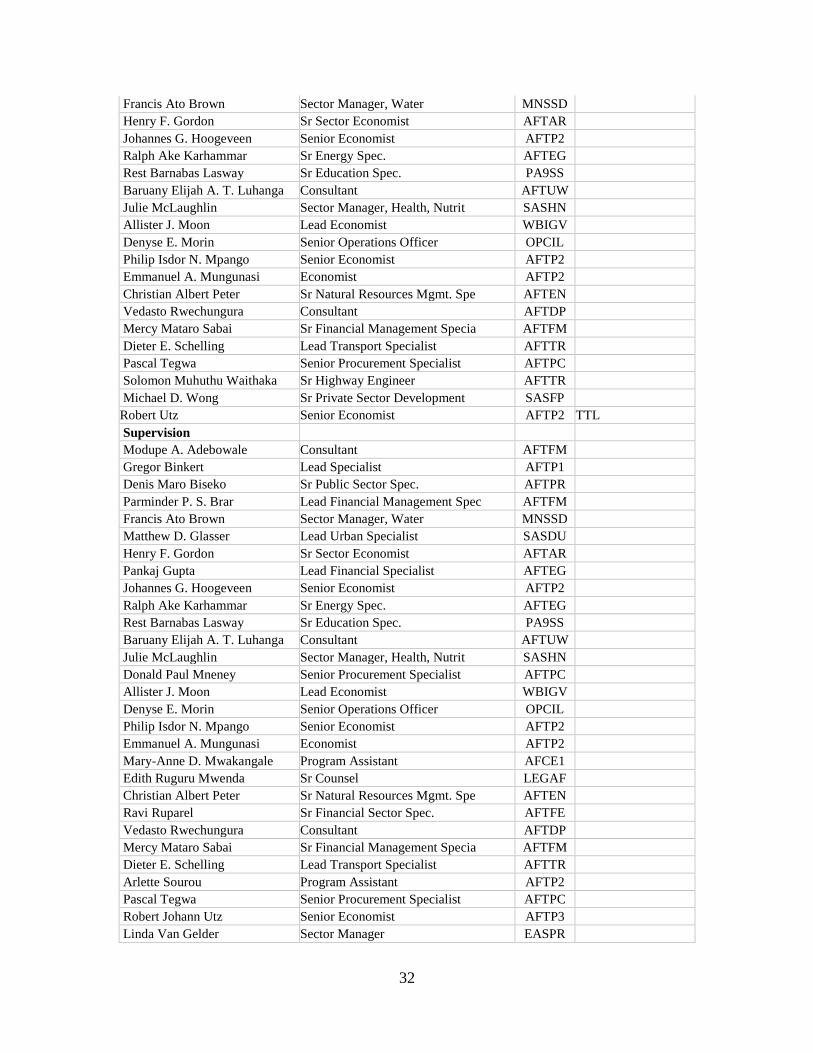
32
Francis Ato Brown Sector Manager, Water MNSSD
Henry F. Gordon Sr Sector Economist AFTAR
Johannes G. Hoogeveen Senior Economist AFTP2
Ralph Ake Karhammar Sr Energy Spec. AFTEG
Rest Barnabas Lasway Sr Education Spec. PA9SS
Baruany Elijah A. T. Luhanga Consultant AFTUW
Julie McLaughlin Sector Manager, Health, Nutrit SASHN
Allister J. Moon Lead Economist WBIGV
Denyse E. Morin Senior Operations Officer OPCIL
Philip Isdor N. Mpango Senior Economist AFTP2
Emmanuel A. Mungunasi Economist AFTP2
Christian Albert Peter Sr Natural Resources Mgmt. Spe AFTEN
Vedasto Rwechungura Consultant AFTDP
Mercy Mataro Sabai Sr Financial Management Specia AFTFM
Dieter E. Schelling Lead Transport Specialist AFTTR
Pascal Tegwa Senior Procurement Specialist AFTPC
Solomon Muhuthu Waithaka Sr Highway Engineer AFTTR
Michael D. Wong Sr Private Sector Development SASFP
Robert Utz Senior Economist AFTP2 TTL
Supervision
Modupe A. Adebowale Consultant AFTFM
Gregor Binkert Lead Specialist AFTP1
Denis Maro Biseko Sr Public Sector Spec. AFTPR
Parminder P. S. Brar Lead Financial Management Spec AFTFM
Francis Ato Brown Sector Manager, Water MNSSD
Matthew D. Glasser Lead Urban Specialist SASDU
Henry F. Gordon Sr Sector Economist AFTAR
Pankaj Gupta Lead Financial Specialist AFTEG
Johannes G. Hoogeveen Senior Economist AFTP2
Ralph Ake Karhammar Sr Energy Spec. AFTEG
Rest Barnabas Lasway Sr Education Spec. PA9SS
Baruany Elijah A. T. Luhanga Consultant AFTUW
Julie McLaughlin Sector Manager, Health, Nutrit SASHN
Donald Paul Mneney Senior Procurement Specialist AFTPC
Allister J. Moon Lead Economist WBIGV
Denyse E. Morin Senior Operations Officer OPCIL
Philip Isdor N. Mpango Senior Economist AFTP2
Emmanuel A. Mungunasi Economist AFTP2
Mary-Anne D. Mwakangale Program Assistant AFCE1
Edith Ruguru Mwenda Sr Counsel LEGAF
Christian Albert Peter Sr Natural Resources Mgmt. Spe AFTEN
Ravi Ruparel Sr Financial Sector Spec. AFTFE
Vedasto Rwechungura Consultant AFTDP
Mercy Mataro Sabai Sr Financial Management Specia AFTFM
Dieter E. Schelling Lead Transport Specialist AFTTR
Arlette Sourou Program Assistant AFTP2
Pascal Tegwa Senior Procurement Specialist AFTPC
Robert Johann Utz Senior Economist AFTP3
Linda Van Gelder Sector Manager EASPR

33
Michael D. Wong Sr Private Sector Development SASFP
Robert Utz Senior Economist AFTP2 TTL
P101229 - Sixth Poverty Reduction Support Credit (PRSC6)
Names Title Unit Responsibility/
Specialty Lending and Supervision
Denis Maro Biseko Sr Public Sector Spec. AFTPR
Francis Ato Brown Sector Manager, Water MNSSD
Matthew D. Glasser Lead Urban Specialist SASDU
Henry F. Gordon Sr Sector Economist AFTAR
Johannes G. Hoogeveen Senior Economist AFTP2
Ralph Ake Karhammar Sr Energy Spec. AFTEG
Josaphat Paul Kweka Senior Economist AFTP2
Rest Barnabas Lasway Sr Education Spec. PA9SS
Baruany Elijah A. T. Luhanga Consultant AFTUW
Julie McLaughlin Sector Manager, Health, Nutrit SASHN
Denyse E. Morin Senior Operations Officer OPCIL
Jacques Morisset Lead Economist AFTP1
Emmanuel A. Mungunasi Economist AFTP2
Mary-Anne D. Mwakangale Program Assistant AFCE1
Edith Ruguru Mwenda Sr Counsel LEGAF
Christian Albert Peter Sr Natural Resources Mgmt. Spe AFTEN
Ravi Ruparel Sr Financial Sector Spec. AFTFE
Mercy Mataro Sabai Sr Financial Management Specia AFTFM
Dieter E. Schelling Lead Transport Specialist AFTTR
Luis M. Schwarz Senior Finance Officer CTRFC
Vera Songwe Adviser MDO
Arlette Sourou Program Assistant AFTP2
Javier Suarez Cordero Senior Economist AFTFE
Michael D. Wong Sr Private Sector Development SASFP
Paolo B. Zacchia Lead Economist AFTP2 TTL
P101230 - Tanzania Seventh Poverty Reduction Support Credit
Names Title Unit Responsibility/
Specialty Lending and Supervision
Sherri Ellen Archondo Senior Operations Officer AFTFE
Denis Maro Biseko Sr Public Sector Spec. AFTPR
Parminder P. S. Brar Lead Financial Management Spec AFTFM
Francis Ato Brown Sector Manager, Water MNSSD
Matthew D. Glasser Lead Urban Specialist SASDU
Pankaj Gupta Lead Financial Specialist AFTEG
Dominic S. Haazen Lead Health Policy Specialist AFTHE
Johannes G. Hoogeveen Senior Economist AFTP2
Arun R. Joshi Sr Education Spec. AFTED
Ralph Ake Karhammar Sr Energy Spec. AFTEG
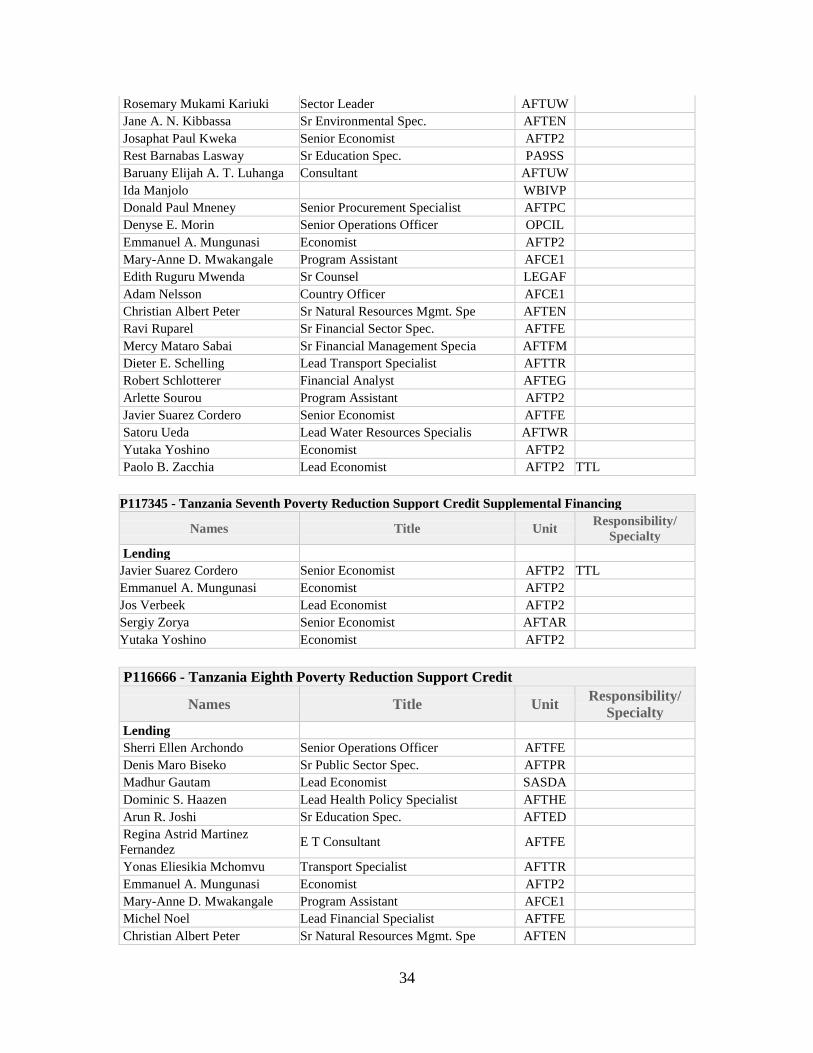
34
Rosemary Mukami Kariuki Sector Leader AFTUW
Jane A. N. Kibbassa Sr Environmental Spec. AFTEN
Josaphat Paul Kweka Senior Economist AFTP2
Rest Barnabas Lasway Sr Education Spec. PA9SS
Baruany Elijah A. T. Luhanga Consultant AFTUW
Ida Manjolo WBIVP
Donald Paul Mneney Senior Procurement Specialist AFTPC
Denyse E. Morin Senior Operations Officer OPCIL
Emmanuel A. Mungunasi Economist AFTP2
Mary-Anne D. Mwakangale Program Assistant AFCE1
Edith Ruguru Mwenda Sr Counsel LEGAF
Adam Nelsson Country Officer AFCE1
Christian Albert Peter Sr Natural Resources Mgmt. Spe AFTEN
Ravi Ruparel Sr Financial Sector Spec. AFTFE
Mercy Mataro Sabai Sr Financial Management Specia AFTFM
Dieter E. Schelling Lead Transport Specialist AFTTR
Robert Schlotterer Financial Analyst AFTEG
Arlette Sourou Program Assistant AFTP2
Javier Suarez Cordero Senior Economist AFTFE
Satoru Ueda Lead Water Resources Specialis AFTWR
Yutaka Yoshino Economist AFTP2
Paolo B. Zacchia Lead Economist AFTP2 TTL
P117345 - Tanzania Seventh Poverty Reduction Support Credit Supplemental Financing
Names Title Unit Responsibility/
Specialty
Lending
Javier Suarez Cordero Senior Economist AFTP2 TTL
Emmanuel A. Mungunasi Economist AFTP2
Jos Verbeek Lead Economist AFTP2
Sergiy Zorya Senior Economist AFTAR
Yutaka Yoshino Economist AFTP2
P116666 - Tanzania Eighth Poverty Reduction Support Credit
Names Title Unit Responsibility/
Specialty Lending
Sherri Ellen Archondo Senior Operations Officer AFTFE
Denis Maro Biseko Sr Public Sector Spec. AFTPR
Madhur Gautam Lead Economist SASDA
Dominic S. Haazen Lead Health Policy Specialist AFTHE
Arun R. Joshi Sr Education Spec. AFTED
Regina Astrid Martinez
Fernandez E T Consultant AFTFE
Yonas Eliesikia Mchomvu Transport Specialist AFTTR
Emmanuel A. Mungunasi Economist AFTP2
Mary-Anne D. Mwakangale Program Assistant AFCE1
Michel Noel Lead Financial Specialist AFTFE
Christian Albert Peter Sr Natural Resources Mgmt. Spe AFTEN
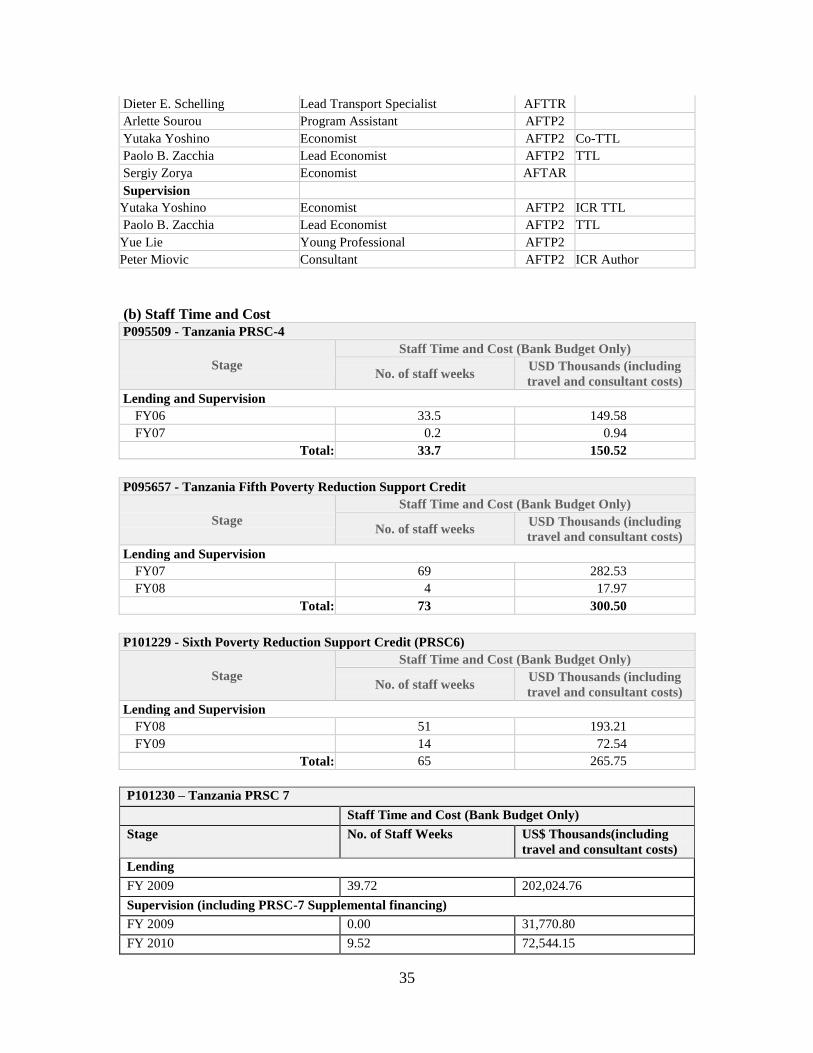
35
Dieter E. Schelling Lead Transport Specialist AFTTR
Arlette Sourou Program Assistant AFTP2
Yutaka Yoshino Economist AFTP2 Co-TTL
Paolo B. Zacchia Lead Economist AFTP2 TTL
Sergiy Zorya Economist AFTAR
Supervision
Yutaka Yoshino Economist AFTP2 ICR TTL
Paolo B. Zacchia Lead Economist AFTP2 TTL
Yue Lie Young Professional AFTP2
Peter Miovic Consultant AFTP2 ICR Author
(b) Staff Time and Cost
P095509 - Tanzania PRSC-4
Stage
Staff Time and Cost (Bank Budget Only)
No. of staff weeks USD Thousands (including
travel and consultant costs)
Lending and Supervision
FY06 33.5 149.58
FY07 0.2 0.94
Total: 33.7 150.52
P095657 - Tanzania Fifth Poverty Reduction Support Credit
Stage
Staff Time and Cost (Bank Budget Only)
No. of staff weeks USD Thousands (including
travel and consultant costs)
Lending and Supervision
FY07 69 282.53
FY08 4 17.97
Total: 73 300.50
P101229 - Sixth Poverty Reduction Support Credit (PRSC6)
Stage
Staff Time and Cost (Bank Budget Only)
No. of staff weeks USD Thousands (including
travel and consultant costs)
Lending and Supervision
FY08 51 193.21
FY09 14 72.54
Total: 65 265.75
P101230 – Tanzania PRSC 7
Staff Time and Cost (Bank Budget Only)
Stage No. of Staff Weeks US$ Thousands(including
travel and consultant costs)
Lending
FY 2009 39.72 202,024.76
Supervision (including PRSC-7 Supplemental financing)
FY 2009 0.00 31,770.80
FY 2010 9.52 72,544.15
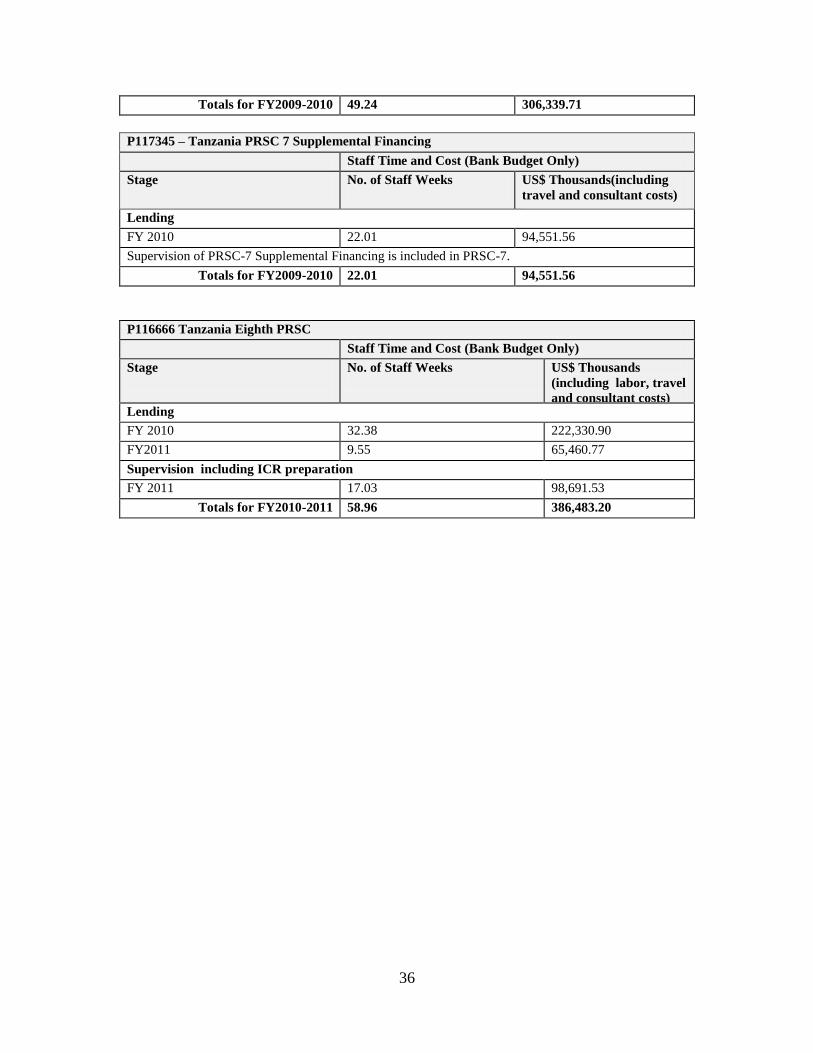
36
Totals for FY2009-2010 49.24 306,339.71
P117345 – Tanzania PRSC 7 Supplemental Financing
(Lending only, Supervision is included in PRSC 7 supervision) Staff Time and Cost (Bank Budget Only)
Stage No. of Staff Weeks US$ Thousands(including
travel and consultant costs)
Lending
FY 2010 22.01 94,551.56
Supervision of PRSC-7 Supplemental Financing is included in PRSC-7.
Totals for FY2009-2010 22.01 94,551.56
P116666 Tanzania Eighth PRSC
Staff Time and Cost (Bank Budget Only)
Stage
No. of Staff Weeks US$ Thousands
(including labor, travel
and consultant costs) Lending
FY 2010 32.38 222,330.90
FY2011 9.55 65,460.77
Supervision including ICR preparation
FY 2011 17.03 98,691.53
Totals for FY2010-2011 58.96 386,483.20
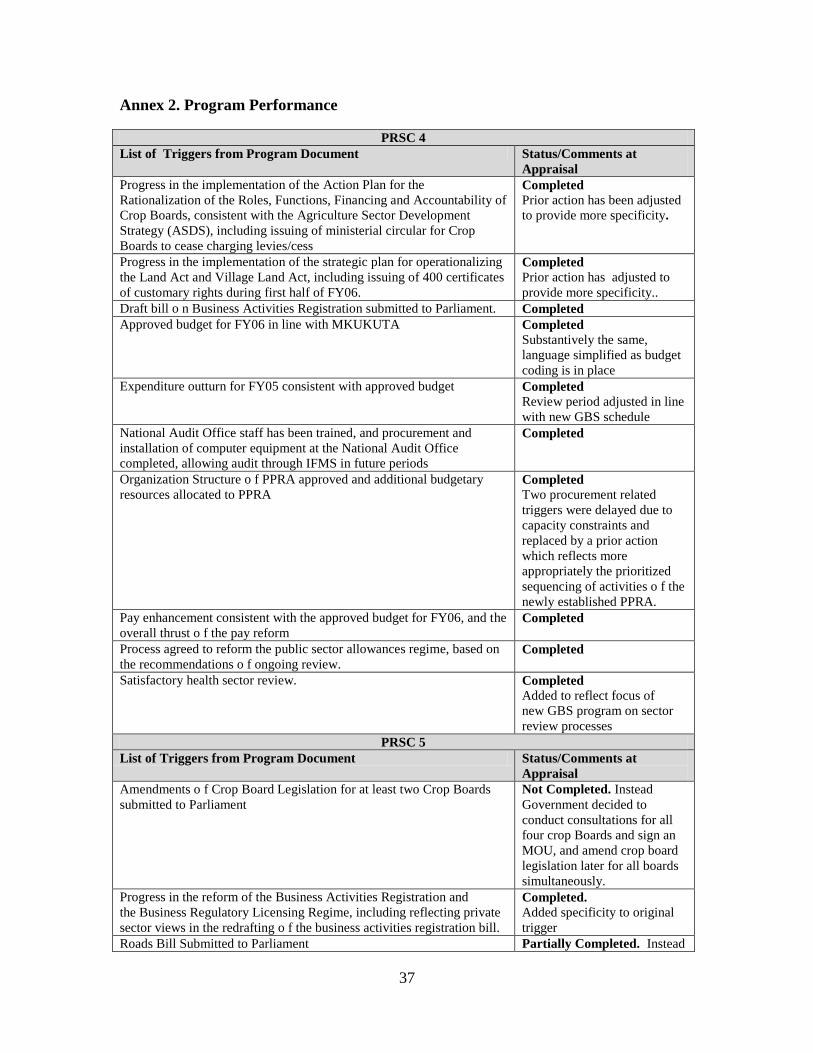
37
Annex 2. Program Performance
PRSC 4
List of Triggers from Program Document Status/Comments at
Appraisal
Progress in the implementation of the Action Plan for the
Rationalization of the Roles, Functions, Financing and Accountability of
Crop Boards, consistent with the Agriculture Sector Development
Strategy (ASDS), including issuing of ministerial circular for Crop
Boards to cease charging levies/cess
Completed Prior action has been adjusted
to provide more specificity.
Progress in the implementation of the strategic plan for operationalizing
the Land Act and Village Land Act, including issuing of 400 certificates
of customary rights during first half of FY06.
Completed Prior action has adjusted to
provide more specificity..
Draft bill o n Business Activities Registration submitted to Parliament. Completed
Approved budget for FY06 in line with MKUKUTA Completed Substantively the same,
language simplified as budget
coding is in place
Expenditure outturn for FY05 consistent with approved budget Completed Review period adjusted in line
with new GBS schedule
National Audit Office staff has been trained, and procurement and
installation of computer equipment at the National Audit Office
completed, allowing audit through IFMS in future periods
Completed
Organization Structure o f PPRA approved and additional budgetary
resources allocated to PPRA Completed Two procurement related
triggers were delayed due to
capacity constraints and
replaced by a prior action
which reflects more
appropriately the prioritized
sequencing of activities o f the
newly established PPRA.
Pay enhancement consistent with the approved budget for FY06, and the
overall thrust o f the pay reform Completed
Process agreed to reform the public sector allowances regime, based on
the recommendations o f ongoing review. Completed
Satisfactory health sector review. Completed Added to reflect focus of
new GBS program on sector
review processes
PRSC 5
List of Triggers from Program Document Status/Comments at
Appraisal
Amendments o f Crop Board Legislation for at least two Crop Boards
submitted to Parliament
Not Completed. Instead
Government decided to
conduct consultations for all
four crop Boards and sign an
MOU, and amend crop board
legislation later for all boards
simultaneously.
Progress in the reform of the Business Activities Registration and
the Business Regulatory Licensing Regime, including reflecting private
sector views in the redrafting o f the business activities registration bill.
Completed.
Added specificity to original
trigger
Roads Bill Submitted to Parliament Partially Completed. Instead
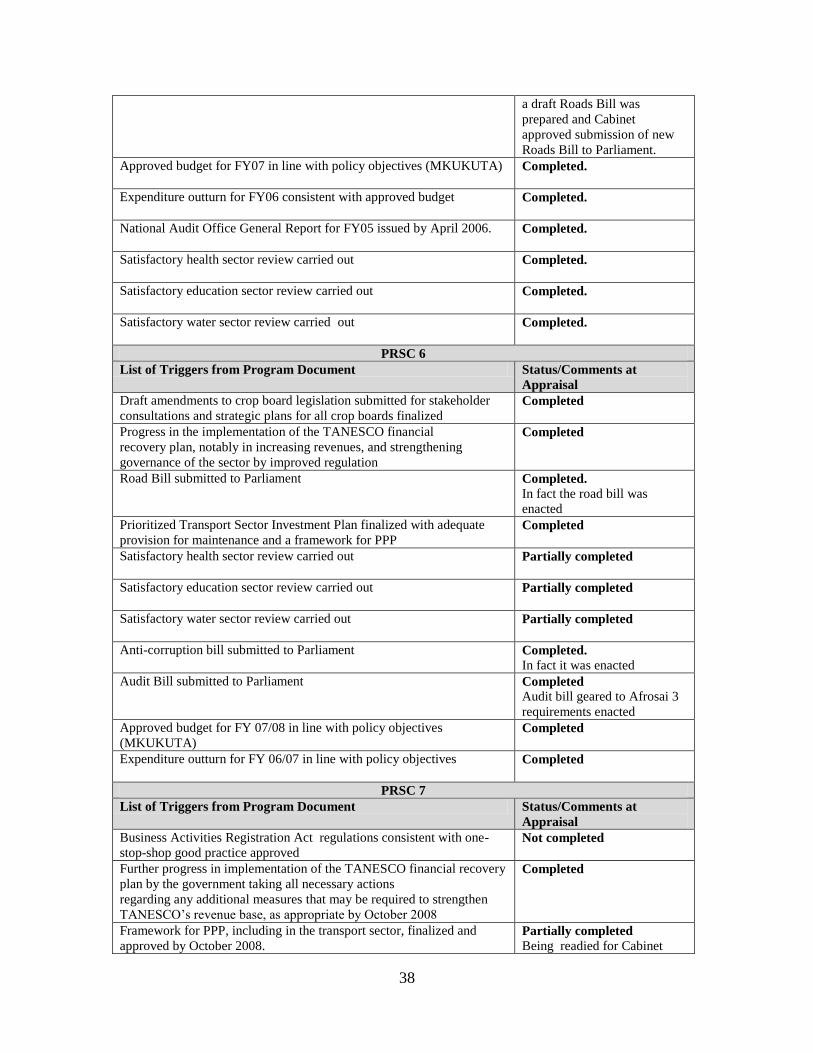
38
a draft Roads Bill was
prepared and Cabinet
approved submission of new
Roads Bill to Parliament.
Approved budget for FY07 in line with policy objectives (MKUKUTA)
Completed.
Expenditure outturn for FY06 consistent with approved budget
Completed.
National Audit Office General Report for FY05 issued by April 2006.
Completed.
Satisfactory health sector review carried out
Completed.
Satisfactory education sector review carried out
Completed.
Satisfactory water sector review carried out
Completed.
PRSC 6
List of Triggers from Program Document Status/Comments at
Appraisal
Draft amendments to crop board legislation submitted for stakeholder
consultations and strategic plans for all crop boards finalized Completed
Progress in the implementation of the TANESCO financial
recovery plan, notably in increasing revenues, and strengthening
governance of the sector by improved regulation
Completed
Road Bill submitted to Parliament Completed.
In fact the road bill was
enacted
Prioritized Transport Sector Investment Plan finalized with adequate
provision for maintenance and a framework for PPP Completed
Satisfactory health sector review carried out
Partially completed
Satisfactory education sector review carried out
Partially completed
Satisfactory water sector review carried out
Partially completed
Anti-corruption bill submitted to Parliament Completed.
In fact it was enacted
Audit Bill submitted to Parliament Completed
Audit bill geared to Afrosai 3
requirements enacted
Approved budget for FY 07/08 in line with policy objectives
(MKUKUTA) Completed
Expenditure outturn for FY 06/07 in line with policy objectives
Completed
PRSC 7
List of Triggers from Program Document Status/Comments at
Appraisal
Business Activities Registration Act regulations consistent with one-
stop-shop good practice approved Not completed
Further progress in implementation of the TANESCO financial recovery
plan by the government taking all necessary actions
regarding any additional measures that may be required to strengthen
TANESCO’s revenue base, as appropriate by October 2008
Completed
Framework for PPP, including in the transport sector, finalized and
approved by October 2008. Partially completed
Being readied for Cabinet
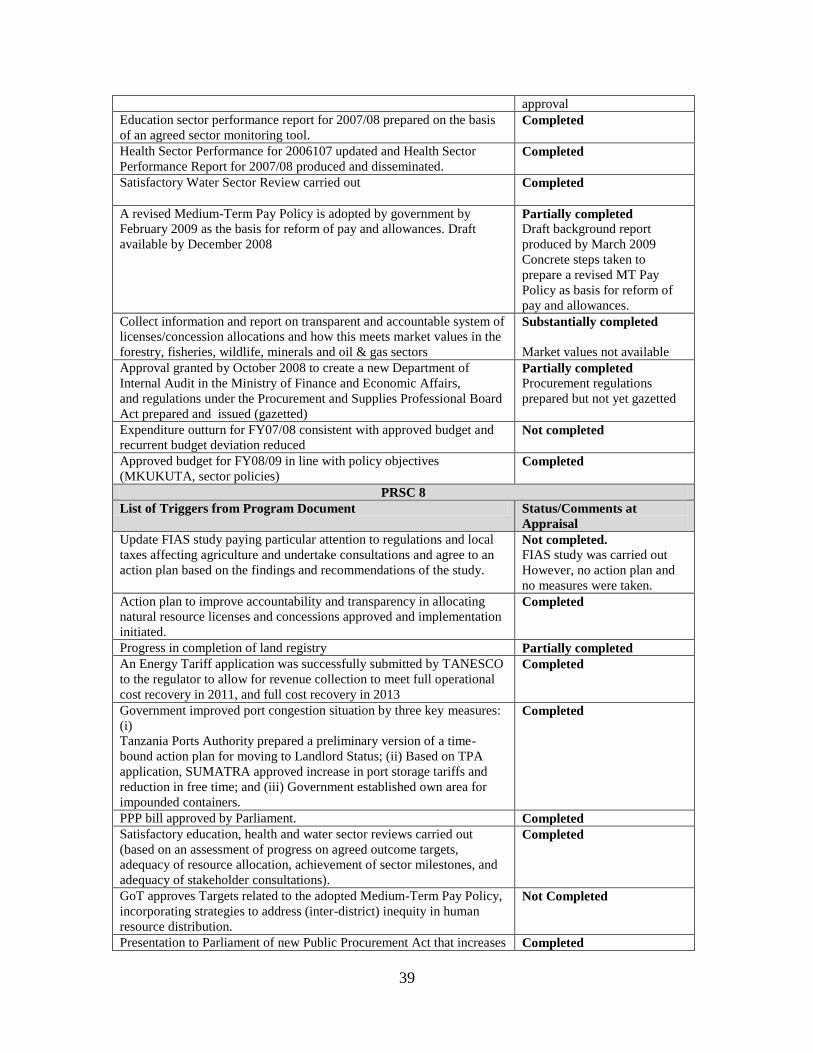
39
approval
Education sector performance report for 2007/08 prepared on the basis
of an agreed sector monitoring tool. Completed
Health Sector Performance for 2006107 updated and Health Sector
Performance Report for 2007/08 produced and disseminated. Completed
Satisfactory Water Sector Review carried out
Completed
A revised Medium-Term Pay Policy is adopted by government by
February 2009 as the basis for reform of pay and allowances. Draft
available by December 2008
Partially completed
Draft background report
produced by March 2009
Concrete steps taken to
prepare a revised MT Pay
Policy as basis for reform of
pay and allowances.
Collect information and report on transparent and accountable system of
licenses/concession allocations and how this meets market values in the
forestry, fisheries, wildlife, minerals and oil & gas sectors
Substantially completed
Market values not available
Approval granted by October 2008 to create a new Department of
Internal Audit in the Ministry of Finance and Economic Affairs,
and regulations under the Procurement and Supplies Professional Board
Act prepared and issued (gazetted)
Partially completed
Procurement regulations
prepared but not yet gazetted
Expenditure outturn for FY07/08 consistent with approved budget and
recurrent budget deviation reduced Not completed
Approved budget for FY08/09 in line with policy objectives
(MKUKUTA, sector policies) Completed
PRSC 8
List of Triggers from Program Document Status/Comments at
Appraisal
Update FIAS study paying particular attention to regulations and local
taxes affecting agriculture and undertake consultations and agree to an
action plan based on the findings and recommendations of the study.
Not completed. FIAS study was carried out
However, no action plan and
no measures were taken.
Action plan to improve accountability and transparency in allocating
natural resource licenses and concessions approved and implementation
initiated.
Completed
Progress in completion of land registry Partially completed
An Energy Tariff application was successfully submitted by TANESCO
to the regulator to allow for revenue collection to meet full operational
cost recovery in 2011, and full cost recovery in 2013
Completed
Government improved port congestion situation by three key measures:
(i)
Tanzania Ports Authority prepared a preliminary version of a time-
bound action plan for moving to Landlord Status; (ii) Based on TPA
application, SUMATRA approved increase in port storage tariffs and
reduction in free time; and (iii) Government established own area for
impounded containers.
Completed
PPP bill approved by Parliament. Completed
Satisfactory education, health and water sector reviews carried out
(based on an assessment of progress on agreed outcome targets,
adequacy of resource allocation, achievement of sector milestones, and
adequacy of stakeholder consultations).
Completed
GoT approves Targets related to the adopted Medium-Term Pay Policy,
incorporating strategies to address (inter-district) inequity in human
resource distribution.
Not Completed
Presentation to Parliament of new Public Procurement Act that increases Completed

40
autonomy of PPRA and its power to enforce procurement rules.
Expenditure outturn for FY08/09 consistent with approved budget and
recurrent budget deviation reduced. Completed
Approved FY09/10 budget broadly in line with policy objectives
(MKUKUTA, sector policies). Partially completed
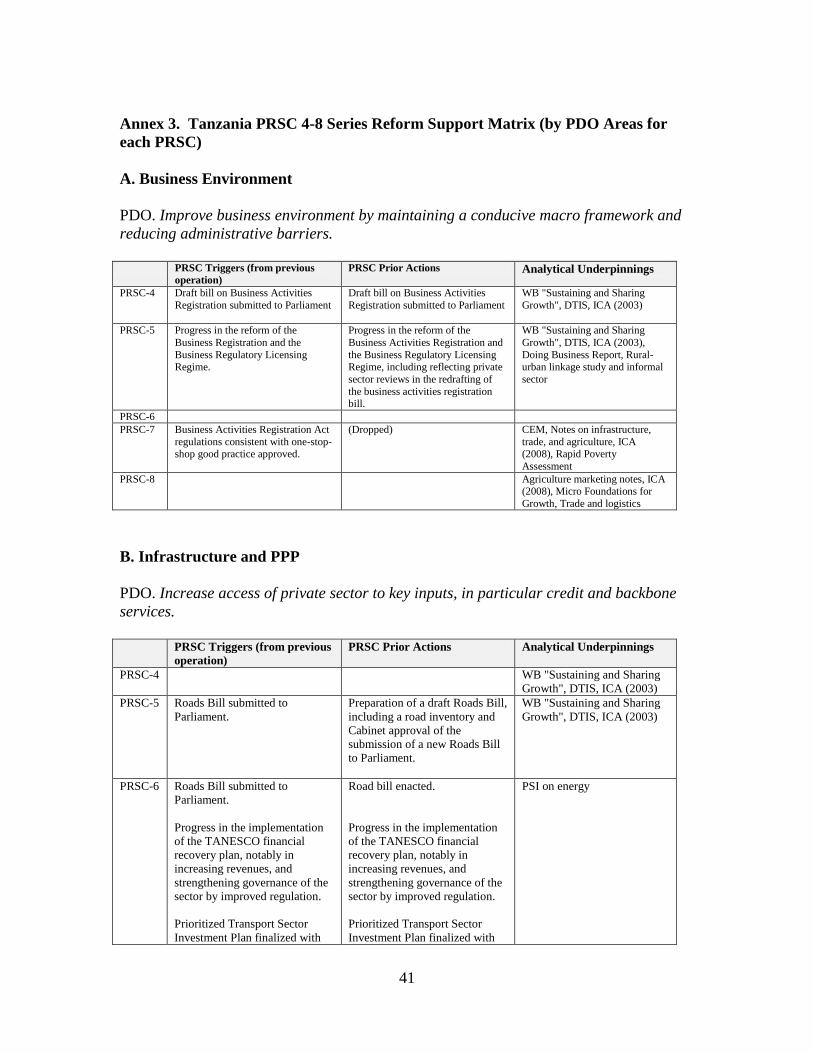
41
Annex 3. Tanzania PRSC 4-8 Series Reform Support Matrix (by PDO Areas for
each PRSC)
A. Business Environment
PDO. Improve business environment by maintaining a conducive macro framework and
reducing administrative barriers.
PRSC Triggers (from previous
operation)
PRSC Prior Actions Analytical Underpinnings
PRSC-4 Draft bill on Business Activities
Registration submitted to Parliament
Draft bill on Business Activities
Registration submitted to Parliament
WB "Sustaining and Sharing
Growth", DTIS, ICA (2003)
PRSC-5 Progress in the reform of the
Business Registration and the
Business Regulatory Licensing Regime.
Progress in the reform of the
Business Activities Registration and
the Business Regulatory Licensing Regime, including reflecting private
sector reviews in the redrafting of
the business activities registration bill.
WB "Sustaining and Sharing
Growth", DTIS, ICA (2003),
Doing Business Report, Rural-urban linkage study and informal
sector
PRSC-6
PRSC-7 Business Activities Registration Act
regulations consistent with one-stop-shop good practice approved.
(Dropped) CEM, Notes on infrastructure,
trade, and agriculture, ICA (2008), Rapid Poverty
Assessment
PRSC-8 Agriculture marketing notes, ICA (2008), Micro Foundations for
Growth, Trade and logistics
B. Infrastructure and PPP
PDO. Increase access of private sector to key inputs, in particular credit and backbone
services.
PRSC Triggers (from previous
operation)
PRSC Prior Actions Analytical Underpinnings
PRSC-4 WB "Sustaining and Sharing
Growth", DTIS, ICA (2003)
PRSC-5 Roads Bill submitted to
Parliament.
Preparation of a draft Roads Bill,
including a road inventory and
Cabinet approval of the
submission of a new Roads Bill
to Parliament.
WB "Sustaining and Sharing
Growth", DTIS, ICA (2003)
PRSC-6 Roads Bill submitted to
Parliament.
Progress in the implementation
of the TANESCO financial
recovery plan, notably in
increasing revenues, and
strengthening governance of the
sector by improved regulation.
Prioritized Transport Sector
Investment Plan finalized with
Road bill enacted.
Progress in the implementation
of the TANESCO financial
recovery plan, notably in
increasing revenues, and
strengthening governance of the
sector by improved regulation.
Prioritized Transport Sector
Investment Plan finalized with
PSI on energy
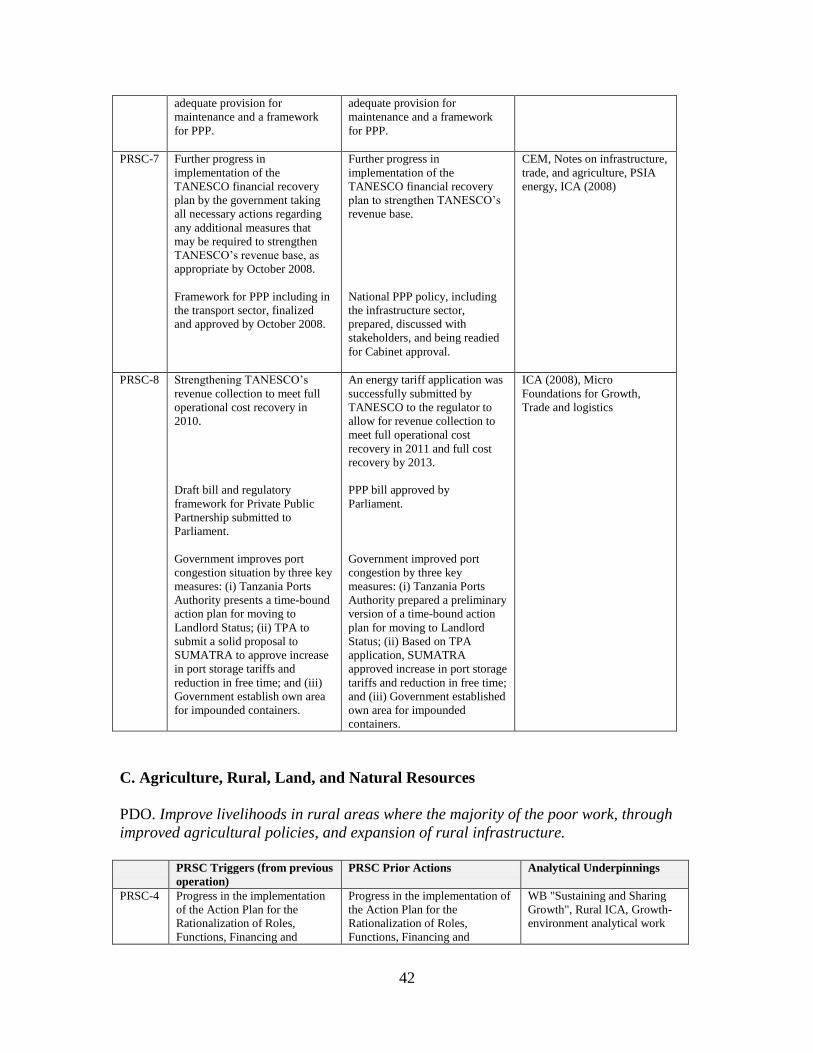
42
adequate provision for
maintenance and a framework
for PPP.
adequate provision for
maintenance and a framework
for PPP.
PRSC-7 Further progress in
implementation of the
TANESCO financial recovery
plan by the government taking
all necessary actions regarding
any additional measures that
may be required to strengthen
TANESCO’s revenue base, as
appropriate by October 2008.
Framework for PPP including in
the transport sector, finalized
and approved by October 2008.
Further progress in
implementation of the
TANESCO financial recovery
plan to strengthen TANESCO’s
revenue base.
National PPP policy, including
the infrastructure sector,
prepared, discussed with
stakeholders, and being readied
for Cabinet approval.
CEM, Notes on infrastructure,
trade, and agriculture, PSIA
energy, ICA (2008)
PRSC-8 Strengthening TANESCO’s
revenue collection to meet full
operational cost recovery in
2010.
Draft bill and regulatory
framework for Private Public
Partnership submitted to
Parliament.
Government improves port
congestion situation by three key
measures: (i) Tanzania Ports
Authority presents a time-bound
action plan for moving to
Landlord Status; (ii) TPA to
submit a solid proposal to
SUMATRA to approve increase
in port storage tariffs and
reduction in free time; and (iii)
Government establish own area
for impounded containers.
An energy tariff application was
successfully submitted by
TANESCO to the regulator to
allow for revenue collection to
meet full operational cost
recovery in 2011 and full cost
recovery by 2013.
PPP bill approved by
Parliament.
Government improved port
congestion by three key
measures: (i) Tanzania Ports
Authority prepared a preliminary
version of a time-bound action
plan for moving to Landlord
Status; (ii) Based on TPA
application, SUMATRA
approved increase in port storage
tariffs and reduction in free time;
and (iii) Government established
own area for impounded
containers.
ICA (2008), Micro
Foundations for Growth,
Trade and logistics
C. Agriculture, Rural, Land, and Natural Resources
PDO. Improve livelihoods in rural areas where the majority of the poor work, through
improved agricultural policies, and expansion of rural infrastructure.
PRSC Triggers (from previous
operation)
PRSC Prior Actions Analytical Underpinnings
PRSC-4 Progress in the implementation
of the Action Plan for the
Rationalization of Roles,
Functions, Financing and
Progress in the implementation of
the Action Plan for the
Rationalization of Roles,
Functions, Financing and
WB "Sustaining and Sharing
Growth", Rural ICA, Growth-
environment analytical work
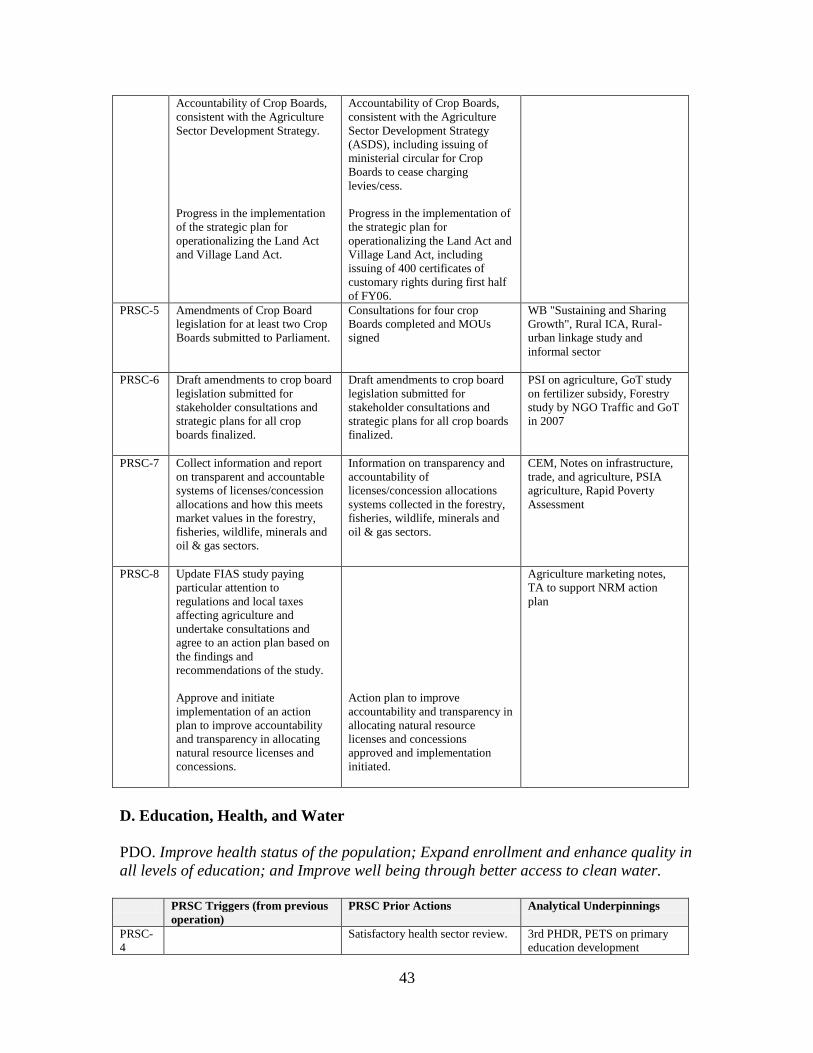
43
Accountability of Crop Boards,
consistent with the Agriculture
Sector Development Strategy.
Progress in the implementation
of the strategic plan for
operationalizing the Land Act
and Village Land Act.
Accountability of Crop Boards,
consistent with the Agriculture
Sector Development Strategy
(ASDS), including issuing of
ministerial circular for Crop
Boards to cease charging
levies/cess.
Progress in the implementation of
the strategic plan for
operationalizing the Land Act and
Village Land Act, including
issuing of 400 certificates of
customary rights during first half
of FY06.
PRSC-5 Amendments of Crop Board
legislation for at least two Crop
Boards submitted to Parliament.
Consultations for four crop
Boards completed and MOUs
signed
WB "Sustaining and Sharing
Growth", Rural ICA, Rural-
urban linkage study and
informal sector
PRSC-6 Draft amendments to crop board
legislation submitted for
stakeholder consultations and
strategic plans for all crop
boards finalized.
Draft amendments to crop board
legislation submitted for
stakeholder consultations and
strategic plans for all crop boards
finalized.
PSI on agriculture, GoT study
on fertilizer subsidy, Forestry
study by NGO Traffic and GoT
in 2007
PRSC-7 Collect information and report
on transparent and accountable
systems of licenses/concession
allocations and how this meets
market values in the forestry,
fisheries, wildlife, minerals and
oil & gas sectors.
Information on transparency and
accountability of
licenses/concession allocations
systems collected in the forestry,
fisheries, wildlife, minerals and
oil & gas sectors.
CEM, Notes on infrastructure,
trade, and agriculture, PSIA
agriculture, Rapid Poverty
Assessment
PRSC-8 Update FIAS study paying
particular attention to
regulations and local taxes
affecting agriculture and
undertake consultations and
agree to an action plan based on
the findings and
recommendations of the study.
Approve and initiate
implementation of an action
plan to improve accountability
and transparency in allocating
natural resource licenses and
concessions.
Action plan to improve
accountability and transparency in
allocating natural resource
licenses and concessions
approved and implementation
initiated.
Agriculture marketing notes,
TA to support NRM action
plan
D. Education, Health, and Water
PDO. Improve health status of the population; Expand enrollment and enhance quality in
all levels of education; and Improve well being through better access to clean water.
PRSC Triggers (from previous
operation)
PRSC Prior Actions Analytical Underpinnings
PRSC-
4
Satisfactory health sector review. 3rd PHDR, PETS on primary
education development
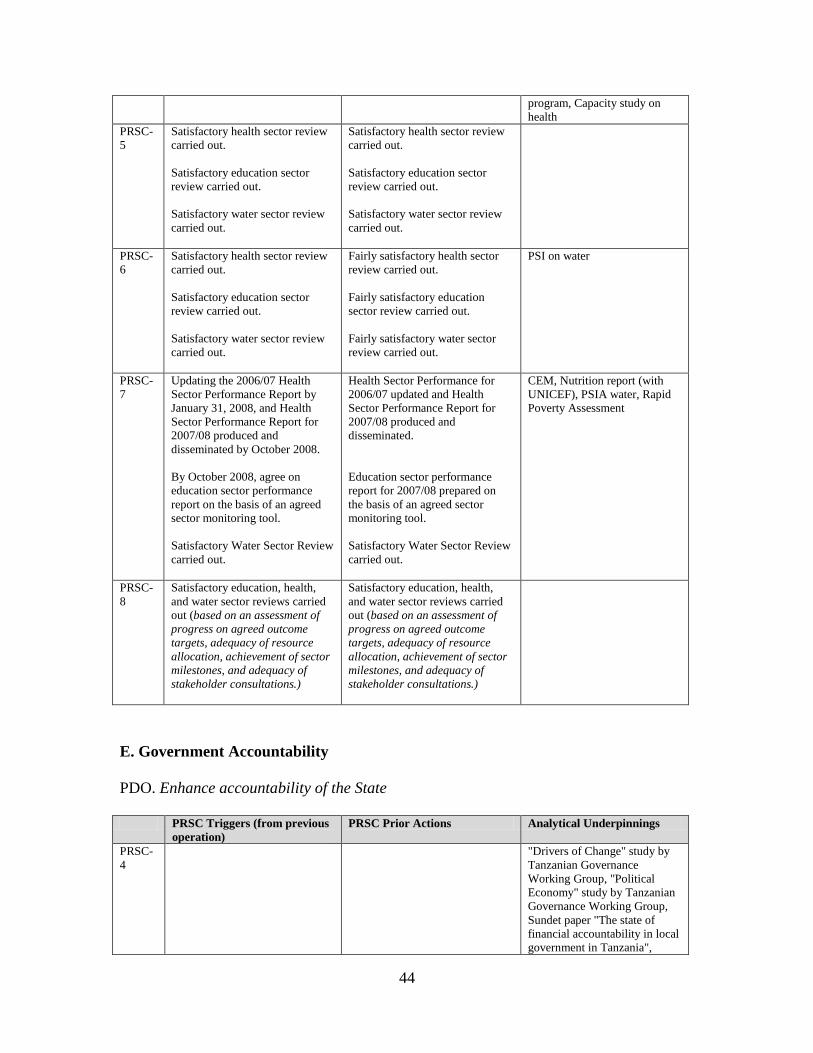
44
program, Capacity study on
health
PRSC-
5
Satisfactory health sector review
carried out.
Satisfactory education sector
review carried out.
Satisfactory water sector review
carried out.
Satisfactory health sector review
carried out.
Satisfactory education sector
review carried out.
Satisfactory water sector review
carried out.
PRSC-
6
Satisfactory health sector review
carried out.
Satisfactory education sector
review carried out.
Satisfactory water sector review
carried out.
Fairly satisfactory health sector
review carried out.
Fairly satisfactory education
sector review carried out.
Fairly satisfactory water sector
review carried out.
PSI on water
PRSC-
7
Updating the 2006/07 Health
Sector Performance Report by
January 31, 2008, and Health
Sector Performance Report for
2007/08 produced and
disseminated by October 2008.
By October 2008, agree on
education sector performance
report on the basis of an agreed
sector monitoring tool.
Satisfactory Water Sector Review
carried out.
Health Sector Performance for
2006/07 updated and Health
Sector Performance Report for
2007/08 produced and
disseminated.
Education sector performance
report for 2007/08 prepared on
the basis of an agreed sector
monitoring tool.
Satisfactory Water Sector Review
carried out.
CEM, Nutrition report (with
UNICEF), PSIA water, Rapid
Poverty Assessment
PRSC-
8
Satisfactory education, health,
and water sector reviews carried
out (based on an assessment of
progress on agreed outcome
targets, adequacy of resource
allocation, achievement of sector
milestones, and adequacy of
stakeholder consultations.)
Satisfactory education, health,
and water sector reviews carried
out (based on an assessment of
progress on agreed outcome
targets, adequacy of resource
allocation, achievement of sector
milestones, and adequacy of
stakeholder consultations.)
E. Government Accountability
PDO. Enhance accountability of the State
PRSC Triggers (from previous
operation)
PRSC Prior Actions Analytical Underpinnings
PRSC-
4
"Drivers of Change" study by
Tanzanian Governance
Working Group, "Political
Economy" study by Tanzanian
Governance Working Group,
Sundet paper "The state of
financial accountability in local
government in Tanzania",
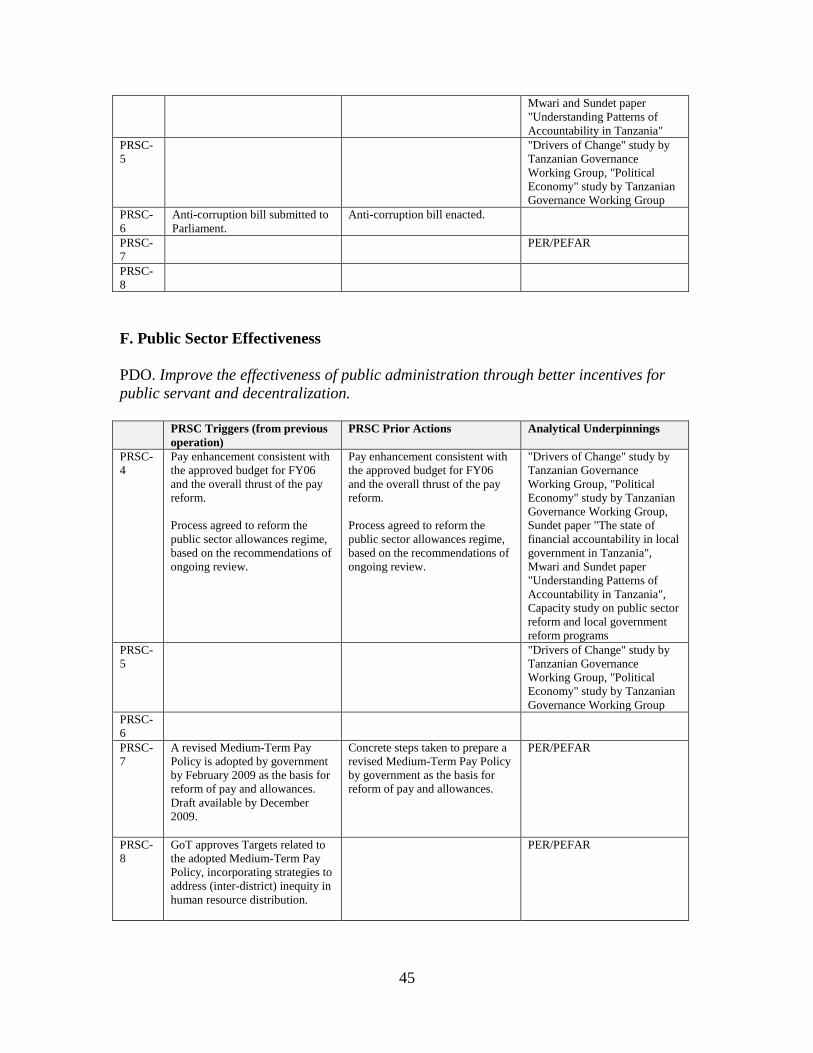
45
Mwari and Sundet paper
"Understanding Patterns of
Accountability in Tanzania"
PRSC-
5
"Drivers of Change" study by
Tanzanian Governance
Working Group, "Political
Economy" study by Tanzanian
Governance Working Group
PRSC-
6
Anti-corruption bill submitted to
Parliament.
Anti-corruption bill enacted.
PRSC-
7
PER/PEFAR
PRSC-
8
F. Public Sector Effectiveness
PDO. Improve the effectiveness of public administration through better incentives for
public servant and decentralization.
PRSC Triggers (from previous
operation)
PRSC Prior Actions Analytical Underpinnings
PRSC-
4
Pay enhancement consistent with
the approved budget for FY06
and the overall thrust of the pay
reform.
Process agreed to reform the
public sector allowances regime,
based on the recommendations of
ongoing review.
Pay enhancement consistent with
the approved budget for FY06
and the overall thrust of the pay
reform.
Process agreed to reform the
public sector allowances regime,
based on the recommendations of
ongoing review.
"Drivers of Change" study by
Tanzanian Governance
Working Group, "Political
Economy" study by Tanzanian
Governance Working Group,
Sundet paper "The state of
financial accountability in local
government in Tanzania",
Mwari and Sundet paper
"Understanding Patterns of
Accountability in Tanzania",
Capacity study on public sector
reform and local government
reform programs
PRSC-
5
"Drivers of Change" study by
Tanzanian Governance
Working Group, "Political
Economy" study by Tanzanian
Governance Working Group
PRSC-
6
PRSC-
7
A revised Medium-Term Pay
Policy is adopted by government
by February 2009 as the basis for
reform of pay and allowances.
Draft available by December
2009.
Concrete steps taken to prepare a
revised Medium-Term Pay Policy
by government as the basis for
reform of pay and allowances.
PER/PEFAR
PRSC-
8
GoT approves Targets related to
the adopted Medium-Term Pay
Policy, incorporating strategies to
address (inter-district) inequity in
human resource distribution.
PER/PEFAR
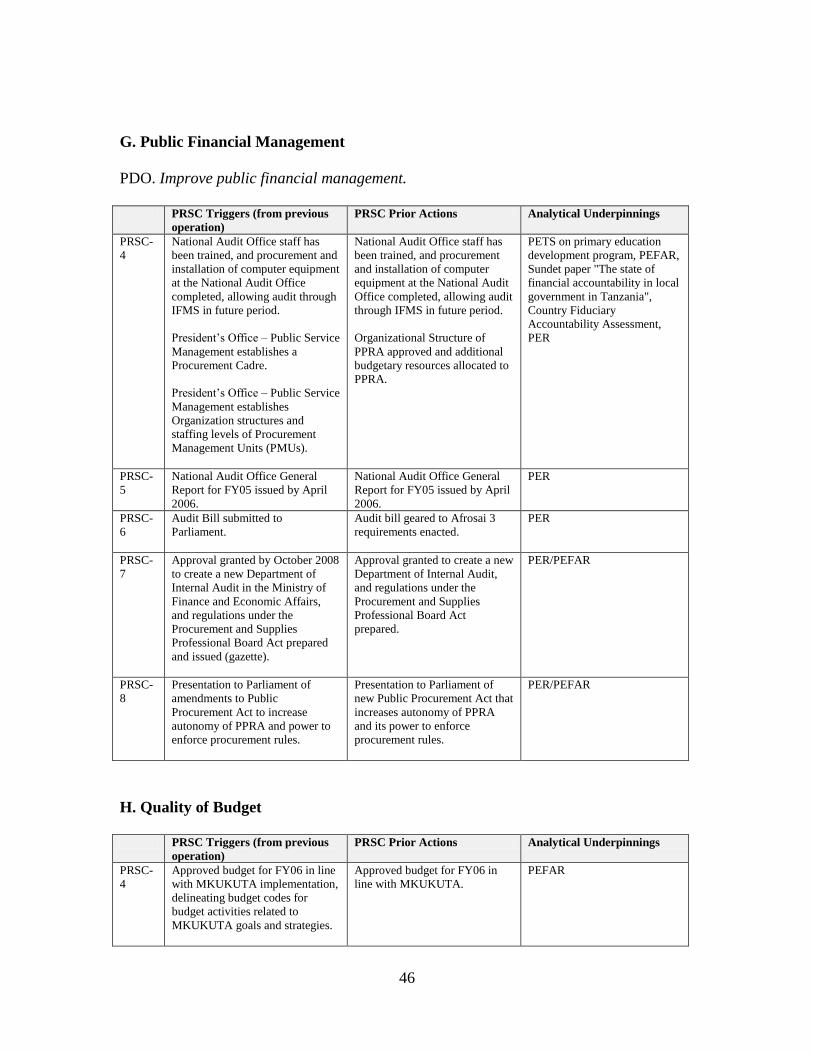
46
G. Public Financial Management
PDO. Improve public financial management.
PRSC Triggers (from previous
operation)
PRSC Prior Actions Analytical Underpinnings
PRSC-
4
National Audit Office staff has
been trained, and procurement and
installation of computer equipment
at the National Audit Office
completed, allowing audit through
IFMS in future period.
President’s Office – Public Service
Management establishes a
Procurement Cadre.
President’s Office – Public Service
Management establishes
Organization structures and
staffing levels of Procurement
Management Units (PMUs).
National Audit Office staff has
been trained, and procurement
and installation of computer
equipment at the National Audit
Office completed, allowing audit
through IFMS in future period.
Organizational Structure of
PPRA approved and additional
budgetary resources allocated to
PPRA.
PETS on primary education
development program, PEFAR,
Sundet paper "The state of
financial accountability in local
government in Tanzania",
Country Fiduciary
Accountability Assessment,
PER
PRSC-
5
National Audit Office General
Report for FY05 issued by April
2006.
National Audit Office General
Report for FY05 issued by April
2006.
PER
PRSC-
6
Audit Bill submitted to
Parliament.
Audit bill geared to Afrosai 3
requirements enacted.
PER
PRSC-
7
Approval granted by October 2008
to create a new Department of
Internal Audit in the Ministry of
Finance and Economic Affairs,
and regulations under the
Procurement and Supplies
Professional Board Act prepared
and issued (gazette).
Approval granted to create a new
Department of Internal Audit,
and regulations under the
Procurement and Supplies
Professional Board Act
prepared.
PER/PEFAR
PRSC-
8
Presentation to Parliament of
amendments to Public
Procurement Act to increase
autonomy of PPRA and power to
enforce procurement rules.
Presentation to Parliament of
new Public Procurement Act that
increases autonomy of PPRA
and its power to enforce
procurement rules.
PER/PEFAR
H. Quality of Budget
PRSC Triggers (from previous
operation)
PRSC Prior Actions Analytical Underpinnings
PRSC-
4
Approved budget for FY06 in line
with MKUKUTA implementation,
delineating budget codes for
budget activities related to
MKUKUTA goals and strategies.
Approved budget for FY06 in
line with MKUKUTA.
PEFAR
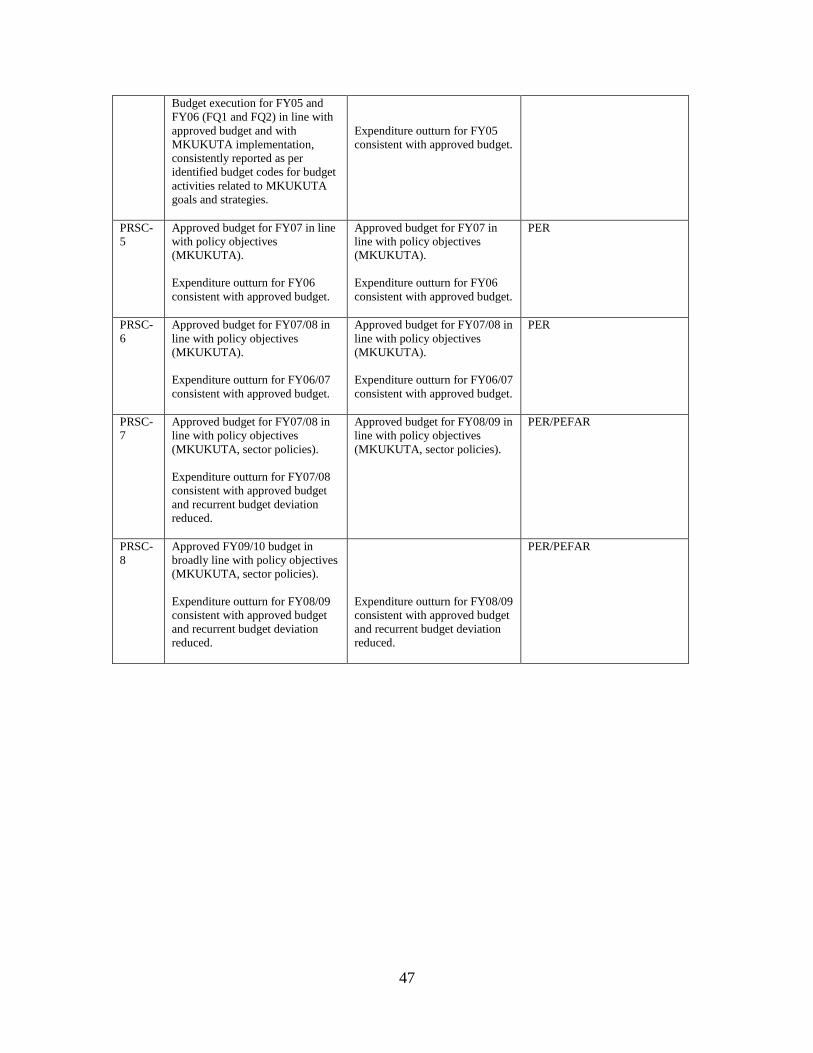
47
Budget execution for FY05 and
FY06 (FQ1 and FQ2) in line with
approved budget and with
MKUKUTA implementation,
consistently reported as per
identified budget codes for budget
activities related to MKUKUTA
goals and strategies.
Expenditure outturn for FY05
consistent with approved budget.
PRSC-
5
Approved budget for FY07 in line
with policy objectives
(MKUKUTA).
Expenditure outturn for FY06
consistent with approved budget.
Approved budget for FY07 in
line with policy objectives
(MKUKUTA).
Expenditure outturn for FY06
consistent with approved budget.
PER
PRSC-
6
Approved budget for FY07/08 in
line with policy objectives
(MKUKUTA).
Expenditure outturn for FY06/07
consistent with approved budget.
Approved budget for FY07/08 in
line with policy objectives
(MKUKUTA).
Expenditure outturn for FY06/07
consistent with approved budget.
PER
PRSC-
7
Approved budget for FY07/08 in
line with policy objectives
(MKUKUTA, sector policies).
Expenditure outturn for FY07/08
consistent with approved budget
and recurrent budget deviation
reduced.
Approved budget for FY08/09 in
line with policy objectives
(MKUKUTA, sector policies).
PER/PEFAR
PRSC-
8
Approved FY09/10 budget in
broadly line with policy objectives
(MKUKUTA, sector policies).
Expenditure outturn for FY08/09
consistent with approved budget
and recurrent budget deviation
reduced.
Expenditure outturn for FY08/09
consistent with approved budget
and recurrent budget deviation
reduced.
PER/PEFAR
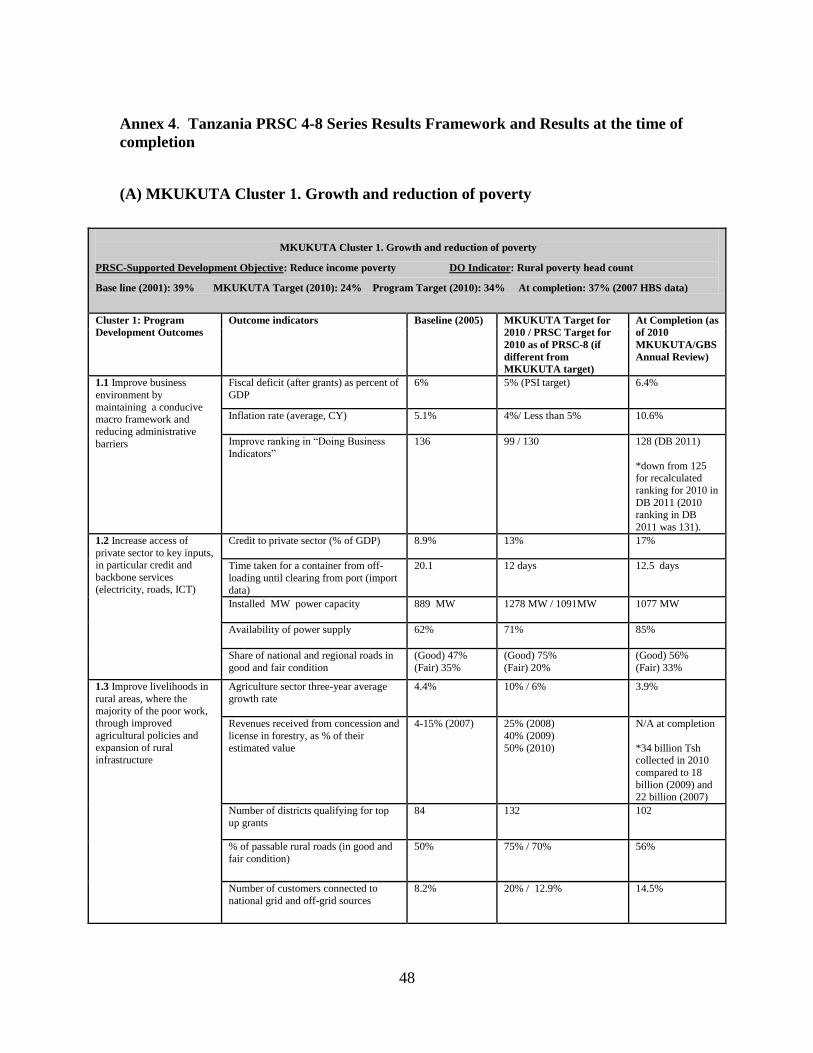
48
Annex 4. Tanzania PRSC 4-8 Series Results Framework and Results at the time of
completion
(A) MKUKUTA Cluster 1. Growth and reduction of poverty
MKUKUTA Cluster 1. Growth and reduction of poverty
PRSC-Supported Development Objective: Reduce income poverty DO Indicator: Rural poverty head count
Base line (2001): 39% MKUKUTA Target (2010): 24% Program Target (2010): 34% At completion: 37% (2007 HBS data)
Cluster 1: Program
Development Outcomes Outcome indicators Baseline (2005) MKUKUTA Target for
2010 / PRSC Target for
2010 as of PRSC-8 (if
different from
MKUKUTA target)
At Completion (as
of 2010
MKUKUTA/GBS
Annual Review)
1.1 Improve business
environment by
maintaining a conducive macro framework and
reducing administrative
barriers
Fiscal deficit (after grants) as percent of
GDP
6% 5% (PSI target) 6.4%
Inflation rate (average, CY) 5.1%
4%/ Less than 5% 10.6%
Improve ranking in ―Doing Business
Indicators‖
136 99 / 130 128 (DB 2011)
*down from 125 for recalculated
ranking for 2010 in
DB 2011 (2010 ranking in DB
2011 was 131).
1.2 Increase access of
private sector to key inputs, in particular credit and
backbone services (electricity, roads, ICT)
Credit to private sector (% of GDP) 8.9% 13% 17%
Time taken for a container from off-
loading until clearing from port (import
data)
20.1 12 days 12.5 days
Installed MW power capacity
889 MW 1278 MW / 1091MW 1077 MW
Availability of power supply
62% 71% 85%
Share of national and regional roads in
good and fair condition
(Good) 47%
(Fair) 35%
(Good) 75%
(Fair) 20%
(Good) 56%
(Fair) 33%
1.3 Improve livelihoods in
rural areas, where the majority of the poor work,
through improved
agricultural policies and expansion of rural
infrastructure
Agriculture sector three-year average
growth rate
4.4% 10% / 6% 3.9%
Revenues received from concession and
license in forestry, as % of their
estimated value
4-15% (2007) 25% (2008)
40% (2009)
50% (2010)
N/A at completion
*34 billion Tsh collected in 2010
compared to 18
billion (2009) and 22 billion (2007)
Number of districts qualifying for top
up grants
84 132 102
% of passable rural roads (in good and
fair condition)
50% 75% / 70% 56%
Number of customers connected to
national grid and off-grid sources
8.2% 20% / 12.9% 14.5%
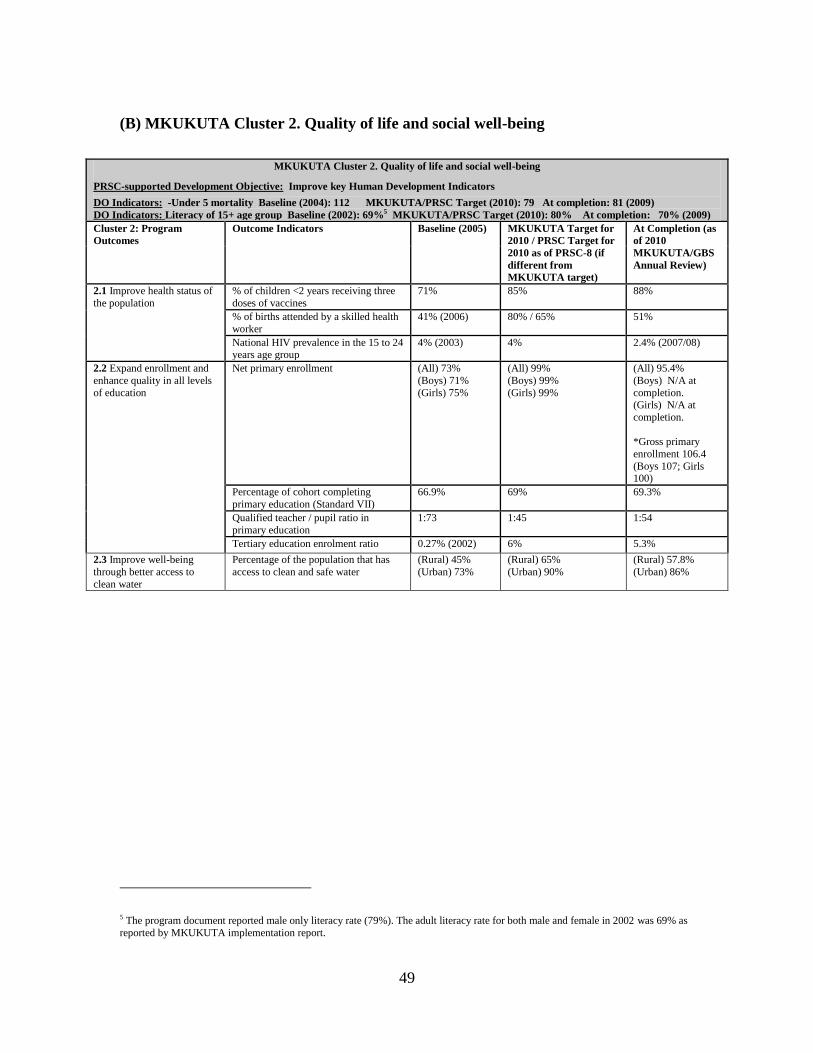
49
(B) MKUKUTA Cluster 2. Quality of life and social well-being
5 The program document reported male only literacy rate (79%). The adult literacy rate for both male and female in 2002 was 69% as
reported by MKUKUTA implementation report.
MKUKUTA Cluster 2. Quality of life and social well-being
PRSC-supported Development Objective: Improve key Human Development Indicators
DO Indicators: -Under 5 mortality Baseline (2004): 112 MKUKUTA/PRSC Target (2010): 79 At completion: 81 (2009)
DO Indicators: Literacy of 15+ age group Baseline (2002): 69%5 MKUKUTA/PRSC Target (2010): 80% At completion: 70% (2009)
Cluster 2: Program
Outcomes
Outcome Indicators Baseline (2005) MKUKUTA Target for
2010 / PRSC Target for
2010 as of PRSC-8 (if
different from
MKUKUTA target)
At Completion (as
of 2010
MKUKUTA/GBS
Annual Review)
2.1 Improve health status of
the population
% of children <2 years receiving three
doses of vaccines
71%
85% 88%
% of births attended by a skilled health
worker
41% (2006) 80% / 65% 51%
National HIV prevalence in the 15 to 24 years age group
4% (2003) 4% 2.4% (2007/08)
2.2 Expand enrollment and
enhance quality in all levels
of education
Net primary enrollment (All) 73%
(Boys) 71%
(Girls) 75%
(All) 99%
(Boys) 99%
(Girls) 99%
(All) 95.4%
(Boys) N/A at
completion. (Girls) N/A at
completion.
*Gross primary
enrollment 106.4
(Boys 107; Girls 100)
Percentage of cohort completing
primary education (Standard VII)
66.9% 69% 69.3%
Qualified teacher / pupil ratio in
primary education
1:73 1:45 1:54
Tertiary education enrolment ratio 0.27% (2002) 6% 5.3%
2.3 Improve well-being
through better access to
clean water
Percentage of the population that has
access to clean and safe water
(Rural) 45%
(Urban) 73%
(Rural) 65%
(Urban) 90%
(Rural) 57.8%
(Urban) 86%
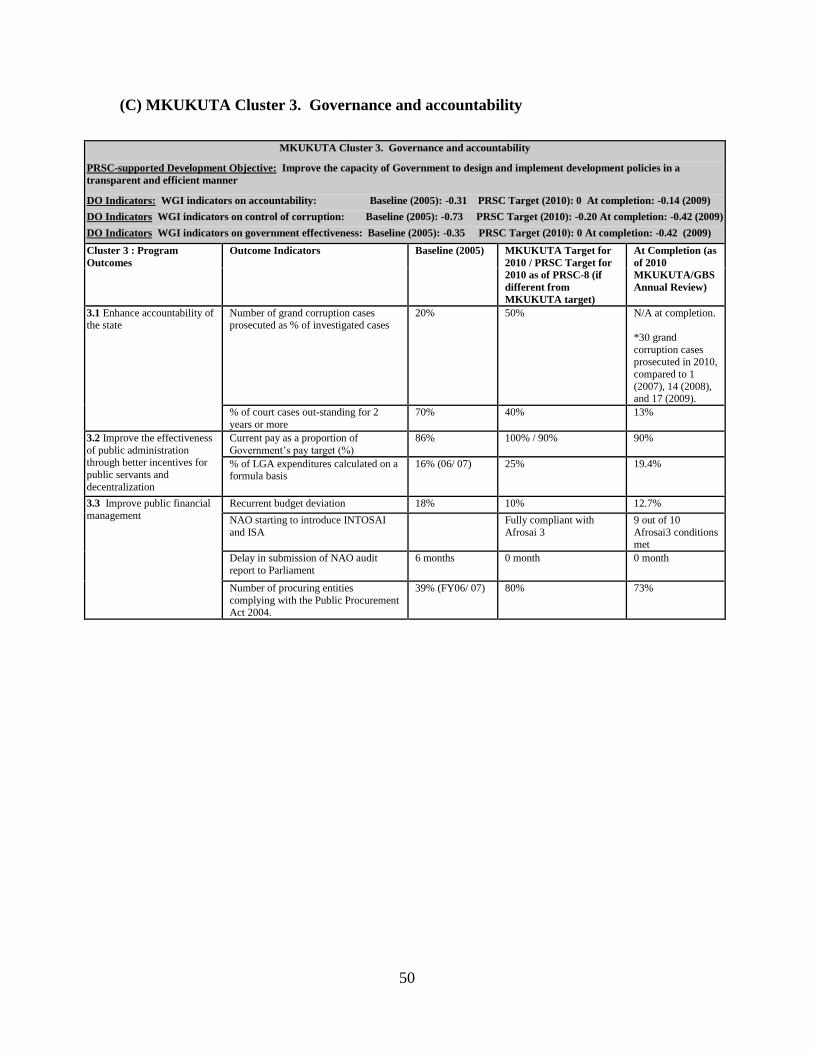
50
(C) MKUKUTA Cluster 3. Governance and accountability
MKUKUTA Cluster 3. Governance and accountability
PRSC-supported Development Objective: Improve the capacity of Government to design and implement development policies in a
transparent and efficient manner
DO Indicators: WGI indicators on accountability: Baseline (2005): -0.31 PRSC Target (2010): 0 At completion: -0.14 (2009)
DO Indicators WGI indicators on control of corruption: Baseline (2005): -0.73 PRSC Target (2010): -0.20 At completion: -0.42 (2009)
DO Indicators WGI indicators on government effectiveness: Baseline (2005): -0.35 PRSC Target (2010): 0 At completion: -0.42 (2009)
Cluster 3 : Program
Outcomes
Outcome Indicators Baseline (2005) MKUKUTA Target for
2010 / PRSC Target for
2010 as of PRSC-8 (if
different from
MKUKUTA target)
At Completion (as
of 2010
MKUKUTA/GBS
Annual Review)
3.1 Enhance accountability of the state
Number of grand corruption cases prosecuted as % of investigated cases
20% 50% N/A at completion.
*30 grand
corruption cases prosecuted in 2010,
compared to 1
(2007), 14 (2008), and 17 (2009).
% of court cases out-standing for 2
years or more
70% 40% 13%
3.2 Improve the effectiveness
of public administration through better incentives for
public servants and
decentralization
Current pay as a proportion of
Government’s pay target (%)
86% 100% / 90% 90%
% of LGA expenditures calculated on a formula basis
16% (06/ 07) 25% 19.4%
3.3 Improve public financial
management
Recurrent budget deviation 18% 10% 12.7%
NAO starting to introduce INTOSAI
and ISA
Fully compliant with
Afrosai 3
9 out of 10
Afrosai3 conditions met
Delay in submission of NAO audit
report to Parliament
6 months 0 month 0 month
Number of procuring entities
complying with the Public Procurement Act 2004.
39% (FY06/ 07) 80% 73%
51
Annex 5. Beneficiary Survey Results
N/A
Annex 6. Stakeholder Workshop Report and Results
N/A
Annex 7. Summary of Borrower's ICR and/or Comments on Draft ICR
No written comments have been received.
Annex 8. Comments of Co-financiers and Other Partners/Stakeholders
No written comments have been received.
52
Annex 9. List of Supporting Documents
Binswanger-Mkhize, H.P and Gautam, M. (2010) Toward an Internationally Competitive
Tanzanian Agriculture, World Bank, June 30, 2010
IMF (2010) Tanzania: First Review under the Policy Support Instrument, IMF Country Report
No. 10/351, December 2010.
UN (2010) Human Development Report
LOT January 29, 2001
UNFPA (2008) Family Planning Vital to Improving Maternal Health
http://www.un.org/apps/news/story.asp?NewsID=27343&Cr=unfpa&Cr1
United Republic of Tanzania (2005), MKUKUTA – National Strategy for Growth and Reduction
of Poverty, (and MKUZA for Zanzibar).
http://www.povertymonitoring.go.tz/Mkukuta/MKUKUTA_MAIN_ENGLISH.pdf
United Republic of Tanzania (2010), MKUKUTA II
Utz, Robert J. ed. (2007), Sustaining and Sharing Economic Growth in Tanzania (―Tanzania
CEM 2007‖), World Bank.
World Bank (2005-10) PRSC Program Files (Concept Notes, ROC review minutes, ISRs and
comments at various stages of the five PRSC reviewed in this document)
World Bank (2006) Tanzania: Fourth Poverty Reduction Support Credit, Report No. 35800-TZ,
April 10, 2006
World Bank (2007) Implementation Completion and Results Report on a Series of Five PRSCs
(PRSC 1-5) in Vietnam, Report No. ICR0000483
World Bank (2007) Implementation Completion and Results Report on the First Series of PRSCs
(PRSCs 1-3) in Tanzania, Report No.ICR0000501
World Bank (2007) Quality at Entry in FY06-06 (QEA8), A QAG Assessment, May 15, 2008
World Bank (2007) Tanzania: Fifth Poverty Reduction Support Credit, Report No. 38820-TZ,
March 1, 2007
World Bank (2008) Tanzania: Sixth Poverty Reduction Support Credit, Report No. 45348-TZ,
September 23, 2008
World Bank (2009) Tanzania: Seventh Poverty Reduction Support Credit, Report No. 48467-TZ,
May 11, 2009
World Bank (2010) Tanzania: Eighth Poverty Reduction Support Credit, Report No. 56347-TZ,
August 30, 2010
World Bank (2010) Poverty Reduction Support Credits: An Evaluation of World Bank Support, a
report produced by the Independent Evaluation Group of the World Bank.
KilimanjaroKilimanjaro(5895 m)(5895 m)
Iwem
bere
Ste
ppe
Nguru M
ts.
Mbeya Range
A R U S H AA R U S H A
M A R AM A R A
R U V U M AR U V U M A MTWARAMTWARA
I R I N G AI R I N G A
L I N D IL I N D I
D O D O M AD O D O M A
K I G O M AK I G O M A
M WA N Z AM WA N Z A
S H I N YA N G AS H I N YA N G A
R U K W AR U K W A
M B E Y AM B E Y AP WA N IP WA N I
TA B O R ATA B O R A
KAGERAKAGERA
SINGIDASINGIDATA N G ATA N G A
MOROGOROMOROGORO
Mbemkur
u
Matandu
Rufiji
Great Ruaha
Rungwa
Wam
iW
ami
Simiyu
Ruvuma
Mara
Kagera
Moyow
osi
Ugalla
Pangani
Kilo
mbe
ro
YalovaYalova
KaliuaKaliua
KasuluKasuluKondoaKondoa
ManyoniManyoni
KibondoKibondoKahamaKahama
NzegaNzega
BuoenBuoen
NjombeNjombe
MpuiMpui
MpandaMpanda
TundumaTunduma
SameSame
TunduruTunduru
MasasiMasasi
UteteUtete
MbeyaMbeya
MoshiMoshi
SongeaSongea
IringaIringa
KibahaKibaha
DODOMADODOMA
TaboraTaboraKigomaKigoma
ArushaArusha
MwanzaMwanza
SingidaSingida
MorogoroMorogoro
ZanzibarZanzibar
ShinyangaShinyanga
Kipengere Range
BabatiBabati
MANYARAMANYARA
MasaiMasaiSteppeSteppe
K E N Y AK E N Y A
UGANDAUGANDA
ZAMBIAZAMBIA
MOZAMBIQUEMOZAMBIQUE
RWANDARWANDA
BURUNDIBURUNDI
DEM
. R
EP.
OF
CO
NG
OD
EM.
REP
. O
F C
ON
GO
To To NakuruNakuru
To To MalindiMalindi
To To KasamaKasama
To To KasamaKasama
To To KasunguKasungu
To To LichingaLichinga
To To MarrupaMarrupa
To To ChiúreChiúre
To To NakuruNakuru
To To TororoTororo
To To KampalaKampala
To To KampalaKampala
To Kama
To Kama
Yalova
Kaliua
KasuluKondoa
Manyoni
KibondoKahama
Nzega
Buoen
Njombe
Mpui
Mpanda
Tunduma
Same
Tunduru
Masasi
Utete
KilwaKivinje
Wete
Lindi
Mbeya
Koani
Tanga
Moshi
Songea
Mtwara
Iringa
Kibaha
DODOMA
Mkoani
TaboraKigoma
Arusha
Mwanza
MusomaBukoba
Singida
Morogoro
Zanzibar
Mkokotoni
Shinyanga
Sumbawanga
Babati
Dar es Salaam
K E N Y A
UGANDA
ZAMBIA
MOZAMBIQUE
RWANDA
BURUNDI
DEM
. R
EP.
OF
CO
NG
O
A R U S H A
MANYARA
M A R A
R U V U M A MTWARA
KILIMANJARO
I R I N G A
L I N D I
D O D O M A
K I G O M A
M WA N Z A
S H I N YA N G A
R U K W A
M B E Y AP WA N I
TA B O R A ZANZIBARNORTH
PEMBANORTH
PEMBASOUTH
ZANZIBARSOUTH &CENTRALZANZIBARWEST
DAR ES SALAAM
KAGERA
SINGIDATA N G A
MOROGORO
Mbemkur
u
Matandu
Rufiji
Great Ruaha
Rungwa
Wam
i
Simiyu
Ruvuma
Mara
Kagera
Moyow
osi
Ugalla
Pangani
Kilo
mbe
ro INDIAN
OCEAN
Lake
Victor ia
LakeTanganyika
LakeMalawi
LakeRukwa
LakeNatron
LakeEyasi Lake
Manyara
To Nakuru
To Malindi
To Kasama
To Kasama
To Kasungu
To Lichinga
To Marrupa
To Chiúre
To Nakuru
To Tororo
To Kampala
To Kampala
To Kama
Iwem
bere
Ste
ppe
MasaiSteppe
Nguru M
ts.
Mbeya Range
Kipengere Range
Kilimanjaro(5895 m)
30°E
0°
2°S
8°S
10°S
0°
2°S
4°S
8°S
10°S
12°S
32°E 34°E 36°E
32°E 34°E 36°E 40°E
TANZANIA
This map was produced by the Map Design Unit of The World Bank. The boundaries, colors, denominations and any other informationshown on this map do not imply, on the part of The World BankGroup, any judgment on the legal status of any territory, or anyendorsement or acceptance of such boundaries.
0 50 100 150
0 50 100 150 Miles
200 Kilometers
IBRD 33494R1
NOVEMBER 2007
TANZANIAMAIN ROADS
RAILROADS
PROVINCE BOUNDARIES
INTERNATIONAL BOUNDARIES
SELECTED CITIES AND TOWNS
PROVINCE CAPITALS
NATIONAL CAPITAL
RIVERS