Embed Size (px)
Citation preview

Document of The World Bank
Report No: ICR3032
IMPLEMENTATION COMPLETION AND RESULTS REPORT (IBRD-74730)
ON A
LOAN
IN THE AMOUNT OF US$ 400 MILLION
TO THE
GOVERNMENT OF ARGENTINA
FOR A
NATIONAL HIGHWAY ASSET MANAGEMENT PROJECT PHASE II (APL2)
March 28, 2014
Sustainable Development Department Argentina Country Management Unit Latin America and the Caribbean Region
Pub
lic D
iscl
osur
e A
utho
rized
Pub
lic D
iscl
osur
e A
utho
rized
Pub
lic D
iscl
osur
e A
utho
rized
Pub
lic D
iscl
osur
e A
utho
rized
Pub
lic D
iscl
osur
e A
utho
rized
Pub
lic D
iscl
osur
e A
utho
rized
Pub
lic D
iscl
osur
e A
utho
rized
Pub
lic D
iscl
osur
e A
utho
rized

ii
CURRENCY QUIVALENTS
(Exchange Rate Effective: December 31, 2013)
Currency Unit = Argentine Peso AR$ 1.00 = US$ 0.201 US$ 1.00 = AR$ 4.978
FISCAL YEAR
January 1 – December 31
ABBREVIATIONS AND ACRONYMS
APL Adaptable Program Lending BMS Bridge Management System CAS Country Assistance Strategy CREMA Rehabilitation and Maintenance Contract (Contrato de Recuperación y Mantenimiento) DNV National Highways Directorate (Dirección Nacional de Vialidad) DPV Provincial Roads Directorate (Dirección Provincial de Vialidad) GDP Gross Domestic Product GoA Government of Argentina HDM Highway Design and Maintenance Standards Model IERR Internal Economic Rate of Return IRI International Roughness Index ISR Implementation Status and Results Report Km Kilometers MOEP Ministry of Economy and Production (Ministerio de Economía y de la Producción) NPV Net Present Value OCCOVI Concession Regulating Entity (Organo de Control de las Concesiones) PAD Project Appraisal Document PCU Project Coordinating Unit PDO Project Development Objective PMS Pavement Management System SIL Standard Investment Loan SME Small and Medium size Enterprise

iii
Vice President: Hasan A. Tuluy Country Director: Sabine Hader Sector Manager: Aurelio Menendez Project Team Leader: Gylfi Palsson ICR Team Leader: Gylfi Palsson


iv
ARGENTINA
National Highways Asset Management Program Phase II (APL2)
CONTENTS
Data Sheet A. Basic Information B. Key Dates C. Ratings Summary D. Sector and Theme Codes E. Bank Staff F. Results Framework Analysis G. Ratings of Project Performance in ISRs H. Restructuring I. Disbursement Graph
1. Project Context, Development Objectives and Design ............................................... 1 2. Key Factors Affecting Implementation and Outcomes .............................................. 5 3. Assessment of Outcomes ............................................................................................ 8 4. Assessment of Risk to Development Outcome ......................................................... 12 5. Assessment of Bank and Borrower Performance ..................................................... 12 6. Lessons Learned ....................................................................................................... 14 7. Comments on Issues Raised by Borrower/Implementing Agencies/Partners .......... 15 Annex 1. Project Costs and Financing .......................................................................... 16 Annex 2. Outputs by Component ................................................................................. 17 Annex 3. Economic and Financial Analysis ................................................................. 18 Annex 4. Bank Lending and Implementation Support/Supervision Processes ............ 20 Annex 5. Beneficiary Survey Results ........................................................................... 22 Annex 6. Stakeholder Workshop Report and Results ................................................... 23 Annex 7. Summary of Borrower's ICR and/or Comments on Draft ICR ..................... 24 Annex 8. Comments of Cofinanciers and Other Partners/Stakeholders ....................... 42 Annex 9. List of Supporting Documents ...................................................................... 43 MAP


v
A. Basic Information
Country: Argentina Project Name: AR APL2 National Highway Asset Mgt
Project ID: P095569 L/C/TF Number(s): IBRD-74730 ICR Date: 03/28/2014 ICR Type: Core ICR
Lending Instrument: APL Borrower: ARGENTINE REPUBLIC
Original Total Commitment:
USD 400.00M Disbursed Amount: USD 400.00M
Revised Amount: USD 400.00M Environmental Category: B Implementing Agencies: Direccion Nacional de Vialidad (DNV) Cofinanciers and Other External Partners: B. Key Dates
Process Date Process Original Date Revised / Actual Date(s)
Concept Review: 03/12/2007 Effectiveness: 11/24/2008 11/24/2008 Appraisal: 05/17/2007 Restructuring(s): 02/07/2012 Approval: 06/28/2007 Mid-term Review: 06/01/2011 06/17/2011 Closing: 12/31/2011 09/30/2013 C. Ratings Summary C.1 Performance Rating by ICR Outcomes: Moderately Satisfactory Risk to Development Outcome: Moderate Bank Performance: Satisfactory Borrower Performance: Moderately Satisfactory
C.2 Detailed Ratings of Bank and Borrower Performance (by ICR) Bank Ratings Borrower Ratings
Quality at Entry: Moderately Satisfactory Government: Satisfactory
Quality of Supervision: Satisfactory Implementing Agency/Agencies: Moderately Satisfactory
Overall Bank Performance: Satisfactory Overall Borrower
Performance: Moderately Satisfactory

vi
C.3 Quality at Entry and Implementation Performance Indicators Implementation
Performance Indicators QAG Assessments (if any) Rating
Potential Problem Project at any time (Yes/No):
Yes Quality at Entry (QEA):
None
Problem Project at any time (Yes/No):
Yes Quality of Supervision (QSA):
None
DO rating before Closing/Inactive status:
Moderately Satisfactory
D. Sector and Theme Codes
Original Actual Sector Code (as % of total Bank financing) General education sector 2 2 General public administration sector 4 4 Rural and Inter-Urban Roads and Highways 94 94
Theme Code (as % of total Bank financing) Administrative and civil service reform 14 14 Environmental policies and institutions 14 14 Infrastructure services for private sector development 29 29 Injuries and non-communicable diseases 14 14 Rural services and infrastructure 29 29 E. Bank Staff
Positions At ICR At Approval Vice President: Hasan A. Tuluy Pamela Cox Country Director: Sabine Hader Axel van Trotsenburg Sector Manager: Aurelio Menendez Jose Luis Irigoyen Project Team Leader: Gylfi Palsson Maria Marcela Silva ICR Team Leader: Gylfi Palsson ICR Primary Author: Gerard L. Liautaud F. Results Framework Analysis Project Development Objectives (from Project Appraisal Document) The objectives of the Project are: (a) to further preserve the Non-Concessioned National Road Network, through the expansion of CREMA Contracts for said network; and (b) to further strengthen DNVs road sector management capacity.
vii
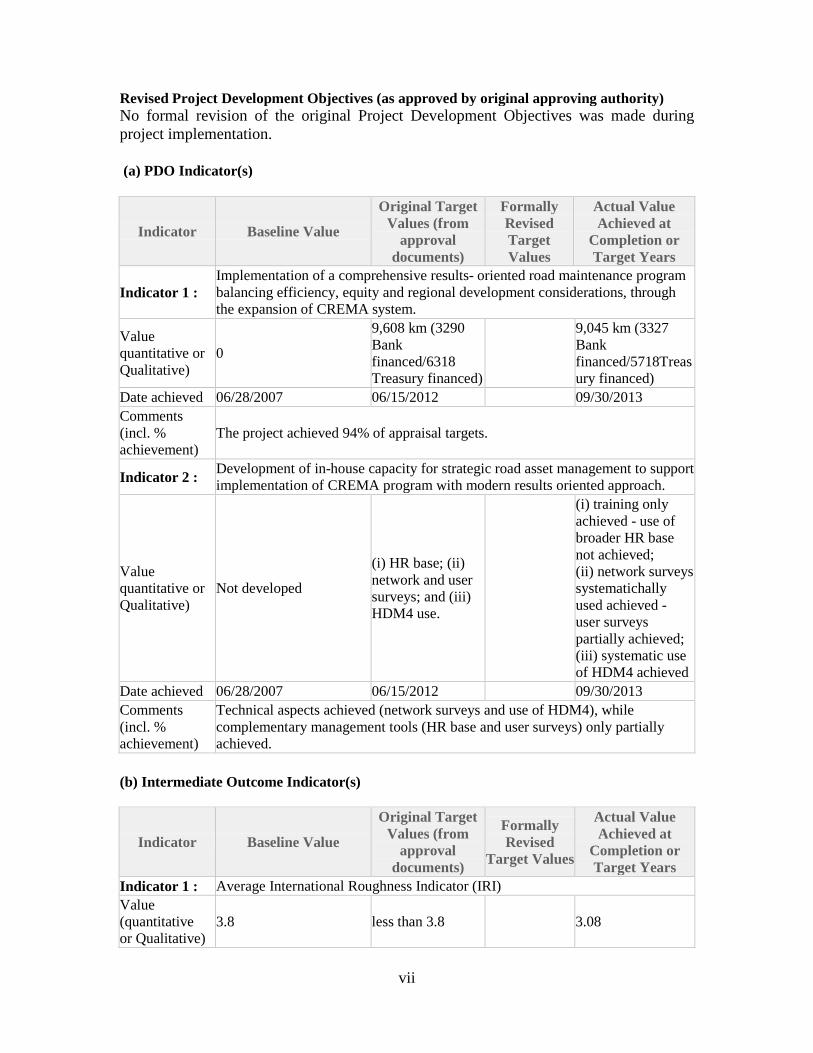
Revised Project Development Objectives (as approved by original approving authority) No formal revision of the original Project Development Objectives was made during project implementation. (a) PDO Indicator(s)
Indicator Baseline Value
Original Target Values (from
approval documents)
Formally Revised Target Values
Actual Value Achieved at
Completion or Target Years
Indicator 1 : Implementation of a comprehensive results- oriented road maintenance program balancing efficiency, equity and regional development considerations, through the expansion of CREMA system.
Value quantitative or Qualitative)
0
9,608 km (3290 Bank financed/6318 Treasury financed)
9,045 km (3327 Bank financed/5718Treasury financed)
Date achieved 06/28/2007 06/15/2012 09/30/2013 Comments (incl. % achievement)
The project achieved 94% of appraisal targets.
Indicator 2 : Development of in-house capacity for strategic road asset management to support implementation of CREMA program with modern results oriented approach.
Value quantitative or Qualitative)
Not developed
(i) HR base; (ii) network and user surveys; and (iii) HDM4 use.
(i) training only achieved - use of broader HR base not achieved; (ii) network surveys systematichally used achieved - user surveys partially achieved; (iii) systematic use of HDM4 achieved
Date achieved 06/28/2007 06/15/2012 09/30/2013 Comments (incl. % achievement)
Technical aspects achieved (network surveys and use of HDM4), while complementary management tools (HR base and user surveys) only partially achieved.
(b) Intermediate Outcome Indicator(s)
Indicator Baseline Value
Original Target Values (from
approval documents)
Formally Revised
Target Values
Actual Value Achieved at
Completion or Target Years
Indicator 1 : Average International Roughness Indicator (IRI) Value (quantitative or Qualitative)
3.8 less than 3.8 3.08

viii
Date achieved 06/28/2007 06/30/2012 09/30/2013 Comments (incl. % achievement)
Target was significantly exceeded
Indicator 2 : 13 bridges Rehabilitated/Reconstructed Value (quantitative or Qualitative)
0 13 8 7 (partially)
Date achieved 06/28/2007 06/26/2010 02/07/2012 09/30/2013 Comments (incl. % achievement)
Partially achieved. Only 7 could be financed and were being executed at closing.
Indicator 3 : Implementation of 2 pilot road safety interventions Value (quantitative or Qualitative)
0 2 1 1 (designed only and about to be tendered)
Date achieved 06/28/2007 06/28/2012 02/07/2012 09/30/2013 Comments (incl. % achievement)
Partially achieved. Vialidad was about to tender this single intervention by closing of the project, and under own financing.
Indicator 4 : At least four technical schools fully operational with more than 400 students promoted each year.
Value (quantitative or Qualitative)
0 4 4
Date achieved 06/28/2012 06/28/2012 09/30/2013 Comments (incl. % achievement)
Fully achieved. Four technical schools fully operational with more than 400 students promoted each year.
G. Ratings of Project Performance in ISRs
No. Date ISR Archived DO IP
Actual Disbursements (USD millions)
1 09/11/2007 Satisfactory Satisfactory 0.00 2 03/20/2008 Satisfactory Satisfactory 0.00 3 06/20/2008 Satisfactory Unsatisfactory 0.00 4 10/16/2008 Satisfactory Unsatisfactory 0.00 5 05/06/2009 Satisfactory Satisfactory 27.09 6 12/07/2009 Satisfactory Moderately Satisfactory 63.00 7 06/28/2010 Satisfactory Moderately Satisfactory 92.53 8 01/04/2011 Satisfactory Moderately Satisfactory 155.89 9 08/09/2011 Satisfactory Moderately Satisfactory 208.31
10 03/29/2012 Satisfactory Moderately Satisfactory 269.38 11 10/23/2012 Satisfactory Moderately Satisfactory 315.23 12 07/01/2013 Moderately Satisfactory Moderately Satisfactory 370.54

ix
H. Restructuring (if any)
Restructuring Date(s)
Board Approved
PDO Change
ISR Ratings at Restructuring
Amount Disbursed at
Restructuring in USD millions
Reason for Restructuring & Key Changes Made DO IP
02/07/2012 N S MS 249.88 Triggering of 6 new safeguards - reduction in scope of road safety and bridges components.
I. Disbursement Profile


1
1. Project Context, Development Objectives and Design
1.1 Context at Appraisal At project appraisal in April-June 2007, the National Road network had a total length of 38,313 km, of which 33,235 km was paved and 5,078 km unpaved. After years of fiscal crisis and poor management, the government took the decision in 1991 to concession nearly 9,000 km of the paved network with the highest volumes of traffic and signed 18 concession contracts with the private sector, for a period of 12 years. In parallel and thanks to loans from the World Bank the Government started pioneering performance based contracts (including the CREMA in 1997) with the private sector on over nearly 15,000 km of the non-concessioned paved network that helped improve the condition of the network. In 2007, the percentage of non-concessioned roads in good condition, i.e., with International Roughness Index (IRI) < 4, was about 89 percent while the percentage of maintenance backlog was about 11 percent. The proportion of the non-concessioned network (about 22,000 km) in bad condition was only in the order of 2 percent, with an average IRI of about 3.3. Traffic volumes averaged some 1,000 to 1,500 vehicles per day. It was important at the time to prevent further deterioration of the network and to ensure that it remained in a steady-state condition in the future. Fortunately, the effects of the 2001-2002 economic crises proved less severe than anticipated. Indeed, Argentina’s rate of recovery was impressive between 2003 and 2007 with average real annual growth rates ranging from 8.8 percent to 9.2 percent of Gross Domestic Product (GDP). The strong growth performance was supported by a dynamic expansion of private investment, internal consumption and exports. Strong export growth fueled by favorable commodity prices and improved fiscal performance (due to increased tax collection) generated persistent primary fiscal surpluses (between 2.7 and 5.3 percent of GDP), which, in turn, increased reserve accumulation from 19.3 $ billion in 2004 to 109.6 $ billion in 2007. Within that context of favorable economic growth, the Government continued to adopt the strategy of promoting increased infrastructure investment that already started in 2004. The focus on infrastructure was supported by solid evidence showing that: (i) infrastructure is an important determinant of economic growth; (ii) inequality declines with higher level of infrastructure quality and quantity and, (iii) proper access to infrastructure facilitates development of small and medium size enterprises (SMEs) which plays a critical role in job creation. Following the 2001-2002 crisis, infrastructure investment grew every year, reaching levels of 4.7 percent of GDP in 2006. Furthermore, the investment budget allocated to the National Road Authority (Direccion Nacional de Vialidad - DNV) for the upkeep and improvement of the national road system increased from an average of US$ 500 million/year during the period 1995-2001 to US$ 1,400 million in 2006 and to US$ 1,891million in 2007 (after a decline in budget allocation of US$ 184 - 324 million in 2002 and 2003). This increasing trend continued over the period 2008-2012, currently reaching nearly US$ 3.3 billion/year (at exchange rates at closing of project).

2
Project objectives remained the same as in 2004 at the time of APL1, which main priorities included: (i) addressing the structural weaknesses that hinder transport efficiency and economic competitiveness, and (ii) improving the institutional framework and the governance of a sector that concentrates nearly 80 percent of total freight volume movements in the country and is the dominant mode of transport. Over the years, the World Bank has played a key role in the road sector in Argentina, enabling reduction in the rehabilitation and maintenance backlog on both the national and provincial networks, while supporting institutional transformation processes to improve road management and promote rationalization of road expenditures in the country. In particular, at the national level, through Loans 3611-AR, 4295-AR and 7242-AR, covering the period 1991-2007, the Bank assisted DNV in the initiative to develop and consolidate the implementation of performance-based contracts (CREMA) for the rehabilitation and maintenance of the national paved non-concessioned road network (about 22,000 km). At the provincial level, since 1995, and through on-lending operations to participating provinces through Loans 4093-AR and 7301-AR, the Bank supported also the development of more efficient provincial road programs, gradually transferring maintenance execution to private contractors or to local road users and consortia, while strengthening the environmental and technical management capabilities of the Direccion Provincial de Vialidad (DPVs). More recently the Bank supported the introduction of the use of CREMA contracts in provinces such as Córdoba, Santa Fe and Corrientes. Bank’s involvement in this project intended to further improve the results achieved so far in the sector, but most importantly, would enable to continue developing the agenda designed during the APL1 phase.
1.2 Original Project Development Objectives (PDO) and Key Indicators (as approved) During the appraisal of the APL2 in 2007, the overall purpose of the program remained the same as the one adopted during the appraisal of the APL1 in 2004, namely: The objectives of the Project are: (a) to further preserve the Non-Concessioned National Road Network, through the expansion of CREMA Contracts for said network; and (b) to further strengthen DNVs road sector management capacity. Achievement of the first objective would primarily be confirmed by the number of kilometers of paved non-concessioned network under the CREMA system and, as a result of such interventions, by the improvement generated in the riding quality of the network (hence a reduction in Road Users Costs). Other key indicators for the achievement of the Project Development Objectives are detailed below (Table 2 – note that not all the indicators are part of results framework). They refer to the overall program as defined in 2004 and by deduction of what was achieved at the closing date of the first phase, (August 31, 2010), they define what was left to be implemented during the second phase of the program (APL2).

3
Table 2. Project Key indicators 1.Project component Key Indicators APL1
+APL2 Achieved under APL1 (9/31/10)
To be achieved under APL2
1.Road Rehabilitation & Maintenance CREMA
17,131 km of which 9,531 km Bank and 7,600 km Treasury Avg. IRI 2007-2010: <=3.5
6,241 km (Bank) + 1,282 (local funds)= 7,523 km Avg. IRI = 3.12
3,290 km Bank-financed; and 6,318 km local funds. (total =9,628 km) Avg. IRI<=3.5
2. Bridge Restoration
• Design and implement a Bridge Management system (BMS);
• Rehabilitate 20 priority bridges.
• BMS design started
• 5 Bridges rehabilitated
• Complete BMS • 13 bridges to be restored
(reduced to 8 at restructuring)
3. Road Safety Enhancement
• Design & Implement 4 pilot Safety Corridors;
• Restore 15 black spots; • Execute 310 km of
Horizontal Marking
• Only 1 corridor designed
• 3 Black spots
restored • Fully executed
Design 3 more & Execute 2 corridors (reduced to execution of 1 corridor at restructuring) • Restore 15 black spots
(reduced to 7 at restructuring)
• No further action
4. Institutional Renewal
• Develop and execute a Short and Long run Human Resources Plan
• Adopt the
recommendations of a Road Sector Financing Study
• Code of Ethics for DNV developed
• Performance indicators for DNV developed
• Road Users Satisfaction Survey & Index developed
• Strengthen Division of Environment
• Modernize Technology within DNV
• Streamline DNV processes
• Support 4 Road Technicians Schools.
• Plan and Training programs designed but not executed
• Study completed, but not discussed nor implemented
• Code of Ethics
completed • In progress • Survey on Users
satisfaction not carried out
• In progress
• In progress
• Study in progress • In progress
• Plan to be executed
• To be discussed and implemented
• No further action
• To be completed
• To be completed
• To be completed
• To be completed • To be completed • To be completed

4
1.3 Revised PDO (as approved by original approving authority) and Key Indicators, and reasons/justification No formal revision of the original Project Development Objectives was made during project implementation.
1.4 Main Beneficiaries, The project was expected to benefit primarily the people in rural and low-income areas in the corridors of influence of the road works through: (i) the reduction of time and travel costs; (ii) new employment opportunities generated by the CREMA program that requires labor for carrying out the works and for the production of road materials; (iii) increased competitiveness and development of Small and Medium-size Enterprises, and (iv) improved access to basic services. The corridors passed through all but two of Argentina’s Provinces. Also, one of the objectives of the APL program in 2004 was to ensure that 40 percent of the CREMA coverage would be in the poorest regions of the Country. At the closing date of the APL1 it was established that the CREMA project had met that target and that there was no need for the APL2 to complete the achievement. Notwithstanding, CREMA during these two APL series was implemented in all but two of Argentina’s Provinces.
1.5 Original Components (as approved) The project original components were the following:
• Component 1: Rehabilitation and Maintenance (Estimated cost US$1,181 million of which US$360 million would be financed by the Bank Loan) for the completion of CREMA contracts initiated under the APL1, launching additional CREMAs to be financed with Bank funds as well as CREMAs to be financed with local funds. The target was to have an International Roughness Index (IRI) less than or equal to 3.5. Continuing with the CREMA as a sustainable system was a key factor in the design of the project. Indeed, the CREMA concept has been fully integrated to the Government modalities of network management since 1995 and has given spectacular results. Since then, that system of network management represented nearly a third of all modalities used by DNV to maintain the 30,000 km of the national paved network and became as important as the concession program.
• Component 2: Bridge Restoration (Estimated cost US$ 22.8 million of which US$ 16 million would be financed by the Bank Loan) for the execution of rehabilitation works on 20 bridges that had been prioritized by DNV;
• Component 3- Road Safety (Estimated cost US$ 26 million of which US$ 19 million would be financed by the Bank Loan) for the implementation and measurement of results of the pilot road safety initiative, as well as the execution of additional road safety improvements in critical spots of the network. The target at the end of the project implementation was to have four road safety interventions completed and covering a total length of 630 km.
• Component 4: Institutional Renewal and Governance (Estimated cost US$ 5.2 million of which US$ 5 million would be financed by the Bank Loan) for the

5
completion of DNV’s institutional renewal action plan. These activities would complement those under implementation through the first phase of the APL.
1.6 Revised Components No formal revisions were made to the original components during project execution.
1.7 Other significant changes Other significant changes made during project implementation include the following: (a) The closing date of the project was extended twice during project implementation bringing the original date of December 31, 2011 to June 30, 2013 and subsequently to September 30, 2013; (b) the project was first restructured in February 2012 in order to accommodate the need to introduce in the Loan Agreement specific clauses on safeguard policies that were not considered applicable in the original documents; (c) partly because of the high inflation in the Argentine economy since 2003 the scope of works for the bridge and road safety sub-components was reduced in order to match available funding allocations – this however was also a reflection of slow implementation pace of these components by DNV; and (d) some minor reallocations of funds among Categories of the Loan were deemed necessary and executed, through a second restructuration of the project in June 2013.
2. Key Factors Affecting Implementation and Outcomes
2.1 Project Preparation, Design and Quality at Entry During project preparation, key lessons learnt from the execution of the first phase of the program were incorporated in the design of the APL2, including: (i) the need to ensure that the designs for CREMA projects have balanced rehabilitation and maintenance standards commensurate to surface and traffic characteristics of the network, avoiding unnecessary conservative solutions that would deviate from the optimum strategy and jeopardize the cost efficiency of the system and (ii) continue with the policy of independent technical audits for the monitoring of contractors and supervision of performance during execution of the CREMA program. Likewise, risks that were identified were adequately taken into account, with well-defined mitigating measures, for instance as it related to procurement and financial management risks. Quality at entry was generally good, except, in retrospect, in the design of the Institutional Component in which too many assignments were programmed, some of which finally proved to be too sensitive to execute, unpalatable to the Road Agency or too time-consuming and difficult to implement, leading to their cancellation, by the Road Agency, towards the end of the program, as discussed in section 3.2.2.
2.2 Implementation During implementation, the following main factors affected project’s execution schedule and outcomes, namely:
• The high inflation that plagued the overall economy of the country since 2003. In the road sector, cumulative inflation reached about 100 percent over the period 2006-2011 and exceeded was estimated at project preparation. Because

6
of that, the cost of road works in the country (including the CREMAs) generally increased by a factor of nearly 2 during project implementation.
• While inflation contributed to reduction in scope of bridges and road safety activities, inaction by DNV on those components resulted in reduction in rehabilitation of the 13 bridges originally identified as in critical condition to a situation where only 7 were in the process of restoration by the revised closing date. Likewise, only 6 black spots instead of 15 were in the process of bidding (but not yet executed) while barely one pilot safety corridors had bidding documents ready (but not yet tendered), instead of the 2 originally planned to be executed;
• The request by the Government in 2007-2008 for Bank assistance to oversee and check the standards and designs used in counterpart-financed CREMA contracts, beyond those financed by the Bank. That request was made in order to avoid discrepancies with the Bank-financed contracts, and was a response to a letter from the Bank to the Government indicating that locally financed programs were using over dimensioned and expensive designs that were causing contract values to explode. In reaction to that letter, DNV was requested by the Ministry of Infrastructure to submit all locally financed projects, before bidding, for Bank’s reviews and comments. Complying with that request until the closing of the project helped contain contracts values and efficiency of design, even if it generated some delay in the launching the bidding processes;
• The discovery, late during project execution, on a few CREMA contracts, of problems related to safeguards policies (both environmental and social) that were unsuspected and unaccounted for during appraisal, leading to activation of several new safeguard policies through an Amendment to the Loan Agreement (in August 2012); and,
• As mentioned earlier, the number of assignments included in the Institutional Component, that finally proved to be overwhelming or unpalatable for the executing Agency, leading to their cancellation by the Agency.
2.3 Monitoring and Evaluation (M&E) Design, Implementation and Utilization As provided for in the appraisal document, implementation of the project was monitored through a series of requirements and mechanisms that proved sufficient, including: regular progress reports furnished by the Project’s Coordinating Unit (PCU), annual management reports provided by the Road Agency, annual reports on the results of the national road network surveys, showing the evolution of traffic and the riding quality (Roughness) on the road system. In parallel, the Bank carried out twice a year regular supervision missions, including site visits, and organized videoconferences as needed. Also, the Bank continued to finance independent technical audits on selected CREMA contracts (about 24), both Bank-financed and counterpart-financed. Finally, and as requested by the Government, the Bank supervision team regularly carried out technical and cost reviews (and in the final years also safeguard reviews) of all CREMA projects to be funded with both bank and local resources, to ensure efficiency in resources utilization
7
and consistency with Bank-funded contracts. By and large, monitoring and evaluation of the project during implementation was satisfactory.
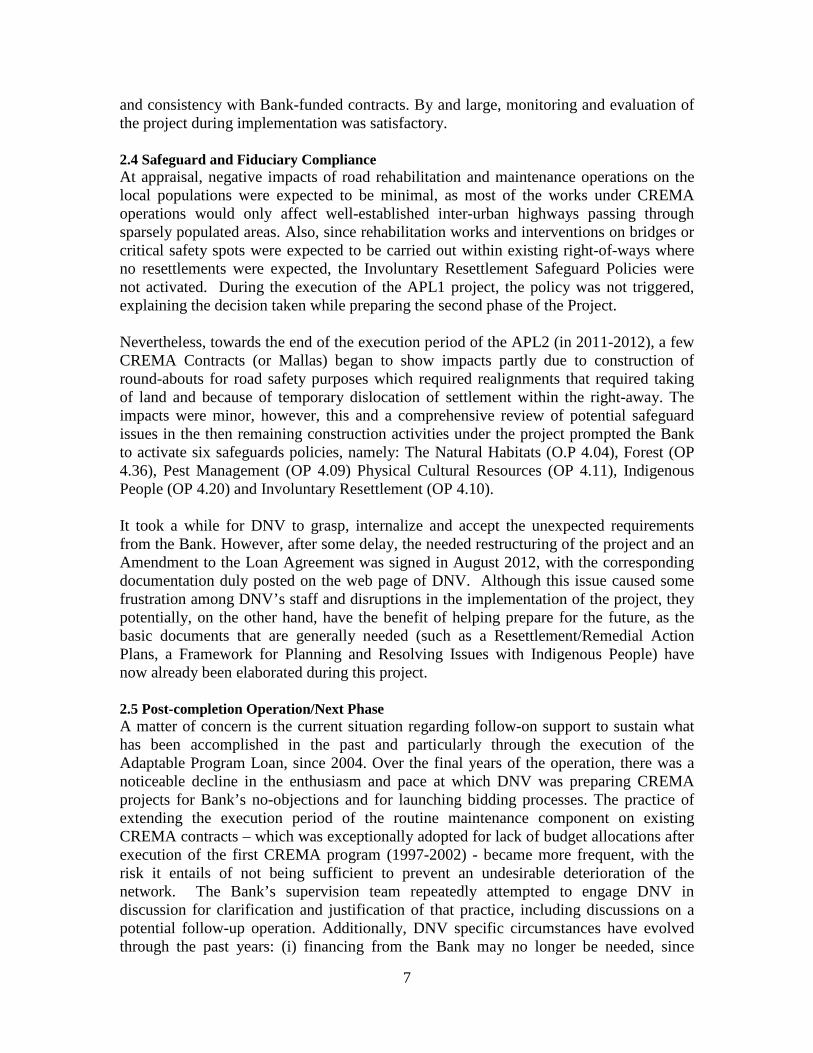
2.4 Safeguard and Fiduciary Compliance At appraisal, negative impacts of road rehabilitation and maintenance operations on the local populations were expected to be minimal, as most of the works under CREMA operations would only affect well-established inter-urban highways passing through sparsely populated areas. Also, since rehabilitation works and interventions on bridges or critical safety spots were expected to be carried out within existing right-of-ways where no resettlements were expected, the Involuntary Resettlement Safeguard Policies were not activated. During the execution of the APL1 project, the policy was not triggered, explaining the decision taken while preparing the second phase of the Project. Nevertheless, towards the end of the execution period of the APL2 (in 2011-2012), a few CREMA Contracts (or Mallas) began to show impacts partly due to construction of round-abouts for road safety purposes which required realignments that required taking of land and because of temporary dislocation of settlement within the right-away. The impacts were minor, however, this and a comprehensive review of potential safeguard issues in the then remaining construction activities under the project prompted the Bank to activate six safeguards policies, namely: The Natural Habitats (O.P 4.04), Forest (OP 4.36), Pest Management (OP 4.09) Physical Cultural Resources (OP 4.11), Indigenous People (OP 4.20) and Involuntary Resettlement (OP 4.10). It took a while for DNV to grasp, internalize and accept the unexpected requirements from the Bank. However, after some delay, the needed restructuring of the project and an Amendment to the Loan Agreement was signed in August 2012, with the corresponding documentation duly posted on the web page of DNV. Although this issue caused some frustration among DNV’s staff and disruptions in the implementation of the project, they potentially, on the other hand, have the benefit of helping prepare for the future, as the basic documents that are generally needed (such as a Resettlement/Remedial Action Plans, a Framework for Planning and Resolving Issues with Indigenous People) have now already been elaborated during this project.
2.5 Post-completion Operation/Next Phase A matter of concern is the current situation regarding follow-on support to sustain what has been accomplished in the past and particularly through the execution of the Adaptable Program Loan, since 2004. Over the final years of the operation, there was a noticeable decline in the enthusiasm and pace at which DNV was preparing CREMA projects for Bank’s no-objections and for launching bidding processes. The practice of extending the execution period of the routine maintenance component on existing CREMA contracts – which was exceptionally adopted for lack of budget allocations after execution of the first CREMA program (1997-2002) - became more frequent, with the risk it entails of not being sufficient to prevent an undesirable deterioration of the network. The Bank’s supervision team repeatedly attempted to engage DNV in discussion for clarification and justification of that practice, including discussions on a potential follow-up operation. Additionally, DNV specific circumstances have evolved through the past years: (i) financing from the Bank may no longer be needed, since

8
DNV’s allocations have exploded over the last five years, currently reaching nearly US$ 3.4 billion/year; (ii) the difficulties that have been experienced in reaching an agreement on a revised set of bidding documents for the CREMA; and (iii) what was perceived as a sudden introduction and rigid application by the Bank, late during project implementation, of safeguard policies that were not previously considered necessary in the past, including during the first CREMA program that started in Argentina in 1997. That situation generated frustration within DNV’s management teams, as well as difficulties and delays in complying with those unexpected requirements and in obtaining no-objections to proceed or to bid. Notwithstanding, it is clear that Bank engagement on DNV’s CREMA program has led to better efficiency in uses of all resources dedicated to the program. Technically, DNV is committed to pursuing CREMA on the non-concessioned part of the primary road network and there is an understanding in the Ministry of Economy of the economic benefits of the approach, but in the end sustainability of DNVs CREMA program will depend on sufficiency of government budget allocations.
3. Assessment of Outcomes
3.1 Relevance of Objectives, Design and Implementation At appraisal, the overall and specific objectives of this project were consistent with the IBRD-IFC 2006 Country Assistance Strategy (CAS) discussed at the Board on May 4, 2006, under which improvement of infrastructure assets was identified as a fundamental pillar of sustained economic growth, as well as being more equitable to the poor. More than one third of lending operations proposed in the 2006 CAS was for infrastructure, with the bulk of these in the transport sector. The PDO remained also highly relevant throughout project implementation including with the objectives of the latest CAS discussed at the Board on May 6, 2009 that covered the period 2010-2012 and has three main pillars, namely: (i) sustained economic growth with equity; (ii) social inclusion, and (iii) improved governance.
3.2 Achievement of Project Development Objectives 3.2.1 First Specific Objective: ..(a) to further preserve the Non-Concessioned National Road Network, through the expansion of CREMA Contracts for said network. Output Indicator and Expected Results for the CREMA. The expected output at the end of the APL2 was to expand the CREMA system over an additional 9,608 km of which 3,290 km (about 20 contracts) would be financed by the Bank and 6,318 km (about 42 contracts) would be funded by the Treasury. At the revised closing date of the project, (September 30, 2013), 3,327 km (20 contracts) had been contracted with Bank financing, and 5,718 km (37 contracts) had been let with local funds, totaling 9,045 km, i.e., 94 percent of appraisal target. Improvement in the riding quality of the network: An expected outcome of the project was that the rehabilitation and maintenance works carried out under the APL2 additional CREMA coverage would help prevent further deterioration of the non-concessioned paved network, as measured by the International Roughness Index (IRI). The target was

9
to keep the average IRI below 3.5 during project implementation. As shown in Table 3 below, that target was consistently achieved (3.1 < IRI < 3.3), with a maintenance backlog that was reduced from 9.1 percent in 2006 to about 5 percent in 2012, and a proportion of roads in poor/bad condition that dropped from 1.8 percent to about one percent for the same period.
Table 3. Evolution of the riding quality on the non-concessioned paved network* Indicator 2006 2007 2008 2009 2010 2011 2012 % in good condition, IRI<4
90.9 97.8 97.7 94.5 96.2 96.1 95
% Maintenance backlog, IRI >4
9.1 2.2 2.3 5.5 3.8 3.9 5
% in poor condition, IRI >5
1.8 0 0 0.5 0.1 1.1 1
Average IRI 3.27 3.29 3.28 3.12 3.28 3.09 3.08 * The IRI is based on results of annual technical surveys of the non-concessioned paved national road network Expected output and Results achieved for the Bridge and Safety Components. As was said earlier, and partly because of the inflation that considerably increased by a factor of about 2 the cost of road works in the country, and also because of DNV’s lack of interest and prioritization, the physical targets set out at appraisal for those two sub-components could not be achieved, as the assigned budget allocations were insufficient. Of the 13 bridges target aimed at appraisal, only 7 could be financed and are being executed. Likewise, instead of executing 4 pilot safety corridors, only one was about to be tendered at closing. Similarly, of the 31 black spots initially identified (but later reduced to 15 interventions), only 3 were executed. 3.2.2 Second Specific Objective: …(b) to further strengthen DNVs road sector management capacity. At the end of the first phase (APL1) of the project, only a limited number of activities included in the DNV renewal program had been executed, including: the elaboration of a Code of Ethics for DNV and the carrying out of the short term Human Resource Study, implemented by the Agency. The second phase APL2 helped complete a number of actions initiated in phase 1. The status, at closing, of those assignments was as follows:
• The Human Resource Plan only achieved the design of short and long-term training part of DNV personnel,
• The Road Sector Financing Study was executed by an individual Consultant, • The streamlining study of DNV’s administrative processes was also theoretically
well advanced, • The study on Territorial Development was completed • The Environmental Manual was updated; • A state-of-the-art axle load control, with the assistance of the Road Authority of
Chile, was also well advanced • The Road Users Satisfaction Survey although lagging behind was well advanced,

10
• The Technical Modernization project for DNV was partly achieved, pending the realization of a cutting edge Weigh-in-Motion System (WIM) for axle load control;
• In the end, only the Bridge Management System and the support to road technicians Schools were substantially achieved, while some progress was also accomplished in the structure and content of the annual DNV management reports, with the incorporation of outcome performance indicators such as the network riding quality.
By and large, out of the assignments programmed for that component, only three were executed with success, while another three were partially achieved with the remaining simply cancelled, due to a lack of interest from DNV. However, worthy of consideration as these were consulted extensively with the Bank are other institutional achievements made with the successful twinning arrangements celebrated with the U.S. Federal Highway Administration in the area of winter maintenance, and with the Chilean Road Authorities in the area of axle load control.
3.3 Efficiency At appraisal, a revised economic evaluation using the HDM model was carried out for the APL2 project and showed that the proposed investment would yield a positive Net Present Value (NPV) in the order of US$ 771 million (in economic terms of roads rehabilitated, (i.e., US$ 245,000/km, in financial terms) with an Internal Economic Rate of Return (IERR) of 47 percent. At closing, an ex-post evaluation using actual costs, with revised traffic and pavement conditions as well as updated vehicle operating costs showed that despite the increase in the cost of road-works, the actual investments continue to yield high returns, with a NPV of US$ 1,350 million (about US$ 214,000/km in financial terms) for about 9,000 km of roads rehabilitated and an Internal Economic Rate of Return of 41 percent (see Annex 3). In addition, the cost efficiency and cost effectiveness of the CREMAs when compared to conventional unit price contracts was demonstrated by a specific empirical study1 in 2010 that confirmed that the system is both efficient and effective: The cost effectiveness was estimated to be in the order of 24 percent due to the facts that: (i) no cost overruns resulting from variation orders is possible under the CREMAs; (ii) the CREMA incorporates for the same lump price a number of additional features that are not contemplated in unit price contracts (or paid separately), such as the carrying out of the detailed engineering design by the Contractor with a comprehensive auto-quality control of the works, the implementation of a traffic and axle-load monitoring system during the entire contract period.
1 The World Bank: Transport Paper 36, September 2011 “Performance-Based Road Contracts (CREMA). A Review of Fifteen Years’ Experience. 1996-2010” by M. Marcela Silva and Gerard Liautaud

11
That empirical study was further deepened using the HDM Model that showed that as the CREMAs addresses the life cycle costs and benefits over a 20-years horizon the system is both efficient and effective.
3.4 Justification of Overall Outcome Rating The overall outcome of the project is rated: Moderately Satisfactory Indeed, even though the Institutional Component fell short of fully achieving its targets, the Project Development Objectives remained highly relevant throughout project implementation, to both the Government global priorities and to the latest Country Assistance Strategy, as formulated in 2009 by the Bank. The targets set out for the major CREMA component of the project were almost fully achieved and resulted in a sustained improvement in the riding quality of the non-concessioned paved network. Also, the economic returns to be expected from the actual investments made continued to be acceptable, as shown above.
3.5 Overarching Themes, Other Outcomes and Impacts (a) Poverty Impact and Social Development. It was expected at the time of appraisal, that overall a minimum of forty percent of investments made under the CREMA component would be located in the poorest provinces of the country. At the end of the APL1, already forty-two percent of investments made were in the poorest provinces, thus slightly exceeding the original target. With the additional contracts financed under the second phase of the program, the CREMA benefits a much greater number of provinces with more than fifty percent of the total investment injected into the economy of the poorest ones. No doubt that this will reduce poverty and inequalities as well as foster economic growth in those regions, while helping develop small and medium size enterprises, and playing a critical role in job creation. (b) Institutional Changes/Strengthening Even though the full spectrum of activities and initiatives aimed at reinforcing and revitalizing DNV’s role in the road sector was not achieved, the progress brought about during the APL2 in completing some of the achievements of the first phase of the program and in implementing new activities, was certainly positive. The Institution grew stronger, particularly in the areas of technological capacity, bridge management system and winter maintenance practices while having set a solid foundation for road safety management and substantially increasing the capacity of its Environmental and Social Division. Also, a valuable assistance was provided to four Schools of Engineering in an area that was most critical, i.e., the lack of competent road Technicians to assist DNV and the Contracting Industry in the execution of the vast program of road construction and rehabilitation that could be contemplated by the Government in the near future. Finally, DNV has improved considerably its approach to more efficient pavement rehabilitation and maintenance standards as well as to costs and quantities evaluations, all of which has already led to bids proposals, during the last few years, much closer to official estimates (less than 20 percent).
12
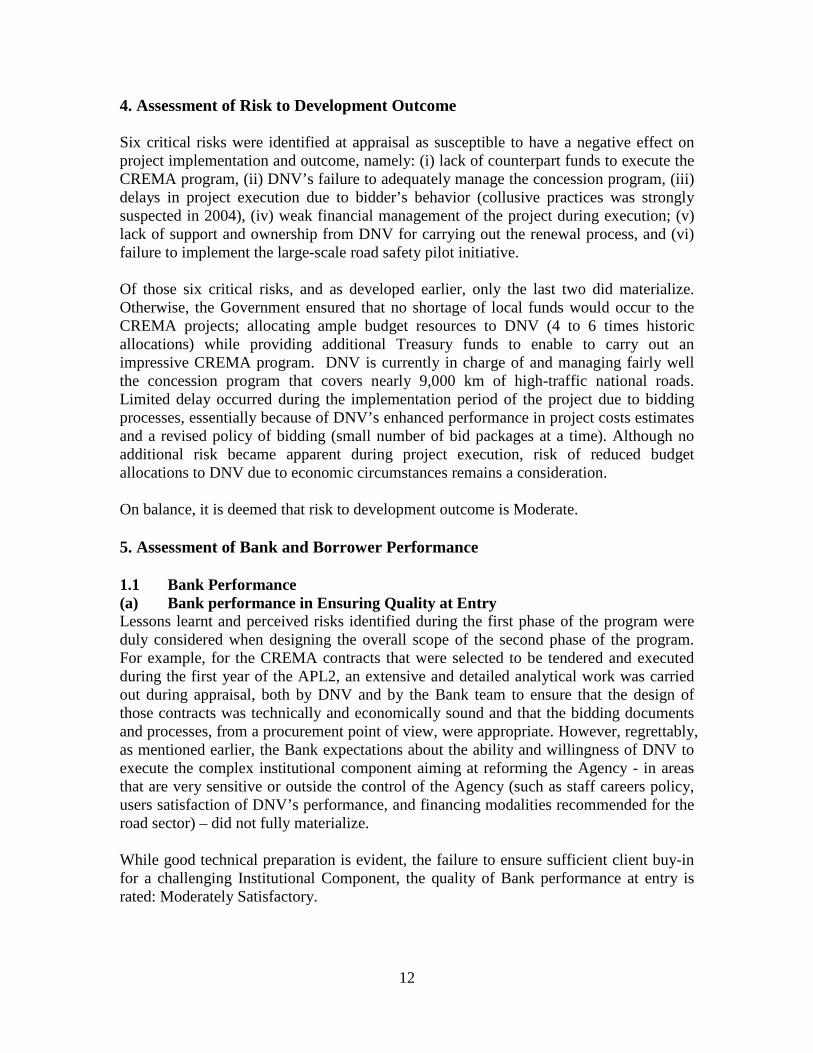
4. Assessment of Risk to Development Outcome Six critical risks were identified at appraisal as susceptible to have a negative effect on project implementation and outcome, namely: (i) lack of counterpart funds to execute the CREMA program, (ii) DNV’s failure to adequately manage the concession program, (iii) delays in project execution due to bidder’s behavior (collusive practices was strongly suspected in 2004), (iv) weak financial management of the project during execution; (v) lack of support and ownership from DNV for carrying out the renewal process, and (vi) failure to implement the large-scale road safety pilot initiative. Of those six critical risks, and as developed earlier, only the last two did materialize. Otherwise, the Government ensured that no shortage of local funds would occur to the CREMA projects; allocating ample budget resources to DNV (4 to 6 times historic allocations) while providing additional Treasury funds to enable to carry out an impressive CREMA program. DNV is currently in charge of and managing fairly well the concession program that covers nearly 9,000 km of high-traffic national roads. Limited delay occurred during the implementation period of the project due to bidding processes, essentially because of DNV’s enhanced performance in project costs estimates and a revised policy of bidding (small number of bid packages at a time). Although no additional risk became apparent during project execution, risk of reduced budget allocations to DNV due to economic circumstances remains a consideration. On balance, it is deemed that risk to development outcome is Moderate.
5. Assessment of Bank and Borrower Performance 1.1 Bank Performance (a) Bank performance in Ensuring Quality at Entry Lessons learnt and perceived risks identified during the first phase of the program were duly considered when designing the overall scope of the second phase of the program. For example, for the CREMA contracts that were selected to be tendered and executed during the first year of the APL2, an extensive and detailed analytical work was carried out during appraisal, both by DNV and by the Bank team to ensure that the design of those contracts was technically and economically sound and that the bidding documents and processes, from a procurement point of view, were appropriate. However, regrettably, as mentioned earlier, the Bank expectations about the ability and willingness of DNV to execute the complex institutional component aiming at reforming the Agency - in areas that are very sensitive or outside the control of the Agency (such as staff careers policy, users satisfaction of DNV’s performance, and financing modalities recommended for the road sector) – did not fully materialize. While good technical preparation is evident, the failure to ensure sufficient client buy-in for a challenging Institutional Component, the quality of Bank performance at entry is rated: Moderately Satisfactory.

13
(b) Quality of Supervision. During the execution of the project, Bank’s performance is rated as Satisfactory, for the following reasons:
a) Good due diligence was ensured with formal supervision missions visiting Argentina systematically, twice a year, and regularly carried out site visits to check the quality of works performed by the Contractors and DNV supervision teams;
b) The Bank initiated about 24 valuable independent audits, by appointing a competent highway consultant for the task – these audits apparently were not required in project design;
c) Albeit imposing additional strain on the supervision team, the Bank team showed sensitivity to and willingly accepted, at no additional budget, the Government’s request for the Bank team to oversee and check, before tendering, the quality of the design and costs estimates proposed for the CREMA works that were financed with its own funds.
d) In spite of resistance of the government counterparts, the Bank supervision team acted decisively when near the end of the project it discovered safeguard policies problems and prompted Management to amend the Loan Agreement in order to incorporate the appropriate safeguards, thus avoiding that the project would be in contradiction to Bank’s policies.
(c) Justification of Rating for Overall Bank Performance Overall, Bank performance is rated: Satisfactory, as the efforts carried out during the implementation of the project to ensure it stayed on track and the fact that the government requested the Bank to expand its review to the entire national program represents a basis for a rating.
5.2 Borrower Performance (a) Government Performance Throughout project design and implementation, Government’s performance was also satisfactory. First of all, and most unusual in Bank-financed projects, the Government made sure that the project did not fall short of providing the necessary counterpart funds: budgetary allocations to DNV increased dramatically from US$ 1.4 billion in 2006 to nearly US$ 3.5 billion in 2012, while additional funds from the Treasury were made available to finance an impressive new CREMA program, covering about 7,000 km, nearly meeting the target set out at appraisal. Finally, the Government, in order to ensure coherence with the Bank-financed program, proactively decided to request Bank’s support to verify - before bidding - the technical design and financial cost estimates used in their own CREMA program. Perhaps, one can only deplore, on the one hand, the long delay in the Government countersigning the Amendment to the Loan Agreement and, on the other hand, lack of communication with the Bank regarding a longer-term objectives for the CREMA approach. Overall, Government performance is rated: Satisfactory

14
(b) Implementing Agency or Agencies Performance The performance of DNV was marginally satisfactory both during the design and implementation phases of the project. At appraisal, the sub-projects that were elaborated to constitute the first-year CREMA work program were adequately designed both in terms of technical quality and estimated costs. Subsequently, the technical standards and costs evaluations proposed for both the Bank and the counterpart-financed CREMA program were consistent with the pursuit of reasonable and cost-efficient solutions. Finally, when the issue of safeguards emerged and was brought to the attention of the Agency, late 2010, the eventual reaction was to strengthen environmental and social monitoring despite their frustration in the face of an unexpected and uncommon situation. However, it is regrettable that DNV did not: (i) allow the Bank to implement a forum on the CREMA that was proposed by the Bank supervision team; (ii) have a discussion on the Agency’s strategy for sustaining in the long-term the benefits of the CREMA program and its expansion to cover a greater length of the paved non-concessioned national network. The limited execution of the institutional component and slow progress on bridges and road safety subcomponents was an issue. Overall, the performance of the Implementing Agency is rated as Moderately Satisfactory (c) Justification of Rating for Overall Borrower Performance For the above reasons, the overall Borrower Performance is rated: Moderately Satisfactory.
6. Lessons Learned The following key lessons were learned during the execution of the Loan:
1. Despite Bank’s worldwide experience with the difficulty in achieving the objectives of Institutional Components, this project fell victim, once again, of a scope of tasks not fully committed to by a client. Out of the major actions that formed part of the Renewal Plan to reform DNV, only two were formally requested by the Agency, namely: a financial support to engineering Schools, and Technological modernization, and those were satisfactorily achieved. All the others were submitted by the Bank without fully ensuring beforehand, a formal ownership by DNV. The result was that scheduled assignments fell short of being achieved, when not simply cancelled during implementation. The Bank must be prepared and willing to accept that reality i.e., the fact that institutional reforms or even improvements may or will not take place within a short expected timeframe and without the Borrower’s consent and ownership. In order to avoid those shortcomings, future projects should concentrate on a achievable tasks for which the Borrower shows to have a genuine appetite;
2. The policy of independent technical audits during project implementation proved to be extremely valuable and should be widely institutionalized for this type of interventions. Indeed, that policy is a complement to the activities carried out during formal supervision missions on site or during the regular follow-up work done by Bank staff at Head Office. The audits carried out throughout the execution of this project, helped depict a number of deficiencies or needs for

15
improvements in the supervision by DNV, that were subsequently brought to the attention of the authorities for remedial actions;
3. The assessment done by the World Bank of use of CREMA in Argentina (the 2010 study referred to in section 3.3), found that the overall cost effectiveness of these type of contracts in comparison to traditional ad-measurement or input contracts is 24 percent. Argentina’s and the World Bank’s experience with these type of contracts is and should continue to be presented in road sector engagements in other countries.
4. One additional advantage of the CREMA system that is rarely mentioned and yet became, once again, apparent during project execution, is that it allows reasonably swift disbursement of Bank’s funds, since payments are not linked to time-consuming measurements and testing as is the case in traditional inputs-based contracting systems. Indeed the shift from traditional input-based contracts to the performance-based CREMA contracts in 1995-97 was essentially motivated by the slow disbursement of Bank’s Loan 3611. Slow disbursements were due the lack of, inadequate and/or untimely final engineering rehabilitation designs that caused severe delays in execution and several modifications of works with corresponding variation orders. With the CREMAs adequate preliminary or conceptual designs are made by DNV and provided to bidders to help them make meaningful bids, while the final engineering design is the responsibility of the winning bidder who has only 45 days to produce the final design after signing the contract. Such system is more efficient and enables much quicker initiation of works and disbursements as well as it limits the need for design modifications and cost overruns during execution. In addition, Finance Ministries are generally keen to have Bank loans quickly disbursed, in order to avoid unnecessary payments of interest charges that build up when loan proceeds remain idle for a long period of time.
7. Comments on Issues Raised by Borrower/Implementing Agencies/Partners (a) Borrower/implementing agencies Minor editorial comments have been made by the Implementing Agency. (b) Cofinanciers: Not applicable (c) Other partners and stakeholders Not applicable

16
Annex 1. Project Costs and Financing
(a) Project Cost by Component (in USD Million equivalent)
Components Appraisal Estimate (USD millions)
Actual/Latest Estimate (USD
millions)
Percentage of Appraisal
1. CREMA 360.00 389.80 108.3 2. Bridges 16.00 6.03 3.4 3. Road Safety 19.00 0.10 0.0 4. Institutional Renewal 5.00 4.07 81.4
Total Baseline Cost 400.00 400.00 100.0
Physical Contingencies 0.00
0.00
-
Price Contingencies 0.00
0.00
-
Total Project Costs 400.00 400.00 100.0 Front-end fee PPF 0.00 0.00 - Front-end fee IBRD 0.00 0.00 -
Total Financing Required 400.00 400.00 100.0
(b) Financing
Source of Funds Type of Cofinancing
Appraisal Estimate
(USD millions)
Actual/Latest Estimate
(USD millions)
Percentage of Appraisal
Borrower 935.10 952.70 101.88 International Bank for Reconstruction and Development 400.00 400.00 100.00

17
Annex 2. Outputs by Component
Objective/Outcome per Component Expected Output at Appraisal of APL2
Achieved under APL2, at closing, Sept. 2013
CREMA Coverage 9,608 km of which 3,290 km Bank-funded, and 6,318 km Treasury-financed
9,044 km of CREMA contracts contracted, of which 3,327 km with Bank’s funds and 5,718 km with local funds, i.e., 94% of expected
Average IRI < 3.5 Avg. IRI in 2011 and 2012: 3.09 and 3.08 Bridges
BMS in operation BMS in operation
15 priority bridges rehabilitated 7 priority bridges being rehabilitated
Road Safety Design and execute 4 pilot safety corridors (including monitoring system)
Only one corridor ready for bidding
Improve 31(later reduced to15) critical black-spots
3 black spots improved
Institutional Renewal of DNV
Short-run Human Resources plan implemented
Human Resources Diagnosis completed. Only Short-term training program implemented
Adopt Road Sector Financing study recommendations
Road Sector Financing study, and strategic study for Territorial Development completed. Road Sector study recommendations not implemented
Performance indicators for DNV and dissemination mechanisms developed
Some progress has been achieved.
Road Users Satisfaction Index developed Little progress. Strengthen Division of Environment Environmental Manual updated. Training of staff
implemented. Modernize technology within DNV State-of-the-art axle-load control system designed
but yet to be implemented Streamline DNV processes in management, procurement, etc.
Consultant contracted for diagnosis of procurement processes; recommendations not implemented
Financially Assist in 4 Road Technicians Schools (running expenditures)
4 Schools satisfactorily assisted.

18
Annex 3. Economic and Financial Analysis CREMA Component An economic analysis to confirm the Internal Economic Rate of Return (IERR) and the Net Present Value (NPV) established at appraisal using the Bank’s HDM model was carried out by the Planning Department of DNV, using the same model. The ex-post evaluation covered a sample of 4,349 km CREMA networks, belonging to both the Bank-financed and Treasury-financed contracts. To be representative, the sample of networks was selected with the following criteria in mind: (i) the rehabilitation and maintenance works were practically completed at the time of the evaluation; (ii) they would cover different geographic areas of the country; and (iii) their total length would be equal to at least 30 percent of the total length of new contracts financed under the project. The factors that would primarily affect the results of the analyses – as compared to appraisal - were revised and updated, namely:
• The actual cost of the works, incorporating increases that occurred as a result of inflation, bid prices, and design adjustments;
• The dates or periods at which the rehabilitation component of the contracts was actually executed and completed (start-up year);
• The costs of vehicles operation during the period of implementation of the capital works (as established in DNV’s V.O.C Manual, COSTOP);
• The actual condition of the pavements (roughness, and other surface defects) and levels of traffic measured, prior to rehabilitation;
• The actual rehabilitation standards or overlay thickness executed; and • The actual roughness measured after rehabilitation (as obtained from the various
independent technical audits carried out by the Bank, i.e., IRI generally equal to 1.8)
Otherwise, all other meaningful factors were kept unchanged in the evaluation: (i) the analysis period continued to be 20 years; (ii) economic costs remained at about 71 percent of financial costs; (iii) annual traffic growth rate after rehabilitation remained at 3 percent for all types of vehicles; (iv) no generated traffic or exogenous benefits were taken into account; (v) the discount rate remained at 12 percent; (v) the base scenario or without project case consisted in a standard routine maintenance policy with 100 percent patching followed by reconstruction works when the IRI reaches 8 IRI; (vi) future maintenance policy for the with-project case consisted in routine maintenance (100 percent of potholes patched) and applying a 5 cm-thick overlay when roughness reaches 4 IRI.
The results of the updated economic evaluation are summarized in the following Table. They show that the revised weighted average Economic Internal Rate of Return IERR is 41 percent compared to a weighted average of 47 percent obtained at appraisal, with an NPV, at 12 percent discount rate, in the order of US$ 160,000/km, in economic terms, as compared to a weighted average of US$ 145,000/km obtained at appraisal.

19
Mallas Parte A2 Bank-Financing
Malla NPV ARS
M NPV
US$M IERR % Length, km NPV/km 108B 175.94 35.2 71 192 183,271 132 52.25 10.5 39 114 91,667 206 283.84 56.8 107 168 337,905 208 118.57 23.7 49 153 154,993 307 50.03 10.0 28 188 53,223 308 6.8 1.4 13 219 6,210 314 9.24 1.8 39 162 11,407
401A 98.33 19.7 29 146 134,699 403 45.7 9.1 17 236 38,729
405A 58.66 11.7 46 123 95,382 503 358.69 71.7 104 178 403,022 508 7.91 1.6 20 131 12,076 510 49.53 9.9 50 82 120,805
Sub-total 1315.49 263.1 47 2092 125,764 Malla Parte A3 Treasury- financed
Malla NPV ARS
M NPV
US$M IERR % Length, km NPV/km 111 183 36.6 50 130 281,538 114 234 46.8 60 144 325,000 120 217 43.4 49 203 213,793 130 106 21.2 37 172 123,256 140 97 19.4 34 119 163,025
209C 49 9.8 21 161 60,870 211 259 51.8 61 140 370,000 212 362 72.4 46 203 356,650
401B 214 42.8 44 109 392,661 531 43 8.6 21 201 42,786 541 117 23.4 29 89 262,921 603 8 1.6 21 179 8,939 630 12 2.4 14 215 11,163 632 8 1.6 17 160 10,000 634 36 7.2 24 219 32,877
Sub-total 1945 389 35.2 2444 159,165 28 Mallas
Total 3260.49 652.1 41 4536 143,761

20
Annex 4. Bank Lending and Implementation Support/Supervision Processes
(a) Task Team members
Names Title Unit Responsibility/ Specialty
Lending Marcelo Hector Acerbi Senior Environmental Specialist LCSEN Rodrigo Archondo-Callao Senior Highway Engineer ECSTR Vickram Cuttaree Senior Infrastructure Economist MNSTI Gerard L. Liautaud Consultant ECSTR Juan Lopez-Silva Consultant LCSEN Andres Mac Gaul Senior Procurement Specialist LCSPT Reynaldo F. Pastor Chief Counsel LEGLE Geise B. Santos Program Assistant LCSEN Tomas S. Serebrisky Senior Infrastructure Economist LCSSD Maria Marcela Silva Lead Transport Specialist LCSTR Alejandro Roger Solanot Sr Financial Management Specialist LCSFM Supervision/ICR Marcelo Hector Acerbi Senior Environmental Specialist LCSEN Sergio Espana Consultant LCSHE Gerard L. Liautaud Consultant ECSTR Ricardo Eduardo Lugea Senior Procurement Specialist LCSPT Andres Mac Gaul Senior Procurement Specialist LCSPT Hector Miguel Mansilla Consultant LCSTR Federico Ricardo Manuel Mejer Consultant LCSTR
Lilian Pedersen Consultant LCSSO Alejandro Roger Solanot Sr Financial Management Specia LCSFM Gylfi Palsson Lead Transport Specialist LCSTR Cecilia Corvalan Senior Transport Economist LCSTR Elba Gaggero Senior Environmental Specialist LCSEN Daniel Chalupowicz Financial Management Specialist LCSFM Maria Marcela Silva Lead Transport Specialist LCSTR
(b) Staff Time and Cost
Stage of Project Cycle Staff Time and Cost (Bank Budget Only)
No. of staff weeks USD Thousands (including travel and consultant costs)
Lending FY07 146.46 FY08 -2.28
Total: 144.18 Supervision/ICR
FY08 Not loaded in system

21
FY09 Not loaded in system FY10 Not loaded in system FY11 Not loaded in system FY12 200.60 FY13 95.82 FY14 44.04
Total: 340.46

22
Annex 5. Beneficiary Survey Results Not Applicable

23
Annex 6. Stakeholder Workshop Report and Results Not Applicable

24
Annex 7. Summary of Borrower's ICR and/or Comments on Draft ICR DNV has prepared a succinct ICR report of its own. It is presented in its entirety and in original language.

25
REPUBLICA ARGENTINA DIRECCION NACIONAL DE VIALIDAD
PROYECTO
GESTION DE ACTIVOS DE VIALIDAD NACIONAL
PRESTAMO 7473 AR
INFORME DE CIERRE FINAL ENERO DE 2014.
1. OBJETIVO Y COMPONENTES
1.1 OBJETIVOS DEL PROYECTO
La finalidad general del programa fue consolidar gradualmente una estrategia de gestión eficaz de la red vial, generando parte de los recursos necesarios para preservar la red vial nacional en el largo plazo. El Proyecto propuesto se basó en los logros alcanzados en proyectos anteriores, también financiados por el Banco, y tuvo los siguientes objetivos específicos:
• Preservar el estado de los activos viales, mejorando la condición física de las calzadas y evitando su deterioro mediante un adecuado plan de mantenimiento.
• Reducir los costos económicos de los usuarios a largo plazo para lograr un adecuado beneficio económico.
• Fortalecer la capacidad de la DNV para planificar, contratar y supervisar los contratos.
• Aumentar la seguridad vial.
1.2 INDICADORES CLAVE i) Longitud de la Red Pavimentada no concesionada incluída en el Sistema
CREMA. ii) Cantidad de Puentes Rehabilitados iii) Implementación de Corredores de Seguridad Vial iv) Cumplimiento del Programa de Renovación Institucional incluyendo a)
actualización de los sistemas de comunicación, b) Fortalecimiento de la Unidad de Gestión Ambiental de la DNV y d) realización de estudios estratégicos para la red vial Argentina.
1.3 COMPONENTES 1.3.1 Descripción
FÍSICOS
Rehabilitación y mantenimiento de las carreteras mediante los Contratos C.Re.Ma.: Estos contratos ya iniciados en el Préstamo 3611-AR y continuados en el 4295-AR y el 7242-AR, requieren que el Contratista recupere la calzada (en los

26
tramos que esto es necesario), en una Malla de rutas, y realizar el mantenimiento por un periodo total de 5 años. El esquema de supervisión se hace sobre la base de controlar que se lleven a cabo las tareas de recuperación y el mantenimiento, con el logro de un estado mínimo de la calzada que asegura el nivel de servicio de la ruta. El pago se realiza en base a un esquema de precio total con certificaciones en base a cuotas establecidas en función de las tareas ejecutadas para los trabajos de recuperación, más una cuota mensual por el mantenimiento. De esta manera se logra establecer un nivel de servicio con un gasto previsible y uniforme. En el Appraisal se previó continuar con la financiación de 8 de estos contratos iniciados en el APL1 cubriendo aproximadamente 1.417 Km y contratar otras 12 mallas con una longitud de aproximadamente 1.873 Km, totalizando de esta manera 20 Mallas financiadas y una longitud de 3.290 Km aproximadamente. Además estableció que la DNV contrataría otras 50 Mallas durante la vigencia de los dos tramos de Préstamo APL1 y APL2 cubriendo una longitud de 7.637 Km. Considerando que en el APL1 se iniciaron 8 Mallas acumulando una longitud de 1.282 Km, para el APL2 quedó una meta de 42 Mallas con una extensión de 6.318 Km.
• Restauración y Construcción de Puentes: El proyecto contemplaba dos
actividades: a) la financiación de obras en trece puentes con necesidad de intervención. Las
obras incluirían actividades de construcción, reconstrucción, reemplazo, ensanchamiento y rehabilitación, todas las cuales se llevarían a cabo dentro del derecho de paso existente. Durante el MTR se fijó la meta en 8 puentes.
b) la financiación de diseños de ingeniería para futuros proyectos de recuperación de aproximadamente 20 puentes. Esta actividad se anuló en el MTR.
• Componente de Seguridad Vial. Se previeron dos subcomponentes:
a) El proyecto previó la realización de experiencias sobre seguridad vial en tramos denominados corredores, estableciendo los mecanismos para su puesta en marcha. Esto incluía el diseño de un Sistema para efectuar el seguimiento y la evaluación de los impactos, formular campañas de educación, realizar diseños de ingeniería como así también las obras en los corredores propuestos, que inicialmente fueron dos y posteriormente durante el MTR se redujo a un corredor.
b) Además se financiarían obras puntuales en aproximadamente 15 puntos críticos identificados de la red vial, los que fueron reducidos a 7 durante el MTR, para mejorar la seguridad vial.
• Componente 4 – Renovación Institucional de la DNV.
El proyecto previó financiar una serie de actividades:

27
a) Soporte al programa de educación secundaria y terciaria de la DNV. b) Fortalecimiento de la capacidad ambiental de la DNV. c) Soporte a la DNV sobre temas de Gestión Financiera. d) Asistencias Técnicas para completar estudios estratégicos. e) Mejora en el Sistema de Comunicación entre las Regiones de la DNV.
1.3.2 Montos asignados En el siguiente Cuadro se muestra la versión original a la firma del acuerdo del Préstamo el
27 de Junio de 2008, que contemplaba una inversión total para el Proyecto de 1.332,9
Millones de U$S de los cuales correspondían 400 Millones de U$S (30%) para el BIRF y
932,9 Millones de U$S (70%) para la DNV.
En miles de dólares PRESTAMO CONTRAPARTE LOCAL
Categoría % BIRF MONTO % DNV MONTO TOTAL
1(a). Contratos Crema – Parte 1(a) 1(b). Contratos Crema – Parte 1(b) 1(c). Obras en Puentes 1(d). Obras de Seguridad Vial 2. Bienes 3. Servicios de Consultoría, Capacitación y
Costos Operativos 7. Costo Unitario Elegible de Educación
74 74 74 74 70
100 100
106.000 253.750 15.800 16.300
500
4.750 2.900
26 26 26 26 30
0 0
37.243 89.155 5.551 5.727
214
0 0
143.243 342.905 21.351 22.027
714
4.750 2.900
Sub-Total 400.000 137.891 537.891 Obras CREMA No-Financiadas 0 795.000 795.000
Total Proyecto 400.000 932.891 1.332.891
Se realizó una primera enmienda en el tercer trimestre de 2012 mediante la cual se reasignaron fondos a la Categoría 2 – Bienes – descontándolos de la Categoría 1 (b) – Contratos Crema Parte 1 (b) Como consecuencia de esta enmienda según se puede ver en el Cuadro siguiente el Monto del Proyecto pasó a 1.333,1 Millones de U$S, manteniéndose el monto aportado por el Banco en 400 Millones de U$S y el aporte de la DNV pasó a 933,1 Millones de U$S.
PRIMERA ENMIENDA Montos en miles de dólares PRESTAMO CONTRAPARTE LOCAL
Categoría % BIRF MONTO % DNV MONTO TOTAL
1(a). Contratos Crema – Parte 1(a) 1(b). Contratos Crema – Parte 1(b) 1(c). Obras en Puentes 1(d). Obras de Seguridad Vial 2. Bienes 3. Servicios de Consultoría, Capacitación y
Costos Operativos 7. Costo Unitario Elegible de Educación
74 74 74 74 70
100 100
106.000 251.250 15.800 16.300 3.000
4.750 2.900
26 26 26 26 30
0 0
37.243 88.277 5.551 5.727 1.286
0 0
143.243 349.527 21.351 22.027 4.286
4.750 2.900
Sub-Total 400.000 138.084 538.084 Obras CREMA No-Financiadas 0 795.000 795.000

28
PRESTAMO CONTRAPARTE LOCAL Total Proyecto 400.000 933.084 1.333.084
En Mayo de 2013 se llevó a cabo una segunda enmienda, y con el propósito de utilizar totalmente los fondos del Préstamo, se reasignaron fondos entre las distintas categorías, dando como resultado la matriz de financiamiento que se muestra en el siguiente cuadro:
SEGUNDA ENMIENDA Montos en miles de dólares
PRESTAMO CONTRAPARTE LOCAL Categoría % BIRF MONTO % DNV MONTO TOTAL
1(a). Contratos Crema – Parte 1(a) 1(b). Contratos Crema – Parte 1(b) 1(c). Obras en Puentes 1(d). Obras de Seguridad Vial 2. Bienes 3. Servicios de Consultoría, Capacitación y
Costos Operativos 7. Costo Unitario Elegible de Educación
74 74 74 74 70
100 100
106.000 281.500
7.800 1.300
0
500 2.900
26 26 26 26 30
0 0
37.243 98.905 2.741
457 0
0 0
143.243 380.405 10.541 1.757
0
500 2.900
Sub-Total 400.000 139.346 539.346 Obras CREMA No-Financiadas 0 795.000 795.000
Total Proyecto 400.000 934.346 1.334.346
2. CUMPLIMIENTO DE OBJETIVOS – COMPONENTES - INDICADORES
2.1 FÍSICOS 2.1.1 Contratos CREMA - Volúmenes de Aplicación del Proyecto Las Obras financiadas tuvieron la siguiente implementación:
f) Se continuó con la financiación de 7 contratos iniciados en el APL1, los cuales
totalizan una longitud de 1.236 Km g) Se contrataron 13 nuevas Mallas con un total de 2.091 Km.
De esta manera se cumplió con el objetivo total acumulando 20 contratos y 3.327 Km.
Se adjunta un cuadro con el detalle de las obras financiadas.
29
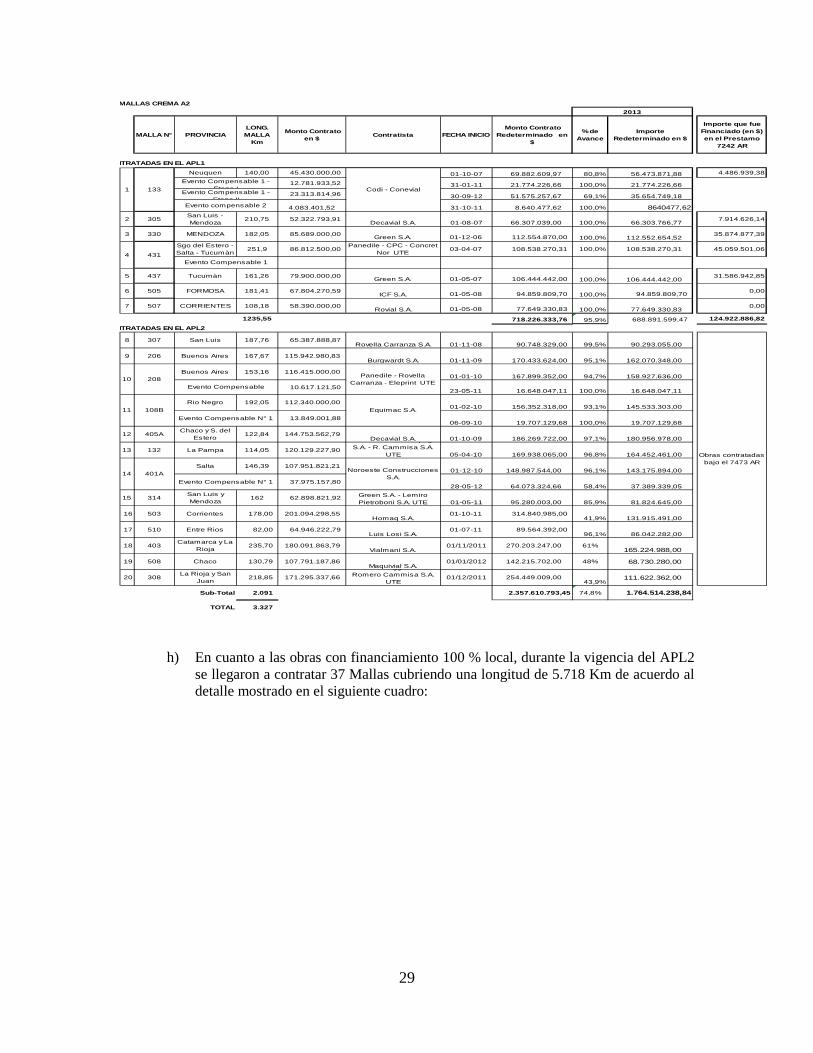
h) En cuanto a las obras con financiamiento 100 % local, durante la vigencia del APL2 se llegaron a contratar 37 Mallas cubriendo una longitud de 5.718 Km de acuerdo al detalle mostrado en el siguiente cuadro:
MALLAS CREMA A2
MALLA N° PROVINCIALONG. MALLA
Km
Monto Contrato en $ Contratista FECHA INICIO
Monto Contrato Redeterminado en
$
% de Avance
Importe Redeterminado en $
Importe que fue Financiado (en $) en el Prestamo
7242 AR
NTRATADAS EN EL APL1
Neuquen 140,00 45.430.000,00 01-10-07 69.882.609,97 80,8% 56.473.871,88 4.486.939,38
12.781.933,52 31-01-11 21.774.226,66 100,0% 21.774.226,66
23.313.814,96 30-09-12 51.575.257,67 69,1% 35.654.749,18
4.083.401,52 31-10-11 8.640.477,62 100,0% 8640477,62
2 305San Luis - Mendoza
210,75 52.322.793,91 Decavial S.A. 01-08-07 66.307.039,00 100,0% 66.303.766,77
7.914.626,14
3 330 MENDOZA 182,05 85.689.000,00 Green S.A. 01-12-06 112.554.870,00 100,0% 112.552.654,52 35.874.877,39
Sgo del Estero - Salta - Tucumàn
251,9 86.812.500,00 Panedile - CPC - Concret
Nor UTE03-04-07 108.538.270,31 100,0% 108.538.270,31 45.059.501,06
5 437 Tucumàn 161,26 79.900.000,00 Green S.A. 01-05-07 106.444.442,00 100,0% 106.444.442,00 31.586.942,85
6 505 FORMOSA 181,41 67.804.270,59 ICF S.A. 01-05-08 94.859.809,70 100,0% 94.859.809,70 0,00
7 507 CORRIENTES 108,18 58.390.000,00 Rovial S.A. 01-05-08 77.649.330,83 100,0% 77.649.330,83
0,00
1235,55 718.226.333,76 95,9% 688.891.599,47 124.922.886,82
NTRATADAS EN EL APL2
8 307 San Luis 187,76 65.387.888,87 Rovella Carranza S.A. 01-11-08 90.748.329,00 99,5% 90.293.055,00
9 206 Buenos Aires 167,67 115.942.980,83 Burgwardt S.A. 01-11-09 170.433.624,00 95,1% 162.070.348,00
Buenos Aires 153,16 116.415.000,00 01-01-10 167.899.352,00 94,7% 158.927.636,00
10.617.121,50 23-05-11 16.648.047,11 100,0% 16.648.047,11
Rio Negro 192,05 112.340.000,00 01-02-10 156.352.318,00 93,1% 145.533.303,00
13.849.001,88 06-09-10 19.707.129,68 100,0% 19.707.129,68
12 405AChaco y S. del
Estero122,84 144.753.562,79
Decavial S.A. 01-10-09 186.269.722,00 97,1% 180.956.978,00
13 132 La Pampa 114,05 120.129.227,90
a ca ba S Sapag S.A. - R. Cammisa S.A.
UTE 05-04-10 169.938.065,00 96,8% 164.452.461,00
Salta 146,39 107.951.821,21 01-12-10 148.987.544,00 96,1% 143.175.894,00
37.975.157,80 28-05-12 64.073.324,66 58,4% 37.389.339,05
15 314San Luis y Mendoza
162 62.898.821,92 Green S.A. - Lemiro Pietroboni S.A. UTE 01-05-11 95.280.003,00 85,9% 81.824.645,00
16 503 Corrientes 178,00 201.094.298,55 Homaq S.A.
01-10-11 314.840.985,00 41,9% 131.915.491,00
17 510 Entre Rios 82,00 64.946.222,79 Luis Losi S.A.
01-07-11 89.564.392,00 96,1% 86.042.282,00
18 403Catamarca y La
Rioja 235,70 180.091.863,79
Vialmani S.A.01/11/2011 270.203.247,00 61%
165.224.988,00
19 508 Chaco 130,79 107.791.187,86 Maquivial S.A.
01/01/2012 142.215.702,00 48% 68.730.280,00
20 308La Rioja y San
Juan 218,85 171.295.337,66
gg Romero Cammisa S.A.
UTE01/12/2011 254.449.009,00
43,9%111.622.362,00
Sub-Total 2.091 2.357.610.793,45 74,8% 1.764.514.238,84
TOTAL 3.327
2013
Obras contratadas bajo el 7473 AR
1 Codi - ConevialEvento Compensable 1 -
Etapa IEvento Compensable 1 -
Etapa IIEvento compensable 2
4Evento Compensable 1
133
431
10 208Evento Compensable
Panedile - Rovella Carranza - Eleprint UTE
108B11Evento Compensable N° 1
Equimac S.A.
14 401AEvento Compensable N° 1
Noroeste Construcciones S.A.

30
APL1 - PARTE A 3 DEL PRÉSTAMO 7242 AR (OBRAS NO FINANCIADAS)
MALLA N°
PROVINCIALONG. MALLA
Km.
Fecha de Replanteo
MONTO CONTRATO
ORIGINAL
MONTO CONTRATO
REDETERMINADO
Monto Certificado al 30-09-2013
Avance Financiero
1 204 Cordoba 155,39 01-02-07 $ 64.644.285,00 $ 69.942.862,03 $ 7.145.025,32 10% Obra rescind
2 303 La Rioja 237,92 01/08/06 $ 47.395.449,00 $ 56.012.568,15 $ 55.999.454,72 100%
3 309 La Rioja 300,75 01-07-06 $ 68.138.212,00 $ 85.932.798,91 $ 85.932.180,25 100%
4 313A Mendoza 113,11 01-04-07 $ 47.890.331,48 $ 61.908.567,00 $ 61.908.567,00 100%
5 313B Mendoza 145,79 01-08-06 $ 43.478.617,71 $ 52.618.402,44 $ 52.619.013,01 100%
6 501 Corrientes 144,33 01-08-06 $ 47.315.000,00 $ 57.431.679,79 $ 57.430.761,17 100%
7 513C Entre Rios 82,94 01-07-06 $ 43.557.560,00 $ 50.948.693,81 $ 50.948.680,45 100%
8 534 Corrientes 101,59 01-07-07 $ 70.907.025,00 $ 80.561.772,35 $ 80.564.288,68 100%
Total APL 1 1.282 $ 433.326.480,19 $ 515.357.344,48 $ 452.547.970,60 88%
APL 2 - PARTE A 3 DEL PRÉSTAMO 7473 AR (OBRAS NO FINANCIADAS)
MALLA N°
PROVINCIALONG. MALLA
Km.
Fecha de Replanteo
MONTO CONTRATO
ORIGINAL
MONTO CONTRATO
REDETERMINADO
Certificado al 30/09/2013
Avance Financiero
OBRAS CONTRATADAS
1 106 Neuquen 195,44 01/03/08 $ 96.032.007,28 $ 112.701.059,93 $ 112.695.237,74 100%2 107A Chubut 129,49 01/08/2009 $ 85.488.847,66 $ 103.793.390,22 $ 101.145.922,00 97%3 107B Chubut 135,47 01/11/07 $ 101.525.001,88 $ 127.516.109,96 $ 127.516.109,96 100%4 111 Neuquen 130,36 01/01/11 $ 75.276.598,77 $ 99.784.245,78 $ 42.045.244,00 42%5 123A Rio Negro 113,08 01/09/07 $ 68.181.443,07 $ 75.904.451,24 $ 75.904.451,24 100%6 140 Rio Negro 118,50 24/09/10 $ 146.326.051,05 $ 180.719.115,24 $ 176.056.854,00 97%7 202B Santa Fe 95 01/10/11 $ 190.503.765,68 $ 247.213.457,23 $ 188.898.446,00 76%
8 205Buenos Aires - Santa Fe 171,90 01/07/08 $ 184.047.017,82 $ 221.140.915,00 $ 192.381.439,75 87%
9 209C Santa Fe 161 01/10/11 $ 210.060.304,30 $ 268.580.722,00 $ 238.559.981,00 89%10 234 Buenos Aires 124,66 01/12/07 $ 103.686.188,60 $ 127.244.017,97 $ 126.866.492,87 100%11 311 La Rioja 282,51 02/01/08 $ 54.385.016,81 $ 63.888.021,31 $ 63.888.021,31 100%12 401B Salta 109,45 01/09/2009 $ 97.809.629,40 $ 121.409.986,56 119.096.582,00$ 98%13 406 Jujuy - Salta 205,05 01/06/08 $ 130.000.000,00 $ 184.360.546,28 $ 140.823.246,10 76%14 432 Jujuy 219,39 02/01/08 $ 107.197.059,37 $ 127.053.325,89 $ 126.541.900,03 100%15 434 Salta 159,29 01/11/07 $ 118.194.500,76 $ 163.847.804,44 $ 163.847.804,44 100%16 441 Catamarca 66,05 01/02/08 $ 80.380.800,15 $ 96.147.184,60 $ 94.526.959,03 98%17 502 Entre Rios 146,75 01/06/08 $ 142.917.962,24 $ 163.453.477,44 $ 163.453.477,46 100%18 504 Misiones 125,97 01/03/08 $ 105.468.997,00 $ 130.629.570,61 $ 130.627.369,91 100%19 531 Formosa 201,28 01/11/10 $ 126.604.416,50 $ 162.511.093,57 $ 133.898.557,00 82%20 533 Entre Rios 133,32 01/06/07 $ 83.958.620,97 $ 94.389.505,42 $ 94.386.561,00 100%21 536 Chaco 88,39 01/04/08 $ 99.950.800,00 $ 125.400.960,30 $ 125.400.960,30 100%22 539 Misiones 134,66 02/06/08 $ 104.969.263,25 $ 136.175.387,32 $ 136.173.204,53 100%23 603 Tierra del Fuego 178,98 01/10/07 $ 88.892.020,35 $ 103.872.481,07 $ 103.871.982,61 100%24 632 Chubut 159,62 01/09/07 $ 117.388.043,87 $ 142.225.991,46 $ 142.220.702,61 100%
25 211 Buenos Aires 139,62 01/01/13 $ 144.500.000,00 $ 188.408.916,00 $ 21.470.446,00 11%
26 120Buenos Aires y Rio Negro
202,61 15/06/12$ 139.805.977,00 $ 177.187.918,00 $ 80.546.709,00 45%
27 334 Mendoza 110,25 01/09/12 $ 78.888.879,29 $ 104.350.529,00 $ 30.413.713,00 29%28 630 Chubut 214,64 01/10/12 $ 209.672.559,00 $ 258.529.697,00 $ 49.140.219,00 19%29 634 Chubut 219,49 02/05/13 $ 224.779.440,36 $ 277.001.086,98 $ 21.556.906,00 8%30 402A Sgo del Estero 97,02 02/05/13 $ 50.911.489,00 $ 50.911.489,00 $ 6.807.919,00 13%31 130 Neuquen 172,11 En elaboración de Proyecto Ejecutivo32 212 Cordoba 203,25 $ 234.187.686,00 $ 234.187.686,00 $ 4.187.275,00 2%33 114 Rio Negro 144,3634 103 Rio Negro 236,0735 408 B Catamarca 176,6736 541 Chaco 88,9437 402 B S. del Estero 127,69
SUB-TOTAL 5.718 $ 3.801.990.387,43 $ 4.670.540.142,82 $ 3.334.950.693,89 71%
OBRAS A LICITAR
38 117 A La Pampa 134,4539 116 B La Pampa 124,440 302 San Juan 167,0141 301 San Luis 235,442 201 A Buenos Aires 112,83
Total en APL 2 = 6.492
Total en APL 1 = 1.282
TOTAL = 7.774

31
2.1.2 Evolución de los Km. atendidos por el Programa CREMA. Mostramos la evolución de la longitud atendida por dicho Sistema de Gestión el cual vemos que representó en promedio aproximadamente un 45 % de la Red Nacional Pavimentada No Concesionada (Actualmente de aprox. 24.000 Km). Observamos que el APL2 logró mantener el volumen de Km. bajo el sistema CREMA ante la finalización de los contratos de Programas anteriores, aunque no fue suficiente para aumentar la longitud total.
EVOLUCION DE LOS KM EN EL PROGRAMA CREMA
Año
CREMA 1
CREMA2 Año 2001
CREMA 2 Prestamo
4295
A1 Prestamo 7242
A2 Prestamos 7242 y
7473
A3 Prestamos 7242 y
7473
TOTAL
2006 3382 679 1609 3555 182 912 10.319
2007 2875 679 1609 3395 946 2286 11.790
2008 2536 0 1609 3395 1423 3922 12.885
2009 1637 0 1609 3259 1714 4161 12.380
2010 859 0 1609 3259 2482 4456 12.665
2011 0 0 526 1390 3196 4474 9.586
2012 0 0 526 1261 3327 4707 9.821
2013 0 0 387 1132 3145 5598 10.262
0
2,000
4,000
6,000
8,000
10,000
12,000
14,000
2006 2007 2008 2009 2010 2011 2012 2013
CREMA 1
CREMA2 Año 2001
CREMA 2 Prestamo4295
A1 Prestamo 7242
A2 Prestamos 7242 y7473
A3 Prestamos 7242 y7473
TOTAL
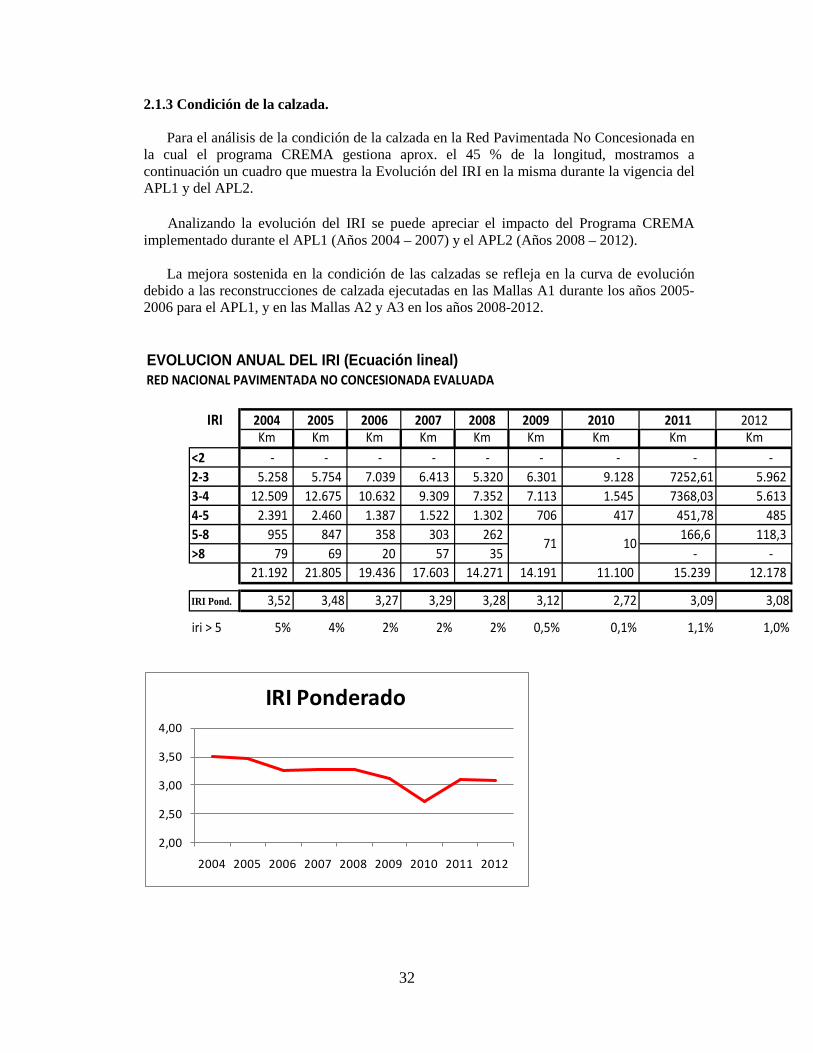
32
2.1.3 Condición de la calzada.
Para el análisis de la condición de la calzada en la Red Pavimentada No Concesionada en la cual el programa CREMA gestiona aprox. el 45 % de la longitud, mostramos a continuación un cuadro que muestra la Evolución del IRI en la misma durante la vigencia del APL1 y del APL2. Analizando la evolución del IRI se puede apreciar el impacto del Programa CREMA implementado durante el APL1 (Años 2004 – 2007) y el APL2 (Años 2008 – 2012).
La mejora sostenida en la condición de las calzadas se refleja en la curva de evolución
debido a las reconstrucciones de calzada ejecutadas en las Mallas A1 durante los años 2005-2006 para el APL1, y en las Mallas A2 y A3 en los años 2008-2012.
EVOLUCION ANUAL DEL IRI (Ecuación lineal)RED NACIONAL PAVIMENTADA NO CONCESIONADA EVALUADA
IRI 2004 2005 2006 2007 2008 2009 2010 2011 2012Km Km Km Km Km Km Km Km Km
<2 - - - - - - - - - 2-3 5.258 5.754 7.039 6.413 5.320 6.301 9.128 7252,61 5.962 3-4 12.509 12.675 10.632 9.309 7.352 7.113 1.545 7368,03 5.613 4-5 2.391 2.460 1.387 1.522 1.302 706 417 451,78 485 5-8 955 847 358 303 262 166,6 118,3 >8 79 69 20 57 35 - -
21.192 21.805 19.436 17.603 14.271 14.191 11.100 15.239 12.178
IRI Pond. 3,52 3,48 3,27 3,29 3,28 3,12 2,72 3,09 3,08
iri > 5 5% 4% 2% 2% 2% 0,5% 0,1% 1,1% 1,0%
71 10
2,00
2,50
3,00
3,50
4,00
2004 2005 2006 2007 2008 2009 2010 2011 2012
IRI Ponderado

33
2.1.4 Componente PUENTES
i) Obras. La actividad se inició tardíamente dentro del plazo del Préstamo. Recién en el 2010 se concretó la adjudicación y firma del primer contrato para las obras de restauración de un puente. En el año 2011 se firmaron otros cuatro contratos para la ejecución de cinco puentes y en el año 2013 casi al cierre del Préstamo se contrató otro puente acumulando de esta manera seis contratos para la ejecución de siete puentes. El avance de ejecución al 30-Set-2013 (cierre del Préstamo) arroja un acumulado de 52 % para todos los contratos. La DNV asumirá el 100% de los gastos que quedaran pendientes por ejecutar después del 30 de Setiembre de 2013 ya que las obras continuarán ejecutándose hasta su finalización. Se muestra a continuación el avance financiero de los contratos alcanzado al cierre del Préstamo.
j) Diseños de ingeniería para recuperación de 20 puentes. Esta actividad no se
realizó dado que la DNV optó por seguir licitando las obras con los proyectos que prepara el personal de la oficina de Puentes que luego el contratista ajusta para lograr la profundidad de fundación adecuada a los estudios de suelos que realice, elaborando un proyecto ejecutivo que es aprobado por dicha oficina de Puentes.
2.1.5 Componente SEGURIDAD VIAL
a) Corredores de Seguridad Vial.
Se había previsto inicialmente la ejecución de las obras en dos corredores: • Tramo Experimental La Pampa: • Tramo Experimental Corrientes:
Los contratos de consultoría para la elaboración de los diseños de ingeniería necesarios
para la implementación del Programa de ejecución de las obras y demás actividades conexas, se encontraban en desarrollo financiadas inicialmente con el APL1 y posteriormente con fondos locales. Se contaba con que se tendría el proyecto a tiempo para poder contratar las obras para un corredor, pero la entrega final de los proyectos por parte de las firmas consultoras recién se hizo efectivo a mediados del año 2013 ya cuando estaba por cerrar el APL2, no pudiéndose llevar a
OBRAS CONTRATADAS
PROVINCIA Original Redeterminado Ejecutado %
Ejecutado
1 Puente y accesos s/Río Los Alisos Jujuy 6.865.929,33 11.887.327,29 1.145.179,54 10%
2Puente y accesos s/Río Perico
Jujuy13.148.670,33 17.190.154,52 17.190.154,52 100%
3 Puentes y accesos s/Rio Malargue y s/ Arroyo Loncoche
Mendoza14.179.953,77 19.245.773,00 5.192.435,00 27%
4 Puente y accesos s/Rio SaladoSantiago del
Estero 11.731.735,94 14.933.535,21 12.978.773,73 87%
5 Puente y accesos s/Arroyo 3er Coronda Santa Fe 8.085.549,80 11.919.873,93 2.788.298,31 23%6 Puente y accesos s/Río Medina Tucuman 21.655.517,04 21.655.517,04 - 0%
Totales 75.176.663,95 39.294.841,10 52%
Monto del Contrato en $

34
cabo la experiencia de realizar las mejoras de seguridad vial en uno de los tramos, evaluando sus resultados.
b) Obras puntuales. En el primer llamado a licitación las ofertas no fueron aceptables, por lo que no fue posible la contratación de las obras. Ante una reformulación de los proyectos agrupando las obras de intervención en dos contratos, se llegó a formalizar un contrato en Julio de 2013, que comprende tres intervenciones puntuales en sendas intersecciones sobre la Ruta 11 en la Provincia de Chaco. Se detalla en el siguiente cuadro el avance al cierre del Préstamo:
Obra Inicio de la
Obra Situación de
la obra
Monto Contrato en
$AR
Monto Certificado al
30-Set-13 en $AR
Obras de Seguridad Vial en Ruta 11 – Provincia de Chaco
26-Agosto-13 Obra en ejecución 22,232,700
2,043,584
Las obras se siguen ejecutando y serán financiadas con fondos locales.
2.2 RENOVACION INSTITUCIONAL
a) Programa de Educación Secundaria y Terciaria en la DNV Se llevó a cabo el financiamiento del Costo Unitario Elegible de Educación en las Escuelas Técnicas de la DNV correspondiente a los años 2008, 2009, 2010, 2011 y 2012. Se había establecido como meta que al final del Proyecto estuvieran funcionando 4 escuelas con un total de 400 alumnos promovidos al siguiente nivel. Esto fue satisfactoriamente cumplido dado que el último año financiado por el Proyecto (2012) se contó con 5 Escuelas funcionado y el total de alumnos promovidos para ese año fueron 523, de acuerdo al siguiente detalle:
b) Fortalecimiento de la Capacidad Ambiental de la DNV
• Diseminación del MEGA. Esta actividad fue realizada con otra de las fuentes de financiación con que cuenta la DNV. Durante el año 2013 se llevaron a cabo 5 capacitaciones: (i) Buenos Aires (31/7 al 2/8); (ii) SS Jujuy (20 al 22/8); (iii) Santa Fe (3 al 5/9); (iv) San
Institución Alumnos Promovidos
Nivel Secundario Nivel Terciario TOTAL N° 1 - Oreste Casano 29 52 81 N° 2 - Juan Domingo Pio 0 56 56 N° 3 - Manuel Belgrano 245 50 295 N° 4 - Luis Barletta 7 47 54 N° 5 - Santa Cruz 0 37 37
523

35
Luis (17 al 19/9); y (v) Trelew (8 al 10/10). Cada capacitación se realizó durante un período de tres días, y fue atendida por un promedio de 30-40 participantes. El balance de esta capacitación fue muy positivo, no solo con una alta participación, sino por un gran interés tanto del personal de Vialidad, así como de otras agencias participantes.
• Estudio de Pasivos Ambientales. Esta actividad fue desarrollada por el consultor contratado que financia el Préstamo. Los informes producidos fueron oportunamente enviados al Banco, para su revisión por parte del especialista ambiental del Proyecto.
c) Soporte a la DNV sobre temas de Gestión Financiera
Por decisión de la DNV no se llevó adelante esta actividad. Los recursos asignados fueron reprogramados en el marco de la reasignación de fondos que elaboró la DNV dentro de la restructuración del proyecto efectuada luego de la Misión de MTR.
d) Asistencias Técnicas para completar Estudios Estratégicos.
Dentro de esta actividad se firmó un convenio de Hermanamiento para el manejo de la vialidad invernal (Fase III).
e) Mejora en el Sistema de Comunicación entre las Regiones.
Para la implementación se prepararon los documentos de licitación y
fueron aprobados por el Banco. Dado que la actividad requería de la compra de bienes en el exterior, en el contexto de restricciones a las importaciones al momento de iniciar el proceso de adquisición un contrato de esta naturaleza podría verse comprometido por lo que la DNV finalmente decidió no realizar la compra de los equipos de Video Conferencia.
2.3 FINANCIEROS
Los montos finales desembolsados en las distintas categorías financiadas por el Banco y aportados por la DNV se pueden apreciar en el siguiente cuadro.
MONTOS EN MILES DE U$S
CATEGORÍA BIRF DNV TOTAL 1a Contratos CREMA (iniciados en APL1) 106.991 37.592 144.583 1b Contratos CREMA APL2 1c Obras en Puentes 1d Obras de Seguridad Vial
282.829 6.020
0
99.372 2.115
0
382.201 8.135
0 2 Bienes 0 0 0 3 Servicios de Consultoría, Capacitación y costos operativos 469 0 469 4 Educación por costos unitarios 3.691 0 3.691 TOTAL 400.000 139.079 539.079

36
Vemos que el uso de los recursos financieros disponibles por el Banco se utilizaron en un 100 % La utilización de los fondos muestra una altísima incidencia de los componentes físicos que sumados representan el 98,9% del total de los fondos desembolsados por el Banco. En cuanto al progreso anual de los desembolsos se realizó de acuerdo al siguiente cuadro.
2.4 MONTOS DEL PROYECTO En el siguiente cuadro mostramos los Montos por componentes a invertir estimados inicialmente en el Programa y los resultantes al final.
AÑO Monto en Millones de U$S
ANUAL ACUMULADO
2009 63 63 2010 93 156 2011 79 235 2012 94 329 2013 71 400
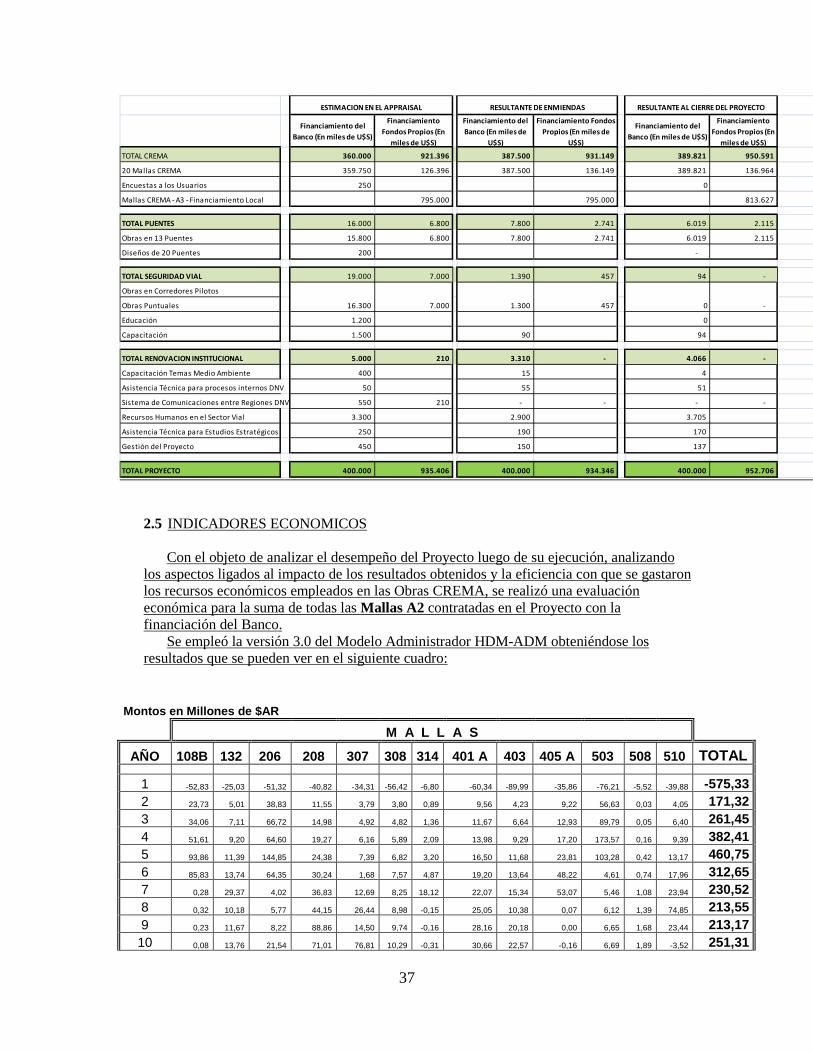
37
2.5 INDICADORES ECONOMICOS
Con el objeto de analizar el desempeño del Proyecto luego de su ejecución, analizando
los aspectos ligados al impacto de los resultados obtenidos y la eficiencia con que se gastaron los recursos económicos empleados en las Obras CREMA, se realizó una evaluación económica para la suma de todas las Mallas A2 contratadas en el Proyecto con la financiación del Banco.
Se empleó la versión 3.0 del Modelo Administrador HDM-ADM obteniéndose los resultados que se pueden ver en el siguiente cuadro:
Montos en Millones de $AR
M A L L A S
AÑO 108B 132 206 208 307 308 314 401 A 403 405 A 503 508 510 TOTAL
1 -52,83 -25,03 -51,32 -40,82 -34,31 -56,42 -6,80 -60,34 -89,99 -35,86 -76,21 -5,52 -39,88 -575,33 2 23,73 5,01 38,83 11,55 3,79 3,80 0,89 9,56 4,23 9,22 56,63 0,03 4,05 171,32 3 34,06 7,11 66,72 14,98 4,92 4,82 1,36 11,67 6,64 12,93 89,79 0,05 6,40 261,45 4 51,61 9,20 64,60 19,27 6,16 5,89 2,09 13,98 9,29 17,20 173,57 0,16 9,39 382,41 5 93,86 11,39 144,85 24,38 7,39 6,82 3,20 16,50 11,68 23,81 103,28 0,42 13,17 460,75 6 85,83 13,74 64,35 30,24 1,68 7,57 4,87 19,20 13,64 48,22 4,61 0,74 17,96 312,65 7 0,28 29,37 4,02 36,83 12,69 8,25 18,12 22,07 15,34 53,07 5,46 1,08 23,94 230,52 8 0,32 10,18 5,77 44,15 26,44 8,98 -0,15 25,05 10,38 0,07 6,12 1,39 74,85 213,55 9 0,23 11,67 8,22 88,86 14,50 9,74 -0,16 28,16 20,18 0,00 6,65 1,68 23,44 213,17 10 0,08 13,76 21,54 71,01 76,81 10,29 -0,31 30,66 22,57 -0,16 6,69 1,89 -3,52 251,31
Financiamiento del Banco (En miles de U$S)
Financiamiento Fondos Propios (En
miles de U$S)
Financiamiento del Banco (En miles de
U$S)
Financiamiento Fondos Propios (En miles de
U$S)
Financiamiento del Banco (En miles de U$S)
Financiamiento Fondos Propios (En
miles de U$S)
TOTAL CREMA 360.000 921.396 387.500 931.149 389.821 950.591
20 Mallas CREMA 359.750 126.396 387.500 136.149 389.821 136.964
Encuestas a los Usuarios 250 0
Mallas CREMA - A3 - Financiamiento Local 795.000 795.000 813.627
TOTAL PUENTES 16.000 6.800 7.800 2.741 6.019 2.115
Obras en 13 Puentes 15.800 6.800 7.800 2.741 6.019 2.115
Diseños de 20 Puentes 200 -
TOTAL SEGURIDAD VIAL 19.000 7.000 1.390 457 94 -
Obras en Corredores Pilotos
Obras Puntuales
Educación 1.200 0
Capacitación 1.500 90 94
TOTAL RENOVACION INSTITUCIONAL 5.000 210 3.310 - 4.066 -
Capacitación Temas Medio Ambiente 400 15 4
Asistencia Técnica para procesos internos DNV 50 55 51
Sistema de Comunicaciones entre Regiones DNV 550 210 - - - -
Recursos Humanos en el Sector Vial 3.300 2.900 3.705
Asistencia Técnica para Estudios Estratégicos 250 190 170
Gestión del Proyecto 450 150 137
TOTAL PROYECTO 400.000 935.406 400.000 934.346 400.000 952.706
16.300 7.000 0 -
ESTIMACION EN EL APPRAISAL RESULTANTE AL CIERRE DEL PROYECTORESULTANTE DE ENMIENDAS
1.300 457

38
11 -0,35 18,46 18,06 -0,49 9,47 10,70 -0,52 33,04 25,17 -0,40 16,14 1,90 -15,25 115,93 12 -3,40 25,14 -11,28 -0,79 22,80 11,23 -0,78 38,69 27,98 -0,76 -16,39 -2,87 -9,14 80,43 13 -14,80 7,79 -14,98 -1,33 9,67 11,89 -4,31 26,24 30,80 -2,03 10,53 4,60 0,48 64,55 14 -12,16 22,76 2,37 -3,54 25,81 12,67 0,08 31,93 33,92 -3,50 45,05 5,30 0,62 161,31 15 18,64 -1,50 30,47 -5,99 13,90 -2,62 0,09 130,22 37,06 -12,28 65,22 6,09 1,16 280,46 16 27,69 -2,23 49,71 -8,55 -7,71 18,14 0,13 7,18 40,12 -13,98 91,71 6,97 2,65 211,83 17 40,35 -3,06 83,11 -34,49 -12,33 19,35 0,34 1,54 78,39 0,77 134,42 7,97 4,82 321,18 18 58,17 -5,06 153,83 1,01 -13,64 20,66 0,60 1,47 19,98 1,36 100,61 9,08 8,20 356,27 19 107,12 -8,44 27,18 1,23 -3,27 22,29 0,88 1,37 38,79 2,47 135,78 10,33 14,09 349,82 20 40,91 -8,11 25,32 2,42 0,35 24,17 1,07 1,21 74,12 4,12 107,47 11,72 34,48 319,25
VAN ($x106) 175,94 52,25 283,84 118,57 50,03
6,80
9,24 98,33 45,70 58,66 358,69 7,91 49,53 $1.315
TIR 71% 39% 107% 49,10% 28% 13% 36% 29% 17% 46% 104% 20% 29% 46%
La muestra produce un Valor Actual Neto, al 12% de tasa de descuento, de $AR 1.315 Millones y una tasa de Rentabilidad Económica del 46% confirmándose que se produjo una Rentabilidad Económica aceptable para el subcomponente C.Re.Ma. el cual representó un 97 % del total del PRESTAMO.
En cuanto a los contratos que se financiaron con recursos económicos de fuente local en
las Obras CREMA, la evaluación económica se hizo para una muestra de 15 Mallas A3 contratadas en el Proyecto con financiación local, arrojando en siguiente resultado:
Montos en Millones de $AR
M A L L A S
AÑO 111 114 120 130 140 209 C 211 212 401 B 531 541 603 630 632 634 TOTAL
1 -38,90 -59,78 -56,23 -58,54 -92,73 -57,66 -70,03 -105,27 -60,55 -44,20 -67,70 -13,51 -99,92 -
46,31 -80,11
-951,44
2 7,21 22,61 16,47 12,13 17,32 1,59 28,41 21,27 16,45 3,04 11,32 1,52 6,11 5,96 12,53 183,94 3 11,87 28,65 21,26 15,35 24,86 3,54 34,67 32,18 20,54 4,11 13,19 1,85 7,80 7,68 16,27 243,82 4 17,54 35,51 26,82 19,02 34,39 6,37 42,90 44,29 25,07 5,39 15,55 2,26 9,61 9,58 20,15 314,45 5 24,42 45,81 32,84 28,37 46,51 9,73 53,89 57,94 29,95 6,87 18,40 2,71 11,48 21,01 90,71 480,64 6 32,70 60,92 39,39 26,56 61,54 13,64 69,02 73,96 35,13 8,42 21,79 3,19 13,45 36,22 4,77 500,70 7 42,58 79,51 46,65 69,36 154,78 18,17 90,47 92,77 40,47 7,21 25,52 3,75 34,76 20,43 5,44 731,87 8 54,25 181,74 54,67 61,27 -3,79 23,41 179,89 114,76 46,06 10,23 29,50 4,35 1,83 -1,71 6,15 762,61 9 67,85 55,75 63,77 10,01 -6,66 29,19 40,69 157,10 51,86 11,78 33,69 6,72 77,12 -2,19 40,32 637,00
10 105,93 -5,92 108,10 3,22 -10,34 56,85 115,39 134,36 57,38 13,50 37,80 4,56 -2,03 -5,59 -0,49 612,72 11 69,06 -8,21 22,44 3,11 -37,18 24,55 -4,34 170,39 62,37 20,52 41,73 19,97 7,52
-16,69 -0,67 374,57
12 14,74 -10,41 33,40 24,20 0,60 26,78 -7,82 76,97 67,64 23,10 62,68 -0,14 8,28 0,14 -1,32 318,84 13 24,23 -17,50 26,11 12,45 0,71 23,19 -12,75 13,49 80,39 34,04 33,23 -0,28 8,96 0,16 -2,20 224,23 14 70,46 -33,87 67,77 52,09 0,89 47,00 -18,49 29,67 45,85 42,74 49,91 -1,09 9,68 0,20 -3,17 359,64 15 -0,73 16,88 80,50 3,70 1,53 -0,26 -42,59 68,84 87,60 17,28 16,60 -2,28 2,32 0,31 -23,58 226,12
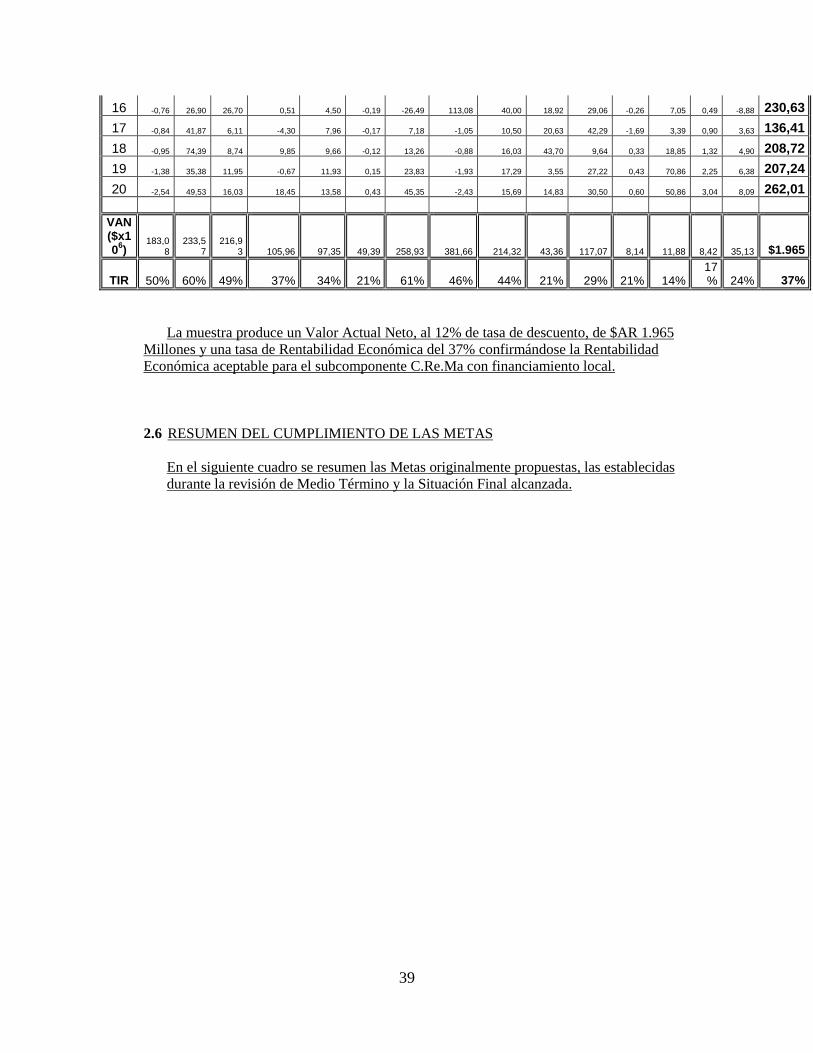
39
16 -0,76 26,90 26,70 0,51 4,50 -0,19 -26,49 113,08 40,00 18,92 29,06 -0,26 7,05 0,49 -8,88 230,63 17 -0,84 41,87 6,11 -4,30 7,96 -0,17 7,18 -1,05 10,50 20,63 42,29 -1,69 3,39 0,90 3,63 136,41 18 -0,95 74,39 8,74 9,85 9,66 -0,12 13,26 -0,88 16,03 43,70 9,64 0,33 18,85 1,32 4,90 208,72 19 -1,38 35,38 11,95 -0,67 11,93 0,15 23,83 -1,93 17,29 3,55 27,22 0,43 70,86 2,25 6,38 207,24 20 -2,54 49,53 16,03 18,45 13,58 0,43 45,35 -2,43 15,69 14,83 30,50 0,60 50,86 3,04 8,09 262,01
VAN ($x106)
183,08
233,57
216,93 105,96 97,35 49,39 258,93 381,66 214,32 43,36 117,07 8,14 11,88 8,42 35,13 $1.965
TIR 50% 60% 49% 37% 34% 21% 61% 46% 44% 21% 29% 21% 14% 17% 24% 37%
La muestra produce un Valor Actual Neto, al 12% de tasa de descuento, de $AR 1.965
Millones y una tasa de Rentabilidad Económica del 37% confirmándose la Rentabilidad Económica aceptable para el subcomponente C.Re.Ma con financiamiento local.
2.6 RESUMEN DEL CUMPLIMIENTO DE LAS METAS
En el siguiente cuadro se resumen las Metas originalmente propuestas, las establecidas durante la revisión de Medio Término y la Situación Final alcanzada.

40
3 COMENTARIO FINAL.
Lo hasta aquí expuesto resume por un lado el objetivo y los alcances del Proyecto y por otro los logros alcanzados y su comparación con lo previsto.
Han existido factores externos e internos al Proyecto que lo han afectado. Entre los
factores externos podemos mencionar como el más importante, el aumento de los costos de la obra vial, reflejado en el sistema de redeterminación de precios, y que trae siempre una respuesta del mercado que eleva los costos previstos, lo cual incide negativamente en el alcance de las metas físicas propuestas. En cuanto al factor interno que nos afectó, este fue el hecho de que durante el año 2011, de acuerdo a los resultados de la revisión del Proyecto a mediano plazo, resultó que por activación de las políticas de salvaguardas no contempladas en el Proyecto original, se retrasó el desarrollo de las contrataciones de las Mallas CREMA, afectando exclusivamente a aquellas financiadas con fondos locales, dado que su revisión y
41
aprobación por parte del Banco estuvo temporalmente suspendida hasta que fuera formalizada la aprobación de la 1ra Enmienda al Proyecto.
Los temas de Seguridad Vial, no llegaron a desarrollarse en la medida de lo esperado. En
este aspecto podemos señalar en primer lugar a las obras en los Corredores de Seguridad Vial que, como ya se mencionó, los proyectos no estuvieron concretados a tiempo para implementar las obras, además de que por el volumen de los mismos resultaron de un costo muy elevado para los presupuestos con que se contaba. En cuanto a las obras puntuales proyectadas, fracasaron los llamados a licitación en su primer intento, y al ser nuevamente licitadas, los contratos fueron tardíamente iniciados para su financiación dentro del Préstamo, continuándose actualmente con financiación local.
En cuanto a la Reforma Institucional de la DNV consideramos que se ha logrado avances
muy importantes en el Fortalecimiento de la Gestión Ambiental y en el funcionamiento de las Escuelas Técnicas de la DNV.
En efecto, se consolidó el funcionamiento de la División Gestión Ambiental a partir de su interacción con el Proyecto financiado con el Banco y se avanzó en la difusión del Manual de Gestión Ambiental al ámbito de todos los Distritos de la DNV en todo el país, haciéndolo extensivo a otros organismos gubernamentales. En cuanto a las Escuelas aparte de haber logrado superar los objetivos físicos, consideramos como muy valiosa la intervención del Banco, tanto en lo que respecta a los fondos del Préstamo utilizados en la actividad, como el aporte al desarrollo de la estructura educativa en las Escuelas, llevado a cabo por el especialista del Banco y los consultores contratados.
Por último queremos destacar que consideramos exitoso el desarrollo del Préstamo en
cuanto a los objetivos conseguidos y el uso de los fondos disponibles. Todo esto merced al desempeño del Banco, en especial a los funcionarios responsables de las supervisiones, los funcionarios de la DNV y los integrantes de la Unidad Coordinadora, quienes pusieron su empeño y conocimientos para salvar las dificultades que se presentaron a lo largo de la implementación del Proyecto.

42
Annex 8. Comments of Cofinanciers and Other Partners/Stakeholders Not applicable

43
Annex 9. List of Supporting Documents
1. The World Bank: Project Appraisal Document Report 28649, National Highway Asset Management Project, June 2004 (Phase 1).
2. The World Bank: Project Appraisal Document National Highway Asset Management Project, June 2007 (Phase 2)
3. The World Bank: Loan Agreement (Loan 7473-AR); June 2008
4. The World Bank: Country Assistance Strategy (with the Government of Argentina) 2006
5. The World Bank: Estrategia de Alianza con la Republica Argentina, Report No. 48476, May 2009
6. The World Bank: Aide memoires from 2010 to 2013
7. The World Bank: Implementation Completion and Results Report (APL1), 2011
8. Vialidad Nacional: Informe de Gestion 2008-2010
9. Ministerio de Planificacion Federal: Escuelas Viales de Vialidad Nacional (2012)
10. Vialidad Nacional – Information received from the Project Coordination Unit regarding: Roughness values (historic) and for 2011 and 2012, DNV historic annual budgets, Project Total Costs and Outputs by Component, HDM Economic Evaluation… October 2013
11. The World Bank: Transport Paper 36, September 2011 “Performance-Based Road Contracts. (CREMA). A Review of Fifteen Years’ Experience. 1996-2010” by M. Marcela Silva and Gerard Liautaud

LA PAMPA
S A NL U I S
S A N J U A N
L AR I O J A
SANTIAGODEL
ESTERO
ENTRE
JUJUY
S A L T A
F O R MO S A
CHACO
CORRIENTES
MISI ON ES
SANTAFE
RIOS
CORDOBA
CATAMARCA TUCUMAN
M E N D O Z A
NEUQUÉN
RÍO
NEGRO
CHUBUT
SANTA
CRUZ
TIERRADEL FUEGO
B U E N O SA I R E S
3
40S
3
288
281
40S
26
3
258
234
22
40S 3
22
251
250
22
15235
23
151
143
143
33
5
5
35
205
188
40S
40S
146
188
147
14240N
40N
20
141
148 158
8
9
178
8
9
33
38
150
79 38
60 9
19
98
157
9
64
34
343840N
95
8989
11
81
81
16
16
86
34
34
34
68
40N
9
12
12
12
12
12
12
14
14
14
123119
127
86
76 74
228
226
154
145
77
9
95
118
242
237
40S
25
3
3
Santiago
MontevideoBuenos Aires
Asunción
Cauchari
S.A. de los Cobres
Pocitos
El Tunal
Olleros
Las Lomitas
Cmte. FontanaClorinda
Pres. R. Saenz Peña
LasFrentones
Concordia
VillaguayNogoyá
Gral.Galarzo Concepción del Uruguay
P. Fernandez
Paso de los Libres
Yapeyú
Santo Tomé
San José
SanVicente
Bernardo de Irigoyen
Pt.Iguazú
28 deNoviembre
El Salado
Très Lagos
Chilecito
Patquía
ChamicalP. del
Agua Negro
Jachal
Rosario
CafayateCampo Gallo
Tinogasta
AlpasincheLavalle Añatuya
Villa de María
TostadoVera
San Cristobal
RafaelaDevoto
Rosario
ChabasNicolás
Río Cuarto
La Cautiva
Villa María
Dolores
QuinesLa
Tranca
Chepes
El AlperoLas Cuevas
Agrelo
Pareditas
Mercedes
San RafaelGr. Alvear Nva. Galia
El Sosneado
Malargüe Arizona
Sta. Isabel Telén
Realicó
RufinoGral.
Villegas
Pehuajo
Bolívar
Arrecifes
Campana
Junín
AzulMaipú
Mar del Plata
Quequén
Très Arroyos
Bahia Blanca
Gral. Acha
El Carancho
LaAdela
Puelén
Barrancas
Zapala
CollónCurá
Bariloche
Sierra Colorada
Ing. Jacobacci Sierra Grande
TrelewEsquel
Rio MoyoSarmiento
Comodoro Rivadavia
Las Heras
Fitz Roy
Pto. Deseado
Las Horquetas
Gr. Conesa
La Cuiaca
Aguas Blancas
San Ramon
SantaSylvina
Sauce de Luna
ChoeleChoel
PA
CIF
IC
O
CE
AN
A T L A N T I C
O C E A N
A DISPUTE CONCERNING SOVEREIGNTY OVER THEISLANDS EXISTS BETWEEN ARGENTINA WHICH CLAIMSTHIS SOVEREIGNTY AND THE U.K. WHICH ADMINISTERSTHE ISLANDS.
FALKLAND ISLANDS(ISLAS MALVINAS)
Rio
Pilcomayo
Rio
Para
ná
Rio
Para
ná
Rio
Uru
guay
R i od e l aP l a t a
SaladoRio
Rio
ColoradoRio Negro
Rio Chubut
Rio
Chic
o
Rio Deseado
Rio Santa Cruz
Gulf ofSan Jorge
Gulf ofSan Martin
70° 60° 55°
25°
30°
35°
50°
40°
45°
50°
55°
55° 50° 45°60°65°70°75°80°
55°
50°
80°
45°
40°
35°
30°
25°
75°
P A R A G U A Y
B R A Z I L
B O L I V I A
CH
IL
E
U R U G U A Y
Ushuaia
Río Gallegos
Rawson
Viedma
Neuquén
Santa Rosa
MendozaSan Luis
Córdoba Santa Fé
Paraná
Corrientes
PosadasResistenciaSantiagodel Estero
Tucumán
Catamarca
La Rioja
San Juan
Salta
San Salvadorde Jujuy
Formosa
Puerto Madryn
La Plata
0 250 500 750
KILOMETERS
NATIONAL ROADS
SELECTED CITIES
PROVINCE CAPITALS
NATIONAL CAPITALS
PROVINCE BOUNDARIES
INTERNATIONAL BOUNDARIES
ROADS REHABILITATED AND MAINTAINED UNDER NATIONAL HIGHWAYASSET MANAGEMENT PROJECT — CREMA SYSTEM — LOAN 7242
ROADS REHABILITATED AND MAINTAINED UNDERPROVINCIAL ROAD INFRASTRUCTURE PROJECT — LOAN 7301
ROADS REHABILITATED AND MAINTAINED UNDERCÓRDOBA PROVINCIAL ROAD INFRASTRUCTURE PROJECT — LOAN 7398
ROADS REHABILITATED UNDER BUENOS AIRES INFRASTRUCTUREPROJECT — LOAN 7268 ROADS IMPROVED BY SANTA FE ROAD INFRASTRUCTURE PROJECT — LOAN 7429
ARGENTINAWORLD BANK ROAD PROJECTS
IBRD 35301MARCH 2007
This map was produced by the Map Design Unit of The World Bank. The boundaries, colors, denominations and any other information shown on this map do not imply, on the part of The World Bank Group, any judgment on the legal status of any territory, o r any endo r s emen t o r a c c e p t a n c e o f s u c h boundaries.

Ushuaia
Río Gallegos
Rawson
Viedma
Neuquén
Santa Rosa
MendozaSanLuis
CórdobaSantaFé
Paraná
CorrientesPosadasResistencia
Santiagodel Estero
Tucumán
Catamarca
La Rioja
San Juan
Salta
San Salvadorde Jujuy
Formosa
La Plata Montevideo
Buenos Aires
Asunción
Santiago
28 deNoviembre
Très Lagos
Las Horquetas
El Salado
Pto. Deseado
Fitz Roy
Las Heras
RioMoyo
SarmientoComodoro Rivadavia
TrelewPuerto Madryn
Esquel
Ing. JacobacciSierra
Grande
SierraColorada
Bariloche
CollónCurá
Zapala
Gr. Conesa
ChoeleChoel
LaAdela
Bahia Blanca
Très Arroyos
Quequén
Mar del Plata
PuelénEl Carancho
Barrancas Gral. Acha
TelénSta. Isabel
Realicó
ArizonaMalargüeEl Sosneado
Nva.GaliaGr.
Alvear
Mercedes
San Rafael
Pareditas
Agrelo
Las Cuevas ElAlpero
MaipúAzul
Bolívar
Pehuajo
Junín
ArrecifesCampana
Nicolás
RufinoGral.Villegas
La Cautiva
RíoCuarto
Dolores
QuinesVilla María
RosarioGral. Galarzo
Concepcióndel Uruguay
NogoyáVillaguay
ConcordiaSauce de Luna
Chabas
DevotoRafaela
SanCristobal
Vera
Villa deMaría
Tostado
Añatuya
SantaSylvina
P. Fernandez
Yapeyú
Paso de los Libres
Santo Tomé
San José
SanVicente
Bernardo deIrigoyen
Pt.Iguazú
Campo Gallo
LasFrentones
Pres. R. Saenz Peña
Cmte.Fontana Clorinda
Las Lomitas
LaTranca
Chepes
P. delAgua Negro
JachalChamical
Patquía
Chilecito
TinogastaAlpasinche Lavalle
Cafayate
El Tunal Olleros
S.A. de losCobres
Cauchari
San Ramon
PocitosLa Cuiaca
AguasBlancas
603
107B
632
114
106
120
111
211
201A
201B
205
311
441
401B
406432
434
536
209C
539
504
502
510
506
533
107A
113
133
108B
208
206
132
212
305
330
307 230
532
507
503
505
405A
437 431
401A
603
107B
107A
113
632
114
106
120
111
211
201A
201B
205
311
441
401B
406432
434
536
209C
539
504
502
510
506
533
133
108B
208
206
132
212
305
330
307 230
532
507
503
505
405A
437 431
401A
3
40S
3
288
281
40S
26
3
234
22
40S 3
22
251
250
22
152 35
2
3
151
143
143 33
5
5
35
36
205
188
18840S
146
146
188
147
14240N
40N
20
141
158
88
7
7
79
9
178
173
8
933
38
150150
79
79
38
38
60
60
60
60
9
19
18
1819
98
98157
157
9
9
64
34
34
343840N
95
8989
11
1181
81
16
16
86
34
34
34
68
51
50
51
52
40N
9
9
12
12
12
12
12
12
12
14
14
14
14
123119
127
136
130
86
76 74
75
228
226
154
77
9
95
95
118120
105
242
237
40S
25
3
3
23
3
260
40S
1S40
231
3
250
143
144
226
7
12
20
11
101
151
28 deNoviembre
Très Lagos
Las Horquetas
El Salado
Pto. Deseado
Fitz Roy
Las Heras
RioMoyo
SarmientoComodoro Rivadavia
TrelewPuerto Madryn
Esquel
Ing. JacobacciSierra
Grande
SierraColorada
Bariloche
CollónCurá
Zapala
Gr. Conesa
ChoeleChoel
LaAdela
Bahia Blanca
Très Arroyos
Quequén
Mar del Plata
PuelénEl Carancho
Barrancas Gral. Acha
TelénSta. Isabel
Realicó
ArizonaMalargüeEl Sosneado
Nva.GaliaGr.
Alvear
Mercedes
San Rafael
Pareditas
Agrelo
Las Cuevas ElAlpero
MaipúAzul
Bolívar
Pehuajo
Junín
ArrecifesCampana
Nicolás
RufinoGral.Villegas
La Cautiva
RíoCuarto
Dolores
QuinesVilla María
RosarioGral. Galarzo
Concepcióndel Uruguay
NogoyáVillaguay
ConcordiaSauce de Luna
Chabas
DevotoRafaela
SanCristobal
Vera
Villa deMaría
Tostado
Añatuya
SantaSylvina
P. Fernandez
Yapeyú
Paso de los Libres
Santo Tomé
San José
SanVicente
Bernardo deIrigoyen
Pt.Iguazú
Campo Gallo
LasFrentones
Pres. R. Saenz Peña
Cmte.Fontana Clorinda
Las Lomitas
LaTranca
Chepes
P. delAgua Negro
JachalChamical
Patquía
Chilecito
TinogastaAlpasinche Lavalle
Cafayate
El Tunal Olleros
S.A. de losCobres
Cauchari
San Ramon
PocitosLa Cuiaca
AguasBlancas
Ushuaia
Río Gallegos
Rawson
Viedma
Neuquén
Santa Rosa
MendozaSanLuis
CórdobaSantaFé
Paraná
CorrientesPosadasResistencia
Santiagodel Estero
Tucumán
Catamarca
La Rioja
San Juan
Salta
San Salvadorde Jujuy
Formosa
La Plata Montevideo
Buenos Aires
Asunción
Santiago
TIERRADEL FUEGO
SANTACRUZ
CHUBUT
RÍONEGRO
NEUQUÉN
LA PAMPA
MENDOZA SANLUIS
CORDOBA
ENTRERIOS
CORRIENTES
MIS
IONES
SANTAFÉ
CHACO
SALTA
JUJUY
CATAMARCA
LA RIOJA
SAN JUAN
TUCUMÁNSANTIAGO
DELESTERO
FORMOSA
BUENOSAIRES
C H I L E
U R U G U A Y
B R A Z I L
B R A Z I LP A R A G U A Y
B O L I V I A
FALKLAND ISLANDS (ISLAS MALVINAS)A DISPUTE CONCERNING SOVEREIGNTY OVER THE
ISLANDS EXISTS BETWEEN ARGENTINA WHICH CLAIMSTHIS SOVEREIGNTY AND THE U.K. WHICH ADMINISTERS
THE ISLANDS.
PA
CIF
IC
O
CE
AN
A T L A N T I CO C E A N
Riode laPlata
Gulf ofSan Martin
Gulf ofSan Jorge
Rio Santa Cruz
Rio Deseado
Rio
Chic
o
Rio Chubut
Rio Negro
Rio
Colorado
Rio Salado
Pilcomayo
Rio
Rio
Para
ná
Rio
U
rugu
ay
Rio
Para
ná
50°
80°75°
80° 75° 70° 65° 60° 55° 50° 45°
55°
50°
45°
40°
35°
30°
25°
55°60°70°
25°
30°
35°
40°
45°
50°
55°
This map was produced by the Map Design Unit of The World Bank. The boundaries, colors, denominations and any other information shown on this map do not imply, on the part of The World Bank Group, any judgment on the legal status of any territory, or any endorsement or acceptance of such boundaries.
ARGENTINAAPL2 NATIONAL HIGHWAYS
AND ASSET MANAGEMENT PROJECTC.RE.MA. NETWORKS TO BE FINANCEDBY LOAN AND COUNTERPART FUNDS
C.RE.MA. NETWORKS TO BE FINANCEDBY COUNTERPART FUNDS
SELECTED CITIES AND TOWNS
DISTRICT CAPITALS
NATIONAL CAPITAL
RIVERS
NATIONAL ROADS
DISTRICT BOUNDARIES
INTERNATIONAL BOUNDARIES
KILOMETERS
0 250125
IBRD 35505
MAY 2007