Embed Size (px)
Citation preview

1 UK Power Networks (Operations) Limited. Registered in England and Wales. Registered No. 3870728. Registered Office: Newington House, 237 Southwark Bridge Road, London, SE1 6NP
Document 5 Asset Category – 132kV Switchgear SPN
Asset Stewardship Report 2014
Richard Gould

Asset Stewardship Report 2014 SPN 132kV Switchgear Version 2.0 All of the cost numbers displayed in this document are before the application of on-going efficiencies and real price effects.
2 UK Power Networks (Operations) Limited. Registered in England and Wales. Registered No. 3870728. Registered Office: Newington House, 237 Southwark Bridge Road, London, SE1 6NP
Approved by Richard Wakelen / Barry Hatton
Approved Date 03/03/2014
Document History
Version Date Details Originator Revision Class
Section Update
1.0 17/02/2014 July 2013 Submission
Richard Gould
1.1 17/02/2014 Expenditure tables and charts updated with 19th February NAMP figures
Richard Gould
Major Header, 1.1, 1.3, 1.5, 7.4, 7.5, Appendix 5
1.2 20/02/2014 Updated Appendix 7 with list of scheme papers and added Appendices 8-10
Richard Gould
Minor 1.1, Appendix 7, 8, 9, 10
1.3 24/02/2014 Updated HI Profiles and added Preface
Richard Gould
Minor 7.2, 7.8, Appendix 2
1.4 26/02/2014 Figure and table numbers added to Appendices. Network risk removed from section 7.8.
Richard Gould
Minor 7.8, Appendix 1-10
1.5 03/03/2014 Paragraph added to end of section 1.3
Richard Gould
Minor 1.3
1.6 05/05/2014 HI Profiles updated
Richard Gould
Minor 7.2, 7.8, Appendix 2
2.0 05/05/2014 Final Version Richard Gould

Asset Stewardship Report 2014 SPN 132kV Switchgear Version 2.0 All of the cost numbers displayed in this document are before the application of on-going efficiencies and real price effects.
3 UK Power Networks (Operations) Limited. Registered in England and Wales. Registered No. 3870728. Registered Office: Newington House, 237 Southwark Bridge Road, London, SE1 6NP
Preface
UK Power Networks uses Asset Stewardship Reports (‘ASR’) to describe the optimum asset
management strategy and proposals for different groups of assets. This optimised asset
management strategy and plan details the levels of investment required and the targeted
interventions and outputs needed. Separate ASRs define the most efficient maintenance and
inspection regimes needed and all documents detail the new forms of innovation which are
required to maximise value, service and safety for all customers and staff throughout the
ED1 regulatory period. Outline proposals for the ED2 period are also included.
Each DNO has a suite of approximately 20 ASR’s. Although asset policy and strategy is
similar for the same assets in each DNO the detailed plans and investment proposals are
different for each DNO. There are also local issues which must be taken into account.
Accordingly each DNO has its own complete set of ASR documents.
A complete list of titles of the ASR’s, a summary of capex and opex investment is included in
‘Document 20: Asset Stewardship Report: Capex/Opex Overview’. This document also
defines how costs and outputs in the various ASR’s build up UK Power Networks ‘NAMP’
(Network Asset Management Plan) and how the NAMP aligns with Ofgem’s ED1 RIGs
tables and row numbers.
Where ‘HI’ or asset ‘Health Index’ information is included please note predicted ED1 profiles
are before any benefits from ‘Load driven investment.’
This ASR has also been updated to reflect the feedback from Ofgem on our July 2013 ED1
business plan submission. Accordingly to aid the reader three additional appendices have
been added. They are;
1. Appendix 8 - Output NAMP/ED1 RIGS reconciliation: This section explains the
‘line of sight’ between the UKPN Network Asset Management Plan (NAMP) and the
replacement volumes contained in the Ofgem RIGS tables. The NAMP is the UKPN
ten year rolling asset management investment plan. It is used as the overarching
plan to drive both direct and indirect Capex and Opex interventions volumes and
costs. The volume and cost data used in this ASR to explain our investment plan is
taken from the UK Power Networks NAMP. Appendix 8 explains how the NAMP
outputs are translated into the Ofgem RIGS tables. The translation of costs from the
NAMP to the ED1 RIGS tables is more complex and it is not possible to explain this
in a simple table. This is because the costs of project in the ‘NAMP’ are allocated to a
wide variety of tables and rows in the RIGS. For example the costs of a typical
switchgear replacement project will be allocated to a range of different Ofgem ED1
RIGs tables and rows such as CV3 (Replacement), CV5 (Refurbishment) CV6 (Civil
works) and CV105 (Operational IT Technology and Telecoms). However guidance
notes of the destination RIGs tables for NAMP expenditure and included in the table
in the Section 1.2 of the Executive Summary of each ASR.

Asset Stewardship Report 2014 SPN 132kV Switchgear Version 2.0 All of the cost numbers displayed in this document are before the application of on-going efficiencies and real price effects.
4 UK Power Networks (Operations) Limited. Registered in England and Wales. Registered No. 3870728. Registered Office: Newington House, 237 Southwark Bridge Road, London, SE1 6NP
2. Appendix 9 – Efficiency benchmarking with other DNO’s: This helps to inform
readers how UK Power Networks is positioned from a benchmarking position with
other DNO’s. It aims to show why we believe our investment plans in terms of both
volume and money is the right answer when compared to the industry, and why we
believe our asset replacement and refurbishment investment proposals are efficient
and effective and in the best interest for our customers.
3. Appendix 10 – Material changes since the July 2013 ED1 submission: This
section shows the differences between the ASR submitted in July 2013 and the ASR
submitted for the re-submission in March 2014. It aims to inform the reader about the
changes made to volumes and costs as a result of reviewing the plans submitted in
July 2013. Generally the number of changes made is very small, as we believe the
original plan submitted in July 2013 meets the requirements of a well justified plan.
However there are areas where we have identified further efficiencies and
improvements or recent events have driven us to amend our plans to protect
customer safety and service.
We have sought to avoid duplication in other ED1 documents, such as ‘Scheme Justification Papers’, by referring the reader to key issues of asset policy and asset engineering which are included in the appropriate ASR documents.

Asset Stewardship Report 2014 SPN 132kV Switchgear Version 2.0 All of the cost numbers displayed in this document are before the application of on-going efficiencies and real price effects.
5 UK Power Networks (Operations) Limited. Registered in England and Wales. Registered No. 3870728. Registered Office: Newington House, 237 Southwark Bridge Road, London, SE1 6NP
Contents Document History ................................................................................................................. 2
1.0 Executive Summary SPN 132kV Switchgear .............................................................. 7
1.1 Scope 7
1.2 Investment Strategy 7
1.3 ED1 Proposals 8
1.4 Innovation 8
1.5 Risks and Opportunities 8
2.0 Description of 132kV Switchgear Population .............................................................. 9
2.1 132kV Switchgear 9
3.0 Investment Drivers ................................................................................................... 10
3.1 Investment Drivers 10
3.2 Condition Measurements 14
4.0 Asset Assessment .................................................................................................... 15
4.1 Asset Health 15
4.2 Asset Criticality 16
4.3 Network Risk 17
4.4 Data Validation 17
4.5 Data Quality 17
5.0 Intervention policies .................................................................................................. 18
5.1 Interventions: Description of Intervention Options 18
5.2 Policies: Selecting Preferred Interventions 20
6.0 Innovation ................................................................................................................. 22
7.0 ED1 Expenditure Requirements for 132kV Switchgear ............................................. 22
7.1 Method 22
7.2 Constructing the plan 22
7.3 Additional Considerations 23
7.4 Asset Volumes and Expenditure 24
7.5 Commentary 25
7.6 Sensitivity Analysis and Plan Validation 25
7.7 Model Testing 27
7.8 Network Risk 28
8.0 Deliverability ............................................................................................................. 28
Appendices ......................................................................................................................... 30
Appendix 1 – Age Profiles 30

Asset Stewardship Report 2014 SPN 132kV Switchgear Version 2.0 All of the cost numbers displayed in this document are before the application of on-going efficiencies and real price effects.
6 UK Power Networks (Operations) Limited. Registered in England and Wales. Registered No. 3870728. Registered Office: Newington House, 237 Southwark Bridge Road, London, SE1 6NP
Appendix 2 – HI and Criticality Profiles 31
Appendix 3 – Fault Data 32
Appendix 4 – WLC Case Studies 33
Appendix 5 – NLRE Expenditure Plan 34
Appendix 6 – Sensitivity Analysis 36
Appendix 7 – Named Schemes 39
Appendix 8 – Output NAMP/ED1 Business Plan Data Table Reconciliation .................... 40
Appendix 9 – Efficiency Benchmarking with other DNOs 41
Appendix 10 – Material changes since the July 2013 ED1 submission ............................ 42

Asset Stewardship Report 2014 SPN 132kV Switchgear Version 2.0 All of the cost numbers displayed in this document are before the application of on-going efficiencies and real price effects.
7 UK Power Networks (Operations) Limited. Registered in England and Wales. Registered No. 3870728. Registered Office: Newington House, 237 Southwark Bridge Road, London, SE1 6NP
1.0 Executive Summary SPN 132kV Switchgear
1.1 Scope
This document details UK Power Networks’ NLRE investment proposals for 132kV
switchgear for the RIIO-ED1 period. Indicative proposals for the ED2 period are also
included.
In total there are 201 items of 132kV Switchgear with an estimated MEAV of £161m.
The proposed investment including civils is £2.4m per annum, equating to an
average annual 1.5% of the MEAV for this asset category.
Replacement and refurbishment costs along with the Network Asset Management
Plan (NAMP) lines for these assets during ED1 can be seen in Table 1. Appendix 8
contains a reconciliation between NAMP volumes and RIGs volumes.
Investment type
ED1 total expenditure
NAMP line
RIGs reference
Replacement £13.8m 1.48
Additions
CV3 Row 96 - 132kV CB (Air Insulated Busbar)(ID)(GM)
CV3 Row 97 - 132kV CB (Air Insulated Busbar)(OD)(GM)
CV3 Row 98 - 132kV CB (Gas Insulated Busbar)(ID)(GM)
CV3 Row 99 - 132kV CB (Gas Insulated Busbar)(OD)(GM)
CV3 Row 100 132kV switchgear (other)
Removals
CV3 Row 224 - 132kV CB (Air Insulated Busbar)(ID)(GM)
CV3 Row 225 - 132kV CB (Air Insulated Busbar)(OD)(GM)
CV3 Row 226 - 132kV CB (Gas Insulated Busbar)(ID)(GM)
CV3 Row 227 - 132kV CB (Gas Insulated Busbar)(OD)(GM)
Legal and
Safety
£0.1m 1.48
CV8 Multiple lines
Table 1 – Investment plan
Source: 21st February 2014 ED1 Business Plan Data Tables
*Expenditure on this asset type is also included in CV6 Civils and CV3 Underground
Cables.
A full list of abbreviations is included in Section 6.0 of Document 20: Capex Opex
overview.
1.2 Investment Strategy
The investment plan for ED1 for 132kV switchgear has been developed using the
Asset Risk and Prioritisation (ARP) model. The plan focuses on items of switchgear
in poor condition or those that provide poor service and reliability – not items of
switchgear that are old. This is shown in Figure 4, where older assets remain on the
network because there are no defects recorded against them.

Asset Stewardship Report 2014 SPN 132kV Switchgear Version 2.0 All of the cost numbers displayed in this document are before the application of on-going efficiencies and real price effects.
8 UK Power Networks (Operations) Limited. Registered in England and Wales. Registered No. 3870728. Registered Office: Newington House, 237 Southwark Bridge Road, London, SE1 6NP
The strategy for selecting the level of investment has been to maintain the same level
of risk throughout the period. This has been done by keeping the number of HI4 and
HI5s at the start and end of the period at similar levels.
1.3 ED1 Proposals
Appendix 9 benchmarks our ED1 proposals with reference to other DNOs July 2013
submissions. It shows that for EHV Switchgear we are proposing to replace 21% of
our assets while other DNOs were seeking funding to replace 14% of these assets
on average. This demonstrates the effectiveness of our asset risk management
systems and the value for money of our proposals.
1.4 Innovation
As mentioned in section 1.2, the ARP model has been used to develop the
investment plan. ARP, which has been created for 132kV Switchgear as well as other
asset categories, is industry leading and uses environment, condition and
manufacturer/model information to determine a HI for every asset both now and in
the future. This has been developed with EA Technology.
The model is able to calculate a criticality index for every asset as well as a risk value
in monetary terms, but this part is still in development. The risk for individual assets
has not been looked at in this way before.
1.5 Risks and Opportunities
Description of similarly likely opportunities or risks arising in ED1 period
Level of (uncertainties)/cost growth (£m)
Opportunity Refurbishment option becomes available instead of replacement on one site.
(0.7)
Risk
Average initial life used in ARP model over optimistic, leading to an increase of 1% in total number of HI4 and HI5s (Section 7) and more interventions are required.
1.5
Opportunity
Average initial life used in ARP model under optimistic, leading to an decrease of 3.5% in total number of HI4 and HI5s (Section 7) and more interventions are required.
(5.2)
Table 2 – Risk and opportunities

Asset Stewardship Report 2014 SPN 132kV Switchgear Version 2.0 All of the cost numbers displayed in this document are before the application of on-going efficiencies and real price effects.
9 UK Power Networks (Operations) Limited. Registered in England and Wales. Registered No. 3870728. Registered Office: Newington House, 237 Southwark Bridge Road, London, SE1 6NP
2.0 Description of 132kV Switchgear Population
2.1 132kV Switchgear
There are 201 circuit breakers currently operating at 132kV on the network. These
are distributed across 37 substation sites with 44 units installed at indoor locations
and 157 outdoor locations. These are split into the four categories of switchgear as
shown in Table 3.
Switchgear arc extinction method Population
Bulk oil 36
SF6 104
GIS 34
Air blast 27
Table 3 – 132kV Switchgear types
Source: ARP Model 27th November 2012
As seen in the age profile in Figure 1, there was a large amount of investment pre
1970s and during the 1990s and 2000s. Of the pre-1970s switchgear, there are 27
air blast circuit breakers and 35 bulk oil circuit breakers. The average age of the
switchgear on the network is 24 years. The oldest 10% these assets have an
average age of 54 years.
Figure 1 – 132kV Switchgear age profile
Source: 2012 RIGs V5
The NAMP lines used for 132kV switchgear capital expenditure can be seen in Table
4.
0.00
5.00
10.00
15.00
20.00
25.00
30.00
19
56
19
59
19
62
19
65
19
68
19
71
19
74
19
77
19
80
19
83
19
86
19
89
19
92
19
95
19
98
20
01
20
04
20
07
20
10
Vo
lum
e o
f Sw
itch
gear
Year of manufacture

Asset Stewardship Report 2014 SPN 132kV Switchgear Version 2.0 All of the cost numbers displayed in this document are before the application of on-going efficiencies and real price effects.
10 UK Power Networks (Operations) Limited. Registered in England and Wales. Registered No. 3870728. Registered Office: Newington House, 237 Southwark Bridge Road, London, SE1 6NP
NAMP line Description
1.48.01 Replace 132kV/66kV switchgear
1.48.05 Replace with 132kV indoor open terminal CB
1.48.06 Replace with 132kV indoor GIS
1.48.07 Replace with 132kV outdoor open terminal CB
1.48.08 Replace with 132kV outdoor GIS
Table 4 –132kV Switchgear NAMP lines
Refer to Table 5 and Table 6 for the mappings for additions and removals in the RIGs
tables
Description Table Row
132kV CB (Air Insulated Busbar)(ID)(GM) CV3 96
132kV CB (Air Insulated Busbar)(OD)(GM) CV3 97
132kV CB (Gas Insulated Busbar)(ID)(GM) CV3 98
132kV CB (Gas Insulated Busbar)(OD)(GM) CV3 99
Table 5 – Additions RIGs mappings
Description Table Row
132kV CB (Air Insulated Busbar)(ID)(GM) CV3 224
132kV CB (Air Insulated Busbar)(OD)(GM) CV3 225
132kV CB (Gas Insulated Busbar)(ID)(GM) CV3 226
132kV CB (Gas Insulated Busbar)(OD)(GM) CV3 227
Table 6 – Removals RIGs mappings
3.0 Investment Drivers
3.1 Investment Drivers
Investment drivers for switchgear can be split into two categories: internal condition
and external condition. External condition factors include the condition of the paint
and corrosion of any part of the switchgear, such as the bushings, which can lead to
flash overs resulting in disruptive failures. On outdoor sites the condition of air-
insulated busbars and any concrete or steel support structures will also be
considered. Internal condition factors include mechanism wear and circuit breaker
trip times.
The proposed investment plan for 132kV switchgear in ED1 includes interventions on
just one type of switchgear, the GEC OFA11. There are currently 33 OFA11 circuit
breakers on the network and, with the proposed investment plan, eight will remain at
the end of ED1.

Asset Stewardship Report 2014 SPN 132kV Switchgear Version 2.0 All of the cost numbers displayed in this document are before the application of on-going efficiencies and real price effects.
11 UK Power Networks (Operations) Limited. Registered in England and Wales. Registered No. 3870728. Registered Office: Newington House, 237 Southwark Bridge Road, London, SE1 6NP
Figure 2 – GEC OFA11 bulk oil circuit breaker
The GEC OFA11 is a bulk oil circuit breaker with a separate oil tank for each phase.
In the SPN area they are all located outdoors with air-insulated busbars. A common
issue experienced with the breaker is corrosion on the bottom of the tank and the
associated pipework. This is caused due to difficulty in accessing the underside of
the breaker for painting and is especially an issue at Hastings due to its coastal
location and higher corrosion levels. Hastings is in the plan for replacement in ED1
following its deferral from DPCR5 after short-term remedial work to repair oil leaks
was carried out.
There are a number of switchgear defects which are critical in the ARP model, and
they are described in section 4 of this document. As defects are found or cleared
they are recorded in the Ellipse asset register using a handheld device. Defects can
be captured either on an ad-hoc basis or at each inspection and maintenance.
Measure Inspection Maintenance
Conditioning air ineffective If present If present
Air leaks No If present
Compound leak Yes Yes
Control cubicle If present If present
External connections If present If present
Gasket If present If present
Oil level Yes Yes
Oil sight glass Yes Yes
Partial discharge Yes Yes
SF6 gas pressure Yes Yes
Table 7 – 132kV defects
In calculating the HI the ARP model counts the total number recorded against
individual items of plant, not just those currently outstanding. These defects are
described in more detail below.
Conditioning air ineffective. Air blast circuit breakers require a constant
supply of conditioned air to remove any moisture from the air system and
Asset Stewardship Report 2014 SPN 132kV Switchgear Version 2.0 All of the cost numbers displayed in this document are before the application of on-going efficiencies and real price effects.
12 UK Power Networks (Operations) Limited. Registered in England and Wales. Registered No. 3870728. Registered Office: Newington House, 237 Southwark Bridge Road, London, SE1 6NP
circuit breaker. The presence of moisture can lead to catastrophic failure of
the circuit breaker.
Air leaks. On air-blast circuit breakers a burst of high-pressure air is used to
extinguish any arching at the interrupters when the circuit breaker opens. This
is to enable the isomaker arm to operate and for the circuit breaker to become
isolated. If there are air leaks in the air system then this leads to the air
compressors running excessively, and therefore increased maintenance is
required.
Compound leak. To provide an impulse voltage rating bitumen compound
was used as an insulation medium in busbars, current transformer (CT)
chambers and cable termination boxes on older metal-clad switchgear. If any
compound has leaked the impulse rating is reduced along with the risk of a
disruptive failure if the equipment is subject to an overvoltage.
Control cubicle. This is a means of recording defects in the small wiring,
auxiliary fuses and terminal blocks associated with control of the circuit
breaker. These defects can prevent the circuit breakers from operating
correctly with a resultant impact on customer interruptions (CIs) and customer
minutes lost (CMLs)
External connections. For 132kV circuit breakers this is used to record
defects with the bushings of the switchgear and associated busbar
connections. A problem here can result in overheating and eventual disruptive
failure.
Gasket. For oil-filled switchgear, this is used to record a defective gasket. No
action is immediately required, but if it is left unchecked it can result in a low
oil level.
Oil level. For oil-filled switchgear, this is used to show that the oil level is low
and needs to be topped up. If left unchecked, this can result in a disruptive
failure.
Oil sight glass. For oil-filled switchgear, this is used to show that the oil sight
glass is unreadable, broken or missing. If left unchecked, this can result in a
disruptive failure.
Partial discharge. This shows that partial discharge has been recorded. If left
unchecked, this can result in disruptive failure.
SF6 gas pressure. SF6 gas is used as an insulating medium. If the pressure
falls below the rated value, the equipment could fail disruptively if left in
service.
Figure 3 shows the age of an asset when a new defect was reported, plotted against
the age of other assets on the network. There will be defects reported at ages where
there are currently no assets as they will have either aged or been removed from the
network since the defect was reported. This shows that the number of defects for
assets over 40 years old is double that of the younger assets. As mentioned earlier in
this section, defects recorded on an asset represent a big risk, not only the network,
but also operator safety because of the increased likelihood of a catastrophic failure.

Asset Stewardship Report 2014 SPN 132kV Switchgear Version 2.0 All of the cost numbers displayed in this document are before the application of on-going efficiencies and real price effects.
13 UK Power Networks (Operations) Limited. Registered in England and Wales. Registered No. 3870728. Registered Office: Newington House, 237 Southwark Bridge Road, London, SE1 6NP
Figure 3 – Defects by asset age
Source: Ellipse Extract 19/02/2013 and 2012 RIGs V5
Figure 4 shows the fault rate for all faults relating to switchgear and then split by i)
faults caused by the condition of the switchgear and ii) non-condition-related faults.
This shows an increasing fault trend.
Figure 4 – 132kV Switchgear fault rate
Source: UK Power Networks Fault Analysis Cube
The maintenance costs of the different types of switchgear is considered, but is not
used as a primary driver for investment cases. The cost of maintaining air-blast
circuit breakers is significantly more than a modern SF6 circuit breaker. Figure 5
shows the cost of maintenance over a 52-year period, which is the average asset life
0
5
10
15
20
25
30
0 5 10 15 20 25 30 35 40 45 50 55 60 65 70 75 80
No
of
Ass
ets
/De
fect
s
Asset Age
Count of Asset Manufactured Count of Defects of Age
y = 0.004x + 0.0043
y = 0.0044x - 0.0046
0.0000
0.0050
0.0100
0.0150
0.0200
0.0250
0.0300
0.0350
0.0400
0.0450
0.0500
2007 2008 2009 2010 2011 2012
Fau
lts
/ Sw
itch
gear
Year
All Faults
Poor Condition Due ToAge & Wear
Linear (All Faults )
Linear (Poor ConditionDue To Age & Wear)
Asset Stewardship Report 2014 SPN 132kV Switchgear Version 2.0 All of the cost numbers displayed in this document are before the application of on-going efficiencies and real price effects.
14 UK Power Networks (Operations) Limited. Registered in England and Wales. Registered No. 3870728. Registered Office: Newington House, 237 Southwark Bridge Road, London, SE1 6NP
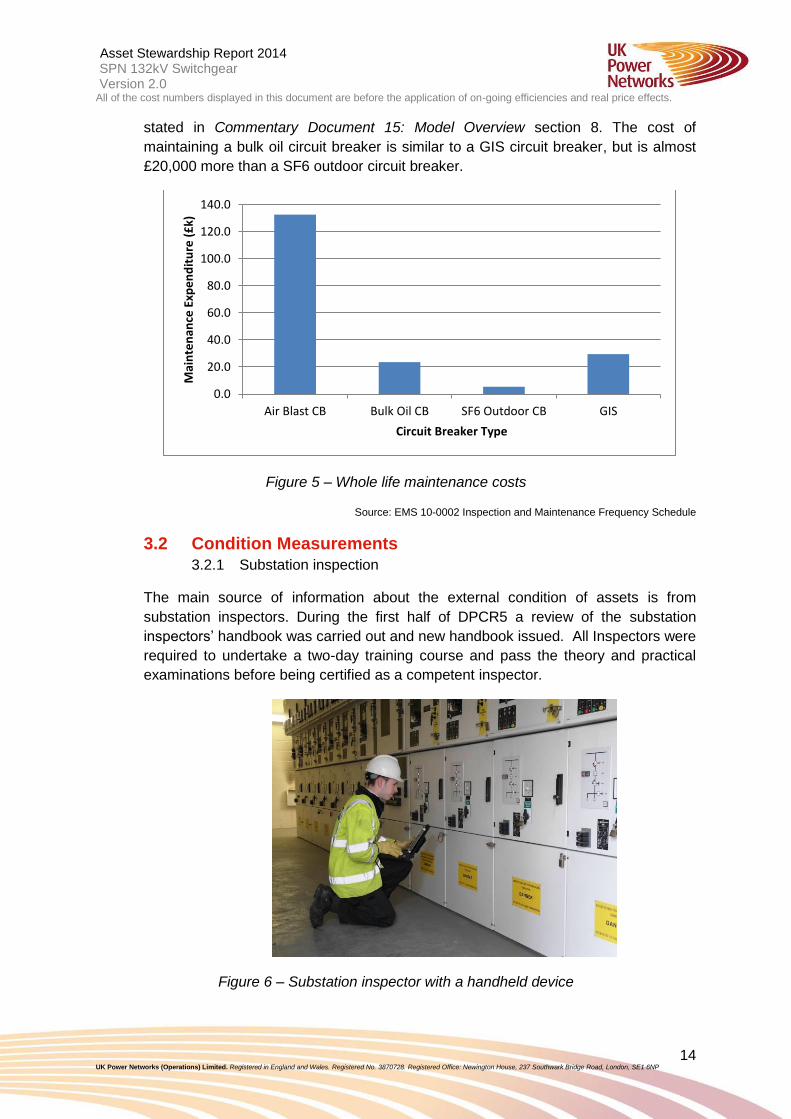
stated in Commentary Document 15: Model Overview section 8. The cost of
maintaining a bulk oil circuit breaker is similar to a GIS circuit breaker, but is almost
£20,000 more than a SF6 outdoor circuit breaker.
Figure 5 – Whole life maintenance costs
Source: EMS 10-0002 Inspection and Maintenance Frequency Schedule
3.2 Condition Measurements
3.2.1 Substation inspection
The main source of information about the external condition of assets is from
substation inspectors. During the first half of DPCR5 a review of the substation
inspectors’ handbook was carried out and new handbook issued. All Inspectors were
required to undertake a two-day training course and pass the theory and practical
examinations before being certified as a competent inspector.
Figure 6 – Substation inspector with a handheld device
0.0
20.0
40.0
60.0
80.0
100.0
120.0
140.0
Air Blast CB Bulk Oil CB SF6 Outdoor CB GIS
Mai
nte
nan
ce E
xpe
nd
itu
re (
£k)
Circuit Breaker Type

Asset Stewardship Report 2014 SPN 132kV Switchgear Version 2.0 All of the cost numbers displayed in this document are before the application of on-going efficiencies and real price effects.
15 UK Power Networks (Operations) Limited. Registered in England and Wales. Registered No. 3870728. Registered Office: Newington House, 237 Southwark Bridge Road, London, SE1 6NP
Data is captured and recorded in the asset register in a timely manner on handheld
devices, on site and at the point of inspection, to record it in the correct format within
the asset register (Ellipse). When a handheld device script is run, the inspector
answers set questions about the condition specific to the asset type, and records any
defects as well as reviewing current defects and clear them where required. The
inspection scripts have been designed to be as objective as possible, so that there is
consistency across the whole network.
Inspections are carried out at a set frequency, which is recorded in EMS 10-0002
Inspection and Maintenance Frequency Schedule. For grid and primary substations
with wet cell batteries, one major inspection and two minor inspections are carried
out annually; for substations with dry cell batteries, one minor inspection and one
major inspection are carried out annually. Switchgear is inspected at both minor and
major inspections.
3.2.2 Maintenance
There are two routine maintenance tasks carried out on 132kV Switchgear:
mechanism maintenance and full maintenance. The two maintenance tasks are
carried out alternatively in six-year intervals, as recorded in EMS 10-0002 Inspection
and Maintenance Frequency Schedule. A circuit breaker operation is also carried out
yearly for bus section and transformer breakers, and every two years for feeder
breakers.
Maintenance fitters also use the same technology to record their assessment of the
internal and external condition of the assets. This assessment is made twice to
provide condition data both ‘as found’ and ‘as left’.
The key condition points recorded at maintenance are the circuit breaker trip time,
the overall internal condition, the condition of the operating mechanism, and the
condition of the isolating contacts. For oil circuit breakers an on-site oil test is also
carried out.
4.0 Asset Assessment
4.1 Asset Health
An innovative asset health modelling tool, the ARP model, has been developed for
several asset categories including 132kV Switchgear. The methodology behind the
modelling is the same for all asset categories, but the switchgear model has been
tailored specifically to use the data available against the identified investment drivers
for switchgear.
The general methodology for the ARP model can be found in Commentary Document
15: Model Overview. The 132kV switchgear ARP model uses both the age of an
asset, its location information and its condition data to calculate an HI for the asset.
An initial HI is calculated based on the year of manufacture, the average initial life,
the environment where the asset is installed and the duty of the switchgear during its
life.

Asset Stewardship Report 2014 SPN 132kV Switchgear Version 2.0 All of the cost numbers displayed in this document are before the application of on-going efficiencies and real price effects.
16 UK Power Networks (Operations) Limited. Registered in England and Wales. Registered No. 3870728. Registered Office: Newington House, 237 Southwark Bridge Road, London, SE1 6NP
The environmental factors include the distance from the coast, whether the asset is
indoors or outdoors, and the level of pollution. The function of the switchgear,
whether it is a feeder, bus section or transformer breaker, is used to account for the
duty. An average initial life is assigned per make and model of switchgear, calculated
from the date of manufacture to the expected time that the asset will show signs of
increased deterioration. It does not show the time from when the asset is
commissioned until it is decommissioned. This initial HI is capped at HI3 to ensure
assets will never achieve an HI greater than three and therefore be considered for
intervention based on age alone.
A factor value is calculated using condition, defects and switchgear reliability data.
The condition and defect data that is input into the model is obtained from the asset
register, Ellipse. The reliability is based on the make and model of the switchgear.
There are a number of condition points that force the HI to a minimum of HI5,
including the external condition of the housing and the number of SF6 top-ups. This is
due to wanting to flag any assets showing poor condition in these measures
regardless of asset age as they will have a higher probability of failure.
This factor value is then combined with the initial HI to produce the current HI of the
asset.
4.2 Asset Criticality
The ARP model can also be used to calculate the criticality of a particular item of
switchgear, which is in the form of a criticality index 1 to 4, with 1 being the least
critical and 4 the most critical. A detailed methodology for calculating the criticality
index can be found in Commentary Document 15: Model Overview. The criticality
section of the ARP model is under development.
In the switchgear model there are five main areas when calculating the criticality of
an asset: network performance, safety, operational expenditure, capital expenditure
and environment. A number of key factors are considered in each of these areas.
Network performance. The key factors are the number of customers the
substation feeds and the function of the asset. The function of the switchgear
can be either a feeder breaker, bus section or transformer breaker. A bus
section breaker is the most critical and a feeder breaker is the least critical.
Safety. The factors considered are the arc extinction method, and whether
the switchgear is internally arc rated. The arc extinction method plays a large
part in the safety of a particular type of switchgear, with oil switchgear
considered the most dangerous method, and therefore the most critical. Items
of switchgear that are not internal arc rated are considered more critical that
switchgear that is.
Operational and capital expenditure. This section considers the criticality
between assets in terms of the difference in maintenance costs between
different makes and models of switchgear, and the difference in capital
expenditure for various voltage levels.
Environmental. This section considers the type of insulation and the effect it
has on the environment. The volume of gas and oil is also considered.

Asset Stewardship Report 2014 SPN 132kV Switchgear Version 2.0 All of the cost numbers displayed in this document are before the application of on-going efficiencies and real price effects.
17 UK Power Networks (Operations) Limited. Registered in England and Wales. Registered No. 3870728. Registered Office: Newington House, 237 Southwark Bridge Road, London, SE1 6NP
4.3 Network Risk
The network risk in monetary terms can also be calculated in the ARP model using
the probability of failure, the criticality and the consequence of failure, although it is
still under development. The probability of failure is calculated using the current HI of
the item of switchgear, and the criticality is calculated as described in the previous
section. The consequence of failure is the average cost to either repair or replace the
item of switchgear following one of four failure modes. These are detailed in Table 8.
Failure mode Description
Minor Can be repaired in house
Significant Can be repaired using external resource
Major Beyond repair – disruptive failure or sent away for repair
Failure to trip No repair needed
Table 8 – Failure modes
For the failure to trip mode, although no repair is needed, post-fault maintenance will
be carried out to investigate the cause of the stuck circuit breaker. Stuck or slow
operating breakers have a huge effect on customers as they result in increased CIs
and CMLs. This is because if a feeder circuit breaker fails to trip or is slow to trip
during a fault, the circuit breaker upstream will operate. The circuit breaker upstream
will usually be the transformer breaker that feeds the bus section, meaning the bus
section will be lost. This loss will result in an increased number of customers affected
than if just the original feeder was lost.
4.4 Data Validation
All data used in the ARP model is subject to validation against a set of data
requirements, which ensure data is within specified limits, up to date and in the
correct format. On completion of the validation process an exception report is issued
which provides details of every non-compliance, allowing continual improvement of
data quality to be achieved.
An example is the circuit breaker trip times used in the model. These values have to
be between 10ms and 1000ms, otherwise they will be discarded. There is also an
age limit on the condition data, so no data recorded more than five years ago is used.
This is to ensure that the outputs describe the current asset rather than in the past.
4.5 Data Quality
The completeness, accuracy and timeliness of the data used in the ARP model is
routinely checked and a CAT Score produced. For the latest results of the data used
in the 132kV switchgear model, refer to Table 9.
The score is colour coded as follows.
Green – score of 85% or greater
Amber – score of 65% or greater
Red – score of less than 65%.

Asset Stewardship Report 2014 SPN 132kV Switchgear Version 2.0 All of the cost numbers displayed in this document are before the application of on-going efficiencies and real price effects.
18 UK Power Networks (Operations) Limited. Registered in England and Wales. Registered No. 3870728. Registered Office: Newington House, 237 Southwark Bridge Road, London, SE1 6NP
Area Score
Completeness 67%
Accuracy 89%
Timeliness 97%
Table 9 – CAT score
Source: Ellipse Extract 27/11/2012
The completeness score is a combination of switchgear nameplate data and
condition data. Information used on the nameplate includes the year of manufacture,
the operating voltage, circuit breaker function, and any other information that will
remain constant during an assets life. Condition data is recorded by substation
inspectors, as described in section 3.4, and will change with time.
Investment in a project during DPCR5 has attempted to improve the completeness of
the condition data, and this has led to some new condition points being created.
Because of this, in some cases, the condition point may not be populated until the
next maintenance.
The accuracy score is a measure of how reliable and correct the condition data
stored in Ellipse is. This is done by making a comparison between the condition
measure recorded by UK Power Networks and the same measure recorded by an
independent third party, SKM.
The timeliness score shows the percentage of assets that have condition data
recorded within the expected time period, as stated in EMS 10-0002 Inspection and
Maintenance Frequency Schedule.
5.0 Intervention policies
5.1 Interventions: Description of Intervention Options
Two options were considered during planning for ED1: replacement and
refurbishment. There are a number of refurbishment options available for 132kV
switchgear. For air-blast circuit breakers, a full refurbishment would include the
following:
Supply a full set of seals, O-rings and grease
Refurbish the circuit breaker operating mechanism
Dismantle the blast valve and sequence-switch motor, and clean the pistons
Sand the cylinder walls
Replace all rubber components and gaskets
Replace valve seats and buffers
Examine all linkages for signs of wear
Lower the tank of the of the oil dashpot and clean and replace oil

Asset Stewardship Report 2014 SPN 132kV Switchgear Version 2.0 All of the cost numbers displayed in this document are before the application of on-going efficiencies and real price effects.
19 UK Power Networks (Operations) Limited. Registered in England and Wales. Registered No. 3870728. Registered Office: Newington House, 237 Southwark Bridge Road, London, SE1 6NP
Examine the circuit breaker and series break arm contacts nozzles and
arching electrodes
Examine both fixed and moving contacts and carryout ductor tests
Check all electrical connections are secure
Carry out speed curve tests
Carry out timing tests.
Where only some of these activities are completed, the Ofgem definition of
refurbishment is checked to assess whether the activity should be classified as
refurbishment or not.
For refurbishments of SF6 circuit breakers would involve replacing the entire
operating mechanism due to the ‘sealed for life’ design. In these cases a new
mechanism can be installed in the circuit breaker and the old mechanism can be
returned to the manufacturer to be refurbished and used elsewhere.
For replacement interventions there different options available depending on the
equipment currently installed on the site, and the site situation. These are outlined in
Table 10.
Option Description Advantages Disadvantages
Outdoor AIS solution
This option uses outdoor circuit breakers, for example, the Siemens 3AP1DT circuit breaker shown in Figure 7. If there are existing outdoor busbars these can be reused depending on condition.
Cheaper than an indoor solution. Can reuse existing busbar. Replacement of individual circuit breakers possible.
Requires a lot of space. Can’t always reuse busbar due to poor condition support structures. Prone to deterioration as outdoors. Trespass risk resulting in security/safety issues.
Indoor AIS solution
This option would only be considered if there were already indoor AIS circuit breakers at the site. It uses the same type of circuit breaks as the outdoor solution.
Can reuse existing busbar and building. Replacement of individual breakers possible. Slower deterioration due to being indoors.
Requires a lot of space. Can’t always reuse busbar and building.
GIS solution Indoor switchboard-type switchgear. Gas-insulated busbars located indoors. An example of GIS is in Figure 8, showing a Siemens 8DN8 GIS.
Small footprint. Slower deterioration due to being indoors.
Expensive compared to AIS solutions. May have to replace whole board for future extensions.
Table 10 – Replacement options

Asset Stewardship Report 2014 SPN 132kV Switchgear Version 2.0 All of the cost numbers displayed in this document are before the application of on-going efficiencies and real price effects.
20 UK Power Networks (Operations) Limited. Registered in England and Wales. Registered No. 3870728. Registered Office: Newington House, 237 Southwark Bridge Road, London, SE1 6NP
Figure 7 – Siemens 3AP1DT circuit breaker
Figure 8 – Siemens 8DN8 GIS circuit breaker
5.2 Policies: Selecting Preferred Interventions
The process used for selecting interventions can be seen in Figure 9. The process is
different depending on whether the switchgear asset is part of a switchboard or a
standalone unit.
If the switchgear asset is part of a switchboard, replacement will require the whole
board to be replaced, whereas refurbishment can be carried out on individual unit.

Asset Stewardship Report 2014 SPN 132kV Switchgear Version 2.0 All of the cost numbers displayed in this document are before the application of on-going efficiencies and real price effects.
21 UK Power Networks (Operations) Limited. Registered in England and Wales. Registered No. 3870728. Registered Office: Newington House, 237 Southwark Bridge Road, London, SE1 6NP
However, in most cases, the switchboard will contain circuit breakers of the same
model, year of manufacture, environmental conditions and maintenance engineers,
so they should be in similar health.
If the switchgear is a standalone unit, it can be either be refurbished or replaced. If
there are multiple items of switchgear on the site, the condition and health of the
other assets has to be considered to see if efficiencies can be made by replacing
them at the same time. If modern switchgear is replaced as part of one of these
projects, this can be reused at a different site or as a strategic spare.
All Switchgear at
Grid and Primary
Sites
Switchboard or
individual unit?
Is the % of OFGEM HI
4 & 5s on the
switchboard greater
than 50%?
Switchboard
Does the CB type have
a retrofit/refurbishment
option?
Individual CB
Condition data validation Condition data validation Condition data validation Condition data validation
Does the CB type have
a retrofit/refurbishment
option?
Yes
No
No
Refurbish/Retrofit
CBReplace CB
Refurbish/Retrofit
Switchboard/CB
Replace
Switchboard/site
Yes
Yes Yes
Yes
Monitor CB/
Switchboard
No No
No
Is the external Housing
in serviceable
condition?
Yes
No
Yes
Is the external Housing
in serviceable
condition?
Yes
Yes
No
No
Is the CB OFGEM HI 4 enough
to warrant replacing the
switchboard?Yes
No
No
Are more than 70% of
the sites CBs HI4 or
above?
No
Yes
In the item of
Switchgear
greater than HI4?
Figure 9 – Intervention strategy process
The capital expenditure plan for 132kV switchgear can lead to cost saving in
operational expenditure. This is because the maintenance costs for air blast and oil
switchgear are higher than modern equivalent SF6 switchgear, as shown in Figure 5.
Whole life costs will be considered on a site-by-site basis as part of an internal
investment approval process.

Asset Stewardship Report 2014 SPN 132kV Switchgear Version 2.0 All of the cost numbers displayed in this document are before the application of on-going efficiencies and real price effects.
22 UK Power Networks (Operations) Limited. Registered in England and Wales. Registered No. 3870728. Registered Office: Newington House, 237 Southwark Bridge Road, London, SE1 6NP
6.0 Innovation
As mentioned in section 4 of this document an innovative new model has been used
to develop the plan, the ARP model. This has been developed for 132kV switchgear
as well as other asset categories. The model is industry leading and uses
environment, condition and manufacturer/model information to determine an HI for
every asset, both now and in the future. It has been developed with EA Technology.
The model can calculate a criticality index for every asset as well as a risk value in
monetary terms, though this is still in development. The risk for individual assets has
not been looked at in this way before.
7.0 ED1 Expenditure Requirements for 132kV Switchgear
7.1 Method
Figure 10 shows an overview of the method to construct the ED1 NLRE investment
plans.
Asset Heath
Modelling
Future HI Profile
End of DPCR5
Asset Health
Modelling
Future HI Profile
End of RIIO-ED1
Business
Objective
Maintain Constant
Level of Network
Risk
Calculate Volume
of Interventions
Required
Identify Preferred
Intervention
Options
LRE Expenditure
Plans Produced
Asset Health/
Criticality
Identify Named
Schemes
Stakeholder
Engagement
Maintenance
Engineers
Infrastructure
Planning
Investment
Delivery
Optimized NLRE
Expenditure Plan
Figure 10 – Programme development methodology
7.2 Constructing the plan
The overall strategy for non-load related expenditure on 132kV switchgear during
ED1 has been to maintain the same level of risk at the end of the period as there is at
the start. This is achieved by keeping the number of HI4 and HI5s at the beginning
and end of the period the same. The HI profiles are outputs from the ARP model.
Asset Stewardship Report 2014 SPN 132kV Switchgear Version 2.0 All of the cost numbers displayed in this document are before the application of on-going efficiencies and real price effects.
23 UK Power Networks (Operations) Limited. Registered in England and Wales. Registered No. 3870728. Registered Office: Newington House, 237 Southwark Bridge Road, London, SE1 6NP
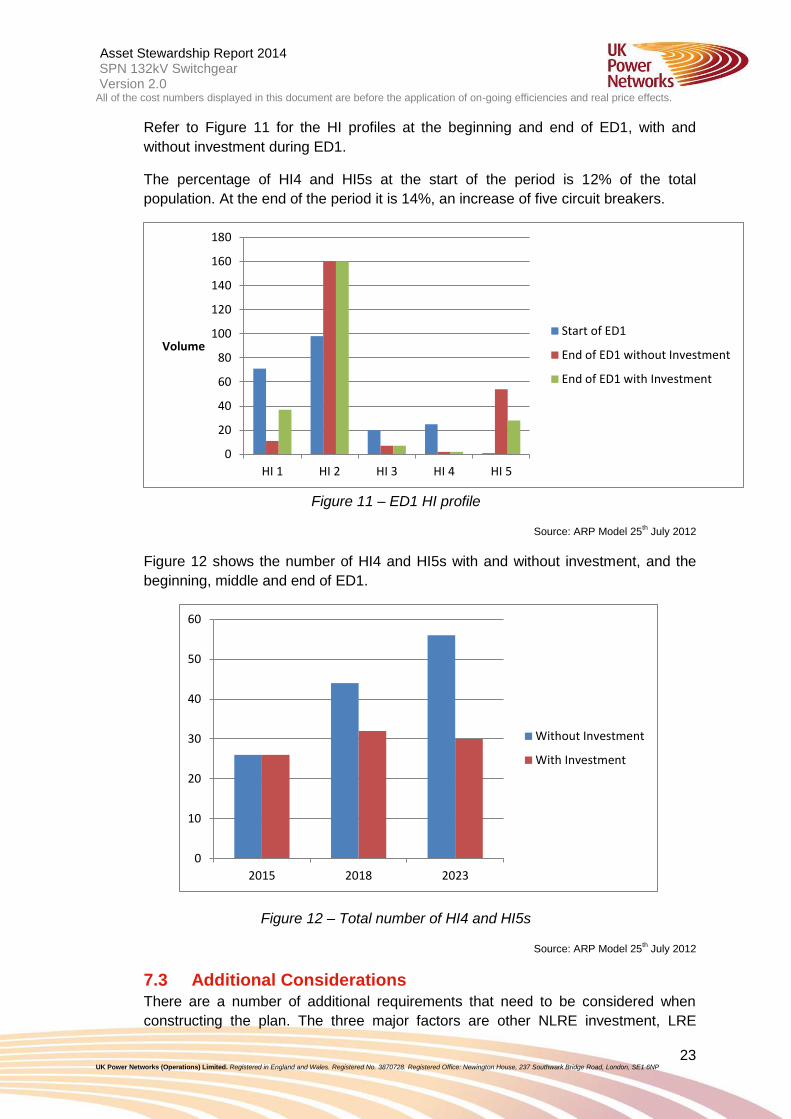
Refer to Figure 11 for the HI profiles at the beginning and end of ED1, with and
without investment during ED1.
The percentage of HI4 and HI5s at the start of the period is 12% of the total
population. At the end of the period it is 14%, an increase of five circuit breakers.
Figure 11 – ED1 HI profile
Source: ARP Model 25th July 2012
Figure 12 shows the number of HI4 and HI5s with and without investment, and the
beginning, middle and end of ED1.
Figure 12 – Total number of HI4 and HI5s
Source: ARP Model 25th July 2012
7.3 Additional Considerations
There are a number of additional requirements that need to be considered when
constructing the plan. The three major factors are other NLRE investment, LRE
0
20
40
60
80
100
120
140
160
180
HI 1 HI 2 HI 3 HI 4 HI 5
Volume Start of ED1
End of ED1 without Investment
End of ED1 with Investment
0
10
20
30
40
50
60
2015 2018 2023
Without Investment
With Investment

Asset Stewardship Report 2014 SPN 132kV Switchgear Version 2.0 All of the cost numbers displayed in this document are before the application of on-going efficiencies and real price effects.
24 UK Power Networks (Operations) Limited. Registered in England and Wales. Registered No. 3870728. Registered Office: Newington House, 237 Southwark Bridge Road, London, SE1 6NP
investment required at the site during ED1 and any National Grid work at the site or
on the surrounding network.
The main NLRE schemes that will affect 132kV Switchgear projects is work on
switchgear of other voltages on the same site and transformer interventions at the
site. If these schemes are set to happen within five years of the 132kV Switchgear
scheme, consideration has been given as to whether cost efficiencies are possible by
combining the schemes. This can mean that site establishment (CDM) costs are
reduced, project administration can be combined, and there is the possibility of
combining network outages.
Any LRE requirements at the site may mean that a project needs to be re-phased.
Where a project has both NLRE and LRE drivers, NLRE is used as the primary driver
as the LRE requirements at a specific site might change meaning the switchgear no
longer requires changing, but the condition of the switchgear won’t improve without
investment.
At 132kV, many of the substations sites are shared between National Grid and UK
Power Networks and, in some cases, switchgear from both companies can be
connected to the same busbar. In these cases National Grid will normally owns the
incoming circuit breakers and the busbar, and UK Power Networks owns the
outgoing circuit breakers. Due to this, consultation with National Grid has taken place
to discuss investment plans and align them.
7.4 Asset Volumes and Expenditure
Figure 13 shows the number of interventions on 132kV switchgear from the start of
DPCR4 to the end of ED2. For a list of named schemes, refer to Appendix 7.
Figure 13 – 132kV Switchgear yearly interventions
Source: DPCR5 FBPQ, 2013 RIGS, 19th February 2014 NAMP, and Age- Based Model
The actual expected volume of interventions in DPCR5 is 24, compared to 28
forecast in the FBPQ. This reduction is due to better end-of-life management of the
0
2
4
6
8
10
12
14
16
Co
un
t
Regulatory Year
Refurbishment
Replacement
FBPQ
DPCR4 DPCR5 ED1 ED2

Asset Stewardship Report 2014 SPN 132kV Switchgear Version 2.0 All of the cost numbers displayed in this document are before the application of on-going efficiencies and real price effects.
25 UK Power Networks (Operations) Limited. Registered in England and Wales. Registered No. 3870728. Registered Office: Newington House, 237 Southwark Bridge Road, London, SE1 6NP
assets during DPCR5. Refer to Figure 14 for 132kV Switchgear expenditure from the
start of DPCR4 to the end of ED2.
Figure 14 – 132kV Switchgear yearly expenditure
Source: DPCR5 FBPQ, 2013 RIGS, 19th February 2014 NAMP, and Age-Based Model
Full page versions of Figure 13 and Figure 14 can be found at the end of Appendix 7.
7.5 Commentary
The yearly average number of interventions for DPCR4 was 0.4 items of switchgear,
with a number of large projects finishing in the final year. The forecast yearly average
for DPCR5 is five items of switchgear, and the proposed yearly average for ED1 is
three. The proposed volume of replacements in ED1 is 26 and there are no
refurbishments.
The number of interventions planned for ED1 is less than DPCR5, but more than
DPCR4. As described in section 3.1 of this document, the reduction in interventions
is caused by the continued reliable service of a large proportion of the switchgear
commissioned in the 1960s. There are no refurbishments planned for ED1 as the
sites where a current refurbishment option is available where refurbished in DPCR5.
The average yearly expenditure for DPCR4 and DPCR5 is £2.4m and £1.1m; for
ED1 it is £2.4m. The ED1 expenditure is the same level as DPCR5 with an increase
in unit cost due to all interventions being replacements rather than a mix of
refurbishments and replacements, as there are in DPCR5.
The ED2 figures in the chart have been derived from age-based modelling. Asset
condition and health will be used closer to ED2 to reassess the volume of
interventions required.
7.6 Sensitivity Analysis and Plan Validation
Sensitivity analysis has been carried out on the ARP models to see how changes in
the average initial life affect the HI profile.
0.0
2.0
4.0
6.0
8.0
10.0
12.0
14.0
16.0
Inve
stm
en
t (£
m)
Regulatory Year
Refurbishment
Replacement
FBPQ
DPCR4 DPCR5 ED2 ED1
Asset Stewardship Report 2014 SPN 132kV Switchgear Version 2.0 All of the cost numbers displayed in this document are before the application of on-going efficiencies and real price effects.
26 UK Power Networks (Operations) Limited. Registered in England and Wales. Registered No. 3870728. Registered Office: Newington House, 237 Southwark Bridge Road, London, SE1 6NP
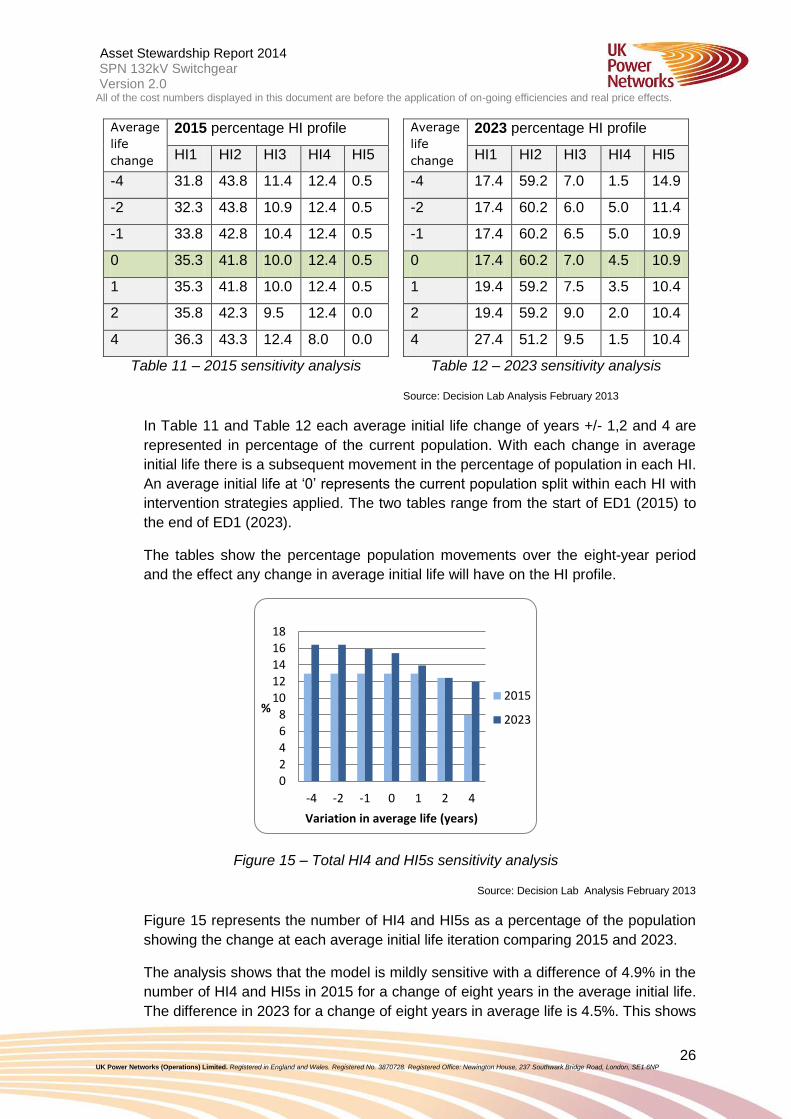
Table 11 – 2015 sensitivity analysis
Average
life
change
2015 percentage HI profile
HI1 HI2 HI3 HI4 HI5
-4 31.8 43.8 11.4 12.4 0.5
-2 32.3 43.8 10.9 12.4 0.5
-1 33.8 42.8 10.4 12.4 0.5
0 35.3 41.8 10.0 12.4 0.5
1 35.3 41.8 10.0 12.4 0.5
2 35.8 42.3 9.5 12.4 0.0
4 36.3 43.3 12.4 8.0 0.0
Table 12 – 2023 sensitivity analysis
Source: Decision Lab Analysis February 2013
Average
life
change
2023 percentage HI profile
HI1 HI2 HI3 HI4 HI5
-4 17.4 59.2 7.0 1.5 14.9
-2 17.4 60.2 6.0 5.0 11.4
-1 17.4 60.2 6.5 5.0 10.9
0 17.4 60.2 7.0 4.5 10.9
1 19.4 59.2 7.5 3.5 10.4
2 19.4 59.2 9.0 2.0 10.4
4 27.4 51.2 9.5 1.5 10.4
In Table 11 and Table 12 each average initial life change of years +/- 1,2 and 4 are
represented in percentage of the current population. With each change in average
initial life there is a subsequent movement in the percentage of population in each HI.
An average initial life at ‘0’ represents the current population split within each HI with
intervention strategies applied. The two tables range from the start of ED1 (2015) to
the end of ED1 (2023).
The tables show the percentage population movements over the eight-year period
and the effect any change in average initial life will have on the HI profile.
Figure 15 – Total HI4 and HI5s sensitivity analysis
Source: Decision Lab Analysis February 2013
Figure 15 represents the number of HI4 and HI5s as a percentage of the population
showing the change at each average initial life iteration comparing 2015 and 2023.
The analysis shows that the model is mildly sensitive with a difference of 4.9% in the
number of HI4 and HI5s in 2015 for a change of eight years in the average initial life.
The difference in 2023 for a change of eight years in average life is 4.5%. This shows
0
2
4
6
8
10
12
14
16
18
-4 -2 -1 0 1 2 4
%
Variation in average life (years)
2015
2023

Asset Stewardship Report 2014 SPN 132kV Switchgear Version 2.0 All of the cost numbers displayed in this document are before the application of on-going efficiencies and real price effects.
27 UK Power Networks (Operations) Limited. Registered in England and Wales. Registered No. 3870728. Registered Office: Newington House, 237 Southwark Bridge Road, London, SE1 6NP
that changes in the average initial life have very similar effects on current and future
HIs. Also, the different between the number of HI4 and HI5s in 2015 and 2023 is very
similar when the average initial life is increased by four years and when it is reduced
by four years.
7.7 Model Testing
The ARP model has undergone rigorous testing to ensure it met the defined
requirements prior to acceptance. There were four distinct subsets to the testing
process: algorithm testing, software testing, data flow testing and user and
methodology testing. Each test is designed to capture potential errors in specific
parts of the system and the completion of all tests provides assurance that a
thorough evaluation has been carried out to ensure correctness and validity of the
outputs.
7.7.1 Algorithm testing
The ARP model comprises a set of algorithms implemented within the
database code. Each algorithm is mimicked by the tester in a
spreadsheet with the results compared to those of the ARP algorithm
for a given set of test data inputs. The test data comprised data within
normal expected ranges, low-value numbers, high-value numbers,
floating point numbers, integers, negative numbers and unpopulated
values. To pass the test, all results from the ARP algorithm are
required to match the spreadsheet calculation.
7.7.2 Software testing
A number of new software functions are used in the model which
required testing to ensure correct performance. A test script was
created to identify the functional requirement, the method to carry out
the function and the expected outcome. To pass the test the achieved
outcome had to match the expected outcome.
7.7.3 Data flow testing
To ensure data presented in the ARP upload files passes into the
model correctly data flow testing has been carried out. The test carries
out data counts to check that the number of records put into the model
is the same as the number shown in the final model.
7.7.4 User and methodology testing
The aim of the user and methodology testing is to ensure that the
models are fit for purpose. A test script has been created to check
displays operate correctly and the outputs respond to changes in
calibration settings.

Asset Stewardship Report 2014 SPN 132kV Switchgear Version 2.0 All of the cost numbers displayed in this document are before the application of on-going efficiencies and real price effects.
28 UK Power Networks (Operations) Limited. Registered in England and Wales. Registered No. 3870728. Registered Office: Newington House, 237 Southwark Bridge Road, London, SE1 6NP
7.8 Network Risk
As mentioned in section 4, the ARP model is able to produce a criticality index (C1 to
C4) for each individual asset, although this is a very new concept and it is still being
developed. The criticality index can use with the HI to give an indication of the level
of risk seen on the network. Table 13 and Table 14 show the HI and criticality matrix
for 2015 and 2023 with investment during ED1.
Asset categories Criticality Units
Estimated asset health and criticality profile 2015
Asset register
Asset health index
2015
HI1 HI2 HI3 HI4 HI5
132kV Switchgear Low
No. CB
56 56 9 7 0 128
Average
No. CB
14 52 9 15 1 91
High
No. CB
0 9 1 3 0 13
Very high
No. CB
1 0 1 0 0 2
Table 13 – 2015 HI and criticality matrix
Source: ARP Model (HI: 25th July 2012, Criticality: 27
th November 2012)
Asset categories Criticality Units
Estimated asset health and criticality profile 2023
Asset Register
Asset health index
2023
HI1 HI2 HI3 HI4 HI5
132kV Switchgear Low
No. CB
13 99 6 1 9 128
Average
No. CB
21 51 1 0 18 91
High
No. CB
3 9 0 0 1 13
Very high
No. CB
0 1 0 1 0 2
Table 14 – 2023 HI and criticality matrix
Source: ARP Model (HI: 25th July 2012, Criticality: 27th November 2012)
8.0 Deliverability The number of interventions taking place during ED1 is less than what is predicted to
be delivered during DPCR5, so resources are available and consideration of network
outage issues has taken place during project phasing.

Asset Stewardship Report 2014 SPN 132kV Switchgear Version 2.0 All of the cost numbers displayed in this document are before the application of on-going efficiencies and real price effects.
29 UK Power Networks (Operations) Limited. Registered in England and Wales. Registered No. 3870728. Registered Office: Newington House, 237 Southwark Bridge Road, London, SE1 6NP
All projects will be created in the NAMP and this will be used to manage the project
portfolio internally.

Asset Stewardship Report 2014 SPN 132kV Switchgear Version 2.0 All of the cost numbers displayed in this document are before the application of on-going efficiencies and real price effects.
30 UK Power Networks (Operations) Limited. Registered in England and Wales. Registered No. 3870728. Registered Office: Newington House, 237 Southwark Bridge Road, London, SE1 6NP
Appendices
Appendix 1 – Age Profiles
Figure 16 – 132kV Switchgear age profile
Source: 2012 RIGs V5
0.00
5.00
10.00
15.00
20.00
25.00
30.001
95
6
19
59
19
62
19
65
19
68
19
71
19
74
19
77
19
80
19
83
19
86
19
89
19
92
19
95
19
98
20
01
20
04
20
07
20
10
Vo
lum
e o
f Sw
itch
gear
Year of manufacture

Asset Stewardship Report 2014 SPN 132kV Switchgear Version 2.0 All of the cost numbers displayed in this document are before the application of on-going efficiencies and real price effects.
31 UK Power Networks (Operations) Limited. Registered in England and Wales. Registered No. 3870728. Registered Office: Newington House, 237 Southwark Bridge Road, London, SE1 6NP
Appendix 2 – HI and Criticality Profiles
Asset categories Criticality Units
Estimated asset health and criticality profile 2015
Asset register
Asset health index
2015
HI1 HI2 HI3 HI4 HI5
132kV Switchgear Low
No. CB
56 56 9 7 0 128
Average
No. CB
14 52 9 15 1 91
High
No. CB
0 9 1 3 0 13
Very high
No. CB
1 0 1 0 0 2
Table 15 – 2015 HI and criticality matrix
Source: ARP Model (HI: 25th July 2012, Criticality: 27
th November 2012)
Asset categories Criticality Units
Estimated asset health and criticality profile 2023
Asset Register
Asset health index
2023
HI1 HI2 HI3 HI4 HI5
132kV Switchgear Low
No. CB
13 99 6 1 9 128
Average
No. CB
21 51 1 0 18 91
High
No. CB
3 9 0 0 1 13
Very high
No. CB
0 1 0 1 0 2
Table 16 – 2023 HI and criticality matrix
Source: ARP Model (HI: 25th July 2012, Criticality: 27
th November 2012)

Asset Stewardship Report 2014 SPN 132kV Switchgear Version 2.0 All of the cost numbers displayed in this document are before the application of on-going efficiencies and real price effects.
32 UK Power Networks (Operations) Limited. Registered in England and Wales. Registered No. 3870728. Registered Office: Newington House, 237 Southwark Bridge Road, London, SE1 6NP
Appendix 3 – Fault Data
2007 2008 2009 2010 2011 2012
All faults 2 2 1 9 2 6
Corrosion 0 0 0 0 0 0
Deterioration due to
ageing or wear
(excluding corrosion) 8 1 4
Deterioration due to
ageing or wear
(including corrosion)
0 0 0 8 1 4
2007 2008 2009 2010 2011 2012
All faults 0.0100 0.0100 0.0050 0.0448 0.0100 0.0299
Poor condition
due to age and wear
0.0000 0.0000 0.0000 0.0398 0.0050 0.0199
Table 17 – 132kV Switchgear Faults data
Source: UKPN Faults cube
Figure 17 – Fault Rate 132kV Switchgear in SPN
Source: UKPN Faults Cube
y = 0.004x + 0.0043
y = 0.0044x - 0.0046
0.0000
0.0050
0.0100
0.0150
0.0200
0.0250
0.0300
0.0350
0.0400
0.0450
0.0500
2007 2008 2009 2010 2011 2012
Fau
lts
/ Sw
itch
gear
Year
All Faults
Poor Condition Due ToAge & Wear
Linear (All Faults )
Linear (Poor ConditionDue To Age & Wear)

Asset Stewardship Report 2014 SPN 132kV Switchgear Version 2.0 All of the cost numbers displayed in this document are before the application of on-going efficiencies and real price effects.
33 UK Power Networks (Operations) Limited. Registered in England and Wales. Registered No. 3870728. Registered Office: Newington House, 237 Southwark Bridge Road, London, SE1 6NP
Appendix 4 – WLC Case Studies
Section not applicable.

Asset Stewardship Report 2014 SPN 132kV Switchgear Version 2.0 All of the cost numbers displayed in this document are before the application of on-going efficiencies and real price effects.
34 UK Power Networks (Operations) Limited. Registered in England and Wales. Registered No. 3870728. Registered Office: Newington House, 237 Southwark Bridge Road, London, SE1 6NP
Appendix 5 – NLRE Expenditure Plan
Figure 18 – 132kV Switchgear yearly interventions
Source: DPCR5 FBPQ, 2013 RIGs, 19th February 2014 NAMP, and Age Based Model
0
2
4
6
8
10
12
14
16
Co
un
t
Regulatory Year
2006
2007
2008
2009
2010
2011
2012
2013
2014
2015
2016
2017
2018
2019
2020
2021
2022
2023
2024
2025
2026
2027
2028
2029
2030
2031
Refurbishment 0 0 0 0 0 0 0 3 7 0 0 0 0 0 0 0 0 0 0 0 0 0 0 0 0 0
Replacement 0 0 0 0 2 2 0 5 4 3 0 3 9 0 0 14 0 0 3 3 3 3 3 3 3 3
FBPQ 8 9 6 3 2
DPCR5 ED1 ED2 DPCR4

Asset Stewardship Report 2014 SPN 132kV Switchgear Version 2.0 All of the cost numbers displayed in this document are before the application of on-going efficiencies and real price effects.
35 UK Power Networks (Operations) Limited. Registered in England and Wales. Registered No. 3870728. Registered Office: Newington House, 237 Southwark Bridge Road, London, SE1 6NP
Figure 19 – 132kV Switchgear yearly expenditure
Source: DPCR5 FBPQ, 2013 RIGs, 19th February 2014 NAMP, and Age Based Model
0.0
2.0
4.0
6.0
8.0
10.0
12.0
14.0
16.0
Inve
stm
en
t (£
m)
Regulatory Year
2006
2007
2008
2009
2010
2011
2012
2013
2014
2015
2016
2017
2018
2019
2020
2021
2022
2023
2024
2025
2026
2027
2028
2029
2030
2031
Refurbishment 0.0 0.0 0.0 0.0 0.0 0.0 0.0 0.3 0.3 0.0 0.0 0.0 0.0 0.0 0.0 0.0 0.0 0.0 0.0 0.0 0.0 0.0 0.0 0.0 0.0 0.0
Replacement 9.4 0.4 0.2 1.5 0.3 2.2 0.4 0.3 0.6 0.1 1.0 3.5 2.9 3.2 4.2 4.5 0.0 0.0 2.2 2.2 2.2 2.2 2.2 2.2 2.2 2.2
FBPQ 11.8 13.4 6.3 1.6 1.7
DPCR4 DPCR5 ED2 ED1

36 for evidence-based operational, tactical and strategic decisions ©DecisionLab Ltd
Appendix 6 – Sensitivity Analysis
Sensitivity Analysis: Asset Risk and Prioritisation Model for SPN 132kV Switchgear (written by Decision Lab)
Introduction
This is a report of the sensitivity analysis conducted on the Asset Risk and Prioritisation
(ARP) model developed by EA Technology used to support the asset replacement and
investment strategy for SPN 132kV Switchgear which is included in the ED1 plan.
The objective is to understand how the HI profile of assets may change if the average life of
assets does not turn out as predicted.
An input to the ARP model is the starting asset population in each HI which is different in
each region. Therefore sensitivity analysis has been done on a region-by-region basis.
The ARP model
The ARP model uses database information about each individual asset and models many
parameters to predict the HI of each asset in the future. Significant parameters are age,
location, loading and current average life.
Sensitivity analysis
Variation in average asset life can occur, but this is significantly less than variation in
individual asset lives.
Standard average asset lives are used in the ARP model. These are 40, 45 and 50 years. In
2012 about 52% of the population had a current average life of 40 years and about 30% of
45 years. This study covered the full population of SPN 132kV Switchgear.
Using 2012 asset data and the replacement plans up to 2023, the ARP model was used to
predict the HI of each asset at the beginning and end of ED1. This was then repeated
varying each current average asset life by ±1, 2 and 4 years.
All results are shown below as the percentages of the population.

37 for evidence-based operational, tactical and strategic decisions ©DecisionLab Ltd
Average
life
change
2015 percentage HI profile
HI1 HI2 HI3 HI4 HI5
-4 31.8 43.8 11.4 12.4 0.5
-2 32.3 43.8 10.9 12.4 0.5
-1 33.8 42.8 10.4 12.4 0.5
0 35.3 41.8 10.0 12.4 0.5
1 35.3 41.8 10.0 12.4 0.5
2 35.8 42.3 9.5 12.4 0.0
4 36.3 43.3 12.4 8.0 0.0
Average
life
change
2023 percentage HI profile
HI1 HI2 HI3 HI4 HI5
-4 17.4 59.2 7.0 1.5 14.9
-2 17.4 60.2 6.0 5.0 11.4
-1 17.4 60.2 6.5 5.0 10.9
0 17.4 60.2 7.0 4.5 10.9
1 19.4 59.2 7.5 3.5 10.4
2 19.4 59.2 9.0 2.0 10.4
4 27.4 51.2 9.5 1.5 10.4
As the percentages above are rounded, the sum of a row may be 0.2% above or below
100%.
The upper and lower and current average life cases are charted below.
For all cases modelled, the sum of assets in HI4 and HI5 is plotted below.
0
10
20
30
40
50
60
HI1 HI2 HI3 HI4 HI5
%
Health Index profile in 2015
4 years less Av. life 4 years more
0
10
20
30
40
50
60
HI1 HI2 HI3 HI4 HI5
%
Health Index profile in 2023
4 years less Av. life 4 years more
38 for evidence-based operational, tactical and strategic decisions ©DecisionLab Ltd
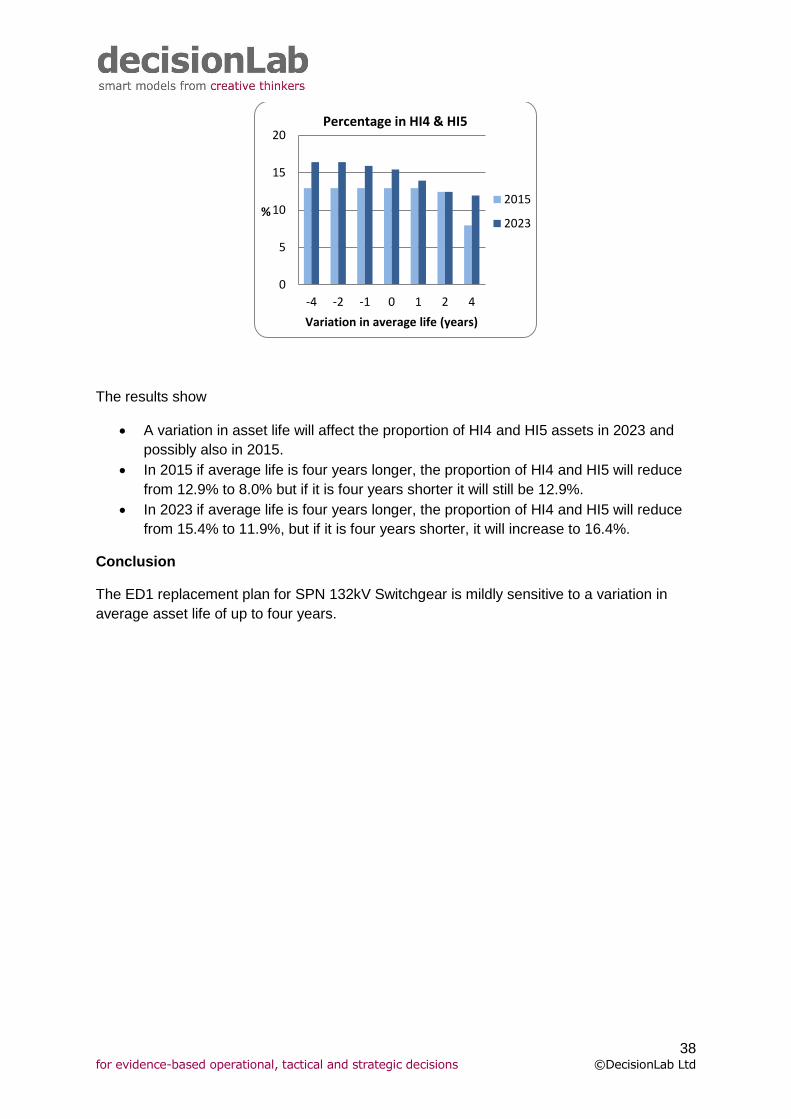
The results show
A variation in asset life will affect the proportion of HI4 and HI5 assets in 2023 and
possibly also in 2015.
In 2015 if average life is four years longer, the proportion of HI4 and HI5 will reduce
from 12.9% to 8.0% but if it is four years shorter it will still be 12.9%.
In 2023 if average life is four years longer, the proportion of HI4 and HI5 will reduce
from 15.4% to 11.9%, but if it is four years shorter, it will increase to 16.4%.
Conclusion
The ED1 replacement plan for SPN 132kV Switchgear is mildly sensitive to a variation in
average asset life of up to four years.
0
5
10
15
20
-4 -2 -1 0 1 2 4
%
Variation in average life (years)
Percentage in HI4 & HI5
2015
2023

Asset Stewardship Report 2014 SPN 132kV Switchgear Version 2.0
39 for evidence-based operational, tactical and strategic decisions ©DecisionLab Ltd
Appendix 7 – Named Schemes
GWP Ref Project
ID
DNO Description Switchgear
manufacturer
and model
Volume Scheme
Paper
1.48 1.48.01.3284 3284 SPN Hastings main
–132kV
switchboard
replacement
GEC OFA11 9 Yes
1.48 1.48.01.7806 7806 SPN Smallfield grid
– replace
132kV
switchgear
GEC OFA11 4 No
1.48 1.48.01.7807 7807 SPN Canterbury
South – replace
132kV
switchgear
GEC OFA11 10 No
1.48 1.48.01.8661 8661 SPN Betteshanger
grid – 132kV
switchgear
replacement
GEC OFA11 3 Yes
Table 18 – 132kV Switchgear Named Schemes
Source: 19th February NAMP 2014 Table J Less Indirect

Asset Stewardship Report 2014 SPN 132kV Switchgear Version 2.0
40 UK Power Networks (Operations) Limited. Registered in England and Wales. Registered No. 3870728. Registered Office: Newington House, 237 Southwark Bridge Road, London, SE1 6NP
Appendix 8 – Output NAMP/ED1 Business Plan Data Table Reconciliation
Outputs Asset Stewardship Report Business Plan Data Table
Investment destription NAMP Line
2015/16
2016/17
2017/18
2018/19
2019/20
2020/21
2021/22
2022/23 Total
RIG Table
RIG Row
2015/16
2016/17
2017/18
2018/19
2019/20
2020/21
2021/22
2022/23 Total
132kV Switchgear Removals
1.48.01
0 3 9 0 0 14 0 0 26
CV3 224 0 0 0 0 0 0 0 0 0
1.48.05 CV3 225 0 3 9 0 0 14 0 0 26
1.48.06 CV3 226 0 0 0 0 0 0 0 0 0
1.48.07 CV3 227 0 0 0 0 0 0 0 0 0
1.48.08
132kV Switchgear Refurbishment 1.55.02 0 0 0 0 0 0 0 0 0 CV5 53 0 0 0 0 0 0 0 0 0
Total 0 3 9 0 0 14 0 0 26 0 3 9 0 0 14 0 0 26
Table 19 - NAMP to ED1 Business Plan Data Table Reconciliation
Source: 19th February 2014 NAMP Table J less indirects and 21
st February 2014 ED1 Business Plan Data Tables

Asset Stewardship Report 2014 SPN 132kV Switchgear Version 2.0
41 UK Power Networks (Operations) Limited. Registered in England and Wales. Registered No. 3870728. Registered Office: Newington House, 237 Southwark Bridge Road, London, SE1 6NP
Appendix 9 – Efficiency Benchmarking with other DNOs
Figure 20 - Efficiency Benchmarking
Source: DNO Datashare_2013
The graph above shows that although SPN has a lower replacement rate than the industry average per percentage of population and it also has a slightly lower average age. As mentioned within this document the plan for ED1 has been based on the condition of the assets rather than age.
EPN
LPN SPN
EMID
WMID
SWALES
SWEST
ENW
NPGN
NPGY
SPMW
SSES
0%
5%
10%
15%
20%
25%
30%
15.0 20.0 25.0 30.0 35.0
ED1
Re
pla
cem
en
ts (
% o
f P
op
ula
tio
n)
Mean Average Age (Years)
132kV Switchgear (Additions)
All DNO Average Age
All DNO AverageReplacement Rate

Asset Stewardship Report 2014 SPN 132kV Switchgear Version 2.0
42 UK Power Networks (Operations) Limited. Registered in England and Wales. Registered No. 3870728. Registered Office: Newington House, 237 Southwark Bridge Road, London, SE1 6NP
Appendix 10 – Material changes since the July 2013 ED1 submission
There have been no changes to the SPN 132kV Switchgear plan since the July 2013
submission.
The following Ofgem questions were answered relating to 132kV Switchgear:
Ph1-14
Ph1-147
Neither question resulted in a change to the submission values.