Embed Size (px)
Citation preview

Doctoral Initiative on Minority Attrition
and Completion
Robert SowellVice President, Programs and Operations (Retired)
Jeff AllumDirector, Research and Policy Analysis
Hironao OkahanaResearch Associate
Copyright © 2015 Council of Graduate Schools
Suggested citation:
Sowell, R., Allum, J., & Okahana, H. (2015). Doctoral initiative on minority attrition and completion. Washington, DC: Council of Graduate Schools.
This publication is based upon work supported by the National Science Foundation under Grant No. 1138814. Any opinions, findings, and conclusions or recommendations expressed in this publication are those of the authors and do not necessarily reflect the views of the National Science Foundation.
ALL RIGHTS RESERVED. No part of this work covered by the copyright herein may be reproduced or used in any form by any means—graphic, electronic, or mechanical including photocopying, recording, taping, Web distribution, or information storage and retrieval systems—without the written permission of the Council of Graduate Schools, One Dupont Circle, NW, Suite 230, Washington, D.C. 20036-1173.
ISBN-13: 978-1-933042-43-5ISBN-10: 1-933042-43-5
Doctoral Initiative on Minority Attrition and Completion iii
TABLE OF CONTENTS
List of Tables and Figures ..................................................................... v
List of Appendices ................................................................................ vii
Acknowledgments ............................................................................... viii
Foreword ............................................................................................... x
Chapter 1. Introduction ......................................................................... 1
Chapter 2. Data and Methods ................................................................ 5 Data Collection .............................................................................. 6 Data Analysis ............................................................................... 10 Chapter Summary ........................................................................ 12
Chapter 3. Results from the Analysis of Student-level Enrollment Data .......................................................... 14 Seven-year Completion and Attrition Rates ................................ 15 Cumulative Ten-year URM Doctoral Completion Rates ............. 21 Time-to-Degree and Time-to-Attrition ........................................ 26 Chapter Summary ........................................................................ 30
Chapter 4. Analyses of Program Inventories, Student Surveys, and Site Visit Data ............................................................................... 32 Policies, Practices, and Interventions .......................................... 33 Doctoral Student Survey .............................................................. 36 Site Visits ..................................................................................... 51
Doctoral Initiative on Minority Attrition and Completioniv
Chapter 5. Summary, Recommendations, and Future Research ........................................................................... 60 Summary of Findings .................................................................. 61 Limitations ................................................................................... 63 Recommendations ........................................................................ 64 Conclusion and Directions for Future Research .......................... 66
References ............................................................................................ 69
Doctoral Initiative on Minority Attrition and Completion v
Table 2.1 Descriptive Characteristics of the Student-level Data ............. 7
Table 2.2 Demographic Characteristics of the Doctoral Student Survey Respondents ................................................................. 9
Table 2.3 Demographic Characteristics of the Student Focus Group Participants ..................................................................... 10
Figure 3.1 Seven-year Completion and Attrition Rates by Broad Field of Study ....................................................................... 16
Figure 3.2 Seven-year Completion and Attrition Rates by Gender ..... 18
Figure 3.3 Seven-year Completion and Attrition Rates by Race/Ethnicity .................................................................................. 19
Figure 3.4 Seven-year Completion and Attrition Rates by Prior Degree Status .......................................................................... 19
Figure 3.5 Seven-year Completion and Attrition Rates by Academic Year Groups .................................................................... 22
Figure 3.6 Ten-year Cumulative Completion Rates ............................. 23
Figure 3.7 Ten-year Cumulative Completion Rates by Broad Field of Study ........................................................................ 23
Figure 3.8 Ten-year Cumulative Completion Rates by Gender ............ 25
Figure 3.9 Ten-year Cumulative Completion Rates by Race/Ethnicity .................................................................................. 25
Figure 3.10 Ten-year Cumulative Completion Rates by Prior Degree Status .......................................................................... 26
Figure 3.11 Median Time-to-Degree by Broad Field of Study ............. 28
LIST OF TABLES AND FIGURES
Doctoral Initiative on Minority Attrition and Completionvi
Figure 3.12 Median Time-to-Degree by Select Student and Institutional Characteristics ............................................................ 28
Figure 3.13 Median Time-to-Attrition by Broad Field of Study ........... 29
Figure 3.14 Median Time-to-Attrition by Select Student and Institutional Characteristics ............................................................ 29
Figure 4.1 URM Doctoral Student Responses to Survey Questions on Program Climate ................................................. 37
Figure 4.2 URM Doctoral Student Responses to Survey Questions on Graduate Student Experience ............................. 39
Figure 4.3 URM Doctoral Student Responses to Survey Questions on Program Factors Affecting Achievement of Degree Objectives ............ 40
Figure 4.4 URM Doctoral Student Responses to Survey Questions on Personal Factors Affecting Achievement of Degree Objectives ........... 40
Table 4.1 URM Students’ Perception of Program Climate by Candidacy Status ............................................................................. 41
Table 4.2 URM Graduate Student Experience by Candidacy Status .... 42
Table 4.3 Perceived Importance of Program and Personal Factors by Candidacy Status of URM STEM Students .......................................... 43
Table 4.4 URM Doctoral Students’ Perceptions of Program Climate by Race/Ethnicity ..................................................... 44
Table 4.5 URM Graduate Student Experience by Race/Ethnicity ........ 45
Table 4.6 Perceived Importance of Program and Personal Factors to Degree Completion by Race/Ethnicity .................................................. 46
Doctoral Initiative on Minority Attrition and Completion vii
LIST OF APPENDICES
Appendix A List of Participating Institutions
Appendix B Request for Proposals
Appendix C Selection Committee Membership
Appendix D List of Site Visits
Appendix E Taxonomy of Fields of Study
Appendix F Data Collection Instrument for Student-level Data
Appendix G Inventory of Policies, Programs and Procedures
Appendix H Instrument for the Doctoral Student Survey
Appendix I Protocol for Student Focus Group Sessions
Appendix J Demographic Information Questionnaire for Student Focus Group Sessions
Appendix K Protocol for Group Interview Sessions with University Personnel
Appendix L Sample Size and Percentage Distributions of 7-year Completion and Attrition Rates Analysis
Appendix M Sample Size and Percentage Distributions of 10-year Completion Rates Analysis
Appendix N An Illustrative List of Programs, Initiatives, and Associations
Appendix O Seven-year URM Doctoral Completion and Attrition Rates by Academic-Year Groups and Selected Student Characteristics
Appendix P Summary of Inventory of Policies, Programs and Procedures
All appendices are available on the DIMAC project page at the CGS website (www.cgsnet.org)
Doctoral Initiative on Minority Attrition and Completionviii
ACKNOWLEDGMENTS
Many organizations and individuals deserve special acknowledgment for their participation in and commitment to the Doctoral Initiative on Minority Attrition and Completion
(DIMAC). From the inception of the project to this publication, the collective participation of so many individuals made DIMAC the success that it is. First, this project would not have been possible without the generous support of the National Science Foundation (grant #1138814, originally titled Completion and Attrition in AGEP and non-AGEP Institutions), a long-standing supporter of diversity and inclusiveness in the fields of science, technology, engineering, and mathematics. Its leadership keeps advancing scientific innovations and achievements in all respects. We also want to acknowledge the contribution of members of the selection advisory committee: Charlotte Kuh (National Research Council, retired), Michael Nettles (Educational Testing Service), Lewis Siegel (Duke University), Mark J.T. Smith (Purdue University), and Janet A. Weiss (University of Michigan). The project benefited greatly from their collective wisdom in selecting the following 21 institutions: Brown University; Drexel University; Florida International University; Florida State University; Loyola University Chicago; Mississippi State University; New Mexico State University; North Carolina State University; Northwestern University; Princeton University; Texas A&M University; the University of California, Irvine; the University of California, San Diego; the University of Central Florida; the University of Georgia; the University of Illinois, Urbana-Champaign; the University of Iowa; the University of Maryland, Baltimore County; the University of Mississippi; the University of Missouri; and the University of South Florida. We owe our deep thanks to the graduate deans at each of these 21 partner institutions for their willingness to bring their institutions on board for this project. As campus principal investigators, they shared
Doctoral Initiative on Minority Attrition and Completion ix
the responsibility for overseeing a substantial data collection exercise, which we know was not always easy. We know that we speak for the graduate deans when we extend a special note of gratitude to co-principal investigators and project staff at each participating institution for their contributions to this project. We also want to express our appreciation to the 16 campuses that hosted us for site visits during this project. We are grateful to all of the former and current doctoral students, graduate faculty, staff, and administrators who participated in the various data collection efforts and provided the basis for the analyses in this report. Finally, we also want to extend a special word of thanks to three individuals in particular, Sam Attoh (Loyola University Chicago), John Keller (University of Iowa), and Frances Leslie (University of California, Irvine) for reviewing the draft report. It is also fitting that we recognize the contributions of the CGS staff for their leadership on this project in particular and on diversity and inclusiveness in general. We especially want to thank Debra Stewart for her vision and leadership that made this project possible. We also want to thank Suzanne T. Ortega, Beth B. Buehlmann, and Daniel Denecke for their review of the report; Julia Kent for her role in preparing communications about the important findings; Nate Thompson for his work to produce the publication; Margaret King for her copyediting assistance; and to the other current and former staff members for their supporting roles in production of this publication.
ACKNOWLEDGMENTS
Doctoral Initiative on Minority Attrition and Completionx
FOREWORD
Doctoral education can be credited for any number of scientific, literary, and intellectual achievements, and those U.S. institutions that confer doctoral degrees are often regarded as being of the
highest quality in the world. Underrepresented minority (URM) students, however, have not participated in doctoral education at the same rate as their peers, a trend that is particularly acute in science, technology, engineering, and mathematics (STEM) fields. America’s capacity to meet STEM workforce demands of the future will undoubtedly be compromised if this state of underrepresentation is allowed to persist. For decades, institutions and doctoral programs have been taking steps to improve doctoral education for everyone, including URMs. Federal programs such as the National Science Foundation’s Alliances for Graduate Education and the Professoriate, among others, have been established specifically to support URM students in STEM doctoral programs. The Council of Graduate Schools (CGS) made important headway in the understanding of doctoral completion and attrition, namely through the PhD Completion Project, an initiative that was able to estimate completion and attrition rates for doctoral students in a range of fields of study and disaggregate the findings by select demographic characteristics. While the PhD Completion Project provided estimates for completion rates for students by race/ethnicity, the estimates were based upon a small number of URM doctoral students. The Doctoral Initiative on Minority Attrition and Completion (DIMAC) takes our understanding of completion and attrition among URM STEM students one step further by collecting both quantitative and qualitative data exclusively on this population from 21 participating institutions, yielding the largest dataset of its kind. This publication reports and synthesizes the findings of the project in order to better inform graduate deans at CGS member institutions as well as the general public.
Doctoral Initiative on Minority Attrition and Completion 1
CHAPTER 1. INTRODUCTION
The participation of underrepresented minority (URM) students, particularly Black/African American, American Indian/Alaska Native, and Hispanic/Latino students in doctoral programs in
science, technology, engineering, and mathematics (STEM) fields, is an issue of national concern. Over the past several decades, this issue has been of great interest to higher education researchers and policymakers (see Council of Graduate Schools [CGS], 2009; National Research Council [NRC], 1995; National Science Foundation [NSF], 2006; Nettles & Millet, 2006 for examples). There have been major initiatives by CGS, NSF, and others to increase URM representation. Indeed, the rate of increase in the number of URM students completing doctoral degrees over the past two decades has exceeded that of all U.S. students. However, the participation of URM students in STEM doctoral programs is still disproportionately low. For example, in academic year 2011/12, about 41,400 research doctoral degrees in STEM fields were conferred at U.S. institutions that award doctoral degrees as the highest degree, but only 8.5% of these degrees were awarded to URM students (National Center for Education Statistics [NCES], 2013). In the same year, by contrast, URM students earned 21% percent of the bachelor’s degrees granted in the U.S. (NCES, 2013). The problem of underrepresentation of race/ethnic minorities in STEM doctoral programs is magnified by the fact that in comparison with those of all STEM doctoral students, their completion rates tend to be lower and attrition rates tend to be higher. While past efforts have explored degree completion and attrition of doctoral students in the arts and sciences (see Bowen & Rudenstine, 1992; Lovitts, 2001; Most, 2008; Nettles & Millett, 2006; Sowell, Zhang, & Redd, 2008a), there has not been a recent effort devoted solely to understanding degree completion and attrition of
Doctoral Initiative on Minority Attrition and Completion2
INTRODUCTION
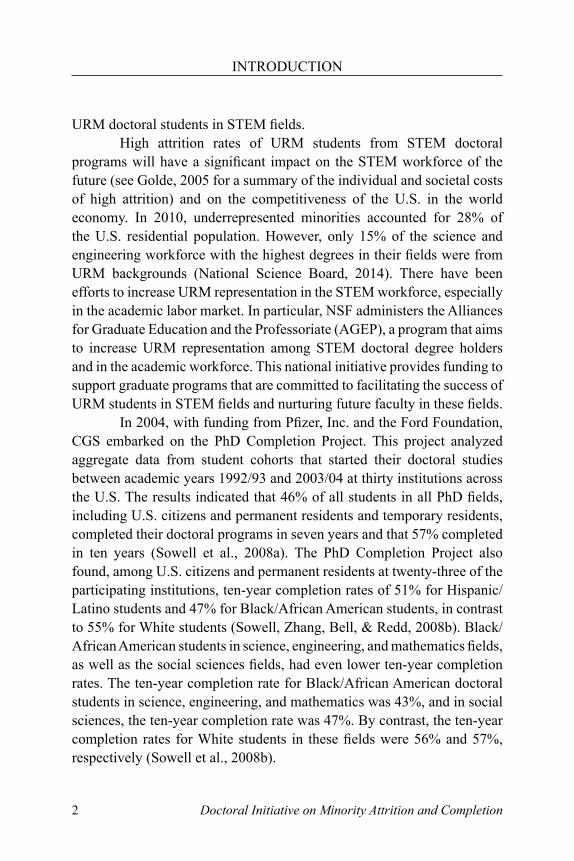
URM doctoral students in STEM fields. High attrition rates of URM students from STEM doctoral programs will have a significant impact on the STEM workforce of the future (see Golde, 2005 for a summary of the individual and societal costs of high attrition) and on the competitiveness of the U.S. in the world economy. In 2010, underrepresented minorities accounted for 28% of the U.S. residential population. However, only 15% of the science and engineering workforce with the highest degrees in their fields were from URM backgrounds (National Science Board, 2014). There have been efforts to increase URM representation in the STEM workforce, especially in the academic labor market. In particular, NSF administers the Alliances for Graduate Education and the Professoriate (AGEP), a program that aims to increase URM representation among STEM doctoral degree holders and in the academic workforce. This national initiative provides funding to support graduate programs that are committed to facilitating the success of URM students in STEM fields and nurturing future faculty in these fields. In 2004, with funding from Pfizer, Inc. and the Ford Foundation, CGS embarked on the PhD Completion Project. This project analyzed aggregate data from student cohorts that started their doctoral studies between academic years 1992/93 and 2003/04 at thirty institutions across the U.S. The results indicated that 46% of all students in all PhD fields, including U.S. citizens and permanent residents and temporary residents, completed their doctoral programs in seven years and that 57% completed in ten years (Sowell et al., 2008a). The PhD Completion Project also found, among U.S. citizens and permanent residents at twenty-three of the participating institutions, ten-year completion rates of 51% for Hispanic/Latino students and 47% for Black/African American students, in contrast to 55% for White students (Sowell, Zhang, Bell, & Redd, 2008b). Black/African American students in science, engineering, and mathematics fields, as well as the social sciences fields, had even lower ten-year completion rates. The ten-year completion rate for Black/African American doctoral students in science, engineering, and mathematics was 43%, and in social sciences, the ten-year completion rate was 47%. By contrast, the ten-year completion rates for White students in these fields were 56% and 57%, respectively (Sowell et al., 2008b).
Doctoral Initiative on Minority Attrition and Completion 3
INTRODUCTION
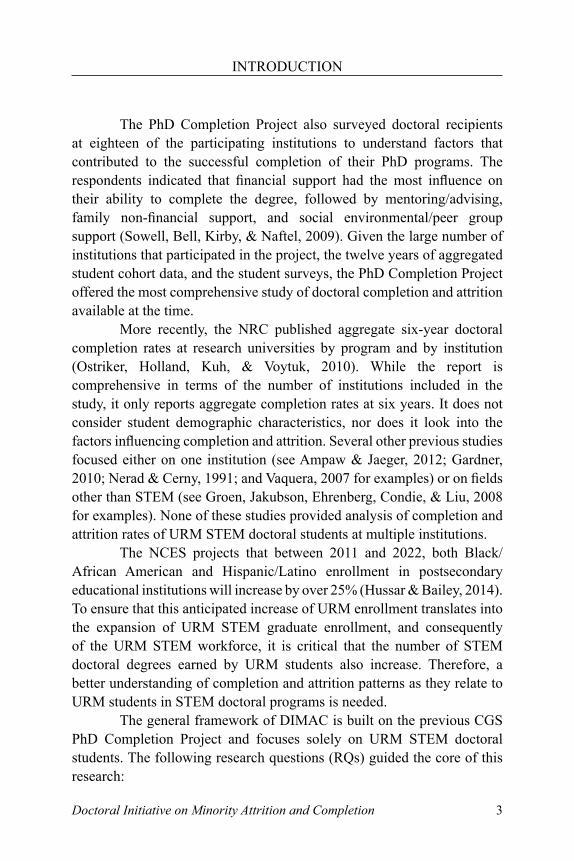
The PhD Completion Project also surveyed doctoral recipients at eighteen of the participating institutions to understand factors that contributed to the successful completion of their PhD programs. The respondents indicated that financial support had the most influence on their ability to complete the degree, followed by mentoring/advising, family non-financial support, and social environmental/peer group support (Sowell, Bell, Kirby, & Naftel, 2009). Given the large number of institutions that participated in the project, the twelve years of aggregated student cohort data, and the student surveys, the PhD Completion Project offered the most comprehensive study of doctoral completion and attrition available at the time. More recently, the NRC published aggregate six-year doctoral completion rates at research universities by program and by institution (Ostriker, Holland, Kuh, & Voytuk, 2010). While the report is comprehensive in terms of the number of institutions included in the study, it only reports aggregate completion rates at six years. It does not consider student demographic characteristics, nor does it look into the factors influencing completion and attrition. Several other previous studies focused either on one institution (see Ampaw & Jaeger, 2012; Gardner, 2010; Nerad & Cerny, 1991; and Vaquera, 2007 for examples) or on fields other than STEM (see Groen, Jakubson, Ehrenberg, Condie, & Liu, 2008 for examples). None of these studies provided analysis of completion and attrition rates of URM STEM doctoral students at multiple institutions. The NCES projects that between 2011 and 2022, both Black/African American and Hispanic/Latino enrollment in postsecondary educational institutions will increase by over 25% (Hussar & Bailey, 2014). To ensure that this anticipated increase of URM enrollment translates into the expansion of URM STEM graduate enrollment, and consequently of the URM STEM workforce, it is critical that the number of STEM doctoral degrees earned by URM students also increase. Therefore, a better understanding of completion and attrition patterns as they relate to URM students in STEM doctoral programs is needed. The general framework of DIMAC is built on the previous CGS PhD Completion Project and focuses solely on URM STEM doctoral students. The following research questions (RQs) guided the core of this research:
Doctoral Initiative on Minority Attrition and Completion4
INTRODUCTION
RQ1. What are the completion and attrition rates for URM students in STEM doctoral programs at the participating institutions?
RQ2. Do these URM STEM doctoral completion and attrition rates vary by student characteristics?
RQ3. How have these completion and attrition rates changed over time?
RQ4. What are the times-to-degree and times-to-attrition for URM students in STEM doctoral programs at the participating institutions?
RQ5. What activities or initiatives have been implemented by participating institutions to facilitate completion of STEM doctoral programs among URM students?
RQ6. What activities and initiatives enhance success, in terms of completion, for underrepresented minority students in STEM doctoral programs?
Unlike many prior studies, DIMAC focuses its analysis on the doctoral completion and attrition of URM STEM students at multiple institutions by using student-level data. Also, this project includes analyses of student survey and focus group data that permit a better understanding of various efforts designed to facilitate doctoral completion by URM STEM students. This report consists of five chapters. Following this introductory chapter, the report presents the research design, which details data collection and analysis methods and procedures. Chapter 3 examines completion and attrition rates of URM STEM doctoral students. Chapter 4 utilizes results from program inventories, student surveys, and site visits to identify the types of activities and initiatives implemented by participating institutions to enhance student success. The report concludes with a summary of findings, a set of recommendations, and suggestions for future research.
Doctoral Initiative on Minority Attrition and Completion 5
CHAPTER 2. DATA AND METHODS
This chapter describes the data collection and analysis employed in the project. The Doctoral Initiative on Minority Attrition and Completion (DIMAC) selected 21 institutions (see Appendix A for
the full list of institutions), based on responses to a Request for Proposals (RFP) issued by the Council of Graduate Schools (CGS) to all of its U.S. institutional members (see Appendix B for the RFP). A selection advisory committee appointed by CGS reviewed all proposals and, guided by criteria articulated in the research design, recommended 21 institutions to receive sub-awards (see Appendix C for the selection advisory committee membership). Each selected institution received up to $30,000 to cover the costs of implementing various project requirements. The awardee institutions included a mix of institutions that participated in the National Science Foundation’s (NSF) Alliance for Graduate Education and the Professoriate (AGEP) program, in the CGS PhD Completion Project, in both of these programs, or in neither of them. The data for this project comprise four parts: student-level enrollment data; an inventory of policies, practices, and interventions; a student survey; and information obtained from focus group interviews with students and university personnel during site visits to 16 institutions conducted throughout 2013 (see Appendix D for the list of site visits). At each institution, the graduate dean served as the principal investigator (PI) and acted as a point of contact for the CGS research team. Data collection efforts were collaborations between CGS researchers and participating institutions; however, imputation and analysis of data were the responsibility of CGS researchers. CGS assured the institutions, as well as survey and focus group interview participants that all data collected would be treated as confidential and not be reported in a way that could be attributed to a particular institution or individual. All components of data collection methods were shared with Institutional Review Boards at each of the 21 participating institutions.
Doctoral Initiative on Minority Attrition and Completion6
In the remainder of this chapter, data collection and cleaning are discussed, and the statistical methods used to analyze the data are described.
Data Collection
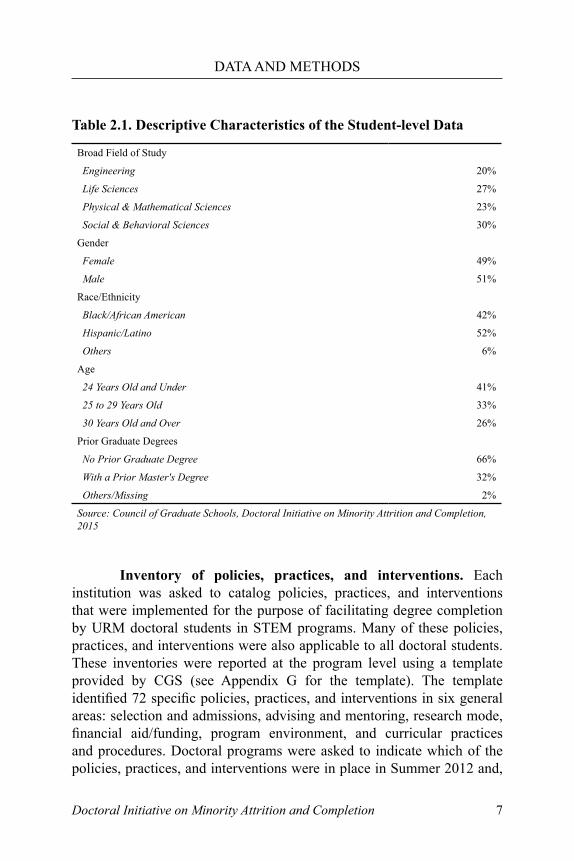
This project focuses on completion and attrition of underrepresented minority (URM) students in science, technology, engineering, and mathematics (STEM) doctoral programs and on factors that may contribute to these students’ ability to achieve their degree objectives. The phrase “underrepresented minority” refers to individuals who are U.S. citizens and permanent residents who self-identify as Black/African American, American Indian/Alaska Native, and Hispanic/Latino. “Doctoral programs” in this project refer to programs leading to Doctor of Philosophy (PhD) and Doctor of Engineering (DEng) degrees. The complete list of doctoral programs included in this project can be found in Appendix E. Doctoral programs were aggregated into four broad fields of study: engineering, life sciences (including health sciences), physical & mathematical sciences, and social & behavioral sciences. The position of particular programs within the four broad fields was largely based on the taxonomy used by the National Research Council (Ostriker et al., 2010) and in the CGS/GRE Survey of Graduate Enrollment and Degrees (Allum, 2014). Student-level enrollment data. Each institution completed an instrument (Appendix F) reporting student-level enrollment data for all URM students who entered STEM doctoral programs between the academic years 1992/93 and 2011/12. The following key variables were included: field of study; month and year of doctoral enrollment, student demographics, prior graduate degree awarded, candidacy, completion or attrition; and enrollment status as of June 30, 2012. Only records with all of these components were included in the analysis. The CGS research team reviewed all data submitted by the institutions and identified inconsistencies and missing data. Institutions were given the opportunity to revise and correct data problems as identified by CGS researchers. The project includes 7,575 URM STEM doctoral students who entered their programs between May 1992 and April 2012 at the 21 participating institutions. Table 2.1 presents their basic descriptive characteristics.
DATA AND METHODS
Doctoral Initiative on Minority Attrition and Completion 7
Inventory of policies, practices, and interventions. Each institution was asked to catalog policies, practices, and interventions that were implemented for the purpose of facilitating degree completion by URM doctoral students in STEM programs. Many of these policies, practices, and interventions were also applicable to all doctoral students. These inventories were reported at the program level using a template provided by CGS (see Appendix G for the template). The template identified 72 specific policies, practices, and interventions in six general areas: selection and admissions, advising and mentoring, research mode, financial aid/funding, program environment, and curricular practices and procedures. Doctoral programs were asked to indicate which of the policies, practices, and interventions were in place in Summer 2012 and,
DATA AND METHODS
Broad Field of Study
Engineering 20%
Life Sciences 27%
Physical & Mathematical Sciences 23%
Social & Behavioral Sciences 30%
Gender
Female 49%
Male 51%
Race/Ethnicity
Black/African American 42%
Hispanic/Latino 52%
Others 6%
Age
24 Years Old and Under 41%
25 to 29 Years Old 33%
30 Years Old and Over 26%
Prior Graduate Degrees
No Prior Graduate Degree 66%
With a Prior Master's Degree 32%
Others/Missing 2%
Source: Council of Graduate Schools, Doctoral Initiative on Minority Attrition and Completion, 2015
Table 2.1. Descriptive Characteristics of the Student-level Data
Doctoral Initiative on Minority Attrition and Completion8
DATA AND METHODS
for those that were in place, the number of years each had been in place. Individual templates from programs were consolidated into one data file for analysis by CGS researchers. Inventories of programs were included in this dataset. Doctoral Student Survey. Each institution was asked to disseminate the Doctoral Student Survey to all URM STEM doctoral students enrolled at their institutions in Fall 2012 (see Appendix H for the survey instrument). The survey instrument included a range of questions regarding students’ perceptions of program climate, the student experience, and factors perceived to influence their ability to complete their doctoral programs. The online survey was administered during the Fall 2012 term, and some participating institutions elected to provide small incentives for survey respondents. Responses were collected by the institutions and forwarded to CGS researchers, who consolidated the responses into one dataset for analyses. A total of 1,640 valid survey responses were received, for a response rate of approximately 69%. Table 2.2 presents their basic descriptive characteristics. Focus group interviews. During the site visits, the CGS researchers conducted focus group interviews with currently enrolled URM STEM doctoral students, as well as with university personnel, including staff members for diversity-related projects, admission and enrollment management officials, faculty members, graduate program directors/chairs, college deans and associate deans, and deans and associate deans for graduate education. While institutions were responsible for recruiting participants for these focus groups, all focus group sessions were facilitated by CGS researchers in order to maintain confidentiality. Some participating institutions offered small incentives for participants, including refreshments. Generally, student sessions were organized by candidacy status of participants, and sessions with university personnel were organized by their job responsibilities in relation to URM STEM doctoral students (e.g., graduate program directors, URM outreach coordinators, academic advisors, etc.). The focus group interviews for students were semi-structured and typically included the following topics: students’ reasons for choosing the particular program and institution; their interactions with advisors, mentors, and peers; their perceptions of program climate; and their sources for financing their doctoral education (see Appendix I for the protocol). Students participating in the focus groups were also invited to complete a
Doctoral Initiative on Minority Attrition and Completion 9
DATA AND METHODS
Broad Field of Study
Engineering 19%
Life Sciences 34%
Physical & Mathematical Sciences 22%
Social & Behavioral Sciences 25%
Candidacy Status
Pre-candidadate 49%
Candidate 51%
Gender
Female 53%
Male 47%
Race/Ethnicity
Black/African American 33%
Hispanic/Latino 58%
Others 9%
Age
24 Years Old and Under 23%
25 to 29 Years Old 45%
30 Years Old and Over 32%
Parents Have an Undergraduate Degree 62%
Parents Have a Graduate Degree 37%
Received Pell Grant for Undergraduate Education 44%
Attended Minority Serving Institutions for Undergraduate 21%
Source: Council of Graduate Schools, Doctoral Initiative on Minority Attrition and Completion, 2015
Table 2.2. Demographic Characteristics of the Doctoral Student Survey Respondents
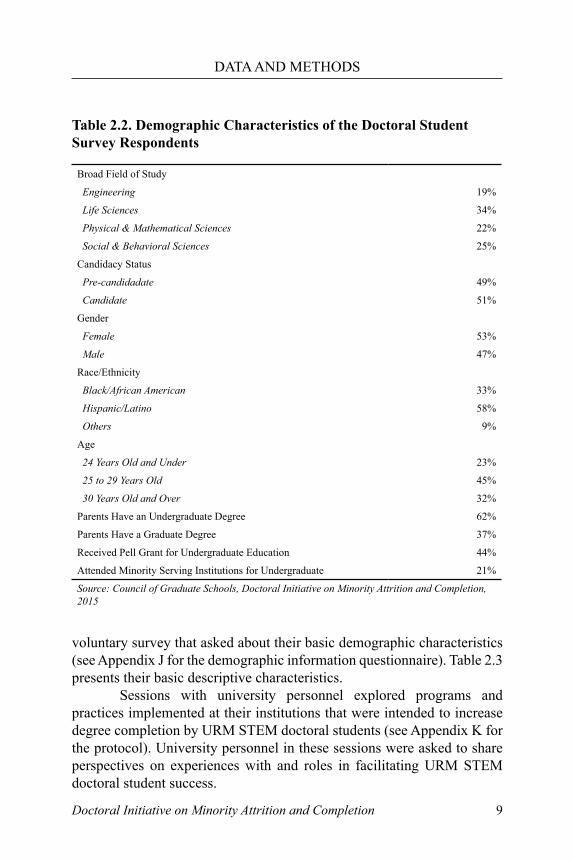
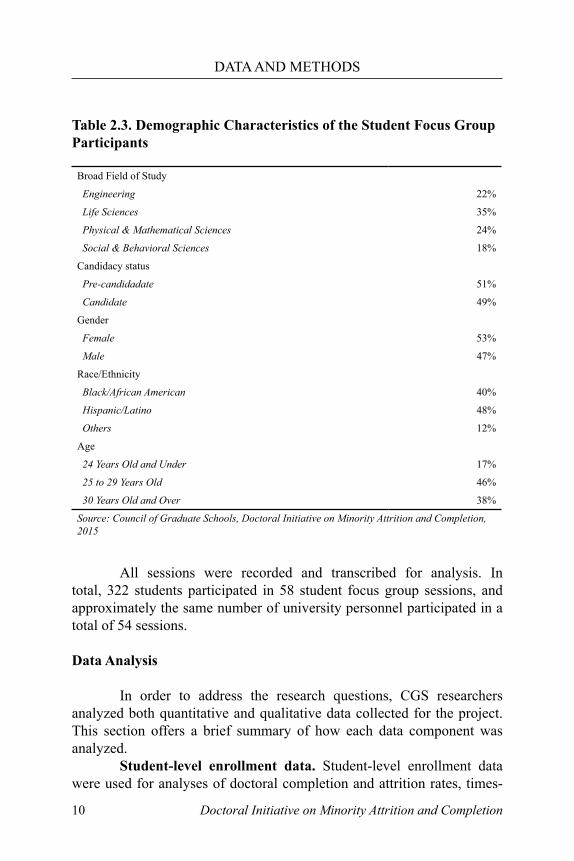
voluntary survey that asked about their basic demographic characteristics (see Appendix J for the demographic information questionnaire). Table 2.3 presents their basic descriptive characteristics. Sessions with university personnel explored programs and practices implemented at their institutions that were intended to increase degree completion by URM STEM doctoral students (see Appendix K for the protocol). University personnel in these sessions were asked to share perspectives on experiences with and roles in facilitating URM STEM doctoral student success.
Doctoral Initiative on Minority Attrition and Completion10
DATA AND METHODS
Broad Field of Study
Engineering 22%
Life Sciences 35%
Physical & Mathematical Sciences 24%
Social & Behavioral Sciences 18%
Candidacy status
Pre-candidadate 51%
Candidate 49%
Gender
Female 53%
Male 47%
Race/Ethnicity
Black/African American 40%
Hispanic/Latino 48%
Others 12%
Age
24 Years Old and Under 17%
25 to 29 Years Old 46%
30 Years Old and Over 38%
Source: Council of Graduate Schools, Doctoral Initiative on Minority Attrition and Completion, 2015
Table 2.3. Demographic Characteristics of the Student Focus Group Participants
All sessions were recorded and transcribed for analysis. In total, 322 students participated in 58 student focus group sessions, and approximately the same number of university personnel participated in a total of 54 sessions.
Data Analysis
In order to address the research questions, CGS researchers analyzed both quantitative and qualitative data collected for the project. This section offers a brief summary of how each data component was analyzed. Student-level enrollment data. Student-level enrollment data were used for analyses of doctoral completion and attrition rates, times-
Doctoral Initiative on Minority Attrition and Completion 11
DATA AND METHODS
to-degree, and times-to-attrition. Completion and attrition rates were calculated as percentages of students who earned doctoral degrees or left their programs, respectively, within a given set of students and within a defined number of months after starting their programs. Seven-year completion and attrition rates were calculated as percentages of students who completed or left their programs, respectively, within 84 months of their starting dates. The analysis of seven-year completion and attrition rates was based on records of 3,829 URM STEM students who started doctoral study between May 1992 and April 2005 (See Appendix L for basic characteristics). Cumulative ten-year completion rates were calculated as percentages of students who started their doctoral study between May 1992 and April 2002. The analysis includes 2,530 URM STEM doctoral students at the participating institutions (see Appendix M for basic characteristics). Time-to-degree was computed as the number of months from the time a student started a doctoral program until the student earned the doctorate. Likewise, time-to-attrition was computed as the time from which a student started a doctoral program until the student dropped out of the doctoral program. The analysis is focused on median times-to-degree and median times-to-attrition, and included all 7,575 URM students who started their doctoral degrees between May 1992 and April 2012 and who completed or withdrew, respectively, before the end of June 2012. Completion and attrition rates, as well as median times-to-degree and median times-to-attrition, were analyzed by the following four student characteristics: broad field of study, gender, race/ethnicity, and prior graduate degree status. These student characteristics were collected as a part of the student-level enrollment data. In addition, the following institutional characteristics were reported in this project: institutional control (i.e., public vs. private, not-for-profit), and Carnegie Classification (i.e., very high research activity, high research activity). Furthermore, seven-year completion and attrition rates were disaggregated by academic year groups. The academic year for enrollment purposes was defined as May of one calendar year through April of the next calendar year to accommodate institutions on both the semester system and the quarter system. Summer sessions for students starting their graduate programs at institutions on the semester system typically start in May. The academic year for degree completion and attrition was defined
Doctoral Initiative on Minority Attrition and Completion12
DATA AND METHODS
as July of one year through June of the next to accommodate institutions on the quarter system, where the Spring quarter typically ends in June. Because each academic year included in this project had too few students for comparison by individual academic years, the years were bundled together into academic year groups. Academic year groups were defined as follows: Group 1, academic years 1992/93 to 1995/96; Group 2, academic years 1996/97 to 1999/2000; Group 3, academic years 2000/01 to 2002/03; and Group 4, academic years 2003/04 and 2004/05. These groups were used to compare seven-year doctoral completion and attrition rates over time. Inventory of policies, practices, and interventions. Inventories from individual programs were aggregated into one large database of policies, practices, and interventions. The data were tallied by each item and reported in aggregated form. Doctoral Student Survey data. Survey responses were summarized in frequency tables. The analysis focused on four key areas of student responses: program climate, student experiences, program factors, and personal factors. In order to understand the experiences of students in their doctoral programs, frequencies were ranked within these four areas. In addition, frequency distributions were disaggregated by two student characteristics: candidacy status and race/ethnicity. Focus group interviews. CGS researchers independently reviewed transcripts of the student focus group and group-meeting sessions and generated field notes, which summarized reflections on major themes that emerged related to degree completion and attrition of URM STEM doctoral students. Notes were then compared and validated across researchers. Chapter Summary
This project is the most comprehensive large-scale study of completion and attrition among URM STEM doctoral students ever conducted. The quantitative data make possible the fullest description to date of completion and attrition rates among URM STEM doctoral students, as well as time-to-degree and time-to-attrition. The qualitative data from URM STEM doctoral students, as well as from university personnel, allow the project to triangulate the perspectives of both groups, giving insights into possible programmatic recommendations.
Doctoral Initiative on Minority Attrition and Completion 13
DATA AND METHODS
In the two following chapters, results of the data analyses are presented and discussed. In Chapter 3, the results from the analysis of student-level enrollment data are presented. Chapter 4 presents findings from program inventories, student surveys, and focus group sessions with students and university personnel during site visits. Chapter 5 summarizes the findings and offers recommendations for future research.
Doctoral Initiative on Minority Attrition and Completion14
CHAPTER 3. RESULTS FROM THE ANALYSIS OF STUDENT-LEVEL ENROLLMENT DATA
This chapter reports findings from the analysis of student-level enrollment data for underrepresented minority (URM) students in science, technology, engineering, and mathematics (STEM)
doctoral programs at 21 participating institutions, by addressing the following research questions:
RQ1. What are the completion and attrition rates for URM students in STEM doctoral programs at the participating institutions?
RQ2. Do these URM STEM doctoral completion and attrition rates vary by student characteristics?
RQ3. How have these completion and attrition rates changed over time?
RQ4. What are the times-to-degree and times-to-attrition for URM students in STEM doctoral programs at the participating institutions?
The analysis of seven-year completion and attrition rates by select student characteristics of STEM URM doctoral students comes first. This is followed by findings on cumulative ten-year completion rates. In addition, this chapter presents data on time-to-degree and time-to-attrition for URM students who completed or dropped out of their STEM doctoral programs
Doctoral Initiative on Minority Attrition and Completion 15
RESULTS FROM THE ANALYSIS OF STUDENT-LEVEL ENROLLMENT DATA
by student characteristics. This chapter concludes with a summary and a brief discussion of the findings.
Seven-year Completion and Attrition Rates
Among the 3,829 URM STEM doctoral students in the project population who started their doctoral studies prior to April 2005, 44% of them earned doctorates within seven years, while 36% of them withdrew from their respective graduate programs during the same time period. After seven years, 20% of the students were still enrolled in their doctoral programs. Seven-year completion and attrition rates were disaggregated by the following student characteristics: field of study, gender, race/ethnicity, and prior graduate degree. In this section, completion and attrition rates are reported for each of these characteristics. Field of study. Previous studies of doctoral completion and attrition reported significant field effects. For example, Bowen and Rudenstine (1992) and Nettles and Millett (2006) found that students in the natural sciences completed at higher rates than students in the social sciences, a finding that was consistent with that of the Council of Graduate Schools’ (CGS) PhD Completion Project (Sowell et al., 2008a). The latter study also found that attrition rates were consistently higher for students in the physical & mathematical sciences than they were for students in all other broad fields. The study also found that attrition rates for the other STEM fields (engineering, life sciences, and social sciences) were essentially the same for years seven through ten. While the prior CGS study examined whether field effects varied by race/ethnicity or were the same for underrepresented minorities, the sample size for the study was small. In order to address this gap, the STEM doctoral programs at the 21 institutions represented in this project were grouped into four broad field categories: engineering, life sciences, physical & mathematical sciences, and social & behavioral sciences, and completion and attrition rates were determined for students in each of these broad fields. Seven-year completion rates for each of these broad fields are reported in Figure 3.1. The seven-year completion rate for students in engineering was 48% and the seven-year attrition rate was 36%. For life sciences students, the seven-year completion rate was 52% and the
Doctoral Initiative on Minority Attrition and Completion16
RESULTS FROM THE ANALYSIS OF STUDENT-LEVEL ENROLLMENT DATA
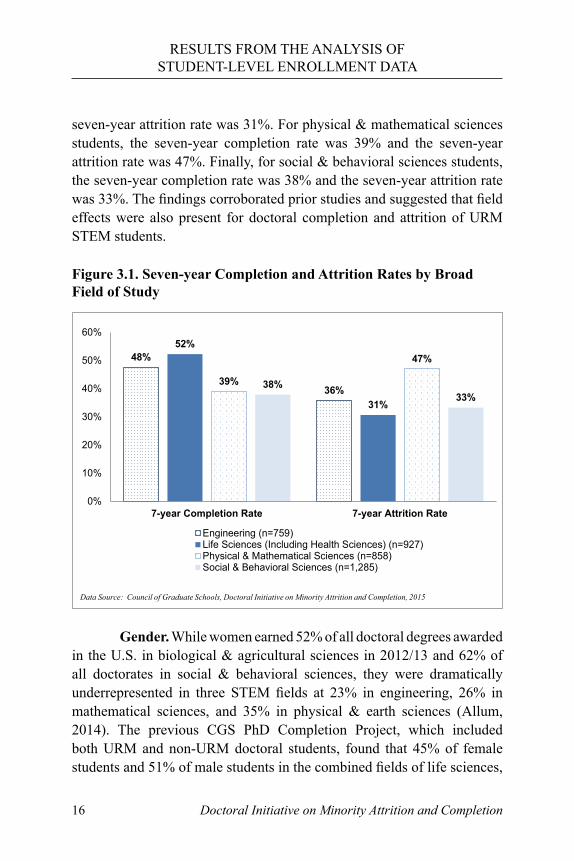
seven-year attrition rate was 31%. For physical & mathematical sciences students, the seven-year completion rate was 39% and the seven-year attrition rate was 47%. Finally, for social & behavioral sciences students, the seven-year completion rate was 38% and the seven-year attrition rate was 33%. The findings corroborated prior studies and suggested that field effects were also present for doctoral completion and attrition of URM STEM students.
Figure 3.1. Seven-year Completion and Attrition Rates by Broad Field of Study
48%
36%
52%
31%
39%
47%
38%33%
0%
10%
20%
30%
40%
50%
60%
7-year Completion Rate 7-year Attrition Rate
Engineering (n=759)Life Sciences (Including Health Sciences) (n=927)Physical & Mathematical Sciences (n=858)Social & Behavioral Sciences (n=1,285)
Data Source: Council of Graduate Schools, Doctoral Initiative on Minority Attrition and Completion, 2015
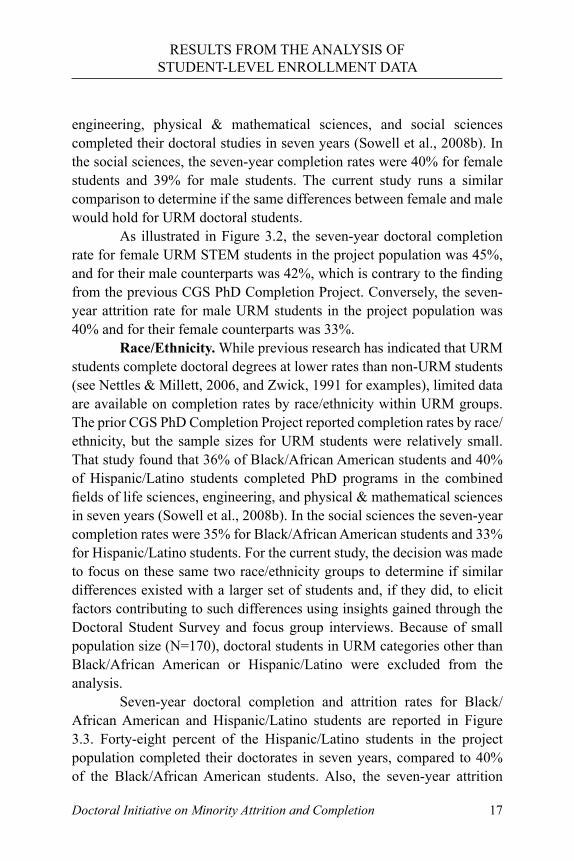
Gender. While women earned 52% of all doctoral degrees awarded in the U.S. in biological & agricultural sciences in 2012/13 and 62% of all doctorates in social & behavioral sciences, they were dramatically underrepresented in three STEM fields at 23% in engineering, 26% in mathematical sciences, and 35% in physical & earth sciences (Allum, 2014). The previous CGS PhD Completion Project, which included both URM and non-URM doctoral students, found that 45% of female students and 51% of male students in the combined fields of life sciences,
Doctoral Initiative on Minority Attrition and Completion 17
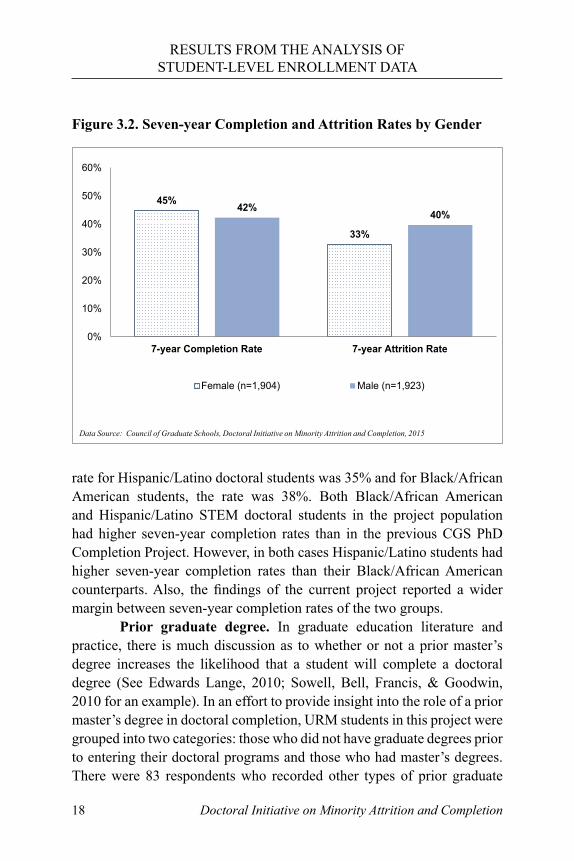
RESULTS FROM THE ANALYSIS OF STUDENT-LEVEL ENROLLMENT DATA
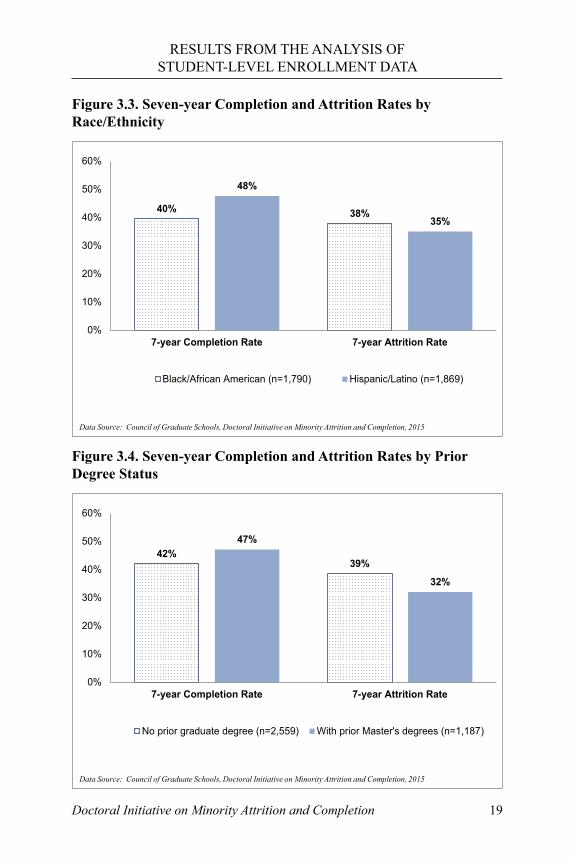
engineering, physical & mathematical sciences, and social sciences completed their doctoral studies in seven years (Sowell et al., 2008b). In the social sciences, the seven-year completion rates were 40% for female students and 39% for male students. The current study runs a similar comparison to determine if the same differences between female and male would hold for URM doctoral students. As illustrated in Figure 3.2, the seven-year doctoral completion rate for female URM STEM students in the project population was 45%, and for their male counterparts was 42%, which is contrary to the finding from the previous CGS PhD Completion Project. Conversely, the seven-year attrition rate for male URM students in the project population was 40% and for their female counterparts was 33%. Race/Ethnicity. While previous research has indicated that URM students complete doctoral degrees at lower rates than non-URM students (see Nettles & Millett, 2006, and Zwick, 1991 for examples), limited data are available on completion rates by race/ethnicity within URM groups. The prior CGS PhD Completion Project reported completion rates by race/ethnicity, but the sample sizes for URM students were relatively small. That study found that 36% of Black/African American students and 40% of Hispanic/Latino students completed PhD programs in the combined fields of life sciences, engineering, and physical & mathematical sciences in seven years (Sowell et al., 2008b). In the social sciences the seven-year completion rates were 35% for Black/African American students and 33% for Hispanic/Latino students. For the current study, the decision was made to focus on these same two race/ethnicity groups to determine if similar differences existed with a larger set of students and, if they did, to elicit factors contributing to such differences using insights gained through the Doctoral Student Survey and focus group interviews. Because of small population size (N=170), doctoral students in URM categories other than Black/African American or Hispanic/Latino were excluded from the analysis. Seven-year doctoral completion and attrition rates for Black/African American and Hispanic/Latino students are reported in Figure 3.3. Forty-eight percent of the Hispanic/Latino students in the project population completed their doctorates in seven years, compared to 40% of the Black/African American students. Also, the seven-year attrition
Doctoral Initiative on Minority Attrition and Completion18
RESULTS FROM THE ANALYSIS OF STUDENT-LEVEL ENROLLMENT DATA
rate for Hispanic/Latino doctoral students was 35% and for Black/African American students, the rate was 38%. Both Black/African American and Hispanic/Latino STEM doctoral students in the project population had higher seven-year completion rates than in the previous CGS PhD Completion Project. However, in both cases Hispanic/Latino students had higher seven-year completion rates than their Black/African American counterparts. Also, the findings of the current project reported a wider margin between seven-year completion rates of the two groups. Prior graduate degree. In graduate education literature and practice, there is much discussion as to whether or not a prior master’s degree increases the likelihood that a student will complete a doctoral degree (See Edwards Lange, 2010; Sowell, Bell, Francis, & Goodwin, 2010 for an example). In an effort to provide insight into the role of a prior master’s degree in doctoral completion, URM students in this project were grouped into two categories: those who did not have graduate degrees prior to entering their doctoral programs and those who had master’s degrees. There were 83 respondents who recorded other types of prior graduate
Figure 3.2. Seven-year Completion and Attrition Rates by Gender
45%
33%
42%40%
0%
10%
20%
30%
40%
50%
60%
7-year Completion Rate 7-year Attrition Rate
Female (n=1,904) Male (n=1,923)
Data Source: Council of Graduate Schools, Doctoral Initiative on Minority Attrition and Completion, 2015
Doctoral Initiative on Minority Attrition and Completion 19
RESULTS FROM THE ANALYSIS OF STUDENT-LEVEL ENROLLMENT DATA
Figure 3.3. Seven-year Completion and Attrition Rates by Race/Ethnicity
40% 38%
48%
35%
0%
10%
20%
30%
40%
50%
60%
7-year Completion Rate 7-year Attrition Rate
Black/African American (n=1,790) Hispanic/Latino (n=1,869)
Data Source: Council of Graduate Schools, Doctoral Initiative on Minority Attrition and Completion, 2015
Figure 3.4. Seven-year Completion and Attrition Rates by Prior Degree Status
42%39%
47%
32%
0%
10%
20%
30%
40%
50%
60%
7-year Completion Rate 7-year Attrition Rate
No prior graduate degree (n=2,559) With prior Master's degrees (n=1,187)
Data Source: Council of Graduate Schools, Doctoral Initiative on Minority Attrition and Completion, 2015
Doctoral Initiative on Minority Attrition and Completion20
RESULTS FROM THE ANALYSIS OF STUDENT-LEVEL ENROLLMENT DATA
degrees or who did not provide information on prior degree status. These students were excluded from the analysis. The results of this analysis are shown in Figure 3.4. URM students in the project population who started their doctoral programs after receiving prior master’s degrees had a seven-year completion rate of 47% and a seven-year attrition rate of 32%. Students who started their doctoral studies without prior graduate degrees had a seven-year completion rate of 42% and a seven-year attrition rate of 39%. The findings corroborated the previous studies and suggested that effects of prior graduate degree statuses also hold for completion and attrition of STEM URM doctoral students. Interaction effects. The descriptive findings thus far suggested that within the project population, Hispanic/Latino students were more likely to earn their STEM doctorates within seven years than their Black/African American counterparts. However, the extent to which gender or field effects influenced these findings is not known from the descriptive results alone. Therefore, statistical tests (i.e., logit model in particular) were performed to further examine whether gender and field effects varied by ethnicity or whether racial/ethnic differences in gender and field distributions accounted for apparent race and ethnic differences. Results indicate that racial/ethnic differences persist after controlling for the main and interactive effects of gender and field in seven-year completion and attrition. Academic year cohort groups. A number of reform efforts and interventions at the national and institution level were implemented to increase retention of and degree completion by URM students in STEM doctoral programs during the nearly twenty-year span covered in this study. These included the National Science Foundation’s (NSF) Alliance for Graduate Education and the Professoriate (AGEP) and Bridge to the Doctorate programs, the Meyerhoff Scholars Program, McKnight Doctoral Fellowships, and the CGS PhD Completion Project (see Appendix N for an illustrative list of programs, initiatives, and associations). The aggregate seven-year URM doctoral completion and attrition rates over the years from 1992/93 to 2004/05, as presented in the previous section, do not capture potential changes that may have occurred as a result of these new interventions. Therefore, the project population for the

Doctoral Initiative on Minority Attrition and Completion 21
RESULTS FROM THE ANALYSIS OF STUDENT-LEVEL ENROLLMENT DATA
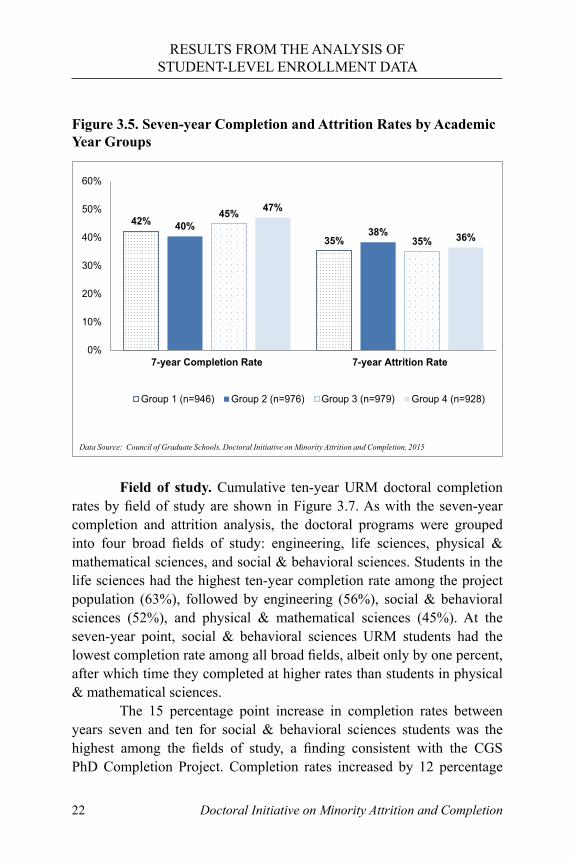
seven-year completion and attrition rates analysis was disaggregated into four cohort groups. The cohorts are as follows: Group 1 includes URM students who entered their STEM doctoral programs during academic years 1992/93 to 1995/96; Group 2, academic years 1996/97 to 1999/2000; Group 3, academic years 2000/01 to 2002/03; and Group 4, academic years 2003/04 and 2004/05. The seven-year completion and attrition rates are shown in Figure 3.5. The seven-year completion rate for Group 1 of the project population was 42%, for Group 2 was 40%, for Group 3 was 45%, and for Group 4 was 47%. The seven-year attrition rate for Group 1 of the project population was 35%, for Group 2 was 38%, for Group 3 was 35%, and for Group 4 was 36%. Seven-year completion and attrition rates by academic year cohort groups were further disaggregated by broad field of study, gender, race/ethnicity, and prior graduate degree and the results are included in Appendix O. In general, gains in seven-year completion rates were seen across broad fields, gender, race/ethnicity, and prior graduate degree when comparing the completion rates for Group 1 and Group 4. An exception was students in engineering fields. Changes in seven-year attrition rates were less distinct when comparing Group 1 against Group 4.
Cumulative Ten-year URM Doctoral Completion Rates
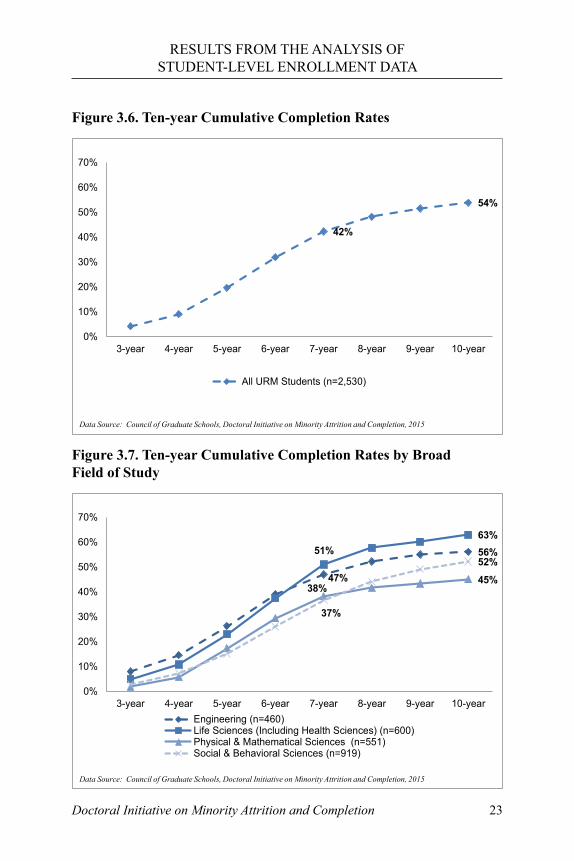
The previous CGS PhD Completion Project found that PhD completion rates for Black/African American students increased by seven percentage points in STEM fields, minus the social sciences, and by 12 percentage points in social sciences between the seventh and tenth years (Sowell et al., 2008a). The study also found that the comparable increases for Hispanic/Latino students were 14 percentage points and 21 percentage points, respectively (Sowell et al., 2008a). The current project is based on a much larger set of URM doctoral students in STEM fields, and essentially replicates these results. As shown in Figure 3.6, the ten-year completion rate for these students was 54%, and the seven-year completion rate was 42%, a 12-percentage-point increase. The results were also disaggregated by the same set of student characteristics used in the analysis of seven-year URM STEM doctoral completion and attrition rates.
Doctoral Initiative on Minority Attrition and Completion22
RESULTS FROM THE ANALYSIS OF STUDENT-LEVEL ENROLLMENT DATA
Field of study. Cumulative ten-year URM doctoral completion rates by field of study are shown in Figure 3.7. As with the seven-year completion and attrition analysis, the doctoral programs were grouped into four broad fields of study: engineering, life sciences, physical & mathematical sciences, and social & behavioral sciences. Students in the life sciences had the highest ten-year completion rate among the project population (63%), followed by engineering (56%), social & behavioral sciences (52%), and physical & mathematical sciences (45%). At the seven-year point, social & behavioral sciences URM students had the lowest completion rate among all broad fields, albeit only by one percent, after which time they completed at higher rates than students in physical & mathematical sciences. The 15 percentage point increase in completion rates between years seven and ten for social & behavioral sciences students was the highest among the fields of study, a finding consistent with the CGS PhD Completion Project. Completion rates increased by 12 percentage
Figure 3.5. Seven-year Completion and Attrition Rates by Academic Year Groups
42%
35%40% 38%
45%
35%
47%
36%
0%
10%
20%
30%
40%
50%
60%
7-year Completion Rate 7-year Attrition Rate
Group 1 (n=946) Group 2 (n=976) Group 3 (n=979) Group 4 (n=928)
Data Source: Council of Graduate Schools, Doctoral Initiative on Minority Attrition and Completion, 2015
Doctoral Initiative on Minority Attrition and Completion 23
Figure 3.7. Ten-year Cumulative Completion Rates by Broad Field of Study
47%
56%51%63%
38%45%
37%
52%
0%
10%
20%
30%
40%
50%
60%
70%
3-year 4-year 5-year 6-year 7-year 8-year 9-year 10-yearEngineering (n=460)Life Sciences (Including Health Sciences) (n=600)Physical & Mathematical Sciences (n=551)Social & Behavioral Sciences (n=919)
Data Source: Council of Graduate Schools, Doctoral Initiative on Minority Attrition and Completion, 2015
RESULTS FROM THE ANALYSIS OF STUDENT-LEVEL ENROLLMENT DATA
Figure 3.6. Ten-year Cumulative Completion Rates
42%
54%
0%
10%
20%
30%
40%
50%
60%
70%
3-year 4-year 5-year 6-year 7-year 8-year 9-year 10-year
All URM Students (n=2,530)
Data Source: Council of Graduate Schools, Doctoral Initiative on Minority Attrition and Completion, 2015
Doctoral Initiative on Minority Attrition and Completion24
RESULTS FROM THE ANALYSIS OF STUDENT-LEVEL ENROLLMENT DATA
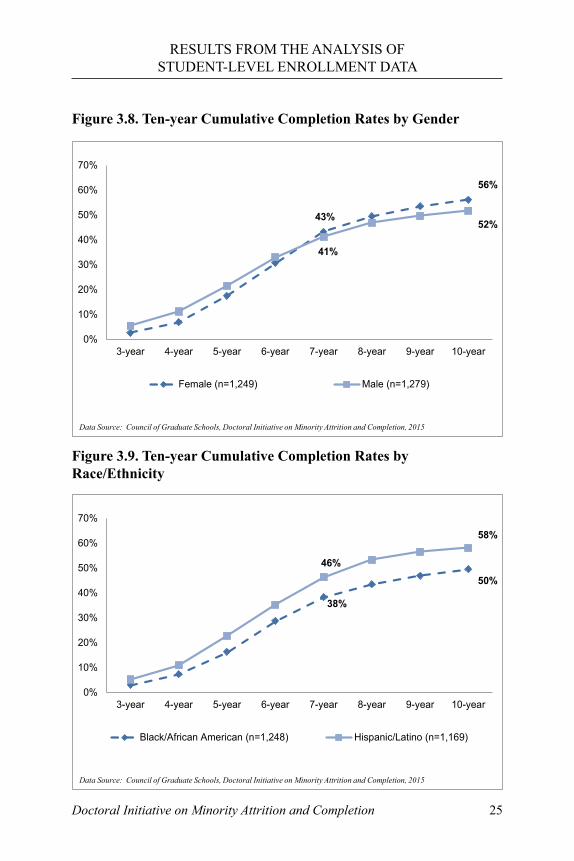
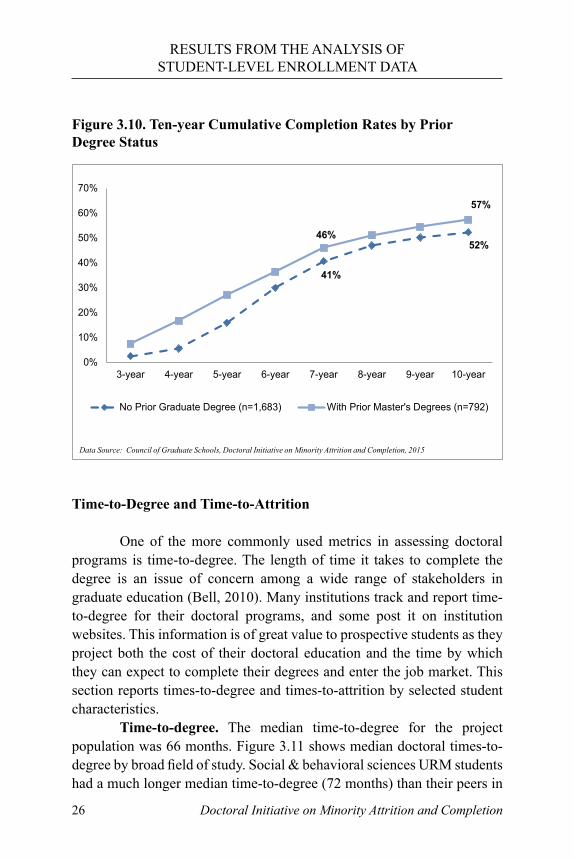
points between the seventh and tenth years for life science students, by nine percentage points for engineering students, and by seven percentage points for physical & mathematical sciences students. Gender. Figure 3.8 reports cumulative URM doctoral completion rates by gender. The ten-year completion rate for female URM students in the project population was 56% and for male URM students, it was 52%. From years three through six, female students had lower cumulative completion rates than their male counterparts; however, their completion rates surpassed those of male students after the sixth year. The completion rate for female students increased by 13 percentage points between years seven and ten, and for male students the increase was 11 percentage points over the same time period. Race/Ethnicity. Hispanic/Latino doctoral students in the project population had a ten-year completion rate of 58%, while that of their Black/African American counterparts was 50% (Figure 3.9). Between the seventh and tenth years, the completion rates for Black/African American students and Hispanic/Latino students both increased by 12 percentage points. This is contrary to the findings of the previous CGS PhD Completion Project, which reported greater percentage point gains between seventh and tenth years for Hispanic/Latino STEM doctoral students than their Black/African American counterparts. Prior graduate degree. Figure 3.10 compares the differences in completion rates between URM students without prior graduate degrees and those with prior master’s degrees. Students in the project population who started their doctoral programs after receiving master’s degrees had a ten-year completion rate of 57%, while those without any prior graduate degrees had a ten-year completion rate of 52%. Between years seven and ten, the completion rates for URM students who had prior master’s degrees and those who had no prior graduate degree both increased by 11 percentage points.
Doctoral Initiative on Minority Attrition and Completion 25
Figure 3.9. Ten-year Cumulative Completion Rates by Race/Ethnicity
38%
50%46%
58%
0%
10%
20%
30%
40%
50%
60%
70%
3-year 4-year 5-year 6-year 7-year 8-year 9-year 10-year
Black/African American (n=1,248) Hispanic/Latino (n=1,169)
Data Source: Council of Graduate Schools, Doctoral Initiative on Minority Attrition and Completion, 2015
RESULTS FROM THE ANALYSIS OF STUDENT-LEVEL ENROLLMENT DATA
Figure 3.8. Ten-year Cumulative Completion Rates by Gender
43%
56%
41%
52%
0%
10%
20%
30%
40%
50%
60%
70%
3-year 4-year 5-year 6-year 7-year 8-year 9-year 10-year
Female (n=1,249) Male (n=1,279)
Data Source: Council of Graduate Schools, Doctoral Initiative on Minority Attrition and Completion, 2015
Doctoral Initiative on Minority Attrition and Completion26
RESULTS FROM THE ANALYSIS OF STUDENT-LEVEL ENROLLMENT DATA
Time-to-Degree and Time-to-Attrition
One of the more commonly used metrics in assessing doctoral programs is time-to-degree. The length of time it takes to complete the degree is an issue of concern among a wide range of stakeholders in graduate education (Bell, 2010). Many institutions track and report time-to-degree for their doctoral programs, and some post it on institution websites. This information is of great value to prospective students as they project both the cost of their doctoral education and the time by which they can expect to complete their degrees and enter the job market. This section reports times-to-degree and times-to-attrition by selected student characteristics. Time-to-degree. The median time-to-degree for the project population was 66 months. Figure 3.11 shows median doctoral times-to-degree by broad field of study. Social & behavioral sciences URM students had a much longer median time-to-degree (72 months) than their peers in
Figure 3.10. Ten-year Cumulative Completion Rates by Prior Degree Status
41%
52%46%
57%
0%
10%
20%
30%
40%
50%
60%
70%
3-year 4-year 5-year 6-year 7-year 8-year 9-year 10-year
No Prior Graduate Degree (n=1,683) With Prior Master's Degrees (n=792)
Data Source: Council of Graduate Schools, Doctoral Initiative on Minority Attrition and Completion, 2015
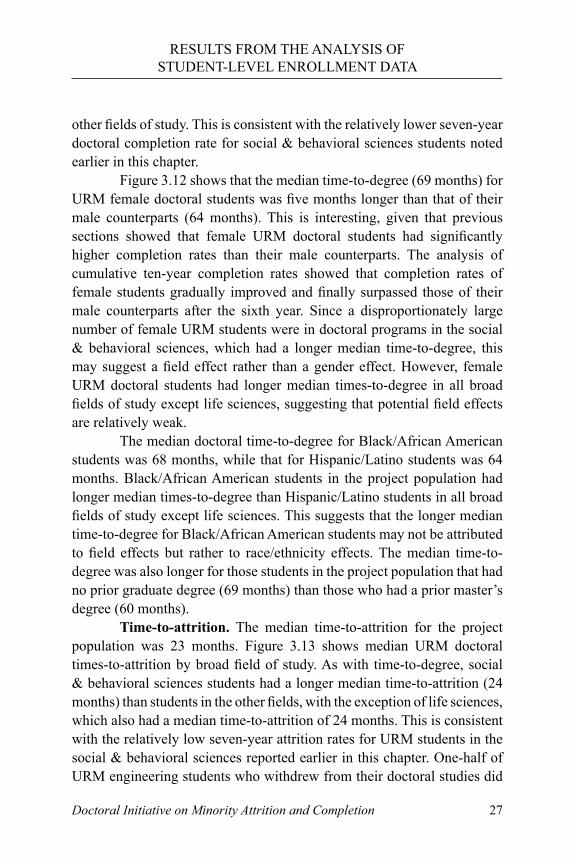
Doctoral Initiative on Minority Attrition and Completion 27
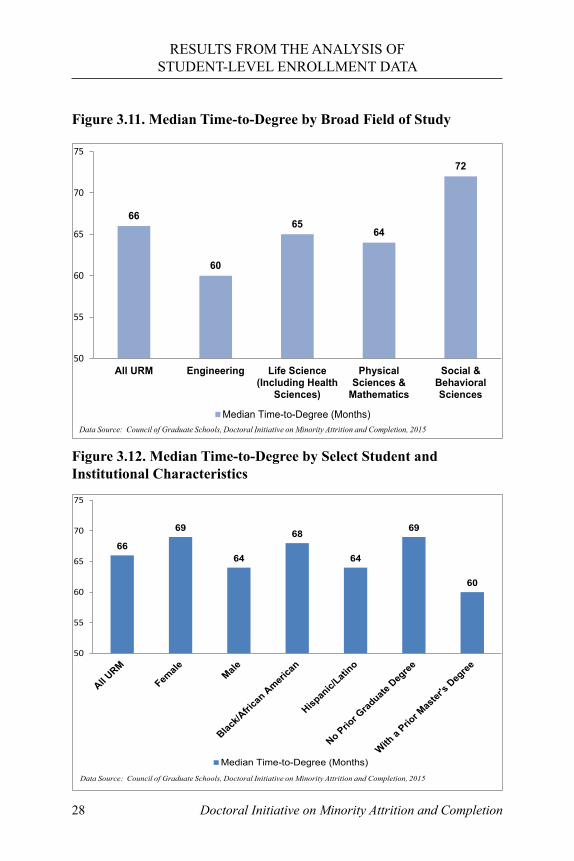
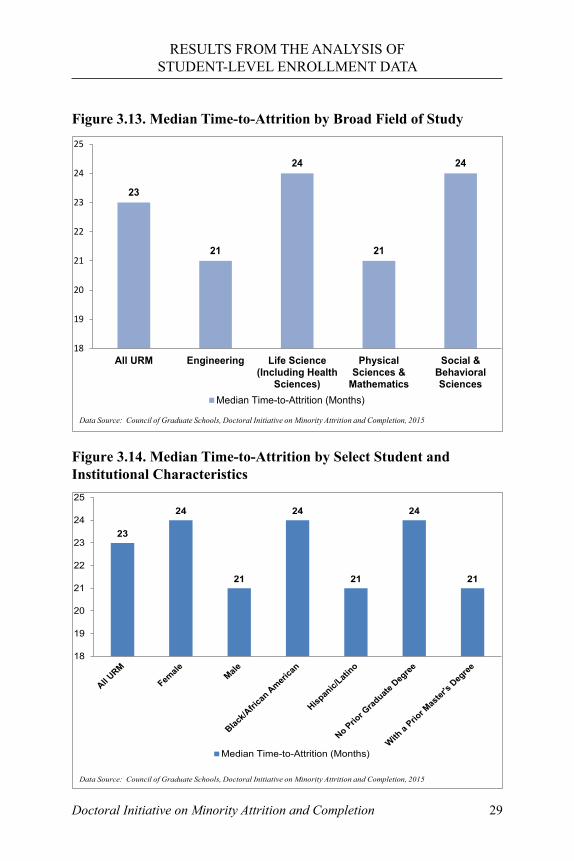
other fields of study. This is consistent with the relatively lower seven-year doctoral completion rate for social & behavioral sciences students noted earlier in this chapter. Figure 3.12 shows that the median time-to-degree (69 months) for URM female doctoral students was five months longer than that of their male counterparts (64 months). This is interesting, given that previous sections showed that female URM doctoral students had significantly higher completion rates than their male counterparts. The analysis of cumulative ten-year completion rates showed that completion rates of female students gradually improved and finally surpassed those of their male counterparts after the sixth year. Since a disproportionately large number of female URM students were in doctoral programs in the social & behavioral sciences, which had a longer median time-to-degree, this may suggest a field effect rather than a gender effect. However, female URM doctoral students had longer median times-to-degree in all broad fields of study except life sciences, suggesting that potential field effects are relatively weak. The median doctoral time-to-degree for Black/African American students was 68 months, while that for Hispanic/Latino students was 64 months. Black/African American students in the project population had longer median times-to-degree than Hispanic/Latino students in all broad fields of study except life sciences. This suggests that the longer median time-to-degree for Black/African American students may not be attributed to field effects but rather to race/ethnicity effects. The median time-to-degree was also longer for those students in the project population that had no prior graduate degree (69 months) than those who had a prior master’s degree (60 months). Time-to-attrition. The median time-to-attrition for the project population was 23 months. Figure 3.13 shows median URM doctoral times-to-attrition by broad field of study. As with time-to-degree, social & behavioral sciences students had a longer median time-to-attrition (24 months) than students in the other fields, with the exception of life sciences, which also had a median time-to-attrition of 24 months. This is consistent with the relatively low seven-year attrition rates for URM students in the social & behavioral sciences reported earlier in this chapter. One-half of URM engineering students who withdrew from their doctoral studies did
RESULTS FROM THE ANALYSIS OF STUDENT-LEVEL ENROLLMENT DATA
Doctoral Initiative on Minority Attrition and Completion28
RESULTS FROM THE ANALYSIS OF STUDENT-LEVEL ENROLLMENT DATA
Figure 3.11. Median Time-to-Degree by Broad Field of Study
66
60
6564
72
50
55
60
65
70
75
All URM Engineering Life Science(Including Health
Sciences)
PhysicalSciences &
Mathematics
Social &BehavioralSciences
Median Time-to-Degree (Months)Data Source: Council of Graduate Schools, Doctoral Initiative on Minority Attrition and Completion, 2015
Figure 3.12. Median Time-to-Degree by Select Student and Institutional Characteristics
66
69
64
68
64
69
60
50
55
60
65
70
75
Median Time-to-Degree (Months)
Data Source: Council of Graduate Schools, Doctoral Initiative on Minority Attrition and Completion, 2015
Doctoral Initiative on Minority Attrition and Completion 29
RESULTS FROM THE ANALYSIS OF STUDENT-LEVEL ENROLLMENT DATA
Figure 3.13. Median Time-to-Attrition by Broad Field of Study
23
21
24
21
24
18
19
20
21
22
23
24
25
All URM Engineering Life Science(Including Health
Sciences)
PhysicalSciences &
Mathematics
Social &BehavioralSciences
Median Time-to-Attrition (Months)
Data Source: Council of Graduate Schools, Doctoral Initiative on Minority Attrition and Completion, 2015
Figure 3.14. Median Time-to-Attrition by Select Student and Institutional Characteristics
23
24
21
24
21
24
21
18
19
20
21
22
23
24
25
Median Time-to-Attrition (Months)
Data Source: Council of Graduate Schools, Doctoral Initiative on Minority Attrition and Completion, 2015
Doctoral Initiative on Minority Attrition and Completion30
RESULTS FROM THE ANALYSIS OF STUDENT-LEVEL ENROLLMENT DATA
so in 21 months. The same was true for physical & mathematical sciences students. Figure 3.14 shows median times-to-attrition by other student characteristics. Irrespective of student characteristics, slightly over one-half of the URM students who withdrew from their doctoral programs did so within two years of starting their programs. This suggests that that the risk of URM attrition is highest during the early stages of doctoral study. However, it also means that nearly one-half of STEM URM doctoral students who withdrew did so at more advanced stages of their doctoral studies.
Chapter Summary
This chapter reports the results from the analyses of student-level enrollment data collected from the 21 participating institutions. Each of the research questions that were identified at the beginning of this chapter are addressed in this chapter, and a summary and discussion of the findings follow. Less than one-half (44%) of 3,829 URM doctoral students who entered their STEM programs at the participating institutions between May 1992 and April 2005 achieved their degree objectives within seven years, while more than one-third of them (36%) withdrew from their doctoral programs during the same time period. The results indicate that seven-year completion rates for URM STEM doctoral students for the most recent cohort (academic years 2003/04 and 2004/05) was five percent higher than that of the earliest cohort (academic years 1996/97 to 1999/2000). The results also indicate that completion and attrition rates of the project population differ by field of study, gender, and race/ethnicity, as well as prior graduate degree status of URM doctoral students, and magnitudes of effects by each student characteristic appear to vary. The next chapter discusses experiences of URM STEM doctoral students as it relates to their ability to persist and complete their degree objectives, and sheds some light on how graduate programs may be able to identify and implement policies, practices, and interventions that are aimed at multiple fronts.
Doctoral Initiative on Minority Attrition and Completion 31
RESULTS FROM THE ANALYSIS OF STUDENT-LEVEL ENROLLMENT DATA
The overall median time-to-degree for students in the study who completed their doctorates by June 2012 was 66 months. The findings from the analysis of median times-to-degree by student characteristics largely corroborated the findings from the analysis of cumulative completion rates. The median time-to-attrition was 23 months with some variations by student characteristics. However, for the most part, irrespective of these characteristics, slightly over one-half of students who withdrew from their doctoral programs did so within two years. The results from the Doctoral Student Survey and site visits discussed in the next chapter shed some light in understanding the high concentration of early attrition. The next chapter addresses common challenges faced by URM STEM doctoral students in pursuit of their doctoral degree, as well as activities and initiatives that have been implemented to enhance their success. The presentations and discussions of the analyses of the Doctoral Student Survey and other data components of this project add context to the quantitative data reported in this chapter.
Doctoral Initiative on Minority Attrition and Completion32
CHAPTER 4. ANALYSES OF PROGRAM INVENTORIES, STUDENT SURVEYS, AND SITE VISIT DATA
This chapter reports findings from the analysis of program inventories, the Doctoral Student Survey, and qualitative data derived from a series of focus groups with students and university personnel. These
data provide insights that can inform the design of policies, practices, and interventions that will increase completion rates of underrepresented minority (URM) doctoral students in science, technology, engineering, and mathematics (STEM) fields. The principal investigators (PIs) at participating institutions were asked to inventory policies, practices, and interventions in place on their respective campuses that were designed to improve retention. Similarly, the Doctoral Student Survey was administered during the Fall 2012 term to currently enrolled URM STEM doctoral students. During the spring and fall of 2013, members of the Council of Graduate Schools (CGS) research team visited 16 of the 21 institutions and conducted focus groups with URM STEM doctoral students, graduate faculty, and administrators. Based upon analyses of the program inventories, data from the Doctoral Student Survey, and site visits, the following research questions are addressed in this chapter:
RQ5. What activities or initiatives have been implemented by participating institutions to facilitate completion of STEM doctoral programs among URM students?
RQ6. What activities and initiatives enhance success, in terms of completion, for underrepresented minority students in STEM doctoral programs?
Doctoral Initiative on Minority Attrition and Completion 33
ANALYSES OF PROGRAM INVENTORIES, STUDENT SURVEYS, AND SITE VISITS DATA
This chapter begins with a descriptive analysis of the policies, practices, and interventions in place at the participating institutions, followed by an analysis of the Doctoral Student Survey data, and an analysis of transcripts from focus group sessions with students and meetings with graduate faculty and administrators. Each section concludes with a summary and brief discussion.
Policies, Practices, and Interventions
For decades, graduate schools have been implementing programs designed to expand the pipeline and ensure the success of URM STEM doctoral students, ranging from the National Science Foundation’s (NSF) programs intended to increase the interest in and preparation for doctoral studies (e.g., Alliance for Graduate Education and Professoriate (AGEP) and Louis Stokes Alliance for Minority Participation (LSAMP)) to best practices identified in CGS’ PhD Completion Project. In order to determine if such programs were in place at the 21 institutions participating in this project, inventories of policies, practices, and interventions were compiled for 603 of the 668 STEM doctoral programs at these institutions. Responses were tallied by each item in the inventory, and the length of time the policy, practice, or intervention had been in place was recorded. The inventory consists of 72 items across six broad categories: recruitment, selection, and admissions; advising and mentoring; research mode; financial aid/funding; program environment; and administrative/curricular practices and procedures. Summary figures are shown in Appendix P. While the percentages of STEM doctoral programs with a particular policy, practice, or intervention in place as of Summer 2012 varied by individual item, most of these efforts had been in place for a long period of time. Of the 72 items in the inventory, all but five had been in place longer than eight years in the majority of the programs. Only five items at 10% of the programs had been in place for less than one year. The following section discusses the frequency of specific inventory items within the six broad categories listed above. Recruitment, selection, and admissions. A large majority of the STEM doctoral programs in the study indicated faculty involvement in the admission process (96%) and selection of students based on “fit” (89%). However, only 45% of the programs indicated that they engage in targeted recruitment of URM students at minority-focused job fairs and
Doctoral Initiative on Minority Attrition and Completion34
ANALYSES OF PROGRAM INVENTORIES, STUDENT SURVEYS, AND SITE VISITS DATA
conferences. Similarly, only 37% of programs reported that they engaged in targeted recruiting at minority-serving institutions, and 36% reported that they engaged in targeted recruiting via minority outreach programs such as the McNair Scholars Program and the Leadership Alliance. Also, while a large majority of the programs (96%) noted that they provide department/faculty profiles via web/printed materials, only 40% of them said that they make completion/attrition/placement data publicly available. Advising and mentoring. A large majority of the programs indicated that they have a program/departmental orientation for new graduate students (94%), provide a graduate handbook to students (86%), and conduct annual student evaluations (80%). A large majority also indicated that doctoral students are assigned advisors upon enrollment (86%), that a clear process is in place for selection/assignment of advisors (88%), and that information on changing advisors is provided to students (79%). Nearly three-quarters (73%) of programs noted that they use early research experience as a mentoring tool. Almost nine of ten programs (89%) indicated that they permit students to have multiple faculty mentors. However, fewer programs noted that they offer targeted mentoring for doctoral candidates (36%) or peer mentoring programs (36%). In terms of mentoring resources for faculty, 26% of the programs indicated that they offer advising/mentoring workshops, 28% offer web-based mentoring resources for faculty, and 19% give faculty mentor awards. Research mode. Most of the programs indicated that they encourage early research involvement (86%), as well as collaborative research and publications between students and faculty (97%). However, considerably fewer of them indicated that they host research fairs (34%) or foster a university-wide community for URM students (42%). Financial aid/funding. More than three-quarters (78%) of the programs indicated that they offer guaranteed multi-year financial support. A large majority of them provide research assistantships (92%), teaching assistantships (84%), and/or fellowships (71%), as well as health insurance coverage for students on teaching assistantships, research assistantships, fellowships and traineeships (78%). More than one-half (53%) of the programs participate in traineeship programs, and over two-thirds (68%) noted that they integrate fellowship recipients into their respective programs/departments. More than four of five (83%) programs indicated that they actively promote information about external fellowship
Doctoral Initiative on Minority Attrition and Completion 35
ANALYSES OF PROGRAM INVENTORIES, STUDENT SURVEYS, AND SITE VISITS DATA
opportunities. Seventy-two percent of them provide travel grants for URM students to attend professional conferences. Program environment. A large majority of the STEM doctoral programs indicated that they ensure transparency in the program environment (88%). Overwhelming numbers noted that they facilitate student/faculty discussions (94%) and encourage student/visiting speaker interactions (94%). More than one-half (56%) noted that they include student members on program committees, and approximately one in four (27%) indicated that students are included on faculty hiring committees.Very few (9%) programs indicated that they have minority graduate student organizations within the program. Also, a little over one-third (37%) noted that they offer organized student/peer support groups. However, more than nine of ten (92%) noted that they host student/faculty social events, 90% provide office space for students, and 62% have a department/program lounge. Administrative/curricular practices and procedures. An overwhelming majority (96%) of the STEM doctoral programs indicated that they track students’ academic progress, and 83% track students’ placement and career outcomes. Almost nine of ten (87%) reported that they establish goals for degree completion. About one-half (52%) indicated that they conduct exit interviews/surveys of completers and non-completers, and 49% make periodic program review outcomes available. Ninety percent of the responding programs indicated that they provide information on the dissertation process. Thirty-nine percent offer dissertation workshops, camps, and other dissertation writing assistance, and 8% have a web-based dissertation progress tracking tool. Also, a little more than one-third (35%) provide recognition/certificates for candidacy.Less than one-half (41%) of the programs indicated that they facilitate student/graduate school dialogues via forums such as “Meet the Dean,” and 47% indicated that they have electronic or printed newsletters. One-half (50%) of them convene routine meetings between graduate deans and program directors, and 43% have orientations for graduate program directors and graduate secretaries. Very few (11%) programs indicated that they host seminars/workshops for minority students. Section summary. While the analysis of inventories suggests that policies, practices, and interventions intended to support STEM doctoral students in Summer 2012 are rather long-standing, it also suggests that very few special interventions are dedicated specifically to URM STEM
Doctoral Initiative on Minority Attrition and Completion36
ANALYSES OF PROGRAM INVENTORIES, STUDENT SURVEYS, AND SITE VISITS DATA
doctoral students. Also, the inventory did not ask about ways in which STEM doctoral programs collect data and evaluate interventions that are aimed to facilitate retention of and degree completion by URM doctoral students. Most of these policies, practices, and interventions are for all doctoral students, and some of them may only be statements of commitment or principle, rather than formal and institutionalized initiatives.
Doctoral Student Survey
The Doctoral Student Survey asked URM STEM students questions regarding their experiences in their doctoral programs, including questions about factors that they believed may contribute to completion. The analysis in this section discusses three general themes of the survey: program climate, the students’ general experience in their doctoral programs, and program and personal factors that may affect URM students’ abilities to complete degree objectives, placing particular focus on comparisons across candidacy status of the students, as well as on their race/ethnicity. In addition, CGS researchers reviewed responses to an open-ended question where students were asked to provide recommendations on how programs and/or universities may better facilitate URM doctoral completion. Program climate. Figure 4.1 shows the responses to questions regarding program climate. An overwhelming majority of students agreed or strongly agreed with most of the questionnaire items, with few exceptions. For example, a majority (56%) of students disagreed or strongly disagreed that their race/ethnicity was “a factor in the manner in which they are treated.” Also, 71% of respondents disagreed or strongly disagreed with the statement, “I have been subjected to racism.” The plurality of students (43%) indicated that they neither agreed nor disagreed with the statement, “Faculty are aware of issues facing URMs.” Furthermore, the difference between students who agreed or strongly agreed (43%) and those who neither agreed nor disagreed (40%) with the statement, “This program is doing a good job helping URM students succeed,” was relatively small, compared to the responses to other questionnaire items. Graduate student experience. Figure 4.2 shows the responses to the graduate student experience questions, ranked by percentage distributions of responses of “frequently” and “occasionally.” The figure
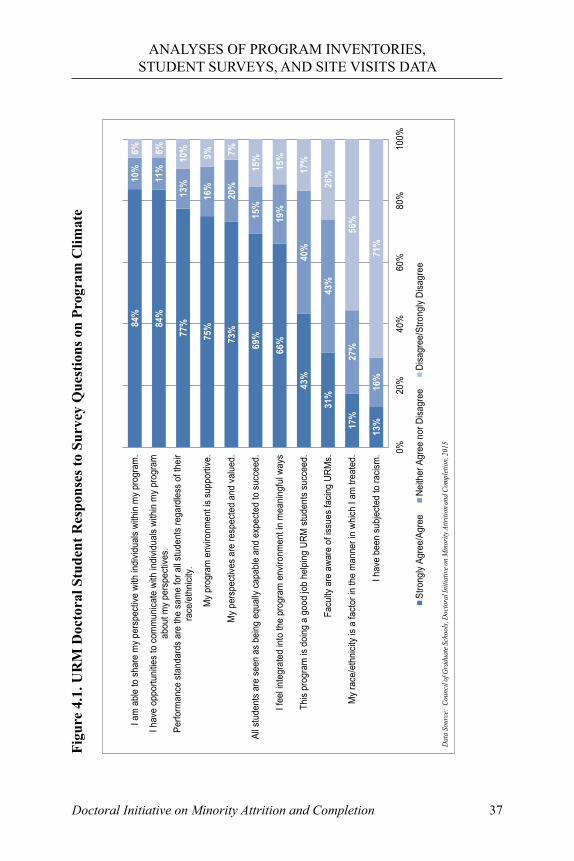
Doctoral Initiative on Minority Attrition and Completion 37
ANALYSES OF PROGRAM INVENTORIES, STUDENT SURVEYS, AND SITE VISITS DATA
Figu
re 4
.1. U
RM
Doc
tora
l Stu
dent
Res
pons
es to
Sur
vey
Que
stio
ns o
n Pr
ogra
m C
limat
e
13%17
%
31%
43%
66%69
%73%
75%77%84
%
84%
16%
27%
43%
40%
19%15%
20%
16%
13%11
%
10%
71%
56%
26%17
%15%
15%7%9%10
%6%6%
0%20
%40
%60
%80
%10
0%
I hav
e be
en s
ubje
cted
to ra
cism
.
My
race
/eth
nicit
y is
a fa
ctor
in th
e m
anne
r in
which
I am
trea
ted.
Facu
lty a
re a
ware
of i
ssue
s fa
cing
URM
s.
This
prog
ram
is d
oing
a g
ood
job
help
ing
URM
stu
dent
s su
ccee
d.
I fee
l inte
grat
ed in
to th
e pr
ogra
m e
nviro
nmen
t in
mea
ning
ful w
ays
All s
tude
nts
are
seen
as
bein
g eq
ually
cap
able
and
exp
ecte
d to
suc
ceed
.
My
pers
pect
ives
are
resp
ecte
d an
d va
lued
.
My
prog
ram
env
ironm
ent i
s su
ppor
tive.
Perfo
rman
ce s
tand
ards
are
the
sam
e fo
r all s
tude
nts
rega
rdle
ss o
f the
irra
ce/e
thni
city.
I hav
e op
portu
nitie
s to
com
mun
icate
with
indi
vidua
ls wi
thin
my
prog
ram
abou
t my
pers
pect
ives.
I am
abl
e to
sha
re m
y pe
rspe
ctive
with
indi
vidua
ls wi
thin
my
prog
ram
.
Stro
ngly
Agre
e/Ag
ree
Neith
er A
gree
nor
Disa
gree
Disa
gree
/Stro
ngly
Disa
gree
Data
Sour
ce:
Coun
cil of
Grad
uate
Scho
ols,
Docto
ral I
nitia
tive o
n Min
ority
Attr
ition
and C
ompl
etion
, 201
5
Doctoral Initiative on Minority Attrition and Completion38
ANALYSES OF PROGRAM INVENTORIES, STUDENT SURVEYS, AND SITE VISITS DATA
is intended to portray common experiences of URM STEM doctoral students, as they relate to academic progress. Relative to other items, a high proportion of the URM doctoral students (95%) responded that they frequently or occasionally felt supported by a network of students. A relatively high proportion of respondents also noted that their work responsibilities1 interfered with their education performance (78%) and that they worried about their mental or physical health (62%). Program and personal factors. Figures 4.3 and 4.4 report on program and personal factors that may affect URM students’ ability to achieve their doctoral degree objectives and outcomes. As Figure 4.3 indicates, the top three program factors contributing to student success, as represented by the percentage of respondents reporting “to a great extent/to a moderate extent,” were “financial support” (80%), “program requirements” (77%), and “program quality” (75%), findings that were largely consistent with CGS’ PhD Completion Project (Sowell et al., 2009). In regards to the impact of personal factors, the most frequently mentioned were “motivation and determination” (94%), “non-financial family support” (79%), and other mentors (76%) (see Figure 4.4). Survey results by candidacy status of respondents. The survey responses related to program climate, graduate student experience, and program and personal factors questions were disaggregated by the candidacy status of URM students. For the purpose of this study, candidates are those URM doctoral students who indicated in the survey that they had completed all coursework and passed the qualifying examination. The comparisons by candidacy status were made to determine if there were systematic differences in how URM students perceived challenges they faced while pursuing their doctoral degrees. This section reports the survey items that had differences between candidates and pre-candidates greater than or equal to five percentage points.
1 The survey instrument did not differentiate between on-campus academic work re-sponsibilities (e.g., research assistantship and teaching assistantship) and off-campus jobs unrelated to their academic pursuits.
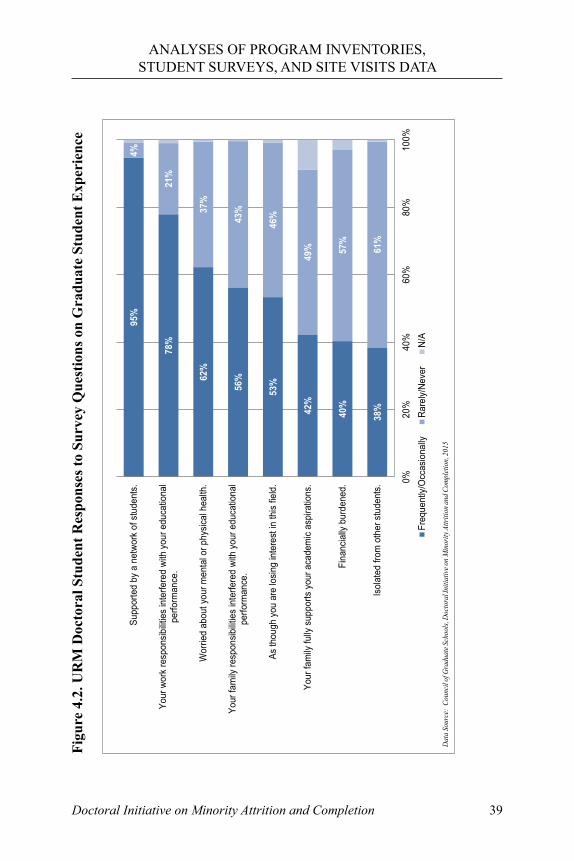
Doctoral Initiative on Minority Attrition and Completion 39
ANALYSES OF PROGRAM INVENTORIES, STUDENT SURVEYS, AND SITE VISITS DATA
Figu
re 4
.2. U
RM
Doc
tora
l Stu
dent
Res
pons
es to
Sur
vey
Que
stio
ns o
n G
radu
ate
Stud
ent E
xper
ienc
e
38%40%42%
53%56%62
%
78%
95%
61%
57%
49%
46%43
%37%
21%
4%
0%20
%40
%60
%80
%10
0%
Isol
ated
from
oth
er s
tude
nts.
Fina
ncia
lly b
urde
ned.
Your
fam
ily fu
lly s
uppo
rts y
our a
cade
mic
aspi
ratio
ns.
As th
ough
you
are
losin
g in
tere
st in
this
field
.
Your
fam
ily re
spon
sibilit
ies
inte
rfere
d wi
th y
our e
duca
tiona
lpe
rform
ance
.
Wor
ried
abou
t you
r men
tal o
r phy
sical
hea
lth.
Your
wor
k re
spon
sibilit
ies
inte
rfere
d wi
th y
our e
duca
tiona
lpe
rform
ance
.
Supp
orte
d by
a n
etwo
rk o
f stu
dent
s.
Freq
uent
ly/O
ccas
iona
llyRa
rely/
Neve
rN/
A
Data
Sour
ce:
Coun
cil of
Grad
uate
Scho
ols,
Docto
ral I
nitia
tive o
n Min
ority
Attr
ition
and C
ompl
etion
, 201
5
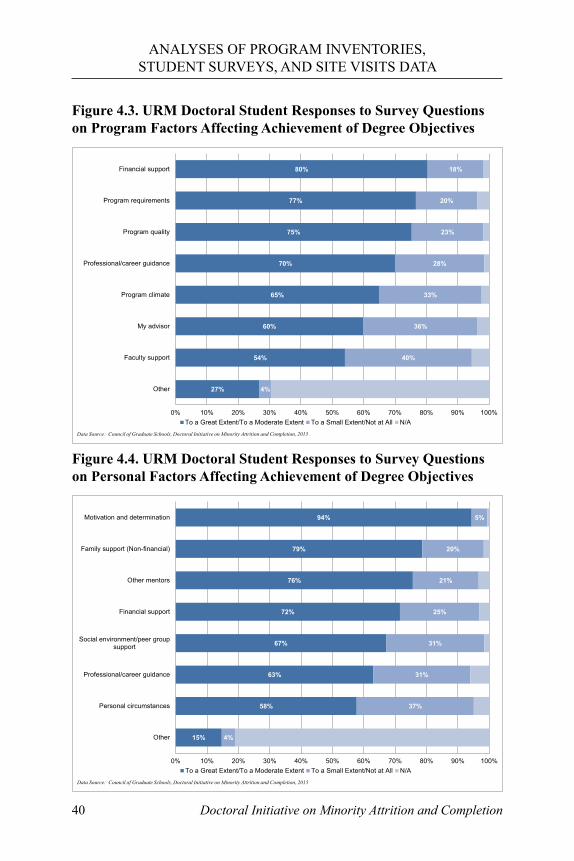
Doctoral Initiative on Minority Attrition and Completion40
ANALYSES OF PROGRAM INVENTORIES, STUDENT SURVEYS, AND SITE VISITS DATA
Figure 4.3. URM Doctoral Student Responses to Survey Questions on Program Factors Affecting Achievement of Degree Objectives
27%
54%
60%
65%
70%
75%
77%
80%
4%
40%
36%
33%
28%
23%
20%
18%
0% 10% 20% 30% 40% 50% 60% 70% 80% 90% 100%
Other
Faculty support
My advisor
Program climate
Professional/career guidance
Program quality
Program requirements
Financial support
To a Great Extent/To a Moderate Extent To a Small Extent/Not at All N/A
Data Source: Council of Graduate Schools, Doctoral Initiative on Minority Attrition and Completion, 2015
Figure 4.4. URM Doctoral Student Responses to Survey Questions on Personal Factors Affecting Achievement of Degree Objectives
15%
58%
63%
67%
72%
76%
79%
94%
4%
37%
31%
31%
25%
21%
20%
5%
0% 10% 20% 30% 40% 50% 60% 70% 80% 90% 100%
Other
Personal circumstances
Professional/career guidance
Social environment/peer groupsupport
Financial support
Other mentors
Family support (Non-financial)
Motivation and determination
To a Great Extent/To a Moderate Extent To a Small Extent/Not at All N/A
Data Source: Council of Graduate Schools, Doctoral Initiative on Minority Attrition and Completion, 2015
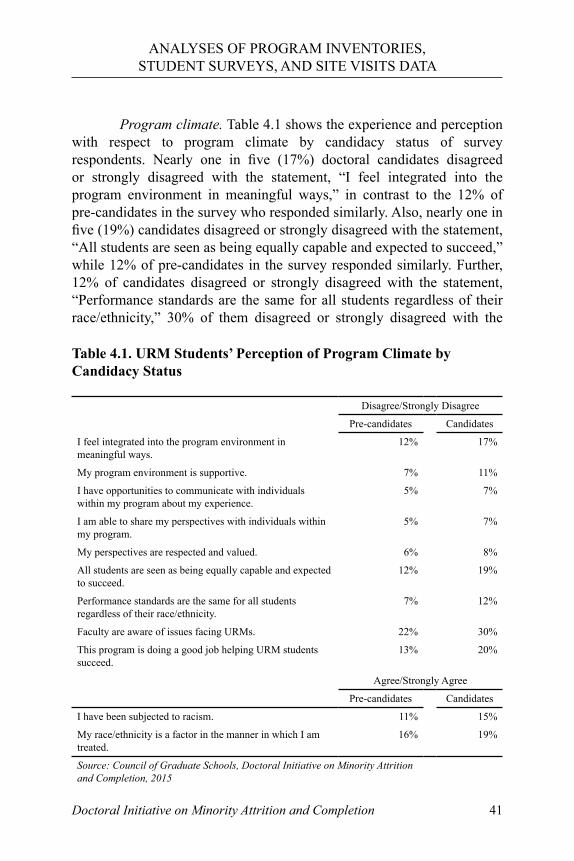
Doctoral Initiative on Minority Attrition and Completion 41
Disagree/Strongly Disagree
Pre-candidates Candidates
I feel integrated into the program environment in meaningful ways.
12% 17%
My program environment is supportive. 7% 11%
I have opportunities to communicate with individuals within my program about my experience.
5% 7%
I am able to share my perspectives with individuals within my program.
5% 7%
My perspectives are respected and valued. 6% 8%
All students are seen as being equally capable and expected to succeed.
12% 19%
Performance standards are the same for all students regardless of their race/ethnicity.
7% 12%
Faculty are aware of issues facing URMs. 22% 30%
This program is doing a good job helping URM students succeed.
13% 20%
Agree/Strongly Agree
Pre-candidates Candidates
I have been subjected to racism. 11% 15%
My race/ethnicity is a factor in the manner in which I am treated.
16% 19%
Source: Council of Graduate Schools, Doctoral Initiative on Minority Attrition and Completion, 2015
Table 4.1. URM Students’ Perception of Program Climate by Candidacy Status
ANALYSES OF PROGRAM INVENTORIES, STUDENT SURVEYS, AND SITE VISITS DATA
Program climate. Table 4.1 shows the experience and perception with respect to program climate by candidacy status of survey respondents. Nearly one in five (17%) doctoral candidates disagreed or strongly disagreed with the statement, “I feel integrated into the program environment in meaningful ways,” in contrast to the 12% of pre-candidates in the survey who responded similarly. Also, nearly one in five (19%) candidates disagreed or strongly disagreed with the statement, “All students are seen as being equally capable and expected to succeed,” while 12% of pre-candidates in the survey responded similarly. Further, 12% of candidates disagreed or strongly disagreed with the statement, “Performance standards are the same for all students regardless of their race/ethnicity,” 30% of them disagreed or strongly disagreed with the
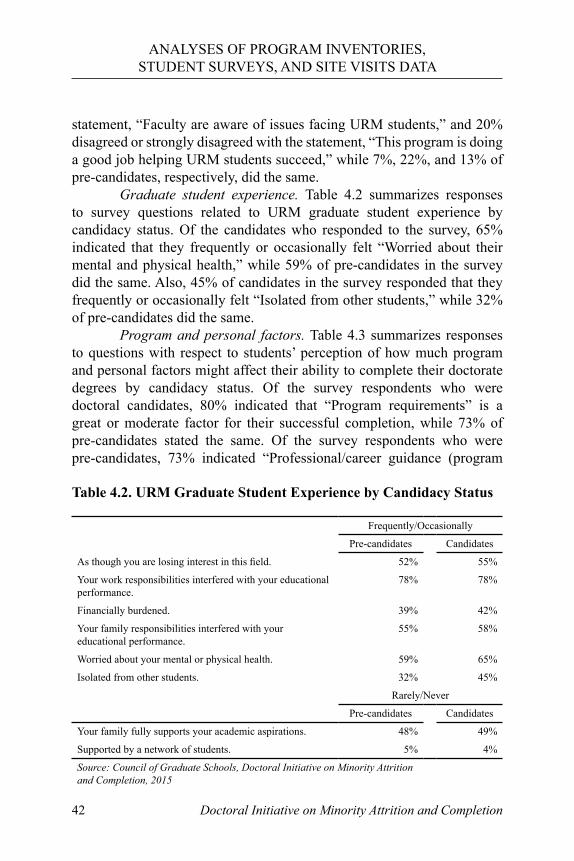
Doctoral Initiative on Minority Attrition and Completion42
ANALYSES OF PROGRAM INVENTORIES, STUDENT SURVEYS, AND SITE VISITS DATA
statement, “Faculty are aware of issues facing URM students,” and 20% disagreed or strongly disagreed with the statement, “This program is doing a good job helping URM students succeed,” while 7%, 22%, and 13% of pre-candidates, respectively, did the same. Graduate student experience. Table 4.2 summarizes responses to survey questions related to URM graduate student experience by candidacy status. Of the candidates who responded to the survey, 65% indicated that they frequently or occasionally felt “Worried about their mental and physical health,” while 59% of pre-candidates in the survey did the same. Also, 45% of candidates in the survey responded that they frequently or occasionally felt “Isolated from other students,” while 32% of pre-candidates did the same. Program and personal factors. Table 4.3 summarizes responses to questions with respect to students’ perception of how much program and personal factors might affect their ability to complete their doctorate degrees by candidacy status. Of the survey respondents who were doctoral candidates, 80% indicated that “Program requirements” is a great or moderate factor for their successful completion, while 73% of pre-candidates stated the same. Of the survey respondents who were pre-candidates, 73% indicated “Professional/career guidance (program
Frequently/Occasionally
Pre-candidates Candidates
As though you are losing interest in this field. 52% 55%
Your work responsibilities interfered with your educational performance.
78% 78%
Financially burdened. 39% 42%
Your family responsibilities interfered with your educational performance.
55% 58%
Worried about your mental or physical health. 59% 65%
Isolated from other students. 32% 45%
Rarely/Never
Pre-candidates Candidates
Your family fully supports your academic aspirations. 48% 49%
Supported by a network of students. 5% 4%
Source: Council of Graduate Schools, Doctoral Initiative on Minority Attrition and Completion, 2015
Table 4.2. URM Graduate Student Experience by Candidacy Status
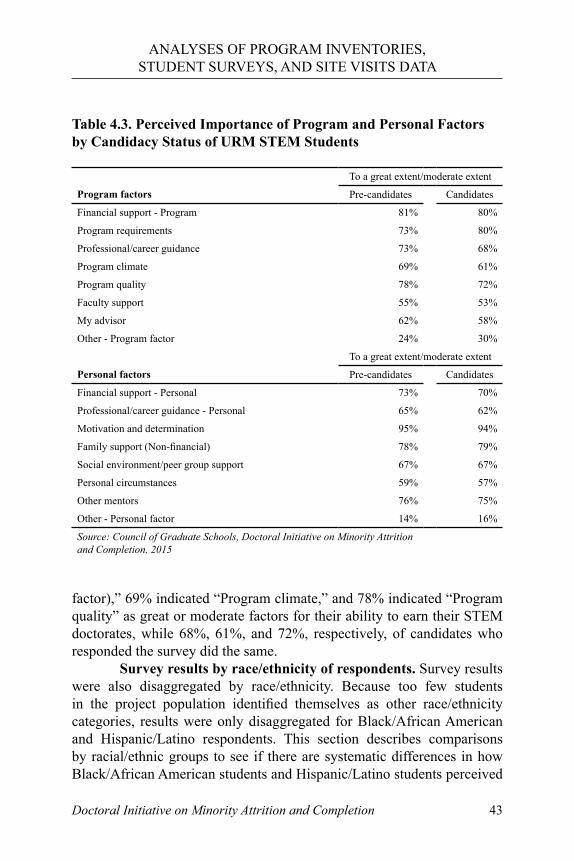
Doctoral Initiative on Minority Attrition and Completion 43
To a great extent/moderate extent
Program factors Pre-candidates Candidates
Financial support - Program 81% 80%
Program requirements 73% 80%
Professional/career guidance 73% 68%
Program climate 69% 61%
Program quality 78% 72%
Faculty support 55% 53%
My advisor 62% 58%
Other - Program factor 24% 30%
To a great extent/moderate extent
Personal factors Pre-candidates Candidates
Financial support - Personal 73% 70%
Professional/career guidance - Personal 65% 62%
Motivation and determination 95% 94%
Family support (Non-financial) 78% 79%
Social environment/peer group support 67% 67%
Personal circumstances 59% 57%
Other mentors 76% 75%
Other - Personal factor 14% 16%
Source: Council of Graduate Schools, Doctoral Initiative on Minority Attrition and Completion, 2015
Table 4.3. Perceived Importance of Program and Personal Factors by Candidacy Status of URM STEM Students
ANALYSES OF PROGRAM INVENTORIES, STUDENT SURVEYS, AND SITE VISITS DATA
factor),” 69% indicated “Program climate,” and 78% indicated “Program quality” as great or moderate factors for their ability to earn their STEM doctorates, while 68%, 61%, and 72%, respectively, of candidates who responded the survey did the same. Survey results by race/ethnicity of respondents. Survey results were also disaggregated by race/ethnicity. Because too few students in the project population identified themselves as other race/ethnicity categories, results were only disaggregated for Black/African American and Hispanic/Latino respondents. This section describes comparisons by racial/ethnic groups to see if there are systematic differences in how Black/African American students and Hispanic/Latino students perceived
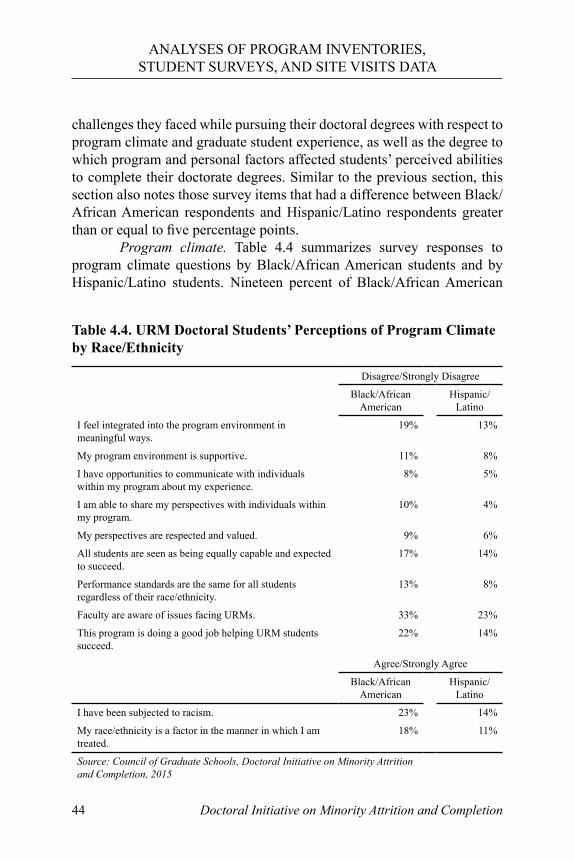
Doctoral Initiative on Minority Attrition and Completion44
ANALYSES OF PROGRAM INVENTORIES, STUDENT SURVEYS, AND SITE VISITS DATA
challenges they faced while pursuing their doctoral degrees with respect to program climate and graduate student experience, as well as the degree to which program and personal factors affected students’ perceived abilities to complete their doctorate degrees. Similar to the previous section, this section also notes those survey items that had a difference between Black/African American respondents and Hispanic/Latino respondents greater than or equal to five percentage points. Program climate. Table 4.4 summarizes survey responses to program climate questions by Black/African American students and by Hispanic/Latino students. Nineteen percent of Black/African American
Disagree/Strongly Disagree
Black/African American
Hispanic/Latino
I feel integrated into the program environment in meaningful ways.
19% 13%
My program environment is supportive. 11% 8%
I have opportunities to communicate with individuals within my program about my experience.
8% 5%
I am able to share my perspectives with individuals within my program.
10% 4%
My perspectives are respected and valued. 9% 6%
All students are seen as being equally capable and expected to succeed.
17% 14%
Performance standards are the same for all students regardless of their race/ethnicity.
13% 8%
Faculty are aware of issues facing URMs. 33% 23%
This program is doing a good job helping URM students succeed.
22% 14%
Agree/Strongly Agree
Black/African American
Hispanic/Latino
I have been subjected to racism. 23% 14%
My race/ethnicity is a factor in the manner in which I am treated.
18% 11%
Source: Council of Graduate Schools, Doctoral Initiative on Minority Attrition and Completion, 2015
Table 4.4. URM Doctoral Students’ Perceptions of Program Climate by Race/Ethnicity
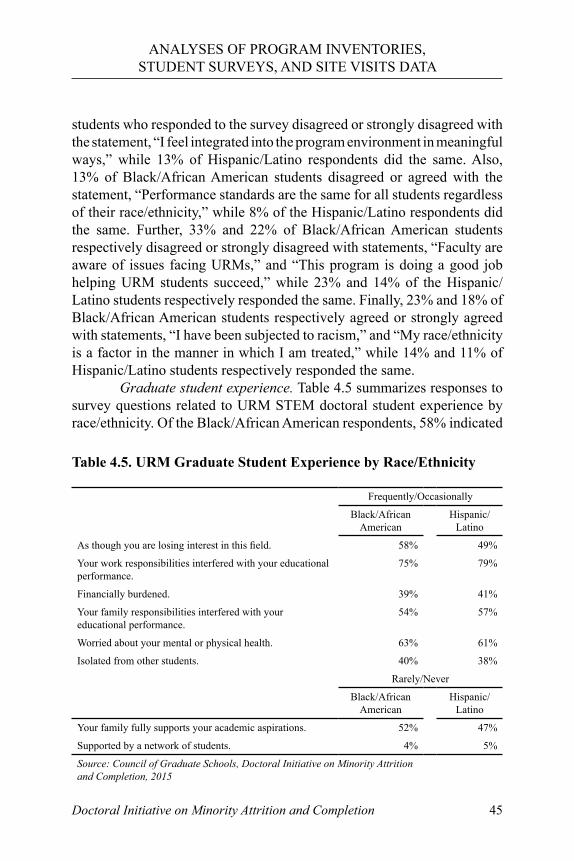
Doctoral Initiative on Minority Attrition and Completion 45
ANALYSES OF PROGRAM INVENTORIES, STUDENT SURVEYS, AND SITE VISITS DATA
students who responded to the survey disagreed or strongly disagreed with the statement, “I feel integrated into the program environment in meaningful ways,” while 13% of Hispanic/Latino respondents did the same. Also, 13% of Black/African American students disagreed or agreed with the statement, “Performance standards are the same for all students regardless of their race/ethnicity,” while 8% of the Hispanic/Latino respondents did the same. Further, 33% and 22% of Black/African American students respectively disagreed or strongly disagreed with statements, “Faculty are aware of issues facing URMs,” and “This program is doing a good job helping URM students succeed,” while 23% and 14% of the Hispanic/Latino students respectively responded the same. Finally, 23% and 18% of Black/African American students respectively agreed or strongly agreed with statements, “I have been subjected to racism,” and “My race/ethnicity is a factor in the manner in which I am treated,” while 14% and 11% of Hispanic/Latino students respectively responded the same. Graduate student experience. Table 4.5 summarizes responses to survey questions related to URM STEM doctoral student experience by race/ethnicity. Of the Black/African American respondents, 58% indicated
Frequently/Occasionally
Black/African American
Hispanic/Latino
As though you are losing interest in this field. 58% 49%
Your work responsibilities interfered with your educational performance.
75% 79%
Financially burdened. 39% 41%
Your family responsibilities interfered with your educational performance.
54% 57%
Worried about your mental or physical health. 63% 61%
Isolated from other students. 40% 38%
Rarely/Never
Black/African American
Hispanic/Latino
Your family fully supports your academic aspirations. 52% 47%
Supported by a network of students. 4% 5%
Source: Council of Graduate Schools, Doctoral Initiative on Minority Attrition and Completion, 2015
Table 4.5. URM Graduate Student Experience by Race/Ethnicity
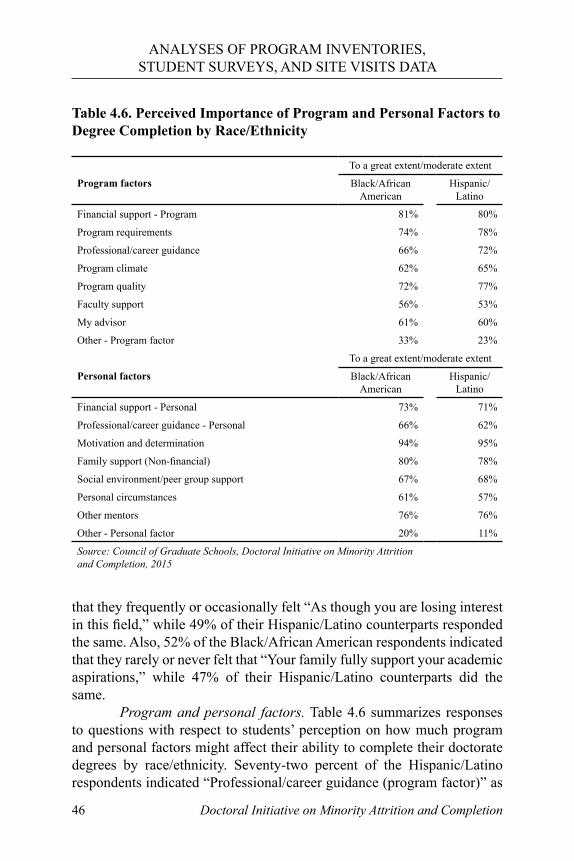
Doctoral Initiative on Minority Attrition and Completion46
ANALYSES OF PROGRAM INVENTORIES, STUDENT SURVEYS, AND SITE VISITS DATA
that they frequently or occasionally felt “As though you are losing interest in this field,” while 49% of their Hispanic/Latino counterparts responded the same. Also, 52% of the Black/African American respondents indicated that they rarely or never felt that “Your family fully support your academic aspirations,” while 47% of their Hispanic/Latino counterparts did the same. Program and personal factors. Table 4.6 summarizes responses to questions with respect to students’ perception on how much program and personal factors might affect their ability to complete their doctorate degrees by race/ethnicity. Seventy-two percent of the Hispanic/Latino respondents indicated “Professional/career guidance (program factor)” as
To a great extent/moderate extent
Program factors Black/African American
Hispanic/Latino
Financial support - Program 81% 80%
Program requirements 74% 78%
Professional/career guidance 66% 72%
Program climate 62% 65%
Program quality 72% 77%
Faculty support 56% 53%
My advisor 61% 60%
Other - Program factor 33% 23%
To a great extent/moderate extent
Personal factors Black/African American
Hispanic/Latino
Financial support - Personal 73% 71%
Professional/career guidance - Personal 66% 62%
Motivation and determination 94% 95%
Family support (Non-financial) 80% 78%
Social environment/peer group support 67% 68%
Personal circumstances 61% 57%
Other mentors 76% 76%
Other - Personal factor 20% 11%
Source: Council of Graduate Schools, Doctoral Initiative on Minority Attrition and Completion, 2015
Table 4.6. Perceived Importance of Program and Personal Factors to Degree Completion by Race/Ethnicity
Doctoral Initiative on Minority Attrition and Completion 47
ANALYSES OF PROGRAM INVENTORIES, STUDENT SURVEYS, AND SITE VISITS DATA
a great or moderate factor, while 66% of their Black/African American counterparts indicated the same. Also, 77% of the Hispanic/Latino students responded to the survey indicated “Program quality” as a great or moderate factor, while 72% of the Black/African American respondents of the survey indicated the same. Student recommendations. In the Doctoral Student Survey, students were asked to respond to several open-ended questions. This section discusses observations made by CGS researchers upon reviewing student responses to the question, “What would you recommend your program and/or university do to help underrepresented minority students complete their doctoral programs?” Their recommendations generally addressed the following topics: program expectations and tracking progress, advising and mentoring, networking, research and professional development, and non-financial support. These recommendations were consistent with program factors identified in the earlier section. Program expectations and tracking progress. Many students suggested that program requirements and expectations from the time of initial enrollment to the dissertation defense should be made clear to all students. They further suggested that these expectations should be made available online and that student progress should be tracked and periodically reviewed by students and their faculty advisors in meetings so that students are made fully aware of their progress toward the doctorates. Advising and mentoring. Many students emphasized the importance of “fit” with their faculty advisors and the institution’s role in helping them identify the “right match.” Consistent with their earlier recommendations about progress tracking, students emphasized the importance of frequent one-on-one meetings with their advisors. They also stressed the value of having mentors outside the department/program, especially individuals who understand the unique challenges faced by URM students. Finally, some students suggested organizing a peer mentoring program, where senior graduate students are assigned to mentor new URM students. Networking. The importance of providing opportunities for URM students to network with peers, both URM and non-URM, was highlighted in several responses. Some focused on having formal functions such as research and educational seminars, while others expressed the need for more opportunities to engage socially with their peers. It was also suggested that URM students should have more opportunities to interact with other URMs in their academic field, including alumni. Finally, some
Doctoral Initiative on Minority Attrition and Completion48
ANALYSES OF PROGRAM INVENTORIES, STUDENT SURVEYS, AND SITE VISITS DATA
students highlighted the importance of having URM student organizations that focus on outreach to first-generation college students. Research and professional development. Many respondents recommended that institutions and departments be more proactive in providing research and professional development opportunities for URM students. Students recommended that departments should facilitate research opportunities for students early on. They also recommended professional development opportunities, such as career fairs, leadership programs, internships outside the academy, and interactions with URM alumni in the field who can speak on their experience in STEM doctoral programs, as well as in the job market. Non-financial support. While financial support is critical to the success of URM STEM doctoral students, survey respondents also identified areas of non-financial support that they recommended graduate institutions and programs address. Several respondents suggested that universities should make faculty more aware of diversity issues and the unique challenges that URM students face in their doctoral programs, including the role and importance of family in their lives. Students also suggested that universities do more to make URM students feel welcome in doctoral programs and encouraged to pursue STEM doctorates, as well as to improve the campus climate by promoting tolerance for diversity. In addition, students recommended organizing programs that help parents understand the value of a graduate education as well as the process of pursuing a doctorate. Section summary. Several themes emerged from the analysis of the Doctoral Student Survey data. First, Black/African American pre-candidates had more concerns about program climate than their Hispanic/Latino counterparts, and URM doctoral candidates were more skeptical about program climate than URM pre-candidates. Specifically, both Black/African American students and doctoral candidates felt more isolated and less well-supported than Hispanic/Latino students and pre-doctoral candidates. Second, the overwhelming majority of URM students felt that they were supported by a network of their peers. Third, many URM students felt that their work responsibilities, off-campus and/or on-campus, including their responsibilities as teaching assistants and/or research assistants interfered with their ability to meet the academic requirements of their doctoral programs. Fourth, URM doctoral candidates were more concerned about their physical and mental health than pre-candidates.
Doctoral Initiative on Minority Attrition and Completion 49
ANALYSES OF PROGRAM INVENTORIES, STUDENT SURVEYS, AND SITE VISITS DATA
Finally, financial support and personal motivation were cited as the two most important factors contributing to URM students’ ability to complete their doctoral degrees. The following sub-sections summarize the findings from the responses to questions related to each of the three major themes of the Doctoral Student Survey. Program climate. Among the responses to program climate questions, Black/African American doctoral students showed a relatively higher level of skepticism about the awareness and ability of faculty and the program to address URM student challenges than did their Hispanic/Latino counterparts. The results suggested that Black/African American doctoral students have less favorable experiences or perceptions with regard to their race/ethnicity than do Hispanic/Latino doctoral students. Black/African American students were also more skeptical than Hispanic/Latino students about the faculty’s ability or the doctoral program’s efforts to address their needs. Perceptions of program climate also differed by candidacy status of students. This is not surprising, given that the doctoral process is made up of different stages (Ampaw, 2010; Tinto, 1993) and that students’ experiences and factors that influence retention differ by the stages (Ampaw, 2010). In this study, these differences by the stages of doctoral programs were most evident in students’ perceptions of program climate. The results suggest that URM STEM doctoral candidates were relatively more skeptical about program climate than pre-candidates. This was largely true even after controlling for race/ethnicity. Both Black/African American and Hispanic/Latino STEM doctoral candidates were less likely than pre-candidates to think that all students were seen as being equally capable and expected to succeed, and candidates were less likely than pre-candidates to think that performance standards were the same for all students regardless of their race/ethnicity. Furthermore, both Black/African American and Hispanic/Latino doctoral candidates were less likely than pre-candidates to think that faculty were aware of issues facing URM students or to think that their doctoral programs were doing a good job of helping URM students succeed. Moreover, the results suggest that candidates considered “program climate” less important to their ability to complete their doctoral degrees than did pre-candidates. Presumably, doctoral candidates are more seasoned as graduate students; thus, they are more familiar with the people, as well as the norms, traditions, and culture, within their institutions and
Doctoral Initiative on Minority Attrition and Completion50
ANALYSES OF PROGRAM INVENTORIES, STUDENT SURVEYS, AND SITE VISITS DATA
programs. Yet the survey results suggest that they were more skeptical about the program climate than pre-candidates were and did not regard it as important a factor for degree completion as did pre-candidates. Graduate student experience. The overwhelming majority of URM STEM doctoral students felt that they were supported by a network of their peers, suggesting that many of them were socialized into their respective doctoral programs in a meaningful way. This was true across candidacy status and race/ethnicity of students. More than three of four students in the study also indicated that their work responsibilities interfered with their educational performance. There was little difference between Black/African American students and Hispanic/Latino students in this regard. Because only 7% of all respondents indicated that “personal earnings or savings” were a source of financial support for their graduate education, as opposed to 21% who indicated that they received “assistantship, fellowship, scholarship, grant, or traineeship” support, it is safe to assume that when students cited “work responsibilities,” they were including their on-campus, academic-related job duties, such as research and teaching. Approximately two-thirds of the students, both Black/African American and Hispanic/Latino, indicated that they worried about their mental or physical health. Doctoral candidates were more likely to express this worry than pre-candidates. Candidates were also more likely than pre-candidates to feel isolated from other students. This may be an intuitive response, because writing the dissertation is often a solitary process for students and requires almost ascetic self-discipline. These findings suggest that the learning environment for doctoral candidates is much different than that for pre-candidates. This is generally consistent with Tinto’s (1993) theory of completion at the doctoral level, which suggests that doctoral student experiences are defined by the evolution of interactions among peers, faculty, and administrators. Program and personal factors. As identified by URM students responding to this survey, the relative importance of program and personal factors that influence one’s ability to complete a doctoral degree was largely consistent with findings from the exit survey of CGS’ PhD Completion Project, which studied both URM and non-URM PhD students (Sowell et al., 2009). “Financial support,” “program requirements,” and “program quality” ranked high as program factors to which URM students attributed their ability to complete their degrees. Neither “faculty support” nor “my advisor” was cited as frequently as important to degree completion. The
Doctoral Initiative on Minority Attrition and Completion 51
ANALYSES OF PROGRAM INVENTORIES, STUDENT SURVEYS, AND SITE VISITS DATA
overwhelming majority of students cited “motivation and determination” as a personal factor that enabled them to complete their degrees, as well as “non-financial family support.”
Site Visits
Between January and October 2013, CGS researchers conducted site visits at 16 of the 21 participating institutions, which included focus group sessions with currently enrolled URM STEM doctoral students, as well as faculty, staff, and administrators (hereafter referred to as “university personnel”) who worked closely on issues concerning URM STEM doctoral completion. Each session was recorded and transcribed. CGS researchers independently reviewed transcripts, generated field notes, and reflected upon major themes. We begin this section by discussing the uniqueness of the doctoral experience as explained to us by focus group participants, followed by our observations of policies, practices, and interventions intended to facilitate recruitment and selection of URM STEM doctoral students as well as their acclimation into the graduate school culture.2 We briefly describe the roles of special programs and fellowships, mentors, and champions before concluding with a brief summary and discussion regarding challenges specific to URM students. Unique experience. During the course of the site visits, we spoke with 322 URM STEM doctoral students and roughly as many if not more university personnel. Although we learned that no two students transition into and through their doctoral program in the same way, we also learned that the doctoral experience for URM students is unique when compared with the undergraduate experience. Specifically, the doctoral experience was generally described by focus group participants as one that can be intensive, solitary, and complicated. Our observations regarding these three characteristics are discussed in the following paragraphs. Intensive. We observed students and university personnel describing the doctoral experience in terms of heavy workloads, challenging courses, and rigorous research performed on the frontier of their disciplines. Sometimes these conditions led students to encounter
2 Since this section is based upon observation and interpretation by CGS researchers, as opposed to a report of statistical findings, customary third-person references are not used. Instead, first-person references are incorporated.
Doctoral Initiative on Minority Attrition and Completion52
ANALYSES OF PROGRAM INVENTORIES, STUDENT SURVEYS, AND SITE VISITS DATA
their first experience with failure. A number of students, for example, described the ease with which they became high achievers in high school and college, only to be intellectually stymied in graduate school. Moreover, besides performing work necessary to fulfill the requirements of their own doctoral programs, many students also carry out additional responsibilities as graduate assistants, research assistants, teaching assistants, and/or trainees. Solitary. We also heard that the experience of earning a doctorate requires that students achieve a new level of independence, which can leave some feeling isolated. In comparison with the undergraduate experience, which is often driven by large and centralized classes, the doctoral experience requires that students spend substantial amounts of time in solitude. Some doctoral students described occasions of physical isolation, where they spent extended periods of time in libraries, laboratories, or at their desk. Some students described feelings of being intellectually isolated, focusing so intently on one single aspect of research that they struggled to communicate with others, even among peers in their doctoral programs. Complicated. Finally, we heard students and university personnel describe how complicated it is to earn a doctorate. In comparison to an undergraduate experience, which was described as a relatively straight forward fulfillment of course requirements, the doctoral experience was characterized as being more like a maze. Also, by the time some students enter doctoral programs, they may have taken on additional responsibilities as spouses, parents, working professionals, and/or homeowners. We learned that having these additional roles can compound the complexity they already face as doctoral students. Policies, practices, and interventions. Through focus group sessions, we learned of a range of policies, practices, and interventions that the participating institutions implemented to encourage the success of URM STEM doctoral students. Many of these are focused specifically on facilitating the transition between the undergraduate and graduate experience. We also observed that there are generally two areas of emphasis: recruitment/selection of students, and acclimation of students to the graduate school culture. Moreover, we observed three particular aspects of acclimation: the advisor-advisee relationship, clarification of expectations, and social interaction. The following section discusses these observations.
Doctoral Initiative on Minority Attrition and Completion 53
ANALYSES OF PROGRAM INVENTORIES, STUDENT SURVEYS, AND SITE VISITS DATA
Recruitment and selection. Driven by the still very modest pool of prospective URM STEM doctoral students, university personnel with whom we spoke most frequently and comprehensively described efforts to recruit and select prospective URM doctoral students. With respect to recruitment, university personnel described the value of attending recruitment/graduate school fairs, conducting campus visits, and waiving application fees. The recruitment method most commonly mentioned as being the most effective, however, was the utilization of faculty networks. Professional networks established by individual faculty members with their colleagues at other institutions, including Historically Black Colleges and Universities, Hispanic-serving Institutions, and other minority-serving institutions, are central to the establishment of pipelines for prospective URM STEM doctoral students. Some faculty members extend their network further by taking currently enrolled URM doctoral students with them to recruiting events, including to the students’ alma mater. We also learned that the selection of prospective URM students often reflects a commitment towards achieving “fit” between the student and the program. Although the term “fit” was never clearly defined by students or university personnel, it was widely believed to be of paramount importance to a successful doctoral experience and highly influential in degree completion. Specific processes through which admission committees determine “fit” were not discussed in the focus group sessions as such; however, standardized test scores, as well as holistic reviews of applications were mentioned as a part of the process of making admissions decisions. Some university personnel expressed concern that prospective and incoming URM doctoral students are inadequately prepared for graduate-level coursework or research experiences. There are, however, programs that help URM students prepare for their doctoral studies. The NSF’s AGEP program supports and encourages participating institutions to implement interventions such as summer research opportunities and professional development experiences in order to prepare URM doctoral students for their doctoral studies. The U.S. Department of Education’s McNair Scholars Program, as well as the NSF’s LSAMP and Bridge to the Doctorate programs are other examples. These programs were described by focus group participants as being essential in helping incoming URM STEM doctoral students acclimate to the graduate school environment. While these programs do not necessarily recruit prospective URM STEM doctoral students, they are seen as effective tools
Doctoral Initiative on Minority Attrition and Completion54
ANALYSES OF PROGRAM INVENTORIES, STUDENT SURVEYS, AND SITE VISITS DATA
to expand the applicant pool and better ensure its success. Acclimation. We learned that recruitment and selection efforts alone cannot guarantee “fit” between the student and program. We observed that URM STEM doctoral students must still negotiate the process of “fitting in” to the graduate environment in general and to their doctoral programs in particular. Achieving “fit” is a continuous process by which students become acclimated, and ultimately assimilate into graduate school. While some transitional challenges may be universal to all incoming doctoral students regardless of race/ethnicity or any other personal characteristics, some challenges appeared to be compounded for URM doctoral students, particularly first-generation students. Three major challenges of achieving “fit” emerged in the focus group sessions: advisor-advisee relationships, understanding expectations, and social interactions with faculty and other students. Advisor-advisee relationships. It was very clear from our discussions with students and university personnel that establishing good advisor-advisee relationships is an integral part of a successful doctoral experience. However, despite even the very best efforts by admission committees and students to predict a successful advisor-advisee relationship, the ultimate success of the match cannot be determined until the students and advisors begin to work together. Over the course of the focus group sessions with university personnel, there was little discussion about policies, practices, and interventions that specifically addressed advising URM students once they are in the program. We observed that faculty members are largely left to their own devices to negotiate the relationships with their doctoral students. For some bench science fields, we heard that first-year students rotate among different laboratories before requesting an assignment to a particular advisor. Other programs provide prospective and/or incoming students with information about different laboratories and research teams to help them identify preferred faculty advisors. Students noted that they appreciated having such information and opportunities before committing to a particular faculty member, as they were helpful in understanding the culture and group dynamics within a laboratory or research group. Less clear to us was how students ultimately determined their advisor preferences in the face of sometimes conflicting assessments. Deliberating the merits of one advisor over another, for example, required some students to weigh research opportunities against personality compatibilities.
Doctoral Initiative on Minority Attrition and Completion 55
ANALYSES OF PROGRAM INVENTORIES, STUDENT SURVEYS, AND SITE VISITS DATA
Both students and university personnel acknowledged that every relationship is different, each dependent on the personalities of all parties involved. However, we heard many students describe feelings of vulnerability in the advisor-advisee relationship, as faculty advisors can hold great influence over students’ doctoral experience. Thus, students appeared to approach advisors cautiously on subjects such as changing faculty advisors and sharing personal circumstances for fear of becoming alienated. Although university personnel also acknowledged that productive advisor-advisee relationships are in the best interests of all parties involved, few reported having a formal process for mediating potentially uncomfortable situations. Expectations. In addition to formal requirements, doctoral programs and graduate schools have many traditions, codes, and norms – some written and some not – to which members of each community must adjust. For some students this can complicate their acclimation to the graduate culture. Some URM students we spoke with found themselves confused by these sometimes ambiguous expectations, often not even knowing where to go for clarification. On the other hand, we also learned that institutions provide a number of professional development opportunities for all STEM doctoral students, such as writing courses, career preparation courses, and dissertation boot camps, to name a few, intended to communicate program expectations and help students refine their skills. We also heard of deliberate efforts taken by institutions and programs to celebrate key milestones, such as achieving candidacy. This is particularly important for URM students who are first-generation doctoral students, since they and their families may not fully understand the significance of these achievements. Formal recognition of key milestones appears to help URM students reestablish any confidence lost in their doctoral experience and to further authenticate their achievements for their loved ones. Social interaction. While peer support appears to play an important role in facilitating student success, the process of socializing was described by students we spoke with as being more formal and structured than what they had experienced as undergraduate students. We heard about the restraint with which some URM doctoral students began their doctoral studies, choosing to share neither their struggles nor their achievements with their peers or faculty. They sometimes expressed fears of being the
Doctoral Initiative on Minority Attrition and Completion56
ANALYSES OF PROGRAM INVENTORIES, STUDENT SURVEYS, AND SITE VISITS DATA
only one who failed, as if that might invalidate their status as capable doctoral students. We also learned that this anxiety can be overcome when students are able to socialize with one another. We heard about programs that were intended to create a welcoming environment and to promote acculturation into the doctoral program and the university community at large. Some programs offer receptions and happy hours informally, while others offer activities that are more formal, such as forums, retreats, and peer mentoring. Some programs encourage the involvement of URM doctoral students in social organizations, student governance bodies, and diversity advisory committees. Students most commonly, however, described informal activities, such as study groups and happy hours, that grew organically from participating in their academic cohorts, laboratories, and research teams. There appear to be some difficulties in sustaining some student-led opportunities for social interaction. Leadership roles in student-led social organizations, for example, are often short-term in nature, and any form of social activity may conflict with the intensive demands of students’ coursework, research, and other responsibilities. We heard from both students and university personnel that research often takes priority. Nevertheless, these various spaces for social interaction create opportunities for students to build comradery amongst their peers and help them be resilient when faced with challenges encountered in pursing their doctoral degrees. Special programs and fellowships. We heard about several programs that are intended to address, in a more holistic way, the challenges faced by URM STEM doctoral students. Some programs, such as NSF’s AGEP program and the U.S. Department of Education’s Graduate Assistance in Areas of National Need (GAANN), are federally funded. Other programs, such as the Sloan Minority PhD Program, the Meyerhoff Scholars Program, and the McKnight Doctoral Fellowship Program, are nationally, regionally, or locally funded. We learned that generous financial support from some of these programs addresses one of the top concerns of URM doctoral students – paying for graduate school – very effectively. These programs also sometimes create a space for socializing and help URM doctoral students establish a sense of community with their peers. In addition, these programs encourage URM students to stay connected with each other and create support mechanisms for them that might not otherwise be offered at individual doctoral program levels. However, we
Doctoral Initiative on Minority Attrition and Completion 57
ANALYSES OF PROGRAM INVENTORIES, STUDENT SURVEYS, AND SITE VISITS DATA
learned that formal means to collect relevant data and evaluate the impact of these programs is not uniformly available. Mentors. Many students described very different roles played by advisors and mentors, although we also heard that some individuals can and do play both roles. Although many students appeared to be satisfied with their advisor, they often describe their advisor as being responsible primarily for the operational aspects of their doctoral experience (e.g., recommending coursework, directing research, and finding funding). Mentors, on the other hand, were often described as individuals who were more interested in the general well-being of students above and beyond their doctoral studies. Champions. Beginning with our earliest site visits, we noticed instances in which students and university personnel would independently and voluntarily name the same one or two individuals as playing particularly important roles in supporting URM doctoral students. We labeled these individuals as “champions,” self-motivated and often self-appointed individuals who seemed to share two common characteristics. First, champions were often not the students’ advisors. In fact, many champions were used by students as confidantes to help them negotiate various challenges associated with their doctoral studies, including those involving their advisors. Second, champions commonly worked across disciplines, often being administrators or faculty members in one department, but mentoring students across the institution. They were described as being proactive and resourceful, with elaborate personal and professional networks capable of serving current and prospective students. Section summary and challenges. The focus group sessions gave us opportunities to engage students and university personnel in describing both the doctoral experience and efforts intended to facilitate the successful completion of STEM doctoral degrees. While many programs and interventions address key transitional challenges URM doctoral students face, many are not exclusively targeted to URM students. Every doctoral student must ultimately negotiate the intensive, solitary, and complicated nature of the doctoral process in his or her own way, a process that may result in occasional feelings of isolation, self-awareness, and self-doubt. We observed that this process requires that students address two tensions. First, doctoral students must learn to balance the demands of research with personal interests and commitments. This was apparent, for instance, when students described the process by which they selected their preferred
Doctoral Initiative on Minority Attrition and Completion58
ANALYSES OF PROGRAM INVENTORIES, STUDENT SURVEYS, AND SITE VISITS DATA
advisors, and their decisions about whether or not to join student or social organizations. Second, doctoral students must also learn to establish their niche as independent researchers while also becoming members of a community of scholars. While the act of balancing these competing demands is most certainly required of all doctoral students, our conversations with focus group participants at 16 institutions led us to believe that URM doctoral students face three uniquely challenging conditions. First, we heard some URM students express sentiments that their needs and challenges are not well understood by many of their non-URM faculty members and non-URM student peers. Some URM students noted that they faced hostility or instances of microaggression from non-URM faculty members and/or non-URM peers. Some URM students, for example, recalled allegations made by non-URM peers that they were only in the STEM doctoral program because they were fulfilling a racial quota or because they received minority fellowships. As a consequence, some URM students we spoke with felt as though they had to work harder to prove that they were deserving of their status in the program. While some of this behavior may simply be the result of unfamiliarity with admission processes and minority funding support among a majority of faculty and students, it also suggests a need for more sensitivity training and diversity awareness in the graduate school community. Second, URM students, particularly those who identified themselves as being first-generation students, often face difficulty in explaining the doctoral process and their academic work to their family members. Although it was apparent that family support plays a crucial role in student success, such support can be limited when family members lack personal experience in postsecondary education, especially the pursuit of a doctorate. This suggests a need to provide students, their families, and their home communities with more information about the doctoral process. Finally, although we learned about the critical role that self-motivated and self-appointed champions play in supporting URM students, we also became aware of the fragility of this arrangement. While not all champions were URM faculty or administrators themselves, those who were often got tapped by the university for a host of other purposes, a condition that imposed additional workloads and expectations upon them. Moreover, in situations where the roles and responsibilities of the
Doctoral Initiative on Minority Attrition and Completion 59
ANALYSES OF PROGRAM INVENTORIES, STUDENT SURVEYS, AND SITE VISITS DATA
champion are not institutionalized, should a champion decide to leave the institution, URM doctoral students would be left wanting. This reality suggests a need to institutionalize roles and responsibilities otherwise assumed voluntarily by these champions.
Doctoral Initiative on Minority Attrition and Completion60
CHAPTER 5. SUMMARY, RECOMMENDATIONS, AND FUTURE RESEARCH
Postsecondary participation of underrepresented minority (URM) students is expected to increase in the next decade. To ensure that growth at the undergraduate-level translates into the expansion
of graduate-level URM educational attainment in science, technology, engineering, and mathematics (STEM) fields, as well as subsequent participation in the STEM workforce, it is critical that the number of STEM doctoral degrees earned by URM students also increase. Until now, there has been a substantial gap in the literature on degree completion among URM STEM doctoral students. The Council of Graduate Schools (CGS) implemented the Doctoral Initiative on Minority Attrition and Completion (DIMAC) to address these gaps with a grant from the National Science Foundation (NSF).
In the DIMAC project, CGS worked with 21 institutions of higher education across the United States to assemble the largest dataset of its kind for the study of degree completion and attrition, as well as of time-to-degree and time-to-attrition for URM students in STEM doctoral programs. The 21 participating institutions also provided CGS with inventories of policies, practices, and interventions intended to support URM STEM doctoral students at their institutions. Finally, the DIMAC project recorded the opinions of URM students and university personnel about the factors likely to contribute to the completion of a STEM doctoral degree. Unlike previous studies, which focused largely on either cohort student data to estimate completion and attrition rates or data reflecting the experiences of students at a single institution or within a single field of study, DIMAC based its findings on student-level data, as well as student
Doctoral Initiative on Minority Attrition and Completion 61
SUMMARY, RECOMMENDATIONS, AND FUTURE RESEARCH
survey and focus group data, that encompassed multiple institutions and all STEM fields. Moreover, this study did not sample students; rather, it collected data on an entire population of students. The depth and breadth of the data added to the richness of the analyses performed in the DIMAC project. This chapter summarizes the findings from the project, makes recommendations for increasing URM STEM doctoral completion, and offers some suggestions for future research.
Summary of Findings
This project addressed four fundamental questions: What are the degree completion and attrition rates of URM STEM doctoral students, and how have they changed over time? What are the times-to-degree and times-to-attrition for URM STEM doctoral students? What activities or initiatives have been implemented at participating institutions to facilitate completion of STEM doctoral programs among URM students? What factors appear to contribute to higher completion and lower attrition of URM STEM doctoral students? Completion and attrition. This study found that 44% of URM doctoral students who entered their STEM programs at the participating institutions between May 1992 and April 2005 earned their doctorates within seven years, while 36% of them withdrew from their doctoral programs. The findings also revealed a 12 percentage point increase in the doctoral completion rate between years seven and ten for URM students who entered STEM doctoral programs between May 1992 and April 2002. Moreover, the results indicate that seven-year completion rates for URM STEM doctoral students for the most recent academic year cohort group in the project population was higher than that of the earliest cohort. Completion and attrition rates of URM STEM doctoral students varied by field of study, gender, and race/ethnicity. Black/African American STEM doctoral students, particularly those who were male, had lower completion rates than their Hispanic/Latino counterparts. Women STEM doctoral students had higher completion rates than men. Also, URM STEM students who started their doctoral studies with prior master’s degrees had consistently higher completion rates than their counterparts without prior graduate degrees.
Doctoral Initiative on Minority Attrition and Completion62
Time-to-degree and time-to-attrition. The overall median time-to-degree for students in the study who began their doctoral program between May 1992 and April 2005 and earned their doctorates by June 2012 was 66 months. The median time-to-attrition was 23 months. There were some variations in median times-to-attrition by student and institutional characteristics; however, for the most part irrespective of these characteristics, slightly more than one-half of students who withdrew from their doctoral programs did so within two years. Programs and initiatives. Analysis of the inventory data found that many of the policies, practices, and interventions intended to support STEM doctoral students in general are long-standing. From the focus group sessions, CGS researchers observed that a number of interventions focused on transitional challenges that incoming STEM doctoral students face. More specifically, there is a strong emphasis on the recruitment, selection, and admission of STEM doctoral students and their acclimation to the doctoral culture. National programs such as the U.S. Department of Education’s McNair Scholars program and NSF’s Louis Stokes Alliance for Minority Participation and Bridge to Doctorate programs are credited for being effective means of recruiting and preparing URM students for the academic rigor of STEM doctoral programs. However, both the inventories of policies, programs, and interventions and the focus group sessions suggested that there are very few interventions at the institutional level that are dedicated specifically to URM students in STEM doctoral programs. There are several special programs, including national initiatives such as NSF’s Alliance for Graduate Education and the Professoriate (AGEP) and the Sloan Minority PhD Program, as well as regional or institutional efforts such as the McKnight Doctoral Fellowship and the Meyerhoff Scholars Program, that specifically target URM students in STEM doctoral programs. However, CGS researchers observed from the focus group sessions that many interventions for URM STEM doctoral students, beyond providing additional funding support, are informal and ambiguous. Informal efforts such as peer support groups and mentorships appeared to be effective in fostering a sense of community among URM STEM doctoral students, thus helping them persist in their doctoral programs. While there may be resource and legal constraints preventing
SUMMARY, RECOMMENDATIONS, AND FUTURE RESEARCH
Doctoral Initiative on Minority Attrition and Completion 63
broader implementation of programs that explicitly benefit URM students, it is likely that more can be done to institutionalize some of efforts that address unique needs of URM students in STEM doctoral fields.
Limitations
Generally speaking, this project was constrained by three overarching limitations. First, in an effort to maximize the number of URM STEM doctoral students in the study, the Request for Proposal (RFP) specified that institutions offer a minimum of 15 doctoral programs in STEM fields. As a result, institutions offering a small number of STEM doctoral programs are not included in the study. There were also limitations associated with the data collected for the project. Participating institutions were not randomly selected; rather, they were selected based on alignment with the requirements as outlined in the RFP. Given the nature of the project and the intensive work demands for data retrieval and collection on the part of participating institutions, institutions that had a strong interest in the issues surrounding completion of URM STEM doctoral degrees and those with a robust institution research infrastructure are most likely to have responded to the RFP. Consequently, the results may be skewed by the institutions’ interest in and commitment to the project’s goals. Second, the calculation of completion rates, attrition rates, times-to-completion, and times-to-attrition were performed using data spanning academic years 1992/93 to 2011/12, while the elucidation of factors contributing to the successful completion of STEM doctoral degrees is based upon survey data collected from doctoral students enrolled in Fall 2012 and focus group interviews of doctoral students enrolled in Spring and Fall 2013. Furthermore, doctoral programs at participating institutions were asked to provide an inventory of policies, practices, and interventions as of Summer 2012 and to estimate, over a range of preceding years, the number of years in which they were in place. Third, student focus groups participants were a convenience sample. Each institution recruited their own participants from the roster of currently enrolled URM STEM doctoral students. However, all student focus group sessions were conducted by CGS researchers using predetermined and consistent protocol across all sessions.
SUMMARY, RECOMMENDATIONS, AND FUTURE RESEARCH
Doctoral Initiative on Minority Attrition and Completion64
Recommendations
These limitations notwithstanding, this study has established new knowledge about completion and attrition among URM STEM doctoral programs, which lead to a number of recommendations. The analyses of data generated by DIMAC revealed that challenges relating to the transition into and persistence through STEM doctoral programs can be mitigated at least to some extent by leaders at all levels of the institution by the following actions: conducting interventions early and often, providing enhanced academic supports, monitoring and evaluating programs and interventions, and cultivating a culture of diversity and inclusion. Each of these recommendations is discussed briefly in the following section. Conduct interventions throughout the doctoral process. In this study, there was evidence to suggest that pre-exposing students to the doctoral experience has a number of benefits that may contribute to the successful completion of a STEM doctoral degree. For example, summer research opportunities for undergraduates and incoming doctoral students can give them a head start in becoming acclimated to the doctoral program culture, understanding doctoral-level expectations, and establishing formative relationships with administrators, faculty, and fellow students. Similarly, advisors and faculty who meet with incoming URM STEM doctoral students early in the doctoral program have more opportunities to communicate expectations and contribute to the formation of a doctoral experience that is best suited to both the student and the program. Interventions that extend beyond the first year of the doctoral program could help ensure that investments in early interventions are not wasted. These interventions do not necessarily need to be focused on curricular aspects of the doctoral experience. For example, resources explaining each stage of the doctoral experience could be useful to first-generation students and could help reinforce positive communication between students and their families. Provide enhanced academic support. University personnel as well as some URM STEM doctoral students reported that levels of academic preparation were not always sufficient for graduate-level coursework or research experiences. While summer research opportunities, discussed above, can help assess and enhance academic preparation of
SUMMARY, RECOMMENDATIONS, AND FUTURE RESEARCH
Doctoral Initiative on Minority Attrition and Completion 65
incoming doctoral students, academic supports such as writing classes and mathematics and statistics supplements can help promote early academic success of doctoral students. If carried out among peers and peer mentors, these types of interventions can also help alleviate feelings of isolation and contribute to ongoing opportunities for social interaction. While more work needs to be done on the pipeline to graduate school, the results of this project also suggest that programs intended to help faculty advisors be better dissertation supervisors should be considered as well. Dissertation boot camps and peer support are important, given the fact that this is a stage in which doctoral students can feel particularly isolated and least understood. Faculty could benefit from guidance on how to walk the fine line between being a supportive mentor and being a “nag” during this stage. Monitor and evaluate programs and interventions. Although this study found that the vast majority of programs track students’ academic progress, it also found that less than one-half of programs make completion rates and related data available to the public, an action that might have an impact on recruiting prospective URM STEM doctoral students. In addition, there were few formal evaluations of interventions intended to support doctoral completion, particularly among URM STEM students. Institutions and graduate schools that implement sustained collection, analysis, and distribution of data regarding their STEM doctoral students, including and especially their URM students, may identify opportunities for program improvement. In an era of constrained resources, it is essential that there be a better understanding of exactly which programs or program elements have the greatest impact on reducing attrition and facilitating timely degree completion. Some programs, such as pipeline programs, are particularly expensive, and in the absence of external grant support, they may be difficult to sustain. Assessment should be built into the design of programs, rather than post-facto analyses. Cultivate a culture of diversity and inclusion. This study provided evidence to suggest that visible commitments to the diversification of the student body can have positive effects on STEM doctoral completion. For example, faculty members who attend minority-focused recruitment/graduate fairs, serve on campus diversity committees, or help URM students apply for minority fellowships are taking discernable steps towards
SUMMARY, RECOMMENDATIONS, AND FUTURE RESEARCH
Doctoral Initiative on Minority Attrition and Completion66
SUMMARY, RECOMMENDATIONS, AND FUTURE RESEARCH
broadening URM participation within not only their program but also their discipline and ultimately the STEM workforce. The implementation of diversity/cultural sensitivity training for administrators, faculty, and students as well as providing incentives to mentors and champions who take it upon themselves to support URM STEM doctoral student success would help to promote a culture of diversity and inclusion. To paraphrase the words of one university staff member who participated in a DIMAC focus group session, diversity and inclusion are not just matters of increasing the number of URM students; they are matters of changing the climate of diversity and inclusion on campus. Diversity and inclusion must be seen as a part of the excellence agenda, rather than be juxtaposed to it.
Conclusion and Directions for Future Research
The fact that the seven-year completion rates are less than 50%, compounded by the persistent difference in completion rates between Black/African American and Hispanic/Latino students should be a call for institutions and graduate programs to identify and implement policies, practices, and interventions that can lead to successful outcomes for all URM STEM doctoral students, especially among Black/African American students. The findings from this project suggest that successful advisor-advisee relationships and inclusive culture are particularly critical. The DIMAC project casts light on the fact that university personnel and URM STEM doctoral students alike agree that the “fit” between the student and the program, the relationship between the advisor and the student, and the mutual understanding of expectations are three pillars essential for a successful doctoral experience. However, the particulars of these three pillars remain somewhat undefined: (1) How is “fit” described, and what is the process by which it is achieved?; (2) What are the attributes of a successful advisor-advisee relationship?; (3) What are the differences and commonalities in the perception of “fit” between students, faculty, and administrators?; and (4) What are the ambiguities of program expectations that need to be addressed? Also, this project identified a need to support the cultivation of a culture of diversity and inclusiveness among all those involved in the
Doctoral Initiative on Minority Attrition and Completion 67
SUMMARY, RECOMMENDATIONS, AND FUTURE RESEARCH
institution. Future studies may want to explore further the effectiveness of interventions intended to achieve this goal: (1) What policies are most effective in nurturing diversity and inclusiveness?; (2) How do co-curricular activities support the mutual socialization of doctoral students and the graduate program?; and (3) Are there correlations between diversity climate assessments and completion rates? Despite generating the largest dataset of its kind, DIMAC lacked a control group, such as White, Asian, or international STEM doctoral students, it was not designed with a purposeful or random sample of institutions, and the data came from students who participated to varying degrees in an array of programs and interventions at varying periods of time. This study also did not collect information from students who left their doctoral program. As a result, it was impossible for this project to generalize the findings beyond the 21 participating institutions and draw causal inferences on doctoral completion. Future projects might explore differences in completion rates, attrition rates, time-to-degree, and time-to-attrition by citizenship, race, ethnicity, socioeconomic status, and family background. Future projects might also explore factors associated with early attrition and late attrition by race, socioeconomic status, family background, and other characteristics in efforts to reduce all attrition in general, and late attrition in particular. Accordingly, while the DIMAC project offers a broad view of URM STEM doctoral completion, this project was not designed as an evaluation of the impact of any specific program or set of interventions. Future studies should focus on specific elements of policies, programs, and interventions that aim to improve URM doctoral completion by posing and answering the following questions: (1) To what extent are specific practices and interventions (e.g., dissertation boot camps, summer research opportunities, etc.) contributing to improvements in completion rates and attrition rates?; (2) What are the components of various initiatives that help STEM doctoral students, especially URM doctoral students, succeed?; and (3) What metrics define a successful intervention? Finally, the DIMAC project focused primarily on factors that contributed to successful degree completion by URM STEM doctoral students. Future studies may devote attention to those students who withdraw from doctoral programs without a degree in order to better
Doctoral Initiative on Minority Attrition and Completion68
SUMMARY, RECOMMENDATIONS, AND FUTURE RESEARCH
understand the reasons behind attrition: (1) Why do students withdraw from doctoral programs?; (2) At what stages and for what reasons do students most commonly withdraw from their doctoral program, and why?; (3) How do we implement and assess a menu of interventions that are explicitly targeted to the unique challenges that characterize pre-candidacy and post-candidacy stages? Similarly, future studies may explore factors contributing to students who take a very long time to complete their degree.
Online Graduate Education69
REFERENCES
Allum, J. R. (2014). Graduate enrollment and degrees: 2003 to 2013. Washington, DC: Council of Graduate Schools.
Ampaw, F. D. (2010). The effect of labor market conditions and financial aid packages on doctoral students retention (Doctoral dissertation). Retrieved from North Carolina State University Libraries.
Ampaw, F. D., & Jaeger, A. J. (2012). Completing the three stages of doctoral education: An event history analysis. Research in Higher Education, 2012(53), 640-660.
Bell, N. (2010). Data sources: Time-to-degree for doctoral recipients. CGS Communicator, March.
Bowen, W., & Rudenstine, N. (1992). In pursuit of the Ph.D. Princeton, NJ: Princeton University Press.
Carnegie Foundation for the Advancement of Teaching (n.d.). Carnegie Classification: Methodology. Retrieved from http://classifications.carnegiefoundation.org/methodology/basic.php
Council of Graduate Schools. (2009). Broadening participation in graduate education. Washington, DC: Author.
Edwards Lange, S. (2010). The master’s degree: A critical transition in STEM doctoral education. Presentation at the CGS/NSF Workshop, Arlington, VA.
Gardner, S. K. (2010). Contrasting the socialization experiences of doctoral students in high- and low-completing departments: A qualitative analysis of disciplinary contexts at one institution. The Journal of Higher Education, 81(1), 61-81.
Online Graduate Education 70
REFERENCES
Golde, C. M. (1998). Beginning graduate school: Explaining first-year doctoral attrition. New Directions in Graduate Education, 26(1), 55-64.
Golde, C. M. (2005). Should I stay or should I go? Student descriptions of the doctoral attrition process. Review of Higher Education, 23(2), 119-227.
Groen, J. A., Jakubson, G. H., Ehrenberg, R. G., Condie, S., & Liu, A. Y. (2008). Program design and student outcomes in graduate education. Economics of Education Review, 27(2008), 111-124.
Hussar, J., & Bailey, T. M. (2014). Projections of education statistics to 2022 (NCES 2014-051). U.S. Department of Education, National Center for Education Statistics. Washington, DC: U.S. Government Printing Office.
Lovitts, B. (2001). Leaving the ivory tower: The causes and consequences of departure from doctoral study. Lanham, MD: Rowman and Littlefield.
Most, D. E. (2008). Patterns of doctoral degree completion: A longitudinal analysis. Journal of College Student Retention, 10(2), 171-190.
National Center for Education Statistics (2013). Integrated Postsecondary Education Data System. Washington, DC: Author.
National Research Council (1995). Reshaping the graduate education of scientists and engineers. A report by the Committee on Science, Engineering, and Public Policy. Washington, DC: The National Academies Press.
National Science Board (2014). Science and engineering indicators 2014 (NSB 14-01). Arlington, VA: National Science Foundation.
Online Graduate Education71
REFERENCES
National Science Foundation (2006). Investing in America’s future: Strategic plan FY 2006-2011. Arlington VA: The Author. Retrieved from http://www.nsf.gov/pubs/2006/nsf0648/NSF-06-48.pdf
Nerad, M., & Cerny, J. (1991). From facts to action: Expanding the educational role of the graduate division. CGS Communicator, Special Edition.
Nettles, M. T., & Millett, C. M. (2006). Three magic letters: Getting to Ph.D. Baltimore, MD: The Johns Hopkins University Press.
Ostriker, J. P., Holland, P. W., Kuh, C. V., & Voytuk, J. A. (Eds.) (2010). A data-based assessment of research–doctorate programs in the United States. Washington, DC: The National Academies Press.
Sowell, R. S., Bell, N., Francis, S., & Goodwin, L. (2010). The role and status of the master’s degree in STEM. Washington, DC: Council of Graduate Schools.
Sowell, R. S., Bell, N., Kirby, S. N., & Naftel, S. (2009). Ph.D. completion and attrition: Findings from exit surveys of Ph.D. completers. Washington, DC: Council of Graduate Schools.
Sowell, R. S., Zhang, T., & Redd, K. (2008a). Ph.D. completion and attrition: Analysis of baseline program data from the Ph.D. Completion Project. Washington, DC: Council of Graduate Schools.
Sowell, R. S., Zhang, T., Bell, N., & Redd, K. (2008b). Ph.D. completion and attrition: Analysis of baseline demographic data from the Ph.D. Completion Project. Washington, DC: Council of Graduate Schools.
Tinto, V. (1993). Leaving college: Rethinking the causes and cures of student attrition. Chicago, IL: University of Chicago Press.
Online Graduate Education 72
REFERENCES
Vaquera, G. (2007). Testing theories of doctoral student persistence at a Hispanic serving institution. Journal of College Student Retention, 9(3), 283-305.
Zwick, R. (1991). Differences in graduate school attainment patterns across academic programs and demographic groups. Princeton, NJ: Minority Graduation Project, Educational Testing Service and Graduate Records Examinations.