Embed Size (px)
Citation preview

RETENTION AND ATTRITION OF DOCTORAL CANDIDATES
IN HIGHER EDUCATION
Eric D. Malmberg, B.S., M.Ed., M.B.A.
Dissertation Prepared for the Degree of
DOCTOR OF EDUCATION
APPROVED: Michael K. Altekruse, Major Professor and Department Chair
of Counseling, Development, and Higher Education Ronald W. Newsom, Committee Member and Program Coordinator for Higher Education Thomas C. Richards, Committee Member M. Jean Keller, Dean of the College of Education C. Neal Tate, Dean of the Robert B. Toulouse School of
Graduate Studies
UNIVERSITY OF NORTH TEXAS
December 2000

Malmberg, Eric D., Retention and attrition of doctoral candidates in higher
education. Doctor of Education (Higher Education), December 2000, 154 pp., 27 tables, 4
illustrations, references, and 148 titles.
A number of studies have been conducted on the attrition rates of undergraduate
and graduate students. However, the body of knowledge concerning attrition for doctoral
students, especially those who have attained the level of “all but dissertation” (ABD), is
limited.
The purpose of this research was to examine retention and attrition factors of
doctoral candidates from a typical Higher Education Doctoral Program (Research II
Public Institution) who were admitted to candidacy from 1991 through July 2000.
Participation of the subject population was limited to those who had attained the level of
ABD--those who had previously fulfilled the residency, coursework, foreign language or
tool-subject requirements, and successfully completed the comprehensive/qualifying
exams. This population included current ABDs, previously attrited ABDs, and graduates
of the degree program.
The research study was qualitative and intended to identify the effect of specific,
predetermined factors that may have influenced or affected the progress of current,
previous, and graduated students towards the doctoral degree in higher education. This
study obtained responses to questions from the questionnaire/survey instrument concerning
factors that affected program completion or attrition. Students had the opportunity to
elaborate on factors from their dissertation, advisement, and personal, financial, and

employment experiences that affected their ability to complete the program through
open-ended question responses.
By examining key factors in the doctoral degree experience from the three sample
groups (current ABDs, previous ABDs, and graduated Ed.Ds), this study was able to
draw some conclusions about doctoral attrition. Reconstructing and comparing the
experiences of ABDs from the point of candidacy to the point of attrition or completion
of the program determined trends, commonalities, and issues affecting achievement.
Results of this study add to the limited research concerning ABD attrition and
provide an insight from the student perspective as to the obstacles and support variables
in the quest for the doctoral degree.

ii
© Copyright 2000
by
Eric D. Malmberg
iii
ACKNOWLEDGMENTS
The completion of this study could not have been accomplished without the
support, contributions, and encouragement of many individuals. I am extremely grateful
to the current, previous, and graduated survey participants who willingly and unselfishly
shared their doctoral experiences through their questionnaire responses. I would also like
to thank Albert B. Smith and Brent D. Cejda for allowing this study to be conducted in
their Higher Education Doctoral Program.
I am grateful to my committee chair, Michael K. Altekruse, and dissertation
committee members Ronald W. Newsom and Thomas C. Richards. I thank them for their
guidance, constructive reviews and critiques, and encouragement during the dissertation
process. I am also grateful to Kathleen Smith for proofreading this dissertation.
I offer my sincere gratitude and thanks to my previous committee chair, professor,
colleague, and friend -- John P. Eddy. His steadfast encouragement, leadership, guidance,
and mentoring were a source of inspiration and support throughout my entire degree
program.
Most of all, I offer a special thank-you to my wife, Marlene, who has been a
constant source of support, encouragement, confidence, and love during this quest for the
doctorate. I could not have done it without her.
iv
TABLE OF CONTENTS
Page Chapter 1. INTRODUCTION ...................................................................................................1
Statement of the Problem Purpose of the Study The Research Question and Subquestions Limitations and Delimitations Definition of Terms Significance of the Study
2. REVIEW OF THE LITERATURE .........................................................................6
Chapter Overview Historical Background Factors Affecting Success Summary
3. METHODOLOGY ..................................................................................................46
Description of the Population Research Method Research Instrument Pilot and Previous Study Data Collection Procedures Data Management/Analysis
4. RESULTS ................................................................................................................54
Chapter Overview Results of the Study Summary of Survey Returns Conclusions Discussion Suggestions for Further Research and Actions
APPENDIXES .................................................................................................................126
REFERENCES ................................................................................................................142

v
LIST OF TABLES
Table Page 1. Relationship of Research Questions and Survey Instrument Questions/Items..........53 2. Population Sample and Survey Response Rate of ABDs and Graduated
Participants in the Study ............................................................................................58 3. Question 1: What Was Your Age When Starting the Dissertation Portion of
Your Doctoral Program?............................................................................................60 4. Question 2: What Is Your Gender?............................................................................60 5. Question 3: What Is Your Ethnic Background? ........................................................61 6. Question 4: How Would You Describe Your Marital Status During the
Dissertation Portion of Your Doctoral Program? ......................................................62 7. Question 5: To What Extent Did You Stay Involved With the Institutional
Environment?.............................................................................................................65 8. Question 6: Did You Participate In An Academic Peer Support Group After
Completing the Qualifying Exams?...........................................................................66 9. Question 7: The Higher Education Research Seminar (EDHE 6310) Was
Beneficial to Increasing My Abilities to Conduct Independent Research.................68 10. Question 8: Did You Experience “Writer’s Block” While Formulating or
Writing Any Portion of the Dissertation? ..................................................................70 11. Program Factors Influencing Degree Progress ..........................................................74 12. Program Factors Affecting Dissertation Progress......................................................77 13. Committee Advisement Factors Influencing Degree Progress..................................82 14. Question 10: Were Changes Made to Your Dissertation Committee (Chair and
Members) After Completing the Qualifying Exams?................................................84 15. Question 11: My Relationship With the Dissertation Committee Chair Could
Best Be Described As?...............................................................................................87 16. Question 12: My Relationship With the Dissertation Committee Could Best
Be Described As?.......................................................................................................89

vi
17. Personal Factors Influencing Degree Progress ..........................................................92 18. Personal Factors Affecting Dissertation Progress......................................................97 19. Question 14: In General, Was Your Family Supportive of Your Study For the
Doctorate? ..................................................................................................................98 20. Question 15: To What Extent Did Family Commitments Take Time Away
From Your Doctoral Studies? ....................................................................................100 21. Question 16: To What Extent Did Personal Obligations Take Time Away From
Your Doctoral Studies?..............................................................................................102 22. Relevant Financial Factors Influencing Degree Progress..........................................103 23. Relevant Financial Factors Affecting Dissertation Progress .....................................104 24. Question 17: What Percentages of the Following Financial Options Were Used
To Fund Your Doctoral Studies? ...............................................................................107 25. Employment Factors Influencing Degree Progress ...................................................108 26. Employment Factors Affecting Dissertation Progress...............................................110 27. Question 18: If Employed, Was Your Employer Supportive of Your Completing
the Degree? ................................................................................................................111

vii
LIST OF ILLUSTRATIONS
Figure Page 1. Respondents adversely affected by commute to the university .................................78 2. Personal factors which adversely affected dissertation progress...............................97 3. Relevant financial factors which adversely affected dissertation progress ...............104 4. Employment factors which adversely affected dissertation progress ........................110

1
CHAPTER 1
INTRODUCTION
This year in the United States, almost 44,000 graduate students will receive their
doctoral degrees. During the period of 2000 through 2005, about 261,600 doctorates are
projected to be conferred (The Chronicle of Higher Education, 1999, p. 25). On the
surface, this appears to be positive news for U.S. colleges and universities, which will be
trying to hire new faculty and staff during the same period. But what about the others,
who entered doctoral studies, completed all their coursework, residency requirements,
foreign language or tool-subject, passed their comprehensive exams, and were in the
dissertation phase of their program? Approximately 65,400 doctoral candidates will be
casualties of attrition from higher education programs across the United States.
Statement of the Problem
There are many stakeholders in doctoral candidates’ rise from ABD to the final
attainment of their doctoral degree. In addition to the students themselves, the research
advisor or major professor,
. . . the university; and society as a whole – have a vital interest in the successful
outcome of every thesis or dissertation project. Every time a graduate student’s
dissertation sheds some light on a dark corner of human understanding and
banishes some segment, however small, of the world’s mystery, society reaps
incalculable benefits. (Madsen, 1992, p. 8)

2
The problem is in identifying and examining the factors that may have influenced
or affected the progress of current, previous, and graduated students.
Purpose of the Study
The purpose of this study was to examine the retention and attrition factors of
doctoral candidates in a typical Higher Education Doctoral Program (Research II Public
Institution).
The Research Question and Subquestions
As in the study conducted by L. H. Myers (1999) to describe ABD attrition, the
researcher sought to answer the one primary research question, with five subquestions:
What do candidates of a Higher Education Doctoral Program selected for this
study (Research II Public Institution) perceive as obstacles to completion of the doctoral
degree?
1. What are the perceived doctoral program factors that may have influenced or
affected the progress of current, previous, and graduated students?
2. What are the perceived committee advisement factors that may have influenced or
affected the progress of current, previous, and graduated students?
3. What are the perceived personal factors that may have influenced or affected the
progress of current, previous, and graduated students?
4. What are the perceived financial factors that may have influenced or affected the
progress of current, previous, and graduated students?
5. What are the perceived employment factors that may have influenced or affected
the progress of current, previous, and graduated students?

3
The factors affecting dissertation completion were determined by analyzing
student responses to the survey instrument of their experiences in the doctoral program
after attaining ABD status.
Limitations and Delimitations
Participation of subject population was limited to those who attained the level of
ABD, those who had previously met the residency requirements, course completion,
foreign language or tool-subject requirements, and successfully completed the
comprehensive/qualifying exams. This group consisted of all ABD doctoral students in a
typical Higher Education Doctoral Program who were admitted to candidacy from 1991
through July 2000. This population included current ABDs, previously attrited ABDs,
and graduates of the degree program. Current students who had not reached this level by
the time of sample selection were not included.
Random sampling of the defined population was not desired, since the rationale
for using the special classes of participants was (a) to focus upon their experiences and
(b) to ascertain the possible obstacles to completion of the dissertation and subsequent
attainment of the doctoral degree. No other special classes of participants were required.
The following assumptions were made in conducting this study:
1. The Graduate School and the Higher Education Doctoral Program maintain
accurate records.
2. Progress by students to attain the level of ABD demonstrates a strong
commitment to complete the dissertation process and attain the doctoral degree.

4
3. Participants were exposed to similar environmental conditions and program
requirements within the Higher Education Doctoral Program and were subject to similar
factors or obstacles towards completion of their dissertation.
4. The expanded open-ended questionnaire provided a more comprehensive method
for focusing upon student experiences through their written commentary and elaborations
than the traditional Likert-type scale.
5. Participants would respond honestly, openly, and truthfully to the questionnaire.
“It is assumed that time did not substantially distort their recollections of a major life
event, the doctoral process” (L. H. Myers, 1999, p. 11).
Definition of Terms
ABD: “All but dissertation” doctoral students who have completed all
coursework, language or tool-subject requirements, and residency requirements; have
successfully completed the qualifying exams; and are within the time limit of their
program. At this point, all that remains is the writing and defense of the dissertation.
Attrition: The voluntary or involuntary discontinuance of a student’s participation
in the degree program prior to completion.
Completer: A person who has completed all requirements for the doctoral degree,
including the dissertation, and has been awarded the degree.
Comprehensive or Qualifying Exams: Series of written and oral examinations
encompassing all previous coursework in the student’s major and minor field of doctoral
studies.
Course Completion: Student’s completion of all doctoral course requirements.

5
Doctoral Candidate: The formal identification used for those doctoral students
who have completed all coursework, residency, language or tool-subject, and
comprehensive/qualifying exam requirements. The unofficial classification for these
students is ABD.
Noncompleter: A person who has not completed all requirements for the doctoral
degree, including the dissertation, and has not been awarded the degree.
Persistence: The continuance of a student’s progress towards degree completion.
Residency Requirement: Requirement to complete a full schedule (at least 12
semester hours) of graduate coursework in each of two consecutive terms. Students
holding half-time graduate assistantships may satisfy the requirement by taking at least 9
hours of course work in each of the two long terms and 6 hours in the summer (Texas
Tech University, 2000, p.36).
Time Limit or Time-to-degree: All requirements for the doctoral degree to be
completed within a period of 8 consecutive calendar years (Texas Tech University, 2000,
p.38).
Significance of the Study
This study adds to the body of knowledge regarding the experiences of ABD
students during the dissertation phase of their doctoral program. It provides relevant data
about the factors and obstacles encountered by these students and provide better insight
into how they dealt with these issues. Because only a limited amount of information is
available on this population, it will be of interest to a myriad of stakeholders in the higher
education process, particularly students and those administering doctoral programs.
6
CHAPTER 2
REVIEW OF THE LITERATURE
Chapter Overview
This chapter presents relevant information on the factors and obstacles to
dissertation completion found from the literature review. There have been a number of
studies on attrition; however, the majority of information on doctoral attrition
concentrates on student research projects for the dissertation. This wealth of information
provides a more comprehensive look into the more prominent variables relating to
doctoral degree attrition.
Historical Background
Graduate education in the United States has a relatively short history. Graduate
study started at Harvard College in 1826, and soon after, in 1829, Princeton began its
program. The actual awarding of the doctorate did not occur until over 30 years later, in
1861. Yale University was the first American institution to confer the Ph.D., and Harvard
followed in 1873 (Malaney, 1988). In 1875, U.S. universities granted 23 Ph.D. degrees.
The numbers continued to rise at a rate of about 7% per year, and for the period of 1875
to 1879, 161 doctorates had been awarded.
By the turn of the 20th century, doctorates were being awarded at the rate of 382
per year. Harmon (1978) stated,
This growth rate has fluctuated widely, particularly as a result of World Wars I
and II and also as a result of the great economic depression of the 1930’s, as well

7
as for reasons that cannot be accurately determined, particularly at the early years
of this century [20th century]. (p. 1)
By 1970, the number of awarded doctorates surpassed 31,000 per year. The
National Science Foundation reported that over 1 million doctorates (1,174,442) have
been awarded during the past 40 years; of these, 33.8% were conferred within the last 10
years (Sanderson, Dugoni, Hoffer, & Selfa, 1999). The rate of doctoral enrollments is
expected to slow over the next 4 years; however, it is anticipated that rates will start
increasing by the year 2005 (The Chronicle of Higher Education, 1999, p. 25).
According to the National Science Foundation’s [NSF] Doctorate Recipients from
United States Universities: Summary Report 1998, colleges and universities in the United
States awarded 42,683 research doctoral degrees (Sanderson et al., 1999). The field of
education accounted for 15.4% of these degrees, a decline from the 1968 rate of 17.6%.
Data from the National Center for Educational Statistics (NCES) revealed that
approximately 5% of the 42,683 degrees, or 2,255 doctoral degrees, were awarded to
students in educational administrative and supervision fields (U. S. Department of
Education, 1999). Degree completion by women has continued to rise: “Women
continued to increase their proportion of the Ph.D. pool, earning 13,452 doctorates, or
48% of those granted to Americans. That compares to 42% 10 years ago and 29% 20
years ago” (Magner, 1999, para. 6). The highest percentages of doctorates awarded to
females are in the field of education. The proportion of recipients has risen significantly
over the past 4 decades: 19.9% in 1968, 39.7% in 1978, 55.2% in 1988, and 62.8% in
1998 (NSF, 1999).

8
The NSF’s report also revealed an increase in minority Ph.D. attainment: African
Americans (1,467) had an increase of 1.1%, or 131 Ph.D.’s awarded in 1997; Hispanics
(1,190) had an increase of 1.14%, or 143 Ph.D.’s awarded in 1997; Asians (1,168) had a
decrease of 9%, or 128 Ph.D.’s awarded in 1997; and American Indians (189) had an
increase of 1.14%, or 20 Ph.D.’s awarded in 1997. Magner (1999) observed that the
National Science Foundation report “held good news for universities interested in
increasing the diversity of the Ph.D. pool. More minority Americans than ever, 4,014,
earned doctorates in 1998, up from 3, 845 the previous year” (para. 9).
Attrition rates of college and university students in undergraduate programs have
been, and will continue to be, the focus of numerous research and dissertation studies.
Data obtained from these efforts enable institutions to assess or validate their
productivity, efficiency, quality of services, and to respond to the concerns of their
stakeholders (Hanson, 1992). Specifically, the data may direct a more indepth evaluation
of entrance requirements, curriculum content, and prerequisite course needs; degree
programs; quality of student services, housing, and food services; counseling and
administrative support services; financial aid, scholarship, and work study availability
and processes; and library facilities and computer lab resources. To a certain degree,
retention and attrition studies provide a more detailed perspective of what the institution
is doing to be “more inclusive and diverse by race, ethnicity, gender, disability, sexual
orientation, age, socioeconomic status, and other factors” (Upcraft & Schuh, 1996, p. 7).
Two of the most notable studies of doctoral attrition were conducted by Bernard
Berelson in 1960 and William Bowen and Neil Rudenstine in 1992. Berelson’s (1960)
Graduate Education in the United States was the first comprehensive study of graduate
9
education, and it provided a wealth of data on retention and attrition. Data included time-
to-degree, financial resources, student ability and motivation, department and program
structure, and completion rates. An interesting perspective on attrition was found in the
views of graduate deans and faculty. Graduate deans speculated that attrition from
doctoral programs ranged from 50% to 55%, whereas faculty thought the rate was about
20%. Neither group felt that graduate attrition was a major concern. Bowen and
Rudenstine’s (1992) work, In Pursuit of the Ph.D., continued the investigation of attrition
for the period of 1962 to 1986. Their work focused upon the doctoral programs in the arts
and sciences at leading research institutions. Their work examined completion rates by
program of study and size of the graduate program, as well as the influences of teaching
assistants and financial support on student time-to-degree. They also focused on the
relationship of the time between completing undergraduate studies and completing the
doctorate.
Malaney (1995) made the point that “the differences between undergraduate and
graduate students make generalizations of undergraduate research difficult to apply to the
graduate population” (as cited in Cooke, Sims, & Peyrefitte, 1995, para. 1). In addition,
the need for retention and attrition studies in doctoral programs has not received the same
attention as those in undergraduate programs. This may be due to the smaller number of
students in doctoral studies than in undergraduate programs--where retention and attrition
impact has a greater focus.
The Council of Graduate Schools in the United States (1977) declared, “The
doctoral program is designed to prepare a student for a lifetime of intellectual inquiry that
manifests itself in creative scholarship and research” (p. 1). Consequently, the pinnacle of

10
doctoral program success is the completion of the doctoral dissertation. Objectives of the
dissertation are to demonstrate the students’ ability to (a) conduct extensive and
independent research, (b) accurately interpret the data, (c) make an original contribution
to the body of knowledge through a new analysis or synthesis of previous research, and
(d) document the findings and share the results of the research (Chambers, 1960; Davis &
Parker, 1997; Mellon Institute of Sciences and Carnegie Institute of Technology,
Graduate Studies, 1970).
The steps needed to attain the doctorate differ to a certain degree from institution
to institution. The general coursework requirements are to complete concentrated study in
a major and minor field, earning a minimum amount of graduate credit beyond the
bachelor’s and master’s degrees. The concentration of coursework is defined in detail by
the division or program supervisory committee. An entrance examination is normally
required for entry into the doctoral program. Upon successful completion of the entrance
examination, the student is assigned a graduate advisor. The advisor works with the
doctoral student throughout the program. In addition to maintaining a required grade
point average, several milestones and requirements must be met by the student. These
include meeting residency requirements; completing the entire degree program within a
predetermined time-period; mastering a foreign language or tool-subject requirement;
completing a degree plan; completing qualifying examinations, usually written and oral;
and completing the dissertation. Of particular note, the doctoral student becomes a
doctoral candidate after completing coursework, language or tool-subject requirements,
residency requirements, and successfully completing the qualifying exams. At this point,
11
all that remains is the dissertation; doctoral candidates are commonly referred to as ABD,
meaning “all but dissertation.”
Doctoral students enter the program with a different base from which to grow
than do those in undergraduate or master’s programs. The doctoral student is usually
more mature, self-assured, skilled in negotiation and rationalization, adept at synthesizing
complex information, well-developed in communication and leadership skills, adept at
handling multiple role responsibilities, and effective in decision making (Phillips, 1996).
Sometimes, these same well-prepared students encounter obstacles to completing the
final stage of their doctoral program--the dissertation. The dissertation “requires
independent activity that must meet specific guidelines, with many unique hurdles to
overcome and many decisions to make to arrive at a satisfactory study” (Kluever &
Green, 1998, para.3). According to Smith (1982), “Some students find that they can never
take that giant step of writing the dissertation, and some begin, but never complete, the
project” (as cited in Vartuli, 1982, p. 37).
Writing the dissertation can be an intimidating experience because the process,
format, and requirements are somewhat alien. The dissertation “challenges all graduate
students, even top-grade, well-published ones, because it calls on skills far exceeding
those required by course papers or even journal articles” (Association for Support of
Graduate Students [ASGS], 2000a). The dissertation is frequently the ABD’s initial
independent research effort. In most instances, this is the first time the student has been
placed in a position of planning, managing, and completing a task of this magnitude--and
one so important to his or her future and career. Ramos (1995) described this period as
the ABD phenomenon. It is a time during which many students experience an increased

12
sense of isolation, insecurity, and uncertainty about their abilities; have feelings of
disenchantment, frustration, embarrassment, and guilt; and are somewhat at a loss as to
how to complete the final stage of their program.
There is a wide range of student involvement in completing each dissertation task.
Some students take a dominant role meeting these requirements, and others
assume that the university (advisor/committee) will provide the initiative for
completing each task. And, for some students, tasks are never completed and the
possibility of obtaining a doctorate fades away. (Kluever & Green, 1998, para. 10)
According to Cahill (1999), “A.B.D.’s are a dime a dozen” (para. 13). So who is
to blame for ABDs’ lack of completion? In general, both academia and the departing
student each blame the student for failure. In the absence of accurate exit interviewing or
feedback, the actual reasons for incompletion are rarely known (Lovitts, 1997b).
Although data are relatively easy to obtain concerning successful doctoral graduates,
colleges and universities are reluctant to publish statistical data pertaining to unsuccessful
doctoral candidates (Monsour & Corman, 1991). Interest in doctoral retention and
attrition data is normally limited to those associated with these programs in the
university, rather than on a large university-wide examination (Lee & Cayer, 1987;
Middleton, Mason, Stilwell, & Parker, 1988). Faculty, program offices, or doctoral
students working on dissertations complete most of the research, data collection, and
analysis. The results of this research receive far less distribution or widespread interest
than do those from undergraduate programs. Records of unsuccessful ABD doctoral
candidates are difficult to obtain because there are no nationwide data banks or records
available. The proportion of ABDs to graduates is unknown or even “how long they’ve
13
been in that category, and how those figures compare with the previous years”
(Leatherman, 2000, A18). The majority of ABD attrition information can be obtained
only from a particular program within a college or university. At this juncture, the
concern for confidentiality of student records becomes a factor, limiting available
avenues for discovery. Data about terminal ABDs and their attrition must be pieced
together from a variety of resources; that is, graduate office records, enrollment records,
dissertation advisors’ records and memories, class rosters, alumni, ex-students
associations, or even graduation programs.
In general, attrition rates of doctoral students entering the program range between
40% and 60% (Berelson, 1960; Bowen & Rudenstine, 1992; Cheatham, Edwards, &
Erikson, 1982; Cuetara & LeCapitaine, 1991). However, in an attrition study by
Lunneborg and Lunneborg (1973), the data revealed that 35% of doctoral students
dropped out of the program during their first 4 years of study (p. 381). Davis and Parker
(1997) speculated that “perhaps as many as one-third of doctoral candidates complete the
course requirements, but never the dissertation” (p. 6). Most of these students persist in
completing all planned coursework before dropping out of the program (Sigafus, 1998).
Bowen and Rudenstine (1992) reported that those reaching the level of ABD had an 80%
chance of completing the program. Quinn (1992) supported this view in her research on
time-to-degree. She reported that students completing the qualifying exams had an 82.4%
chance of attaining their degree.
The “facetious references to the ‘A.B.D.’ (all but dissertation) often cloak the
bitter acknowledgement of unfulfilled aspirations and altered career plans (Madsen, 1992,
xi). Altered plans include changing departments, majors, and degree programs midway

14
through the student’s doctoral program. Gonzalez (1997) found that after 9 years of
doctoral studies, 5.4% of the population at the University of Toronto migrated to a
program different from the one they began. These numbers were less than those found in
the Program of Higher Education at the University of North Texas with only 2.83%
changed majors (UNT, 2000, p. 2).
Although the factors associated with retention and attrition are similar in nature in
affecting student progress, they are not identical (Hamilton, 1998). Jacks, Chubin, Porter,
and Connolly (1983) conducted one of the more interesting investigations into ABD
attrition. Their research attempted to provide insight into the students’ reasons for leaving
the doctoral program; the impact upon their professional life; and an assessment of the
value of the Ph.D. for possible changes in requirements. Their research data results were
divided into major programs of study: psychology, sociology, biosciences, physics, and
electrical engineering. However, the major themes expressed by all students showed the
following variables adversely influencing their progress: (a) poor working relationship
with doctoral committees and advisors; (b) substantive problems with dissertation
research and topic selection; (c) financial needs, obligations, and difficulties; (d) family
pressures and demands; (e) lack of peer support; (f) personal or emotional problems; (g)
interference of paid work (full-time or part-time) with dissertation work; (h) loss of
interest and motivation; and (i) receipt of an attractive job offer or relocation.
All respondents of the survey felt that future opportunities for growth, career
advancement, and salary would be limited. In addition, most felt that the dissertation
process should essentially remain unchanged.

15
In identifying characteristics that facilitate or inhibit degree completion, Emerson
(1998) determined that successful dissertation completers rated family support,
perseverance, and peer support for their accomplishment; whereas noncompleters cited
job pressures, personal problems, and problems with the research topic as inhibitors to
their completion. Some of these same factors were identified by Green and Kluever
(1997) in their dissertation barrier research of 142 successful graduates and 97 ABDs.
Results of this investigation confirmed four significant obstacles to successful completion
of the dissertation phase of the degree program: (a) advisor/committee functioning, (b)
personal organizational skills, (c) time management and external pressures, and (d)
student research skills. Kluever’s (1997b) study of 142 doctoral graduates and 97 ABDs
found differences in each group’s sense of responsibility, employment patterns, financial
aid and problems, lack of research skills and experience, and external sources of moral
encouragement.
The research by L. H. Myers (1999) examined key factors in attrition of ABDs in
the College of Human Resources and Education in the Department of Educational
Leadership and Policy Studies at Virginia Polytechnic Institute and State University. His
study focused on those ABDs who were unable to complete the dissertation and
subsequently left the doctoral program. Just as importantly, this research study sought to
“explore rather than confirm contributing factors leading to attrition” (p. 59). Time and
finances were defined as the major obstacles to dissertation completion; these were
followed by frustration and/or loss of interest, financial considerations, family
considerations, and time and support considerations. The majority of respondents (54%)
reported relationship difficulties with their advisor and/or committee members. Balancing

16
family, personal obligations, and employment were detrimental factors for dissertation
completion for 64% of the respondents. Financial and employment factors adversely
affected over 70% of the ABDs’ ability to complete their dissertation.
Factors Affecting Success
As mentioned earlier, a number of research studies have attempted to isolate the
rudimentary causes of ABD attrition. The variables identified by these researchers can be
grouped into factors over which the student has some degree of control and those over
which they have no control. Research studies have sought to show comparisons
concerning age, gender, race, employment, financial support, motivation, advisor and
committee interaction, or lack of structure and preparation of students during the
dissertation stage of their program, as contributing factors in noncompletion of the
doctorate. In general, the factors of age (Berry, 1994; McGhee, 1993; Quinn, 1992), race
(Aragon, 1999; Ballew, 1997; Beeler, 1993; Cooke et al., 1995; Garcia, 1997; Hamilton,
1998; E. S. W. Harrison, 1997; J. L. Harrison, 1998; Loo & Rolison, 1995; McGhee,
1993; Quezada et al., 1984; Solorzano, 1993; Suen, 1995; Wiemers, 1999), and gender
(Aronson, Bennett, Moore, & Stoll, 1985; Barnett, 1982; Berg & Ferber, 1983; Filippelli,
1997; Gell, 1995; Germeroth, 1991; Kerlin, 1999; Lenz, 1995; Mooney, 1968; Muskopf,
1998) have not been found to contribute to completion or noncompletion of the
dissertation. This is most likely due to the fact that students have no control over these
variables. However, issues associated with these variables have been found to influence
relationships and interactions between students, their peers, advisors, and committees,
and subsequently to affect the time to degree completion.
17
Variables over which students have input or control are generally found to be
contributors or hindrances to their completing the dissertation. These include the
following:
Academic Advisement and Mentoring (ASGS, 2000b; Bako-Okolo, 1996; Bargar
& Mayo-Chamberlain, 1983; Barnett, 1982; Bauer, 1997; Berelson, 1960; Bloom,
1981; Campbell, 1992; Cheatham et al., 1982; Cooper, 1997; Davis & Parker,
1997; Faghihi, Rakow, & Ethington, 1999; Filippelli, 1997; Gardner & Beatty,
1980; Girves & Wemmerus, 1988; Golde, 1994; Goulden, 1991; Hales, 1998;
Hamilton, 1998; Harbold, 1988; Heiss, 1970; Karolyi, 1994; Lees, 1997;
Levinson & Darrow, 1978; Madsen, 1992; McFarland, 1995; Monaghan, 1989;
NSF, 1999; O’Bara, 1993; Schwarz, 1998)
Employment (Astin, 1975; Berry, 1994; Germeroth, 1991; Huguley, 1989; Jacks
et al., 1983; Wahlstrom, 1997; Wilson, 1965; Wright, 1991)
Family Support and Obligations (Berry, 1994; Hamilton, 1998; Harbold, 1988; L.
H. Myers, 1999; Powles, 1999)
Financial Assistance (Abedi & Benkin, 1987; Boydstun, 1996; Cheatham et al.,
1982; Davis & Parker, 1997; Dinham & Scott, 1999b; Hamilton, 1998; L. H.
Myers, 1999)
Integration, Involvement, and Interaction with the Institution (Astin, 1985; Bauer,
1997; Faghihi & Ethington, 1996; Girves & Wemmerus, 1988; Golde, 1994; Levi,
1969; Lovitts, 1997a, 1997b; Nielson, 1998; Tinto, 1987; Weil, 1990)
Peer and Social Support Groups (Gell, 1995; Hamilton, 1998; Monaghan, 1989;
Monsour & Corman, 1991; Stalker, 1991)
18
Personality Variables (Cooke et al., 1995; Dinham & Scott, 1999a; Hamilton,
1998)
Motivation (Bauer, 1997; Davis & Parker, 1997; Dorn, Papalewis, & Brown,
1995; L. H. Myers, 1999; Wilgers, 1992)
Persistence (Berry, 1994; Cabrera, Castañeda, Nora, & Hengstler, 1992; Cohen,
1998; Davis & Parker, 1997; Dorn et al., 1995; Frasier, 1994; Golde, 1994;
Karolyi, 1994; NSF, 1999; Tinto, 1987)
Procrastination (Cheatham et al., 1982; Davis & Parker, 1997; Simpson, 1986;
Wilson, 1965)
Research Skills of the Student (ASGS, 2000a, 2000b, 2000c; Bako-Okolo, 1996;
Bloom, 1981; Briggs, 1986; Dixon & Peltier, 1991; Graves, 1997; Heiss, 1967;
O’Bara, 1993; Olson, 1960; Pinson, 1997; Wilson, 1965)
Program Structure (Aronson et al., 1985; Bauer, 1997; Huguley, 1989; Kluever,
1997a)
Stress (Barnett, 1982; Cooke et al., 1995; Davis & Parker, 1997; Hales, 1998;
Malaney, 1988; Scrubb, 1998; Wells, 1982)
Time-to-Degree (Bair, 1999; Civian, 1990; Cuetara & LeCapitaine, 1991;
Gillingham, Seneca, & Taussig, 1991; R. S. Myers, 1999; Porter & Wolfle, 1991;
Wahlstrom, 1997; Wilson, 1965)
Topic Selection (Bargar & Duncan, 1982; Davis & Parker, 1997; P. D. Isaac,
Koenigsknecht, Malaney, & Karras, 1989; P. D. Isaac, Quinlan, & Walker, 1992;
S. Isaac & Michael, 1995; Lawton, 1997; Wilson, 1965)

19
In the early 1990s, Germeroth (1991) conducted a survey of 132 Ph.D. and Ed.D.
recipients in communications. The intent of the research was to identify leading factors to
dissertation completion, measure the severity of these obstacles, determine the value of
student support structures, and obtain opinions on completing a dissertation. She found
that the top three factors to dissertation completion were, (a) job related pressures and
demands (27.2%); (b) time to work on the project (26.6%); and (c) the student’s own
perfectionism (19.7%) (p. 64).
Tluczek (1995) examined obstacles and attitudes of dissertation completers,
noncompleters, and committee members from the Doctoral Program in Instructional
Technology at Wayne State University. She reported that the most significant obstacles in
completing the dissertation by this group were, (a) individual lack of motivation and self-
discipline, (b) demands of employment, (c) lack of research skills, (d) poor relationship
with advisor, (e) topic selection, and (f) lack of structure to remain on track.
L. H. Myers (1999) reported that student “frustration and/or loss of interest”
(36%), “finances” (27%), and “family factors” (18%) were the reasons most commonly
listed for noncompletion of the dissertation (p. 38). Supporting this premise, Kluever and
Green (1998) noted that the “external support systems from the advisor and family,
financial support, and reasonable time commitments for other activities affect dissertation
completion positively, and the absence of them may negatively affect it” (para. 31).
In her case study of four university departmental policies, practices, and
relationships, Golde (1997) found five key issues relating to student attrition:
1. Structure and timing of requirements affected student experiences.

20
2. Unrealistic expectations about graduate school and academic life soon led to
disillusionment.
3. Relationships with advisors affected student experience.
4. Decision to attrite was viewed as a positive by the student.
5. The experiences were different for students based upon their gender.
According to LaPidus and Mishkin (1990), successful doctoral dissertation
completers exhibit the traits of imagination, creativity, and productivity. They remain
intensely involved emotionally and intellectually and are able to balance the rigors,
stressors, and influences from internal and external sources to successfully complete their
dissertation (p. 287).
Gender, Age, and Race
The situation has changed since the 1960s and 1970s, when one of the major
obstacles to successful completion of the doctorate was one’s gender. Mooney (1968)
found that after being in the doctoral program from 6 to 8 years, only 16% of the women
attained their degrees. He found possible explanations in the need for women to remain at
home and care for the family and low expectations of teaching on a part-time basis. The
1980s and 1990s brought about a revolution in women’s attainment of advanced degrees
and a continued movement towards filling upper-level administrative positions of
chancellor, president, chief executive officer, provost, vice-president, assistant vice-
president and associate vice-president in academia.
Muskopf’s (1998) research into identifying the proportional increases of women
in these upper-level administrative positions reported that, indeed, women had made
significant increases in every category during the period from 1983 through 1998.

21
Gordon (1999) projected that 50,900 doctoral degrees will be awarded during the year
2006 in the United States. Of these 21,600, or 42.4%, will be awarded to women, and a
mere 18%, or 9,162 degrees, are projected to be awarded to African American women.
In her quest to identify critical factors influencing women’s persistence, Kerlin
(1999) reported that even though the women’s rates of enrollment are increasing, their
withdrawal rates remain higher than those of men. This may be due to their integrating
into middle- and upper-level leadership positions, juggling conflicting roles, and coping
with the demands of multiple responsibilities. Germeroth (1991) found this to be the
second most prevalent problem from female respondents in her examination of the factors
in completing the doctorate based on gender. These same Ph.D. and Ed.D. graduates in
communications “rated their perfectionism as more of a problem than men did their
perfectionism” (p. 67).
Previous studies on the effects of age, race, and gender were not found to be
significant predictors of degree completion (Berry, 1994; McGhee, 1993; Quinn, 1992).
However, in the gender research of graduate success by Berg and Ferber (1983), women
students were found to be at a disadvantage in finding same-sex role models and mentors.
“The positive effect of women faculty on women students might be stronger if women
faculty were themselves of higher rank and perceived as more successful” (p. 631).
In his study addressing underrepresentation of Mexican American faculty
members, Solorzano (1993) reported that only 0.7% of doctorates were awarded in the
United States to this minority group for the period 1980 through 1990. Aragon (1999)
and Quezada et al. (1984) pointed out that categorizing or stereotyping women of
Hispanic and Mexican ethnicity by graduate advisors could be an inhibitor to their

22
success. Specifically, they recommended that faculty advisors be more sensitive to, and
familiar with, the cultural, social, educational, financial, and family issues associated with
this diverse group of students. Ballew (1997) and J. L. Harrison (1998) found similar
results in their examinations of Native Americans’ experiences in doctoral programs. The
overall sense of feeling different or, in fact, being treated differently has adversely
influenced this group’s self-esteem and confidence. Subsequently, this minority group
has experienced large attrition rates from doctoral programs. On a positive note, Garcia
(1997) identified factors that facilitated completing the doctoral program by Hispanic
American women. These items included family background and responsibilities; outside
encouragement; grade performance; finances; understanding and dealing with racism,
leadership, and nontraditional knowledge; and learning English.
Some researchers have focused on race differences in attrition rates, and others
have determined that other factors may be operating. African Americans on
predominately White campuses drop out more than their White counterparts (Loo
& Rolison, 1995; and Suen, 1995); hence it is suggested that ethnic minorities
experience alienation from the university, which in turn leads to stress and
eventually attrition. Thus, minority status by itself may not be the key factor in
attrition. (Cooke et al., 1995, para. 9)
A study conducted by E. S. W. Harrison (1997) of Black doctoral students in a
predominantly White university revealed that one third of the graduates experienced race-
related difficulties in their programs. He reported that these students were exposed to
unfair treatment, underestimation of their abilities, exclusion, insults, and denial of
opportunities. However, they were able to cope with these obstacles by sheer self-

23
determination, increased relationship with their peers, maintaining connectivity
spiritually and socially, and a confidence in their abilities and self-worth.
O’Bara (1993) found that successful graduates rated their advisors very high on
issues relating to research. However, male students rated advisors higher than did female
students in their overall ratings. To a large extent, female doctoral students said that they
would not select the same advisor again. Beeler (1993) suggested that demographic and
socioeconomic population shifts would soon lead to increased student diversity. Faculty
advisors should prepare and improve their advising techniques to meet the needs of this
new wave of women, minority, and adult learners. This includes increasing the diversity
of minority and women representation in the faculty, developing mentoring programs,
and adjusting program relevancy to careers for “at risk” students (Wiemers, 1999).
Support for changes in advising techniques can be found from Solorzano’s (1993)
research of 66 Ford Foundation Minority Fellowship scholars. He reported that this group
encountered educational obstacles involving lack of program information; inadequate
preparation; shortage of role models; family responsibilities; affirmative action stigma;
and racial and gender discrimination. This same group reported the benefits to positive
mentoring and encouragement from individual faculty members, peers, and family.
Integration, Involvement and Interaction
In order to help students find the link between academic learning and practical
experience, Bok (1986) recommended that formal practice and instruction were needed
“to teach students to analyze different skills, understand their constituent elements, and
comprehend how the elements function to achieve a desired result” (p. 106). Rogers
(1969) highlighted the importance of learning by doing. “Placing the student in direct
24
experimental confrontation with practical problems, social problems, ethical and
philosophical problems, personal issues, and research problems, is one of the most
effective modes of promoting learning” (p. 162). According to Rogers, student learning is
facilitated by their active involvement in the process. The “buy-in” is greater when
students select their own direction for discovery, formulate their own issues and problems
for investigation, and, above all, live with the results of their work.
In examining the influences of institutional structure and environment upon
student development and integration, Pascarella suggested the following:
“Growth is a function of the direct and indirect effects of five major sets of
variables. Two of those sets, students’ background and precollege characteristics
and the structural and organizational features of the institution (for example, size,
selectivity, residential character), together shape the third variable set: a college’s
or university’s environment.
These three clusters of variables, in turn, influence a fourth cluster that
involves both the frequency and content of students’ interactions with the major
socializing agents on campus (the faculty and other students). Quality of effort,
the fifth constellation of variables, is shaped by students’ background traits, by the
general institutional environment, and by the normative influences of peers and
faculty members. (as cited in Pascarella & Terenzini, 1991, p. 53)
Tinto (1987) demonstrated that the intensity of the interaction between students
and the academic and social systems of the institutional program have a profound effect
upon student success or failure. “The opportunities for involvement within the university
for undergraduate students, while possibly extensive, may not be the most effective

25
method for improving involvement among graduate students” (Cooke et al., 1995, para.
35).
Family, Finance and Employment
In investigating attrition, Powles (1999) discovered that increased family concerns
and responsibilities were a leading cause of student attrition. This included family illness,
births, deaths, and marital separation or divorce. Family concerns and obligations are
intertwined with many of the variables affecting student success or failure in the doctoral
program. These variables include dealing with stress and anxiety; employment and
finances; time-to-degree; interaction with the institution; relationships with advisors and
committees; time devoted to research and writing; and individual motivation, persistence,
or procrastination.
In their research of the costs (excluding tuition) of competing dissertation
research, Cheatham et al. (1982) reported that the average doctoral candidate spent
$1,118.51. It is important to note that this research was done almost 20 years ago. At
today’s dollar, the figure would at least be doubled and probably tripled.
Some doctoral candidates are fortunate to obtain grants, scholarships, or third-
party backing to finance the dissertation phase of their program. But, all too often, the
majority of ABDs attempt to bear the burden of research costs from their normal budget.
Davis and Parker (1997) noted,
Students seem willing to borrow money and seek other financial aid for the period
they are taking courses, but seem quite reluctant to take financial risks at the
dissertation stage. From a logical standpoint, borrowing is most appropriate for
the completion of the dissertation. (p. 7)

26
In examining the factors associated with student problems encountered while
working on their doctorate, Dinham and Scott (1999b) found that financial difficulty was
the leading factor mentioned by almost 60% of those surveyed. The same point was made
by Abedi and Benkin (1987), who postulated that financial support was the most
important factor contributing to the time taken to complete the doctorate. They found that
doctoral students who supported themselves and family through off-campus employment
took longer to complete their degrees. Conversely, those doctoral students who did not
have to work off-campus, but received either financial aid or support (i.e., on-campus
employment), were able to complete their programs more rapidly. The lengthier time to
completion, due to the need to work full-time, was cited as a major factor in the success
of doctorate attainment in the research conducted by Wahlstrom (1997).
Faculty, alumni, and ABDs continually highlight the detrimental effects of full-
time job responsibilities upon progress towards completion of the dissertation. The
pressures and demands of employment were found to be among the most significant
factors to completing the dissertation by both completers and noncompleters of the
program (Germeroth, 1991; Wright, 1991). “Almost inevitably the immediate demands of
their paid employment became more pressing than the dissertation, and the dissertation
was put off indefinitely” (Jacks et al., 1983, p. 77). Models developed by Boydstun
(1996), after examining 366 doctoral-granting institutions, show that finances are the
overwhelming dominant issue affecting student progress towards the doctorate. Astin
(1975) found similar adverse effects to student success from full-time or off-campus
employment.

27
An interesting perspective on the time taken to complete the degree was
postulated by Wilson (1965), who reported that, the longer students were employed
before starting their program, the longer it took them to complete. The faster group
completed their initial coursework on an average of 2 years, while the slower group
(those with preemployment) took an average of 8 years to complete their coursework.
Stress and Anxiety
Student stress and anxiety during the dissertation phase of the doctoral program
vary in intensity, depending on the factors at work. Time constraints, family obligations,
perfectionism, finances, and advisor and committee conflicts are but a few of the issues
that can raise the ABD’s stress index and anxiety levels. Investigations into the effects of
stress upon completion of the degree support the notion that, the more stressors, the less
likely the program completion (Hales, 1998).
Individual students rarely acknowledge or recognize the stressors associated with
the dissertation process. Although they may realize that they are becoming more short-
tempered, irritable, and anxious, and are experiencing loss of sleep, they tend to associate
the manifestations with the approaching conclusion of their program and not recognize
that the increased stress upon themselves and family is caused by the research and writing
of the dissertation. Cooke et al. (1995) stated,
Stress and lack of support from family and friends are potentially associated with
the likelihood to drop out. Students who report feelings of great stress and those
who do not have social support to encourage them to persevere may be more
likely to drop out. (para. 13)
28
Wells (1982) wrote, “Others have described the checkpoints and hurdles
necessarily encountered by all doctoral students who stick it out. The three years are an
emotional binge: anxiety, affirmation, depression, euphoria, terror, and ecstasy. Most
students have these feelings” (as cited in Vartuli, 1982, p. 111). Usually, a spouse, peer,
close friend, or faculty member may be the first to recognize the symptoms of stress.
They may be able to assist the student by recommending “a number of strategies: (1)
improving study habits, (2) managing time wisely, (3) learning positive self-talk, (4)
learning how to relax, and (5) joining a student support group” (Whitman, Spendlove, &
Clark, 1986, p. 2). However, the prolonged affects of stress – unchecked or recognized –
can lead to serious consequences.
Malaney’s (1988) literature review on stress and anxiety provides extensive data
on the adverse effects of stress and the students’ ability to cope. In addition to becoming
obstacles to dissertation completion (motivation, depression, self-worth, guilt, etc.) stress
can put one into a high-risk category for illness (pp. 426-427). Responses from a two-
page stress survey of 30 doctoral students in the College of Education at Ohio State
University revealed overall agreement that stress influenced their ability to complete the
program. Reacting to financial adjustments during the 1st year of study caused the most
worry and stress. However, the single most stressful period was in preparation for the
comprehensive exams. “Physical symptoms during this time included intestinal disorders,
skin rashes, weight gain (20 pounds were reported gained by several woman), irregular
menstrual cycles, nervousness, and lack of sleep” (Barnett, 1982, p. 65).

29
Monaghan (1989) suggested that students who have a more difficult time coping
with the rise and fall of anxiety levels during the dissertation stage of the doctorate are
those unable to maintain a close relationship with their advisor.
Many advisors, committee members, and other faculty can offer the support and
sensitivity necessary to make the process one of gratification of specific skills and
abilities, so that the prolonged frustration does not build over a period of time to
symptoms of emotional and physical stress. (Barnett, 1982, p. 63)
Time Allocation and Topic Selection
In research conducted on 158 distance-learning doctoral students from Walden
University, Scrubb (1998) discovered that students experienced a significant amount of
stress while working towards degree completion. The greatest stressor was, time. The
factors of employment, family commitment, persistence, motivation, financial support,
and time to complete the degree are interconnected. The longer it takes to complete the
degree, the larger the costs associated with tuition, fees, and books; the greater the
demand upon the family life, the greater the likelihood to postpone project work.
Similarly, the more hours one works per week, in full-time or part-time employment, the
less time one has available for study and research, project development, interacting with
one’s family, along with the increased likelihood of procrastination. Subsequently, the
less time devoted to full-time or part-time employment, the greater the need for financial
aid and the greater the stress associated with the paying back of the loans. Of course,
another major influence in this equation is the time restraints associated with completing
the doctoral degree. Gillingham et al. (1991) described these determinants as “rational
student choice” (p. 464).

30
In her research at the Harvard University Graduate School of Education, Civian
(1990) reported that the average time to complete the entire doctoral program was 5.83
years. This time-to-degree increased significantly over the following 6 years. R. S. Myers
(1999) reported that the averages increased to 7.2 years. The largest increases occurred in
the humanities, social sciences, and education disciplines. The time-to-degree was also
recognized as the strongest predictor of student success. This premise was also noted by
Bair (1999) in her study of retention rates in 13 universities. She reported that, the longer
doctoral students spent in the program, the greater their chances were not to persist to
completion. “Research conducted by Porter and Wolfle (1991) indicated that the average
time required to complete a dissertation was 9.5 full-time months” (as cited in Cuetara &
LeCapitaine, 1991, p. 239). Their findings were substantiated several years later by
Cuetara and LeCapitaine (1991), who found the average time to completion to be 10.15
years.
The pressures upon the ABD student seem to increase and intensify with the
passing of time and approaching deadlines. Unfortunately, those postponing initiating
their dissertation development soon find the task almost overwhelming and almost
insurmountable. “Most experienced advisors find that a student’s early efforts to define a
research problem are characterized by confusion and uncertainty both about the nature of
the problem and how it might best be solved” (Bargar & Duncan, 1982, p. 17). Wilson
(1965) found from his research that “there is marked variability among individuals in
regard to the timing of initiation of dissertation research in relation to completion of other
degree requirements, and in speed of completion of the dissertation thereafter” (p. 169).
31
Students often experience periods of “writer’s block” during the development of
their proposal or writing the dissertation. This may occur when deciding upon a topic of
research, defining research questions, or at any stage along the way towards completion.
Cohen (1998) suggested that rigors of research and writing the dissertation differ greatly
from the requirements, expectations, and support found in previous writing experiences.
There are times when students believe they are experiencing writer’s block, when, in fact,
they are experiencing a phase of development, reflection, and “ripening” of ideas. This
pause in written productivity may raise the student anxiety levels and develop into
writer’s block.
Many students quickly encounter difficulties in deciding upon a topic for study or
developing research questions. “Such confusion and uncertainty in thought is likely to be
accompanied at times by emotional reactions of anxiety, feelings of inadequacy, self-
doubt, and loss of confidence” (Bargar & Duncan, 1982, p. 18). S. Isaac and Michael
(1995) identified several common mistakes graduate students make in formulating a
research study. The number-one item was postponing topic selection until finishing all or
most of the coursework. The second most notable problem was accepting the first topic
that they thought of or was suggested to them. The third mistake was selecting a topic
that was so massive and convoluted, which if attempted, could never be completed (p.
35). Lawton (1997) referred to those who select a topic too vast or complex to be
meaningful, as the “magnum opus” type of doctoral student (as cited in Graves & Varma,
1997, p. 8).
In examining the ideal time to begin work on a dissertation, Cheatham et al.
(1982) wrote that 87% of respondents felt that doctoral students should start work during
32
the coursework stage of study, while only 12% of respondents indicated that students
should wait until all coursework was completed. Although the topic of inquiry may be
selected prior to completion of the comprehensive exams, most “doctoral students
commonly wait until they have completed all requirements except the dissertation before
seriously considering the dissertation topic” (Davis & Parker, 1997, p. 49).
An investigation of 438 doctoral graduates revealed that 40% of education majors
(52% of all majors) actually selected their topic of inquiry before completion of the
comprehensive exams; the remaining 60% (48% of all majors) waited until after reaching
the ABD level (P. D. Isaac et al., 1989). The later work conducted by P. D. Isaac et al.
(1992) of 596 graduating Ph.D. students found that 70% of education majors (80% of all
majors) selected topics before completing comprehensive exams.
Preparedness and Research Skills
Wilson (1965) identified several factors related to student completion of the
dissertation: (a) choosing a topic outside one’s nature and scope of knowledge, one which
was unclear and out of focus; (b) delaying start of the research project by procrastinating
or taking a break in the program; (c) being unprepared and lacking knowledge of library
and research resources; (d) having inadequate research experience; and (e) possessing an
inability to organize and write up the results of research (p. 44).
Student preparedness for conducting intense research for the dissertation is a
concern to all parties involved in the process: the student, the advisor, the committee, the
university, and the community in general. Dixon and Peltier (1991) and Heiss (1967)
reported that many doctoral candidates are inadequately prepared to collect and analyze
the experimental research data obtained during the dissertation stage of their program.

33
Many students have attended only introductory statistics courses and are not able to run
statistical analysis computer programs, such as Statistical Package for the Social Sciences
(SPSS) or Statistical Analysis System (SAS). Subsequently, many of these students lose
confidence and resort to having the statistics done by a computing center or other
students.
Briggs (1986) suggested that “a systematic data collection should be guided by
systematic examination of the best methods for conducting research on the chosen
problem in the society in question” (p. 98). Defining the best methods of data collection
can be a difficult task, especially for students who are knowledge deficient in their
research skills. Many students, especially part-time students, are unwilling to take
research courses. They argue the relevancy of such courses and feel their time should be
devoted to required coursework (Graves, 1997). In some instances, due to employment
obligations or distance from campus, a few students find it difficult to gain access to
resources (Pinson, 1997).
Madsen (1992) found the following:
The syndrome that produces the A.B.D. is less likely to afflict the candidate who
is well prepared, who understands what is expected of him [or her] at each stage
of the degree program, and who knows how to go about researching and writing
the thesis. (p. xi)
Those who viewed the aspects of the dissertation process as being within their
control were more likely to complete the work than those who felt they had no control
over the process (Mariano, 1993).

34
Writing and Structure
Fitzpatrick, Secrist, and Wright (1998) whimsically proclaimed that “writing the
dissertation is guaranteed to reduce former academic confidence levels to quivering
attacks of feeling ‘educationally challenged” (p. xi). The point is that student
preparedness in writing the proposal and dissertation is often lacking. The process,
requirements, format, and structure are far removed from writing position papers during
the standard coursework phases of their program or producing articles for publication or
presentation. Actual formal preparation for this work may be available from the
university in the form of a dissertation research course or research seminar, which is
dedicated to assisting students develop their research proposal. These courses are
intended to “bridge the gap between theory and practice” (Texas Tech University, 2000,
p. 104). Regrettably, these courses are usually optional and are sometimes overlooked or
passed over by doctoral students in their pursuit to complete required coursework.
Writing anxiety was shown to be a factor to doctoral dissertation completion by
Bloom (1981). She found that the students’ previous academic and experience did not
adequately prepare ABDs for the rigors of proposal and dissertation completion. Bako-
Okolo (1996) explained that many doctoral candidates were adept in completing the
literature review of their dissertation, but far less prepared for analyzing the data or
completing the research design. O’Bara (1993) explained that many doctoral candidates
felt unprepared to tackle the rigors of intensive research and the prolonged planning,
construction, and formulation of placing their synthesized thoughts on paper. Many
students abandon the dissertation after realizing their inability to merge their learned
knowledge and research into a final body of work.
35
The Association for Support of Graduate Students (2000c) described the pressing
need for better writing:
Advisors are concerned about quality of writing, knowing their reputations go
online with the dissertations they chair. But few programs, with the exception of
English departments, offer doctoral coursework in writing and editing. This is
despite the fact students in most fields don’t write at a professional level and don’t
know how to copy-edit beyond basic grammar and organization. Until such
instruction becomes common, students are, for the most part, on their own to fine-
tune their dissertations. (para. 7)
Kluever (1997a) suggested that many ABDs need more guidance and structure to
bridge the gap between the structured coursework to the less structured dissertation phase
of the doctoral program. In comparing dissertation completers to noncompleters, he
found student support for increased structure in the dissertation stage of the doctoral
program. These suggestions included adding dissertation proposal writing, compiling
student support groups for those working on the proposal and dissertation, providing
guidance on how to choose a major professor and committee, managing time, and
establishing and maintaining quality communications with their committee.
In a study conducted by Bauer (1997) at UCLA, 342 Ph.D. candidates, 95 Ph.D.
graduates, and 193 dissertation advisors were asked to rate the level of satisfaction with
the dissertation structure. The data revealed that a major factor in slowing down the time
to obtain the degree was associated with service as a teaching or research assistant. An
interesting note to this work was the results of Lovitts’s (1997a) study on attrition. She
found that “people who dropped out were less likely to have had teaching or research

36
assistantships than their peers who earned degrees” (para. 5). The inference from the
work by Lovitts (1997a) and Bauer (1997) show the value of one’s interaction with the
institution as a teaching or research assistant. The time to completion of the degree may
be lengthened, but the success is increased.
Procrastination, Persistence, and Motivation
Procrastination is another obstacle in the doctoral candidate’s path towards
completing the dissertation requirement. The transition from the standard classroom
environment of coursework to the isolation of self-directed dissertation research takes its
toll on many students (Simpson, 1986). Some students elect to take well-deserved time
off before starting their dissertation, whereas others may feel unprepared or uncertain
about what they are to do and how they will go about it. The result is the same--the
project initiation is postponed.
The more time taken to complete the degree, especially after one becomes an
ABD, can have a negative impact on both the student and the university. The students’
competitiveness in the job market diminishes, their morale tends to decline, and their
persistence to finish the work dwindles. The university has a different set of issues to
contend with involving program attractiveness to prospective students and restrictions on
the number of new students allowed to enter the program (Weil, 1990). Of course, “the
most serious possible consequence of a delay in completion is that the doctoral
dissertation will never be written and the doctorate will never be attained” (Davis &
Parker, 1997, p. 6).
In a study conducted with professors from the University Council for Educational
Administration, Berry (1994) revealed that the most important variables limiting or
37
adversely affecting student success were associated with goal setting, individual student
persistence, working full time, and coping with pressures from family obligations.
Frasier (1994) concluded that student persistence and feelings towards graduate
work were directly related to the support, guidance, and direction received from their
program department. Faculty advisors generally view the students’ increased program
involvement as a positive action, which can easily lead to increased faculty and advisor
interaction and support (Girves & Wemmerus, 1988). Girves and Wemmerus stated,
“Involvement in one’s program is directly related to doctoral degree progress” (p. 185).
This viewpoint was substantiated almost a decade later by Lovitts (1997b). Her research
revealed profound differences in structures and opportunities available to students for
departmental academic and social systems integration. Degree completers were those
who were participators in departmental formal and informal development opportunities
and who were involved in activities beyond required coursework.
According to Karolyi (1994), student persistence was essential to completing the
dissertation. She suggested that success in this phase could be enhanced significantly by
fostering a sound professional relationship between the advisor and advisee. This active
relationship should be a joint effort by the advisor and advisee. The National Science
Foundation (1999) commented that the academic and professional interaction between
faculty and student strongly affected persistence. The positive interaction between
doctoral students, their peers, faculty, and the program improve the overall educational
experience, making it much more than acquiring a diploma (Harbold, 1988).
In The Doctorate: Talking About the Degree, Dinham and Scott (1999a) found
that the leading personal qualities for successful doctoral degree completion were

38
tenacity and perseverance. This view of student persistence was expressed by 91% of
their survey respondents. Dorn et al. (1995) made the point that the lack of persistence
and motivation positioned the student on a course towards reduced support and
encouragement from group members and peers.
Student persistence to complete the doctorate can be enhanced through a more
active intellectual involvement in the academic and social life of the university (Faghihi
& Ethington, 1996). Increased student involvement equates to greater satisfaction in the
overall academic experience (Nielson, 1998). In their research to find convergence
between two major theories of college persistence, Cabrera et al. (1992), found the
following:
Bean’s (1982) Student Attrition Model and Tinto’s (1987) Student Integration
Model are correct in presuming that college persistence is the product of a
complex set of interactions among personal and institutional factors as well as
presuming that Intent to Persist is the outcome of the successful match between
the student and the institution. (p. 158)
Dorn et al. (1995) analyzed group cohesiveness and student persistence
motivators and purported a link to graduate studies from Astin’s (1985) “theory of
involvement” and Tinto’s (1987) Student Integration Model. They found that educators
who “work together as a team earning doctorates benefit from the experience, share those
benefits with their workplaces, and most importantly, tend to find the motivation to
complete their doctorates” (p. 305).
Student motivation can be adversely affected in several ways, some internal and
some external. Certainly settling upon a dissertation topic and research question is a

39
hurdle that must be overcome in the initial stages. Students face many other difficulties in
their quest towards completion of the dissertation. Some are defined by Davis and Parker
(1997):
The project does not go as planned
Momentum is lost
Discouragement and depression
Writer’s block
Someone else publishes the same research
The dissertation is rejected. (p. 130)
In a study examining faculty attitudes towards doctoral students, McFarland
(1995) explained that the faculty expects doctoral students to initiate contact, be assertive,
independent, and committed. Generally, faculty members do not accept responsibility for
their advisees’ lack of progress. Bauer’s (1997) research at UCLA of 342 Ph.D.
candidates, 95 Ph.D. graduates, and 193 dissertation advisors concluded that lack of
personal motivation was a primary reason for noncompletion of the dissertation.
Peer and Social Support
Stalker (1991) wrote, “There is only one group more isolated than people who are
writing their dissertation; that is people who should be writing their dissertation” (p. 56).
Dissertation support groups can help avoid this isolation and be a valuable resource to
doctoral candidates; they can help members stay focused and work towards the common
goal of completing the dissertation (Stalker, 1991).
The support and guidance obtained from this peer group can help students cope
with the anxieties, pressures, and problems encountered during their program. While the

40
major advisor can advise on research design, topic selection, formation of research
questions, dealing with writer’s block, establishing goals and timetables, and a multitude
of other topics, the peer support group can offer advice and consolation for the student
who is dealing with internal feelings of frustration, disillusionment, isolationism,
insecurity, anger, confusion, self-doubt, disenchantment, inadequacy, loss of confidence,
and a feeling of generally being overwhelmed. Monsour and Corman (1991) wrote, “In
sum, individuals writing dissertations need support beyond that which is provided by
advisors and committees. . . . The ideal source of support is from someone who is
actually going through the dissertation process at the same time” (p. 182). Barnett (1982)
reported, “The most consistent support mentioned by female students was that of other
female students in the program (as cited in Vartuli, 1982, p. 66).
Monaghan (1989) found a viable reason to sanction support groups from his
analysis of doctoral student counseling: “The slowest students had no relationships with
others. And, while often given to helping others, they did not seek help themselves for
fear of feeling vulnerable” (para. 11). Gell (1995) surmised that the mutual concerns and
exchanges between students could best be accomplished in dissertation support groups.
She suggested that dissertation advising handbooks, describing major milestones and
requirements for limiting topic selection and developing the proposal, could be helpful to
ABDs in completing the final phase of the program.
Advisors and Committees
One of the most overwhelming variables in completing the doctoral dissertation
stage is the relationship between the student and his or her advisor and committee. The
time spent during their encounters may involve “both pleasant and unpleasant

41
experiences” (Goulden, 1991, p. 46). The Association for Support of Graduate Students
(2000b) offered ABDs sage advise about this relationship: “Problems with your research
can be frustrating, but problems with your advisor can be fatal to your degree” (para.1).
Astin (1971) found from his research on the college environment that “the
administrator who wishes to utilize these results in changing his [or her] environment
may be hindered by the fact that he [or she] does not have complete control over it” (p.
131). This statement is applicable to the both the advisor and advisee in their relationship
during the dissertation phase:
Should the relationship between student and advisor be closer than it is? In a
study some years ago, it was reported that 80% of all graduate faculty and recent
recipients of the Ph.D. degree were satisfied with the closeness of the relationship
(Berelson, 1960, p. 179). In the matter of advice, Heiss (1970, p. 153) found that
most of the 3,000 graduate students she studied were satisfied with their
relationship with their thesis advisor; however, 6% reported that advisors gave too
much direction, and 28% said they gave too little. It is, unquestionably, a difficult
balance to strike. Of additional interest, by the way, is the fact that 82% reported
that their advisers expected the candidate to take the initiative in arranging
meetings to discuss matters of concern. (Madsen, 1992, p. 16)
Heiss (1970) found that “the quality and character of the relationship between the
doctoral student and his major professor is unequivocally the most sensitive and crucial
element in the doctoral experience” (p. 151). Campbell (1992) and Bako-Okolo (1996)
stated that the strength of this relationship is most critical during the dissertation stage.
This is the time when the student is most in need of positive encouragement, guidance,
42
support, and mentoring by the advisor. In support of this premise, Faghihi et al. (1999)
observed that student dissertation progress was significantly enhanced through a positive
relationship with the advisor. Just as importantly, their research showed this to be
applicable to all students, despite their race, sex, age, financial status, or time within the
program. Campbell (1992) discovered that successful doctoral candidates attributed part
of their accomplishment to their strong rapport with their advisor, in his examination of
doctoral student completion and noncompletion at the University of Delaware.
Conversely, unsuccessful ABDs felt that a stronger relationship with their advisor would
have helped them achieve their goal.
Cheatham et al. (1982) found that, for the most part, students are “generally
satisfied with their advisors’ supervision” (p. 318). They reported:
Fifty-seven percent were very satisfied, thirty-two percent were satisfied, six
percent were neutral, four percent expressed dissatisfaction, and only one percent
were very dissatisfied. Reasons for dissatisfaction ranged from unclear
expectations to an unsupportive attitude. Thirteen percent of the respondents
reported that their advisor did not know enough about their research area, nine
percent claimed the expectations were unclear or inconsistent; eight percent
reported that their advisors did not spend enough time with them; four percent
indicated their advisors were not prescriptive enough, and three percent claimed
the advisors’ attitude was not helpful or supportive. (p. 319)
The National Science Foundation (1999) found in their Workshop on Graduate
Student Attrition that student time to degree could be reduced if their progress were
monitored more closely and regularly by faculty advisors. Research by Bauer (1997) and

43
Bloom (1981) recommended that faculty advisors encourage advisees to set goals,
milestones, and time schedules in working towards completion of the dissertation. Golde
(1994) concluded that student persistence and success could increase, provided they
received active intervention from the department and more caring and nurturing support
from advisors. A caring and positive attitude on the part of the advisor is paramount to
developing mutual respect and productive relationship between the advisor and advisee
(Bargar & Mayo-Chamberlain, 1983; Hales, 1998). Additionally, this increase in advisor-
advisee communication could identify and possibly eliminate some of the more common
inhibitors or obstacles to student completion of the dissertation, such as writer’s block;
picking a viable and exciting topic; coping with financial issues; full-time employment;
goal commitment/establishing timetables; and working through family and personal
problems.
Selection and Mentoring
Levi (1969) portrayed the ideal university: “They have inculcated an appreciation
for the works of the mind, developed the skills of the intellect, emphasized the continuing
need for free inquiry and discussion, the importance of scientific discovery, the need to
understand the nonrational” (p. 169). Advisors and committees have this same charge in
mentoring and guiding doctoral students through the dissertation process. Their
viewpoints describing these obstacles are indispensable in gaining a comprehensive
understanding of the ABD phenomena (McFarland, 1995).
Lees (1997) observed that students tended to choose dissertation advisors who
had similar interests and values, and those with whom they had a previous relationship.
Davis and Parker (1997) offered doctoral candidates some factors to take into account

44
when choosing an advisor. This includes their (a) past performance with other candidates,
(b) interest in competence in topic area or research methodology, (c) personality and
personal characteristics, and (d) response characteristics (p. 46). Another factor to
consider is the advisors’ experience in the profession. A study conducted at the Louisiana
State University and Agriculture and Mechanical College by Cooper (1997) on doctoral
advisors from the University Council for Vocational Education found the advisors’
professional experience to have the greatest impact on student completion rates. The
impact of the advisors on student completion was the focus of a study conducted by
Schwarz (1998). She found student progress affected by the values of the advisor,
frequency of their meetings and communications, and support from the advisor to help
the student complete his or her program.
The selection of the doctoral committee is equally important, and their
competence and interest characteristics can help or hinder the doctoral student’s progress.
“Two major criteria for selection are the assistance a proposed committee member is
likely to provide to the candidate and the advisor’s feeling as to how the proposed
committee member will function in the committee” (Davis & Parker, 1997, p. 47).
Madsen (1992) asserted that the research advisor will often be more aware of the “petty
feuds and personality conflicts that bedevil many departments” (p. 16). Gardner & Beatty
(1980) recommended that students try to select committee members who get along with
each other and are interested in the topic of research.
What their advisor and committee members expect from the doctoral student may
offer some insight into why conflicts and troubles occur between them. Advisors and
committee members generally want a candidate (a) who will do a good dissertation in a
45
reasonable time that they can be proud to sign; (b) who shows initiative, but accepts
guidance and follows through on suggestions; (c) who is organized, uses the committee’s
time effectively, and is also reasonable in the demands on their time; and (d) who has
personal integrity. (Davis & Parker, 1997, p. 47)
Mentoring involves a continuous series of goal setting, periodic maintenance, and
redirection to assure accomplishment of the task. Preestablished communication avenues
and routine meetings are essential in facilitating a strong professional and collegial
relationship between the advisor and advisee. Filippelli’s (1997) study involving
mentoring and gender differences reported that the career-enhancing mentoring advice
provided by the major professor was found to be more important to women than to men.
Summary
Research has concentrated on identifying the issues and variables associated with
attrition at the graduate and doctoral levels. These include correlation studies of age, race,
and gender; academic advisement and mentoring; employment; family support and
obligations; financial assistance; integration, involvement, and interaction with the
institution; peer and social support groups; personality variables of motivation,
persistence, and procrastination; research and writing skills of the student; program
structure; stress; time-to-degree; and topic selection. However, the data from the majority
of these works have not provided an understanding of how the ABD phenomenon
develops and progresses during the dissertation phase of study. Nor does the research
provide an insight into how these obstacles were overcome by successful dissertation
completers.
46
CHAPTER III
METHODOLOGY
Description of the Population
The participants for this project were selected from doctoral candidates and past
graduates from the Higher Education Program in a College of Education. The program
currently offers a doctor of education (Ed.D.) with a major in higher education and is in
the final stages of obtaining approval from The Higher Education Coordinating Board to
expand the program to include the doctor of philosophy (Ph.D.).
The population for this study consisted of current ABDs, previously attrited
ABDs, and graduates in a Higher Education Doctoral Program who were admitted to
doctoral candidacy from 1991 through July 2000. Students who had not reached this level
by the time of sample selection were not included in the survey.
The actual numbers of students surveyed within these three groups were 101; this
did not include two students who had died since becoming ABD. These groups consisted
of adults from approximately 25 to over 60 years of age; the group included both male
and female students; ethnic backgrounds were varied; and their marital status was within
the norms for their age groups. The age, sex, ethnicity, or marital status of the
participants were not factors in selection for participation or rejection from this study.
Research Method
The qualitative approach for this project was chosen to focus “on the meaning of
events and actions as expressed by the participants” (McMillan, 1996, p. 241).

47
Qualitative research and research questionnaires provide for richer insight into the issues
associated with factors to completing the dissertation process. Fitzpatrick et al. (1998) felt
that the “beauty of qualitative data is in reading and rereading and physically
manipulating the data, in discovering those little nuances, those pearls of wisdom your
participants have orally bestowed upon you” (p. 116).
The research conducted by Lawrence H. Myers, who used the research
questionnaire in ethnographic format, sought responses from participants in face-to-face
interviews. This methodology allowed the participants to respond spontaneously to
questioning and to elaborate on key issues when they felt it necessary. The drawback to
this method of data gathering was low participation. Myers found only 11 students
willing to participate in his research study.
The intention of this study was to expand Myers’s work by increasing the
population sample to include all ABD students, whether successful, unsuccessful, or in
progress of the dissertation stage. Therefore, the scope of the study was expanded to seek
a broader view of possible obstacles to completing the dissertation.
Research Instrument
The research instrument used in this study consisted of a 20-item questionnaire
developed by the researcher and through the contributions (questions 14, 15, 16, and 18)
of Lawrence H. Myers (Appendix F). Ten of these 20 questions were open-ended,
allowing respondents the opportunity of providing more indepth reactions in their
responses than could have been obtained by merely a Likert-type scale.
Demographic information Questions 1 through 4 were derived from a variety of
research studies (Emerson, 1998; Gell, 1995; Huguley, 1989; Myers, 1999; O’Bara,
48
1993). Faculty members from the research study institution sought responses to
Questions 5, 6, 7, 10, 19, and 20. Cohen’s (1998) writer’s block research provided the
foundation for Question 8. Myers’s (1999) questionnaire provided the basis for Questions
9, 11, 12, and 13, and the research studies of Emerson (1998), Hales (1998), Huguley
(1989), and O’Bara (1993) enabled more precise question development. Question 17 was
developed from the research by O’Bara (1993) and refined as a result of feedback from
the pilot study.
Questions were grouped into a logical sequence that solicited responses to
questions encompassing influences and impressions relating to their own preparedness;
advisor and committee interaction; personal and family aspects; financing of the degree;
employment factors; and other impediments affecting the completion of the doctoral
program. “This type of interview fit the needs of the researcher to explore for information
pertaining to the doctoral experience, and permitted the participants to tell their stories”
(L. H. Myers, 1999, p. 31).
Pilot and Previous Study
The content validity and reliability of the research questionnaire were found to be
consistent through the pilot testing of the instrument. The first pilot test of the
questionnaire was conducted with a group of previous Higher Education Doctoral
Program graduates. Results from this initial study enabled the researcher to refine the
directions, eliminate duplication, combine similar questions, and restructure the question
sequence. A second pilot study was conducted with a group of 6 current and previous
ABD students, as well as past graduates from a Higher Education Doctoral Program.
Results from the second pilot study found consistency in completion times and responses.

49
Only minor punctuation and syntax changes were made to the finalized instrument to
facilitate ease of reading and response. None of the pilot test participants was included in
the final survey.
Incorporated questions (14, 15, 16, and 18) from the L. H. Myers (1999)
questionnaire were also pilot tested on a small group of doctoral graduate students and
field tested with a larger population of doctoral students from Virginia Polytechnic
Institute and State University’s doctoral program in educational leadership. Approval for
use of this questionnaire may be found in Appendix E.
Data Collection Procedure
A request was made to, and approved by, the Coordinator for the Higher
Education Program in the College of Education to conduct the dissertation research at his
institution (Appendix A). A comprehensive listing of past and present ABD students and
graduated students from this program was compiled using data from a multitude of
sources within the university. This included graduate office records, registrar enrollment
records, dissertation advisor records and memories, qualifying exam completion records,
Doctoral Review and Summary Reports sent to the Higher Education Coordinating
Board, class rosters, alumni directory, ex-students associations, and doctoral graduation
programs. The faculty in the Higher Education Doctoral Program assisted the researcher
by reviewing names of prospective study participants and deleting names of students who
did not meet the criteria described above. A final review of current students who had
completed their qualifying/comprehensive exams during the month of July 2000 was
added to complete the final list of 101 participants used in the investigation. Mailing

50
addresses for the completed participants list were provided by the Higher Education
Program Office.
Formal approval from the University of North Texas Institutional Review Board
(Appendix B) was requested and obtained before contacting ABD students.
Subsequently, students on the completed participants list were sent a Letter of Purpose
(Appendix D) requesting their participation in the research study; the approved
University of North Texas Committee for the Protection of Human Subjects Research
Consent Form (Appendix C); Questionnaire/Survey Instrument (Appendix F); and a
return preaddressed and stamped envelope.
Questionnaires were color coded to distinguish among those who dropped out of
the program, currently enrolled doctoral candidates, and past graduates. Additionally,
each questionnaire and return envelope was annotated with alphanumeric symbols
corresponding to a master list of participants, such as “C,” “P,” or “G,” followed by a
number indicating their alphabetical position (i.e., C-001, for current student 1; P-005
symbolizing previous student 5; or G-007 for graduated student 7). The surveys for all
participants were identical, with the exception of the paper color “ivory” for current
ABDs, “buff” for previous ABDs, and “yellow” for graduated or Ed.D.’s. After 10 days,
67 nonrespondents were sent a second package of materials. This included a follow-up
letter of purpose and identical materials as in the first mailings. After an additional 10 day
period, the remaining nonrespondents were sent a final letter and package requesting their
participation. All surveys received up until the final drafting of this dissertation were
included.
51
Data Management/Analysis
Data collected on the survey instrument were categorized into tables and charts
manually by the researcher. The 20 survey questions and subquestions of (1) Age, (2)
Gender, (3) Ethnicity, (4) Marital Status, (5) Institutional Involvement, (6) Peer Support
Group Participation, (7) Value of Research Seminar, (8) Experiences in Writer’s Block,
(9) Factors (26 items) Influencing Degree Progress, (10) Changes to Dissertation
Committee, (11) Relationship With Dissertation Chair, (12) Relationship With
Dissertation Committee, (13) Employment, Financial, or Personal Factors (19 items)
Adversely Affecting Progress, (14) Family Support, (15) Family Commitments, (16)
Personal Obligations, (17) Financing the Degree, (18) Employer Support, (19) Ideas for a
Better Experience, and (20) Other Factors Affecting Degree Progress, were tabulated,
converted to percentages, and put into table format. Open-ended responses to these
questions were reported in narrative form. The data are organized around the following
five research questions guiding the study:
Research Question 1
What are the perceived doctoral program factors that may have influenced or
affected the progress of current, previous, and graduated students? The purpose of this
question was to ascertain trends, commonalities, and issues associated with the actual
doctoral degree program, which may have influenced student degree progress.
Research Question 2
What are the perceived committee advisement factors that may have influenced or
affected the progress of current, previous, and graduated students? The focus of this

52
question was to identify the perceived quality and quantity of the doctoral dissertation
committee and chair involvement, which may have helped or hindered student progress.
Research Question 3
What are the perceived personal factors that may have influenced or affected the
progress of current, previous, and graduated students? The purpose of this question was
to identify the positive or negative influences of the personal factors (internal or
external), including family commitments and obligations, which may have influenced
dissertation progress.
Research Question 4
What are the perceived financial factors that may have influenced or affected the
progress of current, previous, and graduated students? The intent of this question was to
obtain data relating to the students’ financing of the degree and to discover any financial
factors that may have helped or hindered student progress.
Research Question 5
What are the perceived employment factors that may have influenced or affected
the progress of current, previous, and graduated students? The purpose of this question
was to identify the positive or negative employment factors encountered that may have
influenced student degree progress.
In summary, Table 1 shows the relationship between the five research questions
and the 20 survey instrument questions and subquestion items.

53
Table 1
Relationship of Research Questions and Survey Instrument Questions/Items
Research questions Survey instrument questions/items
1 5, 6, 7, 8, 9 (l, r, t, v, w, x, y, z), 13 (l)
2 9 (a, b, e, f), 10, 11, 12
3 9 (c, d, h, i, k, m, n, o, p, q, s, u), 13 (d, e, i, j, m, n, q, r), 14, 15, 16
4 9 (j), 13 (a, c, h, p), 17
5 9 (g), 13 (b, f, g, k, o), 18

54
CHAPTER 4
RESULTS AND DISCUSSION
Chapter Overview
This chapter presents the demographic and personal results collected from the
survey instrument, discusses and interprets the results from the study data, makes
recommendations, and offers suggestions for further research. Survey results of the
qualitative analysis are organized under the associated seven categories: demographic
characteristics of the participants, doctoral program factors, committee advisement
factors, personal factors, relevant financial factors, employment factors, and other factors
affecting degree progress.
Results of the Study
Research Question 1: What are the perceived doctoral program factors that may have
influenced or affected the progress of current, previous, and graduated students?
The perceived doctoral program factors that may have influenced or affected the
progress of current, previous, and graduated students reported by at least 50% of
respondents included Research Skills (87.3%), Writing Skills (87.3%), Topic Selection
(77.8%), the Higher Education Research Seminar Course (EDHE 6310) (58.7%),
Program Requirements (58.7%), and Time-to-Degree (50.8%).
Additionally, the Commute to the University (38.2%), Writer’s Block (38.1%),
Support Groups -- outside academia (38.1%), Involvement within the University

55
(30.2%), Institutional Involvement (28.6%), and Support Groups -- in academia (22.2%)
were believed to be pertinent factors influencing dissertation progress.
Research Question 2: What are the perceived committee advisement factors that may
have influenced or affected the progress of current, previous, and graduated students?
The perceived committee advisement factors that may have influenced or affected
the progress of current, previous, and graduated students reported by at least 50% of
respondents included Relationship With Dissertation Chair (93.6% positive), Committee
Chair (92.1%), Relationship With Dissertation Committee (90.5% positive), Committee -
- other than Chair (81.0%), Academic Advisement (69.8%), and Changes to Dissertation
Committee (52.4%).
Additionally, Academic Mentoring (49.2%) was believed to be a pertinent factor
influencing dissertation progress.
Research Question 3: What are the perceived personal factors that may have influenced
or affected the progress of current, previous, and graduated students?
The perceived personal factors that may have influenced or affected the progress
of current, previous, and graduated students reported by at least 50% of respondents
were: Motivation (90.5%), Family Support of Doctoral Study (96.8%), Family Support
(88.9%), Persistence (82.6%), Stress (68.3%), Family Obligations (65.1%), Family
Commitments (65.0%), Perfectionism (60.3%), Personal Obligations (57.1%), Other
Obligations (54.8%), Age (53.9%), and Anxiety (50.8%).
Additionally, the factors of Procrastination (47.7%), Family Obligations (46.0%),
Stress/Anxiety (36.5%), and Gender (20.6%) were believed to be pertinent factors
influencing dissertation progress.
56
Research Question 4: What are the perceived financial factors that may have influenced
or affected the progress of current, previous, and graduated students?
The perceived financial factors that may have influenced or affected the progress
of current, previous, and graduated students reported by at least 50% of respondents
included financing their degree through full-time employment (87.8%).
Additionally, Financial Assistance (39.7%), Part-time Employment (23.8%), Cost
of the Doctorate (19.0%), Other Financial Options (19.0%), and Financial Aid (17.5%)
were believed to be pertinent factors influencing dissertation progress.
Research Question 5: What are the perceived employment factors that may have
influenced or affected the progress of current, previous, and graduated students?
The perceived employment factors that may have influenced or affected the
progress of current, previous, and graduated students reported by at least 50% of
respondents were: Employer Supportiveness (96.8%), Employment (84.1%), and
Demands of the Job (55.6%)
Additionally, Work-Related Travel (23.8%) was believed to be a pertinent factor
influencing dissertation progress.
Summary of Survey Returns
Table 2 summarizes the survey response rate from the study sample consisting of
101 participants. Questionnaires were sent to 23 current ABD, 10 previously attrited
ABD students, and 68 past graduates from the Higher Education Doctoral Program from
1991 through July 2000. Of the 101 survey instruments distributed, 53 were returned on
the first mailing. From this number, 8 surveys were returned with incorrect addresses; 2
of these included forwarding addresses from the U.S. Postal Service; 45 participants
57
returned the questionnaires completed, and the remaining 48 did not respond. Ten days
following the initial mailing of surveys, a second distribution was conducted to the
previous 48 nonrespondents, and 2 returned packages. As in the first mailing, this
included (a) follow-up Letter of Purpose (Appendix D), (b) Questionnaire, (c) Research
Consent Form, and (d) a preaddressed stamped return envelope. From this second
mailing, 11 participants returned questionnaires completed, 2 surveys were returned with
incorrect addresses, and the remaining 37 did not respond. A third and final request for
participation was sent to the second group of 37 nonrespondents. This final request
produced an additional 7 completed surveys. The three mailings to 101 potential
participants produced the following results: 63 returned and completed surveys; 8 postal-
returned surveys with no forwarding address; and 30 unreturned surveys from those
choosing not to participate in this project. Therefore, the sample group for data collection
was 63 (15 current ABDs, 4 previously attrited ABDs, and 44 graduated Ed.D.’s), or 67.8
% of the original 101 potential participants. In summary, Table 2 depicts data on the
population sample, returned surveys with incorrect addresses, adjusted samples,
respondents, nonrespondents, and response rates based on total and adjusted samples.
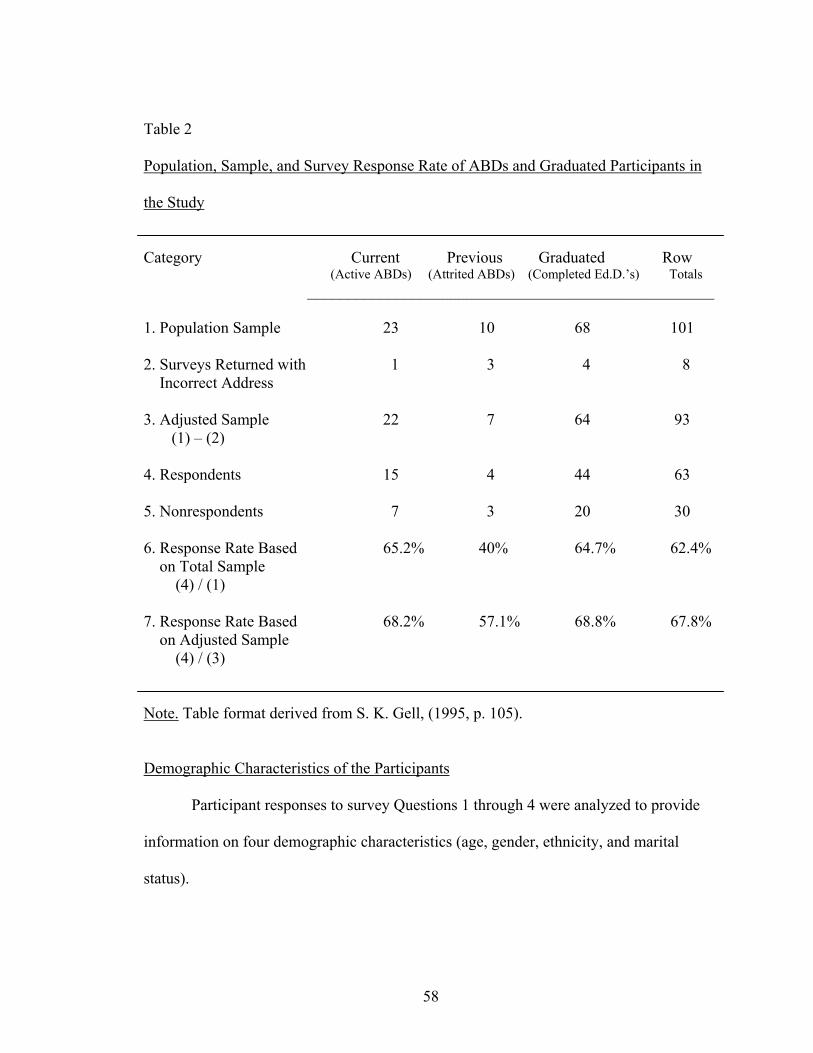
58
Table 2
Population, Sample, and Survey Response Rate of ABDs and Graduated Participants in
the Study
Category Current Previous Graduated Row
(Active ABDs) (Attrited ABDs) (Completed Ed.D.’s) Totals ___________________________________________________
1. Population Sample 23 10 68 101
2. Surveys Returned with 1 3 4 8 Incorrect Address
3. Adjusted Sample 22 7 64 93 (1) – (2)
4. Respondents 15 4 44 63
5. Nonrespondents 7 3 20 30
6. Response Rate Based 65.2% 40% 64.7% 62.4% on Total Sample (4) / (1)
7. Response Rate Based 68.2% 57.1% 68.8% 67.8% on Adjusted Sample (4) / (3)
Note. Table format derived from S. K. Gell, (1995, p. 105).
Demographic Characteristics of the Participants
Participant responses to survey Questions 1 through 4 were analyzed to provide
information on four demographic characteristics (age, gender, ethnicity, and marital
status).
59
Survey Questions 1 and 2. Survey responses to Question 1, as shown in Table 3,
revealed that the age for students entering the dissertation portion of the higher education
program ranged from less than 30 to over 60. The largest group, 57.1% (n=36) was found
within the 40-49 age category. This group was followed by the 30-39 age category,
20.6% (n=13); the 50-59 age group, 12.7% (n=8); the 21-29 age group, 6.3% (n=4); and
lastly by the 60+ age group, 3.2% (n=2). Therefore, 77.7% (n=49) of the responding
participants surveyed were encompassed the 30-49 age-group categories.
Table 4 shows the numbers of male and female respondents. The data revealed
that the majority of responding students (63.5%, n=40) were female, and 75% (n=30) of
these were graduated Ed.D.’s. Male participants encompassed 36.5% (n=23) of the
sample, and 60.9% were also categorized as graduates. In compiling the frequency count
of males and females within each of the “age” categories, the data revealed that 80%
(n=32) of the 40 female students and 82.6% (n=19) of the 23 male students were in the
30-49 age-group category.

60
Table 3
Question 1: What Was Your Age When Starting the Dissertation Portion of Your
Doctoral Program?
Age Current Previous Graduated Row
(Active ABDs) (Attrited ABDs) (Completed Ed.D.’s) Totals n (%) n (%) n (%) n (%)
___________________________________________________
21-29 0 (0%) 0 (0%) 4 (6.3%) 4 (6.3%)
30-39 7 (11.1%) 0 (0%) 6 (9.5%) 13 (20.6%)
40-49 7 (11.1%) 2 (3.2%) 27 (42.9%) 36 (57.1%)
50-59 1 (1.6%) 2 (3.2%) 5 (7.9%) 8 (12.7%)
60+ 0 (0%) 0 (0%) 2 (3.2%) 2 (3.2%)
Column totals 15 (23.8%) 4 (6.4%) 44 (69.8%) 63 (100%)
Table 4
Question 2: What Is Your Gender?
Gender Current Previous Graduated Row
(Active ABDs) (Attrited ABDs) (Completed Ed.D.s) Totals n (%) n (%) n (%) n (%)
___________________________________________________
Male 7 (11.1%) 2 (3.2%) 14 (22.2%) 23 (36.5%)
Female 8 (12.7%) 2 (3.2%) 30 (47.6%) 40 (63.5%)
Column totals 15 (23.8%) 4 (6.4%) 44 (69.8%) 63 (100%)

61
Survey Question 3. Table 5 shows the range of responses to ethnicity. The
overwhelming majority of survey respondents were Caucasian, 93.6% (n=59). Hispanic,
3.2% (n=2), Asian, 1.6% (n=1), and Native American, 1.6% (n=1) participants followed
this category with minimal representation. There were no African American respondents.
The actual frequency of males and females within these ethnic categories was 35 female
and 24 male Caucasians; 2 female Hispanics; 1 female Asian; and 1 female Native
American.
Table 5 also shows that the largest representation (65.1%, n=41) from the
Caucasian category were “Graduated” students.
Table 5
Question 3: What Is Your Ethnic Background?
Ethnicity Current Previous Graduated Row
(Active ABDs) (Attrited ABDs) (Completed Ed.D.’s) Totals n (%) n (%) n (%) n (%)
___________________________________________________
African American 0 (0%) 0 (0%) 0 (0%) 0 (0%)
Asian 0 (0%) 0 (0%) 1 (1.6%) 1 (1.6%)
Hispanic 1 (1.6%) 0 (0%) 1 (1.6%) 2 (3.2%)
Native American 0 (0%) 0 (0%) 1 (1.6%) 1 (1.6%)
Caucasian 14 (22.2%) 4 (6.3%) 41 (65.1%) 59 (93.6%)
Other 0 (0%) 0 (0%) 0 (0%) 0 (0%)
Column totals 15 (23.8%) 4 (6.4%) 44 (69.8%) 63 (100%)

62
Survey Question 4. As shown in Table 6, married participants encompassed the
largest representation, with 69.8% (n=44). This majority representation was followed by
the remaining 30.2% of those classifying themselves as “divorced” (14.3%, n=9); “single,
never married” (7.9%, n=5); and “separated” (4.8%, n=3) or “widowed” (3.2%, n=2).
Table 6
Question 4: How Would You Describe Your Marital Status During the Dissertation
Portion of Your Doctoral Program?
Marital status Current Previous Graduated Row
(Active ABDs) (Attrited ABDs) (Completed Ed.D.’s) Totals n (%) n (%) n (%) n (%)
___________________________________________________
Single, never married 2 (3.2%) 0 (0%) 3 (4.8%) 5 (7.9%)
Married 11 (17.5%) 2 (3.2%) 31 (49.2%) 44 (69.8%)
Separated 0 (0%) 1 (1.6%) 2 (3.2%) 3 (4.8%)
Divorced 2 (3.2%) 1 (1.6%) 6 (9.5%) 9 (14.3%)
Widowed 0 (0%) 0 (0%) 2 (3.2%) 2 (3.2%)
Column totals 15 (23.8%) 4 (6.4%) 44 (69.8%) 63 (100%)
Doctoral Program Factors
This section addresses survey responses applicable to Research Question 1: What
are the perceived doctoral program factors that may have influenced or affected the
progress of current, previous, and graduated students?
Survey Question 5. As shown in Table 7, the largest cluster of respondents, 44.4%
(n=28), “seldom” participated in institutional and student activities during the dissertation

63
portion of their program. The next largest group, 30.2% (n=19) of those surveyed “never”
stayed involved in the institution. These two groups encompassed 74.6% (n=47) of
respondents.
Only 14.3% (n=8) of those surveyed “often” participated in institutional and
student activities during their dissertation portion of the program. The same results
(14.3%, n=8) were found by those who were “sometimes” involved in activities. Table 7
also illustrates that none of those surveyed were “always” involved with institutional and
student activities.
Participants were asked to elaborate on their ratings of institutional involvement;
many respondents provided more insight as to their low participation. Some specific
examples from these responses are as follows:
A full-time teaching position and family were more of a priority. I was able to attend some higher education functions, but distance/full-time work prevented involvement. If you mean during my studies, you need to know that I also worked full-time and was raising two children. I commuted 180 miles one-way to campus once a week for seven years and didn’t have time. Due to working full-time, I didn’t have much time to get involved. Moved from the area 5 years before completing program. Several of those who were able to participate in university activities provided a
clearer understanding of why they differed from the majority who did not.
I worked full-time at the university, so I could participate in research discussions; I think we had a graduate student group, too.
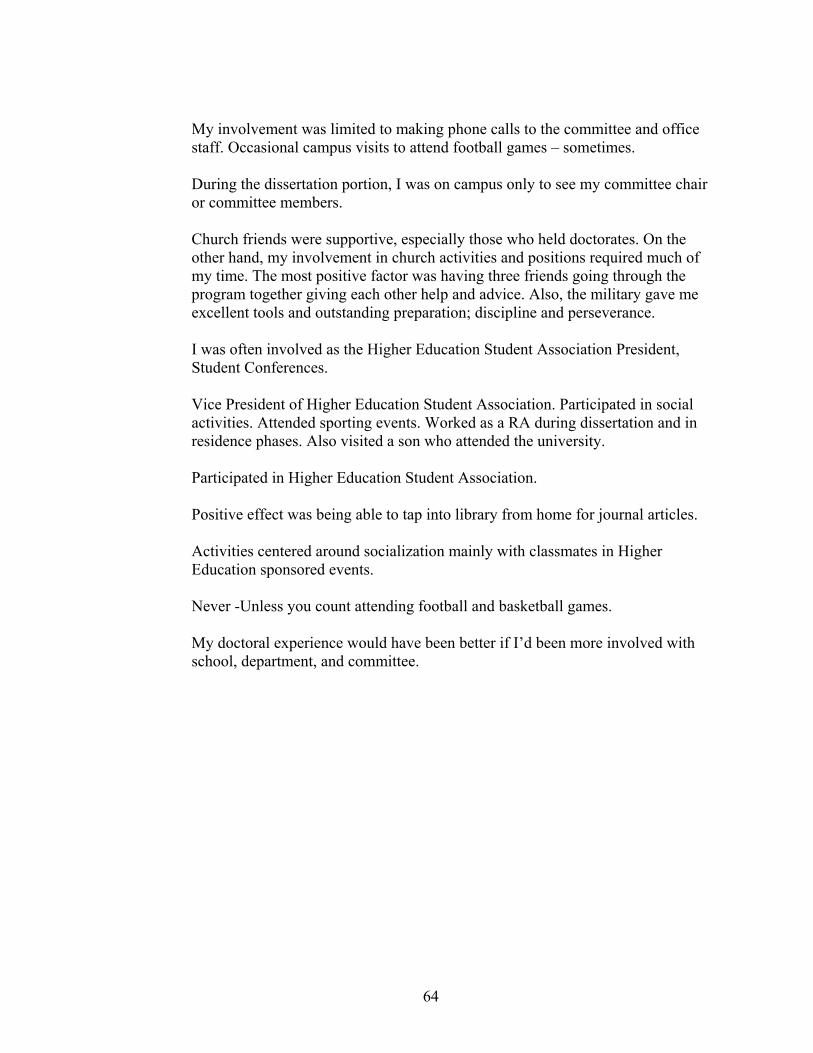
64
My involvement was limited to making phone calls to the committee and office staff. Occasional campus visits to attend football games – sometimes. During the dissertation portion, I was on campus only to see my committee chair or committee members. Church friends were supportive, especially those who held doctorates. On the other hand, my involvement in church activities and positions required much of my time. The most positive factor was having three friends going through the program together giving each other help and advice. Also, the military gave me excellent tools and outstanding preparation; discipline and perseverance. I was often involved as the Higher Education Student Association President, Student Conferences. Vice President of Higher Education Student Association. Participated in social activities. Attended sporting events. Worked as a RA during dissertation and in residence phases. Also visited a son who attended the university. Participated in Higher Education Student Association. Positive effect was being able to tap into library from home for journal articles. Activities centered around socialization mainly with classmates in Higher Education sponsored events. Never -Unless you count attending football and basketball games. My doctoral experience would have been better if I’d been more involved with school, department, and committee.
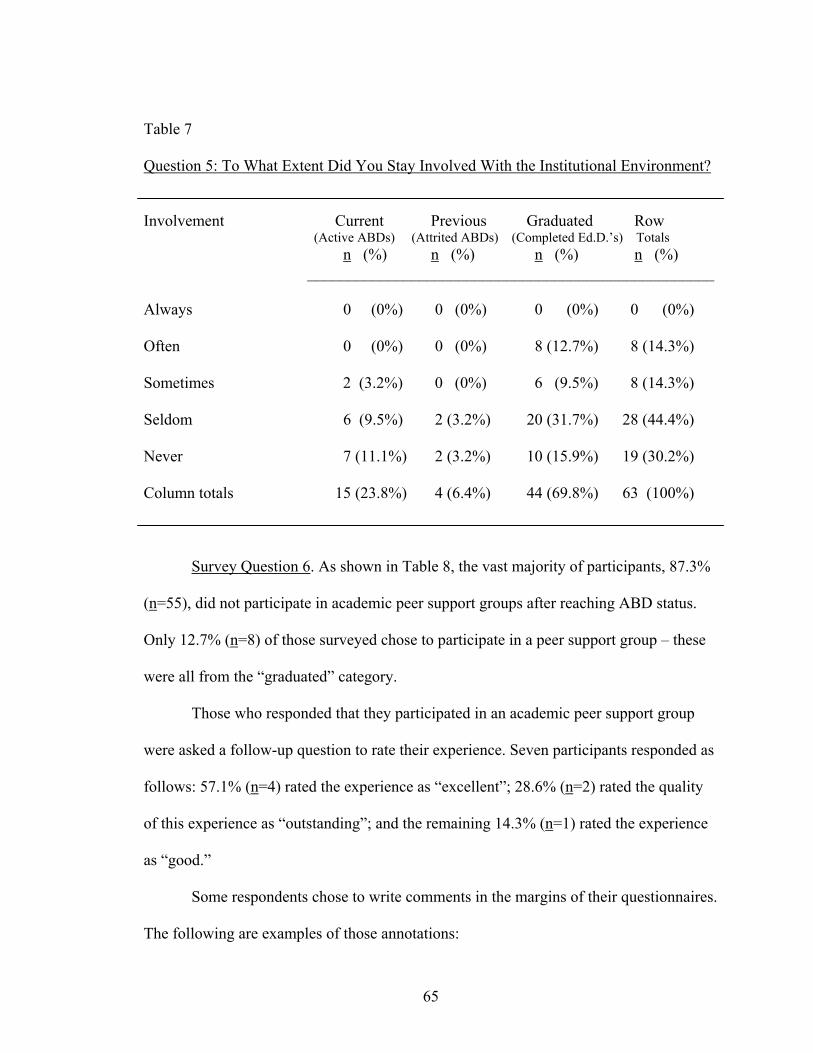
65
Table 7
Question 5: To What Extent Did You Stay Involved With the Institutional Environment?
Involvement Current Previous Graduated Row
(Active ABDs) (Attrited ABDs) (Completed Ed.D.’s) Totals n (%) n (%) n (%) n (%)
___________________________________________________
Always 0 (0%) 0 (0%) 0 (0%) 0 (0%)
Often 0 (0%) 0 (0%) 8 (12.7%) 8 (14.3%)
Sometimes 2 (3.2%) 0 (0%) 6 (9.5%) 8 (14.3%)
Seldom 6 (9.5%) 2 (3.2%) 20 (31.7%) 28 (44.4%)
Never 7 (11.1%) 2 (3.2%) 10 (15.9%) 19 (30.2%)
Column totals 15 (23.8%) 4 (6.4%) 44 (69.8%) 63 (100%)
Survey Question 6. As shown in Table 8, the vast majority of participants, 87.3%
(n=55), did not participate in academic peer support groups after reaching ABD status.
Only 12.7% (n=8) of those surveyed chose to participate in a peer support group – these
were all from the “graduated” category.
Those who responded that they participated in an academic peer support group
were asked a follow-up question to rate their experience. Seven participants responded as
follows: 57.1% (n=4) rated the experience as “excellent”; 28.6% (n=2) rated the quality
of this experience as “outstanding”; and the remaining 14.3% (n=1) rated the experience
as “good.”
Some respondents chose to write comments in the margins of their questionnaires.
The following are examples of those annotations:

66
Yes, this was a formal group, but four of us came from Abilene every week for classes for about three years. Yes, I was in a special (formal) dissertation class with peers. I didn’t know one existed - I didn’t know about it.
Other survey participants provided comments on this topic through their
responses to Question 19, seeking recommendations for improvement. Some specific
examples are as follows:
Doctoral work is so lonely. I’d like to have been in some kind of support group for fellow commuters like myself. The solitary nature of writing this dissertation will make this a terminal degree for me. This is my fourth and last. A support group might have helped. We had study groups and the Higher Education Student Organization.
Table 8
Question 6: Did You Participate In An Academic Peer Support Group After Completing
the Qualifying Exams?
Response Current Previous Graduated Row
(Active ABDs) (Attrited ABDs) (Completed Ed.D.’s) Totals n (%) n (%) n (%) n (%)
___________________________________________________
Yes 0 (0%) 0 (0%) 8 (12.7%) 8 (12.7%)
No 15 (23.8%) 4 (6.4%) 36 (57.1%) 55 (87.3%)
Column totals 15 (23.8%) 4 (6.4%) 44 (69.8%) 63 (100%)
Survey Question 7. The Higher Education Research Seminar (EDHE 6310) is a
requirement for all participants in the doctoral program. However, this was not always

67
the case. Prior to the Spring 1998 term, students were required to meet their research
requirement through the Independent Research Course (EDHE 7000). This course was
structured to allow them time to develop their dissertation proposals or work on their
research projects. From 1992 through 1997, students were able to become more familiar
with acceptable qualitative and quantitative research designs used in higher education
through the newly developed Higher Education Research Seminar (EDHE 6310).
Therefore, from 1991 through 1997, doctoral students could take either EDHE 6310 or
EDHE 7000 to meet their research requirement. Eight of the 63 survey participants, or
12.7%, fell into this category and responded to Question 7 as “N/A” (not applicable).
This was because it was not a requirement or not available during their course work
portion of their program. In Spring 1998, the Higher Education Research Seminar (EDHE
6310) was completely revised and included a “series of seminars dedicated to the
development of student research proposals. . . . The seminars bridge the gap between
theory and practice” (Texas Tech University, 2000, p. 104).
Table 9 shows that almost half of the respondents, 49.2% (n=31), found EDHE
6310 to be beneficial to increasing their abilities to conduct independent research. Those
who were “unsure” of these benefits comprised 28.6% (n=18) of the responses. Only
9.5%, or 10 participants, felt that the coursework did not increase their research abilities.
One of these respondents offered the following comment: “I took this course twice and
had a negative experience both times.”
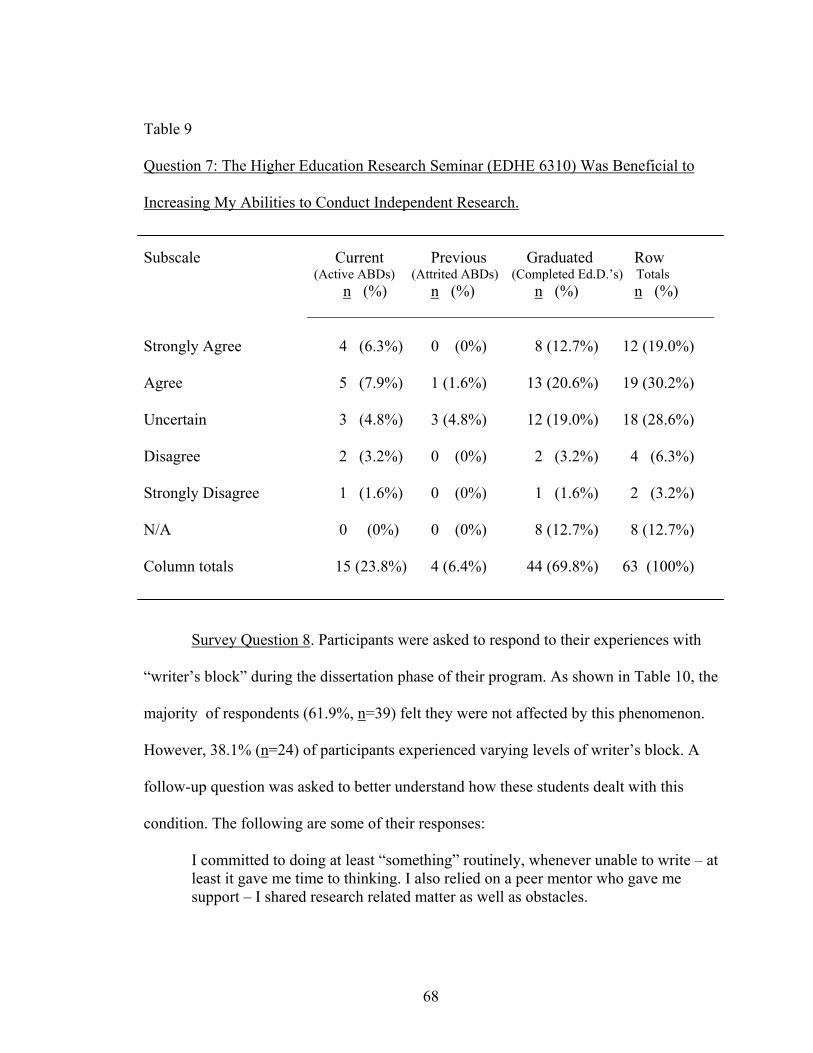
68
Table 9
Question 7: The Higher Education Research Seminar (EDHE 6310) Was Beneficial to
Increasing My Abilities to Conduct Independent Research.
Subscale Current Previous Graduated Row
(Active ABDs) (Attrited ABDs) (Completed Ed.D.’s) Totals n (%) n (%) n (%) n (%)
___________________________________________________
Strongly Agree 4 (6.3%) 0 (0%) 8 (12.7%) 12 (19.0%)
Agree 5 (7.9%) 1 (1.6%) 13 (20.6%) 19 (30.2%)
Uncertain 3 (4.8%) 3 (4.8%) 12 (19.0%) 18 (28.6%)
Disagree 2 (3.2%) 0 (0%) 2 (3.2%) 4 (6.3%)
Strongly Disagree 1 (1.6%) 0 (0%) 1 (1.6%) 2 (3.2%)
N/A 0 (0%) 0 (0%) 8 (12.7%) 8 (12.7%)
Column totals 15 (23.8%) 4 (6.4%) 44 (69.8%) 63 (100%)
Survey Question 8. Participants were asked to respond to their experiences with
“writer’s block” during the dissertation phase of their program. As shown in Table 10, the
majority of respondents (61.9%, n=39) felt they were not affected by this phenomenon.
However, 38.1% (n=24) of participants experienced varying levels of writer’s block. A
follow-up question was asked to better understand how these students dealt with this
condition. The following are some of their responses:
I committed to doing at least “something” routinely, whenever unable to write – at least it gave me time to thinking. I also relied on a peer mentor who gave me support – I shared research related matter as well as obstacles.
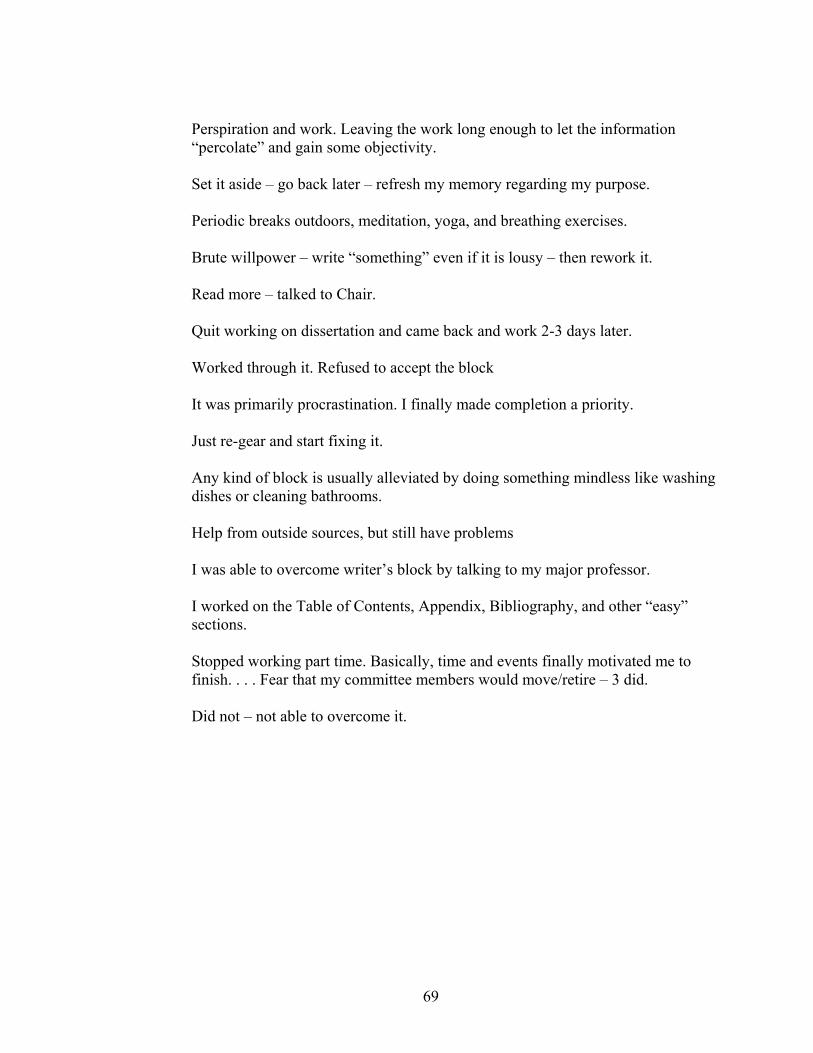
69
Perspiration and work. Leaving the work long enough to let the information “percolate” and gain some objectivity. Set it aside – go back later – refresh my memory regarding my purpose. Periodic breaks outdoors, meditation, yoga, and breathing exercises. Brute willpower – write “something” even if it is lousy – then rework it. Read more – talked to Chair. Quit working on dissertation and came back and work 2-3 days later. Worked through it. Refused to accept the block It was primarily procrastination. I finally made completion a priority. Just re-gear and start fixing it. Any kind of block is usually alleviated by doing something mindless like washing dishes or cleaning bathrooms. Help from outside sources, but still have problems I was able to overcome writer’s block by talking to my major professor. I worked on the Table of Contents, Appendix, Bibliography, and other “easy” sections. Stopped working part time. Basically, time and events finally motivated me to finish. . . . Fear that my committee members would move/retire – 3 did. Did not – not able to overcome it.

70
Table 10
Question 8: Did You Experience “Writer’s Block” While Formulating or Writing Any
Portion of the Dissertation?
Response Current Previous Graduated Row
(Active ABDs) (Attrited ABDs) (Completed Ed.D.’s) Totals n (%) n (%) n (%) n (%)
___________________________________________________
Yes 8 (12.7%) 2 (3.2%) 14 (22.2%) 24 (38.1%)
No 7 (11.1%) 2 (3.2%) 30 (47.6%) 39 (61.9%)
Column totals 15 (23.8%) 4 (6.4%) 44 (69.8%) 63 (100%)
Survey Question 9. This question contained a total of 26 factors influencing
degree progress. Eight of these factors pertain to the doctoral program structure, content,
and support. Table 11 depicts participants’ responses to each of these factors.
As shown in Table 11, subsection (l) Involvement within the University, the
overwhelming majority of respondents, 69.8% (n=44), believed that university
involvement was not a factor in their progress; 28.6% (n=18) of those surveyed
respondents felt their involvement was positive; and only 1.6% (n=1) of respondents
classified their involvement as negative.
Subsection (r) of Table 11 shows that 41.3% (n=26) of respondents believed that
Program Requirements were not applicable to their progress; 39.7% (n=25) felt that it
was a positive factor; and 19% (n=12) felt that this was a negative factor influencing their
degree progress. Question 19 and 20 provided the opportunity for participants to respond
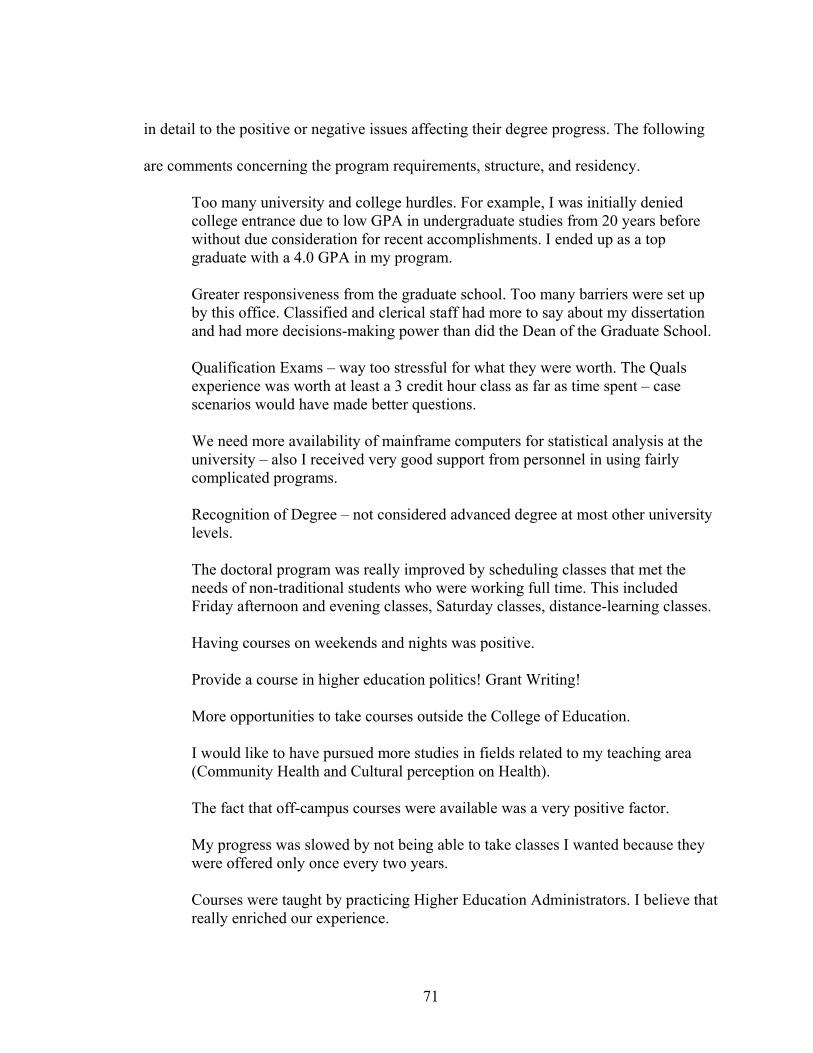
71
in detail to the positive or negative issues affecting their degree progress. The following
are comments concerning the program requirements, structure, and residency.
Too many university and college hurdles. For example, I was initially denied college entrance due to low GPA in undergraduate studies from 20 years before without due consideration for recent accomplishments. I ended up as a top graduate with a 4.0 GPA in my program.
Greater responsiveness from the graduate school. Too many barriers were set up by this office. Classified and clerical staff had more to say about my dissertation and had more decisions-making power than did the Dean of the Graduate School. Qualification Exams – way too stressful for what they were worth. The Quals experience was worth at least a 3 credit hour class as far as time spent – case scenarios would have made better questions. We need more availability of mainframe computers for statistical analysis at the university – also I received very good support from personnel in using fairly complicated programs. Recognition of Degree – not considered advanced degree at most other university levels. The doctoral program was really improved by scheduling classes that met the needs of non-traditional students who were working full time. This included Friday afternoon and evening classes, Saturday classes, distance-learning classes. Having courses on weekends and nights was positive. Provide a course in higher education politics! Grant Writing!
More opportunities to take courses outside the College of Education. I would like to have pursued more studies in fields related to my teaching area (Community Health and Cultural perception on Health). The fact that off-campus courses were available was a very positive factor.
My progress was slowed by not being able to take classes I wanted because they were offered only once every two years. Courses were taught by practicing Higher Education Administrators. I believe that really enriched our experience.

72
Change in program – I took way too long due to raising children, job, family. Program has been supportive of my delays.
Please - No residency requirements. I had a wonderful experience. I suppose the most problematic part was the residency requirement. I felt it was an “artificial” requirement. I live and work on a campus as a HE Administrator. Living at the university seemed unnecessary for me. I hope that requirement has been removed.
It might have been nice to have a full-time academic experience of residency during the program, but it certainly did not prove necessary. The only suggestion I have is to (and the problem is probably solved by now) be sure to tell graduate students the truth about distance education classes counting/not counting for residency. Subsection (t) of Table 11 indicates that Research Skills were found to be a
positive influence to 79.4% (n=50) of respondents; 12.7% (n=8) believed this was not
applicable; and the remaining 7.9% (n=5) found it to be a negative influence to their
progress.
Table 11, subsection (v) Support Groups (outside academia), reflects that the
majority (61.9%, n=39) of those surveyed believed that this was not a factor in their
degree progress; 36.5% (n=23) found this to be a positive influence; and a mere 1.6%
(n=1) found it to be a negative influence.
Subsection (w) of Table 11 shows that a large majority (77.8%, n=49) of
respondents believed that Support Groups (in academia) were not a factor in their
progress; 19% (n=12) reported this as a positive influence; and the remaining 3.2% (n=2)
found it to be a negative influence. One survey respondent offered the following:
One of the most positive parts of the experience was the networking in class (and out) with other professionals who were students. That informal support was great. Also, my colleague with whom I traveled back and forth 4 hours per week for six classroom years and less frequently during two dissertation years made all the
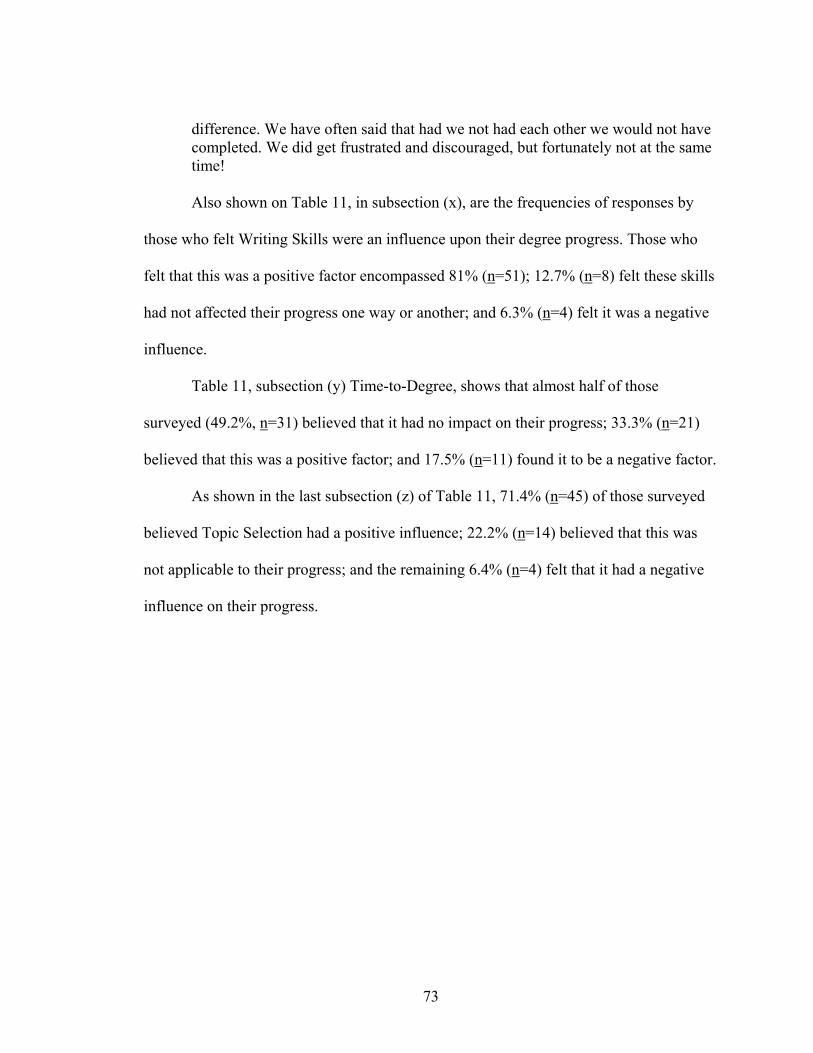
73
difference. We have often said that had we not had each other we would not have completed. We did get frustrated and discouraged, but fortunately not at the same time! Also shown on Table 11, in subsection (x), are the frequencies of responses by
those who felt Writing Skills were an influence upon their degree progress. Those who
felt that this was a positive factor encompassed 81% (n=51); 12.7% (n=8) felt these skills
had not affected their progress one way or another; and 6.3% (n=4) felt it was a negative
influence.
Table 11, subsection (y) Time-to-Degree, shows that almost half of those
surveyed (49.2%, n=31) believed that it had no impact on their progress; 33.3% (n=21)
believed that this was a positive factor; and 17.5% (n=11) found it to be a negative factor.
As shown in the last subsection (z) of Table 11, 71.4% (n=45) of those surveyed
believed Topic Selection had a positive influence; 22.2% (n=14) believed that this was
not applicable to their progress; and the remaining 6.4% (n=4) felt that it had a negative
influence on their progress.

74
Table 11
Program Factors Influencing Degree Progress
(l) Involvement within Current Previous Graduated Row the University (Active ABDs) (Attrited ABDs) (Completed Ed.D.’s) Totals
n (%) n (%) n (%) n (%) ___________________________________________________
Positively 2 (3.2%) 0 (0%) 16 (25.4%) 18 (28.6%)
Negatively 0 (0%) 1 (1.6%) 0 (0%) 1 (1.6%)
N/A 13 (20.6%) 3 (4.8%) 28 (44.4%) 44 (69.8%)
Column totals 15 (23.8%) 4 (6.4%) 44 (69.8%) 63 (100%)
(r) Program Requirements
Positively 3 (4.8%) 0 (0%) 22 (34.9%) 25 (39.7%)
Negatively 8 (12.7%) 1 (1.6%) 3 (4.8%) 12 (19.0%)
N/A 4 (6.3%) 3 (4.8%) 19 (30.2%) 26 (41.3%)
Column totals 15 (23.8%) 4 (6.4%) 44 (69.8%) 63 (100%)
(t) Research Skills Positively 11 (17.5%) 2 (3.2%) 37 (58.7%) 50 (79.4%)
Negatively 1 (1.6%) 1 (1.6%) 3 (4.8%) 5 (7.9%)
N/A 3 (4.8%) 1 (1.6%) 4 (6.3%) 8 (12.7%)
Column totals 15 (23.8%) 4 (6.4%) 44 (69.8%) 63 (100%)
(table continues)

75
(v) Support Groups Current Previous Graduated Row (outside academia) (Active ABDs) (Attrited ABDs) (Completed Ed.D.’s) Totals
n (%) n (%) n (%) n (%) ___________________________________________________ Positively 5 (7.9%) 0 (0%) 18 (28.6%) 23 (36.5%)
Negatively 0 (0%) 1 (1.6%) 0 (0%) 1 (1.6%)
N/A 10 (15.9%) 3 (4.8%) 26 (41.2%) 39 (61.9%)
Column totals 15 (23.8%) 4 (6.4%) 44 (69.8%) 63 (100%)
(w) Support Groups (in academia) Positively 0 (0%) 0 (0%) 12 (19.0%) 12 (19.0%)
Negatively 0 (0%) 1 (1.6%) 1 (1.6%) 2 (3.2%)
N/A 15 (23.8%) 3 (4.8%) 31 (49.2%) 49 (77.8%)
Column totals 15 (23.8%) 4 (6.4%) 44 (69.8%) 63 (100%)
(x) Writing Skills
Positively 11 (17.4%) 3 (4.8%) 37 (58.7%) 51 (81.0%)
Negatively 2 (3.2%) 0 (0%) 2 (3.2%) 4 (6.3%)
N/A 2 (3.2%) 1 (1.6%) 5 (7.9%) 8 (12.7%)
Column totals 15 (23.8%) 4 (6.4%) 44 (69.8%) 63 (100%)
(table continues)
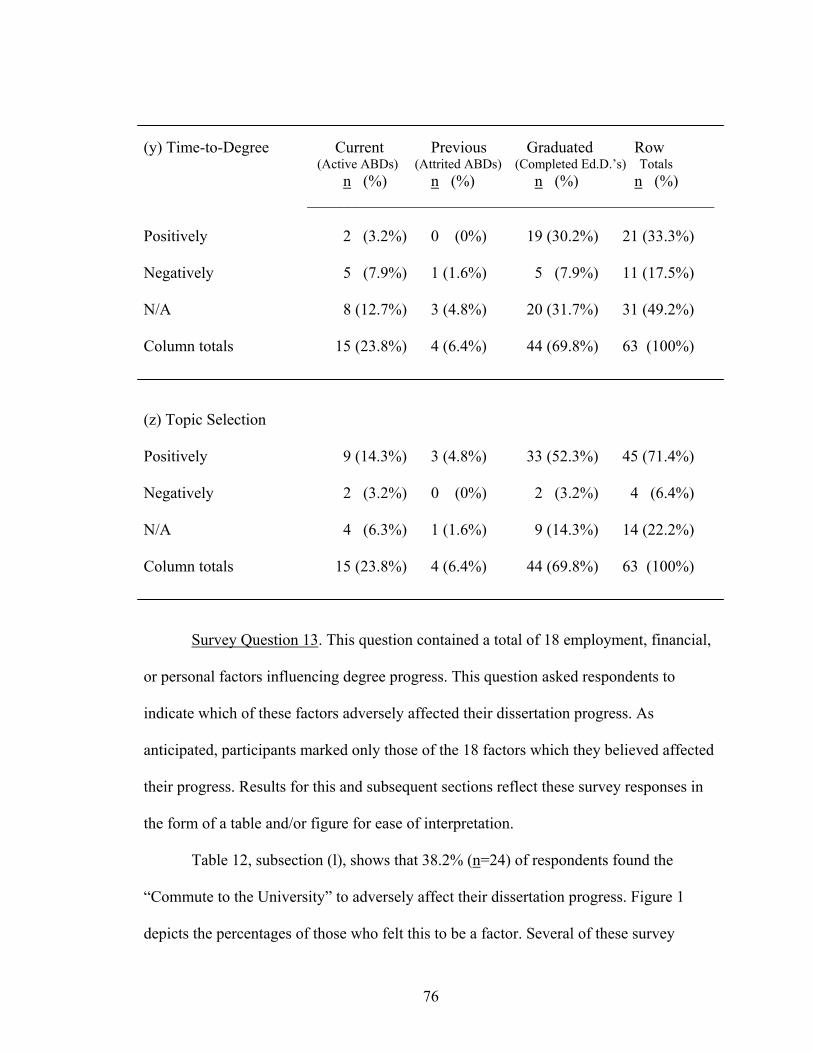
76
(y) Time-to-Degree Current Previous Graduated Row (Active ABDs) (Attrited ABDs) (Completed Ed.D.’s) Totals
n (%) n (%) n (%) n (%) ___________________________________________________
Positively 2 (3.2%) 0 (0%) 19 (30.2%) 21 (33.3%)
Negatively 5 (7.9%) 1 (1.6%) 5 (7.9%) 11 (17.5%)
N/A 8 (12.7%) 3 (4.8%) 20 (31.7%) 31 (49.2%)
Column totals 15 (23.8%) 4 (6.4%) 44 (69.8%) 63 (100%)
(z) Topic Selection
Positively 9 (14.3%) 3 (4.8%) 33 (52.3%) 45 (71.4%)
Negatively 2 (3.2%) 0 (0%) 2 (3.2%) 4 (6.4%)
N/A 4 (6.3%) 1 (1.6%) 9 (14.3%) 14 (22.2%)
Column totals 15 (23.8%) 4 (6.4%) 44 (69.8%) 63 (100%)
Survey Question 13. This question contained a total of 18 employment, financial,
or personal factors influencing degree progress. This question asked respondents to
indicate which of these factors adversely affected their dissertation progress. As
anticipated, participants marked only those of the 18 factors which they believed affected
their progress. Results for this and subsequent sections reflect these survey responses in
the form of a table and/or figure for ease of interpretation.
Table 12, subsection (l), shows that 38.2% (n=24) of respondents found the
“Commute to the University” to adversely affect their dissertation progress. Figure 1
depicts the percentages of those who felt this to be a factor. Several of these survey

77
participants provided comments on this topic through their responses to Question 19,
seeking recommendations for improvement.
I live two hours away from the university; I’m single with two children. I did not have the luxury of being involved in activities. My daily commute each summer to campus was over 200 miles – this made for long days and limited time to complete reading assignments. I would have enjoyed having on-line courses so that I wouldn’t have had to commute. I live two hours from campus. Four hour commutes several times a week, plus family, a full and part time teaching positions left me no time for institutional environment. I lived 150 miles away from campus in another state. I lived 2 hours away from the university. I moved from the university to Oregon just after passing the Qualification Exam and completion of all course work. I was not employed in Oregon – I focused solely on gathering data and writing chapters 1-3, then I moved to Albuquerque. I would commute to the university in order to work with my chair on the stats and last two chapters. I was not working full-time during this stage of my studies.
Table 12
Program Factors Affecting Dissertation Progress
Current Previous Graduated Row
(Active ABDs) (Attrited ABDs) (Completed Ed.D.’s) Totals n (%) n (%) n (%) n (%)
___________________________________________________
(l) Commute to University 3 (4.8%) 2 (3.2%) 19 (30.2%) 24 (38.2%)

78
Commute to the University
0.00%5.00%10.00%15.00%20.00%25.00%30.00%35.00%
Current Previous Graduated
Figure 1. Respondents adversely affected by commute to the university.
Committee Advisement Factors
This section addresses survey responses applicable to Research Question 2: What
are the perceived committee advisement factors that may have influenced or affected the
progress of current, previous, and graduated students?
Survey Question 9. As previously described, Question 9 contained a total of 26
factors influencing degree progress. Table 13 depicts participants’ responses to each of
the three factors pertaining to the committee and academic advisement issues.
As shown in Table 13, subsection (a), 65% (n=41) of those surveyed found that
Academic Advisement had a positive influence on their degree progress, and 30.2%
(n=19) felt that academic advisement did not influence their progress either in a positive
or negative manner. Only 4.8% (n=3) of respondents found this factor to be a negative
influence on their progress. In a follow-up question, survey participants were asked to
elaborate on how the employment, financial, or personal factors impeded their progress.
The following comments were received:

79
Since I was a full-time student with accommodations on campus, I avoided most of these pitfalls. It was 144 miles from work to campus (one way). It took 7 years for me to finish, not bad for working full-time (9 months some years – 12 months others). Two hour commute one way – By the time I reached campus, I was not on my best. Committee Chair reliable and available by phone/electronic mail. However, found face-to-face communications much more valuable. Committee and university an inconvenience – however believe did not adversely affect dissertation progress. Time consuming to drive and meet residency requirements. I drove 150 miles (one way) twice a week for 3 years.
Additionally, survey participants could elaborate on specific academic advisement
factors in their responses to Questions 19 and 20. Some pertinent examples are as
follows:
I wish we would have had better communications regarding expectations they had of me. Majority of time they were very supportive and helpful. The university changed the committee requirement from five to three members. This was very helpful. To have a graduate assistantship at the beginning of my program rather than offered to me at the last semester of my program. Being older means it takes longer. Working full time is most difficult and health problems add to the stress – I suspect this is not unusual for doctoral students returning to academia after some years. I didn’t experience any major factors that affected my degree progress. What has been a negative outcome is that I’m still unable to find a professional full time position that I’d hope the degree would have helped. Table 13, subsection (b), shows that 50.8% (n=32) believed that Academic
Mentoring was not a factor in their progress; 41.3% (n=26) felt that it was a positive
influence; and the remaining 7.9% (n=5) rated the experience as a negative influence.

80
Survey participants could elaborate on specific academic mentoring factors in their
responses to Questions 19 and 20. Some pertinent examples are as follows:
More effort by faculty to be mentors. More emphasis needed on a “theme” leading towards the dissertation – so all of the portfolio of work culminates in the dissertation as opposed to a bunch of individual assignments. The department and Graduate school were very good to me. I also owe a great debt to my dissertation chair – mentor. As displayed in Table 13, subsection (e), the majority of respondents, 68.3%
(n=43), described the relationship with their Committee (other than chair) as a positive
influence in their degree progress; 19% (n=12) felt that the committee did not influence
their progress, and only 12.7% (n=8) rated the experience negatively. Many survey
participants chose to provide additional comments on this topic through their responses to
Questions 19 and 20. Some specific examples are as follows:
An effort by a faculty member who tried to side track me at every possible opportunity. If it weren’t for my Chair– I would not have wanted to finish – much less been able to finish. After I finished my defense, my Chair dismissed this faculty member, and my committee passed me despite all of this members efforts to derail me even in the end.
In the five years I have been taking classes, there has been a high retirement rate of the faculty. Most of those I knew are gone.
At the time I went to the university, two of the HE full-time faculty members were not very good. I understand they are gone - I hope they have a better faculty now. I learned foundation and structure of knowledge and Myers-Briggs over and over.
One professor was extremely mean to me, he is no longer with the institution – unfortunately, neither am I.
Not losing 60% of faculty during program.
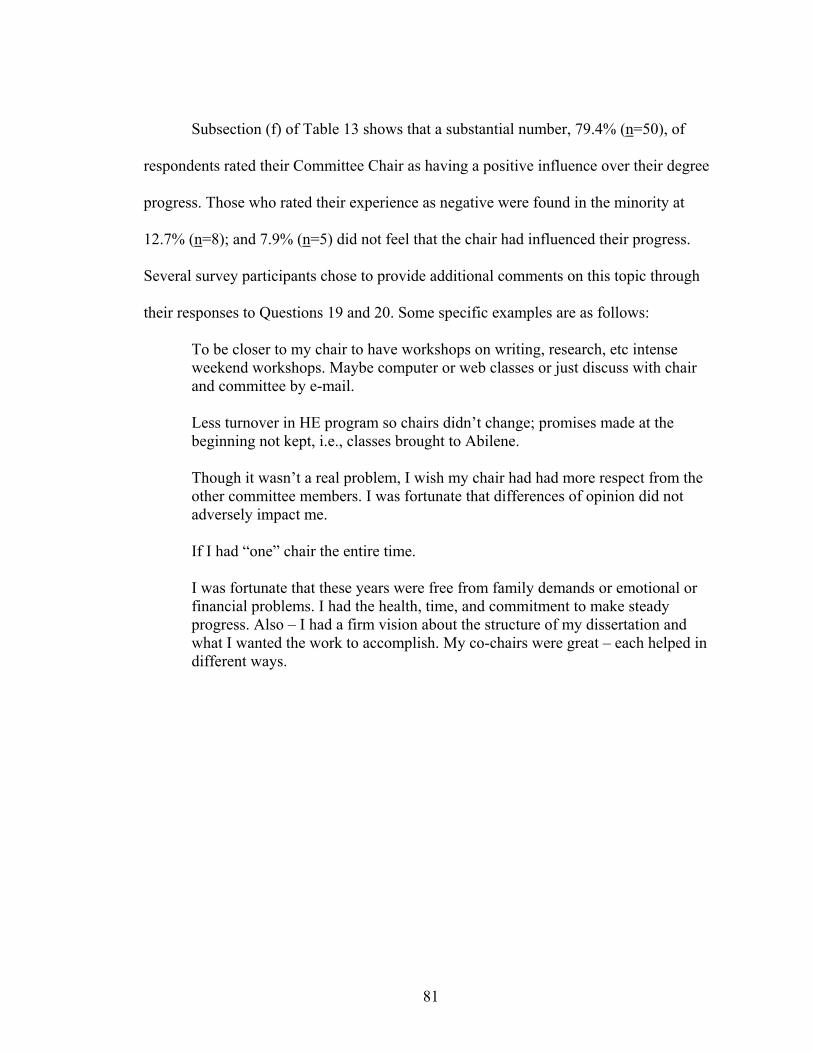
81
Subsection (f) of Table 13 shows that a substantial number, 79.4% (n=50), of
respondents rated their Committee Chair as having a positive influence over their degree
progress. Those who rated their experience as negative were found in the minority at
12.7% (n=8); and 7.9% (n=5) did not feel that the chair had influenced their progress.
Several survey participants chose to provide additional comments on this topic through
their responses to Questions 19 and 20. Some specific examples are as follows:
To be closer to my chair to have workshops on writing, research, etc intense weekend workshops. Maybe computer or web classes or just discuss with chair and committee by e-mail. Less turnover in HE program so chairs didn’t change; promises made at the beginning not kept, i.e., classes brought to Abilene. Though it wasn’t a real problem, I wish my chair had had more respect from the other committee members. I was fortunate that differences of opinion did not adversely impact me. If I had “one” chair the entire time. I was fortunate that these years were free from family demands or emotional or financial problems. I had the health, time, and commitment to make steady progress. Also – I had a firm vision about the structure of my dissertation and what I wanted the work to accomplish. My co-chairs were great – each helped in different ways.
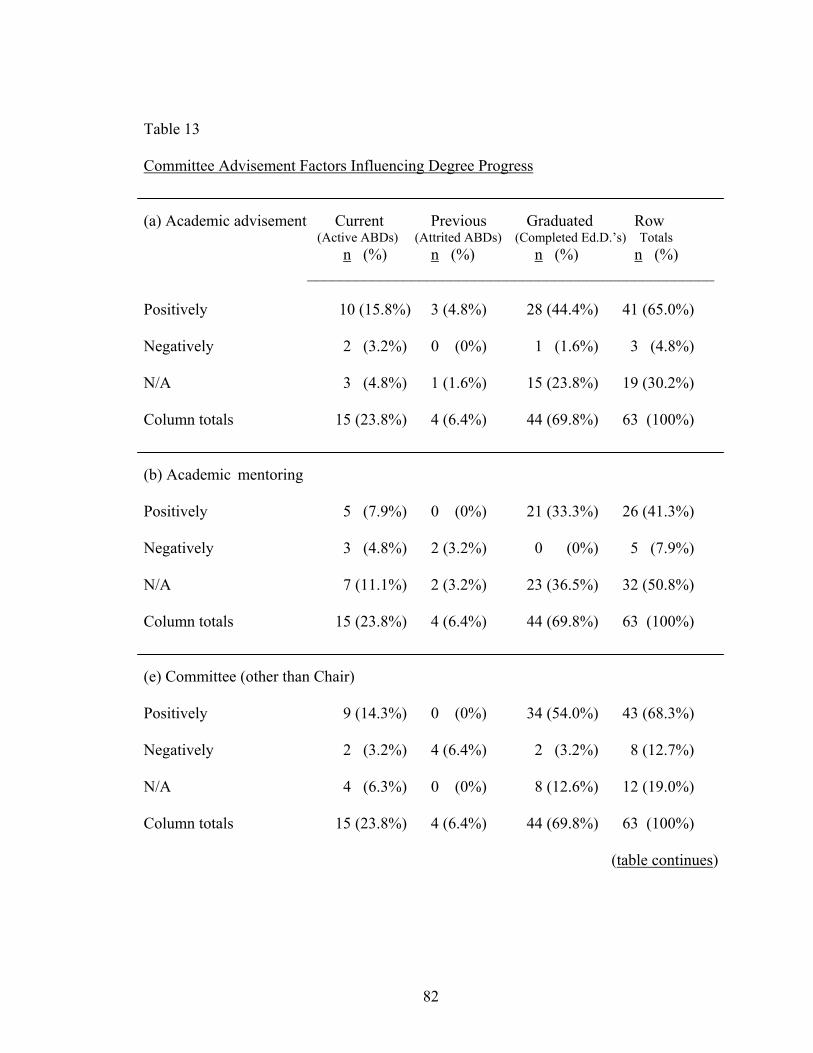
82
Table 13
Committee Advisement Factors Influencing Degree Progress
(a) Academic advisement Current Previous Graduated Row (Active ABDs) (Attrited ABDs) (Completed Ed.D.’s) Totals
n (%) n (%) n (%) n (%) ___________________________________________________
Positively 10 (15.8%) 3 (4.8%) 28 (44.4%) 41 (65.0%)
Negatively 2 (3.2%) 0 (0%) 1 (1.6%) 3 (4.8%)
N/A 3 (4.8%) 1 (1.6%) 15 (23.8%) 19 (30.2%)
Column totals 15 (23.8%) 4 (6.4%) 44 (69.8%) 63 (100%)
(b) Academic mentoring
Positively 5 (7.9%) 0 (0%) 21 (33.3%) 26 (41.3%)
Negatively 3 (4.8%) 2 (3.2%) 0 (0%) 5 (7.9%)
N/A 7 (11.1%) 2 (3.2%) 23 (36.5%) 32 (50.8%)
Column totals 15 (23.8%) 4 (6.4%) 44 (69.8%) 63 (100%)
(e) Committee (other than Chair) Positively 9 (14.3%) 0 (0%) 34 (54.0%) 43 (68.3%)
Negatively 2 (3.2%) 4 (6.4%) 2 (3.2%) 8 (12.7%)
N/A 4 (6.3%) 0 (0%) 8 (12.6%) 12 (19.0%)
Column totals 15 (23.8%) 4 (6.4%) 44 (69.8%) 63 (100%)
(table continues)

83
(f) Committee chair Current Previous Graduated Row (Active ABDs) (Attrited ABDs) (Completed Ed.D.’s) Totals
n (%) n (%) n (%) n (%) ___________________________________________________
Positively 9 (14.3%) 2 (3.2%) 39 (61.9%) 50 (79.4%)
Negatively 3 (4.8%) 2 (3.2%) 3 (4.8%) 8 (12.7%)
N/A 3 (4.8%) 0 (0%) 2 (3.2%) 5 (7.9%)
Column totals 15 (23.8%) 4 (6.4%) 44 (69.8%) 63 (100%)
Survey Question 10. As shown in Table 14, there were almost equal numbers of
respondents who had experienced changes in their committee (52.4%, n=33) and those
who had not (47.6%, n=30). The follow-up to this question asked, “If changes were
made, who initiated them and why?” This subquestion produced the following responses:
Statistician requested by program chair, this statistician requested to be co-chair for time to serve and it was a blessing. He has been the most encouraging and helpful of anyone. A member was added to my committee as a new faculty member who had special expertise in my area of study. He proved to be invaluable. I did – two of the committee members who could not work together. I replaced the chair and 2 members. One faculty member had a family crises, and the chair selected another member. Rearranged committee to get faculty that were interested – most didn’t seem to want to help – only wanted their name on paper. Changed one member due to personality conflict. I initiated the change. All my committee either retired or moved. New Chair went overseas at a critical time – major factor.
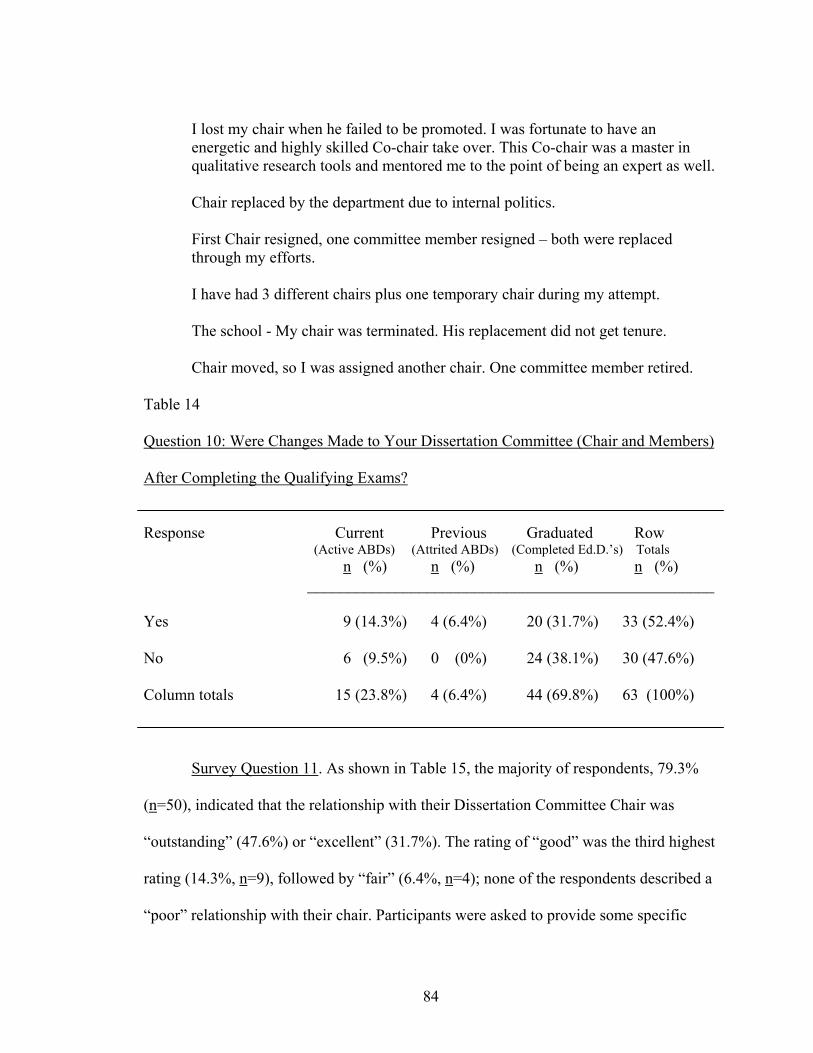
84
I lost my chair when he failed to be promoted. I was fortunate to have an energetic and highly skilled Co-chair take over. This Co-chair was a master in qualitative research tools and mentored me to the point of being an expert as well. Chair replaced by the department due to internal politics. First Chair resigned, one committee member resigned – both were replaced through my efforts. I have had 3 different chairs plus one temporary chair during my attempt. The school - My chair was terminated. His replacement did not get tenure. Chair moved, so I was assigned another chair. One committee member retired.
Table 14
Question 10: Were Changes Made to Your Dissertation Committee (Chair and Members)
After Completing the Qualifying Exams?
Response Current Previous Graduated Row
(Active ABDs) (Attrited ABDs) (Completed Ed.D.’s) Totals n (%) n (%) n (%) n (%)
___________________________________________________
Yes 9 (14.3%) 4 (6.4%) 20 (31.7%) 33 (52.4%)
No 6 (9.5%) 0 (0%) 24 (38.1%) 30 (47.6%)
Column totals 15 (23.8%) 4 (6.4%) 44 (69.8%) 63 (100%)
Survey Question 11. As shown in Table 15, the majority of respondents, 79.3%
(n=50), indicated that the relationship with their Dissertation Committee Chair was
“outstanding” (47.6%) or “excellent” (31.7%). The rating of “good” was the third highest
rating (14.3%, n=9), followed by “fair” (6.4%, n=4); none of the respondents described a
“poor” relationship with their chair. Participants were asked to provide some specific
85
examples of how the dissertation committee chair either helped or hindered their
progress. Some specific examples from these responses are as follows:
She has been available when I need her, she responds quickly to my e-mails and questions. Her critiques of my work have been helpful. My chair is my mentor and friend. His support and belief in me has kept me moving toward the “prize.” He has always kept in contact with me usually via e-mail, and he always makes time for face-to-face conversation when I am in town. By calling and checking on my progress - he encouraged me. I felt I had someone from the university that wanted to help rather than make it tougher. Very supportive – I’m the one who procrastinated. Good criticism of work – helped me down the right path – of least resistance – extremely helpful. Changed his mind – my dissertation was to fit his criteria. Statistician co-chair has encouraged and challenged me by having me become an expert on structural equation modeling. It did hinder me by having to take a year to learn and study this statistical process. No one uses this in education department. I feel good about the knowledge now. Chair was distracted because of a non-tenured decision by the university. Replacement was very good; however, I was no longer interested in completing the dissertation requirement given age, job, and other personal circumstances. I had co-chairs – one helped to define topic and scope of research content. The other helped with research methodology (quantitative) and page-by-page critiques. Coordinated committee, managed relationships of committee members, personal advice, collaborative research opportunities. Political savvy about the university; calmness; years of experience working with committees; knowledge of subject; approval and support. My chair would see me when I needed him. He was very supportive of my topic and the directions I wanted to go. He gave me great help in the statistical analysis – not a strength for me.

86
Chair and Co-chair provided immediate feedback on rewrites – often 24-hour turn around. Talked with me whenever I need him, reviewed my work regularly, let me stay at his home when I came to campus to meet with him and others on the dissertation. Directed me toward relevant research. Was understanding when the computer destroyed my first chapter. My chair was very helpful with the statistics analysis. He also gave me access to his office and computer when I would come to town and work on the stats. (Sometimes I felt like a nuisance to him though.) He always read what I’d written – read it thoroughly. He was always available and always made helpful suggestions. He was caring and supportive. He gave me specific, clear feedback; met regularly and spent time discussing my work; had high expectations and stuck to them; and he was always encouraging. Very supportive. One negative was I followed guidelines that he set for my proposal defense, then he did not defend me when others questioned those guidelines. Final chair’s willingness to pickup partially completed project was crucial. Original chair’s background in subject area was equally essential. Constant pressure and advice to clarify focus of the dissertation topic. Freedom to select my own topic commensurate with background and interests. Kept me on deadlines without which I would not have finished.

87
Table 15
Question 11: My Relationship With the Dissertation Committee Chair Could Best Be
Described As?
Subscale Current Previous Graduated Row
(Active ABDs) (Attrited ABDs) (Completed Ed.D.’s) Totals n (%) n (%) n (%) n (%)
___________________________________________________
Outstanding 3 (4.8%) 0 (0%) 27 (42.8%) 30 (47.6%)
Excellent 7 (11.1%) 1 (1.6%) 12 (19.0%) 20 (31.7%)
Good 4 (6.3%) 2 (3.2%) 3 (4.8%) 9 (14.3%)
Fair 1 (1.6%) 1 (1.6%) 2 (3.2%) 4 (6.4%)
Poor 0 (0%) 0 (0%) 0 (0%) 0 (0%)
Column totals 15 (23.8%) 4 (6.4%) 44 (69.8%) 63 (100%)
Survey Question 12. Table 16 shows that the majority of respondents, 74.6%
(n=47), felt that the relationship with their Dissertation Committee could best be
described as either “good” (44.4%, n=28) or “excellent” (30.2%, n=19). Another 15.9%
(n=10) rated this relationship as “outstanding,” and the remaining 9.5% (n=6) found it to
be “fair” or “poor.” Participants were asked to provide some specific examples of how
the committee either helped or hindered their progress. Some specific examples from
these responses are as follows:
I have only worked closely with two of the three people on my committee thus far. Their professional critiques and advice have helped me progress in writing the dissertation.
They helped me narrow my study, and offered suggestions were right on target.
88
Members critiqued parts and helped with wording of dissertation. They really had no impact – my sense was that they paid little attention outside of formal meetings. Nitpicky changes hindered; close reading of dissertation drafts and constructive criticism helped; moral support helped. Support of proposal – good suggestions for technical and content areas. I had a super group of folks to work with. Only one member was ever less than positive and supportive. He never really bought into my topic. Each member shared generously their expertise in various portions of the dissertation. They invested lots of time, listened and posed challenges that made me evaluate and defend my work informally as I was writing. No real problems. It is just difficult to please five people. One committee member even arranged for a typist for me.
My committee was helpful in the timely way they reviewed each chapter. Individually, members offered good advice, when asked. Less involved overall than Chair – help with writing primarily. The final committee was supportive. Third committee member – almost no involvement. Had quantitative chair and qualitative methodologist. Overall, worked well together despite philosophies. Encouragement, answered questions. Positive and constructive suggestions for improvement of the dissertation; willingness to work around time and distance constraints. I could count on them to discuss my dissertation topic and progress without criticism – the open discussions provided me much confidence.
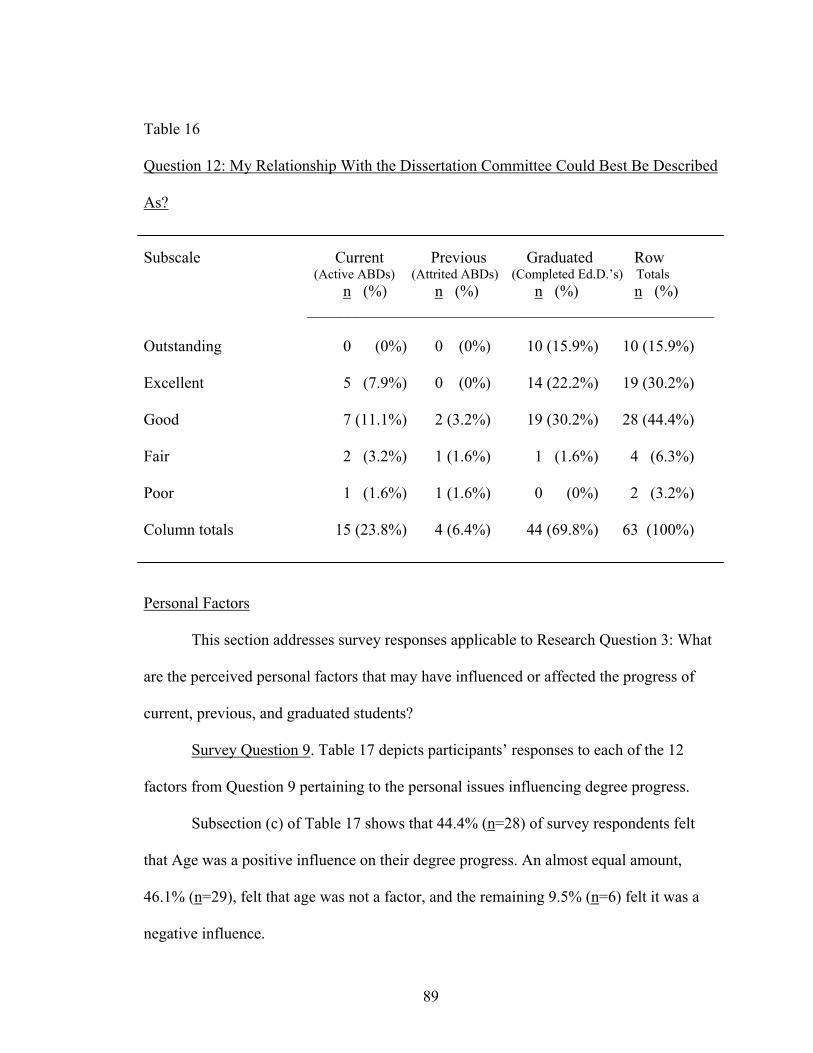
89
Table 16
Question 12: My Relationship With the Dissertation Committee Could Best Be Described
As?
Subscale Current Previous Graduated Row
(Active ABDs) (Attrited ABDs) (Completed Ed.D.’s) Totals n (%) n (%) n (%) n (%)
___________________________________________________
Outstanding 0 (0%) 0 (0%) 10 (15.9%) 10 (15.9%)
Excellent 5 (7.9%) 0 (0%) 14 (22.2%) 19 (30.2%)
Good 7 (11.1%) 2 (3.2%) 19 (30.2%) 28 (44.4%)
Fair 2 (3.2%) 1 (1.6%) 1 (1.6%) 4 (6.3%)
Poor 1 (1.6%) 1 (1.6%) 0 (0%) 2 (3.2%)
Column totals 15 (23.8%) 4 (6.4%) 44 (69.8%) 63 (100%)
Personal Factors
This section addresses survey responses applicable to Research Question 3: What
are the perceived personal factors that may have influenced or affected the progress of
current, previous, and graduated students?
Survey Question 9. Table 17 depicts participants’ responses to each of the 12
factors from Question 9 pertaining to the personal issues influencing degree progress.
Subsection (c) of Table 17 shows that 44.4% (n=28) of survey respondents felt
that Age was a positive influence on their degree progress. An almost equal amount,
46.1% (n=29), felt that age was not a factor, and the remaining 9.5% (n=6) felt it was a
negative influence.
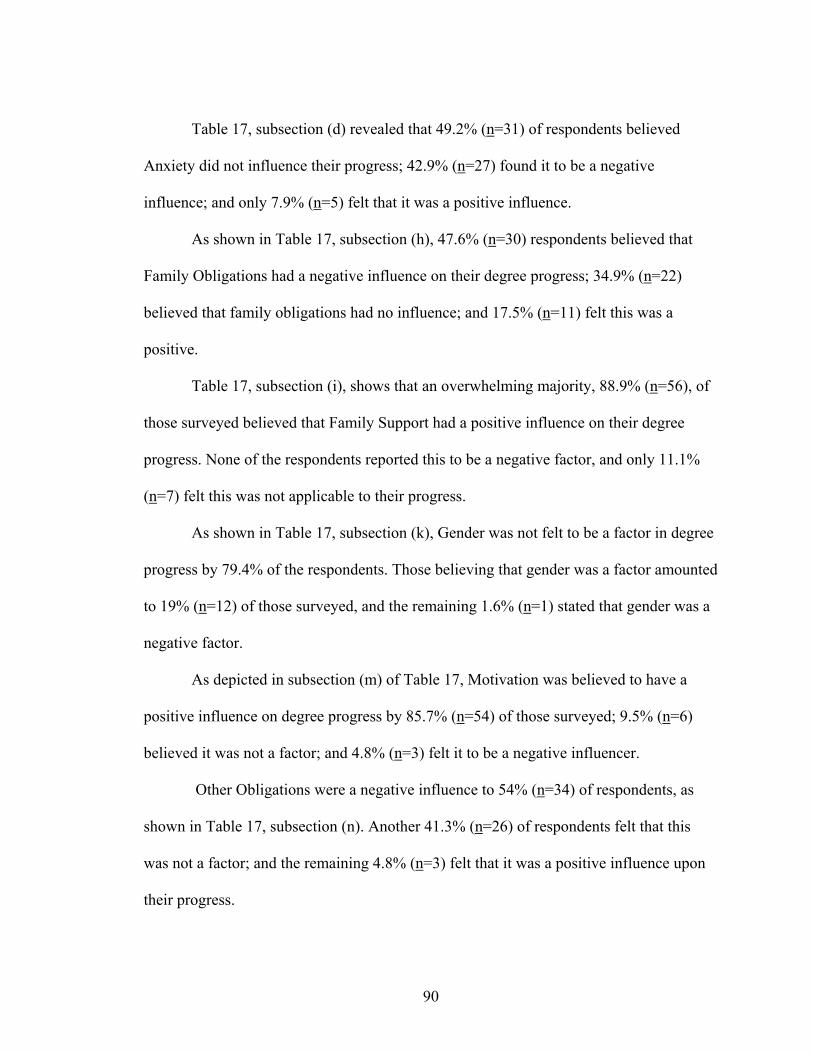
90
Table 17, subsection (d) revealed that 49.2% (n=31) of respondents believed
Anxiety did not influence their progress; 42.9% (n=27) found it to be a negative
influence; and only 7.9% (n=5) felt that it was a positive influence.
As shown in Table 17, subsection (h), 47.6% (n=30) respondents believed that
Family Obligations had a negative influence on their degree progress; 34.9% (n=22)
believed that family obligations had no influence; and 17.5% (n=11) felt this was a
positive.
Table 17, subsection (i), shows that an overwhelming majority, 88.9% (n=56), of
those surveyed believed that Family Support had a positive influence on their degree
progress. None of the respondents reported this to be a negative factor, and only 11.1%
(n=7) felt this was not applicable to their progress.
As shown in Table 17, subsection (k), Gender was not felt to be a factor in degree
progress by 79.4% of the respondents. Those believing that gender was a factor amounted
to 19% (n=12) of those surveyed, and the remaining 1.6% (n=1) stated that gender was a
negative factor.
As depicted in subsection (m) of Table 17, Motivation was believed to have a
positive influence on degree progress by 85.7% (n=54) of those surveyed; 9.5% (n=6)
believed it was not a factor; and 4.8% (n=3) felt it to be a negative influencer.
Other Obligations were a negative influence to 54% (n=34) of respondents, as
shown in Table 17, subsection (n). Another 41.3% (n=26) of respondents felt that this
was not a factor; and the remaining 4.8% (n=3) felt that it was a positive influence upon
their progress.

91
Table 17, subsection (o), shows that 39.7% (n=25) of those surveyed believed that
Perfectionism was not a factor in their degree progress; 36.5% (n=23) felt it was a
positive influence; and 23.8% (n=15) felt it was a negative influence.
Persistence towards degree progress was shown to be a positive factor by 81%
(n=51) of those surveyed, as depicted in Table 17, subsection (p); 17.4% (n=11) indicated
that persistence was not a factor, and only 1.6% (n=1) of respondents felt it to be a
negative influence in their progress.
As shown in Table 17, subsection (q), Procrastination was not a factor in the
degree progress by the majority (52.3%, n=33) of survey respondents. However, 42.9%
(n=27) of those surveyed believed that procrastination was a negative influence, and
4.8% (n=3) felt that it was a positive influence in their degree progress.
Table 17, subsection (s), shows that Race was not considered to be a factor
towards degree progress by the overwhelming majority, 87.3% (n=55), of survey
respondents. However, 12.7% (n=8) believed that race was a positive factor toward their
progress, and no one surveyed felt it was a negative influence.
As shown in Table 17, subsection (u), Stress was believed to have a negative
influence on the majority (55.6%, n=35) of those surveyed. Another 31.7% (n=20) of
respondents felt that stress had no impact, and 12.7% (n=8) believed it had a positive
influence upon their progress.

92
Table 17
Personal Factors Influencing Degree Progress
(c) Age Current Previous Graduated Row
(Active ABDs) (Attrited ABDs) (Completed Ed.D.’s) Totals n (%) n (%) n (%) n (%)
___________________________________________________ Positively 5 (7.9%) 2 (3.2%) 21 (33.3%) 28 (44.4%)
Negatively 1 (1.6%) 0 (0%) 5 (7.9%) 6 (9.5%)
N/A 9 (14.3%) 2 (3.2%) 18 (28.6%) 29 (46.1%)
Column totals 15 (23.8%) 4 (6.4%) 44 (69.8%) 63 (100%)
(d) Anxiety
Positively 0 (0%) 0 (0%) 5 (7.9%) 5 (7.9%)
Negatively 7 (11.1%) 3 (4.8%) 17 (27.0%) 27 (42.9%)
N/A 8 (12.7%) 1 (1.6%) 22 (34.9%) 31 (49.2%)
Column totals 15 (23.8%) 4 (6.4%) 44 (69.8%) 63 (100%)
(h) Family obligations
Positively 1 (1.6%) 1 (1.6%) 9 (14.3%) 11 (17.5%)
Negatively 13 (20.6%) 1 (1.6%) 16 (25.4%) 30 (47.6%)
N/A 1 (1.6%) 2 (3.2%) 19 (30.2%) 22 (34.9%)
Column totals 15 (23.8%) 4 (6.4%) 44 (69.8%) 63 (100%)
(table continues)

93
(i) Family support Current Previous Graduated Row
(Active ABDs) (Attrited ABDs) (Completed Ed.D.’s) Totals n (%) n (%) n (%) n (%)
___________________________________________________
Positively 15 (23.8%) 2 (3.2%) 39 (61.9%) 56 (88.9%)
Negatively 0 (0%) 0 (0%) 0 (0%) 0 (0%)
N/A 0 (0%) 2 (3.2%) 5 (7.9%) 7 (11.1%)
Column totals 15 (23.8%) 4 (6.4%) 44 (69.8%) 63 (100%)
(k) Gender
Positively 3 (4.8%) 1 (1.6%) 8 (12.6%) 12 (19.0%)
Negatively 0 (0%) 0 (0%) 1 (1.6%) 1 (1.6%)
N/A 12 (19.0%) 3 (4.8%) 35 (55.6%) 50 (79.4%)
Column totals 15 (23.8%) 4 (6.4%) 44 (69.8%) 63 (100%)
(m) Motivation
Positively 12 (19.0%) 2 (3.2%) 40 (63.5%) 54 (85.7%)
Negatively 1 (1.6%) 1 (1.6%) 1 (1.6%) 3 (4.8%)
N/A 2 (3.2%) 1 (1.6%) 3 (4.7%) 6 (9.5%)
Column totals 15 (23.8%) 4 (6.4%) 44 (69.8%) 63 (100%)
(table continues)

94
(n) Other obligations Current Previous Graduated Row
(Active ABDs) (Attrited ABDs) (Completed Ed.D.’s) Totals n (%) n (%) n (%) n (%)
___________________________________________________
Positively 0 (0%) 0 (0%) 3 (4.8%) 3 (4.8%)
Negatively 13 (20.6%) 4 (6.4%) 17 (27.0%) 34 (54.0%)
N/A 2 (3.2%) 0 (0%) 24 (38.1%) 26 (41.3%)
Column totals 15 (23.8%) 4 (6.4%) 44 (69.8%) 63 (100%)
(o) Perfectionism
Positively 5 (7.9%) 1 (1.6%) 17 (27.0%) 23 (36.5%)
Negatively 3 (4.8%) 1 (1.6%) 11 (17.4%) 15 (23.8%)
N/A 7 (11.1%) 2 (3.2%) 16 (25.4%) 25 (39.7%)
Column totals 15 (23.8%) 4 (6.4%) 44 (69.8%) 63 (100%)
(p) Persistence
Positively 11 (17.5%) 1 (1.6%) 39 (61.9%) 51 (81.0%)
Negatively 0 (0%) 1 (1.6%) 0 (0%) 1 (1.6%)
N/A 4 (6.3%) 2 (3.2%) 5 (7.9%) 11 (17.4%)
Column totals 15 (23.8%) 4 (6.4%) 44 (69.8%) 63 (100%)
(table continues)

95
(q) Procrastination Current Previous Graduated Row
(Active ABDs) (Attrited ABDs) (Completed Ed.D.’s) Totals n (%) n (%) n (%) n (%)
___________________________________________________
Positively 0 (0%) 1 (1.6%) 2 (3.2%) 3 (4.8%)
Negatively 9 (14.3%) 1 (1.6%) 17 (27.0%) 27 (42.9%)
N/A 6 (9.5%) 2 (3.2%) 25 (39.6%) 33 (52.3%)
Column totals 15 (23.8%) 4 (6.4%) 44 (69.8%) 63 (100%)
(s) Race
Positively 2 (3.2%) 1 (1.6%) 5 (7.9%) 8 (12.7%)
Negatively 0 (0%) 0 (0%) 0 (0%) 0 (0%)
N/A 13 (20.6%) 3 (4.8%) 39 (61.9%) 55 (87.3%)
Column totals 15 (23.8%) 4 (6.4%) 44 (69.8%) 63 (100%)
(u) Stress
Positively 0 (0%) 0 (0%) 8 (12.7%) 8 (12.7%)
Negatively 9 (14.3%) 3 (4.8%) 23 (36.5%) 35 (55.6%)
N/A 6 (9.5%) 1 (1.6%) 13 (20.6%) 20 (31.7%)
Column totals 15 (23.8%) 4 (6.4%) 44 (69.8%) 63 (100%)
Survey Question 13. As previously stated, Question 13 contained a total of 18
employment, financial, or personal factors influencing degree progress and asked
respondents to indicate which of these factors adversely affected their dissertation

96
progress. The 8 “personal factors” from Question 13 pertaining to this section are
portrayed in both table and figure format for ease of interpretation.
As shown in Table 18, the influences of Family Obligations and Stress/Anxiety
were factors reported most often by respondents. These issues were followed by Personal
Health/Injury, Death of a Family Member, Family Member Health/Injury,
Divorce/Separation, Birth of a Child, and Marriage as factors adversely affecting degree
progress. Figure 2 depicts the percentages of those who felt these 8 issues were factors in
their progress. In a follow-up question, survey participants were asked to elaborate on
how the employment, financial, or personal factors impeded their progress. The following
comments were received:
The demands of work and family are my priority. I have to handle these responsibilities before I can sit down and focus on the dissertation. Illness and surgery. The death of a family member delayed my dissertation defense for 1 semester. I had total hip replacement and still had to sign up for a course - I couldn’t miss a semester. The committee was time consuming – 5 hrs round trip for a 3 hr class.” Having both parents ill and hospitalized as well as having a parent die requires time to grieve and tend to family matters. Divorced (no support person at home). Lived 350 miles from university. Treated for depression and alcohol abuse.
Demands from many directions on my time. It was hard to sacrifice so much time that I wanted to spend with my children. A malignant melanoma with years of testing added stress and anxiety and a full-time job as a faculty member and director of a program.

97
Table 18
Personal Factors Affecting Dissertation Progress
Variable Current Previous Graduated Row
(Active ABDs) (Attrited ABDs) (Completed Ed.D.’s) Totals n (%) n (%) n (%) n (%)
___________________________________________________
(d) Divorce/Separation 0 (0%) 2 (3.2%) 2 (3.2%) 4 (6.3%)
(e) Birth of a Child 0 (0%) 0 (0%) 2 (3.2%) 2 (3.2%)
(i) Family Obligations 13 (20.6%) 1 (1.6%) 15 (23.8%) 29 (46.0%)
(j) Stress/Anxiety 10 (15.9%) 1 (1.6%) 12 (19.0%) 23 (36.5%)
(m) Personal Health/Injury 2 (3.2%) 2 (3.2%) 4 (6.3%) 8 (12.7%)
(n) Death of Family Member 1 (1.6%) 0 (0%) 5 (7.9%) 6 (9.5%)
(q) Marriage 0 (0%) 0 (0%) 1 (1.6%) 1 (1.6%)
(r) Family Member Health 1 (1.6%) 1 (1.6%) 4 (6.3%) 6 (9.5%)
Family Obligations
Stress/Anxiety
Personal Health/Injury
Death of Family Member
Family Member Health/Injury
Divorce/Separation
Birth of a Child
Marriage
Figure 2. Personal factors which adversely affected dissertation progress.

98
Survey Question 14. As shown in Table 19, the vast majority of respondents
(96.8%, n=61) reported that their family was supportive of their study for the doctorate.
Only 3.2% (n=2) of those surveyed stated that their family was not supportive.
Table 19
Question 14: In General, Was Your Family Supportive of Your Study For the Doctorate?
Response Current Previous Graduated Row
(Active ABDs) (Attrited ABDs) (Completed Ed.D.’s) Totals n (%) n (%) n (%) n (%)
___________________________________________________
Yes 15 (23.8%) 3 (4.8%) 43 (68.2%) 61 (96.8%)
No 0 (0%) 1 (1.6%) 1 (1.6%) 2 (3.2%)
Column totals 15 (23.8%) 4 (6.4%) 44 (69.8%) 63 (100%)
Survey Question 15. Table 20 shows that 30.0% (n=19) of those surveyed felt that
Family Commitments were “sometimes” relevant to their progress; 28.6% (n=18) thought
they “often” took time away from their studies, as did the 28.6% (n=18) of those who felt
that this “seldom” occurred. The remaining 12.8% (n=8) were equally split in their belief
that this factor “always” or “never” affected their studies. A follow-up question asked
participants to elaborate on their response to family commitment distractions. Some
specific examples are as follows:
I had a variety of commitments, a mother with cancer, a son divorced, a son ill, a son in a car wreck, and a daughter who married. Married with four children, ages 11, 9, 5, and 1. Lots of time demands on me. Daughter moved back to hometown. Got to spend more time with grandchildren. I helped with their move and home repairs.

99
Cared for my mother in my home; stayed enrolled and worked full time during her last year. With a seven year old, we have to take Tae Kwon Do and violin concerts, not to mention making sure everybody’s spirits stay up. My children were away at school and I had to make a couple of related trips. My husband is a rancher, as I sometimes had obligations with bookkeeping. I am a single parent with two children. They will always be given priority. I have to handle these responsibilities before I can sit down and focus on the dissertation. Travel to take care of parents during multiple surgeries stopped the writing process. My husband moved the year before – making me a single parent to sell a house. Family commitments often took time away from my studies – but it was worth it to be with them. I was a single parent with teens to guide during my doctoral work. I was also employed full time and doing graduate work. I had two children during the dissertation stage, and my husband lost his job. My parents occasionally had health or other needs I attended. Both parents died during my doctoral studies. I had two babies during the time I was working on my degree. My family seldom was a distraction. They were very helpful; I could not have done it without them. My family – husband – had done this earlier and I knew what was involved – he was very supportive and encouraging. Family obligations were a priority – sometimes forcing study into the early morning hours.

100
Table 20
Question 15: To What Extent Did Family Commitments Take Time Away From Your
Doctoral Studies?
Subscale Current Previous Graduated Row
(Active ABDs) (Attrited ABDs) (Completed Ed.D.’s) Totals n (%) n (%) n (%) n (%)
___________________________________________________
Always 1 (1.6%) 1 (1.6%) 2 (3.2%) 4 (6.4%)
Often 5 (7.8%) 1 (1.6%) 12 (19.0%) 18 (28.6%)
Sometimes 6 (9.4%) 0 (0%) 13 (20.6%) 19 (30.0%)
Seldom 3 (4.8%) 0 (0%) 15 (23.8%) 18 (28.6%)
Never 0 (0%) 2 (3.2%) 2 (3.2%) 4 (6.4%)
Column totals 15 (23.8%) 4 (6.4%) 44 (69.8%) 63 (100%)
Survey Question 16. Table 21 shows that 38.1% (n=24) of surveyed respondents
felt Personal Obligations “seldom” took time away from their studies. Another 34.9%
(n=22) believed that this occurred “sometimes”; 19% (n=12) felt that it occurred “often”;
4.8% (n=3) said “never”; and the remaining 3.2% (n=2) responded that personal
obligations “always” affected their studies. A follow-up question asked participants to
elaborate on their response to personal obligation distractions. Some specific examples
are as follows:
Family and social relationships are always coming up – birthdays, holidays, etc., when I give time to personal obligations rather than write the dissertation Church responsibilities, job requirements – they want me to finish this pronto! I started a new business.

101
My personal obligations are my family. I was a very committed student. I am obligated to provide proper parenting to my children, but I usually placed school before personal pursuits. Sold a house, was an elder in my church – full time employment. Sister was sick and required my blood donations – she died. Full time employment was a big factor. I was a full time college administrator. My job required travel and many community related meetings during the evenings. I worked on campus; lived two blocks away; my husband was also in grad school (same college); I didn’t have kids. All this made my doctoral studies relatively easy. I arranged my schedule to put school first for 1-½ years. After completing the TRIO grant proposal, I refocused the energy, commitment, time and discipline to completing the dissertation. It took 18 months to finish the surveys, results, stats, and writing. I have several commitments to my church – one of which is planning a wilderness camp for teenaged girls each summer.
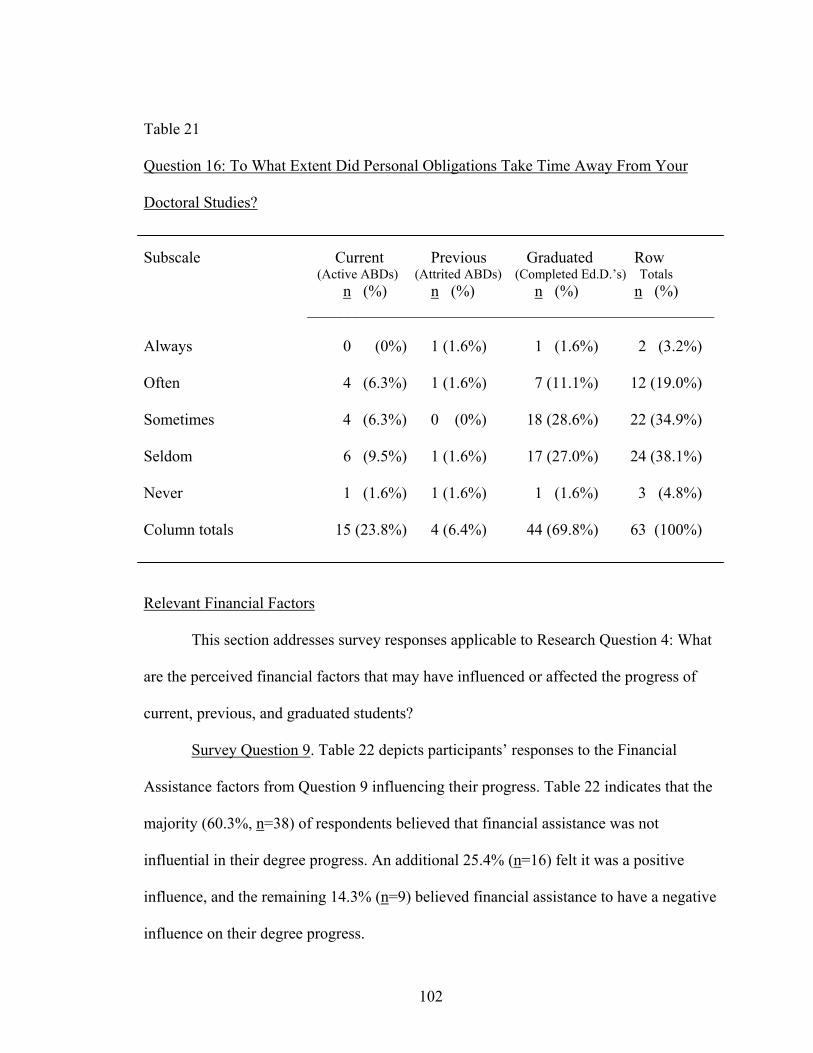
102
Table 21
Question 16: To What Extent Did Personal Obligations Take Time Away From Your
Doctoral Studies?
Subscale Current Previous Graduated Row
(Active ABDs) (Attrited ABDs) (Completed Ed.D.’s) Totals n (%) n (%) n (%) n (%)
___________________________________________________
Always 0 (0%) 1 (1.6%) 1 (1.6%) 2 (3.2%)
Often 4 (6.3%) 1 (1.6%) 7 (11.1%) 12 (19.0%)
Sometimes 4 (6.3%) 0 (0%) 18 (28.6%) 22 (34.9%)
Seldom 6 (9.5%) 1 (1.6%) 17 (27.0%) 24 (38.1%)
Never 1 (1.6%) 1 (1.6%) 1 (1.6%) 3 (4.8%)
Column totals 15 (23.8%) 4 (6.4%) 44 (69.8%) 63 (100%)
Relevant Financial Factors
This section addresses survey responses applicable to Research Question 4: What
are the perceived financial factors that may have influenced or affected the progress of
current, previous, and graduated students?
Survey Question 9. Table 22 depicts participants’ responses to the Financial
Assistance factors from Question 9 influencing their progress. Table 22 indicates that the
majority (60.3%, n=38) of respondents believed that financial assistance was not
influential in their degree progress. An additional 25.4% (n=16) felt it was a positive
influence, and the remaining 14.3% (n=9) believed financial assistance to have a negative
influence on their degree progress.

103
Table 22
Relevant Financial Factors Influencing Degree Progress
(j) Finance assistance Current Previous Graduated Row
(Active ABDs) (Attrited ABDs) (Completed Ed.D.’s) Totals n (%) n (%) n (%) n (%)
___________________________________________________
Positively 6 (9.5%) 1 (1.6%) 9 (14.3%) 16 (25.4%)
Negatively 2 (3.2%) 1 (1.6%) 6 (9.5%) 9 (14.3%)
N/A 7 (11.1%) 2 (3.2%) 29 (46.0%) 38 (60.3%)
Column totals 15 (23.8%) 4 (6.4%) 44 (69.8%) 63 (100%)
Survey Question 13. The four “relevant financial factors” of 18 employment,
financial, or personal factors influencing degree progress, pertaining to Question 13, are
shown in this section. They are portrayed in both table and figure format for ease of
interpretation.
As shown in Table 23, Cost of the Doctorate, Financial Problems, Change to
Income, and Lost Financial Aid were factors adversely affecting degree progress. Figure
3 depicts the percentages of those who felt that these four issues were factors in their
progress. In a follow-up question, survey participants were asked to elaborate on how the
employment, financial, or personal factors impeded their progress. The following
comments were received:
Major move in middle of dissertation process; new position a senior administrative level; internal departmental politics, which required, but unwanted, change of chair. I am part time retired, had no use for the degree.

104
We each have limited budgets and time - I didn’t qualify for financial aid, nor did I receive scholarships. Overall, it was more a matter of time and money than anything else.
Table 23
Relevant Financial Factors Affecting Dissertation Progress
Variable Current Previous Graduated Row
(Active ABDs) (Attrited ABDs) (Completed Ed.D.’s) Totals n (%) n (%) n (%) n (%)
___________________________________________________
(a) Change of Income 3 (4.8%) 2 (3.2%) 1 (1.6%) 6 (9.5%)
(c) Lost Financial Aid 0 (0%) 0 (0%) 1 (1.6%) 1 (1.6%)
(h) Cost of Doctorate 4 (6.3%) 1 (1.6%) 7 (11.1%) 12 (19.0%)
(p) Financial Problems 2 (3.2%) 1 (1.6%) 4 (6.3%) 7 (11.1%)
Cost of Doctorate
Financial Problems
Change of Income
Lost Financial Aid
Figure 3. Relevant financial factors which adversely affected dissertation progress.

105
Survey Question 17. Respondents were asked to indicate which of the nine
financial options were used in funding their doctoral studies. The data, as shown in Table
24, revealed that “full-time employment” was marked most often by 87.3% (n=55) of the
respondents. The second most often selected form of finance was “part-time
employment” (23.8%, n=15); followed by “other” (19%, n=12); “financial aid” (17.5%,
n=11); “savings” and “personal loans,” each at 14.3% (n=9); “scholarships” (9.5%, n=6);
“grants” (4.8%, n=3); and “gifts” (3.2%, n=2).
Financing percentages for each of the nine options, by student groups, are as
follows:
Current Students:
(5) 100% Full-time Employment 98% Full-time Employment; 2% Scholarship 95% Full-time Employment; 5% Scholarship 85% Full-time Employment; 10% Financial Aid; 5% Savings 80% Full-time Employment; 20% Savings 80% Full-time Employment; 20% Financial Aid 50% Full-time Employment; 50% Financial Aid 50% Full-time Employment; 15% Part-time Employment; 5% Grant(s); 5% Savings; 10% Financial Aid; 5% Scholarship(s); 10% Personal Loan(s) 33% Full-time Employment; 33% Savings; 33% Personal Loans 80% Other: Fellowship from employer; 20% Full-time Employment; 75% Other: Employer School Refund Program; 25% Full-time Employment

106
Previous Students:
100% Other: Hazelwood Fee and Tuition Exemption 75% Full-time Employment; 25% Tuition Assistance 50% Full-time Employment; 50% Part-time Employment 80% Part-time Employment; 20% Other: Spousal Income
Graduated Students:
(23) 100% Full-time Employment 90% Full-time Employment; 10% Gift(s) 90% Full-time Employment; 10% Scholarship 80% Full-time Employment; 20% Grant(s) 80% Full-time Employment; 20% Personal Loan(s) 80% Full-time Employment; 20% Financial Aid 75% Full-time Employment; 25% Grant(s) 50% Full-time Employment; 50% Part-time employment 50% Full-time Employment; 50% Savings 50% Full-time Employment; 25% Savings; 25% Personal Loans 40% Full-time Employment; 40% Part-time; 20% Personal Loan(s)

107
Table 24
Question 17: What Percentages of the Following Financial Options Were Used To Fund
Your Doctoral Studies? (i.e., 15%, 20%, 50%, etc.)
Options Current Previous Graduated Row
(Active ABDs) (Attrited ABDs) (Completed Ed.D.’s) Totals n (%) n (%) n (%) n (%)
___________________________________________________
Part-Time Employment 2 (3.2%) 3 (4.8%) 10 (15.9%) 15 (23.8%)
Full-Time Employment 15 (23.8%) 1 (1.6%) 39 (61.9%) 55 (87.3%)
Grants 1 (1.6%) 0 (0%) 2 (3.2%) 3 (4.8%)
Savings 6 (9.5%) 0 (0%) 3 (4.8%) 9 (14.3%)
Financial Aid 6 (9.5%) 0 (0%) 5 (7.9%) 11 (17.5%)
Scholarship(s) 2 (3.2%) 0 (0%) 4 (6.3%) 6 (9.5%)
Gift(s) 0 (0%) 0 (0%) 2 (3.2%) 2 (3.2%)
Personal Loan(s) 3 (4.8%) 0 (0%) 6 (9.5%) 9 (14.3%)
Other 2 (3.2%) 3 (4.8%) 7 (11.1%) 12 (19.0%)
Employment Factors
This section addresses survey responses applicable to Research Question 5: What
are the perceived employment factors that may have influenced or affected the progress
of current, previous, and graduated students?
Survey Question 9. Table 25 reflects survey responses to the employment factors
associated with Question 9. The data indicates that 49.2% (n=31) of the respondents
believed that employment factors influenced their degree progress in a positive manner.
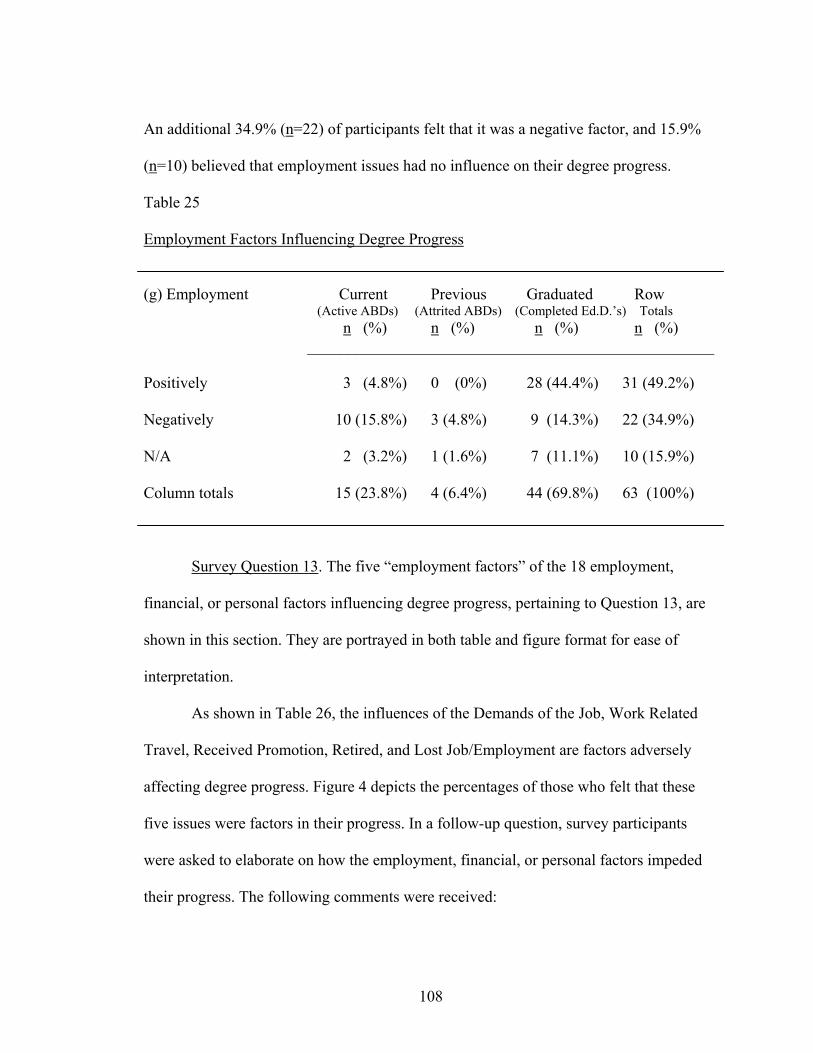
108
An additional 34.9% (n=22) of participants felt that it was a negative factor, and 15.9%
(n=10) believed that employment issues had no influence on their degree progress.
Table 25
Employment Factors Influencing Degree Progress
(g) Employment Current Previous Graduated Row
(Active ABDs) (Attrited ABDs) (Completed Ed.D.’s) Totals n (%) n (%) n (%) n (%)
___________________________________________________
Positively 3 (4.8%) 0 (0%) 28 (44.4%) 31 (49.2%)
Negatively 10 (15.8%) 3 (4.8%) 9 (14.3%) 22 (34.9%)
N/A 2 (3.2%) 1 (1.6%) 7 (11.1%) 10 (15.9%)
Column totals 15 (23.8%) 4 (6.4%) 44 (69.8%) 63 (100%)
Survey Question 13. The five “employment factors” of the 18 employment,
financial, or personal factors influencing degree progress, pertaining to Question 13, are
shown in this section. They are portrayed in both table and figure format for ease of
interpretation.
As shown in Table 26, the influences of the Demands of the Job, Work Related
Travel, Received Promotion, Retired, and Lost Job/Employment are factors adversely
affecting degree progress. Figure 4 depicts the percentages of those who felt that these
five issues were factors in their progress. In a follow-up question, survey participants
were asked to elaborate on how the employment, financial, or personal factors impeded
their progress. The following comments were received:
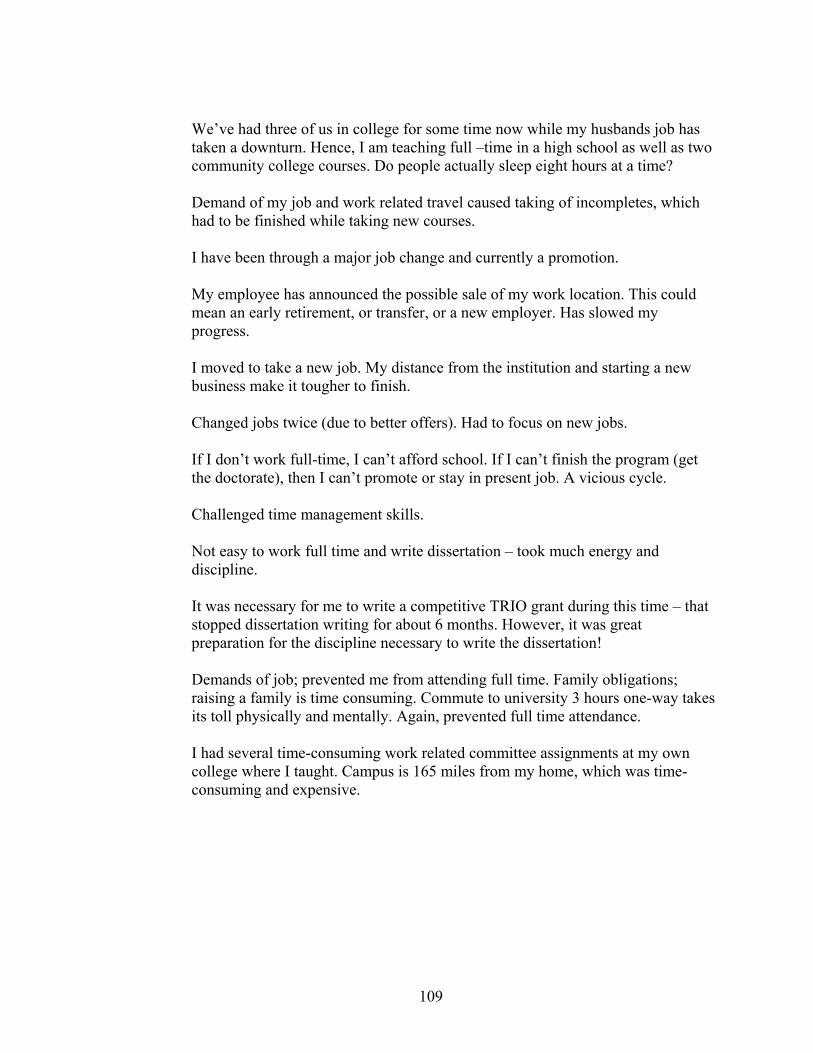
109
We’ve had three of us in college for some time now while my husbands job has taken a downturn. Hence, I am teaching full –time in a high school as well as two community college courses. Do people actually sleep eight hours at a time? Demand of my job and work related travel caused taking of incompletes, which had to be finished while taking new courses. I have been through a major job change and currently a promotion. My employee has announced the possible sale of my work location. This could mean an early retirement, or transfer, or a new employer. Has slowed my progress. I moved to take a new job. My distance from the institution and starting a new business make it tougher to finish. Changed jobs twice (due to better offers). Had to focus on new jobs. If I don’t work full-time, I can’t afford school. If I can’t finish the program (get the doctorate), then I can’t promote or stay in present job. A vicious cycle. Challenged time management skills. Not easy to work full time and write dissertation – took much energy and discipline. It was necessary for me to write a competitive TRIO grant during this time – that stopped dissertation writing for about 6 months. However, it was great preparation for the discipline necessary to write the dissertation! Demands of job; prevented me from attending full time. Family obligations; raising a family is time consuming. Commute to university 3 hours one-way takes its toll physically and mentally. Again, prevented full time attendance. I had several time-consuming work related committee assignments at my own college where I taught. Campus is 165 miles from my home, which was time-consuming and expensive.
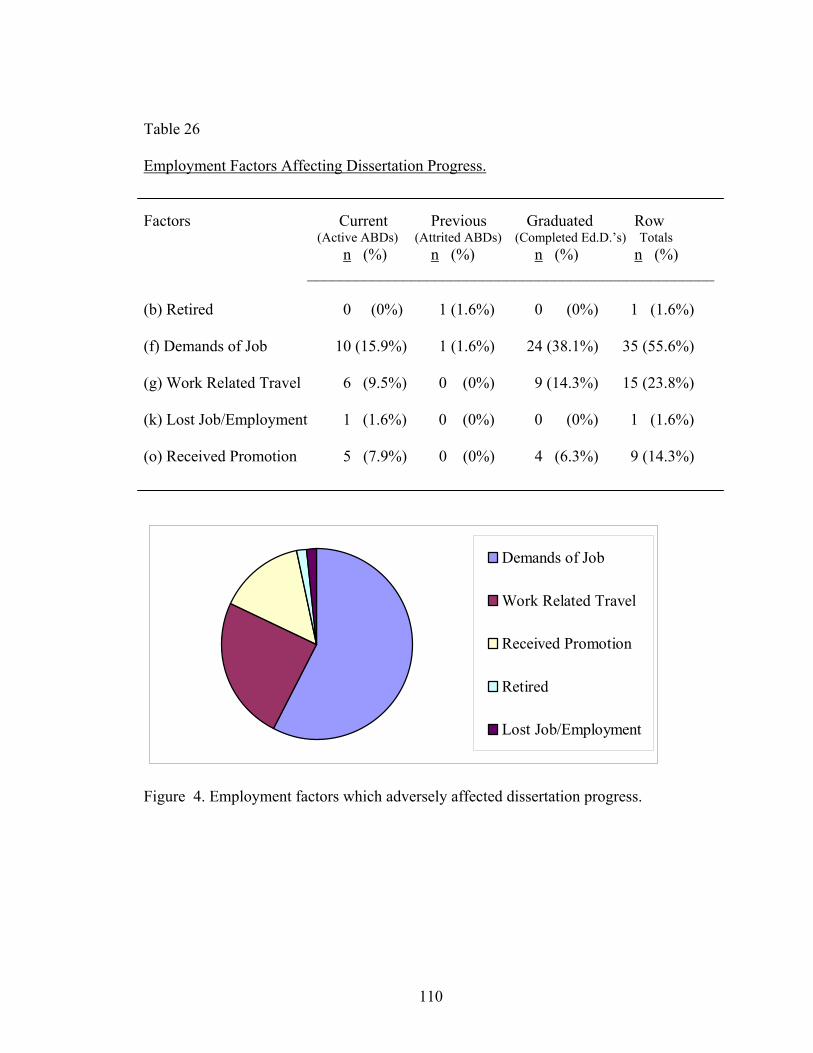
110
Table 26
Employment Factors Affecting Dissertation Progress.
Factors Current Previous Graduated Row (Active ABDs) (Attrited ABDs) (Completed Ed.D.’s) Totals
n (%) n (%) n (%) n (%) ___________________________________________________
(b) Retired 0 (0%) 1 (1.6%) 0 (0%) 1 (1.6%)
(f) Demands of Job 10 (15.9%) 1 (1.6%) 24 (38.1%) 35 (55.6%)
(g) Work Related Travel 6 (9.5%) 0 (0%) 9 (14.3%) 15 (23.8%)
(k) Lost Job/Employment 1 (1.6%) 0 (0%) 0 (0%) 1 (1.6%)
(o) Received Promotion 5 (7.9%) 0 (0%) 4 (6.3%) 9 (14.3%)
Demands of Job
Work Related Travel
Received Promotion
Retired
Lost Job/Employment
Figure 4. Employment factors which adversely affected dissertation progress.
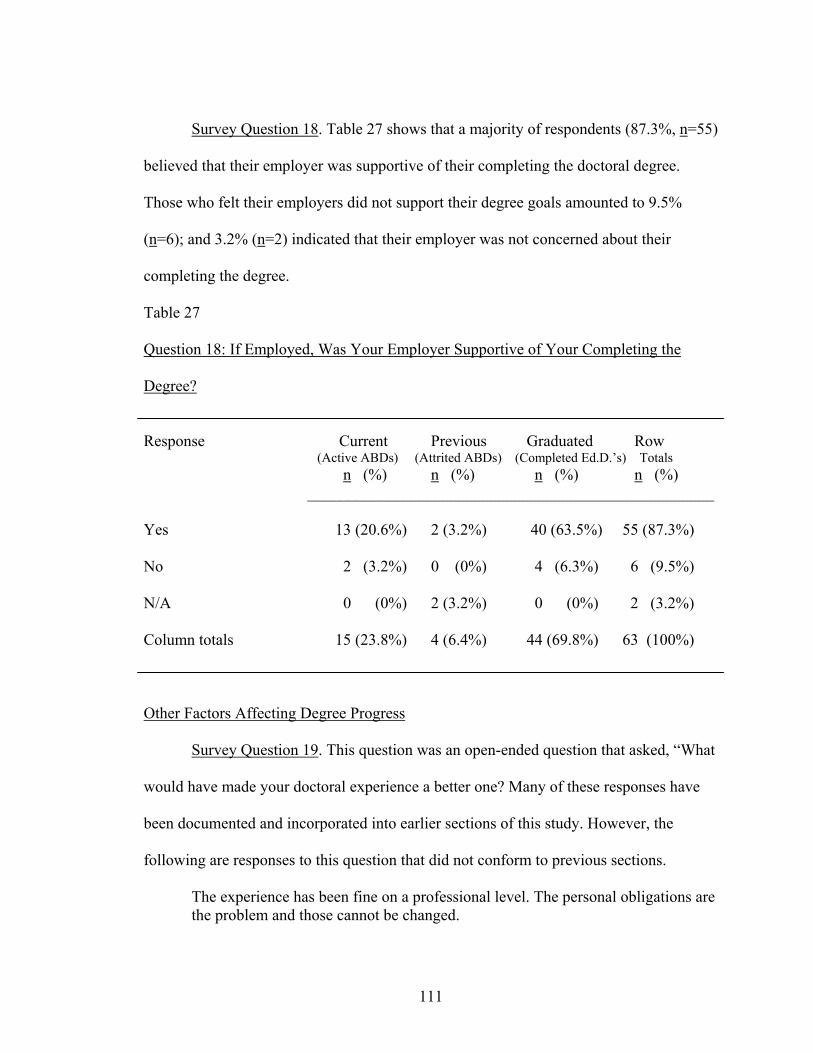
111
Survey Question 18. Table 27 shows that a majority of respondents (87.3%, n=55)
believed that their employer was supportive of their completing the doctoral degree.
Those who felt their employers did not support their degree goals amounted to 9.5%
(n=6); and 3.2% (n=2) indicated that their employer was not concerned about their
completing the degree.
Table 27
Question 18: If Employed, Was Your Employer Supportive of Your Completing the
Degree?
Response Current Previous Graduated Row
(Active ABDs) (Attrited ABDs) (Completed Ed.D.’s) Totals n (%) n (%) n (%) n (%)
___________________________________________________
Yes 13 (20.6%) 2 (3.2%) 40 (63.5%) 55 (87.3%)
No 2 (3.2%) 0 (0%) 4 (6.3%) 6 (9.5%)
N/A 0 (0%) 2 (3.2%) 0 (0%) 2 (3.2%)
Column totals 15 (23.8%) 4 (6.4%) 44 (69.8%) 63 (100%)
Other Factors Affecting Degree Progress
Survey Question 19. This question was an open-ended question that asked, “What
would have made your doctoral experience a better one? Many of these responses have
been documented and incorporated into earlier sections of this study. However, the
following are responses to this question that did not conform to previous sections.
The experience has been fine on a professional level. The personal obligations are the problem and those cannot be changed.

112
If I had been physically closer to a good library. I would’ve pushed more frequently. Not working, more motivation, better writing skills – same chair (had 3-4) more pressure less deadlines. Communications; a better EDHE 6310; 2 different types of statistics classes; 2 hours a week course to do Chapter 4. Being there – and getting to finish. Positive support from graduate dean. Less responsibility – more time. I finished against the odds because I really needed to finish and get on to supporting my family. Support of junior college where I was employed. Library facilities in my hometown. Leave of absence from job.
More help from the library for such things as Inter-library Loan. Considering I pay those damn fees and live two hours away, the least they could do is ship a book to me now and then, but that’s not SOP. A Ph.D. program at the university. If I were a better typist.
Living in town.
Not moving during the writing process.
A study committee – clearer requirements.
Support from my employer. Living closer to campus. Being younger. No university help was available for financing the degree even though I asked – had 4.0.GPA. Graduate school faculty who helped you – not try to keep you from finishing.
113
Professors who were willing to teach at times the students can go to class – come to El Paso and teach weekend classes. Overall - was a positive experience.
Survey Question 20. Question 20 was an open-ended question that asked, “ What
other factors (positive or negative) affected your degree progress that have not been
covered in the previous questions? Many of these responses have been documented and
incorporated into earlier sections of this study. However, the following are responses to
this question that did not conform to previous sections.
I stopped out for about four years after divorcing, and then my mother died. I had to give my children time to grow up a little before I could give the time necessary to accomplish the degree. I only lack 12 hours of course work when I stopped out. I want to clarify the fact that I consciously chose not to complete the dissertation. I am responsible for this decision, and I do not blame anyone else for the choice I made…I have a substantial amount of residual anger at myself as a result of my choices. Strangely enough, I have no remorse for having chosen not to finish the degree requirements, but I have a substantial amount of residual anger for having been so foolish as to waste so much time and money. Not willing to give up free time, playing golf, travel, etc., to complete the doctorate. Wasn’t particularly impressed by the nature of the rigor applicable to the dissertation – found the process mostly political, not intellectual. I would have progressed through a bit slower, as I felt guilty at times due to focusing too much on Grad school and not enough on family and job. Prior to the move in 1992, my employer at one point made my termination of the program a condition of continued employment. After 1992, the college for which I worked was highly supportive of my degree work.
Scholarship allowed for full-time work on dissertation that would have otherwise been impossible – probably adequately addressed in previous questions – getting at issue of amount of time able to devote to doctoral studies. Plain old laziness.

114
Conclusions
The following 28 factors that affected current, previous, and graduated students’
degree progress as reported by at least 50% of the survey respondents, are ranked in order
of their influence.
1. Relationship With Dissertation Chair (100%)
2. Relationship With Dissertation Committee (100%)
3. Employer Supportiveness (96.8%)
4. Family Support of Doctoral Study (96.8%)
5. Committee Chair (92.1%)
6. Motivation (90.5%)
7. Family Support (88.9%)
8. Financing their degree through full-time employment (87.3%)
9. Research Skills (87.3%)
10. Writing Skills (87.3%)
11. Employment (84.1%)
12. Persistence (82.6%)
13. Committee - other than Chair (81.0%)
14. Topic Selection (77.8%)
15. Academic Advisement (69.8%)
16. Stress (68.3%)
17. Family Obligations (65.1%)
18. Family Commitments (65.0%)
19. Perfectionism (60.3%)
115
20. Program Requirements (58.7%)
21. The Higher Education Research Seminar Course (EDHE 6310) (58.7%)
22. Personal Obligations (57.1%)
23. Demands of the Job (55.6%)
24. Other Obligations (54.8%)
25. Age (53.9%)
26. Changes to Dissertation Committee (52.4%)
27. Time-to-Degree (50.8%)
28. Anxiety (50.8%)
This study focused on the factors influencing student completion or
noncompletion of the degree program. It was found that many of these factors were
interrelated and influenced one another. One example of this interrelationship may be
found in the area of student/spouse employment and job demands and their influences on
the factors of committee and committee chair relationships; employer support; family
support, commitments, and obligations; finances and financing the degree; motivation;
perfectionism; persistence; personal and other obligations; stress; and anxiety. Many
other combinations of interactions are possible. However, the extent of these interactions
could be determined only through individual studies of each of these elements.
Discussion
Research suggests that those who attain the classification of ABD face an 80-
82.4% chance of completing their degree program (Bowen & Rudenstine, 1992; Quinn,
1992). Researchers have suggested a multitude of factors that contribute to the success or
failure of ABDs towards program completion. These include academic advisement and

116
mentoring; employment; family support and obligations; financial assistance; integration,
involvement, and interaction with the institution; personality variables of motivation,
procrastination, and perseverance; research skills; program structure; stress and anxiety;
time-to-degree; and topic selection.
The purpose of this study was to identify the factors affecting student progress,
attrition, and retention after reaching ABD status. The design expanded the scope of
previous doctoral attrition and retention research by including all affected participants –
whether they were currently enrolled ABDs, previously attrited ABDs, or successfully
graduated Ed.D.’s of the program. Including all relevant participants ensured an inclusive
viewpoint from both the attrition and retention perspectives. Participants were provided
the latitude to expand upon their Likert-type scale responses in open-ended follow-up
questions. The value of this methodology proved fruitful by providing a greater insight
into how the factors affecting degree progress were dealt with by members of these
groups.
The actual numbers of students surveyed within these three groups were 101
(n=68 Ed.D.’s, n=23 current ABDs, and n=10 attrited ABDs). In compiling the
participant listing for this study, it was noted that the attrition rate of ABD students was
10.1% -- considerably lower than the 20% to 17.6% reported in the literature (Bowen &
Rudenstine, 1992; Quinn, 1992). The reasons for this increased retention may be
explained by examining the relationship between the student, the dissertation chair, and
the dissertation committee.
The results of this study indicate that the positive influences of the Relationship
With Dissertation Chair (93.6%), the Relationship With Dissertation Committee (90.5%),

117
Committee Chair (79.4%), and Committee – other than Chair (68.3%) contribute to
student degree progress. One of the most positive aspects of the doctoral program in this
study is the active involvement of their faculty as mentors. Each doctoral student is
provided continual program guidance from the faculty. The faculty prides itself on
keeping in constant contact with students, which is accomplished through one-on-one
meetings, telephone conversations, and exchanges of e-mail, Fax, or postal mailings.
Students are routinely afforded the opportunity to participate in group functions to
exchange ideas and seek answers to common concerns. The faculty advisors frequently
offer their homes and hospitality to commuter students from remote locations. This active
involvement and genuine concern for students appears to be reflected in the low attrition
rate of ABDs from the program.
Universities should develop and encourage an ongoing mentoring program that
provides needed support services to doctoral students. As Cooper (1997) recommended,
the experienced faculty could serve as mentors, while the newer faculty could function
more in the doctoral-student advising capacity. It is important that these faculty
participants receive professional mentoring training to accomplish their task. This
mentoring program could be expanded to include doctoral students who have reached
ABD status or are well within their program of study. Dorn et al. (1995) found that “peers
make excellent educators” (p. 313). Both faculty mentors and student mentors from the
same program could be assigned to each incoming doctoral student. Far too often
doctoral students do not know where to seek help or are reluctant to appear
unknowledgeable about a particular issue. This “loss” includes not knowing which
courses to take during which semester (since all courses are not offered each semester);

118
when and where to file for degree plans, interim exams or qualification exams; and how
to obtain financial aid, grants, or scholarship opportunities. The mentoring from both a
faculty and student would enhance the doctoral experience and increase the chances for
student success. It also enables the university to have a vehicle for student feedback
pertaining to the quality of services provided by the institution.
This study found that Academic Advisement had a positive influence on the
degree progress of 65% of the survey respondents. Active academic advisement,
mentoring, and support of ABD students are also essential issues in increasing retention
and graduation rates within the institution. Commuter doctoral students may easily
become detached from the university environment and not only need -- but deserve active
involvement from their faculty advisor and mentor. Contact could be enhanced through
regular meetings on a schedule agreed to by both parties. These meetings should include
setting a timetable for accomplishments, such as developing the dissertation proposal,
conducting the research, developing and mailings of survey instruments, and writing the
various chapters of the dissertation. Actual communications should routinely incorporate
all forms of communications, such as one-on-one meetings, telephone, e-mail, Fax, and
postal mailings.
The relationship between the dissertation committee chair (advisor) and the
dissertation student (advisee) can sometimes deteriorate or, at the very least, encounter
periods of misunderstanding. Davis and Parker (1997) suggested that using a systematic
approach to the advisor-advisee relationship and “implied contract” could greatly
facilitate the student completion of the dissertation. This contract would outline the

119
responsibilities of each party during the dissertation stage of the program. Items for the
advisor would include the following:
Provide guidance; Respond to the papers given to read within a reasonable time;
Be reasonably consistent in advise; Protect the student from unreasonable
demands; Assist the student at those times when the voice of a faculty member
advocate is necessary; and generally aid the student in pursuing the dissertation
project. (p. 11)
The doctoral student would be expected to do
Do what he or she says will be done when promised (or explain why it cannot be
done); Have integrity in research and writing; Keep in communication; Prepare
documents for comment; Follow a method of presentation that effectively uses the
advisor’s and committee’s time; Be reasonable in making demands on the time of
the advisor and the committee; Be open to suggestions and to advise, but also
show initiative. (p. 11)
The results of this study found that Employer Supportiveness had a positive
influence on the degree progress of 87.3% of the survey respondents. Additionally, the
positive influences of Family Support (88.9%), Family Support of Doctoral Study
(87.3%), and Employment (49.2%) contributed to student degree progress. The negative
influences of Family Commitments (65%), Personal Obligations (57.1%), and Family
Obligations (47.6%) were found to affect degree progress. One must understand the
impact of the dissertation upon family, job, and time. It is a matter of choice and
commitment. The doctoral program is in itself a difficult task for many to accomplish --
attrition rates of 40% to 60% support this premise (Berelson, 1960; Bowen & Rudenstine,

120
1992; Cheatham, Edwards, & Erikson, 1982; Cuetara & LeCapitaine, 1991). However,
the dissertation is by far the most demanding upon one’s time and organizational skills. If
a logical and systematic approach to time management and obligations is accomplished
and adhered to; the dissertation process can be completed. It is essential that the students
communicate this commitment to themselves, their families and friends, business and
social organizations, and anyone else who has demands upon their time.
Employment and Demands of the Job during the dissertation are some of the most
influential factors affecting completion. As found in the research and in this study, many
doctoral students are married and are between the ages of 40 and 49 years of age. They
have established themselves in the community, one of the spouses or both work full-time,
and many times the other is employed part-time. The results of this study found that
87.3% of survey respondents financed the degree through full-time employment. This
employment necessity places demands upon time and financial resources. These students
soon feel the burden of the commute, class attendance, finances, family and personal
obligations, community and academic involvement, and a myriad of other complexities.
The “balance” of work – school – obligations – and play is essential to maintaining one’s
motivation, persistence, and sense of well-being. As Wright (1991) proposed almost a
decade ago, “ABD individuals are urged to become fully aware of the work load they will
face when employed” (p. 52).
Family support is an essential element in coping with the rigors of the
dissertation; however, family members may not fully understand the complexities and
frustrations encountered when developing the dissertation. Peer support groups, and
dissertation study groups may be able to fill this void and provide an additional source of

121
encouragement for those entering the dissertation portion of their program. Support
groups offer a source of encouragement, collaboration, and help not as easily
accomplished by faculty advisement and mentoring alone. These support groups benefit
all parties by helping “members stay focused, finish their doctorates and feel better about
themselves in the process” (Stalker, 1991, p. 56). “The ideal source of support is from
someone who is actually going through the dissertation process at the same time”
(Monsour & Corman, 1991, p. 182).
This study found that the negative influences of Stress (55.6%) and Anxiety
(42.0%) affected degree progress. Coping with stress and anxiety during the dissertation
can be a difficult task. While stress and anxiety can be a positive influence in maintaining
motivation and persistence, it can also be detrimental to one’s progress and health. It is
important that students are made aware of how to identify the symptoms and adverse
affects of stress. This could be accomplished through student/faculty workshops,
counseling, or seminars and would be an excellent source of information exchange while
helping to improve the “contact time” between these two factions. Additionally, faculty
mentors can be a source of information and guidance to students who encounter stress
and anxiety during the dissertation process. However, “if students try strategies for
coping and still experience the negative aspects of stress, then faculty should encourage
students to seek professional counseling or therapy” (Whitman, Spendlove, & Clark,
1986, p. 2).
Respondents in this study reported that Writing Skills (81%) and Research Skills
(79.4%) had a positive affect on degree progress. Student research, writing, and
presentation skills may be developed through increased participation in academia.

122
Nielson (1998) found that increased student involvement equates with greater satisfaction
in the overall academic experience. This is especially important for those who have
reached the ABD stage and feel somewhat alienated from academia. Students should seek
opportunities to join student or professional organizations to increase their contact with
those in similar situations. Meeting and exchanging ideas with others in a formal or
informal environment is essential to one’s development This may include participating in
conference presentations; developing and publishing articles in professional journals;
participating in formal forum workgroups, workshops, or seminars; or becoming an
active member of professional or graduate student organizations. The increased contact
may lead to lifelong professional relationships that are of mutual benefit to both the
individual and the organization.
This study found that Topic Selection had a positive influence on the degree
progress of 71.4% of survey respondents. Faculty mentors and program departments
should encourage students to arrive at a dissertation topic while in their early stages of
coursework. The advantages to accomplishing early topic selection are numerous and
include designing the degree plan and selecting required and optional coursework along
the lines of the topic; directing class research and writings towards the dissertation topic;
seeking opportunities for publication or presentation of associated research; becoming
more familiar with research and technical writing; and most importantly, increasing the
opportunities for contact with the faculty advisor or mentor.
Topic selection should (1) sustain interest and stimulate imagination, (2) be
manageable in size - too many doctoral students “begin with a topic that is too
large to be handled successfully”, (3) within ones range of competence, (4) have

123
the potential to make an original contribution to the sum of human knowledge,
and (5) permit the student to demonstrate their independent mastery of both the
subject and the appropriate research method. (Madsen, 1992, p. 23)
Higher education programs should include an active series of information
exchanges between faculty and students. Support seminars for doctoral students should
be conducted by current ABD and graduated students from the program. Seminars would
be informal but structured for exchange of information about the doctoral program. These
seminars could be offered for doctoral students at two important junctures of the program
– entry into the doctoral program as a new student and entry into doctoral candidacy as an
ABD student. Attendance by doctoral students at these seminars should not be optional,
but a requirement (i.e., 1 credit-hour course) to proceed to the next stage of their
program. The “how-to’s” and “look-out-for’s” during these stages would benefit all
members of these groups. Suggestions for additional resources could be made available
to these students during these seminars. Some of these resources include Steinberg’s
(1981), How to Complete and Survive a Doctoral Dissertation; Gardner and Beatty’s
(1980), Dissertation Proposal Guidebook: How to Prepare a Research Proposal and Get It
Accepted; or the on-line resources of “The Dissertation Doctor” at
http://www.dissertationdoctor.com; “Dissertation News” through the Association for
Support of Graduate Students at http://www.asgs.org; and the “All-But-Dissertation
Survival Guide” by Ben Dean at http://www.ecoach.com. These are but a few
outstanding resources available to all doctoral students.
It is also recommended that all graduate, especially doctoral program
administrators, track the retention and attrition rates of those in their degree programs.

124
This information is essential in evaluating the program and instruction. In addition, exit
interviews from graduates and attrited doctoral candidates would provide a wealth of
information and feedback to university program administrators about their programs. As
described by Lovitts (1997b), the absence of accurate exit interviewing or feedback
inhibits administrators from obtaining the actual reasons for incompletion of degree
programs. It is important that the factors affecting degree progress be identified and that
the actual reasons or circumstances of attrition are known, in hopes others will not
succumb to the same fate by the same circumstances. University administrators should
maintain an accurate and up-to-date database of all students who have completed or are
exiting the university. The database of addresses, phone numbers and e-mail addresses
would be available to student service organizations, individual program offices, and
alumni personnel.
Suggestions for Further Research and Actions
The following are suggested areas of research that are believed to enhance the
retention rates of doctoral candidates in higher education.
1. An investigation should be conducted to determine the extent of interaction and
influence of the factors affecting the degree progress of doctoral students.
2. An investigation should be completed into the value of doctoral student
workshops and seminars to obtain and exchange information prior to completing the
coursework degree plan as a doctoral student and again before entering doctoral
candidacy.
3. A study into the value of the residency requirement for commuter students should
be completed.

125
4. It is recommended that faculty and peer mentoring studies be conducted to
ascertain their effectiveness in doctoral student retention.
5. It is recommended that more funding opportunities, such as financial aid, grants,
and student scholarships are made available to all doctoral students regardless of their
enrollment status.
6. It is recommended that a study be completed on the stress and anxiety factors
encountered by the doctoral student during the dissertation portion of the program. It may
also be of interest to include the dissertations family in this investigation.
7. Research should be completed to obtain the value of an “implied contract”
between advisor-advisee to outline the responsibilities of each party during the
dissertation stage of the program.
8. All doctoral students should be required to complete a dissertation development
course. In addition to receiving guidance in developing the proposal and dissertation, the
course should require every student to attend to at least one dissertation proposal defense
and dissertation defense before completing the course. Additional preparation for the
dissertation could be achieved through student role-playing exercises.
9. It is recommended that each doctoral student utilize the resources of a
professional proofreader and if necessary – a competent computer typist.
10. A follow-up study should be conducted involving the current ABD students who
were subjects in this study and future doctoral candidates from the Higher Education
Doctoral Program.

126
APPENDIX A
RESEARCH SITE APPROVAL

127
TEXAS TECH UNIVERSITY
College of Education Box 41071 Lubbock, TX 79409-1071 (806) 742-1997 ext. 302 FAX (806) 742-2179 April 14, 2000 Eric D. Malmberg 114 Pebble Beach Drive Trophy Club, TX 76262 Sub: Research Project Dear Mr. Malmberg, Thank you for your recent request to conduct you dissertation research project at Texas Tech University. We have reviewed your proposal, survey questionnaire, and supporting information. It is our understanding that the focus will be upon current and past doctoral candidates from our higher education program. For clarification, this group will be those who completed their coursework, comprehensive exams, and residency requirements from 1991 through 2000. We share your interest in ascertaining the quality of service and experiences from this student group and offer our full support. If possible, we would like to receive a copy of your completed study. This information will be an asset to our program evaluation and planning efforts. Your primary contacts at Texas Tech will be: Albert B. Smith, Ph.D. Brent D. Cejda, Ph.D. (806) 742-1997 x302 (806) 742-1997 x273 Fax: (806) 742-2179 Fax: (806) 742-2179 [email protected] [email protected] Thank you for considering our program for your research project. We believe it will be a mutually rewarding experience. If we can be of any further assistance, please don’t hesitate to contact us. Sincerely, (Original Signature) Albert B. Smith, Ph.D. Professor and Coordinator Higher Education Program

128
APPENDIX B
INSTITUTIONAL REVIEW BOARD APPROVAL

129

130
APPENDIX C
HUMAN SUBJECTS RESEARCH CONSENT FORM

131
UNIVERSITY OF NORTH TEXAS COMMITTEE FOR THE PROTECTION OF HUMAN SUBJECTS
RESEARCH CONSENT FORM
Subject Name:__________________________________________ Date: _________________ Title of Study: Retention and Attrition of Doctoral Candidates In Higher Education Principal Investigator: ___Eric D. Malmberg_________________________________________ Co-Investigators: _______Dr. Michael K. Altekruse III_________________________________ Before agreeing to participate in this research study, it is important that you read and understand the following explanation of the proposed procedures. It describes the procedures, benefits, risks, discomforts of the study. It also describes the alternative treatments that are available to you and your right to withdraw from the study at any time. It is important for you to understand that no guarantees or assurances can be made as to the results of the study. PURPOSE OF THE STUDY AND HOW LONG IT WILL LAST: The purpose of this study is to examine the retention and attrition of doctoral candidates in the Higher Education Doctoral Program in the College of Education at Texas Tech University between the periods of 1991 through 2000. The period for gathering data from participants will start in August and conclude before November 2000. DESCRIPTION OF THE STUDY INCLUDING THE PROCEDURES TO BE USED: You were selected from a comprehensive list of “All But Dissertation” ABD students in the Higher Education Doctoral Program at Texas Tech University who were admitted to candidacy from 1991 through 2000; those who have previously met the residency requirements, course completion, and successful completion of the Qualifying Exams.
This study consists of obtaining response to questions concerning factors that affected program completion or attrition. Information gathered from responses to these questions may help to identify key factors affecting graduate degree progress at Texas Tech University. Your frank and honest opinions in response to questions will be very helpful in gaining a better understanding of your experiences as a doctoral candidate. You will be asked to complete a self-administered questionnaire concerning your doctoral experience, which should take fifteen to twenty minutes to complete.

132
UNIVERSITY OF NORTH TEXAS COMMITTEE FOR THE PROTECTION OF HUMAN SUBJECTS
RESEARCH CONSENT FORM Subject Name:__________________________________________ Date: _________________ Title of Study: Retention and Attrition of Doctoral Candidates In Higher Education Principal Investigator: ___Eric D. Malmberg_________________________________________ Co-Investigators: _______Dr. Michael K. Altekruse III_________________________________ DESCRIPTION OF PROCEDURES/ELEMENTS THAT MAY RESULT IN DISCOMFORT OR INCONVENIENCE: There are no anticipated or foreseeable procedures or elements of this project that will result in discomfort or inconvenience. DESCRIPTION OF THE PROCEDURES/ELEMENTS THAT ARE ASSOCIATED WITH FORESEEABLE RISKS: There are no anticipated or foreseeable physical or emotional risks to you. BENEFITS TO THE SUBJECTS OR OTHERS: The research study is intended to identify the effect of specific, predetermined factors on completion or non-completion of the doctoral degree in higher education. This study will be an opportunity for you to provide comments about your experiences in the dissertation process within the Higher Education Doctoral Program. The exploratory nature of this study will enable you the opportunity to elaborate on factors from your personal experience that also affected these outcomes. You will be given the opportunity to address the relevant factors in the following areas: the dissertation experience, advisement experience, personal experience, financial experience, and the employment experience. By examining key factors in the doctorate degree experience, this study will be able to draw some conclusions on how doctoral attrition evolves over time. The rich descriptors afforded by case study research will allow indepth, intensive examination of individual cases in an attempt to develop and understand principles of attrition. Reconstructing and comparing the experiences of ABDs from the point of candidacy to the point of attrition or completion of the program will determine the factors to success. Data from this study may be of even greater benefit in making modifications to existing or future programs. CONFIDENTIALITY OF RESEARCH RECORDS: Confidentiality is guaranteed in this study. The researcher will not release identifiable information regarding the participants at any time. Only the researchers will know your identity. Each returned questionnaire will be coded alpha-numerically for the researcher’s use. Participants will be referred to only by codified information of whether they completed, withdrew, or remained in the Higher Education Doctoral Program at Texas Tech University. A reference list of the coded participants will be secured in a locked box and placed away from the research materials. This data will be destroyed one year after the completion of the study.

133
UNIVERSITY OF NORTH TEXAS COMMITTEE FOR THE PROTECTION OF HUMAN SUBJECTS
RESEARCH CONSENT FORM Subject Name:__________________________________________ Date: _________________ Title of Study: Retention and Attrition of Doctoral Candidates In Higher Education Principal Investigator: ___Eric D. Malmberg_________________________________________ Co-Investigators: _______Dr. Michael K. Altekruse III_________________________________ REVIEW FOR PROTECTION OF PARTICIPANTS: This research study has been reviewed and approved by the UNT Committee for the Protection of Human Subjects (940) 565-3940. RESEARCH SUBJECTS’ RIGHTS: I have read or have had read to me all of the above. Eric D. Malmberg has explained the study to me and answered all of my questions. I have been told the risks or discomforts and possible benefits of the study. I have been told of other choices of treatment available to me. I understand that I do not have to take part in this study, and my refusal to participate will involve no penalty or loss of rights to which I am entitled. I may withdraw at any time without penalty or loss of benefits to which I am entitled. The study personnel can stop my participation at any time if it appears to be harmful to me, if I fail to follow directions for participation in the study, if it is discovered that I do not meet the study requirements, or if the study is canceled. In case there are problems or questions, I have been told I can call Eric D. Malmberg at telephone number: (817) 491-4716. I understand my rights as a research subject, and I voluntarily consent to participate in this study. I understand what the study is about and how and why it is being done. I will receive a signed copy of this consent form.
_____________________________________ _____________________________________ Subject’s Signature Date _____________________________________ _____________________________________ Signature of Witness Date
For the Investigator or Designee: I certify that I have reviewed the contents of this form with the person signing above, who, in my opinion, understood the explanation. I have explained the known benefits and risks of the research. _____________________________________ ____________________________________ Principal Investigator’s Signature Date

134
APPENDIX D
LETTER OF PURPOSE/FOLLOW-UP LETTER OF PURPOSE

135
Eric D. Malmberg 114 Pebble Beach Drive Trophy Club, Texas 76262 August 18, 2000
Dear Colleague: You have been specially selected to participate in a research study, which will examine retention and attrition factors of doctoral candidates and past graduates from the Higher Education Doctoral Program at Texas Tech University from 1991 to 2000. As a member of a relatively small sample of students, your participation is critical to the success of this study.
This project has been reviewed and approved by the Committee for the Protection of Human Subjects, and by the Department of Counseling, Development, and Higher Education at the University of North Texas, as well as the Higher Education Program faculty at Texas Tech University. You are asked to take about fifteen minutes to complete the enclosed self-administered Questionnaire concerning your doctoral experience at Texas Tech University. Your responses to questions concerning factors that affected your program completion or attrition are essential in ensuring project success with a 100% response. Your frank and honest responses to these questions will be very helpful in gaining a better understanding of your experiences and identifying key factors affecting graduate degree progress.
Confidentiality is guaranteed in this study - only the researcher will know your identity. The researcher will not release identifiable information regarding you or any other participants at any time. Each returned questionnaire will be coded alpha-numerically for the researcher’s use. Participants will be referred to only by codified information of whether they completed, withdrew, or remained in the Higher Education Doctoral Program at Texas Tech University. A reference list of the coded participants will be secured in a locked box and placed away from the research materials. This data will be destroyed one year after the completion of the study.
I will greatly appreciate your participation in this study and ask that you (1) complete the questionnaire, (2) sign and date the Research Consent Form (indicating your voluntary consent to participate in this study), and (3) return these items in the enclosed, preaddressed stamped envelope, PRIOR TO SEPTEMBER 10, 2000.
Questions and concerns about this research or its conduct should be addressed to the UNT Institutional Review Board contact telephone number, (940) 565-3940 or myself at:
Eric D. Malmberg Phone: (817) 491-4716 114 Pebble Beach Drive E-mail: [email protected] Trophy Club, Texas 76262 FAX: (817) 491-4875
Thank you for your kind attention to this request. Your opinions and experiences are essential to the successful completion of this study. Additionally, if you would be interested in a follow-up interview, please provide a telephone number or e-mail address for contact. Also, if you would like to receive the results of this study, please provide your preferred mailing address in the return package.
Sincerely, Eric D. Malmberg

136
Eric D. Malmberg 114 Pebble Beach Drive Trophy Club, Texas 76262 August 28, 2000
Dear Colleague:
Recently, I mailed you a questionnaire seeking your opinions about your experiences in the Higher Education Doctoral Program at Texas Tech University. I am grateful that so many surveys have been returned, but as of this date, I have not received your response. If you have already completed and returned the survey, disregard this second request and please accept my sincere thanks for your participation. If you have not completed the survey, please take 15 minutes right now to share your perceptions on these issues. Your opinions are important, and what you have to say about your experiences, are very important For your convenience, a new questionnaire, Research Consent Form, and preaddressed stamped envelope are enclosed. Please return the completed questionnaire and signed Research Consent Form in the preaddressed stamped envelope to me as soon as possible. You may be assured of complete confidentiality. If you do not wish to participate in this project, please return these items (uncompleted) and I will not send any further requests. Questions and concerns about this research or its conduct should be addressed to the UNT Institutional Review Board contact telephone number, (940) 565-3940 or myself at:
Eric D. Malmberg Phone: (817) 491-4716 114 Pebble Beach Drive E-mail: [email protected] Trophy Club, Texas 76262 FAX: (817) 491-4875
Again, thank you for your participation,
Sincerely, Eric D. Malmberg

137
APPENDIX E
REPLICATION AND QUESTIONNAIRE APPROVAL

138
Dr. Lawrence Myers Vice Principal Indian Head Elementary School 4200 Indian Head Highway Indian Head, MD 20640 May 26, 2000
Eric D. Malmberg 114 Pebble Beach Drive Trophy Club, TX 76262 Subject: Dissertation Project Dr. Mr. Malmberg, This letter is in response to your request - You have my permission to use and replicate the design, survey questions (questionnaire), and associated information from my January 1999 dissertation study at the Virginia Polytechnic Institute and State University titled: “Barriers to Completion of the Doctoral Degree in Educational Administration” for your dissertation project at the University of North Texas. It is understood, of course, that full credit, acknowledgement, and recognition for my research and concept development will be given in your project. Additionally, I request that your dissertation abstract and any subsequent published material relating to your study be provided upon completion. If possible, I would also be interested in receiving a full copy of your completed study. Best of luck in your research – I look forward to your completion. Sincerely, (Original Signed) Dr. Lawrence H. Myers

139
APPENDIX F
QUESTIONNAIRE/SURVEY INSTRUMENT

140
QUESTIONNAIRE
Directions: Please read and then respond to the following 20 questions, this should take you about 15 minutes to complete. Some questions may ask you to fill in the blanks, place an (X) or (√) in blank spaces or boxes provided, or circle the best answers. Please select the response that best fits your situation and recollection. 1. What was your age when starting the dissertation portion of your doctoral program?
____21-29 ____30-39 ____40-49 ____50-59 ____60+ 2. What is your gender? ____Male ____Female 3. What is your ethnic background?
____African American ____Asian ____Hispanic ____Native American ____Caucasian ____Other (please specify ____________________________)
4. How would you describe your marital status during the dissertation portion of your doctoral program?
_____Single, never married _____Married _____Separated _____Divorced _____Widowed
5. To what extent did you stay involved with the institutional environment? (i.e., student organizations, activities, and social events) Always Often Sometimes Seldom Never
Please elaborate____________________________________________________________________________________________________ _________________________________________________________________________________________________________________________ _________________________________________________________________________________________________________________________
6. Did you participate in an academic peer support group after completing the qualifying exams? Yes or No
If you answered “yes” – how would you describe this experience?
Outstanding Excellent Good Fair Poor
7. The Higher Education Research Seminar (EDHE 6310) was beneficial to increasing my abilities to conduct independent research.
Strongly Agree Agree Uncertain Disagree Strongly Disagree
8. Did you experience “writer’s block” while formulating or writing any portion of the dissertation? ................... Yes or No
If so, how were you able to overcome it?____________________________________________________________________________________ _________________________________________________________________________________________________________________________ _________________________________________________________________________________________________________________________
9. How did each of the following factors influence your degree progress?
Positively Negatively N/A Positively Negatively N/A _____ _____ ___ Academic Advisement (a) _____ _____ ___ Academic Mentoring (b) _____ _____ ___ Age (c) _____ _____ ___ Anxiety (d) _____ _____ ___ Committee (other than Chair) (e) _____ _____ ___ Committee Chair (f) _____ _____ ___ Employment (g) _____ _____ ___ Family Obligations (h) _____ _____ ___ Family Support (i) _____ _____ ___ Finance Assistance (j) _____ _____ ___ Gender (k) _____ _____ ___ Involvement within the University (l) _____ _____ ___ Motivation (m) _____ _____ ___ Other Obligations (n) _____ _____ ___ Perfectionism (o) _____ _____ ___ Persistence (p) _____ _____ ___ Procrastination (q) _____ _____ ___ Program Requirements (r) _____ _____ ___ Race (s) _____ _____ ___ Research Skills (t) _____ _____ ___ Stress (u) _____ _____ ___ Support Groups (outside academia) (v) _____ _____ ___ Support Groups (in academia) (w) _____ _____ ___ Writing Skills (x) _____ _____ ___ Time-to-Degree (y) _____ _____ ___ Topic Selection (z)
10. Were changes made to your dissertation committee (chair and members) after completing the qualifying exams? Yes or No
If changes were made, who initiated them and why? _________________________________________________________________________ _________________________________________________________________________________________________________________________ _________________________________________________________________________________________________________________________ _________________________________________________________________________________________________________________________

141
11. My relationship with the dissertation committee chair could best be described as:
Outstanding Excellent Good Fair Poor
What are some examples of how your chair helped or hindered you? ___________________________________________________________ _________________________________________________________________________________________________________________________ _________________________________________________________________________________________________________________________
12. My relationship with the dissertation committee could best be described as:
Outstanding Excellent Good Fair Poor
What are some examples of how your committee helped or hindered you?______________________________________________________ _________________________________________________________________________________________________________________________ _________________________________________________________________________________________________________________________
13. Which of the following employment, financial, or personal factors do you feel adversely affected your dissertation progress? (Please
check (√ ) the appropriate responses)
_____Change of Income (a) _____Demands of Job (f) _____Lost Job/Employment (k) _____Received Promotion (o) _____Retired (b) _____Work Related Travel (g) _____Commute to University (l) _____Financial Problems (p) _____Lost Financial Aid (c) _____Cost of Doctorate (h) _____Personal Health/Injury (m) _____Marriage (q) _____Divorce/Separation (d) _____Family Obligations (i) _____Death of Family Member (n) _____Family Member Health/Injury (r) _____Birth of Child (e) _____Stress/Anxiety (j) _____Other (please specify) (s)__________________________________
How did this impede your progress?________________________________________________________________________________________ _________________________________________________________________________________________________________________________ _________________________________________________________________________________________________________________________
14. In general, was your family supportive of your study for the doctorate? Yes or No 15. To what extent did family commitments take time away from your doctoral studies? (Please circle the appropriate response)
Always Often Sometimes Seldom Never
Please elaborate____________________________________________________________________________________________________ _________________________________________________________________________________________________________________________ _________________________________________________________________________________________________________________________
16. To what extent did personal obligations take time away from your doctoral studies? (Please circle the appropriate response)
Always Often Sometimes Seldom Never
Please elaborate____________________________________________________________________________________________________ _________________________________________________________________________________________________________________________ _________________________________________________________________________________________________________________________
17. What percentages of the following financial options were used to fund your doctorial studies? (i.e., 15%, 20%, 50%,, etc.)
_____Part-time Employment _____Grant(s) _____Financial Aid _____Gift(s) _____Personal Loan(s) _____Full-time Employment _____Savings _____Scholarship(s) _____Other (please specify) ________________________
18. If employed, was your employer supportive of your completing your degree? Yes or No 19. What would have made your doctoral experience a better one? _________________________________________________________
_________________________________________________________________________________________________________________________ _________________________________________________________________________________________________________________________ _________________________________________________________________________________________________________________________
20. What other factors (positive or negative) affected your degree progress that have not been covered in the previous questions?________ _________________________________________________________________________________________________________________________ _________________________________________________________________________________________________________________________ _________________________________________________________________________________________________________________________
THANK YOU FOR PARTICIPATING IN THIS STUDY. PLEASE MAIL THE COMPLETED QUESTIONNAIRE BEFORE SEPTEMBER 10TH
Eric D. Malmberg 114 Pebble Beach Drive Trophy Club, TX 76262

142
REFERENCES
Abedi, J., & Benkin, E. (1987). The effects of students’ academic, financial, and demographic variables on time to the doctorate. Research in Higher Education, 27(1), 3-14.
Aragon, G. J. (1999). An inquiry into the completion of the doctorate by American
women of Mexican ancestry [Abstract]. Retrieved from ProQuest File database (Dissertation Abstracts, CD-ROM, Item 9911101)
Aronson, J. A., Bennett, D., Moore, L. V., & Stoll, N. C. (1985). Student personnel
dissertation topics, 1979 to 1983. Journal of College Student Personnel, 26(3), 262-264. Association for Support of Graduate Students. (2000a). Back to dissertation basics.
Dissertation News 5, 1994. Retrieved May 31, 2000 from the World Wide Web: http://www.asgs.org/DissBscs.htm
Association for Support of Graduate Students. (2000b). Dissertation advisor user’s
manual. Dissertation News 8, 1993. Retrieved May 6, 2000 from the World Wide Web: http://www.asgs.org/AdvManl.htm
Association for Support of Graduate Students. (2000c). Dressing your dissertation
for success. Dissertation News 4, 1993. Retrieved May 6, 2000 from the World Wide Web: http://www.asgs.org/Dr_Succ.htm
Astin, A. W. (1971). The college environment. Washington, DC: American Council
on Education. Astin, A. W. (1975). Preventing students from dropping out. San Francisco: Jossey-
Bass. Astin, A. W. (1985). Achieving educational excellence: A critical assessment of
priorities and practices in higher education. San Francisco: Jossey-Bass. Bair, C. R. (1999). Doctoral student attrition and persistence a meta-synthesis
[Abstract]. Retrieved from ProQuest File database (Dissertation Abstracts, CD-ROM, Item 9917754)
Bako-Okolo, S. (1996). The effects of selected variables on the research self-efficacy
of doctoral candidates in the college of education at the University of Akron [Abstract]. Retrieved from ProQuest File database (Dissertation Abstracts, CD-ROM, Item 9623204)

143
Ballew, R. L. (1997). The experience of Native American women obtaining doctoral degrees in psychology at traditional American universities [Abstract]. Retrieved from ProQuest File database (Dissertation Abstracts, CD-ROM, Item 9708985)
Bargar, R. R., & Duncan, J. K. (1982). Cultivating creative endeavor in doctoral
research. Journal of Higher Education, 53(1), 1-31. Bargar, R. R., & Mayo-Chamberlain, J. (1983). Advisor and advisee issues in
doctoral education. Journal of Higher Education, 54, 407-432. Barnett, S. (1982). New brains for old bodies: The impact of emotional and physical
stress during the PhD process. In S. I. Vartuli (Ed.), The PhD experience: A woman’s point of view (pp. 61-69). New York: Praeger.
Bauer, W. C. (1997). Pursuing the Ph.D.: Importance of structure, goal-setting, and
advising practices in the completion of the doctoral dissertation [Abstract]. Retrieved from ProQuest File database (Dissertation Abstracts, CD-ROM, Item 9737358)
Beeler, K. J. (1993, June 10-12). Shaping graduate education’s future: Improving the
doctoral experience. Position paper presented at the Annual Conference of Canadian Society for the Study of Higher Education, Ottawa, Ontario, Canada.
Berelson, B. (1960). Graduate education in the United States. New York: McGraw-
Hill. Berg, H. M., & Ferber, M. A. (1983). Men and women graduate students: Who
succeeds and why? Journal of Higher Education, 54(6), 629-648. Berry, M. D. (1994). Perceptions of educational administration professors about
factors which affect doctoral attrition [Abstract]. Retrieved from ProQuest File database (Dissertation Abstracts, CD-ROM, Item 9401916)
Bloom, L. Z. (1981, March 26-28). Why graduate students can’t write: Implications
of research on writing anxiety for graduate education. Paper presented at the Annual Meeting of the Conference on College Composition and Communication, Dallas, TX.
Bok, D. (1986). Higher learning. Cambridge: Harvard University Press. Bowen, W. G., & Rudenstine, N. L. (1992). In pursuit of the Ph.D. Princeton, NJ:
Princeton University Press. Boydstun, R. L. (1996). Time to the doctorate: A study of the trends in an analysis of
the factors affecting the time required to complete the doctorate at the University of Texas at Austin [Abstract]. Retrieved from ProQuest File database (Dissertation Abstracts, CD-ROM, Item 9633094)

144
Briggs, C. L. (1986). Learning how to ask: A sociolinguistic appraisal of the role of the interview in social science research. New York: Cambridge University Press.
Cabrera, A. F., Castañeda, M. B., Nora, A., & Hengstler, D. (1992). The
convergence between two theories of college persistence. Journal of Higher Education, 63(2), 143-164.
Cahill, G. (1999). A doctoral dropout’s quest for closure. The Chronicle of Higher
Education. Opinion & Arts, B6. Retrieved May 10, 2000 from the World Wide Web: http://chronicle.com/weekly/v46/i11/11b00601.htm
Campbell, R. B. (1992). A study of the completion and non-completion of the doctor
of education degree in educational leadership at the university of Delaware [Abstract]. Retrieved from ProQuest File database (Dissertation Abstracts, CD-ROM, Item 9232596)
Chambers, M. M. (1960). Selection, definition, and delimitation of a doctoral
research problem. Kappan, 42(2), 71-73. Cheatham, T. R., Edwards, J. R., & Erickson, K. V. (1982). The doctoral dissertation
in speech communications: An inventory of attitudes and experiences. Communication Education, 31, 315-323.
The Chronicle of Higher Education. (1999). The Nation. 1999-2000 Almanac Issue. Civian, J. T. (1990). Examining duration of doctoral study using proportional hazard
models [Abstract]. Retrieved from ProQuest File database (Dissertation Abstracts, CD-ROM, Item 9032419)
Cohen, M. R. (1998). The pause that represses: The experience of working through
writer’s block during the dissertation writing process (Doctoral dissertation, Massachusetts School of Professional Psychology, 1998). Dissertation Abstracts International, 60(05), 1448.
Cooke, D. K., Sims, R. L, & Peyrefitte, J. (1995). The relationship between graduate
student attitudes and attrition. Journal of Psychology, 129(6), 677-688. Retrieved May 25, 2000 from the World Wide Web: http://www.texshare.edu/uta/ovidweb.cgi
Cooper, B. C. (1997). Faculty characteristics that are associated with the retention of
doctoral students [Abstract]. Retrieved from ProQuest File database (Dissertation Abstracts, CD-ROM, Item 9706321)
Council of Graduate Schools in the United States. (1977). The doctor of philosophy degree: A political statement. Washington, DC: Author.
145
Cuetara, J., & LeCapitaine, J. (1991). The relationship between dissertation writing experiences and doctoral training environments. Education, 112(2), 233-241.
Davis, G. B., & Parker, C. A. (1997). Writing the doctoral dissertation: A systematic
approach (2nd ed). Hauppauge, NY: Barron’s Educational Series. Dinham, S., & Scott, C. (1999a). The doctorate: Talking about the degree. Retrieved
May 14, 2000 from the World Wide Web: http://www.nepean.uws.edu.au/teaching/staff/ sd/doct/doct.html
Dinham, S. & Scott, C. (1999b, July 12-15). The waste of a PhD: The experience of
disseminating the results of post graduate research. Paper presented to the Higher Education Research and Development Society of Australasia, National Conference, Melbourne.
Dixon, R. M, Jr., & Peltier, G. L. (1991). Improving candidates’ confidence with
statistics in experimental doctoral research. Education, 112(1), 119-123. Dorn, S. M., Papalewis, R., & Brown, R. (1995). Educators earning their doctorates:
Doctoral student perceptions regarding cohesiveness and persistence. Education, 116(2), 305-314.
Emerson, J. (1998). An investigation of the characteristics that facilitate or impede
completion of inquiry, a nontraditional organized doctoral program in educational administration (Doctoral dissertation, Columbia University Teachers College, 1998). Dissertation Abstracts International, 59(07), 2264.
Faghihi, F., Rakow, E. A., & Ethington, C. (1999, April 19-23). A study of factors
related to dissertation progress among doctoral candidates: Focus on students’ research self-efficacy as a result of their research training and experiences. Paper presented at the Annual Meeting of the American Educational Research Association, Montreal, Quebec, Canada.
Faghihi, F., & Ethington, C. A. (1996, October 31- November 3). The effect of
doctoral students’ background, involvement, and perception of growth on their intention to persist. Paper presented at the Annual Meeting of the American Educational Research Association, Memphis, TN.
Filippelli, L. A. (1997). The mentoring of male and female scientists during their
doctoral studies[Abstract]. Retrieved from ProQuest File database (Dissertation Abstracts, CD-ROM, Item 9730237)
Fitzpatrick, J., Secrist, J., & Wright, D. J. (1998). Secrets for a successful
dissertation. Thousand Oaks, CA: Sage.

146
Frasier, E. R. M. (1994). Persistence of doctoral candidates in the college of education, University of Missouri-Columbia [Abstract]. Retrieved from ProQuest File database (Dissertation Abstracts, CD-ROM, Item 9412483)
Garcia, H. M. (1997). Factors influencing academic attainment for Hispanic-
American women Ph.D. recipients [Abstract]. Retrieved from ProQuest File database (Dissertation Abstracts, CD-ROM, Item 9720591)
Gardner, D. C., & Beatty, G. J. (1980). Dissertation proposal guidebook; How to
prepare a research proposal and get it accepted. Springfield, IL: Thomas. Gell, S. K. (1995). Factors associated with completion or non-completion of doctoral
dissertations: Self direction and advisor/advisee congruity (Doctoral dissertation, University of Maryland College Park, 1996). Dissertation Abstracts International, 56(11), 4292.
Germeroth, D. (1991). Lonely days and lonely nights: Completing the doctoral
dissertation. ACA Bulletin, 76, 60-89. Gillingham, L., Seneca, J. J., & Taussig, M. K. (1991). The determinants of progress
to the doctoral degree. Research in Higher Education, 32(4), 449-468. Girves, J. E., & Wemmerus, V. (1988). Developing a model of graduate student
degree progress. Journal of Higher Education, 59(2), 163-189. Golde, C. M. (1994, November 10-13). Student descriptions of the doctoral student
attrition process. Paper presented at the Annual Meeting of the Association for the Study of Higher education, Tucson, AZ.
Golde, C. M. (1997). How departmental contextual factors shape doctoral student
attrition [Abstract]. Retrieved from ProQuest File database (Dissertation Abstracts, CD-ROM, Item 9702896)
Gonzalez, A. O. (1997). Graduation rates and times to completion for doctoral
programs in Canadian universities [Abstract]. Retrieved from ProQuest File database (Dissertation Abstracts, CD-ROM, Item NN11730)
Gordon, D. J. (1999). African-American women in higher education: Barriers
African-American women overcome in achieving the ultimate degree [Abstract]. Retrieved from ProQuest File database (Dissertation Abstracts, CD-ROM, Item 9928053)
Goulden, N. R. (1991). A report of the perceptions of communication and
relationships during the dissertation process by speech communication doctoral advisors and advisees. ACA Bulletin, 76, 39-48.

147
Graves, N. (1997). Problems of supervision. In N. Graves & V. Varma (Eds.), Working for a doctorate: A guide for the humanities and social sciences (pp. 80-95). New York: Routledge.
Graves, N., & Varma, V. (Eds.). (1997). Working for a doctorate: A guide for the
humanities and social sciences. New York: Routledge. Green, K. E., & Kluever, R. C. (1997, March 24-28). The dissertation barrier scale.
Paper presented at the Annual Meeting of the American Educational Research Association, Chicago.
Hales, K. S. E. (1998). The relationship between personality type, life events, and
completion of the doctorate degree (Doctoral dissertation, Texas A&M University-Commerce, 1998). Dissertation Abstracts International, 59(04), 1077.
Hamilton, C. A. (1998). Factors that influenced the persistence of minority doctoral
students at northeast research university [Abstract]. Retrieved from ProQuest File database (Dissertation Abstracts, CD-ROM, Item 9825794)
Hanson, T. L. (1992, October 29-November 1). The ABD phenomenon: The “at
risk” population in higher education and the discipline of communications. Paper presented at the Annual Meeting of the Speech Communication Association (79th), Chicago.
Harbold, E. A. (1988). Perceived developmental issues of doctoral students in
educational administration [Abstract]. Retrieved from ProQuest File database (Dissertation Abstracts, CD-ROM, Item 8824514)
Harmon, L. R. (1978). A century of doctorates: Data analysis of growth and change.
Washington, DC: National Academy of Sciences Printing & Publishing. Harrison, E. S. W. (1997). Black doctoral graduates from a predominantly White
university [Abstract]. Retrieved from ProQuest File database (Dissertation Abstracts, CD-ROM, Item 9735322)
Harrison, J. L. (1998). American Indians in higher education: A case study of
doctoral candidates at Montana State University [Abstract]. Retrieved from ProQuest File database (Dissertation Abstracts, CD-ROM, Item 9816314)
Heiss, A. M. (1967). Berkeley doctoral students appraise their academic programs.
Educational Record, 48(1), 30-44. Heiss, A. M. (1970). Challenge to graduate schools. San Francisco: Jossey-Bass.

148
Huguley, S. (1989). An investigation of obstacles to completion of the dissertation and of doctoral student attitudes towards the dissertation experience (Doctoral dissertation, Pepperdine University, 1989). Dissertation Abstracts International, 50(01), 372.
Isaac, P. D., Koenigsknecht, R. A., Malaney, G. D., & Karras, J. E. (1989). Factors
related to doctoral dissertation topic selection. Research in Higher Education, 30(4), 357-373.
Isaac, P. D., Quinlan, S. V., & Walker, M. M. (1992) Faculty perceptions of the
doctoral dissertation. Journal of Higher Education, 63(3), 241-268. Isaac, S., & Michael, W. B. (1995). Handbook in research and evaluation (3rd ed.).
San Diego, CA: Educational and Industrial Testing Services. Jacks, P., Chubin, D. E., Porter, A. L., & Connolly, T. (1983). The ABCs of ABDs:
A study of incomplete doctorates. Improving College & University Teaching, 31(2), 74-83.
Karolyi, M. S. (1994). All but the dissertation: Perceptions of ABD level attrition
among faculty, alumni, and ABDs in a graduate school of education at a large, public Midwestern university [Abstract]. Retrieved from ProQuest File database (Dissertation Abstracts, CD-ROM, Item 9405927)
Kerlin, R. (1999). Breaking the silence: Toward a theory of women’s doctoral
persistence [Abstract]. Retrieved from ProQuest File database (Dissertation Abstracts, CD-ROM, Item NQ32750)
Kluever, R. C. (1997a, March 24-28). Dissertation completers and non-completers:
An analysis of psycho-social variables. Paper presented at the Annual Meeting of the American Educational Research Association, Chicago.
Kluever, R. C. (1997b). Students’ attitudes toward the responsibilities and barriers in
doctoral study. New Directions for Higher Education, 25(3), 47-56. Kluever, R. C., & Green, K. E. (1998). The responsibility scale: A research note on
dissertation completion. Educational & Psychological Measurement, 58(3), 520-531. Retrieved May 25, 2000 from the World Wide Web: http://www.texshare.edu/uta/ovidweb.cgi
LaPidus, J. B., & Mishkin, B. (1990). Values and ethics in the graduate education of
scientists. In W. W. May (Ed.), Ethics and higher education (pp. 283-298). New York: Macmillian.
149
Lawton, D. (1997). How to succeed in postgraduate study. In N. Graves & V. Varma (Eds.), Working for a doctorate: A guide for the humanities and social sciences (pp. 8-17). New York: Routledge.
Leatherman, C. (2000). A new push for ABDs to cross the finish line. The Chronicle
of Higher Education, 46(29), A18-19. Lee, D. S., & Cayer, N. J. (1987). Recruitment of minority students for public
administration education. Public Administration Review, 47, 329-335. Lees, K. A. (1997). Understanding how female doctoral students’ interactions with
their chairpersons during the dissertation process affect doctoral persistence [Abstract]. Retrieved from ProQuest File database (Dissertation Abstracts, CD-ROM, Item 9722314)
Lenz K. S. (1995). A multiple case study examining factors affecting the completion
of the doctoral dissertation by academically able women [Abstract]. Retrieved from ProQuest File database (Dissertation Abstracts, CD-ROM, Item 9511965)
Levi, E. H. (1969). Point of view: Talks on education. Chicago: University of
Chicago Press. Loo, C. M., & Rolison, G. (1995). Alienation of ethnic minority students at a
predominantly White university. In D. K. Cooke, R. L. Sims, & J. Peyrefitte, The relationship between graduate student attitudes and attrition. Journal of Psychology, 129(6), 677-688. Retrieved May 25, 2000 from the World Wide Web: http://www.texshare.edu/uta/ovidweb.cgi
Lovitts, B. E. (1997a). Dissertation examines attrition rate in Ph.D. programs. The
Chronicle of Higher Education. Footnotes, March 14, 1997. Retrieved June 2, 2000 from the World Wide Web: http://chronicle.com/che-data/articles.dir/art-43.dir/issues-27.dir/27a01002.htm
Lovitts, B. E. (1997b). Leaving the ivory tower: A sociological analysis of the causes
of departure from doctoral study [Abstract]. Retrieved from ProQuest File database (Dissertation Abstracts, CD-ROM, Item 9718277)
Lunneborg, C., & Lunneborg, P. (1973). Doctoral study attrition in psychology.
Research in Higher Education, 1, 379-388. Madsen, D. (1992). Successful dissertations and theses. San Francisco: Jossey-Bass. Magner, D. K. (1999). Universities see slight increase in number of doctorates
awarded. The Chronicle of Higher Education. The Faculty, November 26, 1999. Retrieved June 6, 2000 from the World Wide Web: http://chronicle.com/weekly/v46/i14/14a01801.htm

150
Malaney, G. D. (1988). Graduate education as an area of research in the field of higher education. In J. C. Smart (Ed.), Higher education: Handbook of theory and research, (Vol. 4, pp. 397-454). New York: Agathon.
Malaney, G. D. (1995). Why students pursue graduate education, how they find out
about a program, and why they apply to a specific school. In D. K. Cooke, R. L. Sims, & J. Peyrefitte, The relationship between graduate student attitudes and attrition. Journal of Psychology, 129(6), 677-688.
Mariano, C. M. (1993). A study of Ed.Ds,, Ph.Ds, and ABDs in educational
administration [Abstract]. Retrieved from ProQuest File database (Dissertation Abstracts, CD-ROM, Item 9329287)
May, W. W. (1990). Ethics and higher education. New York: Macmillan. McFarland, R. T. (1995). Faculty perspectives of doctoral persistence within arts and
science disciplines [Abstract]. Retrieved from ProQuest File database (Dissertation Abstracts, CD-ROM, Item 9620217)
McGhee, M. P. (1993). Attitudes towards African-American doctoral students
among college of education faculty: A national study [Abstract]. Retrieved from ProQuest File database (Dissertation Abstracts, CD-ROM, Item 9325212)
McMillan, J. H. (1996). Educational research: Fundamentals for the consumer (2nd
ed.). New York: Harper Collins College. Mellon Institute of Sciences and Carnegie Institute of Technology, Graduate Studies.
(1970). Pittsburgh, PA: Carnegie-Mellon University Press. Middleton, E. J., Mason, E. J., Stilwell, W. E., & Parker, W. C. (1988). A model for
recruitment and retention of minority students in teacher preparation programs. Journal of Teacher Education, 39, 14-18.
Monaghan, P. (1989). Nothing to do with brightness. The Chronicle of Higher
Education. December 6, 1989. Retrieved May 10, 2000 from the World Wide Web: http://chronicle.com/chronicle/archive.htm
Monsour, M., & Corman, S. (1991). Social task function of the dissertation partner:
One way of avoiding terminal ABD status. Communication Education, 40(2), 180-186. Mooney, J. D. (1968). Attrition among Ph.D. candidates: An analysis of a cohort of
recent Woodrow Wilson Fellows. Journal of Human Resources, 3, 47-62.

151
Muskopf, S. J. (1998). Women in higher education administration: An analysis from 1983-1998 [Abstract]. Retrieved from ProQuest File database (Dissertation Abstracts, CD-ROM, Item 9841442)
Myers, L. H. (1999). Barriers to completion of the doctoral degree in educational
administration [Dissertation], Virginia Polytechnic Institute and State University. VT ETD Collection. Retrieved March 15, 2000 from the World Wide Web: http://scholar.lib.vt.edu/thesis/available/etd-041699-125349
Myers, R. S. (1999). Doctoral time-to-degree: An analysis of departmental variation
[Abstract]. Retrieved from ProQuest File database (Dissertation Abstracts, CD-ROM, Item 9930137)
National Science Foundation, NSF. (1999). Completing the Ph.D.: What faculty,
departments, and students can do. American Political Science Association, 32(2), 266. Nielson, D. (1998). Student involvement in graduate education: Comparison of
African American and White students [Abstract]. Retrieved from ProQuest File database (Dissertation Abstracts, CD-ROM, Item 9805706)
O’Bara, C. C. (1993). Why some finish and why some don’t: Factors affecting PhD
completion (Doctoral dissertation, The Claremont Graduate School, 1993). Dissertation Abstracts International, 54(06), 2070.
Olson, W. C. (1960). What is research? In M. M. Chambers, Selection, definition,
and delimitation of a doctoral research problem. Kappan, 42(2), 71-73. Pascarella, E. T., & Terenzini, P. T. (1991). How college affects students: Findings
and insights from twenty years of research. San Francisco: Jossey-Bass. Phillips, D. G. (1996). A grounded theory model of adult doctoral student
progression [Abstract]. Retrieved from ProQuest File database (Dissertation Abstracts, CD-ROM, Item 9603641)
Pinson, C. G. (1997). Academic speed bumps: Time to completion of the dissertation
[Dissertation], Virginia Polytechnic Institute and State University. VT ETD Collection. Retrieved May 6, 2000 from the World Wide Web: http://scholar.lib.vt.edu/thesis/available/etd-2316162539751141
Porter, A. L., & Wolfle, D. (1991). Utility of the doctoral dissertation. In J. Cuetara
& J. LeCapitaine, The relationship between dissertation writing experiences and doctoral training environments. Education, 112(2), 233-241.
152
Powles, M. (1999). How’s the thesis going? In S. Dinham & C. Scott (1999), The doctorate: Talking about the degree. Retrieved May 14, 2000 from the World Wide Web: http://www.nepean.uws.edu.au/teaching/staff/sd/doct/doct.html
Quezada, R, and others (1984). The Hispanic woman graduate student: Barriers to
mentoring in higher education. Texas Tech Journal of Education, 11(3), 235-241. Quinn, E. L. C. (1992). Doctoral student retention and selected personal factors
[Abstract]. Retrieved from ProQuest File database (Dissertation Abstracts, CD-ROM, Item 9206183)
Ramos, M. G., Jr. (1995). Understanding the ABD (all but dissertation) doctoral
candidate: A phenomenological approach [Abstract]. Retrieved from ProQuest File database (Dissertation Abstracts, CD-ROM, Item 9508680)
Rogers, C. R. (1969). Freedom to learn: A view of what education might become.
Columbus, OH: Charles E. Merrill. Sanderson, A., Dugoni, B., Hoffer, T., & Selfa, L. (1999). Doctorate recipients from
United States Universities: Summary report 1998. Chicago: National Opinion Research Center. (The report gives the results of data collected in the Survey of Earned Doctorates, conducted for five Federal agencies, NSF, NIH, NEH, USED, and USDA, by NORC.)
Schwarz, S. (1998). Students’ perceptions of the role of the dissertation chair in time
to complete the doctoral dissertation [Abstract]. Retrieved from ProQuest File database (Dissertation Abstracts, CD-ROM, Item 9802746)
Scrubb, M. M. (1998). An examination of the doctoral student stress survey (DSSS)
as an instrument for measuring the effects of stress as perceived by doctoral students in a distance learning university [Abstract]. Retrieved from ProQuest File database (Dissertation Abstracts, CD-ROM, Item 9894458)
Sigafus, B. (1998, April 13-17). The creation of ABDs: A turning point in
educational doctoral programs? Paper presented at the Annual Meeting of the American Educational Research Association, San Diego, CA.
Simpson, A. E. (1986). Hurdling the dissertation barrier: The library and the needs of
the A.B.D. Behavioral & Social Sciences Librarian, 6(1-2), 111-129. Smart, J. C. (1988). Higher education: Handbook of theory and research (Vol. 4).
New York: Agathon. Smith, B. D. (1982). Taking the giant step: Writing the dissertation. In S. I. Vartuli
(Ed.), The PhD experience: A woman’s point of view (pp. 35-44). New York: Praeger.

153
Solorzano, D. G. (1993). The road to the doctorate for California’s Chicanas and Chicanos: A study of Ford foundation minority fellows. California Policy Seminar Brief, 5(16). Berkeley: University of California at Berkeley Press.
Stalker, A. B. (1991). Misery loves company and other important functions of a
dissertation support group. ACA Bulletin, 76, 56-59. Steinberg, D. (1981). How to complete and survive a doctoral dissertation. New
York: St. Martin’s Press. Suen, H. K. (1995). Alienation and attrition of Black college students on
predominantly White campuses. In D. K. Cooke, R. L. Sims, & J. Peyrefitte, The relationship between graduate student attitudes and attrition. Journal of Psychology, 129(6), 677-688. Retrieved May 25, 2000 from the World Wide Web: http://www.texshare.edu/uta/ovidweb.cgi
Texas Tech University. (2000). Graduate catalog 2000-2001. Lubbock: Texas Tech
University, Office of Official Publications. Tinto, V. (1987). Leaving college: Rethinking the causes and cures of student
attrition. Chicago: University of Chicago Press. Tluczek, J. L. (1995). Obstacles and attitudes affecting graduate persistence in
completing the doctoral dissertation (Doctoral dissertation, Wayne State University, 1995). Dissertation Abstracts International, 56(08), 1683.
University of North Texas (UNT). Program in higher education: Follow up survey
1997. Denton: Author. Retrieved June 13, 2000 from the World Wide Web: http://unt.edu/highered/survey.htm
Upcraft, M. L., & Schuh, J. H. (1996). Assessment in student affairs: A practitioners
guide. San Francisco: Jossey-Bass. U. S. Department of Education. (1999). National Center for Educational Statistics
(NCES). Digest of Educational Statistics, chap 3, Postsecondary Education. Retrieved June 2, 2000 from the World Wide Web: http://nces.ed.gov/pubs99/digest98/d98t253.html
Vartuli, S. I. (1982). The PhD experience: A woman’s point of view. New York:
Praeger. Wahlstrom, M. W. (1997). Time to completion of doctorate: Implications for Ph.D.
and Ed.D. programs in education [Abstract]. Retrieved from ProQuest File database (Dissertation Abstracts, CD-ROM, Item NN11656)
154
Weil, R. L. (1990). Factors affecting doctoral students’ time to degree [Abstract]. Retrieved from ProQuest File database (Dissertation Abstracts, CD-ROM, Item 9025682)
Wells, M. C. (1982). Grandma! What big plans you’ve got!: The older woman’s PhD
experience. In S. I. Vartuli (Ed.), The PhD experience: A woman’s point of view (pp. 105-114). New York: Praeger.
Whitman, N. A., Spendlove, D. C., & Clark, C. H. (1986). Increasing students’
learning: A faculty guide to reducing stress among students. Executive summary. (ASHE-Eric Higher Education Report 4). Washington, DC: Association for the Study of Higher Education.
Wiemers, R. W. (1999). Pre-enrollment goals v. post-program outcomes of doctoral
students in the college of education at Tennessee State University [Abstract]. Retrieved from ProQuest File database (Dissertation Abstracts, CD-ROM, Item 9907865)
Wilgers, C. L. (1992). Motivational characteristics of doctoral students majoring in
education: A qualitative study (Doctoral dissertation, University of Northern Colorado, 1993). Dissertation Abstracts International, 53(07), 2270.
Wilson, K. M. (1965). Of time and the doctorate: Report of an inquiry into the
duration of doctoral study. Atlanta, GA: Southern Regional Education Board. Wright, L. M. (1991). Full time teaching and the ABD phenomenon. ACA Bulletin,
76, 49-55.