Embed Size (px)
Citation preview

Running Head: Measuring Agenda Setting Power
On Measuring Legislative Agenda Setting Power
Jeffery A. JenkinsDepartment of PoliticsUniversity of [email protected]
Nathan W. MonroeDepartment of Political ScienceUniversity of California, Merced
Word Count: 9,950
Abstract
We propose a typology for measuring agenda setting success and failure in a legislative context. Our typology goes beyond the most commonly used measure (“rolls”) and includes the full range of agenda setting outcomes – rolls (opposing a proposal that subsequently passes), as well as “blocks” (opposing a proposal that is subsequently defeated), “successes” (supporting a proposal that subsequently passes), and “disappointments” (supporting a proposal that is subsequently defeated) – and thus takes into account instances of both positive and negative agenda power. We discuss these measures, and the theoretical questions surrounding them, with the hope of providing some guidance to scholars of the U.S. House, as well as those analyzing agenda power in other legislatures. As a first step in this direction, we explore variation in agenda setting measures in 85 American state legislative chambers, the Mexican Chamber of Deputies, and the Canadian House of Commons.
Keywords: Agenda power, agenda setting, measurement, legislature, Congress
Files and data to replicate the analyses in this article are available in the AJPS Data Archive on Dataverse (http://thedata.harvard.edu/dvn/dv/ajps). An earlier version of this paper was presented at the 2013 annual meeting of the American Political Science Association, Chicago, IL; and the 2013 annual meeting of the Midwest Political Science Association, Chicago, IL. We thank Jeff Ladewig and Jason Roberts for helpful comments and Sarah Anzia, Molly Jackman, Eric Magar, and Jean-François Godbout for access to various roll-call datasets.

Measuring Agenda Setting Power
Introduction
As studies of legislative agenda setting originated with the U.S. House in mind and
focused primarily on the majority party’s ability to exercise negative agenda control (i.e., to
prevent consideration of proposals), the literature has tended to focus on “rolls” (when an agenda
setter opposes a proposal that nonetheless passes) as the appropriate measure of agenda power.1
But rolls are not the whole story when it comes to assessing agenda power, and in fact rolls may
not always be the most appropriate or useful measure for investigating negative agenda power.
This overly narrow measurement strategy has consequences well beyond scholarship on
the U.S. House. Recent years have seen a significant expansion of agenda-centric theories of
legislative power, as scholars have begun to adopt and adapt the insights of research on the
House to explain decision making in the Senate (Campbell, Cox, and McCubbins 2002; Chiou
and Rothenberg 2003; Gailmard and Jenkins 2007; Koger 2010; Den Hartog and Monroe 2011),
American state legislatures (Aldrich and Battista 2002; Wright and Schaffner 2002; Gamm and
Kousser 2010; Cox, Kousser, and McCubbins 2010; Anzia and Jackman 2013; Jackman 2014),
and legislative bodies around the world (Amorim Neto, Cox, and McCubbins 2003; Jones and
Hwang 2005; Chandler, Cox, and McCubbins 2006; Cox, McCubbins, and Heller 2008; Calvo
and Sagarzazu 2011; Crisp, Desposato, and Kanthak 2011). But if the agenda setting institutions
in these legislative bodies do not map well onto those in the U.S. House, the transition from
theory to measure will suffer. Moreover, where theoretical innovation is sometimes hampered
by the anticipation of measurement limitations, the over-focus on rolls as the measure of agenda
control stunts the growth of agenda setting theories beyond the U.S. House.
1 Note that we use the terms “agenda control” and “agenda power” throughout the paper, but not interchangeably. Agenda power is the abstract ability to affect the agenda, whether actualized or not. Agenda control is the manifested results of actual attempts to affect the agenda.
1

Measuring Agenda Setting Power
In this paper, we seek to loosen that restraint by proposing a typology for measuring
legislative agenda setting power. Our typology includes the full range of agenda setting
outcomes – rolls, as well as “blocks” (when an agenda setter opposes a proposal that is
subsequently defeated), “successes” (when an agenda setter supports a proposal that
subsequently passes), and “disappointments” (when an agenda setter supports a proposal that is
subsequently defeated) – and thus takes into account instances of both positive and negative
agenda power. Our key motivation is to provide more nuance in measuring agenda power, and
to suggest more points of connection between theories and measures of legislative agenda setting
in various forms. While we hope to offer some guidance to scholars taking another look at the
House, our primary goal is to set the stage for more appropriate analyses of agenda power in
other legislatures – both in the United States (in the Senate and at the state level) and beyond.
The paper proceeds as follows. We first describe our measurement typology in more
detail, and then consider how these measures could be used as counts versus rates – and how
subsequent empirical results could be sensitive to such decisions. We then discuss (a) how
measures follow from spatial theories of agenda setting (using rolls and the “cartel agenda
model” as our example) and (b) how and when different measures of negative and positive
agenda power are most theoretically appropriate. We conclude by exploring variation in agenda
setting measures in 85 American state legislative chambers, as well as in the Mexican Chamber
of Deputies and the Canadian House of Commons, and then performing comparative static tests
on the state-legislature data based on propositions derived in earlier theoretical sections.
Moving Beyond Rolls
Our typology of agenda setting outcomes is illustrated in Table 1. The rows and columns
in this simple two-by-two table provide the two pieces of information necessary to construct a
2

Measuring Agenda Setting Power
measure of agenda setting power: (1) whether the relevant agenda setter supports or opposes a
given proposal (rows) and (2) whether the proposal passes or fails (columns). This yields four
distinct outcome cells, which we label “success,” “disappointment,” “roll,” and “block.”
[Table 1 about here]
As noted, much of the literature to date has focused on the case in the lower left cell, a
roll, where an agenda setter opposes a proposal that nonetheless passes. This indicates a failure
to exercise negative agenda control effectively. This measure, however, may not fully capture
the presence of negative agenda power. If we move beyond the contemporary U.S. House,
where defeating objectionable proposals is largely a pre-floor activity and thus only failures (or
rolls) are easily observable using roll-call data, and examine a chamber where most screening is
done by manipulating floor votes or through a mix of pre-floor and floor agenda power, then
looking at blocks – instances where an agenda setter opposes a proposal that is subsequently
defeated (lower right cell) – would be as or more useful in measuring negative agenda power.
The logic for the cells in the top row, which are indicators of positive agenda power, is
slightly different. If an agenda setter supports a proposal that gets to the floor and passes –
resulting in a success (upper left cell) – this indicates the favorable exercise of positive agenda
control. But, to get a full picture of positive agenda power, one must also look at
disappointments, those cases in which an agenda setter supports a proposal that subsequently
goes down to defeat (upper right cell). While disappointments may not be numerous in the
contemporary U.S. House, where the majority party rarely moves forward on a proposal unless it
knows it has the votes, the same may not be true in other legislative bodies where agenda setting
power typically occurs through vote buying at the floor stage (Snyder 1991).
3

Measuring Agenda Setting Power
Combinations of these four outcome categories can also be helpful, especially in the
context of understanding whether an agenda setter effectively gets what she wants. If one seeks
a measure of how often an agenda setter “wins” in pursuit of agenda power, then successes and
blocks can be aggregated. Likewise, if one seeks a measure of how often an agenda setter
“loses” in pursuit of agenda power, then disappointments and rolls can be aggregated. Thus,
while agenda power type is organized left to right by row (categories of positive agenda power
outcomes in the top row, categories of negative agenda power outcomes in the bottom row), the
end result of agenda power (for the agenda setter) is organized along the diagonals (wins on the
positive slope, losses on the negative slope).
The Consequences and Sensitivity of Variable Construction
To this point, we have talked about legislative agenda setting outcomes, like rolls and
their companion categories, in terms of distinct units. This would lead to the construction of a
measure based on a “count” of such outcomes. A count of rolls, for example, would suggest
that, for the agenda setter, four rolls (in Congress x) is twice as bad in terms of exercising
negative agenda control as two rolls (in Congress y). Such a count-based approach is often
referred to as a numerator study. Alternatively, a count of actual agenda setting outcomes, like
rolls, could be compared to a similar count of possible or hypothetical outcomes. For example, a
ratio-based measure of rolls (or “roll rate”) could be constructed – the count of actual rolls over
the count of possible rolls (or roll opportunities). A higher roll rate (in Congress x) for an agenda
setter would be worse than a lower roll rate (in Congress y), as this would indicate a poorer
performance in exercising negative agenda control after accounting for the number of roll
opportunities. This ratio-based approach is often referred to as a denominator study.
4

Measuring Agenda Setting Power
Both numerator and denominator approaches appear in legislative studies. And a spirited
debate has ensued in the lawmaking literature as to which approach is better or more appropriate,
with some arguing in favor of numerators (Mayhew 2005) and others advocating for
denominators (Edwards, Barrett, and Peake 1997; Binder 2003).2 In the literature on agenda
setting power, numerators (counts) are typically provided as descriptive data, but denominators
(rates) are more often used as dependent variables in multivariate analyses. The most common
denominator is the roll rate developed by Cox and McCubbins (2002; 2005),3 but other
denominators include the success rate (Jenkins and Nokken 2008) and the win rate (Lawrence,
Maltzman, and Smith 2006; Smith 2007; Jenkins and Stewart 2013).
All else equal, if methodological issues are not serious, denominators seem preferable to
numerators, since performance is relative and must be interpreted in terms of opportunity. For
example, how often an agenda setter gets rolled is dependent, in part, on how many would-be
rolls she is confronted with – thus, a rate (ratio) better captures the environmental context. In
some cases, however, numerators might be preferred, if denominators cannot be constructed
easily or validly. On the broader issue of numerators (counts) versus denominators (ratios) in
analyzing agenda setting power, we believe that the measure employed should first and foremost
reflect the theory being tested. And here a discussion of Cox and McCubbins’ roll rate measure
is instructive.
2 Much of the debate centers on the validity of the chosen denominator in denominator studies. Numerators (counts) are readily observable, but denominators are often hypothetical – or must be constructed from different sources, based on particular assumptions. For specific arguments regarding the value of numerators versus denominators in lawmaking studies, see Mayhew (2005, pp. 34-37, 200-02) and Binder (2003, pp. 35-38).3 A number of studies have utilized rolls or roll rates to study the House (Roberts 2005; Gailmard and Jenkins 2007; Wiseman and Wright 2008; Carroll and Kim 2010; Carson, Monroe, and Robinson 2011) as well as other legislative chambers (Gailmard and Jenkins 2007; Cox, Masuyama, and McCubbins 2000; Campbell, Cox, and McCubbins 2002; Chandler, Cox, and McCubbins 2006; Cox, Heller, and McCubbins 2008; Cox, Kousser, and McCubbins 2010; Akirav, Cox, and McCubbins 2010; Den Hartog and Monroe 2011; Anzia and Jackman 2013; Jackman 2014).
5

Measuring Agenda Setting Power
Cox and McCubbins developed their roll rate measure with the intent of testing their
model/theory of negative agenda control (which will be covered in more detail in the next
section). Very simply, they examine how often a majority of the majority (or minority) opposed
a bill on final passage that nevertheless went on to pass, relative to the full set of final-passage
votes considered in a Congress. Looking back at Table 1, one can see that their roll rate measure
considers rolls (lower left cell) relative to outcomes in all four cells. That is, their roll rate is
constructed by dividing rolls by [rolls + blocks + successes + disappointments].
The problem with this construction is that outcomes associated with both positive and
negative agenda control get conflated in a measure that is intended to test only negative agenda
control. For example, imagine a majority party that is active in pushing a positive agenda – if so,
then the number of outcomes in the top two cells (successes and disappointments) of Table 1 will
be large. This active display of positive agenda power – trying to get new policies that the
majority favors onto the agenda and passed – will in fact lead to a decrease in the majority’s roll
rate, as constructed by Cox and McCubbins. This result is perverse, of course, as a true measure
of negative agenda control should not be affected by cases involving positive agenda control.
Given the problematic nature of Cox and McCubbins’ roll rate measure, what can be
done? Two options seem available: (1) constructing a new rate that is more closely tied to the
theory in question (negative agenda control) or (2) using rolls as a count (numerator). If the
former is chosen, a new denominator is needed. One option is to try to assemble a hypothetical
set of cases that might have rolled the majority party, if such bills would have been allowed on
the agenda (and thus were not screened out). Because negative agenda control (as conceived by
Cox and McCubbins) is tied directly to pre-floor behavior, and the roll rate is a floor-based
measure, the connection between the observed cases (numerator) and the hypothetical cases
6

Measuring Agenda Setting Power
(denominator) is slippery. Another option is to consider only those cases that cannot be excluded
at the pre-floor stage by the majority – in which case, the roll rate would be premised on rolls
relative to rolls + blocks. A low roll rate, therefore, would indicate that the majority party on the
floor is able to successfully defeat (block) most of the proposals that it would have preferred to
exclude at the pre-floor stage.
A set of simple regressions shows how results can be sensitive to the composition of the
dependent variable. The focus in these regressions, the results of which appear in Table 2, is on
the minority party and its ability to exercise negative agenda control in the House between the
45th (1877-79) and 105th (1997-98) Congresses. The first column of results replicates Cox and
McCubbins’ analysis (Table 6.1 in Setting the Agenda, p. 112), where the dependent variable is
their basic roll rate measure and the model is estimated using extended beta binomial (EBB); the
second column of results is based instead on ordinary least squares (OLS) regression. The third
and fourth columns display results of models estimated via EBB and OLS, respectively, which
use a “modified” roll rate measure (where rolls are divided by rolls + blocks) as the dependent
variable.4 Finally, the fifth column displays results of an OLS model that uses a count of
minority rolls (and thus not a rate). Key independent variables include a distance measure (the
absolute value of the first-dimension DW-NOMINATE distance between the floor median and
the minority-party median by Congress) and a dummy variable for Congresses operating under
the Reed Rules.5 Additional controls include dummy variables for (a) Congresses after the revolt
against House Speaker Joseph Cannon, when chamber power was decentralized and embedded
in committees and (b) Congresses in the post-Reform era, wherein chamber power was
increasingly recentralized in the majority party.6 4 The correlation between the “standard” and “modified” roll rate measures is a significant, but modest, 0.433. 5 Reed takes on a value of 1 in Congresses 51 and 54-105, and 0 otherwise. 6 Post-Revolt takes on a value of 1 in Congresses 61-105 and 0 otherwise. Post-Reform takes on a value of 1 in Congresses 94-105 and 0 otherwise.
7

Measuring Agenda Setting Power
[Table 2 about here]
The key predictions for Cox and McCubbins’ theory are that the distance and Reed Rules
variables should be positive and significantly related to the minority-party roll rate measure. That
is, because the minority party in the House does not possess negative agenda power, it will not
have a “blockout zone” like the majority. The minority instead has a “roll zone.” Distance,
therefore, should be positively related to the minority’s roll rate, in that greater distance indicates
(all else equal) more status quos that can be readjusted to the floor median (to the harm of a
majority of the minority). In addition, with the adoption of the Reed Rules, a regime change
occurred, as the House moved from a system in which the minority possessed a set of informal
veto rights to a system in which the minority possessed no meaningful negative agenda power.
Thus, the minority-party roll rate should be positively related to Congresses that operate under
the Reed Rules.
And when we look at the results in columns 1 and 2 of Table 2, the EBB replication and
the OLS estimation, we find Cox and McCubbins’ key predictions borne out – both the distance
and Reed Rules variables are positive and significant. When we move to columns 3 and 4,
however, and examine the estimations on the “modified” roll rate, both the distance and Reed
Rules variables fall short of standard significance levels (with the Reed Rules variable also
taking on the wrong sign). Finally, when we shift to the roll count in column 5, both the distance
and Reed Rules variables once again wash out (with both variables taking on the wrong sign).7
This simple set of regressions indicates that results are (or, at least, can be) sensitive to
measurement. That is, the basic structure of the dependent variable will affect the type and
7 If we follow Wiseman and Wright (2008) and include the total number of final-passage votes in a Congress as an additional covariate in the roll count regression, to account for the increase in such votes over time (and thus the great possibility of rolls occurring), then the distance variable becomes positive and significant, while the Reed Rules variable continues to wash out (and display the incorrect sign).
8

Measuring Agenda Setting Power
magnitude of results that are generated. In the example above, Cox and McCubbins’ key results
regarding the determinants of the minority party’s roll rate washed out when the rate was
modified or a count was used instead. This underscores that one must be careful in variable
construction, and that the best justification for a particular variable (in this case, a dependent
variable) – at least in our minds – is the closeness to which it approximates the theory being
tested.
From Theory to Measures
As noted, the heavy emphasis on rolls is a product of the relationship between that
measure and the “cartel agenda model,” as developed and tested by Cox and McCubbins (2002;
2005). Their model is a one-dimensional representation of a policy space, where pivotal actors’
ideal points play the essential role in generating various hypotheses.
[Figure 1 about here]
More formally, the cartel agenda model assumes that Mj, the majority-party median (or
party leaders acting in the interests of Mj), decides whether to allow consideration of bills dealing
with the given policy dimension j. If consideration of a bill dealing with dimension j is allowed,
then it is dealt with under an open rule and passes at the ideal point of Fj, the floor median. As
shown in Figure 1, Mj therefore prevents consideration of any bills that seek to amend SQj, the
status quo policy, if it resides in the “majority blockout zone” between 2Mj-Fj and Fj. If SQj is
outside the majority blockout zone, however, then policy on dimension j will be moved to Fj. 8
With this in mind, it is easy to see how predictions about rolls follow naturally from the
theory. Recall that a majority-party roll is an instance where a majority of the majority party
8 Note that the use of restrictive rules by the majority-party median could cause the blockout zone to be cut in half. Any status quo that falls between 2Mj-Fj and Mj – all of which lead to rolls under an open rule – could be moved to the majority median’s ideal point, protected by a closed rule, and adopted by the chamber. If this were the case, then the blockout zone would only stretch from Mj to Fj. The same basic result is true for our more general model, detailed in the next section.
9

Measuring Agenda Setting Power
votes against a bill that then passes. By assuming a one-dimensional arrangement of member
preferences, the cartel model necessarily assumes that the preference of the median member of
the majority party will always be in concert with a majority of her co-partisans. Thus, by coding
outcomes as rolls when a majority of the party votes in opposition, the measure is in close
harmony with the assumptions of the model.
Moreover, the measure lends itself to straightforward, testable hypotheses. If the
majority party is perfectly successful at screening out bills that address status quos in its blockout
zone, then no rolls should occur. And, short of perfection, the more effective the majority is at
controlling the agenda, the lower its roll rate should be.
Given Cox and McCubbins’ model, rolls are a well-conceived measure – but they are
also a function of very specific assumptions. Our aim is to consider how we might broaden our
measurement tool kit, and thus move beyond the confines of the cartel model. In doing so,
however, it is crucial that we keep theory in mind. And while our intent is to suggest a class of
measures that might be applied in a variety of theoretical settings, we can rest our measures on
some general theoretical principles that are likely to apply across a number of contexts.
In the next two sections, we consider when and how different measures of negative and
positive agenda power are theoretically appropriate.
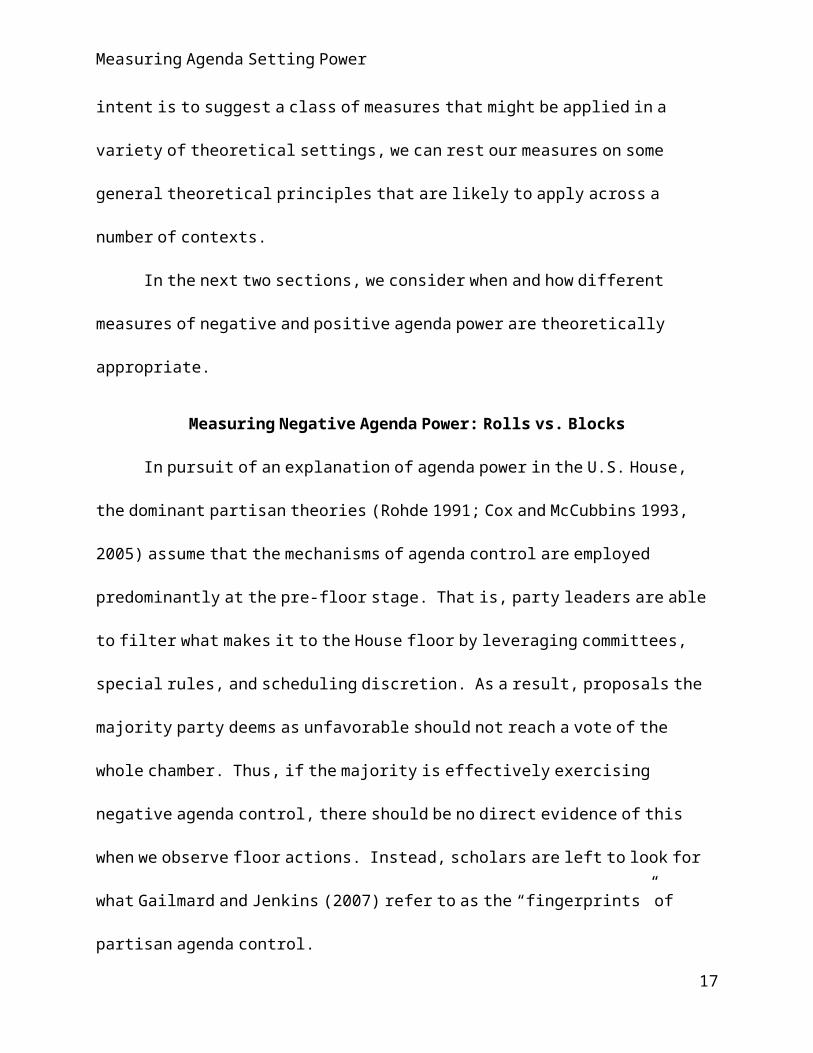
Measuring Negative Agenda Power: Rolls vs. Blocks
In pursuit of an explanation of agenda power in the U.S. House, the dominant partisan
theories (Rohde 1991; Cox and McCubbins 1993, 2005) assume that the mechanisms of agenda
control are employed predominantly at the pre-floor stage. That is, party leaders are able to filter
what makes it to the House floor by leveraging committees, special rules, and scheduling
discretion. As a result, proposals the majority party deems as unfavorable should not reach a
10

Measuring Agenda Setting Power
vote of the whole chamber. Thus, if the majority is effectively exercising negative agenda
control, there should be no direct evidence of this when we observe floor actions. Instead,
scholars are left to look for what Gailmard and Jenkins (2007) refer to as the “fingerprints” of
partisan agenda control.
In this context, given the choice of either blocks or rolls, employing rolls as a measure of
negative agenda power is the correct course of action. If all of the agenda control occurs at the
pre-floor stage, then it is not clear what a theory would predict about blocks. Recall that a block,
in this case, is an instance where a majority of the party votes against a proposal on the floor and
it is subsequently defeated. But given the assumption that bills of this sort should be screened
out, one might view blocks as agenda control failures. On the other hand, since the bills in
question do not pass, they ultimately do not harm the party (at least in a policy-change sense).
Thus, observing a higher versus lower block rate is theoretically ambiguous in this setting.
Rolls, on the other hand, are clear failures, and thus theoretically unambiguous. If the
majority of the party votes against a bill that nonetheless passes, it demonstrates a failure of
negative agenda control. Accordingly, pre-floor agenda control theories make a clear prediction:
more effective agenda control results in a lower roll rate.
So when are blocks the right measure of negative agenda power? In short, the answer is
that as the exercise of negative agenda control shifts from the pre-floor stage to the floor stage,
blocks become a more useful measure. Of course, under the open rule and sincere voting
assumptions of the cartel model, if a status quo located in the blockout zone is considered on the
floor, then the agenda setter will be helpless to block it; by the median voter rule, the bill will
eventually be amended to the floor median’s ideal point. In a world where pre-floor agenda
control is limited or non-existent, however, floor-based tactics (which represent departures from
11

Measuring Agenda Setting Power
the assumptions of the cartel model) can be used to effectuate negative agenda control.9
Specifically, blocks can occur (1) through the use of restrictive rules to protect bills from being
amended (what we will refer to as “proposal placement” power) or (2) through vote buying.
To see this more formally, consider a model similar to the cartel model shown in Figure
1, but with the actors relabeled to fit a broader set of theoretical conditions. Specifically, assume
an “agenda setter” rather than a majority median and a “median voter” instead of a floor median.
Further assume that agenda control takes place on the floor, rather than at the pre-floor stage.
Under these conditions, blocks can occur when the agenda setter targets a status quo
located in her own blockout zone, but does so by proposing an extreme bill (further from the
floor median than the status quo) and then protecting it with a restrictive rule. Consider, for
example, the scenario shown in Figure 2. Under an open rule, the status quo – just to the left of
the floor median – would eventually be paired against an amended proposal at the floor median’s
ideal point, which would result in the agenda setter and most of her coalition being rolled.
However, if the agenda setter can instead propose the bill shown on the far right side of the
space, and use proposal placement power to protect it from moderating amendments, the bill will
fail – blocked by “nay” votes from the agenda setter and more than a majority of her coalition.
[Figure 2 about here]
This sort of block occurs when the agenda setter can “get ahead of the game.” That is,
while she may prefer to let that status quo lie dormant, if some constellation of forces aligns such
that it is inevitable that that status quo will be addressed, the agenda setter has an incentive to
preempt the process and avoid a roll. While it is implausible that the agenda setter herself would
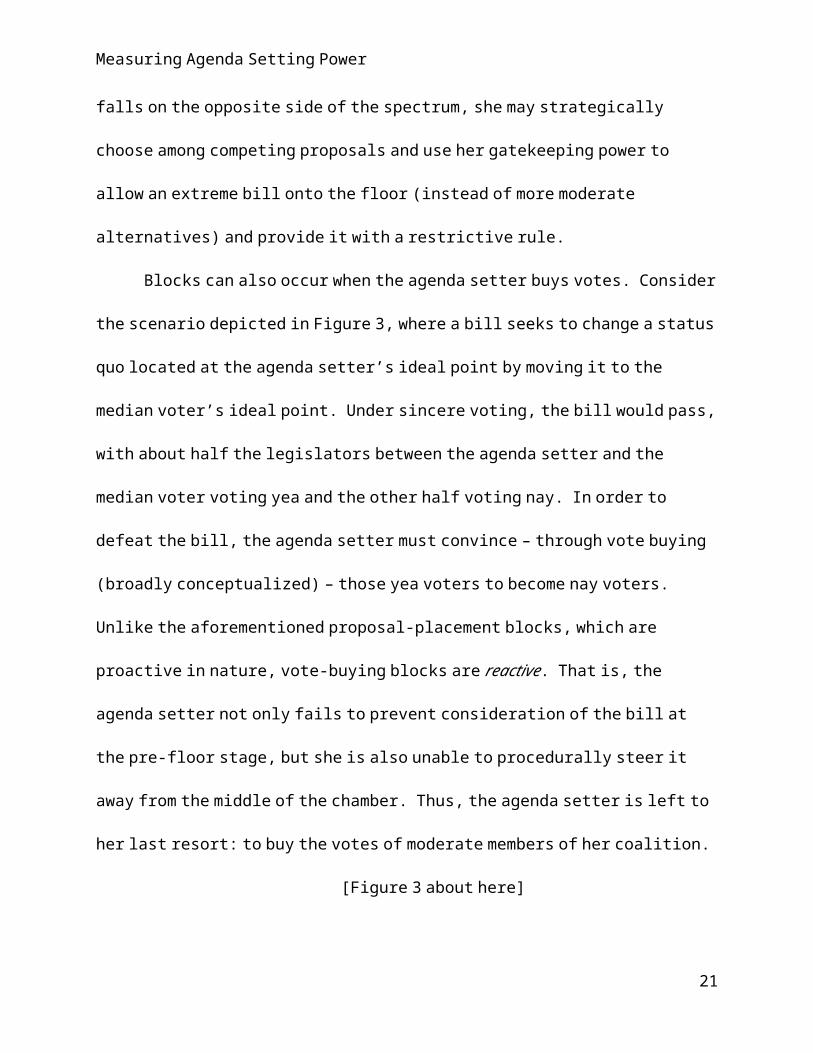
propose a bill that falls on the opposite side of the spectrum, she may strategically choose among
9 A good example of this is the motion to table in the U.S. Senate (Den Hartog and Monroe 2008; 2011).
12

Measuring Agenda Setting Power
competing proposals and use her gatekeeping power to allow an extreme bill onto the floor
(instead of more moderate alternatives) and provide it with a restrictive rule.
Blocks can also occur when the agenda setter buys votes. Consider the scenario depicted
in Figure 3, where a bill seeks to change a status quo located at the agenda setter’s ideal point by
moving it to the median voter’s ideal point. Under sincere voting, the bill would pass, with about
half the legislators between the agenda setter and the median voter voting yea and the other half
voting nay. In order to defeat the bill, the agenda setter must convince – through vote buying
(broadly conceptualized) – those yea voters to become nay voters. Unlike the aforementioned
proposal-placement blocks, which are proactive in nature, vote-buying blocks are reactive. That
is, the agenda setter not only fails to prevent consideration of the bill at the pre-floor stage, but
she is also unable to procedurally steer it away from the middle of the chamber. Thus, the
agenda setter is left to her last resort: to buy the votes of moderate members of her coalition.
[Figure 3 about here]
So when should we observe more blocks? In short, the frequency of blocks should be
greater (and block rates should be higher) when agenda control is exercised on the floor, rather
than at the pre-floor stage. Stated differently, blocks should be more numerous in chambers
where pre-floor agenda screening is weak or nonexistent. Later in the paper, we investigate this
proposition empirically.
Measuring Positive Agenda Power: Successes vs. Disappointments
While negative agenda power may occur at either the pre-floor or floor stage (or both),
positive agenda power must at least exist at the floor stage in order for an agenda setter to
exercise positive agenda control effectively. However, the theoretically expected relationship
between agenda power and “success,” as defined by our measurement matrix in Table 1, depends
13

Measuring Agenda Setting Power
on where in a given policy space the targeted status quo resides. Thus, in order to illuminate
“where successes come from,” it will be useful to first ask: what is the minimum level of agenda
power required to produce a success for any given status quo?
To illustrate this discussion, Figure 4 takes our previous policy space, with an agenda
setter and a median voter, and breaks it into four regions. Recall that the basic median voter
model suggests that in this single dimension, in the absence of agenda control, any status quo
that is addressed will be moved to the median voter’s ideal point. Also recall that a success (as
we have defined it) requires that a bill pass with the support of the relevant agenda setter.
[Figure 4 about here]
With this in mind, notice that for any status quo in Regions 1 and 4, successes will accrue
to the agenda setter as long as she has a monopoly on gatekeeping power. That is, as long as
there is no other actor with the ability (and incentive) to prevent status quos in Regions 1 and 4
from receiving floor consideration, the agenda setter can simply allow proposals onto the floor
that move these status quos to the center of the policy space, where they will pass (by the median
voter theorem) with the support of the agenda setter (and at least a majority of her coalition).
The support of the agenda setter, in this case, comes from the basic spatial distances
defined by the region. The median reflection point represents the point at which the agenda
setter would be indifferent between a status quo and a new policy at the median voter’s ideal
point (Romer and Rosenthal 1978). Thus, the agenda setter prefers the median voter’s ideal
point to all status quos in Region 1. The same rationale applies to status quos in Region 4.
This logic sets the stage for understanding the dynamics within Regions 2 and 3. The
agenda setter prefers every status quo in these regions to a new policy at the median voter’s ideal
point. Thus, in a basic negative agenda control model, where the agenda setter’s only options are
14

Measuring Agenda Setting Power
to deny proposals floor consideration or to allow them at the median voter’s ideal point (i.e.
gatekeeping only), she will reject any proposals that address status quos in these regions.10
Thus, the minimum conditions to produce successes from status quos in Regions 2 and 3
are higher. First, consider what is necessary for Region 2. The agenda setter prefers to move all
of the status quos in this region closer to the median voter (as both the agenda setter and the
median voter are on the same side – to the right – of these status quos), and thus any proposal the
agenda setter makes will pass. However, to pass with the support of the agenda setter, the
proposal must stop short of the median voter’s ideal point, such that the proposal is closer to the
agenda setter’s ideal point than is the status quo. Thus, in addition to possessing a monopoly on
gatekeeping power, the agenda setter must also have proposal placement power in order to
prevent complete convergence to the median voter’s ideal point and thus generate a success.
This is akin to the agenda setter being able to make a take-it-or-leave-it offer to the median voter.
The typical mechanism, in the context of the U.S. House, is through the use of a closed rule.
But, more generally, this insight is useful for any chamber procedure that provides an agenda
setter with the ability to restrict amendments or counter-proposals.
Now consider what must be true in the toughest case, Region 3. Status quos in this
region are in perfect tension between the agenda setter and the median voter. That is, any move
toward the agenda setter will be rejected by the median voter, and thus will fail. But the agenda
setter will not initiate a move toward the median voter, as she would prefer the status quo in that
case. Thus, in order to generate a success in this region, the agenda setter must propose to move
policy away from the median voter, but persuade the median (and some individuals to his left) to
vote for the proposal and against their sincere policy preferences. In order to achieve this vote
10 Note that the combination of Regions 2 and 3 represents the blockout zone in Cox and McCubbins’ cartel agenda model, where the agenda setter is the majority-party median.
15

Measuring Agenda Setting Power
buying, the agenda setter might employ some combination of side payments, threats, and
bargaining (Snyder 1991; Jenkins and Monroe 2012). Thus, in Region 3, the minimum
conditions to produce a success are all three positive agenda setting powers: gatekeeping,
proposal placement, and vote buying.
So how do disappointments come about? Recall that a disappointment is when a
proposal fails to pass, despite the support of the agenda setter. To understand how these
outcomes occur, we can piggyback on the logic just used to understand successes. In terms of
status quos in Regions 1 and 4, any proposal that will pass will also have the support of the
agenda setter. Thus, since proposals that pass, by definition, cannot be disappointments, then
disappointments are not expected to occur for status quos in these regions.
Proposals to shift status quos in Region 2, on the other hand, can pass without the support
of the agenda setter (including all proposals made at the median voter’s ideal point). But these
failures (i.e., letting proposals slip too far towards the median voter) will produce rolls, not
disappointments. Thus, disappointments are not expected in this region either.
In fact, disappointments can only come from agenda-setting failures vis-à-vis status quos
in Region 3.11 That is, disappointments only occur when the agenda setter attempts to move
policy away from the median voter’s ideal point, but fails to successfully buy enough votes –
which results in the proposal failing. Understandably, then, disappointments in the modern U.S.
House are rare, both because there are few status quos that are capable of producing a
disappointment and because the agenda setter will likely have the votes lined up well in advance
11 Of course, by assuming proposal power and/or vote buying for status quos in Regions 1, 2, and 4, we could produce expected disappointments in those cases too. And we would encourage anyone using disappointments as a measure to carefully think through these theoretical issues. Probably the most likely theoretical scenario for disappointments outside of Region 3 would involve the agenda setter attempting to “leap frog” policy over the median voter (Monroe and Robinson 2008). In this case, the agenda setter could take a status quo from Region 4 and make a proposal in Region 3, but place it too far away from the median voter to draw his support, and fail to successfully buy enough votes to get the proposal passed.
16
Measuring Agenda Setting Power
of the proposal being considered by the full chamber.12 However, this may not be true of other
legislatures, where time is less scarce and agenda setters are either less informed or less risk
averse. Thus, disappointments may be an important measurement tool for testing some
theoretical formulations of agenda power.
In sum, choosing which measure(s) of positive agenda power is (are) appropriate depends
both on the assumed powers of the agenda setter and on the range of status quos being addressed.
By viewing positive agenda power as an additive typology of specific types of agenda control,
scholars will not only have more conceptually satisfying measures, but will perhaps also be able
to generate clearer predictions from their theoretical models.
Data Variation Beyond the U.S. House
While the modern U.S. House may not be a good venue for observing variation in the
four agenda control measures, American state legislatures and national legislatures outside the
U.S. offer a window into the potential utility of our measurement typology.
Table 3 displays the disappointment, roll, success, and block rates for the majority and
minority parties for most of the American state legislative chambers for the 1999-2000 sessions.
The data, generated by Anzia and Jackman (2013), include all “competitive” final-passage votes,
where competitive is defined as votes where at least 5% of legislators are on the losing side (see
Wright 2004). Several states are excluded from the table because data were not available for
1999-2000 or because final-passage votes could not be identified.13
[Table 3 about here]
12 For a theory of positive-agenda setting with vote buying, which offers explicit predictions about (a) who should be bought and (b) how much each vote buyee should receive in equilibrium, see Snyder (1991).13 These include Idaho, Nebraska, New York, Rhode Island, Wyoming, Delaware (House), North Dakota (Senate), Pennsylvania (House), and Tennessee (Senate). The Washington House is excluded because majority and minority parties could not be identified, due to a tie in the number of seats held by each party.
17

Measuring Agenda Setting Power
We first focus on variation across the summary statistics at the bottom of Table 3.
Comparing the average majority (3.8%) and minority roll rates (27.2%), we see that the majority
party across the states is much better able to prevent votes that will pass and split their
copartisans. However, when we look at the minimum and maximum roll rates, we find
important variation. In the Texas House, for example, the majority party’s pre-floor negative
agenda power appears very weak relative to other chambers; there, the majority roll rate (18.8%)
is fifty percent higher than the minority roll rate (12.5%). Conversely, in the Hawaii Senate, the
majority party is never rolled, while the minority party has an extremely high roll rate (91%),
suggesting a near total lack of negative agenda power in a very divisive chamber.
With regard to the more floor-centric measure of negative agenda power, we find
significantly less disparity between the parties, on average. Across all chambers, the majority
blocks about 3.9% of bills at final passage, just slightly more than the minority’s 3.6% block
rate. Similarly, as compared to the roll rate, the range of disparity in the block rate is much
smaller, and the majority and minority block rates are much more in concert across the range.
For example, the highest minority block rate is in the North Carolina House (16.1%), where the
majority block rate is exactly the same. But there are exceptions. In the Alaska Senate, which
has the highest majority block rate in the sample (19.3%), the minority blocks bills at final
passage about one-tenth as often (2.5%).
Turning to measures of positive agenda power, we see that while the majority is
disappointed less often (1.8%) on average than the minority (2.2%), the margin is small.
Unsurprisingly, the highest minority disappointment rate is in the Alaska Senate (16.8%), where
the majority party is never disappointed, while the highest majority disappointment rate is in the
Maine Senate (10.3%), where the minority is disappointed only about a third as often (3.4%).
18

Measuring Agenda Setting Power
Both the range and majority-minority disparity in success rates, however, are much
larger. On average, the majority achieves “success” at final passage 90.4% of the time compared
to just 66.7% for the minority. There are several cases where the majority has a 100% success
rate (the Ohio and Connecticut Senates as well as both chambers in Hawaii), but within those
cases, there is a wide range of minority success rates, from 70.8% in the Connecticut Senate to
8.2% in the Hawaii Senate (which is also the lowest minority success rate in the sample).
In Tables 4 and 5, we move beyond the U.S. and consider final-passage votes in two
North American national legislatures – the Chamber of Deputies in the 61st Legislature of the
Mexican Congress (2009-12) and the House of Commons in the 40th Canadian Parliament
(2008-11).14 Analyzing block, roll, disappointment, and success rates by party provides a
different take on agenda power, as no single party in either legislature controlled a majority of
seats.
[Tables 4 and 5 about here]
In the Chamber of Deputies in the 61st Legislature of the Mexican Congress (2009-12),
seven different parties split the 500 seats: the Institutional Revolutionary Party (PRI) controlled
239 seats, the National Action Party (PAN) 142, the Party of the Democratic Revolution (PRD)
69, the Ecologist Green Party of Mexico (PVEM) 23, the Labor Party (PT) 13, the New Alliance
Party (PANAL) 7, and the Convergence for Democracy (CONVE) 6.15 Thus, the PRI was
clearly the plurality party (after making significant gains in the midterm races), but fell just short
of majority status. However, the PRI’s pre-election ally, the PVEM, controlled enough seats to
effect a post-election coalition (or coalition government), which congressional rules require.
Jointly, the PRI and PVEM controlled nearly 52 percent of the seats.
14 Final-passage votes in the Canadian House of Commons are akin to votes on bills that receive a third reading.15 The Convergence for Democracy relabeled itself as the Citizens’ Movement in July 2011, during the 61st Legislature.
19

Measuring Agenda Setting Power
Our measures thus provide a lens to examine the following question: to what extent was
the PRI-PVEM coalition able to control the legislative agenda despite sharing power? Looking
at roll rates, the answer appears to be: quite well. The PRI was never rolled, while the PVEM
was rolled less than 1% of the time. Every other party was rolled at a higher rate, with the PT
rolled more than 30% of the time. The PRI and PVEM were also rarely disappointed (less than
1% of the time), with every other party experiencing higher disappointment rates. The PAN and
especially the left PRD were often rolled and disappointed. (PAN still enjoyed a plurality in the
Senate and controlled the presidency.) PANAL often negotiated with the PRI-PVEM coalition,
and that is visible in its lower roll and disappointment rates. Interestingly, the PRI and PVEM
were also the most effective parties in terms of blocking (each at more than 5%), with the PRD
being the least successful (less than 1%). Thus, while many proposals pass unanimously or
nearly so, as seen by the high success rates for each party (with the PT being the lowest at 64%),
the variance in roll, disappointment, and block rates is telling.
In the House of Commons in the 40th Canadian Parliament (2008-11), four different
parties split the 308 seats: the Conservative Party controlled 143 seats, the Liberal Party 77, the
Bloc Québécois 49, and the New Democratic Party 37.16 Thus, much like the PRI in Mexico, the
Conservative Party was clearly the plurality party (after making slight gains in the 2008
election), but fell just short of majority status.
As is the case with the PRI, the Conservative Party does best across all four measures; of
the four Canadian parties, the Conservatives have the lowest roll (14.5%) and disappointment
(0%) rates and the highest block (9.3%) and success (76.7%) rates. The “official” opposition
(i.e., the party holding the second most seats), the Liberal Party, did not fare as well, though it
did not do dramatically worse, experiencing a somewhat higher roll rate (23.3%), but only a
16 There were also 2 Independents.
20
Measuring Agenda Setting Power
modestly higher disappointment (2.3%) rate and slightly lower block (7%) and success (67.4%)
rates. This is not surprising, as the Liberals often joined the Conservatives on votes. The “real”
opposition was found amongst the Bloc Québécois and New Democratic Parties, who opposed
the “government” on many votes, and as a result experienced very high roll rates and very low
success rates.
Note, however, an important contrast between the PRI’s agenda control in Mexico and
the Conservative Party’s agenda control in Canada: while the PRI was never rolled, the
Conservative Party was rolled on about one out of every seven final-passage votes; but the
Conservative party was never disappointed. Making sense of this contrast requires an
understanding of agenda power in Canada.
In the House of Commons, bills can come from a member of the Cabinet or from any
backbencher. When a Cabinet member introduces a public bill, acting as an agent of the
“government,” it usually involves spending public money from the treasury or raising taxes. In
most cases, bills require the support of a House majority to pass; if a bill from the Cabinet fails to
be adopted, it signals that the House has lost confidence in the government, which typically
results in either a change of government or a new election. In other words, a government
“disappointment” completely undoes the power of the controlling party. This has occurred only
a couple of times in Canada’s history.
The same disastrous scenario for the controlling party does not transpire, however, when
bills roll the government. That is, if a bill introduced by a backbencher (either from within
government or from the opposition) is adopted over the objections of the plurality party, it does
not signal a loss of confidence in the government. Thus, while the government has reasons to
21

Measuring Agenda Setting Power
exercise negative agenda power effectively, it is imperative for the Cabinet’s survival that they
not fail to wield their positive agenda power.
This example highlights the need for our broader typology for measuring legislative
agenda power. Because negative agenda power is paramount in theories born from the U.S.
House, rolls are the ultimate signal of agenda control failure. In parliamentary settings like
Canada, where lack of support for the government on the floor is the ultimate failure,
disappointments are the essential measure of agenda power. It takes little imagination to
conceptualize other legislative settings that would call for yet a different focus.
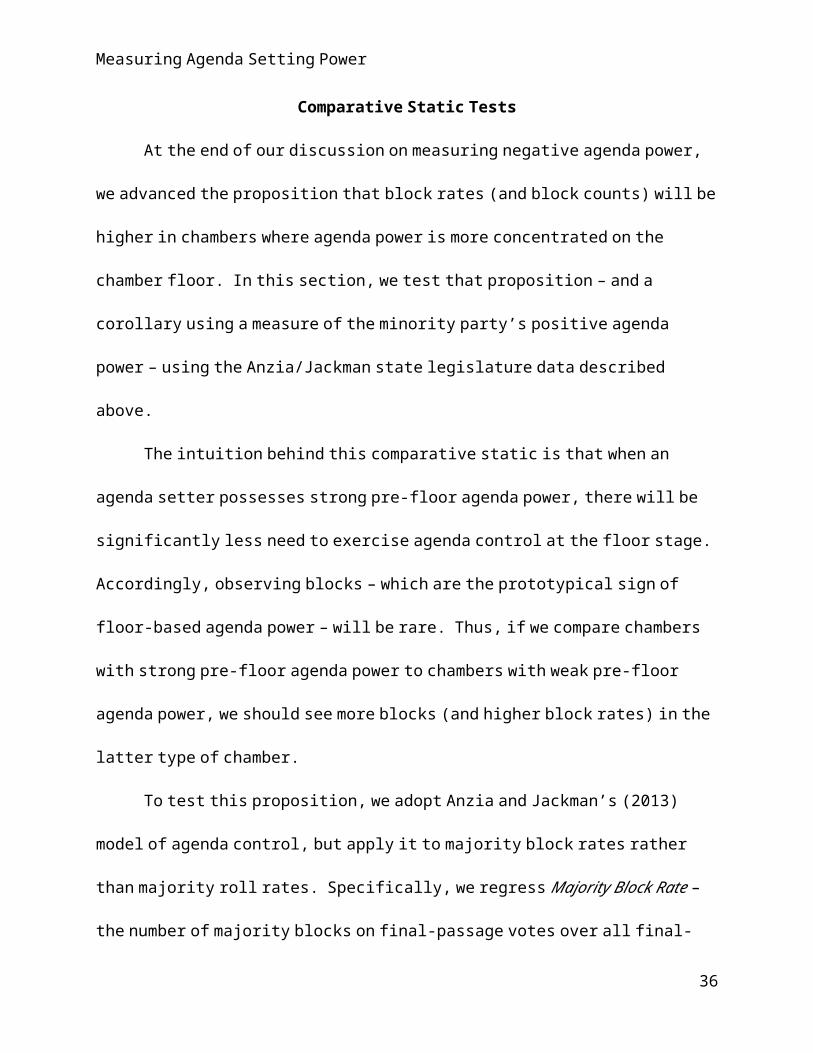
Comparative Static Tests
At the end of our discussion on measuring negative agenda power, we advanced the
proposition that block rates (and block counts) will be higher in chambers where agenda power is
more concentrated on the chamber floor. In this section, we test that proposition – and a
corollary using a measure of the minority party’s positive agenda power – using the
Anzia/Jackman state legislature data described above.
The intuition behind this comparative static is that when an agenda setter possesses
strong pre-floor agenda power, there will be significantly less need to exercise agenda control at
the floor stage. Accordingly, observing blocks – which are the prototypical sign of floor-based
agenda power – will be rare. Thus, if we compare chambers with strong pre-floor agenda power
to chambers with weak pre-floor agenda power, we should see more blocks (and higher block
rates) in the latter type of chamber.
To test this proposition, we adopt Anzia and Jackman’s (2013) model of agenda control,
but apply it to majority block rates rather than majority roll rates. Specifically, we regress
Majority Block Rate – the number of majority blocks on final-passage votes over all final-
22

Measuring Agenda Setting Power
passage votes – on a set of variables that indicate the presence of pre-floor agenda power.
Majority Sets Calendar is a dummy variable that takes a value of one if a majority-party leader
makes decisions about when bills appear on the floor, and zero otherwise. Committee
Gatekeeping is a dummy variable that take a value of one if a chamber’s committees (controlled
by the majority) possess nonhearing or nonreporting rights, and zero otherwise. Calendar x
Gatekeeping is the interaction of these two variables, which captures the effect of having both of
these powers, as compared to just one. Finally, Strong Pre-Floor Agenda Control is a post-
estimation linear combination of the interaction of Calendar x Gatekeeping and the constituent
terms (Majority Sets Calendar and Committee Gatekeeping), and captures the comparison
between a chamber that has both calendar and committee-gatekeeping rights and one that has
neither. Our key expectation is that Strong Pre-Floor Agenda Control should have a significant,
negative effect on Majority Block Rate. That is, majorities in chambers that can screen
effectively at the pre-floor stage, relative to majorities in chambers that cannot screen at the pre-
floor stage, should not often find themselves in the position of having to block bills on the floor.
We also incorporate the Anzia/Jackman controls for Majority Party Size, which is the
proportion of seats in a given chamber held by the majority party; Intraparty Heterogeneity,
which is the sum of the proportion of Democrats who are more conservative than the most liberal
Republican and the proportion of Republicans who are more liberal than the most conservative
Democrat; and Interparty Heterogeneity, which measures the average distance between the
median ideal points of the parties in each state.
Table 6 includes four columns of results. The first and second columns present the results
of the EBB and OLS (with robust standard errors) estimations just described.17 In the third, the
17 Anzia and Jackman (2013) use OLS exclusively in their article. We include the EBB estimation to allow comparisons to the models presented in Table 2.
23

Measuring Agenda Setting Power
OLS model specification is the same, but the dependent variable is the majority-party block
count rather than the majority-party block rate. The fourth column is identical to the third, except
that a control for the total number of final-passage votes in a given chamber (FPVs) is added to
account for differences in the size of the floor agenda across state legislatures.
[Table 6 about here]
In each of the four iterations, we find support for the proposition. Of the two types of
pre-floor agenda control, committee gatekeeping has the larger negative effect on majority-party
block rates and block counts. And, looking at the Strong Pre-Floor Agenda Control linear
combination, we find that majorities in chambers with both calendar and committee-gatekeeping
rights have significantly lower block rates (5.3 percentage points) and block significantly fewer
bills (roughly 35) than majorities in chambers that have neither.
A second testable implication of the presence of pre-floor agenda control stems from the
logic that such pre-floor control will preempt floor proposals from the agenda setter’s opponents.
Stated differently, strong pre-floor agenda control will prevent the minority party from getting
floor votes on its bills. An upshot of this is that we should be less likely to observe the minority
losing in chambers with strong pre-floor agenda control; thus, there should be fewer minority
disappointments (defined as a majority of the minority supporting a bill that fails to pass) in these
chambers.
To test this corollary, we repeat in Table 7 the models described above, except that we
use Minority Disappointment Rate as the dependent variable in columns 1 and 2, and the number
of Minority Disappointments as the dependent variable in columns 3 and 4. We find strong
support for the corollary. As with blocks, committee gatekeeping has a larger negative effect on
minority disappointments than does calendar gatekeeping. And, looking at the Strong Pre-Floor
24

Measuring Agenda Setting Power
Agenda Control linear combination, we see that minorities in chambers with both calendar and
committee-gatekeeping rights have significantly lower disappointment rates (5.3 percentage
points) and experience significantly fewer disappointments (roughly 18) than minorities in
chambers that have neither.
[Table 7 about here]
These comparative static tests indicate the possibilities that exist when one moves (a)
beyond rolls and (b) outside of the U.S. House to investigate elements of legislative agenda
setting power. From our perspective, these tests are just the tip of the iceberg. Depending on the
particular legislature being studied, and the type of agenda power being explored, additional tests
can be undertaken – and not just on the ultimate form of decision-making (final-passage votes),
but also at earlier points in the process (procedural and amendment votes), as the relevant theory
dictates.
Conclusion
Our goal in this paper has been to draw greater attention to issues of typology,
measurement, and theory estimation in research on legislative agenda setting power. Much of
the existing literature relies too heavily on one measure – “rolls” – while neglecting the existence
and appropriateness (given the particular theoretical question being pursued) of other such
measures. Thus, we first lay out a typology, based on how an agenda setter behaves (supporting
or opposing a legislative proposal) and what the outcome of the legislative process is (whether
the proposal passes or fails). For any given proposal, this leads to four possible outcomes – the
now-ubiquitous roll as well as a “block,” a “success,” and a “disappointment.” We then discuss
how such outcomes, when aggregated, might be used effectively as dependent variables in
multivariate studies. The rub is whether such an aggregation is sufficient on its own (leading to a
25

Measuring Agenda Setting Power
count variable, or a numerator study), or whether the aggregation must be compared to some
larger aggregation of possible/hypothetical outcomes that could have occurred (leading to a rate
variable, or a denominator study). And as we show in a set of minority-party regressions, the
choice of dependent variable may influence the types of results that are generated.
These typology/measurement issues then lead us into a broader discussion of the issues
involved in moving from theory to measures. More than likely, in our pursuit of theory
estimation, any measures that we adopt will be flawed in some way. We note, for example, that
Cox and McCubbins’ roll rate measure conflates positive and negative agenda control outcomes
in what is ostensibly intended to be a measure simply of negative agenda control. Our own
“modified” roll rate measure, which only taps negative agenda control outcomes (rolls + blocks),
is likely inflated (and perhaps considerably so), because it excludes a distribution of block
outcomes at the pre-floor stage (when the majority successfully blocks proposals, and when the
minority does not move forward with proposals in anticipation of being blocked) that are
unobservable in the roll-call data.
More fundamentally, though, choosing the right measure must be driven by the
particulars of the theory being tested. As a matter of fact and, hopefully, of theory, agenda
power is conceived very differently across different legislative bodies. Agenda power emanates
from institutional arrangements and agenda-setter incentives, and thus where there is meaningful
variance in either of those two components, so too will there be variance in our expectations
about the consequences of effective agenda control. As we show empirically, this is certainly
true across the U.S. state legislatures, and through a juxtaposition of the Mexican and Canadian
federal legislatures. The variance in our four measures across these settings is substantial, and in
some instances is easily explained by differences in the institutional arrangements of these
26

Measuring Agenda Setting Power
bodies. Comparative static tests on the state legislatures, exploring calendar and committee-
gatekeeping rights and their effects on majority blocks and minority disappointments, support the
more general point.
In the end, the lesson here is: measures can be constructed to better match the theory
being tested, but all such measures will involve some inferential loss. The goal is to have a sense
of the inferential limitations of each possible measure, such that the estimated results can be
interpreted properly and ascribed the appropriate confidence. In this imperfect empirical world,
one strategy to pursue is a kind of “triangulation,” whereby a theory is tested using different
measures with different (but well understood) inferential limitations. If multiple flawed
measures can each tell us something – and perhaps something different – about a theoretical
phenomenon, we are likely better off than proceeding with only one measure (regardless of its
popularity or widespread usage).
27

Measuring Agenda Setting Power
References
Akirav, Osnat, Gary W. Cox, and Mathew D. McCubbins. 2010. “Agenda Control in the Israeli Knesset during Ariel Sharon’s Second Government.” The Journal of Legislative Studies 16: 251-67.
Aldrich, John H., and James S. Coleman Battista. 2002. “Conditional Party Government in the States.” American Journal of Political Science 46: 164-72.
Amorim Neto, Octavio, Gary Cox, and Matthew McCubbins. 2003. “Agenda Power in Brazil’s Camara dos Deputados, 1989–1998.” World Politics 55: 550-78.
Anzia, Sarah F., and Molly C. Jackman. 2013. “Legislative Organization and the Second Face of Power: Evidence from U.S. State Legislatures.” Journal of Politics 75: 210-224.
Edwards, George C. III, Andrew Barrett, and Jeffrey Peake. 1997. “The Legislative Impact of Divided Government.” American Journal of Political Science 41: 545-63.
Binder, Sarah A. 2003. Stalemate: Causes and Consequences of Legislative Gridlock. Washington: The Brookings Institution Press.
Calvo, Ernesto, and Iñaki Sagarzazu. 2011. “Legislator Success in Committee: Gatekeeping Authority and the Loss of Majority Control.” American Journal of Political Science 55: 1-15.
Campbell, Andrea C., Gary W. Cox, and Mathew D. McCubbins. 2002. “Agenda Power in the U.S. Senate, 1877 to 1986.” In David Brady and Mathew D. McCubbins, eds., Party, Process, and Political Change in Congress: New Perspectives on the History of Congress. Stanford: Stanford University Press.
Carroll, Royce, and Henry A. Kim. 2010. “Party Government and the ‘Cohesive Power of Public Plunder.’” American Journal of Political Science 54: 34-44.
Carson, Jamie L., Nathan W. Monroe, and Gregory Robinson. 2011. “Unpacking Agenda Control in Congress: Individual Roll Rates and the Republican Revolution.” Political Research Quarterly 64: 17-30.
Chandler, William M., Gary W. Cox, and Mathew D. McCubbins. 2006. “Agenda Control in the Bundestag, 1980-2002.” German Politics 15: 27-48.
Chiou, Fang-Yi and Lawrence S. Rothenberg. 2003. “When Pivotal Politics Meets Partisan Politics.” American Journal of Political Science 47: 503-522.
Cox, Gary W., William B. Heller, and Mathew D. McCubbins. 2008. “Agenda Power in the Italian Chamber of Deputies, 1988-2000.” Legislative Studies Quarterly 33: 171-98.
28

Measuring Agenda Setting Power
Cox, Gary W., Thad Kousser, and Mathew D. McCubbins. 2010.”Party Power or Preferences? Quasi-Experimental Evidence from American State Legislatures.” Journal of Politics 72: 799-811.
Cox, Gary W., Mikitaka Masuyama, and Mathew D. McCubbins. 2000. “Agenda Power in the Japanese House of Representatives.” Japanese Journal of Political Science 1: 1-21.
Cox, Gary W., and Mathew D. McCubbins. 1993. Legislative Leviathan: Party Government in the House. Berkeley: University of California Press.
Cox, Gary W., and Mathew D. McCubbins. 2002. “Agenda Power in the U.S. House of Representatives.” In David Brady and Mathew D. McCubbins, eds., Party, Process, and Political Change in Congress: New Perspectives on the History of Congress. Stanford: Stanford University Press.
Cox, Gary W., and Mathew D. McCubbins. 2005. Setting the Agenda: Responsible Party Government in the U.S. House of Representatives. Cambridge: Cambridge University Press.
Crisp, Brian F., Scott W. Desposato, and Kristin Kanthak. 2011. “Legislative Pivots, Presidential Powers, and Policy Stability.” Journal of Law, Economics, and Organization 27: 426-52.
Den Hartog, Chris, and Nathan W. Monroe. 2008. “Agenda Influence and Tabling Motions in the U.S. Senate.” In Why Not Parties? Party Effects in the United States Senate, Nathan W. Monroe, Jason R. Roberts and David W. Rohde, eds. Chicago: University of Chicago Press.
Den Hartog, Chris, and Nathan W. Monroe. 2011. Agenda Setting in the U.S. Senate: Costly Consideration and Majority Party Advantage. Cambridge: Cambridge University Press.
Gailmard, Sean, and Jeffery A. Jenkins. 2007. “Negative Agenda Control in the Senate and House: Fingerprints of Majority Party Power.” Journal of Politics 69: 689-700.
Gamm, Gerald, and Thad Kousser. 2010. “Broad Bills or Particularistic Policy? Historical Patterns in American State Legislatures.” American Political Science Review 104: 151-70.
Jackman, Molly C. 2014. “Parties, Median Legislators, and Agenda Setting: How Legislative Institutions Matter.” Journal of Politics 76: 259-72.
Jenkins, Jeffery A., and Timothy P. Nokken. 2008. “Legislative Shirking in the Pre-Twentieth Amendment Era: Presidential Influence, Party Power, and Lame-Duke Session of Congress, 1877-1933.” Studies in American Political Development 22: 111-40.
Jenkins, Jeffery A., and Nathan W. Monroe. 2012. “Buying Negative Agenda Control in the U.S. House.” American Journal of Political Science 56: 897-912.
29

Measuring Agenda Setting Power
Jenkins, Jeffery A., and Charles Stewart III. 2013. Fighting for the Speakership: The House and the Rise of Party Government. Princeton: Princeton University Press.
Jones, Mark P., and Wonjae Hwang. 2005. “Party Government in Presidential Democracies: Extending Cartel Theory Beyond the U.S. Congress.” American Journal of Political Science 49: 267-82.
Koger, Gregory. 2010. Filibustering: A Political History of Obstruction in the House and Senate. Chicago: University of Chicago Press.
Lawrence, Eric, Forrest Maltzman, and Steven S. Smith. 2006. “Who Wins? Party Effects in Legislative Voting.” Legislative Studies Quarterly 31: 33-70.
Mayhew, David R. 2005. Divided We Govern: Party Control, Lawmaking, and Investigations, 1946-2002. Second Edition. New Haven: Yale University Press.
Monroe, Nathan W., and Gregory Robinson. 2008. “Do Restrictive Rules Produce Non-Median Outcomes? Evidence from the 101st-106th Congresses.” Journal of Politics 70: 217-31.
Roberts, Jason. 2005. “Minority Rights and Majority Power: Conditional Party Government and the Motion to Recommit in the House.” Legislative Studies Quarterly 30: 219-34.
Rohde, David W. 1991. Parties and Leaders in the Postreform House. Chicago and London: University of Chicago Press.
Romer, Thomas, and Howard Rosenthal. 1978. “Political Resource Allocation, Controlled Agendas, and the Status Quo.” Public Choice 33: 27-43.
Smith, Steven S. 2007. Party Influence in Congress. Cambridge: Cambridge University Press.
Snyder, James M., Jr. 1991. “On Buying Legislatures.” Economics and Politics 3: 93-109.
Wiseman, Alan E., and John R. Wright. 2008. “The Legislative Median and Partisan Policy.” Journal of Theoretical Politics 20: 5-29.
Wright, Gerald C. 2004. “Representation in America’s Legislatures.” Indiana University: NSF Grant.
Wright, Gerald C., and Brian F. Schaffner. 2002. “The Influence of Party: Evidence from the State Legislatures.” American Political Science Review 96: 367-79.
30

Measuring Agenda Setting Power
Table 1: Typology of Measures of Agenda Setting Power
Proposal Outcome
Age
nda
Sett
er P
ositi
on Pass Fail
Support Success Disappointment
Oppose Roll Block
31

Measuring Agenda Setting Power
Table 2: Estimating Minority-Party Roll Behavior in the House, 45th-105th Congresses
Explanatory Variable
C&M Roll Rate
(EBB)
C&M Roll Rate
(OLS)
“Modified” Roll Rate
(EBB)
“Modified” Roll Rate
(OLS)
Roll Count (OLS)
Distance 2.884**(0.489)
0.592** (0.141)
1.817 (1.023)
0.183(0.114)
-3.519 (8.152)
Reed 0.883**(0.331)
0.232**(0.079)
-0.367 (0.674)
-0.018(0.043)
-1.008 (3.054)
Post-Revolt -0.285(0.335)
-0.085(0.095)
0.565 (0.698)
0.002(0.059)
2.364 (3.406)
Post-Reform 0.224(0.153)
0.023(0.030)
0.303 (0.331)
0.058(0.032)
32.579** (3.590)
Constant -2.732** (0.368)
-0.086 (0.095)
1.164 (0.799)
0.807**(0.079)
11.094* (5.509)
Pseudo R2
LR 20.055
238.90**----
0.03121.94**
----
----
R2 F statistic
-- --
0.542 11.11**
-- --
0.1051.89
0.747 41.36**
N 61 61 61 61 61
Note: Each column is a separate model of the House minority party. Standard errors are in parentheses (robust standard errors in OLS models). Column 1 results are a perfect replication of Table 6.1 in Cox and McCubbins (2005, p. 112). Although some of the variable results are based on directional hypotheses, we report p-values of two-tailed tests to be consistent with the original Cox and McCubbins model.
*p < .05, **p < .01 (two-tailed tests)
32

Measuring Agenda Setting Power
Table 3: Disappointment, Roll, Success, and Block Rates by Minority/Majority Party,U.S. State Legislatures, 1999-2000
State (Chamber)Disappointment Rate Roll Rate Success Rate Block Rate Total
VotesMajority Minority Majority Minority Majority Minority Majority MinorityAlabama (H) 1.1 0 1.1 17.4 96.7 80.4 1.1 2.2 92Alabama (S) 1.5 1.5 0 22.1 97.1 75 1.5 1.5 68Alaska (H) 0 0 0 42.1 99.3 57.1 0.7 0.7 140Alaska (S) 0 16.8 3.4 33.6 77.3 47.1 19.3 2.5 119Arizona (H) 4.8 0.6 5 25 88.5 68.5 1.8 6 685Arizona (S) 6.3 0.2 7.3 15.8 82 73.5 4.5 10.5 494Arkansas (H) 3.7 6 1.9 19.4 82.4 64.8 12 9.7 216Arkansas (S) 2.5 6.2 4.3 21.6 78.4 61.1 14.8 11.1 162California (H) 1.2 0 0.1 62.8 98.7 36 0 1.2 1430California (S) 0.3 0.3 0.6 77.7 98.5 21.4 0.5 0.6 1147Colorado (H) 1.2 7.3 10.7 21.8 78.7 67.6 9.4 3.4 413Colorado (S) 2.7 5.5 6.9 23.4 93.2 66.8 7.1 4.4 364Connecticut (H) 0 2.1 2.1 27.1 95.8 70.8 2.1 0 96Connecticut (S) 0 0 0 29.2 100 70.8 0 0 48Delaware (S) 2.3 4.5 6.8 22.7 84.1 68.2 6.8 4.5 44Florida (H) 0 1.4 2.9 24.6 95.7 73.9 1.4 0 69Florida (S) 0 0 2.3 25.6 97.7 74.4 0 0 43Georgia (H) 1.1 2.2 0 20.7 95.7 75 3.3 2.2 92Georgia (S) 1.7 0 0 41 98.3 57.3 0 1.7 117Hawaii (H) 0 0 0 48.7 100 51.4 0 0 148Hawaii (S) 0 0 0 91.8 100 8.2 0 0 97Illinois (H) 3.3 0.4 1.6 20.1 93.1 74.7 2 4.9 553Illinois (S) 2.6 0 6.9 20.7 87.9 74.1 2.6 5.2 116Indiana (H) 3.4 0 0.7 35.5 95.2 60.3 0.7 4.1 290Indiana (S) 3.4 2.7 4.1 16.3 84.5 72.3 8.1 8.8 148Iowa (H) 0.8 0 1.6 22.2 97.6 77 0 0.8 126Iowa (S) 0 0 6 35 94 65 0 0 100Kansas (H) 2.1 5.4 8.7 14.5 92.2 76.4 7 3.7 242Kansas (S) 0.9 0.5 2.7 11.3 94.6 86 1.8 2.3 222Kentucky (H) 2.8 0 2.1 21.1 94.4 75.3 0.7 3.5 142Kentucky (S) 1.1 0 2.2 15.7 95.5 82 1.1 2.2 89Louisiana (H) 3.3 3 3.3 15.2 83.2 71.3 10.2 10.6 303Louisiana (S) 2.9 0.2 2.7 10.2 90.5 82.9 3.9 6.6 410Maine (H) 4 1.6 4 46 88.9 46.8 3.2 5.6 126Maine (S) 10.3 3.4 6.9 62.1 77.6 22.4 5.2 12.1 58Maryland (H) 0.7 1 1.3 26.4 97 71.9 1 0.7 303Maryland (S) 1.4 2.4 4.7 23.1 90.1 71.7 3.8 2.8 212Massachusetts (H) 0 0 0 77 99.3 22.2 0.7 0.7 135Massachusetts (S) 0 0 14.3 42.9 85.7 57.1 0 0 14Michigan (H) 0.4 0 0.8 41.6 98.9 58 0 0.4 262Michigan (S) 0.1 0.1 0.2 8.4 99.5 91.3 0.2 0.2 1070Minnesota (H) 1.2 0.8 3.1 29.6 93.4 66.9 2.3 2.7 257Minnesota (S) 0 2.6 8.5 22.2 88.9 75.2 2.6 0 117Mississippi (H) 2.2 1.7 1.3 6.9 91.8 86.1 4.8 5.2 231Mississippi (S) 4.3 1.4 2.9 18.8 88.4 72.5 4.3 7.2 69
33

Measuring Agenda Setting Power
Missouri (H) 1.6 0.3 0.6 22.1 96.8 75.3 1 2.2 312Missouri (S) 1.8 1.2 0 17.4 97 79.6 1.2 1.8 167Montana (H) 1.1 2.2 4.2 13.6 92.4 82.9 2.3 1.2 733Montana (S) 0.6 0.6 3 20.8 94.6 76.8 1.8 1.8 336Nevada (H) 0.7 3 1.5 21.6 93.3 73.1 4.5 2.2 134Nevada (S) 2.5 0 0.8 22.5 96.7 75 0 2.5 120New Hampshire (H) 0 0 17.6 23.5 76.5 70.6 5.9 5.9 17New Hampshire (S) 8.1 8.1 8.1 33.9 67.7 41.9 16.1 16.1 62New Jersey (H) 0 0 0.7 26.3 99.3 73.7 0 0 152New Jersey (S) 0 0 1.5 32.4 98.5 67.6 0 0 68New Mexico (H) 3.7 0.3 2.1 44.8 92.7 50 1.5 4.9 328New Mexico (S) 3 5.5 5 35.5 83.4 52.9 5.9 6.1 361North Carolina (H) 4 0 0 19.8 93.2 73.4 16.1 16.1 177North Carolina (S) 0 4.9 0 22 95.1 73.2 0 0 82North Dakota (H) 1.8 16.7 1.8 12.7 57.7 46.7 0 0 503Ohio (H) 0 0 0.9 13.8 99.1 86.2 0 0 116Ohio (S) 0 0 0 44.2 100 55.8 0 0 52Oklahoma (H) 1.9 1.2 2.3 20.2 92.8 74.8 3.1 3.7 485Oklahoma (S) 1.7 1.2 1.7 39.2 92.9 55.5 3.6 4.1 411Oregon (H) 2.6 0.2 3.7 31.4 93.1 65.4 0.6 3 465Oregon (S) 2.2 0.4 2.2 31 94.4 65.5 1.3 3 461Pennsylvania (S) 0 4.5 0 18.2 95.5 77.3 4.5 0 22South Carolina (H) 1.7 0 8.5 22 88.1 74.6 1.7 3.4 59South Carolina (S) 0 12.5 0 12.5 87.5 75 12.5 0 8South Dakota (H) 3 6.6 4.4 15.7 76.5 65.2 16 12.4 362South Dakota (S) 1.7 7.4 6.2 15.7 80.2 70.7 12 6.2 242Tennessee (H) 2.8 0 2.8 9.7 88.9 81.9 5.6 8.3 72Texas (H) 0 0 18.8 12.5 81.3 87.5 0 0 16Texas (S) 0 0 9.1 9.1 90.9 90.9 0 0 22Utah (H) 2 5.2 10.4 17.3 78.7 71.8 8.9 5.8 347Utah (S) 2.6 1.9 11.6 28.4 81.9 65.2 3.9 4.5 155Vermont (H) 4.3 8.7 17.4 43.5 65.2 39.1 13 8.7 23Vermont (S) 0 4.5 0 40.9 95.5 54.5 4.5 0 22Virginia (H) 4.4 2.8 7.5 5.8 79.2 80.9 8.9 10.5 789Virginia (S) 2.4 5.6 12 14.1 71.5 69.5 14.1 10.8 249Washington (S) 3 0 3.4 36.8 93.6 60.3 0 3 234West Virginia (H) 0 0 2 15.7 98 84.3 0 0 51West Virginia (S) 2.7 1.3 1.3 20 92 73.3 4 5.3 75Wisconsin (H) 2.1 1 0 28.1 96.9 68.8 1 2.1 96Wisconsin (S) 1.9 0 0 44.4 98.1 53.7 0 1.9 54
Disappointment Rate Roll Rate Success Rate Block RateMajority Minority Majority Minority Majority Minority Majority Minority
Average 1.8 2.2 3.8 27.2 90.4 66.7 3.9 3.6Minimum 0 0 0 5.8 57.7 8.2 0 0Maximum 10.3 16.8 18.8 91.8 100 91.3 19.3 16.1
34

Measuring Agenda Setting Power
Table 4: Block, Roll, Disappointment, and Success Rates by Party, Chamber of Deputies, 61st Legislature of the Mexican Congress (2009-12)
Block Rate
Roll Rate
Disappointment Rate
Success Rate
Total Votes
PAN 4.1 4.5 1.8 89.7 738PRI 5.7 0.0 0.1 94.2 738PRD 0.7 10.0 5.1 84.1 738PVEM 5.1 0.9 0.7 93.2 738PT 1.8 30.2 4.1 64.0 738PANAL 4.6 2.4 1.2 91.7 738CONVE 1.9 10.6 3.9 83.6 738
Table 5: Block, Roll, Disappointment, and Success Rates by Party, House of Commons, 40th Canadian Parliament (2008-11)
Block Rate
Roll Rate
Disappointment Rate
Success Rate
Total Votes
Bloc Québécois 4.7 53.5 4.7 37.2 43New Democratic 0 58.1 9.3 32.6 43Conservative 9.3 14.0 0 76.7 43Liberal 7.0 23.3 2.3 67.4 43
35
Measuring Agenda Setting Power
Table 6: Estimating Majority-Party Block Behavior across State Legislatures
Explanatory Variable
Block Rate
(EBB)
Block Rate
(OLS)
Block Count(OLS)
Block Count(OLS)
Majority Sets Calendar (β1) -1.072** (0.326)
-0.009 (0.025)
-28.63 (17.79)
-26.21*(14.88)
Committee Gatekeeping (β2) -1.607** (0.305)
-0.038*(0.019)
-33.93* (18.22)
-38.25*(17.92)
Calendar x Gatekeeping (β3) 0.721** (0.436)
-0.007(0.027)
27.93 (18.27)
28.91*(16.71)
Majority Party Size (β4) 0.105 (1.324)
-0.015(0.073)
23.44 (21.38)
6.08(18.82)
Intraparty Heterogeneity (β5) 0.161 (0.280)
0.007(0.011)
-7.10(5.09)
-5.19(4.02)
Interparty Heterogeneity (β6) -0.711** (0.258)
-0.013(0.011)
-10.42(9.11)
-21.66(13.06)
FPVs (β7) 0.038*(0.019)
Constant -1.052 (0.977)
0.097*(0.052)
39.64 (32.19)
56.26(34.81)
Post-Estimation Test: Strong Pre-Floor Agenda Control (β1 + β2 + β3)
-1.959** (0.297)
-0.053**(0.017)
-34.63*(17.77)
-35.54* (16.09)
Pseudo R2 (EBB) / R2 (OLS) N
0.188 81
0.183 81
0.264 81
0.384 81
Note: Each column is a separate model of the House majority party. Standard errors are in parentheses (robust standard errors in OLS models). We adopt Anzia and Jackman’s (2013) model of agenda control and thus have directional hypotheses. We therefore report p-values for one-tailed tests. Strong Pre-Floor Agenda Control is a linear combination of Majority Sets Calendar, Committee Gatekeeping, and Calendar x Gatekeeping.
*p < .05, **p < .01 (one-tailed tests)
36

Measuring Agenda Setting Power
Table 7: Estimating Minority-Party Disappointment Behavior across State Legislatures
Explanatory Variable
Disappointment Rate
(EBB)
Disappointment Rate
(OLS)
Disappointment Count(OLS)
Disappointment Count(OLS)
Majority Sets Calendar (β1) -1.196** (0.357)
-0.028(0.018)
-14.90* (7.83)
-13.94*(6.73)
Committee Gatekeeping (β2) -1.605** (0.326)
-0.043**(0.014)
-17.77* (7.90)
-19.49**(7.80)
Calendar x Gatekeeping (β3) 0.697 (0.495)
0.018(0.019)
14.75* (8.01)
15.14*(7.43)
Majority Party Size (β4) 1.457 (1.511)
0.027(0.052)
16.33 (10.88)
9.45(10.13)
Intraparty Heterogeneity (β5) -0.121 (0.352)
-0.004(0.008)
-3.80*(2.28)
-3.05(1.94)
Interparty Heterogeneity (β6) -0.383 (0.272)
-0.009(0.007)
-3.15(3.79)
-7.60(5.50)
FPVs (β7) 0.015*(0.008)
Constant -2.925** (1.109)
0.057(0.038)
14.76 (14.19)
21.35(15.33)
Post-Estimation Test: Strong Pre-Floor Agenda Control (β1 + β2 + β3)
-2.105** (0.331)
-0.053**(0.013)
-17.92*(7.75)
-18.28** (7.10)
Pseudo R2 (EBB) / R2 (OLS) N
0.163 81
0.296 81
0.322 81
0.409 81
Note: Each column is a separate model of the House minority party. Standard errors are in parentheses (robust standard errors in OLS models). We adopt Anzia and Jackman’s (2013) model of agenda control and thus have directional hypotheses. We therefore report p-values for one-tailed tests. Strong Pre-Floor Agenda Control is a linear combination of Majority Sets Calendar, Committee Gatekeeping, and Calendar x Gatekeeping.
*p < .05, **p < .01 (one-tailed tests)
37

Measuring Agenda Setting Power
Figure 1: The Cartel Agenda Model
Figure 2: An Agenda Setting Model with Placement Power Causing a Block
Figure 3: An Agenda Setting Model with Vote Buying Causing a Block
38
M F2M-F
j
Majority Blockout Zone
AgendaSetter
MedianVoter
Median Reflection
j
Pre-Floor Blockout Zone
SQ BillVotes Bought
“Yeas”switch to
“Nays”
AgendaSetter
MedianVoter
Median Reflection
j
Pre-Floor Blockout Zone
SQ BillYeasNays

Measuring Agenda Setting Power
Figure 4: Minimum Conditions for “Successes” by Region
39
Region 2
AgendaSetter
MedianVoter
Median Reflection
j
Region 1 Region 4Region 3
Gatekeeping Gatekeeping GatekeepingProposal Placement
GatekeepingProposal Placement
Vote Buying