Embed Size (px)
Citation preview

proteinsSTRUCTURE O FUNCTION O BIOINFORMATICS
Docking with PIPER and refinementwith SDU in rounds 6–11 of CAPRIYang Shen,1,2 Ryan Brenke,1,3 Dima Kozakov,1,4 Stephen R. Comeau,5
Dmitri Beglov,1,4 and Sandor Vajda1,4*1 BioMolecular Engineering Research Center, Boston University, Boston, Massachusetts
2 Program in Systems Engineering, Boston University, Boston, Massachusetts
3 Program in Bioinformatics, Boston University, Boston, Massachusetts
4 Department of Biomedical Engineering, Boston University, Boston, Massachusetts
5 Dyax Corp., Boston, Massachusetts
INTRODUCTION
For a number of years we have been using a multistep approach to
protein–protein docking.1–6 The first step is exploring the conforma-
tional space by a rigid body global search method based on the Fast Fou-
rier Transform (FFT) correlation approach that evaluates the energies of
billions of docked conformations on a grid. Depending on the particular
method, 2000–20,000 docked structures are retained for analysis. Second,
the number of structures are reduced by rigid body filters based on em-
pirical potentials and electrostatics calculations. Third, the retained struc-
tures are clustered using the pairwise root mean square Deviation
(RMSD) as the distance measure and a fixed or variable clustering ra-
dius.5 We have demonstrated that the 30 largest clusters contain at least
one near-native structure (defined as having less that 10 A ligand RMSD
from the native) for 93% of the complexes in the well-known Weng
benchmark set.7 Finally, the conformations in the selected clusters are
refined, in the past primarily by energy minimization with the
CHARMM potential.8 The use of this algorithm in Rounds 1 through 5
of CAPRI was fairly successful, and our team, led by Dr. Carlos Camacho
at that time, consistently ranked among the top five performers in each
round. We note that Dr. Camacho is now at the University of Pittsburgh,
and participates in CAPRI with a separate team.
During the last year we have substantially redesigned the two main
steps of the above multistep approach, namely the initial rigid body
search and the refinement of structures in the selected clusters. For the
rigid body search we have developed a new docking program called
PIPER.6 Similar to a number of other docking programs, PIPER is based
on the FFT correlation approach, but the method is extended to be used
with pairwise interaction potentials. Such structure-based (or knowledge-
based) potentials have been previously used with success for ranking
docked conformations,1,2,4,9–12 but their use directly for docking by the
The authors state no conflict of interest.
Grant sponsor: National Institute of Health; Grant numbers: GM061867, GM079396; Grant sponsor:
National Science Foundation; Grant number: MRI DBI-0116574.
Yang Shen, Ryan Brenke, Dima Kozakov, and Stephen R. Comeau contributed equally to this work.
*Correspondence to: Sandor Vajda, Department of Biomedical Engineering Boston University, 44
Cummington Street, Boston, MA 02215. E-mail: [email protected]
Received 5 June 2007; Revised 13 July 2007; Accepted 18 July 2007
Published online 12 September 2007 inWiley InterScience (www.interscience.wiley.com).
DOI: 10.1002/prot.21754
ABSTRACT
Our approach to protein–protein docking
includes three main steps. First we run
PIPER, a new rigid body docking program.
PIPER is based on the Fast Fourier Trans-
form (FFT) correlation approach that has
been extended to use pairwise interactions
potentials, thereby substantially increasing
the number of near-native structures gener-
ated. The interaction potential is also new,
based on the DARS (Decoys As the Reference
State) principle. In the second step, the 1000
best energy conformations are clustered, and
the 30 largest clusters are retained for refine-
ment. Third, the conformations are refined by
a new medium-range optimization method
SDU (Semi-Definite programming based Un-
derestimation). SDU has been developed to
locate global minima within regions of the
conformational space in which the energy
function is funnel-like. The method constructs
a convex quadratic underestimator function
based on a set of local energy minima, and
uses this function to guide future sampling.
The combined method performed reliably
without the direct use of biological informa-
tion in most CAPRI problems that did not
require homology modeling, providing accept-
able predictions for targets 21, and medium
quality predictions for targets 25 and 26.
Proteins 2007; 69:734–742.VVC 2007 Wiley-Liss, Inc.
Key words: fast Fourier transform; clustering;
energy funnel; protein docking by PIPER;
refinement by SDU; global optimization;
semidefinite programming; DARS pairwise
potential.
734 PROTEINS VVC 2007 WILEY-LISS, INC.
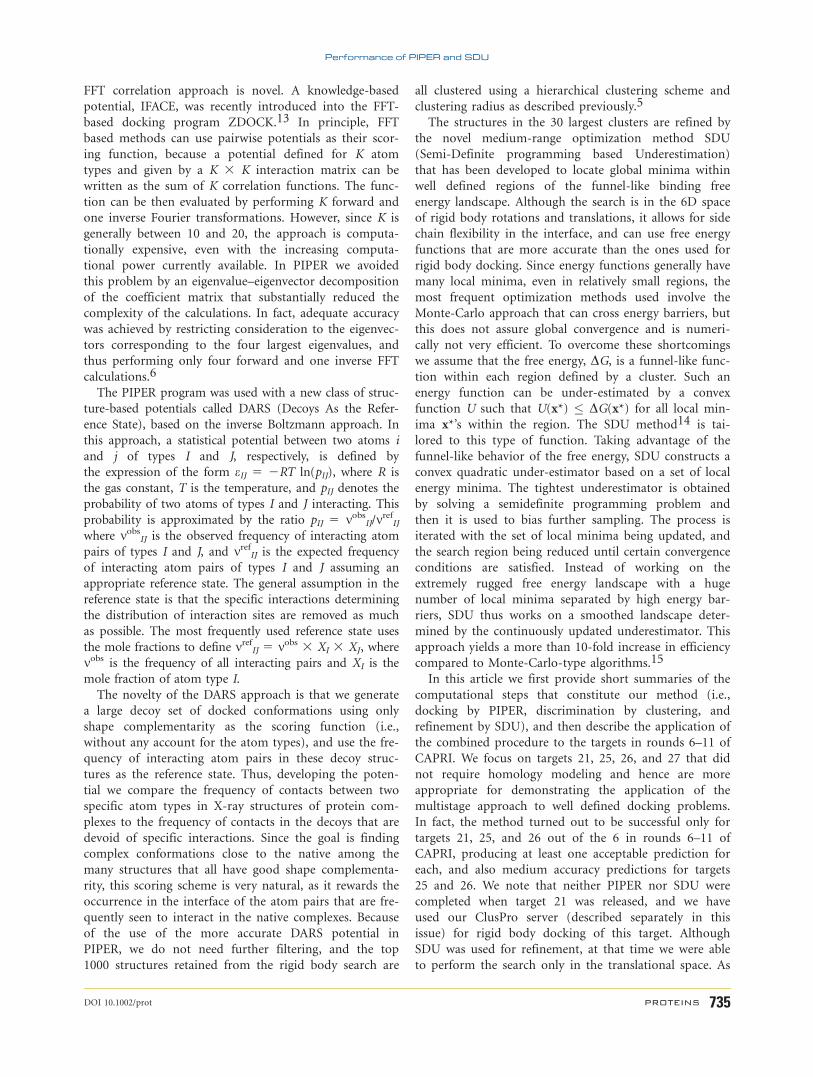
FFT correlation approach is novel. A knowledge-based
potential, IFACE, was recently introduced into the FFT-
based docking program ZDOCK.13 In principle, FFT
based methods can use pairwise potentials as their scor-
ing function, because a potential defined for K atom
types and given by a K 3 K interaction matrix can be
written as the sum of K correlation functions. The func-
tion can be then evaluated by performing K forward and
one inverse Fourier transformations. However, since K is
generally between 10 and 20, the approach is computa-
tionally expensive, even with the increasing computa-
tional power currently available. In PIPER we avoided
this problem by an eigenvalue–eigenvector decomposition
of the coefficient matrix that substantially reduced the
complexity of the calculations. In fact, adequate accuracy
was achieved by restricting consideration to the eigenvec-
tors corresponding to the four largest eigenvalues, and
thus performing only four forward and one inverse FFT
calculations.6
The PIPER program was used with a new class of struc-
ture-based potentials called DARS (Decoys As the Refer-
ence State), based on the inverse Boltzmann approach. In
this approach, a statistical potential between two atoms i
and j of types I and J, respectively, is defined by
the expression of the form eIJ 5 2RT ln(pIJ), where R is
the gas constant, T is the temperature, and pIJ denotes the
probability of two atoms of types I and J interacting. This
probability is approximated by the ratio pIJ 5 mobsIJ/mref
IJ
where mobsIJ is the observed frequency of interacting atom
pairs of types I and J, and mrefIJ is the expected frequency
of interacting atom pairs of types I and J assuming an
appropriate reference state. The general assumption in the
reference state is that the specific interactions determining
the distribution of interaction sites are removed as much
as possible. The most frequently used reference state uses
the mole fractions to define mrefIJ 5 mobs 3 XI 3 XJ, where
mobs is the frequency of all interacting pairs and XI is the
mole fraction of atom type I.
The novelty of the DARS approach is that we generate
a large decoy set of docked conformations using only
shape complementarity as the scoring function (i.e.,
without any account for the atom types), and use the fre-
quency of interacting atom pairs in these decoy struc-
tures as the reference state. Thus, developing the poten-
tial we compare the frequency of contacts between two
specific atom types in X-ray structures of protein com-
plexes to the frequency of contacts in the decoys that are
devoid of specific interactions. Since the goal is finding
complex conformations close to the native among the
many structures that all have good shape complementa-
rity, this scoring scheme is very natural, as it rewards the
occurrence in the interface of the atom pairs that are fre-
quently seen to interact in the native complexes. Because
of the use of the more accurate DARS potential in
PIPER, we do not need further filtering, and the top
1000 structures retained from the rigid body search are
all clustered using a hierarchical clustering scheme and
clustering radius as described previously.5
The structures in the 30 largest clusters are refined by
the novel medium-range optimization method SDU
(Semi-Definite programming based Underestimation)
that has been developed to locate global minima within
well defined regions of the funnel-like binding free
energy landscape. Although the search is in the 6D space
of rigid body rotations and translations, it allows for side
chain flexibility in the interface, and can use free energy
functions that are more accurate than the ones used for
rigid body docking. Since energy functions generally have
many local minima, even in relatively small regions, the
most frequent optimization methods used involve the
Monte-Carlo approach that can cross energy barriers, but
this does not assure global convergence and is numeri-
cally not very efficient. To overcome these shortcomings
we assume that the free energy, DG, is a funnel-like func-
tion within each region defined by a cluster. Such an
energy function can be under-estimated by a convex
function U such that U(x*) � DG(x*) for all local min-
ima x*’s within the region. The SDU method14 is tai-
lored to this type of function. Taking advantage of the
funnel-like behavior of the free energy, SDU constructs a
convex quadratic under-estimator based on a set of local
energy minima. The tightest underestimator is obtained
by solving a semidefinite programming problem and
then it is used to bias further sampling. The process is
iterated with the set of local minima being updated, and
the search region being reduced until certain convergence
conditions are satisfied. Instead of working on the
extremely rugged free energy landscape with a huge
number of local minima separated by high energy bar-
riers, SDU thus works on a smoothed landscape deter-
mined by the continuously updated underestimator. This
approach yields a more than 10-fold increase in efficiency
compared to Monte-Carlo-type algorithms.15
In this article we first provide short summaries of the
computational steps that constitute our method (i.e.,
docking by PIPER, discrimination by clustering, and
refinement by SDU), and then describe the application of
the combined procedure to the targets in rounds 6–11 of
CAPRI. We focus on targets 21, 25, 26, and 27 that did
not require homology modeling and hence are more
appropriate for demonstrating the application of the
multistage approach to well defined docking problems.
In fact, the method turned out to be successful only for
targets 21, 25, and 26 out of the 6 in rounds 6–11 of
CAPRI, producing at least one acceptable prediction for
each, and also medium accuracy predictions for targets
25 and 26. We note that neither PIPER nor SDU were
completed when target 21 was released, and we have
used our ClusPro server (described separately in this
issue) for rigid body docking of this target. Although
SDU was used for refinement, at that time we were able
to perform the search only in the translational space. As
Performance of PIPER and SDU
DOI 10.1002/prot PROTEINS 735

will be further discussed, for each target, models 1 and 2
incorporated some biological information we were able
to find in the literature. However, it turned out that
none of these models achieved even acceptable accuracy,
and our successful predictions were generally selected on
the basis of either large cluster size or low energy. In
addition to describing our results, we provide a brief
analysis to show that most targets in CAPRI rounds 6–11
were more difficult than the targets in the previous
rounds, attesting the progress a number of groups,
including ours, have made in developing docking metho-
dology.
METHODS
Rigid body docking using PIPER
FFT docking algorithms perform exhaustive evaluation
of simplified energy functions in discretized 6D space of
mutual orientations of the protein partners. The larger
docking partner is considered the receptor and its center
of mass is fixed at the origin of the coordinate system.
The other partner is considered the ligand and all its
possible orientational and translational positions are eval-
uated at the given level of discretization. The rotational
space is sampled using a deterministic layered Sukharev
grid sequence for the rotational group SO(3), which
quasi-uniformly covers the space with a given number of
samples.16 The translational space is represented as a grid
of displacements of the ligand center of mass with respect
to the receptor’s center of mass. The energy function is
given as the sum of terms representing shape complemen-
tarity, electrostatic, and desolvation contributions, the lat-
ter described by a pairwise potential as follows.
E ¼ Eshape þ w2Eelec þ w3Epair
Eshape ¼ Eattr þ w1Erep
Eelec ¼XNr
i¼1
XNl
j¼1
qiqj
r2ij þ D2 exp�r2
ij
4D2
� �� �12
Epair ¼XNr
i¼1
XNl
j¼1
eij
where Nr and Nl denote the numbers of atoms in the
receptor and the ligand, respectively. The shape comple-
mentarity term Eshape is a stepwise implementation of the
Van der Waals energy, with Eattr and Erep representing its
attractive and repulsive components, respectively. Eelec is
the Coulombic electrostatic energy. Epair is a pairwise
knowledge-based potential, with eij representing the inter-
action energy between atoms i and j. To evaluate the
energy function E by FFT, it must be written as a sum of
correlation functions. The first two terms, Eshape and
Eelec, satisfy this condition. To write Epair as a sum of a
few correlation functions, we consider the eigenvalue–
eigenvector decomposition.
Epair ¼XNr
i¼1
XNl
j¼1
XKp¼1
dijkpupIupJ
Here dij denotes an indicator function such that dij 5 1
if atom i of the receptor is within a cutoff distance from
atom j of the ligand, kp is pth eigenvalue of the interac-
tion matrix, and upI is the Ith component of the pth
eigenvector.
The details of the PIPER docking program implement-
ing the above energy functions have been previously
reported.6 The same article also described the DARS
potential used in our calculations, and provided the ma-
trix of interaction coefficients.6 As mentioned in the
introduction, Epair can be well approximated by restrict-
ing considerations to the first few terms of the eigen-
value–eigenvector decomposition. Each term in the
decomposition represents an energy contribution propor-
tional to the absolute value of the eigenvalue kp, and
such contributions are independent due to the orthogo-
nality of the eigenvectors. Calculating the energy on a
grid may yield up to 10% error, so it is well justified to
truncate the summation when the energy contributions
of the neglected terms are comparable to this error. The
analysis shows that only K 5 4 eigenvalues are needed to
achieve this accuracy. Although the meaning of the corre-
sponding eigenvectors are somewhat difficult to interpret,
the first eigenvector primarily represents favorable hydro-
phobic interactions. The second eigenvector shows that
repulsive same-sign electrostatic interactions and, more
generally, Lys side chains are not favorable in the interface.
The atomic parameters in the energy functions have
been adopted from the CHARMM potential.8 The pa-
rameters of the FFT algorithm used in our calculations
were independent of the type of the proteins to be
docked. We sampled 70,000 rotations which aproximately
corresponds to sampling at every 58 in the space of Euler
angles. Increasing the number of rotations generally
would improve the results, and the selected number of
points was chosen as a compromise between performance
and computational efficiency. We used grids with 1.2 A
cell size, which was found to be adequate for representing
protein structures with sufficient details and at the same
time providing acceptable computational efficiency.
Discrimination by clustering
The clustering of the retained conformations is based
on the pairwise RMSD of ligand structures, calculated
for the atoms that are within 10 A of any atom of the
fixed receptor (to be referred to as ligand RMSD). We
use a simple greedy algorithm to find the structures with
the largest number of neighbors within a clustering ra-
dius RC. As we described earlier,5 the choice of RC
Y. Shen et al.
736 PROTEINS DOI 10.1002/prot
depends on a clustering parameter 0 � D � 1, which is
based on the histogram of pairwise RMSD values, and
measures the depth of the separation between clusters.
D 5 1 indicates perfect separation of intercluster and
intracluster length scales. Such separation means that clus-
tering is very easy, and that the use of the optimal radius
RC, calculated from the histogram of pairwise RMSD
values,5 substantially increases the number of near-native
structures in the top clusters. The analysis of the docked
structures for the proteins in the benchmark set7 showed
that for D � 0.4 the use of the optimal radius generally
increases the number of the near-native predictions in
the largest clusters. In contrast, for D < 0.4 the choice of
the calculated optimal radius does not necessarily
improve the results, and hence it is better to use the
default clustering radius of 9 A. Once a clustering radius
RC is selected, the structure with the highest number of
neighbors within RC is considered as the center of the
first cluster. The members of this cluster are removed,
and we select the next structure with the highest number
of neighbors from the remaining ligands until the set is ex-
hausted, thereby generating 10–30 rank ordered clusters.5
Refining top-ranked clusters with SDU
The structures in the top-ranked clusters are further
refined using SDU, a stochastic global optimization
method which exploits and utilizes the funnel-like behav-
ior of the free energy function DG in the regions of the
conformational space defined by separate clusters.14 SDU
consists of two key components:
(i). Underestimating the surface spanned by the local min-
ima. Given a set of K local minima x1,. . .,xK of DG,we are interested in constructing a convex quadratic
function U that underestimates DG at all local
minima i.e., U(xi) � DG(xi), i 5 1,. . .,K. Let
U ðxÞ¼D x0Qx þ b0x þ c, where Q [ Rn3n is positive
semidefinite (hence, U is convex), b [ Rn, and c is a
scalar. Using an L1 norm as a distance metric the
problem of finding the tightest possible underestima-
tor U can be formulated as follows:
minXKi¼1
ðDGðxiÞ � c � xi0Qxi � b0xiÞ
s:t: DGðxiÞ � c þ xi0Qxi þ b0xi; i ¼ 1; . . . ;K ;
Q ” 0;
where the decision variables are Q, b, and c, and ‘‘” 0’’
denotes positive semidefiniteness. We have shown that
this problem can be reformulated into a semidefinite
programming problem which can be solved efficiently
using interior-point methods.14
(ii). Using the underestimator to guide further exploration.
Assuming that the constructed underestimator re-
flects the funnel-like behavior of free energy func-
tion, we call the global minimum xP of U the ‘‘pre-
dictive conformation’’ where xP ¼ � 12Q�1b. High
energy samples or those far from xP are discarded.
Considering the huge number of local minima
spread over the region B, we sample more struc-
tures and give more chances to those closer to xP.
This can be achieved by using the following
probability density function (pdf) in B: f ðxÞ ¼U ðxÞ�UmaxR
BðUðxÞ�UmaxÞ dx; x 2 B where Umax 5 maxiU(x
i).
Random samples with the above pdf are generated by
an acceptance/rejection method and added to the
sample set. The process of (i) and (ii) are iterated for
a fixed number of iterations unless the convergence
conditions are satisfied. SDU reports the lowest-
energy structure in the sample set at the end as the
final solution.
In the refinement step by SDU we use the free energy
model DG 5 DGdes 1 DGelec 1 kDEvdw, where the desol-
vation free energy DGdes is estimated by the Atomic Con-
tact Potential (ACP),17 the electrostatic energy DGelec is
based on the Coulombic formula with distance-depend-
ent dielectrics e 5 4r, and the Van der Waals term is
adopted from the CHARMM potential.8 The scaling fac-
tor k of the Van der Waals contributions to the free
energy is dynamically selected between 0 and 1 by SDU,
which strengthens the ability of the method to cross high
energy barriers.14 The search space is the 6D space of
rigid motions including translations and rotations, that
is, the special Euclidean group (SE(3) 5 R3 3 SO(3)),
plus side-chain flexibility in the interface. Each sample
structure is locally minimized with 300 steps of Adopted
Base Newton–Raphson (ABNR) method under
CHARMM,8 by fixing the backbones and allowing the
side-chain flexibility in the interface from both receptor
and ligand. The resulted local minima are used in SDU
for determining the underestimator and thus performing
the 6D search. The lowest free energy structure (with full
contribution of the Van der Waals term) of each cluster
is chosen as the new cluster representative.
Prediction ranking
After all clusters have been refined by SDU, we select
the models to be submitted. At this point the selection is
a manual and somewhat intuitive process, rather than the
application of well defined selection criteria. Although we
rank order the clusters based on their size (the number of
entries), the selection also incorporated other criteria. In
particular, the first two submitted models were selected
from large clusters that also had relatively good energies,
and agreed the most with the biological information
available on the target. If not selected, the lowest energy
structure in the largest cluster was usually submitted as
Model 3, without accounting for any a priori information.
As we describe, we generally had better success with this
Performance of PIPER and SDU
DOI 10.1002/prot PROTEINS 737
model than with the first two. The remaining seven mod-
els were representatives from other large clusters.
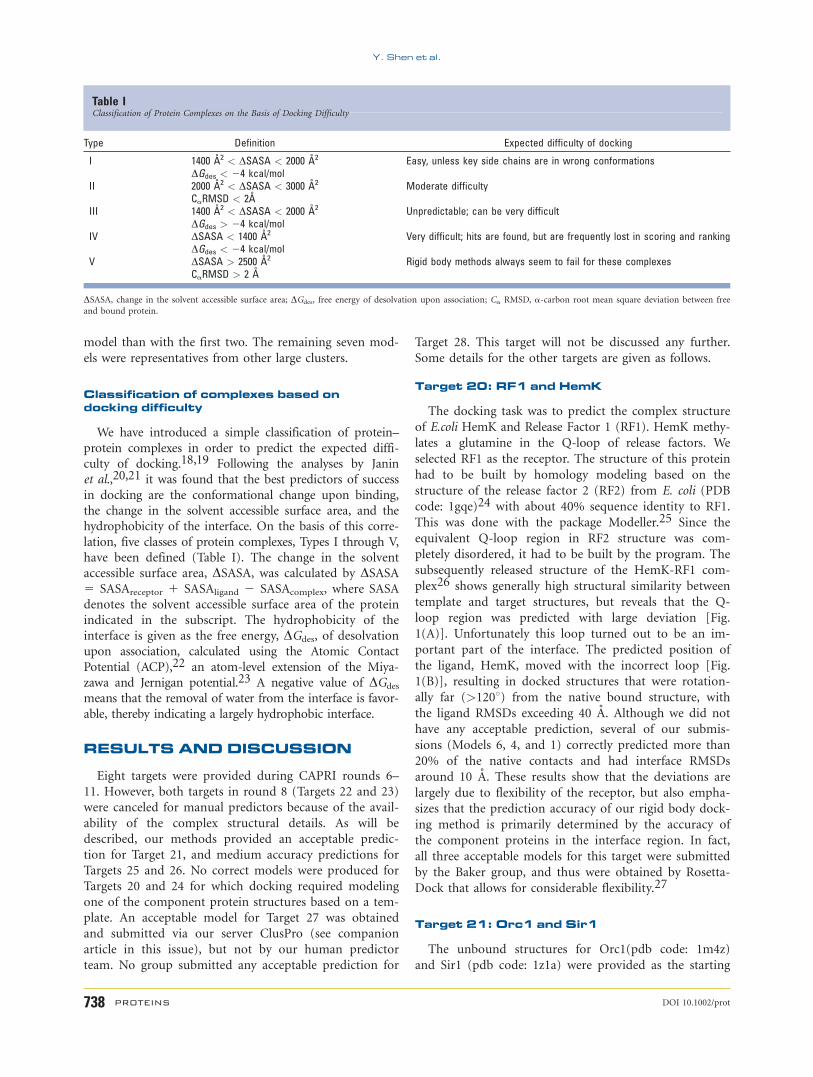
Classification of complexes based ondocking difficulty
We have introduced a simple classification of protein–protein complexes in order to predict the expected diffi-culty of docking.18,19 Following the analyses by Janinet al.,20,21 it was found that the best predictors of successin docking are the conformational change upon binding,the change in the solvent accessible surface area, and thehydrophobicity of the interface. On the basis of this corre-lation, five classes of protein complexes, Types I through V,have been defined (Table I). The change in the solventaccessible surface area, DSASA, was calculated by DSASA5 SASAreceptor 1 SASAligand 2 SASAcomplex, where SASAdenotes the solvent accessible surface area of the proteinindicated in the subscript. The hydrophobicity of theinterface is given as the free energy, DGdes, of desolvationupon association, calculated using the Atomic ContactPotential (ACP),22 an atom-level extension of the Miya-zawa and Jernigan potential.23 A negative value of DGdes
means that the removal of water from the interface is favor-able, thereby indicating a largely hydrophobic interface.
RESULTS AND DISCUSSION
Eight targets were provided during CAPRI rounds 6–
11. However, both targets in round 8 (Targets 22 and 23)
were canceled for manual predictors because of the avail-
ability of the complex structural details. As will be
described, our methods provided an acceptable predic-
tion for Target 21, and medium accuracy predictions for
Targets 25 and 26. No correct models were produced for
Targets 20 and 24 for which docking required modeling
one of the component protein structures based on a tem-
plate. An acceptable model for Target 27 was obtained
and submitted via our server ClusPro (see companion
article in this issue), but not by our human predictor
team. No group submitted any acceptable prediction for
Target 28. This target will not be discussed any further.
Some details for the other targets are given as follows.
Target 20: RF1 and HemK
The docking task was to predict the complex structure
of E.coli HemK and Release Factor 1 (RF1). HemK methy-
lates a glutamine in the Q-loop of release factors. We
selected RF1 as the receptor. The structure of this protein
had to be built by homology modeling based on the
structure of the release factor 2 (RF2) from E. coli (PDB
code: 1gqe)24 with about 40% sequence identity to RF1.
This was done with the package Modeller.25 Since the
equivalent Q-loop region in RF2 structure was com-
pletely disordered, it had to be built by the program. The
subsequently released structure of the HemK-RF1 com-
plex26 shows generally high structural similarity between
template and target structures, but reveals that the Q-
loop region was predicted with large deviation [Fig.
1(A)]. Unfortunately this loop turned out to be an im-
portant part of the interface. The predicted position of
the ligand, HemK, moved with the incorrect loop [Fig.
1(B)], resulting in docked structures that were rotation-
ally far (>1208) from the native bound structure, with
the ligand RMSDs exceeding 40 A. Although we did not
have any acceptable prediction, several of our submis-
sions (Models 6, 4, and 1) correctly predicted more than
20% of the native contacts and had interface RMSDs
around 10 A. These results show that the deviations are
largely due to flexibility of the receptor, but also empha-
sizes that the prediction accuracy of our rigid body dock-
ing method is primarily determined by the accuracy of
the component proteins in the interface region. In fact,
all three acceptable models for this target were submitted
by the Baker group, and thus were obtained by Rosetta-
Dock that allows for considerable flexibility.27
Target 21: Orc1 and Sir1
The unbound structures for Orc1(pdb code: 1m4z)
and Sir1 (pdb code: 1z1a) were provided as the starting
Table IClassification of Protein Complexes on the Basis of Docking Difficulty
Type Definition Expected difficulty of docking
I 1400 �2 < DSASA < 2000 �2
DGdes < 24 kcal/molEasy, unless key side chains are in wrong conformations
II 2000 �2 < DSASA < 3000 �2
CaRMSD < 2�Moderate difficulty
III 1400 �2 < DSASA < 2000 �2
DGdes > 24 kcal/molUnpredictable; can be very difficult
IV DSASA < 1400 �2
DGdes < 24 kcal/molVery difficult; hits are found, but are frequently lost in scoring and ranking
V DSASA > 2500 �2
CaRMSD > 2 �Rigid body methods always seem to fail for these complexes
DSASA, change in the solvent accessible surface area; DGdes, free energy of desolvation upon association; Ca RMSD, a-carbon root mean square deviation between free
and bound protein.
Y. Shen et al.
738 PROTEINS DOI 10.1002/prot
structures for docking. On the basis of the released struc-
ture (pdb code: 1zhi),28 the Orc1-Sir1 complex has a
relatively small interface (DSASA 5 1453 A2) which is
fairly polar (see Table II). As expected, the target proved to
be relatively difficult, with only six groups submitting at
least acceptable predictions. As already mentioned, PIPER
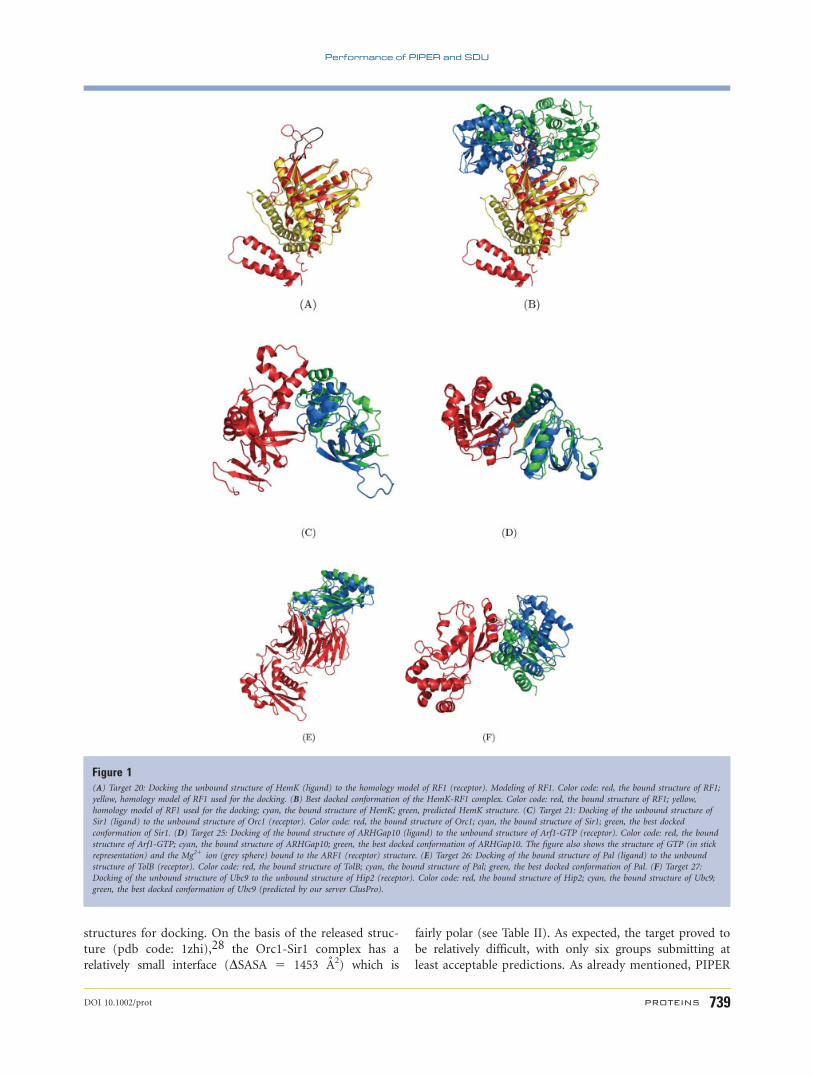
Figure 1(A) Target 20: Docking the unbound structure of HemK (ligand) to the homology model of RF1 (receptor). Modeling of RF1. Color code: red, the bound structure of RF1;
yellow, homology model of RF1 used for the docking. (B) Best docked conformation of the HemK-RF1 complex. Color code: red, the bound structure of RF1; yellow,
homology model of RF1 used for the docking; cyan, the bound structure of HemK; green, predicted HemK structure. (C) Target 21: Docking of the unbound structure of
Sir1 (ligand) to the unbound structure of Orc1 (receptor). Color code: red, the bound structure of Orc1; cyan, the bound structure of Sir1; green, the best docked
conformation of Sir1. (D) Target 25: Docking of the bound structure of ARHGap10 (ligand) to the unbound structure of Arf1-GTP (receptor). Color code: red, the bound
structure of Arf1-GTP; cyan, the bound structure of ARHGap10; green, the best docked conformation of ARHGap10. The figure also shows the structure of GTP (in stick
representation) and the Mg21 ion (grey sphere) bound to the ARF1 (receptor) structure. (E) Target 26: Docking of the bound structure of Pal (ligand) to the unbound
structure of TolB (receptor). Color code: red, the bound structure of TolB; cyan, the bound structure of Pal; green, the best docked conformation of Pal. (F) Target 27:
Docking of the unbound structure of Ubc9 to the unbound structure of Hip2 (receptor). Color code: red, the bound structure of Hip2; cyan, the bound structure of Ubc9;
green, the best docked conformation of Ubc9 (predicted by our server ClusPro).
Performance of PIPER and SDU
DOI 10.1002/prot PROTEINS 739

was not ready when Target 21 was released, and hence
we used our server ClusPro4 which did not yield any ac-
ceptable model. However, starting from the largest cluster
of ClusPro-generated structures, refinement by SDU
derived a structure, submitted as our Model 3, which
turned out to be of acceptable accuracy [Fig. 1(C)]. Since
SDU was not fully developed either, we performed the
refinement only in the translational space. Nevertheless,
it dramatically improved the percentage of native con-
tacts from 4.9 to 24.4%, and the ligand RMSD was
decreased from 11.9 A to 9.6 A. Our posterior analysis
shows that the high energy barriers due to clashes
between overlapping atoms would have prevented an off-
grid search from approaching the native conformation if
side chains at the interface had been fixed. Thus, it was
very important that the SDU enabled the adjustment of
structures by medium-range minimization. We also
tested PIPER on this target as part of our post-examina-
tion. The center of the 8th largest cluster had 9.7 A
RMSD from the native complex, and thus would have
provided a model with acceptable accuracy. However, the
refinement of this cluster actually slightly increased the
RMSD, to 9.9 A. Thus, even our new programs would
produce only an acceptable model for Target 21.
Targets 24 and 25: Arf1 and ARHGap10
Two targets of the same complex were provided during
round 9. The difference lies in the structures of ARH-
Gap10. In Target 24, the ARHGap10 structure must be
built from the binding site of a PH domain (PDB code:
1btn). Since 27 C-terminus residues of ARHGap10 do
not align to any region of 1btn, these were not modeled.
Post-examination of the native complex structure29 (pdb
code: 2j59) shows that this C-terminus region folds into
a long a-helix, which is an important part of the inter-
face. Without the helix, the docking failed to deliver any
acceptable prediction. Our best submission (Model 5)
had the interface RMSD of 5.6 A but no native contacts.
In Target 25 the bound structure of ARHGap10 was
provided. The structure included a bound GTP molecule
and a magnesium ion that were retained for the docking.
Note that the use of these ligands required special addi-
tions to the parameter files of PIPER and SDU. With the
explicit introduction of GTP and Mg21, the predicted
conformations from PIPER were concentrated more in
the native-like region. Our submissions included one me-
dium accuracy prediction (Model 3) and three acceptable
accuracy ones. Model 3 was derived from the third lar-
gest cluster provided by PIPER (with 4.4 A ligand RMSD)
which, after the SDU refinement, was reduced to 2.8 A.
This model, shown in Figure 1(D), predicted 63% of the
native contacts and had an interface RMSD of 1.3 A. We
note that the largest cluster from PIPER had 8.5 A ligand
RMSD, but this was increased to 10.4 A in the SDU
refinement, resulting in an incorrect model. Our three
acceptable predictions (Models 4, 10, and 8, with ligand
RMSD values of 6.8, 8.7, and 9.6 A, respectively) were
obtained from further large clusters derived by PIPER.
Target 26: TolB and Pal
The problem was to dock the unbound structures of
TolB (pdb code: 1c5k) and Pal (pdb code: 1oap). The
native complex of TolB and Pal30 (pdb code: 2hqs)
reveals that this target is relatively easy (see Table II), and
the docking was indeed straightforward. The largest clus-
ter from PIPER had a ligand RMSD of 9.8 A, which was
reduced to 8.0 A RMSD by SDU. This was submitted as
Model 6, resulting in acceptable accuracy. Our best pre-
diction came from the 23rd largest cluster of PIPER. The
center of this cluster had 6.0 A ligand RMSD, which was
reduced to 3.0 A by SDU. Although derived from a rela-
tively small cluster, the refined structure (submitted as
Table IITargets and Performance in Rounds 6–11 of CAPRI
Target Level of difficulty Performancea
ID Receptor LigandInterfacearea �2
DGdes
kcal/mol Type Comment Group Community
T20 Homology model Unbound 3756.5 13.24 V Very difficult; conformationalchange
Incorrect loop 3*
T21 Unbound Unbound 1453.3 3.14 III Uncertain; close to region II 1* 4** and 7*T24 Unbound Homology
model751.2 0.51 IV Difficult, requires correct
prediction of helixRemoved C-terminalhelix
4*
T25 Unbound Bound 751.2 0.51 IV Difficult but doable; smallarea, but somewhathydrophobic
1** and 3* 1*** and 13**and 20*
T26 Unbound model Bound 2562.1 6.82 II Easy/uncertain (close toregion III)
2** and 1* 22** and 20*
T27 Unbound Unbound 520.0 4.74 IV (A:D) Very difficult None None1190.3 1.77 IV (A:C) Difficult/undertain 1* (ClusPro) 2** and 55*
aAcceptable (*), medium (**), and high (***) accuracy predictions.
Y. Shen et al.
740 PROTEINS DOI 10.1002/prot

Model 3) had the 3rd lowest energy among all models
refined by SDU, and hence was selected for submission.
This model, shown in Figure 1(E), predicted 54% of the
native contacts and had an interface RMSD of 1.2 A. We
had another medium accuracy submission (Model 5)
with 5.5 A ligand RMSD. We note that from mutagenesis
experiments31 it was known that the propeller domain
of TolB is important for binding of Pal. However, since
the rigid body docking by PIPER placed several large
clusters of models in such orientations, including the
largest cluster, we would have had at least acceptable ac-
curacy models even without this information.
Target 27: Hip2 and Ubc9
The challenge was to dock the unbound structures of
Hip2 (pdb code: 1yla) and Ubc9 (pdb code: 1a3s). The
released structure of the complex32 reveals two interfaces,
with the biological state unknown. As shown in Table II,
the A:D interface has very small surface area, suggesting
a very weak complex which is beyond the current dock-
ing methods.18,19 In fact, no submission represented
this orientation. The A:C interaction has a larger inter-
face and hence is easier to predict, but the complex is
still classified as Type IV with high level of difficulty. For
this target PIPER generated a large number of clusters
that did not considerably differ in size and collectively
covered large regions on the receptor surface. Thus, we
were unsure whether our usual strategy of refining the 30
largest clusters would result in any meaningful model. In
addition, studies of an ubiquitin-conjugating enzyme33
suggested that Lys14 of Hip2 should be close to the cata-
lytic Cys93 of Ubc9 to allow sumoylation of Hip2 by
Ubc9. In view of the uncertainty of docking we have gen-
erated a number of models that satisfied this constraint.
However, the experimentally solved complex structure
reveals two unexpected binding interfaces which do not
satisfy the sumoylation constraint, and hence we did not
produce any valid model for Target 27. In contrast, our
server ClusPro generated a model (Model 7) that turned
out to be of acceptable accuracy without employing any
biological information (see article in this issue). During a
follow-up analysis we have further studied the models
provided by PIPER and ClusPro, and made two observa-
tions. First, Model 7 from ClusPro was selected on the
basis of favorable electrostatics, which is not a very im-
portant selection criterion in PIPER. This issue will be
discussed further below. Second, refining this ClusPro-
generated model by SDU yields the lowest energy among
all models for this target.
CONCLUSIONS
We describe a three-step docking and refinement pro-
cedure that includes rigid body docking by PIPER, clus-
tering the generated structures and ranking the clusters
by size, and finally refinement of the 30 largest clusters
by the semiglobal stochastic optimization method called
SDU. For submission to CAPRI, we selected models from
the large clusters if they also had relatively low energies
after refinement. Results in Rounds 6–11 of CAPRI sug-
gest that this algorithm can generally produce at least
acceptable predictions in both unbound/unbound and
unbound/bound docking problems if the interface
regions in the structures of the component proteins do
not heavily differ from the corresponding structures in
the complex. Moreover, in most cases, this level of accu-
racy can be achieved without the use of biological infor-
mation.
The above algorithm was also tested on the docking
benchmarks.7,34 Our strategy of selecting the largest
clusters for refinement and then selecting low energy
structures from these clusters appears to be reasonably
successful, but needs further testing and refinement.
Indeed, for Targets 20, 25, and 26 the medium and ac-
ceptable accuracy predictions came from large clusters.
The failure of producing acceptable predictions for Tar-
gets 20 and 24 was due to large errors in our homology
modeling. The only current target for which the PIPER/
SDU docking algorithm was clearly inferior to a number
of others was Target 27. In fact, for this target the rigid
body docking using PIPER was less productive than
using the DOT program35 in the ClusPro server that
generated an acceptable accuracy model.
Our experience in this round of CAPRI led to two
changes in our strategy. First, due to the progress in
methodology, it may be advisable to put more trust into
the results of docking calculations. In fact, our attempts
to improve the prediction using information available in
the literature did not provide much help for any target,
and led to losing an acceptable model for Target 27.
However, such information may be crucial for docking
problems that are not within the realm of current metho-
dology; for example, if the binding involves large confor-
mational changes or leads to a weak complex. Second,
post-examination of Target 27 revealed why DOT was
superior to PIPER for this target. The DARS potential,
used in PIPER, was extracted from a large protein–pro-
tein interaction database,6 dominated by multisubunit
proteins and enzyme-inhibitor complexes. On the basis
of such structures, the current version of DARS works
best for complexes in which the interface is at least par-
tially hydrophobic. However, the Hip2-Ubc9 complex is
primarily stabilized by electrostatics. Although the poten-
tial in PIPER separately accounts for electrostatics, the
weight of the electrostatic term in the expression is rela-
tively small. In contrast, ClusPro uses a filtering stra-
tegy36 that retains 500 structures with favorable desolva-
tion, and another 1500 structures with the most favorable
electrostatics. This approach is motivated by the fact
that, for a particular complex, it is not possible to a pri-
ori assume the relative contributions of different types of
Performance of PIPER and SDU
DOI 10.1002/prot PROTEINS 741

interactions. The electrostatics filter works well for Target
27, and yields a structure with acceptable accuracy. On
the basis of this experience, the use of PIPER will be
modified to reflect the ClusPro approach as follows: we
will run PIPER twice, with different weights of the elec-
trostatic term in the energy expression, and select some
clusters from both calculations.
ACKNOWLEDGMENTS
For the CPU time used for this paper we are grateful
to the Boston University Scientific Computing and Visua-
lization Center for the opportunity of running the PIPER
program on the Blue Gene/L supercomputer.
REFERENCES
1. Camacho CJ, Gatchell DW, Kimura SR, Vajda S. Scoring docked
conformations generated by rigid-body protein–protein docking.
Proteins 2000;40(3):525–537.
2. Murphy J, Gatchell D, Prasad J, Vajda S. Combination of scoring
functions improves discrimination in protein–protein docking. Pro-
teins 2003;53:840–854.
3. Camacho C, Vajda S. Protein docking along smooth association
pathways. Proc Natl Acad Sci USA 2001;98:10636–10641.
4. Comeau S, Gatchell D, Vajda S, Camacho C. ClusPro: an automated
docking and discrimination method for the prediction of protein
complexes. Bioinformatics 2004;20:45–50.
5. Kozakov D, Clodfelter K, Vajda S, Camacho C. Optimal clustering
for detecting near-native conformations in protein docking. Biophys
J 2005;89:867–875.
6. Kozakov D, Brenke R, Comeau SR, Vajda S. Piper: an fft-based pro-
tein docking program with pairwise potentials. Proteins 2006;65:
392–406.
7. Chen R, Mintseris J, Janin J, Weng Z. A protein–protein docking
benchmark. Proteins 2003;52:88–91.
8. Brooks B, Bruccoleri R, Olafson B, States D, Swaminathan S, Kar-
plus M. CHARMM: a program for macromolecular energy, minimi-
zation, and dynamics calculations. J Comput Chem 1983;4:187–217.
9. Li L, Cheng R, Weng Z. RDOCK: refinement of rigid-body protein
docking predictions. Proteins 2003;53:693–707.
10. Moont G, Gabb H, Sternberg M. Use of pair potentials across pro-
tein interfaces in screening predicted docked complexes. Proteins
1999;35:364–373.
11. Lu H, Lu L, Skolnick J. Development of unified statistical potentials
describing protein–protein interactions. Biophys J 2003;84:1895–
1901.
12. Liu S, Zhang C, Zhou H, Zhou Y. A physical reference state unifies
the structure-derived potential of mean force for protein folding
and binding. Proteins 2004;56:93–101.
13. Mintseris J, Pierce B, Wiehe K, Anderson R, Chen R, Weng Z. Inte-
grating statistical pair potentials into protein complex prediction.
Proteins, to be published.
14. Paschalidis IC, Shen Y, Vakili P, Vajda S. A semi-definite program-
ming-based underestimation method for stochastic global optimiza-
tion in protein docking. IEEE Trans Automatic Control 2007;52:
664–676.
15. Paschalidis IC, Shen Y, Vakili P, Vajda S. Protein–protein docking
with reduced potentials by exploiting multi-dimensional energy
funnels. In Proceedings of the 28th IEEE Engineering in Medicine
and Biology Society (EMBS) Conference, New York City, New York,
2006, pp 5330–5333.
16. Lindemann S, Yershova A, LaValle S. Incremental grid sampling
strategies in robotics. In Proceedings of the Sixth International
Workshop on the Algorithmic Foundations of Robotics, July 11–13,
2004; Utrecht/Zeist, Netherlands.
17. Zhang C, Vasmatzis G, Cornette J. Determination of atomic desol-
vation energies from the structures of crystallized proteins. J Mol
Biol 1997;267:707–726.
18. Vajda S, Camacho C. Protein–protein docking: is the glass half full
or half empty? Trends Biotechnol 2004;22:110–116.
19. Vajda S. Classification of protein complexes based on docking diffi-
culty. Proteins 2005;60:176–180.
20. LoConte L, Chothia C, Janin J. The atomic structure of protein–
protein recognition sites. J Mol Biol 1999;285:2177–2198.
21. Chakrabarti P, Janin J. Dissecting protein–protein recognition sites.
Proteins 2002;47:334–343.
22. Zhang C, Vasmatzis G, Cornette J, DeLisi C. Determination of
atomic desolvation energies from the structures of crystallized pro-
teins. J Mol Biol 1997;267:707–726.
23. Miyazawa S, Jernigan R. Estimation of effective interresidue contact
energies from protein crystal structures: quasi-chemical approxima-
tion. Macromolecules 1985;18:534–552.
24. Vestergaard B, Van L, Andersen G, Nyborg J, Buckingham R,
Kjeldgaard M. Bacterial polypeptide release factor RF2 is structur-
ally distinct from eukaryotic eRF1. Mol Cell 2001;8:1375–1382.
25. Sanchez R, Sali A. Evaluation of comparative protein structure
modeling by MODELLER-3. Proteins 1997;1:50–58.
26. Graille M, Heurgue-Hamard V, Champ S, Mora L, Scrima N, Ulryck
N, van Tilbeurgh H, Buckingham R. Molecular basis for bacterial class
I release factor methylation by PrmC. Mol Cell 2005;20:917–927.
27. Gray J, Moughon S, Wang C, Schueler-Furman O, Kuhlman B,
Rohl C, Baker D. Protein–protein docking with simultaneous opti-
mization of rigid-body displacement and side-chain conformations.
J Mol Biol 2003;331:281–299.
28. Hou Z, Bernstein D, Fox C, Keck J. Structural basis of the Sir1-
origin recognition complex interaction in transcriptional silencing.
Proc Natl Acad Sci USA 2005;102:8489–8494.
29. Menetrey J, Perderiset M, Cicolari J, Dubois T, Elkhatib N, El
Khadali F, Franco M, Chavrier P, Houdusse A. Structural basis for
ARF1-mediated recruitment of ARHGAP21 to golgi membranes.
EMBO J 2007;26:1953–1962.
30. Bonsor D, Grishkovskaya I, Dodson E, Kleanthous C. Molecular
mimicry enables competitive recruitment by a natively disordered
protein. J Am Chem Soc 2007;129:4800–4807.
31. Ray M, Germon P, Vianney A, Portalier R, Lazzaroni J. Identifica-
tion by genetic suppression of Escherichia coli TolB residues impor-
tant for TolB-Pal interaction. J Bacteriol 2000;182:821–824.
32. Walker J, Avvakumov G, Xue S, Newman E, Mackenzie F, Weigelt J,
Sundstrom M, Arrowsmith C. Novel and unexpected complex
between the sumo-1-conjugating enzyme UBC9 and the ubiquitin-
conjugating enzyme E2-25 kDa, to be published.
33. Pichler A, Knipscheer P, Oberhofer E, van Dijk W, Korner R, Olsen
J, Jentsch S, Melchior F, Signma T. SUMO modifications of the
ubiquitin-conjugating enzyme E2-25K. Nat Struct Mol Biol 2005;12:
264–269.
34. Mintseris J, Wiehe K, Pierce B, Anderson R, Chen R, Janin J, Weng
Z. Protein–Protein docking benchmark 2.0: an update. Proteins
2005;60:214–216.
35. Mandell J, Roberts V, Pique M, Kotlovyi V, Mitchell J, Nelson E,
Tsigelny I, Ten Eyck L. Protein docking using continuum electro-
statics and geometric fit. Protein Eng 2001;14:105–113.
36. Camacho C, Gatchell D, Kimura S, Vajda S. Scoring docked confor-
mations generated by rigid-body protein–protein docking. Proteins
2000;40:525–537.
Y. Shen et al.
742 PROTEINS DOI 10.1002/prot