Embed Size (px)
Citation preview
Do we see economies of scale in universities? (or: differentiate, not merge at all cost)
Inserire qui il logo del proprio ateneo
d’appartenenza!
Andrea Bonaccorsi, University of PisaCinzia Daraio, University of Pisa Léopold Simar, Institute of Statistics, UCLTarmo Raty, VATT Finland

Outline
• Introduction• Background• Data• Methodology• Preliminary results• Further developments
Economies of scale
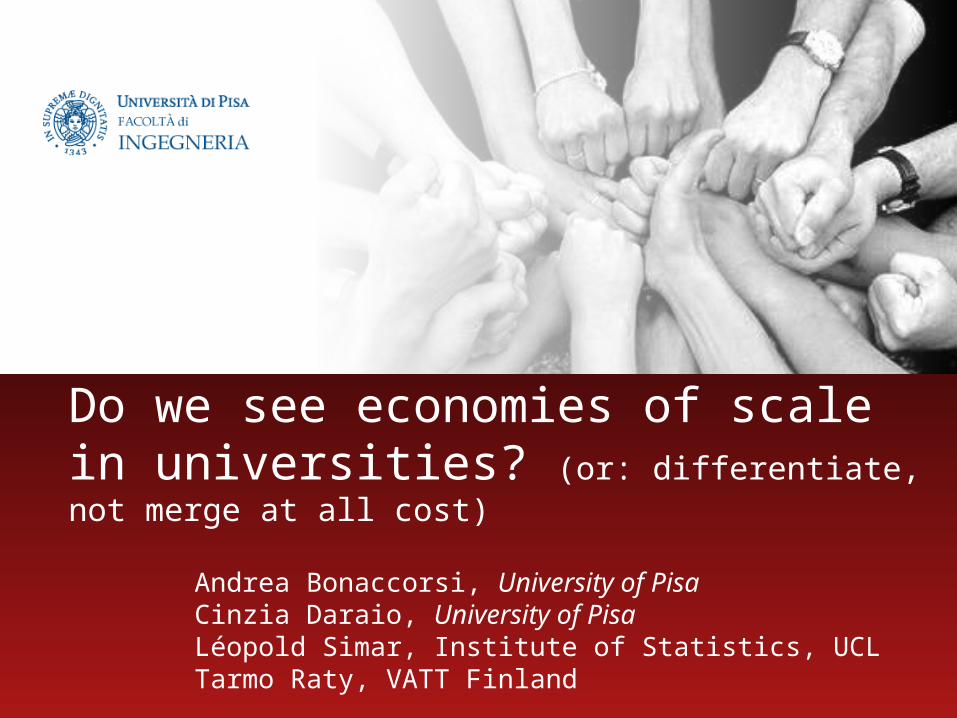
Key issue
– Widespread belief among policy makers that increasing returns and critical mass effects are at place in universities
– Large debate on assumed European “fragmentation” in the university landscape
– Arguments: (a) economies of scale (b) economies of variety (Jacob)
However, empirical evidence is ambiguous– Brinkman (1981), Brinkman and Leslie (1986), Cohn et al. (1989), de Groot, McMahon and
Volkwein (1991), Nelson and Hevert (1992) and Lloyd, Morgan and Williams (1993) – Verry and Layard (1975), Verry and Davies (1976) and Adams and Griliches (1998)– Narin and Hamilton (1996), Abbott, M., & Doucouliagos, C. (2003) – Bonaccorsi and Daraio (2004,2005), Bonaccorsi, Daraio and Simar (2006, 2007)
Important practical policy implications• aggregation of universities (e.g. Australian government in the ‘90s; current
debate in UK and other EU countries on critical mass);• aggregation of institutes in large public research organisations (e.g. CNRS
in France, CNR in Italy).
Background
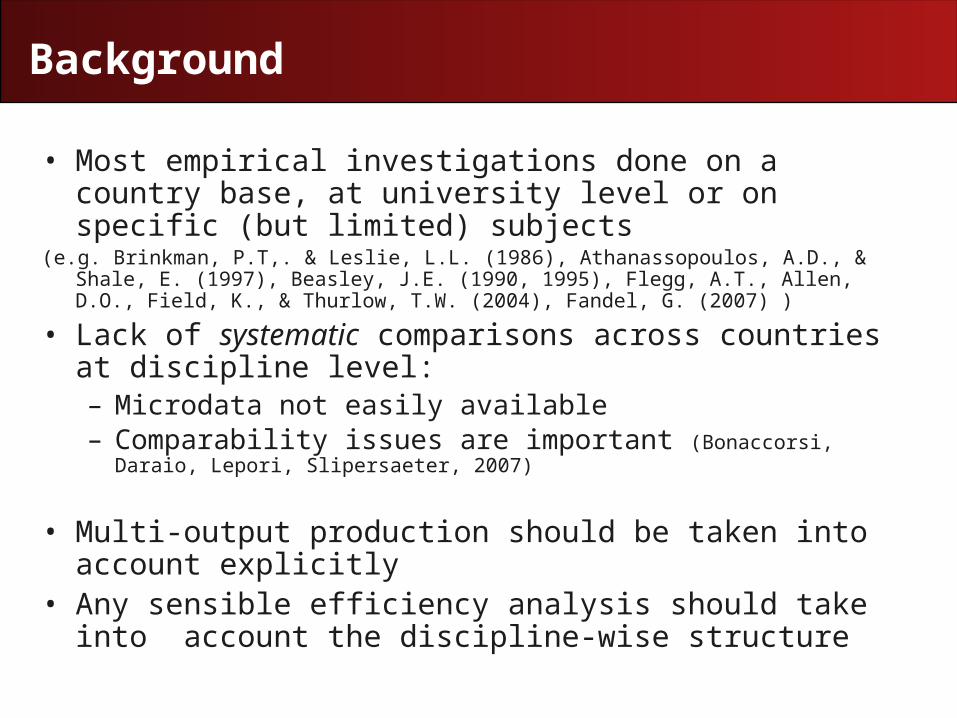
• Most empirical investigations done on a country base, at university level or on specific (but limited) subjects
(e.g. Brinkman, P.T,. & Leslie, L.L. (1986), Athanassopoulos, A.D., & Shale, E. (1997), Beasley, J.E. (1990, 1995), Flegg, A.T., Allen, D.O., Field, K., & Thurlow, T.W. (2004), Fandel, G. (2007) )
• Lack of systematic comparisons across countries at discipline level:– Microdata not easily available– Comparability issues are important (Bonaccorsi, Daraio, Lepori,
Slipersaeter, 2007)
• Multi-output production should be taken into account explicitly
• Any sensible efficiency analysis should take into account the discipline-wise structure
Data and empirical background
Data
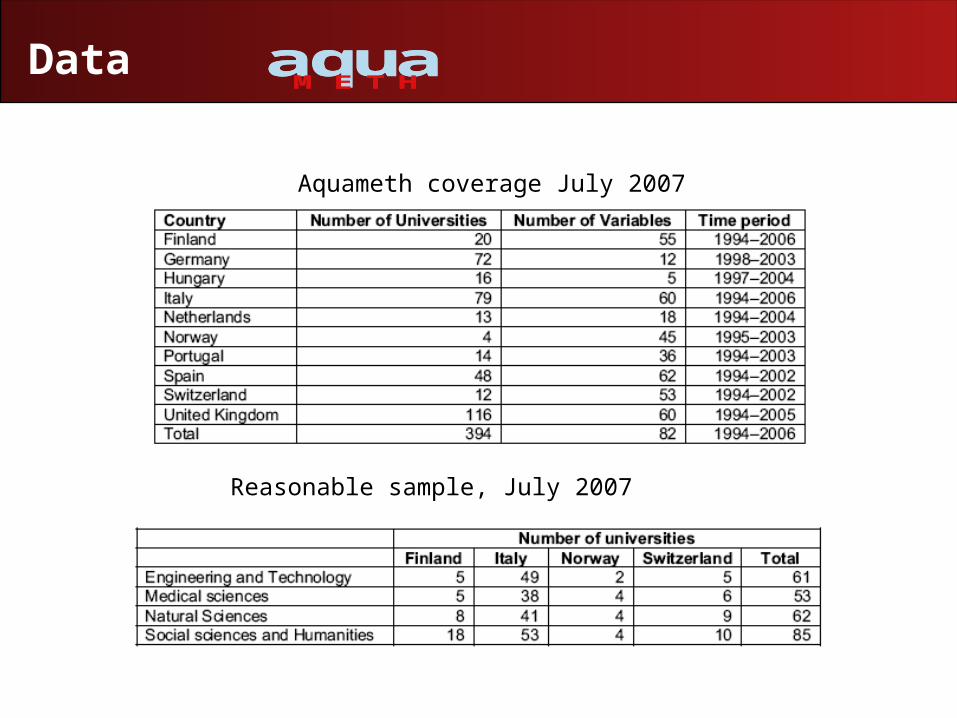
Aquameth coverage July 2007
Reasonable sample, July 2007
aquaM E T H
aquaM E T H
Data
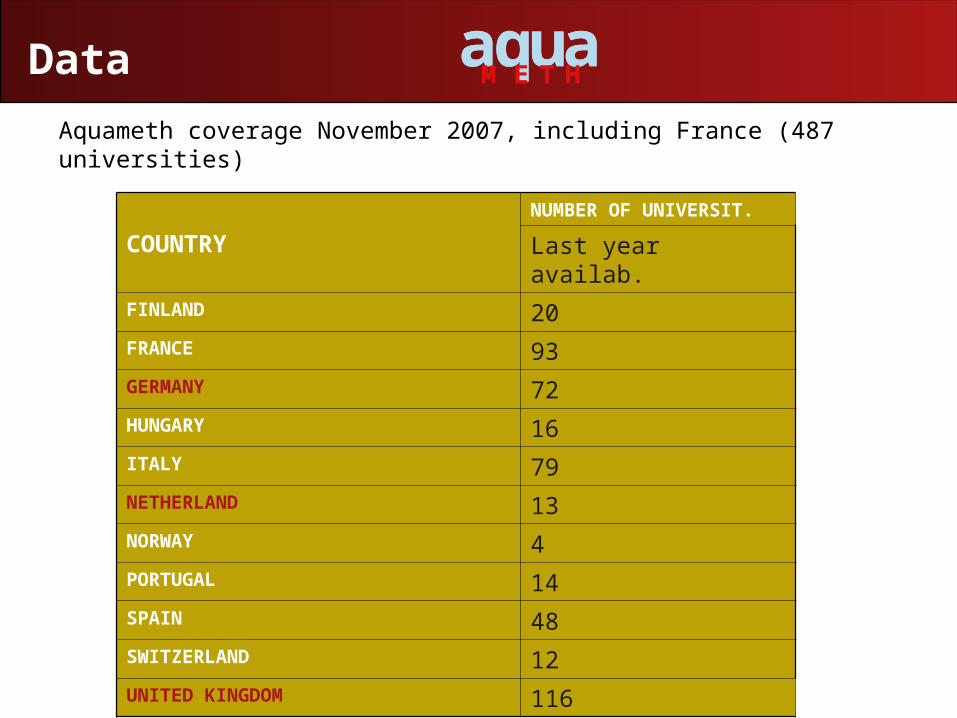
COUNTRYNUMBER OF UNIVERSIT.
Last year availab.FINLAND 20FRANCE 93GERMANY 72HUNGARY 16ITALY 79 NETHERLAND 13NORWAY 4PORTUGAL 14SPAIN 48SWITZERLAND 12UNITED KINGDOM 116
Aquameth coverage November 2007, including France (487 universities)
aquaM E T H
aquaM E T H

Methodology: Robust Nonparametric efficiency analysis
Advantages of Robust nonparametric techniques vs. conventional production function
– No need for functional specification
– No assumptions on the elasticity of substitution between inputs
– Capture local effects as opposed to estimation of average tendency
– Inclusion of external factors in a general way
Introducing conditional efficiency:an illustration
external factor Z
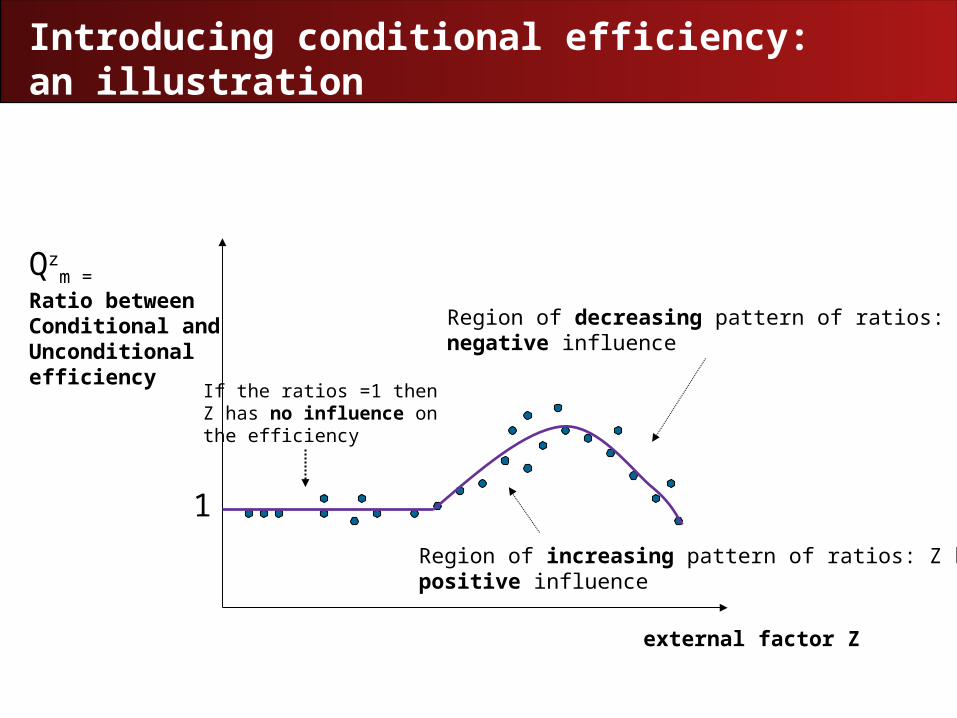
Qzm =
Ratio betweenConditional andUnconditional efficiency
1
If the ratios =1 thenZ has no influence onthe efficiency
Region of increasing pattern of ratios: Z has a positive influence
Region of decreasing pattern of ratios: Z has a negative influence
Empirical analysis
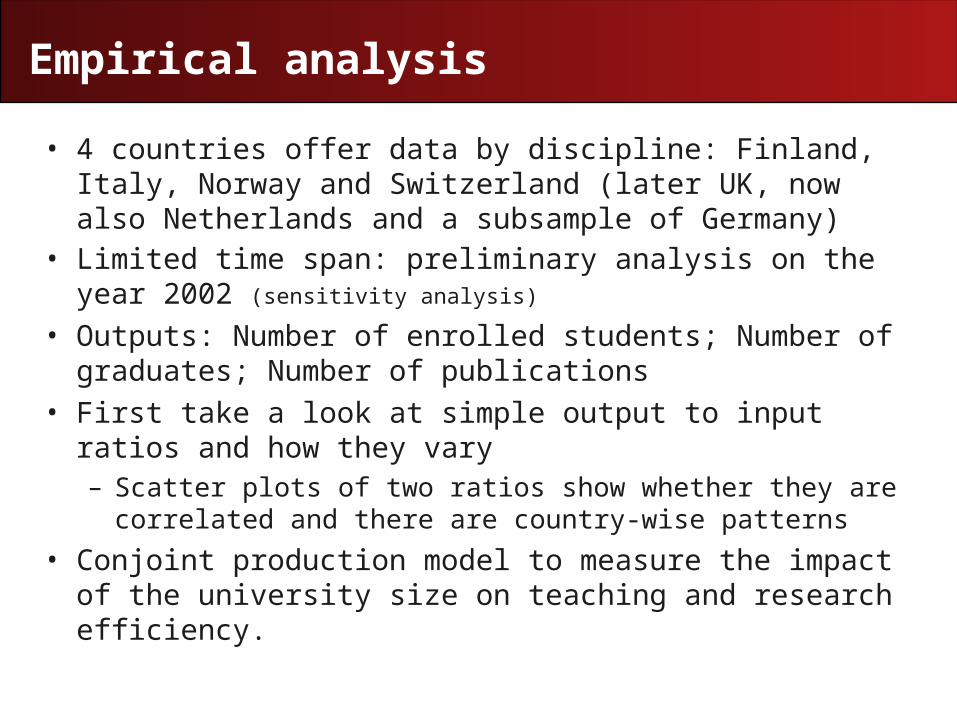
• 4 countries offer data by discipline: Finland, Italy, Norway and Switzerland (later UK, now also Netherlands and a subsample of Germany)
• Limited time span: preliminary analysis on the year 2002 (sensitivity analysis)
• Outputs: Number of enrolled students; Number of graduates; Number of publications
• First take a look at simple output to input ratios and how they vary– Scatter plots of two ratios show whether they are correlated
and there are country-wise patterns
• Conjoint production model to measure the impact of the university size on teaching and research efficiency.
Engineering and Technology Field
0
0,2
0,4
0,6
0,8
1
1,2
0 1 2 3 4 5 6 7
FinlandItalyNorwaySwitzerland
Graduates
Publications
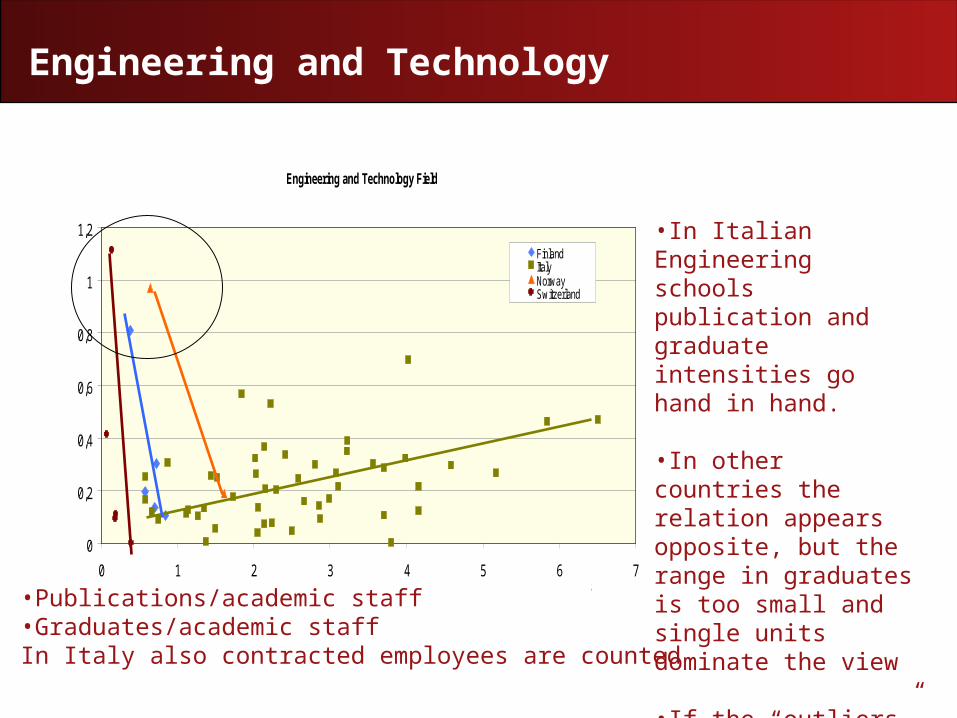
Engineering and Technology
•In Italian Engineering schools publication and graduate intensities go hand in hand.
•In other countries the relation appears opposite, but the range in graduates is too small and single units dominate the view
•If the “outliers” are removed, the figure is quite unique.
•Publications/academic staff•Graduates/academic staffIn Italy also contracted employees are counted
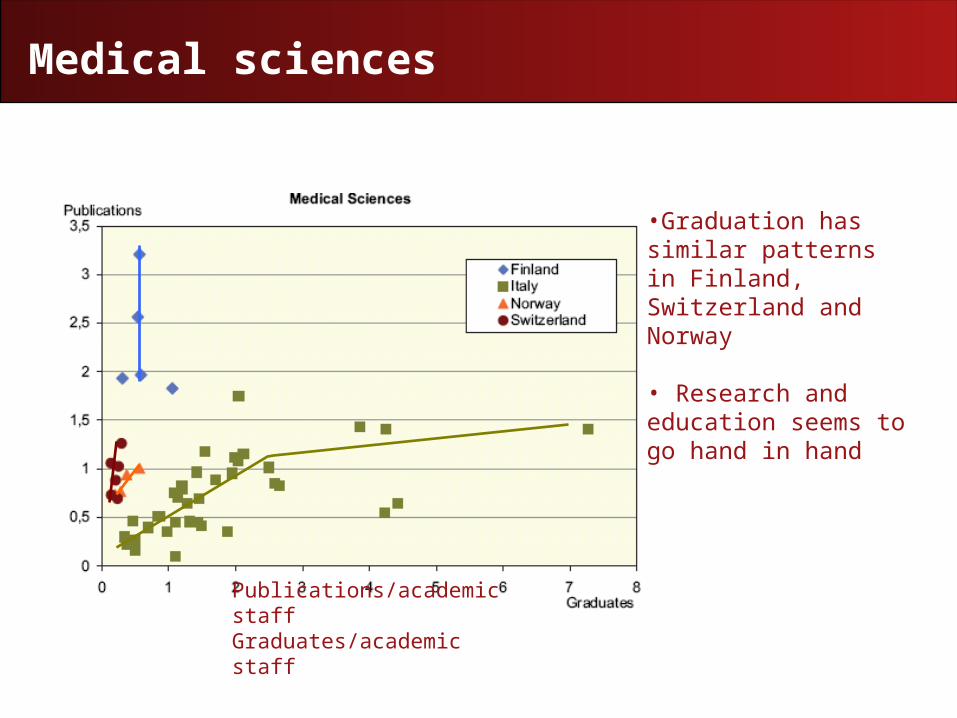
Medical sciences
•Graduation has similar patterns in Finland, Switzerland and Norway
• Research and education seems to go hand in hand
Publications/academic staffGraduates/academic staff
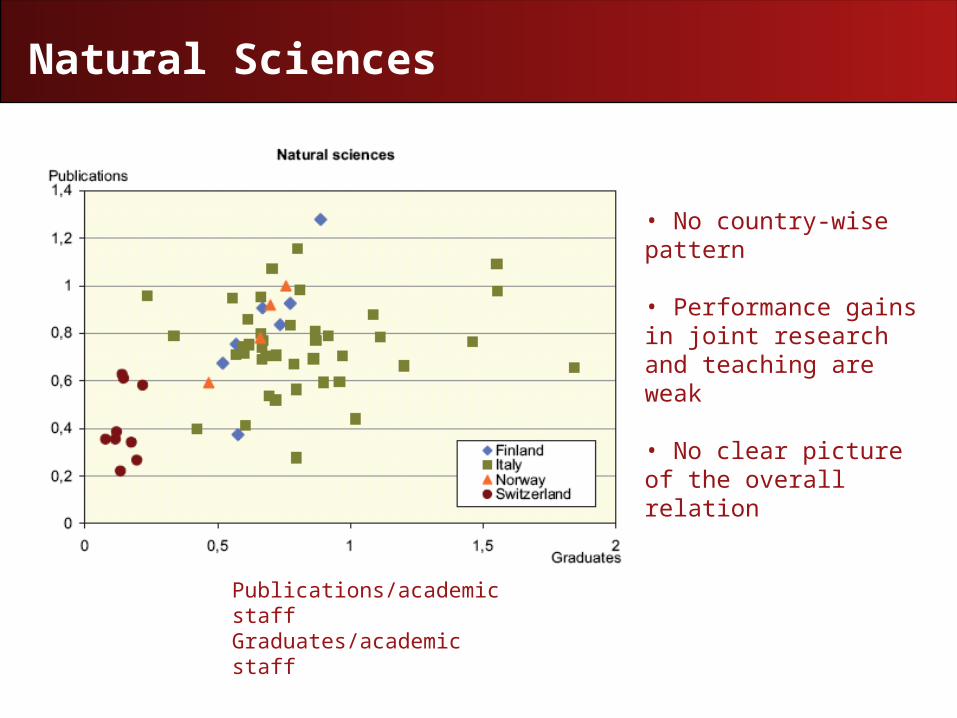
Natural Sciences
• No country-wise pattern
• Performance gains in joint research and teaching are weak
• No clear picture of the overall relation
Publications/academic staffGraduates/academic staff
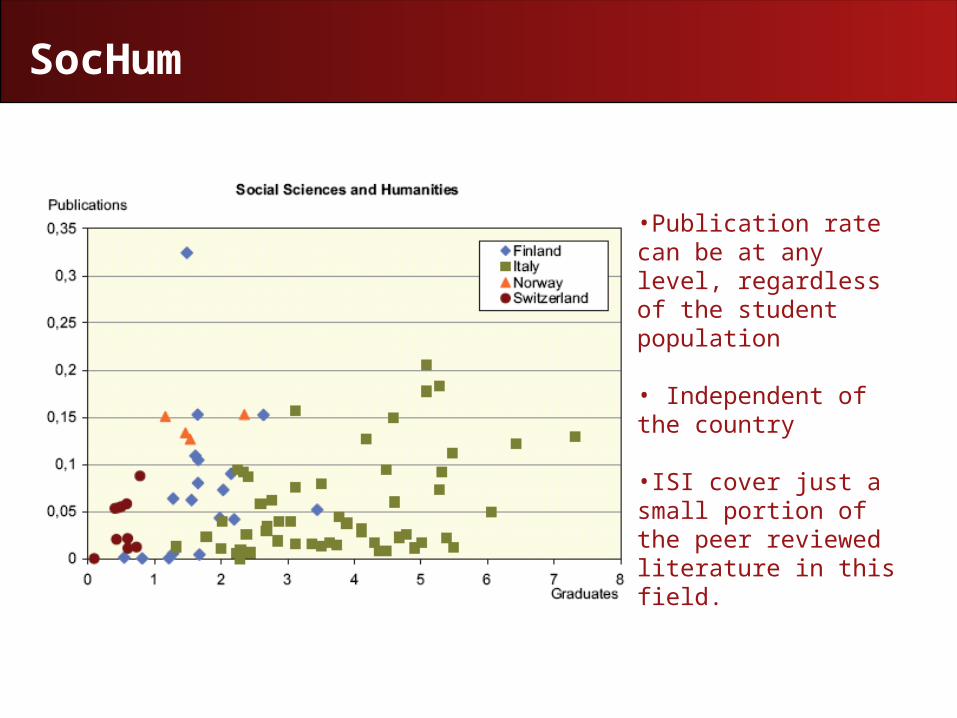
SocHum
•Publication rate can be at any level, regardless of the student population
• Independent of the country
•ISI cover just a small portion of the peer reviewed literature in this field.
Preliminary Comments
• Importance of systematic international analysis discipline-wise: subject mix matters
• The usefulness of robust conditional measures to summarize overall effects
• Too early to draw any policy conclusions• Next Steps
– UK universities, first estimates and then NL and a subsample of G
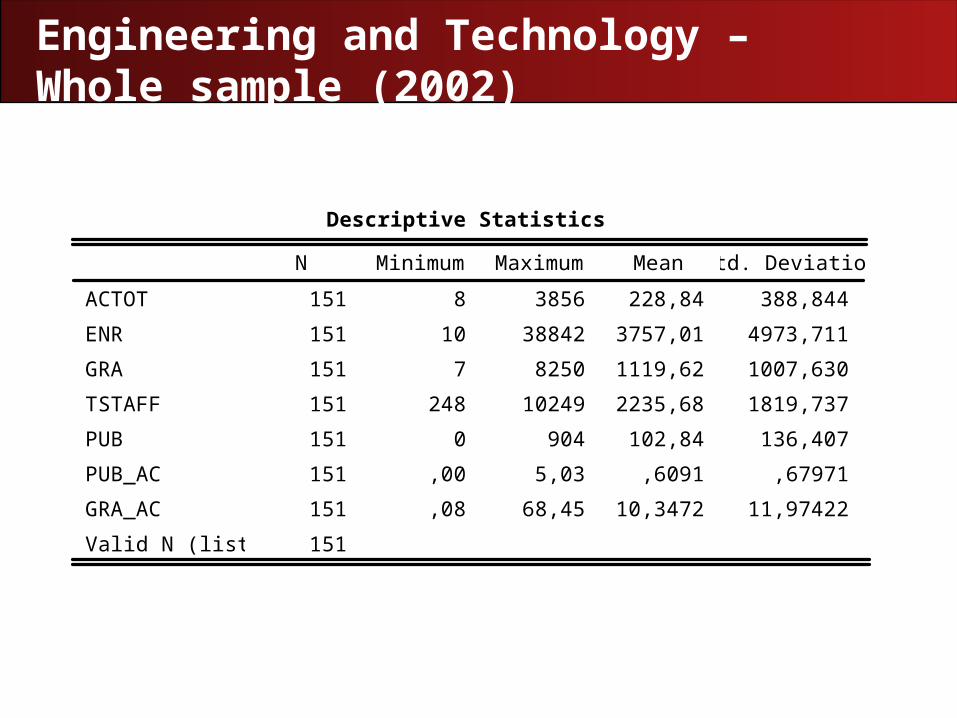
Engineering and Technology – Whole sample (2002)
Descriptive Statistics
151 8 3856 228,84 388,844
151 10 38842 3757,01 4973,711
151 7 8250 1119,62 1007,630
151 248 10249 2235,68 1819,737
151 0 904 102,84 136,407
151 ,00 5,03 ,6091 ,67971
151 ,08 68,45 10,3472 11,97422
151
ACTOT
ENR
GRA
TSTAFF
PUB
PUB_AC
GRA_AC
Valid N (listwise)
N Minimum Maximum Mean Std. Deviation
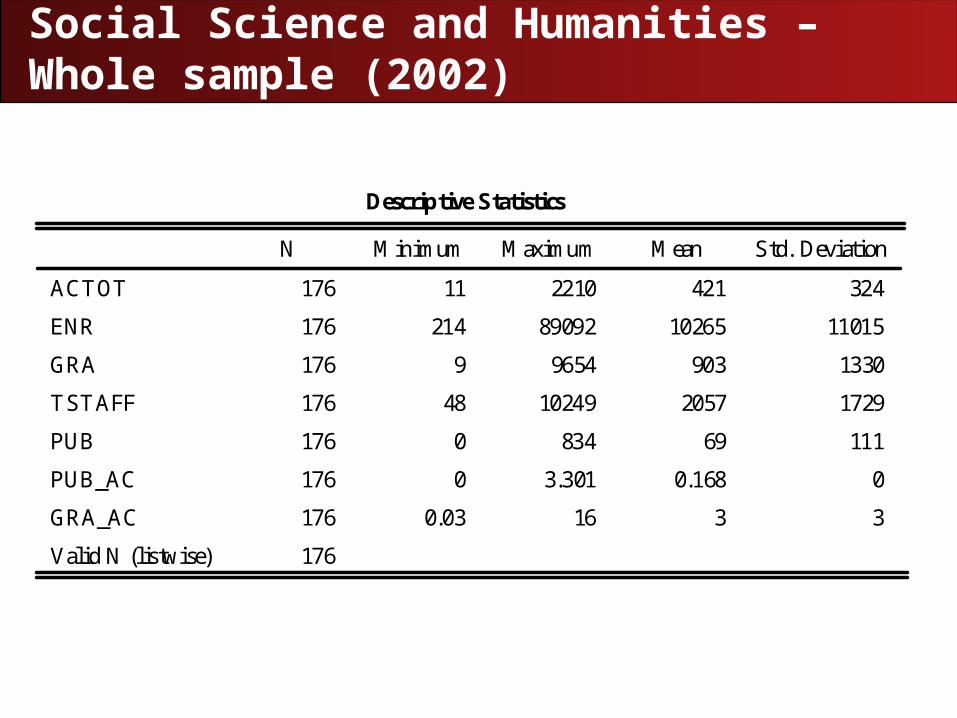
Social Science and Humanities –Whole sample (2002)
Descriptive Statistics
176 11 2210 421 324
176 214 89092 10265 11015
176 9 9654 903 1330
176 48 10249 2057 1729
176 0 834 69 111
176 0 3.301 0.168 0
176 0.03 16 3 3
176
ACTOT
ENR
GRA
TSTAFF
PUB
PUB_AC
GRA_AC
Valid N (listwise)
N Minimum Maximum Mean Std. Deviation
0.5 1 1.5 2 2.5
x 104
0.5
1
1.5
2
2.5
3
values of Z
Qz m
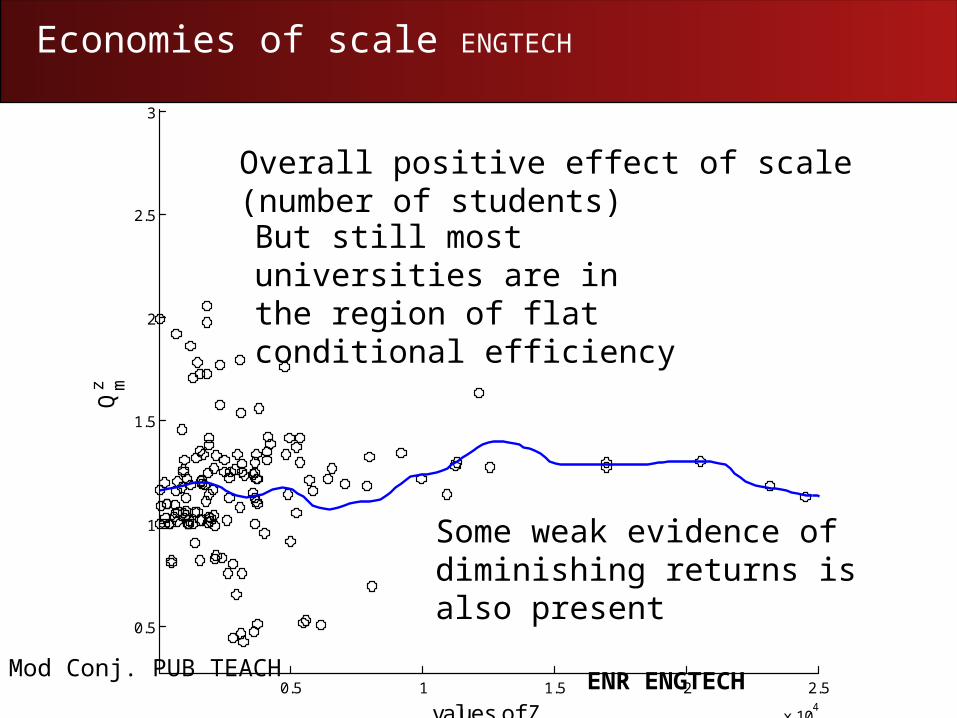
Economies of scale ENGTECH
ENR ENGTECHMod Conj. PUB TEACH
But still most universities are in the region of flat conditional efficiency
Overall positive effect of scale (number of students)
Some weak evidence of diminishing returns is also present
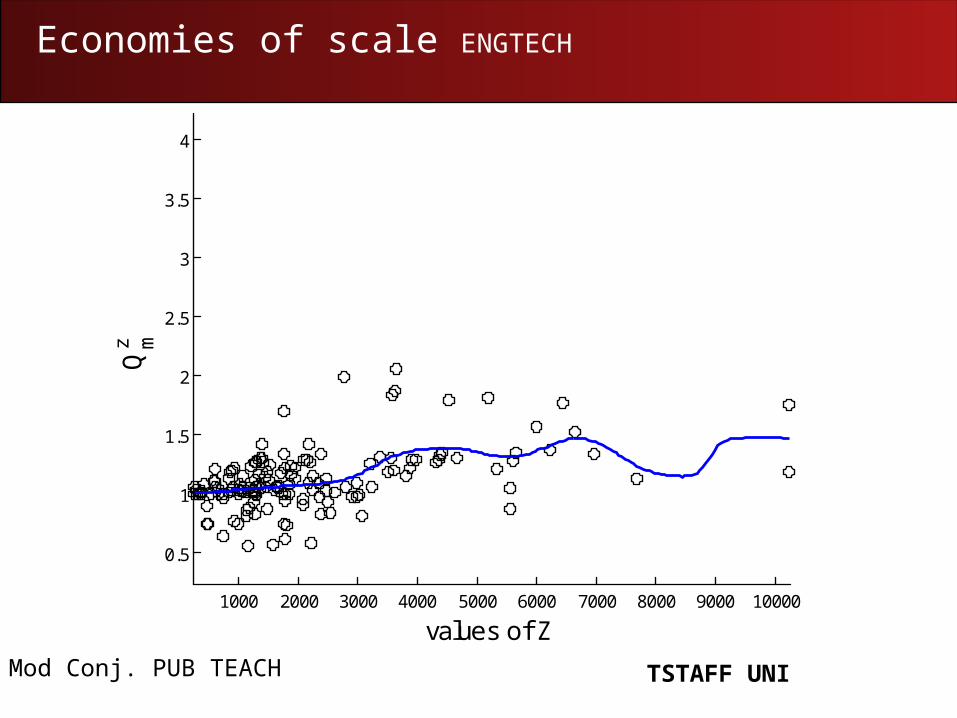
Economies of scale ENGTECH
TSTAFF UNIMod Conj. PUB TEACH
1000 2000 3000 4000 5000 6000 7000 8000 9000 10000
0.5
1
1.5
2
2.5
3
3.5
4
values of Z
Qz m
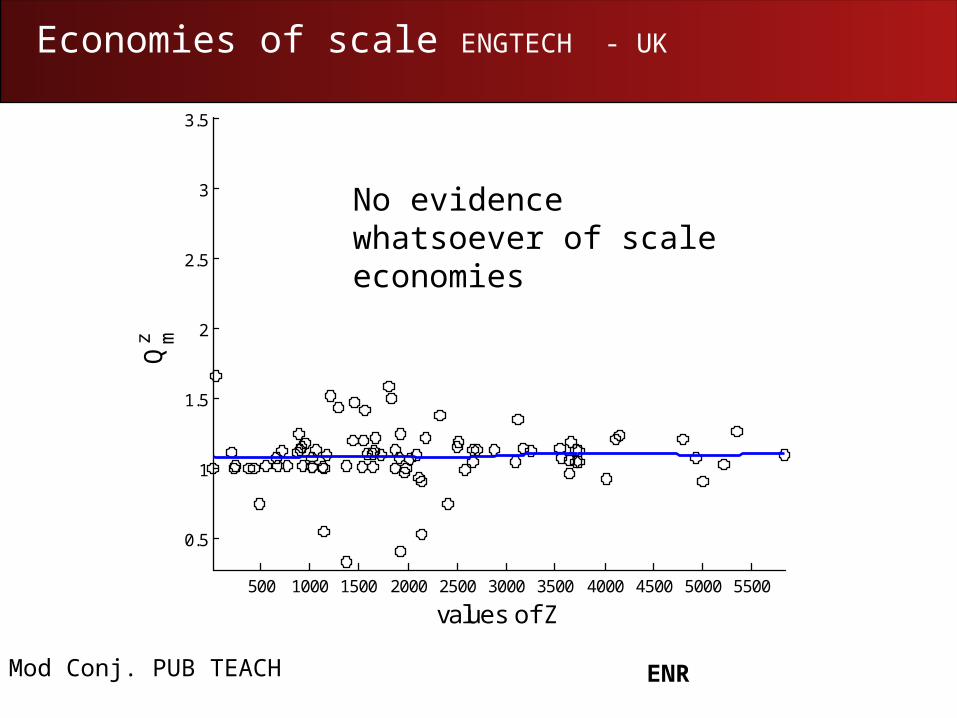
Economies of scale ENGTECH - UK
ENRMod Conj. PUB TEACH
500 1000 1500 2000 2500 3000 3500 4000 4500 5000 5500
0.5
1
1.5
2
2.5
3
3.5
values of Z
Qz m
No evidence whatsoever of scale economies
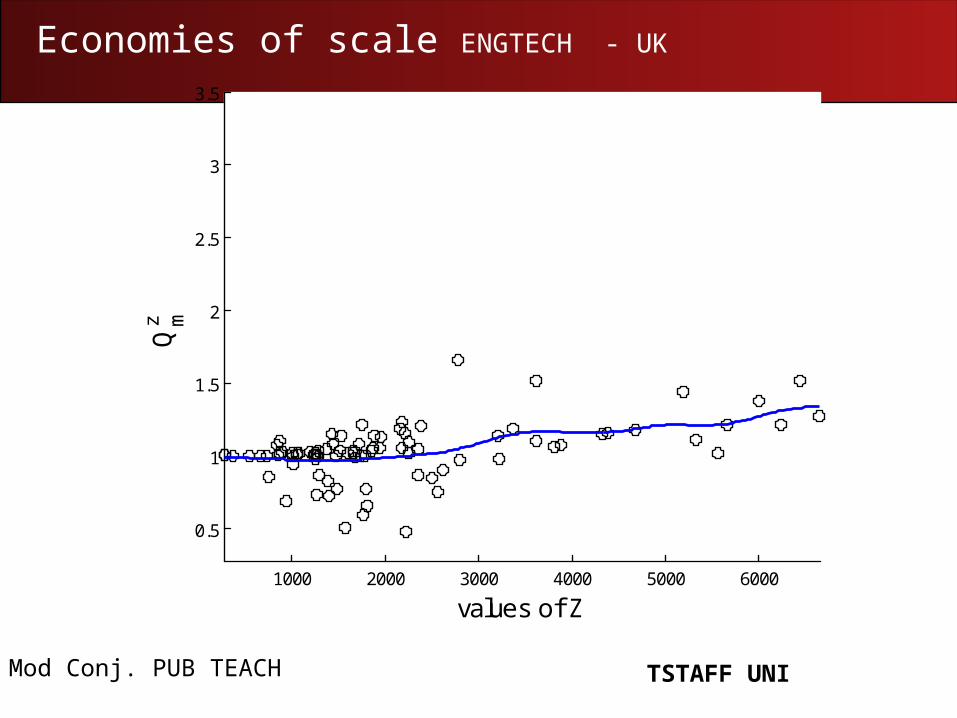
Economies of scale ENGTECH - UK
TSTAFF UNIMod Conj. PUB TEACH
1000 2000 3000 4000 5000 6000
0.5
1
1.5
2
2.5
3
3.5
values of Z
Qz m
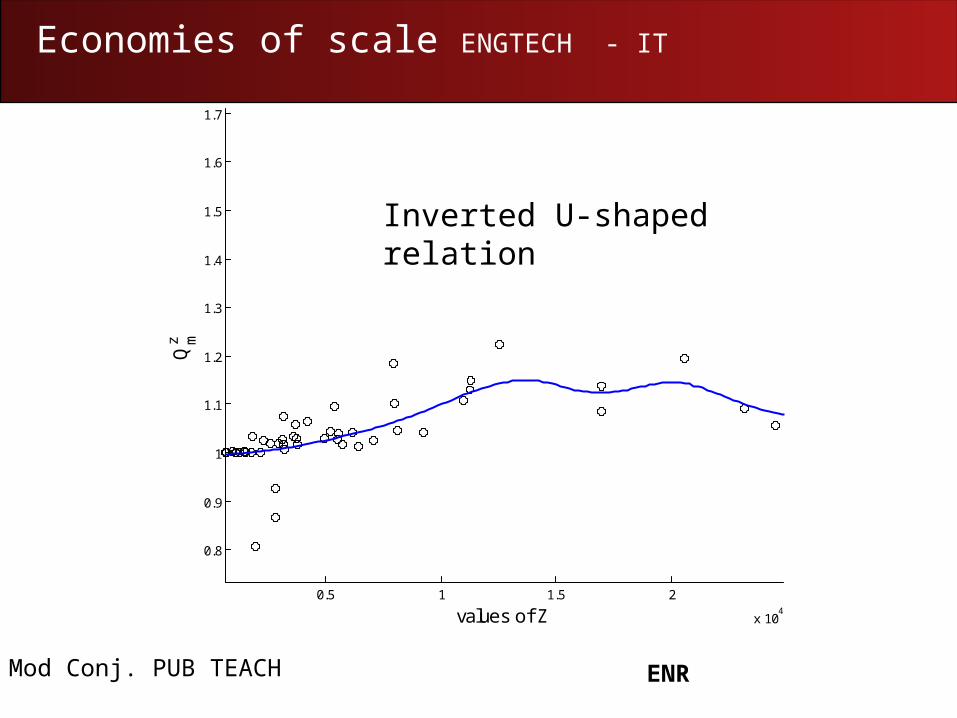
Economies of scale ENGTECH - IT
ENRMod Conj. PUB TEACH
0.5 1 1.5 2
x 104
0.8
0.9
1
1.1
1.2
1.3
1.4
1.5
1.6
1.7
values of Z
Qz m
Inverted U-shaped relation
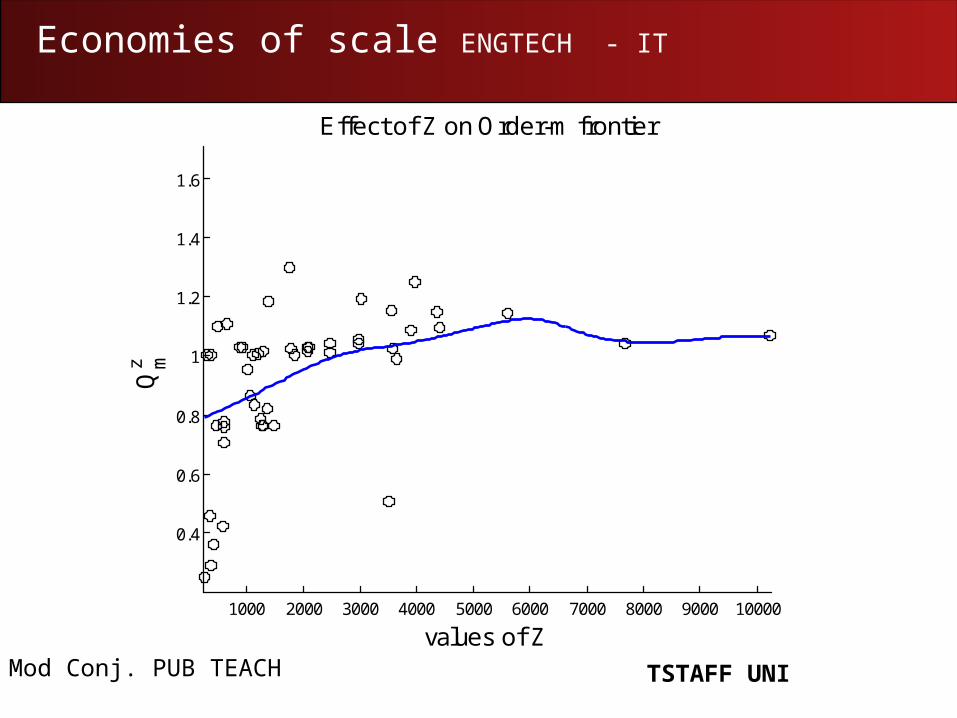
Economies of scale ENGTECH - IT
TSTAFF UNIMod Conj. PUB TEACH
1000 2000 3000 4000 5000 6000 7000 8000 9000 10000
0.4
0.6
0.8
1
1.2
1.4
1.6
Effect of Z on Order-m frontier
values of Z
Qz m
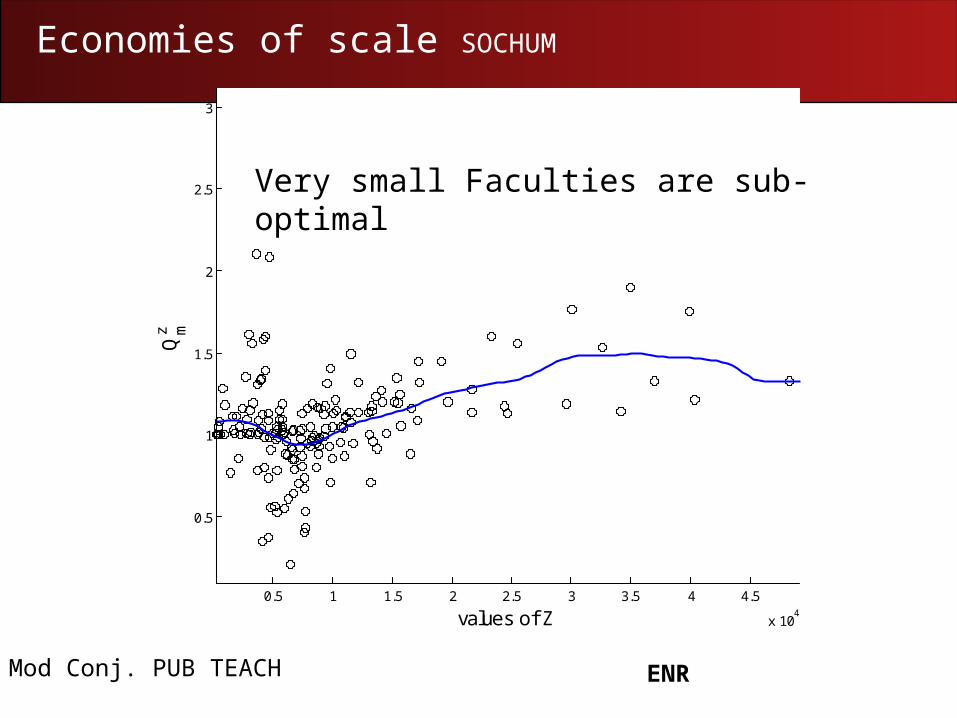
Economies of scale SOCHUM
ENRMod Conj. PUB TEACH
0.5 1 1.5 2 2.5 3 3.5 4 4.5
x 104
0.5
1
1.5
2
2.5
3
values of Z
Qz m
Very small Faculties are sub-optimal
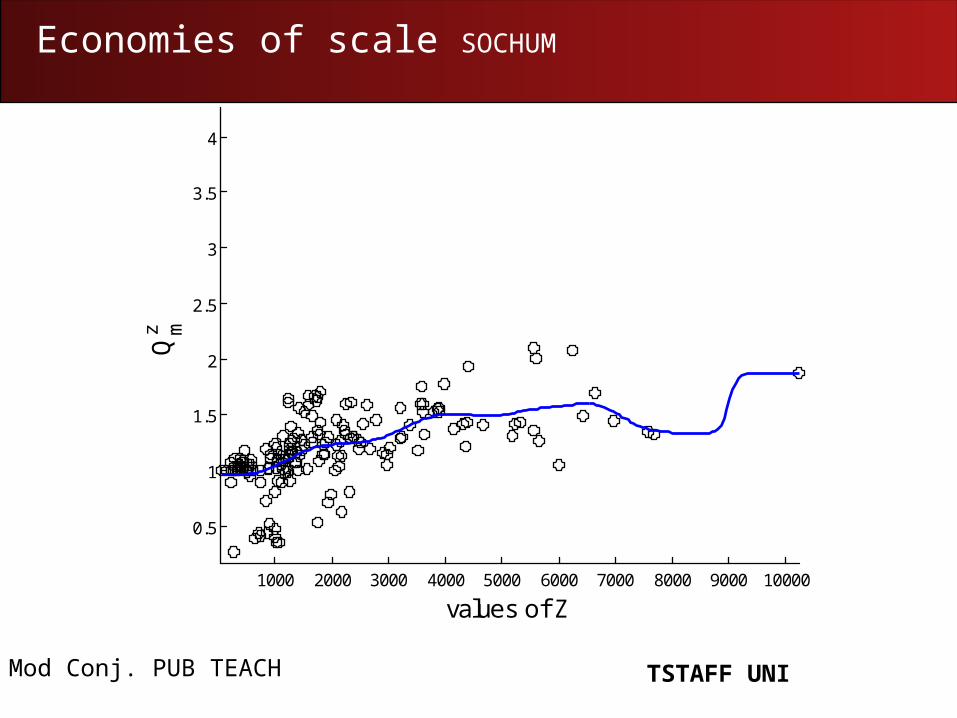
Economies of scale SOCHUM
TSTAFF UNIMod Conj. PUB TEACH
1000 2000 3000 4000 5000 6000 7000 8000 9000 10000
0.5
1
1.5
2
2.5
3
3.5
4
values of Z
Qz m
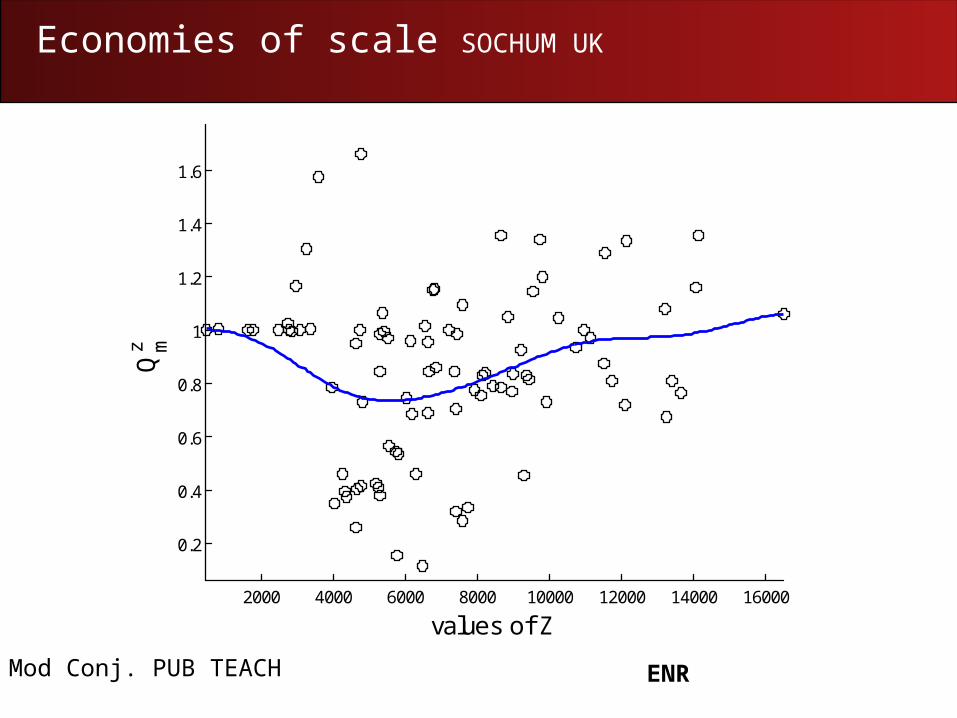
Economies of scale SOCHUM UK
ENRMod Conj. PUB TEACH
2000 4000 6000 8000 10000 12000 14000 16000
0.2
0.4
0.6
0.8
1
1.2
1.4
1.6
values of Z
Qz m
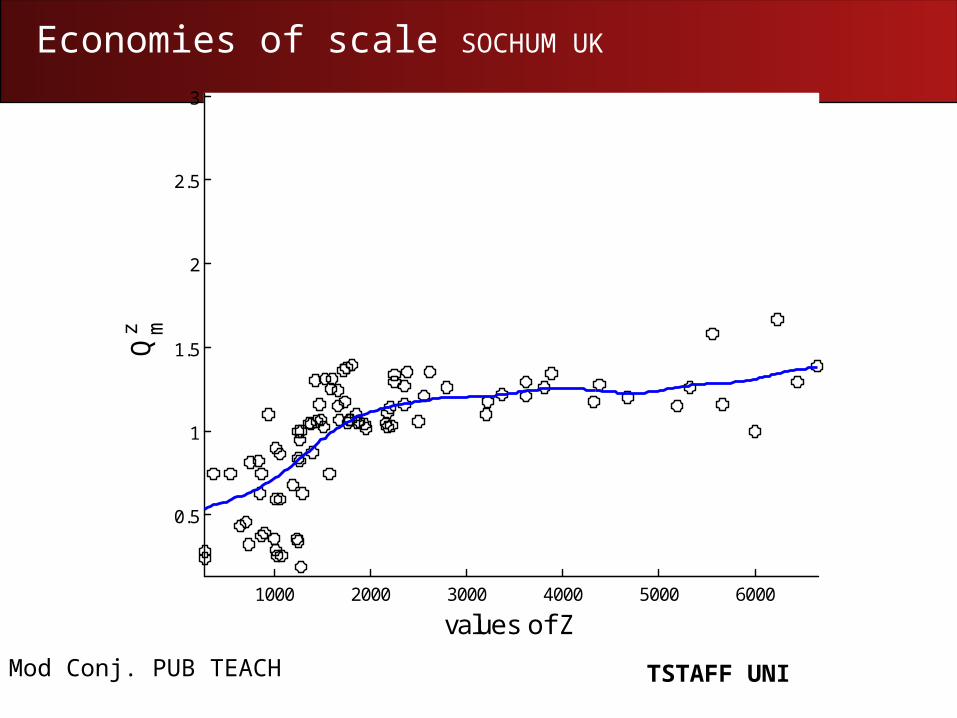
Economies of scale SOCHUM UK
TSTAFF UNIMod Conj. PUB TEACH
1000 2000 3000 4000 5000 6000
0.5
1
1.5
2
2.5
3
values of Z
Qz m
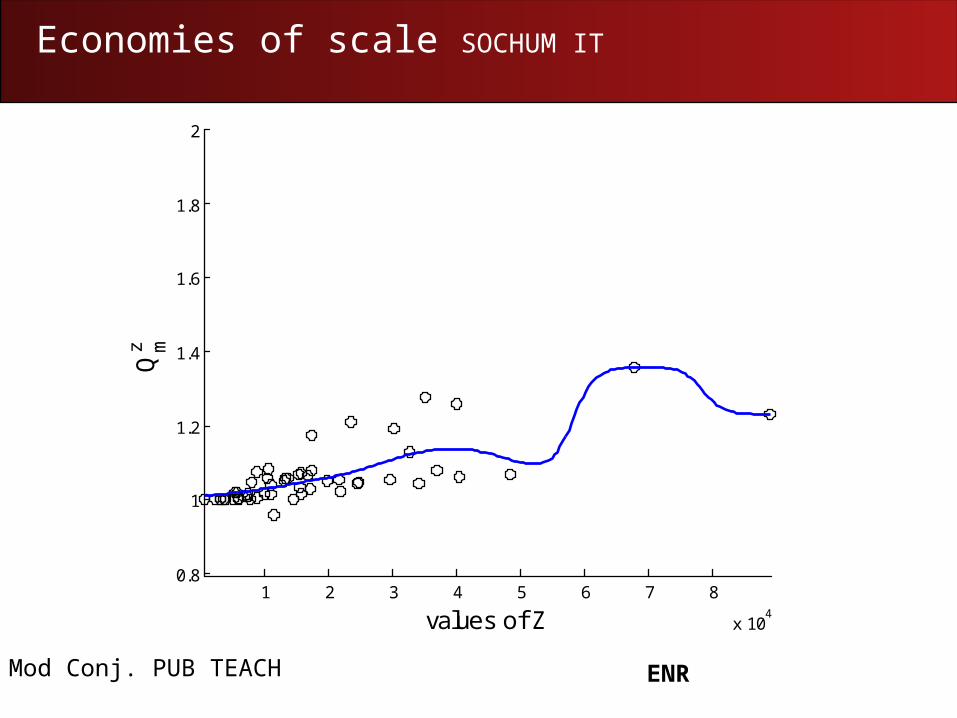
Economies of scale SOCHUM IT
ENRMod Conj. PUB TEACH
1 2 3 4 5 6 7 8
x 104
0.8
1
1.2
1.4
1.6
1.8
2
values of Z
Qz m
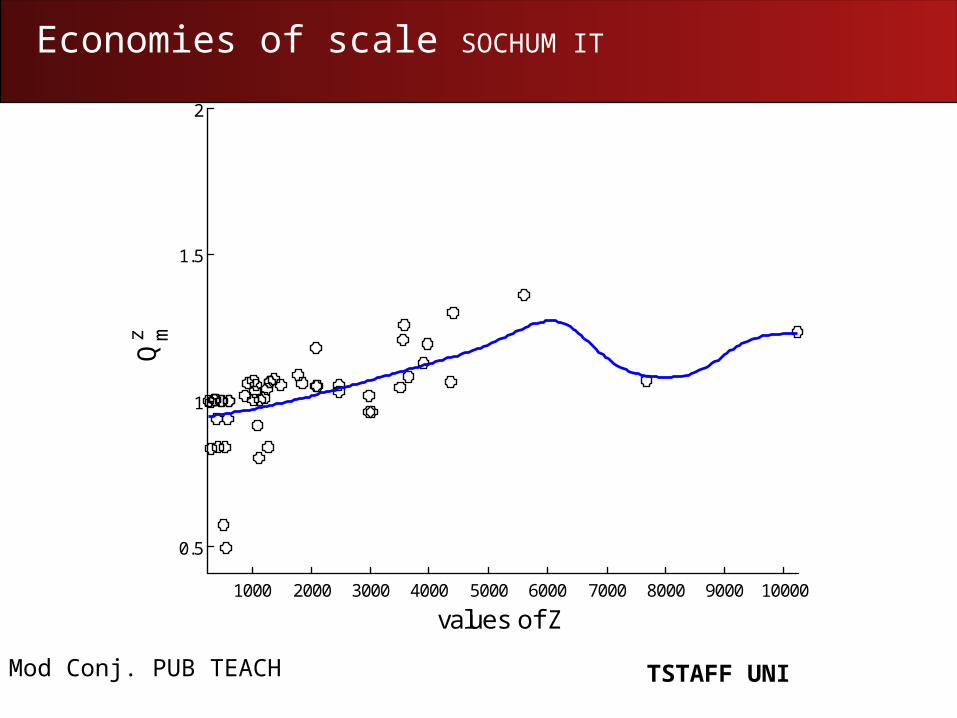
Economies of scale SOCHUM IT
TSTAFF UNIMod Conj. PUB TEACH
1000 2000 3000 4000 5000 6000 7000 8000 9000 10000
0.5
1
1.5
2
values of Z
Qz m
Conclusions on scale and efficiency
• Economies of scale should not be examined at the level of universities at aggregate level
• Differentiated pattern by discipline• Also some country-level differences emerge
No empirical support for a generalized policy of pressure on universities to grow or merge
Rather, each scientific/ educational field must find its own “optimal” scale
Policies of concentration/ merger should be aimed at helping universities to find their own optimal configuration among disciplines, each of which follows differentiated patterns
University as a strategic multi-divisional agent
The key to strategic behaviour is differentiation

Differentiation of European universities in PhD education• PhD education crucial in knowledge society
• Internationalization and mobility
• Competition
• Institutional adaptation
• Differentiation and “division of academic labor” as response to enlargement of the market and competition
Variable observed
Number of graduate students/ Number of undergraduate students (ratio)
Institutional differentiation
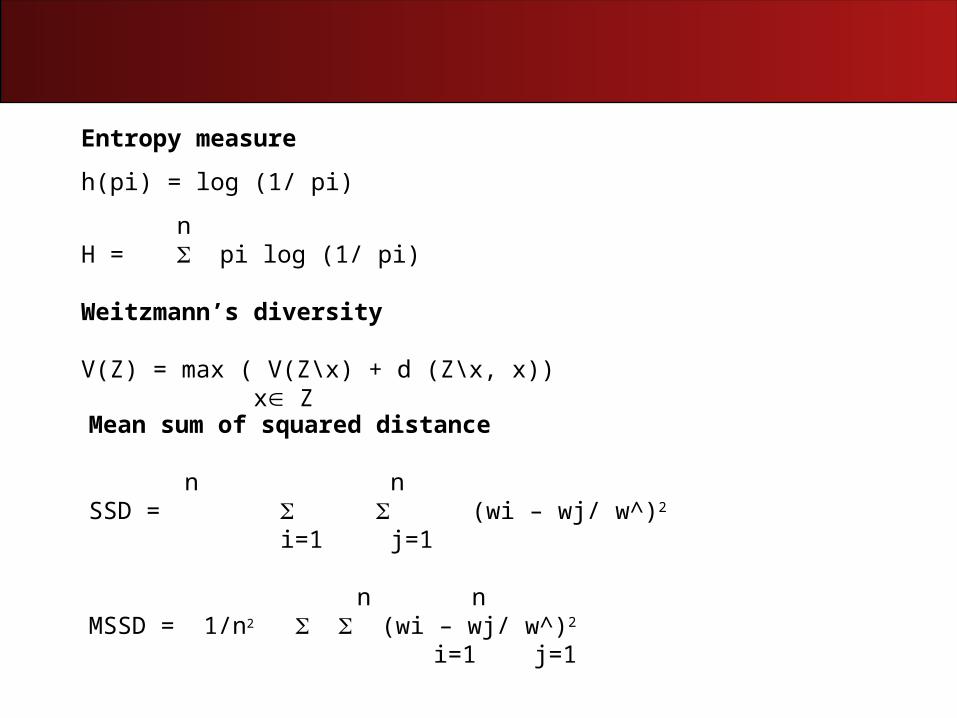
Mean sum of squared distance
n nSSD = (wi – wj/ w^)2
i=1 j=1
n nMSSD = 1/n2 (wi – wj/ w^)2
i=1 j=1
Entropy measure
h(pi) = log (1/ pi)
nH = pi log (1/ pi)
Weitzmann’s diversity
V(Z) = max ( V(Z\x) + d (Z\x, x)) x Z
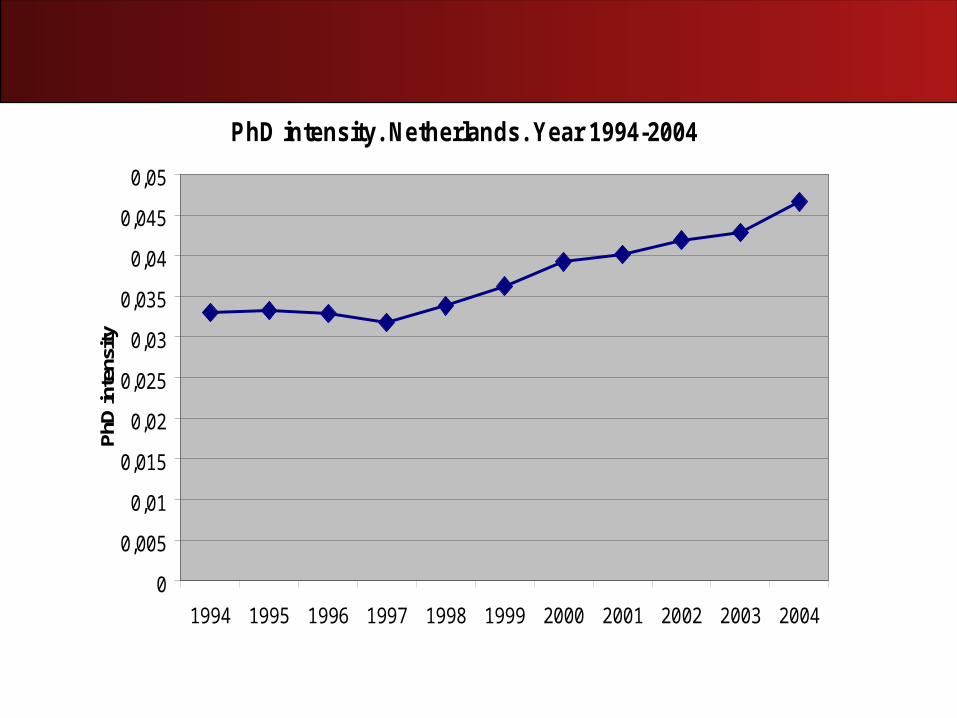
PhD intensity. Netherlands. Year 1994-2004
0
0,005
0,01
0,015
0,02
0,025
0,03
0,035
0,04
0,045
0,05
1994 1995 1996 1997 1998 1999 2000 2001 2002 2003 2004
PhD
inte
nsity
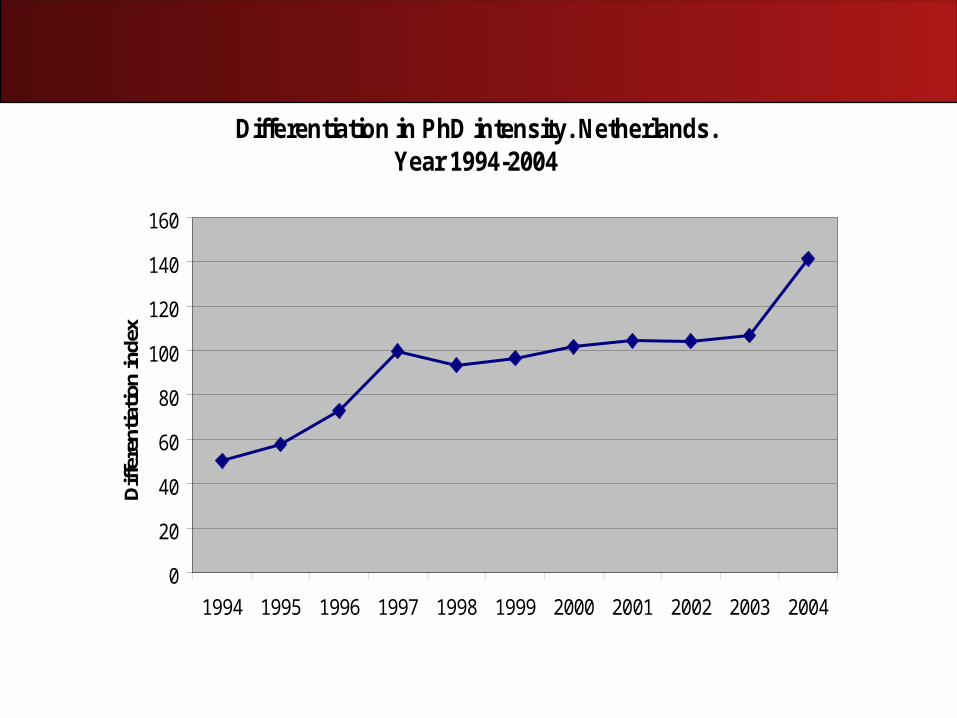
Differentiation in PhD intensity. Netherlands. Year 1994-2004
0
20
40
60
80
100
120
140
160
1994 1995 1996 1997 1998 1999 2000 2001 2002 2003 2004
Diff
eren
tiatio
n in
dex
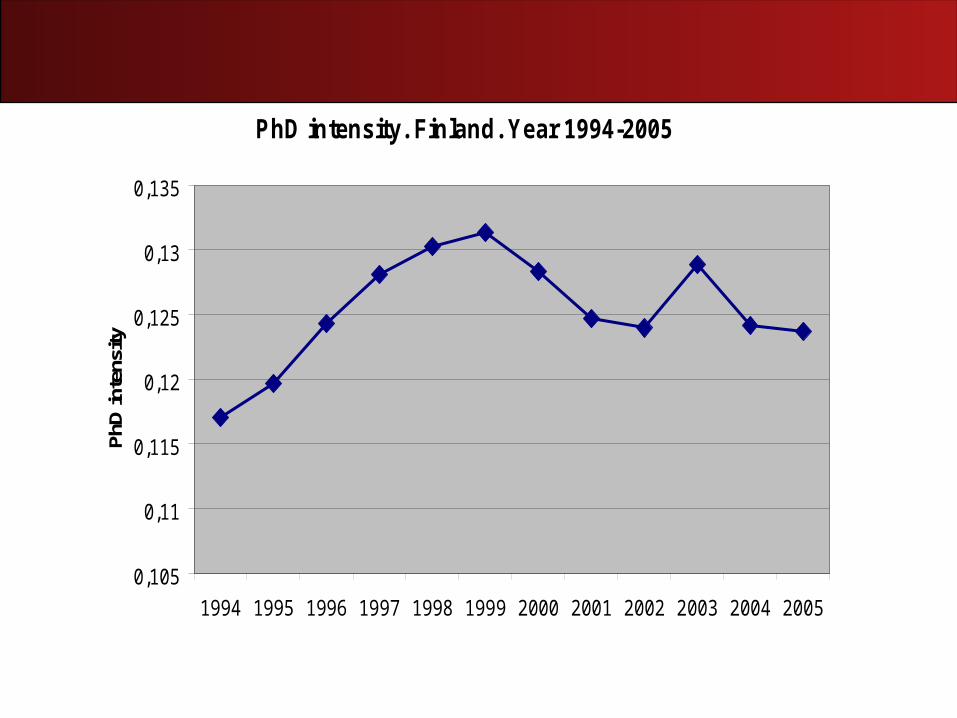
PhD intensity. Finland. Year 1994-2005
0,105
0,11
0,115
0,12
0,125
0,13
0,135
1994 1995 1996 1997 1998 1999 2000 2001 2002 2003 2004 2005
PhD
inte
nsity
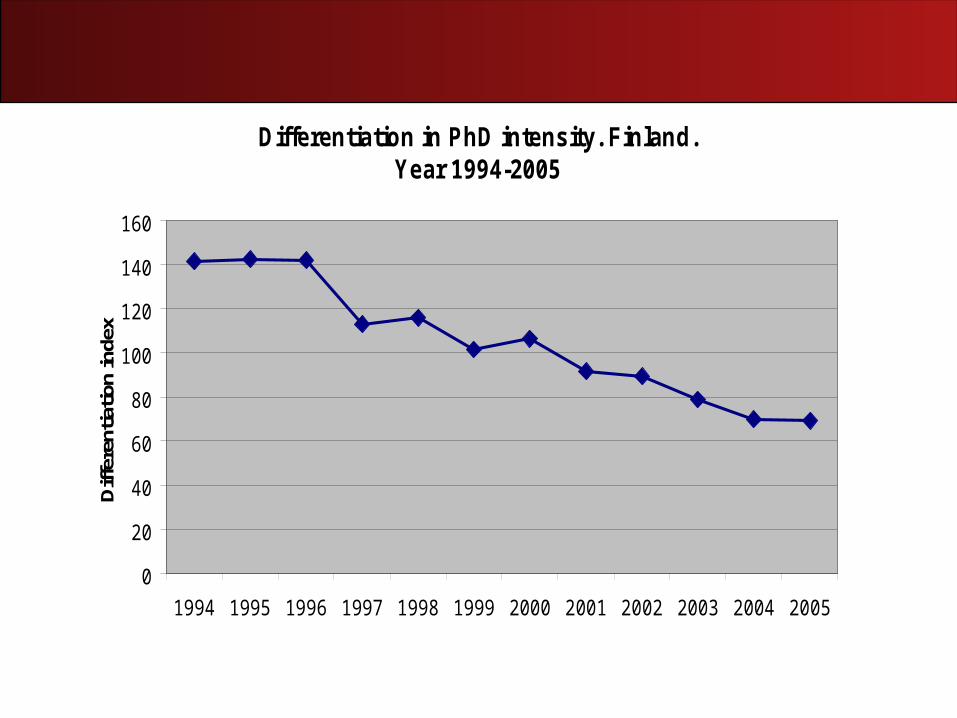
Differentiation in PhD intensity. Finland. Year 1994-2005
0
20
40
60
80
100
120
140
160
1994 1995 1996 1997 1998 1999 2000 2001 2002 2003 2004 2005
Diff
eren
tiatio
n in
dex
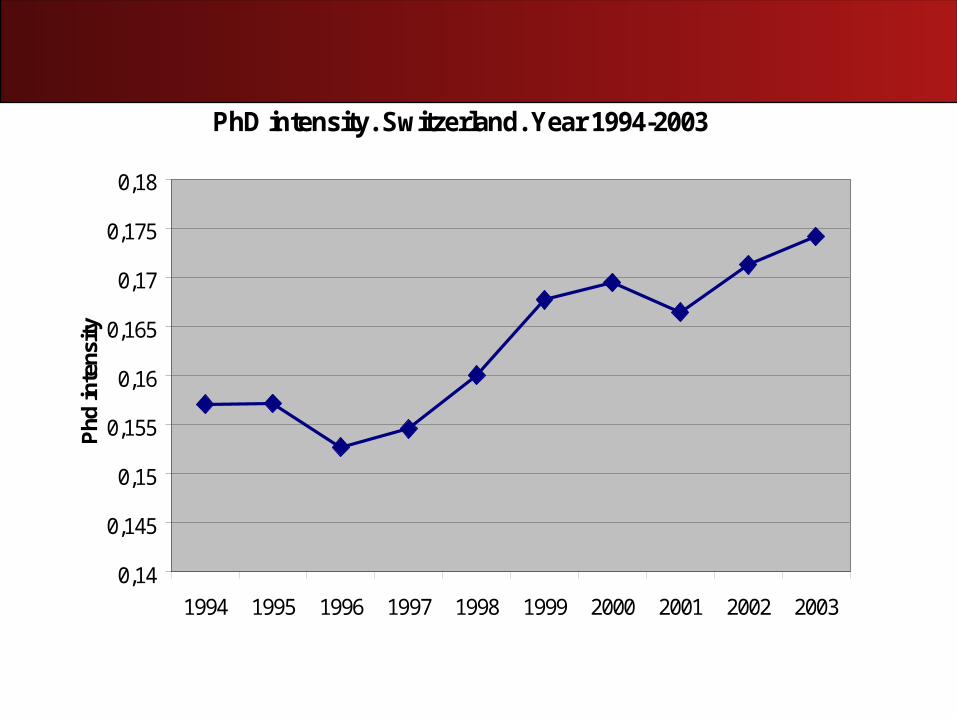
PhD intensity. Switzerland. Year 1994-2003
0,14
0,145
0,15
0,155
0,16
0,165
0,17
0,175
0,18
1994 1995 1996 1997 1998 1999 2000 2001 2002 2003
Phd
inte
nsity
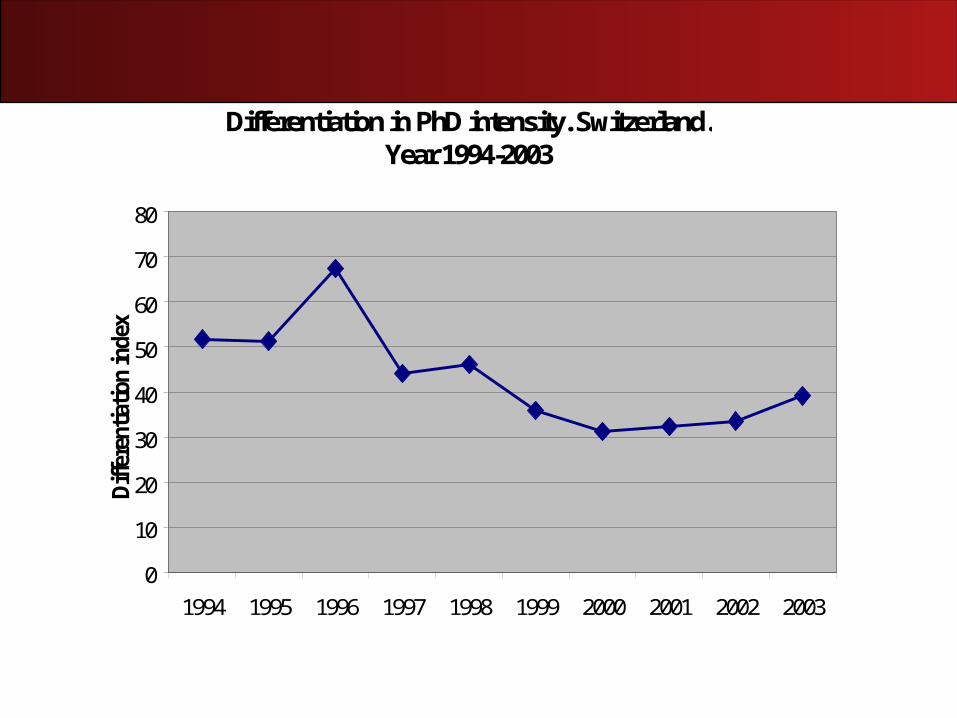
Differentiation in PhD intensity. Switzerland. Year 1994-2003
0
10
20
30
40
50
60
70
80
1994 1995 1996 1997 1998 1999 2000 2001 2002 2003
Diff
eren
tiatio
n in
dex
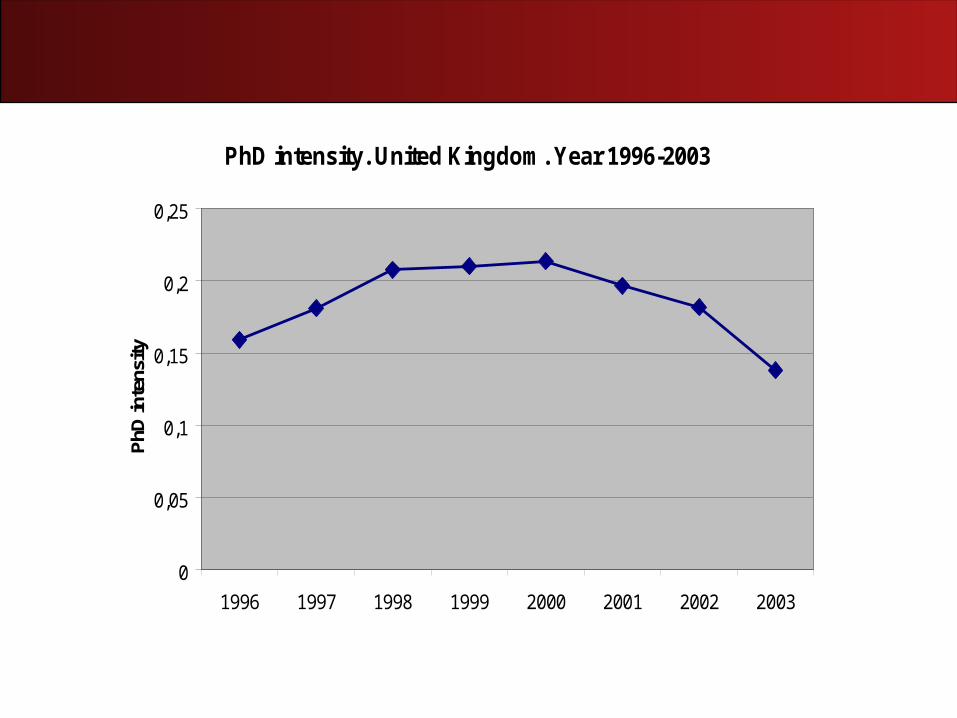
PhD intensity. United Kingdom. Year 1996-2003
0
0,05
0,1
0,15
0,2
0,25
1996 1997 1998 1999 2000 2001 2002 2003
PhD
inte
nsity
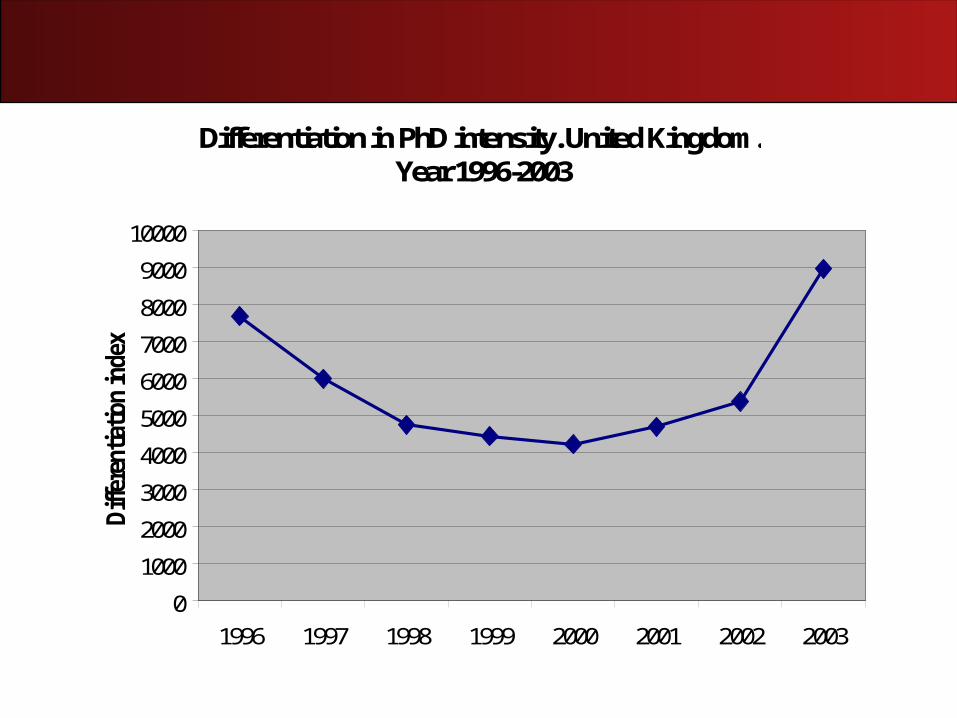
Differentiation in PhD intensity. United Kingdom. Year 1996-2003
0
1000
2000
3000
4000
5000
6000
7000
8000
9000
10000
1996 1997 1998 1999 2000 2001 2002 2003
Diff
eren
tiatio
n in
dex
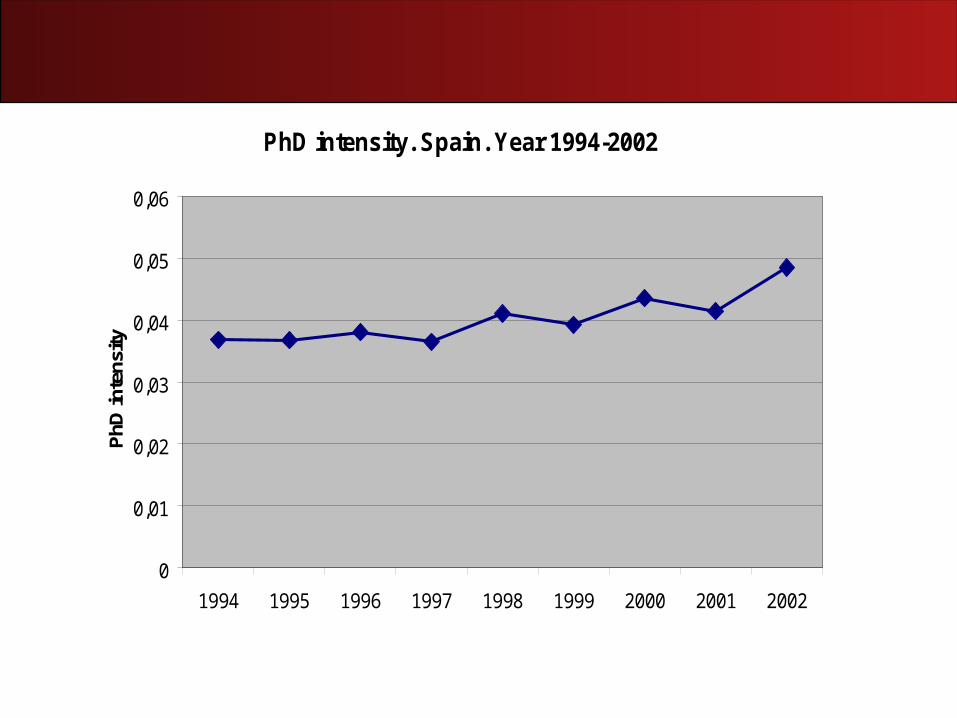
PhD intensity. Spain. Year 1994-2002
0
0,01
0,02
0,03
0,04
0,05
0,06
1994 1995 1996 1997 1998 1999 2000 2001 2002
PhD
inte
nsity
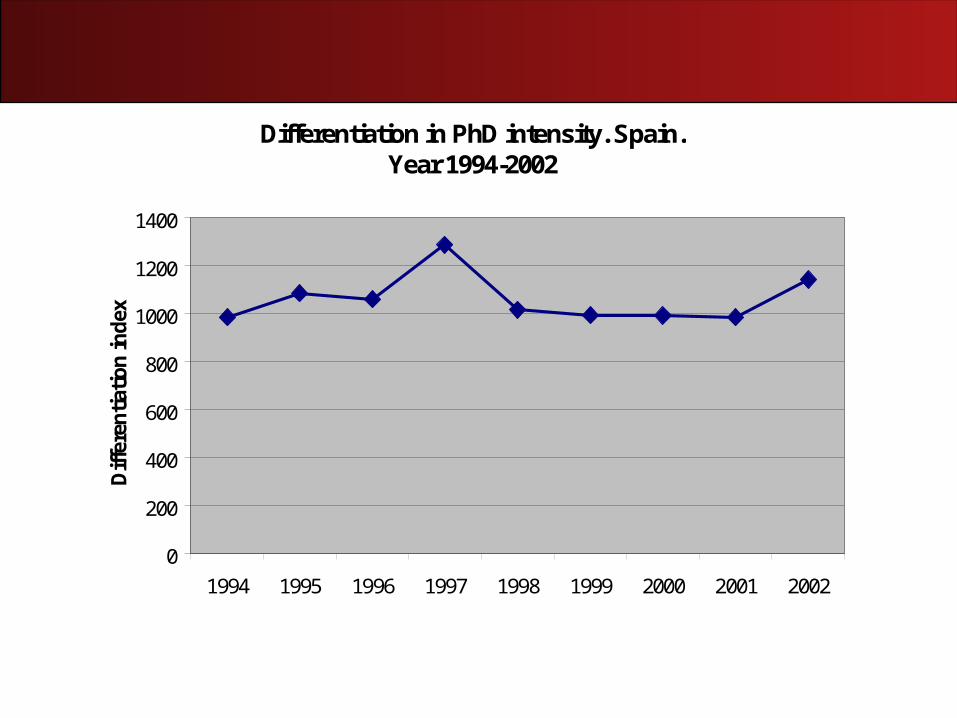
Differentiation in PhD intensity. Spain. Year 1994-2002
0
200
400
600
800
1000
1200
1400
1994 1995 1996 1997 1998 1999 2000 2001 2002
Diffe
rentiat
ion in
dex
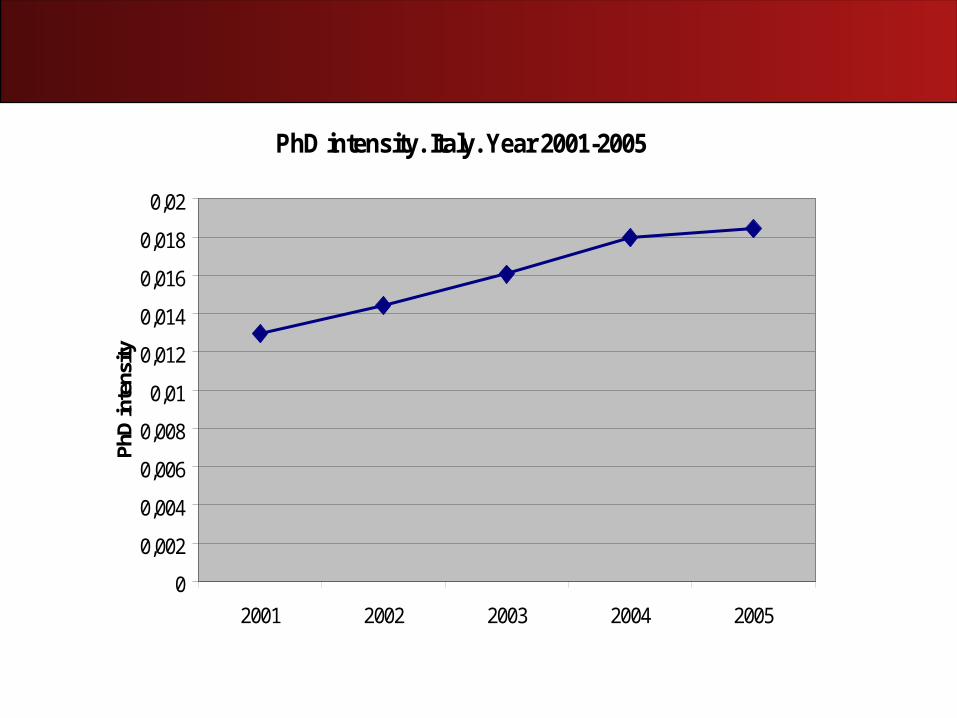
PhD intensity. Italy. Year 2001-2005
0
0,002
0,004
0,006
0,008
0,01
0,012
0,014
0,016
0,018
0,02
2001 2002 2003 2004 2005
PhD
inte
nsity
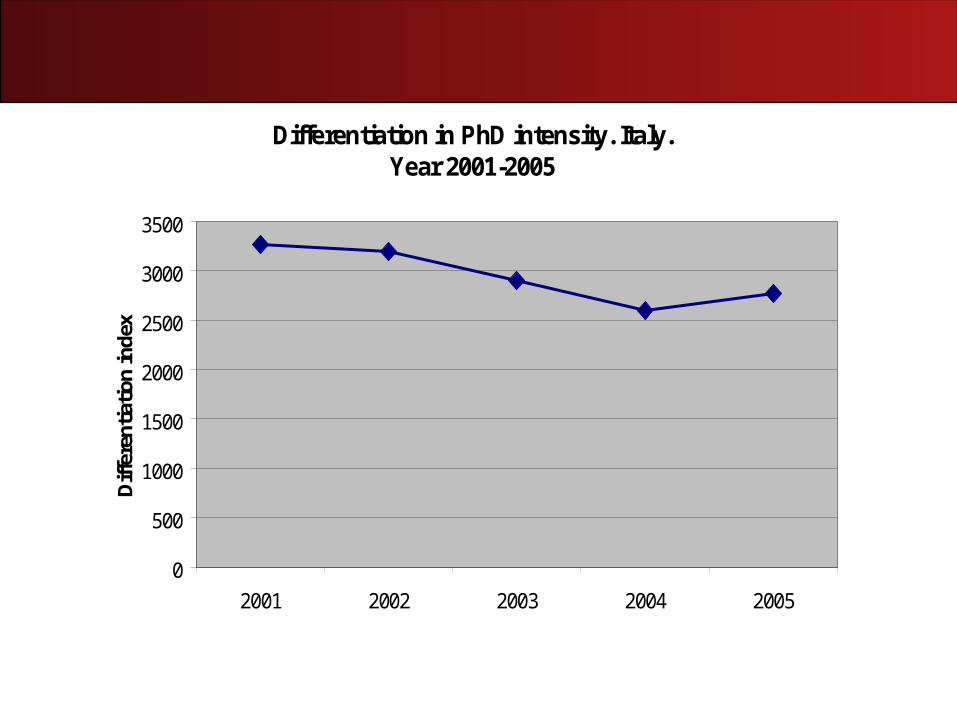
Differentiation in PhD intensity. Italy. Year 2001-2005
0
500
1000
1500
2000
2500
3000
3500
2001 2002 2003 2004 2005
Diff
eren
tiatio
n in
dex
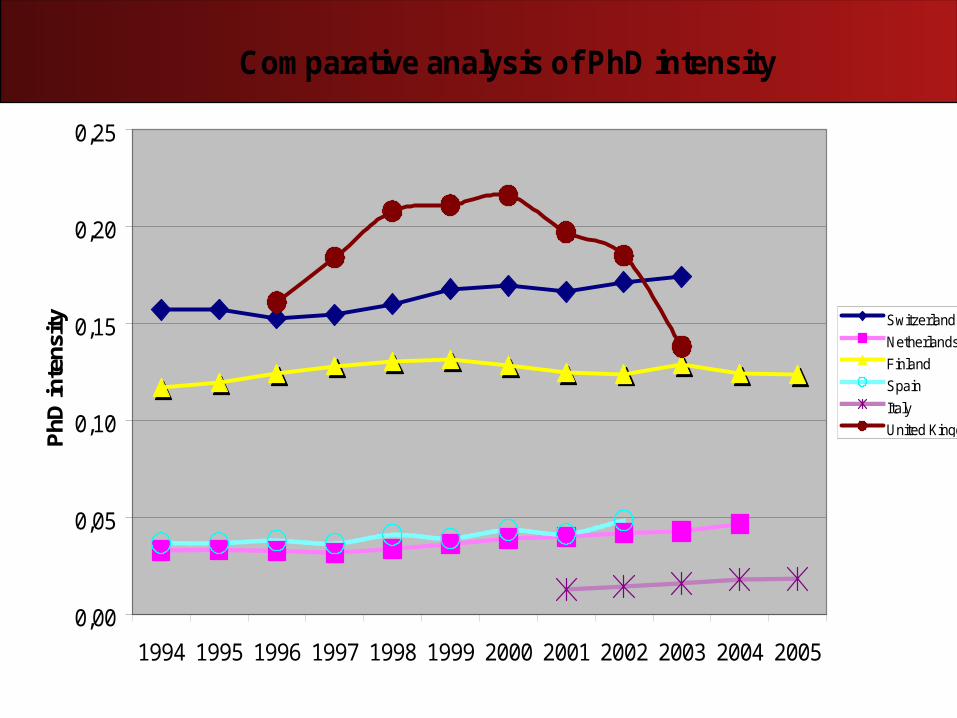
Comparative analysis of PhD intensity
0,00
0,05
0,10
0,15
0,20
0,25
1994 1995 1996 1997 1998 1999 2000 2001 2002 2003 2004 2005
PhD
inte
nsity Switzerland
Netherlands
Finland
Spain
Italy
United Kingdom
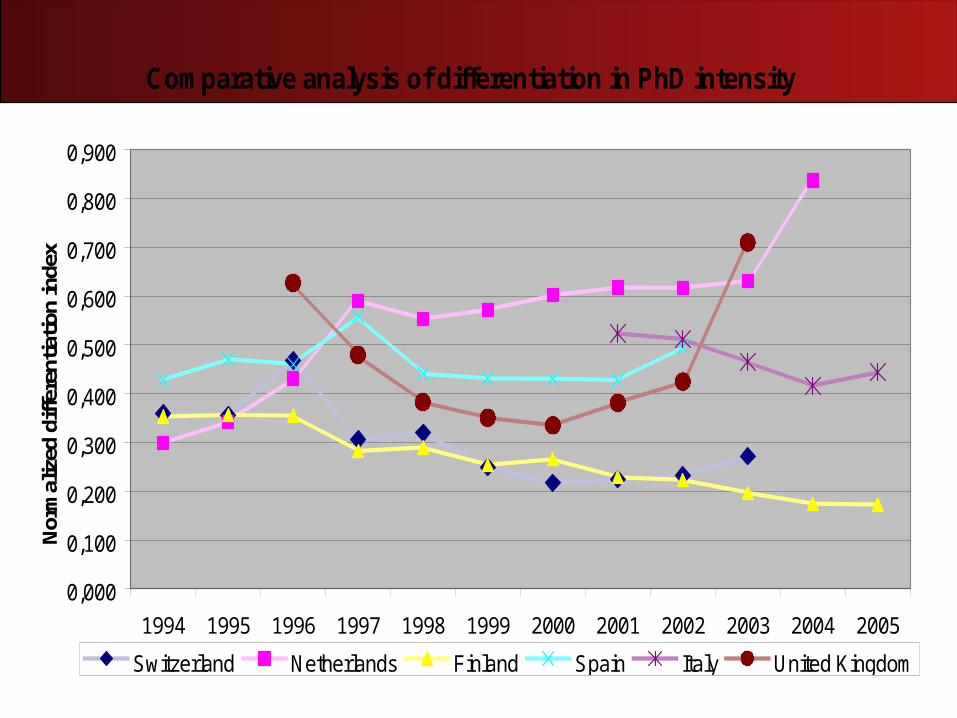
Comparative analysis of differentiation in PhD intensity
0,000
0,100
0,200
0,300
0,400
0,500
0,600
0,700
0,800
0,900
1994 1995 1996 1997 1998 1999 2000 2001 2002 2003 2004 2005
Nor
mal
ized
diff
eren
tiatio
n in
dex
Switzerland Netherlands Finland Spain Italy United Kingdom
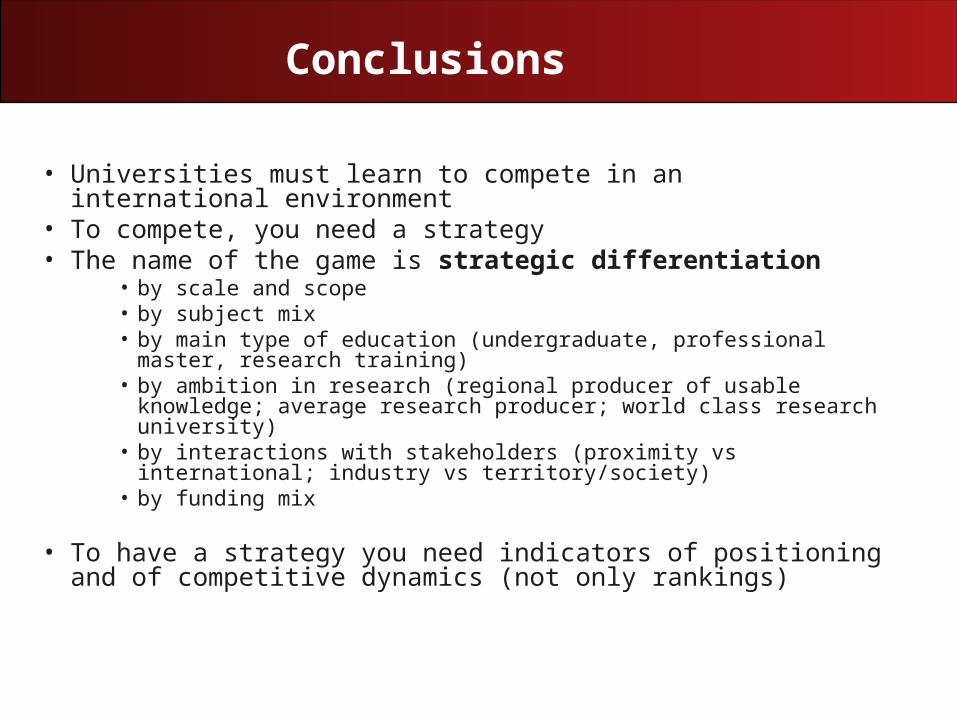
Conclusions
• Universities must learn to compete in an international environment
• To compete, you need a strategy• The name of the game is strategic differentiation
• by scale and scope• by subject mix • by main type of education (undergraduate, professional master,
research training)• by ambition in research (regional producer of usable knowledge;
average research producer; world class research university)• by interactions with stakeholders (proximity vs international; industry
vs territory/society)• by funding mix
• To have a strategy you need indicators of positioning and of competitive dynamics (not only rankings)