Embed Size (px)
Citation preview
1
Bowers, Sprott & Taff (2013) Do We Know Who Will Dropout?
Do We Know Who Will Drop Out? A Review of the Predictors of Dropping out of High
School: Precision, Sensitivity and Specificity1
Alex J. Bowers2, Ryan Sprott3 & Sherry Taff3
ABSTRACT
123
The purpose of this study is to review the literature on the most
accurate indicators of students at risk of dropping out of high
school. We used Relative Operating Characteristic (ROC) analysis
to compare the sensitivity and specificity of 110 dropout flags
across 36 studies. Our results indicate that 1) ROC analysis
provides a means to compare the accuracy of different dropout
indicators, 2) the majority of dropout flags to date have high
precision yet lack accuracy, 3) longitudinal growth models
provided the most accurate flags, while 4) the most accurate cross-
sectional flags examine low or failing grades. We provide
recommendations for future policy and practice.
Keywords: Dropout, dropout characteristics, dropout
identification, dropout prediction, dropout research, ROC, relative
operating characteristic, receiver operating characteristic, growth
mixture models, grades.
INTRODUCTION For students who fail to graduate from high school, a long history
of research has demonstrated that on average, in comparison to
graduates, these students experience higher rates of unemployment
and incarceration and lower overall lifetime earnings and life
expectancy (Berktold & Carroll, 1998; Jemal, Ward, Anderson,
Murray, & Thun, 2008; Moretti, 2007; Muenning, 2007; Rouse,
2007; Swanson, 2009; Waldfogel, Garfinkel, & Kelly, 2007). In
the United States, graduation rates are estimated to average
between 70% and 80% nationally (Balfanz, Bridgeland, Moore, &
Hornig Fox, 2010; Cataldi, Laird, & KewalRamani, 2009;
Kaufman, 2004). However, for some schools, specifically schools
in urban and poor contexts, graduation rates have been shown to be
as low as 50% or less (Balfanz, et al., 2010; Balfanz & Legters,
2006; Swanson, 2004). Since the 1970s, many demographic factors
have been associated with dropping out of school (Rumberger,
1987, 2004) including increased rates of drop out among males,
African Americans, Hispanics, low socioeconomic (SES) families,
as well as schools in urban and rural contexts. However, beyond
demographic variables, the central focus of the current study is to
ask: What do we know about how well school malleable factors
predict if a student will drop out or graduate?
1 This document is a pre-print of this manuscript, published in
2013 in The High School Journal. Recommended Citation:
Bowers, A.J., Sprott, R., Taff, S.A. (2013) Do we Know Who Will
Drop Out? A Review of the Predictors of Dropping out of High
School: Precision, Sensitivity and Specificity. The High School
Journal. 96(2), 77-100. doi:10.1353/hsj.2013.0000 2 Teachers College, Columbia University; [email protected]; 525 W.
120th Street, New York, New York 10027.
ORCID: 0000-0002-5140-6428, ResearcherID: C-1557-2013 3 The University of Texas at San Antonio.
Note: This document last updated July 30, 2013.
This issue is important not only in helping understand who will
drop out, but also aids in a school’s decision to provide dropout
interventions to students deemed at-risk (Gleason & Dynarski,
2002). If a dropout predictor is not accurate, then some students
will be misidentified as likely to drop out when they would have
graduated without intervention. As noted by Gleason and Dynarski
(2002), this issue leads to inefficient management of limited school
district resources, as schools are potentially funding expensive
dropout prevention initiatives to students who do not require
intervention. In addition, students misidentified as at risk of
dropping out, when in fact they would not have dropped out, could
conceivably be categorized under a type of at-risk deficit model,
negatively impacting their school achievement as they may be
pulled out of the regular curriculum for dropout interventions or
experience other adverse consequences of the misapplied at-risk
label. The reverse situation is also a major problem: If a predictor
is inaccurate, then many students who do eventually drop out are
never identified as at-risk, and thus the school district is unaware
of the issue and does not provide an intervention to students who
may need it. Indeed, some studies have estimated that many
dropout flags only accurately identify about 50% to 60% of the
students who do eventually drop out (Balfanz, Herzog, & MacIver,
2007; Gleason & Dynarski, 2002; Janosz, Archambault, Morizot,
& Pagani, 2008). This means that large percentages of students
who are identified by dropout flags do not drop out, and conversely
a large percentage of students who do drop out of high schools are
not identified by their school districts.
Nevertheless, there is a perception in policy and the research
literature that we know who will drop out. As stated by Troob
(1985), “[Their study] supports the perception that most future
dropouts can be identified at the beginning of their high school
careers” (p. 1). But is this perception true? Claims across the
dropout prediction literature are extremely varied, with many
reporting specific problems with dropout flags, to others that state
that they are able to predict early on who will drop out, to still
other studies that state that their flags are almost 100% predictive.
However, the literature is plagued by inconsistent language, and to
date, no study has attempted to compare each of the reported
dropout flags across the studies on a standard metric, comparing
the claims of each study on precision, sensitivity and specificity.
This inconsistency has created a hodgepodge of claims as to the
accuracy of the tested dropout flags across the literature that is
difficult to evaluate in an effort to help schools, districts,
researchers and policymakers find and employ accurate indicators
of student dropout risk.
Purpose
The purpose of this study is threefold. First, we aim to
comprehensively examine the dropout prediction literature over the
past 30 years and present a synthesis of each of the calculations
from across the studies by recalculating and reporting the
2
Bowers, Sprott & Taff (2013) Do We Know Who Will Dropout?
precision, sensitivity and specificity from each study, whether it
was originally reported or not. Second, we outline a method from
the signal detection theory literature for comparing each dropout
flag for precision, sensitivity and specificity so that each dropout
indicator can be compared as to its accuracy, known as a Relative
Operating Characteristic (ROC). Third, we present a comparison of
each of the dropout flags using a ROC analysis to identify which
predictors of high school dropout are the most accurate and usable
by schools, districts, policymakers and researchers.
METHODS
Study Selection and Inclusion Criteria
As a review of the literature on the most accurate dropout flags that
correctly identify students who drop out and do not misidentify
students who graduate as at risk of dropping out, we aimed to
include studies from the past 30 years that presented empirical
results on dropout predictors. Our criteria list for eligibility for
each study was: (a) The study focused on high school dropout
prediction; (b) The study examined school-wide characteristics, all
students in the school were included in the study, and the study
was not specific to one subgroup of students (such as students with
a learning disability); (c) The study focused on student-level, not
school-level, dropout characteristics; (d) The study contained
quantitative data that fit our specific requirements for recalculating
precision, sensitivity and specificity, such that a cross-tabulation
contingency event table could be constructed for each reported
dropout flag.
To create an encompassing search of high school dropout
prediction literature, we performed Boolean searches in JSTOR,
ERIC, Educational Full Text Wilson Web and Google Scholar. We
searched literature published after 1979. We used various search
strings to explore the breadth of the articles pertaining to high
school dropout prediction. The Boolean phrase “(dropout*) AND
(Indicat* OR Identif* OR Predict*) AND (School* or edu*)”
serves as an example of one of the more effective search phrases.
This specific search yielded 843 articles in EBSCO, 1437 in HW
Full Text, 15322 in JSTOR, and 14400 in Google Scholar (not
mutually exclusive). In addition we included Worldcat and Google
Books to search for books relating to our study. Throughout the
database research process, reference sections of applicable articles,
foundational pieces and dissertations were mined for further
resources that may have been missed through the Boolean
searches. This resulted in 6,434 studies. After reading the article
titles and abstracts yielded by the initial searches, we decided to
remove dissertations as well as publications that only studied a
specific school subpopulation to add the appropriate specificity to
our paper (i.e., gender, ethnicity, socioeconomic levels, learning
disabilities). We omitted studies that analyzed school effects on
students’ likelihood to drop out, such as how school size impacted
student dropout rates. Thus, the present study includes studies that
predicted dropout likelihood based on student-level characteristics
using school-wide samples. This resulted in 301 studies that were
read in full.
The final stage narrowed down these 301 further to 140 studies
after parceling out those that initially seemed usable but upon
reading the full text did not meet the inclusion criteria by either not
having a school-wide sample or by not reporting quantifiable data.
Finally, these 140 articles were examined more closely to
determine whether the articles included the data we required.
Thirty-six of these articles contained the necessary data for the new
calculations discussed below. We derived from the reporting in
each of these 36 articles the following information: the number of
students in the sample with the dropout indicator, the number of
the students without the dropout indicator, the number of students
with the flag who dropped out, and the number of students without
the flag who dropped out. We used this information to determine
the precision, specificity, and sensitivity of each study’s dropout
predictor. Multiple articles reported multiple dropout indicators,
hence from the 36 articles, we report on 110 dropout flags.
Sample Characteristics and Dropout Definitions
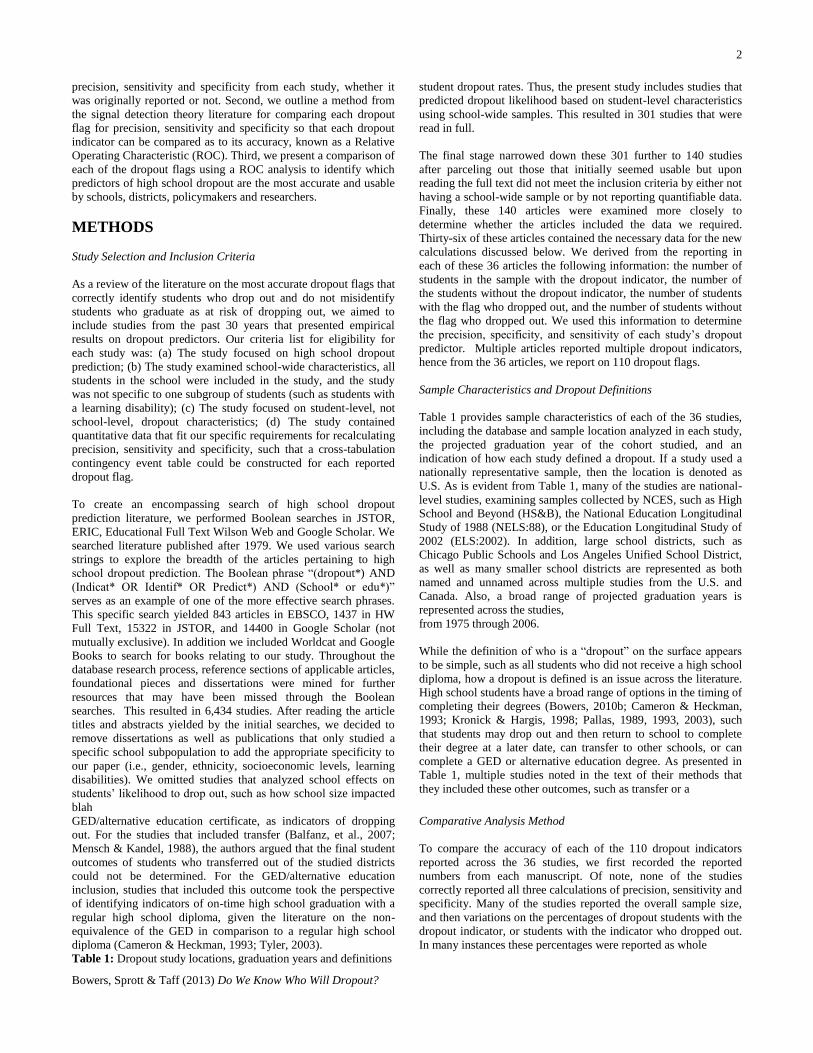
Table 1 provides sample characteristics of each of the 36 studies,
including the database and sample location analyzed in each study,
the projected graduation year of the cohort studied, and an
indication of how each study defined a dropout. If a study used a
nationally representative sample, then the location is denoted as
U.S. As is evident from Table 1, many of the studies are national-
level studies, examining samples collected by NCES, such as High
School and Beyond (HS&B), the National Education Longitudinal
Study of 1988 (NELS:88), or the Education Longitudinal Study of
2002 (ELS:2002). In addition, large school districts, such as
Chicago Public Schools and Los Angeles Unified School District,
as well as many smaller school districts are represented as both
named and unnamed across multiple studies from the U.S. and
Canada. Also, a broad range of projected graduation years is
represented across the studies,
from 1975 through 2006.
While the definition of who is a “dropout” on the surface appears
to be simple, such as all students who did not receive a high school
diploma, how a dropout is defined is an issue across the literature.
High school students have a broad range of options in the timing of
completing their degrees (Bowers, 2010b; Cameron & Heckman,
1993; Kronick & Hargis, 1998; Pallas, 1989, 1993, 2003), such
that students may drop out and then return to school to complete
their degree at a later date, can transfer to other schools, or can
complete a GED or alternative education degree. As presented in
Table 1, multiple studies noted in the text of their methods that
they included these other outcomes, such as transfer or a
blah
GED/alternative education certificate, as indicators of dropping
out. For the studies that included transfer (Balfanz, et al., 2007;
Mensch & Kandel, 1988), the authors argued that the final student
outcomes of students who transferred out of the studied districts
could not be determined. For the GED/alternative education
inclusion, studies that included this outcome took the perspective
of identifying indicators of on-time high school graduation with a
regular high school diploma, given the literature on the non-
equivalence of the GED in comparison to a regular high school
diploma (Cameron & Heckman, 1993; Tyler, 2003).
Comparative Analysis Method
To compare the accuracy of each of the 110 dropout indicators
reported across the 36 studies, we first recorded the reported
numbers from each manuscript. Of note, none of the studies
correctly reported all three calculations of precision, sensitivity and
specificity. Many of the studies reported the overall sample size,
and then variations on the percentages of dropout students with the
dropout indicator, or students with the indicator who dropped out.
In many instances these percentages were reported as whole
Table 1: Dropout study locations, graduation years and definitions
3
Bowers, Sprott & Taff (2013) Do We Know Who Will Dropout?
Table 1 continued
Included in Dropout Definition
Study Database Location Projected
Graduatio
n Year
No High
School
Diploma
Transfer GED/
Alt Ed
Allensworth & Easton (2007) Chicago Public Schools Chicago 2005 X
Austin ISD (1982) Austin Independent School District Austin 1983 X
Balfanz et al. (2007) School district of Philadelphia Philadelphia 2004 X X
Bowers (2010a) District transcript records Mid-West district 2006 X X
Bowers (2010b) District transcript records Mid-West district 2006 X X
Bowers & Sprott (2012a) Education Longitudinal Study of 2002
(ELS:2002)
U.S. 2004 X X
Curtis et al. (1983) Austin Independent School District Austin 1983 X
Dalton et al. (2009) Education Longitudinal Study of 2002
(ELS:2002)
U.S. 2004 X
Doss (1986) Austin Independent School District Austin 1983 X
Duchesne et al. (2008) Quebec Ministry of Education Quebec 2000 X
Eide & Showalter (2001) High School and Beyond (HS&B):
1980 Sophomore
U.S. 1982 X
Ekstrom et al. (1986) High School and Beyond (HS&B):
1980 Sophomore
U.S. 1982 X
Ensminger & Slusarcick
(1992)
Chicago Public Schools Chicago 1978 X
Finn et al. (2008) National Education Longitudinal Study 1988
(NELS:88)
U.S. 1992 X
Frazer (1991) Austin Independent School District Austin 1991-1996 X
French & Conrad (2001) Pacific Northwest Pacific Northwest
District
No year
given
X
Gleason & Dynarski (2002) School Dropout Demonstration Assistance
Program
Dallas TX, Phoenix
AZ, Grand Rapids
MI, Santa Ana CA
1995-1999 X
Hess & Lauber (1985) Chicago Public Schools Chicago 1982-1984 X
HRSD (2006) School Leavers Survey Canada 1993-1995 X
Janosz et al. (2008) New Solutions longitudinal data set (2002-
2005)
Quebec 2005 X
Kupersmidt & Coie (1990) Coie & Associates Longitudinal Study Durham County,
North Carolina
1983 X
Lee & Staff (2007) National Education Longitudinal Study 1988
(NELS:88)
U.S. 1992 X
Mahoney (2000) Carolina Longitudinal Study (CLS) Southeastern
United States
1986, 1989 X X
McCaul (1989) High School and Beyond (HS&B):
1980 Sophomore and 1982 follow-up surveys
U.S. 1982 X
McNeal (1997) High School and Beyond (HS&B):
1980 Sophomore and 1982 follow-up surveys
U.S. 1982 X
Mensch & Kandel (1988) National Longitudinal Survey of Young Adults
(aged 19-27 in 1984)
U.S. 1975-1983 X X X
Muthén (2004) Longitudinal Study of Youth (LSAY) from cohort
2, from Grade 7 through 12 in 1987
U.S. 1992 X
Pagani et al. (2008) Quebec Longitudinal Study of Kindergarten
Children (QLSKC) spring of 1986 and 1987
Quebec 1999, 2000 X
Roderick (1994) Fall River school district transcript records Fall River, Ma. 1996 X
Sandefur et al. (1992) National Longitudinal Survey of Young Adults
waves 1979-1985, study confined to 14-17 in
1979
U.S. 1985 X
4
Bowers, Sprott & Taff (2013) Do We Know Who Will Dropout?
numbers, or only to one decimal place, thus we back-calculated
from the percentages to get the overall numbers of students in each
group, rounding up to whole numbers when required. In addition,
some studies reported the percentages of students who graduated
with the flags, rather than dropped out; in these instances we
recalculated the reported numbers as dropout indicators, such as
taking one minus the reported graduation flag percentage to get the
dropout percentage. Furthermore, many studies first report the
overall number of students with the dropout indicators and then go
on to conduct inferential statistics, such as logistic regression,
failing to report the posterior probabilities of the statistics,
reporting only regression coefficients. In these cases, we included
the study data from the descriptives only, since it was not possible
to deduce the required frequency information without the posterior
probabilities. Thus, unless otherwise noted, calculations for each
study’s dropout flags are based on descriptive cross-tabulations.
The purpose of the present study is to highlight, encourage, and
provide an example of the usefulness of providing accuracy
measures across the dropout indicator research and to help move
the field towards a more consistent reporting structure. As will be
detailed further below, an analysis across the literature that would
take the form of a meta-analysis is outside the scope of the present
study due to this current lack of consistent reporting across the
studies. Thus, we turned to signal detection theory to examine the
accuracy of the identified dropout flags.
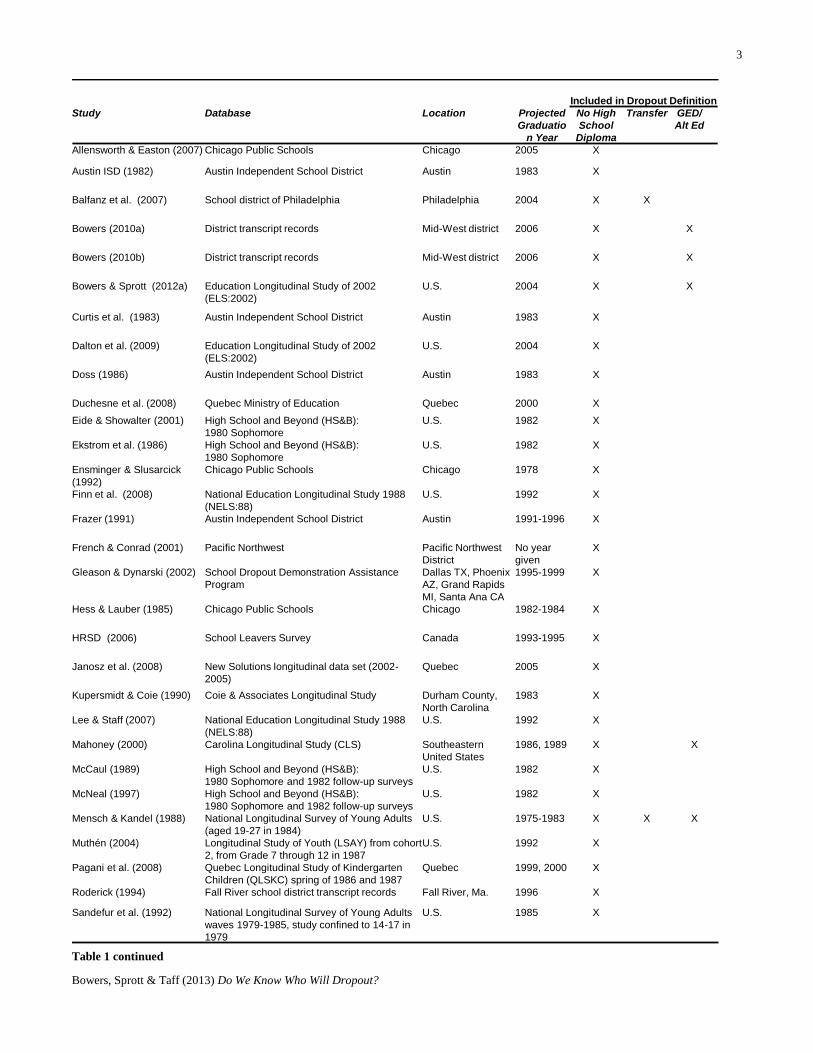
Following the recommendations of the signal detection and
diagnostics systems accuracy theory literature (Hanley & McNeil,
1982; Swets, 1988; Vivo & Franco, 2008; Zwieg & Campbell,
1993), our analysis of each study included calculations for
precision, sensitivity, and specificity (see Figure 1). Figure 1
outlines a contingency table (crosstabs) in which the event under
consideration is if a student drops out or graduates (columns). A
dropout indicator predicts if the student will drop out or graduate
(rows). This type of event table mirrors issues with Type I and
Type II errors (Rogosa, 2005), in that true-positives and true-
negatives are correct predictions of dropouts and graduates, but
false-positives are Type I errors that reflect students with a dropout
flag who graduate, while false-negatives are Type II errors that
reflect students predicted to graduate who then drop out. We are
interested here in examining the interplay between these different
prediction outcomes in dropout indicator studies. Thus our analysis
included calculations for precision, which is the true-positives
divided by the total number of students with the flag, the true-
positive proportion (sensitivity) which is the true-positives divided
by the total number of actual dropouts, the true-negative proportion
(specificity) which is the true-negatives divided by the total
number of graduates, and the false-positive proportion (1-
specificity) which is the false-positives divided by the total number
of graduates. None of the studies reviewed for this analysis
reported all four of these indicators of accuracy, with almost all
studies reporting precision and many reporting sensitivity, but
almost none reporting specificity or the false-positive proportion.
In the parlance of signal detection theory (Swets, 1988), the two
most important calculations for considering the accuracy of a
predictor are the true-positive proportion and the false-positive
proportion, known as “hits” versus “false alarms.” Unless a
detection system is perfect, there will always be a trade-off
between hits and false alarms, in that as one attempts to maximize
the number of hits by casting a wider net, one must also be
conscious of the number of false alarms that the wider net may also
end up catching mistakenly. It is exactly this issue that is the focus
of the present study, which has to date rarely been addressed in the
dropout indicator literature.
Figure 1: Event table for calculating dropout contingency
proportions
Table 2: Dropout Indicator Results by Study
Included in Dropout Definition
Study Database Location Projected
Graduation
Year
No High
School
Diploma
Transfer GED/
Alt Ed
Silver et al. (2008) Los Angeles Unified School District Los Angeles 2005 X
South et al. (2007) National Longitudinal Study of Adolescent
Health
U.S. 1995-2000 X X
Suh and Suh (2007) National Longitudinal Survey of Young Adults
(1997)
U.S. 2000 X
Troob (1985) New York City Board of Education: Student
Automated Record-Keeping System (SARK)
New York 1983, 1984 X
Warren and Lee (2003) National Education Longitudinal Study 1988
(NELS:88)
U.S. 1992 X
Dropout Graduate
Dropout a
True-positive
(TP)
Correct
b
False-positive
(FP)
Type I Error
a+b
Graduate c
False-negative
(FN)
Type II Error
d
True-negative
(TN)
Correct
c+d
a+c b+d a+b+c+d=N
Event
Pre
dic
tor
Precision = a/(a + b) Positive Predictive Value
True-Positive Proportion = a/(a + c) Sensitivity
True-Negative Proportion = d/(b + d) Specificity
False-Positive Proportion = b/(b + d) 1-Specificity

5
Bowers, Sprott & Taff (2013) Do We Know Who Will Dropout?
ID Study Grade
Level
Dropout Indicator Sample
Size
Dropout
Rate
Precision
Positive
Predictive
Value
Sensitivity
True- Positive
Proportion
Specificity
True- Negative
Proportion
False-
Positive
Proportion
(1-Specificity)
1 Allensworth &
Easton (2007)
9 On Track indicator, low course credits and more
than one failed course
20803 0.426 0.780 0.751 0.843 0.157
2 9-12 3 or more semester F's 20340 0.411 0.806 0.648 0.891 0.109
3 Austin ISD (1982) 9 Retention, student in grade 8 or lower 3899 0.242 0.487 0.453 0.848 0.152
4 Balfanz et al. (2007) 6 Attended less than or equal to 80% of the time 12037 0.572 0.830 0.233 0.936 0.064
5 6 Failed Math 12037 0.572 0.810 0.212 0.934 0.066
6 6 Failed English 12037 0.572 0.820 0.168 0.951 0.049
7 6 Suspended out of school 12037 0.572 0.800 0.098 0.967 0.033
8 6 Unsatisfactory behavior 12037 0.572 0.710 0.505 0.725 0.275
9 6 One or more flags (low attendance, unsatisfactory
behavior, fail math or English)
12037 0.572 0.710 0.595 0.675 0.325
10 6 Any one flag 12037 0.572 0.636 0.323 0.753 0.247
11 6 Any two flags 12037 0.572 0.791 0.153 0.946 0.054
12 6 Any three flags 12037 0.572 0.863 0.078 0.983 0.017
13 6 All four flags 12037 0.572 0.923 0.044 0.995 0.005
14 Bowers (2010b) 7-12 Retention, student ever retained in any grade
level
193 0.244 0.909 0.426 0.986 0.014
15 7-12 Low non-cumulative GPA (D or lower) 193 0.244 0.514 0.809 0.753 0.247
16 Bowers (2010a) K-6 Hierarchical cluster analysis of non-cumulative
course grades, K-6
145 0.186 0.258 0.630 0.585 0.415
17 K-8 Hierarchical cluster analysis of non-cumulative
course grades, K-8
154 0.214 0.356 0.939 0.537 0.463
18 K-12 Hierarchical cluster analysis of non-cumulative
course grades, K-12
186 0.237 0.379 0.886 0.549 0.451
19 Bowers & Sprott
(2012a)
9-12 Growth mixture modeling using non-cumulative
semester GPA
5400 0.090 0.336 0.918 0.821 0.180
20 Croninger and Lee
(2001)
10-12 3-5 Social Factors (low SES, ESL, non-white,
single parent, mother dropped out)
10979 0.114 0.106 0.405 0.561 0.439
21 10-12 Academic Risk (GPA<2.0, retained, will not go to
college, high discipline)
10979 0.114 0.237 0.708 0.707 0.293
22 Curtis et al. (1983) 9-12 D grade average 3907 0.241 0.810 0.199 0.985 0.015
23 9-12 Retention, student in grade 8 or lower 3907 0.241 0.486 0.453 0.848 0.152
24 Dalton et al. (2009) 10-12 Retention, age 17 or older in grade 10 15360 0.066 0.276 0.284 0.947 0.053
25 10-12 Non-native English Speaker 15360 0.066 0.103 0.208 0.872 0.128
26 10-12 Lowest SES quartile 15360 0.066 0.124 0.457 0.772 0.228
27 10-12 Parent's education HS or less 15360 0.066 0.112 0.453 0.746 0.254
28 10-12 Changed schools 3 or more times 15360 0.066 0.083 0.245 0.808 0.192
29 10-12 Student does not expect to graduate HS 15360 0.066 0.299 0.045 0.992 0.008
30 10-12 English teacher does not expect student to
graduate from HS
15360 0.066 0.342 0.150 0.980 0.020
6
Bowers, Sprott & Taff (2013) Do We Know Who Will Dropout?
Table 2 continued
ID Study Grade
Level
Dropout Indicator Sample
Size
Dropout
Rate
Precision
Positive
Predictive
Value
Sensitivity
True- Positive
Proportion
Specificity
True-
Negative
Proportion
False-
Positive
Proportion
(1-Specificity)
31 10-12 Teachers rate student as not relating well to
others
15360 0.066 0.179 0.116 0.962 0.038
32 10-12 Teachers rate student as disruptive in class 15360 0.066 0.137 0.143 0.936 0.064
33 10-12 Zero hours of homework completed per week 15360 0.066 0.123 0.136 0.931 0.069
34 10-12 Lowest standardized test quartile math and
reading
15360 0.066 0.133 0.475 0.781 0.219
35 10-12 Less than 10 credits by spring of sophomore
year
15360 0.066 0.546 0.290 0.983 0.017
36 Doss (1986)* 9 Four Flags (low GPA, retained, gender,
ethnicity, discipline)
3038 0.214 0.483 0.698 0.797 0.203
37 Duchesne et al.
(2008)
K-6 Anxiety Trajectories 1817 0.308 0.361 0.597 0.531 0.469
38 Eide and Showalter
(2001)
10-12 Retention, student ever repeated a grade 7809 0.165 0.367 0.312 0.894 0.106
39 Ekstrom et al.
(1986)
10-12 Cut classes 24000 0.150 0.276 0.540 0.750 0.250
40 10-12 Had disciplinary problems 24000 0.150 0.311 0.410 0.840 0.160
41 10-12 Suspended or put on probation 24000 0.150 0.354 0.310 0.900 0.100
42 10-12 Serious trouble with the law 24000 0.150 0.328 0.130 0.953 0.047
43 10-12 Not interested in school 24000 0.150 0.252 0.400 0.790 0.210
44 10-12 Not satisfied with the way education is going 24000 0.150 0.238 0.550 0.690 0.310
45 10-12 Does not like to work hard in school 24000 0.150 0.194 0.600 0.560 0.440
46 10-12 Close friend does not attend class regularly 24000 0.150 0.312 0.180 0.930 0.070
47 10-12 Close friend is not popular 24000 0.150 0.218 0.190 0.880 0.120
48 10-12 Close friend does not get good grades 24000 0.150 0.219 0.270 0.830 0.170
49 10-12 Close friend is not interested in school 24000 0.150 0.218 0.490 0.690 0.310
50 10-12 Close friend does not plan on going to college 24000 0.150 0.230 0.560 0.670 0.330
51 Ensminger and
Slusarcick (1992)
1 Low Grades in Grade 1, C or less 864 0.508 0.599 0.620 0.572 0.428
52 Finn et al. (2008) 8-10 High misbehavior, four or more different
misbehavior flags
16489 0.105 0.336 0.231 0.947 0.053
53 Frazer (1991) 9-12 Texas At-Risk Category (retained, low math
and reading skills, low or failing grades)
16657 0.187 0.272 0.665 0.590 0.410
54 French and Conrad
(2001)
8 Grade 8 peer rejection and antisocial
categories
218 0.133 0.217 0.448 0.751 0.249
55 8 Grade 10 peer rejection and antisocial
categories
610 0.062 0.095 0.421 0.734 0.266
56 Gleason and
Dynaraski (2002)
10-12 HS Multiple Regression using multiple flags + 2615 0.146 0.421 0.432 0.898 0.102
57 Hess and Lauber
(1985)
9 Retention, student age 16 or older in grade 9 29942 0.428 0.621 0.048 0.978 0.022
58 8 Low reading scores 29942 0.428 0.549 0.534 0.673 0.327
59 HRSD (2006) 9-12 Student lives in single parent household 9460 0.162 0.270 0.250 0.869 0.131
60 9-12 Student did not live with either parent in the
last school year
9460 0.162 0.301 0.130 0.942 0.058
61 9-12 Student reports that parents do not consider
HS completion very important
9460 0.162 0.489 0.211 0.957 0.043
62 9-12 High risk group ++ 9460 0.162 0.270 0.667 0.652 0.348
7
Bowers, Sprott & Taff (2013) Do We Know Who Will Dropout?
Table 2 continued
ID Study Grade
Level
Dropout Indicator Sample
Size
Dropout
Rate
Precision
Positive
Predictive
Value
Sensitivity
True- Positive
Proportion
Specificity
True-
Negative
Proportion
False-
Positive
Proportion
(1-Specificity)
63 Janosz et al.
(2008)
8-12 Growth Mixture Modeling of unstable
engagement pathways
13300 0.030 0.266 0.787 0.932 0.068
64 Kupersmidt and
Coie (1990)
5 Rejection 99 0.182 0.313 0.278 0.864 0.136
65 5 Aggression 99 0.182 0.538 0.389 0.926 0.074
66 5 Absences 99 0.182 0.368 0.389 0.852 0.148
67 5 Failing grades 99 0.182 0.235 0.222 0.840 0.160
68 Lee and Staff
(2007)
9-10 Working over 20 hours per week 4985 0.058 0.090 0.424 0.736 0.264
69 Mahoney and
Cairns (1997)
7-12 Middle School Extracurricular Activity
(Students not involved in more than 1 activity)
378 0.151 0.171 0.947 0.184 0.816
70 7-12 High School Extracurricular Activity (Students
not involved in more than 1 activity)
337 0.095 0.168 0.969 0.498 0.502
71 7-12 Middle school at risk category (aggressive,
unpopular, low achievement)
378 0.151 0.387 0.632 0.822 0.178
72 7-12 High school at risk category (aggressive,
unpopular, low achievement)
337 0.095 0.229 0.500 0.823 0.177
73 Mahoney (2000) 4-12 No extracurricular activity participation 653 0.156 0.416 0.559 0.855 0.145
74 4-12 Cluster analysis of low academics, popularity,
SES and high aggression
653 0.156 0.543 0.490 0.924 0.076
75 McCaul (1989) 10-12 Grades (Averaged C&D's and below) 2635 0.223 0.411 0.368 0.849 0.151
76 10-12 Test Score Quartiles (Lowest Quartile) 2635 0.223 0.384 0.492 0.774 0.226
77 10-12 SES Quartiles (Lowest Quartile) 2635 0.223 0.336 0.475 0.731 0.269
78 McNeal (1997) 10-12 Whether or Not Students Worked 20493 0.082 0.082 0.591 0.409 0.591
79 10-12 Employed in retail, service, manufacturing or
other
20493 0.082 0.110 0.415 0.699 0.301
80 Mensch and
Kandel (1988)
9-12 Smoking one or more packs per day 11661 0.223 0.337 0.539 0.695 0.305
81 9-12 Used marijuana 100 or more times ever 11661 0.223 0.346 0.275 0.850 0.150
82 9-12 Ever used cocaine 11661 0.223 0.280 0.230 0.830 0.170
83 9-12 Used other illicit drugs 40 or more times
(excluding marijuana)
11661 0.223 0.356 0.163 0.915 0.085
84 9-12 Women who became pregnant before age 19 5763 0.251 0.526 0.620 0.813 0.187
85 Muthén (2004) 7-12 Growth in mathematics test scores using
growth mixture modeling
2757 0.147 0.693 0.896 0.932 0.068
86 Pagani et al.
(2008)
K-6 Three risk factors (mother less than a H.S.
diploma, single parent family, retained)
1605 0.303 0.971 0.068 0.999 0.001
87 Roderick (1994) 4-12 Retained at least once between K-8 707 0.465 0.798 0.626 0.862 0.138
88 4-12 Retained at least twice between K-8 707 0.465 0.938 0.319 0.981 0.019
89 Sandefur et al.
(1992)
8-12 Student’s family is neither two parent, step
parent or single parent
5246 0.264 0.483 0.050 0.981 0.019
90 8-12 Change from two-parent, single parent or step
parent to neither between ages 14-17
5246 0.264 0.616 0.209 0.953 0.047
91 8-12 Student’s parents are step or single parent 5246 0.264 0.332 0.279 0.798 0.202
92 8-12 Not intact two parent family from ages 14-17 5246 0.264 0.398 0.694 0.623 0.377
93 Silver et al. (2008) 7-12 Two or more Fs in Middle School 48561 0.520 0.600 0.300 0.783 0.217
94 9-12 Low standardized test scores (9th grade
below/far below basic)
48561 0.520 0.540 0.727 0.329 0.671
8
Bowers, Sprott & Taff (2013) Do We Know Who Will Dropout?
Table 2 continued
* Indicates studies that predicted dropout rather than measured it.
+ Multiple flags were two to three out of the following risk factors: ever previously dropped out, had a child, attended six or more schools, high absenteeism,
being overage for grade, low grades, having a sibling who dropped out, unsure of graduating from high school, spends less than 1 hour a week on homework.
++ High risk group defined as one or more indicators: dependent children, ever married, with disabilities, living with neither parent, lone-parent, parent had
less than postsecondary education, parents not working, both parents work blue collar jobs, father's education unknown.
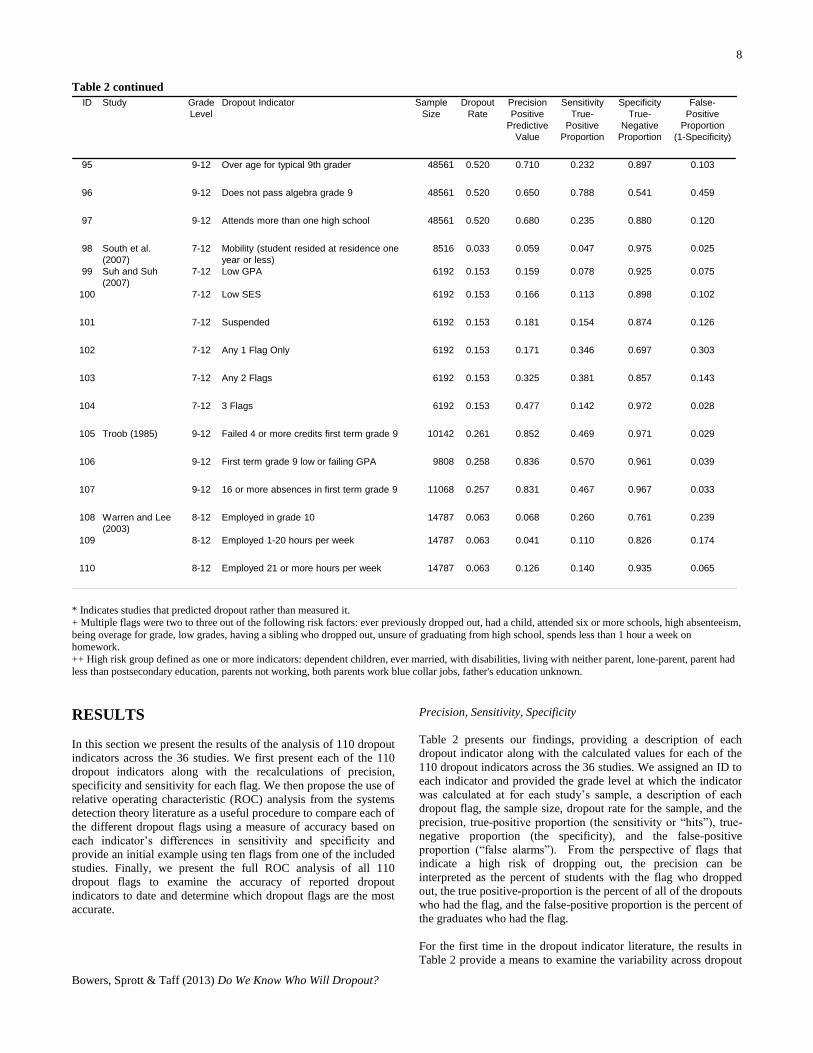
RESULTS
In this section we present the results of the analysis of 110 dropout
indicators across the 36 studies. We first present each of the 110
dropout indicators along with the recalculations of precision,
specificity and sensitivity for each flag. We then propose the use of
relative operating characteristic (ROC) analysis from the systems
detection theory literature as a useful procedure to compare each of
the different dropout flags using a measure of accuracy based on
each indicator’s differences in sensitivity and specificity and
provide an initial example using ten flags from one of the included
studies. Finally, we present the full ROC analysis of all 110
dropout flags to examine the accuracy of reported dropout
indicators to date and determine which dropout flags are the most
accurate.
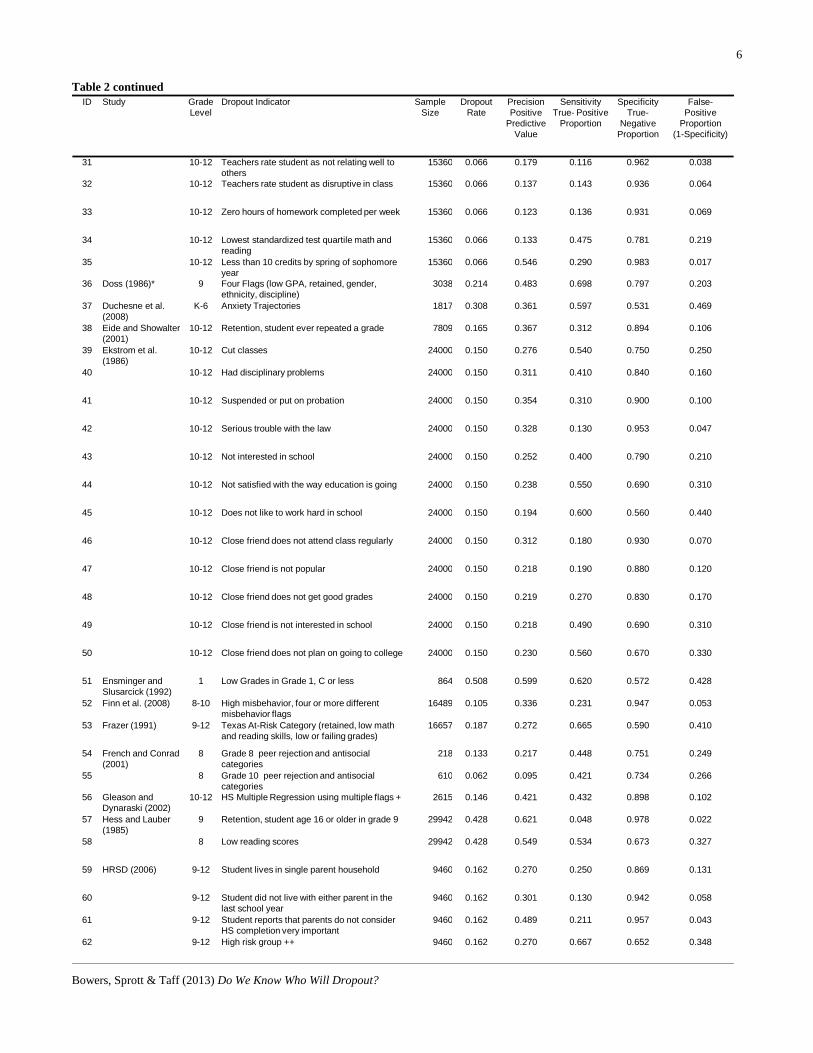
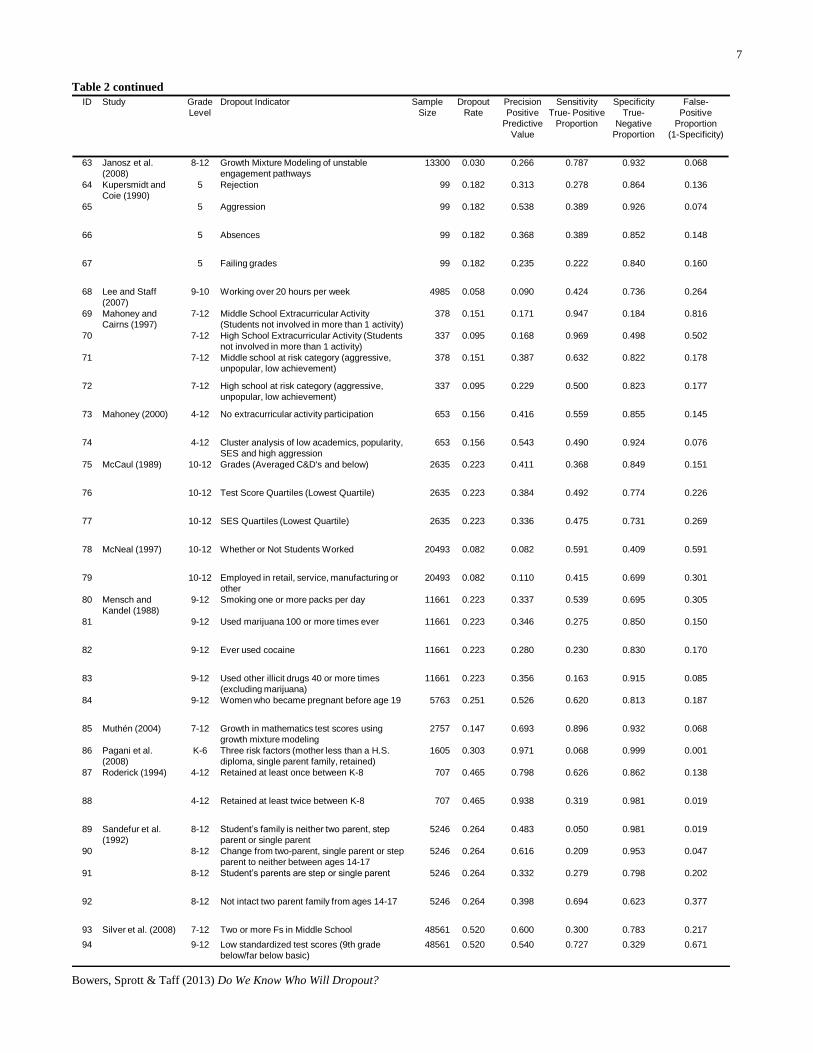
Precision, Sensitivity, Specificity
Table 2 presents our findings, providing a description of each
dropout indicator along with the calculated values for each of the
110 dropout indicators across the 36 studies. We assigned an ID to
each indicator and provided the grade level at which the indicator
was calculated at for each study’s sample, a description of each
dropout flag, the sample size, dropout rate for the sample, and the
precision, true-positive proportion (the sensitivity or “hits”), true-
negative proportion (the specificity), and the false-positive
proportion (“false alarms”). From the perspective of flags that
indicate a high risk of dropping out, the precision can be
interpreted as the percent of students with the flag who dropped
out, the true positive-proportion is the percent of all of the dropouts
who had the flag, and the false-positive proportion is the percent of
the graduates who had the flag.
For the first time in the dropout indicator literature, the results in
Table 2 provide a means to examine the variability across dropout
ID Study Grade
Level
Dropout Indicator Sample
Size
Dropout
Rate
Precision
Positive
Predictive
Value
Sensitivity
True-
Positive
Proportion
Specificity
True-
Negative
Proportion
False-
Positive
Proportion
(1-Specificity)
95 9-12 Over age for typical 9th grader 48561 0.520 0.710 0.232 0.897 0.103
96 9-12 Does not pass algebra grade 9 48561 0.520 0.650 0.788 0.541 0.459
97 9-12 Attends more than one high school 48561 0.520 0.680 0.235 0.880 0.120
98 South et al.
(2007)
7-12 Mobility (student resided at residence one
year or less)
8516 0.033 0.059 0.047 0.975 0.025
99 Suh and Suh
(2007)
7-12 Low GPA 6192 0.153 0.159 0.078 0.925 0.075
100 7-12 Low SES 6192 0.153 0.166 0.113 0.898 0.102
101 7-12 Suspended 6192 0.153 0.181 0.154 0.874 0.126
102 7-12 Any 1 Flag Only 6192 0.153 0.171 0.346 0.697 0.303
103 7-12 Any 2 Flags 6192 0.153 0.325 0.381 0.857 0.143
104 7-12 3 Flags 6192 0.153 0.477 0.142 0.972 0.028
105 Troob (1985) 9-12 Failed 4 or more credits first term grade 9 10142 0.261 0.852 0.469 0.971 0.029
106 9-12 First term grade 9 low or failing GPA 9808 0.258 0.836 0.570 0.961 0.039
107 9-12 16 or more absences in first term grade 9 11068 0.257 0.831 0.467 0.967 0.033
108 Warren and Lee
(2003)
8-12 Employed in grade 10 14787 0.063 0.068 0.260 0.761 0.239
109 8-12 Employed 1-20 hours per week 14787 0.063 0.041 0.110 0.826 0.174
110 8-12 Employed 21 or more hours per week 14787 0.063 0.126 0.140 0.935 0.065
9
Bowers, Sprott & Taff (2013) Do We Know Who Will Dropout?
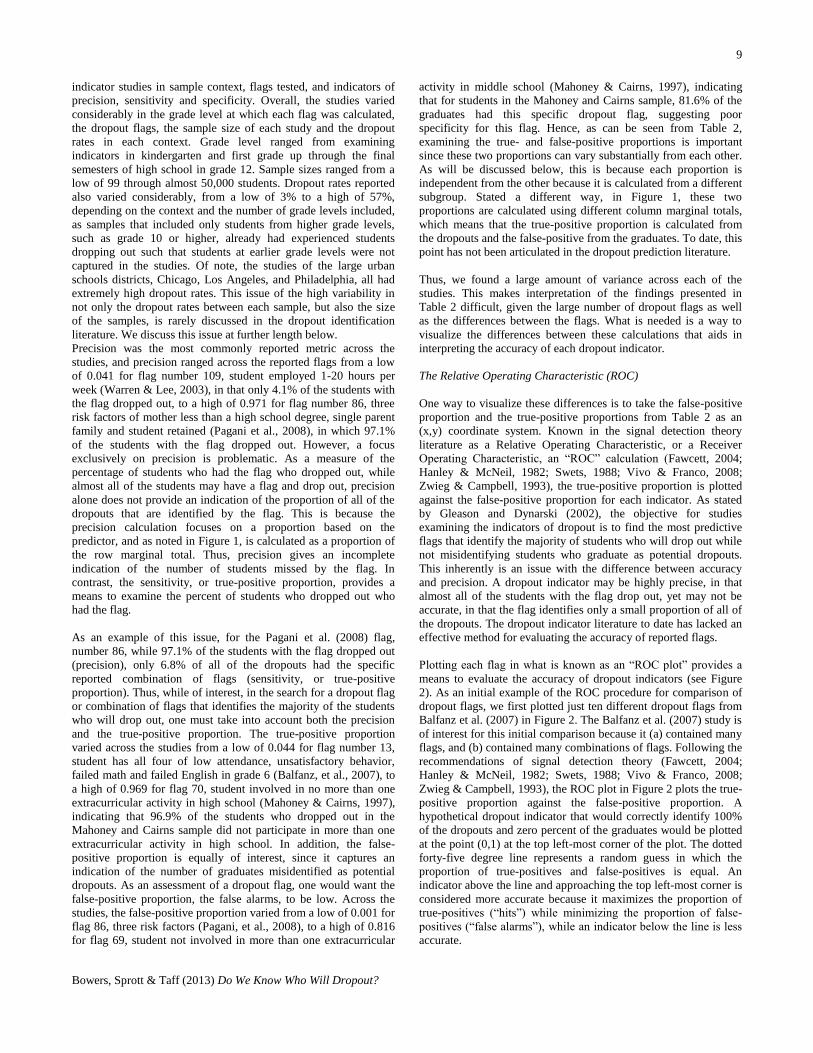
indicator studies in sample context, flags tested, and indicators of
precision, sensitivity and specificity. Overall, the studies varied
considerably in the grade level at which each flag was calculated,
the dropout flags, the sample size of each study and the dropout
rates in each context. Grade level ranged from examining
indicators in kindergarten and first grade up through the final
semesters of high school in grade 12. Sample sizes ranged from a
low of 99 through almost 50,000 students. Dropout rates reported
also varied considerably, from a low of 3% to a high of 57%,
depending on the context and the number of grade levels included,
as samples that included only students from higher grade levels,
such as grade 10 or higher, already had experienced students
dropping out such that students at earlier grade levels were not
captured in the studies. Of note, the studies of the large urban
schools districts, Chicago, Los Angeles, and Philadelphia, all had
extremely high dropout rates. This issue of the high variability in
not only the dropout rates between each sample, but also the size
of the samples, is rarely discussed in the dropout identification
literature. We discuss this issue at further length below.
Precision was the most commonly reported metric across the
studies, and precision ranged across the reported flags from a low
of 0.041 for flag number 109, student employed 1-20 hours per
week (Warren & Lee, 2003), in that only 4.1% of the students with
the flag dropped out, to a high of 0.971 for flag number 86, three
risk factors of mother less than a high school degree, single parent
family and student retained (Pagani et al., 2008), in which 97.1%
of the students with the flag dropped out. However, a focus
exclusively on precision is problematic. As a measure of the
percentage of students who had the flag who dropped out, while
almost all of the students may have a flag and drop out, precision
alone does not provide an indication of the proportion of all of the
dropouts that are identified by the flag. This is because the
precision calculation focuses on a proportion based on the
predictor, and as noted in Figure 1, is calculated as a proportion of
the row marginal total. Thus, precision gives an incomplete
indication of the number of students missed by the flag. In
contrast, the sensitivity, or true-positive proportion, provides a
means to examine the percent of students who dropped out who
had the flag.
As an example of this issue, for the Pagani et al. (2008) flag,
number 86, while 97.1% of the students with the flag dropped out
(precision), only 6.8% of all of the dropouts had the specific
reported combination of flags (sensitivity, or true-positive
proportion). Thus, while of interest, in the search for a dropout flag
or combination of flags that identifies the majority of the students
who will drop out, one must take into account both the precision
and the true-positive proportion. The true-positive proportion
varied across the studies from a low of 0.044 for flag number 13,
student has all four of low attendance, unsatisfactory behavior,
failed math and failed English in grade 6 (Balfanz, et al., 2007), to
a high of 0.969 for flag 70, student involved in no more than one
extracurricular activity in high school (Mahoney & Cairns, 1997),
indicating that 96.9% of the students who dropped out in the
Mahoney and Cairns sample did not participate in more than one
extracurricular activity in high school. In addition, the false-
positive proportion is equally of interest, since it captures an
indication of the number of graduates misidentified as potential
dropouts. As an assessment of a dropout flag, one would want the
false-positive proportion, the false alarms, to be low. Across the
studies, the false-positive proportion varied from a low of 0.001 for
flag 86, three risk factors (Pagani, et al., 2008), to a high of 0.816
for flag 69, student not involved in more than one extracurricular
activity in middle school (Mahoney & Cairns, 1997), indicating
that for students in the Mahoney and Cairns sample, 81.6% of the
graduates had this specific dropout flag, suggesting poor
specificity for this flag. Hence, as can be seen from Table 2,
examining the true- and false-positive proportions is important
since these two proportions can vary substantially from each other.
As will be discussed below, this is because each proportion is
independent from the other because it is calculated from a different
subgroup. Stated a different way, in Figure 1, these two
proportions are calculated using different column marginal totals,
which means that the true-positive proportion is calculated from
the dropouts and the false-positive from the graduates. To date, this
point has not been articulated in the dropout prediction literature.
Thus, we found a large amount of variance across each of the
studies. This makes interpretation of the findings presented in
Table 2 difficult, given the large number of dropout flags as well
as the differences between the flags. What is needed is a way to
visualize the differences between these calculations that aids in
interpreting the accuracy of each dropout indicator.
The Relative Operating Characteristic (ROC)
One way to visualize these differences is to take the false-positive
proportion and the true-positive proportions from Table 2 as an
(x,y) coordinate system. Known in the signal detection theory
literature as a Relative Operating Characteristic, or a Receiver
Operating Characteristic, an “ROC” calculation (Fawcett, 2004;
Hanley & McNeil, 1982; Swets, 1988; Vivo & Franco, 2008;
Zwieg & Campbell, 1993), the true-positive proportion is plotted
against the false-positive proportion for each indicator. As stated
by Gleason and Dynarski (2002), the objective for studies
examining the indicators of dropout is to find the most predictive
flags that identify the majority of students who will drop out while
not misidentifying students who graduate as potential dropouts.
This inherently is an issue with the difference between accuracy
and precision. A dropout indicator may be highly precise, in that
almost all of the students with the flag drop out, yet may not be
accurate, in that the flag identifies only a small proportion of all of
the dropouts. The dropout indicator literature to date has lacked an
effective method for evaluating the accuracy of reported flags.
Plotting each flag in what is known as an “ROC plot” provides a
means to evaluate the accuracy of dropout indicators (see Figure
2). As an initial example of the ROC procedure for comparison of
dropout flags, we first plotted just ten different dropout flags from
Balfanz et al. (2007) in Figure 2. The Balfanz et al. (2007) study is
of interest for this initial comparison because it (a) contained many
flags, and (b) contained many combinations of flags. Following the
recommendations of signal detection theory (Fawcett, 2004;
Hanley & McNeil, 1982; Swets, 1988; Vivo & Franco, 2008;
Zwieg & Campbell, 1993), the ROC plot in Figure 2 plots the true-
positive proportion against the false-positive proportion. A
hypothetical dropout indicator that would correctly identify 100%
of the dropouts and zero percent of the graduates would be plotted
at the point (0,1) at the top left-most corner of the plot. The dotted
forty-five degree line represents a random guess in which the
proportion of true-positives and false-positives is equal. An
indicator above the line and approaching the top left-most corner is
considered more accurate because it maximizes the proportion of
true-positives (“hits”) while minimizing the proportion of false-
positives (“false alarms”), while an indicator below the line is less
accurate.
10
Bowers, Sprott & Taff (2013) Do We Know Who Will Dropout?
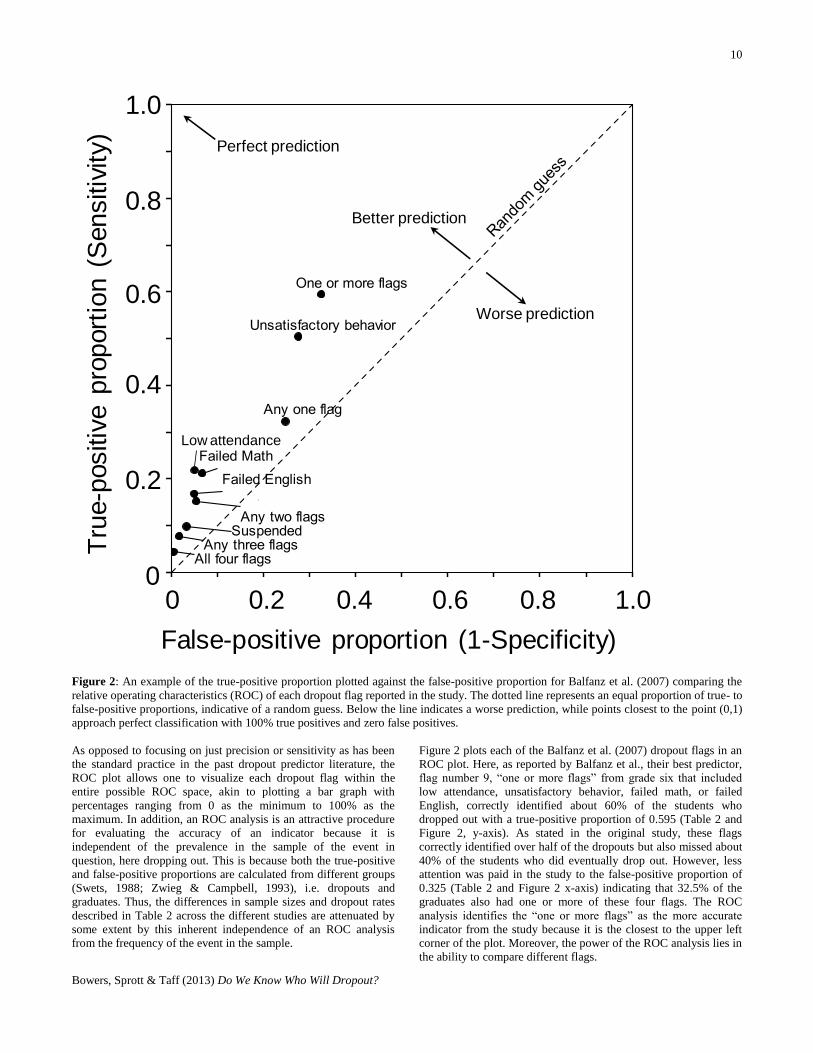
Figure 2: An example of the true-positive proportion plotted against the false-positive proportion for Balfanz et al. (2007) comparing the
relative operating characteristics (ROC) of each dropout flag reported in the study. The dotted line represents an equal proportion of true- to
false-positive proportions, indicative of a random guess. Below the line indicates a worse prediction, while points closest to the point (0,1)
approach perfect classification with 100% true positives and zero false positives.
As opposed to focusing on just precision or sensitivity as has been
the standard practice in the past dropout predictor literature, the
ROC plot allows one to visualize each dropout flag within the
entire possible ROC space, akin to plotting a bar graph with
percentages ranging from 0 as the minimum to 100% as the
maximum. In addition, an ROC analysis is an attractive procedure
for evaluating the accuracy of an indicator because it is
independent of the prevalence in the sample of the event in
question, here dropping out. This is because both the true-positive
and false-positive proportions are calculated from different groups
(Swets, 1988; Zwieg & Campbell, 1993), i.e. dropouts and
graduates. Thus, the differences in sample sizes and dropout rates
described in Table 2 across the different studies are attenuated by
some extent by this inherent independence of an ROC analysis
from the frequency of the event in the sample.
Figure 2 plots each of the Balfanz et al. (2007) dropout flags in an
ROC plot. Here, as reported by Balfanz et al., their best predictor,
flag number 9, “one or more flags” from grade six that included
low attendance, unsatisfactory behavior, failed math, or failed
English, correctly identified about 60% of the students who
dropped out with a true-positive proportion of 0.595 (Table 2 and
Figure 2, y-axis). As stated in the original study, these flags
correctly identified over half of the dropouts but also missed about
40% of the students who did eventually drop out. However, less
attention was paid in the study to the false-positive proportion of
0.325 (Table 2 and Figure 2 x-axis) indicating that 32.5% of the
graduates also had one or more of these four flags. The ROC
analysis identifies the “one or more flags” as the more accurate
indicator from the study because it is the closest to the upper left
corner of the plot. Moreover, the power of the ROC analysis lies in
the ability to compare different flags.
0
0.2
0.4
0.6
0.8
1.0T
rue-p
ositiv
e p
roport
ion (
Sensitiv
ity)
0 0.2 0.4 0.6 0.8 1.0
False-positive proportion (1-Specificity)
Perfect prediction
Better prediction
Worse prediction
Low attendance
11
Bowers, Sprott & Taff (2013) Do We Know Who Will Dropout?
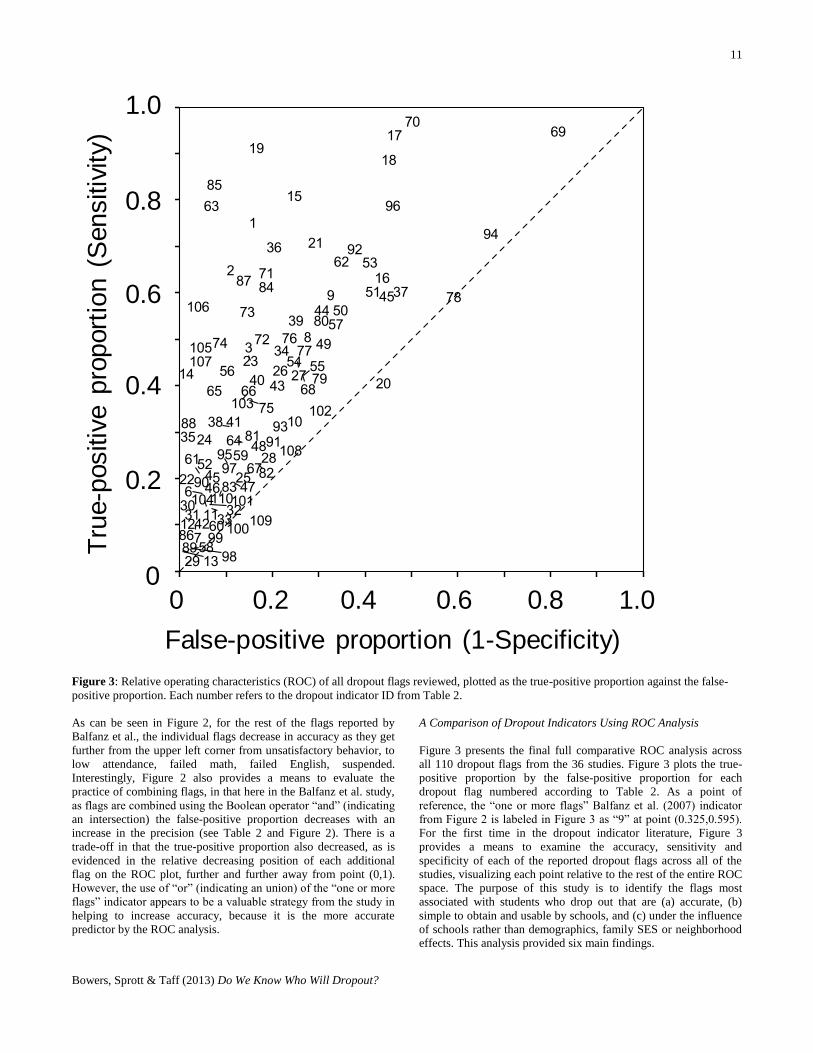
Figure 3: Relative operating characteristics (ROC) of all dropout flags reviewed, plotted as the true-positive proportion against the false-
positive proportion. Each number refers to the dropout indicator ID from Table 2.
As can be seen in Figure 2, for the rest of the flags reported by
Balfanz et al., the individual flags decrease in accuracy as they get
further from the upper left corner from unsatisfactory behavior, to
low attendance, failed math, failed English, suspended.
Interestingly, Figure 2 also provides a means to evaluate the
practice of combining flags, in that here in the Balfanz et al. study,
as flags are combined using the Boolean operator “and” (indicating
an intersection) the false-positive proportion decreases with an
increase in the precision (see Table 2 and Figure 2). There is a
trade-off in that the true-positive proportion also decreased, as is
evidenced in the relative decreasing position of each additional
flag on the ROC plot, further and further away from point (0,1).
However, the use of “or” (indicating an union) of the “one or more
flags” indicator appears to be a valuable strategy from the study in
helping to increase accuracy, because it is the more accurate
predictor by the ROC analysis.
A Comparison of Dropout Indicators Using ROC Analysis
Figure 3 presents the final full comparative ROC analysis across
all 110 dropout flags from the 36 studies. Figure 3 plots the true-
positive proportion by the false-positive proportion for each
dropout flag numbered according to Table 2. As a point of
reference, the “one or more flags” Balfanz et al. (2007) indicator
from Figure 2 is labeled in Figure 3 as “9” at point (0.325,0.595).
For the first time in the dropout indicator literature, Figure 3
provides a means to examine the accuracy, sensitivity and
specificity of each of the reported dropout flags across all of the
studies, visualizing each point relative to the rest of the entire ROC
space. The purpose of this study is to identify the flags most
associated with students who drop out that are (a) accurate, (b)
simple to obtain and usable by schools, and (c) under the influence
of schools rather than demographics, family SES or neighborhood
effects. This analysis provided six main findings.
0
0.2
0.4
0.6
0.8
1.0T
rue-p
ositiv
e p
roport
ion (
Sensitiv
ity)
0 0.2 0.4 0.6 0.8 1.0
False-positive proportion (1-Specificity)
12
Bowers, Sprott & Taff (2013) Do We Know Who Will Dropout?
First, the use of an ROC plot is an improvement over the past
methods of reporting only precision or the true-positive
proportions, in that each dropout flag can now be visualized and
evaluated for accuracy in the context of the other reported
indicators. In examining the Balfanz et al. (2007) flags from Figure
2, now in Figure 3 as points 4 through 13, while flag number 9,
“one or more flags”, is fairly accurate, it does not appear to be one
of the most accurate flags of all of the flags analyzed. The second
main finding is that the majority of the dropout flags in Figure 3
cluster near the bottom left of the ROC space. This indicates that
while many of these dropout flags had low false-positive
proportions, they also had low true-positive proportions,
identifying only a small fraction of all of the students who dropped
out from each of the samples. The third finding is that many of
these dropout indicators are no better than a random guess; with
near equal proportions of true-positives and false-positives near the
dotted line, such as flag 78 “whether or not a student worked”.
Fourth, few studies are near the top of the ROC space in Figure 3
with high true-positive rates. Mahoney and Cairns (1997) provide
an interesting example with dropout flags 69 and 70, in which the
flag was students involved in no more than one extracurricular
activity in middle school or high school, respectively. In Figure 3,
flag 69 is near the top right of the ROC space, indicating both a
high true- and false-positive proportion. The dropout flag of
students in middle school from the Mahoney and Cairns sample
who participated in one or no extracurricular activities captures
almost all of the students who dropped out, 94.7% of them; few
students drop out who participated in more than one extracurricular
activity in middle school. However, this flag also captured 81.6%
of the graduates, in that less than 20% of the graduates participated
in more than one extracurricular activity, indicating that this flag
performed poorly, despite its high true-positive proportion. As
discussed above, and plotted here, this is an example of the need to
consider both the true- and false- positive proportions, which can
behave very differently dependent upon the flag under
consideration. Conversely, flag 70, students in high school who
participated in no more than one extracurricular activity, is much
more accurate, with a similarly high true-positive proportion
(0.969) but a relatively lower false-positive proportion (0.502).
The ROC analysis provides a means to evaluate flags such as these
in comparison to all of the others.
The fifth main finding is that overall, the dropout flags 85, 19 and
63 are the most accurate by the ROC analysis, grouping together in
the upper left of Figure 3. Interestingly, all three of these studies
used a form of multivariate longitudinal analysis, Growth Mixture
Modeling (GMM), in which flag 85, Muthén (2004), modeled
math achievement trajectories from grades 7-12, flag 19, Bowers
and Sprott (2012a), modeled the trajectories of non-cumulative
GPA from grades 9-12, and flag 63, Janosz et al. (2008), modeled
student engagement trajectories from grades 8-12. From the ROC
analysis, we posit that flag 85, longitudinal growth in mathematics
achievement (Muthén, 2004), is the most accurate of all 110 flags
reviewed, in that as a measure of the longitudinal trajectory of
student mathematics achievement, it has one of the highest true-
positive proportions (highly sensitive) while maintaining a very
low false-positive proportion. This finding that the most accurate
dropout flags incorporate a form of longitudinal growth modeling
supports the dropout-as-a-“life course” literature (Alexander,
Entwisle, & Kabbani, 2001; Bowers, 2010a, 2010b; Jimerson,
Egeland, Sroufe, & Carlson, 2000; Pallas, 2003) that has suggested
that the best way to describe the dropout process is not with cross-
sectional data, but rather as a long-term longitudinal event history
that includes a student’s trajectory through time in school. Our
findings support this literature that has argued for longitudinal
analysis, demonstrating that the most accurate indicators of
dropout appear to be the longitudinal trajectories of student
achievement or engagement in school. Indeed, the point of the
GMM method used in each of these three flags is to incorporate a
growth trajectory model within a structural equation modeling
framework, in which the growth model segment of the GMM
models the longitudinal change of students over time, while
controlling for demographics (Jung & Wickrama, 2008; Kaplan,
Kim, & Kim, 2009; Muthén, 2004). In addition, these types of
models are mixture models, which sort out the different trajectories
from one another, removing and enriching the group of students
with the flag to only those students that have statistically similar
growth trajectories. This type of GMM analysis is fairly complex
and stands in contrast to the majority of the other studies included
that used descriptive statistics, cross-tabulations, or logistic
regressions to identify a dropout flag. Thus, it appears that for
policy and research on dropout flags, growth mixture models that
include achievement or engagement trajectories are superior to all
of the other flags reviewed.
Nevertheless, for teachers, administrators, schools and districts,
while longitudinal analysis is important, one consistent argument
from the dropout literature is that these stakeholders need an easy-
to-calculate flag using data already collected in schools that
identifies the majority of the students who drop out and does not
incorrectly flag graduates at a high rate. Therefore, our final
finding to describe is the next most accurate flags from Figure 3,
which includes flag 1, the Chicago on-track indicator including
low course credits and failures in grade 9 (Allensworth & Easton,
2007), flag 15, low non-cumulative GPA (Bowers, 2010b), and
flag 2, three or more first semester course failures (Allensworth &
Easton, 2007). As the final main finding, our analysis demonstrates
that out of all of the flags reviewed, flag number 1, the Chicago
on-track indicator (Allensworth & Easton, 2007), is the most
accurate and most usable dropout indicator. The ROC analysis
indicates that in comparison to all but the growth mixture model
studies, the on-track indicator is highly accurate, and, as argued by
Allensworth and Easton (2007), is usable by schools because it a)
includes only data already collected in schools (course credits and
failures), b) is easy to calculate by examining if a student is behind
on the number of credits to stay on-track to graduate and c)
examines if a student has any course failures. In addition, the on-
track indicator provides a means for intervention, in identifying
students that need assistance from the school and district to help
them obtain the appropriate number of credits to put them on-track
for graduation and to perform well enough in the specific courses
they have failed to pass. Moreover, these three flags together, flags
1, 15, and 2, are interesting in that they each include an indication
of the performance of the students as measured by low or failing
grades. We turn next to a discussion of each of these main
findings.
DISCUSSION
While ROC analysis has been rarely applied to the dropout
indicator literature before, it appears to have worked well here as a
summary procedure reflecting the accuracy of an indicator relative
to the other dropout indicators. Here, we offer the present study as
a step towards increasing the ability of researchers and
practitioners to compare flags on similar measures through
consistent reporting of sensitivity and specificity. However, as
presented above, the studies varied remarkably across contexts,
13
Bowers, Sprott & Taff (2013) Do We Know Who Will Dropout?
grade levels, span of data collected, sample sizes, and the types of
data that were reported. For future research, we encourage
researchers to continue in this line and examine the research using
meta-analytic methods, to help control for sample size differences,
as well as variation across the contexts. However, given current
reporting of dropout indicators as dichotomous, as has been
detailed in the signal detection literature (Rice & Harris, 2005),
this is problematic for meta-analysis comparisons because effect
size measures are assumed to be normally distributed, as are the
standard errors, while any effect size comparison in the dropout
literature currently would require point-biserial correlations. Due
to this issue, combined with the lack of consistent reporting across
studies reported above, we relied here on the use of the ROC
comparison method as a first step to improving accuracy reporting
across the studies. While outside the scope of the present study, we
encourage future research in this domain to examine the use of
continuous indicator outcomes, such as ROC “Area Under the
Curve” (AUC) analysis (Swets, 1988), which is amenable to effect
size comparisons such as meta-analysis (Rice & Harris, 2005).
Thus, given the present findings for future research we recommend
that dropout indicator studies include not only calculations for
precision, sensitivity and specificity, but also the raw cross-
tabulation numbers so that each of these proportions may be
recalculated at a later date and included in future ROC studies. As
others have called for studies that use inferential statistics to
appropriately report effect sizes such that standard meta-analysis
techniques can be applied, we stress here that it is important for
dropout indicator studies to report these calculations based on the
recommendations from signal detection theory. As our review of
the studies to date indicated, this literature domain has lacked
consistent reporting standards so that claims as to precision and
accuracy can be evaluated across studies. In reading the studies
nominated for inclusion based on our initial search criteria, we
initially thought that there would be many more than 36 studies
included in the final analysis. We were dismayed to find that
haphazard reporting prevented the inclusion of many studies, since
we were unable to recalculate the required numbers, because they
were either not reported or were not reported appropriately. This
was especially true for many of the dropout indicator studies that
are highly cited in this domain, such as Alexander et al. (2001) for
example, in which, rather than report the actual sample sizes, n’s
were reported as ranges. In addition, for the 36 included studies,
these had to be read multiple times to find all of the information
needed to recalculate the numbers, because different studies
provided the information in multiple locations, from methods
sections, to tables, to the text, to figures and footnotes. We
postulate that some of this is due to the large number of non-peer
reviewed reports from research and policy centers, but even many
of the peer-reviewed journal articles reported the numbers in an
inconsistent format. For future research, we recommend that
studies report each of the numbers as an event table as in Figure 1
here, as well as each of the calculations for precision, and true- and
false-positive proportions.
One of the main findings here is that the majority of the dropout
flags included in this analysis clustered near the lower left of the
ROC plot, with low false-positive proportions but also low true-
positive proportions. We speculate this is because prior to the use
of ROC analysis, this domain has lacked a standard method for
determining the accuracy of each of the dropout flags. Rather, it
appears that many of the studies focused on precision in the
absence of accuracy, driving down the false-positive proportion
(increasing specificity) but in turn identifying smaller proportions
of all of the students who drop out. This may be a good result.
Highly precise and specific dropout flags are useful, even if they
are not sensitive. For such flags, almost 100% of the students with
the flag may drop out, and while the flag misses the majority of the
dropouts, this information about a specific flag can be informative
for schools. Retention, requiring a student to repeat a grade level,
as a dropout flag provides a good example of this point. Retention
was defined very differently across the studies, ranging from over
age in grade 8 or grade 9, to asking students if they had ever been
retained, to examining school records on if the student had ever
been retained, to restricting a definition of retention to just specific
grade levels, such as middle school. This led to differences in
precision and specificity across the studies due to the retention
definition, as well as which grade level was included in the
definition and how dropout was defined in the study. Nevertheless,
for many of the studies that examined retention as a dropout flag,
while only a small proportion of all of the dropouts were retained
(low sensitivity), the majority of the students retained dropped out
(high precision). Thus, as an example here of high precision with
low sensitivity, as stated in the extensive literature on the
deleterious impact of retaining students (Jimerson et al., 2005;
Roderick, 1994), retaining a student is something that schools do to
students, and knowing that retaining students is highly predictive
of dropout even if not all dropouts are retained, is an important
consideration when attempting to decrease dropout rates.
Furthermore, we found that while combining flags using and
increases precision, in that students have each of the flags, our
results suggest that a better strategy is to combine flags with or,
such that students have any one of the nominated flags. We
speculate that this focus on the intersection of flags, rather than the
union, also contributed to the high amount of clustering of studies
on the lower left of the ROC analysis, increasing precision but
decreasing sensitivity. It may be that students drop out for many
different reasons, and this is supported by the dropout typology
literature (Bowers, 2010a; Bowers & Sprott, 2012b; Fortin,
Marcotte, Potvin, Royer, & Joly, 2006; Janosz, LeBlanc,
Boulerice, & Tremblay, 2000). Thus, different flags may
encompass different types of students who are highly likely to drop
out, so it stands to reason that multiple non-overlapping flags
would cast a wide net and capture the majority of students who
drop out. However, as demonstrated in the Balfanz et al. (2007)
example in Figure 2, this type of union calculation may experience
increased false-positive proportions, especially if each separate
flag has a relatively large proportion of false-positives. Thus, we
encourage future research to report on both the union of flags as
well as the intersection.
Other than the growth mixture models, the results of the ROC
analysis indicated that some of the most accurate dropout
indicators that use cross-sectional data, focus on low or failing
grades. While this is important given that grades are collected
regularly in schools for all students and provide an accessible data
point with high face validity for teachers and administrators
(Allensworth & Easton, 2007; Bowers, 2010a, 2010b), grades have
historically been viewed as a subjective and “hodgepodge”
assessment of student ability and academic knowledge, including
academic achievement as well as class participation and behavior
(Brookhart, 1991; Cizek, Fitzgerald, & Rachor, 1995-1996; Cross
& Frary, 1999). However, an emerging line of research suggests
that teacher-assigned grades are a multi-dimensional assessment of
both student academic achievement as well as a student’s ability to
negotiate the social processes and norms of schooling (Bowers,
2009, 2011; Klapp Lekholm & Cliffordson, 2008, 2009;
14
Bowers, Sprott & Taff (2013) Do We Know Who Will Dropout?
Willingham, Pollack, & Lewis, 2002). We posit that low or failing
grades may constitute teacher assessment of a student’s ability at
both the academic components of their courses and social and
behavioral components, as represented by their low and failing
grades, indicators highly predictive of whether a student will
persist in the system. We encourage more work in this area, since
our results here suggest that low and failing grades, especially
when coupled with a low number of credits in high school, are
some of the most accurate indicators of students at risk of dropping
out.
CONCLUSION
In conclusion, our results indicate that while there is high
variability across the dropout flags in the literature, there are some
indicators that are more accurate than others. The goal of an early
warning system, which is the purpose of dropout flags, to warn a
school early that a student is at an increased risk of dropping out in
the future, is to correctly identify the students who will drop out,
without mistakenly flagging students who would have graduated
anyway. The costs of poor and inaccurate dropout flags is not only
in misspent funds on dropout interventions for students who would
have graduated anyway, but also in categorizing students as at-risk
when they are not, as well as in missing students who actually are
at risk of dropping out. We hope that this study provides a way
forward to help future research on dropout identification improve
the accuracy of dropout flags, to help identify early which students
are the most likely to drop out, and direct the limited funds of
schools and districts to the specific needs of each student to help
them graduate on time.
RECOMMENDED CITATION FORMAT Bowers, A.J., Sprott, R., Taff, S.A. (2013) Do we Know Who Will
Drop Out? A Review of the Predictors of Dropping out of High
School: Precision, Sensitivity and Specificity. The High School
Journal. 96(2), 77-100. doi:10.1353/hsj.2013.0000
REFERENCES
Alexander, K. L., Entwisle, D. R., & Kabbani, N. S. (2001). The
dropout process in life course perspective: Early risk factors
at home and school. The Teachers College Record, 103(5),
760-822.
Allensworth, E. M., & Easton, J. Q. (2007). What matters for
staying on-track and graduating in Chicago public high
schools: A close look at course grades, failures, and
attendance in the freshman year. Chicago: Consortium on
Chicago School Research.
Austin ISD. (1982). "Mother got tired of taking care of my baby."
A study of dropouts. Austin, Texas: Austin Independent
School District.
Balfanz, R., Bridgeland, J. M., Moore, L. A., & Hornig Fox, J.
(2010). Building a grad nation: Progress and challenge in
ending the high school dropout epidemic. Washington D.C.:
Civic Enterprises Everyone Graduates Center at Johns
Hopkins University America's Promise Alliance.
Balfanz, R., Herzog, L., & MacIver, D. J. (2007). Preventing
student disengagement and keeping students on the
graduation path in urban middle-grades schools: Early
identification and effective interventions. Educational
Psychologist, 42(4), 223-235.
Balfanz, R., & Legters, N. (2006, July 12). Closing 'dropout
factories': The graduation-rate crisis we know, and what can
be done about it. Education Week, 25, 42-43.
Berktold, J., & Carroll, C. D. (1998). Subsequent educational
attainment of high school dropouts. Office of Educational
Research and Improvement. Retrieved from
http://nces.ed.gov/pubsearch/pubsinfo.asp?pubid=98085.
Bowers, A. J. (2009). Reconsidering grades as data for decision
making: More than just academic knowledge. Journal of
Educational Administration, 47(5), 609-629.
doi:10.1108/09578230910981080
Bowers, A. J. (2010a). Analyzing the longitudinal K-12 grading
histories of entire cohorts of students: Grades, data driven
decision making, dropping out and hierarchical cluster
analysis. Practical Assessment Research and Evaluation,
15(7), 1-18. http://pareonline.net/pdf/v15n7.pdf
Bowers, A. J. (2010b). Grades and Graduation: A Longitudinal
Risk Perspective to Identify Student Dropouts. Journal of
Educational Research, 103(3), 191-207.
doi:10.1080/00220670903382970
Bowers, A. J. (2011). What's in a grade? The multidimensional
nature of what teacher-assigned grades assess in high school.
Educational Research and Evaluation, 17(3), 141-159. doi:
10.1080/13803611.2011.597112
Bowers, A. J., & Sprott, R. (2012a). Examining the multiple
trajectories associated with dropping out of high school: A
growth mixture model analysis. Journal of Educational
Research, 105(3), 176-195. doi:10.1080/00220671.2011.552075
Bowers, A. J., & Sprott, R. (2012b). Why tenth graders fail to
finish high school: A dropout typology latent class analysis.
Journal of Education for Students Placed at Risk, 17(3), 129-
148. doi:10.1080/10824669.2012.692071
Brookhart, S. M. (1991). Grading practices and validity.
Educational Measurement: Issues and Practice, 10(1), 35-36.
Cameron, S. V., & Heckman, J. J. (1993). The nonequivalence of
high school equivalents. Journal of Labor Economics, 11(1),
1-47.
Cataldi, E. F., Laird, J., & KewalRamani, A. (2009). High school
dropout and completion rates in the United States: 2007.
Washington, DC: National Center for Education Statistics,
Institute of Education Sciences, U.S. Department of
Education.
Cizek, G. J., Fitzgerald, S. M., & Rachor, R. E. (1995-1996).
Teachers' assessment practices: Preparation, isolation and the
kitchen sink. Educational Assessment, 3(2), 159-179.
Croninger, R. G., & Lee, V. E. (2001). Social capital and dropping
out of high school: Benefits to at-risk students of teachers'
support and guidance. Teachers College Record, 103(4), 548-
581.
Cross, L. H., & Frary, R. B. (1999). Hodgepodge grading:
Endorsed by students and teachers alike. Applied
Measurement in Education, 12(1), 53-72.
Curtis, J., Doss, D., MacDonald, J., & Davis, W. (1983). Dropout
prediction. Paper presented at the Annual meeting of the
American Educational Research Association, Montreal.
Dalton, B., Glennie, E., & Ingles, S. J. (2009). Late high school
dropouts: Characteristics, experiences, and changes across
cohorts. (NCES 2009-307). Washington, DC: National Center
for Education Statistics, Institute of Education Sciences, U.S.
Department of Education Retrieved from
http://nces.ed.gov/pubs2009/2009307.pdf.
15
Bowers, Sprott & Taff (2013) Do We Know Who Will Dropout?
Doss, D. A. (1986). Ninth grade course enrollment and dropping
out. Paper presented at the Annual Meeting of the American
Educational Research Association, San Francisco.
Duchesne, S., Vitaro, F., Larose, S., & Tremblay, R. E. (2008).
Trajectories of anxiety during elementary-school years and
the prediction of high school noncompletion. Journal of
Youth and Adolescence, 2008(37), 1134-1146.
Eide, E. R., & Showalter, M. H. (2001). The effect of grade
retention on educational and labor market outcomes.
Economics of Education Review, 20, 563-576.
Ekstrom, R. B., Goertz, M. E., Pollack, J. M., & Rock, D. A.
(1986). Who drops out of high school and why? Findings
from a national study. Teachers College Record, 87(3), 356-
373.
Ensminger, M. E., & Slusarcick, A. L. (1992). Paths to high school
graduation or dropout: A longitudinal study of a first-grade
cohort. Sociology of Education, 65(2), 91-113.
Fawcett, T. (2004). ROC Graphs: Notes and practical
considerations for researchers. Retrieved from
http://citeseerx.ist.psu.edu/viewdoc/download?doi=10.1.1.10.
9777&rep=rep1&type=pdf.
Finn, J. D., Scott, L. A., & Fish, R. M. (2008). Educational
sequelae of high school misbehavior. Journal of Educational
Research, 101(5), 259-274.
Fortin, L., Marcotte, D., Potvin, P., Royer, E., & Joly, J. (2006).
Typology of students at risk of dropping out of school:
Description by personal, family and school factors. European
Journal of Psychology of Education, 21(4), 363-383.
Frazer, L. (1991). At-risk students three years later: We know
which ones will drop out. Paper presented at the Annual
Meeting of the American Educational Research Association,
Chicago, IL.
French, D. C., & Conrad, J. (2001). School dropout as predicted by
peer rejection and antisocial behavior. Journal of Research on
Adolescence, 11(3), 225-244.
Gleason, P., & Dynarski, M. (2002). Do we know whom to serve?
Issues in using risk factors to identify dropouts. Journal of
Education for Students Placed at Risk, 7(1), 25-41.
Hanley, J. A., & McNeil, B. J. (1982). The meaning and use of the
area under a receiver operating characteristic (ROC) curve.
Radiology, 143, 29-36.
Hess, A. G., & Lauber, D. (1985). Dropouts from the Chicago
public schools: An analysis of the classes of 1982, 1983,
1984. Chicago, IL: Chicago Panel on Public School Finances.
HRSD. (2006). Leaving school - Results from a national survey
comparing school leavers and high school graduates 18 to 20
years of age - January 1995. #1995-00015. Ottawa CA:
Human Resources Skills Development Canada.
Janosz, M., Archambault, I., Morizot, J., & Pagani, L. S. (2008).
School engagement trajectories and their differential
predictive relations. Journal of Social Issues, 64(1), 21-40.
Janosz, M., LeBlanc, M., Boulerice, B., & Tremblay, R. E. (2000).
Predicting different types of school dropouts: A typological
approach with two longitudinal samples. Journal of
Educational Psychology, 92(1), 171-190.
Jemal, A., Ward, E., Anderson, R. N., Murray, T., & Thun, M. J.
(2008). Widening of socioeconomic inequalities in U.S. death
rates, 1993-2001. PLoS ONE, 3(5).
Jimerson, S. R., Egeland, B., Sroufe, L. A., & Carlson, B. (2000).
A prospective longitudinal study of high school dropouts
examining multiple predictors across development. Journal of
School Psychology, 38(6), 525-549.
Jimerson, S. R., Pletcher, S. M. W., Graydon, K., Schnurr, B. L.,
Nickerson, A. B., & Kundert, D. K. (2005). Beyond grade
retention and social promotion: Promoting the social and
academic competence of students. Psychology in the schools,
43(1), 85-97.
Jung, T., & Wickrama, K. A. S. (2008). An introduction to latent
class growth analysis and growth mixture modeling. Social
and Personality Psychology Compass, 2(1), 302-317.
Kaplan, D., Kim, J.-S., & Kim, S.-Y. (2009). Multilevel latent
variable modeling: Current research and recent developments.
In R. E. Millsap & A. Maydeu-Olivares (Eds.), The SAGE
handbook of quantitative methods in psychology (pp. 592-
612). Thousand Oaks, CA: SAGE Publications.
Kaufman, P. (2004). The national dropout data collection system:
History and the search for consistency. In G. Orfield (Ed.),
Dropouts in America: Confronting the graduation rate crisis
(pp. 107-130). Cambridge, MA: Harvard Education Press.
Klapp Lekholm, A., & Cliffordson, C. (2008). Discrepancies
between school grades and test scores at individual and school
level: effects of gender and family background. Educational
Research and Evaluation, 14(2), 181-199.
Klapp Lekholm, A., & Cliffordson, C. (2009). Effects of student
characteristics on grades in compulsory school. Educational
Research and Evaluation, 15(1), 1-23. doi:
10.1080/13803610802470425
Kronick, R. F., & Hargis, C. H. (1998). Dropouts: Who drops out
and why - and the recommended action (2 ed.). Springfield,
IL: Charles C. Thomas.
Kupersmidt, J. B., & Coie, J. D. (1990). Preadolescent peer status,
aggression, and school adjustment as predictors of
externalizing problems in adolescence. Child Development,
61, 1350-1362.
Lee, J. C., & Staff, J. (2007). When work matters: The varying
impact of work intensity on high school dropout. Sociology of
Education, 80, 158-178.
Mahoney, J. L. (2000). School extracurricular activity participation
as a moderator in the development of antisocial patterns.
Child Development, 71(2), 502-516.
Mahoney, J. L., & Cairns, R. B. (1997). Do extracurricular
activities protect against early school dropout? Developmental
Psychology, 33(2), 241-253.
McCaul, E. (1989). Rural public school dropouts: Findings from
high school and beyond. Research in Rural Education, 6(1),
19-24.
McNeal, R. B., Jr. (1997). Are students being pulled out of high
school? The effect of adolescent employment on dropping
out. Sociology of Education, 70(3), 206-220.
Mensch, B. S., & Kandel, D. B. (1988). Dropping out of high
school and drug involvement. Sociology of Education, 61, 95-
113.
Moretti, E. (2007). Crime and the costs of criminal justice. In C. R.
Belfield & H. M. Levin (Eds.), The price we pay (pp. 142-
159). Washington, DC: Brookings Institution Press.
Muenning, P. (2007). Consequences in health status and costs. In
C. R. Belfield & H. M. Levin (Eds.), The price we pay (pp.
125-141). Washington, DC: Brookings Institution Press.
Muthén, B. O. (2004). Latent variable analysis: Growth mixture
modeling and related techniques for longitudinal data. In D.
Kaplan (Ed.), The Sage handbook of quantitative
methodology for the social sciences (pp. 345-370). Thousand
Oaks, CA: Sage Publications.
Pagani, L. S., Vitaro, F., Tremblay, R. E., McDuff, P., Japel, C., &
Larose, S. (2008). When predictions fail: The case of
unexpected pathways toward high school dropout. Journal of
Social Issues, 64(1), 175-194.
16
Bowers, Sprott & Taff (2013) Do We Know Who Will Dropout?
Pallas, A. M. (1989). Conceptual and measurement issues in the
study of school dropouts. In K. Namboodiri & R. G. Corwin
(Eds.), Research in the sociology of education and
socialization (Vol. 8, pp. 87-116). Greenwich, CT: JAI Press
Inc.
Pallas, A. M. (1993). Schooling in the course of human lives: The
social context of education and the transition to adulthood in
industrial society. Review of Educational Research, 63(4),
409-447.
Pallas, A. M. (2003). Educational transitions, trajectories, and
pathways. In J. T. Mortimer & M. J. Shanahan (Eds.),
Handbook of the life course. New York: Kluwer
Academic/Plenum Publishers.
Rice, M. E., & Harris, G. T. (2005). Comparing effect sizes in
follow-up studies: ROC area, Cohen's d, and r. Law and
Human Behavior, 29(5), 615-620. doi: 10.1007/s10979-005-
6832-7
Roderick, M. (1994). Grade retention and school dropout:
Investigating the association. American Educational Research
Journal, 31(4), 729-759.
Rogosa, D. (2005). Statistical misunderstandings of the properties
of school scores and school accountability. In J. L. Herman &
E. H. Haertel (Eds.), Uses and misuses of data for educational
accountability and improvement: 104th yearbook of the
National Society for the Study of Education (pp. 147-174).
Malden, Mass.: Blackwell Publishing.
Rouse, C. E. (2007). Consequences for the labor market. In C. R.
Belfield & H. M. Levin (Eds.), The price we pay (pp. 99-
124). Washington, DC: Brookings Institution Press.
Rumberger, R. W. (1987). High school dropouts: A review of
issues and evidence. Review of Educational Research, 57(2),
101-121.
Rumberger, R. W. (2004). Why students drop out of school. In G.
Orfield (Ed.), Dropouts in America: Confronting the
graduation rate crisis (pp. 131-156). Cambridge, MA: Harvard
Education Press.
Sandefur, G. D., Mclanahan, S., & Wojtkiewicz, R. A. (1992). The
effects of parental marital status during adolescence on high
school graduation. Social Forces, 71(1), 103-121.
Silver, D., Saunders, M., & Zarate, E. (2008). What factors predict
high school graduation in the Los Angeles Unified School
District California Dropout Research Project. Santa Barbara,
CA: University of California Santa Barbara.
South, S. J., Haynie, D. L., & Bose, S. (2007). Student mobility
and school dropout. Social Science Research, 36, 68-94.
Suh, S., & Suh, J. (2007). Risk factors and levels of risk for high
school dropouts. Professional School Counseling, 10(3), 297-
306.
Swanson, C. B. (2004). Sketching a portrait of public high school
graduation: Who graduates? Who doesn't? In G. Orfield (Ed.),
Dropouts in America: Confronting the graduation rate crisis
(pp. 13-40). Cambridge, MA: Harvard Education Press.
Swanson, C. B. (2009). Cities in crisis 2009: Closing the
graduation gap: Educational and economic conditions in
America's largest cities. Bethesda, MD: Editorial Projects in
Education, Inc.
Swets, J. A. (1988). Measuring the accuracy of diagnostic systems.
Science, 240(4857), 1285-1293. doi:
10.1126/science.3287615
Troob, C. (1985). Longitudinal study of students entering high
school in 1979: The relationship between first term
performance and school completion. New York: New York
City Board of Education.
Tyler, J. H. (2003). Economic benefits of the GED: Lessons from
recent research. Review of Educational Research, 73(3), 369-
403.
Vivo, J.-M., & Franco, M. (2008). How does one assess the
accuracy of academic success predictors? ROC analysis
applied to university entrance factors. International Journal of
Mathematical Education in Science and Technology, 39(3),
325-340. doi: 10.1080/00207390701691566
Waldfogel, J., Garfinkel, I., & Kelly, B. (2007). Welfare and the
costs of public assistance. In C. R. Belfield & H. M. Levin
(Eds.), The price we pay (pp. 160-174). Washington, DC:
Brookings Institution Press.
Warren, J. R., & Lee, J. C. (2003). The impact of adolescent
employment on high school dropout: Differences by
individual and labor-market characteristics. Social Science
Research, 32, 98-128.
Willingham, W. W., Pollack, J. M., & Lewis, C. (2002). Grades
and test scores: Accounting for observed differences. Journal
of Educational Measurement, 39(1), 1-37.
Zwieg, M. H., & Campbell, G. (1993). Receiver-operating
characteristic (ROC) plots: A fundamental evaluation tool in
clinical medicine. Clinical Chemistry, 39(4), 561-577.