Embed Size (px)
Citation preview
J. Bio. Env. Sci. 2016
209 | Akbari and Toorchi
RESEARCH PAPER OPEN ACCESS
Proteome analysis of wheat (Triticum aestivum L.) root under
sodium chloride stress
Mahdi Akbari, Mahmoud Toorchi*
Department of Plant Breeding and Biotechnology, University of Tabriz, Iran
Article published on April28, 2016
Key words: NaCl stress, root proteome, two-dimensional electrophoresis, wheat.
Abstract
Salinity is the most important abiotic stresses adversely affect the quality and quantity of crops, in which 20% of
the world's irrigated agricultural lands are affected by salinity. Wheat is an oldest and the first crop used for bread
making for human nutrition. To investigate the response of wheat root to NaCl stress, a susceptible, Arta, and
resistance, Bam, wheat varieties were grown under both non-stress and stress conditions. Stress plants were
exposed to 250 mM of NaCl based on a completely randomized design with four replications. Proteins were
extracted from root and proteomic analysis was performed by two-dimensional polyacrylamide gel
electrophoresis. Proteome profile of root in susceptible variety lead to the identification of 21 differentially
changed protein spots compare with 49 spots of tolerant variety. The regulatory changed proteins belongs to
stress-responsive proteins and others related processes including metabolism and energy; scavenging of reactive
oxygen species and detoxifying; protein translation, processing and degradation; cell wall-related proteins;
Amino acid metabolism and hormone-related proteins; signal transduction network; cytoskeleton; transcription-
related proteins.
*CorrespondingAuthor: Mahmoud Toorchi [email protected]
Journal of Biodiversity and Environmental Sciences (JBES) ISSN: 2220-6663 (Print) 2222-3045 (Online)
Vol. 8, No. 4, p. 209-220, 2016
http://www.innspub.net
J. Bio. Env. Sci. 2016
210 | Akbari and Toorchi
Introduction
Salinity is one of the most important abiotic stresses
that adversely affect the quality and quantity of crops,
so that 20% of the world's irrigated agricultural lands
are affected by salinity (Zhao etal., 2007). Biological
and abiotic stresses such as salinity, before any
change in cytoplasmic calcium concentration and pH
occur, it must somehow be understood by the plant.
Salinity stress by osmotic stress and ion toxicity
(sodium and chloride) and these tensions can be
understood in both the inner and outer plasma
membrane by transmembrane proteins or enzymes
inside cytosolunderstood. Many osmotic raised in
understanding drought stress sensors are activated by
intense passion (Abdul Kader and Lindberg, 2010).
Salt interferes with plant growth and can lead to
physiological drought and ionic toxicity. Thus, salinity
and drought stress often affects the physiological
aspects of plant metabolism, creating tension
(Hyperionic and Hyper osmotic), and eventually plant
will death. Salinity and drought stress have overlap on
physiology because having salt in soil decrease the
amount of water on it and leading to reduced water
absorption. Salinity stresses cause ion stress,
potassium ion, sodium ion ratio are change. External
sodium ions can have a negative effect on the
absorption of calcium ions. Salinity resulted increase
the concentration of sodium ions and chloride in
cytosol, the outcome could be detrimental to the cells.
Sodium ion can eliminate membrane potential, thus
facilitated the absorption of chloride. The high
concentration of sodium ions (up to 100 mM), is
toxicity for the cell metabolism and can prevent
activity of many essential enzymes, cell division and
expansion, causing membrane damage and osmotic
imbalance and thus stop the growth. The high
concentration of sodium ions can lead to the
production of reactive oxygen species and reduction
of photosynthesis. Potassium is an essential element
required for growth. The concentration of potassium
ions (due to severe salt stress) cause osmotic
imbalance, problem in stomata functions and action
of enzymes. Salinity damage cells in the leaf
transpiration, resulting in prevention of growth and
cause cell toxicity. Salts can accumulate in older
leaves and cause death (Tuteja, 2007).
Several studies have used Proteomics to identify
proteins in response to salinity. Many proteins have
been found that match their words with the salt
concentration is set. The proteins in the process of
photosynthesis, photo respiration, transduction,
metabolism, defense against oxidative stress, ion
channels control the folding of proteins are involved
(Joseph and Jini, 2010). The effect of salinity on plant
growth is a two-step Changes in the osmotic effect of
salt water, and toxic ions in salt increases the
transpiration and leaf emerges. Changes in proteome
of wheat, 30 days after exposure to 125 mM NaCl in
the culture chamber were evaluated. A significant
negative correlation between tolerance to salt and
sodium concentration in wheat stems were observed.
Protein expression and susceptible genotypes after 10
days of treatment with 125 mM sodium chloride,
more than 5%, but the difference between the figures
in different groups of protein modifications (over
expression, knockdown, disappearance and
appearance) from 1 to 8 % was variable (Saqib et al.,
2006). Song (2007) to develop a better understanding
of the roots of wheat, a map of soluble proteins in
roots using a combination of MS/MS and MALDI
TOF MS and 2-DE prepared. A total of 450 protein
spots stained with silver in the pH range 4-7 View and
identified 240 proteins were identified. These
proteins are functionally divided into various groups
compared with the wheat root proteome proteins
involved in metabolism and transport were
mentioned too. 25 proteins from 45 different proteins
expressed in metabolism, energy production, growth
and cell division, disease, and the secondary
metabolites involved. They also showed that
hybridization between two parental lines could be
differences in protein expression in the offspring than
their parents..
Proteomic analysis of leaves in different wheat
cultivars to salinity stress on both the performance
J. Bio. Env. Sci. 2016
211 | Akbari and Toorchi
and quality of gluten strength were investigated.
Seedlings with four different salt concentrations (1,
5.1, 2 and 2.5%) were evaluated. Total protein was
extracted from the leaves of plants under stress and
non-stress conditions were separated by two-
dimensional electrophoresis. Of 2358 protein spots,
125 spots showed significant changes in response to
salinity. Using mass spectrometry, 52 spots were
detected in response to salt in six functional groups.
These groups include proteins associated with the
transport, detoxification enzymes, ATP synthesis,
carbon metabolism, formation of protein structure
and protein with unknown biological function. Of
these 52 spots, 26 spots up-regulated and 21 down-
regulated spots and five spots showed several
patterns of expression (Gao et al., 2011).
Long-term effects of salt stress, and stress on plant
seeds planted in the four-leaf stage, the levels were
zero and 300 mM NaCl. Sampling by separating the
fourth leaf of each plant was done 21 days after stress.
The results of this experiment showed that among
more than 500 protein spots repeatable, 124 spots
were a significant difference between treatments.
Proteins identified in the mechanism of
photosynthesis, oxidative stress, translation, and
protein were involved Trarsany message. The aim of
the present work was to perform a comparative study
by proteomics approach, based on two-dimensional
poly-acrylamide gel electrophoresis (2D-PAGE) in
order to identify salinity-related proteins in wheat
(Triticum aestivum) varieties named Arta and Bam
that differ in tolerance to the NaCl stress (Fatehi et
al., 2012).
Materials and methods
Plant growth and stress treatment
Plant material used in this study was two wheat
(Triricum aestivum L.) cultivars; ―Bam‖ and ―Arta‖
known as tolerant and susceptible to NaCl stress,
respectively. These seeds were taken from ―Seed and
Plant Improvement Institute‖, Karaj, IRAN.
Experiment was conducted in completely randomized
design with three replications. Treatments were
combination of wheat, cultivars of wheat (―Arta‖ and
―Bam‖) and two irrigation levels including normal
and NaCl stress (250 mM). Stress was imposed by
combination Nacl with water. Then roots were
harvested and were immediately immersed in liquid
nitrogen and stored at -80˚C until used for protein
extraction.
Protein extraction
Total protein extracts were isolated from
approximately 0.5 g of frozen leaf per biological
replicate and suspended the fine powder in cold
acetone containing 10% TCA and 0.07% 2-
Mercapthoetanol. The resultant powder dissolved in
lysis buffer containing 7 M Urea, 2 M thiourea, 2%
CHAPS, 60 mM DDT and 1% ampholyte (pH:3-10).
Protein concentration was determined by Bradford
assay (Bradford, 1976).
Two-dimensional gel electrophoresis
IEF of proteins performed with 140 µg of protein
extract using 11 cm tube gels and 3 mm diameter
(O’Farrell, 1975). IEF gel solution consisted of 8 M
urea, 3.5% polyacrylamide, and 2% NP-40, 2%
ampholines (pH: 3.5-10.0 and pH: 5.0-8.0),
ammonium persulfate and TEMED. The voltage
settings of the IEF were a 200 V gradient for 30 min,
a 400 V gradient for 16 h and a 600 V for 1h. Proteins
in the tube gels separated on the basis of their IF. The
second dimension SDS-PAGE gels, tube gels were
subjected to the second dimension electrophoresis
after transferring onto a 15% acrylamide separating
gel and 5%b acrylamide stacking gel. After
electrophoresis, we stained Proteins with Silver
nitrate (AgNO3).
Statistical analysis and spot identification
Gels were scanned using BioRad GS-800 scanner.
Images analyses were performed with PDQuestTM
software (BioRad). Selected spots were attributed to
the corresponding proteins by search taking into
account of their isoelectric point (pI) and molecular
weight (MW) within databases especially ―SWISS-
2DPAGE‖ in EXPASY. After normalization, a one-way
J. Bio. Env. Sci. 2016
212 | Akbari and Toorchi
ANOVA model was used to identify the differentially
expressed protein spots between normal and stress.
Protein identification was obtained from MSDB,
NCBI and SwissProt protein database.
Result
Analysis of proteome
NaCl stress related proteins were investigated by 2D-
PAGE and bioinformatics’ databases in two Triticum
aestivum cultivars: Bam (Salinity tolerant) and Arta
(Salinity susceptible).
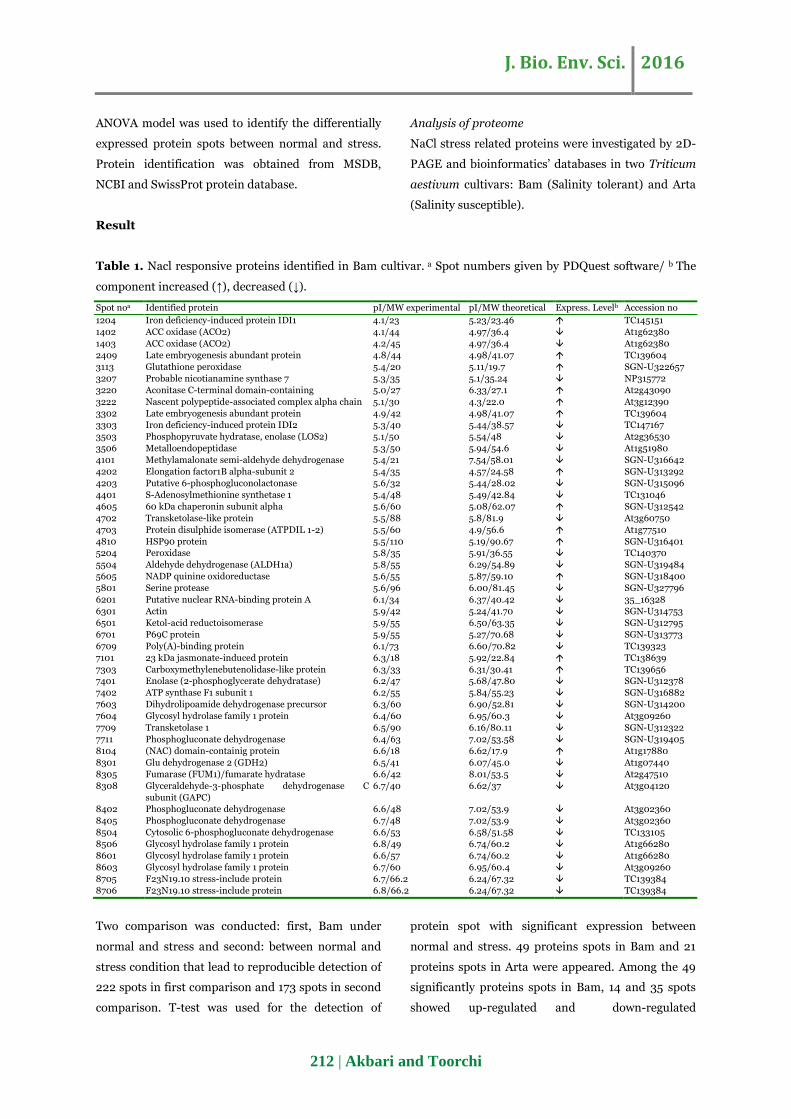
Table 1. Nacl responsive proteins identified in Bam cultivar. a Spot numbers given by PDQuest software/ b The
component increased (↑), decreased (↓).
Spot noa Identified protein pI/MW experimental pI/MW theoretical Express. Levelb Accession no
1204 Iron deficiency-induced protein IDI1 4.1/23 5.23/23.46 TC145151
1402 ACC oxidase (ACO2) 4.1/44 4.97/36.4 At1g62380
1403 ACC oxidase (ACO2) 4.2/45 4.97/36.4 At1g62380
2409 Late embryogenesis abundant protein 4.8/44 4.98/41.07 TC139604
3113 Glutathione peroxidase 5.4/20 5.11/19.7 SGN-U322657
3207 Probable nicotianamine synthase 7 5.3/35 5.1/35.24 NP315772
3220 Aconitase C-terminal domain-containing 5.0/27 6.33/27.1 At2g43090
3222 Nascent polypeptide-associated complex alpha chain 5.1/30 4.3/22.0 At3g12390
3302 Late embryogenesis abundant protein 4.9/42 4.98/41.07 TC139604
3303 Iron deficiency-induced protein IDI2 5.3/40 5.44/38.57 TC147167
3503 Phosphopyruvate hydratase, enolase (LOS2) 5.1/50 5.54/48 At2g36530
3506 Metalloendopeptidase 5.3/50 5.94/54.6 At1g51980
4101 Methylamalonate semi-aldehyde dehydrogenase 5.4/21 7.54/58.01 SGN-U316642
4202 Elongation factor1B alpha-subunit 2 5.4/35 4.57/24.58 SGN-U313292
4203 Putative 6-phosphogluconolactonase 5.6/32 5.44/28.02 SGN-U315096
4401 S-Adenosylmethionine synthetase 1 5.4/48 5.49/42.84 TC131046
4605 60 kDa chaperonin subunit alpha 5.6/60 5.08/62.07 SGN-U312542
4702 Transketolase-like protein 5.5/88 5.8/81.9 At3g60750
4703 Protein disulphide isomerase (ATPDIL 1-2) 5.5/60 4.9/56.6 At1g77510
4810 HSP90 protein 5.5/110 5.19/90.67 SGN-U316401
5204 Peroxidase 5.8/35 5.91/36.55 TC140370
5504 Aldehyde dehydrogenase (ALDH1a) 5.8/55 6.29/54.89 SGN-U319484
5605 NADP quinine oxidoreductase 5.6/55 5.87/59.10 SGN-U318400
5801 Serine protease 5.6/96 6.00/81.45 SGN-U327796
6201 Putative nuclear RNA-binding protein A 6.1/34 6.37/40.42 35_16328
6301 Actin 5.9/42 5.24/41.70 SGN-U314753
6501 Ketol-acid reductoisomerase 5.9/55 6.50/63.35 SGN-U312795
6701 P69C protein 5.9/55 5.27/70.68 SGN-U313773
6709 Poly(A)-binding protein 6.1/73 6.60/70.82 TC139323
7101 23 kDa jasmonate-induced protein 6.3/18 5.92/22.84 TC138639
7303 Carboxymethylenebutenolidase-like protein 6.3/33 6.31/30.41 TC139656
7401 Enolase (2-phosphoglycerate dehydratase) 6.2/47 5.68/47.80 SGN-U312378
7402 ATP synthase F1 subunit 1 6.2/55 5.84/55.23 SGN-U316882
7603 Dihydrolipoamide dehydrogenase precursor 6.3/60 6.90/52.81 SGN-U314200
7604 Glycosyl hydrolase family 1 protein 6.4/60 6.95/60.3 At3g09260
7709 Transketolase 1 6.5/90 6.16/80.11 SGN-U312322
7711 Phosphogluconate dehydrogenase 6.4/63 7.02/53.58 SGN-U319405
8104 (NAC) domain-containig protein 6.6/18 6.62/17.9 At1g17880
8301 Glu dehydrogenase 2 (GDH2) 6.5/41 6.07/45.0 At1g07440
8305 Fumarase (FUM1)/fumarate hydratase 6.6/42 8.01/53.5 At2g47510
8308 Glyceraldehyde-3-phosphate dehydrogenase C
subunit (GAPC) 6.7/40 6.62/37 At3g04120
8402 Phosphogluconate dehydrogenase 6.6/48 7.02/53.9 At3g02360
8405 Phosphogluconate dehydrogenase 6.7/48 7.02/53.9 At3g02360
8504 Cytosolic 6-phosphogluconate dehydrogenase 6.6/53 6.58/51.58 TC133105
8506 Glycosyl hydrolase family 1 protein 6.8/49 6.74/60.2 At1g66280
8601 Glycosyl hydrolase family 1 protein 6.6/57 6.74/60.2 At1g66280
8603 Glycosyl hydrolase family 1 protein 6.7/60 6.95/60.4 At3g09260
8705 F23N19.10 stress-include protein 6.7/66.2 6.24/67.32 TC139384
8706 F23N19.10 stress-include protein 6.8/66.2 6.24/67.32 TC139384
Two comparison was conducted: first, Bam under
normal and stress and second: between normal and
stress condition that lead to reproducible detection of
222 spots in first comparison and 173 spots in second
comparison. T-test was used for the detection of
protein spot with significant expression between
normal and stress. 49 proteins spots in Bam and 21
proteins spots in Arta were appeared. Among the 49
significantly proteins spots in Bam, 14 and 35 spots
showed up-regulated and down-regulated
J. Bio. Env. Sci. 2016
213 | Akbari and Toorchi
respectively. Among 21 significantly proteins spots in
Arta, 6 and 15 spots showed up-regulated and down-
regulated respectively (Fig. 1).
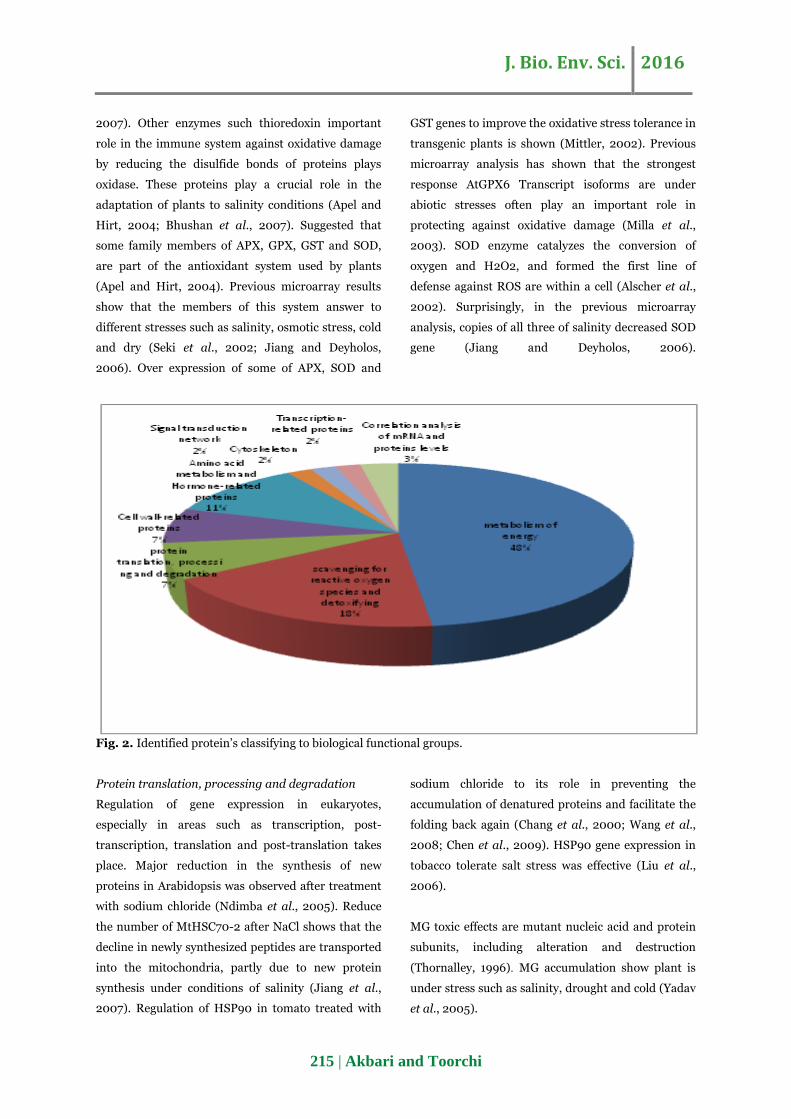
The proteins identified included many previously
characterized stress-responsive proteins and others
related to processes including metabolism of energy;
scavenging for reactive oxygen species and
detoxifying; protein translation, processing and
degradation; Cell wall-related proteins; Amino acid
metabolism and Hormone-related proteins; Signal
transduction network; Cytoskeleton; Transcription-
related proteins; Correlation analysis of mRNA and
proteins levels (Fig. 2).
Discussion
Metabolism of energy
Under salt stress in plants to conserve energy and to
limit the amount of energy metabolism decreases
ROS (Moller, 2001). Previously it was reported that
the frequency Transcript members involved in
glycolysis, citrate cycle, respiration, mitochondrial
pentose phosphate pathway is generally reduced
under salt stress in Arabidopsis roots (Jiang and
Deyholos, 2006).
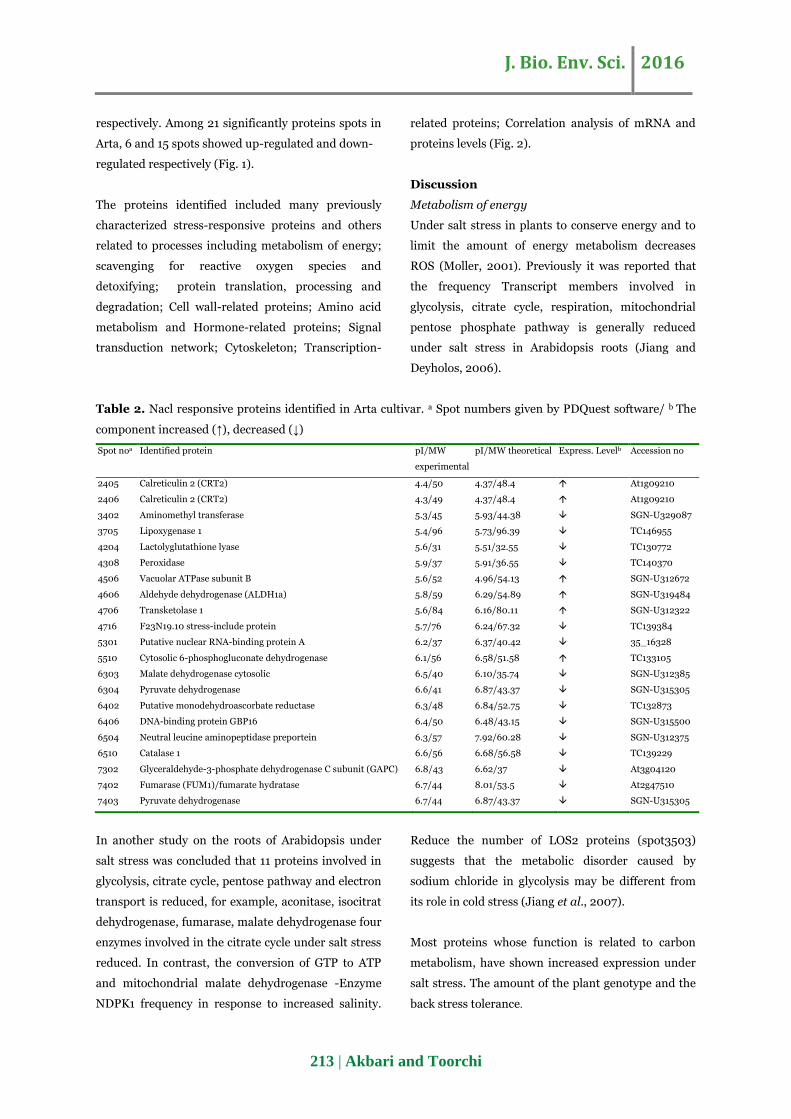
Table 2. Nacl responsive proteins identified in Arta cultivar. a Spot numbers given by PDQuest software/ b The
component increased (↑), decreased (↓)
Spot noa Identified protein pI/MW
experimental
pI/MW theoretical Express. Levelb Accession no
2405 Calreticulin 2 (CRT2) 4.4/50 4.37/48.4 At1g09210
2406 Calreticulin 2 (CRT2) 4.3/49 4.37/48.4 At1g09210
3402 Aminomethyl transferase 5.3/45 5.93/44.38 SGN-U329087
3705 Lipoxygenase 1 5.4/96 5.73/96.39 TC146955
4204 Lactolyglutathione lyase 5.6/31 5.51/32.55 TC130772
4308 Peroxidase 5.9/37 5.91/36.55 TC140370
4506 Vacuolar ATPase subunit B 5.6/52 4.96/54.13 SGN-U312672
4606 Aldehyde dehydrogenase (ALDH1a) 5.8/59 6.29/54.89 SGN-U319484
4706 Transketolase 1 5.6/84 6.16/80.11 SGN-U312322
4716 F23N19.10 stress-include protein 5.7/76 6.24/67.32 TC139384
5301 Putative nuclear RNA-binding protein A 6.2/37 6.37/40.42 35_16328
5510 Cytosolic 6-phosphogluconate dehydrogenase 6.1/56 6.58/51.58 TC133105
6303 Malate dehydrogenase cytosolic 6.5/40 6.10/35.74 SGN-U312385
6304 Pyruvate dehydrogenase 6.6/41 6.87/43.37 SGN-U315305
6402 Putative monodehydroascorbate reductase 6.3/48 6.84/52.75 TC132873
6406 DNA-binding protein GBP16 6.4/50 6.48/43.15 SGN-U315500
6504 Neutral leucine aminopeptidase preportein 6.3/57 7.92/60.28 SGN-U312375
6510 Catalase 1 6.6/56 6.68/56.58 TC139229
7302 Glyceraldehyde-3-phosphate dehydrogenase C subunit (GAPC) 6.8/43 6.62/37 At3g04120
7402 Fumarase (FUM1)/fumarate hydratase 6.7/44 8.01/53.5 At2g47510
7403 Pyruvate dehydrogenase 6.7/44 6.87/43.37 SGN-U315305
In another study on the roots of Arabidopsis under
salt stress was concluded that 11 proteins involved in
glycolysis, citrate cycle, pentose pathway and electron
transport is reduced, for example, aconitase, isocitrat
dehydrogenase, fumarase, malate dehydrogenase four
enzymes involved in the citrate cycle under salt stress
reduced. In contrast, the conversion of GTP to ATP
and mitochondrial malate dehydrogenase -Enzyme
NDPK1 frequency in response to increased salinity.
Reduce the number of LOS2 proteins (spot3503)
suggests that the metabolic disorder caused by
sodium chloride in glycolysis may be different from
its role in cold stress (Jiang et al., 2007).
Most proteins whose function is related to carbon
metabolism, have shown increased expression under
salt stress. The amount of the plant genotype and the
back stress tolerance.
J. Bio. Env. Sci. 2016
214 | Akbari and Toorchi
Some of the genes involved in carbohydrate
metabolism in the short-term effects of sodium
chloride stress or osmotic stress showed decreased
expression (Jiang and Deyholos, 2006).
Methylmalonate semi-aldehyde dehydrogenase
(spot4101), involved in energy production, and UDP-
glucose pyrophosphorylase which is related to sucrose
and starch metabolism were, in control conditions,
also less abundant in tolerant genotypes than in
sensitive ones but were more up-regulated by salt
stress. Our results showed that some proteins
associated with energy production or with transport,
malate dehydrogenase cytosolic (spot6303) and
methylmalonate semi-aldehyde dehydrogenase
(spot4101), also exhibited genotype- and salt related
abundance variations. vacuolar ATPase and
phosphoglycerate kinase) were less abundant after
salt stress. V-ATPase (spot4506), which may provide
the driving force for Na+ transport, via Na+–H+
exchangers, to isolate toxic ions within the vacuole,
has been associated, in many studies, to the ability of
the plant to resist salty conditions (Manaa et al.,
2011).
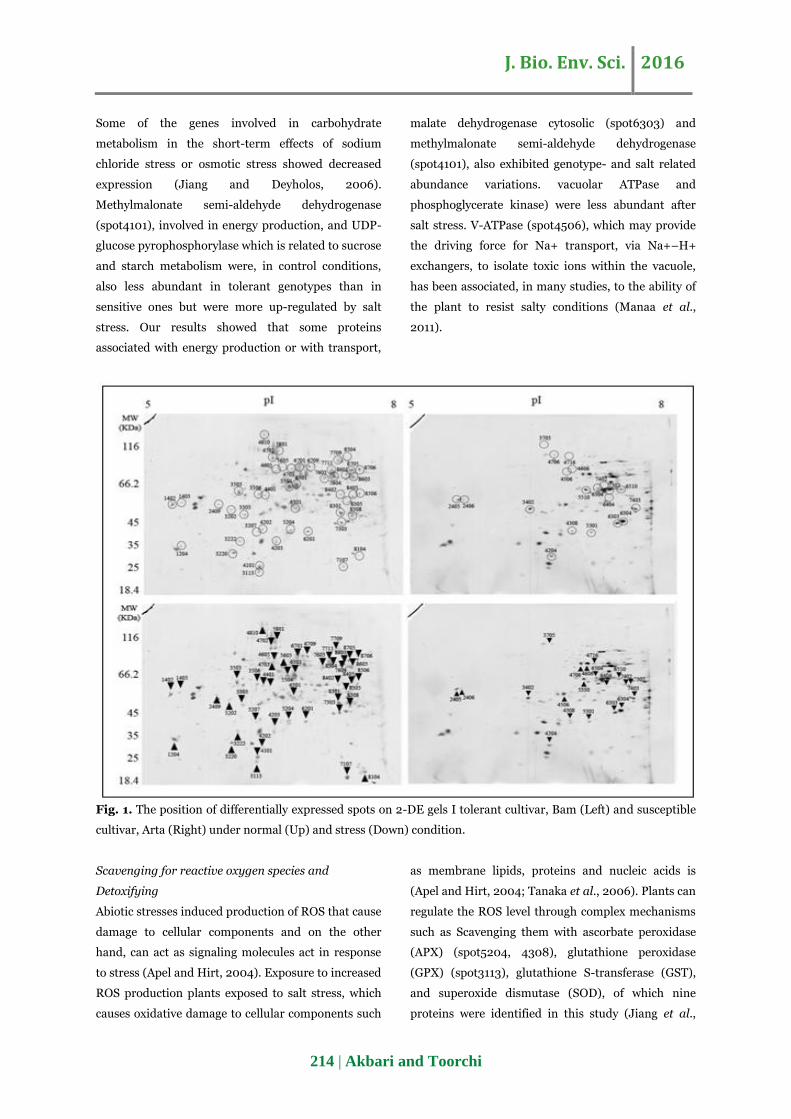
Fig. 1. The position of differentially expressed spots on 2-DE gels I tolerant cultivar, Bam (Left) and susceptible
cultivar, Arta (Right) under normal (Up) and stress (Down) condition.
Scavenging for reactive oxygen species and
Detoxifying
Abiotic stresses induced production of ROS that cause
damage to cellular components and on the other
hand, can act as signaling molecules act in response
to stress (Apel and Hirt, 2004). Exposure to increased
ROS production plants exposed to salt stress, which
causes oxidative damage to cellular components such
as membrane lipids, proteins and nucleic acids is
(Apel and Hirt, 2004; Tanaka et al., 2006). Plants can
regulate the ROS level through complex mechanisms
such as Scavenging them with ascorbate peroxidase
(APX) (spot5204, 4308), glutathione peroxidase
(GPX) (spot3113), glutathione S-transferase (GST),
and superoxide dismutase (SOD), of which nine
proteins were identified in this study (Jiang et al.,
J. Bio. Env. Sci. 2016
215 | Akbari and Toorchi
2007). Other enzymes such thioredoxin important
role in the immune system against oxidative damage
by reducing the disulfide bonds of proteins plays
oxidase. These proteins play a crucial role in the
adaptation of plants to salinity conditions (Apel and
Hirt, 2004; Bhushan et al., 2007). Suggested that
some family members of APX, GPX, GST and SOD,
are part of the antioxidant system used by plants
(Apel and Hirt, 2004). Previous microarray results
show that the members of this system answer to
different stresses such as salinity, osmotic stress, cold
and dry (Seki et al., 2002; Jiang and Deyholos,
2006). Over expression of some of APX, SOD and
GST genes to improve the oxidative stress tolerance in
transgenic plants is shown (Mittler, 2002). Previous
microarray analysis has shown that the strongest
response AtGPX6 Transcript isoforms are under
abiotic stresses often play an important role in
protecting against oxidative damage (Milla et al.,
2003). SOD enzyme catalyzes the conversion of
oxygen and H2O2, and formed the first line of
defense against ROS are within a cell (Alscher et al.,
2002). Surprisingly, in the previous microarray
analysis, copies of all three of salinity decreased SOD
gene (Jiang and Deyholos, 2006).
Fig. 2. Identified protein’s classifying to biological functional groups.
Protein translation, processing and degradation
Regulation of gene expression in eukaryotes,
especially in areas such as transcription, post-
transcription, translation and post-translation takes
place. Major reduction in the synthesis of new
proteins in Arabidopsis was observed after treatment
with sodium chloride (Ndimba et al., 2005). Reduce
the number of MtHSC70-2 after NaCl shows that the
decline in newly synthesized peptides are transported
into the mitochondria, partly due to new protein
synthesis under conditions of salinity (Jiang et al.,
2007). Regulation of HSP90 in tomato treated with
sodium chloride to its role in preventing the
accumulation of denatured proteins and facilitate the
folding back again (Chang et al., 2000; Wang et al.,
2008; Chen et al., 2009). HSP90 gene expression in
tobacco tolerate salt stress was effective (Liu et al.,
2006).
MG toxic effects are mutant nucleic acid and protein
subunits, including alteration and destruction
(Thornalley, 1996). MG accumulation show plant is
under stress such as salinity, drought and cold (Yadav
et al., 2005).
J. Bio. Env. Sci. 2016
216 | Akbari and Toorchi
Cell wall-related proteins
Salt stress reduces the amount of water available to
plants and lead to the inhibition of plant growth is the
increasing pressure on the eve of the wall. This
pressure causes cell spread or induces hydraulic
limitations to absorb water (Steudle, 2000). GH1 and
GH17 family proteins (spot7604, 8506, 8601, 8603),
including β- glycosidase and β-1,3-glucanase
important role in many physiological processes in
plants, including reconstruction of the cell wall (Bray,
2004; Xu et al., 2004). GRPS post-translational
modifications regulate gene expression in plants
under stress does play a role. In most cases, the
vascular tissue accumulation and synthesis of plant
defense mechanism (Mousavi and Hotta, 2005).
Salinity caused a temporary increase in the frequency
of AtGRP7 (Jiang et al., 2007). Three proteins
associated with the cell wall GRP7, Caffeoyl-CoA O-
methyltransferase 6 and S1UPTG1. Have important
role in post-transcriptional changes in gene
expression in plants under stress plays. Important
role in the processes of defense against stress and
protein GRP7 also reduced in the susceptible cultivar
showed sustained expression (Mousavi and Hotta,
2005). Up regulation of S1UPTG1 protein in cell wall
biosynthesis root occurs in response to salt stress (Li
et al., 2008).
Amino acid metabolism and Hormone-related
proteins
Jasmonic acid and ethylene, are hormones that are
associated with environmental stresses (Chen et al.,
2005; Devoto and Turner, 2005). Jasmonic acid in a
wide variety of stresses, defense and developmental
processes involved (Devoto and Turner, 2005). One
of the enzymes involved in the biosynthesis of
Jasmonic acid, AOC2 (spot1402, 1403) the frequency
is increased under salt stress. It seems that the
increase Jasmonic acid biosynthesis may also be
associated with response to sodium chloride in
Arabidopsis roots (Jiang et al., 2007). Some amino
acids like proline content increased after treatment
with sodium chloride (Di Martino et al., 2003).
Ashraf and Harris (2004) found that stress causes the
accumulation of free amino acids such as glutamine
hyper osmotic, Sparzhyn and proline in plant cells.
The frequency of amino acid 3-Isopropylmalate
dehydrogenase and Cobalamine-independent
methionine syntethase decreased after treatment with
sodium chloride. But Frequency of glutamate
dehydrogenase 2 (GDH2) (spot8301) and glutamine
synthetase (GS) in the first six hours of salt stress
reduction and increased after 48 hours (Jiang et al.,
2007). GS and GDH with a number of other enzymes,
plays a key role in maintaining the balance of carbon
and nitrogen (Miflin and Habash, 2002). Studies
show that salinity signal to produce ROS, causing α-
GDH subunit expression and anionic iso-GDH as
anti-stress enzymes in the detoxification of ammonia
and glutamine are reproducible (Skopelitis et al.,
2006). SAMS, isopropyl malate dehydrogenase and
glutamine synthetase has effect on amino acid
synthesis and osmotic adjustment in roots under salt
stress (Ouyang et al., 2007).
Signal transduction network
Increase the concentration of sodium chloride in the
extracellular space can be assumed by the sensor in
the cell membrane to regulate gene expression in
Arabidopsis and transfer the cellular understood
(Chinnusamy et al., 2005). Stress can disable
stimulation of the formation ROS in the Ca2 +
transmission path, central regulators and can affect
on plant growth factors (Mortimer et al., 2008).
Proteins such CRT1 and CRT2 (spot2406), protein
associated with calcium and small Ras-like GTP-
binding (Ran-1) protein in signal transduction
networks are involved in salt stress (Jiang et al.,
2007). CRT1 and CRT2 major isoforms that link to
Ca2 plays an important role in Ca2+ homeostasis
under environment.al stress (Yang, 2002). There is
little information about the function of (Ran) in plant
response to stress. Ran1 frequency after 48 hours of
treatment with sodium chloride is increased (Jiang et
al., 2007).
Cytoskeleton
Actin (spot6301) and tubuline have important
J. Bio. Env. Sci. 2016
217 | Akbari and Toorchi
applications in cell homeostasis. Cytoskeleton
reconstructed by endogenesis and external stimuli
such as hormones, low temperature, aluminum,
sodium chloride (Sivaguru et al., 2003). Research
shows that salt stress impairs cortical microtubules
array through the SPR1.Role of (SPR1) is inhibition of
dissimilar growth (Shoji et al., 2006). It was found
that the prevalence of the actin protein (ACT8) and a
β chain tubuline decreased under salt stress. While
the tubuline, chain 6-α (TUA6) is induced by sodium
chloride. However, their importance is not entirely
clear (Jiang et al., 2007).
Transcription-related proteins
The protein consist of NAC domain (spot8104) in
Arabidopsis root is similar to humans transcription
factors (BTF3) under NaCl stress (Jiang et al., 2007).
Down-regulation of BTF3 in Nicotiana benthamiana
cause reduction of chloroplast and mitochondrial and
chloroplast genes were expressed and that in these
cells were producing large amounts of ROS (Yang et
al., 2007).
Correlation analysis of mRNA and proteins levels
The relationship between gene expression at the
mRNA (spot1402, 1403) level and protein is not clear
in the root tissues of plants under abiotic stresses
(Jiang and Deyholos, 2006). The relationship
between expression ratios (For example, treatment
/control) Observed in previous experiments for
protein and transcript has been rarely reported and
this measure represents the mRNA is not associated
with protein frequency (Yan et al., 2006).
Conclusion
Two wheat cultivars with different tolerance to
response NaCl stress was compared in term of
molecular responses using two dimensional
polyacrilamid gel electrophoresis that allow
monitoring of proteome changes and could identify
some proteins that have key role in wheat response to
Nacl stress. These proteins are involved in main
metabolism of energy and scavenging for reactive
oxygen species and detoxifying. Investigating them
could help to understand molecular basis of wheat
response to NaCl stress.
Reference
Abdul Kader MD, Lindberg S. 2010. Cytosolic
calcium and pH signaling in plants under salinity
stress. Plant Signaling and Behavior 5,233-238.
Alscher RG, Erturk N, Heath LS. 2002. Role of
superoxide dismutases (SODs) in controlling
oxidative stress in plants. Journal of Experimental
Botany 53, 1331–1341.
Apel K, Hirt H. 2004. Reactive oxygen species:
metabolism, oxidative stress, and signal transduction.
Annual Review of Plant Biology 55, 373–399.
Bhushan D, Pandey A, Choudhary MK, Datta
A, Chakraborty S, Chakraborty N. 2007.
Comparative proteomics analysis of differentially
expressed proteins in chickpea extracellular matrix
during dehydration stress. Molecular and Cellular
Proteomics 6, 1868–1884.
Bray EA. 2004. Genes commonly regulated by
water-deficit stress in Arabidopsis thaliana. Journal
of Experimental Botany 55, 2331–2341.
Chang WWP, Huang L, Shen M, Webster C,
Burlingame AL, Roberts JKM. 2000. Patterns of
protein synthesis and tolerance of anoxia in root tips
of maize seedlings acclimated to a low-oxygen
environment, and identification of proteins by mass
spectrometry. Plant Physiology 122, 295–318.
Chen S, Gollop N, Heuer B. 2009. Proteomic
analysis of saltstressed tomato (Solanum
lycopersicum) seedlings: effect of genotype and
exogenous application of glycinebetaine. Journal of
Experimental Botany 60, 2005–2019.
Chen YF, Etheridge N, Schaller GE. 2005.
Ethylene signal transduction. Annals of Botany 95,
901–915.
J. Bio. Env. Sci. 2016
218 | Akbari and Toorchi
Chinnusamy V, Jagendorf A, Zhu JK. 2005.
Understanding and improving salt tolerance in
plants. Crop Science 45, 437-448.
Devoto A, Turner JG. 2005. Jasmonate-regulated
Arabidopsis stress signalling network. Physiologia
Plantarum 123, 161–172.
Di Martino C, Delfine S, Pizzuto R, Loreto F,
Fuggi A. 2003. Free amino acids and glycine betaine
in leaf osmoregulation of spinach responding to
increasing salt stress. New Phytologist 158, 455–463.
Gao L, Yan XLi, X, Guo G, Hu Y, Ma W, Yan Y.
2011. Proteome analysis of wheat leaf under salt
stress by two-dimensional difference gel
electrophoresis (2D-DIGE). Phytochemistry 72, 1180-
1191.
Jiang Y, Deyholos M. 2006. Comprehensive
transcriptional profiling of NaCl-stressed Arabidopsis
roots reveals novel classes of responsive genes. BMC
Plant Biology 6, 25.
Jiang Y, Yang B, Harris NS, Deyholos MK.
2007. Comparative proteomic analysis of NaCl stress-
responsive proteins in Arabidopsis roots. Journal of
Experimental Botany 58, 3591-3607.
Jiang YQ, Deyholos MK. 2006. Comprehensive
transcriptional profiling of NaCl-stressed Arabidopsis
roots reveals novel classes of responsive genes. BMC
Plant Biology 6, 25.
Joseph B, Jini D. 2010. Proteomic analysis of
salinity stress-responsive proteins in plants. Asian
Journal of Plant Sciences 9, 307-313.
Li J, Wu XD, Hao ST, Wang XJ, Ling HQ. 2008.
Proteomic response to iron deficiency in tomato root.
Proteomics 8, 2299–2311.
Liu DL, Zhang XX, Cheng YX, Takano T, Liu
SK. 2006. rHsp90 gene expression in response to
several environmental stresses in rice (Oryza sativa
L.). Plant Physiology and Biochemistry 44, 380–386.
Manaa A, Ahmed HB, Valot B, Bouchet JP,
Aschi-smiti S, Causse M, Faurobert M. 2011.
Salt and genotype impact on plant physiology and
root proteome variations in tomato. Journal of
Experimental Botany 1-17 p.
Miflin BJ, Habash DZ. 2002. The role of
glutamine synthetase and glutamate dehydrogenase
in nitrogen assimilation and possibilities for
improvement in the nitrogen utilization of crops.
Journal of Experimental Botany 53, 979–987.
Milla MA, Maurer A, Huete AR, Gustafson JP.
2003. Glutathione peroxidase genes in Arabidopsis
are ubiquitous and regulated by abiotic stresses
through diverse signaling pathways. The Plant
Journal 36, 602–615.
Mittler R. 2002. Oxidative stress, antioxidants and
stress tolerance. Trends in Plant Science 7, 405–410.
Moller IM. 2001. Plant mitochondria and oxidative
stress: electron transport, NADPH turnover, and
metabolism of reactive oxygen species. Annual
Review of Plant Physiology and Plant Molecular
Biology 52, 561–591.
Mortimer JC, Laohavisit A, Macpherson N,
Webb A, Brownlee C, Battey NH, Davies JM.
2008. Annexins: multifunctional components of
growth and adaptation. Journal of Experimental
Botany 59, 533–544.
Mousavi A, Hotta Y. 2005. Glycine-rich proteins: a
class of novel proteins. Applied Biochemistry and
Biotechnology 120, 169–174.
Ndimba BK, Chivasa S, Simon WJ, Slabas AR.
2005. Identification of Arabidopsis salt and osmotic
stress responsive proteins using two dimensional
difference gel electrophoresis and mass spectrometry.
Proteomics 5, 4185–4196.
J. Bio. Env. Sci. 2016
219 | Akbari and Toorchi
Ouyang B, Yang T, Li H, Zhang L, Zhang Y,
Zhang J, Fei Z, Ye Z. 2007. Identification of early
salt stress response genes in tomato root by
suppression subtractive hybridization and microarray
analysis. Journal of Experimental Botany 58, 507–
520.
Saqib M, Zorb C, Schubert S. 2006. Salt-resistant
and salt-sensitive wheat genotypes show similar
biochemical reaction at protein level in the first phase
of salt stress. Journal of Plant Nutrition and Soil
Science 169, 542-548.
Seki M, Narusaka M, Ishida J. 2002. Monitoring
the expression profiles of 7000 Arabidopsis genes
under drought, cold and high-salinity stresses using a
full-length cDNA microarray. The Plant Journal 31,
279–292.
Shoji T, Suzuki K, Abe T, Kaneko Y, Shi H, Zhu
JK, Rus A, Hasegawa PM, Hashimoto T. 2006.
Salt stress affects cortical microtubule organization
and helical growth in Arabidopsis. Plant and Cell
Physiology 47, 1158–1168.
Sivaguru M, Pike S, Gassmann W, Baskin TI.
2003. Aluminum rapidly depolymerizes cortical
microtubules and depolarizes the plasma membrane:
evidence that these responses are mediated by a
glutamate receptor. Plant and Cell Physiology 44,
667–675.
Skopelitis DS, Paranychianakis NV,
Paschalidis KA, Pliakonis ED, Delis ID,
Yakoumakis DI, Kouvarakis A, Papadakis AK,
Stephanou EG, Roubelakis-Angelakis KA.
2006. Abiotic stress generates ROS that signal
expression of anionic glutamate dehydrogenases to
form glutamate for proline synthesis in tobacco and
grapevine. The Plant Cell 18, 2767–2781.
Song X. 2007. Wheat (Triticum aestivum L.) root
proteome and differentially expressed root proteins
between hybrid and parents. Proteomics 7, 3538-
3557.
Steudle E. 2000. Water uptake by roots: effects of
water deficit. Journal of Experimental Botany 51,
1531–1542.
Tanaka A, Christensen MJ, Takemoto D, Park
P, Scott B. 2006. Reactive oxygen species play a role
in regulating a fungus–perennial ryegrass mutualistic
interaction. The Plant Cell 18, 1052–1066.
Thornalley PJ. 1996. Pharmacology of
methylglyoxal: formation, modification of proteins
and nucleic acids, and enzymatic detoxification—a
role in pathogenesis and antiproliferative
chemotherapy. General Pharmacology 27, 565–573.
Tuteja N. 2007. Mechanisms of high salinity
tolerance in plants. Methods in Enzymology 428,
419-438.
Wang MC, Peng ZY, Li CL, Li F, Liu C, Xia GM.
2008. Proteomic analysis on a high salt tolerance
introgression strain of Triticum
aestivum/Thinopyrum ponticum. Proteomics 8,
1470–1489.
Xu Z, Escamilla-Trevino L, Zeng L. 2004.
Functional genomic analysis of Arabidopsis thaliana
glycoside hydrolase family 1. Plant Molecular Biology
55, 343–367.
Yadav SK, Singla-Pareek SL, Ray M, Reddy
MK, Sopory SK. 2005. Methylglyoxal levels in
plants under salinity stress are dependent on
glyoxalase I and glutathione. Biochemical and
Biophysical Research Communications 337, 61–67.
Yan SP, Zhang QY, Tang ZC, Su WA, Sun WN.
2006. Comparative proteomic analysis provides new
insights into chilling stress responses in rice.
Molecular and Cellular Proteomics 5, 484–496.
Yang KS, Kim HS, Jin UH, Lee S, Park JA, Lim
J. Bio. Env. Sci. 2016
220 | Akbari and Toorchi
Y, Pai HS. 2007. Silencing of NbBTF3 results in
developmental defects and disturbed gene expression
in chloroplasts and mitochondria of higher plants.
Planta 225, 1459–1469.
Yang Z. 2002. Small GTPases: versatile signaling
switches in plants. The Plant Cell (Suppl.) 14, S375–
S388.
Zhao GQ, Ma BL, Ren CS. 2007. Growth, gas
exchange, chlorophyll fluorescence, and ion content
of naked oat in response to salinity. Crop Science 47,
123-131.