Embed Size (px)
Citation preview
Norsk Epidemiologi 2013; 23 (1): 61-74 61
Do Norwegians with diabetes have a healthier diet than the general population?
Anne-Marie Aas1,2, Lars Johansson3, Kirsti Bjerkan1,4, Nina Lorentsen5 and Ingrid Løvold Mostad6,7
1) Department of Nutrition and Dietetics, Oslo University Hospital, Aker, Oslo, Norway 2) Faculty of Medicine, University of Oslo, Oslo, Norway
3) Norwegian Directorate of Health, Oslo, Norway 4) Department of Endocrinology, Oslo University Hospital, Aker, Oslo, Norway
5) Department of Medicine, the Hospital Helgelandssykehuset, Mosjøen, Norway 6) Department of Clinical Nutrition, Clinic of Clinical Service, St. Olavs Hospital, Trondheim University
Hospital, Trondheim, Norway 7) Department of Cancer Research and Molecular Medicine, Faculty of Medicine, Norwegian University of
Science and Technology (NTNU), Trondheim, Norway Correspondence: Anne-Marie Aas, Department of Nutrition and Dietetics, Oslo University Hospital, Aker, PB 4959 Nydalen, NO-0424 Oslo, Norway
e-mail: [email protected] Telephone: +47 47 30 29 12 Telefax: +47 23 03 30 57
ABSTRACT
Objective: Review current knowledge about dietary habits among people with diabetes in Norway compared with the general population and nutrient- and food-based dietary recommendations. Method: Baseline dietary data from four intervention studies in subjects with type 2 diabetes, were merged (n=92) and compared with data extracted from a nationwide dietary survey, NORKOST, where participants with diabetes (n=115) were compared with a gender and age matched control group (n=575). A validated food frequency questionnaire was used for dietary assessment. An overview of previously published data from two studies among young people with type 1 diabetes was included for comparison. Results: Subjects with diabetes had an intake of carbohydrates in the lower recommended range and lower than the controls, which was reflected in a lower intake of added sugar, sweets, potatoes, sugar-sweetened beverages, and fruit juices. Subjects with diabetes had a fiber intake which was similar or higher than controls, but below the recommended intake. They reported a higher proportion of energy from protein and fat than controls, reflecting the higher intake of meat, fish, edible fats, and high-fat meat products. There was a higher intake of vegetables, fruits and whole grain among subjects with diabetes compared with controls, but also a higher intake of red meat. Conclusion: Compared with the recommendations, people with diabetes had a low intake of carbohydrates and a high intake of protein and fat, but they made more healthy choices regarding intake of selected food groups compared with the control groups.
INTRODUCTION Changes in dietary habits, weight reduction and physical activity are cornerstones in the prevention and treatment of type 2 diabetes (1-3). Lifestyle interven-tion over a period of about 3-6 years has been shown to prevent the development of type 2 diabetes in high-risk individuals with impaired glucose tolerance by almost 60% (4-6) and the difference between the inter-vention group and control group has been sustained for up to 13 years post intervention (7). Further, a high intake of dietary fiber from fruit, berries, vegetables and whole meal products has been shown to prevent type 2 diabetes (8,9). In established type 2 diabetes, similar lifestyle interventions have beneficial effects on glycaemic control, blood lipids and blood pressure within the time span of up to four years (10-13). As diet has a prominent impact on blood glucose metabolism and also influences cardiovascular disease risk factors such as blood lipids and blood pressure, a healthy diet is also an integrated part of the treatment
of type 1 diabetes. The Multi Centre Study EURODIAB, found that low intake of saturated fat and high intake of fiber was related to reduced risk of cardiovascular disease among subjects with type 1 diabetes (14,15). With the emphasis given to diet in the treatment and prevention of diabetes it may be expected that people with diabetes have a diet more close to the dietary recommendations than the average population. The dietary recommendations in the Norwegian clinical guidelines of 2009 for the prevention and treatment of diabetes (1) are based upon guidelines from the Diabetes and Nutrition Study Group (DNSG) of the European Association for the Study of Diabetes (EASD) (8) and the American Diabetes Association (ADA) (9), and they are coherent with Norwegian die-tary recommendations for the general population from 2005 (16). The Norwegian dietary recommendations for the general population from 2011 are food-based rather than nutrient-based (17). These recommenda-tions are expressed in quantitative, not only qualitative,
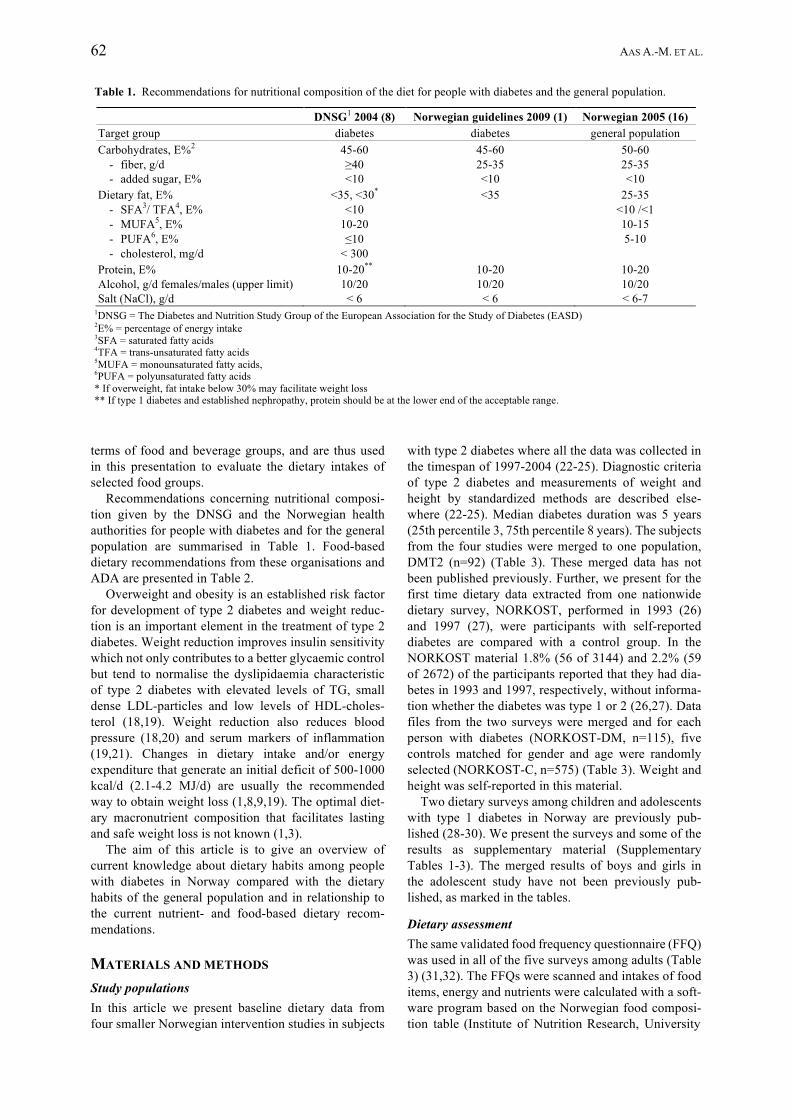
62 AAS A.-M. ET AL.
Table 1. Recommendations for nutritional composition of the diet for people with diabetes and the general population. DNSG1 2004 (8) Norwegian guidelines 2009 (1) Norwegian 2005 (16) Target group diabetes diabetes general population Carbohydrates, E%2 45-60 45-60 50-60
- fiber, g/d ≥40 25-35 25-35 - added sugar, E% <10 <10 <10
Dietary fat, E% <35, <30* <35 25-35 - SFA3/ TFA4, E% <10 <10 /<1 - MUFA5, E% 10-20 10-15 - PUFA6, E% ≤10 5-10 - cholesterol, mg/d < 300
Protein, E% 10-20** 10-20 10-20 Alcohol, g/d females/males (upper limit) 10/20 10/20 10/20 Salt (NaCl), g/d < 6 < 6 < 6-7
1DNSG = The Diabetes and Nutrition Study Group of the European Association for the Study of Diabetes (EASD)
2E% = percentage of energy intake 3SFA = saturated fatty acids 4TFA = trans-unsaturated fatty acids 5MUFA = monounsaturated fatty acids, 6PUFA = polyunsaturated fatty acids * If overweight, fat intake below 30% may facilitate weight loss ** If type 1 diabetes and established nephropathy, protein should be at the lower end of the acceptable range.
terms of food and beverage groups, and are thus used in this presentation to evaluate the dietary intakes of selected food groups. Recommendations concerning nutritional composi-tion given by the DNSG and the Norwegian health authorities for people with diabetes and for the general population are summarised in Table 1. Food-based dietary recommendations from these organisations and ADA are presented in Table 2. Overweight and obesity is an established risk factor for development of type 2 diabetes and weight reduc-tion is an important element in the treatment of type 2 diabetes. Weight reduction improves insulin sensitivity which not only contributes to a better glycaemic control but tend to normalise the dyslipidaemia characteristic of type 2 diabetes with elevated levels of TG, small dense LDL-particles and low levels of HDL-choles-terol (18,19). Weight reduction also reduces blood pressure (18,20) and serum markers of inflammation (19,21). Changes in dietary intake and/or energy expenditure that generate an initial deficit of 500-1000 kcal/d (2.1-4.2 MJ/d) are usually the recommended way to obtain weight loss (1,8,9,19). The optimal diet-ary macronutrient composition that facilitates lasting and safe weight loss is not known (1,3). The aim of this article is to give an overview of current knowledge about dietary habits among people with diabetes in Norway compared with the dietary habits of the general population and in relationship to the current nutrient- and food-based dietary recom-mendations. MATERIALS AND METHODS Study populations In this article we present baseline dietary data from four smaller Norwegian intervention studies in subjects
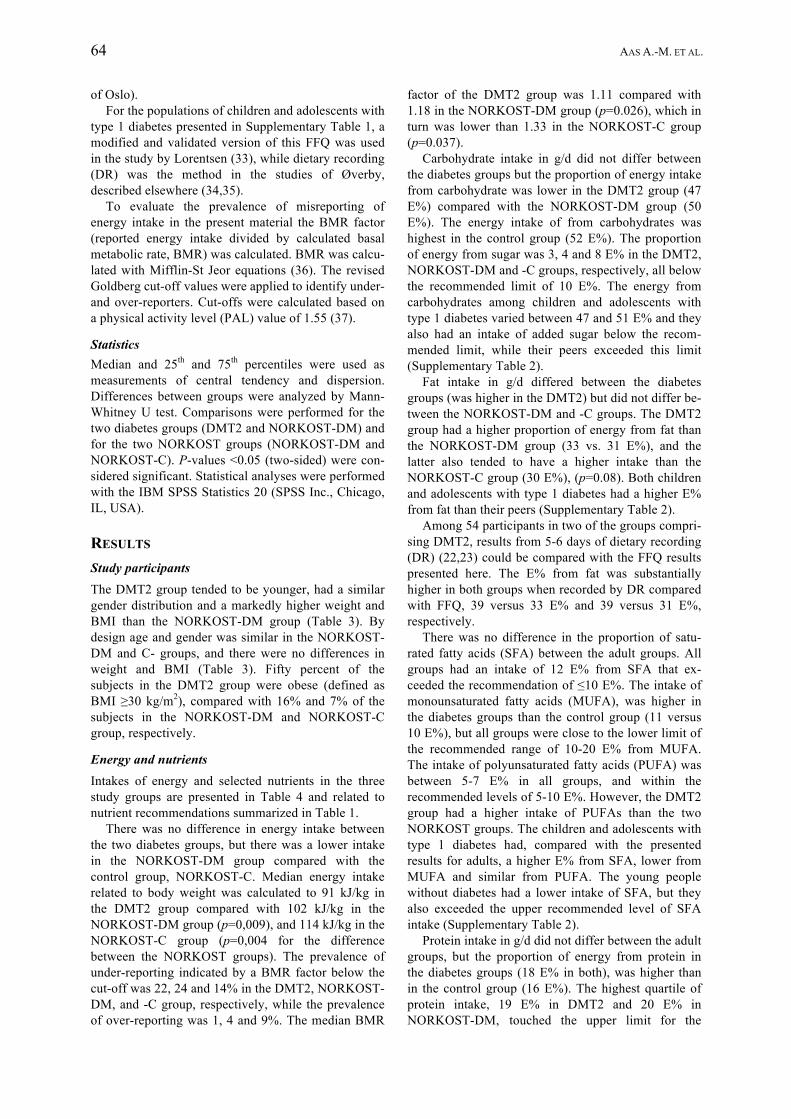
with type 2 diabetes where all the data was collected in the timespan of 1997-2004 (22-25). Diagnostic criteria of type 2 diabetes and measurements of weight and height by standardized methods are described else-where (22-25). Median diabetes duration was 5 years (25th percentile 3, 75th percentile 8 years). The subjects from the four studies were merged to one population, DMT2 (n=92) (Table 3). These merged data has not been published previously. Further, we present for the first time dietary data extracted from one nationwide dietary survey, NORKOST, performed in 1993 (26) and 1997 (27), were participants with self-reported diabetes are compared with a control group. In the NORKOST material 1.8% (56 of 3144) and 2.2% (59 of 2672) of the participants reported that they had dia-betes in 1993 and 1997, respectively, without informa-tion whether the diabetes was type 1 or 2 (26,27). Data files from the two surveys were merged and for each person with diabetes (NORKOST-DM, n=115), five controls matched for gender and age were randomly selected (NORKOST-C, n=575) (Table 3). Weight and height was self-reported in this material. Two dietary surveys among children and adolescents with type 1 diabetes in Norway are previously pub-lished (28-30). We present the surveys and some of the results as supplementary material (Supplementary Tables 1-3). The merged results of boys and girls in the adolescent study have not been previously pub-lished, as marked in the tables. Dietary assessment The same validated food frequency questionnaire (FFQ) was used in all of the five surveys among adults (Table 3) (31,32). The FFQs were scanned and intakes of food items, energy and nutrients were calculated with a soft-ware program based on the Norwegian food composi-tion table (Institute of Nutrition Research, University
DIETARY HABITS AMONG PEOPLE WITH DIABETES 63
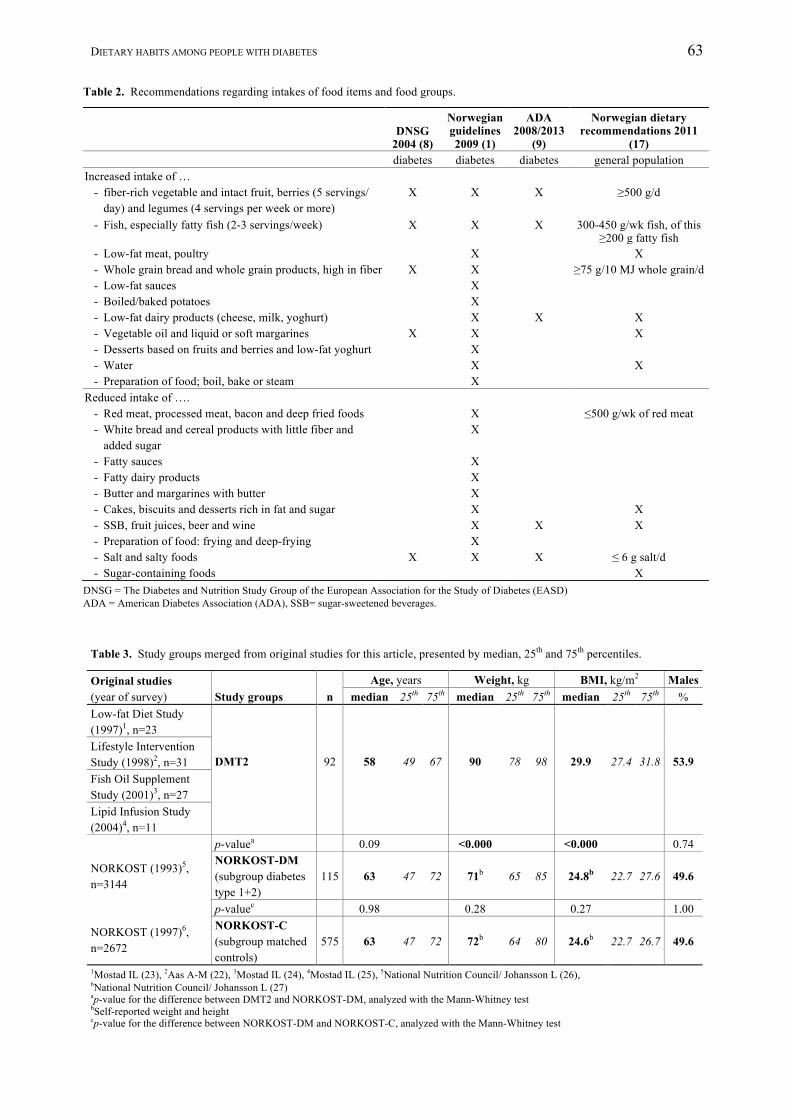
Table 2. Recommendations regarding intakes of food items and food groups.
DNSG
2004 (8)
Norwegian guidelines 2009 (1)
ADA 2008/2013
(9)
Norwegian dietary recommendations 2011
(17) diabetes diabetes diabetes general population Increased intake of …
- fiber-rich vegetable and intact fruit, berries (5 servings/ day) and legumes (4 servings per week or more)
X X X ≥500 g/d
- Fish, especially fatty fish (2-3 servings/week) X X X 300-450 g/wk fish, of this ≥200 g fatty fish
- Low-fat meat, poultry X X - Whole grain bread and whole grain products, high in fiber X X ≥75 g/10 MJ whole grain/d - Low-fat sauces X - Boiled/baked potatoes X - Low-fat dairy products (cheese, milk, yoghurt) X X X - Vegetable oil and liquid or soft margarines X X X - Desserts based on fruits and berries and low-fat yoghurt X - Water X X - Preparation of food; boil, bake or steam X
Reduced intake of …. - Red meat, processed meat, bacon and deep fried foods X ≤500 g/wk of red meat - White bread and cereal products with little fiber and
added sugar X
- Fatty sauces X - Fatty dairy products X - Butter and margarines with butter X - Cakes, biscuits and desserts rich in fat and sugar X X - SSB, fruit juices, beer and wine X X X - Preparation of food: frying and deep-frying X - Salt and salty foods X X X ≤ 6 g salt/d - Sugar-containing foods X
DNSG = The Diabetes and Nutrition Study Group of the European Association for the Study of Diabetes (EASD) ADA = American Diabetes Association (ADA), SSB= sugar-sweetened beverages.
Table 3. Study groups merged from original studies for this article, presented by median, 25th and 75th percentiles. Original studies (year of survey) Study groups
n
Age, years Weight, kg BMI, kg/m2 Males median 25th 75th median 25th 75th median 25th 75th %
Low-fat Diet Study (1997)1, n=23
DMT2
92
58
49
67
90
78
98
29.9
27.4
31.8
53.9 Lifestyle Intervention Study (1998)2, n=31 Fish Oil Supplement Study (2001)3, n=27 Lipid Infusion Study (2004)4, n=11 p-valuea 0.09 <0.000 <0.000 0.74
NORKOST (1993)5, n=3144 NORKOST (1997)6, n=2672
NORKOST-DM (subgroup diabetes type 1+2)
115
63
47 72 71b 65 85
24.8b
22.7 27.6 49.6
p-valuec 0.98 0.28 0.27 1.00 NORKOST-C (subgroup matched controls)
575
63
47 72 72b 64 80
24.6b
22.7 26.7 49.6
1Mostad IL (23), 2Aas A-M (22), 3Mostad IL (24), 4Mostad IL (25), 5National Nutrition Council/ Johansson L (26), 6National Nutrition Council/ Johansson L (27) ap-value for the difference between DMT2 and NORKOST-DM, analyzed with the Mann-Whitney test bSelf-reported weight and height cp-value for the difference between NORKOST-DM and NORKOST-C, analyzed with the Mann-Whitney test
64 AAS A.-M. ET AL.
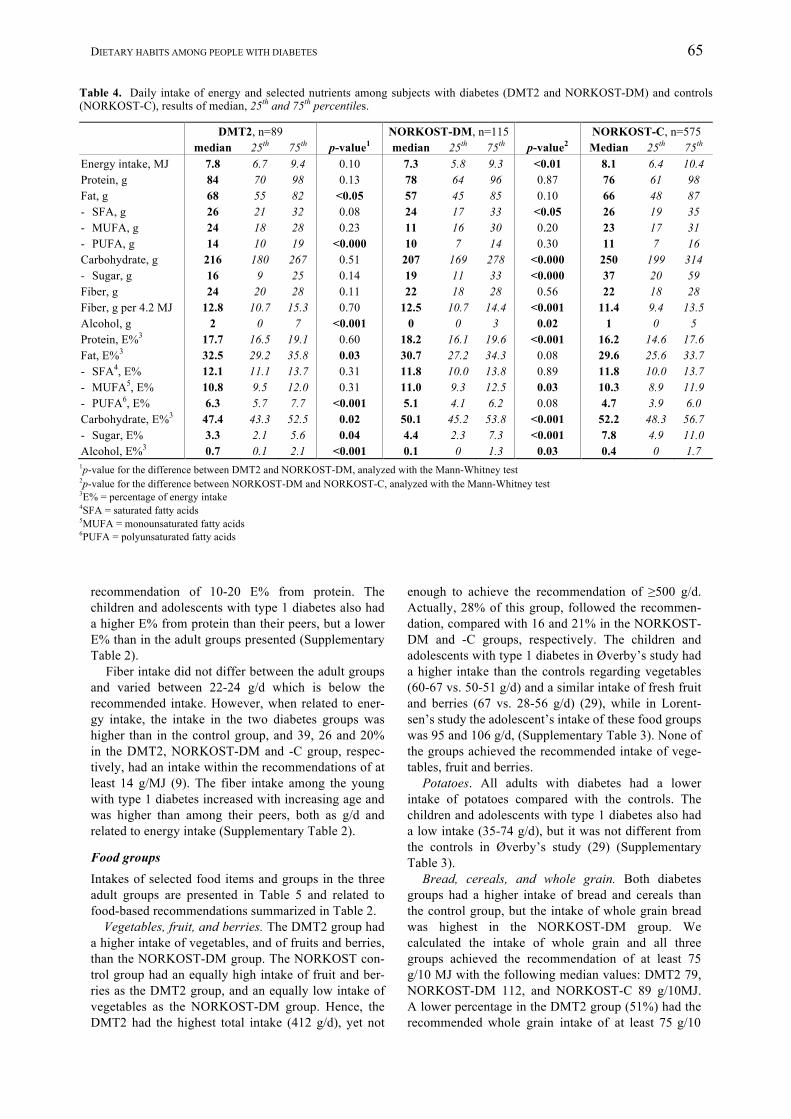
of Oslo). For the populations of children and adolescents with type 1 diabetes presented in Supplementary Table 1, a modified and validated version of this FFQ was used in the study by Lorentsen (33), while dietary recording (DR) was the method in the studies of Øverby, described elsewhere (34,35). To evaluate the prevalence of misreporting of energy intake in the present material the BMR factor (reported energy intake divided by calculated basal metabolic rate, BMR) was calculated. BMR was calcu-lated with Mifflin-St Jeor equations (36). The revised Goldberg cut-off values were applied to identify under- and over-reporters. Cut-offs were calculated based on a physical activity level (PAL) value of 1.55 (37). Statistics Median and 25th and 75th percentiles were used as measurements of central tendency and dispersion. Differences between groups were analyzed by Mann-Whitney U test. Comparisons were performed for the two diabetes groups (DMT2 and NORKOST-DM) and for the two NORKOST groups (NORKOST-DM and NORKOST-C). P-values <0.05 (two-sided) were con-sidered significant. Statistical analyses were performed with the IBM SPSS Statistics 20 (SPSS Inc., Chicago, IL, USA). RESULTS Study participants The DMT2 group tended to be younger, had a similar gender distribution and a markedly higher weight and BMI than the NORKOST-DM group (Table 3). By design age and gender was similar in the NORKOST-DM and C- groups, and there were no differences in weight and BMI (Table 3). Fifty percent of the subjects in the DMT2 group were obese (defined as BMI ≥30 kg/m2), compared with 16% and 7% of the subjects in the NORKOST-DM and NORKOST-C group, respectively. Energy and nutrients Intakes of energy and selected nutrients in the three study groups are presented in Table 4 and related to nutrient recommendations summarized in Table 1. There was no difference in energy intake between the two diabetes groups, but there was a lower intake in the NORKOST-DM group compared with the control group, NORKOST-C. Median energy intake related to body weight was calculated to 91 kJ/kg in the DMT2 group compared with 102 kJ/kg in the NORKOST-DM group (p=0,009), and 114 kJ/kg in the NORKOST-C group (p=0,004 for the difference between the NORKOST groups). The prevalence of under-reporting indicated by a BMR factor below the cut-off was 22, 24 and 14% in the DMT2, NORKOST-DM, and -C group, respectively, while the prevalence of over-reporting was 1, 4 and 9%. The median BMR
factor of the DMT2 group was 1.11 compared with 1.18 in the NORKOST-DM group (p=0.026), which in turn was lower than 1.33 in the NORKOST-C group (p=0.037). Carbohydrate intake in g/d did not differ between the diabetes groups but the proportion of energy intake from carbohydrate was lower in the DMT2 group (47 E%) compared with the NORKOST-DM group (50 E%). The energy intake of from carbohydrates was highest in the control group (52 E%). The proportion of energy from sugar was 3, 4 and 8 E% in the DMT2, NORKOST-DM and -C groups, respectively, all below the recommended limit of 10 E%. The energy from carbohydrates among children and adolescents with type 1 diabetes varied between 47 and 51 E% and they also had an intake of added sugar below the recom-mended limit, while their peers exceeded this limit (Supplementary Table 2). Fat intake in g/d differed between the diabetes groups (was higher in the DMT2) but did not differ be-tween the NORKOST-DM and -C groups. The DMT2 group had a higher proportion of energy from fat than the NORKOST-DM group (33 vs. 31 E%), and the latter also tended to have a higher intake than the NORKOST-C group (30 E%), (p=0.08). Both children and adolescents with type 1 diabetes had a higher E% from fat than their peers (Supplementary Table 2). Among 54 participants in two of the groups compri-sing DMT2, results from 5-6 days of dietary recording (DR) (22,23) could be compared with the FFQ results presented here. The E% from fat was substantially higher in both groups when recorded by DR compared with FFQ, 39 versus 33 E% and 39 versus 31 E%, respectively. There was no difference in the proportion of satu-rated fatty acids (SFA) between the adult groups. All groups had an intake of 12 E% from SFA that ex-ceeded the recommendation of ≤10 E%. The intake of monounsaturated fatty acids (MUFA), was higher in the diabetes groups than the control group (11 versus 10 E%), but all groups were close to the lower limit of the recommended range of 10-20 E% from MUFA. The intake of polyunsaturated fatty acids (PUFA) was between 5-7 E% in all groups, and within the recommended levels of 5-10 E%. However, the DMT2 group had a higher intake of PUFAs than the two NORKOST groups. The children and adolescents with type 1 diabetes had, compared with the presented results for adults, a higher E% from SFA, lower from MUFA and similar from PUFA. The young people without diabetes had a lower intake of SFA, but they also exceeded the upper recommended level of SFA intake (Supplementary Table 2). Protein intake in g/d did not differ between the adult groups, but the proportion of energy from protein in the diabetes groups (18 E% in both), was higher than in the control group (16 E%). The highest quartile of protein intake, 19 E% in DMT2 and 20 E% in NORKOST-DM, touched the upper limit for the
DIETARY HABITS AMONG PEOPLE WITH DIABETES 65
Table 4. Daily intake of energy and selected nutrients among subjects with diabetes (DMT2 and NORKOST-DM) and controls (NORKOST-C), results of median, 25th and 75th percentiles. DMT2, n=89 NORKOST-DM, n=115 NORKOST-C, n=575 median 25th 75th p-value1 median 25th 75th p-value2 Median 25th 75th Energy intake, MJ 7.8 6.7 9.4 0.10 7.3 5.8 9.3 <0.01 8.1 6.4 10.4 Protein, g 84 70 98 0.13 78 64 96 0.87 76 61 98 Fat, g 68 55 82 <0.05 57 45 85 0.10 66 48 87 - SFA, g 26 21 32 0.08 24 17 33 <0.05 26 19 35 - MUFA, g 24 18 28 0.23 11 16 30 0.20 23 17 31 - PUFA, g 14 10 19 <0.000 10 7 14 0.30 11 7 16 Carbohydrate, g 216 180 267 0.51 207 169 278 <0.000 250 199 314 - Sugar, g 16 9 25 0.14 19 11 33 <0.000 37 20 59 Fiber, g 24 20 28 0.11 22 18 28 0.56 22 18 28 Fiber, g per 4.2 MJ 12.8 10.7 15.3 0.70 12.5 10.7 14.4 <0.001 11.4 9.4 13.5 Alcohol, g 2 0 7 <0.001 0 0 3 0.02 1 0 5 Protein, E%3 17.7 16.5 19.1 0.60 18.2 16.1 19.6 <0.001 16.2 14.6 17.6 Fat, E%3 32.5 29.2 35.8 0.03 30.7 27.2 34.3 0.08 29.6 25.6 33.7 - SFA4, E% 12.1 11.1 13.7 0.31 11.8 10.0 13.8 0.89 11.8 10.0 13.7 - MUFA5, E% 10.8 9.5 12.0 0.31 11.0 9.3 12.5 0.03 10.3 8.9 11.9 - PUFA6, E% 6.3 5.7 7.7 <0.001 5.1 4.1 6.2 0.08 4.7 3.9 6.0 Carbohydrate, E%3 47.4 43.3 52.5 0.02 50.1 45.2 53.8 <0.001 52.2 48.3 56.7 - Sugar, E% 3.3 2.1 5.6 0.04 4.4 2.3 7.3 <0.001 7.8 4.9 11.0 Alcohol, E%3 0.7 0.1 2.1 <0.001 0.1 0 1.3 0.03 0.4 0 1.7 1p-value for the difference between DMT2 and NORKOST-DM, analyzed with the Mann-Whitney test 2p-value for the difference between NORKOST-DM and NORKOST-C, analyzed with the Mann-Whitney test 3E% = percentage of energy intake 4SFA = saturated fatty acids 5MUFA = monounsaturated fatty acids 6PUFA = polyunsaturated fatty acids
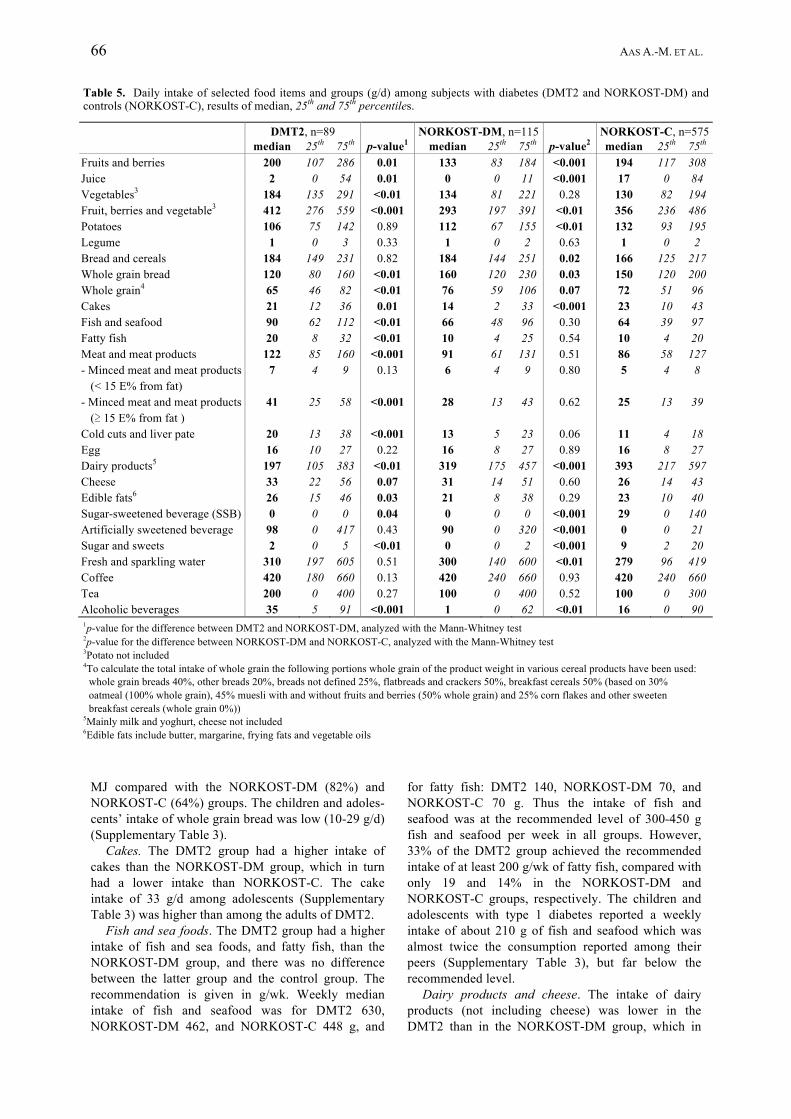
recommendation of 10-20 E% from protein. The children and adolescents with type 1 diabetes also had a higher E% from protein than their peers, but a lower E% than in the adult groups presented (Supplementary Table 2). Fiber intake did not differ between the adult groups and varied between 22-24 g/d which is below the recommended intake. However, when related to ener-gy intake, the intake in the two diabetes groups was higher than in the control group, and 39, 26 and 20% in the DMT2, NORKOST-DM and -C group, respec-tively, had an intake within the recommendations of at least 14 g/MJ (9). The fiber intake among the young with type 1 diabetes increased with increasing age and was higher than among their peers, both as g/d and related to energy intake (Supplementary Table 2). Food groups Intakes of selected food items and groups in the three adult groups are presented in Table 5 and related to food-based recommendations summarized in Table 2. Vegetables, fruit, and berries. The DMT2 group had a higher intake of vegetables, and of fruits and berries, than the NORKOST-DM group. The NORKOST con-trol group had an equally high intake of fruit and ber-ries as the DMT2 group, and an equally low intake of vegetables as the NORKOST-DM group. Hence, the DMT2 had the highest total intake (412 g/d), yet not
enough to achieve the recommendation of ≥500 g/d. Actually, 28% of this group, followed the recommen-dation, compared with 16 and 21% in the NORKOST-DM and -C groups, respectively. The children and adolescents with type 1 diabetes in Øverby’s study had a higher intake than the controls regarding vegetables (60-67 vs. 50-51 g/d) and a similar intake of fresh fruit and berries (67 vs. 28-56 g/d) (29), while in Lorent-sen’s study the adolescent’s intake of these food groups was 95 and 106 g/d, (Supplementary Table 3). None of the groups achieved the recommended intake of vege-tables, fruit and berries. Potatoes. All adults with diabetes had a lower intake of potatoes compared with the controls. The children and adolescents with type 1 diabetes also had a low intake (35-74 g/d), but it was not different from the controls in Øverby’s study (29) (Supplementary Table 3). Bread, cereals, and whole grain. Both diabetes groups had a higher intake of bread and cereals than the control group, but the intake of whole grain bread was highest in the NORKOST-DM group. We calculated the intake of whole grain and all three groups achieved the recommendation of at least 75 g/10 MJ with the following median values: DMT2 79, NORKOST-DM 112, and NORKOST-C 89 g/10MJ. A lower percentage in the DMT2 group (51%) had the recommended whole grain intake of at least 75 g/10
66 AAS A.-M. ET AL.
Table 5. Daily intake of selected food items and groups (g/d) among subjects with diabetes (DMT2 and NORKOST-DM) and controls (NORKOST-C), results of median, 25th and 75th percentiles. DMT2, n=89 NORKOST-DM, n=115 NORKOST-C, n=575 median 25th 75th p-value1 median 25th 75th p-value2 median 25th 75th Fruits and berries 200 107 286 0.01 133 83 184 <0.001 194 117 308 Juice 2 0 54 0.01 0 0 11 <0.001 17 0 84 Vegetables3 184 135 291 <0.01 134 81 221 0.28 130 82 194 Fruit, berries and vegetable3 412 276 559 <0.001 293 197 391 <0.01 356 236 486 Potatoes 106 75 142 0.89 112 67 155 <0.01 132 93 195 Legume 1 0 3 0.33 1 0 2 0.63 1 0 2 Bread and cereals 184 149 231 0.82 184 144 251 0.02 166 125 217 Whole grain bread 120 80 160 <0.01 160 120 230 0.03 150 120 200 Whole grain4 65 46 82 <0.01 76 59 106 0.07 72 51 96 Cakes 21 12 36 0.01 14 2 33 <0.001 23 10 43 Fish and seafood 90 62 112 <0.01 66 48 96 0.30 64 39 97 Fatty fish 20 8 32 <0.01 10 4 25 0.54 10 4 20 Meat and meat products 122 85 160 <0.001 91 61 131 0.51 86 58 127 - Minced meat and meat products
(< 15 E% from fat) 7 4 9 0.13 6 4 9 0.80 5 4 8
- Minced meat and meat products (≥ 15 E% from fat )
41 25 58 <0.001 28 13 43 0.62 25 13 39
Cold cuts and liver pate 20 13 38 <0.001 13 5 23 0.06 11 4 18 Egg 16 10 27 0.22 16 8 27 0.89 16 8 27 Dairy products5 197 105 383 <0.01 319 175 457 <0.001 393 217 597 Cheese 33 22 56 0.07 31 14 51 0.60 26 14 43 Edible fats6 26 15 46 0.03 21 8 38 0.29 23 10 40 Sugar-sweetened beverage (SSB) 0 0 0 0.04 0 0 0 <0.001 29 0 140 Artificially sweetened beverage 98 0 417 0.43 90 0 320 <0.001 0 0 21 Sugar and sweets 2 0 5 <0.01 0 0 2 <0.001 9 2 20 Fresh and sparkling water 310 197 605 0.51 300 140 600 <0.01 279 96 419 Coffee 420 180 660 0.13 420 240 660 0.93 420 240 660 Tea 200 0 400 0.27 100 0 400 0.52 100 0 300 Alcoholic beverages 35 5 91 <0.001 1 0 62 <0.01 16 0 90 1p-value for the difference between DMT2 and NORKOST-DM, analyzed with the Mann-Whitney test 2p-value for the difference between NORKOST-DM and NORKOST-C, analyzed with the Mann-Whitney test 3Potato not included 4To calculate the total intake of whole grain the following portions whole grain of the product weight in various cereal products have been used:
whole grain breads 40%, other breads 20%, breads not defined 25%, flatbreads and crackers 50%, breakfast cereals 50% (based on 30% oatmeal (100% whole grain), 45% muesli with and without fruits and berries (50% whole grain) and 25% corn flakes and other sweeten breakfast cereals (whole grain 0%))
5Mainly milk and yoghurt, cheese not included 6Edible fats include butter, margarine, frying fats and vegetable oils
MJ compared with the NORKOST-DM (82%) and NORKOST-C (64%) groups. The children and adoles-cents’ intake of whole grain bread was low (10-29 g/d) (Supplementary Table 3). Cakes. The DMT2 group had a higher intake of cakes than the NORKOST-DM group, which in turn had a lower intake than NORKOST-C. The cake intake of 33 g/d among adolescents (Supplementary Table 3) was higher than among the adults of DMT2. Fish and sea foods. The DMT2 group had a higher intake of fish and sea foods, and fatty fish, than the NORKOST-DM group, and there was no difference between the latter group and the control group. The recommendation is given in g/wk. Weekly median intake of fish and seafood was for DMT2 630, NORKOST-DM 462, and NORKOST-C 448 g, and
for fatty fish: DMT2 140, NORKOST-DM 70, and NORKOST-C 70 g. Thus the intake of fish and seafood was at the recommended level of 300-450 g fish and seafood per week in all groups. However, 33% of the DMT2 group achieved the recommended intake of at least 200 g/wk of fatty fish, compared with only 19 and 14% in the NORKOST-DM and NORKOST-C groups, respectively. The children and adolescents with type 1 diabetes reported a weekly intake of about 210 g of fish and seafood which was almost twice the consumption reported among their peers (Supplementary Table 3), but far below the recommended level. Dairy products and cheese. The intake of dairy products (not including cheese) was lower in the DMT2 than in the NORKOST-DM group, which in
DIETARY HABITS AMONG PEOPLE WITH DIABETES 67
turn did not differ from the control group. The young with type 1 diabetes in Øverby’s study reported similar intakes of milk as their peers, about 1.8 dl/d (29). The intake of all milk and yoghurt in Lorentsen’s study was about 2.5 dl/d (Supplementary Table 3). We lack information about the choices regarding fat content of milk and yoghurt among the adults, but the children and adolescents reported that they almost exclusively used semi-skimmed milk (1-1.5% fat) (Supplementary Table 3). Regarding cheese, the intake was similar in all groups, including the adolescents (Supplementary Table 3), although the DMT2 group tended to have a higher intake than the NORKOST-D group. Meat and meat products. Weekly median intake of meat and meat products was 854, 637 and 602 g in the DMT2, NORKOST-DM and NORKOST-C groups, respectively. Norwegian health authorities recommend red meat and processed meat to be limited to 500 grams per week. Our dietary surveys did not distinguish between red and white meat. According to sales statistics, approximately 80% of the Norwegian meat consumption is red (pig, cattle, sheep, goat) and 20% poultry (17,38). Given a similar distribution we can suggest the intake of red and processed meat to be about 680 g/wk in the DMT2 group which had the highest intake. Regarding contribution of fat from meat products, the intake of minced meat with a high fat content (≥ 15 g/100 g), cold cuts, and liver pate was particularly high in the DMT2 group compared with both NORKOST groups. Further, the intake of low-fat minced meat was marginal and similar in all adult groups. The children and adolescents with type 1 dia-betes reported an increasing intake of meat and meat products with increasing age, and a markedly higher intake than their peers (Supplementary Table 3). Edible fats. The intake of edible fats including but-ter, margarine, frying fat and vegetable oils was higher in DMT2 than both NORKOST groups. The adoles-cent’s intake of 33 g/d was higher than the DMT2 group (Supplementary Table 3). Sugar and sweets. A negligible intake of sugar and sweets was characteristic of adults with diabetes com-pared to controls. In Øverby’s study the intake of sugar and sweets was 20-22 g/day among children and adol-escents with type 1 diabetes vs. 32-38 g/d among the controls, while the adolescents in Lorentsen’s study reported an intake of 24 g/d (Supplementary Table 3). Water and other beverages. Both adult diabetes groups had a higher intake of fresh and sparkling water and artificially sweetened beverages compared with the controls. The intake of fruit juice and sugar-sweetened beverages (SSB) was marginal among the subjects with diabetes. Children and adolescents with type 1 diabetes also reported a very low intake of fruit juice and SSB compared with their peers, and they had an intake of artificially sweetened soft drinks ranging between 1.3-3.6 dl/d, in the different groups (Supple-mentary Table 3). Alcohol. The median intake of alcoholic beverages
was highest in the DMT2 group, while the NORKOST-DM group had a lower intake than the controls. However, the recommended upper limit of alcohol intake in g/d of 10 to 20 g for women and men, respectively, was far from exceeded (Table 4), even in the DMT2 group. Among women in the DMT2 group, there was only 2% that exceeded 10 g/d, compared with 5% and 6% in NORKOST-D and NORKOST-C. More men than women had an intake above the upper recommended intake: 15% in DMT2, 12% in NORKOST-D and 8% in the NORKOST-C groups. The median intake of alcoholic beverages (mainly beer) was zero among the adolescents in Lorentsen’s study. However, the 75th percentile result of 120 g/d was higher than the corresponding results of any adult group (Supplementary Table 3) DISCUSSION The results presented for the first time in this article add new knowledge about dietary habits among adults with diabetes in Norway. We have also summarized previously published data about dietary habits among children and adolescents with diabetes in Norway for comparison. Both adults and young subjects with diabetes had a lower intake of carbohydrates than the controls without diabetes, and this was reflected in a lower intake of added sugar, sweets, potatoes, sugar-sweetened beverages, and fruit juices. Despite a lower intake of carbohydrates, subjects with diabetes had an intake of fiber at the same level or higher than controls, caused by a higher intake of whole grain bread and/or vegetables. Further they reported a higher proportion of energy intake from protein and fat than controls. The higher intake of meat, meat products, fish, and fish products probably contributed to the hig-her intake of protein in the diabetes populations, while the increased intake of fat could be a result of a higher intake of edible fats, and high-fat meat and meat pro-ducts, at least in some of the diabetes groups studied. The data confirms trends of energy distribution among carbohydrate, protein and fat seen in several international dietary surveys investigating dietary habits among people with diabetes (39-44), but add some new information regarding the underlying factors within separate food groups contributing to this result, at least in Norway. Intake of energy and nutrients compared with the recommendations The dietary recommendations do not include specific levels for total energy intake, except for suggesting a reduction to be able to lose weight for people with overweight/obesity. The lower energy intake in NORKOST-DM compared with their controls was stri-king taking into account that the groups had a similar BMI, age, and gender distribution. The reported low energy intakes may have been caused by efforts to lose weight or to maintain weight reduction, but it may also
68 AAS A.-M. ET AL.
be caused by under-reporting of intake supported by our finding regarding this matter. This may also be the case for the DMT2 group, which had the lowest energy intake of all groups when the energy intake was related to body weight. The lower proportion of energy intake from carbo-hydrate in the patient groups was due to a low intake of sugar and sugar-containing food. This is relevant for people with diabetes in particular, as a low intake of sugar prevents blood glucose excursions and recent updated reviews of evidence (45) supports that it also reduces the risk of weight gain. The intake of carbohydrate-rich foods with beneficial health effects (fruits, berries, vegetables, and whole grain products) was also relatively high compared with the controls. Even though the intake of fiber did not reach recom-mended levels in any of the diabetes groups, patients with diabetes seem to have a higher intake of fiber than the controls. Sufficient intake of fiber is important as reviews of evidence conclude that increased intake of fiber reduces the risk of cardiovascular disease (CVD), colorectal and breast cancer (46) in addition to type 2 diabetes (9). High fiber diets may also improve glycaemic control and reduce number of hypoglycae-mic events (8). The proportion of energy intake from fat in the DMT2 group, where most of the subjects were over-weight, exceeded the recommended limit of 30 E% for overweight and obese people with diabetes (8). Also the subjects with diabetes in NORKOST, where most were normal weight, had a median intake above 30 E% and they tended to have a higher E% from fat than their controls, although the difference did not reach significance. However, the FFQ may have underesti-mated the intake of fat as fat intake was higher when measured by dietary records in some groups (22,23). This is also supported by earlier validation studies (32). The samples with type 1 diabetes also tended to have an intake of fat in the upper end of the recom-mended range (28,29), even in the study that used dietary recording for obtaining dietary data (29). In the long-term a high intake of fat may contribute to an in-creased risk of obesity and insulin resistance (8). Re-garding the risk of CVD, the high intake of saturated fatty acids is of particular concern considering the increased risk of cardiovascular disease in diabetes. All groups, adults and young, with or without diabetes, had intakes of saturated fatty acids that exceeded the recommended levels, while the intakes of MUFA and PUFA were low or moderate compared with the re-commendations. The fatty acid pattern of the diet is important as it affects both blood lipid levels and the risk of CVD. There is convincing evidence that re-placing SFA with unsaturated fatty acids decreases the risk of CVD (8,47,48). Our data clearly shows a need for exchanging saturated for unsaturated fat in the diet of both adults and young people with diabetes. The proportion of energy intake from protein was within the recommended level, although within the up-
per range. Taking into account the recent media debate in the Norwegian tabloids, strongly promoting a high protein intake for weight reduction, we would like to highlight the recently published data that indicate that a high protein intake may have disadvantageous health effects, especially in people with diabetes. A five year follow-up of more than 370 000 subjects from 10 Eu-ropean countries (the PANACEA project of the EPIC cohort) showed that a higher proportion of energy from protein at the expense of carbohydrates and fat was po-sitively associated with weight gain (49), especially if the carbohydrate sources were rich in fiber. All associ-ations were slightly stronger in participants being overweight, ≥60 years old and/or underreporting their energy intake (49), descriptions that are similar to our adult participants. Further, in the Malmö Diet and Can-cer cohort high intake of protein was associated with increased incidence of type 2 diabetes (50). Another study found that in patients with increased cardiovas-cular risk, a low intake of carbohydrates with corre-spondingly high intakes of protein and fat was associ-ated with poorer small artery vascular reactivity (51). The DNSG and the ADA also recommend a reduc-tion in protein intake in individuals with diabetes and early chronic kidney disease to improve renal function (3,8). This gives another argument for moderate pro-tein consumption in subjects with diabetes. Intake of selected food groups compared with the recommendations None of the groups studied had intakes of vegetables, fruit and berries at recommended levels (at least 500 g/d), but 28% of the participants in the DMT2 group reached the recommended level. People with diabetes had a higher intake of vegetables than controls, and al-though the young subjects had an intake of vegetables, fruits, and berries that was just half of what was repor-ted in the adult populations, they still had a higher intake than their peers. There is convincing evidence that a diet rich in vegetables, fruits and berries reduces the risk for CVD and probable evidence that such diets has beneficial effects on several risk factors for disease, including obesity and the metabolic syndrome (17). Therefore this is an important dietary goal for people with diabetes in particular. Bread and cereals were, together with vegetables, important contributors to the intake of fiber. The high intake of bread and cereal also explains that all adult groups had a median intake of whole grain above the recommendation. The intake of whole grain is of par-ticular interest as there is probable evidence for a protective effect of whole grain in the relation to CVD (17,52). People with diabetes may reduce or avoid carbo-hydrate rich foods to obtain better glycaemic control. In our study this was evident for sugar and sugar con-taining foods and beverages, fruit juices, and among adults also potatoes and milk. The blood sugar-increasing ability of these foods is easier to adjust for
DIETARY HABITS AMONG PEOPLE WITH DIABETES 69
by multiple insulin injection, which is the most com-mon means of treating type 1 diabetes, than other treat-ment modalities most often used in type 2 diabetes. This may explain some of our findings where the young with type 1 diabetes has a higher intake than the adults with predominantly type 2 diabetes (as is the case for milk, sweets and cakes). Still, the intakes of most of these foods are lower in children and adoles-cents with diabetes than their peers. Our results also show that people with diabetes (adults and young) seem to choose the carbohydrate-rich foods that are nutrient-dense and rich in fiber, and are thus more in line with the recommendations than the controls. As recommen-ded the adults with diabetes also preferred water as thirst quencher in a greater extent than controls. The quantitative recommendation for fish intake is mainly based on fish’ and especially fatty fish’ effect on CVD (17). The high intake of fish and seafood among the adults with diabetes in particular, is gratify-ing, even though only a small proportion reached the recommended level for fatty fish. The youngest sub-jects with type 1 diabetes reported an intake of fish and seafood that was twice the amount reported by their peers. Still they did not achieve the weekly recommen-dation. In order to reduce the intake of saturated fatty acids, a reduction of full-fat dairy and meat products is re-commended. Unfortunately, we lack comparable quali-tative information regarding the fat content of dairy products in the adult studies, but the intake of cheese tended to be higher in the DMT2 than the NORKOST-DM group, which in turn had a similar intake as the NORKOST-C group. The finding may partly explain the higher total fat intake of the DMT2 group. The preference for semi-skimmed milk in the young popu-lation is in line with the recommendation about choosing low-fat dairy products although there are types of milk with an even lower fat content. More-over, dairy products and cheese provided about half of total intake of saturated fat among children with dia-betes in Øverby’s study (29). The total intake of meat and meat products was high in all diabetes groups, in particular the DMT2 group. High intakes of processed meat and red meat are re-ported not only to increase the risk of developing type 2 diabetes (50,53), but also CVD and cancer (53,54). Recently, mortality due to CVD, but also to cancer, was reported to be associated with the consumption of processed meat in a European prospective study com-prising about 450 000 men and women (55). A similar finding but applied to red meat intake and total morta-lity in about 135 000 Chinese people, was reported for men only and related to a weekly intake of 380 g (56). However, in another study including over 17 500 adults, the authors found no consistent association between the consumption of red or processed meat or white meat and all-cause or cause-specific mortality (57). Although we must interpret these results with caution, we are concerned about the high intake of meat and
meat products reported among people with diabetes in our study groups. Up to now there has been little focus on meat consumption in the dietary recommendation for diabetes, as long as the intake is predominantly lean meat. With the new evidence emerging concer-ning disadvantageous health effects of high meat con-sumption, this must also be incorporated in the dietary guidelines for people with diabetes, as it is for the ge-neral population (17). In addition the intake of high-fat meat products was higher in the DMT2 group compared with the NORKOST-DM and -C groups. The young subjects with type 1 diabetes also preferred the high-fat variants. This contributed to an even higher intake of SFA than what was seen in the adults, as reported in Øverby’s study where 22% of the total SFA intake came from meat and meat products (29). This is worrying because of the well-reasoned advice to avoid products high in SFA to prevent CVD (8,17). All groups reported a relatively low intake of alcohol and for most subjects the intake was substantially lower than the recommended limit of 10 g (women) or 20 g (men) alcohol per day. Alcohol consumption is notoriously difficult to quantify and these results may reflect under-reporting. In conjunction with diabetes drinking alcohol increases the risk of hypoglycaemia and this may also explain the overall low intakes among people with diabetes. A moderate alcohol con-sumptions (in line with the recommendations) have been associated with several health benefits, among them a protective effect on CHD and DMT2 (17,58). However, the many negative effects of heavy alcohol consumption explain why recommendations concern-ing alcohol consumption are made with caution. The strength of our study is that we have used the same FFQ that gives comparable data in a relatively large group of adults with diabetes. The groups are al-so comparable because the gender distribution did not differ, taking into account possible gender differences in dietary intakes. There is little published knowledge about the dietary habits among this group of patients and the results from this study may identify which dietary recommendations need to be emphasized to prevent cardiovascular and other disease risks. Under-reporting is a well-known problem with all dietary survey methods, and especially selectively under-reporting of foods that are conceived to be un-healthy (32,59,60). This is a limitation in our study as calculations indicate that many of the participants re-ported an energy intake which was not compatible with sustained weight and body function. On the other hand overweight patients with diabetes are recommen-ded to lose weight, and a low energy intake may reflect this. The equation used to estimate energy requirements (BMR) may also overestimate requirements in over-weight subjects as it is based on the body composition of normal-weight people. However, we have used the equation which is the most reliable equation for pre-dicting BMR in obese individuals (36). Adequacy ex-pressed in terms of energy density (e.g. E% from fat)
70 AAS A.-M. ET AL.
would not be biased, but there could be some degree of underestimation of inadequacy due to bias related to social desirability such that reported intake could be “healthier” than the actual intake. The data presented in this article is collected 10-15 years ago and dietary habits may have changed in this population as has been observed in the general population (38,61). If the trend observed in the general population towards a higher intake of protein and fat, including saturated fat, is adopted by people with diabetes, this may exacer-bate the dietary challenges pinpointed in this study. However, there is also an increased intake of fruit, ve-getables and whole grain in the population that would improve the quality of the diet. Finally, the DMT2 population may not be representative for people with type 2 diabetes as they were all volunteers to dietary intervention studies and obviously we lack a proper control group for this population. In the NORKOST survey type of diabetes was not specified and weight and height were self-reported which means that it may be biased. CONCLUSION Do Norwegians with diabetes have a healthier diet than the general population? Compared with the recommen-
dations, people with diabetes had a low intake of carbo-hydrates and a high intake of protein and fat, so they were not healthier than the controls in this respect. On the other side, this was compensated by the more healthy choices than the controls regarding intake of vegetables, fruits and berries, fish, fiber and whole grain, and a low intake of sugary foods and beverages. In this respect, the people with diabetes were closer to the recommended intakes than the controls, although they did not meet the recommendations in full. Based on our results we would suggest an increa-sed emphasis in the dietary guidance to people with diabetes on practical ways to increase the intake of fruits, berries and vegetables, whole grain, and fatty fish, but reduce the intake of red meat. Further, it is still important to stress the advantage of replacing saturated with unsaturated fat by choosing edible fats like oils and soft margarines and low-fat variants of dairy products, cheese and meat products. The low in-take of sugary foods and beverages and alcohol should be appreciated, but people with overweight may still benefit form reducing the intake of cakes and edible fats. In the individual setting guidance should be offered on how to best balance the glucose-increasing effect of some healthy foods with physical activity, insulin or oral anti hypoglycaemic agents.
REFERENCES 1. Helsedirektoratet. Diabetes – Forebygging, diagnostikk og behandling. Nasjonale kliniske retningslinjer, 15-
1674. 2009. Oslo, Helsedirektoratet. 2. Ryden L, Standl E, Bartnik M, et al. Guidelines on diabetes, pre-diabetes, and cardiovascular diseases:
executive summary. The Task Force on Diabetes and Cardiovascular Diseases of the European Society of Cardiology (ESC) and of the European Association for the Study of Diabetes (EASD). Eur Heart J 2007; 28 (1): 88-136.
3. American Diabetes Association. Standards of Medical Care in Diabetes 2013. Diabetes Care 2013; 36 (Suppl 1): S11-S66.
4. Knowler WC, Barrett-Connor E, Fowler SE, et al. Reduction in the incidence of type 2 diabetes with lifestyle intervention or metformin. N Engl J Med 2002; 346 (6): 393-403.
5. Pan XR, Li GW, Hu YH, et al. Effects of diet and exercise in preventing NIDDM in people with impaired glucose tolerance. The Da Qing IGT and Diabetes Study. Diabetes Care 1997; 20 (4): 537-44.
6. Tuomilehto J, et al. Prevention of type 2 diabetes mellitus by changes in lifestyle among subjects with impaired glucose tolerance. N Engl J Med 2001; 344: 1343-50.
7. Lindstrom JF, Peltonen MF, Eriksson JG, et al. Improved lifestyle and decreased diabetes risk over 13 years: long-term follow-up of the randomised Finnish Diabetes Prevention Study (DPS). Diabetologia 2013; 56 (2): 284-93.
8. Mann JI, De Leeuw I, Hermansen K, et al. Evidence-based nutritional approaches to the treatment and pre-vention of diabetes mellitus. Nutr Metab Cardiovasc Dis 2004; 14 (6): 373-94.
9. American Diabetes Association. Nutrition Recommendations and Interventions for Diabetes: A position statement of the American Diabetes Association. Diabetes Care 2008; 31 (Suppl 1): S61-S78.
10. Agurs-Collins TD, Kumanyika SK, Ten Have TR, et al. A randomized controlled trial of weight reduction and exercise for diabetes management in older African-American subjects. Diabetes Care 1997; 20 (10): 1503-11.
11. The Look AHEAD Research Group. Reduction in Weight and Cardiovascular Disease Risk Factors in Indi-viduals With Type 2 Diabetes: One-year results of the Look AHEAD trial. Diabetes Care 2007; 30 (6): 1374-83.
12. The Look AHEAD Research Group. Long-term Effects of a Lifestyle Intervention on Weight and Cardio-vascular Risk Factors in Individuals With Type 2 Diabetes Mellitus: Four-Year Results of the Look AHEAD Trial. Arch Intern Med 2010; 170 (17): 1566-75.
DIETARY HABITS AMONG PEOPLE WITH DIABETES 71
13. Wolf AM, Conaway MR, Crowther JQ, et al. Translating lifestyle intervention to practice in obese patients with type 2 diabetes: Improving Control with Activity and Nutrition (ICAN) study. Diabetes Care 2004; 27 (7): 1570-6.
14. Toeller MF, Buyken AE, Heitkamp GF, et al. Fiber intake, serum cholesterol levels, and cardiovascular dis-ease in European individuals with type 1 diabetes. EURODIAB IDDM Complications Study Group. Diabetes Care 1999; 22 (Suppl 2): B21-B28.
15. Toeller MF, Buyken AE, Heitkamp GF, et al. Associations of fat and cholesterol intake with serum lipid levels and cardiovascular disease: the EURODIAB IDDM Complications Study. Exp Clin Endocrinol Diabetes 1999; 107: 512-21.
16. Helsedirektoratet. Norske anbefalinger for ernæring og fysisk aktivitet. IS-1219. 2005. 17. Helsedirektoratet. Kostråd for å fremme folkehelsen og forebygge kroniske sykdommer. IS 1881. 2011. 18. Anderson JW, Kendall CWC, Jenkins DJA. Importance of weight management in type 2 diabetes: review
with meta-analysis of clinical studies. J Am Coll Nutr 2003; 22 (5): 331-9. 19. Klein S, Sheard NF, Pi-Sunyer X, et al. Weight management through lifestyle modification for the prevention
and management of type 2 diabetes: rationale and strategies. A statement of the American Diabetes Association, the North American Association for the Study of Obesity, and the American Society for Clinical Nutrition. Am J Clin Nutr 2004; 80 (2): 257-63.
20. Neter JE, Stam BE, Kok FJ, et al. Influence of weight reduction on blood pressure: a meta-analysis of rando-mized controlled trials. Hypertension 2003; 42 (5): 878-84.
21. Van Gaal LF, Mertens IL, De Block CE. Mechanisms linking obesity with cardiovascular disease. Nature 2006; 444 (7121): 875-80.
22. Aas AM, Bergstad I, Thorsby PM, et al. An intensified lifestyle intervention programme may be superior to insulin treatment in poorly controlled Type 2 diabetic patients on oral hypoglycaemic agents: results of a feasibility study. Diabet Med 2005; 22 (3): 316-22.
23. Mostad IL, Qvigstad E, Bjerve KS, et al. Effects of a 3-day low-fat diet on metabolic control, insulin sensitivity, lipids and adipocyte hormones in Norwegian subjects with hypertriacylglycerolaemia and type 2 diabetes. Scand J Clin Lab Invest 2004; 64 (6): 565-74.
24. Mostad IL, Bjerve KS, Bjorgaas MR, et al. Effects of n-3 fatty acids in subjects with type 2 diabetes: reduc-tion of insulin sensitivity and time-dependent alteration from carbohydrate to fat oxidation. Am J Clin Nutr 2006; 84 (3): 540-50.
25. Mostad IL, Bjerve KS, Basu S, et al. Addition of n-3 fatty acids to a 4-hour lipid infusion does not affect insulin sensitivity, insulin secretion, or markers of oxidative stress in subjects with type 2 diabetes mellitus. Metabolism 2009; 58 (12): 1753-61.
26. National Nutrition Council. Norkost 1993-94. Nation-wide dietary survey among men and women aged 16-79 years. 1997. Oslo, Norway.
27. National Nutrition Council. Norkost 1997. Nation-wide dietary survey among men and women aged 16-79 years. 1999. Oslo, Norway.
28. Lorentsen N, Bergstad I. Diet, self-management and metabolic control in Norwegian teenagers with type 1 dependent diabetes. Scand J Nutr 2005; 49 (1): 27-37.
29. Øverby NC, Flaaten V, Veierød MB, et al. Children and adolescents with type 1 diabetes eat a more atherosclerosis-prone diet than healthy control subjects. Diabetologia 2007 50 (2): 307-16.
30. Lorentsen N. Kosthold, livsstil og metabolsk kontroll blant barn og unge med type 1 diabetes. Cand.scient. oppgave i klinisk ernæring. University of Oslo, Faculty of Medicine, 2002.
31. Johansson L, Solvoll K, Opdahl S, et al. Response rates with different distribution methods and reward, and reproducibility of a quantitative food frequency questionnaire. Eur J Clin Nutr 1997; 51 (6): 346-53.
32. Frost Andersen L, Solvoll K, Drevon CA. Very long-chain n-3 fatty acids as biomarkers for intake of fish and n-3 fatty acid concentrates. Am J Clin Nutr 1996; 64: 305-11
33. Andersen LF, Nes MF, Lillegaard IT, et al. Evaluation of a quantitative food frequency questionnaire used in a group of Norwegian adolescents. Eur J Clin Nutr 1995; 49 (8): 543-54.
34. Lillegaard IT, Andersen LF. Validation of a pre-coded food diary with energy expenditure, comparison of under-reporters v. acceptable reporters. Br J Nutr 2005; 94 (6): 998-1003.
35. Øverby NC, Lillegaard IT, Johansson L, et al. High intake of added sugar among Norwegian children and adolescents. Public Health Nutr 2004; 7 (2): 285-93.
36. Frankenfield D, Roth-Yousey L, Compher C. Comparison of predictive equations for resting metabolic rate in healthy nonobese and obese adults: a systematic review. J Am Diet Assoc 2005; 105 (5): 775-89.
37. Black AE. Critical evaluation of energy intake using the Goldberg cut-off for energy intake: basal metabolic rate. A practical guide to its calculation, use and limitations. Int J Obes Relat Metab Disord 2000; 24 (9): 1119-30.
72 AAS A.-M. ET AL.
38. Helsedirektoratet. Utviklingen i norsk kosthold. Matforsyningsstatistikk og forbruksundersøkelser. 2012. Oslo. IS-2037.
39. The Diabetes and Nutrition Study Group of the Spanish Diabetes Association (GSEDNu). Diabetes Nutrition and Complications Trial: adherence to the ADA nutritional recommendations, targets of metabolic control, and onset of diabetes complications. A 7-year, prospective, population-based, observational multicenter study. J Diabetes Complications 2006; 20: 361-6.
40. Barclay AW, Brand-Miller JC, Mitchell P. Macronutrient intake, glycaemic index and glycaemic load of older Australian subjects with and without diabetes: baseline data from the Blue Mountains Eye study. Br J Nutr 2006; 96 (1): 117-23.
41. Delahanty LM, Sonnenberg LM, Hayden D, et al. Clinical and cost outcomes of medical nutrition therapy for hypercholesterolemia: a controlled trial. J Am Diet Assoc 2001;101 (9): 1012-23.
42. Eeley EA, Stratton IM, Hadden DR, et al. UKPDS 18: estimated dietary intake in type 2 diabetic patients randomly allocated to diet, sulphonylurea or insulin therapy. UK Prospective Diabetes Study Group. Diabetic Medicine 1996; 13 (7): 656-62.
43. Thanopoulou A, Karamanos B, Angelico F, et al. Nutritional habits of subjects with Type 2 diabetes mellitus in the Mediterranean Basin: comparison with the non-diabetic population and the dietary recommendations. Multi-Centre Study of the Mediterranean Group for the Study of Diabetes (MGSD). Diabetologia 2004; 47 (3): 367-76.
44. Toeller M, Klischan A, Heitkamp G, et al. Nutritional intake of 2868 IDDM patients from 30 centres in Europe. EURODIAB IDDM Complications Study Group. Diabetologia 1996; 39 (8): 929-39.
45. Sonestedt E, Øverby NC, Laaksonen DE, et al. Does high sugar consumption exacerbate cardiometabolic risk factors and increase the risk of type 2 diabetes and cardiovascular disease? Food Nutr Res 2012; 56: 19104.
46. Øverby NC, Sonestedt E, Laaksonen DE, et al. Dietary fiber and the glycemic index: a background paper for the Nordic Nutrition Recommendations 2012. Food Nutr Res 2013; 57: 20709.
47. Astrup A, Dyerberg J, Elwood P, et al. The role of reducing intakes of saturated fat in the prevention of cardiovascular disease: where does the evidence stand in 2010? Am J Clin Nutr 2011; 93 (4): 684-8.
48. FAO. Fats and fatty acids in human nutrition. Report of an expert consultation. FAO Food and nutrition paper 91. ISBN 978-92-5-106733-8. 2010. Rome, Food and Agriculture Organization of the United Nations (FAO).
49. Vergnaud AC, Norat T, Mouw T, et al. Macronutrient composition of the diet and prospective weight change in Participants of the EPIC-PANACEA Study. PLoS ONE 2013; 8 (3): e57300.
50. Ericson U, Sonestedt E, Gullberg B, et al. High intakes of protein and processed meat associate with increased incidence of type 2 diabetes. Br J Nutr 2013; 109 (6): 1143-53.
51. Merino J, Kones R, Ferro R, et al. Negative effect of a low-carbohydrate, high-protein, high-fat diet on small peripheral artery reactivity in patients with increased cardiovascular risk. Br J Nutr 2013; 109 (7): 1241-7.
52. WHO. Diet, nutrition and the prevention of chronic diseases. 916. 2003. Geneva. 53. von Ruesten A, Feller S, Bergmann MM, et al. Diet and risk of chronic diseases: results from the first 8 years
of follow-up in the EPIC-Potsdam study. Eur J Clin Nutr 2013; 67 (4): 412-9. 54. World Cancer Research Fund/American Institute for Cancer Research. Food, Nutrition, Physical Activity, and
the Prevention of Cancer: a Global Perspective. The Second Expert Report. 2007. 55. Rohrmann S, Overvad K, Bueno-de-Mesquita H, et al. Meat consumption and mortality – results from the
European Prospective Investigation into Cancer and Nutrition. BMC Med 2013; 11 (1): 63. 56. Takata Y, Shu XO, Gao YT, et al. Red meat and poultry intakes and risk of total and cause-specific mortality:
results from cohort studies of Chinese adults in Shanghai. PLoS ONE 2013; 8 (2): e56963. 57. Kappeler R, Eichholzer M, Rohrmann S. Meat consumption and diet quality and mortality in NHANES III.
Eur J Clin Nutr 2013. doi: 10.1038/ejcn.2013.59 58. Rasouli B, Ahlbom A, Andersson T, et al. Alcohol consumption is associated with reduced risk of Type-2
diabetes and autoimmune diabetes in adults: results from the Nord-Trøndelag health study. Diabet Med 2013; 30 (1): 56-64.
59. Goris AH, Westerterp-Plantenga MS, Westerterp KR. Undereating and underrecording of habitual food intake in obese men: selective underreporting of fat intake. Am J Clin Nutr 2000; 71 (1): 130-4.
60. Hill RJ, Davies PS. The validity of self-reported energy intake as determined using the doubly labelled water technique. Br J Nutr 2001; 85 (4): 415-30.
61. Helsedirektoratet. Norkost 3. En landsomfattende kostholdsundersøkelse blant menn og kvinner i Norge i alderen 18-70 år, 2010-11. IS-2000. 2012. Oslo.
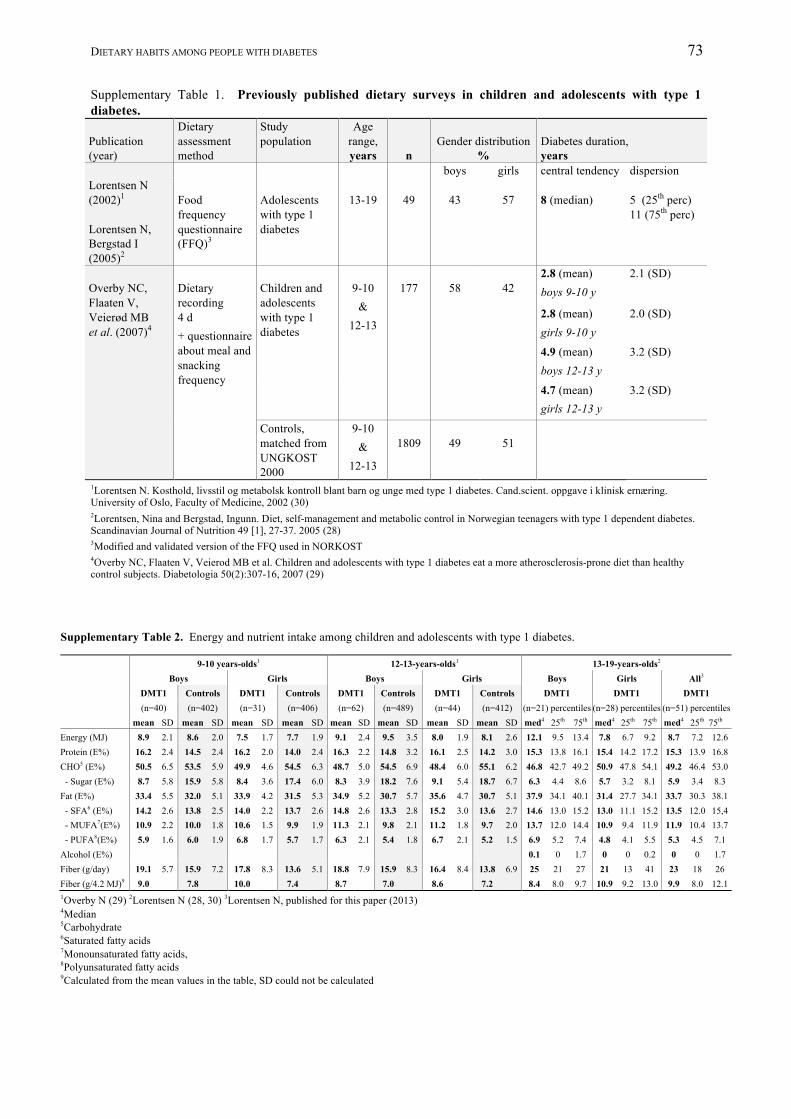
DIETARY HABITS AMONG PEOPLE WITH DIABETES 73
Supplementary Table 1. Previously published dietary surveys in children and adolescents with type 1 diabetes. Publication (year)
Dietary assessment method
Study population
Age range, years
n
Gender distribution
%
Diabetes duration, years
boys girls central tendency dispersion Lorentsen N (2002)1
Lorentsen N, Bergstad I (2005)2
Food frequency questionnaire (FFQ)3
Adolescents with type 1 diabetes
13-19
49
43
57
8 (median)
5 (25th perc) 11 (75th perc)
Overby NC, Flaaten V, Veierød MB et al. (2007)4
Dietary recording 4 d + questionnaire about meal and snacking frequency
Children and adolescents with type 1 diabetes
9-10
& 12-13
177
58
42
2.8 (mean) boys 9-10 y
2.1 (SD)
2.8 (mean) girls 9-10 y
2.0 (SD)
4.9 (mean) boys 12-13 y
3.2 (SD)
4.7 (mean) girls 12-13 y
3.2 (SD)
Controls, matched from UNGKOST 2000
9-10 &
12-13
1809
49
51
1Lorentsen N. Kosthold, livsstil og metabolsk kontroll blant barn og unge med type 1 diabetes. Cand.scient. oppgave i klinisk ernæring. University of Oslo, Faculty of Medicine, 2002 (30) 2Lorentsen, Nina and Bergstad, Ingunn. Diet, self-management and metabolic control in Norwegian teenagers with type 1 dependent diabetes. Scandinavian Journal of Nutrition 49 [1], 27-37. 2005 (28) 3Modified and validated version of the FFQ used in NORKOST 4Overby NC, Flaaten V, Veierod MB et al. Children and adolescents with type 1 diabetes eat a more atherosclerosis-prone diet than healthy control subjects. Diabetologia 50(2):307-16, 2007 (29)
Supplementary Table 2. Energy and nutrient intake among children and adolescents with type 1 diabetes. 9-10 years-olds1 12-13-years-olds1 13-19-years-olds2 Boys Girls Boys Girls Boys Girls All3
DMT1 Controls DMT1 Controls DMT1 Controls DMT1 Controls DMT1 DMT1 DMT1 (n=40) (n=402) (n=31) (n=406) (n=62) (n=489) (n=44) (n=412) (n=21) percentiles (n=28) percentiles (n=51) percentiles mean SD mean SD mean SD mean SD mean SD mean SD mean SD mean SD med4 25th 75th med4 25th 75th med4 25th 75th Energy (MJ) 8.9 2.1 8.6 2.0 7.5 1.7 7.7 1.9 9.1 2.4 9.5 3.5 8.0 1.9 8.1 2.6 12.1 9.5 13.4 7.8 6.7 9.2 8.7 7.2 12.6 Protein (E%) 16.2 2.4 14.5 2.4 16.2 2.0 14.0 2.4 16.3 2.2 14.8 3.2 16.1 2.5 14.2 3.0 15.3 13.8 16.1 15.4 14.2 17.2 15.3 13.9 16.8 CHO5 (E%) 50.5 6.5 53.5 5.9 49.9 4.6 54.5 6.3 48.7 5.0 54.5 6.9 48.4 6.0 55.1 6.2 46.8 42.7 49.2 50.9 47.8 54.1 49.2 46.4 53.0 - Sugar (E%) 8.7 5.8 15.9 5.8 8.4 3.6 17.4 6.0 8.3 3.9 18.2 7.6 9.1 5.4 18.7 6.7 6.3 4.4 8.6 5.7 3.2 8.1 5.9 3.4 8.3 Fat (E%) 33.4 5.5 32.0 5.1 33.9 4.2 31.5 5.3 34.9 5.2 30.7 5.7 35.6 4.7 30.7 5.1 37.9 34.1 40.1 31.4 27.7 34.1 33.7 30.3 38.1 - SFA6 (E%) 14.2 2.6 13.8 2.5 14.0 2.2 13.7 2.6 14.8 2.6 13.3 2.8 15.2 3.0 13.6 2.7 14.6 13.0 15.2 13.0 11.1 15.2 13.5 12.0 15,4 - MUFA7(E%) 10.9 2.2 10.0 1.8 10.6 1.5 9.9 1.9 11.3 2.1 9.8 2.1 11.2 1.8 9.7 2.0 13.7 12.0 14.4 10.9 9.4 11.9 11.9 10.4 13.7 - PUFA8(E%) 5.9 1.6 6.0 1.9 6.8 1.7 5.7 1.7 6.3 2.1 5.4 1.8 6.7 2.1 5.2 1.5 6.9 5.2 7.4 4.8 4.1 5.5 5.3 4.5 7.1 Alcohol (E%) 0.1 0 1.7 0 0 0.2 0 0 1.7 Fiber (g/day) 19.1 5.7 15.9 7.2 17.8 8.3 13.6 5.1 18.8 7.9 15.9 8.3 16.4 8.4 13.8 6.9 25 21 27 21 13 41 23 18 26 Fiber (g/4.2 MJ)9 9.0 7.8 10.0 7.4 8.7 7.0 8.6 7.2 8.4 8.0 9.7 10.9 9.2 13.0 9.9 8.0 12.1 1Overby N (29) 2Lorentsen N (28, 30) 3Lorentsen N, published for this paper (2013) 4Median 5Carbohydrate 6Saturated fatty acids 7Monounsaturated fatty acids, 8Polyunsaturated fatty acids 9Calculated from the mean values in the table, SD could not be calculated
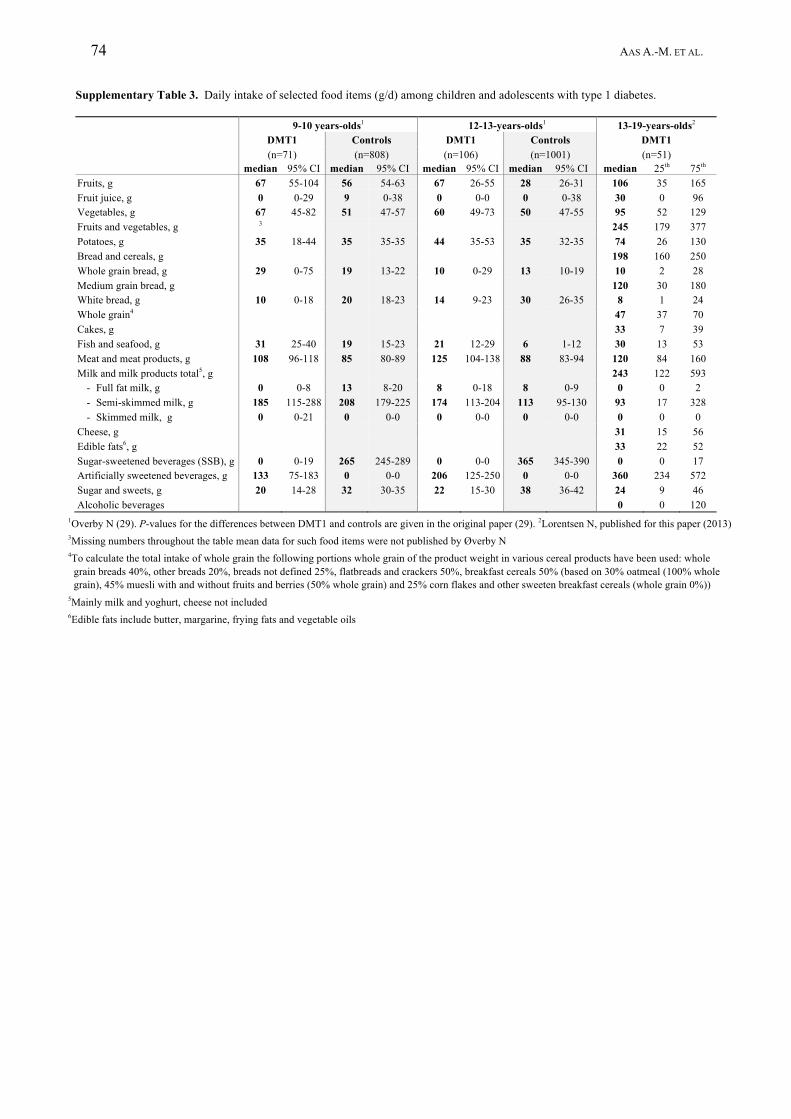
74 AAS A.-M. ET AL.
Supplementary Table 3. Daily intake of selected food items (g/d) among children and adolescents with type 1 diabetes. 9-10 years-olds1 12-13-years-olds1 13-19-years-olds2 DMT1 Controls DMT1 Controls
(n=1001) DMT1
(n=71) (n=808) (n=106) (n=51) median 95% CI median 95% CI median 95% CI median 95% CI median 25th 75th Fruits, g 67 55-104 56 54-63 67 26-55 28 26-31 106 35 165 Fruit juice, g 0 0-29 9 0-38 0 0-0 0 0-38 30 0 96 Vegetables, g 67 45-82 51 47-57 60 49-73 50 47-55 95 52 129 Fruits and vegetables, g 3 245 179 377 Potatoes, g 35 18-44 35 35-35 44 35-53 35 32-35 74 26 130 Bread and cereals, g 198 160 250 Whole grain bread, g 29 0-75 19 13-22 10 0-29 13 10-19 10 2 28 Medium grain bread, g 120 30 180 White bread, g 10 0-18 20 18-23 14 9-23 30 26-35 8 1 24 Whole grain4 47 37 70 Cakes, g 33 7 39 Fish and seafood, g 31 25-40 19 15-23 21 12-29 6 1-12 30 13 53 Meat and meat products, g 108 96-118 85 80-89 125 104-138 88 83-94 120 84 160 Milk and milk products total5, g 243 122 593
- Full fat milk, g 0 0-8 13 8-20 8 0-18 8 0-9 0 0 2 - Semi-skimmed milk, g 185 115-288 208 179-225 174 113-204 113 95-130 93 17 328 - Skimmed milk, g 0 0-21 0 0-0 0 0-0 0 0-0 0 0 0
Cheese, g 31 15 56 Edible fats6, g 33 22 52 Sugar-sweetened beverages (SSB), g 0 0-19 265 245-289 0 0-0 365 345-390 0 0 17 Artificially sweetened beverages, g 133 75-183 0 0-0 206 125-250 0 0-0 360 234 572 Sugar and sweets, g 20 14-28 32 30-35 22 15-30 38 36-42 24 9 46 Alcoholic beverages 0 0 120
1Overby N (29). P-values for the differences between DMT1 and controls are given in the original paper (29). 2Lorentsen N, published for this paper (2013) 3Missing numbers throughout the table mean data for such food items were not published by Øverby N 4To calculate the total intake of whole grain the following portions whole grain of the product weight in various cereal products have been used: whole
grain breads 40%, other breads 20%, breads not defined 25%, flatbreads and crackers 50%, breakfast cereals 50% (based on 30% oatmeal (100% whole grain), 45% muesli with and without fruits and berries (50% whole grain) and 25% corn flakes and other sweeten breakfast cereals (whole grain 0%))
5Mainly milk and yoghurt, cheese not included 6Edible fats include butter, margarine, frying fats and vegetable oils