Embed Size (px)
Citation preview

Introduction Background Experimental Design Results Appendix
Do Environmental Messages Work on the Poor?Experimental Evidence from Brazilian Favelas
Chantal Toledo
UC Berkeley
IPWSD, April 13 2013
Introduction Background Experimental Design Results Appendix
Motivation
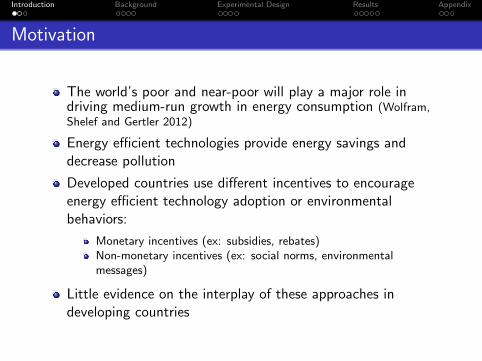
The world’s poor and near-poor will play a major role indriving medium-run growth in energy consumption (Wolfram,Shelef and Gertler 2012)
Energy efficient technologies provide energy savings anddecrease pollution
Developed countries use different incentives to encourageenergy efficient technology adoption or environmentalbehaviors:
Monetary incentives (ex: subsidies, rebates)Non-monetary incentives (ex: social norms, environmentalmessages)
Little evidence on the interplay of these approaches indeveloping countries
Introduction Background Experimental Design Results Appendix
In this Paper
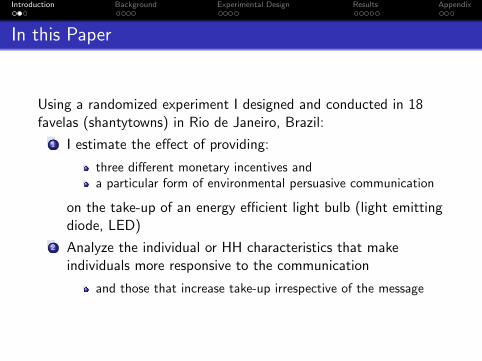
Using a randomized experiment I designed and conducted in 18favelas (shantytowns) in Rio de Janeiro, Brazil:
1 I estimate the effect of providing:
three different monetary incentives anda particular form of environmental persuasive communication
on the take-up of an energy efficient light bulb (light emittingdiode, LED)
2 Analyze the individual or HH characteristics that makeindividuals more responsive to the communication
and those that increase take-up irrespective of the message
Introduction Background Experimental Design Results Appendix
Literature Review
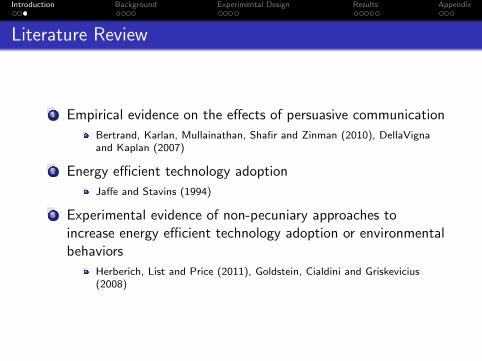
1 Empirical evidence on the effects of persuasive communication
Bertrand, Karlan, Mullainathan, Shafir and Zinman (2010), DellaVignaand Kaplan (2007)
2 Energy efficient technology adoption
Jaffe and Stavins (1994)
3 Experimental evidence of non-pecuniary approaches toincrease energy efficient technology adoption or environmentalbehaviors
Herberich, List and Price (2011), Goldstein, Cialdini and Griskevicius(2008)
Introduction Background Experimental Design Results Appendix
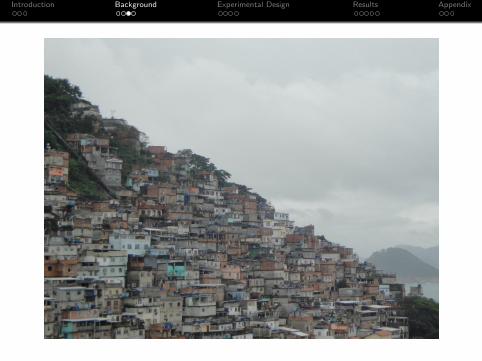
Favelas
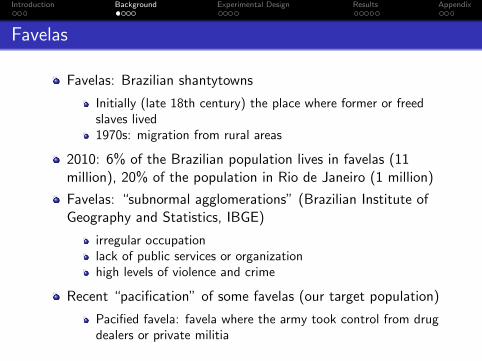
Favelas: Brazilian shantytowns
Initially (late 18th century) the place where former or freedslaves lived1970s: migration from rural areas
2010: 6% of the Brazilian population lives in favelas (11million), 20% of the population in Rio de Janeiro (1 million)
Favelas: “subnormal agglomerations” (Brazilian Institute ofGeography and Statistics, IBGE)
irregular occupationlack of public services or organizationhigh levels of violence and crime
Recent “pacification” of some favelas (our target population)
Pacified favela: favela where the army took control from drugdealers or private militia
Introduction Background Experimental Design Results Appendix
Pacification Phases
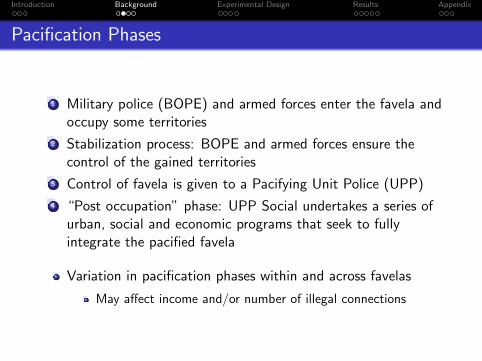
1 Military police (BOPE) and armed forces enter the favela andoccupy some territories
2 Stabilization process: BOPE and armed forces ensure thecontrol of the gained territories
3 Control of favela is given to a Pacifying Unit Police (UPP)
4 “Post occupation” phase: UPP Social undertakes a series ofurban, social and economic programs that seek to fullyintegrate the pacified favela
Variation in pacification phases within and across favelas
May affect income and/or number of illegal connections
Introduction Background Experimental Design Results Appendix
Introduction Background Experimental Design Results Appendix
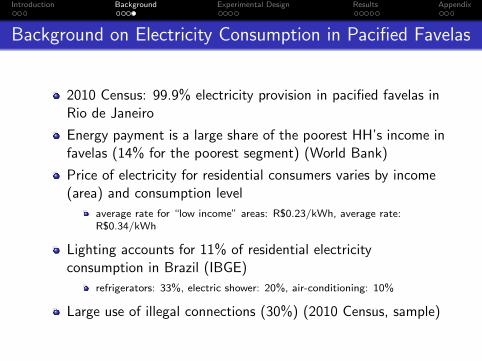
Background on Electricity Consumption in Pacified Favelas
2010 Census: 99.9% electricity provision in pacified favelas inRio de Janeiro
Energy payment is a large share of the poorest HH’s income infavelas (14% for the poorest segment) (World Bank)
Price of electricity for residential consumers varies by income(area) and consumption level
average rate for “low income” areas: R$0.23/kWh, average rate:R$0.34/kWh
Lighting accounts for 11% of residential electricityconsumption in Brazil (IBGE)
refrigerators: 33%, electric shower: 20%, air-conditioning: 10%
Large use of illegal connections (30%) (2010 Census, sample)
Introduction Background Experimental Design Results Appendix
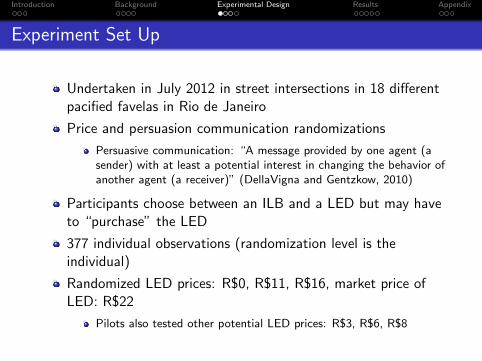
Experiment Set Up
Undertaken in July 2012 in street intersections in 18 differentpacified favelas in Rio de Janeiro
Price and persuasion communication randomizations
Persuasive communication: “A message provided by one agent (asender) with at least a potential interest in changing the behavior ofanother agent (a receiver)” (DellaVigna and Gentzkow, 2010)
Participants choose between an ILB and a LED but may haveto “purchase” the LED
377 individual observations (randomization level is theindividual)
Randomized LED prices: R$0, R$11, R$16, market price ofLED: R$22
Pilots also tested other potential LED prices: R$3, R$6, R$8
Introduction Background Experimental Design Results Appendix
Steps
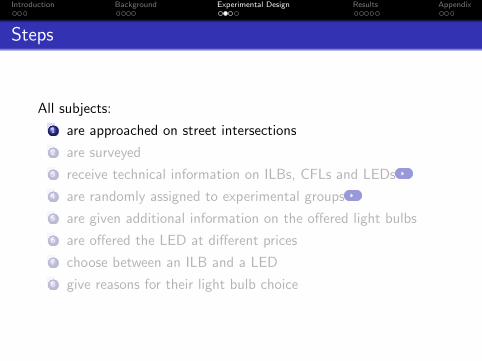
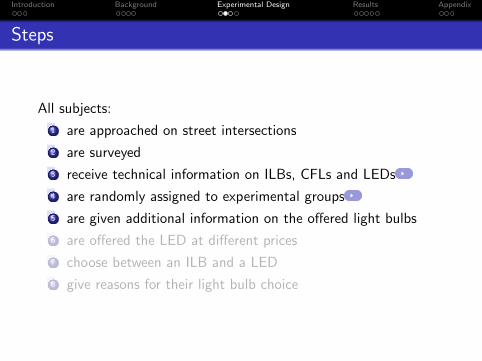
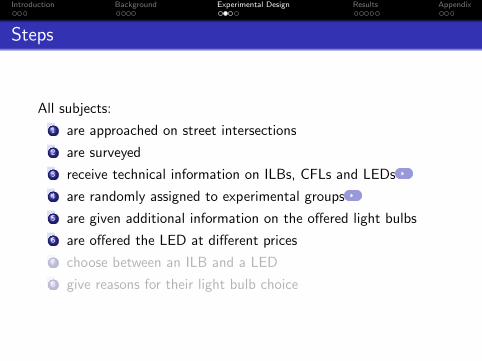
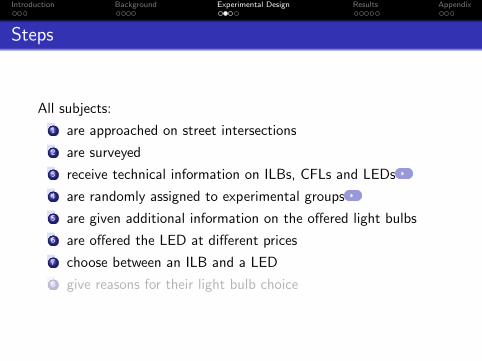
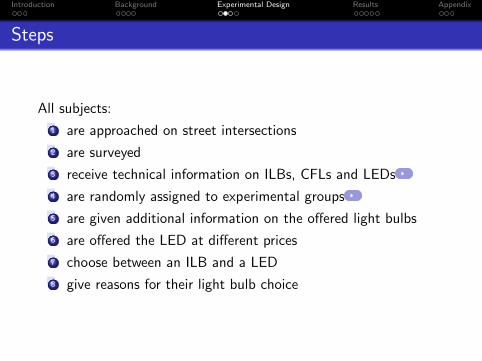
All subjects:
1 are approached on street intersections
2 are surveyed
3 receive technical information on ILBs, CFLs and LEDs
4 are randomly assigned to experimental groups
5 are given additional information on the offered light bulbs
6 are offered the LED at different prices
7 choose between an ILB and a LED
8 give reasons for their light bulb choice
Introduction Background Experimental Design Results Appendix
Steps
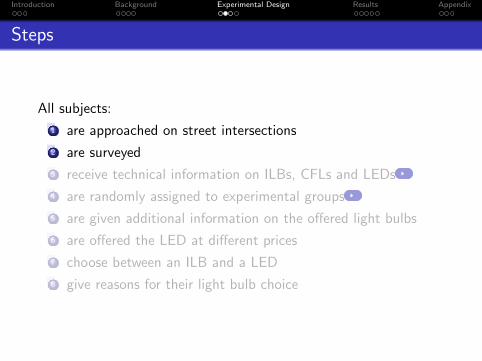
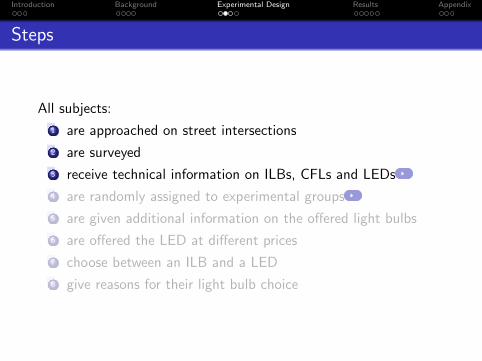
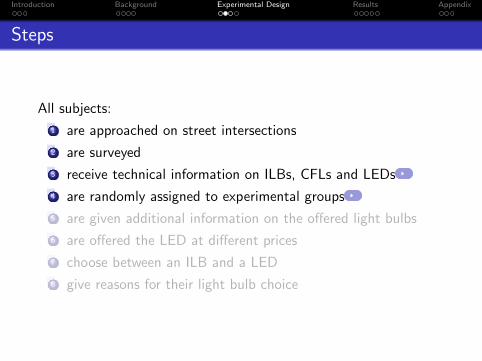
All subjects:
1 are approached on street intersections
2 are surveyed
3 receive technical information on ILBs, CFLs and LEDs
4 are randomly assigned to experimental groups
5 are given additional information on the offered light bulbs
6 are offered the LED at different prices
7 choose between an ILB and a LED
8 give reasons for their light bulb choice
Introduction Background Experimental Design Results Appendix
Insights from the Psychology Literature
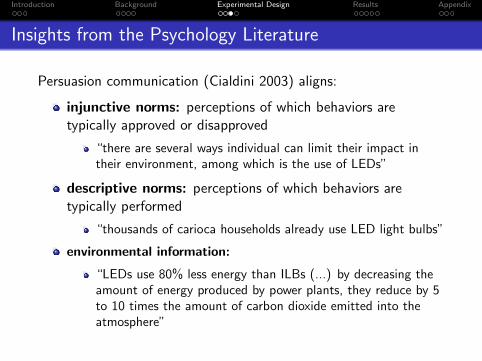
Persuasion communication (Cialdini 2003) aligns:
injunctive norms: perceptions of which behaviors aretypically approved or disapproved
“there are several ways individual can limit their impact intheir environment, among which is the use of LEDs”
descriptive norms: perceptions of which behaviors aretypically performed
“thousands of carioca households already use LED light bulbs”
environmental information:
“LEDs use 80% less energy than ILBs (...) by decreasing theamount of energy produced by power plants, they reduce by 5to 10 times the amount of carbon dioxide emitted into theatmosphere”
Introduction Background Experimental Design Results Appendix
Estimation Strategy
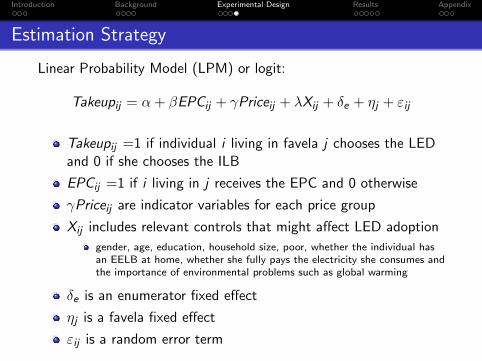
Linear Probability Model (LPM) or logit:
Takeupij = α + βEPCij + γPriceij + λXij + δe + ηj + εij
Takeupij =1 if individual i living in favela j chooses the LEDand 0 if she chooses the ILB
EPCij =1 if i living in j receives the EPC and 0 otherwise
γPriceij are indicator variables for each price group
Xij includes relevant controls that might affect LED adoption
gender, age, education, household size, poor, whether the individual hasan EELB at home, whether she fully pays the electricity she consumes andthe importance of environmental problems such as global warming
δe is an enumerator fixed effect
ηj is a favela fixed effect
εij is a random error term
Introduction Background Experimental Design Results Appendix
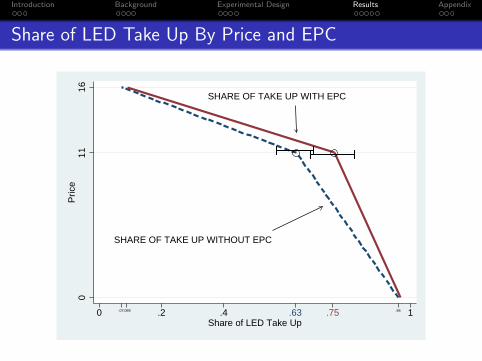
Share of LED Take Up By Price and EPC
SHARE OF TAKE UP WITH EPC
SHARE OF TAKE UP WITHOUT EPC
011
16P
rice
0 .2 .4 .63 .75 1.07.089 .96
Share of LED Take Up
Introduction Background Experimental Design Results Appendix
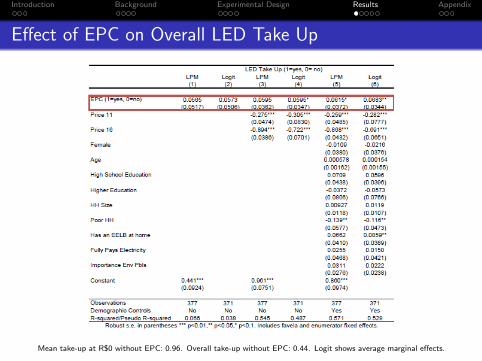
Effect of EPC on Overall LED Take Up
Mean take-up at R$0 without EPC: 0.96. Overall take-up without EPC: 0.44. Logit shows average marginal effects.
Introduction Background Experimental Design Results Appendix
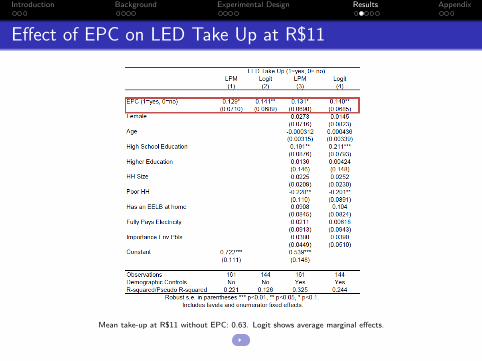
Effect of EPC on LED Take Up at R$11
Mean take-up at R$11 without EPC: 0.63. Logit shows average marginal effects.
Introduction Background Experimental Design Results Appendix
Reasons for ILB and LED Adoption
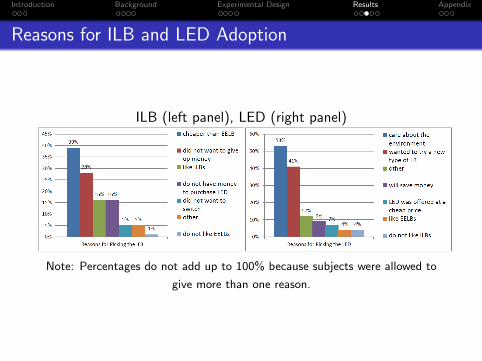
ILB (left panel), LED (right panel)
Note: Percentages do not add up to 100% because subjects were allowed to
give more than one reason.
Introduction Background Experimental Design Results Appendix
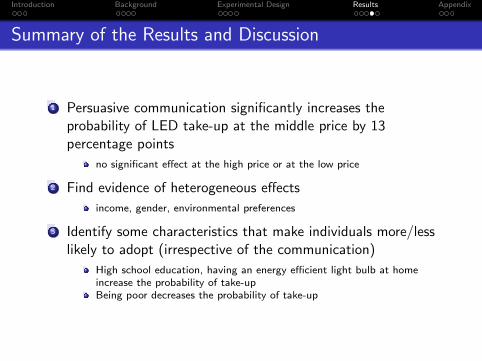
Summary of the Results and Discussion
1 Persuasive communication significantly increases theprobability of LED take-up at the middle price by 13percentage points
no significant effect at the high price or at the low price
2 Find evidence of heterogeneous effects
income, gender, environmental preferences
3 Identify some characteristics that make individuals more/lesslikely to adopt (irrespective of the communication)
High school education, having an energy efficient light bulb at homeincrease the probability of take-upBeing poor decreases the probability of take-up

Introduction Background Experimental Design Results Appendix
Thank you!
Thank you!
Introduction Background Experimental Design Results Appendix
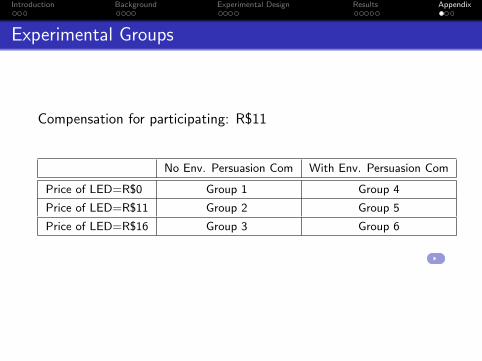
Experimental Groups
Compensation for participating: R$11
No Env. Persuasion Com With Env. Persuasion Com
Price of LED=R$0 Group 1 Group 4
Price of LED=R$11 Group 2 Group 5
Price of LED=R$16 Group 3 Group 6
Introduction Background Experimental Design Results Appendix
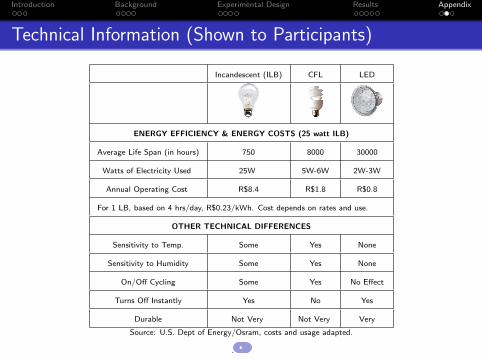
Technical Information (Shown to Participants)
Incandescent (ILB) CFL LED
ENERGY EFFICIENCY & ENERGY COSTS (25 watt ILB)
Average Life Span (in hours) 750 8000 30000
Watts of Electricity Used 25W 5W-6W 2W-3W
Annual Operating Cost R$8.4 R$1.8 R$0.8
For 1 LB, based on 4 hrs/day, R$0.23/kWh. Cost depends on rates and use.
OTHER TECHNICAL DIFFERENCES
Sensitivity to Temp. Some Yes None
Sensitivity to Humidity Some Yes None
On/Off Cycling Some Yes No Effect
Turns Off Instantly Yes No Yes
Durable Not Very Not Very Very
Source: U.S. Dept of Energy/Osram, costs and usage adapted.
.
Introduction Background Experimental Design Results Appendix
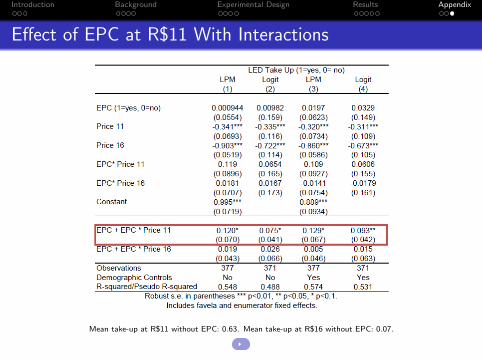
Effect of EPC at R$11 With Interactions
Mean take-up at R$11 without EPC: 0.63. Mean take-up at R$16 without EPC: 0.07.