Embed Size (px)
Citation preview

Do Colleges and Universities “Manage” their Financial Reporting?
By
Robert E. Martin
Emeritus Boles Professor of Economics
Centre College
Danville, KY 40422
April 9, 2013
Abstract
Prior to 2008 public universities, private universities, and liberal arts colleges made small
changes in the proportion of total cost accounted for by instruction, research, and public service.
After 2008 these institutions reported dramatic increases in the share of total cost accounted for
by instruction, research, and public service. These shifts may be legitimate examples of resource
reallocation or they may be examples of widespread reclassification of expenses. The latter case
suggests financial reports are “managed” in higher education, as they frequently are among
corporations. I explore the relationship between these shifts and changes in staffing.

Do Colleges and Universities “Manage” their Financial Reporting?
Introduction.
Financial analysts know corporations “manage their earnings” in a persistent attempt to
influence how financial markets value their securities. Earnings can be managed by changes in
accounting practices, adopting optimistic contingency rates for reserves, or timing the
recognition of earnings. Unfortunately, “earnings management” sometimes crosses over to
fraudulent behavior. As a consequence, financial analysts play “cat and mouse” with
corporations as they try to determine the “quality” of corporate earnings. I play the “cat” in this
paper, as I try to determine the “quality” of college and university financial reporting.
The efficiency of charitable organizations is measured by their “activity ratio,” which is
the proportion of total expenditures accounted for by the charity’s central mission (Baber,
Daniel, and Roberts, 2002). A college or university’s central missions are instruction, research,
and public service; academic cost is defined as the sum of these three costs. Therefore, higher
education’s “activity ratio” is the share of total expenditures taken by academic cost. Like
profits for corporations, an academic institution’s activity ratio is its efficiency measure1.
Prior to 2008 universities made small changes in their activity ratios; after 2008 there was
a widespread movement among public universities, private universities, and liberal arts colleges
to report significant increases in the share of total expenditures accounted for by academics.
Taken at face value, there were large shifts in spending out of other activities and into
instruction, research, and public service at numerous higher education institutions after 2008. If
accurate, substantial cuts were made in other activities and the proceeds used to provide more
instruction, research, and public service.
If other activities were cut by these amounts and the money used in academics, this is a
legitimate exercise in resource reallocation. If costs were not cut in other activities and instead
existing expenditures were reclassified as academic costs, this is a case of “managed financial
reporting.” If it is a legitimate exercise in resource reallocation, changes in staffing after 2008
1 What is remarkable about activity ratios in higher education is the variation in the ratio across institutions
with identical missions. Howard Bowen dubbed this variation “centrifugal randomness” (1980, 228). That
randomness denotes weak accounting standards for what can and cannot be designated as academic cost.

should reflect increased academic hiring and decreased hiring of nonacademic staff. If there is
little relationship between cost and staff changes, it suggests we may have a case of managed
financial reporting2. Real cost changes follow the people who are added or subtracted from a
given activity; cost changes without staff changes are most likely due to ad hoc accounting
changes.
Changes in activity ratios pre and post 2008
Changes in pre and post 2008 activity ratios at public universities, private universities,
and liberal arts colleges are reported in Table 1. Prior to 2008, 29 of the 134 public universities,
8 of the 54 private universities, and 30 of the 202 liberal arts colleges in the sample reported
increases in their activity ratios. The remainders showed no change or declines in their activity
ratios. After 2008, 130 of the public universities, 49 of the private universities, and 108 of the
liberal arts colleges reported increases in their activity ratios. Before 2008, 22 percent of public
universities, 15 percent of private universities, and 15 percent of liberal arts colleges were
reporting increases in the “efficiency” of their operations. After 2008, 97 percent of public
universities, 91 percent of private universities, and 53 percent of liberal arts colleges reported
increases in their “efficiency” and a renewed dedication to academics.
The weighted average activity ratio for public and private universities increased by 7
percentage points after 2008 and the average activity ratio for liberal arts colleges remained
unchanged. There was only one public and one private university that reduced its activity ratio
after 2008. In contrast, 85 liberal arts colleges reduced their activity ratios after 2008; these
reductions offset the increases from 108 institutions. The circumstantial picture created by this
data is many higher education institutions dramatically improved their efficiency after 2008.
The rest of this paper is focused on measuring the size of the apparent shifts in resources
from other activities to academics and exploring whether or not the shifts in resources can be
associated with corresponding shifts in staffing. The motivation for reporting higher activity
ratios is discussed in the next section, along with previous data reporting issues in higher
education. The methodologies for measuring resource shifts, staff changes, and data are
2 The only way to say conclusively whether the shifts were resource reallocations or managed reporting is
to audit each institution.

explained in the fourth section. Results are reported in the fifth section and conclusions are
contained in the final section.
Why would colleges and universities report higher activity ratios?
The loss of wealth, the increase in unemployment, and the slow economic recovery after
2008, coupled with rapidly increasing student loan debt, three decades of rising real cost of
attendance, and increasing doubt about the return on higher education, has created a significant
public relations problem for higher education. The public relations problem inevitably leads to
closer public scrutiny and more questions asked about where the money goes. Beyond this
generic problem, studies3 identify “administrative bloat” as a major issue in higher education.
Simply put, a significant increase in the share of total spending taken by academics is a good
defense against charges that overhead costs are too high. A rising activity ratio has public
relations value.
Manufacturing an increase in the activity ratio by re-classifying expenses is at the very
least ethically dubious. Could higher education administrations be as ethically challenged as
corporate administrations? There are instances, such as the Penn State scandal, where senior
administrations appear to have covered up issues of considerable moral weight. In addition,
there are frequent cases of misleading data problems.
Recently, Claremont McKenna College, Emory University, George Washington
University, Tulane University’s business school, and York College of Pennsylvania submitted
false data to ranking agencies (Brody, 2012) (Jaschik, 2013a 2013b) (Hoover, 2012) (Anderson,
2013). These are not the first instances of false data reporting. The erroneous data problem has
been reported regularly since the early 1990’s (Stecklow, 1995).
In the 2012 survey of admission officers conducted by Inside Higher Ed, Jaschik reports
“… such scandals would not surprise most admission directors, 91 percent of whom said that
they believe other institutions have falsely reported scores and other data” (2012). They believe
the practice is widespread, but only 1 percent of the respondents admitted their own institutions
have reported false data.
3 Greene, et al (2010), Martin and Hill (2013a, 2013b).

Jaschik quotes an unnamed senior admissions official who says “that the misreporting …
is less due to deliberate deception, and more to self-rationalizing why certain students or groups
of students ought not be included in a profile” (2013a). Jaschik also quotes a rankings critic who
says "as long as commercial rankings are considered as part of an institution's identity, there will
be pressure on college personnel to falsify ranking data. An effective way to curb such unethical
and harmful behavior is for presidents and trustees to stop supporting the ranking enterprise and
start promoting more meaningful measurements of educational quality" (2013b). Similarly,
Hoover quotes another admissions official who describes these stories as “a sad tale of the
pressure to compete” (2012).
The response by higher education insiders is revealing; they seem to blame the outside
rankings for creating the problem. Imagine how the public would respond if corporations
claimed external regulators demanding rigorous accounting standards for earnings reports create
“pressure to compete” that leads them to falsify their data? That would not pass any credibility
test: the public knows misleading financial reports lead to more regulation, regulation does not
cause misleading reports.
Most of the data provided by colleges and universities “… to U.S. News, other analysts
and the federal government is not independently verified. That makes it impossible to know how
many might have misreported data over the years as they angle for prestige to stand out in a
crowded market” (Anderson, 2013). Given the significant uncertainty surrounding college value
added, the higher education market depends crucially on trust. Capital markets are no different;
willingness to invest rests on trust. Anything that threatens that bedrock, threatens capital
markets and public support for higher education.
In summary, evidence suggests colleges and universities provide misleading information.
Further, there are few second party safeguards in higher education that might prevent institutions
from providing misleading data. Finally, higher education insiders are subject to all the human
weaknesses that trouble the rest of humanity and in the past they have been subject to less
scrutiny than other institutions. It would be easy to rationalize the reclassification of other
expenditures as academic expenditures, even though reclassification is not resource reallocation.
Data and Methodology.

Data. Data are drawn from the IPEDS website. For public research universities cost and
staffing data consists of observations for 2005, 2008, and 2010. For private research universities
cost and staffing data consists of observations for 2005, 2008, and 2011. For liberal arts colleges
cost and staffing data consists of observations for 1999, 2008, and 2011. All dollar denominated
variables are in constant 2008 values. In each case, observations for all institutions in each
classification were drawn; however, reporting problems led to usable observations for 134 public
research universities, 54 private research universities, and 202 liberal arts colleges in the sample.
Estimating Cost Shifts. The issue here is how do we measure resource shifting from
one activity to another among colleges and universities? A rise in the share of total expenditure
accounted for by one activity is not sufficient to establish that resources are being shifted to that
activity.4 The share of total cost for one activity can rise when all activities are being cut or all
activities receive higher budgets. In these cases, the share can increase because at the margin
fewer cuts were made in academics or because academics received a larger share of an
expanding budget. Resources may be shifted only when one activity increases while other
activities decrease; hence, these are necessary conditions for resource shifting. Since one
activity increases while the other declines, total expenditures may rise, remain the same, or
decline. If total expenditures increase or remain the same, then the value of resources shifted
from the declining activity to the increasing activity equals the reduction in the declining
activity. If total expenditures decline, then the value of resources shifted from the declining
activity to the increasing activity equals the increase in the increasing activity. Let the forgoing
be the total expenditure rule for identifying resource shifts.
4 By definition total cost equals the sum of academic cost and other cost; such as,
(1) 𝑡𝑐 ≡ 𝑎𝑐 + 𝑜𝑐, where tc is total cost, ac is academic cost, and oc is all other cost. It follows from (1) that the total differential of
cost is
(2) 𝑑𝑡𝑐 = 𝑑𝑎𝑐 + 𝑑𝑜𝑐. Also by definition, the share of total cost accounted for by academic cost is
(3) 𝑠 ≡ 𝑎𝑐/(𝑎𝑐 + 𝑜𝑐). Hence, the total differential of academic share is
(4) 𝑑𝑠 = (𝑡𝑐−2)(𝑡𝑐 ∙ 𝑎𝑐)(𝑑𝑎𝑐/𝑎𝑐 − (𝑑𝑎𝑐 + 𝑑𝑜𝑐)/𝑡𝑐), after substitution from (1) and (2). Suppose dac>0, doc<0, and dtc<=0; then s increases. If dtc>0 and dac>0, then
dac>-doc and s increases, since ac<tc and dac>dac+doc. As long as dac>0 and doc<0, s increases. Similarly, s
declines as long as dac<0 and doc>0. However, s may increase or decrease when dac and doc have the same sign.

In this paper total cost is divided into two activities: academic and other. Academic cost
equals the sum of instruction, research, and public service costs as reported to NCES/IPEDS. If
academic expenditures increase and other expenditures decline, resources appear to be moving
out of other activities into academics. If academic expenditures decline and other expenditures
increase, resources appear to be moving out of academics and into other activities. The value of
these shifts can be computed by the forgoing increase/decrease in total expenditure rule.
Measuring Staff Changes. Among service industries, cost in different activities are
directly related to the number of people employed in those activities; therefore, if resources from
one activity are reallocated from that activity to another activity one expects to see employment
in the first activity decline and employment in the activity receiving new resources increase. Let
the resource reallocation hypothesis be changes in cost from one activity to another follow
changes in staffing in those activities.
After 2008, colleges and universities changed the number of staff in all classifications.
Generally, there was a break with pre 2008 staffing where institutions economized on the use of
faculty and non-professional staff while investing more in executive/managerial and professional
staff. After 2008 many of these institutions reduced their staffing ratios across the board, but cut
academic and non-professional staff more than executive/managerial and professional staff
(Martin and Hill, 2013a 2013b).
In academic staffing, I use tenure track faculty (tt), contract and part time faculty (cpt),
and FTE (ftef) faculty (the sum of tenure track, contract, and part time faculty). Budget shifts
from other activities to academics should be positively correlated with dtt and dcpt, where “d”
denotes change in the variable. For other staffing, I use executive/managerial (ex), professional
staff (pro), and nonprofessional staff (npro). Budget shifts from other activities to academics
should be negatively related to dex, dpro, and dnpro, where “d” denotes change.
The professional and nonprofessional staff classifications pose some problems, since a
subset of each classification contains people employed in support of academic activities.
However, the data does not allow one to separate nonacademic professional staff of any type by
function, as has been the case for over three decades5.
5 Howard Bowen observed that “Unfortunately, inadequacy of data has prevented extending the analysis to
the salaries of administrators and other staff, and the purchase of goods and services from outside vendors.
Therefore, any effort to present the allocation of total expenditures by recipient groups must rely on rough estimates
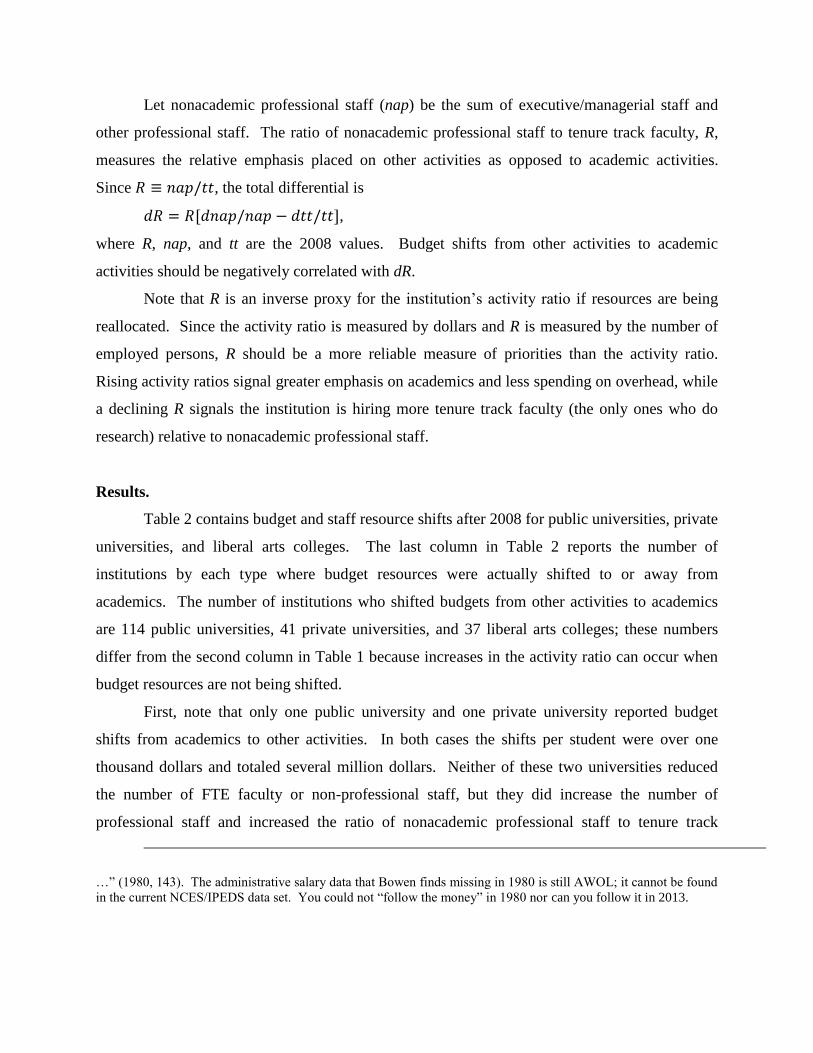
Let nonacademic professional staff (nap) be the sum of executive/managerial staff and
other professional staff. The ratio of nonacademic professional staff to tenure track faculty, R,
measures the relative emphasis placed on other activities as opposed to academic activities.
Since 𝑅 ≡ 𝑛𝑎𝑝/𝑡𝑡, the total differential is
𝑑𝑅 = 𝑅[𝑑𝑛𝑎𝑝/𝑛𝑎𝑝 − 𝑑𝑡𝑡/𝑡𝑡],
where R, nap, and tt are the 2008 values. Budget shifts from other activities to academic
activities should be negatively correlated with dR.
Note that R is an inverse proxy for the institution’s activity ratio if resources are being
reallocated. Since the activity ratio is measured by dollars and R is measured by the number of
employed persons, R should be a more reliable measure of priorities than the activity ratio.
Rising activity ratios signal greater emphasis on academics and less spending on overhead, while
a declining R signals the institution is hiring more tenure track faculty (the only ones who do
research) relative to nonacademic professional staff.
Results.
Table 2 contains budget and staff resource shifts after 2008 for public universities, private
universities, and liberal arts colleges. The last column in Table 2 reports the number of
institutions by each type where budget resources were actually shifted to or away from
academics. The number of institutions who shifted budgets from other activities to academics
are 114 public universities, 41 private universities, and 37 liberal arts colleges; these numbers
differ from the second column in Table 1 because increases in the activity ratio can occur when
budget resources are not being shifted.
First, note that only one public university and one private university reported budget
shifts from academics to other activities. In both cases the shifts per student were over one
thousand dollars and totaled several million dollars. Neither of these two universities reduced
the number of FTE faculty or non-professional staff, but they did increase the number of
professional staff and increased the ratio of nonacademic professional staff to tenure track
…” (1980, 143). The administrative salary data that Bowen finds missing in 1980 is still AWOL; it cannot be found
in the current NCES/IPEDS data set. You could not “follow the money” in 1980 nor can you follow it in 2013.

faculty. Of the 33 liberal arts colleges that shifted resources from academics to other activities,
45 percent reduced the number of FTE faculty, 52 percent reduced the number of
nonprofessional staff, 45 percent increased the number of executives/managers, 55 percent
increased the number of professional staff, and 55 percent increased the ratio of nonacademic
professional staff with respect to tenure track faculty. Overall, the budget shifts from academics
to other activities seem consistent with the reported staff changes.
This is not the case for budget shifts from other activities to academics. At public
universities 47 percent of these institutions reduced the number of FTE faculty, even though
most of their enrollments increased. At private universities, 10 percent reduced the number of
FTE faculty and at liberal arts colleges 35 percent reduced the number of FTE faculty. The
proportion of institutions that increased the number of executives/managers was 46 percent at
public universities, 63 percent at private universities, and 41 percent at liberal arts colleges. The
proportion of institutions that increased the number of other professional staff was 59 percent at
public universities, 73 percent at private universities, and 62 percent at liberal arts colleges.
Finally, the proportion of institutions reporting increases in the ratio of nonacademic professional
staff to tenure track faculty was 50 percent at public universities, 63 percent at private
universities, and 46 percent at liberal arts colleges.
At public research universities, the annual shift to academic spending totaled $5.9 billion;
the annual shift at private research universities totaled $2.6 billion; and the annual shift at liberal
arts colleges is $33.6 million. If these shifts were literal resource reallocations, it seems
improbable they could have escaped the attention of people working on these campuses. The
firing of that many people and the hiring of others could not have escaped attention.
The pattern of staff changes after 2008 is not consistent with budget shifts from other
activities to academics. Shifting resources from other activities to academics increases the
institutions activity ratio which signals constituents the institution is placing more emphasis on
instruction, research, and public service. Reducing FTE faculty, while increasing nonacademic
staff, is inconsistent with the budget signal. Finally, if the ratio of nonacademic professional
staff to tenure track faculty is increasing, it suggests less emphasis is placed on instruction,
research, and public service. Overall, the rising activity ratio seems inconsistent with the
reported staff changes.

The next step is to test regression models where the dependent variables are budget shift
values measured on a per student basis and in total and where the independent variables are staff
changes, enrollment, and shift variables for institution type. The independent variables in the
regression are:
enroll – current enrollment;
dcfpt – change in contract and part time faculty;
dftef – change in FTE faculty;
dR – change in the ratio of nonacademic professional staff to tenure track faculty;
dex – change in executive/managerial staff;
dpro – change in other professional staff;
dnpro – change in nonprofessional staff;
pubu – a zero/one dummy for public university;
priu – a zero/one dummy for private university; and
constant – regression constant.
Since FTE faculty equals the sum of tenure track, contract, and part time faculty, tenure track
faculty is the excluded faculty variable.
The results for the two regressions are reported in Table 3. In general, changes in staffing
explain very little of the variation in budget shifts as either measured on a per student basis or in
total. The only staffing variables that are significant are in the per student model, where dex and
dpro are negative (as anticipated) and significant at the .10 level. The other staff variables are
not significant in either model. Enrollment is significant in the total model; while the zero/one
dummy for private universities is significant in both models and the zero/one dummy for public
universities is significant in the per student model.
The data does not support the hypothesis that colleges and universities reallocated
resources from other activities to academics after 2008; the data is more consistent with the
hypothesis that a widespread reclassification of other activities occurred. An alternative
motivation for these reclassifications could be the adoption of new accounting standards that
coincidently caused these institutions to act simultaneously. I contacted the accounting standards
group at the National Association of College and Universities Business Officers (NACUBO)
three times and asked if an accounting change was responsible for these reporting changes:
NACUBO’s accounting standards group did not respond to any of these inquiries.

Summary and conclusions
Corporate financial reports must be certified by external auditors, they are subject to strict
regulation, and transgressions carry significant civil and criminal penalties; never the less,
corporations frequently test the limits of this regulation. While most colleges and universities
are audited, the data they provide ranking agencies, NCES/IPEDS, and the IRS are not certified
by those auditors; the reports are prepared at the discretion of the institution. The penalties for
falsifying data are normally embarrassment and damage to reputation. Like corporations,
colleges and universities can enhance their competitive position by issuing misleading data.
Further, there are precedents where colleges and universities misled the public on matters of
great import and where they provided false data.
Changes in staffing patterns are inconsistent with the hypothesis that colleges and
universities improved their efficiency by dedicating more resources to academics after 2008.
The break with the pre 2008 trends in activity ratios is most likely the result of reclassification of
existing expenditures. The only way to confirm that these shifts represent “managed” financial
reporting is by detailed audits. These audits would have to focus on account definitions pre and
post 2008.
It is likely that some reclassifications can be justified as academic expenditures; this
seems probable if the expenses are related to computer services. Other reclassifications would
be arguable, however. For example, student service professionals pursue an organized effort to
take over all “instruction” outside the class room (Fried, 1995). Benjamin Ginsburg says these
“shadow curriculums” appear at “three-fourths of the nation’s colleges” and the purpose of this
curriculum is “… the transformation of students’ values and beliefs regarding matters of race,
gender, public morality, the environment, and a variety of other political topics” (2011, 126).
Further, some economists find statistical relationships between spending on student services and
education outcomes such as retention and graduation rates (Webber and Ehrenberg, 2010). What
is clear is the inclusion/exclusion of different expenses as academic cost is a matter for open,
public debate.
Even if an open discussion of what costs to count as academic cost arrives at a consensus,
institutions are obligated to report the change in accounting standards and to provide sufficient
information for outsiders to reconstruct pro forma estimates of these expenses sufficient to

construct a consistent time series. This is particularly true for activity ratios, since they are the
accepted efficiency metric among nonprofit organizations.
Higher education institutions will face tight budget constraints for the foreseeable future.
Hence, resource reallocation is a critical question for the public and all higher education
constituents. Without transparent financial reporting, it is unlikely what needs to be preserved
will be preserved. Academic quality depends on the faculty, particularly the tenure track faculty;
therefore, the faculty must be aware of these issues and take an active and constructive role in
improving academic quality.

Table 1
Number and Percent of Institutions Increasing their Activity Ratio
Pre 2008 Post 2008 Number
Number
Public Universities 29 130 134
Private Universities 8 49 54
Liberal Arts Colleges 30 108 202
Percent % %
Public Universities 22 97 134
Private Universities 15 91 54
Liberal Arts Colleges 15 53 202

Table 2
Budget and Staff Resource Shifts after 2008
Changea in Valuesb: Decreasesc: Increasesd: Numbere
Activity Ratio Per Student Total FTE Faculty NonPro Exe/Mgr Pro Ratiof
(millions)
From Other to
Academics
Public Universities 8 $2,146 $51.4 54 89 53 67 57 114
47% 78% 46% 59% 50%
Private Universities 9 $5,424 $62.3 4 25 26 30 26 41
10% 61% 63% 73% 63%
Liberal Arts 3 $541 $0.9 13 27 15 23 17 37
35% 73% 41% 62% 46%
From Academics to
Other
Public Universities -5 -$1,059 -$7.9 0 0 0 1 1 1
Private Universities -6 -$4,012 -$43.6 0 0 0 1 1 1
Liberal Arts -4 -$651 -$10.5 15 17 15 18 18 33
45% 52% 45% 55% 55%
a Change in academic share of total cost. b Average dollar values among those reporting budget shifts to academics. c Number of institutions reporting shifts to academics who reduced FTE faculty and non-professional staff. d Number of institutions reporting shifts to academics who increased executive/managerial staff, other professional staff, and the ratio of nonacademic
professional staff to tenure track faculty. e Number of institutions reporting shifts by type. f Ratio of nonacademic professional staff to tenure track faculty.

Table 3
Regression Models
Shift per Student Total Shift
Variable Coefficient t-Value Coefficient t-Value
Enroll -4.73 -0.26 2449392 8.03*
Dcfpt 2.67 0.92 69449 1.42
Dftef -.21 -0.08 -40540 -0.88
dR -69.12 -0.73 -1414962 -0.89
Dex -2.77 -1.70** -30459 -1.11
Dpro -1.06 -1.88** -10326 -1.08
Dnpro -.38 -0.50 -12535 -0.98
Pubu 1986.03 4.36* -5523298 -0.72
Priu 4090.88 9.52* 19000000 2.62*
constant -38.49 -0.22 -4844099 -1.65
Adj R2 0.29 0.35
N 371 371
F 18.15 23.58
*Significant at the .01 level.
**Significant at the .10 level.

References
Anderson, Nick (Feb 06, 2013), “Five colleges misreported data to U.S. News, raising concerns
about rankings, reputation,” Washington Post.
Baber, William R., Daniel, Patricia L., and Roberts, Andrea A. (July 2002), ‘Compensation to
Managers of Charitable Organizations: An Empirical Study of the Role of Accounting
Measures of Program Activities.’ The Accounting Review, 77(3): 679-693.
Bowen, Howard R. (1980), The Costs of Higher Education: How much do colleges and
universities spend per student and how much should they spend?, Washington: Jossey-
Bass Publishers.
Brody, Rachel (Feb 2, 2012), “President Pamela Gann Discusses False Reporting of SAT
Scores,” Forum.
Fried, Jane (1995), Shifting Paradigms in Student Affairs: Culture, Context, Teaching, and
Learning, University Press of America, Maryland: Lanham.
Ginsberg, Benjamin (2011), The Fall of the Faculty: The Rise of the All-administrative
University and Why it Matters, Oxford University Press.
Greene, Jay P, Kisida, Brian, and Mills, Jonathan (2010), “Administrative Bloat at American
Universities: The Real Reason for High Costs in Higher Education,” The Goldwater
Institute.
Hoover, Eric (Jan 31, 2012), “Claremont McKenna Official Resigns after Falsely Reporting SAT
Scores,” The Chronicle of Higher Education.
Jaschik, Scott (Oct 3, 2012), “Debt, Jobs, Diversity and Who Gets In: A Survey of Admissions
Directors,” Inside Higher Education.
___________ (Jan 28, 2013), “Bucknell’s admission raises questions about how many colleges
are reporting false data,” Inside Higher Ed.
___________ (Apr 16, 2013), “More Fudging of SAT Averages,” Inside Higher Ed.
Martin, Robert E (2011), The College Cost Disease: Higher Cost and Lower Quality, Edward
Elgar, Ltd.: Northamption, MA.
______________ and Hill, R Carter (2013a), “Measuring Baumol and Bowen Effects in Public
Research Universities,” http://papers.ssrn.com/sol3/papers.cfm?abstract_id=2153122.

_______________ and Hill, R Carter (2013b), “Involuntary and Voluntary Cost Increases in
Private Research Universities,” http://papers.ssrn.com/sol3/papers.cfm?abstract_id=2254339.
Stecklow, Steve (1995), ‘Cheat Sheets: Colleges Inflate SATs and Graduation Rates in
Popular Guidebook,’ Wall Street Journal, April 5, A1.
Webber, Douglas A and Ehrenberg, Ronald G (2010), “Do expenditures other than instructional
expenditures affect graduation and persistence rates in American higher education?”
Economics of Education Review, 29(6), 947-958.