Embed Size (px)
Citation preview

Do Borrowers Benefit from Bank Bailouts
The Effects of TARP on Loan Contract Terms
Allen N Berger
Darla Moore School of Business University of South Carolina
Wharton Financial Institutions Center
European Banking Center
abergermoorescedu
Tanakorn Makaew
Securities and Exchange Commission (SEC)
makaewtsecgov
Raluca A Roman
Federal Reserve Bank of Kansas City
ralucaromankcfrborg
September 2016
Abstract
We study whether borrowers benefit from bank bailouts using the US Troubled Asset Relief
Program (TARP) Using loan-level data and difference-in-difference methodology we find more favorable
loan contract terms ndash spreads amounts maturities collateral and covenants ndash for borrowers from bailed-
out banks suggesting increased credit supply at the intensive margin Findings are robust to dealing with
potential endogeneity and other checks Our results indicate that riskier borrowers benefit most consistent
with increased exploitation of moral hazard Terms improve more for large and publicly-listed borrowers
suggesting bailouts may provide less assistance for financially-constrained firms Benefits also flow to both
relationship and non-relationship borrowers
JEL Classification Codes G01 G21 G28
Keywords Bailouts TARP Bank Loans Financial Crisis Moral Hazard Financial Constraints
Relationship Lending
The Securities and Exchange Commission as a matter of policy disclaims responsibility for any private publications
or statements by any of its employees The views expressed herein are those of the authors and do not necessarily
reflect the views of the Commission or of the authorsrsquo colleagues on the staff of the Commission Also the views
expressed herein are those of the authors and do not necessarily reflect the views of the Federal Reserve Bank of
Kansas City or the Federal Reserve System The authors thank Dean Amel Mitchell Berlin Tara Bhandari Natasha
Burns Indraneel Chakraborty Nick Coleman Troy Davig Taeyoung Doh Andrew Foerster Scott Frame Bernhard
Ganglmair Todd Gormley Bjorn Imbierowicz Michael King Kris Gerardi Rachita Gullapalli Vladimir Ivanov
Anzhela Knyazeva Diana Knyazeva Mattias Nilsson Chuck Morris Ned Prescott Jordan Rappaport Rich Rosen
Natalya Schenck Rajdeep Sengupta Ioannis Spyridopoulos Anjan Thakor Larry Wall Jim Wilkinson Krzysztof
Wozniak Helen Zhang and participants at the presentations at the 2016 ASSA Annual Meetings 2016 FIRS Annual
Meetings 2015 Federal Reserve Bank of Kansas City Research Seminar 2015 Federal Reserve System Committee
Meetings on Financial Structure and Regulation 2015 Northern Financial Association Meetings 2015 Financial
Management Association Meetings 2015 Southern Finance Association Meetings and the SECrsquos Empirical Corporate
Finance Research Group for useful comments and suggestions The authors thank Lamont Black Christa Bouwman
and Jennifer Dlugosz for data on Discount Window (DW) and Term Auction Facility (TAF) programs
1
1 Introduction
Do bank bailouts result in net benefits or costs for the borrowers of bailed-out banks From a policy
perspective whether or not bailouts are worthwhile depends on their many consequences one of which is
whether the borrowers from the recipient banks benefit Many of the other consequences such as changes
in real economic conditions competitive advantages conferred and systemic risk have been covered
elsewhere in the literature but there is very little evidence on how bailouts affect borrowers This is an
important research question because treatment of loan customers directly affects their financial conditions
which drive economic recovery and growth The event study evidence that does exist on this question is
contradictory and only covers borrowers with prior relationships with these banks
We address this question by examining the effects of the US Troubled Asset Relief Program
(TARP) bailout during the recent financial crisis on loan contract terms to borrowers of bailed-out banks
Using a difference-in-difference methodology we find that bailed-out banks offer more favorable price and
non-price loan contract terms to borrowers Conditional on borrower and bank characteristics loan type
industry and time recipient banks granted loans with lower spreads larger amounts longer maturities less
frequency of collateral and less restrictive covenants This is consistent with an increase in credit supply at
the intensive margin suggesting that the recipient banksrsquo borrowers benefited from the TARP program
Our findings are statistically and economically significant and are robust to dealing with potential
endogeneity issues and other checks
Our approach departs from the existing literature in a number of important respects First whereas
most prior bailout research is at the bank or market level we use loan-level data and examine the effects of
TARP from the perspective of the borrowers
Second unlike most of the bank- or market-level studies we are able to control for borrower
characteristics This is important because certain types of loan customers may self-select to borrow from
TARP banks or non-TARP banks and because these characteristics are key determinants of loan contract
terms
Third to our knowledge we are the first to use multidimensional information about bank loans
2
examining the effects of TARP on five key loan contract terms and find that all five contract terms become
more favorable for borrowers
Fourth analysis of loan contract terms across different types of borrowers allows us to address
other open questions in the literature including whether bank bailouts exacerbate moral hazard incentives
in a more definitive fashion than the existing work We find that improvements in loan contract terms are
greater for riskier borrowers than for safer borrowers consistent with an increase in the exploitation of
moral hazard incentives We also find that improvements in loan contract terms are greater for less-
financially-constrained borrowers than for more-financially-constrained borrowers Specifically large and
publicly-listed borrowers experienced significantly greater improvements in contract terms than small and
private borrowers respectively due to TARP This suggests that the bailout may not provide assistance to
borrowers that need capital the most We also find that both relationship and non-relationship borrowers
experienced improvements in loan credit terms due to TARP This is consistent with the notion that TARP
banks used bailout funds to reach out to new borrowers as well as grant more favorable terms to existing
clients This finding also suggests that studies that focus only on borrowers with prior relationship with
TARP banks may overlook some benefits of the program
Our paper contributes to several strands of literature We add to the literature on the effects of
bailouts on bank borrowers Two event studies look at the valuation effects of TARP on relationship
customers and document opposing results Norden Roosenboom and Wang (2013) find that TARP led to
a significantly positive impact on relationship firmsrsquo stock returns around the time of TARP capital
injections In contrast Lin Liu and Srinivasan (2014) find that relationships borrowers suffered significant
valuation losses around the time of TARP approval announcements
Our work adds to this research in three main ways First the valuation changes in these studies may
be due to expectations of better or worse direct treatment of the borrowers by TARP banks but it is
unknown from these studies alone whether these expectations were met in practice In contrast we examine
actual changes in borrower treatment In effect the event studies may reveal a noisy signal about borrower
treatment while we measure it more directly
3
Second stock returns around TARP dates may partially be driven by other indirect factors that are
not specifically related to the treatment of the loan customers (eg expectations of changes in local
economic conditions) but are correlated with bailouts of their banks As discussed below the TARP
selection criteria targeted ldquohealthy viable institutionsrdquo which may mean that TARP was more often given
to banks in markets with improving local conditions which in turn may be related to positive stock market
returns for their relationship borrowers Unlike event studies in which all control variables must be
measured before or on TARP announcement dates we are able to control for borrower characteristics at
the time the loans are issued and examine the actual effects of TARP on the borrowersrsquo loan contract terms
Controlling for borrower characteristics at the time of loan issuance is crucial for alleviating the
identification problem This is because changes in local economic conditions and borrower characteristics
between TARP initiation and the time when the loan is issued may be correlated with TARP acceptance
but not caused by TARP itself
Third event studies are by construction limited to borrowers with existing relationships with the
banks and cannot measure the effects of TARP on non-relationship borrowers In contrast we are able to
measure the latter effects and in fact find that non-relationship borrowers benefited slightly more than
relationship borrowers from the bailout program
We also add to the studies that investigate the effects of bank bailouts on credit supply A number
of studies examine the effects of bailouts on the quantity of credit ie the credit supply at the extensive
margin and the results of these studies are not uniform Li (2013) Puddu and Walchli (2013) Berger and
Roman (forthcoming) and Chu Zhang and Zhao (2016) find that TARP banks expanded their credit
supply Black and Hazelwood (2013) find mixed results Lin Liu and Srinivasan (2014) find a decline in
credit supply and Bassett and Demiralp (2014) and Duchin and Sosyura (2014) do not find any evidence
of a change in credit supply We are able to extend the research to cover the intensive margin or how the
borrowers that receive credit are treated based on five loan contract terms ndash loan spread amount maturity
collateral and covenant intensity This provides a fuller picture of the change in credit supply and whether
borrowers benefited from the program
4
Our paper also supplements the bank bailout and moral hazard literature Bailouts might increase
moral hazard incentives for banks to take more risk by raising expectations of future bailouts (eg Acharya
and Yorulmazer 2007 Kashyap Rajan and Stein 2008) Alternatively bailouts might reduce moral
hazard incentives because of the additional bank capital or because of extra explicit or implicit government
restrictions on these institutions (eg Duchin and Sosyura 2014 Berger and Roman 2015 forthcoming)
Recent papers that empirically investigate this issue find large TARP banks tend to grant riskier loans after
the bailouts (Black and Hazelwood 20131 Duchin and Sosyura 2014) This evidence is generally viewed
as support for the increased exploitation of moral hazard incentives 2
However an increase in average risk of borrowers by TARP banks is not a sufficient condition for
increased exploitation of moral hazard An alternative explanation is that TARP increases the supply of
credit overall and TARP banks dip deeper into the pool of riskier borrowers to lend more Our analysis of
loan contract terms conditional on borrower risk and other characteristics is a novel approach to test the
moral hazard hypothesis Our finding that the preponderance of improvements in loan contract terms due
to TARP goes to riskier borrowers confirms an increase in the exploitation of moral hazard incentives
In addition we contribute to the literature on the effects of bailouts on banksrsquo market power and
valuations Berger and Roman (2015) find that TARP gave recipients competitive advantages and increased
both their market shares and market power3 Others find positive effects of TARP on banksrsquo valuations
(eg Veronesi and Zingales 2010 Kim and Stock 2012 Liu Kolari Tippens and Fraser 2013 Ng
Vasvari and Wittenberg-Moerman 2013) While these papers find that TARP benefited the recipient
banks our paper suggests that these banks do not extract all the rents Their borrowers also received
substantially better treatment as a consequence of TARP4
1 Black and Hazelwood (2013) find a decrease in risk-taking for small recipient banks but we focus here primarily on
large banks because lenders in DealScan dataset are mainly large banks 2 One study that takes an alternative approach finds that TARP reduced contributions to systemic risk of recipient
banks and this occurred more for banks that were safer ex ante suggesting reduced exploitation of moral hazard
incentives (Berger Roman and Sedunov 2016) 3 Koetter and Noth (2015) also find competitive distortions as a result of TARP for unsupported banks 4 For completeness we note that other TARP studies focus on determinants of TARP program entry and exit decisions
(eg Bayazitova and Shivdasani 2012 Duchin and Sosyura 2012 Wilson and Wu 2012 Cornett Li and Tehranian
5
Finally our paper adds to the broader literature on bank loan contracting There are papers that
focus on loan amounts5 spreads6 loan maturity7 collateral8 and loan covenants9 Most papers focus on one
or a few loan contract terms whereas we investigate all five10 As well none of this literature investigates
how loan contract terms are affected by bank bailouts the focus of this study We find that all five contract
terms become more favorable after TARP
2 Main Hypotheses
It is unclear ex ante whether bank bailouts benefit borrowers There are a number of channels
through which bailouts would improve the treatment of borrowers and others through which the treatment
would worsen These channels are used in the literature to motivate changes in competitive conditions for
TARP banks (Berger and Roman 2015) changes in economic conditions in the local markets in which
these banks operate (Berger and Roman forthcoming) and changes in systemic risk (Berger Roman and
Sedunov 2016) but they also may affect the treatment of borrowers through loan contract terms
2013 Li 2013 Duchin and Sosyura 2014) Other related literature looks at the effects of other government
interventions on bank risk-taking lending and liquidity creation using data from both the US and other countries
(eg Brandao-Marques Correa and Sapriza 2012 Dam and Koetter 2012 Hryckiewicz 2012 Berger Bouwman
Kick and Schaeck 2016 Calderon and Schaeck forthcoming) and finds either reductions or increases in risk-taking
and reductions in credit growth and liquidity creation
5 Papers focusing on loan amounts include Sufi (2007) Ivashina and Scharfstein (2010ab) and Bharath Dahiya
Saunders and Srinivasan (2011) 6 Papers focusing on loan spreads include Barry and Brown (1984) Petersen and Rajan (1994) Berger and Udell
(1995) Blackwell Noland and Winters (1998) Berlin and Mester (1999) Pittman and Fortin (2004) Mazumdar and
Sengupta (2005) Ivashina (2009) and Berger Makaew and Turk-Ariss (2016) 7 Papers focusing on loan maturity include Flannery (1986) Diamond (1991) Barclay and Smith (1995) Rajan and
Winton (1995) Guedes and Opler (1996) Stohs and Mauer (1996) Scherr and Hulburt (2001) Berger Espinosa-
Vega Frame and Miller (2005) and Ortiz-Molina and Penas (2008) 8 Papers focusing on loan collateral are Bester (1985) Chan and Kanatas (1985) Stultz and Johnson (1985) Besanko
and Thakor (1987) Berger and Udell (19901995) Boot Thakor and Udell (1991) Rajan and Winton (1995)
Jimenez Salas and Saurina (2006) and Berger Frame and Ioannidou (2011) 9 Papers focusing on loan covenants and covenant violation include Smith and Warner (1979) Beneish and Press
(1993) Chen and Wei (1993) Smith (1993) Sweeney (1994) Beneish and Press (1995) Chava and Roberts (2008)
Nini Smith and Sufi (2009) Roberts and Sufi (2009a) Sufi (2009) Murfin (2012) Freudenberg Imbierowicz
Saunders and Steffen (2013) and Bradley and Roberts (2015) 10 A few papers examine the impact of various factors on more than one loan contract term These include Berger and
Udell (1995) Strahan (1999) Benmelech Garmaise and Moskowitz (2005) Qian and Strahan (2007) Bharath
Sunder and Sunder (2008) Graham Li and Qui (2008) Bae and Goyal (2009) Chava Livdan and Purnanandam
(2009) Bharath Dahiya Saunders and Srinivasan (2011) Hasan Hoi and Zhang (2014) and Chakraborty
Goldstein and MacKinlay (2016)
6
The following channels predict benefits for borrowers from recipient banks in the form of more
favorable loan contract terms
Channels predicting more favorable treatment of borrowers in loan contract terms There are
several reasons why borrowers from bailed-out banks may experience more favorable loan contract
terms Recipient banks may use the capital infusions to compete more aggressively offering more
favorable credit terms (predation channel) It is also possible that recipient banks may be perceived
as riskier requiring them to offer borrowers more favorable terms to compensate for the risk that
future credit and other services may be withdrawn (stigma channel) Finally bailout funds may be
relatively cheap resulting in recipient banks offering more favorable credit terms because of their
lower marginal costs (cost advantage channel)
In contrast other channels predict less favorable loan contract terms for borrowers
Channels predicting less favorable treatment of borrowers in loan contract terms There are
several reasons why recipient bank borrowers may experience less favorable loan contract terms
The extra capital from the bailout may increase charter value andor allow for a ldquoquiet liferdquo
decreasing incentives to compete more aggressively resulting in less favorable credit terms (charter
value quiet life channel) It is also possible that recipient banks may be perceived as safer due to
bailouts For TARP in particular the recipient banks may be safer due to TARP criteria which
targeted ldquohealthy viable institutionsrdquo Borrowers may accept less favorable contract terms because
recipient banks are less likely to fail or become financially distressed (safety channel) Finally
bailout funds may be relatively expensive resulting in banks offering less favorable credit terms
due to higher marginal costs (cost disadvantage channel)11
These channels imply two opposing hypotheses for the effects of bailouts on contract terms to
recipient banksrsquo borrowers
11 The safety channel is the opposite of the stigma channel and the cost disadvantage channel is the opposite of the
cost advantage channel so they never hold for the same bank at the same time The predation and charter valuequiet
life channels may also be regarded as opposites because they have opposing implications
7
H1a Bailouts result in more favorable loan terms for the borrowers of recipient banks
H1b Bailouts result in less favorable loan terms for the borrowers of recipient banks
The hypotheses are not mutually exclusive ndash each may apply to different sets of banks and
borrowers Our empirical analysis tests which of these hypotheses empirically dominates the other overall
We test empirically the net impact of bailouts on the five loan contract terms to understand which of these
hypotheses finds stronger empirical support Our ancillary hypotheses about cross-sectional differences
across various types of borrowers ndash safer versus riskier borrowers more or less financial constrained and
relationship versus non-relationship borrowers ndash are discussed below in Section 6
3 Data and Methodology
31 Data and Sample
We use Loan Pricing Corporationrsquos (LPCrsquos) DealScan dataset on corporate loans which has
detailed information on deal characteristics for corporate and middle market commercial loans12 We match
these data with the Call Report for commercial banks TARP transactions data and TARP recipients list
from the Treasuryrsquos website and borrower data from Compustat
The basic unit of analysis is a loan also referred to as a facility or tranche in DealScan Loans are
grouped into deals so a deal may have one or more loans While each loan has only one borrower loans
can have multiple lenders due to syndication in which case a group of banks andor other financial
institutions make a loan jointly to a borrower The DealScan database reports the roles of lenders in each
facility We consider only the lead lenders in our analysis since these are typically the banks making the
loan decisions and setting the contract terms (Bharath Dahiya Saunders and Srinivasan 2009)13 We
follow Ivashina (2009) to identify the lead bank of a facility If a lender is denoted as the ldquoadministrative
12 Although lenders in this dataset include non-bank financial intermediaries such as hedge funds we focus on
regulated commercial banks operating in the US market as this will enable us to control for the financial condition
of lenders using Call Report data throughout our analysis Commercial banks dominate the syndicated loan market in
the US 13 In all our results we focus on the lead lender In unreported results we find that benefits in loan terms are pertinent
for lenders with both low and high lender shares with slightly better improvements when the lender has a higher share
8
agentrdquo it is defined as the lead bank If no lender is denoted as the ldquoadministrative agentrdquo we define a
lender who is denoted as the ldquoagentrdquo ldquoarrangerrdquo ldquobook-runnerrdquo ldquolead arrangerrdquo ldquolead bankrdquo or ldquolead
managerrdquo as the lead bank In the case of multiple lead banks we keep the one with the largest assets14
For each DealScan lender we manually match lender names to the Call Report data using lender
name location and dates of operation for the period 2005Q1 to 2012Q4 using the National Information
Center (NIC) website Call Report data contains balance sheet information for all US commercial banks
Given that the majority of our TARP recipients are bank holding companies (BHCs) we aggregate Call
Report data of all the banks in each BHC at the holding company level This aggregation is done for all
bank-level variables If the commercial bank is independent we keep the data for the commercial bank For
convenience we use the term ldquobankrdquo or ldquolenderrdquo to mean either type of entity We exclude firm-quarter
observations in the Call Report data that do not refer to commercial banks (RSSD9331 different from 1)
or have missing or incomplete financial data for total assets and common equity To avoid distortions for
the Equity to GTA ratio for all observations with equity less than 1 of gross total assets (GTA) we
replace equity with 1 of GTA (as in Berger and Bouwman 2013)15 In addition we normalize all financial
variables using the seasonally adjusted GDP deflator to be in real 2012Q4 dollars Bank characteristics are
obtained from the Call Report as of the calendar quarter immediately prior to the deal activation date
The TARP bailout transactions data for the period October 2008 to December 2009 (when TARP
money was distributed) and TARP recipients list are obtained from the Treasuryrsquos website16 We match by
name and location the institutions in the list with their corresponding RSSD9001 (Call Report ID) where
available The TARP report has 756 transactions included for 709 unique institutions (572 BHCs 87
commercial banks and 51 Savings and Loans (SampLs) and other thrifts) since some institutions have
multiple transactions ndash some received more than one TARP capital purchase and some made one or more
14 Our main results are robust to keeping all lead banks in the sample 15 Gross total assets (GTA) equals total assets plus the allowance for loan and lease losses and the allocated transfer
risk reserve (a reserve for certain foreign loans) Total assets on Call Reports deduct these two reserves which are
held to cover potential credit losses We add these reserves back to measure the full value of the assets financed 16 httpwwwtreasurygovinitiativesfinancial-stabilityPagesdefaultaspx
9
repayments17 We exclude thrifts because datasets are not comparable with banks and these institutions
compete in different ways than commercial banks and provide few corporate and middle market
commercial loans We merge the Call Report data with the TARP recipients list
We match DealScan to Compustat to obtain borrower financial information Compustat contains
accounting information on publicly traded and OTC US companies For each facility in DealScan during
our sample window (2005Q1- 2012Q4) we match the borrowers to Compustat via the GVKEY identifier
using the link file of Chava and Roberts (2008) updated up to August 2012 to obtain borrower information
We also extract the primary SIC code for the borrowers from Compustat and exclude all loans to financial
services firms (SIC codes between 6000 and 6999) and loans to non-US firms as in Bharath Dahiya
Saunders and Srinivasan (2009) Borrower characteristics are obtained from the Compustat database as of
the fiscal quarter ending immediately prior to a deal activation date
We use data from several other sources for additional control variables and instruments FDIC
Summary of Deposits House of Representatives website Missouri Census Data Center and the Center for
Responsible Politics Our final regression sample contains 5973 loan-firm-bank observations with
complete information on firm and bank characteristics
32 Econometric Methodology
We use a difference-in-difference (DID) approach A DID estimator is commonly used in the
program evaluation literature (eg Meyer 1995) to compare a treatment group to a control group before
and after treatment Recently it has been used in the banking literature (eg Beck Levine and Levkov
2010 Gilje 2012 Schaeck Cihak Maehler and Stolz 2012 Berger Kick and Schaeck 2014 Duchin
and Sosyura 2014 Berger and Roman 2015 forthcoming Berger Roman and Sedunov 2016) In our
case the treated group consists of loans from banks that received TARP funds and the control group
17 A few special cases are resolved as follows For Union First Market Bancshares Corporation (First Market Bank
FSB) located in Bowling Green VA we include the RSSD9001 of the branch of the commercial bank First Market
Bank because this is the institution located in Bowling Green VA In two other cases where MampAs occurred (the
bank was acquired by another BHC according to the National Information Center (NIC)) and TARP money were
received by the unconsolidated institution we included the RSSD9001 of this unconsolidated institution
10
consists of loans from other banks An advantage of this approach is that by analyzing the time difference
of the group differences the DID estimator accounts for omitted factors that affect treated and untreated
groups alike
The DID regression model has the following form for loan i to borrower j from bank b at time t
(1) Yijbt = β1 TARP RECIPIENTb + β 2 POST TARPt x TARP RECIPIENTb +
+ β 3 BORROWER CHARACTERISTICS jt-1 + β4 BORROWER RATING DUMMIESjt-1 +
+ β5 BANK CHARACTERISTICS bt-1 + β 6 LOAN TYPE DUMMIESi +
+ β 7 INDUSTRY FIXED EFFECTSj + β 8 YEAR FIXED EFFECTS t+ Ɛijbt
Y is one of the five loan contract terms spread amount maturity collateral and covenant intensity index
TARP RECIPIENT is a dummy which takes a value of 1 if the bank was provided TARP capital support
POST TARP is a dummy equal to one in 2009-2012 the period after the TARP program started (following
Duchin and Sosyura 2014 but considering a longer period) POST TARP does not appear by itself on the
right hand side of the equation because it would be perfectly collinear with the time fixed effects POST
TARP x TARP RECIPIENT is the DID term and captures the effect of the treatment (TARP) after it is
implemented Positive coefficients on the DID terms in the loan amount and maturity equations or negative
coefficients on the DID terms in the spread collateral and covenant intensity index would show favorable
changes in loan contract terms for firms that received loans from TARP banks and vice-versa We include
also controls for the borrower BORROWER CHARACTERISTICS BORROWER RATING DUMMIES and
INDUSTRY FIXED EFFECTS (2-digit SIC) BANK CHARACTERISTICS (bank control variables other than
TARP) LOAN TYPE DUMMIES and YEAR FIXED EFFECTS Ɛ represents an error term All variables
are defined more precisely in Section 33 and Table 1
33 Variables and Summary Statistics
Table 1 shows variable descriptions and summary statistics for the full sample We present means
medians standard deviations and 25th and 75th percentiles for the variables used in our analyses
Main dependent variables
11
For dependent variables we consider five loan contract terms LOANSPREAD is the loan spread
or All-in-Spread-Drawn (in bps) the interest rate spread over LIBOR plus one time fees on the drawn
portion of the loan18 LOG (LOAN SIZE) is the natural logarithm of the amount of the loan LOG (LOAN
MATURITY) is the natural logarithm of the maturity of the loan in months COLLATERAL is a dummy
equal to one if the loan is secured COV_INTENSITY_INDEX is the covenant intensity index We follow
Bradley and Roberts (2015) and track the total number of covenants included in the loan agreement and
create a restrictiveness of the covenants index ranging from 0 to 6 More specifically this is calculated as
the sum of six covenant indicators (dividend restriction asset sales sweep equity issuance sweep debt
issuance sweep collateral and more than two financial covenants) The index consists primarily of
covenants that restrict borrower actions or provide lendersrsquo rights that are conditioned on adverse future
events19
Table 1 shows that the average loan in our sample has LOANSPREAD of 187991 basis points over
LIBOR LOG (LOANSIZE) of 19210 (mean loan amount is $586 million) LOG (LOANMATURITY) of
3816 (mean loan maturity is 50370 months) COLLATERAL is pledged on 473 of the loans and the
average covenant intensity index (COV_INTENSITY_INDEX) is 2079
Main independent variables
As described above our main TARP variables for the regression analysis are TARP RECIPIENT
a dummy equal to one if the bank was provided TARP capital support POST TARP is a dummy equal to
one in 2009-2012 and POST TARP x TARP RECIPIENT the DID term which captures the effect of the
treatment (TARP) on the treated (TARP recipients) compared to the untreated (non-TARP banks) after
treatment As noted above POST TARP is not included without the interaction term because it would be
18 For loans not based on LIBOR DealScan converts the spread into LIBOR terms by adding or subtracting a
differential which is adjusted periodically 19 Sweeps are prepayment covenants that mandate early retirement of the loan conditional on an event such as a
security issuance or asset sale They can be equity debt and asset sweeps Sweeps are stated as percentages and
correspond to the fraction of the loan that must be repaid in the event of a violation of the covenant For example a
contract containing a 50 asset sweep implies that if the firm sells more than a certain dollar amount of its assets it
must repay 50 of the principal value of the loan Asset sweeps are the most popular prepayment restriction
12
perfectly collinear with the time fixed effects The table also shows LOG (1+Bailout Amount) which is
used below as an alternative measure for TARP support
Control variables
Turning to controls we first account for borrower characteristics We include BORROWER SIZE
the logarithm of book value of assets of the borrower as reported in Compustat MARKET-TO-BOOK the
market value of equity scaled by book value of equity LEVERAGE the ratio of book value of total debt
to book value of assets CASH FLOW VOLATILITY the standard deviation of the previous 12 quarterly
cash flows where cash flow is calculated as income before extraordinary items plus depreciation and
amortization divided by total assets PROFITABILITY the ratio of Earnings Before Interest Taxes
Depreciation and Amortization (EBITDA) to Sales TANGIBILITY the ratio of Net Property Plant and
Equipment (NPPE) to Total Assets CASH HOLDINGS RATIO the ratio of cash and marketable securities
divided by total assets and Borrower SampP Credit Rating dummies For the latter variables we use the long-
term issuer credit ratings compiled by Standard amp Poorrsquos (SampP) and create dummies for each of the ratings
and one category for the those unrated (AAA AA A BBB BB B CCC or below Unrated) We also include
borrower industry fixed effects based on 2-digit SIC codes (INDUSTRY FIXED EFFECTS)20 to control for
any industry patterns in the loan contracts to borrowers
We next control for bank characteristics including proxies for CAMELS (financial criteria used by
regulators for evaluating banks) following Duchin and Sosyura (2014) CAPITAL ADEQUACY (ratio of
equity capital to GTA) ASSET QUALITY (fraction of nonperforming loans to total loans) MANAGEMENT
QUALITY (the ratio of overhead expenses to GTA) EARNINGS (return on assets (ROA) ratio of the
annualized net income to GTA) LIQUIDITY (ratio of cash to total deposits) SENSITIVITY TO MARKET
RISK (the ratio of the absolute difference (gap) between short-term assets and short-term liabilities to GTA)
We also include other bank characteristics following Bayazitova and Shivdasani (2012) Berger and
20 In Section 56 concerning additional robustness tests we also show results using 2-digit NAICS codes and Fama-
French 49 industries In unreported results we also tried 3-digit SIC 3-digit NAICS codes and Fama-French 12
industries and results are robust to all these alternative industry fixed effects
13
Bouwman (2013) Duchin and Sosyura (2014) Berger Bouwman Kick and Schaeck (2016) Berger and
Roman (2015 forthcoming) Berger Roman and Sedunov 2016) BANK SIZE logarithm of gross total
assets (GTA) HHI DEPOSITS local deposit concentration PERCENT METROPOLITAN percent of bank
deposits in metropolitan areas (Metropolitan Statistical Areas (MSAs) or New England County
Metropolitan Areas (NECMAs)) FEE INCOME ratio of non-interest income to total income
DIVERSIFICATION measure of diversification across sources of income 1 ndash |(Net Interest Income ndash Other
Operating Income)(Total Operating Income)| following Laeven and Levine (2007) DWTAF dummy if a
bank received Discount Window (DW) andor Term Auction Facility (TAF) funding during the crisis21
We also include LOAN TYPE DUMMIES for each of the categories term loans revolvers and
other loans to control for any patterns in loan types TERM LOANS is defined as a dummy equal to one if
the loan type in LPC DealScan is any of the following Term Loan Term Loan A Term Loan B Term
Loan C Term Loan D Term Loan E Term Loan F Term Loan G Term Loan H Term Loan I or Delay
Draw Term Loan Similarly REVOLVERS are defined as a dummy equal to one if the loan type in DealScan
is any of the following two categories RevolverLine lt 1 Yr or RevolverLine ge 1 Yr We also create a
dummy OTHER LOANS which comprises of any other loan types that do not fit in the first two categories
Finally we include YEAR FIXED EFFECTS to control for temporal patterns in the loan contracts
4 Main Results
Table 2 shows our main results for the estimations of equation (1) We find that the TARP bailout
led to more favorable loan contract terms in all five dimensions analyzed (columns 1-5) Conditional on
borrower characteristics borrower rating dummies bank characteristics loan type and time we find that
recipient banks tended to grant loans with lower spreads larger amounts longer maturities less frequency
of collateral and less restrictive covenants and all are statistically significant
These results are also economically significant The coefficient on the DID term of -41974 in the
21 Berger Black Bouwman and Dlugosz (2016) find that banks that received discount window and TAF funds
increased their lending Data on these programs during the crisis were made public due to the Freedom of Information
Act (FOIA) requests and a provision of the Dodd-Frank Act
14
loan spread equation suggest that TARP results in a decrease in the loan spread by about 42 basis points22
The DID term of 0257 in the loan amount equation suggests that TARP results in an increase in loan
amount by approximately one-quarter The DID term of 0149 in the maturity equation suggests that TARP
results in an increase in the loan maturity by almost one-fifth The DID term of -0083 in the collateral
equation suggests that TARP results in a decrease in the likelihood of collateral by about 8 percentage
points The DID term of -0535 in the covenant intensity equation suggests that TARP results in a decrease
in the intensity of the covenant index on the loan by about one-fourth from its mean of 2079 Thus TARP
results in statistically and economically significant improvements in all five loan contract terms consistent
with the empirical dominance of Hypothesis H1a over H1b
Turning to the roles of borrower characteristics on loan contract terms BORROWER_SIZE is
positively related to loan amount and maturity and negatively related to loan spread collateral and covenant
intensity As expected larger borrowers tend to receive more favorable loan contract terms larger loans
with lower spreads longer maturity lower frequency of collateral and less restrictive covenants Borrower
MARKET-TO-BOOK generally does not significantly affect loan contract terms Four of the five
coefficients are statistically insignificant and the coefficient on loan amount is statistically significant but
very small (a one standard deviation in the market-to-book ratio produces an average decrease in the loan
amount of 0007) Borrower LEVERAGE makes all of the loan contract terms less favorable for the
borrowers consistent with expectations that more highly leveraged borrowers are riskier Higher leverage
significantly reduces loan amount and maturity and increases loan spread collateral and covenant
intensity As expected borrower PROFITABILITY favorably affects loan contract terms It increases loan
amount and maturity and negatively impacts loan spread collateral and covenant intensity Borrower
TANGIBILITY is not always significant but has negative effects on collateral and covenant intensity terms
consistent with the idea that tangible assets can reduce opaqueness problems may be used as collateral and
22 Researchers often include other loan contract terms in the loan spread regression model on the assumption that loan
spreads are set last Our loan spread results are robust to including these other loan terms in the regression However
we prefer to exclude these other potentially endogenous loan contract terms from the main model Similar controls
would not be appropriate for the other contract terms as it is not reasonable to assume that they are set last
15
may enable firms to be profitable and generate cash23 Borrower CASH FLOW VOLATILITY is mostly
insignificant but has a small positive impact on the loan amount Higher borrower CASH HOLDINGS
RATIO yields mostly unfavorable contract terms ndash reduced loan amount and maturity and increased loan
spread and collateral The effect on covenant intensity is insignificant It may be the case that that riskier
borrowers hold more cash due to the precautionary motive (they are less sure of future
financing) Therefore firms with higher cash ratios tend to receive less favorable loan contract terms
Finally the seven dummies for borrower ratings (BORROWER RATING DUMMIES) are included in all the
regressions but are not reported in the tables for the purpose of brevity Not surprisingly the better-rated
borrowers receive substantially better loan contract terms relative to the poorly-rated and unrated ones For
example in the loan spread regressions the estimated coefficients on borrower dummies are -65859 -
69069 -54387 -36390 7377 46479 and 92346 for an SampP rating of AAA AA A BBB BB B and
CCC or below-rated borrowers (all relative to the unrated category) respectively and they are all but one
statistically significant at the 1 level
In sum borrowers from TARP recipients received more favorable loan contract terms in all five
dimensions consistent with the empirical dominance of Hypothesis H1a over H1b The coefficients on
borrower characteristics are consistent with the expectation that safer borrowers (eg larger less levered
and more profitable borrowers) tend to receive more favorable loan contract terms
5 Robustness Checks
In this section we provide a number of robustness tests Unless noted otherwise we include all
control variables from the main regressions in these tests but they are not shown for brevity
51 Instrumental Variable (IV) Analysis
We first address the potential endogeneity of our TARP Recipient variables which could bias our
findings For example TARP capital might be more often provided to the strongest banks which may be
23 Himmelberg and Morgan (1995) find that tangible assets reduce firm opaqueness and thereby increase a firmrsquos
access to external capital Strahan (1999) finds that firms with less tangible assets can face more restrictive loan
contracts
16
more likely to provide favorable terms to borrowers yielding a spurious relationship To deal with this we
employ an instrumental variable (IV) analysis following Li (2013) Duchin and Sosyura (2014) Berger and
Roman (2015 forthcoming) and Berger Roman and Sedunov (2016)
Prior research on TARP finds that a bankrsquos political connections can affect the bankrsquos probability
of receiving TARP funds Following this research we use SUBCOMMITEES ON FINANCIAL
INSTITUTIONS OR CAPITAL MARKETS as an instrument for the TARP RECIPIENT variable This is a
dummy which takes a value of 1 if a firm is headquartered in a district of a House member who served on
the Financial Institutions Subcommittee or the Capital Markets Subcommittee of the House Financial
Services Committee in 2008 or 200924 These subcommittees played a direct role in the development of the
Emergency Economic Stabilization Act (EESA) and were charged with preparing voting recommendations
for Congress on authorizing and expanding TARP Members of these subcommittees were shown to arrange
meetings with the banks write letters to regulators and write provisions into EESA to help particular firms
While these arguments indicate that SUBCOMMITEES ON FINANCIAL INSTITUTIONS OR CAPITAL
MARKETS should be positively related to TARP decisions the distribution of committee assignments are
determined by the House leadership which is unlikely to be under the control of individual banks
Because the potentially endogenous explanatory variable is binary and we need the instrument to
predict treatment we employ a dummy endogenous variable model and follow a three-step approach as
suggested in section 1841 of Wooldridge (2002) For the first stage we use a probit model in which we
regress the TARP RECIPIENT dummy on the political instrument and the control variables from the main
regression model for predicting the probability of receiving TARP25 We then use the predicted probability
obtained from the first stage as an instrument for the second stage We instrument our TARP RECIPIENT
24 We use the MABLEGeocorr2k software on the Missouri Census Data Center website to match banks with
congressional districts using the zip codes of their headquarters The final regression sample for this test is slightly
smaller than the main regression sample This is due to some of the banks not being able to be mapped into a
congressional district (either due to an invalid headquarters zipcode or because we could not match it to a
congressional district) a problem reported also by Li (2013) 25 In unreported tests we also tried excluding SIC fixed effects from the probit estimation to mitigate potential
incidental parameters and inconsistency concerns as recommended in Greene (2002) and Fernandez-Val (2009) and
results are robust to this alternative specification
17
variable by the TARP RECIPIENT dummy fitted value and POST TARP x TARP RECIPIENT by the
product of the POST TARP dummy and the TARP RECIPIENT dummy fitted value26
The results of the IV regressions are reported in Table 3 We report the first-stage regression results
in Table 3 Panel A column (1) and the second-stage results for the IV specification in Table 3 Panel B The
first-stage regression in Panel A column (1) indicates that the instrumental variable is positively related to
TARP injections and the F-test indicates that the instrument is valid (F = 149572 with a p-value less than
0001) The final stage results in Panel B show that after controlling for endogeneity all five of the loan
contract terms retain the same sign albeit at a lower significance level in some cases Thus the main results
that TARP generally leads to more favorable terms of credit are robust
52 Heckmanrsquos (1979) Two-Stage Selection Model
To address potential selection bias we use Heckmanrsquos (1979) two-step procedure This approach
controls for selection bias introduced by bank borrower and government choices about TARP by
incorporating TARP decisions into the econometric estimation In the first step we use the same probit
model from the IV estimation to predict TARP RECIPIENT In the second stage (outcome equation) the
loan contract terms are the dependent variables and the right-hand-side variables include the self-selection
parameter (inverse Mills ratio) estimated from the first stage
The second-stage results are reported in Table 3 Panel C The results again suggest that TARP is
associated with improvements in all the loan contract terms consistent with our main findings
53 Placebo Experiment
As mentioned in Roberts and Whited (2013) the key assumption behind the DID estimator the
parallel trends assumption is untestable However several researchers including Angrist and Krueger
(1999) and Roberts and Whited (2013) propose performing a falsification sensitivity test to alleviate
concerns that alternative forces may drive the effects documented We follow their advice and conduct a
26 As indicated in Wooldridge (2002 p 236-237) this method is not the same as the forbidden regression as we use
the obtained variables as instruments in the next step and not as regressors
18
placebo experiment We follow Puddu and Walchli (2013) and Berger and Roman (2015 forthcoming) and
fictionally assume that the TARP participation took place four years earlier while still distinguishing
between banks that received TARP and those that did not according to the ldquotrue TARP program To mimic
our main analysis we use an eight-year period immediately preceding the TARP program from 2001-2008
and assume that the fictional Post TARP period begins four years before the actual program We rerun the
regressions using the placebo sample (2001-2008) and define PLACEBO POST TARP as a dummy equal
to one in 2005-2008 the period after the fictional TARP program initiation If our main results reflect the
true program we should not find statistically significant results with the same sign for the DID terms
The placebo results reported in Table 4 confirm that indeed there are no statistically significant
results with the same sign on four of the five loan contract terms for the fictional TARP For amount
collateral and covenant intensity the effect of the fictional TARP program is insignificantly different from
zero while for spread the effect is reversed and only marginally statistically significant The effect also is
only marginally statistically significant for maturity Thus the placebo experiment generally suggests that
our main results do not appear to be driven by alternative forces
54 Alternative Measure of TARP
We next test robustness to the use of an alternative measure of TARP In Table 5 we replace the
TARP RECIPIENT dummy with an alternative measure of TARP infusion LOG (1+Bailout Amount) Our
main results continue to hold all five of the loan contract terms have statistically significant coefficients
that suggest more favorable treatment to business borrowers associated with TARP
55 Alternative Econometric Models
To help alleviate the concern that omitted unobserved bank-specific year-specific industry-
specific or local market-specific determinants might explain our results Table 6 Panels A-C examine
alternative econometric methods using various combinations of bank year borrower industry and
borrower state fixed effects In Panels A and B when bank fixed effects are included we drop the
uninteracted TARP dummy which would be perfectly collinear with the bank fixed effects We also use
19
White standard errors which are robust to within-cluster correlation at the borrower and bank level in Panels
D-F In addition we exclude various other bank control variables and borrower characteristics in Panels G-
I27 We use alternative industry fixed effects specifications (2-digit NAICS codes and Fama-French 48
industries) in Panels J-K We use alternative functional forms for collateral in Panel L The results show
consistently more favorable treatment to borrowers by the TARP banks
56 Additional Robustness Tests
Table 7 contains additional robustness checks in which we exclude borrowers with missing SampP
credit ratings in Panel A or borrowers with only one loan in Panel B These results show consistently
statistically significantly more favorable credit terms treatment to business borrowers by the TARP banks
In Panel C we rerun our results excluding foreign-owned banks to mitigate the concern that our
effects may be influenced by these banks Some research shows that many foreign banks increased their
market share in the period leading up to the financial crisis (eg Claessens and Van Horen 2014 Berlin
2015) but they drew back from US lending during the financial crisis consistent with a home bias of
lendersrsquo loan origination (eg Giannetti and Laeven 2012) Our results excluding foreign banks continue
to show qualitatively similar effects to our main findings
In Panel D we examine the timing of the effects of TARP on loan contract terms to borrowers We
replace our DID term POST TARP x TARP RECIPIENT with a series of DID terms interacting the TARP
RECIPIENT with each of the POST TARP years (2009 2010 2011 and 2012) to trace out the timing of the
effects of TARP The results show that the loan contract term improvements are fairly strong throughout
the post-TARP period although they trail off somewhat for collateral in the last two years
In Panel E we examine effects of TARP on loan contract terms for involuntary and voluntary
TARP participants Some banks were required to participate in TARP at its inception We classify the
following eight banks as involuntary participants Citigroup JP Morgan Wells Fargo Morgan Stanley
27 This exercise addresses the concern that some bank characteristics might be endogenously driven by TARP
20
Goldman Sachs Bank of New York Bank of America and State Street Bank28 We specify variables for
the TARP involuntary and voluntary banks and interact these variables with our Post TARP dummy We
find more favorable loan contract terms for borrowers from both involuntary and voluntary participants
In Panel F we examine effects of TARP on loan contract terms for TARP participants subject to
the US bank Stress Tests (aka the Supervisory Capital Assessment program (SCAP) and the
Comprehensive Capital Analysis and Review (CCAR) programs) and participants not subject to these tests
These tests were applied to 19 banking organizations with assets exceeding $100 billion to ensure these
large banking organizations had enough capital to withstand the recession and a hypothetical more adverse
scenario that might occur over the rest of the financial crisis29 We specify variables for the TARP banks
subject to these stress tests and those not subject to them and interact these variables with our Post TARP
dummy We find more favorable loan contract terms for borrowers from both types of participants
6 Ancillary Hypotheses
We next develop hypotheses to understand which types of borrowers benefit more from bailouts ndash
safer or riskier more or less financially constrained and relationship or non-relationship
First we examine whether the changes in the credit terms for safer borrowers as a result of bank
bailouts are more or less favorable relative to the treatment for riskier borrowers We offer two channels
with opposing predictions
Increased moral hazard channel Bailouts increase the perceived probability of future bailouts
for recipient banks increasing their moral hazard incentives to take on excessive risk leading the
recipients to improve contract terms relatively more for riskier borrowers than safer borrowers
Decreased moral hazard channel Bailouts reduce the moral hazard incentives of the recipient
banks to take on excessive risk because of the increases in the capital of the recipient banks or
28 We exclude Merrill Lynch from the nine involuntary recipients because it is not a bank 29 These were 19 banks including Bank of America Citigroup Goldman Sachs JP Morgan Chase Morgan Stanley
Wells Fargo Bank of NY Mellon BBampT Fifth Third Bancorp Keycorp PNC Financial Regions Financial SunTrust
Banks US Bancorp Ally Financial American Express Company Capital One Financial Metlife and State Street
21
because of extra explicit or implicit government restrictions on these institutions leading them to
improve contract terms relatively more for safer borrowers than for riskier borrowers30
We compare the net impact of bank bailouts on changes in loan contract terms between riskier and
safer borrowers using the following set of opposing hypotheses
H2a Bailouts result in greater improvements in loan terms for the riskier borrowers relative to the
safer borrowers of recipient banks
H2b Bailouts result in greater improvements for the safer borrowers relative to the riskier
borrowers of recipient banks
As above these hypotheses are not mutually exclusive and we are only able to tests which of these
hypotheses empirically dominates the other overall
Next we examine whether the changes in the credit terms as a result of bank bailouts for small
unlisted borrowers that are more financially constrained because of informationally opacity problems are
more or less favorable relative to the treatment for large listed borrowers that are more transparent We
offer two channels with opposing predictions that are based on the finding discussed above that TARP
appears to have increased the market power of its recipients
Increased relative credit supply to financially constrained borrowers channel Bailouts
increase the market power of recipient banks more relative to small unlisted financially constrained
borrowers with few financial alternatives than to large listed borrowers The increased market
power incentivizes the bailed-out banks to offer more improved terms of credit to the financially
constrained borrowers and make up for any short-term losses with higher future profits from future
loans (eg Petersen and Rajan 1995) That is banks may temporarily subsidize borrowers have
fewer outside options that are more likely to borrow from these banks in subsequent periods
Reduced relative credit supply to financially constrained borrowers channel The lesser
30 The decreased moral hazard channel is the opposite of the increased moral hazard channel so they never both hold
for the same bank at the same time
22
increase in relative market power to large listed borrowers results in bailed-out banks improving
contract terms more for large listed borrowers to attract them away from alternative lenders
We compare the net impact of bank bailouts on changes in loan contract terms for small and unlisted
borrowers relative to large and listed borrowers respectively using the following opposing hypotheses
H3a Bailouts result in greater improvements in loan terms for the small and unlisted borrowers
relative to the large and listed borrowers of recipient banks respectively
H3b Bailouts result in greater improvements for the large and listed borrowers relative to the small
and unlisted borrowers of recipient banks respectively
As above these hypotheses are not mutually exclusive and we are only able to tests which of these
hypotheses empirically dominates the other overall
Finally we examine whether the changes in the credit terms for relationship borrowers as a result
of bank bailouts are more or less favorable relative to the treatment for non-relationship borrowers We
offer two channels with opposing predictions
Relationship borrowersrsquo preservation channel Bailout recipients may improve contract terms
relatively more for relationship borrowers than non-relationship borrowers to help preserve or
enhance the relationships enabling the banks to earn more in the long run from continuing business
Non-relationship borrowersrsquo attraction channel Bailout recipient banks may improve loan
contract terms relatively more for non-relationship borrowers as these borrowers do not have a
recent history with the bank and may require better terms to attract them
Based on these channels we compare the net impact of bank bailouts on changes in loan contract
terms for relationship and non-relationship borrowers in our next set of opposing hypotheses
H4a Bank bailouts result in greater improvements in loan terms for relationship borrowers relative
to non-relationship borrowers of recipient banks
H4b Bank bailouts result in greater improvements in loan terms for non-relationship borrowers
relative to relationship borrowers of recipient banks
As above we are only able to measure which hypothesis empirically dominates overall
23
7 Ancillary Results
71 Borrower Risk
Borrower SampP Credit Rating
To test hypotheses H2a and H2b on whether improvements in loan contract terms are greater for
riskier or safer borrowers respectively we first use borrower SampP credit rating as a proxy for borrower
risk We group borrowers according to whether they have investment grade ratings (BBB or higher) versus
speculative or junk ratings (BB or lower rated) and estimate the model for each of the subsamples31
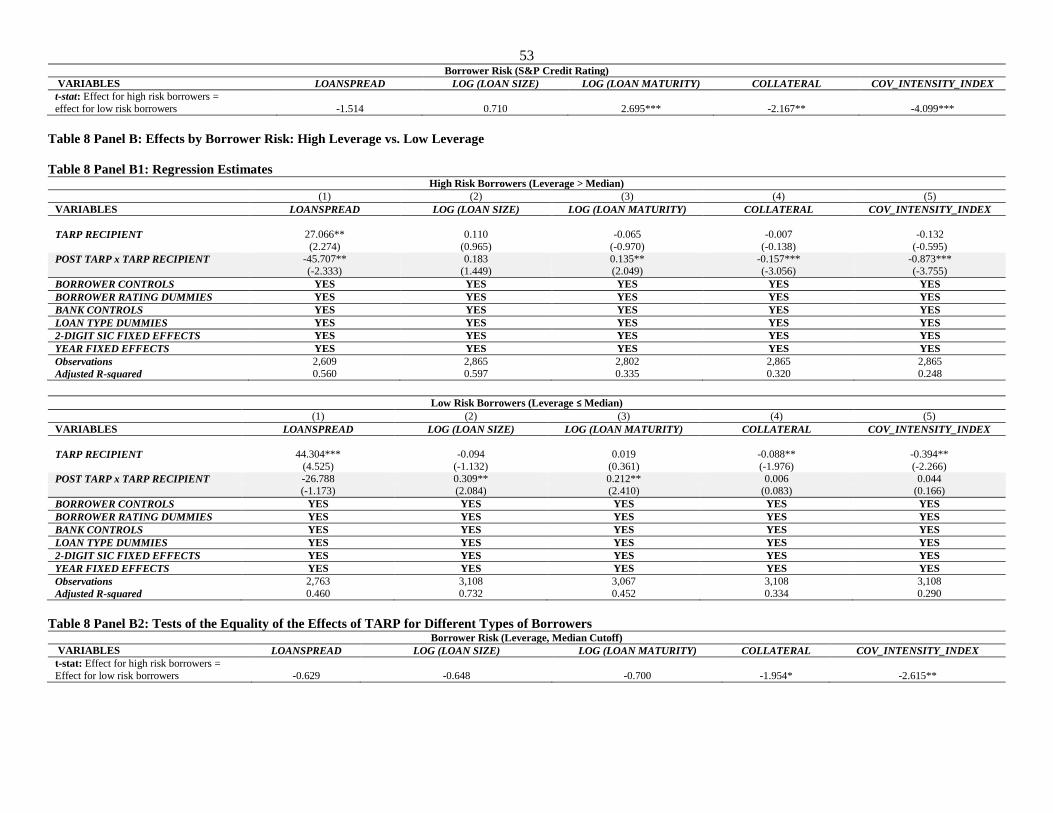
Regression estimates are shown in Table 8 Panel A1 Panel A2 reports the tests of equality between
the two types of borrower groups The results suggest that high-risk borrowers experienced more favorable
loan contract terms as a result of TARP as indicated by the DID term coefficients consistent with the
empirical dominance of the Hypothesis H2a over H2b The DID coefficients of all five loan contract terms
are only significant for the riskier borrowers The differences between the two groups are statistically and
economically significant for LOG (LOAN MATURITY) COLLATERAL and COV_INTENSITY_INDEX
Borrower Leverage
Similarly we test hypotheses H2a and H2b using borrower leverage We group borrowers
according to whether they have low leverage ratio (LEVERAGE le median) or high leverage ratio
(LEVERAGE gt median) and estimate the main DID regressions for each subsample
The regression results are shown in Table 8 Panel B1 Panel B2 reports the tests of equality between
the two types of borrower groups We find that both groups of borrowers generally experience more
favorable contract terms as a result of TARP but terms are in most cases more favorable to high-risk
borrowers again consistent with the empirical dominance of the Hypothesis H2a over H2b This is
especially important for the effects on COLLATERAL and COV_INTENSITY_INDEX where DID terms
are only statistically significant for the riskier borrowers and the differences are statistically and
economically significant These results are generally consistent with increased exploitation of moral hazard
31 We exclude unrated borrowers because their risks are unknown
24
Borrower Cash Flow Volatility
Finally we test hypotheses H2a and H2b using borrower cash flow volatility as a proxy for risk
We group borrowers according to whether they have low cash flow volatility (CASH FLOW VOLATILITY
le median) or high cash flow volatility (CASH FLOW VOLATILITY gt median) and estimate the main DID
regressions using each subsample
The regression results are shown in Table 8 Panel C1 Panel C2 reports the tests of equality between
the two borrower groups For the risky borrowers the DID coefficients of all five loan contract terms are
significant but for the safer borrowers only the DID coefficient for LOG (LOAN SIZE) is significant
72 Borrower Financial Constraints
Borrower Size
To test hypotheses H3a and H3b on whether the improvements in loan contract terms are greater
for more financially-constrained borrowers we first use borrower size as a proxy for financial constraints
following Hadlock and Pierce (2010) Smaller borrowers also tend to be more informationally opaque and
have access to fewer sources of finance so they are more bank dependent than large borrowers We group
borrowers according to whether they are large (BORROWER_SIZE gt median) or small (BORROWER_SIZE
le median) and estimate the DID regressions using each of the subsamples32
Regression estimates are shown in Table 9 Panel A1 Panel A2 reports the tests of equality between
the two types of borrower groups The results suggest that larger borrowers experienced more favorable
loan contract terms as a result of TARP as indicated by the DID term coefficients consistent with the
empirical dominance of the Hypothesis H3b over H3a This is especially important for the effects on
LOANSPREAD LOG (LOAN SIZE) and COV_INTENSITY_INDEX where DID terms are only statistically
significant for the larger borrowers The difference in LOANSPREAD between the two groups is a
statistically and economically significant 52321 basis points
32 In unreported tests we also perform tests using the borrower total sales instead of total assets to proxy borrower
size and obtain consistent results
25
Borrower Public Status
We also test hypotheses H3a and H3b using borrower listing status Publicly listed borrowers are
generally more transparent and have better access to other external sources of finance We compare the net
impact of TARP on changes in loan contract terms for public versus private borrowers based on the
borrowerrsquos listing status in the DealScan dataset and estimate the main DID regressions using each
subsample33
The regression results are shown in Table 9 Panel B1 Panel B2 reports the tests of equality between
the two types of borrower groups The results suggest that public borrowers experienced more favorable
loan contract terms as a result of TARP as indicated by the DID term coefficients the DID coefficients of
all five loan contract terms are only significant for the public borrowers Overall our results indicate that
less-financially-constrained borrowers benefit more from the bailout
73 Relationship Lending
We next explore whether relationship borrowers benefited more or less relative to non-relationship
borrowers ie which of the two hypotheses H4a and H4b respectively empirically dominates
We group borrowers according to whether they had a relationship with a TARP bank in the pre-
TARP period (2005Q1-2008Q4) Relationship is defined as a dummy indicating the same borrower and
lead bank were involved in at least one loan over the pre-TARP period
Regression estimates are shown in Table 10 Panel A1 Panel A2 reports the tests of equality of the
DID terms for two types of borrowers The estimated DID coefficients for the two groups of borrowers
suggest that the change in contract terms is beneficial for both relationship and non-relationship borrowers
for the first three contract terms However the favorable effects on collateral and covenant intensity are
only significant for the non-relationship borrowers These findings suggest that TARP banks used bailout
funds to reach out to new borrowers as well as grant more favorable terms to existing clients with slightly
33 In unreported results we also perform tests using Compustat to split borrowers into public and private where a
private firm would have an exchange code of 0 1 19 or 20 and results are consistent
26
better terms for the non-relationship borrowers The findings also imply that TARP studies that focus on
borrowers with prior relationship with TARP banks may overlook some benefits of the program
74 Additional Tests
In Internet Appendix Y we conduct several additional subsample analyses to determine which
borrowers received benefits from the TARP program The data suggest that a broad spectrum of borrowers
experienced more favorable loan credit terms from TARP recipients borrowers using term loans and
revolvers and borrowers from both relatively concentrated and unconcentrated industries Thus the data
suggest that many types of business borrowers benefited from the TARP program
8 Conclusions
Do bank bailouts result in net benefits or costs for their borrowers We formulate and test
hypotheses about the effects of these bailouts on loan contract terms to business borrowers ndash whether loan
contract terms become more or less favorable for the borrowers of recipient banks (Hypotheses H1a and
H1b) whether terms improve more for riskier or safer borrowers (Hypotheses H2a and H2b) whether terms
improve more for more or less financially-constrained borrowers (Hypotheses H3a and H3b) and whether
terms improved more for relationship or non-relationship borrowers (Hypotheses H4a and H4b) We use
data from the US TARP bailout during the recent financial crisis
We first find that TARP bailout resulted in more favorable loan contract terms for recipient banksrsquo
business customers consistent with the empirical dominance of H1a over H1b and an increase in credit
supply at the intensive margin Conditional on borrower characteristics and ratings bank characteristics
loan type and industry and time fixed effects we find that recipient banks tended to grant loans with lower
spreads larger amounts longer maturities less frequency of collateral and less restrictive covenants These
findings are robust to dealing with potential endogeneity and other robustness checks and suggest that
borrowers significantly benefited from TARP
Second the improvement in loan contract terms due to TARP was more pronounced among the
riskier borrowers consistent with an increase in the exploitation of moral hazard incentives and the
27
empirical dominance of H2a over H2b Borrowers with lower credit ratings higher leverage and higher
cash flow volatility experienced significantly greater improvements in loan spread than other borrowers
Third the improvement in loan contract terms due to TARP was more pronounced for large and
publicly-listed borrowers than for small and private borrowers respectively consistent with more benefits
for less financially-constrained borrowers and the empirical dominance of H3b over H3a
Fourth we find that both relationship and non-relationship borrowers benefited from TARP This
finding suggests that TARP banks used bailout funds to reach out to new loan customers as well as to grant
more favorable terms to existing clients
This paper contributes to important strands of research First it adds to the broad bank bailout
literature by studying whether the recipient banksrsquo borrowers benefited from the TARP bailout We focus
on the effects of TARP on loan contract terms of these customers about which there is no evidence in the
extant literature It adds to the literature on the effects of bailouts on bank borrowers by clearing up some
of the ambiguities in the event studies on the effects of TARP on the relationship borrowers In contrast to
these other studies we examine actual changes in the treatment of loan customers and cover both
relationship and non-relationship borrowers The paper also extends the literature on the effects of bank
bailouts on credit supply at the extensive margin by covering the intensive margin or how borrowers that
received credit are treated along five different dimensions of loan contract terms It adds to the bank bailout
and moral hazard literature where existing work focuses on the credit supply to risky and safe borrowers at
the extensive margin Our intensive margin result that risker borrowers benefit more from TARP supports
an increase in the exploitation of moral hazard incentives Our finding that the preponderance of
improvements in loan contract terms goes to less financially-constrained borrowers raises a question
whether TARP really helps companies that need capital the most Finally this paper also contributes to the
broader literature on bank loan contracting by investigating how loan contracts are affected by bank
bailouts and by examining multiple loan contract dimensions in a single study
In terms of policy implications our study adds to the literature and policy debate on the benefits and
costs of the bank bailouts in general and the benefits and costs of TARP in particular Many of the social
28
benefits and costs of bailouts have been identified and studied extensively in the literature and are
summarized elsewhere in Calomiris and Khan (2015) and Berger and Roman (forthcoming) This study
suggests that borrowers generally receive more favorable treatment due to the bailout program but most of
the benefits do not fall on safer and more financially-constrained borrowers suggesting that the social costs
and benefits of TARP are more nuanced than previously documented and deserve further investigation
29
References
Acharya V Yorulmazer T 2007 Too many to fail mdash An Analysis of Time-inconsistency in Bank
Closure Policies Journal of Financial Intermediation 16 1-31
Angelini P Di Salvo R Ferri G 1998 Availability and cost of credit for small businesses Customer
relationships and credit cooperatives Journal of Banking and Finance 22 925-954
Angrist JD Krueger AB 1999 Empirical strategies in labor economics in A Ashenfelter and D Card
eds Handbook of Labor Economics vol 3 Elsevier Science
Bae K H Goyal V K 2009 Creditor rights enforcement and bank loans The Journal of Finance 64
823-860
Barclay M J Smith C W 1995 The maturity structure of corporate debt Journal of Finance 50 609ndash
631
Barry C B Brown S J 1984 Differential information and the small firm effect Journal of Financial
Economics 13 283ndash294
Bassett WF Demiralp S 2014 Government Support of Banks and Bank Lending Working Paper Board
of Governors of the Federal Reserve System
Bayazitova D Shivdasani A 2012 Assessing TARP Review of Financial Studies 25 377-407
Beck T Levine R Levkov A 2010 Big bad banks The winners and losers from bank deregulation in
the United States Journal of Finance 65 1637ndash1667
Beneish M D Press E 1993 Costs of Technical Violation of Accounting-Based Debt Covenants The
Accounting Review 68 233-257
Beneish M D Press E 1995 Interrelation among Events of Default Contemporary Accounting
Research 12 57-84
Benmelech E Garmaise M J Moskowitz T J 2005 Do liquidation values affect financial contracts
Evidence from commercial loan and zoning regulation The Quarterly Journal of Economics 120
1121-1154
Berger A N Black L K Bouwman C H S Dlugosz J L 2016 The Federal Reserversquos Discount
Window and TAF Programs Pushing on a String Working Paper University of South Carolina
Berger A N Bouwman C H S Kick T K Schaeck K 2016 Bank Risk Taking and Liquidity Creation
Following Regulatory Interventions and Capital Support Journal of Financial Intermediation 26
115-141
Berger AN Espinosa-Vega M A Frame WS Miller NH 2005 Debt maturity risk and asymmetric
information Journal of Finance 60 2895ndash2923
Berger A N Frame W S Ioannidou V 2011 Tests of ex ante versus ex post theories of collateral using
private and public information Journal of Financial Economics 100 85-97
Berger A N Kick T K Schaeck K 2014 Executive board composition and bank risk taking Journal of
Corporate Finance 28 48-65
Berger A N Makaew T Turk-Ariss R 2016 Foreign Banks and Lending to Public and Private Firms
during Normal Times and Financial Crises Working Paper University of South Carolina
Berger A N Roman R A 2015 Did TARP Banks Get Competitive Advantages Journal of Financial
and Quantitative Analysis 50 1199-1236
Berger A N Roman R A Forthcoming Did Saving Wall Street Really Save Main Street The Real
Effects of TARP on Local Economic Conditions The Real Effects of TARP on Local Economic
Conditions Journal of Financial and Quantitative Analysis
Berger A N Roman R A and Sedunov J 2016 Did TARP Reduce or Increase Systemic Risk The
Effects of TARP on Financial System Stability Working Paper University of South Carolina
Berger A N Udell G F 1990 Collateral loan quality and bank risk Journal of Monetary Economics
30
25 21ndash42
Berger A N Udell G F 1995 Relationship lending and lines of credit in small firm finance Journal of
Business 68 351ndash381
Berlin M 2015 New Rules for Foreign Banks Whatrsquos at Stake Business Review Q1 1-10
Berlin M Mester L J 1999 Deposits and relationship lending Review of Financial Studies 12 579-
607
Besanko D Thakor A 1987 Collateral and rationing sorting equilibria in monopolistic and competitive
credit markets International Economic Review 28 601-689
Bester H 1985 Screening vs rationing in credit market under asymmetric information Journal of
Economic Theory 42 167-182
Bolton P Scharfstein D S 1996 Optimal debt structure and the number of creditors Journal of Political
Economy 104 1ndash25
Boot A Thakor A Udell G 1991 Secured Lending and Default Risk Equilibrium Analysis Policy
Implications and Empirical Results The Economics Journal 101 458-472
Bradley M Roberts M R 2015 The structure and pricing of corporate debt covenants Quarterly Journal
of Finance 2 1550001
Brandao-Marques L Correa R Sapriza H 2012 International evidence on government support and
risk-taking in the banking sector IMF Working Paper
Bharath S T Dahiya S Saunders A Srinivasan A 2011 Lending relationships and loan contract
terms Review of Financial Studies 24 1141-1203
Bharath S T Sunder J Sunder S V 2008 Accounting quality and debt contracting Accounting
Review 83 1ndash28
Black L Hazelwood L 2013 The effect of TARP on bank risk-taking Journal of Financial Stability 9
790-803
Blackwell D W Noland T R Winters DB 1998 The value of auditor assurance evidence from loan
pricing Journal of Accounting Research 36 57ndash70
Boot A W A Marinc M 2008 Competition and entry in banking Implications for capital regulation
Working Paper University of Amsterdam
Calderon C Schaeck K forthcoming The effects of government interventions in the financial sector on
banking competition and the evolution of zombie banks Journal of Financial and Quantitative
Analysis
Calomiris C W Pornrojnangkool T 2009 Relationship Banking and the Pricing of Financial Services
Journal of Financial Services Research 35189ndash224
Calomiris C W Khan U 2015 An Assessment of TARP Assistance to Financial Institutions The
Journal of Economic Perspectives 29 53-80
Chakraborty I Goldstein I and MacKinlay A 2016 Housing Price Booms and Crowding-Out Effects
in Bank Lending Working Paper
Chan Y and G Kanatas 1985 Asymmetric valuation and role of collateral in loan agreement Journal of
Money Credit amp Banking 17 84-95
Chava S Livdan D Purnanandam A 2009 Do shareholder rights affect the cost of bank loans Review
of Financial Studies 22(8) 2973-3004
Chava S Roberts M R 2008 How does financing impact investment The role of debt covenants The
Journal of Finance 63 2085-2121
Chen K C Wei K J 1993 Creditors decisions to waive violations of accounting-based debt covenants
Accounting review A quarterly journal of the American Accounting Association 68 218-232
31
Chu Y Zhang D Zhao Y 2016 Bank Capital and Lending Evidence from Syndicated Loans Working
Paper
Claessens S Van Horen N 2014 Foreign Banks Trends and Impact Journal of Money Credit and
Banking 46 295-326
Cole R A 1998 The Importance of Relationships to the Availability of Credit Journal of Banking amp
Finance 22 959ndash77
Cornett M M Li L Tehranian H 2013 The Performance of Banks around the Receipt and Repayment
of TARP Funds Over-achievers versus Under-achievers Journal of Banking amp Finance 37 730ndash
746
Dam L Koetter M 2012 Bank bailouts and moral hazard Empirical evidence from Germany Review
of Financial Studies 25 2343-2380
De Haas R and Van Horen N 2013 Running for the exit International bank lending during a financial
crisis Review of Financial Studies 26 244-285
Degryse H Van Cayseele P 2000 Relationship Lending within a Bank-Based System Evidence from
European Small Business Data Journal of Financial Intermediation 9 90ndash109
Dennis S Nandy D Sharpe L G 2000 The determinants of contract terms in bank revolving credit
agreements Journal of Financial and Quantitative Analysis 35 87-110
Diamond D W 1991 Debt maturity structure and liquidity risk Quarterly Journal of Economics 106
709ndash737
Duchin D Sosyura D 2012 The politics of government investment Journal of Financial Economics 106
24-48
Duchin R Sosyura D 2014 Safer ratios riskier portfolios Banks response to government aid Journal
of Financial Economics 113 1-28
Elsas R Krahnen J P 1998 Is Relationship Lending Special Evidence from Credit-File Data in
Germany Journal of Banking amp Finance 22 1283ndash316
Flannery M J 1986 Asymmetric information and risky debt maturity choice Journal of Finance 41 19ndash
37
Fernandez de Guevara J F Maudos J Perez F 2005 Market power in European banking sectors Journal
of Financial Services Research 27 109-137
Fernaacutendez-Val I 2009 Fixed effects estimation of structural parameters and marginal effects in panel
probit models Journal of Econometrics 150 71-85
Freudenberg F Imbierowicz B Saunders A Steffen S 2013 Covenant violations loan contracting
and default risk of bank borrowers Working Paper
Fudenberg D Tirole J 1986 A signal-jamming theory of predation Rand Journal of Economics 17
366-376
Giannetti M Laeven L 2012 The flight home effect Evidence from the syndicated loan market during
financial crises Journal of Financial Economics 104 23-43
Gilje E 2012 Does local access to finance matter Evidence from US oil and natural gas shale booms
Working Paper Boston College
Giroud X Mueller H 2011 Corporate governance product market competition and equity prices The
Journal of Finance 66 563-600
Graham JR Li S and Qiu J 2008 Corporate misreporting and bank loan contracting Journal of
Financial Economics 89 44-61
Greene W H 2002 The behavior of the fixed effects estimator in nonlinear models NYU Working Paper
No EC-02-05
32
Guedes J Opler T 1996 The determinants of the maturity of corporate debt issues Journal of Finance
51 1809ndash1834
Hadlock Charles J Pierce Joshua R 2010 New Evidence on Measuring Financial Constraints Moving
Beyond the KZ Index Review of Financial Studies 23 1909-1940
Harhoff D Korting T 1998 Lending Relationships in Germany Empirical Evidence from Survey Data
Journal of Banking amp Finance 22 1317ndash53
Harrisa O Huertab D Ngob T 2013 The impact of TARP on bank efficiency Journal of International
Financial Markets Institutions and Money 24 85ndash104
Hasan I Hoi CKS Wu Q and Zhang H 2014 Beauty is in the eye of the beholder The effect of
corporate tax avoidance on the cost of bank loans Journal of Financial Economics 113 109-130
Hernaacutendez-Caacutenovas G Martiacutenez-Solano P 2006 Banking Relationships Effects on Debt Terms for
Small Spanish Firms Journal of Small Business Management 44 315ndash333
Himmelberg C Morgan D 1995 Is Bank Lending Special in ldquoIs Bank Lending Important for the
Transmission of Monetary Policyrdquo edited by Joe Peek and Eric Rosengren Federal Reserve Bank of
Boston Conference Series no 39
Hoshi T and A K Kashyap 2010 Will the US bank recapitalization succeed Eight lessons from Japan
Journal of Financial Economics 97 398ndash417
Hryckiewicz A 2012 Government interventions - restoring or destroying financial stability in the long
run Working Paper Goethe University of Frankfurt
Ivashina V 2009 Asymmetric information effects on loan spreads Journal of Financial Economics 92
300-319
Ivashina V Scharfstein D S 2010 Loan syndication and credit cycles American Economic Review
100 57-61
Ivashina V Scharfstein D S 2010 Bank lending during the financial crisis of 2008 Journal of Financial
Economics 97 319-338
Jimenez G Lopez J Saurina J 2010 How does competition impact bank risk taking Working Paper
Banco de Espana
Jimenez G Salas V Saurina J 2006 Determinants of collateral Journal of Financial Economics 81
255-281
Kashyap AK Rajan R Stein JC 2008 Rethinking capital regulation Kansas City Symposium on
Financial Stability
Kim DH Stock D 2012 Impact of the TARP financing choice on existing preferred stock Journal of
Corporate Finance 18 1121ndash1142
Koetter M and Noth F 2015 Bank Bailouts and Competition - Did TARP Distort Competition Among
Sound Unsupported Banks Economic Inquiry 54 994ndash1020
Laeven L Levine R 2007 Is there a diversification discount in financial conglomerates Journal of
Financial Economics 85 331-367
Lee SW Mullineaux DJ 2004 Monitoring financial distress and the structure of commercial lending
syndicates Financial Management 33 107ndash130
Li L 2013 TARP Funds Distribution and Bank Loan Supply Journal of Banking and Finance 37 4777-
4792
Lin Y Liu X Srinivasan A 2014 Unintended effects of the TARP program Evidence from relationship
borrowers of the TARP recipient banks Working Paper National University of Singapore
Liu W Kolari J W Tippens T K Fraser D R 2013 Did capital infusions enhance bank recovery
from the great recession Journal of Banking amp Finance 37 5048-5061
Machauer AWeber M 2000 Number of Bank Relationships An Indicator of Competition Borrower
33
Quality or Just Size Working Paper 200006 Johan Wolfgang Goethe-Universitat Center for
Financial Studies
Mazumdar S C Sengupta P 2005 Disclosure and the loan spread on private debt Financial Analysts
Journal 61 83ndash95
Mehran H Thakor A 2011 Bank capital and value in the cross-section Review of Financial Studies
241019-1067
Meyer B D 1995 Natural and quasi-experiments in economics Journal of Business and Economic
Statistics 13 151-161
Murfin J 2012 The Supply‐Side Determinants of Loan Contract Strictness The Journal of Finance 67
1565-1601
Myers S C 1977 Determinants of corporate borrowing Journal of Financial Economics 5 147ndash175
Ng J Vasvari F P Wittenberg-Moerman R 2013 The Impact of TARPs Capital Purchase Program on
the stock market valuation of participating banks Working Paper University of Chicago
Nini G Smith D C Sufi A 2009 Creditor control rights and firm investment policy Journal of
Financial Economics 92 400-420
Norden L Roosenboom P Wang T 2013 The Impact of Government Intervention in Banks on
Corporate Borrowersrsquo Stock Returns Journal of Financial and Quantitative Analysis 48 1635-1662
Ortiz-Molina H Penas M F 2008 Lending to small businesses the role of loan maturity in addressing
information problems Small Business Economics 30 361ndash383
Petersen M A Rajan R G 1994 The Benefits of Lending Relationships Evidence from Small Business
Data Journal of Finance 49 3ndash37
Petersen M A Rajan R G 1995 The effect of credit market competition on lending relationships
Quarterly Journal of Economics 110 407-443
Pittman J A Fortin S 2004 Auditor choice and the cost of debt capital for newly public firms Journal
of Accounting and Economics 37 113ndash136
Qian J Strahan PE 2007 How laws and institutions shape financial contracts the case of bank loans
Journal of Finance 62 2803ndash2834
Rajan R Winton A 1995 Covenants and collateral as incentives to monitor Journal of Finance 50
1113ndash1146
Roberts M R Sufi A 2009 Renegotiation of financial contracts Evidence from private credit
agreements Journal of Financial Economics 93 159-184
Roberts M R Whited T M 2013 Endogeneity in Empirical Corporate Finance Chapter 7 in the
Handbook of Economics and Finance Elsevier Science
Schaeck K Cihak M Maehler A M Stolz S M 2012 Who disciplines bank managers Review of
Finance 16 197-243
Scherr F C Hulburt H M 2001 The debt maturity structure of small firms Financial Management 30
85ndash111
Smith Clifford W Jr 1993 A Perspective on Accounting-Based Debt Covenant Violations The
Accounting Review 68 289-303
Smith C W Warner J B 1979 On financial contracting an analysis of bond covenants Journal of
Financial Economics 7 117ndash161
Stohs M Mauer D C 1996 The determinants of corporate debt maturity structure Journal of Business
69 279ndash312
Stulz R Johnson H 1985 An analysis of secured debt Journal of Financial Economics 14 501-521
Strahan P E 1999 Borrower risk and the price and nonprice terms of bank loans Unpublished working
34
paper Federal Reserve Bank of New York
Sufi A 2007 Information asymmetry and financing arrangements evidence from syndicated loans
Journal of Finance 62 629ndash668
Sufi A 2009 Bank lines of credit in corporate finance An empirical analysis Review of Financial Studies
22 1057-1088
Sweeney A P 1994 Debt-covenant violations and managers accounting responses Journal of
Accounting and Economics 17 281-308
Telser L G 1966 Cutthroat competition and the long purse Journal of Law and Economics 9 259-77
Thakor A V forthcoming Bank Capital and Financial Stability An Economic Tradeoff or a Faustian
Bargain Annual Review of Financial Economics
Veronesi P and Zingales L Paulsonrsquos gift 2010 Journal of Financial Economics 97 339-36
Wilson L Wu Y W 2012 Escaping TARP Journal of Financial Stability 8 32ndash42
Wu Q Zhang H Hoi C K S Hasan I 2013 Beauty is in the eye of the beholder The effect of
corporate tax avoidance on the cost of bank loans Journal of Financial Economics
35
Table 1 Definitions and Summary Statistics This table reports definitions and summary statistics of the variables for the full sample All variables using dollar amounts are expressed in real 2012Q4 dollars using the implicit
GDP price deflator
Variable Definitions and Summary Statistics for the Full Sample (2005-2012)
Type Variable Definition Mean p50 Std p25 p75 N
LOAN CONTRACT
TERMS VARIABLES
(SOURCE LPC
DEALSCAN)
LOANSPREAD The loan spread is the all-in spread drawn in the DealScan database All-
in spread drawn is defined as the amount the borrower pays in basis points over LIBOR or LIBOR equivalent for each dollar drawn down For loans
not based on LIBOR LPC converts the spread into LIBOR terms by
adding or subtracting a differential which is adjusted periodically This measure adds the borrowing spread of the loan over LIBOR with any
annual fee paid to the bank group 187991 175000 137312 92500 250000 5372
LOG (LOAN SIZE) Natural logarithm of the loan facility amount Loan amount is measured
in millions of dollars 19210 19337 1493 18369 20212 5973
LOG (LOAN MATURITY) Natural logarithm of the loan maturity Maturity is measured in months 3816 4111 0581 3611 4111 5869
COLLATERAL A dummy variable that equals one if the loan facility is secured by
collateral and zero otherwise 0473 0000 0499 0000 1000 5973
COV_INTENSITY_INDEX Bradley and Roberts (2015) covenant intensity index equal to the sum of
six covenant indicators (collateral dividend restriction more than 2
financial covenants asset sales sweep equity issuance sweep and debt issuance sweep) The index consists primarily of covenants that restrict
borrower actions or provide lenders rights that are conditioned on adverse
future events 2079 2000 1985 0000 3000 5973
TARP
VARIABLES
(SOURCE US
DEPARTMENT OF THE
TREASURY)
TARP RECIPIENT A dummy variable which takes a value of 1 if the bank was provided TARP capital support
0949 1000 0219 1000 1000 5973
LOG (1+BAILOUT AMOUNT)
The natural logarithm of (1 + the bank dollar bailout support) A larger value indicates a higher degree of TARP support
15920 17034 3756 17034 17034 5973
POST TARP An indicator equal to 1 in 2009-2012 and 0 in 2005-2008 0333 0000 0471 0000 1000 5973
BORROWER CONTROL
VARIABLES
(SOURCE
COMPUSTAT)
BORROWER_SIZE The natural logarithm of book value of total assets of the borrower in
millions of dollars 7529 7466 1776 6281 8724 5973
MARKET-TO-BOOK Market-to-book ratio determined as the market value of equity (PRCC_F
CSHO) scaled by the book value of equity 1957 2108 40971 1359 3315 5973
LEVERAGE The ratio of book value of total debt to book value of assets Total Debt
(Total Debt + Market Value of Equity) where Total Debt = Long Term
Debt + Total Debt in Current Liabilities 0273 0223 0228 0097 0394 5973
CASH FLOW VOLATILITY Standard deviation of previous 12 quarterly cash flows where Cash Flow
= (Income Before Extraordinary Items + Depreciation and Amortization) Total Assets and Depreciation and Amortization (DP) is set to 0 if
missing 0026 0010 0148 0005 0022 5973
PROFITABILITY The ratio of Earnings Before Interest Taxes Depreciation and Amortization (EBITDA) to Sales 0035 0033 0030 0021 0047 5973
TANGIBILITY The ratio of net property plant and equipment (NPPE) to total assets 0326 0251 0249 0123 0502 5973
CASH HOLDINGS RATIO Cash and marketable securities divided by total assets 0093 0049 0117 0017 0122 5973
BORROWER RATING
DUMMIES
Dummy variables for SampP borrower credit rating types It includes
dummies for SampP ratings of AAA AA A BBB BB B CCC or below
and 0 for those without a credit rating
36 Variable Definitions and Summary Statistics for the Full Sample (2005-2012) (cont)
Type Variable Definition Mean p50 Std p25 p75 N
BANK CONTROL
VARIABLES
(SOURCE CALL
REPORTS SUMMARY
OF DEPOSITS)
BANK SIZE The natural logarithm of gross total assets (GTA) of the bank 20447 20887 1140 20000 21064 5973
CAMELS PROXY
CAPITAL ADEQUACY
Capitalization ratio defined as equity capital divided by GTA Capital
adequacy refers to the amount of a bankrsquos capital relative to its assets
Broadly this criterion evaluates the extent to which a bank can absorb potential losses 0098 0095 0021 0089 0106 5973
CAMELS PROXY ASSET QUALITY
Asset quality evaluates the overall condition of a bankrsquos portfolio and is typically evaluated by a fraction of nonperforming assets and assets in
default Noncurrent loans and leases are loans that are past due for at least
ninety days or are no longer accruing interest Higher proportion of nonperforming assets indicates lower asset quality
0026 0013 0023 0009 0049 5973
CAMELS PROXY
MANAGEMENT QUALITY
A proxy for the bankrsquos management quality calculated as the ratio of
overhead expenses to GTA 0007 0007 0002 0006 0008 5973
CAMELS PROXY EARNINGS (ROA)
Return on assets (ROA) measured as the ratio of the annualized net income to GTA 0023 0020 0017 0012 0033 5973
CAMELS PROXY
LIQUIDITY
Cash divided by bank total deposits
0087 0079 0060 0056 0098 5973
CAMELS PROXY SENSITIVITY TO MARKET
RISK
The sensitivity to interest rate risk defined as the ratio of the absolute difference (gap) between short-term assets and short-term liabilities to
GTA -0163 -0137 0120 -0258 -0081 5973
HHI DEPOSITS A measure of bank concentration measured by the Herfindahl-Hirschman
Deposits Index determined using the bank deposit data from the FDIC
Summary of Deposits Higher values show greater market concentration 0160 0136 0063 0120 0184 5973
PERCENT METROPOLITAN
Percent of the bank deposits which are in metropolitan areas (MSAs or NECMAs) 0989 0994 0015 0987 0998 5973
FEE INCOME The ratio of banks non-interest income to total bank income 0353 0350 0098 0290 0429 5973
DIVERSIFICATION Laeven and Levine (2007) measure of diversification across different
sources of income calculated as 1- | (Net Interest Income - Other
Operating Income)Total Operating Income| 0503 0497 0251 0330 0646 5973
DWTAF Dummy equal to 1 if a bank received discount window (DW) or Term Auction facility (TAF) funding during the crisis 0980 1000 0139 1000 1000 5973
OTHER CONTROLS
(SOURCES LPC
DEALSCAN
COMPUSTAT)
LOAN TYPE
DUMMIES
Dummy variables for loan types It includes term loans revolving credit
lines and other loans
INDUSTRY FIXED EFFECTS
Dummy variables for borrower 2-digit SIC codes
YEAR FIXED
EFFECTS
Dummy variables for years in the sample
INSTRUMENTAL
VARIABLE
(SOURCES CENTER
FOR RESPONSIVE
POLITICS HOUSE OF
REPRESENTATIVES
MISSOURI CENSUS
DATA CENTER)
SUBCOMMITTEES ON FINANCIAL
INSTITUTIONS OR
CAPITAL MARKETS
A dummy variable which takes a value of 1 if a firm is headquartered in a district of a House member who served on the Capital Markets
Subcommittee or the Financial Institutions Subcommittee of the House
Financial Services Committee in 2008 or 2009
0369 0000 0483 0000 1000 5919
37
Table 2 Effects of TARP on Loan Contract Terms Main Results This table reports estimates from difference-in-difference (DID) regression estimates for analyzing the effects of TARP on loan contract terms The dependent variables are the five
loan contract terms loan spread size maturity collateral and covenant intensity index The explanatory variables are TARP RECIPIENT (a dummy equal to one if the bank was
provided TARP capital support) POST TARP (a dummy equal to one in 2009-2012 the period after TARP program initiation) their interaction as well as borrower and other bank
characteristics Borrower characteristics are borrower size market-to-book leverage profitability tangibility cash flow volatility cash holdings ratio Borrower rating dummies are
borrower SampP credit rating dummies Bank characteristics are bank size capital adequacy asset quality management quality earnings liquidity sensitivity to market risk HHI
percent metropolitan fee income diversification and DWTAF (Discount Window andor Term Auction Facility programs) Models also include loan type dummies industry (2-
digit SIC) fixed effects and year-fixed effects The estimation results are for 2005-2012 All variables are defined in Table 1 and denote significance at 10 5 and 1
level
(1) (2) (3) (4) (5)
VARIABLES LOANSPREAD LOG (LOAN SIZE) LOG (LOAN MATURITY) COLLATERAL COV_INTENSITY_INDEX
TARP RECIPIENT 45885 -0006 -0031 -0035 -0282
(5735) (-0087) (-0702) (-1052) (-2062)
POST TARP x TARP RECIPIENT -41974 0257 0185 -0083 -0484
(-2716) (2647) (3570) (-2089) (-2787)
BORROWER_SIZE -18356 0647 0035 -0085 -0257
(-15558) (60480) (5995) (-19228) (-13688)
MARKET-TO-BOOK 0021 -0000 0000 0000 0001
(1639) (-1972) (0653) (1253) (1443)
LEVERAGE 151786 -0428 -0180 0293 0174
(14426) (-5369) (-3728) (8239) (1110)
CASH FLOW VOLATILITY 13695 0179 -0001 0018 0030
(1139) (2327) (-0033) (0892) (0279)
PROFITABILITY -317613 1992 0805 -1506 -2398
(-3792) (4122) (3647) (-7389) (-3000)
TANGIBILITY 7173 -0093 -0104 -0080 -0443
(0714) (-1179) (-2422) (-1992) (-2662)
CASH HOLDINGS RATIO 71589 -0855 -0157 0211 -0076
(3859) (-7001) (-2346) (3871) (-0312)
BORROWER RATING DUMMIES YES YES YES YES YES
BANK CHARACTERISTICS YES YES YES YES YES
LOAN TYPE DUMMIES YES YES YES YES YES
INDUSTRY FIXED EFFECTS YES YES YES YES YES
YEAR FIXED EFFECTS YES YES YES YES YES
Observations 5372 5973 5869 5973 5973
Adjusted R-squared 0531 0666 0383 0321 0249
38
Table 3 Effects of TARP on Loan Contract Terms ndash Instrumental Variable (IV) Analysis This table shows difference-in-difference (DID) regression estimates for analyzing the effects of TARP on loan contract terms using an instrumental variable approach as in
Wooldridge Section 1841 (Panels A and B) and Heckmanrsquos (1979) Selection Model (Panels A and C) We use as instrument the SUBCOMMITTEES ON FINANCIAL
INSTITUTIONS OR CAPITAL MARKETS SUBCOMMITTEE ON FINANCIAL INSTITUTIONS OR CAPITAL MARKETS is a variable which takes a value of 1 if a firm is
headquartered in a district of a House member who served on the Capital Markets Subcommittee or the Financial Institutions Subcommittee of the House Financial Services
Committee in 2008 or 2009 The dependent variables are the five loan contract terms loan spread size maturity collateral and covenant intensity index The explanatory variables
are TARP RECIPIENT (a dummy equal to one if the bank was provided TARP capital support) POST TARP (a dummy equal to one in 2009-2012 the period after TARP program
initiation) their interaction as well as borrower and other bank characteristics Borrower characteristics are borrower size market-to-book leverage profitability tangibility cash
flow volatility cash holdings ratio Borrower rating dummies are borrower SampP credit rating dummies Bank characteristics are bank size capital adequacy asset quality
management quality earnings liquidity sensitivity to market risk HHI percent metropolitan fee income diversification and DWTAF (Discount Window andor Term Auction
Facility programs) Models also include loan type dummies industry (2-digit SIC) fixed effects and year-fixed effects The estimation results are for 2005-2012 All variables are
defined in Table 1 and denote significance at 10 5 and 1 level
Table 3 Panel A First Stage ndash IV (as in Wooldridge Section 1841)
Dependent Variable TARP Recipient
Independent Variables (1)
SUBCOMMITEES ON FINANCIAL INSTITUTIONS OR CAPITAL MARKETS 0903
(3015)
BORROWER CHARACTERISTICS YES
BORROWER RATING DUMMIES YES
BANK CHARACTERISTICS YES
LOAN TYPE DUMMIES YES
INDUSTRY FIXED EFFECTS YES
YEAR FIXED EFFECTS YES
Observations 4987
Pseudo R-squared 0656
39
Table 3 Panel B Final Stage ndash IV (as in Wooldridge Section 1841) (1) (2) (3) (4) (5)
VARIABLES LOANSPREAD LOG (LOAN SIZE) LOG (LOAN MATURITY) COLLATERAL COV_INTENSITY_INDEX
TARP RECIPIENT 11849 0234 -0002 -0190 -0669
(0728) (1681) (-0018) (-3023) (-2453)
POST TARP x TARP RECIPIENT -55168 0192 0165 -0088 -0643
(-2608) (1653) (2654) (-1826) (-2959)
BORROWER CHARACTERISTICS YES YES YES YES YES
BORROWER RATING DUMMIES YES YES YES YES YES
BANK CHARACTERISTICS YES YES YES YES YES
LOAN TYPE DUMMIES YES YES YES YES YES
INDUSTRY FIXED EFFECTS YES YES YES YES YES
YEAR FIXED EFFECTS YES YES YES YES YES
Observations 4503 4987 4892 4987 4987
Adjusted R-squared 0535 0674 0364 0321 0250
First Stage Kleibergen-Paap rk Wald F-test 149572 149572 149572 149572 149572
Table 3 Panel C Heckmanrsquos (1979) Selection Model ndash Outcome Equation
(1) (2) (3) (4) (5)
VARIABLES LOANSPREAD LOG (LOAN SIZE) LOG (LOAN MATURITY) COLLATERAL COV_INTENSITY_INDEX
TARP RECIPIENT 12612 0410 0094 -0128 -0473
(0785) (2711) (1097) (-1759) (-1630)
POST TARP x TARP RECIPIENT -43315 0232 0166 -0105 -0457
(-2514) (2250) (2960) (-2312) (-2390)
LAMBDA 15713 -0249 -0066 0038 0132
(1972) (-2995) (-1393) (0936) (0784)
BORROWER CHARACTERISTICS YES YES YES YES YES
BORROWER RATING DUMMIES YES YES YES YES YES
BANK CHARACTERISTICS YES YES YES YES YES
LOAN TYPE DUMMIES YES YES YES YES YES
INDUSTRY FIXED EFFECTS YES YES YES YES YES
YEAR FIXED EFFECTS YES YES YES YES YES
Observations 3983 4351 4269 4351 4351
Adjusted R-squared 0515 0667 0323 0297 0221
40
Table 4 Effects of TARP on Loan Contract Terms ndash Placebo Experiment This table shows difference-in-difference (DID) regression estimates for analyzing the effects of TARP on loan contract terms using a placebo experiment In the placebo experiment
we fictionally assume that the TARP participation took place four years earlier and we still distinguish between banks that received TARP and those that did not according to their
ldquotrue TARP program The dependent variables are the five loan contract terms loan spread size maturity collateral and covenant intensity index The explanatory variables are
TARP RECIPIENT (a dummy equal to one if the bank was provided TARP capital support) PLACEBO POST TARP (a dummy equal to one in 2005-2008 the period after the
fictional TARP program initiation) their interaction as well as borrower and other bank characteristics Borrower characteristics are borrower size market-to-book leverage
profitability tangibility cash flow volatility cash holdings ratio Borrower rating dummies are borrower SampP credit rating dummies Bank characteristics are bank size capital
adequacy asset quality management quality earnings liquidity sensitivity to market risk HHI percent metropolitan fee income diversification and DWTAF (Discount Window
andor Term Auction Facility programs) Models also include loan type dummies industry (2-digit SIC) fixed effects and year-fixed effects The estimation results are for 2001-
2008 All variables are defined in Table 1 and denote significance at 10 5 and 1 level
Assuming TARP Took Place Four Years Earlier
(1) (2) (3) (4) (5)
VARIABLES LOANSPREAD LOG (LOAN SIZE) LOG (LOAN MATURITY) COLLATERAL COV_INTENSITY_INDEX
TARP RECIPIENT 19516 -0063 -0052 -0052 -0765
(3333) (-1249) (-1622) (-2270) (-7400)
PLACIBO POST TARP x TARP RECIPIENT 15151 -0046 0081 0032 0186
(1865) (-0642) (1748) (0926) (1218)
BORROWER CHARACTERISTICS YES YES YES YES YES
BORROWER RATING DUMMIES YES YES YES YES YES
BANK CHARACTERISTICS YES YES YES YES YES
LOAN TYPE DUMMIES YES YES YES YES YES
INDUSTRY FIXED EFFECTS YES YES YES YES YES
YEAR FIXED EFFECTS YES YES YES YES YES
Observations 8117 8856 8622 8857 8857
Adjusted R-squared 0524 0726 0456 0357 0286
41
Table 5 Alternative Measure of TARP This table reports difference-in-difference (DID) regression estimates for the effects of TARP on loan contract terms using an alternative measure for TARP Support LOG (1+Bailout
Amount) The dependent variables are the five loan contract terms loan spread size maturity collateral and covenant intensity index The explanatory variables are LOG (1+Bailout
Amount) POST TARP (a dummy equal to one in 2009-2012 the period after TARP program initiation) their interaction as well as borrower and other bank characteristics Borrower
characteristics are borrower size market-to-book leverage profitability tangibility cash flow volatility cash holdings ratio Borrower rating dummies are borrower SampP credit
rating dummies Bank characteristics are bank size capital adequacy asset quality management quality earnings liquidity sensitivity to market risk HHI percent metropolitan
fee income diversification and DWTAF (Discount Window andor Term Auction Facility programs) Models also include loan type dummies industry (2-digit SIC) fixed effects
and year-fixed effects The estimation results are for 2005-2012 All variables are defined in Table 1 and denote significance at 10 5 and 1 level
LOG (1+ Bailout Amount)
(1) (2) (3) (4) (5)
VARIABLES LOANSPREAD LOG (LOAN SIZE) LOG (LOAN MATURITY) COLLATERAL COV_INTENSITY_INDEX
TARP RECIPIENT 2958 0000 -0002 -0003 -0021
(5715) (0041) (-0729) (-1284) (-2305)
POST TARP x TARP RECIPIENT -2422 0015 0011 -0005 -0034
(-2543) (2520) (3339) (-2073) (-3192)
BORROWER CHARACTERISTICS YES YES YES YES YES
BORROWER RATING DUMMIES YES YES YES YES YES
BANK CHARACTERISTICS YES YES YES YES YES
LOAN TYPE DUMMIES YES YES YES YES YES
INDUSTRY FIXED EFFECTS YES YES YES YES YES
YEAR FIXED EFFECTS YES YES YES YES YES
Observations 5372 5973 5869 5973 5973
Adjusted R-squared 0530 0666 0383 0321 0249
42
Table 6 Alternative Econometric Models This table reports difference-in-difference (DID) regression estimates for the effects of TARP on loan contract terms using alternative econometric models bank and year fixed
effects in Panel A bank year and SIC fixed effects in Panel B borrower state year and SIC fixed effects in Panel C state year and SIC fixed effects with errors clustered at the
borrower level in Panel D borrower state and year fixed effects with errors clustered at the borrower level in Panel E borrower state and year fixed effects with errors clustered at
the borrower-bank level in Panel F models excluding all bank-related controls other than proxies for CAMELS in Panel G models excluding all bank-related controls in Panel H
models excluding all borrower-related controls in Panel I models excluding all bank and borrower-related controls in Panel J and alternative econometric models for collateral
probit model with year fixed effects logit model with year fixed effects conditional loglog model with year fixed effects probit model with year and SIC fixed effects logit model
with year and SIC fixed effects and conditional loglog model with year fixed effects and errors clustered at the SIC level in Panel K The dependent variables are the five loan
contract terms loan spread size maturity collateral and covenant intensity index The explanatory variables are TARP RECIPIENT (a dummy equal to one if the bank was provided
TARP capital support) POST TARP (a dummy equal to one in 2009-2012 the period after TARP program initiation) their interaction as well as borrower and other bank
characteristics Borrower characteristics are borrower size market-to-book leverage profitability tangibility cash flow volatility cash holdings ratio Borrower rating dummies are
borrower SampP credit rating dummies Bank characteristics are bank size capital adequacy asset quality management quality earnings liquidity sensitivity to market risk HHI
percent metropolitan fee income diversification and DWTAF (Discount Window andor Term Auction Facility programs) Models also include loan type dummies industry (2-
digit SIC) fixed effects and year-fixed effects The estimation results are for 2005-2012 All variables are defined in Table 1 and denote significance at 10 5 and 1
level
Table 6 Panel A Regression Parameters ndash Bank Year and SIC Fixed Effects
Bank Year and SIC Fixed Effects
(1) (2) (3) (4) (5)
VARIABLES LOANSPREAD LOG (LOAN SIZE) LOG (LOAN MATURITY) COLLATERAL COV_INTENSITY_INDEX
POST TARP x TARP RECIPIENT -45284 0264 0204 -0095 -0657
(-2496) (2370) (3512) (-2123) (-3441)
BORROWER CHARACTERISTICS YES YES YES YES YES
BORROWER RATING DUMMIES YES YES YES YES YES
BANK CHARACTERISTICS YES YES YES YES YES
BANK FIXED EFFECTS YES YES YES YES YES
LOAN TYPE DUMMIES YES YES YES YES YES
INDUSTRY FIXED EFFECTS YES YES YES YES YES
YEAR FIXED EFFECTS YES YES YES YES YES
Observations 5372 5973 5869 5973 5973
Adjusted R-squared 0534 0668 0393 0328 0257
43 Table 6 Panel B Regression Parameters ndash Bank and Year Fixed Effects
Bank and Year Fixed Effects
(1) (2) (3) (4) (5)
VARIABLES LOANSPREAD LOG (LOAN SIZE) LOG (LOAN MATURITY) COLLATERAL COV_INTENSITY_INDEX
POST TARP x TARP RECIPIENT -34458 0310 0197 -0099 -0676
(-1954) (2675) (3468) (-2317) (-3696)
BORROWER CHARACTERISTICS YES YES YES YES YES
BORROWER RATING DUMMIES YES YES YES YES YES
BANK CHARACTERISTICS YES YES YES YES YES
BANK FIXED EFFECTS YES YES YES YES YES
LOAN TYPE DUMMIES YES YES YES YES YES
INDUSTRY FIXED EFFECTS NO NO NO NO NO
YEAR FIXED EFFECTS YES YES YES YES YES
Observations 5855 6508 6393 6508 6508
Adjusted R-squared 0520 0616 0410 0313 0246
Table 6 Panel C Regression Parameters ndash Borrower State Year and SIC Fixed Effects
Borrower State Year and SIC Fixed Effects
(1) (2) (3) (4) (5)
VARIABLES LOANSPREAD LOG (LOAN SIZE) LOG (LOAN MATURITY) COLLATERAL COV_INTENSITY_INDEX
TARP RECIPIENT 46491 -0032 -0025 -0025 -0268
(5692) (-0472) (-0563) (-0728) (-1913)
POST TARP x TARP RECIPIENT -38434 0262 0156 -0084 -0496
(-2505) (2665) (2955) (-2043) (-2823)
BORROWER CHARACTERISTICS YES YES YES YES YES
BORROWER RATING DUMMIES YES YES YES YES YES
BANK CHARACTERISTICS YES YES YES YES YES
STATE FIXED EFFECTS YES YES YES YES YES
LOAN TYPE DUMMIES YES YES YES YES YES
INDUSTRY FIXED EFFECTS YES YES YES YES YES
YEAR FIXED EFFECTS YES YES YES YES YES
Observations 5304 5891 5788 5891 5891
Adjusted R-squared 0539 0672 0388 0331 0255
44 Table 6 Panel D Regression Parameters ndash Borrower State Year and SIC Fixed Effects and Borrower Clusters
Borrower State Year and SIC Fixed Effects and Borrower Clusters
(1) (2) (3) (4) (5)
VARIABLES LOANSPREAD LOG (LOAN SIZE) LOG (LOAN MATURITY) COLLATERAL COV_INTENSITY_INDEX
TARP RECIPIENT 46491 -0032 -0025 -0025 -0268
(4601) (-0380) (-0487) (-0566) (-1474)
POST TARP x TARP RECIPIENT -38434 0262 0156 -0084 -0496
(-2141) (2677) (2240) (-1811) (-2304)
BORROWER CHARACTERISTICS YES YES YES YES YES
BORROWER RATING DUMMIES YES YES YES YES YES
BANK CHARACTERISTICS YES YES YES YES YES
STATE FIXED EFFECTS YES YES YES YES YES
LOAN TYPE DUMMIES YES YES YES YES YES
INDUSTRY FIXED EFFECTS YES YES YES YES YES
YEAR FIXED EFFECTS YES YES YES YES YES
BORROWER CLUSTERS YES YES YES YES YES
Observations 5304 5891 5788 5891 5891
Adjusted R-squared 0539 0672 0388 0331 0255
No Clusters 1985 2056 2041 2056 2056
Table 6 Panel E Regression Parameters ndash SIC and Year Fixed Effects and Borrower Clusters
SIC and Year Fixed Effects and Borrower Clusters
(1) (2) (3) (4) (5)
VARIABLES LOANSPREAD LOG (LOAN SIZE) LOG (LOAN MATURITY) COLLATERAL COV_INTENSITY_INDEX
TARP RECIPIENT 45885 -0006 -0031 -0035 -0282
(4565) (-0070) (-0599) (-0818) (-1580)
POST TARP x TARP RECIPIENT -41974 0257 0185 -0083 -0484
(-2299) (2680) (2668) (-1878) (-2234)
BORROWER CHARACTERISTICS YES YES YES YES YES
BORROWER RATING DUMMIES YES YES YES YES YES
BANK CHARACTERISTICS YES YES YES YES YES
LOAN TYPE DUMMIES YES YES YES YES YES
INDUSTRY FIXED EFFECTS YES YES YES YES YES
YEAR FIXED EFFECTS YES YES YES YES YES
BORROWER CLUSTERS YES YES YES YES YES
Observations 5372 5973 5869 5973 5973
Adjusted R-squared 0531 0666 0383 0321 0249
No Clusters 2020 2099 2083 2099 2099
45 Table 6 Panel F Regression Parameters ndash SIC and Year Fixed Effects and Borrower-Bank Clusters
SIC and Year Fixed Effects and Borrower-Bank Clusters
(1) (2) (3) (4) (5)
VARIABLES LOANSPREAD LOG (LOAN SIZE) LOG (LOAN MATURITY) COLLATERAL COV_INTENSITY_INDEX
TARP RECIPIENT 45885 -0006 -0031 -0035 -0282
(4567) (-0069) (-0595) (-0842) (-1570)
POST TARP x TARP RECIPIENT -41974 0257 0185 -0083 -0484
(-2306) (2636) (2673) (-1856) (-2233)
BORROWER CHARACTERISTICS YES YES YES YES YES
BORROWER RATING DUMMIES YES YES YES YES YES
BANK CHARACTERISTICS YES YES YES YES YES
LOAN TYPE DUMMIES YES YES YES YES YES
INDUSTRY FIXED EFFECTS YES YES YES YES YES
YEAR FIXED EFFECTS YES YES YES YES YES
BORROWER x BANK CLUSTERS YES YES YES YES YES
Observations 5372 5973 5869 5973 5973
Adjusted R-squared 0531 0666 0383 0321 0249
No Clusters 2374 2522 2498 2522 2522
Table 6 Panel G Regression Parameters ndash Exclude Bank Characteristics Other than Proxies for CAMELS
Excluding Bank Characteristics Other than Proxies for CAMELS
(1) (2) (3) (4) (5)
VARIABLES LOANSPREAD LOG (LOAN SIZE) LOG (LOAN MATURITY) COLLATERAL COV_INTENSITY_INDEX
TARP RECIPIENT 27139 0139 0047 -0060 -0370
(3600) (2232) (1121) (-2008) (-3064)
POST TARP x TARP RECIPIENT -33661 0211 0189 -0078 -0380
(-2205) (2232) (3687) (-2023) (-2276)
BORROWER CHARACTERISTICS YES YES YES YES YES
BORROWER RATING DUMMIES YES YES YES YES YES
BANK CHARACTERISTICS other than CAMELS YES YES YES YES YES
LOAN TYPE DUMMIES YES YES YES YES YES
INDUSTRY FIXED EFFECTS YES YES YES YES YES
YEAR FIXED EFFECTS YES YES YES YES YES
Observations 5396 5999 5895 5999 5999
Adjusted R-squared 0524 0666 0381 0319 0247
46 Table 6 Panel H Regression Parameters ndash Exclude All Bank Characteristics
Excluding All Bank Characteristics
(1) (2) (3) (4) (5)
VARIABLES LOANSPREAD LOG (LOAN SIZE) LOG (LOAN MATURITY) COLLATERAL COV_INTENSITY_INDEX
TARP RECIPIENT 20515 0141 0037 -0058 -0203
(3040) (2518) (1052) (-2075) (-1768)
POST TARP x TARP RECIPIENT -31711 0248 0188 -0073 -0187
(-2191) (2821) (3935) (-2056) (-1188)
BORROWER CHARACTERISTICS YES YES YES YES YES
BORROWER RATING DUMMIES YES YES YES YES YES
BANK CHARACTERISTICS NO NO NO NO NO
LOAN TYPE DUMMIES YES YES YES YES YES
INDUSTRY FIXED EFFECTS YES YES YES YES YES
YEAR FIXED EFFECTS YES YES YES YES YES
Observations 5398 6001 5897 6001 6001
Adjusted R-squared 0520 0664 0379 0317 0240
Table 6 Panel I Regression Parameters ndash Exclude All Borrower Characteristics
Excluding All Borrower Characteristics
(1) (2) (3) (4) (5)
VARIABLES LOANSPREAD LOG (LOAN SIZE) LOG (LOAN MATURITY) COLLATERAL COV_INTENSITY_INDEX
TARP RECIPIENT 44641 -0241 -0128 0007 -0168
(5140) (-2765) (-3195) (0221) (-1283)
POST TARP x TARP RECIPIENT -58612 0238 0255 -0113 -0454
(-3465) (1875) (5111) (-2661) (-2675)
BORROWER CHARACTERISTICS NO NO NO NO NO
BORROWER RATING DUMMIES YES YES YES YES YES
BANK CHARACTERISTICS YES YES YES YES YES
LOAN TYPE DUMMIES YES YES YES YES YES
INDUSTRY FIXED EFFECTS YES YES YES YES YES
YEAR FIXED EFFECTS YES YES YES YES YES
Observations 6652 7380 7234 7380 7380
Adjusted R-squared 0359 0261 0348 0130 0151
47 Table 6 Panel J Regression Parameters ndash Using 2-Digit NAICS Industries
Two-Digit NAICS Industries
(1) (2) (3) (4) (5)
VARIABLES LOANSPREAD LOG (LOAN SIZE) LOG (LOAN MATURITY) COLLATERAL COV_INTENSITY_INDEX
TARP RECIPIENT 46473 -0029 -0043 -0025 -0274
(5834) (-0432) (-0978) (-0741) (-1997)
POST TARP x TARP RECIPIENT -41588 0257 0197 -0094 -0509
(-2689) (2652) (3707) (-2367) (-2897)
BORROWER CHARACTERISTICS YES YES YES YES YES
BORROWER RATING DUMMIES YES YES YES YES YES
BANK CHARACTERISTICS YES YES YES YES YES
LOAN TYPE DUMMIES YES YES YES YES YES
2-DIGIT NAICS FIXED EFFECTS YES YES YES YES YES
YEAR FIXED EFFECTS YES YES YES YES YES
Observations 5372 5973 5869 5973 5973
Adjusted R-squared 0526 0665 0379 0318 0238
Table 6 Panel K Regression Parameters ndash Using Fama-French 48 Industries
Fama-French 48 Industries
(1) (2) (3) (4) (5)
VARIABLES LOANSPREAD LOG (LOAN SIZE) LOG (LOAN MATURITY) COLLATERAL COV_INTENSITY_INDEX
TARP RECIPIENT 45118 -0019 -0039 -0035 -0281
(5667) (-0280) (-0900) (-1035) (-2039)
POST TARP x TARP RECIPIENT -44858 0208 0194 -0090 -0502
(-2875) (2180) (3708) (-2237) (-2868)
BORROWER CHARACTERISTICS YES YES YES YES YES
BORROWER RATING DUMMIES YES YES YES YES YES
BANK CHARACTERISTICS YES YES YES YES YES
LOAN TYPE DUMMIES YES YES YES YES YES
FF48 FIXED EFFECTS YES YES YES YES YES
YEAR FIXED EFFECTS YES YES YES YES YES
Observations 5343 5940 5837 5940 5940
Adjusted R-squared 0531 0669 0383 0320 0246
48 Table 6 Panel L Regression Parameters ndash Alternative Models for Collateral
Alternative Models for Collateral
(1) (2) (3) (4) (5) (6)
VARIABLES PROBIT LOGIT CLOGLOG PROBIT LOGIT CLOGLOG
TARP RECIPIENT 0007 -0007 0051 -0038 -0099 0018
(0063) (-0036) (0451) (-0329) (-0501) (0152)
POST TARP x TARP RECIPIENT -0417 -0683 -0576 -0419 -0637 -0544
(-2829) (-2679) (-3788) (-2653) (-2304) (-3388)
BORROWER CHARACTERISTICS YES YES YES YES YES YES
BORROWER RATING DUMMIES YES YES YES YES YES YES
BANK CHARACTERISTICS YES YES YES YES YES YES
LOAN TYPE DUMMIES YES YES YES YES YES YES
INDUSTRY FIXED EFFECTS NO NO NO YES YES YES
YEAR FIXED EFFECTS YES YES YES YES YES YES
Observations 6463 6463 6463 5831 5831 5831
Pseudo R-squared (or R-squared) 0265 0266 0275 0277
49
Table 7 Additional Robustness Tests This table reports difference-in-difference (DID) regression estimates for the effects of TARP on loan contract terms from additional robustness tests Panel A reports estimates when
excluding borrowers with missing SampP credit rating Panel B reports estimates when excluding borrowers with only 1 loan Panel C reports estimates when excluding foreign banks
Panel D reports estimates for the timing of the impact of TARP on loan contract terms The dependent variables are the five loan contract terms loan size spread maturity collateral
and covenant intensity index The explanatory variables are TARP RECIPIENT (a dummy equal to one if the bank was provided TARP capital support) POST TARP (a dummy
equal to one in 2009-2012 the period after TARP program initiation) their interaction (Panel A B C and D) In Panel D the coefficients are the interactions of the TARP Recipient
variable with year dummies for each year after the TARP program was implemented (2009 2010 2011 and 2012) In Panel E we examine effects of TARP on loan contract terms
for involuntary and voluntary TARP participants In all regression we also control for borrower and other bank characteristics Borrower characteristics are borrower size market-
to-book leverage profitability tangibility cash flow volatility cash holdings ratio Borrower rating dummies are borrower SampP credit rating dummies Bank characteristics are
bank size capital adequacy asset quality management quality earnings liquidity sensitivity to market risk HHI percent metropolitan fee income diversification and DWTAF
(Discount Window andor Term Auction Facility programs) Models also include loan type dummies industry (2-digit SIC) fixed effects and year-fixed effects The estimation
results are for 2005-2012 All variables are defined in Table 1 and denote significance at 10 5 and 1 level
Table 7 Panel A Regression Parameters ndash Exclude Borrowers with Missing SampP Credit Rating
Exclude borrowers with missing ratings
(1) (2) (3) (4) (5)
VARIABLES LOANSPREAD LOG (LOAN SIZE) LOG (LOAN MATURITY) COLLATERAL COV_INTENSITY_INDEX
TARP RECIPIENT 36298 0011 -0024 -0197 -0163
(2405) (0070) (-0264) (-2666) (-0549)
POST TARP x TARP RECIPIENT -50990 0429 0199 -0090 -1043
(-2606) (2717) (2483) (-1664) (-3858)
BORROWER CHARACTERISTICS YES YES YES YES YES
BORROWER RATING DUMMIES YES YES YES YES YES
BANK CHARACTERISTICS YES YES YES YES YES
LOAN TYPE DUMMIES YES YES YES YES YES
INDUSTRY FIXED EFFECTS YES YES YES YES YES
YEAR FIXED EFFECTS YES YES YES YES YES
Observations 2664 3014 2949 3014 3014
Adjusted R-squared 0661 0520 0496 0447 0351
Table 7 Panel B Regression Parameters ndash Exclude Borrowers with Only 1 Loan
Exclude borrowers with only 1 loan
(1) (2) (3) (4) (5)
VARIABLES LOANSPREAD LOG (LOAN SIZE) LOG (LOAN MATURITY) COLLATERAL COV_INTENSITY_INDEX
TARP RECIPIENT 43931 -0044 -0009 -0057 -0323
(4919) (-0556) (-0180) (-1533) (-2073)
POST TARP x TARP RECIPIENT -44434 0322 0194 -0082 -0515
(-2653) (2989) (3440) (-1883) (-2717)
BORROWER CHARACTERISTICS YES YES YES YES YES
BORROWER RATING DUMMIES YES YES YES YES YES
BANK CHARACTERISTICS YES YES YES YES YES
LOAN TYPE DUMMIES YES YES YES YES YES
INDUSTRY FIXED EFFECTS YES YES YES YES YES
YEAR FIXED EFFECTS YES YES YES YES YES
Observations 4817 5372 5278 5372 5372
Adjusted R-squared 0538 0647 0386 0329 0267
50 Table 7 Panel C Regression Parameters ndash Exclude Foreign Banks
Exclude Foreign Banks
(1) (2) (3) (4) (5)
VARIABLES LOANSPREAD LOG (LOAN SIZE) LOG (LOAN MATURITY) COLLATERAL COV_INTENSITY_INDEX
TARP RECIPIENT 36746 -0135 0077 -0007 -0363
(2631) (-1259) (1103) (-0120) (-1527)
POST TARP x TARP RECIPIENT -48900 0467 0302 -0101 -0520
(-2214) (3575) (4554) (-2028) (-2217)
BORROWER CHARACTERISTICS YES YES YES YES YES
BANK CHARACTERISTICS YES YES YES YES YES
LOAN TYPE DUMMIES YES YES YES YES YES
INDUSTRY FIXED EFFECTS YES YES YES YES YES
YEAR FIXED EFFECTS YES YES YES YES YES
Observations 4663 5212 5119 5212 5212
Adjusted R-squared 0540 0643 0397 0326 0262
Table 7 Panel D Regression Parameters ndash Timing of the Effects
Timeline of TARP Effects
(1) (2) (3) (4) (5)
VARIABLES LOANSPREAD LOG (LOAN SIZE) LOG (LOAN MATURITY) COLLATERAL COV_INTENSITY_INDEX
TARP RECIPIENT 47114 -0013 -0033 -0036 -0276
(5889) (-0192) (-0748) (-1073) (-2003)
POST TARP 2009 x TARP RECIPIENT -35537 0207 0161 -0083 -0383
(-2112) (2002) (2925) (-2017) (-2056)
POST TARP 2010 x TARP RECIPIENT -56874 0352 0202 -0091 -0587
(-3633) (3073) (3367) (-1799) (-2720)
POST TARP 2011 x TARP RECIPIENT -52606 0358 0247 -0087 -0739
(-3145) (2852) (3766) (-1454) (-3099)
POST TARP 2012 x TARP RECIPIENT -58945 0310 0260 -0002 -0540
(-2798) (1947) (3265) (-0028) (-1809)
BORROWER CHARACTERISTICS YES YES YES YES YES
BORROWER RATING DUMMIES YES YES YES YES YES
BANK CHARACTERISTICS YES YES YES YES YES
LOAN TYPE DUMMIES YES YES YES YES YES
INDUSTRY FIXED EFFECTS YES YES YES YES YES
YEAR FIXED EFFECTS YES YES YES YES YES
Observations 5372 5973 5869 5973 5973
Adjusted R-squared 0531 0666 0383 0321 0249
51 Table 7 Panel E Regression Parameters ndash Involuntary and Voluntary Participants
Involuntary and Voluntary Participants
(1) (2) (3) (4) (5)
VARIABLES LOANSPREAD LOG (LOAN SIZE) LOG (LOAN MATURITY) COLLATERAL COV_INTENSITY_INDEX
TARP RECIPIENT INVOL 78213 -0127 -0136 0068 -0411
(7568) (-1464) (-2322) (1539) (-2232)
TARP RECIPIENT VOL 38490 0020 -0027 -0056 -0341
(4676) (0280) (-0574) (-1567) (-2325)
POST TARP x TARP RECIPIENT INVOL -34444 0232 0142 -0061 -0616
(-2061) (2252) (2607) (-1439) (-3356)
POST TARP x TARP RECIPIENT VOL -32146 0218 0193 -0054 -0315
(-1990) (2013) (3142) (-1098) (-1529)
BORROWER CHARACTERISTICS YES YES YES YES YES
BORROWER RATING DUMMIES YES YES YES YES YES
BANK CHARACTERISTICS YES YES YES YES YES
LOAN TYPE DUMMIES YES YES YES YES YES
INDUSTRY FIXED EFFECTS YES YES YES YES YES
YEAR FIXED EFFECTS YES YES YES YES YES
Observations 5372 5973 5869 5973 5973
Adjusted R-squared 0532 0666 0384 0322 0249
Table 7 Panel F Regression Parameters ndash Stress Test and Non-Stress Test Participants
Stress Tests (SCAP and CCAR) and Non-Stress Tests Participants
(1) (2) (3) (4) (5)
VARIABLES LOANSPREAD LOG (LOAN SIZE) LOG (LOAN MATURITY) COLLATERAL COV_INTENSITY_INDEX
STRESS-TEST TARP RECIPIENT 35412 0089 -0035 -0089 -0306
(4016) (1169) (-0729) (-2317) (-1906)
NON-STRESS-TEST TARP RECIPIENT 78954 -0296 -0047 0115 -0271
(6424) (-2761) (-0681) (2416) (-1218)
POST TARP x STRESS-TEST TARP RECIPIENT -37936 0231 0174 -0076 -0505
(-2438) (2324) (3319) (-1836) (-2837)
POST TARP x NON-STRESS-TEST TARP RECIPIENT -84244 0541 0286 -0184 -0303
(-2973) (3497) (2641) (-2326) (-0892)
BORROWER CHARACTERISTICS YES YES YES YES YES
BORROWER RATING DUMMIES YES YES YES YES YES
BANK CHARACTERISTICS YES YES YES YES YES
LOAN TYPE DUMMIES YES YES YES YES YES
INDUSTRY FIXED EFFECTS YES YES YES YES YES
YEAR FIXED EFFECTS YES YES YES YES YES
Observations 5372 5973 5869 5973 5973
Adjusted R-squared 0531 0666 0383 0322 0249
52
Table 8 Effects of TARP on Loan Contract Terms Borrower Risk This table shows additional subsample tests for analyzing the effects of TARP on loan contract terms It reports difference-in-difference (DID) regression estimates when
differentiating between low versus high risk borrowers Panel A reports the difference-in-difference (DID) regression estimates for TARP lending to high risk borrowers (BB and
below SampP credit rating borrowers) and low risk borrowers (BBB and above SampP credit rating borrowers) in Panel A1 and the tests of the equality of the effects of TARP lending
for the two different types of borrowers in Panel A2 Panel B reports the difference-in-difference (DID) regression estimates for TARP lending to low risk borrowers (low leverage
borrowers that is leverage le median) and high risk borrowers (high leverage borrowers that is leverage gt median) in Panel B1 and the tests of the equality of the effects of TARP
lending for the two different types of borrowers in Panel B2 Panel C reports the difference-in-difference (DID) regression estimates for TARP lending to low risk borrowers (low
cash flow volatility borrowers that is cash flow volatility le median) and high risk borrowers (high cash flow volatility borrowers that is cash flow volatility gt median) in Panel C1
and the tests of the equality of the effects of TARP lending for the two different types of borrowers in Panel C2The dependent variables are the five loan contract terms loan spread
size maturity collateral and covenant intensity index The explanatory variables are TARP RECIPIENT (a dummy equal to one if the bank was provided TARP capital support)
POST TARP (a dummy equal to one in 2009-2012 the period after TARP program initiation) their interaction as well as borrower and other bank characteristics Borrower
characteristics are borrower size market-to-book leverage profitability tangibility cash flow volatility cash holdings ratio Borrower rating dummies are borrower SampP credit
rating dummies Bank characteristics are bank size capital adequacy asset quality management quality earnings liquidity sensitivity to market risk HHI percent metropolitan
fee income diversification and DWTAF (Discount Window andor Term Auction Facility programs) Models also include loan type dummies industry (2-digit SIC) fixed effects
and year-fixed effects The estimation results are for 2005-2012 All variables are defined in Table 1 and denote significance at 10 5 and 1 level
Table 8 Panel A Effects by Borrower Risk SampP Credit Rating
Table 8 Panel A1 Regression Estimates High Risk Borrowers (SampP Credit Rating BB and below)
(1) (2) (3) (4) (5)
VARIABLES LOANSPREAD LOG (LOAN SIZE) LOG (LOAN MATURITY) COLLATERAL COV_INTENSITY_INDEX
TARP RECIPIENT 72453 -0009 -0034 -0240 0213
(3466) (-0044) (-0268) (-2476) (0504)
POST TARP x TARP RECIPIENT -63352 0526 0313 -0198 -1980
(-2108) (2466) (2834) (-2301) (-4900)
BORROWER CONTROLS YES YES YES YES YES
BORROWER RATING DUMMIES YES YES YES YES YES
BANK CONTROLS YES YES YES YES YES
LOAN TYPE DUMMIES YES YES YES YES YES
2-DIGIT SIC FIXED EFFECTS YES YES YES YES YES
YEAR FIXED EFFECTS YES YES YES YES YES
Observations 1453 1590 1533 1590 1590
Adjusted R-squared 0524 0484 0246 0088 0168
Low Risk Borrowers (SampP Credit Rating BBB and above)
(1) (2) (3) (4) (5)
VARIABLES LOANSPREAD LOG (LOAN SIZE) LOG (LOAN MATURITY) COLLATERAL COV_INTENSITY_INDEX
TARP RECIPIENT -50191 0150 -0012 -0243 -0191
(-2292) (0530) (-0103) (-1850) (-0542)
POST TARP x TARP RECIPIENT -7846 0282 -0070 0055 0246
(-0374) (1044) (-0782) (0694) (0678)
BORROWER CONTROLS YES YES YES YES YES
BORROWER RATING DUMMIES YES YES YES YES YES
BANK CONTROLS YES YES YES YES YES
LOAN TYPE DUMMIES YES YES YES YES YES
2-DIGIT SIC FIXED EFFECTS YES YES YES YES YES
YEAR FIXED EFFECTS YES YES YES YES YES
Observations 1211 1424 1416 1424 1424
Adjusted R-squared 0732 0471 0662 0157 0287
Table 8 Panel A2 Tests of the Equality of the Effects of TARP for Different Types of Borrowers
53 Borrower Risk (SampP Credit Rating)
VARIABLES LOANSPREAD LOG (LOAN SIZE) LOG (LOAN MATURITY) COLLATERAL COV_INTENSITY_INDEX
t-stat Effect for high risk borrowers =
effect for low risk borrowers -1514 0710 2695 -2167 -4099
Table 8 Panel B Effects by Borrower Risk High Leverage vs Low Leverage
Table 8 Panel B1 Regression Estimates High Risk Borrowers (Leverage gt Median)
(1) (2) (3) (4) (5)
VARIABLES LOANSPREAD LOG (LOAN SIZE) LOG (LOAN MATURITY) COLLATERAL COV_INTENSITY_INDEX
TARP RECIPIENT 27066 0110 -0065 -0007 -0132
(2274) (0965) (-0970) (-0138) (-0595)
POST TARP x TARP RECIPIENT -45707 0183 0135 -0157 -0873
(-2333) (1449) (2049) (-3056) (-3755)
BORROWER CONTROLS YES YES YES YES YES
BORROWER RATING DUMMIES YES YES YES YES YES
BANK CONTROLS YES YES YES YES YES
LOAN TYPE DUMMIES YES YES YES YES YES
2-DIGIT SIC FIXED EFFECTS YES YES YES YES YES
YEAR FIXED EFFECTS YES YES YES YES YES
Observations 2609 2865 2802 2865 2865
Adjusted R-squared 0560 0597 0335 0320 0248
Low Risk Borrowers (Leverage le Median)
(1) (2) (3) (4) (5)
VARIABLES LOANSPREAD LOG (LOAN SIZE) LOG (LOAN MATURITY) COLLATERAL COV_INTENSITY_INDEX
TARP RECIPIENT 44304 -0094 0019 -0088 -0394
(4525) (-1132) (0361) (-1976) (-2266)
POST TARP x TARP RECIPIENT -26788 0309 0212 0006 0044
(-1173) (2084) (2410) (0083) (0166)
BORROWER CONTROLS YES YES YES YES YES
BORROWER RATING DUMMIES YES YES YES YES YES
BANK CONTROLS YES YES YES YES YES
LOAN TYPE DUMMIES YES YES YES YES YES
2-DIGIT SIC FIXED EFFECTS YES YES YES YES YES
YEAR FIXED EFFECTS YES YES YES YES YES
Observations 2763 3108 3067 3108 3108
Adjusted R-squared 0460 0732 0452 0334 0290
Table 8 Panel B2 Tests of the Equality of the Effects of TARP for Different Types of Borrowers Borrower Risk (Leverage Median Cutoff)
VARIABLES LOANSPREAD LOG (LOAN SIZE) LOG (LOAN MATURITY) COLLATERAL COV_INTENSITY_INDEX
t-stat Effect for high risk borrowers =
Effect for low risk borrowers -0629 -0648 -0700 -1954 -2615
54 Table 8 Panel C Effects by Borrower Risk Cash Flow Volatility
Table 8 Panel C1 Regression Estimates High Risk Borrowers (Cash Flow Volatility gt Median)
(1) (2) (3) (4) (5)
VARIABLES LOANSPREAD LOG (LOAN SIZE) LOG (LOAN MATURITY) COLLATERAL COV_INTENSITY_INDEX
TARP RECIPIENT 62459 0001 -0138 -0057 -0256
(5579) (0010) (-2384) (-1379) (-1479)
POST TARP x TARP RECIPIENT -48099 0238 0228 -0108 -0666
(-2272) (1941) (3491) (-2266) (-3016)
BORROWER CONTROLS YES YES YES YES YES
BORROWER RATING DUMMIES YES YES YES YES YES
BANK CONTROLS YES YES YES YES YES
LOAN TYPE DUMMIES YES YES YES YES YES
2-DIGIT SIC FIXED EFFECTS YES YES YES YES YES
YEAR FIXED EFFECTS YES YES YES YES YES
Observations 2731 2986 2937 2986 2986
Adjusted R-squared 0479 0670 0309 0278 0199
Low Risk Borrowers (Cash Flow Volatility le Median)
(1) (2) (3) (4) (5)
VARIABLES LOANSPREAD LOG (LOAN SIZE) LOG (LOAN MATURITY) COLLATERAL COV_INTENSITY_INDEX
TARP RECIPIENT 8916 0020 0159 -0049 -0242
(0779) (0168) (2386) (-0773) (-1017)
POST TARP x TARP RECIPIENT -28013 0287 0093 -0026 -0094
(-1543) (1886) (1113) (-0340) (-0321)
BORROWER CONTROLS YES YES YES YES YES
BORROWER RATING DUMMIES YES YES YES YES YES
BANK CONTROLS YES YES YES YES YES
LOAN TYPE DUMMIES YES YES YES YES YES
2-DIGIT SIC FIXED EFFECTS YES YES YES YES YES
YEAR FIXED EFFECTS YES YES YES YES YES
Observations 2641 2987 2932 2987 2987
Adjusted R-squared 0561 0639 0475 0326 0302
Table 8 Panel C2 Tests of the Equality of the Effects of TARP for Different Types of Borrowers Borrower Risk (Cash Flow Volatility Median Cutoff)
VARIABLES LOANSPREAD LOG (LOAN SIZE) LOG (LOAN MATURITY) COLLATERAL COV_INTENSITY_INDEX
t-stat Effect for high risk borrowers = Effect for low risk borrowers -0720 -0251 1271 -0895 -2071
55
Table 9 Effects of TARP on Loan Contract Terms Borrower Financial Constraints This table shows additional subsample tests for analyzing the effects of TARP on loan contract terms It reports the difference-in-difference (DID) regression estimates for the effect
of TARP on loan terms to borrowers with different characteristics effect of TARP on large and small size borrowers (using median as a cutoff for the BORROWER SIZE in terms
of total assets) in Panel A1 and public versus private status borrowers in Panel B1 The tests of the equality of the effects of TARP lending for the different types of borrowers are
reported in Panels A2 and B2 respectively The dependent variables are the five loan contract terms loan spread size maturity collateral and covenant intensity index The
explanatory variables are TARP RECIPIENT (a dummy equal to one if the bank was provided TARP capital support) POST TARP (a dummy equal to one in 2009-2012 the period
after TARP program initiation) their interaction as well as borrower and other bank characteristics Borrower characteristics are borrower size market-to-book leverage
profitability tangibility cash flow volatility cash holdings ratio Borrower rating dummies are borrower SampP credit rating dummies Bank characteristics are bank size capital
adequacy asset quality management quality earnings liquidity sensitivity to market risk HHI percent metropolitan fee income diversification and DWTAF (Discount Window
andor Term Auction Facility programs) Models also include loan type dummies industry (2-digit SIC) fixed effects and year-fixed effects The estimation results are for 2005-
2012 All variables are defined in Table 1 and denote significance at 10 5 and 1 level
Table 9 Panel A Effects by Borrower Financial Constraints Large versus Small Borrowers
Table 9 Panel A1 Regression Estimates Large Borrowers (Borrower Size gt Median)
(1) (2) (3) (4) (5)
VARIABLES LOANSPREAD LOG (LOAN SIZE) LOG (LOAN MATURITY) COLLATERAL COV_INTENSITY_INDEX
TARP RECIPIENT 38950 0154 -0273 -0177 -0181
(2414) (0804) (-2333) (-2055) (-0630)
POST TARP x TARP RECIPIENT -67952 0403 0244 -0046 -0662
(-2919) (2385) (2777) (-0772) (-2387)
BORROWER CONTROLS YES YES YES YES YES
BORROWER RATING DUMMIES YES YES YES YES YES
BANK CONTROLS YES YES YES YES YES
LOAN TYPE DUMMIES YES YES YES YES YES
2-DIGIT SIC FIXED EFFECTS YES YES YES YES YES
YEAR FIXED EFFECTS YES YES YES YES YES
Observations 2315 2665 2625 2665 2665
Adjusted R-squared 0638 0381 0524 0418 0325
Small Borrowers (Borrower Size le Median)
(1) (2) (3) (4) (5)
VARIABLES LOANSPREAD LOG (LOAN SIZE) LOG (LOAN MATURITY) COLLATERAL COV_INTENSITY_INDEX
TARP RECIPIENT 40467 0038 -0001 -0017 -0221
(4202) (0510) (-0020) (-0417) (-1343)
POST TARP x TARP RECIPIENT -15631 0072 0186 -0035 -0221
(-0795) (0624) (2855) (-0633) (-0963)
BORROWER CONTROLS YES YES YES YES YES
BORROWER RATING DUMMIES YES YES YES YES YES
BANK CONTROLS YES YES YES YES YES
LOAN TYPE DUMMIES YES YES YES YES YES
2-DIGIT SIC FIXED EFFECTS YES YES YES YES YES
YEAR FIXED EFFECTS YES YES YES YES YES
Observations 3057 3308 3244 3308 3308
Adjusted R-squared 0445 0555 0261 0156 0113
56 Table 9 Panel A2 Tests of the Equality of the Effects of TARP for Different Types of Borrowers
Borrower Size (Median Cutoff)
VARIABLES LOANSPREAD LOG (LOAN SIZE) LOG (LOAN MATURITY) COLLATERAL COV_INTENSITY_INDEX
t-stat Effect for large borrowers = effect
for small borrowers -1717 1615 0530 -0134 -1225
Table 9 Panel B Effects by Borrower Financial Constraints Public versus Private Borrowers
Table 9 Panel B1 Regression Estimates Public Borrowers (Public =1)
(1) (2) (3) (4) (5)
VARIABLES LOANSPREAD LOG (LOAN SIZE) LOG (LOAN MATURITY) COLLATERAL COV_INTENSITY_INDEX
TARP RECIPIENT 47806 -0053 -0037 -0029 -0263
(5575) (-0730) (-0819) (-0793) (-1801)
POST TARP x TARP RECIPIENT -51874 0235 0203 -0098 -0565
(-3145) (2229) (3537) (-2229) (-3039)
BORROWER CONTROLS YES YES YES YES YES
BORROWER RATING DUMMIES YES YES YES YES YES
BANK CONTROLS YES YES YES YES YES
LOAN TYPE DUMMIES YES YES YES YES YES
2-DIGIT SIC FIXED EFFECTS YES YES YES YES YES
YEAR FIXED EFFECTS YES YES YES YES YES
Observations 4235 4716 4652 4716 4716
Adjusted R-squared 0575 0701 0416 0341 0273
Private Borrowers (Public =0)
(1) (2) (3) (4) (5)
VARIABLES LOANSPREAD LOG (LOAN SIZE) LOG (LOAN MATURITY) COLLATERAL COV_INTENSITY_INDEX
TARP RECIPIENT 42711 0279 0054 0008 0046
(2012) (1577) (0493) (0090) (0122)
POST TARP x TARP RECIPIENT -8560 0249 -0043 -0031 -0538
(-0244) (1160) (-0346) (-0323) (-1248)
BORROWER CONTROLS YES YES YES YES YES
BORROWER RATING DUMMIES YES YES YES YES YES
BANK CONTROLS YES YES YES YES YES
LOAN TYPE DUMMIES YES YES YES YES YES
2-DIGIT SIC FIXED EFFECTS YES YES YES YES YES
YEAR FIXED EFFECTS YES YES YES YES YES
Observations 1137 1257 1217 1257 1257
Adjusted R-squared 0431 0552 0308 0281 0218
Table 9 Panel B2 Tests of the Equality of the Effects of TARP for Different Types of Borrowers Public vs Private Borrowers
VARIABLES LOANSPREAD LOG (LOAN SIZE) LOG (LOAN MATURITY) COLLATERAL COV_INTENSITY_INDEX
t-stat Effect for publicly listed borrowers = effect for private borrowers -1117 -0058 1791 -0640 -0058
57
Table 10 Effects of TARP on Loan Contract Terms Relationship Lending This table shows additional subsample tests for analyzing the effects of TARP on loan contract terms It reports the difference-in-difference (DID) regression estimates for TARP
lending to relationship borrowers (borrowers with a prior relationship to a TARP bank in the pre-TARP period) and non-relationship borrowers (borrowers without a prior relationship
to a TARP bank in the pre-TARP period) in Panel A1 and the tests of the equality of the effects of TARP lending for the two different types of borrowers in Panel A2 The dependent
variables are the five loan contract terms loan spread size maturity collateral and covenant intensity index The explanatory variables are TARP RECIPIENT (a dummy equal to
one if the bank was provided TARP capital support) POST TARP (a dummy equal to one in 2009-2012 the period after TARP program initiation) their interaction as well as
borrower and other bank characteristics Borrower characteristics are borrower size market-to-book leverage profitability tangibility cash flow volatility cash holdings ratio
Borrower rating dummies are borrower SampP credit rating dummies Bank characteristics are bank size capital adequacy asset quality management quality earnings liquidity
sensitivity to market risk HHI percent metropolitan fee income diversification and DWTAF (Discount Window andor Term Auction Facility programs) Models also include
loan type dummies industry (2-digit SIC) fixed effects and year-fixed effects The estimation results are for 2005-2012 All variables are defined in Table 1 and denote
significance at 10 5 and 1 level
Table 10 Panel A Effects by Borrower Relationship Lending Status Borrowers with a prior relationship to TARP banks versus those without one
Table 10 Panel A1 Regression Estimates Borrowers with a prior relationship to TARP banks
(1) (2) (3) (4) (5)
VARIABLES LOANSPREAD LOG (LOAN SIZE) LOG (LOAN MATURITY) COLLATERAL COV_INTENSITY_INDEX
TARP RECIPIENT 17275 -0136 0060 -0302 -0845
(0530) (-0596) (0430) (-2666) (-1744)
POST TARP x TARP RECIPIENT -87386 0455 0151 -0102 -0200
(-2214) (2300) (1727) (-1318) (-0540)
BORROWER CONTROLS YES YES YES YES YES
BORROWER RATING DUMMIES YES YES YES YES YES
BANK CONTROLS YES YES YES YES YES
LOAN TYPE DUMMIES YES YES YES YES YES
2-DIGIT SIC FIXED EFFECTS YES YES YES YES YES
YEAR FIXED EFFECTS YES YES YES YES YES
Observations 1519 1749 1723 1749 1749
Adjusted R-squared 0596 0643 0522 0404 0318
Borrowers without a prior relationship to TARP banks
(1) (2) (3) (4) (5)
VARIABLES LOANSPREAD LOG (LOAN SIZE) LOG (LOAN MATURITY) COLLATERAL COV_INTENSITY_INDEX
TARP RECIPIENT 47880 -0032 -0042 0002 -0109
(5951) (-0453) (-0899) (0050) (-0727)
POST TARP x TARP RECIPIENT -27487 0186 0203 -0083 -0542
(-1788) (1649) (3212) (-1732) (-2691)
BORROWER CONTROLS YES YES YES YES YES
BORROWER RATING DUMMIES YES YES YES YES YES
BANK CONTROLS YES YES YES YES YES
LOAN TYPE DUMMIES YES YES YES YES YES
2-DIGIT SIC FIXED EFFECTS YES YES YES YES YES
YEAR FIXED EFFECTS YES YES YES YES YES
Observations 3853 4224 4146 4224 4224
Adjusted R-squared 0517 0658 0340 0304 0232
Table 10 Panel A2 Tests of the Equality of the Effects of TARP for Different Types of Borrowers Borrowers with a prior relationship to TARP banks vs those without one
LOANSPREAD LOG (LOAN SIZE) LOG (LOAN MATURITY) COLLATERAL COV_INTENSITY_INDEX
t-stat Effects for relationship borrowers = Effects for non-relationship borrowers -1414 1126 -0484 -0209 0811
Y-1
Chapter Y INTERNET APPENDIX Y ndash ADDITIONAL TESTS
This appendix contains additional tests on which borrowers benefited from the TARP bailout
program Specifically we investigate whether borrowers using term loans and revolvers benefited and how
benefits differ according to borrower market concentration (relatively low and high industry HHI
borrowers)
Y1 Different Loan Types
The DealScan dataset contains term loans revolvers and other loans A term loan is for a specific
amount that has a specified repayment schedule while a revolver allows a borrower to drawdown repay
and redraw up to a certain amount at any point over the life of the agreement As noted in Ivashina (2009)
there may be differences between term loans and revolvers We explore whether borrowers using term loans
benefited more or less relative to those using revolvers
Theoretically term loan or revolver borrowers may be treated differently because they differ in risk
and relationship characteristics both of which may have ambiguous effects as shown in Hypotheses H2a-
b and H4a-b in Section 6 Either term loans or revolvers could be safer for banks Term loans may be safer
because of the extra takedown or liquidity risk associated with revolvers Revolvers may be safer because
they may be more often given to the safer borrowers In addition revolvers may be more often associated
with banking relationships (Berger and Udell 1995 Dennis Nandy and Sharpe 2000) We rerun our
analysis according to whether borrowers use term loans or revolvers
Regression estimates are shown in Table Y1 Panel A1 while the tests of equality between the
different types of loans are shown in Panel A2 All loan contract terms improved more for term-loan
borrowers although the differences between term-loan and revolver borrowers are not statistically
significant except for loan size Overall TARP banks appear to have provided more favorable terms to
borrowers using both loan types but more so for term-loan borrowers
Y-2
Y2 Other Borrower Characteristics Borrower Industry Concentration
Borrower market power may also affect loan contract term results We do not have information on
the market power of the borrower vis-agrave-vis the bank However following Giroud and Mueller (2011) we
measure the borrower industry concentration (HHI) which may be relatively correlated with the borrower
market power34 We group borrowers according to whether they are in relatively concentrated industries
(industry HHI gt median) or relatively unconcentrated industries (industry HHI le median) We compare the
net impact of TARP on changes in loan contract terms for the two different types of borrowers
Regression estimates are shown in Table Y2 Panel A1 while the tests of equality between the
different groups are shown in Panel A2 We find that borrowers from both relatively concentrated and
relatively unconcentrated industries experience improvements in contract terms as a result of TARP
Although the coefficients for loan spread and maturity are larger for the borrowers in relatively concentrated
industries the coefficients for loan size and covenant intensity are larger for the borrowers in relatively
unconcentrated industries However the differences between the two types are not statistically significant35
34 The HHI is computed as the sum of squared market shares of the firms in each industry where the market shares
are computed from Compustat using the firmsrsquo total sales When computing the HHI we use all available Compustat
firms except firms for which sales are either missing or negative 35 In unreported tests we also perform tests using an alternative proxy for borrower industry concentration ndash the top
four firms in the industry concentration ratio ndash and we obtain consistent results
Y-3
Table Y1 Effects of TARP on Loan Contract Terms Loan Types This table shows additional subsample tests for analyzing the effects of TARP on loan contract terms It reports the difference-in-difference (DID) regression estimates for the effect
of TARP on loan terms to borrowers for different loan types (term loans versus revolvers) in Panel A1 The tests of the equality of the effects of TARP lending for the two different
types of loans are reported in Panel A2 The dependent variables are the five loan contract terms loan spread size maturity collateral and covenant intensity index The explanatory
variables are TARP RECIPIENT (a dummy equal to one if the bank was provided TARP capital support) POST TARP (a dummy equal to one in 2009-2012 the period after TARP
program initiation) their interaction as well as borrower and other bank characteristics Borrower characteristics are borrower size market-to-book leverage profitability tangibility
cash flow volatility cash holdings ratio Borrower rating dummies are borrower SampP credit rating dummies Bank characteristics are bank size capital adequacy asset quality
management quality earnings liquidity sensitivity to market risk HHI percent metropolitan fee income diversification and DWTAF (Discount Window andor Term Auction
Facility programs) Models also include loan type dummies industry (2-digit SIC) fixed effects and year-fixed effects The estimation results are for 2005-2012 All variables are
defined in Table 1 and denote significance at 10 5 and 1 level
Table Y1 Panel A Effects for Different Types of Loans Term Loans versus Revolvers
Table Y1 Panel A1 Regression Estimates Loan Type Term Loans
(1) (2) (3) (4) (5)
VARIABLES LOANSPREAD LOG (LOAN SIZE) LOG (LOAN MATURITY) COLLATERAL COV_INTENSITY_INDEX
TARP RECIPIENT 107423 -0013 -0203 0021 -0199
(4609) (-0096) (-2034) (0291) (-0601)
POST TARP x TARP RECIPIENT -78453 0591 0385 -0173 -0906
(-1868) (2840) (2934) (-2011) (-2285)
BORROWER CONTROLS YES YES YES YES YES
BORROWER RATING DUMMIES YES YES YES YES YES
BANK CONTROLS YES YES YES YES YES
LOAN TYPE DUMMIES YES YES YES YES YES
2-DIGIT SIC FIXED EFFECTS YES YES YES YES YES
YEAR FIXED EFFECTS YES YES YES YES YES
Observations 1313 1400 1358 1400 1400
Adjusted R-squared 0406 0625 0198 0173 0154
Loan Type Revolvers
(1) (2) (3) (4) (5)
VARIABLES LOANSPREAD LOG (LOAN SIZE) LOG (LOAN MATURITY) COLLATERAL COV_INTENSITY_INDEX
TARP RECIPIENT 27767 0000 -0008 -0044 -0242
(3395) (0000) (-0177) (-1092) (-1507)
POST TARP x TARP RECIPIENT -30193 0088 0137 -0059 -0292
(-1962) (0845) (2376) (-1130) (-1408)
BORROWER CONTROLS YES YES YES YES YES
BORROWER RATING DUMMIES YES YES YES YES YES
BANK CONTROLS YES YES YES YES YES
LOAN TYPE DUMMIES YES YES YES YES YES
2-DIGIT SIC FIXED EFFECTS YES YES YES YES YES
YEAR FIXED EFFECTS YES YES YES YES YES
Observations 3753 4067 4032 4067 4067
Adjusted R-squared 0600 0696 0196 0336 0242
Table Y1 Panel A2 Tests of the Equality of the Effects of TARP for Different Types of Loans Term Loans versus Revolvers
VARIABLES LOANSPREAD LOG (LOAN SIZE) LOG (LOAN MATURITY) COLLATERAL COV_INTENSITY_INDEX
t-stat Effect for term loans = effect for revolvers -1079 2159 1731 -1134 -1374
Y-4
Table Y2 Effects of TARP on Loan Contract Terms Other Borrower Characteristics This table shows additional subsample tests for analyzing the effects of TARP on loan contract terms It reports the difference-in-difference (DID) regression estimates for the effect
of TARP on loan terms to borrowers from relatively concentrated and unconcentrated industries (using median as a cutoff for the borrower industry HHI) in Panel A1 The tests of
the equality of the effects of TARP lending for the different types of borrowers are reported in Panel A2 The dependent variables are the five loan contract terms loan spread size
maturity collateral and covenant intensity index The explanatory variables are TARP RECIPIENT (a dummy equal to one if the bank was provided TARP capital support) POST
TARP (a dummy equal to one in 2009-2012 the period after TARP program initiation) their interaction as well as borrower and other bank characteristics Borrower characteristics
are borrower size market-to-book leverage profitability tangibility cash flow volatility cash holdings ratio Borrower rating dummies are borrower SampP credit rating dummies
Bank characteristics are bank size capital adequacy asset quality management quality earnings liquidity sensitivity to market risk HHI percent metropolitan fee income
diversification and DWTAF (Discount Window andor Term Auction Facility programs) Models also include loan type dummies industry (2-digit SIC) fixed effects and year-fixed
effects The estimation results are for 2005-2012 All variables are defined in Table 1 and denote significance at 10 5 and 1 level
Table Y2 Panel A Effects for Borrowers in Relatively Concentrated (High HHI) and Unconcentrated (Low HHI) Industries
Table Y2 Panel A1 Regression Estimates
Borrowers in Relatively Unconcentrated Industries (Borrower Industry HHI le Median)
(1) (2) (3) (4) (5)
VARIABLES LOANSPREAD LOG (LOAN SIZE) LOG (LOAN MATURITY) COLLATERAL COV_INTENSITY_INDEX
TARP RECIPIENT 54840 -0031 0027 -0015 -0108
(4958) (-0310) (0411) (-0300) (-0540)
POST TARP x TARP RECIPIENT -36647 0342 0141 -0060 -0495
(-1784) (2227) (1779) (-1029) (-1988)
BORROWER CONTROLS YES YES YES YES YES
BORROWER RATING DUMMIES YES YES YES YES YES
BANK CONTROLS YES YES YES YES YES
LOAN TYPE DUMMIES YES YES YES YES YES
2-DIGIT SIC FIXED EFFECTS YES YES YES YES YES
YEAR FIXED EFFECTS YES YES YES YES YES
Observations 2376 2627 2574 2627 2627
Adjusted R-squared 0507 0659 0354 0329 0272
Borrowers in Relatively Concentrated Industries (Borrower Industry HHI gt Median)
(1) (2) (3) (4) (5)
VARIABLES LOANSPREAD LOG (LOAN SIZE) LOG (LOAN MATURITY) COLLATERAL COV_INTENSITY_INDEX
TARP RECIPIENT 26818 0005 -0050 -0041 -0466
(2287) (0057) (-0887) (-0846) (-2388)
POST TARP x TARP RECIPIENT -49436 0170 0203 -0060 -0381
(-2054) (1406) (2912) (-1079) (-1557)
BORROWER CONTROLS YES YES YES YES YES
BORROWER RATING DUMMIES YES YES YES YES YES
BANK CONTROLS YES YES YES YES YES
LOAN TYPE DUMMIES YES YES YES YES YES
2-DIGIT SIC FIXED EFFECTS YES YES YES YES YES
YEAR FIXED EFFECTS YES YES YES YES YES
Observations 2996 3346 3295 3346 3346
Adjusted R-squared 0567 0674 0408 0329 0249
Table Y2 Panel A2 Tests of the Equality of the Effects of TARP for Different Types of Borrowers Borrowers in Relatively Unconcentrated (Low HHI) and Concentrated (High HHI) Industries
VARIABLES LOANSPREAD LOG (LOAN SIZE) LOG (LOAN MATURITY) COLLATERAL COV_INTENSITY_INDEX
t-stat Effects for low HHI borrower = effects for high HHI borrower 0404 0878 -0587 0000 -0327

1
1 Introduction
Do bank bailouts result in net benefits or costs for the borrowers of bailed-out banks From a policy
perspective whether or not bailouts are worthwhile depends on their many consequences one of which is
whether the borrowers from the recipient banks benefit Many of the other consequences such as changes
in real economic conditions competitive advantages conferred and systemic risk have been covered
elsewhere in the literature but there is very little evidence on how bailouts affect borrowers This is an
important research question because treatment of loan customers directly affects their financial conditions
which drive economic recovery and growth The event study evidence that does exist on this question is
contradictory and only covers borrowers with prior relationships with these banks
We address this question by examining the effects of the US Troubled Asset Relief Program
(TARP) bailout during the recent financial crisis on loan contract terms to borrowers of bailed-out banks
Using a difference-in-difference methodology we find that bailed-out banks offer more favorable price and
non-price loan contract terms to borrowers Conditional on borrower and bank characteristics loan type
industry and time recipient banks granted loans with lower spreads larger amounts longer maturities less
frequency of collateral and less restrictive covenants This is consistent with an increase in credit supply at
the intensive margin suggesting that the recipient banksrsquo borrowers benefited from the TARP program
Our findings are statistically and economically significant and are robust to dealing with potential
endogeneity issues and other checks
Our approach departs from the existing literature in a number of important respects First whereas
most prior bailout research is at the bank or market level we use loan-level data and examine the effects of
TARP from the perspective of the borrowers
Second unlike most of the bank- or market-level studies we are able to control for borrower
characteristics This is important because certain types of loan customers may self-select to borrow from
TARP banks or non-TARP banks and because these characteristics are key determinants of loan contract
terms
Third to our knowledge we are the first to use multidimensional information about bank loans
2
examining the effects of TARP on five key loan contract terms and find that all five contract terms become
more favorable for borrowers
Fourth analysis of loan contract terms across different types of borrowers allows us to address
other open questions in the literature including whether bank bailouts exacerbate moral hazard incentives
in a more definitive fashion than the existing work We find that improvements in loan contract terms are
greater for riskier borrowers than for safer borrowers consistent with an increase in the exploitation of
moral hazard incentives We also find that improvements in loan contract terms are greater for less-
financially-constrained borrowers than for more-financially-constrained borrowers Specifically large and
publicly-listed borrowers experienced significantly greater improvements in contract terms than small and
private borrowers respectively due to TARP This suggests that the bailout may not provide assistance to
borrowers that need capital the most We also find that both relationship and non-relationship borrowers
experienced improvements in loan credit terms due to TARP This is consistent with the notion that TARP
banks used bailout funds to reach out to new borrowers as well as grant more favorable terms to existing
clients This finding also suggests that studies that focus only on borrowers with prior relationship with
TARP banks may overlook some benefits of the program
Our paper contributes to several strands of literature We add to the literature on the effects of
bailouts on bank borrowers Two event studies look at the valuation effects of TARP on relationship
customers and document opposing results Norden Roosenboom and Wang (2013) find that TARP led to
a significantly positive impact on relationship firmsrsquo stock returns around the time of TARP capital
injections In contrast Lin Liu and Srinivasan (2014) find that relationships borrowers suffered significant
valuation losses around the time of TARP approval announcements
Our work adds to this research in three main ways First the valuation changes in these studies may
be due to expectations of better or worse direct treatment of the borrowers by TARP banks but it is
unknown from these studies alone whether these expectations were met in practice In contrast we examine
actual changes in borrower treatment In effect the event studies may reveal a noisy signal about borrower
treatment while we measure it more directly
3
Second stock returns around TARP dates may partially be driven by other indirect factors that are
not specifically related to the treatment of the loan customers (eg expectations of changes in local
economic conditions) but are correlated with bailouts of their banks As discussed below the TARP
selection criteria targeted ldquohealthy viable institutionsrdquo which may mean that TARP was more often given
to banks in markets with improving local conditions which in turn may be related to positive stock market
returns for their relationship borrowers Unlike event studies in which all control variables must be
measured before or on TARP announcement dates we are able to control for borrower characteristics at
the time the loans are issued and examine the actual effects of TARP on the borrowersrsquo loan contract terms
Controlling for borrower characteristics at the time of loan issuance is crucial for alleviating the
identification problem This is because changes in local economic conditions and borrower characteristics
between TARP initiation and the time when the loan is issued may be correlated with TARP acceptance
but not caused by TARP itself
Third event studies are by construction limited to borrowers with existing relationships with the
banks and cannot measure the effects of TARP on non-relationship borrowers In contrast we are able to
measure the latter effects and in fact find that non-relationship borrowers benefited slightly more than
relationship borrowers from the bailout program
We also add to the studies that investigate the effects of bank bailouts on credit supply A number
of studies examine the effects of bailouts on the quantity of credit ie the credit supply at the extensive
margin and the results of these studies are not uniform Li (2013) Puddu and Walchli (2013) Berger and
Roman (forthcoming) and Chu Zhang and Zhao (2016) find that TARP banks expanded their credit
supply Black and Hazelwood (2013) find mixed results Lin Liu and Srinivasan (2014) find a decline in
credit supply and Bassett and Demiralp (2014) and Duchin and Sosyura (2014) do not find any evidence
of a change in credit supply We are able to extend the research to cover the intensive margin or how the
borrowers that receive credit are treated based on five loan contract terms ndash loan spread amount maturity
collateral and covenant intensity This provides a fuller picture of the change in credit supply and whether
borrowers benefited from the program
4
Our paper also supplements the bank bailout and moral hazard literature Bailouts might increase
moral hazard incentives for banks to take more risk by raising expectations of future bailouts (eg Acharya
and Yorulmazer 2007 Kashyap Rajan and Stein 2008) Alternatively bailouts might reduce moral
hazard incentives because of the additional bank capital or because of extra explicit or implicit government
restrictions on these institutions (eg Duchin and Sosyura 2014 Berger and Roman 2015 forthcoming)
Recent papers that empirically investigate this issue find large TARP banks tend to grant riskier loans after
the bailouts (Black and Hazelwood 20131 Duchin and Sosyura 2014) This evidence is generally viewed
as support for the increased exploitation of moral hazard incentives 2
However an increase in average risk of borrowers by TARP banks is not a sufficient condition for
increased exploitation of moral hazard An alternative explanation is that TARP increases the supply of
credit overall and TARP banks dip deeper into the pool of riskier borrowers to lend more Our analysis of
loan contract terms conditional on borrower risk and other characteristics is a novel approach to test the
moral hazard hypothesis Our finding that the preponderance of improvements in loan contract terms due
to TARP goes to riskier borrowers confirms an increase in the exploitation of moral hazard incentives
In addition we contribute to the literature on the effects of bailouts on banksrsquo market power and
valuations Berger and Roman (2015) find that TARP gave recipients competitive advantages and increased
both their market shares and market power3 Others find positive effects of TARP on banksrsquo valuations
(eg Veronesi and Zingales 2010 Kim and Stock 2012 Liu Kolari Tippens and Fraser 2013 Ng
Vasvari and Wittenberg-Moerman 2013) While these papers find that TARP benefited the recipient
banks our paper suggests that these banks do not extract all the rents Their borrowers also received
substantially better treatment as a consequence of TARP4
1 Black and Hazelwood (2013) find a decrease in risk-taking for small recipient banks but we focus here primarily on
large banks because lenders in DealScan dataset are mainly large banks 2 One study that takes an alternative approach finds that TARP reduced contributions to systemic risk of recipient
banks and this occurred more for banks that were safer ex ante suggesting reduced exploitation of moral hazard
incentives (Berger Roman and Sedunov 2016) 3 Koetter and Noth (2015) also find competitive distortions as a result of TARP for unsupported banks 4 For completeness we note that other TARP studies focus on determinants of TARP program entry and exit decisions
(eg Bayazitova and Shivdasani 2012 Duchin and Sosyura 2012 Wilson and Wu 2012 Cornett Li and Tehranian
5
Finally our paper adds to the broader literature on bank loan contracting There are papers that
focus on loan amounts5 spreads6 loan maturity7 collateral8 and loan covenants9 Most papers focus on one
or a few loan contract terms whereas we investigate all five10 As well none of this literature investigates
how loan contract terms are affected by bank bailouts the focus of this study We find that all five contract
terms become more favorable after TARP
2 Main Hypotheses
It is unclear ex ante whether bank bailouts benefit borrowers There are a number of channels
through which bailouts would improve the treatment of borrowers and others through which the treatment
would worsen These channels are used in the literature to motivate changes in competitive conditions for
TARP banks (Berger and Roman 2015) changes in economic conditions in the local markets in which
these banks operate (Berger and Roman forthcoming) and changes in systemic risk (Berger Roman and
Sedunov 2016) but they also may affect the treatment of borrowers through loan contract terms
2013 Li 2013 Duchin and Sosyura 2014) Other related literature looks at the effects of other government
interventions on bank risk-taking lending and liquidity creation using data from both the US and other countries
(eg Brandao-Marques Correa and Sapriza 2012 Dam and Koetter 2012 Hryckiewicz 2012 Berger Bouwman
Kick and Schaeck 2016 Calderon and Schaeck forthcoming) and finds either reductions or increases in risk-taking
and reductions in credit growth and liquidity creation
5 Papers focusing on loan amounts include Sufi (2007) Ivashina and Scharfstein (2010ab) and Bharath Dahiya
Saunders and Srinivasan (2011) 6 Papers focusing on loan spreads include Barry and Brown (1984) Petersen and Rajan (1994) Berger and Udell
(1995) Blackwell Noland and Winters (1998) Berlin and Mester (1999) Pittman and Fortin (2004) Mazumdar and
Sengupta (2005) Ivashina (2009) and Berger Makaew and Turk-Ariss (2016) 7 Papers focusing on loan maturity include Flannery (1986) Diamond (1991) Barclay and Smith (1995) Rajan and
Winton (1995) Guedes and Opler (1996) Stohs and Mauer (1996) Scherr and Hulburt (2001) Berger Espinosa-
Vega Frame and Miller (2005) and Ortiz-Molina and Penas (2008) 8 Papers focusing on loan collateral are Bester (1985) Chan and Kanatas (1985) Stultz and Johnson (1985) Besanko
and Thakor (1987) Berger and Udell (19901995) Boot Thakor and Udell (1991) Rajan and Winton (1995)
Jimenez Salas and Saurina (2006) and Berger Frame and Ioannidou (2011) 9 Papers focusing on loan covenants and covenant violation include Smith and Warner (1979) Beneish and Press
(1993) Chen and Wei (1993) Smith (1993) Sweeney (1994) Beneish and Press (1995) Chava and Roberts (2008)
Nini Smith and Sufi (2009) Roberts and Sufi (2009a) Sufi (2009) Murfin (2012) Freudenberg Imbierowicz
Saunders and Steffen (2013) and Bradley and Roberts (2015) 10 A few papers examine the impact of various factors on more than one loan contract term These include Berger and
Udell (1995) Strahan (1999) Benmelech Garmaise and Moskowitz (2005) Qian and Strahan (2007) Bharath
Sunder and Sunder (2008) Graham Li and Qui (2008) Bae and Goyal (2009) Chava Livdan and Purnanandam
(2009) Bharath Dahiya Saunders and Srinivasan (2011) Hasan Hoi and Zhang (2014) and Chakraborty
Goldstein and MacKinlay (2016)
6
The following channels predict benefits for borrowers from recipient banks in the form of more
favorable loan contract terms
Channels predicting more favorable treatment of borrowers in loan contract terms There are
several reasons why borrowers from bailed-out banks may experience more favorable loan contract
terms Recipient banks may use the capital infusions to compete more aggressively offering more
favorable credit terms (predation channel) It is also possible that recipient banks may be perceived
as riskier requiring them to offer borrowers more favorable terms to compensate for the risk that
future credit and other services may be withdrawn (stigma channel) Finally bailout funds may be
relatively cheap resulting in recipient banks offering more favorable credit terms because of their
lower marginal costs (cost advantage channel)
In contrast other channels predict less favorable loan contract terms for borrowers
Channels predicting less favorable treatment of borrowers in loan contract terms There are
several reasons why recipient bank borrowers may experience less favorable loan contract terms
The extra capital from the bailout may increase charter value andor allow for a ldquoquiet liferdquo
decreasing incentives to compete more aggressively resulting in less favorable credit terms (charter
value quiet life channel) It is also possible that recipient banks may be perceived as safer due to
bailouts For TARP in particular the recipient banks may be safer due to TARP criteria which
targeted ldquohealthy viable institutionsrdquo Borrowers may accept less favorable contract terms because
recipient banks are less likely to fail or become financially distressed (safety channel) Finally
bailout funds may be relatively expensive resulting in banks offering less favorable credit terms
due to higher marginal costs (cost disadvantage channel)11
These channels imply two opposing hypotheses for the effects of bailouts on contract terms to
recipient banksrsquo borrowers
11 The safety channel is the opposite of the stigma channel and the cost disadvantage channel is the opposite of the
cost advantage channel so they never hold for the same bank at the same time The predation and charter valuequiet
life channels may also be regarded as opposites because they have opposing implications
7
H1a Bailouts result in more favorable loan terms for the borrowers of recipient banks
H1b Bailouts result in less favorable loan terms for the borrowers of recipient banks
The hypotheses are not mutually exclusive ndash each may apply to different sets of banks and
borrowers Our empirical analysis tests which of these hypotheses empirically dominates the other overall
We test empirically the net impact of bailouts on the five loan contract terms to understand which of these
hypotheses finds stronger empirical support Our ancillary hypotheses about cross-sectional differences
across various types of borrowers ndash safer versus riskier borrowers more or less financial constrained and
relationship versus non-relationship borrowers ndash are discussed below in Section 6
3 Data and Methodology
31 Data and Sample
We use Loan Pricing Corporationrsquos (LPCrsquos) DealScan dataset on corporate loans which has
detailed information on deal characteristics for corporate and middle market commercial loans12 We match
these data with the Call Report for commercial banks TARP transactions data and TARP recipients list
from the Treasuryrsquos website and borrower data from Compustat
The basic unit of analysis is a loan also referred to as a facility or tranche in DealScan Loans are
grouped into deals so a deal may have one or more loans While each loan has only one borrower loans
can have multiple lenders due to syndication in which case a group of banks andor other financial
institutions make a loan jointly to a borrower The DealScan database reports the roles of lenders in each
facility We consider only the lead lenders in our analysis since these are typically the banks making the
loan decisions and setting the contract terms (Bharath Dahiya Saunders and Srinivasan 2009)13 We
follow Ivashina (2009) to identify the lead bank of a facility If a lender is denoted as the ldquoadministrative
12 Although lenders in this dataset include non-bank financial intermediaries such as hedge funds we focus on
regulated commercial banks operating in the US market as this will enable us to control for the financial condition
of lenders using Call Report data throughout our analysis Commercial banks dominate the syndicated loan market in
the US 13 In all our results we focus on the lead lender In unreported results we find that benefits in loan terms are pertinent
for lenders with both low and high lender shares with slightly better improvements when the lender has a higher share
8
agentrdquo it is defined as the lead bank If no lender is denoted as the ldquoadministrative agentrdquo we define a
lender who is denoted as the ldquoagentrdquo ldquoarrangerrdquo ldquobook-runnerrdquo ldquolead arrangerrdquo ldquolead bankrdquo or ldquolead
managerrdquo as the lead bank In the case of multiple lead banks we keep the one with the largest assets14
For each DealScan lender we manually match lender names to the Call Report data using lender
name location and dates of operation for the period 2005Q1 to 2012Q4 using the National Information
Center (NIC) website Call Report data contains balance sheet information for all US commercial banks
Given that the majority of our TARP recipients are bank holding companies (BHCs) we aggregate Call
Report data of all the banks in each BHC at the holding company level This aggregation is done for all
bank-level variables If the commercial bank is independent we keep the data for the commercial bank For
convenience we use the term ldquobankrdquo or ldquolenderrdquo to mean either type of entity We exclude firm-quarter
observations in the Call Report data that do not refer to commercial banks (RSSD9331 different from 1)
or have missing or incomplete financial data for total assets and common equity To avoid distortions for
the Equity to GTA ratio for all observations with equity less than 1 of gross total assets (GTA) we
replace equity with 1 of GTA (as in Berger and Bouwman 2013)15 In addition we normalize all financial
variables using the seasonally adjusted GDP deflator to be in real 2012Q4 dollars Bank characteristics are
obtained from the Call Report as of the calendar quarter immediately prior to the deal activation date
The TARP bailout transactions data for the period October 2008 to December 2009 (when TARP
money was distributed) and TARP recipients list are obtained from the Treasuryrsquos website16 We match by
name and location the institutions in the list with their corresponding RSSD9001 (Call Report ID) where
available The TARP report has 756 transactions included for 709 unique institutions (572 BHCs 87
commercial banks and 51 Savings and Loans (SampLs) and other thrifts) since some institutions have
multiple transactions ndash some received more than one TARP capital purchase and some made one or more
14 Our main results are robust to keeping all lead banks in the sample 15 Gross total assets (GTA) equals total assets plus the allowance for loan and lease losses and the allocated transfer
risk reserve (a reserve for certain foreign loans) Total assets on Call Reports deduct these two reserves which are
held to cover potential credit losses We add these reserves back to measure the full value of the assets financed 16 httpwwwtreasurygovinitiativesfinancial-stabilityPagesdefaultaspx
9
repayments17 We exclude thrifts because datasets are not comparable with banks and these institutions
compete in different ways than commercial banks and provide few corporate and middle market
commercial loans We merge the Call Report data with the TARP recipients list
We match DealScan to Compustat to obtain borrower financial information Compustat contains
accounting information on publicly traded and OTC US companies For each facility in DealScan during
our sample window (2005Q1- 2012Q4) we match the borrowers to Compustat via the GVKEY identifier
using the link file of Chava and Roberts (2008) updated up to August 2012 to obtain borrower information
We also extract the primary SIC code for the borrowers from Compustat and exclude all loans to financial
services firms (SIC codes between 6000 and 6999) and loans to non-US firms as in Bharath Dahiya
Saunders and Srinivasan (2009) Borrower characteristics are obtained from the Compustat database as of
the fiscal quarter ending immediately prior to a deal activation date
We use data from several other sources for additional control variables and instruments FDIC
Summary of Deposits House of Representatives website Missouri Census Data Center and the Center for
Responsible Politics Our final regression sample contains 5973 loan-firm-bank observations with
complete information on firm and bank characteristics
32 Econometric Methodology
We use a difference-in-difference (DID) approach A DID estimator is commonly used in the
program evaluation literature (eg Meyer 1995) to compare a treatment group to a control group before
and after treatment Recently it has been used in the banking literature (eg Beck Levine and Levkov
2010 Gilje 2012 Schaeck Cihak Maehler and Stolz 2012 Berger Kick and Schaeck 2014 Duchin
and Sosyura 2014 Berger and Roman 2015 forthcoming Berger Roman and Sedunov 2016) In our
case the treated group consists of loans from banks that received TARP funds and the control group
17 A few special cases are resolved as follows For Union First Market Bancshares Corporation (First Market Bank
FSB) located in Bowling Green VA we include the RSSD9001 of the branch of the commercial bank First Market
Bank because this is the institution located in Bowling Green VA In two other cases where MampAs occurred (the
bank was acquired by another BHC according to the National Information Center (NIC)) and TARP money were
received by the unconsolidated institution we included the RSSD9001 of this unconsolidated institution
10
consists of loans from other banks An advantage of this approach is that by analyzing the time difference
of the group differences the DID estimator accounts for omitted factors that affect treated and untreated
groups alike
The DID regression model has the following form for loan i to borrower j from bank b at time t
(1) Yijbt = β1 TARP RECIPIENTb + β 2 POST TARPt x TARP RECIPIENTb +
+ β 3 BORROWER CHARACTERISTICS jt-1 + β4 BORROWER RATING DUMMIESjt-1 +
+ β5 BANK CHARACTERISTICS bt-1 + β 6 LOAN TYPE DUMMIESi +
+ β 7 INDUSTRY FIXED EFFECTSj + β 8 YEAR FIXED EFFECTS t+ Ɛijbt
Y is one of the five loan contract terms spread amount maturity collateral and covenant intensity index
TARP RECIPIENT is a dummy which takes a value of 1 if the bank was provided TARP capital support
POST TARP is a dummy equal to one in 2009-2012 the period after the TARP program started (following
Duchin and Sosyura 2014 but considering a longer period) POST TARP does not appear by itself on the
right hand side of the equation because it would be perfectly collinear with the time fixed effects POST
TARP x TARP RECIPIENT is the DID term and captures the effect of the treatment (TARP) after it is
implemented Positive coefficients on the DID terms in the loan amount and maturity equations or negative
coefficients on the DID terms in the spread collateral and covenant intensity index would show favorable
changes in loan contract terms for firms that received loans from TARP banks and vice-versa We include
also controls for the borrower BORROWER CHARACTERISTICS BORROWER RATING DUMMIES and
INDUSTRY FIXED EFFECTS (2-digit SIC) BANK CHARACTERISTICS (bank control variables other than
TARP) LOAN TYPE DUMMIES and YEAR FIXED EFFECTS Ɛ represents an error term All variables
are defined more precisely in Section 33 and Table 1
33 Variables and Summary Statistics
Table 1 shows variable descriptions and summary statistics for the full sample We present means
medians standard deviations and 25th and 75th percentiles for the variables used in our analyses
Main dependent variables
11
For dependent variables we consider five loan contract terms LOANSPREAD is the loan spread
or All-in-Spread-Drawn (in bps) the interest rate spread over LIBOR plus one time fees on the drawn
portion of the loan18 LOG (LOAN SIZE) is the natural logarithm of the amount of the loan LOG (LOAN
MATURITY) is the natural logarithm of the maturity of the loan in months COLLATERAL is a dummy
equal to one if the loan is secured COV_INTENSITY_INDEX is the covenant intensity index We follow
Bradley and Roberts (2015) and track the total number of covenants included in the loan agreement and
create a restrictiveness of the covenants index ranging from 0 to 6 More specifically this is calculated as
the sum of six covenant indicators (dividend restriction asset sales sweep equity issuance sweep debt
issuance sweep collateral and more than two financial covenants) The index consists primarily of
covenants that restrict borrower actions or provide lendersrsquo rights that are conditioned on adverse future
events19
Table 1 shows that the average loan in our sample has LOANSPREAD of 187991 basis points over
LIBOR LOG (LOANSIZE) of 19210 (mean loan amount is $586 million) LOG (LOANMATURITY) of
3816 (mean loan maturity is 50370 months) COLLATERAL is pledged on 473 of the loans and the
average covenant intensity index (COV_INTENSITY_INDEX) is 2079
Main independent variables
As described above our main TARP variables for the regression analysis are TARP RECIPIENT
a dummy equal to one if the bank was provided TARP capital support POST TARP is a dummy equal to
one in 2009-2012 and POST TARP x TARP RECIPIENT the DID term which captures the effect of the
treatment (TARP) on the treated (TARP recipients) compared to the untreated (non-TARP banks) after
treatment As noted above POST TARP is not included without the interaction term because it would be
18 For loans not based on LIBOR DealScan converts the spread into LIBOR terms by adding or subtracting a
differential which is adjusted periodically 19 Sweeps are prepayment covenants that mandate early retirement of the loan conditional on an event such as a
security issuance or asset sale They can be equity debt and asset sweeps Sweeps are stated as percentages and
correspond to the fraction of the loan that must be repaid in the event of a violation of the covenant For example a
contract containing a 50 asset sweep implies that if the firm sells more than a certain dollar amount of its assets it
must repay 50 of the principal value of the loan Asset sweeps are the most popular prepayment restriction
12
perfectly collinear with the time fixed effects The table also shows LOG (1+Bailout Amount) which is
used below as an alternative measure for TARP support
Control variables
Turning to controls we first account for borrower characteristics We include BORROWER SIZE
the logarithm of book value of assets of the borrower as reported in Compustat MARKET-TO-BOOK the
market value of equity scaled by book value of equity LEVERAGE the ratio of book value of total debt
to book value of assets CASH FLOW VOLATILITY the standard deviation of the previous 12 quarterly
cash flows where cash flow is calculated as income before extraordinary items plus depreciation and
amortization divided by total assets PROFITABILITY the ratio of Earnings Before Interest Taxes
Depreciation and Amortization (EBITDA) to Sales TANGIBILITY the ratio of Net Property Plant and
Equipment (NPPE) to Total Assets CASH HOLDINGS RATIO the ratio of cash and marketable securities
divided by total assets and Borrower SampP Credit Rating dummies For the latter variables we use the long-
term issuer credit ratings compiled by Standard amp Poorrsquos (SampP) and create dummies for each of the ratings
and one category for the those unrated (AAA AA A BBB BB B CCC or below Unrated) We also include
borrower industry fixed effects based on 2-digit SIC codes (INDUSTRY FIXED EFFECTS)20 to control for
any industry patterns in the loan contracts to borrowers
We next control for bank characteristics including proxies for CAMELS (financial criteria used by
regulators for evaluating banks) following Duchin and Sosyura (2014) CAPITAL ADEQUACY (ratio of
equity capital to GTA) ASSET QUALITY (fraction of nonperforming loans to total loans) MANAGEMENT
QUALITY (the ratio of overhead expenses to GTA) EARNINGS (return on assets (ROA) ratio of the
annualized net income to GTA) LIQUIDITY (ratio of cash to total deposits) SENSITIVITY TO MARKET
RISK (the ratio of the absolute difference (gap) between short-term assets and short-term liabilities to GTA)
We also include other bank characteristics following Bayazitova and Shivdasani (2012) Berger and
20 In Section 56 concerning additional robustness tests we also show results using 2-digit NAICS codes and Fama-
French 49 industries In unreported results we also tried 3-digit SIC 3-digit NAICS codes and Fama-French 12
industries and results are robust to all these alternative industry fixed effects
13
Bouwman (2013) Duchin and Sosyura (2014) Berger Bouwman Kick and Schaeck (2016) Berger and
Roman (2015 forthcoming) Berger Roman and Sedunov 2016) BANK SIZE logarithm of gross total
assets (GTA) HHI DEPOSITS local deposit concentration PERCENT METROPOLITAN percent of bank
deposits in metropolitan areas (Metropolitan Statistical Areas (MSAs) or New England County
Metropolitan Areas (NECMAs)) FEE INCOME ratio of non-interest income to total income
DIVERSIFICATION measure of diversification across sources of income 1 ndash |(Net Interest Income ndash Other
Operating Income)(Total Operating Income)| following Laeven and Levine (2007) DWTAF dummy if a
bank received Discount Window (DW) andor Term Auction Facility (TAF) funding during the crisis21
We also include LOAN TYPE DUMMIES for each of the categories term loans revolvers and
other loans to control for any patterns in loan types TERM LOANS is defined as a dummy equal to one if
the loan type in LPC DealScan is any of the following Term Loan Term Loan A Term Loan B Term
Loan C Term Loan D Term Loan E Term Loan F Term Loan G Term Loan H Term Loan I or Delay
Draw Term Loan Similarly REVOLVERS are defined as a dummy equal to one if the loan type in DealScan
is any of the following two categories RevolverLine lt 1 Yr or RevolverLine ge 1 Yr We also create a
dummy OTHER LOANS which comprises of any other loan types that do not fit in the first two categories
Finally we include YEAR FIXED EFFECTS to control for temporal patterns in the loan contracts
4 Main Results
Table 2 shows our main results for the estimations of equation (1) We find that the TARP bailout
led to more favorable loan contract terms in all five dimensions analyzed (columns 1-5) Conditional on
borrower characteristics borrower rating dummies bank characteristics loan type and time we find that
recipient banks tended to grant loans with lower spreads larger amounts longer maturities less frequency
of collateral and less restrictive covenants and all are statistically significant
These results are also economically significant The coefficient on the DID term of -41974 in the
21 Berger Black Bouwman and Dlugosz (2016) find that banks that received discount window and TAF funds
increased their lending Data on these programs during the crisis were made public due to the Freedom of Information
Act (FOIA) requests and a provision of the Dodd-Frank Act
14
loan spread equation suggest that TARP results in a decrease in the loan spread by about 42 basis points22
The DID term of 0257 in the loan amount equation suggests that TARP results in an increase in loan
amount by approximately one-quarter The DID term of 0149 in the maturity equation suggests that TARP
results in an increase in the loan maturity by almost one-fifth The DID term of -0083 in the collateral
equation suggests that TARP results in a decrease in the likelihood of collateral by about 8 percentage
points The DID term of -0535 in the covenant intensity equation suggests that TARP results in a decrease
in the intensity of the covenant index on the loan by about one-fourth from its mean of 2079 Thus TARP
results in statistically and economically significant improvements in all five loan contract terms consistent
with the empirical dominance of Hypothesis H1a over H1b
Turning to the roles of borrower characteristics on loan contract terms BORROWER_SIZE is
positively related to loan amount and maturity and negatively related to loan spread collateral and covenant
intensity As expected larger borrowers tend to receive more favorable loan contract terms larger loans
with lower spreads longer maturity lower frequency of collateral and less restrictive covenants Borrower
MARKET-TO-BOOK generally does not significantly affect loan contract terms Four of the five
coefficients are statistically insignificant and the coefficient on loan amount is statistically significant but
very small (a one standard deviation in the market-to-book ratio produces an average decrease in the loan
amount of 0007) Borrower LEVERAGE makes all of the loan contract terms less favorable for the
borrowers consistent with expectations that more highly leveraged borrowers are riskier Higher leverage
significantly reduces loan amount and maturity and increases loan spread collateral and covenant
intensity As expected borrower PROFITABILITY favorably affects loan contract terms It increases loan
amount and maturity and negatively impacts loan spread collateral and covenant intensity Borrower
TANGIBILITY is not always significant but has negative effects on collateral and covenant intensity terms
consistent with the idea that tangible assets can reduce opaqueness problems may be used as collateral and
22 Researchers often include other loan contract terms in the loan spread regression model on the assumption that loan
spreads are set last Our loan spread results are robust to including these other loan terms in the regression However
we prefer to exclude these other potentially endogenous loan contract terms from the main model Similar controls
would not be appropriate for the other contract terms as it is not reasonable to assume that they are set last
15
may enable firms to be profitable and generate cash23 Borrower CASH FLOW VOLATILITY is mostly
insignificant but has a small positive impact on the loan amount Higher borrower CASH HOLDINGS
RATIO yields mostly unfavorable contract terms ndash reduced loan amount and maturity and increased loan
spread and collateral The effect on covenant intensity is insignificant It may be the case that that riskier
borrowers hold more cash due to the precautionary motive (they are less sure of future
financing) Therefore firms with higher cash ratios tend to receive less favorable loan contract terms
Finally the seven dummies for borrower ratings (BORROWER RATING DUMMIES) are included in all the
regressions but are not reported in the tables for the purpose of brevity Not surprisingly the better-rated
borrowers receive substantially better loan contract terms relative to the poorly-rated and unrated ones For
example in the loan spread regressions the estimated coefficients on borrower dummies are -65859 -
69069 -54387 -36390 7377 46479 and 92346 for an SampP rating of AAA AA A BBB BB B and
CCC or below-rated borrowers (all relative to the unrated category) respectively and they are all but one
statistically significant at the 1 level
In sum borrowers from TARP recipients received more favorable loan contract terms in all five
dimensions consistent with the empirical dominance of Hypothesis H1a over H1b The coefficients on
borrower characteristics are consistent with the expectation that safer borrowers (eg larger less levered
and more profitable borrowers) tend to receive more favorable loan contract terms
5 Robustness Checks
In this section we provide a number of robustness tests Unless noted otherwise we include all
control variables from the main regressions in these tests but they are not shown for brevity
51 Instrumental Variable (IV) Analysis
We first address the potential endogeneity of our TARP Recipient variables which could bias our
findings For example TARP capital might be more often provided to the strongest banks which may be
23 Himmelberg and Morgan (1995) find that tangible assets reduce firm opaqueness and thereby increase a firmrsquos
access to external capital Strahan (1999) finds that firms with less tangible assets can face more restrictive loan
contracts
16
more likely to provide favorable terms to borrowers yielding a spurious relationship To deal with this we
employ an instrumental variable (IV) analysis following Li (2013) Duchin and Sosyura (2014) Berger and
Roman (2015 forthcoming) and Berger Roman and Sedunov (2016)
Prior research on TARP finds that a bankrsquos political connections can affect the bankrsquos probability
of receiving TARP funds Following this research we use SUBCOMMITEES ON FINANCIAL
INSTITUTIONS OR CAPITAL MARKETS as an instrument for the TARP RECIPIENT variable This is a
dummy which takes a value of 1 if a firm is headquartered in a district of a House member who served on
the Financial Institutions Subcommittee or the Capital Markets Subcommittee of the House Financial
Services Committee in 2008 or 200924 These subcommittees played a direct role in the development of the
Emergency Economic Stabilization Act (EESA) and were charged with preparing voting recommendations
for Congress on authorizing and expanding TARP Members of these subcommittees were shown to arrange
meetings with the banks write letters to regulators and write provisions into EESA to help particular firms
While these arguments indicate that SUBCOMMITEES ON FINANCIAL INSTITUTIONS OR CAPITAL
MARKETS should be positively related to TARP decisions the distribution of committee assignments are
determined by the House leadership which is unlikely to be under the control of individual banks
Because the potentially endogenous explanatory variable is binary and we need the instrument to
predict treatment we employ a dummy endogenous variable model and follow a three-step approach as
suggested in section 1841 of Wooldridge (2002) For the first stage we use a probit model in which we
regress the TARP RECIPIENT dummy on the political instrument and the control variables from the main
regression model for predicting the probability of receiving TARP25 We then use the predicted probability
obtained from the first stage as an instrument for the second stage We instrument our TARP RECIPIENT
24 We use the MABLEGeocorr2k software on the Missouri Census Data Center website to match banks with
congressional districts using the zip codes of their headquarters The final regression sample for this test is slightly
smaller than the main regression sample This is due to some of the banks not being able to be mapped into a
congressional district (either due to an invalid headquarters zipcode or because we could not match it to a
congressional district) a problem reported also by Li (2013) 25 In unreported tests we also tried excluding SIC fixed effects from the probit estimation to mitigate potential
incidental parameters and inconsistency concerns as recommended in Greene (2002) and Fernandez-Val (2009) and
results are robust to this alternative specification
17
variable by the TARP RECIPIENT dummy fitted value and POST TARP x TARP RECIPIENT by the
product of the POST TARP dummy and the TARP RECIPIENT dummy fitted value26
The results of the IV regressions are reported in Table 3 We report the first-stage regression results
in Table 3 Panel A column (1) and the second-stage results for the IV specification in Table 3 Panel B The
first-stage regression in Panel A column (1) indicates that the instrumental variable is positively related to
TARP injections and the F-test indicates that the instrument is valid (F = 149572 with a p-value less than
0001) The final stage results in Panel B show that after controlling for endogeneity all five of the loan
contract terms retain the same sign albeit at a lower significance level in some cases Thus the main results
that TARP generally leads to more favorable terms of credit are robust
52 Heckmanrsquos (1979) Two-Stage Selection Model
To address potential selection bias we use Heckmanrsquos (1979) two-step procedure This approach
controls for selection bias introduced by bank borrower and government choices about TARP by
incorporating TARP decisions into the econometric estimation In the first step we use the same probit
model from the IV estimation to predict TARP RECIPIENT In the second stage (outcome equation) the
loan contract terms are the dependent variables and the right-hand-side variables include the self-selection
parameter (inverse Mills ratio) estimated from the first stage
The second-stage results are reported in Table 3 Panel C The results again suggest that TARP is
associated with improvements in all the loan contract terms consistent with our main findings
53 Placebo Experiment
As mentioned in Roberts and Whited (2013) the key assumption behind the DID estimator the
parallel trends assumption is untestable However several researchers including Angrist and Krueger
(1999) and Roberts and Whited (2013) propose performing a falsification sensitivity test to alleviate
concerns that alternative forces may drive the effects documented We follow their advice and conduct a
26 As indicated in Wooldridge (2002 p 236-237) this method is not the same as the forbidden regression as we use
the obtained variables as instruments in the next step and not as regressors
18
placebo experiment We follow Puddu and Walchli (2013) and Berger and Roman (2015 forthcoming) and
fictionally assume that the TARP participation took place four years earlier while still distinguishing
between banks that received TARP and those that did not according to the ldquotrue TARP program To mimic
our main analysis we use an eight-year period immediately preceding the TARP program from 2001-2008
and assume that the fictional Post TARP period begins four years before the actual program We rerun the
regressions using the placebo sample (2001-2008) and define PLACEBO POST TARP as a dummy equal
to one in 2005-2008 the period after the fictional TARP program initiation If our main results reflect the
true program we should not find statistically significant results with the same sign for the DID terms
The placebo results reported in Table 4 confirm that indeed there are no statistically significant
results with the same sign on four of the five loan contract terms for the fictional TARP For amount
collateral and covenant intensity the effect of the fictional TARP program is insignificantly different from
zero while for spread the effect is reversed and only marginally statistically significant The effect also is
only marginally statistically significant for maturity Thus the placebo experiment generally suggests that
our main results do not appear to be driven by alternative forces
54 Alternative Measure of TARP
We next test robustness to the use of an alternative measure of TARP In Table 5 we replace the
TARP RECIPIENT dummy with an alternative measure of TARP infusion LOG (1+Bailout Amount) Our
main results continue to hold all five of the loan contract terms have statistically significant coefficients
that suggest more favorable treatment to business borrowers associated with TARP
55 Alternative Econometric Models
To help alleviate the concern that omitted unobserved bank-specific year-specific industry-
specific or local market-specific determinants might explain our results Table 6 Panels A-C examine
alternative econometric methods using various combinations of bank year borrower industry and
borrower state fixed effects In Panels A and B when bank fixed effects are included we drop the
uninteracted TARP dummy which would be perfectly collinear with the bank fixed effects We also use
19
White standard errors which are robust to within-cluster correlation at the borrower and bank level in Panels
D-F In addition we exclude various other bank control variables and borrower characteristics in Panels G-
I27 We use alternative industry fixed effects specifications (2-digit NAICS codes and Fama-French 48
industries) in Panels J-K We use alternative functional forms for collateral in Panel L The results show
consistently more favorable treatment to borrowers by the TARP banks
56 Additional Robustness Tests
Table 7 contains additional robustness checks in which we exclude borrowers with missing SampP
credit ratings in Panel A or borrowers with only one loan in Panel B These results show consistently
statistically significantly more favorable credit terms treatment to business borrowers by the TARP banks
In Panel C we rerun our results excluding foreign-owned banks to mitigate the concern that our
effects may be influenced by these banks Some research shows that many foreign banks increased their
market share in the period leading up to the financial crisis (eg Claessens and Van Horen 2014 Berlin
2015) but they drew back from US lending during the financial crisis consistent with a home bias of
lendersrsquo loan origination (eg Giannetti and Laeven 2012) Our results excluding foreign banks continue
to show qualitatively similar effects to our main findings
In Panel D we examine the timing of the effects of TARP on loan contract terms to borrowers We
replace our DID term POST TARP x TARP RECIPIENT with a series of DID terms interacting the TARP
RECIPIENT with each of the POST TARP years (2009 2010 2011 and 2012) to trace out the timing of the
effects of TARP The results show that the loan contract term improvements are fairly strong throughout
the post-TARP period although they trail off somewhat for collateral in the last two years
In Panel E we examine effects of TARP on loan contract terms for involuntary and voluntary
TARP participants Some banks were required to participate in TARP at its inception We classify the
following eight banks as involuntary participants Citigroup JP Morgan Wells Fargo Morgan Stanley
27 This exercise addresses the concern that some bank characteristics might be endogenously driven by TARP
20
Goldman Sachs Bank of New York Bank of America and State Street Bank28 We specify variables for
the TARP involuntary and voluntary banks and interact these variables with our Post TARP dummy We
find more favorable loan contract terms for borrowers from both involuntary and voluntary participants
In Panel F we examine effects of TARP on loan contract terms for TARP participants subject to
the US bank Stress Tests (aka the Supervisory Capital Assessment program (SCAP) and the
Comprehensive Capital Analysis and Review (CCAR) programs) and participants not subject to these tests
These tests were applied to 19 banking organizations with assets exceeding $100 billion to ensure these
large banking organizations had enough capital to withstand the recession and a hypothetical more adverse
scenario that might occur over the rest of the financial crisis29 We specify variables for the TARP banks
subject to these stress tests and those not subject to them and interact these variables with our Post TARP
dummy We find more favorable loan contract terms for borrowers from both types of participants
6 Ancillary Hypotheses
We next develop hypotheses to understand which types of borrowers benefit more from bailouts ndash
safer or riskier more or less financially constrained and relationship or non-relationship
First we examine whether the changes in the credit terms for safer borrowers as a result of bank
bailouts are more or less favorable relative to the treatment for riskier borrowers We offer two channels
with opposing predictions
Increased moral hazard channel Bailouts increase the perceived probability of future bailouts
for recipient banks increasing their moral hazard incentives to take on excessive risk leading the
recipients to improve contract terms relatively more for riskier borrowers than safer borrowers
Decreased moral hazard channel Bailouts reduce the moral hazard incentives of the recipient
banks to take on excessive risk because of the increases in the capital of the recipient banks or
28 We exclude Merrill Lynch from the nine involuntary recipients because it is not a bank 29 These were 19 banks including Bank of America Citigroup Goldman Sachs JP Morgan Chase Morgan Stanley
Wells Fargo Bank of NY Mellon BBampT Fifth Third Bancorp Keycorp PNC Financial Regions Financial SunTrust
Banks US Bancorp Ally Financial American Express Company Capital One Financial Metlife and State Street
21
because of extra explicit or implicit government restrictions on these institutions leading them to
improve contract terms relatively more for safer borrowers than for riskier borrowers30
We compare the net impact of bank bailouts on changes in loan contract terms between riskier and
safer borrowers using the following set of opposing hypotheses
H2a Bailouts result in greater improvements in loan terms for the riskier borrowers relative to the
safer borrowers of recipient banks
H2b Bailouts result in greater improvements for the safer borrowers relative to the riskier
borrowers of recipient banks
As above these hypotheses are not mutually exclusive and we are only able to tests which of these
hypotheses empirically dominates the other overall
Next we examine whether the changes in the credit terms as a result of bank bailouts for small
unlisted borrowers that are more financially constrained because of informationally opacity problems are
more or less favorable relative to the treatment for large listed borrowers that are more transparent We
offer two channels with opposing predictions that are based on the finding discussed above that TARP
appears to have increased the market power of its recipients
Increased relative credit supply to financially constrained borrowers channel Bailouts
increase the market power of recipient banks more relative to small unlisted financially constrained
borrowers with few financial alternatives than to large listed borrowers The increased market
power incentivizes the bailed-out banks to offer more improved terms of credit to the financially
constrained borrowers and make up for any short-term losses with higher future profits from future
loans (eg Petersen and Rajan 1995) That is banks may temporarily subsidize borrowers have
fewer outside options that are more likely to borrow from these banks in subsequent periods
Reduced relative credit supply to financially constrained borrowers channel The lesser
30 The decreased moral hazard channel is the opposite of the increased moral hazard channel so they never both hold
for the same bank at the same time
22
increase in relative market power to large listed borrowers results in bailed-out banks improving
contract terms more for large listed borrowers to attract them away from alternative lenders
We compare the net impact of bank bailouts on changes in loan contract terms for small and unlisted
borrowers relative to large and listed borrowers respectively using the following opposing hypotheses
H3a Bailouts result in greater improvements in loan terms for the small and unlisted borrowers
relative to the large and listed borrowers of recipient banks respectively
H3b Bailouts result in greater improvements for the large and listed borrowers relative to the small
and unlisted borrowers of recipient banks respectively
As above these hypotheses are not mutually exclusive and we are only able to tests which of these
hypotheses empirically dominates the other overall
Finally we examine whether the changes in the credit terms for relationship borrowers as a result
of bank bailouts are more or less favorable relative to the treatment for non-relationship borrowers We
offer two channels with opposing predictions
Relationship borrowersrsquo preservation channel Bailout recipients may improve contract terms
relatively more for relationship borrowers than non-relationship borrowers to help preserve or
enhance the relationships enabling the banks to earn more in the long run from continuing business
Non-relationship borrowersrsquo attraction channel Bailout recipient banks may improve loan
contract terms relatively more for non-relationship borrowers as these borrowers do not have a
recent history with the bank and may require better terms to attract them
Based on these channels we compare the net impact of bank bailouts on changes in loan contract
terms for relationship and non-relationship borrowers in our next set of opposing hypotheses
H4a Bank bailouts result in greater improvements in loan terms for relationship borrowers relative
to non-relationship borrowers of recipient banks
H4b Bank bailouts result in greater improvements in loan terms for non-relationship borrowers
relative to relationship borrowers of recipient banks
As above we are only able to measure which hypothesis empirically dominates overall
23
7 Ancillary Results
71 Borrower Risk
Borrower SampP Credit Rating
To test hypotheses H2a and H2b on whether improvements in loan contract terms are greater for
riskier or safer borrowers respectively we first use borrower SampP credit rating as a proxy for borrower
risk We group borrowers according to whether they have investment grade ratings (BBB or higher) versus
speculative or junk ratings (BB or lower rated) and estimate the model for each of the subsamples31
Regression estimates are shown in Table 8 Panel A1 Panel A2 reports the tests of equality between
the two types of borrower groups The results suggest that high-risk borrowers experienced more favorable
loan contract terms as a result of TARP as indicated by the DID term coefficients consistent with the
empirical dominance of the Hypothesis H2a over H2b The DID coefficients of all five loan contract terms
are only significant for the riskier borrowers The differences between the two groups are statistically and
economically significant for LOG (LOAN MATURITY) COLLATERAL and COV_INTENSITY_INDEX
Borrower Leverage
Similarly we test hypotheses H2a and H2b using borrower leverage We group borrowers
according to whether they have low leverage ratio (LEVERAGE le median) or high leverage ratio
(LEVERAGE gt median) and estimate the main DID regressions for each subsample
The regression results are shown in Table 8 Panel B1 Panel B2 reports the tests of equality between
the two types of borrower groups We find that both groups of borrowers generally experience more
favorable contract terms as a result of TARP but terms are in most cases more favorable to high-risk
borrowers again consistent with the empirical dominance of the Hypothesis H2a over H2b This is
especially important for the effects on COLLATERAL and COV_INTENSITY_INDEX where DID terms
are only statistically significant for the riskier borrowers and the differences are statistically and
economically significant These results are generally consistent with increased exploitation of moral hazard
31 We exclude unrated borrowers because their risks are unknown
24
Borrower Cash Flow Volatility
Finally we test hypotheses H2a and H2b using borrower cash flow volatility as a proxy for risk
We group borrowers according to whether they have low cash flow volatility (CASH FLOW VOLATILITY
le median) or high cash flow volatility (CASH FLOW VOLATILITY gt median) and estimate the main DID
regressions using each subsample
The regression results are shown in Table 8 Panel C1 Panel C2 reports the tests of equality between
the two borrower groups For the risky borrowers the DID coefficients of all five loan contract terms are
significant but for the safer borrowers only the DID coefficient for LOG (LOAN SIZE) is significant
72 Borrower Financial Constraints
Borrower Size
To test hypotheses H3a and H3b on whether the improvements in loan contract terms are greater
for more financially-constrained borrowers we first use borrower size as a proxy for financial constraints
following Hadlock and Pierce (2010) Smaller borrowers also tend to be more informationally opaque and
have access to fewer sources of finance so they are more bank dependent than large borrowers We group
borrowers according to whether they are large (BORROWER_SIZE gt median) or small (BORROWER_SIZE
le median) and estimate the DID regressions using each of the subsamples32
Regression estimates are shown in Table 9 Panel A1 Panel A2 reports the tests of equality between
the two types of borrower groups The results suggest that larger borrowers experienced more favorable
loan contract terms as a result of TARP as indicated by the DID term coefficients consistent with the
empirical dominance of the Hypothesis H3b over H3a This is especially important for the effects on
LOANSPREAD LOG (LOAN SIZE) and COV_INTENSITY_INDEX where DID terms are only statistically
significant for the larger borrowers The difference in LOANSPREAD between the two groups is a
statistically and economically significant 52321 basis points
32 In unreported tests we also perform tests using the borrower total sales instead of total assets to proxy borrower
size and obtain consistent results
25
Borrower Public Status
We also test hypotheses H3a and H3b using borrower listing status Publicly listed borrowers are
generally more transparent and have better access to other external sources of finance We compare the net
impact of TARP on changes in loan contract terms for public versus private borrowers based on the
borrowerrsquos listing status in the DealScan dataset and estimate the main DID regressions using each
subsample33
The regression results are shown in Table 9 Panel B1 Panel B2 reports the tests of equality between
the two types of borrower groups The results suggest that public borrowers experienced more favorable
loan contract terms as a result of TARP as indicated by the DID term coefficients the DID coefficients of
all five loan contract terms are only significant for the public borrowers Overall our results indicate that
less-financially-constrained borrowers benefit more from the bailout
73 Relationship Lending
We next explore whether relationship borrowers benefited more or less relative to non-relationship
borrowers ie which of the two hypotheses H4a and H4b respectively empirically dominates
We group borrowers according to whether they had a relationship with a TARP bank in the pre-
TARP period (2005Q1-2008Q4) Relationship is defined as a dummy indicating the same borrower and
lead bank were involved in at least one loan over the pre-TARP period
Regression estimates are shown in Table 10 Panel A1 Panel A2 reports the tests of equality of the
DID terms for two types of borrowers The estimated DID coefficients for the two groups of borrowers
suggest that the change in contract terms is beneficial for both relationship and non-relationship borrowers
for the first three contract terms However the favorable effects on collateral and covenant intensity are
only significant for the non-relationship borrowers These findings suggest that TARP banks used bailout
funds to reach out to new borrowers as well as grant more favorable terms to existing clients with slightly
33 In unreported results we also perform tests using Compustat to split borrowers into public and private where a
private firm would have an exchange code of 0 1 19 or 20 and results are consistent
26
better terms for the non-relationship borrowers The findings also imply that TARP studies that focus on
borrowers with prior relationship with TARP banks may overlook some benefits of the program
74 Additional Tests
In Internet Appendix Y we conduct several additional subsample analyses to determine which
borrowers received benefits from the TARP program The data suggest that a broad spectrum of borrowers
experienced more favorable loan credit terms from TARP recipients borrowers using term loans and
revolvers and borrowers from both relatively concentrated and unconcentrated industries Thus the data
suggest that many types of business borrowers benefited from the TARP program
8 Conclusions
Do bank bailouts result in net benefits or costs for their borrowers We formulate and test
hypotheses about the effects of these bailouts on loan contract terms to business borrowers ndash whether loan
contract terms become more or less favorable for the borrowers of recipient banks (Hypotheses H1a and
H1b) whether terms improve more for riskier or safer borrowers (Hypotheses H2a and H2b) whether terms
improve more for more or less financially-constrained borrowers (Hypotheses H3a and H3b) and whether
terms improved more for relationship or non-relationship borrowers (Hypotheses H4a and H4b) We use
data from the US TARP bailout during the recent financial crisis
We first find that TARP bailout resulted in more favorable loan contract terms for recipient banksrsquo
business customers consistent with the empirical dominance of H1a over H1b and an increase in credit
supply at the intensive margin Conditional on borrower characteristics and ratings bank characteristics
loan type and industry and time fixed effects we find that recipient banks tended to grant loans with lower
spreads larger amounts longer maturities less frequency of collateral and less restrictive covenants These
findings are robust to dealing with potential endogeneity and other robustness checks and suggest that
borrowers significantly benefited from TARP
Second the improvement in loan contract terms due to TARP was more pronounced among the
riskier borrowers consistent with an increase in the exploitation of moral hazard incentives and the
27
empirical dominance of H2a over H2b Borrowers with lower credit ratings higher leverage and higher
cash flow volatility experienced significantly greater improvements in loan spread than other borrowers
Third the improvement in loan contract terms due to TARP was more pronounced for large and
publicly-listed borrowers than for small and private borrowers respectively consistent with more benefits
for less financially-constrained borrowers and the empirical dominance of H3b over H3a
Fourth we find that both relationship and non-relationship borrowers benefited from TARP This
finding suggests that TARP banks used bailout funds to reach out to new loan customers as well as to grant
more favorable terms to existing clients
This paper contributes to important strands of research First it adds to the broad bank bailout
literature by studying whether the recipient banksrsquo borrowers benefited from the TARP bailout We focus
on the effects of TARP on loan contract terms of these customers about which there is no evidence in the
extant literature It adds to the literature on the effects of bailouts on bank borrowers by clearing up some
of the ambiguities in the event studies on the effects of TARP on the relationship borrowers In contrast to
these other studies we examine actual changes in the treatment of loan customers and cover both
relationship and non-relationship borrowers The paper also extends the literature on the effects of bank
bailouts on credit supply at the extensive margin by covering the intensive margin or how borrowers that
received credit are treated along five different dimensions of loan contract terms It adds to the bank bailout
and moral hazard literature where existing work focuses on the credit supply to risky and safe borrowers at
the extensive margin Our intensive margin result that risker borrowers benefit more from TARP supports
an increase in the exploitation of moral hazard incentives Our finding that the preponderance of
improvements in loan contract terms goes to less financially-constrained borrowers raises a question
whether TARP really helps companies that need capital the most Finally this paper also contributes to the
broader literature on bank loan contracting by investigating how loan contracts are affected by bank
bailouts and by examining multiple loan contract dimensions in a single study
In terms of policy implications our study adds to the literature and policy debate on the benefits and
costs of the bank bailouts in general and the benefits and costs of TARP in particular Many of the social
28
benefits and costs of bailouts have been identified and studied extensively in the literature and are
summarized elsewhere in Calomiris and Khan (2015) and Berger and Roman (forthcoming) This study
suggests that borrowers generally receive more favorable treatment due to the bailout program but most of
the benefits do not fall on safer and more financially-constrained borrowers suggesting that the social costs
and benefits of TARP are more nuanced than previously documented and deserve further investigation
29
References
Acharya V Yorulmazer T 2007 Too many to fail mdash An Analysis of Time-inconsistency in Bank
Closure Policies Journal of Financial Intermediation 16 1-31
Angelini P Di Salvo R Ferri G 1998 Availability and cost of credit for small businesses Customer
relationships and credit cooperatives Journal of Banking and Finance 22 925-954
Angrist JD Krueger AB 1999 Empirical strategies in labor economics in A Ashenfelter and D Card
eds Handbook of Labor Economics vol 3 Elsevier Science
Bae K H Goyal V K 2009 Creditor rights enforcement and bank loans The Journal of Finance 64
823-860
Barclay M J Smith C W 1995 The maturity structure of corporate debt Journal of Finance 50 609ndash
631
Barry C B Brown S J 1984 Differential information and the small firm effect Journal of Financial
Economics 13 283ndash294
Bassett WF Demiralp S 2014 Government Support of Banks and Bank Lending Working Paper Board
of Governors of the Federal Reserve System
Bayazitova D Shivdasani A 2012 Assessing TARP Review of Financial Studies 25 377-407
Beck T Levine R Levkov A 2010 Big bad banks The winners and losers from bank deregulation in
the United States Journal of Finance 65 1637ndash1667
Beneish M D Press E 1993 Costs of Technical Violation of Accounting-Based Debt Covenants The
Accounting Review 68 233-257
Beneish M D Press E 1995 Interrelation among Events of Default Contemporary Accounting
Research 12 57-84
Benmelech E Garmaise M J Moskowitz T J 2005 Do liquidation values affect financial contracts
Evidence from commercial loan and zoning regulation The Quarterly Journal of Economics 120
1121-1154
Berger A N Black L K Bouwman C H S Dlugosz J L 2016 The Federal Reserversquos Discount
Window and TAF Programs Pushing on a String Working Paper University of South Carolina
Berger A N Bouwman C H S Kick T K Schaeck K 2016 Bank Risk Taking and Liquidity Creation
Following Regulatory Interventions and Capital Support Journal of Financial Intermediation 26
115-141
Berger AN Espinosa-Vega M A Frame WS Miller NH 2005 Debt maturity risk and asymmetric
information Journal of Finance 60 2895ndash2923
Berger A N Frame W S Ioannidou V 2011 Tests of ex ante versus ex post theories of collateral using
private and public information Journal of Financial Economics 100 85-97
Berger A N Kick T K Schaeck K 2014 Executive board composition and bank risk taking Journal of
Corporate Finance 28 48-65
Berger A N Makaew T Turk-Ariss R 2016 Foreign Banks and Lending to Public and Private Firms
during Normal Times and Financial Crises Working Paper University of South Carolina
Berger A N Roman R A 2015 Did TARP Banks Get Competitive Advantages Journal of Financial
and Quantitative Analysis 50 1199-1236
Berger A N Roman R A Forthcoming Did Saving Wall Street Really Save Main Street The Real
Effects of TARP on Local Economic Conditions The Real Effects of TARP on Local Economic
Conditions Journal of Financial and Quantitative Analysis
Berger A N Roman R A and Sedunov J 2016 Did TARP Reduce or Increase Systemic Risk The
Effects of TARP on Financial System Stability Working Paper University of South Carolina
Berger A N Udell G F 1990 Collateral loan quality and bank risk Journal of Monetary Economics
30
25 21ndash42
Berger A N Udell G F 1995 Relationship lending and lines of credit in small firm finance Journal of
Business 68 351ndash381
Berlin M 2015 New Rules for Foreign Banks Whatrsquos at Stake Business Review Q1 1-10
Berlin M Mester L J 1999 Deposits and relationship lending Review of Financial Studies 12 579-
607
Besanko D Thakor A 1987 Collateral and rationing sorting equilibria in monopolistic and competitive
credit markets International Economic Review 28 601-689
Bester H 1985 Screening vs rationing in credit market under asymmetric information Journal of
Economic Theory 42 167-182
Bolton P Scharfstein D S 1996 Optimal debt structure and the number of creditors Journal of Political
Economy 104 1ndash25
Boot A Thakor A Udell G 1991 Secured Lending and Default Risk Equilibrium Analysis Policy
Implications and Empirical Results The Economics Journal 101 458-472
Bradley M Roberts M R 2015 The structure and pricing of corporate debt covenants Quarterly Journal
of Finance 2 1550001
Brandao-Marques L Correa R Sapriza H 2012 International evidence on government support and
risk-taking in the banking sector IMF Working Paper
Bharath S T Dahiya S Saunders A Srinivasan A 2011 Lending relationships and loan contract
terms Review of Financial Studies 24 1141-1203
Bharath S T Sunder J Sunder S V 2008 Accounting quality and debt contracting Accounting
Review 83 1ndash28
Black L Hazelwood L 2013 The effect of TARP on bank risk-taking Journal of Financial Stability 9
790-803
Blackwell D W Noland T R Winters DB 1998 The value of auditor assurance evidence from loan
pricing Journal of Accounting Research 36 57ndash70
Boot A W A Marinc M 2008 Competition and entry in banking Implications for capital regulation
Working Paper University of Amsterdam
Calderon C Schaeck K forthcoming The effects of government interventions in the financial sector on
banking competition and the evolution of zombie banks Journal of Financial and Quantitative
Analysis
Calomiris C W Pornrojnangkool T 2009 Relationship Banking and the Pricing of Financial Services
Journal of Financial Services Research 35189ndash224
Calomiris C W Khan U 2015 An Assessment of TARP Assistance to Financial Institutions The
Journal of Economic Perspectives 29 53-80
Chakraborty I Goldstein I and MacKinlay A 2016 Housing Price Booms and Crowding-Out Effects
in Bank Lending Working Paper
Chan Y and G Kanatas 1985 Asymmetric valuation and role of collateral in loan agreement Journal of
Money Credit amp Banking 17 84-95
Chava S Livdan D Purnanandam A 2009 Do shareholder rights affect the cost of bank loans Review
of Financial Studies 22(8) 2973-3004
Chava S Roberts M R 2008 How does financing impact investment The role of debt covenants The
Journal of Finance 63 2085-2121
Chen K C Wei K J 1993 Creditors decisions to waive violations of accounting-based debt covenants
Accounting review A quarterly journal of the American Accounting Association 68 218-232
31
Chu Y Zhang D Zhao Y 2016 Bank Capital and Lending Evidence from Syndicated Loans Working
Paper
Claessens S Van Horen N 2014 Foreign Banks Trends and Impact Journal of Money Credit and
Banking 46 295-326
Cole R A 1998 The Importance of Relationships to the Availability of Credit Journal of Banking amp
Finance 22 959ndash77
Cornett M M Li L Tehranian H 2013 The Performance of Banks around the Receipt and Repayment
of TARP Funds Over-achievers versus Under-achievers Journal of Banking amp Finance 37 730ndash
746
Dam L Koetter M 2012 Bank bailouts and moral hazard Empirical evidence from Germany Review
of Financial Studies 25 2343-2380
De Haas R and Van Horen N 2013 Running for the exit International bank lending during a financial
crisis Review of Financial Studies 26 244-285
Degryse H Van Cayseele P 2000 Relationship Lending within a Bank-Based System Evidence from
European Small Business Data Journal of Financial Intermediation 9 90ndash109
Dennis S Nandy D Sharpe L G 2000 The determinants of contract terms in bank revolving credit
agreements Journal of Financial and Quantitative Analysis 35 87-110
Diamond D W 1991 Debt maturity structure and liquidity risk Quarterly Journal of Economics 106
709ndash737
Duchin D Sosyura D 2012 The politics of government investment Journal of Financial Economics 106
24-48
Duchin R Sosyura D 2014 Safer ratios riskier portfolios Banks response to government aid Journal
of Financial Economics 113 1-28
Elsas R Krahnen J P 1998 Is Relationship Lending Special Evidence from Credit-File Data in
Germany Journal of Banking amp Finance 22 1283ndash316
Flannery M J 1986 Asymmetric information and risky debt maturity choice Journal of Finance 41 19ndash
37
Fernandez de Guevara J F Maudos J Perez F 2005 Market power in European banking sectors Journal
of Financial Services Research 27 109-137
Fernaacutendez-Val I 2009 Fixed effects estimation of structural parameters and marginal effects in panel
probit models Journal of Econometrics 150 71-85
Freudenberg F Imbierowicz B Saunders A Steffen S 2013 Covenant violations loan contracting
and default risk of bank borrowers Working Paper
Fudenberg D Tirole J 1986 A signal-jamming theory of predation Rand Journal of Economics 17
366-376
Giannetti M Laeven L 2012 The flight home effect Evidence from the syndicated loan market during
financial crises Journal of Financial Economics 104 23-43
Gilje E 2012 Does local access to finance matter Evidence from US oil and natural gas shale booms
Working Paper Boston College
Giroud X Mueller H 2011 Corporate governance product market competition and equity prices The
Journal of Finance 66 563-600
Graham JR Li S and Qiu J 2008 Corporate misreporting and bank loan contracting Journal of
Financial Economics 89 44-61
Greene W H 2002 The behavior of the fixed effects estimator in nonlinear models NYU Working Paper
No EC-02-05
32
Guedes J Opler T 1996 The determinants of the maturity of corporate debt issues Journal of Finance
51 1809ndash1834
Hadlock Charles J Pierce Joshua R 2010 New Evidence on Measuring Financial Constraints Moving
Beyond the KZ Index Review of Financial Studies 23 1909-1940
Harhoff D Korting T 1998 Lending Relationships in Germany Empirical Evidence from Survey Data
Journal of Banking amp Finance 22 1317ndash53
Harrisa O Huertab D Ngob T 2013 The impact of TARP on bank efficiency Journal of International
Financial Markets Institutions and Money 24 85ndash104
Hasan I Hoi CKS Wu Q and Zhang H 2014 Beauty is in the eye of the beholder The effect of
corporate tax avoidance on the cost of bank loans Journal of Financial Economics 113 109-130
Hernaacutendez-Caacutenovas G Martiacutenez-Solano P 2006 Banking Relationships Effects on Debt Terms for
Small Spanish Firms Journal of Small Business Management 44 315ndash333
Himmelberg C Morgan D 1995 Is Bank Lending Special in ldquoIs Bank Lending Important for the
Transmission of Monetary Policyrdquo edited by Joe Peek and Eric Rosengren Federal Reserve Bank of
Boston Conference Series no 39
Hoshi T and A K Kashyap 2010 Will the US bank recapitalization succeed Eight lessons from Japan
Journal of Financial Economics 97 398ndash417
Hryckiewicz A 2012 Government interventions - restoring or destroying financial stability in the long
run Working Paper Goethe University of Frankfurt
Ivashina V 2009 Asymmetric information effects on loan spreads Journal of Financial Economics 92
300-319
Ivashina V Scharfstein D S 2010 Loan syndication and credit cycles American Economic Review
100 57-61
Ivashina V Scharfstein D S 2010 Bank lending during the financial crisis of 2008 Journal of Financial
Economics 97 319-338
Jimenez G Lopez J Saurina J 2010 How does competition impact bank risk taking Working Paper
Banco de Espana
Jimenez G Salas V Saurina J 2006 Determinants of collateral Journal of Financial Economics 81
255-281
Kashyap AK Rajan R Stein JC 2008 Rethinking capital regulation Kansas City Symposium on
Financial Stability
Kim DH Stock D 2012 Impact of the TARP financing choice on existing preferred stock Journal of
Corporate Finance 18 1121ndash1142
Koetter M and Noth F 2015 Bank Bailouts and Competition - Did TARP Distort Competition Among
Sound Unsupported Banks Economic Inquiry 54 994ndash1020
Laeven L Levine R 2007 Is there a diversification discount in financial conglomerates Journal of
Financial Economics 85 331-367
Lee SW Mullineaux DJ 2004 Monitoring financial distress and the structure of commercial lending
syndicates Financial Management 33 107ndash130
Li L 2013 TARP Funds Distribution and Bank Loan Supply Journal of Banking and Finance 37 4777-
4792
Lin Y Liu X Srinivasan A 2014 Unintended effects of the TARP program Evidence from relationship
borrowers of the TARP recipient banks Working Paper National University of Singapore
Liu W Kolari J W Tippens T K Fraser D R 2013 Did capital infusions enhance bank recovery
from the great recession Journal of Banking amp Finance 37 5048-5061
Machauer AWeber M 2000 Number of Bank Relationships An Indicator of Competition Borrower
33
Quality or Just Size Working Paper 200006 Johan Wolfgang Goethe-Universitat Center for
Financial Studies
Mazumdar S C Sengupta P 2005 Disclosure and the loan spread on private debt Financial Analysts
Journal 61 83ndash95
Mehran H Thakor A 2011 Bank capital and value in the cross-section Review of Financial Studies
241019-1067
Meyer B D 1995 Natural and quasi-experiments in economics Journal of Business and Economic
Statistics 13 151-161
Murfin J 2012 The Supply‐Side Determinants of Loan Contract Strictness The Journal of Finance 67
1565-1601
Myers S C 1977 Determinants of corporate borrowing Journal of Financial Economics 5 147ndash175
Ng J Vasvari F P Wittenberg-Moerman R 2013 The Impact of TARPs Capital Purchase Program on
the stock market valuation of participating banks Working Paper University of Chicago
Nini G Smith D C Sufi A 2009 Creditor control rights and firm investment policy Journal of
Financial Economics 92 400-420
Norden L Roosenboom P Wang T 2013 The Impact of Government Intervention in Banks on
Corporate Borrowersrsquo Stock Returns Journal of Financial and Quantitative Analysis 48 1635-1662
Ortiz-Molina H Penas M F 2008 Lending to small businesses the role of loan maturity in addressing
information problems Small Business Economics 30 361ndash383
Petersen M A Rajan R G 1994 The Benefits of Lending Relationships Evidence from Small Business
Data Journal of Finance 49 3ndash37
Petersen M A Rajan R G 1995 The effect of credit market competition on lending relationships
Quarterly Journal of Economics 110 407-443
Pittman J A Fortin S 2004 Auditor choice and the cost of debt capital for newly public firms Journal
of Accounting and Economics 37 113ndash136
Qian J Strahan PE 2007 How laws and institutions shape financial contracts the case of bank loans
Journal of Finance 62 2803ndash2834
Rajan R Winton A 1995 Covenants and collateral as incentives to monitor Journal of Finance 50
1113ndash1146
Roberts M R Sufi A 2009 Renegotiation of financial contracts Evidence from private credit
agreements Journal of Financial Economics 93 159-184
Roberts M R Whited T M 2013 Endogeneity in Empirical Corporate Finance Chapter 7 in the
Handbook of Economics and Finance Elsevier Science
Schaeck K Cihak M Maehler A M Stolz S M 2012 Who disciplines bank managers Review of
Finance 16 197-243
Scherr F C Hulburt H M 2001 The debt maturity structure of small firms Financial Management 30
85ndash111
Smith Clifford W Jr 1993 A Perspective on Accounting-Based Debt Covenant Violations The
Accounting Review 68 289-303
Smith C W Warner J B 1979 On financial contracting an analysis of bond covenants Journal of
Financial Economics 7 117ndash161
Stohs M Mauer D C 1996 The determinants of corporate debt maturity structure Journal of Business
69 279ndash312
Stulz R Johnson H 1985 An analysis of secured debt Journal of Financial Economics 14 501-521
Strahan P E 1999 Borrower risk and the price and nonprice terms of bank loans Unpublished working
34
paper Federal Reserve Bank of New York
Sufi A 2007 Information asymmetry and financing arrangements evidence from syndicated loans
Journal of Finance 62 629ndash668
Sufi A 2009 Bank lines of credit in corporate finance An empirical analysis Review of Financial Studies
22 1057-1088
Sweeney A P 1994 Debt-covenant violations and managers accounting responses Journal of
Accounting and Economics 17 281-308
Telser L G 1966 Cutthroat competition and the long purse Journal of Law and Economics 9 259-77
Thakor A V forthcoming Bank Capital and Financial Stability An Economic Tradeoff or a Faustian
Bargain Annual Review of Financial Economics
Veronesi P and Zingales L Paulsonrsquos gift 2010 Journal of Financial Economics 97 339-36
Wilson L Wu Y W 2012 Escaping TARP Journal of Financial Stability 8 32ndash42
Wu Q Zhang H Hoi C K S Hasan I 2013 Beauty is in the eye of the beholder The effect of
corporate tax avoidance on the cost of bank loans Journal of Financial Economics
35
Table 1 Definitions and Summary Statistics This table reports definitions and summary statistics of the variables for the full sample All variables using dollar amounts are expressed in real 2012Q4 dollars using the implicit
GDP price deflator
Variable Definitions and Summary Statistics for the Full Sample (2005-2012)
Type Variable Definition Mean p50 Std p25 p75 N
LOAN CONTRACT
TERMS VARIABLES
(SOURCE LPC
DEALSCAN)
LOANSPREAD The loan spread is the all-in spread drawn in the DealScan database All-
in spread drawn is defined as the amount the borrower pays in basis points over LIBOR or LIBOR equivalent for each dollar drawn down For loans
not based on LIBOR LPC converts the spread into LIBOR terms by
adding or subtracting a differential which is adjusted periodically This measure adds the borrowing spread of the loan over LIBOR with any
annual fee paid to the bank group 187991 175000 137312 92500 250000 5372
LOG (LOAN SIZE) Natural logarithm of the loan facility amount Loan amount is measured
in millions of dollars 19210 19337 1493 18369 20212 5973
LOG (LOAN MATURITY) Natural logarithm of the loan maturity Maturity is measured in months 3816 4111 0581 3611 4111 5869
COLLATERAL A dummy variable that equals one if the loan facility is secured by
collateral and zero otherwise 0473 0000 0499 0000 1000 5973
COV_INTENSITY_INDEX Bradley and Roberts (2015) covenant intensity index equal to the sum of
six covenant indicators (collateral dividend restriction more than 2
financial covenants asset sales sweep equity issuance sweep and debt issuance sweep) The index consists primarily of covenants that restrict
borrower actions or provide lenders rights that are conditioned on adverse
future events 2079 2000 1985 0000 3000 5973
TARP
VARIABLES
(SOURCE US
DEPARTMENT OF THE
TREASURY)
TARP RECIPIENT A dummy variable which takes a value of 1 if the bank was provided TARP capital support
0949 1000 0219 1000 1000 5973
LOG (1+BAILOUT AMOUNT)
The natural logarithm of (1 + the bank dollar bailout support) A larger value indicates a higher degree of TARP support
15920 17034 3756 17034 17034 5973
POST TARP An indicator equal to 1 in 2009-2012 and 0 in 2005-2008 0333 0000 0471 0000 1000 5973
BORROWER CONTROL
VARIABLES
(SOURCE
COMPUSTAT)
BORROWER_SIZE The natural logarithm of book value of total assets of the borrower in
millions of dollars 7529 7466 1776 6281 8724 5973
MARKET-TO-BOOK Market-to-book ratio determined as the market value of equity (PRCC_F
CSHO) scaled by the book value of equity 1957 2108 40971 1359 3315 5973
LEVERAGE The ratio of book value of total debt to book value of assets Total Debt
(Total Debt + Market Value of Equity) where Total Debt = Long Term
Debt + Total Debt in Current Liabilities 0273 0223 0228 0097 0394 5973
CASH FLOW VOLATILITY Standard deviation of previous 12 quarterly cash flows where Cash Flow
= (Income Before Extraordinary Items + Depreciation and Amortization) Total Assets and Depreciation and Amortization (DP) is set to 0 if
missing 0026 0010 0148 0005 0022 5973
PROFITABILITY The ratio of Earnings Before Interest Taxes Depreciation and Amortization (EBITDA) to Sales 0035 0033 0030 0021 0047 5973
TANGIBILITY The ratio of net property plant and equipment (NPPE) to total assets 0326 0251 0249 0123 0502 5973
CASH HOLDINGS RATIO Cash and marketable securities divided by total assets 0093 0049 0117 0017 0122 5973
BORROWER RATING
DUMMIES
Dummy variables for SampP borrower credit rating types It includes
dummies for SampP ratings of AAA AA A BBB BB B CCC or below
and 0 for those without a credit rating
36 Variable Definitions and Summary Statistics for the Full Sample (2005-2012) (cont)
Type Variable Definition Mean p50 Std p25 p75 N
BANK CONTROL
VARIABLES
(SOURCE CALL
REPORTS SUMMARY
OF DEPOSITS)
BANK SIZE The natural logarithm of gross total assets (GTA) of the bank 20447 20887 1140 20000 21064 5973
CAMELS PROXY
CAPITAL ADEQUACY
Capitalization ratio defined as equity capital divided by GTA Capital
adequacy refers to the amount of a bankrsquos capital relative to its assets
Broadly this criterion evaluates the extent to which a bank can absorb potential losses 0098 0095 0021 0089 0106 5973
CAMELS PROXY ASSET QUALITY
Asset quality evaluates the overall condition of a bankrsquos portfolio and is typically evaluated by a fraction of nonperforming assets and assets in
default Noncurrent loans and leases are loans that are past due for at least
ninety days or are no longer accruing interest Higher proportion of nonperforming assets indicates lower asset quality
0026 0013 0023 0009 0049 5973
CAMELS PROXY
MANAGEMENT QUALITY
A proxy for the bankrsquos management quality calculated as the ratio of
overhead expenses to GTA 0007 0007 0002 0006 0008 5973
CAMELS PROXY EARNINGS (ROA)
Return on assets (ROA) measured as the ratio of the annualized net income to GTA 0023 0020 0017 0012 0033 5973
CAMELS PROXY
LIQUIDITY
Cash divided by bank total deposits
0087 0079 0060 0056 0098 5973
CAMELS PROXY SENSITIVITY TO MARKET
RISK
The sensitivity to interest rate risk defined as the ratio of the absolute difference (gap) between short-term assets and short-term liabilities to
GTA -0163 -0137 0120 -0258 -0081 5973
HHI DEPOSITS A measure of bank concentration measured by the Herfindahl-Hirschman
Deposits Index determined using the bank deposit data from the FDIC
Summary of Deposits Higher values show greater market concentration 0160 0136 0063 0120 0184 5973
PERCENT METROPOLITAN
Percent of the bank deposits which are in metropolitan areas (MSAs or NECMAs) 0989 0994 0015 0987 0998 5973
FEE INCOME The ratio of banks non-interest income to total bank income 0353 0350 0098 0290 0429 5973
DIVERSIFICATION Laeven and Levine (2007) measure of diversification across different
sources of income calculated as 1- | (Net Interest Income - Other
Operating Income)Total Operating Income| 0503 0497 0251 0330 0646 5973
DWTAF Dummy equal to 1 if a bank received discount window (DW) or Term Auction facility (TAF) funding during the crisis 0980 1000 0139 1000 1000 5973
OTHER CONTROLS
(SOURCES LPC
DEALSCAN
COMPUSTAT)
LOAN TYPE
DUMMIES
Dummy variables for loan types It includes term loans revolving credit
lines and other loans
INDUSTRY FIXED EFFECTS
Dummy variables for borrower 2-digit SIC codes
YEAR FIXED
EFFECTS
Dummy variables for years in the sample
INSTRUMENTAL
VARIABLE
(SOURCES CENTER
FOR RESPONSIVE
POLITICS HOUSE OF
REPRESENTATIVES
MISSOURI CENSUS
DATA CENTER)
SUBCOMMITTEES ON FINANCIAL
INSTITUTIONS OR
CAPITAL MARKETS
A dummy variable which takes a value of 1 if a firm is headquartered in a district of a House member who served on the Capital Markets
Subcommittee or the Financial Institutions Subcommittee of the House
Financial Services Committee in 2008 or 2009
0369 0000 0483 0000 1000 5919
37
Table 2 Effects of TARP on Loan Contract Terms Main Results This table reports estimates from difference-in-difference (DID) regression estimates for analyzing the effects of TARP on loan contract terms The dependent variables are the five
loan contract terms loan spread size maturity collateral and covenant intensity index The explanatory variables are TARP RECIPIENT (a dummy equal to one if the bank was
provided TARP capital support) POST TARP (a dummy equal to one in 2009-2012 the period after TARP program initiation) their interaction as well as borrower and other bank
characteristics Borrower characteristics are borrower size market-to-book leverage profitability tangibility cash flow volatility cash holdings ratio Borrower rating dummies are
borrower SampP credit rating dummies Bank characteristics are bank size capital adequacy asset quality management quality earnings liquidity sensitivity to market risk HHI
percent metropolitan fee income diversification and DWTAF (Discount Window andor Term Auction Facility programs) Models also include loan type dummies industry (2-
digit SIC) fixed effects and year-fixed effects The estimation results are for 2005-2012 All variables are defined in Table 1 and denote significance at 10 5 and 1
level
(1) (2) (3) (4) (5)
VARIABLES LOANSPREAD LOG (LOAN SIZE) LOG (LOAN MATURITY) COLLATERAL COV_INTENSITY_INDEX
TARP RECIPIENT 45885 -0006 -0031 -0035 -0282
(5735) (-0087) (-0702) (-1052) (-2062)
POST TARP x TARP RECIPIENT -41974 0257 0185 -0083 -0484
(-2716) (2647) (3570) (-2089) (-2787)
BORROWER_SIZE -18356 0647 0035 -0085 -0257
(-15558) (60480) (5995) (-19228) (-13688)
MARKET-TO-BOOK 0021 -0000 0000 0000 0001
(1639) (-1972) (0653) (1253) (1443)
LEVERAGE 151786 -0428 -0180 0293 0174
(14426) (-5369) (-3728) (8239) (1110)
CASH FLOW VOLATILITY 13695 0179 -0001 0018 0030
(1139) (2327) (-0033) (0892) (0279)
PROFITABILITY -317613 1992 0805 -1506 -2398
(-3792) (4122) (3647) (-7389) (-3000)
TANGIBILITY 7173 -0093 -0104 -0080 -0443
(0714) (-1179) (-2422) (-1992) (-2662)
CASH HOLDINGS RATIO 71589 -0855 -0157 0211 -0076
(3859) (-7001) (-2346) (3871) (-0312)
BORROWER RATING DUMMIES YES YES YES YES YES
BANK CHARACTERISTICS YES YES YES YES YES
LOAN TYPE DUMMIES YES YES YES YES YES
INDUSTRY FIXED EFFECTS YES YES YES YES YES
YEAR FIXED EFFECTS YES YES YES YES YES
Observations 5372 5973 5869 5973 5973
Adjusted R-squared 0531 0666 0383 0321 0249
38
Table 3 Effects of TARP on Loan Contract Terms ndash Instrumental Variable (IV) Analysis This table shows difference-in-difference (DID) regression estimates for analyzing the effects of TARP on loan contract terms using an instrumental variable approach as in
Wooldridge Section 1841 (Panels A and B) and Heckmanrsquos (1979) Selection Model (Panels A and C) We use as instrument the SUBCOMMITTEES ON FINANCIAL
INSTITUTIONS OR CAPITAL MARKETS SUBCOMMITTEE ON FINANCIAL INSTITUTIONS OR CAPITAL MARKETS is a variable which takes a value of 1 if a firm is
headquartered in a district of a House member who served on the Capital Markets Subcommittee or the Financial Institutions Subcommittee of the House Financial Services
Committee in 2008 or 2009 The dependent variables are the five loan contract terms loan spread size maturity collateral and covenant intensity index The explanatory variables
are TARP RECIPIENT (a dummy equal to one if the bank was provided TARP capital support) POST TARP (a dummy equal to one in 2009-2012 the period after TARP program
initiation) their interaction as well as borrower and other bank characteristics Borrower characteristics are borrower size market-to-book leverage profitability tangibility cash
flow volatility cash holdings ratio Borrower rating dummies are borrower SampP credit rating dummies Bank characteristics are bank size capital adequacy asset quality
management quality earnings liquidity sensitivity to market risk HHI percent metropolitan fee income diversification and DWTAF (Discount Window andor Term Auction
Facility programs) Models also include loan type dummies industry (2-digit SIC) fixed effects and year-fixed effects The estimation results are for 2005-2012 All variables are
defined in Table 1 and denote significance at 10 5 and 1 level
Table 3 Panel A First Stage ndash IV (as in Wooldridge Section 1841)
Dependent Variable TARP Recipient
Independent Variables (1)
SUBCOMMITEES ON FINANCIAL INSTITUTIONS OR CAPITAL MARKETS 0903
(3015)
BORROWER CHARACTERISTICS YES
BORROWER RATING DUMMIES YES
BANK CHARACTERISTICS YES
LOAN TYPE DUMMIES YES
INDUSTRY FIXED EFFECTS YES
YEAR FIXED EFFECTS YES
Observations 4987
Pseudo R-squared 0656
39
Table 3 Panel B Final Stage ndash IV (as in Wooldridge Section 1841) (1) (2) (3) (4) (5)
VARIABLES LOANSPREAD LOG (LOAN SIZE) LOG (LOAN MATURITY) COLLATERAL COV_INTENSITY_INDEX
TARP RECIPIENT 11849 0234 -0002 -0190 -0669
(0728) (1681) (-0018) (-3023) (-2453)
POST TARP x TARP RECIPIENT -55168 0192 0165 -0088 -0643
(-2608) (1653) (2654) (-1826) (-2959)
BORROWER CHARACTERISTICS YES YES YES YES YES
BORROWER RATING DUMMIES YES YES YES YES YES
BANK CHARACTERISTICS YES YES YES YES YES
LOAN TYPE DUMMIES YES YES YES YES YES
INDUSTRY FIXED EFFECTS YES YES YES YES YES
YEAR FIXED EFFECTS YES YES YES YES YES
Observations 4503 4987 4892 4987 4987
Adjusted R-squared 0535 0674 0364 0321 0250
First Stage Kleibergen-Paap rk Wald F-test 149572 149572 149572 149572 149572
Table 3 Panel C Heckmanrsquos (1979) Selection Model ndash Outcome Equation
(1) (2) (3) (4) (5)
VARIABLES LOANSPREAD LOG (LOAN SIZE) LOG (LOAN MATURITY) COLLATERAL COV_INTENSITY_INDEX
TARP RECIPIENT 12612 0410 0094 -0128 -0473
(0785) (2711) (1097) (-1759) (-1630)
POST TARP x TARP RECIPIENT -43315 0232 0166 -0105 -0457
(-2514) (2250) (2960) (-2312) (-2390)
LAMBDA 15713 -0249 -0066 0038 0132
(1972) (-2995) (-1393) (0936) (0784)
BORROWER CHARACTERISTICS YES YES YES YES YES
BORROWER RATING DUMMIES YES YES YES YES YES
BANK CHARACTERISTICS YES YES YES YES YES
LOAN TYPE DUMMIES YES YES YES YES YES
INDUSTRY FIXED EFFECTS YES YES YES YES YES
YEAR FIXED EFFECTS YES YES YES YES YES
Observations 3983 4351 4269 4351 4351
Adjusted R-squared 0515 0667 0323 0297 0221
40
Table 4 Effects of TARP on Loan Contract Terms ndash Placebo Experiment This table shows difference-in-difference (DID) regression estimates for analyzing the effects of TARP on loan contract terms using a placebo experiment In the placebo experiment
we fictionally assume that the TARP participation took place four years earlier and we still distinguish between banks that received TARP and those that did not according to their
ldquotrue TARP program The dependent variables are the five loan contract terms loan spread size maturity collateral and covenant intensity index The explanatory variables are
TARP RECIPIENT (a dummy equal to one if the bank was provided TARP capital support) PLACEBO POST TARP (a dummy equal to one in 2005-2008 the period after the
fictional TARP program initiation) their interaction as well as borrower and other bank characteristics Borrower characteristics are borrower size market-to-book leverage
profitability tangibility cash flow volatility cash holdings ratio Borrower rating dummies are borrower SampP credit rating dummies Bank characteristics are bank size capital
adequacy asset quality management quality earnings liquidity sensitivity to market risk HHI percent metropolitan fee income diversification and DWTAF (Discount Window
andor Term Auction Facility programs) Models also include loan type dummies industry (2-digit SIC) fixed effects and year-fixed effects The estimation results are for 2001-
2008 All variables are defined in Table 1 and denote significance at 10 5 and 1 level
Assuming TARP Took Place Four Years Earlier
(1) (2) (3) (4) (5)
VARIABLES LOANSPREAD LOG (LOAN SIZE) LOG (LOAN MATURITY) COLLATERAL COV_INTENSITY_INDEX
TARP RECIPIENT 19516 -0063 -0052 -0052 -0765
(3333) (-1249) (-1622) (-2270) (-7400)
PLACIBO POST TARP x TARP RECIPIENT 15151 -0046 0081 0032 0186
(1865) (-0642) (1748) (0926) (1218)
BORROWER CHARACTERISTICS YES YES YES YES YES
BORROWER RATING DUMMIES YES YES YES YES YES
BANK CHARACTERISTICS YES YES YES YES YES
LOAN TYPE DUMMIES YES YES YES YES YES
INDUSTRY FIXED EFFECTS YES YES YES YES YES
YEAR FIXED EFFECTS YES YES YES YES YES
Observations 8117 8856 8622 8857 8857
Adjusted R-squared 0524 0726 0456 0357 0286
41
Table 5 Alternative Measure of TARP This table reports difference-in-difference (DID) regression estimates for the effects of TARP on loan contract terms using an alternative measure for TARP Support LOG (1+Bailout
Amount) The dependent variables are the five loan contract terms loan spread size maturity collateral and covenant intensity index The explanatory variables are LOG (1+Bailout
Amount) POST TARP (a dummy equal to one in 2009-2012 the period after TARP program initiation) their interaction as well as borrower and other bank characteristics Borrower
characteristics are borrower size market-to-book leverage profitability tangibility cash flow volatility cash holdings ratio Borrower rating dummies are borrower SampP credit
rating dummies Bank characteristics are bank size capital adequacy asset quality management quality earnings liquidity sensitivity to market risk HHI percent metropolitan
fee income diversification and DWTAF (Discount Window andor Term Auction Facility programs) Models also include loan type dummies industry (2-digit SIC) fixed effects
and year-fixed effects The estimation results are for 2005-2012 All variables are defined in Table 1 and denote significance at 10 5 and 1 level
LOG (1+ Bailout Amount)
(1) (2) (3) (4) (5)
VARIABLES LOANSPREAD LOG (LOAN SIZE) LOG (LOAN MATURITY) COLLATERAL COV_INTENSITY_INDEX
TARP RECIPIENT 2958 0000 -0002 -0003 -0021
(5715) (0041) (-0729) (-1284) (-2305)
POST TARP x TARP RECIPIENT -2422 0015 0011 -0005 -0034
(-2543) (2520) (3339) (-2073) (-3192)
BORROWER CHARACTERISTICS YES YES YES YES YES
BORROWER RATING DUMMIES YES YES YES YES YES
BANK CHARACTERISTICS YES YES YES YES YES
LOAN TYPE DUMMIES YES YES YES YES YES
INDUSTRY FIXED EFFECTS YES YES YES YES YES
YEAR FIXED EFFECTS YES YES YES YES YES
Observations 5372 5973 5869 5973 5973
Adjusted R-squared 0530 0666 0383 0321 0249
42
Table 6 Alternative Econometric Models This table reports difference-in-difference (DID) regression estimates for the effects of TARP on loan contract terms using alternative econometric models bank and year fixed
effects in Panel A bank year and SIC fixed effects in Panel B borrower state year and SIC fixed effects in Panel C state year and SIC fixed effects with errors clustered at the
borrower level in Panel D borrower state and year fixed effects with errors clustered at the borrower level in Panel E borrower state and year fixed effects with errors clustered at
the borrower-bank level in Panel F models excluding all bank-related controls other than proxies for CAMELS in Panel G models excluding all bank-related controls in Panel H
models excluding all borrower-related controls in Panel I models excluding all bank and borrower-related controls in Panel J and alternative econometric models for collateral
probit model with year fixed effects logit model with year fixed effects conditional loglog model with year fixed effects probit model with year and SIC fixed effects logit model
with year and SIC fixed effects and conditional loglog model with year fixed effects and errors clustered at the SIC level in Panel K The dependent variables are the five loan
contract terms loan spread size maturity collateral and covenant intensity index The explanatory variables are TARP RECIPIENT (a dummy equal to one if the bank was provided
TARP capital support) POST TARP (a dummy equal to one in 2009-2012 the period after TARP program initiation) their interaction as well as borrower and other bank
characteristics Borrower characteristics are borrower size market-to-book leverage profitability tangibility cash flow volatility cash holdings ratio Borrower rating dummies are
borrower SampP credit rating dummies Bank characteristics are bank size capital adequacy asset quality management quality earnings liquidity sensitivity to market risk HHI
percent metropolitan fee income diversification and DWTAF (Discount Window andor Term Auction Facility programs) Models also include loan type dummies industry (2-
digit SIC) fixed effects and year-fixed effects The estimation results are for 2005-2012 All variables are defined in Table 1 and denote significance at 10 5 and 1
level
Table 6 Panel A Regression Parameters ndash Bank Year and SIC Fixed Effects
Bank Year and SIC Fixed Effects
(1) (2) (3) (4) (5)
VARIABLES LOANSPREAD LOG (LOAN SIZE) LOG (LOAN MATURITY) COLLATERAL COV_INTENSITY_INDEX
POST TARP x TARP RECIPIENT -45284 0264 0204 -0095 -0657
(-2496) (2370) (3512) (-2123) (-3441)
BORROWER CHARACTERISTICS YES YES YES YES YES
BORROWER RATING DUMMIES YES YES YES YES YES
BANK CHARACTERISTICS YES YES YES YES YES
BANK FIXED EFFECTS YES YES YES YES YES
LOAN TYPE DUMMIES YES YES YES YES YES
INDUSTRY FIXED EFFECTS YES YES YES YES YES
YEAR FIXED EFFECTS YES YES YES YES YES
Observations 5372 5973 5869 5973 5973
Adjusted R-squared 0534 0668 0393 0328 0257
43 Table 6 Panel B Regression Parameters ndash Bank and Year Fixed Effects
Bank and Year Fixed Effects
(1) (2) (3) (4) (5)
VARIABLES LOANSPREAD LOG (LOAN SIZE) LOG (LOAN MATURITY) COLLATERAL COV_INTENSITY_INDEX
POST TARP x TARP RECIPIENT -34458 0310 0197 -0099 -0676
(-1954) (2675) (3468) (-2317) (-3696)
BORROWER CHARACTERISTICS YES YES YES YES YES
BORROWER RATING DUMMIES YES YES YES YES YES
BANK CHARACTERISTICS YES YES YES YES YES
BANK FIXED EFFECTS YES YES YES YES YES
LOAN TYPE DUMMIES YES YES YES YES YES
INDUSTRY FIXED EFFECTS NO NO NO NO NO
YEAR FIXED EFFECTS YES YES YES YES YES
Observations 5855 6508 6393 6508 6508
Adjusted R-squared 0520 0616 0410 0313 0246
Table 6 Panel C Regression Parameters ndash Borrower State Year and SIC Fixed Effects
Borrower State Year and SIC Fixed Effects
(1) (2) (3) (4) (5)
VARIABLES LOANSPREAD LOG (LOAN SIZE) LOG (LOAN MATURITY) COLLATERAL COV_INTENSITY_INDEX
TARP RECIPIENT 46491 -0032 -0025 -0025 -0268
(5692) (-0472) (-0563) (-0728) (-1913)
POST TARP x TARP RECIPIENT -38434 0262 0156 -0084 -0496
(-2505) (2665) (2955) (-2043) (-2823)
BORROWER CHARACTERISTICS YES YES YES YES YES
BORROWER RATING DUMMIES YES YES YES YES YES
BANK CHARACTERISTICS YES YES YES YES YES
STATE FIXED EFFECTS YES YES YES YES YES
LOAN TYPE DUMMIES YES YES YES YES YES
INDUSTRY FIXED EFFECTS YES YES YES YES YES
YEAR FIXED EFFECTS YES YES YES YES YES
Observations 5304 5891 5788 5891 5891
Adjusted R-squared 0539 0672 0388 0331 0255
44 Table 6 Panel D Regression Parameters ndash Borrower State Year and SIC Fixed Effects and Borrower Clusters
Borrower State Year and SIC Fixed Effects and Borrower Clusters
(1) (2) (3) (4) (5)
VARIABLES LOANSPREAD LOG (LOAN SIZE) LOG (LOAN MATURITY) COLLATERAL COV_INTENSITY_INDEX
TARP RECIPIENT 46491 -0032 -0025 -0025 -0268
(4601) (-0380) (-0487) (-0566) (-1474)
POST TARP x TARP RECIPIENT -38434 0262 0156 -0084 -0496
(-2141) (2677) (2240) (-1811) (-2304)
BORROWER CHARACTERISTICS YES YES YES YES YES
BORROWER RATING DUMMIES YES YES YES YES YES
BANK CHARACTERISTICS YES YES YES YES YES
STATE FIXED EFFECTS YES YES YES YES YES
LOAN TYPE DUMMIES YES YES YES YES YES
INDUSTRY FIXED EFFECTS YES YES YES YES YES
YEAR FIXED EFFECTS YES YES YES YES YES
BORROWER CLUSTERS YES YES YES YES YES
Observations 5304 5891 5788 5891 5891
Adjusted R-squared 0539 0672 0388 0331 0255
No Clusters 1985 2056 2041 2056 2056
Table 6 Panel E Regression Parameters ndash SIC and Year Fixed Effects and Borrower Clusters
SIC and Year Fixed Effects and Borrower Clusters
(1) (2) (3) (4) (5)
VARIABLES LOANSPREAD LOG (LOAN SIZE) LOG (LOAN MATURITY) COLLATERAL COV_INTENSITY_INDEX
TARP RECIPIENT 45885 -0006 -0031 -0035 -0282
(4565) (-0070) (-0599) (-0818) (-1580)
POST TARP x TARP RECIPIENT -41974 0257 0185 -0083 -0484
(-2299) (2680) (2668) (-1878) (-2234)
BORROWER CHARACTERISTICS YES YES YES YES YES
BORROWER RATING DUMMIES YES YES YES YES YES
BANK CHARACTERISTICS YES YES YES YES YES
LOAN TYPE DUMMIES YES YES YES YES YES
INDUSTRY FIXED EFFECTS YES YES YES YES YES
YEAR FIXED EFFECTS YES YES YES YES YES
BORROWER CLUSTERS YES YES YES YES YES
Observations 5372 5973 5869 5973 5973
Adjusted R-squared 0531 0666 0383 0321 0249
No Clusters 2020 2099 2083 2099 2099
45 Table 6 Panel F Regression Parameters ndash SIC and Year Fixed Effects and Borrower-Bank Clusters
SIC and Year Fixed Effects and Borrower-Bank Clusters
(1) (2) (3) (4) (5)
VARIABLES LOANSPREAD LOG (LOAN SIZE) LOG (LOAN MATURITY) COLLATERAL COV_INTENSITY_INDEX
TARP RECIPIENT 45885 -0006 -0031 -0035 -0282
(4567) (-0069) (-0595) (-0842) (-1570)
POST TARP x TARP RECIPIENT -41974 0257 0185 -0083 -0484
(-2306) (2636) (2673) (-1856) (-2233)
BORROWER CHARACTERISTICS YES YES YES YES YES
BORROWER RATING DUMMIES YES YES YES YES YES
BANK CHARACTERISTICS YES YES YES YES YES
LOAN TYPE DUMMIES YES YES YES YES YES
INDUSTRY FIXED EFFECTS YES YES YES YES YES
YEAR FIXED EFFECTS YES YES YES YES YES
BORROWER x BANK CLUSTERS YES YES YES YES YES
Observations 5372 5973 5869 5973 5973
Adjusted R-squared 0531 0666 0383 0321 0249
No Clusters 2374 2522 2498 2522 2522
Table 6 Panel G Regression Parameters ndash Exclude Bank Characteristics Other than Proxies for CAMELS
Excluding Bank Characteristics Other than Proxies for CAMELS
(1) (2) (3) (4) (5)
VARIABLES LOANSPREAD LOG (LOAN SIZE) LOG (LOAN MATURITY) COLLATERAL COV_INTENSITY_INDEX
TARP RECIPIENT 27139 0139 0047 -0060 -0370
(3600) (2232) (1121) (-2008) (-3064)
POST TARP x TARP RECIPIENT -33661 0211 0189 -0078 -0380
(-2205) (2232) (3687) (-2023) (-2276)
BORROWER CHARACTERISTICS YES YES YES YES YES
BORROWER RATING DUMMIES YES YES YES YES YES
BANK CHARACTERISTICS other than CAMELS YES YES YES YES YES
LOAN TYPE DUMMIES YES YES YES YES YES
INDUSTRY FIXED EFFECTS YES YES YES YES YES
YEAR FIXED EFFECTS YES YES YES YES YES
Observations 5396 5999 5895 5999 5999
Adjusted R-squared 0524 0666 0381 0319 0247
46 Table 6 Panel H Regression Parameters ndash Exclude All Bank Characteristics
Excluding All Bank Characteristics
(1) (2) (3) (4) (5)
VARIABLES LOANSPREAD LOG (LOAN SIZE) LOG (LOAN MATURITY) COLLATERAL COV_INTENSITY_INDEX
TARP RECIPIENT 20515 0141 0037 -0058 -0203
(3040) (2518) (1052) (-2075) (-1768)
POST TARP x TARP RECIPIENT -31711 0248 0188 -0073 -0187
(-2191) (2821) (3935) (-2056) (-1188)
BORROWER CHARACTERISTICS YES YES YES YES YES
BORROWER RATING DUMMIES YES YES YES YES YES
BANK CHARACTERISTICS NO NO NO NO NO
LOAN TYPE DUMMIES YES YES YES YES YES
INDUSTRY FIXED EFFECTS YES YES YES YES YES
YEAR FIXED EFFECTS YES YES YES YES YES
Observations 5398 6001 5897 6001 6001
Adjusted R-squared 0520 0664 0379 0317 0240
Table 6 Panel I Regression Parameters ndash Exclude All Borrower Characteristics
Excluding All Borrower Characteristics
(1) (2) (3) (4) (5)
VARIABLES LOANSPREAD LOG (LOAN SIZE) LOG (LOAN MATURITY) COLLATERAL COV_INTENSITY_INDEX
TARP RECIPIENT 44641 -0241 -0128 0007 -0168
(5140) (-2765) (-3195) (0221) (-1283)
POST TARP x TARP RECIPIENT -58612 0238 0255 -0113 -0454
(-3465) (1875) (5111) (-2661) (-2675)
BORROWER CHARACTERISTICS NO NO NO NO NO
BORROWER RATING DUMMIES YES YES YES YES YES
BANK CHARACTERISTICS YES YES YES YES YES
LOAN TYPE DUMMIES YES YES YES YES YES
INDUSTRY FIXED EFFECTS YES YES YES YES YES
YEAR FIXED EFFECTS YES YES YES YES YES
Observations 6652 7380 7234 7380 7380
Adjusted R-squared 0359 0261 0348 0130 0151
47 Table 6 Panel J Regression Parameters ndash Using 2-Digit NAICS Industries
Two-Digit NAICS Industries
(1) (2) (3) (4) (5)
VARIABLES LOANSPREAD LOG (LOAN SIZE) LOG (LOAN MATURITY) COLLATERAL COV_INTENSITY_INDEX
TARP RECIPIENT 46473 -0029 -0043 -0025 -0274
(5834) (-0432) (-0978) (-0741) (-1997)
POST TARP x TARP RECIPIENT -41588 0257 0197 -0094 -0509
(-2689) (2652) (3707) (-2367) (-2897)
BORROWER CHARACTERISTICS YES YES YES YES YES
BORROWER RATING DUMMIES YES YES YES YES YES
BANK CHARACTERISTICS YES YES YES YES YES
LOAN TYPE DUMMIES YES YES YES YES YES
2-DIGIT NAICS FIXED EFFECTS YES YES YES YES YES
YEAR FIXED EFFECTS YES YES YES YES YES
Observations 5372 5973 5869 5973 5973
Adjusted R-squared 0526 0665 0379 0318 0238
Table 6 Panel K Regression Parameters ndash Using Fama-French 48 Industries
Fama-French 48 Industries
(1) (2) (3) (4) (5)
VARIABLES LOANSPREAD LOG (LOAN SIZE) LOG (LOAN MATURITY) COLLATERAL COV_INTENSITY_INDEX
TARP RECIPIENT 45118 -0019 -0039 -0035 -0281
(5667) (-0280) (-0900) (-1035) (-2039)
POST TARP x TARP RECIPIENT -44858 0208 0194 -0090 -0502
(-2875) (2180) (3708) (-2237) (-2868)
BORROWER CHARACTERISTICS YES YES YES YES YES
BORROWER RATING DUMMIES YES YES YES YES YES
BANK CHARACTERISTICS YES YES YES YES YES
LOAN TYPE DUMMIES YES YES YES YES YES
FF48 FIXED EFFECTS YES YES YES YES YES
YEAR FIXED EFFECTS YES YES YES YES YES
Observations 5343 5940 5837 5940 5940
Adjusted R-squared 0531 0669 0383 0320 0246
48 Table 6 Panel L Regression Parameters ndash Alternative Models for Collateral
Alternative Models for Collateral
(1) (2) (3) (4) (5) (6)
VARIABLES PROBIT LOGIT CLOGLOG PROBIT LOGIT CLOGLOG
TARP RECIPIENT 0007 -0007 0051 -0038 -0099 0018
(0063) (-0036) (0451) (-0329) (-0501) (0152)
POST TARP x TARP RECIPIENT -0417 -0683 -0576 -0419 -0637 -0544
(-2829) (-2679) (-3788) (-2653) (-2304) (-3388)
BORROWER CHARACTERISTICS YES YES YES YES YES YES
BORROWER RATING DUMMIES YES YES YES YES YES YES
BANK CHARACTERISTICS YES YES YES YES YES YES
LOAN TYPE DUMMIES YES YES YES YES YES YES
INDUSTRY FIXED EFFECTS NO NO NO YES YES YES
YEAR FIXED EFFECTS YES YES YES YES YES YES
Observations 6463 6463 6463 5831 5831 5831
Pseudo R-squared (or R-squared) 0265 0266 0275 0277
49
Table 7 Additional Robustness Tests This table reports difference-in-difference (DID) regression estimates for the effects of TARP on loan contract terms from additional robustness tests Panel A reports estimates when
excluding borrowers with missing SampP credit rating Panel B reports estimates when excluding borrowers with only 1 loan Panel C reports estimates when excluding foreign banks
Panel D reports estimates for the timing of the impact of TARP on loan contract terms The dependent variables are the five loan contract terms loan size spread maturity collateral
and covenant intensity index The explanatory variables are TARP RECIPIENT (a dummy equal to one if the bank was provided TARP capital support) POST TARP (a dummy
equal to one in 2009-2012 the period after TARP program initiation) their interaction (Panel A B C and D) In Panel D the coefficients are the interactions of the TARP Recipient
variable with year dummies for each year after the TARP program was implemented (2009 2010 2011 and 2012) In Panel E we examine effects of TARP on loan contract terms
for involuntary and voluntary TARP participants In all regression we also control for borrower and other bank characteristics Borrower characteristics are borrower size market-
to-book leverage profitability tangibility cash flow volatility cash holdings ratio Borrower rating dummies are borrower SampP credit rating dummies Bank characteristics are
bank size capital adequacy asset quality management quality earnings liquidity sensitivity to market risk HHI percent metropolitan fee income diversification and DWTAF
(Discount Window andor Term Auction Facility programs) Models also include loan type dummies industry (2-digit SIC) fixed effects and year-fixed effects The estimation
results are for 2005-2012 All variables are defined in Table 1 and denote significance at 10 5 and 1 level
Table 7 Panel A Regression Parameters ndash Exclude Borrowers with Missing SampP Credit Rating
Exclude borrowers with missing ratings
(1) (2) (3) (4) (5)
VARIABLES LOANSPREAD LOG (LOAN SIZE) LOG (LOAN MATURITY) COLLATERAL COV_INTENSITY_INDEX
TARP RECIPIENT 36298 0011 -0024 -0197 -0163
(2405) (0070) (-0264) (-2666) (-0549)
POST TARP x TARP RECIPIENT -50990 0429 0199 -0090 -1043
(-2606) (2717) (2483) (-1664) (-3858)
BORROWER CHARACTERISTICS YES YES YES YES YES
BORROWER RATING DUMMIES YES YES YES YES YES
BANK CHARACTERISTICS YES YES YES YES YES
LOAN TYPE DUMMIES YES YES YES YES YES
INDUSTRY FIXED EFFECTS YES YES YES YES YES
YEAR FIXED EFFECTS YES YES YES YES YES
Observations 2664 3014 2949 3014 3014
Adjusted R-squared 0661 0520 0496 0447 0351
Table 7 Panel B Regression Parameters ndash Exclude Borrowers with Only 1 Loan
Exclude borrowers with only 1 loan
(1) (2) (3) (4) (5)
VARIABLES LOANSPREAD LOG (LOAN SIZE) LOG (LOAN MATURITY) COLLATERAL COV_INTENSITY_INDEX
TARP RECIPIENT 43931 -0044 -0009 -0057 -0323
(4919) (-0556) (-0180) (-1533) (-2073)
POST TARP x TARP RECIPIENT -44434 0322 0194 -0082 -0515
(-2653) (2989) (3440) (-1883) (-2717)
BORROWER CHARACTERISTICS YES YES YES YES YES
BORROWER RATING DUMMIES YES YES YES YES YES
BANK CHARACTERISTICS YES YES YES YES YES
LOAN TYPE DUMMIES YES YES YES YES YES
INDUSTRY FIXED EFFECTS YES YES YES YES YES
YEAR FIXED EFFECTS YES YES YES YES YES
Observations 4817 5372 5278 5372 5372
Adjusted R-squared 0538 0647 0386 0329 0267
50 Table 7 Panel C Regression Parameters ndash Exclude Foreign Banks
Exclude Foreign Banks
(1) (2) (3) (4) (5)
VARIABLES LOANSPREAD LOG (LOAN SIZE) LOG (LOAN MATURITY) COLLATERAL COV_INTENSITY_INDEX
TARP RECIPIENT 36746 -0135 0077 -0007 -0363
(2631) (-1259) (1103) (-0120) (-1527)
POST TARP x TARP RECIPIENT -48900 0467 0302 -0101 -0520
(-2214) (3575) (4554) (-2028) (-2217)
BORROWER CHARACTERISTICS YES YES YES YES YES
BANK CHARACTERISTICS YES YES YES YES YES
LOAN TYPE DUMMIES YES YES YES YES YES
INDUSTRY FIXED EFFECTS YES YES YES YES YES
YEAR FIXED EFFECTS YES YES YES YES YES
Observations 4663 5212 5119 5212 5212
Adjusted R-squared 0540 0643 0397 0326 0262
Table 7 Panel D Regression Parameters ndash Timing of the Effects
Timeline of TARP Effects
(1) (2) (3) (4) (5)
VARIABLES LOANSPREAD LOG (LOAN SIZE) LOG (LOAN MATURITY) COLLATERAL COV_INTENSITY_INDEX
TARP RECIPIENT 47114 -0013 -0033 -0036 -0276
(5889) (-0192) (-0748) (-1073) (-2003)
POST TARP 2009 x TARP RECIPIENT -35537 0207 0161 -0083 -0383
(-2112) (2002) (2925) (-2017) (-2056)
POST TARP 2010 x TARP RECIPIENT -56874 0352 0202 -0091 -0587
(-3633) (3073) (3367) (-1799) (-2720)
POST TARP 2011 x TARP RECIPIENT -52606 0358 0247 -0087 -0739
(-3145) (2852) (3766) (-1454) (-3099)
POST TARP 2012 x TARP RECIPIENT -58945 0310 0260 -0002 -0540
(-2798) (1947) (3265) (-0028) (-1809)
BORROWER CHARACTERISTICS YES YES YES YES YES
BORROWER RATING DUMMIES YES YES YES YES YES
BANK CHARACTERISTICS YES YES YES YES YES
LOAN TYPE DUMMIES YES YES YES YES YES
INDUSTRY FIXED EFFECTS YES YES YES YES YES
YEAR FIXED EFFECTS YES YES YES YES YES
Observations 5372 5973 5869 5973 5973
Adjusted R-squared 0531 0666 0383 0321 0249
51 Table 7 Panel E Regression Parameters ndash Involuntary and Voluntary Participants
Involuntary and Voluntary Participants
(1) (2) (3) (4) (5)
VARIABLES LOANSPREAD LOG (LOAN SIZE) LOG (LOAN MATURITY) COLLATERAL COV_INTENSITY_INDEX
TARP RECIPIENT INVOL 78213 -0127 -0136 0068 -0411
(7568) (-1464) (-2322) (1539) (-2232)
TARP RECIPIENT VOL 38490 0020 -0027 -0056 -0341
(4676) (0280) (-0574) (-1567) (-2325)
POST TARP x TARP RECIPIENT INVOL -34444 0232 0142 -0061 -0616
(-2061) (2252) (2607) (-1439) (-3356)
POST TARP x TARP RECIPIENT VOL -32146 0218 0193 -0054 -0315
(-1990) (2013) (3142) (-1098) (-1529)
BORROWER CHARACTERISTICS YES YES YES YES YES
BORROWER RATING DUMMIES YES YES YES YES YES
BANK CHARACTERISTICS YES YES YES YES YES
LOAN TYPE DUMMIES YES YES YES YES YES
INDUSTRY FIXED EFFECTS YES YES YES YES YES
YEAR FIXED EFFECTS YES YES YES YES YES
Observations 5372 5973 5869 5973 5973
Adjusted R-squared 0532 0666 0384 0322 0249
Table 7 Panel F Regression Parameters ndash Stress Test and Non-Stress Test Participants
Stress Tests (SCAP and CCAR) and Non-Stress Tests Participants
(1) (2) (3) (4) (5)
VARIABLES LOANSPREAD LOG (LOAN SIZE) LOG (LOAN MATURITY) COLLATERAL COV_INTENSITY_INDEX
STRESS-TEST TARP RECIPIENT 35412 0089 -0035 -0089 -0306
(4016) (1169) (-0729) (-2317) (-1906)
NON-STRESS-TEST TARP RECIPIENT 78954 -0296 -0047 0115 -0271
(6424) (-2761) (-0681) (2416) (-1218)
POST TARP x STRESS-TEST TARP RECIPIENT -37936 0231 0174 -0076 -0505
(-2438) (2324) (3319) (-1836) (-2837)
POST TARP x NON-STRESS-TEST TARP RECIPIENT -84244 0541 0286 -0184 -0303
(-2973) (3497) (2641) (-2326) (-0892)
BORROWER CHARACTERISTICS YES YES YES YES YES
BORROWER RATING DUMMIES YES YES YES YES YES
BANK CHARACTERISTICS YES YES YES YES YES
LOAN TYPE DUMMIES YES YES YES YES YES
INDUSTRY FIXED EFFECTS YES YES YES YES YES
YEAR FIXED EFFECTS YES YES YES YES YES
Observations 5372 5973 5869 5973 5973
Adjusted R-squared 0531 0666 0383 0322 0249
52
Table 8 Effects of TARP on Loan Contract Terms Borrower Risk This table shows additional subsample tests for analyzing the effects of TARP on loan contract terms It reports difference-in-difference (DID) regression estimates when
differentiating between low versus high risk borrowers Panel A reports the difference-in-difference (DID) regression estimates for TARP lending to high risk borrowers (BB and
below SampP credit rating borrowers) and low risk borrowers (BBB and above SampP credit rating borrowers) in Panel A1 and the tests of the equality of the effects of TARP lending
for the two different types of borrowers in Panel A2 Panel B reports the difference-in-difference (DID) regression estimates for TARP lending to low risk borrowers (low leverage
borrowers that is leverage le median) and high risk borrowers (high leverage borrowers that is leverage gt median) in Panel B1 and the tests of the equality of the effects of TARP
lending for the two different types of borrowers in Panel B2 Panel C reports the difference-in-difference (DID) regression estimates for TARP lending to low risk borrowers (low
cash flow volatility borrowers that is cash flow volatility le median) and high risk borrowers (high cash flow volatility borrowers that is cash flow volatility gt median) in Panel C1
and the tests of the equality of the effects of TARP lending for the two different types of borrowers in Panel C2The dependent variables are the five loan contract terms loan spread
size maturity collateral and covenant intensity index The explanatory variables are TARP RECIPIENT (a dummy equal to one if the bank was provided TARP capital support)
POST TARP (a dummy equal to one in 2009-2012 the period after TARP program initiation) their interaction as well as borrower and other bank characteristics Borrower
characteristics are borrower size market-to-book leverage profitability tangibility cash flow volatility cash holdings ratio Borrower rating dummies are borrower SampP credit
rating dummies Bank characteristics are bank size capital adequacy asset quality management quality earnings liquidity sensitivity to market risk HHI percent metropolitan
fee income diversification and DWTAF (Discount Window andor Term Auction Facility programs) Models also include loan type dummies industry (2-digit SIC) fixed effects
and year-fixed effects The estimation results are for 2005-2012 All variables are defined in Table 1 and denote significance at 10 5 and 1 level
Table 8 Panel A Effects by Borrower Risk SampP Credit Rating
Table 8 Panel A1 Regression Estimates High Risk Borrowers (SampP Credit Rating BB and below)
(1) (2) (3) (4) (5)
VARIABLES LOANSPREAD LOG (LOAN SIZE) LOG (LOAN MATURITY) COLLATERAL COV_INTENSITY_INDEX
TARP RECIPIENT 72453 -0009 -0034 -0240 0213
(3466) (-0044) (-0268) (-2476) (0504)
POST TARP x TARP RECIPIENT -63352 0526 0313 -0198 -1980
(-2108) (2466) (2834) (-2301) (-4900)
BORROWER CONTROLS YES YES YES YES YES
BORROWER RATING DUMMIES YES YES YES YES YES
BANK CONTROLS YES YES YES YES YES
LOAN TYPE DUMMIES YES YES YES YES YES
2-DIGIT SIC FIXED EFFECTS YES YES YES YES YES
YEAR FIXED EFFECTS YES YES YES YES YES
Observations 1453 1590 1533 1590 1590
Adjusted R-squared 0524 0484 0246 0088 0168
Low Risk Borrowers (SampP Credit Rating BBB and above)
(1) (2) (3) (4) (5)
VARIABLES LOANSPREAD LOG (LOAN SIZE) LOG (LOAN MATURITY) COLLATERAL COV_INTENSITY_INDEX
TARP RECIPIENT -50191 0150 -0012 -0243 -0191
(-2292) (0530) (-0103) (-1850) (-0542)
POST TARP x TARP RECIPIENT -7846 0282 -0070 0055 0246
(-0374) (1044) (-0782) (0694) (0678)
BORROWER CONTROLS YES YES YES YES YES
BORROWER RATING DUMMIES YES YES YES YES YES
BANK CONTROLS YES YES YES YES YES
LOAN TYPE DUMMIES YES YES YES YES YES
2-DIGIT SIC FIXED EFFECTS YES YES YES YES YES
YEAR FIXED EFFECTS YES YES YES YES YES
Observations 1211 1424 1416 1424 1424
Adjusted R-squared 0732 0471 0662 0157 0287
Table 8 Panel A2 Tests of the Equality of the Effects of TARP for Different Types of Borrowers
53 Borrower Risk (SampP Credit Rating)
VARIABLES LOANSPREAD LOG (LOAN SIZE) LOG (LOAN MATURITY) COLLATERAL COV_INTENSITY_INDEX
t-stat Effect for high risk borrowers =
effect for low risk borrowers -1514 0710 2695 -2167 -4099
Table 8 Panel B Effects by Borrower Risk High Leverage vs Low Leverage
Table 8 Panel B1 Regression Estimates High Risk Borrowers (Leverage gt Median)
(1) (2) (3) (4) (5)
VARIABLES LOANSPREAD LOG (LOAN SIZE) LOG (LOAN MATURITY) COLLATERAL COV_INTENSITY_INDEX
TARP RECIPIENT 27066 0110 -0065 -0007 -0132
(2274) (0965) (-0970) (-0138) (-0595)
POST TARP x TARP RECIPIENT -45707 0183 0135 -0157 -0873
(-2333) (1449) (2049) (-3056) (-3755)
BORROWER CONTROLS YES YES YES YES YES
BORROWER RATING DUMMIES YES YES YES YES YES
BANK CONTROLS YES YES YES YES YES
LOAN TYPE DUMMIES YES YES YES YES YES
2-DIGIT SIC FIXED EFFECTS YES YES YES YES YES
YEAR FIXED EFFECTS YES YES YES YES YES
Observations 2609 2865 2802 2865 2865
Adjusted R-squared 0560 0597 0335 0320 0248
Low Risk Borrowers (Leverage le Median)
(1) (2) (3) (4) (5)
VARIABLES LOANSPREAD LOG (LOAN SIZE) LOG (LOAN MATURITY) COLLATERAL COV_INTENSITY_INDEX
TARP RECIPIENT 44304 -0094 0019 -0088 -0394
(4525) (-1132) (0361) (-1976) (-2266)
POST TARP x TARP RECIPIENT -26788 0309 0212 0006 0044
(-1173) (2084) (2410) (0083) (0166)
BORROWER CONTROLS YES YES YES YES YES
BORROWER RATING DUMMIES YES YES YES YES YES
BANK CONTROLS YES YES YES YES YES
LOAN TYPE DUMMIES YES YES YES YES YES
2-DIGIT SIC FIXED EFFECTS YES YES YES YES YES
YEAR FIXED EFFECTS YES YES YES YES YES
Observations 2763 3108 3067 3108 3108
Adjusted R-squared 0460 0732 0452 0334 0290
Table 8 Panel B2 Tests of the Equality of the Effects of TARP for Different Types of Borrowers Borrower Risk (Leverage Median Cutoff)
VARIABLES LOANSPREAD LOG (LOAN SIZE) LOG (LOAN MATURITY) COLLATERAL COV_INTENSITY_INDEX
t-stat Effect for high risk borrowers =
Effect for low risk borrowers -0629 -0648 -0700 -1954 -2615
54 Table 8 Panel C Effects by Borrower Risk Cash Flow Volatility
Table 8 Panel C1 Regression Estimates High Risk Borrowers (Cash Flow Volatility gt Median)
(1) (2) (3) (4) (5)
VARIABLES LOANSPREAD LOG (LOAN SIZE) LOG (LOAN MATURITY) COLLATERAL COV_INTENSITY_INDEX
TARP RECIPIENT 62459 0001 -0138 -0057 -0256
(5579) (0010) (-2384) (-1379) (-1479)
POST TARP x TARP RECIPIENT -48099 0238 0228 -0108 -0666
(-2272) (1941) (3491) (-2266) (-3016)
BORROWER CONTROLS YES YES YES YES YES
BORROWER RATING DUMMIES YES YES YES YES YES
BANK CONTROLS YES YES YES YES YES
LOAN TYPE DUMMIES YES YES YES YES YES
2-DIGIT SIC FIXED EFFECTS YES YES YES YES YES
YEAR FIXED EFFECTS YES YES YES YES YES
Observations 2731 2986 2937 2986 2986
Adjusted R-squared 0479 0670 0309 0278 0199
Low Risk Borrowers (Cash Flow Volatility le Median)
(1) (2) (3) (4) (5)
VARIABLES LOANSPREAD LOG (LOAN SIZE) LOG (LOAN MATURITY) COLLATERAL COV_INTENSITY_INDEX
TARP RECIPIENT 8916 0020 0159 -0049 -0242
(0779) (0168) (2386) (-0773) (-1017)
POST TARP x TARP RECIPIENT -28013 0287 0093 -0026 -0094
(-1543) (1886) (1113) (-0340) (-0321)
BORROWER CONTROLS YES YES YES YES YES
BORROWER RATING DUMMIES YES YES YES YES YES
BANK CONTROLS YES YES YES YES YES
LOAN TYPE DUMMIES YES YES YES YES YES
2-DIGIT SIC FIXED EFFECTS YES YES YES YES YES
YEAR FIXED EFFECTS YES YES YES YES YES
Observations 2641 2987 2932 2987 2987
Adjusted R-squared 0561 0639 0475 0326 0302
Table 8 Panel C2 Tests of the Equality of the Effects of TARP for Different Types of Borrowers Borrower Risk (Cash Flow Volatility Median Cutoff)
VARIABLES LOANSPREAD LOG (LOAN SIZE) LOG (LOAN MATURITY) COLLATERAL COV_INTENSITY_INDEX
t-stat Effect for high risk borrowers = Effect for low risk borrowers -0720 -0251 1271 -0895 -2071
55
Table 9 Effects of TARP on Loan Contract Terms Borrower Financial Constraints This table shows additional subsample tests for analyzing the effects of TARP on loan contract terms It reports the difference-in-difference (DID) regression estimates for the effect
of TARP on loan terms to borrowers with different characteristics effect of TARP on large and small size borrowers (using median as a cutoff for the BORROWER SIZE in terms
of total assets) in Panel A1 and public versus private status borrowers in Panel B1 The tests of the equality of the effects of TARP lending for the different types of borrowers are
reported in Panels A2 and B2 respectively The dependent variables are the five loan contract terms loan spread size maturity collateral and covenant intensity index The
explanatory variables are TARP RECIPIENT (a dummy equal to one if the bank was provided TARP capital support) POST TARP (a dummy equal to one in 2009-2012 the period
after TARP program initiation) their interaction as well as borrower and other bank characteristics Borrower characteristics are borrower size market-to-book leverage
profitability tangibility cash flow volatility cash holdings ratio Borrower rating dummies are borrower SampP credit rating dummies Bank characteristics are bank size capital
adequacy asset quality management quality earnings liquidity sensitivity to market risk HHI percent metropolitan fee income diversification and DWTAF (Discount Window
andor Term Auction Facility programs) Models also include loan type dummies industry (2-digit SIC) fixed effects and year-fixed effects The estimation results are for 2005-
2012 All variables are defined in Table 1 and denote significance at 10 5 and 1 level
Table 9 Panel A Effects by Borrower Financial Constraints Large versus Small Borrowers
Table 9 Panel A1 Regression Estimates Large Borrowers (Borrower Size gt Median)
(1) (2) (3) (4) (5)
VARIABLES LOANSPREAD LOG (LOAN SIZE) LOG (LOAN MATURITY) COLLATERAL COV_INTENSITY_INDEX
TARP RECIPIENT 38950 0154 -0273 -0177 -0181
(2414) (0804) (-2333) (-2055) (-0630)
POST TARP x TARP RECIPIENT -67952 0403 0244 -0046 -0662
(-2919) (2385) (2777) (-0772) (-2387)
BORROWER CONTROLS YES YES YES YES YES
BORROWER RATING DUMMIES YES YES YES YES YES
BANK CONTROLS YES YES YES YES YES
LOAN TYPE DUMMIES YES YES YES YES YES
2-DIGIT SIC FIXED EFFECTS YES YES YES YES YES
YEAR FIXED EFFECTS YES YES YES YES YES
Observations 2315 2665 2625 2665 2665
Adjusted R-squared 0638 0381 0524 0418 0325
Small Borrowers (Borrower Size le Median)
(1) (2) (3) (4) (5)
VARIABLES LOANSPREAD LOG (LOAN SIZE) LOG (LOAN MATURITY) COLLATERAL COV_INTENSITY_INDEX
TARP RECIPIENT 40467 0038 -0001 -0017 -0221
(4202) (0510) (-0020) (-0417) (-1343)
POST TARP x TARP RECIPIENT -15631 0072 0186 -0035 -0221
(-0795) (0624) (2855) (-0633) (-0963)
BORROWER CONTROLS YES YES YES YES YES
BORROWER RATING DUMMIES YES YES YES YES YES
BANK CONTROLS YES YES YES YES YES
LOAN TYPE DUMMIES YES YES YES YES YES
2-DIGIT SIC FIXED EFFECTS YES YES YES YES YES
YEAR FIXED EFFECTS YES YES YES YES YES
Observations 3057 3308 3244 3308 3308
Adjusted R-squared 0445 0555 0261 0156 0113
56 Table 9 Panel A2 Tests of the Equality of the Effects of TARP for Different Types of Borrowers
Borrower Size (Median Cutoff)
VARIABLES LOANSPREAD LOG (LOAN SIZE) LOG (LOAN MATURITY) COLLATERAL COV_INTENSITY_INDEX
t-stat Effect for large borrowers = effect
for small borrowers -1717 1615 0530 -0134 -1225
Table 9 Panel B Effects by Borrower Financial Constraints Public versus Private Borrowers
Table 9 Panel B1 Regression Estimates Public Borrowers (Public =1)
(1) (2) (3) (4) (5)
VARIABLES LOANSPREAD LOG (LOAN SIZE) LOG (LOAN MATURITY) COLLATERAL COV_INTENSITY_INDEX
TARP RECIPIENT 47806 -0053 -0037 -0029 -0263
(5575) (-0730) (-0819) (-0793) (-1801)
POST TARP x TARP RECIPIENT -51874 0235 0203 -0098 -0565
(-3145) (2229) (3537) (-2229) (-3039)
BORROWER CONTROLS YES YES YES YES YES
BORROWER RATING DUMMIES YES YES YES YES YES
BANK CONTROLS YES YES YES YES YES
LOAN TYPE DUMMIES YES YES YES YES YES
2-DIGIT SIC FIXED EFFECTS YES YES YES YES YES
YEAR FIXED EFFECTS YES YES YES YES YES
Observations 4235 4716 4652 4716 4716
Adjusted R-squared 0575 0701 0416 0341 0273
Private Borrowers (Public =0)
(1) (2) (3) (4) (5)
VARIABLES LOANSPREAD LOG (LOAN SIZE) LOG (LOAN MATURITY) COLLATERAL COV_INTENSITY_INDEX
TARP RECIPIENT 42711 0279 0054 0008 0046
(2012) (1577) (0493) (0090) (0122)
POST TARP x TARP RECIPIENT -8560 0249 -0043 -0031 -0538
(-0244) (1160) (-0346) (-0323) (-1248)
BORROWER CONTROLS YES YES YES YES YES
BORROWER RATING DUMMIES YES YES YES YES YES
BANK CONTROLS YES YES YES YES YES
LOAN TYPE DUMMIES YES YES YES YES YES
2-DIGIT SIC FIXED EFFECTS YES YES YES YES YES
YEAR FIXED EFFECTS YES YES YES YES YES
Observations 1137 1257 1217 1257 1257
Adjusted R-squared 0431 0552 0308 0281 0218
Table 9 Panel B2 Tests of the Equality of the Effects of TARP for Different Types of Borrowers Public vs Private Borrowers
VARIABLES LOANSPREAD LOG (LOAN SIZE) LOG (LOAN MATURITY) COLLATERAL COV_INTENSITY_INDEX
t-stat Effect for publicly listed borrowers = effect for private borrowers -1117 -0058 1791 -0640 -0058
57
Table 10 Effects of TARP on Loan Contract Terms Relationship Lending This table shows additional subsample tests for analyzing the effects of TARP on loan contract terms It reports the difference-in-difference (DID) regression estimates for TARP
lending to relationship borrowers (borrowers with a prior relationship to a TARP bank in the pre-TARP period) and non-relationship borrowers (borrowers without a prior relationship
to a TARP bank in the pre-TARP period) in Panel A1 and the tests of the equality of the effects of TARP lending for the two different types of borrowers in Panel A2 The dependent
variables are the five loan contract terms loan spread size maturity collateral and covenant intensity index The explanatory variables are TARP RECIPIENT (a dummy equal to
one if the bank was provided TARP capital support) POST TARP (a dummy equal to one in 2009-2012 the period after TARP program initiation) their interaction as well as
borrower and other bank characteristics Borrower characteristics are borrower size market-to-book leverage profitability tangibility cash flow volatility cash holdings ratio
Borrower rating dummies are borrower SampP credit rating dummies Bank characteristics are bank size capital adequacy asset quality management quality earnings liquidity
sensitivity to market risk HHI percent metropolitan fee income diversification and DWTAF (Discount Window andor Term Auction Facility programs) Models also include
loan type dummies industry (2-digit SIC) fixed effects and year-fixed effects The estimation results are for 2005-2012 All variables are defined in Table 1 and denote
significance at 10 5 and 1 level
Table 10 Panel A Effects by Borrower Relationship Lending Status Borrowers with a prior relationship to TARP banks versus those without one
Table 10 Panel A1 Regression Estimates Borrowers with a prior relationship to TARP banks
(1) (2) (3) (4) (5)
VARIABLES LOANSPREAD LOG (LOAN SIZE) LOG (LOAN MATURITY) COLLATERAL COV_INTENSITY_INDEX
TARP RECIPIENT 17275 -0136 0060 -0302 -0845
(0530) (-0596) (0430) (-2666) (-1744)
POST TARP x TARP RECIPIENT -87386 0455 0151 -0102 -0200
(-2214) (2300) (1727) (-1318) (-0540)
BORROWER CONTROLS YES YES YES YES YES
BORROWER RATING DUMMIES YES YES YES YES YES
BANK CONTROLS YES YES YES YES YES
LOAN TYPE DUMMIES YES YES YES YES YES
2-DIGIT SIC FIXED EFFECTS YES YES YES YES YES
YEAR FIXED EFFECTS YES YES YES YES YES
Observations 1519 1749 1723 1749 1749
Adjusted R-squared 0596 0643 0522 0404 0318
Borrowers without a prior relationship to TARP banks
(1) (2) (3) (4) (5)
VARIABLES LOANSPREAD LOG (LOAN SIZE) LOG (LOAN MATURITY) COLLATERAL COV_INTENSITY_INDEX
TARP RECIPIENT 47880 -0032 -0042 0002 -0109
(5951) (-0453) (-0899) (0050) (-0727)
POST TARP x TARP RECIPIENT -27487 0186 0203 -0083 -0542
(-1788) (1649) (3212) (-1732) (-2691)
BORROWER CONTROLS YES YES YES YES YES
BORROWER RATING DUMMIES YES YES YES YES YES
BANK CONTROLS YES YES YES YES YES
LOAN TYPE DUMMIES YES YES YES YES YES
2-DIGIT SIC FIXED EFFECTS YES YES YES YES YES
YEAR FIXED EFFECTS YES YES YES YES YES
Observations 3853 4224 4146 4224 4224
Adjusted R-squared 0517 0658 0340 0304 0232
Table 10 Panel A2 Tests of the Equality of the Effects of TARP for Different Types of Borrowers Borrowers with a prior relationship to TARP banks vs those without one
LOANSPREAD LOG (LOAN SIZE) LOG (LOAN MATURITY) COLLATERAL COV_INTENSITY_INDEX
t-stat Effects for relationship borrowers = Effects for non-relationship borrowers -1414 1126 -0484 -0209 0811
Y-1
Chapter Y INTERNET APPENDIX Y ndash ADDITIONAL TESTS
This appendix contains additional tests on which borrowers benefited from the TARP bailout
program Specifically we investigate whether borrowers using term loans and revolvers benefited and how
benefits differ according to borrower market concentration (relatively low and high industry HHI
borrowers)
Y1 Different Loan Types
The DealScan dataset contains term loans revolvers and other loans A term loan is for a specific
amount that has a specified repayment schedule while a revolver allows a borrower to drawdown repay
and redraw up to a certain amount at any point over the life of the agreement As noted in Ivashina (2009)
there may be differences between term loans and revolvers We explore whether borrowers using term loans
benefited more or less relative to those using revolvers
Theoretically term loan or revolver borrowers may be treated differently because they differ in risk
and relationship characteristics both of which may have ambiguous effects as shown in Hypotheses H2a-
b and H4a-b in Section 6 Either term loans or revolvers could be safer for banks Term loans may be safer
because of the extra takedown or liquidity risk associated with revolvers Revolvers may be safer because
they may be more often given to the safer borrowers In addition revolvers may be more often associated
with banking relationships (Berger and Udell 1995 Dennis Nandy and Sharpe 2000) We rerun our
analysis according to whether borrowers use term loans or revolvers
Regression estimates are shown in Table Y1 Panel A1 while the tests of equality between the
different types of loans are shown in Panel A2 All loan contract terms improved more for term-loan
borrowers although the differences between term-loan and revolver borrowers are not statistically
significant except for loan size Overall TARP banks appear to have provided more favorable terms to
borrowers using both loan types but more so for term-loan borrowers
Y-2
Y2 Other Borrower Characteristics Borrower Industry Concentration
Borrower market power may also affect loan contract term results We do not have information on
the market power of the borrower vis-agrave-vis the bank However following Giroud and Mueller (2011) we
measure the borrower industry concentration (HHI) which may be relatively correlated with the borrower
market power34 We group borrowers according to whether they are in relatively concentrated industries
(industry HHI gt median) or relatively unconcentrated industries (industry HHI le median) We compare the
net impact of TARP on changes in loan contract terms for the two different types of borrowers
Regression estimates are shown in Table Y2 Panel A1 while the tests of equality between the
different groups are shown in Panel A2 We find that borrowers from both relatively concentrated and
relatively unconcentrated industries experience improvements in contract terms as a result of TARP
Although the coefficients for loan spread and maturity are larger for the borrowers in relatively concentrated
industries the coefficients for loan size and covenant intensity are larger for the borrowers in relatively
unconcentrated industries However the differences between the two types are not statistically significant35
34 The HHI is computed as the sum of squared market shares of the firms in each industry where the market shares
are computed from Compustat using the firmsrsquo total sales When computing the HHI we use all available Compustat
firms except firms for which sales are either missing or negative 35 In unreported tests we also perform tests using an alternative proxy for borrower industry concentration ndash the top
four firms in the industry concentration ratio ndash and we obtain consistent results
Y-3
Table Y1 Effects of TARP on Loan Contract Terms Loan Types This table shows additional subsample tests for analyzing the effects of TARP on loan contract terms It reports the difference-in-difference (DID) regression estimates for the effect
of TARP on loan terms to borrowers for different loan types (term loans versus revolvers) in Panel A1 The tests of the equality of the effects of TARP lending for the two different
types of loans are reported in Panel A2 The dependent variables are the five loan contract terms loan spread size maturity collateral and covenant intensity index The explanatory
variables are TARP RECIPIENT (a dummy equal to one if the bank was provided TARP capital support) POST TARP (a dummy equal to one in 2009-2012 the period after TARP
program initiation) their interaction as well as borrower and other bank characteristics Borrower characteristics are borrower size market-to-book leverage profitability tangibility
cash flow volatility cash holdings ratio Borrower rating dummies are borrower SampP credit rating dummies Bank characteristics are bank size capital adequacy asset quality
management quality earnings liquidity sensitivity to market risk HHI percent metropolitan fee income diversification and DWTAF (Discount Window andor Term Auction
Facility programs) Models also include loan type dummies industry (2-digit SIC) fixed effects and year-fixed effects The estimation results are for 2005-2012 All variables are
defined in Table 1 and denote significance at 10 5 and 1 level
Table Y1 Panel A Effects for Different Types of Loans Term Loans versus Revolvers
Table Y1 Panel A1 Regression Estimates Loan Type Term Loans
(1) (2) (3) (4) (5)
VARIABLES LOANSPREAD LOG (LOAN SIZE) LOG (LOAN MATURITY) COLLATERAL COV_INTENSITY_INDEX
TARP RECIPIENT 107423 -0013 -0203 0021 -0199
(4609) (-0096) (-2034) (0291) (-0601)
POST TARP x TARP RECIPIENT -78453 0591 0385 -0173 -0906
(-1868) (2840) (2934) (-2011) (-2285)
BORROWER CONTROLS YES YES YES YES YES
BORROWER RATING DUMMIES YES YES YES YES YES
BANK CONTROLS YES YES YES YES YES
LOAN TYPE DUMMIES YES YES YES YES YES
2-DIGIT SIC FIXED EFFECTS YES YES YES YES YES
YEAR FIXED EFFECTS YES YES YES YES YES
Observations 1313 1400 1358 1400 1400
Adjusted R-squared 0406 0625 0198 0173 0154
Loan Type Revolvers
(1) (2) (3) (4) (5)
VARIABLES LOANSPREAD LOG (LOAN SIZE) LOG (LOAN MATURITY) COLLATERAL COV_INTENSITY_INDEX
TARP RECIPIENT 27767 0000 -0008 -0044 -0242
(3395) (0000) (-0177) (-1092) (-1507)
POST TARP x TARP RECIPIENT -30193 0088 0137 -0059 -0292
(-1962) (0845) (2376) (-1130) (-1408)
BORROWER CONTROLS YES YES YES YES YES
BORROWER RATING DUMMIES YES YES YES YES YES
BANK CONTROLS YES YES YES YES YES
LOAN TYPE DUMMIES YES YES YES YES YES
2-DIGIT SIC FIXED EFFECTS YES YES YES YES YES
YEAR FIXED EFFECTS YES YES YES YES YES
Observations 3753 4067 4032 4067 4067
Adjusted R-squared 0600 0696 0196 0336 0242
Table Y1 Panel A2 Tests of the Equality of the Effects of TARP for Different Types of Loans Term Loans versus Revolvers
VARIABLES LOANSPREAD LOG (LOAN SIZE) LOG (LOAN MATURITY) COLLATERAL COV_INTENSITY_INDEX
t-stat Effect for term loans = effect for revolvers -1079 2159 1731 -1134 -1374
Y-4
Table Y2 Effects of TARP on Loan Contract Terms Other Borrower Characteristics This table shows additional subsample tests for analyzing the effects of TARP on loan contract terms It reports the difference-in-difference (DID) regression estimates for the effect
of TARP on loan terms to borrowers from relatively concentrated and unconcentrated industries (using median as a cutoff for the borrower industry HHI) in Panel A1 The tests of
the equality of the effects of TARP lending for the different types of borrowers are reported in Panel A2 The dependent variables are the five loan contract terms loan spread size
maturity collateral and covenant intensity index The explanatory variables are TARP RECIPIENT (a dummy equal to one if the bank was provided TARP capital support) POST
TARP (a dummy equal to one in 2009-2012 the period after TARP program initiation) their interaction as well as borrower and other bank characteristics Borrower characteristics
are borrower size market-to-book leverage profitability tangibility cash flow volatility cash holdings ratio Borrower rating dummies are borrower SampP credit rating dummies
Bank characteristics are bank size capital adequacy asset quality management quality earnings liquidity sensitivity to market risk HHI percent metropolitan fee income
diversification and DWTAF (Discount Window andor Term Auction Facility programs) Models also include loan type dummies industry (2-digit SIC) fixed effects and year-fixed
effects The estimation results are for 2005-2012 All variables are defined in Table 1 and denote significance at 10 5 and 1 level
Table Y2 Panel A Effects for Borrowers in Relatively Concentrated (High HHI) and Unconcentrated (Low HHI) Industries
Table Y2 Panel A1 Regression Estimates
Borrowers in Relatively Unconcentrated Industries (Borrower Industry HHI le Median)
(1) (2) (3) (4) (5)
VARIABLES LOANSPREAD LOG (LOAN SIZE) LOG (LOAN MATURITY) COLLATERAL COV_INTENSITY_INDEX
TARP RECIPIENT 54840 -0031 0027 -0015 -0108
(4958) (-0310) (0411) (-0300) (-0540)
POST TARP x TARP RECIPIENT -36647 0342 0141 -0060 -0495
(-1784) (2227) (1779) (-1029) (-1988)
BORROWER CONTROLS YES YES YES YES YES
BORROWER RATING DUMMIES YES YES YES YES YES
BANK CONTROLS YES YES YES YES YES
LOAN TYPE DUMMIES YES YES YES YES YES
2-DIGIT SIC FIXED EFFECTS YES YES YES YES YES
YEAR FIXED EFFECTS YES YES YES YES YES
Observations 2376 2627 2574 2627 2627
Adjusted R-squared 0507 0659 0354 0329 0272
Borrowers in Relatively Concentrated Industries (Borrower Industry HHI gt Median)
(1) (2) (3) (4) (5)
VARIABLES LOANSPREAD LOG (LOAN SIZE) LOG (LOAN MATURITY) COLLATERAL COV_INTENSITY_INDEX
TARP RECIPIENT 26818 0005 -0050 -0041 -0466
(2287) (0057) (-0887) (-0846) (-2388)
POST TARP x TARP RECIPIENT -49436 0170 0203 -0060 -0381
(-2054) (1406) (2912) (-1079) (-1557)
BORROWER CONTROLS YES YES YES YES YES
BORROWER RATING DUMMIES YES YES YES YES YES
BANK CONTROLS YES YES YES YES YES
LOAN TYPE DUMMIES YES YES YES YES YES
2-DIGIT SIC FIXED EFFECTS YES YES YES YES YES
YEAR FIXED EFFECTS YES YES YES YES YES
Observations 2996 3346 3295 3346 3346
Adjusted R-squared 0567 0674 0408 0329 0249
Table Y2 Panel A2 Tests of the Equality of the Effects of TARP for Different Types of Borrowers Borrowers in Relatively Unconcentrated (Low HHI) and Concentrated (High HHI) Industries
VARIABLES LOANSPREAD LOG (LOAN SIZE) LOG (LOAN MATURITY) COLLATERAL COV_INTENSITY_INDEX
t-stat Effects for low HHI borrower = effects for high HHI borrower 0404 0878 -0587 0000 -0327