Embed Size (px)
Citation preview
Pollcy, Planning, and Research
WORKING PAPERS
International Trade
International Economics DepartmentThe World BankSeptember 1989
WPS 265
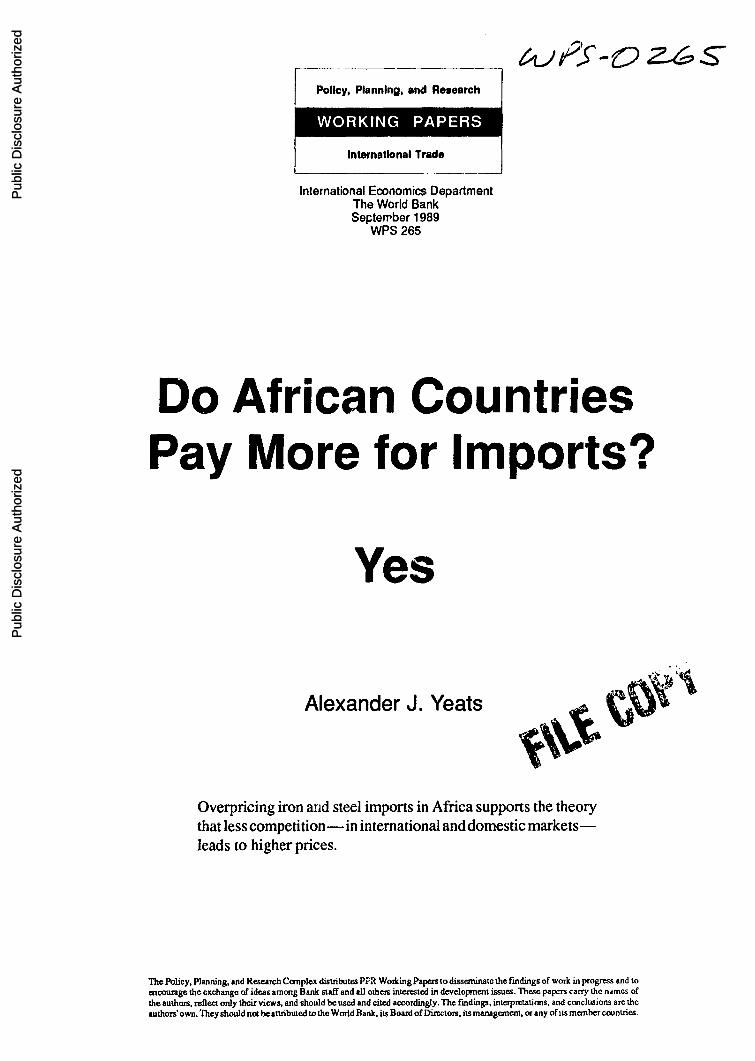
Do African CountriesPay More for Imports?
Yes
Alexander J. Yeats
Overpricing iron and steel imports in Africa supports the theorythat less competition-in international and domestic markets-leads to higher prices.
The Policy. Planning. and Research Complex distibutes PP2 Working Papars to disseminate the findings of work in progress and toenoDusage the exchange of ideas anong Bank staff and all otheis interested in development issues. Thesc papers carry the ndmes ofthe authors. reflect only their views, and should be used and cited accordingly. The fidings, interpretations, and conclusions arc theauthors' own. They should not be attributed to the World Bank. its Board of Directors, its management, or any ofits member countries.
Pub
lic D
iscl
osur
e A
utho
rized
Pub
lic D
iscl
osur
e A
utho
rized
Pub
lic D
iscl
osur
e A
utho
rized
Pub
lic D
iscl
osur
e A
utho
rized
Pub
lic D
iscl
osur
e A
utho
rized
Pub
lic D
iscl
osur
e A
utho
rized
Pub
lic D
iscl
osur
e A
utho
rized
Pub
lic D
iscl
osur
e A
utho
rized
Plc,Planning, and Research
Intelrnationl Trae
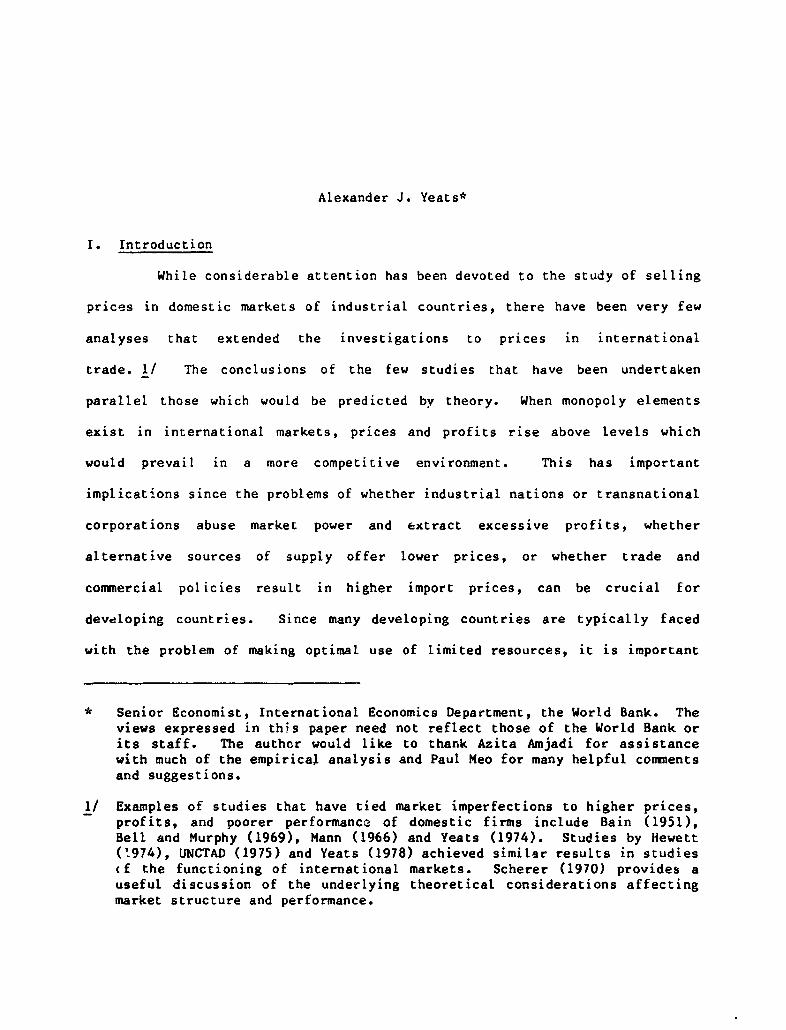
Numerous analysts have studied the influence of imports from France shows excess price marginsmarket structure on performance in domestic so high as to i.ave policy implications since theymarkets in industrial countries. Most show that seriously drain limited resources.prices and profits are higher, and resources lessefliciently allocated, in markets lacking aggres- Over the longer term (1962-87), the Africansive competition. countries paid an average premium of 20 to 30
percent over other importers. The losses fromUsing techniques similar to the earlier those prices came to about $2 billion by 1987 -
studies, Yeats examined the relative prices paid a figure roughly equal to the combined long-for iron and steel products by selected African term debt in 1987 of Burkin- Faso, Chad, Mau-and other developing and developed countries. ritius, and the Central Africadi Republic.
His findings parallel those of the earlier This overpricing extends to other (non-studies. Typically, international markets that are French) African countries. Former colonies ofmore concentrated (less competitive), or that Belgium, Portugal, and the United Kingdom sti!lrely on fewer trade contacts, bring higher prices. pay premiums of 20 to 30 percent on imports
from those three developed countries.Analysis of the price premiums that 20
former French colonies paid for iron and steel
This paper is a product of the Intemational Trade Division, International EconomicsDeparLment. Copies are available free from the World Bank, 1818 H Street NW,Washington DC 20433. Please contact Jean Epps, room S8-037, extension 33710 (44pages with tables).
The PPR Working Paper Series disseminates the findings of work under way in the Bank's Policy, Planning, and ResearchComplex. An objective of the series is to get these fimdings out quickly, even if presentations are less than fully polished.The findings, interpretations, and conclusions in these papers do not necessarily represent official policy of the Bank.
Produced at the PPR Dissemination Center
Do African Countries Pay More for Imports?
Yes
by
Alexander J. Yeats
Table of Contents
1. Introduction 1
II. The Methodological Approach 4
III. The Empirical Findings 9
IV. Correlation Analysis of Unit Value 14Differences
V. Additional Evidence on the Extent of 19Discriminatory Pricing
VI. Summary and Policy Implications 20
References 24
Appendices 26
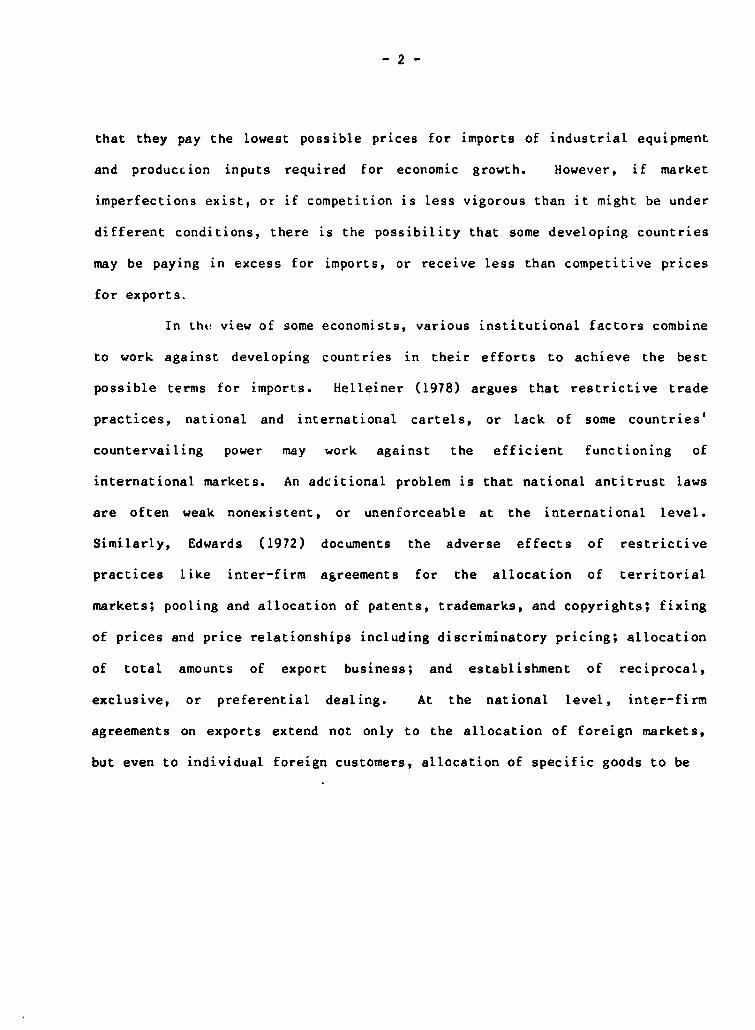
Alexander J. Yeats*
r. Introduction
While considerable attention has been devoted to the study of selling
prices in domestic markets of industrial countries, there have been very few
analyses that extended the investigations to prices in international
trade. 1/ The conclusions of the few studies that have been undertaken
parallel those which would be predicted bv theory. When monopoly elements
exist in international markets, prices and profits rise above levels which
would prevail in a more competitive environment. This has important
implications since the problems of whether industrial nations or transnational
corporations abuse market power and extract excessive profits, whether
alternative sources of supply offer lower prices, or whether trade and
commercial policies result in higher import prices, can be crucial for
developing countries. Since many developing countries are typically faced
with the problem of making optimal use of limited resources, it is important
* Senior Economist, International Economics Department, the World Bank. Theviews expressed in this paper need not reflect those of the World Bank orits staff. The author would like to thank Azita Amjadi for assistancewith much of the empirical analysis and Paul Meo for many helpful commentsand suggestions.
1/ Examples of studies that have tied market imperfections to higher prices,profits, and poorer performance of domestic firms include Bain (1951),Bell and Murphy (1969), Mann (1966) and Yeats (1974). Studies by Hewett('974), UNCTAD (1975) and Yeats (1978) achieved similar results in studiescf the functioning of international markets. Scherer (1970) provides auseful discussion of the underlying theoretical considerations affectingmarket structure and performance.
- 2 -
that they pay the lowest possible prices for imports of industrial equipment
and produccion inputs required for economic growth. However, if market
imperfections exist, or if competition is less vigorous than it might be under
different conditions, there is the possibility that some developing countries
may be paying in excess for imports, or receive less than competitive prices
for exports.
In the. view of some economists, various institutional factors combine
to work against developing countries in their efforts to achieve the best
possible terms for imports. Helleiner (1978) argues that restrictive trade
practices, national and international cartels, or lack of some countries'
countervailing power may work against the efficient functioning of
international markets. An adeitional problem is that national antitrust laws
are often weak nonexistent, or unenforceable at the international level.
Similarly, Edwards (1972) documents the adverse effects of restrictive
practices like inter-firm agreements for the allocation of territorial
markets; pooling and allocation of patents, trademarks, and copyrights; fixing
of prices and price relationships including discriminatory pricing; allocation
of total amounts of export business; and establishment of reciprocal,
exclusive, or preferential dealing. At the national level, inter-firm
agreements on exports extend not only to the allocation of foreign markets,
but even to individual foreign customers, allocation of specific goods to be
exported, fixing of prices and levels of bidding on foreign contacts and the
selection in advance of the firm that will submit the lowest bid.
Using extensive time series information on unit values for homogenous
goods, this paper first examines the distribution of import prices paid by
developing countries whose trade is highly concentrated with a major exporting
country (France), and compares these prices with those paid to France by other
countries whose imports come from more diversified sources. 3/ Where evidence
of "excess" prices are found the paper attempts to quantity the overall level
of economic costs involved. In addition, the analysis employs correlation and
regression tests to account for (quantify) the influence of other economic and
institutional factors such as the degree of market concentration, size of the
importing market, or the number of alternative trading contacts on relative
prices. Next, the paper attempts to determine if other European countries
(e.g., Belgium, Portugal and the United Kingdom) follow similar pricing
policies with former colonies). The paper closes with an overall assessment
of the findings for developing countries trade and commercial policies and
also suggests some lines of related research that appear to have a high
priority.
3/ There is a potentially important inter-active effect between the influenceof market structure on. prices and investment links between Frenchexporting firms and associated enterprises in the developing countries.Given the formal institutional links that exist between exporting andimporting firms, the latter could have little incentive (or capacity) toturn to non-French sources for imports even if they were morecompetitively priced. While an analysis of the precise relation(s)between French firms and their associated companies in developingcountries is beyond the scope of the present study, the empirical resultsof this investigation strongly suggest the matter warrants furtheranalysis.
-4-
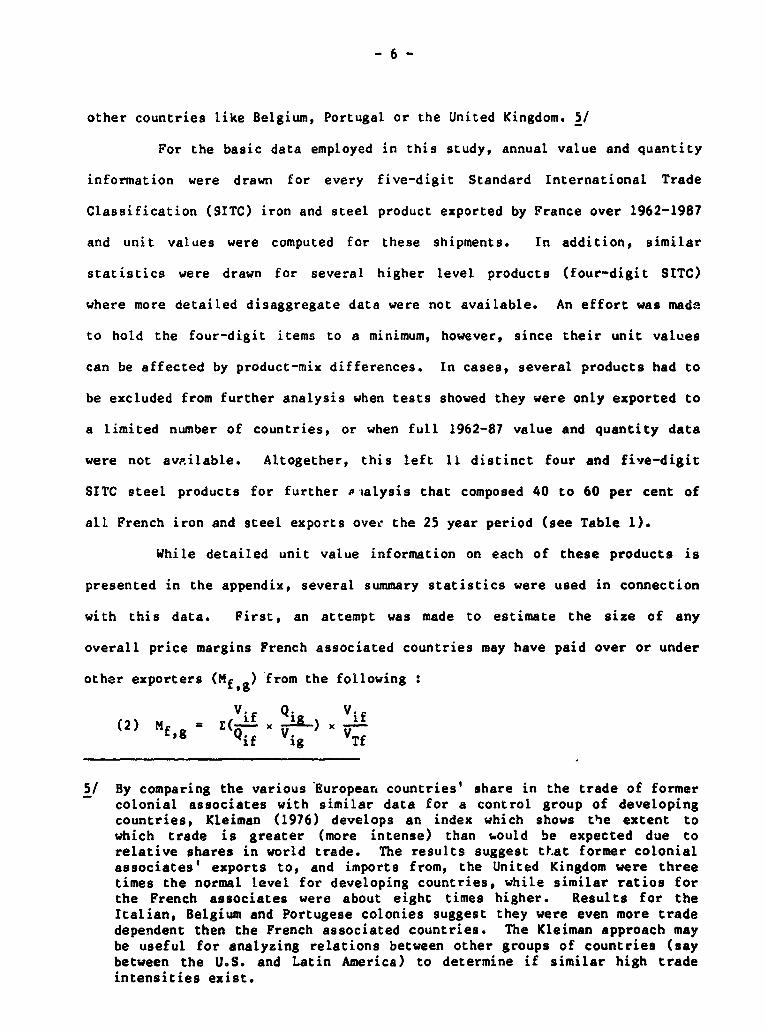
II. The Methodological Approach
For a test of the potential influence of market structure on
international prices, data on French exports of iron and steel products were
compiled directly from United Nations Series D Commodity Trade Tapes. These
computerized records provide detailed information on the quantity and value of
shipments (f.o.b.) on a joint product-by-country basis which can be used to
compute unit values for exports. 4/ The decision to examine French unit
values was based on the fact that a number of former colonial associates are
highly dependent on France for imports (See Appendix 1 for relevant empirical
information on this point including French-African "trade intensity"
ratios). In addition, some useful 1963-1973 data on French export unit values
were available from an earlier study (Yeats 1978) that could now be extended
to 1987. While France was selected as the main focus for both the present and
earlier study due to a very high trade intensity with former colonies, this
study will also show that the findings can be generalized (See Table 5) to
4/ The free-on-board (f.o.b.) export unit value for product i shipped tocountry j (Uij) is derived from:
(1) Uij =vij t Qijl x 100
where V- is the value of the export shipment and is the quantity(normally measured in units, pound or tons) of goods iraded. Analysesbased on unit values must generally be treated with caution since productdifferentials, quality differences or variations in type may be reflectedas price differences. However, for homogenous five-digit StandardInternational Trade Classification (SITC) iron and steel products theinfluence of these other factors should be relatively minor. In fact,studies by Stigler and Kindahl (1970), McAllister (1961), and others haveused iron and steel unit values to assess the accuracy of wholesale pricequotations employed by the United States Bureau of Labor Statistics.
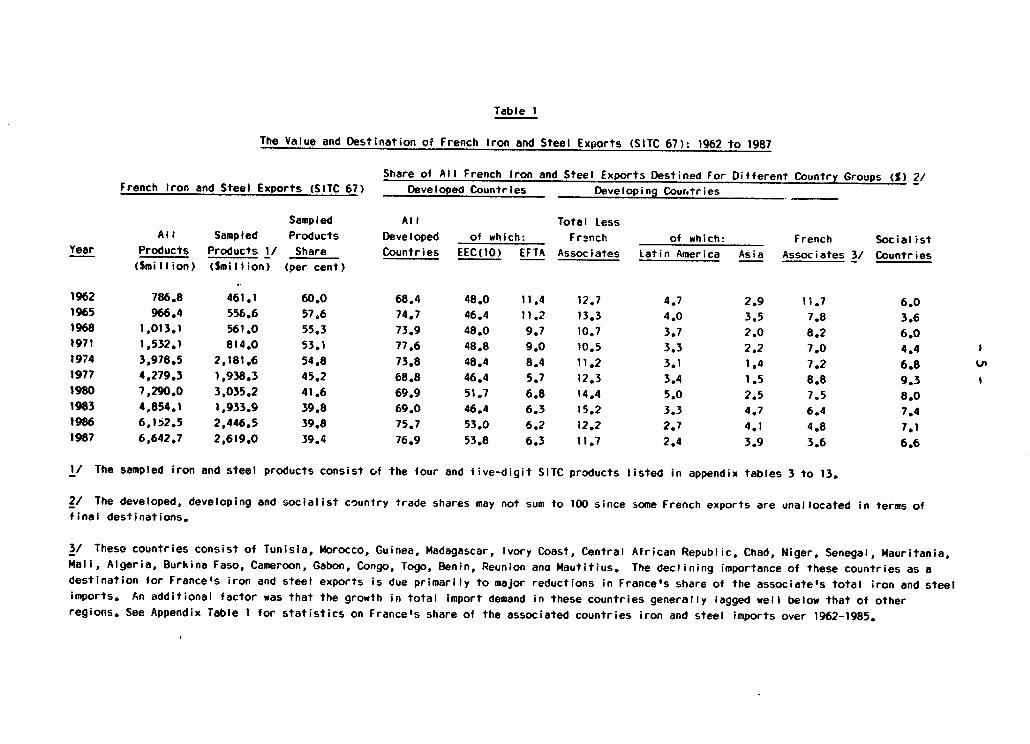
Table 1
The Value and Destination of French Iron and Steel Exports (SITC 67): 1962 to 1987
Share of All French Iron and Steel Exports Destined For Different Country Groups (%) 2/French Iron and Steel Exports (SITC 67) Developed Countries Developing Cour.tries
Sampled All Total LessAll Sampled Products Developed of which: Fr2nch of which: French Socialist
Year Products Products 1/ Share Countries EEC(10) EFTA Associates Latin America Asia Associates 3/ Countries(Smillion) ISmillion) (per cent)
1962 786.8 461.1 60.0 68.4 48.0 11.4 12.7 4.7 2.9 11.7 6.01965 966.4 556.6 57.6 74.7 46.4 11.2 13.3 4.0 3.5 7.8 3.61968 1,013.1 561.0 55.3 73.9 48.0 9.7 10.7 3.7 2.0 8.2 6.01971 1,532.1 814.0 53.1 77.6 48.8 9.0 10.5 3.3 2.2 7.0 4.4 11974 3,978.5 2,181.6 54.8 73.8 48.4 8.4 11.2 3.1 1.4 7.2 6.8 Un1977 4,279.3 1,938.3 45.2 68.8 46.4 5.7 12.3 3.4 1.5 8.8 9.3 t1980 7,290.0 3,035.2 41.6 69.9 51.7 6.8 14.4 5.0 2.5 7.5 8.01983 4,854.1 1,933.9 39.8 69.0 46.4 6.3 15.2 3.3 4.7 6.4 7.41986 6,152.5 2,446.5 39.8 75.7 53.0 6.2 12.2 2.7 4.1 4.8 7.11987 6,642.7 2,619.0 39.4 76.9 53.8 6.3 11.7 2.4 3.9 3.6 6.6
1/ The sampled iron and steel products consist of the four and five-digit SITC products listed in appendix tables 3 to 13.
2/ The developed, developing and socialist co3untry trade shares may not sum to 100 since some French exports are unallocated in terms offinal destinations.
3/ These countries consist of Tunisia, Morocco, Guinea, Madagascar, Ivory Coast, Central African Republic, Chad, Niger, Senegal, Mauritania,Mali, Algeria, Burkina Faso, Cameroon, Gabon, Congo, Togo, Benin, Reunion ana Mautitius. The declining importance of these countries as adestination for France's iron and steel exports is due primarily to major reductions in France's share of the associate's total iron and steelimports. An additional factor was that the growth in total import demand in these countries generally lagged well below that of otherregions. See Appendix Table I for statistics on France's share of the associated countries iron and steel imports over 1962-1985.
- 6 -
other countries like Belgium, Portugal or the United Kingdom. 5/
For the basic data employed in this study, annual value and quantity
information were drawn for every five-digit Standard International Trade
Classification (SITC) iron and steel product exported by France over 1962-1987
and unit values were computed for these shipments. In addition, similar
statistics were drawn for several higher level products (four-digit SITC)
where more detailed disaggregate data were not available. An effort was made
to hold the four-digit items to a minimum, however, since their unit values
can be affected by product-mix differences. In cases, several products had to
be excluded from further analysis when tests showed they were only exported to
a limited number of countries, or when full 1962-87 value and quantity data
were not avpilable. Altogether, this left 11 distinct four and five-digit
SITC steel products for further ialysis that composed 40 to 60 per cent of
all French iron and steel exports over the 25 year period (see Table 1).
While detailed unit value information on each of these products is
presented in the appendix, several summary statistics were used in connection
with this data. First, an attempt was made to estimate the size of any
overall price margins French associated countries may have paid over or under
other exporters (Mf g) from the following
(2) Mf,g = xi-) Vif
5/ By comparing the various Europearn countries' share in the trade of formercolonial associates with similar data for a control group of developingcountries, Kleiman (1976) develops an index which shows the extent towhich trade is greater (more intense) than swould be expected due torelative shares in world trade. The results suggest th.at former colonialassociates' exports to, and imports from, the United Kingdom were threetimes the normal level for developing countries, while similar ratios forthe French associates were about eight times higher. Results for theItalian, Belgium and Portugese colonies suggest they were even more tradedependent then the French associated countries. The Kleiman approach maybe useful for analyzing relations between other groups of countries (saybetween the U.S. and Latin America) to determine if similar high tradeintensities exist.
where Vif and Vig are the value of shipments of product i to the Frei.ch
associates and a group of other countries, respeztively, while Qif and Qig are
export quantities. In equation (2), VTf is the total value of the sampled
iron and steel shipments to the associated French countries within a specific
time interval. 6/ As such, the equation co- 'utes an average associated
country price premium or discount weighted by the value of imports of each
iron and steel product. Next, a second measure of the economic costs (or
benefits) of these price differentials (Ef) derived from:
(3) Ef = z(Uif - Uig) x Qif
where Uif and Ui. are the French associates and other countries' unit values
for the imported product. By taking the difference between the associate and
other countries' unit value, times the quantity of imports, this equation
computes how much more (or less) the former pay for their imports of the
product. These calculations are then summed over all iron and steel
imports. Equation (3) is expressed both in terms of actual current values as
well as the present value of any over or underpayments in the past. 7/
Aside from evaluating the overall magnitude of the unit value
differences on total import payments, correlation tests were employed to
6/ See the footnotes to Table 2 for a listing of the countries that have beenclassified in the French associated country group. Equation (2) computedthe aggregate price differential that French associates pay (positive ornegative) over other countries weighted by the value of shipments to theformer. The results are presented for two year time periods in an attemptto smooth out the effects of any unrepresentative trade values that mightinfluence annual figures.
7/ For example, if the French associates made an apparent over payment of(say) $100,000 five years in the past, the present value of that overpayment would be considerably higher since it includes foregone interestearnings. The appendix tables provide estimates of the present values ofany implied over payments or discounts (equation 3) paid by the Frenchassociates on their steel imports over 1962-87. In these computations adiscount rate of 8 per cent has been assumed. The reader should also notethat any apparent discounts would lower the present values reported inthese tables.
determine if they were systematically linked to several possible explanatory
factors. To evaluate the influence of geographic concentration of imports by
each African country -- a variable that would reflect a situation that could
lead to the abuse of monopoly power -- variables were tested which measured
the share of iron and steel supplies originating in the largest, and three
largest exporting countries. 8/ While these measures rallel the
concentration ratios used in structure-performance studies of domeslic
markets, there is a special problem in that similar (equal) ratios can meek
different d tributions of competing firms. In support of the country ratios,
however, is the fact Lhat firms headquartered in the same exporting nation may
have a tendency to participate in cartel arrangements or collusive oligopoly
decisions on foreign prices. Also, iron and steel production is generally
among the most concentrated of industries in developed countries so the
potential number of expoiting firms is limited. During the 1962-1987 period
which is the focus of this study there appear to have been only 3 or 4 firms
producing the (sampled) French steel products for export, and during various
sub-intervals the links between these companies were reinforced by
nationalization.
Two variables were employed to test the relation between the size of
the export shipments, or the export market, and the pattern of relative
prices. First, the relative y dntity (tons) of each country's iron and steel
8/ Concentration ratios, such as the share of imports received from thelargest or three largest suppliers are statistical measures which show theper cent of sales controlled by a given number of the largest firms. Fora discussion of the use, and problems with measures of marketconcentration see Adelman (1951), Prais (1958) or Scherer (1970).Numercus studies of domestic markets in developed and developing countrieshave consistently shown that firm prices and profits are (positively)linked to the level of market concentration. Since the country ratios areemployed as proxies for the geographic concentration of suppliers, thisvariable tests whether the normal structure-performance relation alsoholds for international markets.
- 9 -
imports from France was computed to determine if larger shipments were
associated with lower import prices. In addition, the absolute size of each
nation's total imports from all sources was tested. Analysis of results from
these variables might indicate whether there are economies of scale associated
with. larger shipments, or whether French pricing policies are different for
large export markets wbi* re countervailing power may be influential. 9/
Other variables employed in these tests include the number of
alternative (country) suppliers of iron and steel to determine if a large
variety of contacts, and potentially greater sources of information on
competitive prices, are related to unit value differences. Also, since
Hufbauer and O'Neill (1972) found that quality differences in imports of
machinery are posit eIy associated with real income, each coLntry's GNP per
capita was also tested as an explanatory variable. Finally, a dummy variable
was used to designate transactions between France and another developed
country while a second dummy was used for shipments between France and a
former colonial associate.
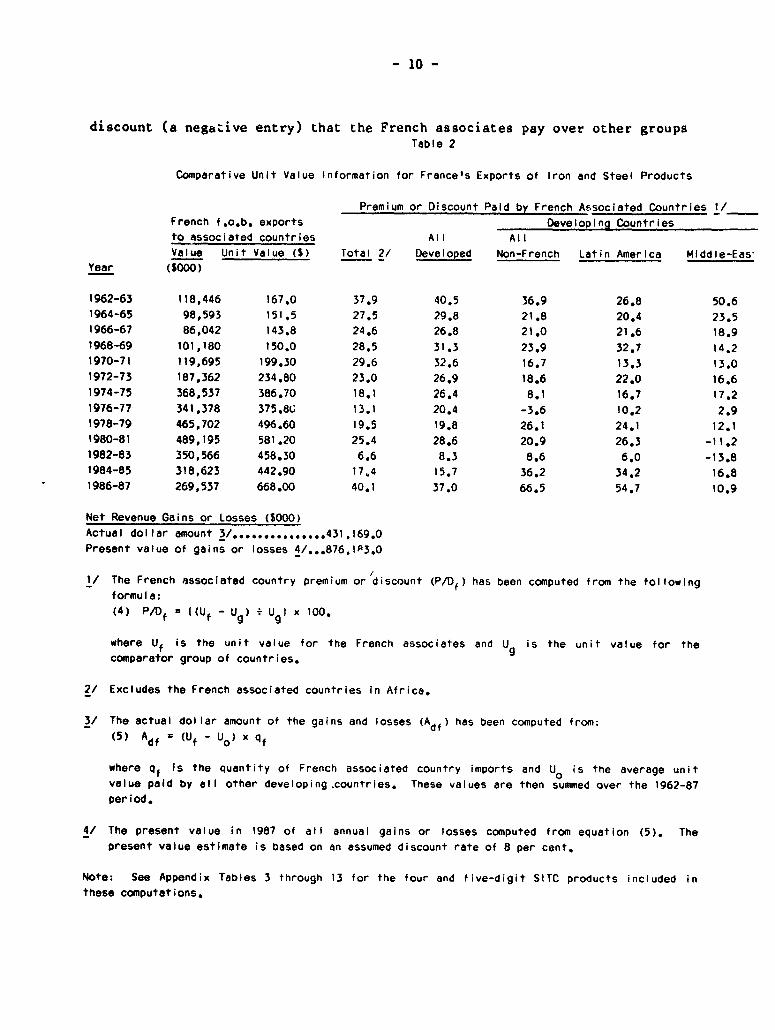
III. The Empirical Findings
Table 2 makes some initial comparisons of the relative prices paid by
the French associated and other developed and developing countries over the
1962-87 period. The table shows the value of the former's imports of the
sampled four and five-digit SITC products and also indicates the average unit
value for these goods. In addition, the premium (a positive figure) or
9/ An attempt to determine if price differentials result from scaleeconomies, or the pricing policies of French exporters, requires a moreexhaustive analysis than is conducted in this study. However,identification of a relationship between prices and size has similarpolicy implications, whichever factor is the basic cause. That is, ifsuch a relation is found (and is strong) it may be appropriate for smallercountry to consider consolidation of orders or even joint purchasearrangements with neighbors.
- 10 -
discount (a negative entry) that the French associates pay over other groupsTable 2
Comparative Unit Value Information for France's Exports of Iron and Steel Products
Premium or Discount Paid by French Associated Countries 1/French f.o.b. exports Developing Countriesto associated countries All AllValue Unit Value (S) Total 2/ Developed Non-French Latin America Middle-Eas,
Year (SOOO)
1962-63 118,446 167.0 37,9 40.5 36.9 26.8 50.61964-65 98,593 151.5 27.5 29.8 21.8 20.4 23.51966-67 86,042 143.8 24.6 26.8 21.0 21.6 18.91968-69 101,180 150.0 28.5 31.3 23.9 32.7 14.21970-71 119,695 199.30 29.6 32.6 16.7 13.3 13.01972-73 187,362 234.80 23.0 26.9 18.6 22.0 16.61974-75 368,537 386.70 18.1 26.4 8.1 16.7 17.21976-77 341,378 375.8G 13.1 20.4 -3.6 10.2 2.91978-79 465.702 496.60 19.5 19.8 26.1 24.1 12.11980-81 489,195 581.20 25.4 28.6 20.9 26.3 -11.21982-83 350.566 458.30 6.6 8.3 8.6 6.0 -13.81984-85 318,623 442.90 17.4 15.7 36.2 34.2 16.81986-87 269,537 668.00 40.1 37.0 66.5 54.7 10.9
Net Revenue Gains or Losses (1000)Actual dollar amount 3/. ..............431,169.0Present value of gains or losses 4/ ... 876,1P3.0
1/ The French associated country premium or discount (P/Df) has been computed from the followingformula:(4) P/Df = [(Uf - Ug) UgI x 100.
where Uf is the unit value for the French associates and U is the unit value for thecomparator group of countries.
2/ Excludes the French associated countries in Africa.
3/ The actual dollar amount of the gains and losses (Adf) has been computed from;(5) Adf = (Uf - UO) x qf
where qf Is the quantity of French associated country imports and UO is the average unitvalue paid by all other developing .countries. These values are then summed over the 1962-87period.
4/ The present value in 1987 of all annual gains or losses computed from equation (5). Thepresent value estimate is based on an assumed discount rate of 8 per cent.
Note: See Appendix Tables 3 through 13 for the four and five-digit SITC products included inthese computations.
- 11 -
of developed or developing countries is given. Appendix Table 3 through 13
provides similar information for each of the sampled iron and steel products.
The statistics in Table 2 strongly suggest that the French associated
countries are paying in excess for their imports whether the comparisons are
made between other developed or developing countries. For the full 26 year
period, the French associated unit values always exceed those of developed
market economy countries (their average premium for this period was
approximately 24 per cent), while in only one two-year period (1976-77) did
the associates' price fall below that for all other developing countries.
Even with this one reversal of the normal pattern, however, the French
associates still paid an average premium of 23 per cent above the unit value
for other developing countries over the full 1962-87 period.
Table 2 summarizes the implications of these findings by computing
the excess associated countries' costs due to their prices exceeding those
paid by all other developing countries (see equation 3). In deriving these
results the computations were made for each of the sampled iron and steel
products (see appendix Tables 3 through 13) and then aggregated to the figures
shown in the Table. In total, the French associates' price premiums over all
developed countries are positive for each two year intervals over 1962 to 1987
and range from 8.3 per cent in 1982-83 up to 40.5 per cent in 1962-63. In
general, the premiums over other non-French associated developing countries
follow the same pattern, but are somewhat lower. Table 2 shows that the
present value of the dollar losses associated with the premiums the associates
paid over other developing countries was close to $900 million by the end of
- 12 -
1987. 10/ However, these results apply only to the sampled steel products
(see Appendix Tables 3 to 13) and, if the same pattern holds for all iron and
steel shipments the present value of the associated losses on imports from
France approximately would be $2 billion. 11/ This extrapolation is based on
the assumption that the same average price premiums are paid for both sampled
and nonsampled products. The importance of this ($2 billion) figure is
highlighted by the fact that it exceeds the long-term debt of 12 of the
associated countries in 1987 and is approximately equal to the debt of the
Central African Republic, Chad, C'urkina Faso and Mauritif.s ($2.2 billion).
While the previous analysis examined relative French unit values in
the aggregate, Table 3 shows the average premiums or discounts paid by
individual associated countries for all imports of sampled iron and steel
products. For the full 1962-87 period the individual country premiums average
10/ The actual dollar losses reported in Table 2 are the summation of theimplied losses in each two year period up to and including 1987. Thepresent value of these losses include their actual value and the interestthat would have been earned on each years excess payments up to 1987. Incalculating the present value a discount rate of 8 per cent was employedas this appeared to be a close approximation to the average for the 1962-87 period. It should be noted that when the French associates received anapparent discount, as in 1976-77, this was recorded as a negative entry inboth the actual cost and present value calculations.
11/ One key question relates to whether the excess pricing pattern observedfor iron and steel products also applies to other sectors. There is sometentative evidence in support of this proposition. Yeats (1978, p. 178)compared four-digit SITC product unit values for all French shipments toselected associated and non-associated African countries over 1962-1969and found that the former averaged between 13 to 18 per cent higher.Assuming that this excess price margin applies to all manufactured importswould mean that the associates were overcharged by approximately $25billion. A second important point is whether the associates sufferedadditional losses due to institutional factors that kept them from dealingwith an alternative supplier (say Japan) whose prices were generally belowthe average French export prices. One way to tesc this hypotheses wouldbe to substitute alternative suppliers' unit values for Uij in equation(3) and recompute the associates' gains or losses. i
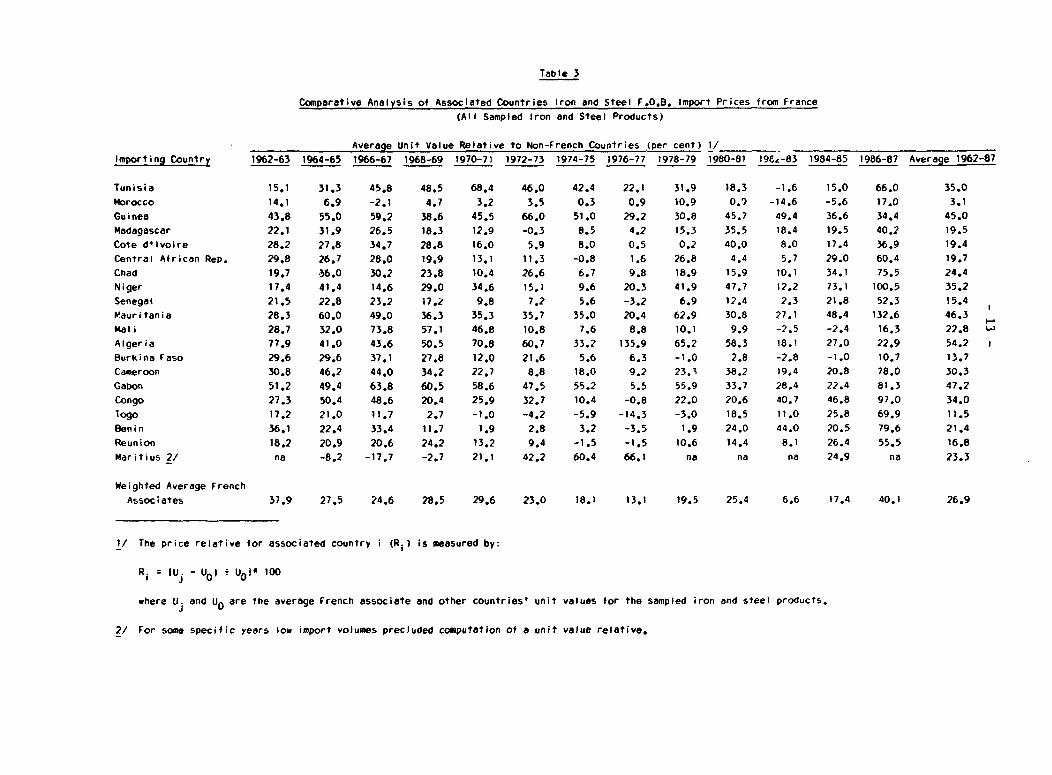
Table 3
Comparative Analysis of Associated Countries Iron and Steel F.O.B. Import Prices from France(All Sampled Iron and Steel Products)
Average Unit Value Relative to Non-French Countries (per cent) 1/Importing Country 1962-63 1964-65 1966-67 1968-69 1970-71 1972-73 1974-75 1976-77 1978-79 1980-81 19&x-83 1984-85 1986-87 Average 1962-87
Tunisia 15.1 31.3 45.8 48.5 68.4 46.0 42.4 22.1 31.9 18.3 -1.6 15.0 66.0 35.0Morocco 14.1 6.9 -2.1 4.7 3.2 3.5 0.3 0.9 10.9 0.) -14.6 -5.6 17.0 3.1Guinea 43.8 35.0 59.2 38.6 45.5 66.0 51.0 29.2 30.8 45.7 49.4 36.6 34.4 45.0Madagascar 22.1 31.9 26.5 15.3 12.9 -0.3 8.5 4.2 15.3 35.5 18.4 19.5 40.2 19.5Cote da lvoire 28.2 27.8 34.7 28.8 16.0 5.9 8.0 0.5 0.2 40.0 8.0 17.4 36.9 19.4Central African ReP. 29.8 26.7 28.0 19.9 13.1 11.3 -0.8 1.6 26.8 4.4 5.7 29.0 60.4 19.7Chad 19.7 36.0 30.2 23.8 10.4 26.6 6.7 9.8 18.9 15.9 10.1 34.1 75.5 24.4Niger 17.4 41.4 14.6 29.0 34.6 15.1 9.6 20.3 41.9 47.7 12.2 73.1 100.5 35.2Senegal 21.5 22.8 23.2 17.2 9.8 7.2 5.6 -3.2 6.9 12.4 2.3 21.8 52.3 15.4Mauritania 28.3 60.0 49.0 36.3 35.3 35.7 35.0 20.4 62.9 30.8 27.1 48.4 132.6 46.3Mali 28.7 32.0 73.6 57.1 46.8 10.8 7.6 8.8 10.1 9.9 -2.5 -2.4 16.3 22.8 3Algeria 77.9 41.0 43.6 50.5 70.8 60.7 33.2 135.9 65.2 58.3 18.1 27.0 22.9 54.2Burkina Faso 29.6 29.6 37 51 27.8 12.0 21.6 5.6 6.3 -1.0 2.8 -2.8 -1.0 10.7 13.7Cameroon 30.8 46.2 44.0 34.2 22.7 8.8 18.0 9.2 23.0 38.2 19.4 20.8 78.0 30.3Gabon 51.2 49.4 63.8 60.5 58.6 47.5 55.2 5.5 55.9 33.7 28.4 22.4 81.3 47.2Congo 27.3 50.4 48.6 20.4 25.9 32.7 10.4 -0.8 22.0 20.6 40.7 46.8 97.0 34.0logo 17.2 21.0 11.7 2.7 -1.0 -4.2 -5.9 -14.3 -3.0 18.5 11.0 25.8 69.9 11.5Benin 36.1 22.4 33.4 11.7 1.9 2.8 3.2 -3.5 1.9 24.0 44.0 20.5 79.6 21.4Reunion 18.2 20.9 20.6 24.2 13.2 9.4 -1.5 -1.5 10.6 14.4 8.1 26.4 55.5 16.8Maritius 2/ na -8.2 -17.7 -2.7 21.1 42.2 60.4 66.1 na na na 24.9 na 23.3
Weighted Average FrenchAssociates 37.9 27.5 24.6 28.5 29.6 23.0 18.1 13.1 19.5 25.4 6.6 17.4 40.1 26.9
I/ The price relative for associated country i (Rd) is measured by:
R. h.- uI uI 100ToR. = lUj 0 0
where U. and UO are the average French associate and other countries' unit values for the sampled iron and steel products.
2/ For some specific years low import volumes precluded computation of a unit value relative.
- 14 -
close to 27 per cent, but some of the lowest values were recorded for 1974-77
and 1982-83. However, the most striking point to emerge from Table 3 concerns
the wide range in average premiums paid by the associated countries. For
example, over the 26 year period these premiums averaged 3.1 per cent for
Morocco, but for Mauritania, Algeria and Gabon they were at least 15 times
greater. Subsequent correlation tests (see Table 4) will show that these
individual country differences are significantly (inversely) related to the
size of the importing market and the number of trade contacts it maintains.
IV. Correlation Analysis of Unit Value Differences
For policy purposes a key question is why there are such major
differences between the f.o.b. export unit values for different countries of
destination. Since these items (five-digit SITC steel products) are generally
homogenous in nature, differences in product characteristics should have a
fairly limited influence on unit values (prices). In an attempt to account
for these differences, French relative export prices (i.e., the unit value for
the individual importing country relative to the average unit value for the
product group) were correlated with various market structure and other
performance variables which might be expected to influence relative prices.
Table 4 summarizes these results for 1968-69 period and also shows similar
correlation results for 1986-1987 in order to determine how the relationships
between variables evolved over time.12/ To assist in evaluating this
12/ An earlier period like 1962-63 was not selected for the correlation testssince 1968-69 provided an interval in which France had considerablybroadened trade contacts among other devleoped and developing countries.This provided a large base and range of country charateristics for whichprice comparisons could be made. The period 1986-87 was selected toprovide the widest possible interval for the intertemporal comparisons ofcorrelation resutls. Since Table 2 shows that the associate country pricemargins were within normal ranges, there is no reason to believe that thecorrelation results would differ significantly if other periods had beenselected.
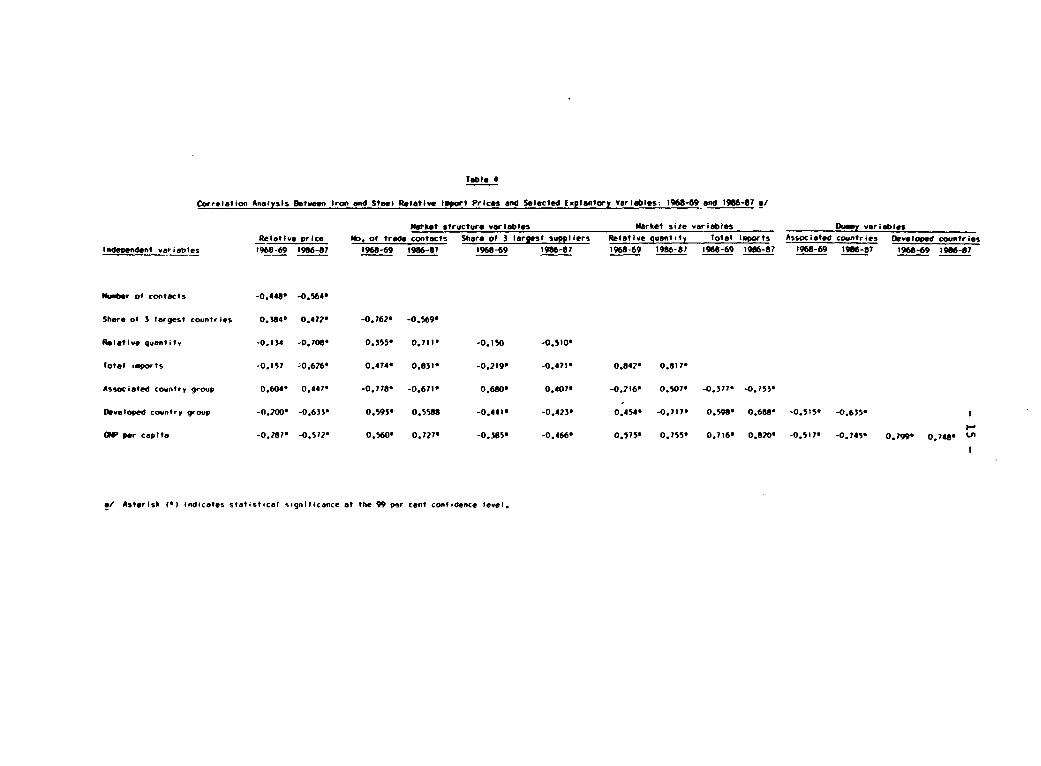
Table 4
Correlation Analysis etween Iron and Steel Relative import Prices ond Selected Explantory variables: 1968-69 and 1986-87 a/
Matket structure variables Market size variables Du_m variablesRelative price No. of trade contacts Share ol 3 largest suppliers Relative quant.ty total Ivports Associated countries Developed countriesIndetendent variables 1968-69 1986-87 t96g-69 1986-67 1968-69 1986-87 1968-69 1986-87 1968-69 1906-87 1968-69 1966-e7 1968-69 1986-07
Number of contacts -0.448" -0.564'
Share ol 3 largest countries 0.384' 0.472' -0.762Z -0.569'
Relative quentity -0.134 -0.70' 0.355) 0.711' -0.150 -0.510'
total eports -0.157 :0.6260 0.4140 0.831' -0.219' -0.471' 0.842' 0.817?
Associated country group 0.604' 0.447' -0.778' -0.671' 0.680' 0.407' -0.216' 0.507' -0.377' -0.753'Developed country group -0.200' -0.63)" 0.593' 0.5588 -0.441' -0.423* 0.454# -0.717' 0.596' 0.6188 -0.515' -0.635 1
1-e U per caplta -0.2876 -0.5712 0.560' 0.727? -0.385' -0.4660 0.5750 0.755' 0.716' 0.8200 -0.5170 -0.745' 0.7990 0.748u >
eJ Asterisk I-) indicates statistical signilicance at the 99 per cent conlidence level.
- 16 -
information, results which are significant at the 99 per cent confidence level
have been marked with an asterisk. The imrediate impression that one gets
from Table 4 is that the nature of the relationships have changed little over
this extended time period (although many of the 1986-87 correlations appear
stronger than those for the earlier period). That is, the variables that had
an important influence on prices and market structure in 1968-69 also had an
important similar influence in 1986-87. 13/
As shown in the first column of the table, five explanatory variables
had a significant influence on relative French export prices in 1968-69 with
all of the variables being significEnt in 1986-87. As is the case with
industrial country market studies, variables relating to market structure
appear to exert a key influence on relative prices. For example, a highly
significant positive relation (r = 0.384) exists between relative prices and
the per cent of imports controlled by the three largest supplying countries in
1968-69 and the relation was even stronger (r = .472) in 1986-87. Thus, those
nations which are heavily dependent on a relatively few suppliers pay for this
13/ When the seven independent variables shown in the left hand column ofTable 4 were combined in a regression against relative import prices (P)the following results were obtained for 1968-69:
P = -0.264 - 0.028N + 0.621S - 0.002Q + 0.001I + 0.023A - 0.050D - 0.OO1G(2.521) (3.437) (2.109) (1.428) (2.646) (0.570) (2.671)
where N is the number of contacts, S is the share of the three largestsuppliers, Q is the relative quantity variable, I is total imports, A is adummy variable taking a value of one for associated countries, D is adeveloped country dummy, and G is the importing countries per capita CNPand t values are shown in parentheses. The coefficient of determination(R ) for this equation was 0.51. When the same equation was run for the1986-87 period the coefficient of determination rose slightly to 0.56.However, the independent variable regression coefficients for both yearsmust be regarded with caution since there is evidence of a high degree ofmulticolinearity in the data.
- 17 -
reliance through higher import prices. 14/ Another result which highlights
the importance of market charateristics is the significant inverse association
that exists in both time period between relative prices and the number of
trading partner (country) contacts. Thus, those importing countries main-
taining trade relations with a larger number of exporters, and theoretically
benefiting from greater competition and information on comparative prices, pay
less for their exports. Unfortunately, from the view of development policy,
there is evidence that the smaller, poor countries may not be able to sustain
a larger number of trading contacts since this variable was significant and
positively correlated with GNP per capita, market size, relative quantities
purchased and the developed country dummy. 15/ Thus, developing countries
acting in isolation (i.e. not resorting to practices like combined bulk
purchasing) may not be able to maintain the trade contacts and other market
conditions leading to lower import prices.
Somewhat surprisingly, the 1968-69 correlations fail to show a strong
association between relative prices and either of the market size variables,
although both these variables are significant with the expected (negative)
sign in 1986-87. While import prices are negatively correlated with both the
14/ As might be expected a strong inverse correlation exists between thenumber of trade contacts and the share of the three largest suppliers.That is, countries with relatively few contacts typically receive a higherpercentage of total imports from three major exporting countries.
15/ Some practices of developed countries, like the "tying" of internationalaid, may strongly reinforce the negative structure (monopoly) elementspresent in developing countries' import markets. Specifically, tied aidrequires that recipient countries make purchases from domestic firmsheadquartered in the donor nation. Knowing that the country receivingtied aid cannot turn to other bidders, suppliers in the donor country haveno incentive to engage in competitive international bidding. The practiceof tying aid may be an important reason for the sizeable and persistentpremiums that the associated countries' paid over 1962-1987.
- 18 -
relative (five-digit) 1968-69 quantities purchased and total imports, these
associations fail to achieve statistical significance at the 99 per cent level
(both are in fact significant at a 95 per cent confidence level). Thus,
market size may have a relatively minor direct influence on price in 1968-69
as compared to the structure variables and related competitive factors.
However, the indirect effects of size appear important in both periods since
Table 4 shows this variable is correlated with market structure which, in
turn, influences market prices. Aside from these relations, the correlations
between relative prices and the association dummy are among the strongest in
the table for both 1968-69 and 1986-87. This suggests that the special
relations between French producers and the associated countries (see Appendix 1)
isolates the former from active competition and allows prices to rise above
levels dictated by market structure. As such, it would seemingly benefit the
associated countries to encourage alternative trade contacts, or adopt policy
measuras aimed at increasing competition in their import markets. However,
they may be deterred from doing this by practices such as tying aid, or by the
small size of their import markets.
While the correlations between relative prices and the explanatory
variables are the primary focus of this analysis, some of the
intercorrelations between the independent variables are also of interest. For
example, there appear to be a number of specific factors working against a
more favorable price position for the associated countries. Specifically,
Table 4 shows that these nations had significantly fewer trade contacts in
both time periods, are generally smaller markets and also have significantly
higher concentration ratios. All of these factors undoubtedly contribute to
higher import prices. Conversely, the developed countries have less
concentrated markets, as well as a larger number of trade contacts. Thus,
- 19 -
certain internal characteristics of each country group appear to have an
important influence on relative prices.
V. Additional Evidence on the Extent of Discriminatory Pricing
While the previous analyses focussed solely on the pricing practices
of French enterprises, a question of obvious importance is whether or not
other industrial countries' firms have adopted similar policies. For a test
of this proposition, f.o.b. unit values were computed for the United Kingdom's
exports of major iron and steel products to former African colonies (Kenya,
Uganda, Tanzania, Sudan, Nigeria, Gambia, Sierra Leone and Ghana) as well as
to all other developing countries. Next, similar computations were made for
Belgium (with Burundi, Rwanda and Zaire designated as colonies) and Portugal
(Angola and Mozambique). These data were then used to compute the average
premium or discount that the Belgium, Portugal or United Kingdom colonies paid
over the 1962-1987 interval. These figures, as well as similar statistics for
the French colonies, have been summarized in Table 5.
Over the full 1962-87 period the average premiums paid by the former
Belgium and French colonies are remarkably close (23.7 and 23.2 percent,
respectively) while the former United Kingdom associated paid a slightly lower
premium of 20.0 percent. The same pricii.g pattern emerges during 1962-75 for
Portugal's exports to former colonies, but from 1976 on the premiums more than
tripled and averaged over 120 percent. It appears that the hostilities in
Angola were a major factor behind this dramatic rise as domestic firms may
have employed excess pricing as a means of transfering resources out of the
country. However, as far as policy implications are concerned, the statistics
in Table 5 are important since they show that the problem of "overpricing" of
imports is widespread among African countries.
- 20 -
VI Summary and Policy Implications
Using techniques which have been employed for analysis of domestic
market performance in industrial countries, this study examined the pattern of
France's iron and steel export prices over an extended period 1962-1987. The
findings parallel those for the industrial organization investigations.
Typically, international markets which are more concentrated, or which rely on
a smaller number of trade contacts, bear higher prices. Also, the magnitudes
of these excess prices are such as to have important policy implications. For
example, had the associated French countries not paid the overall premiums
indicated in Table 3, this would have resulted in a saving of foreign exchange
with a present value of close to $1 billion in 1987. If the same pattern of
excess prices applied to all (i.e., sampled plus other steel imports) the
associates' imports the magnitude of the savings would approximately double.
It should be noted that these figures relate solely to iron and steel
shipments and a key question is whether excess price margins also apply to
other capital goods imports. Bearing on this last point is the fact that
"trade intensity ratios" are lower for most associated countries' iron and
steel products than they are for other items (see appendix table 2). This
would appear to establish a precondition where such excess pricing could be
generalized although more research is needed to establish its definite
existence.

- 21 -
Table 5
Comparative Analysis of the Premium on Discount Charged by SelectedEuropean Countries on Iron and Steel Exports to
Associated African Countries
Average Premium or Discount Charged Associated Countries _
UnitedYear Belgium 2/ France 3/ Portugal 4/ Kingdom 5/
1962-63 20.7 36.9 12.7 4.01964-65 21.2 21.8 37.3 8.81966-67 25.7 21.0 25.6 14.41968-69 19.1 23.9 29.9 12.'1970-71 15.2 16.7 43.7 l3.v1972-73 18.0 18.6 18.7 15.51974-75 26.4 8.1 42.9 9.91976-77 35.3 -3.6 6/ 22.51978-79 37.0 26.1 6/ 15.11980-81 17.1 20.9 6/ 19.21982-83 25.5 8.6 6/ 36.51984-85 16.0 36.2 6/ 37.91986-87 31.5 66.5 6/ 53.0
1/ Based on the four and five digit SITC products listed in AppendixTables 3 through 13. The average premium or discount has beencalculated relative to the average unit value for each product paidby other developing countries.
2/ Burundi, Rwanda and Zaire comprise the as!iociated country group.
3/ See Table 3 for a list of countries classified as French associates.
4/ Angola and Mozambique comprise the associated country group.
5/ Countries classified as United Kingdom associates are Kenya, Uganda,Tanzania, Sudan, Nigeria, Cambia, Sierra Leone and Ghana.
6/ From 1976-77 to 1986-87 the premiums on Portugal's exports ro:.sedramatically and averaged over 120 percent. It appears likely thatthe hostilities in Angola were a major factor causing the largeincrease in premiums over those which prevailed during 1962-63 to1974-75.
- 22 -
From the viewpoint of development policy, several of the direct and
cross correlations shown in this study (Table 4) are quite important. For
example, relative prices are seen to vary with market size. This suggest that
there may be some economies of scale associated with larger shipments, so that
countervailing power may be a factor. However, the indirect effects of size
on prices may be even more important since a strong inverse correlation exists
between this variable and market concentration. 16/ Thus, market size
apparently produces structural features which influence both the level of
competition and prices.
While further research is needed concerning the influence of size on
relative prices, a question of key importance is why the pattern of price
relatives documented in this study exits, and has persisted over such an
extended interval. 17/ As was noted, the excess prices margins are fully
consistent with both economic theory on the functioning of markets and results
16/ In a related study dealing with unit values of United States machineryexports, Hufbauer and O'Neil (1973) find evidence of a strong directrelation between size and relative prices. For example, they suggest (p.272) that "A noteworthy feature of the regression analysis is the strongand highly significant effect of the quantity variable. Whether theelasticity of -0.23 relfects price discrimination based on orthodoxmonpoly consideration, we cannot say. In any event, the quantity effectmeans that a small importing country pays a much higher price for itsmachinery" (italics added).
17/ There are several lines that this research might take. First, it would beuseful to extend the procedures developed in this study to other types ofhomogenous products (i.e., glass, cement, nonferrous metals, etc.) to seeif further evidence of discriminatory pricing exists for these items.Second, trade intensity and other structural variables (see appendix 1)could be computed for a large number of bilateral trade flows and theresults used to "flag" outliers (countries) which may be subject to theabuse of monopoly pricing power. The procedures used in this study mightthen be applied to these specific countries to test for evidence ofmonopoly pricing. Third, the procedures should be applied to homogenousgoods exported from developing countries to determine if they may bereceiving less than competitive prices for this trade.
- 23 -
from investigations of markets where monopoly elements exist. However, it was
not possible within the scope of the current investigation to identify the
precise factors that were adversely affecting the African countries. Among
the possiblities are: the relatively small size of their markets, a point that
could be important if there are economies associated with large orders; the
influence of tied aid and other factors like established lines of
international transport that limit accesss to more competitive suppliers; a
lack of access to information on prices of more competitive suppliers; the use
of "agreed" overpricing to facilitate graft and corruption; or the established
business practices of subsidiaries of foreign firms in the African
countries.181 Definitive information on the relative importance of such
factors will require a detailed analysis of the procurement practices and
problems of African importers.
18/ A recent study by Kreinin (1988) shows that subsidiaries of foreign firmspurchase from the parent company even when other international traderswere offering goods of equal quality at lower prices. This tie betweensubsidiaries and the parent was particularly strong for Japaneseenterprises which almost exclusively relied on the Japanese parent forimports. It would be useful to undertake similar research on thepurchasing practices of foreign subsidiaries in the developing Africancountries to determine if intra-firm practices were an importantexplanatory factor for the large and persistent price premiums.
- 24 -
References
Adelman, Morris (1951). "The Measurement of Industrial Concentration," Reviewof Economics and Statistics, vol. 33, pp. 269-296.
Avramovic, Dragaslov (1978). "Common Fund, Why and What Kind," Journal ofWorld Trade Law, 12 (October), pp. 370-43.
Bain, Joe (1951). "Relation of Profit to Industry Concentration," QuarterlyJournal of Economics, vol. 65 (August), pp. 297-304.
Bell, Frederick and Neil Murphy (1969). "Impact of Market Structure on thePrice of a Commercial Banking Service, "Review of Economics andStatistics, 51 (May), pp. 210-213.
Edwards, Corwin (1972). "Barriers to International Competition: InterfirmCompetitive Behavior," in R. Hawkins and I. Walter (eds), The UnitedStates and International Markets, (Lexington: D.C. Heath).
Helleiner, G. (1978). World Market Imperfections and Developing Countries,(Washington: Overseas Development Council).
Hewett, E.A. (1974). Foreign Trade Prices in the Council for Mutual EconomicAssistance, (London: Cambridge University Press).
Hufbauer, G.C. and J.P. O'Neill (1972). "Unit Values of U.S. Machineryexports," Journal of International Economics, vol. 2, pp. 265-276.
Kleiman. Ephraim (1976). "Trade and the Decline of Colonialism" EconomicJournal, vol. 86 (September), pp. 459-480.
Kreinin, Mordechai (1988). "How Closed is the Japanese Market? AdditionalEvidence," The World Economy, (December), pp. 529-542.
Mann, H.M. (1966). "Seller Concentration, Barriers to Entry, and Rates ofReturn in Thirty Industries: 1950-1960," Review of Economics andStatistics, bo. 48, pp. 296-307.
McAllister, Harry (1961). "Statistical Factors Affecting the Stabiltiy of theWholesale and Consumer Price Indexes," in U.S. Congress, Joint EconomicCommittee, Government Price Statistics Hearing.... (Washington: U.S.Government Printing Office.
Prais, S.J. (1958). "The Statistical Conditions for a Change inConcentration," Review of Economics and Statistics, vol. 40, pp. 268-272.
Scherer, F.M. (1970). Industrial Market Structure and Economic Performance,(Chicago: Rand McNally).
Stigler and Kindahl (1970). The Behavior of Industrial Prices, (New York:National Bureau of Economic Research).
- 25 -
UNCTAD (1975). The Control of Transfer Pricing in Greece, (Geneva: UnitedNations).
Yeats, Alexander (1974) "Further Evidei ce on the Structure-PeformanceRelation in Banking," Journal of Economics and Business, vol. 26,(February), pp. 95-100.
Yeats, Alexander (1978). "Mouiopoly Power, Barriers to Competition, and thePattern of Price Differentials in International Trade, Journal ofDevelopment Economics, 5 (June), pp. 167-180.
- 26 -
Appendix 1
Bilateral Trade Intensity Ratios, Trade Concentration Ratiosand France's Share of Associated African Markets
1962 to 1985
- 27 -
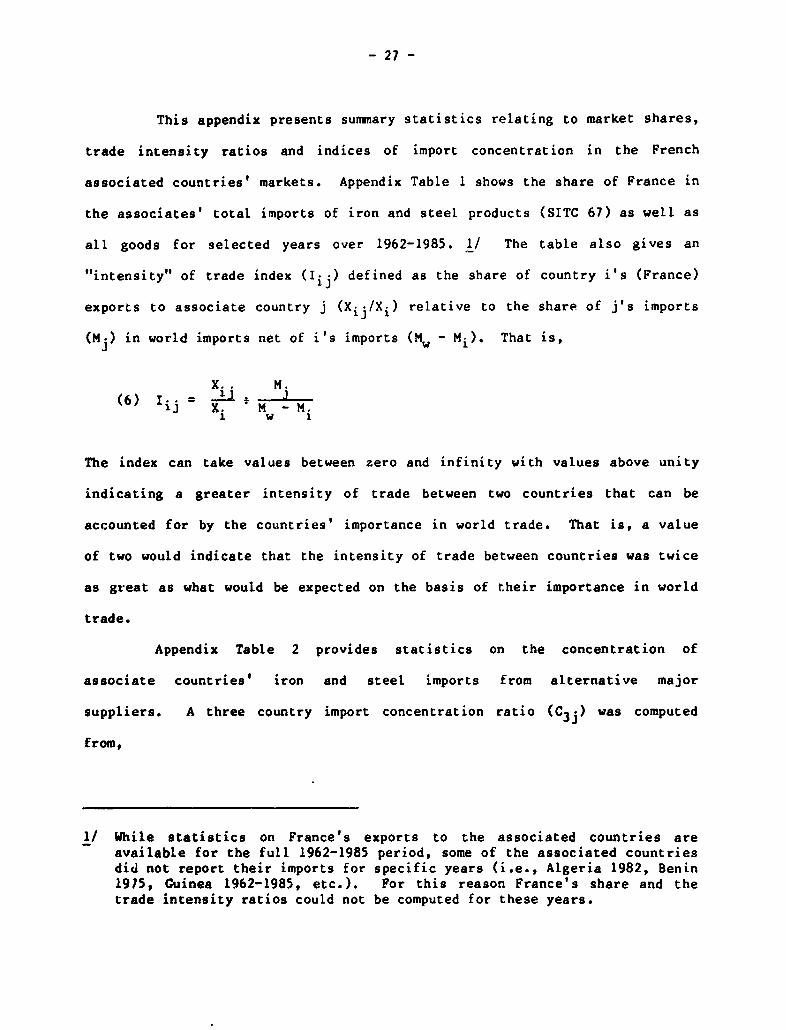
This appendix presents sumary statistics relating to market shares,
trade intensity ratios and indices of import concentration in the French
associated countries' markets. Appendix Table 1 shows the share of France in
the associates' total imports of iron and steel products (SITC 67) as well as
all goods for selected years over 1962-1985. 1/ The table also gives an
"intensity" of trade index (Ii.) defined as the share of country i's (France)
exports to associate country j (Xij/Xi) relative to the share of j's imports
(MN) in world imports net of i's imports (Mw - Mi). That is,
X.. M.(6) I.. = X. *M
Uj X. MN - M.1 w i
The index can take values between zero and infinity with values above unity
indicating a greater intensity of trade between two countries that can be
accounted for by the countries' importance in world trade. That is, a value
of two would indicate that the intensity of trade between countries was twice
as great as what would be expected on the basis of their importance in world
trade.
Appendix Table 2 provides statistics on the concentration of
associate countries' iron and steel imports from alternative major
suppliers. A three country import concentration ratio (C3j) was computed
from,
1/ While statistics on France's exports to the associated countries areavailable for the full 1962-1985 period, some of the associated countriesdid not report their imports for specific years (i.e., Algeria 1982, Benin1975, Guinea 1962-1985, etc.). For this reason France's share and thetrade intensity ratios could not be computed for these years.
- 28 -
(7) C3j = (M3j * NTi) x 100
where M3j is the value of associate country j's iron and steel imports from
the three largest supplying countries and MTj is the total value of imports.
In addition, the Hirschmann concentration index (H.) was also computed,
(8) Hj = /T(ET. X.)2 )
This index may take values ranging from zero to unity with the higher numbers
indicating more concentrated markets. 2/ To assist in evalutaing these
indices, similar statistics have been computed for the total imports of all
developed and developing countries as well as for Brazil, U.S., U.K. and the
Federal Republic of Germany.
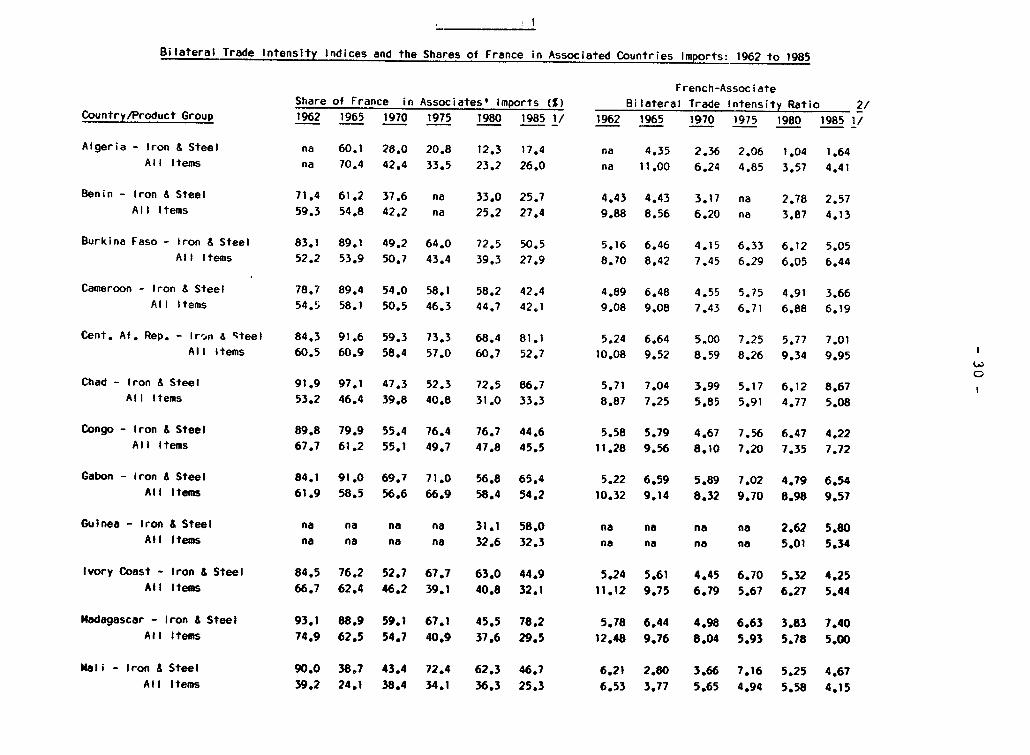
Two major points clearly emerge from these indices. First, the
bilateral trade intensity ratios indicate that France has maintained a
dominant position in almost all the associated countries' markets (Mauritius
is an exception) throughout the 1962-85 period although many of the ratios
appear to be on a declining trend. Still, in 1985 iron and steel exports from
France to Burkina Faso, Central African Republic, Chad, Gabon, Guinea,
2/ Market structure indices like equations (7) and (8) have been usedextensively in structure-performance studies of domestic markets ofindustrial countries where they are based on individual firm's shipment,sales, employment or production data. There is a potential problem inapplying these measures to national trade data in that similar measuresfor different countries may mask very different distributions of competingfirms. That is, a high ratio derived from national trade data may be amisleading indicator of the actual level of competition if there are alarge number of (national) competing firms. In OECD countries, however,there are relatively few iron and steel firms (some of which arenationalized) so this should not be a major problem for the current study.
- 29 -
Madagascar, Reunion and Senegal were five times or more what would be expected
onl the basis of the respective sizes of these countries in world trade. 3/
Second, Appendix Table 2 clearly shows that the markets of the associated
countries for iron and steel imports remain far more concentrated than those
of developed or developing countries although the market structure indices are
falling from their very high levels of the early 1960s. Still, by 1985 the
three largest supplying countries control 70 per cent or more (over 90 per
cent in the case of Chad and Reunion) of the associates' imports. In
industrial market studies such very high levels of concentration have
consistently been found to be associated with higher seller prices and
profits.
3/ The fact that 14 of the 20 countries have higher bilateral trade ratiosfor all imports than for iron and steel in 1985 suggest that "overpricing"may in fact extend beyond this one sector to all goods. Yeats (1978,Table 4, p. 178) provides some evidence in support of this contention byshowing that the average unit values for all four-digit SITC productsimported by selected associate countries from France are consistentlyhigher than those of other African countries.
I ~~~~! I
Bilateral Trade Intensity Indices and the Shares of France in Associated Countries Imports: 1962 to 1985
French-AssociateShare of France in Associates' Imports (%) Bilateral Trade Intensity Ratio 2/
Country/Product Group 1962 1965 1970 1975 1980 1985 1/ 1962 1965 1970 1975 1980 1985 1/
Algeria - Iron & Steel na 60.1 28.0 20.8 12.3 17.4 na 4.35 2.36 2.06 1.04 1.64All Items na 70.4 42.4 33.5 23.2 26.0 na 11.00 6.24 4.85 3.57 4.41
Benin - Iron & Steel 71.4 61.2 37.6 na 33.0 25.7 4.43 4.43 3.17 na 2.78 2.57All Items 59.3 54.8 42.2 na 25.2 27.4 9.88 8.56 6.20 na 3.87 4.13
Burkina Faso - Iron A Steel 83.1 89.1 49.2 64.0 72.5 50.5 5.16 6.46 4.15 6.33 6.12 5.05All Items 52.2 53.9 50.7 43.4 39.3 27.9 8.70 8.42 7.45 6.29 6.05 6.44
Cameroon - Iron a Steel 78.7 89.4 54.0 58.1 58.2 42.4 4.89 6.48 4.55 5.75 4.91 3.66All Items 54.5 58.1 50.5 46.3 44.7 42.1 9.08 9.08 7.43 6.71 6.88 6.19
Cent. Af. Rep. - Iro,n a cteel 84.3 91.6 59.3 73.3 68.4 81.1 5.24 6.64 5.00 7.25 5.77 7.01All Items 60.5 60.9 58.4 57.0 60.7 52.7 10.08 9.52 8.59 8.26 9.34 9.95
0Chad - Iron & Steel 91.9 97.1 47.3 52.3 72.5 86.7 5.71 7.04 3.99 5.17 6.12 8.67All Items 53.2 46.4 39.8 40.8 31.0 33.3 8.87 7.25 5.85 5.91 4.77 5.08
Congo - Iron & Steel 89.8 79.9 55.4 76.4 76.7 44.6 5.58 5.79 4.67 7.56 6.47 4.22All Items 67.7 61.2 55.1 49.7 47.8 45.5 11.28 9.56 8.10 7.20 7.35 7.72
Gabon - Iron & Steel 84.1 91.0 69.7 71.0 56.8 65.4 5.22 6.59 5.89 7.02 4.79 6.54All Items 61.9 58.5 56.6 66.9 58.4 54.2 10.32 9.14 8.32 9.70 8.98 9.57
Guinea - Iron 6 Steel na na na na 31.1 58.0 na na no na 2.62 5.80All Items na na na na 32.6 32.3 na na no na 5.01 5.34
Ivory Coast - Iron & Steel 84.5 76.2 52.7 67.7 63.0 44.9 5.24 5.61 4.45 6.70 5.32 4.25All Items 66.7 62.4 46.2 39.1 40.8 32.1 11.12 9.75 6.79 5.67 6.27 5.44
Hbdagascar - Iron a Steel 93.1 88.9 59.1 67.1 45.5 78.2 5.78 6.44 4.98 6.63 3.83 7.40All Items 74.9 62.5 54.7 40.9 37.6 29.5 12.48 9.76 8.04 5.93 5.78 5.00
Mali - Iron & Steel 90.0 38.7 43.4 72.4 62.3 46.7 6.21 2.80 3.66 7.16 5.25 4.67All Items 39.2 24.1 38.4 34.1 36.3 25.3 6.53 3.77 5.65 4.94 5.58 4.15
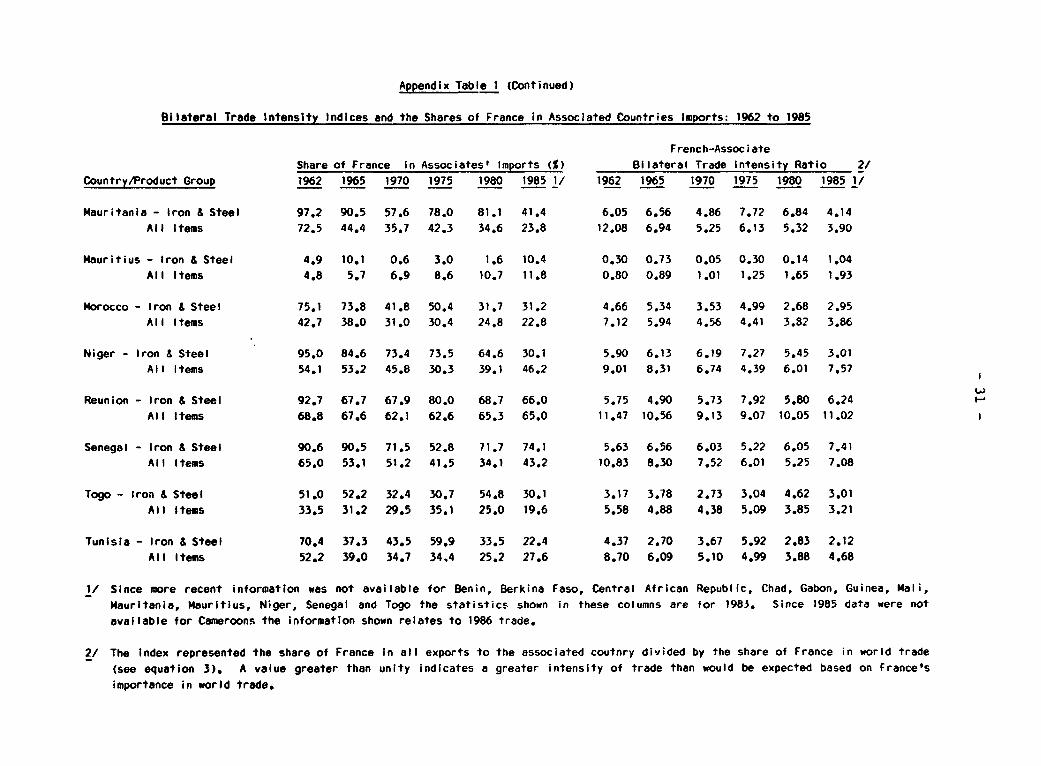
Appendix Table 1 (Continued)
Bilateral Trade Intensity Indices and the Shares of France in Associated Countries Imports: 1962 to 1985
French-AssociateShare of France in Associates' Imports (B) 8ilateral Trade Intensity Ratio 2/
Country/Product Group 1962 1965 1970 1975 1980 1985 1/ 1962 1965 1970 1975 1980 1985 1/
Mauritania - Iron & Steel 97,2 90.5 57.6 78.0 81.1 41.4 6.05 6.56 4.86 7.72 6.84 4.14All Items 72.5 44.4 35.7 42.3 34.6 23.8 12.08 6.94 5.25 6.13 5.32 3.90
Mauritius - Iron & Steel 4.9 10.1 0.6 3.0 1.6 10.4 0.30 0.73 0.05 0.30 0.14 1.04All Items 4.8 5.7 6.9 8.6 10.7 11.8 0.80 0.89 1.01 1.25 1.65 1.93
Morocco - Iron & Steel 75.1 73.8 41.8 50.4 31.7 31.2 4.66 5.34 3.53 4.99 2.68 2.95All Items 42.7 38.0 31.0 30.4 24.8 22.8 7.12 5.94 4.56 4.41 3.82 3.86
Niger - Iron a Steel 95.0 84.6 73.4 73.5 64.6 30.1 5.90 6.13 6.19 7.27 5.45 3.01All Items 54.1 53.2 45.8 30.3 39.1 46.2 9.01 8.31 6.74 4.39 6.01 7.57
Reunion - Iron & Steel 92.7 67.7 67.9 80.0 68.7 66.0 5.75 4.90 5.73 7.92 5.80 6.24All Items 68.8 67.6 62.1 62.6 65.3 65.0 11.47 10.56 9.13 9.07 10.05 11.02
Senegal - Iron & Steel 90.6 90.5 71.5 52.8 71.7 74.1 5.63 6.56 6.03 5.22 6.05 7.41All Items 65.0 53.1 51.2 41.5 34.1 43.2 10.83 8.30 7.52 6.01 5.25 7.08
Togo - Iron & Steel 51.0 52.2 32.4 30.7 54.8 30.1 3.17 3.78 2.73 3.04 4.62 3.01All Items 33.5 31.2 29.5 35.1 25.0 19.6 5.58 4.88 4.38 5.09 3.85 3.21
Tunisia - Iron & Steel 70.4 37.3 43.5 59.9 33.5 22.4 4.37 2.70 3.67 5.92 2.83 2.12All Items 52.2 39.0 34.7 34,4 25.2 27.6 8.70 6.09 5.10 4.99 3.88 4.68
1/ Since more recent information was not available for Benin, Berkina Faso, Central African Republic, Chad, Gabon, Guinea, Mali,Mauritania, Mauritius, Niger, Senegal and Togo the statistics shown in these columns are for 1983. Since 1985 data were notavailable for Cameroons the information shown relates to 1986 trade.
2/ The index represented the share of France in all exports to the associated coutnry divided by the share of France in world trade(see equation 3). A value greater than unity indicates a greater intensity of trade than would be expected based on France'simportance in world trade.
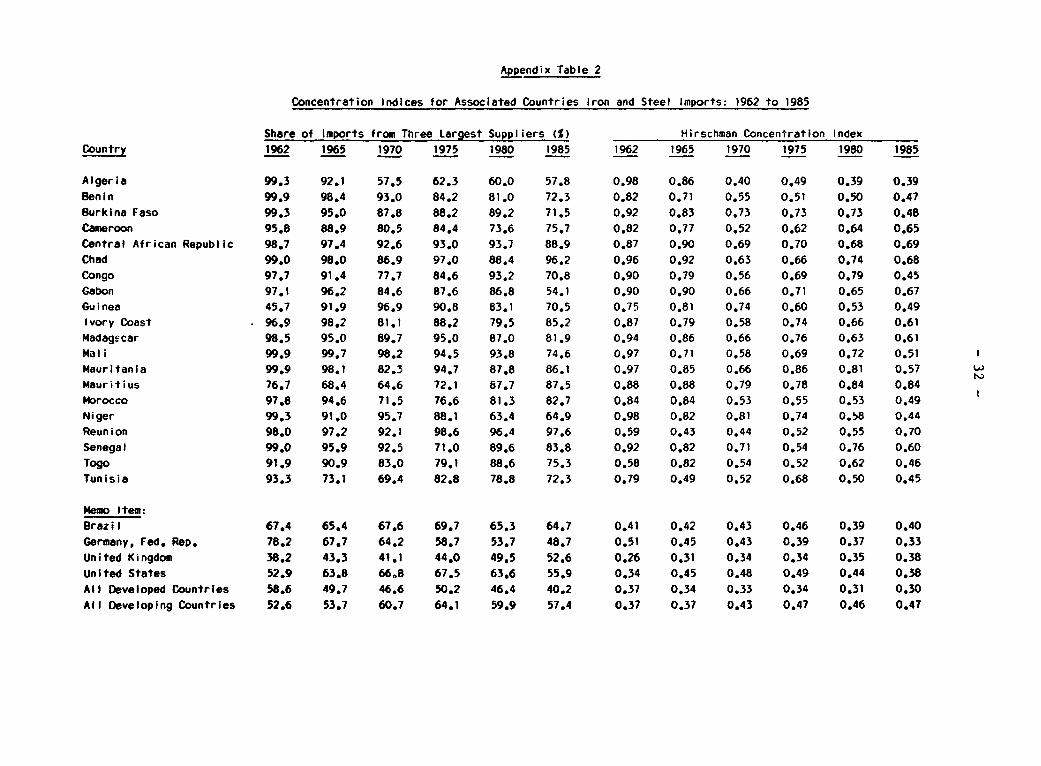
Appendix Table 2
Concentration Indices for Associated Countries Iron and Steel Imports: 1962 to 1985
Share of Imports from Three Largest Suppliers (%) Hirschman Concentration IndexCountry 1962 1965 1970 1975 1980 1985 1962 1965 1970 1975 1980 1985
Algeria 99.3 92.1 57.5 62.3 60.0 57.8 0.98 0.86 0.40 0.49 0.39 0.39Benin 99.9 98.4 93.0 84.2 81.0 72.3 0.82 0.71 0.55 0.51 0.50 0.47Burkina Faso 99.3 95.0 87.8 88.2 89.2 71.5 0.92 0.83 0.73 0.73 0.73 0.48Cameroon 95.8 88.9 80.5 84.4 73.6 75.7 0.82 0.77 0.52 0.62 0.64 0.65Central African Republic 98.7 97.4 92.6 93.0 93.7 88.9 0.87 0.90 0.69 0.70 0.68 0.69Chad 99.0 98.0 86.9 97.0 88.4 96.2 0.96 0.92 0.63 0.66 0.74 0.68Congo 97.7 91.4 77.7 84.6 93.2 70.8 0.90 0.79 0.56 0.69 0.79 0.45Gabon 97.1 96.2 84.6 87.6 86.8 54.1 0.90 0.90 0.66 0.71 0.65 0.67Guinea 45.7 91.9 96.9 90.8 83.1 70.5 0.75 0.81 0.74 0.60 0.53 0.49Ivory Coast 96.9 98.2 81.1 88.2 79.5 85.2 0.87 0.79 0.58 0.74 0.66 0.61Madagecar 98.5 95.0 89.7 95.0 87.0 81.9 0.94 0.86 0.66 0.76 0.63 0.61Mali 99.9 99.7 98.2 94.5 93.8 74.6 0.97 0.71 0.58 0.69 0.72 0.51 1Mauritania 99.9 98.1 82.3 94.7 87.8 86.1 0.97 0.85 0.66 0.86 0.81 0.57Mauritius 76.7 68.4 64.6 72.1 87.7 87.5 0.88 0.88 0.79 0.78 0.84 0.84Morocco 97.8 94.6 71.5 76.6 81.3 82.7 0.84 0.84 0.53 0.55 0.53 0.49Niger 99.3 91.0 95.7 88.1 63.4 64.9 0.98 0.82 0.81 0.74 0.S8 0.44Reunion 98.0 97.2 92.1 98.6 96.4 97.6 0.59 0.43 0.44 0.52 0.55 0.70Senegal 99.0 95.9 92.5 71.0 89.6 83.8 0.92 0.82 0.71 0.54 0.76 0.60Togo 91.9 90.9 83.0 79.1 88.6 75.3 0.58 0.82 0.54 0.52 0.62 0.46Tunisia 93.3 73.1 69.4 82.8 78.8 72.3 0.79 0.49 0.52 0.68 0.50 0.45
Memo Item:Brazil 67.4 65.4 67.6 69.7 65.3 64.7 0.41 0.42 0.43 0.46 0.39 0.40Germany, Fed. Rep. 78.2 67.7 64.2 58.7 53.7 48.7 0.51 0.45 0.43 0.39 0.37 0.33United Kingdom 38.2 43.3 41.1 44.0 49.5 52.6 0.26 0.31 0.34 0.34 0.35 0.38United States 52.9 63.8 66,8 67.5 63.6 55.9 0.34 0.45 0.48 0.49 0.44 0.38All Developed Countries 58.6 49.7 46.6 50.2 46.4 40.2 0.37 0.34 0.33 0.34 0.31 0.30All Developing Countries 52.6 53.7 60.7 64.1 59.9 57.4 0.37 0.37 0.43 0.47 0.46 0.47
- 33 -
Appendix 2
Comparative Analysis of F.O.B. French Unit Valuesfor Iron and Steel Exports: 1962 to 1987
Associated French and Other Developing and Developed Countries
- 34 -
Appendix Table 3
Comparative Unit Value Information for France's Exports of SITC Product 677.01(Iron and Steel Simple Wire Excluding Rod)
Premium or Discount Paid by French Associated Countries I/French f.o.b. exports Developing Countriesto associated countries All AllValue Unit Value (S) Total 2/ Developed Non-French Latin America Middle-East
Year (5000)
1962-63 6,255 168.60 27,2 19.3 40.7 37.2 30.41964-65 7,460 174.00 17.3 9.1 32.4 28.3 21.71966-67 6,704 178.30 15.9 10.9 34.7 41.4 21.31968-69 5,964 183.20 11.3 9.4 29.0 38.0 17.11970-71 8,133 221.20 -9,2 -11.2 12.8 25.5 11.31972-73 8,938 311.Q0 4.5 3.8 19.7 39.5 9.01974-75 17,629 555.10 10.6 10.5 19.3 13.8 26.11976-77 15,019 487.50 -1.4 -2.6 18.0 -0.4 17.61978-79 17,903 678.10 11.0 9.1 36.3 37.8 25.91980-81 22,549 723.80 3.4 0.4 36.3 0.4 40.11982-83 18,976 537.70 -7.5 -14.0 29.3 -22,0 33.21984-85 19,817 530.30 -8.6 -9.9 9.8 -50.6 13.41986-87 16,165 878.20 14.9 15.9 36.9 -9.7 17.2
Net Revenue Gains or Losses (S000)Actual dollar amount 3/ ..... 35,458.0Present value of gains or losses 4/ ... 79,418.0
1/ The French associated country premium or discount (P/Df) has been computed from the followingformula:
(4) P/Df a [(Uf - Ug) 9 UgI x 100.
where Uf Is the unit value for the French associates and U is the unit value for thecomparator group of countries.
2/ Excludes the French associated countries in Africa.3/ The actual dollar amount of the gains and losses (Adf) has Deen computed from:
(5) Adf (Uf - UO) x qf
where qf Is the quantity of French associated country imports and UO is the average unitvalue paid by all other developing countries. These values are then summed over the 1962-87period.
4/ The present value In 1987 of all annual gains or losses computed from equation (5). Thepresent value estimate Is based on an assumed discount rate of 8 per cent.
- 35 -
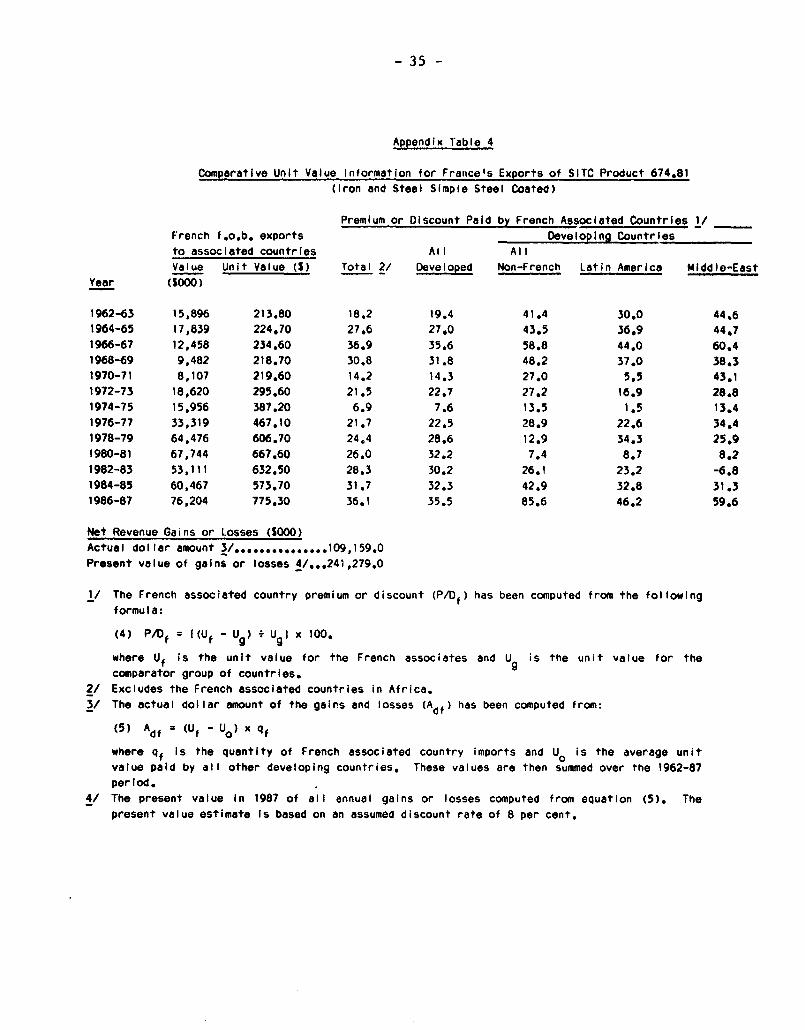
Appendix Table 4
Comparative Unit Value Information for France's Exports of SITC Product 674.81
(iron and Steel Simple Steel Coated)
Premium or Discount Paid by French Associated Countries I/
French f.o.b. exports Developing Countries
to associated countries All All
Value Unit Value (S) Total 2/ Developed Non-French Latin America Middle-East
Year (SOOO)
1962-63 15,896 213.80 18.2 19.4 41.4 30.0 44.6
1964-65 17,839 224.70 27.6 27,0 43.5 36.9 44.7
1966-67 12,458 234.60 36.9 35.6 58.8 44.0 60.4
1968-69 9,482 218.70 30.8 31.8 48.2 37.0 38.3
1970-71 8,107 219.60 14.2 14.3 27.0 5.5 43.1
1972-73 18,620 295.60 21.5 22,7 27.2 16.9 28.8
1974-75 15,956 387.20 6.9 7.6 13.5 1.5 13,4
1976-77 33,319 467.10 21.7 22.5 28.9 22.6 34.4
1978-79 64,476 606.70 24.4 28.6 12.9 34.3 25.9
1980-81 67,744 667.60 26.0 32.2 7.4 8.7 8.2
1982-83 53,111 632.50 28.3 30.2 26.1 23.2 -6.8
1984-85 60,467 573.70 31.7 32.3 42.9 32.8 31.3
1986-87 76,204 775.30 36.1 35.5 85.6 46.2 59.6
Net Revenue Gains or Losses (S000)
Actual dollar amount 3/ ...............109,159.0
Present value of gains or losses 4/ ... 241,279.0
1/ The French associated country premium or discount (P/D) has been computed from the following
formula:
(4) P/Df = H(Uf - Ug) . UgI x 100.
where Uf is the unit value for the French associates and U is the unit value for the
comparator group of countries.
2/ Excludes the French associated countries in Africa.
3/ The actual dollar amount of the gains and losses (Adf) has been computed from:
(5) Adf = (Uf - UO) x qf
where qf Is the quantity of French associated country imports and UO is the average unit
value paid by all other developing countries. These values are then summed over the 1962-87
period.
4/ The present value in 1987 of all annual gains or losses computed from equation (5). The
present value estimate is based on an assumed discount rate of 8 per cent.

- 36 -
Appendix Table 5
Comparative Unit Value Information for France's Exports of SITC Product 673.21(Iron and Steel Simple Steel Bars)
Premium or Discount Paid by French Associated Countries I/French f.o.t. exports Developing Countriesto associated countries All AllValue Unit Value (S) Total 2/ Developed Non-French Latin America Middle-East
Year (S000)
1962-63 18,284 107.50 19.5 14.7 36.3 35.0 35.81964-65 16,348 106.50 13.3 11.6 22.2 19.6 22.01966-67 16,085 100.60 9.4 7.2 19.8 16.7 21.51968-69 15,657 106.30 12.7 12.3 19.9 26.6 19.01970-71 23,419 140.90 9.1 8.0 17.3 17.6 12.51972-73 39,929 174.70 9.7 9.9 15.0 17.2 8.31974-75 102,378 303.20 9.9 7.9 20.0 11.3 16.71976-77 70,506 252.90 -1.7 -6.2 8.9 -10.9 11.41978-79 85,809 341.70 -4.8 -8.9 11.8 -18.8 21.51980-81 58,056 424.50 11.2 12.7 5.3 -8.0 -5.11982-83 41,075 329.50 5.0 0.7 26.9 20.9 8.31984-85 46,755 329.80 14.1 10.9 30.5 36.1 18.51986-87 22,811 445.70 22.4 23.3 11.0 26,7 7.3
Net Revenue Gains or Losses (S000)Actual dollar amount 3/ ......**a...... 78,452.0Present value of gains or losses 4/ ... 216,348.0
i/ The French associated country premium or discount (P/Df) has been computed from the following
formula:
(4) (P/)f a ((Uf - Ug) * U I x 100.
where Uf Is the unit value for the French associates and U is the unit value for thecomparator group of countries.
2/ Excludes the French associated countries in Africa.3/ The actual dollar amount of the gains and losses (Adf) has been computed from:
(5) Af * (Uf - UO) x qf
where qf Is the quantity of French associated country imports and UO is the average unitvalue paid by all other developing countries. These values are then summed over the 1962-87period.
4/ The present value In 1987 of all annual gains or losses computed from equation (5). Thepresent value estimate is based on an assumed discount rate of 8 per cent.
- 37 -
Appendix Table 6
Comparative Unit Value Information for Francets Exports of SITC Pr duct 678.3(Iron and Steel Tube and Pipe)
Premium or Discount Paid by French Associated Countries 1/French f.o.b. exports Developing Countriesto associated countries All All
Value Unit Value (S) Total 2/ Developed Non-French Latin America Middle-EastYear (S000)
1962-63 144,124 263.60 28,3 41.2 24.7 25,8 32.11964-65 50,963 233.40 30.8 34,6 35.0 22.9 42,41966-67 50,592 212.60 21.0 26,9 22.3 6.0 27.61968-69 170,454 173.60 0.5 5.8 -1.0 -16.1 5.01970-71 81,004 299.50 38.8 47,5 10.8 -1.2 29,31972-73 95,939 351,40 26.3 39,1 12.0 -39.1 18.41974-75 74,454 689.10 18.0 36,2 17.3 -9.5 59.81976-77 80,332 668.70 34.8 38.0 9.8 39.4 14.81978-79 93,399 774,10 35.1 26.2 37.1 71,8 10.01980-81 145,206 667.60 6.7 5.8 7.6 32.5 -16.71982-83 86,839 593.20 5,4 -0,3 12,4 42.6 2.71984-85 55,966 648.90 37.5 29.4 33.9 116.4 44.01986-87 31,347 868.90 53.8 18.9 -21.1 -13.0 -59,2
Net Revenue Gains or Losses ($000)
Actual dollar amount 3/.....,,,,,......64,582.0
Present value of gains or losses 4/...192,867.0
1/ The French associated country premium or discount (P/Df) has been computed from the following
formula:
(4) (P/Df C [(Uf -Ug) U I x 100.
where Uf is the unit value for the French associates and U is the unit value for thecomparator group of countries.
2/ Excludes the French associated countries in Africa.
3/ The actual dollar amount of the gains and losses (Adf) has been computed from:
(5) Adf " (Uf - UO) x qf
where qf is the quantity of French associated country imports and UO is the average unitvalue paid by all other developing countries. These values are then summed over the 1962-87period.
4/ The present value In 1987 of all annual gains or losses computed from equation (5). Thepresent value estimate is based on an assumed discount rate of 8 per cent.
- 38 -
Appendix Table 7
Comparative Unit Value Information for France's Exports of SITC Product 674.31(Iron and Steel Simple and Uncoated)
Premium or Discount Paid by French Associated Countries 1/French f.o.b. exports Developing Countriesto associated countries All AllValu Unit Vatue (S) Total 2/ Developed Non-Franch Latin America Middle-East
Year (T000)
1962-63 6,551 153.40 13.9 12.7 26.1 26.2 31.91964-65 7,656 154.60 17.9 16.4 28.9 28.5 31.31966-67 7,154 147.60 16.6 14.0 27.4 30.8 33,91958-69 8,991 152.50 20.6 18.6 31.4 37.7 28.51970-71 12,097 176.30 12.6 13.0 9.1 0.8 18.21972-73 21,878 213.70 11 2 11.2 14.8 -3.3 17.11974-75 36,153 348.80 25.2 26.0 21.3 21.6 16.01976-77 38,701 332.00 13.3 12.4 18.5 20.2 6.61978-79 60,182 376.30 1.4 -2.9 15.2 8.2 10.81980-81 53,172 424.30 5.4 0.2 17.3 7.3 13.91982-83 31,699 374.20 5.1 1.3 17.9 -11.5 11.31984-85 28,173 338.70 2.1 -3.2 14.0 -3.5 2.71986-87 30,647 430.60 1.2 -5.2 30.3 18.8 17.8
Net Revenue Gains or Losses (1000)Actual dollar amount 3/........ 49834.0Present value of gains or losses 4/ ... 128,711.0
1/ The French associated country premium or discount (P/Df) has been computed from the followingformu Ia:
(4) (P/Df a ((Uf - Ug) * U I x 100.
where Uf Is the unit value for the French associates and U is the unit value for thecomparator group of countries.
2/ Excludes the French associated countries in Africa.3/ The actual dollar amount of the gains and losses (Adf) has been computed from:
(5) Adf (Uf - UO) x qf
where qf Is the quantity of French associated country imports and UO Is the average unitvalue paid by all other developing countries. These values are then summed over the 1962-87period.
4/ The present value I, 1987 of all annual gains or losses computed from equation (5). Thepresent value estimate is based on a rssumed discount rate of 8 per cent.
- 39 -
Appendix Table 8
Comparative Unit Value Information for France's Exports of SITC Product 673.41(Iron and Steel Simple Big Sections)
Premium or Discount Paid by French Associated Countries 1/
French f.o.b. exports Developing Countries
to associated countries All All
Value Unit Value (S) Total 2/ Developed Non-French Latin America Middle-East
Year (1000)
1962-63 64,966 113.20 16.8 14.9 25.5 9.8 43.5
1964-65 67,375 115.60 18.4 !7.4 27,4 24.7 35.8
1966-67 65,340 117.30 2,4 19.6 21.1 19.5 36.8
1968-69 65,596 118.10 22.1 18.0 12.0 -6.0 35.4
1970-71 81,555 159.80 18.3 16.7 19.1 21.3 15.8
1972-73 91,647 197.40 17.6 14.4 18.8 20.8 18.5
1974-75 136,924 289.30 17.0 16.5 21.7 11.4 27.0
1976-77 109,855 295.30 14.1 8.f 15.8 S.8 33.5
1978-79 148,854 402.30 12.1 7.4 17.1 -31.3 34.8
1980-81 143,850 450.40 12.3 13.0 1.3 -9.5 4.7
1982-83 163,749 342.50 -7.3 -9.6 -7.7 -2.1 -9.1
1984-85 189,088 289.80 -8.0 -10.4 4.2 -18.7 -2.6
1986-87 78,480 444.60 9.7 4.6 13.3 -23.4 21.3
Net Revenue Gains or Losses (SOOO)
Actual dollar amount 3/................36,961.0
Present value of gains or losses 4/ ... 95,790.0
1/ The French associated country premium or discount (P/Df) has been computed from the following
formula:
(4) (P/Df = ((Uf - Ug) . UgI x 100.
where Uf is the unit value for the French associates and U Is the unit value for the
comparator group of countries.
2/ Excludes the French associated countries In Africa.
3/ The actual dollar amount of the gains and losses (Adf) has been computed from:
(5) Adf a (Uf - UO) x qf
where q, Is the quantity of French associated country Imports and UO is the average unit
value paid by all other developing countries. These values are then summed over the 1962-87
period.4/ The present value In 1987 of all annual gains or losses computed from equation (5). The
present value estimate Is based on an assumed discount rate of 8 per cent.
- 40 -
Appendix Table 9
Comparative Unit Value Information for France's Exports of SITC Product 678.5
(Iron and Steel Simple Tube Fittings)
Premium or Discount Paid by French Associated Countries 1/
Fronch f.o.b. exports Developing Countries
to associated countries All All
Value Unit Value (S) Total 2/ Developed Non-French Latin America Middle-East
Year (S000)
1962-63 5.622 757.20 34.9 44.9 19.5 7.2 44.7
1964-65 5,167 785.50 26.2 31.8 21.1 -14.2 48.8
1966-67 4,956 800.10 11.8 22.6 16.8 1.1 61.3
1968-69 6,151 871.70 7.8 18.1 -3.9 11.8 17.9
1970-71 12,753 1,098.10 11.3 19.4 0.6 -16.9 27.1
1972-73 13,940 1,353.90 14.7 27.0 -1.7 -0.7 18.2
1974-75 38,006 2,380.00 20.9 46.1 -14.0 14.7 7.6
1976-77 40,716 2,166.40 2.0 30.9 -15.6 -8.1 0.6
1978-79 57,435 3,206.20 30.6 63.4 12.1 20.8 16.1
1980-81 72,646 4,212.80 69.6 102.9 44.2 -13.7 47.9
1982-83 48,247 3,219.50 20.3 30.3 2.1 -11.0 9.3
1984-85 44,059 3,277.50 57.9 75.3 0.2 0.8 18.3
1986-87 43,055 5,033.30 51.3 67.5 12.8 -23.4 24.9
Not Revenue Gains or Lossos (S000)
Actual dollar amount 3/.................22,820.0
Preasnt value of gains or losses 4/ ...36,474.0
1/ The Fronch associated country premium or aiscount (P/Df) has been computed from the following
formula:
(4) (P/Df a ((Uf - U8 ) e U Ix 100.
where Uf Is the unit value for the French associates and U is the unit value for the
comparator group of countries.
2/ Excludes the French associated countries In Africa.
3/ The actual dollar amount of the gains and losses (Adf) has been computed from:
(5) Adf * (Uf - UO) x qf
where qf is the quantity of French associated country imports and UO is the average unit
value paid by all other developing countries. These values are then summed over the 1962-87
period.
4/ The present value In 1987 of all annual gains or losses computed from equation (5). The
presont value estimate is based on an assumed discount rate of 8 per cent.
- 41 -
Appendix Table 10
Comparative Unit Value Information for France's Exports of SITC Product 673.11(Iron and Stesl Simple Steel Wire)
Premium or Discount Paid by French Associated Countrles 1/
French f.o.b. exports Developing Countriesto associated countries All AllValue Unit Value (S) Total 2/ Developed Non-French Latin America Middle-East
Year tSOOO )
1962-63 2,735 101,50 13,9 12.9 29.8 31.0 28.01964-65 3,567 104.00 16.5 16.2 23.5 23.1 26.9
1966-67 4,290 99.50 16.8 16.2 30.4 29.7 30.31968-69 2,852 94.40 9.1 8.6 18.1 16.2 14.91970-71 3,314 131.20 7.4 7.9 5.7 0.6 4.21972-73 8,287 161.60 10.0 9.9 10.6 2.5 19.41974-75 15,579 281.70 11.9 11.4 17.4 16.9 20.21976-77 12,656 232,60 -2.6 -3.4 6.1 0.5 6.71978-79 18,918 310.30 2.7 -3.6 23.5 31.5 15.81980-81 21,653 320.90 -3.3 -6.1 7.5 8.4 6.51982-83 31,237 247.40 -13.8 -18.5 5.7 1.0 7.31984-85 15,389 262.40 0.5 -4.4 10.6 3.3 14.11986-87 7,490 314.60 7.2 3.0 31.3 22.3 29.5
Net Revenue Gains or Losses (S000)Actual dollar amount 3/.,,, ......... 16,094.0Present value of gains or losses 4/..42,557.0
I/ The French associated country premium or discount (P/Df) has been computed from the following
formula:
(4) (P/Df = (Uf - U + U I x 100.
where Uf is the unit value for the French associates and U is the unit value for thecomparator group of countries.
2/ Excludes the French associated countries in Africa.3/ The actual dollar amount of the gains and losses (Adf) has been computed from:
(5) Adf = (Uf - U0) x qf
where qf is the quantity of French associated country imports and UO is the average uiitvalue paid by all other developing countries. These values are then summed over the 1962-87
period.
4/ The present value in 1987 of all annual gains or losses camputed from equation (5), Thepresent value estimate is based on an assumed discount rate of 8 per cent.
- 42 -
Appendix Table 11
Comparative Unit Value Information for France's Exports of SITC Product 674.11(iron and Steel Simple Heavy Plate)
Premium or Discount Paid by French Associated Countries I/
French f.o.b. exports Developing Countries
to associated countries Alt AllValue Unit Value (S) Total 2/ Developed Non-French Latin America Middle-East
Year (S000)
1962-63 4,086 125.00 15.7 15.3 11.3 30.9 16.91964-65 4,397 123.90 15.2 15.5 15.5 25.6 13.6
1966-67 3,911 120.60 14.1 14.3 18.3 37.1 -7.6
1968-69 4,283 135.20 23.6 24.7 11.4 21.0 4.11970-71 4,482 171.10 20.2 21.4 14.1 -14.9 25.1
1972-73 7,425 195.50 18.2 19.6 25.0 29.8 4.61974-75 16,539 360.60 17.9 23.8 -9.0 8.6 -4.91976-77 17,198 289.90 13.1 15.9 6.6 13.5 19.41978-79 18,523 404.70 22.8 25.1 19.2 14.2 8.51980-81 21,059 452.40 19.4 23.5 11.9 5.7 15.3
1982-83 13,921 425.50 26.5 30.3 19.4 8.0 7.21984-85 8,518 382.00 13.9 14.5 12.2 32.3 36.11986-87 7,598 486.40 34.5 32.9 52.4 23.4 20.9
Net Revenue Gains or Losses (S000)Actual dollar amount 3/.... ........ 14,536.0Present value of gains or losses 4/ ... 33,022.0
1/ The French associated country premium or discount (P/Df) has been computed from the following
formula:
(4) (P/Df = ((Uf - U%) U U9I x 100.
where Uf is the unit value for the French associates and U is the unit value for thecomparator group of countries.
2/ Excludes the French associated countries in Africa.
3/ The actual dollar amount of the gains and losses (Adf) has been computed from:
(5) Adf (Uf - UO) x qf
where qf Is the quantity of French associated country Imports and UO Is the average unitvalue paid by all other developing countries. These values are then summed over the 1962-87
period.4/ The present value In 1987 of all annual gains or losses computed from equation (5). The
present value estimate is based on an assumed discount rate of 8 per cent.
- 43 -
Appendix Table 12
Comparative Unit Value Information for France's Exports of SITC Product 674.21(Iron and Steel Simple Medium Plato)
Premium or Discount Paid by French Associated Countries 1/French f.o.b. exports Developing Countriesto associated countries All AllValue Unit Value (S) Total 2/ Developed Non-French Latin America Middle-East
Year (S00)
1962-63 1,580 133.40 20.8 20.3 34.0 33.3 34.2
1964-65 2,026 136.20 21.1 21.8 21.3 22.5 27.0
1966-67 1,656 126.90 16.3 17.1 15.9 23.8 15.41968-69 1,471 135.20 12.0 13.9 17.3 40.1 30.51970-71 1,260 166.40 2.6 3.4 5.4 7.2 6.51972-73 2,842 188.90 -1.9 -3.3 9.8 21.4 12.5
1974-75 6,935 354.80 10.3 13.8 5.9 16.8 3.61976-77 7,576 284.30 -11.2 -2.6 -33.7 -40.3 10.61978-79 8,309 384.50 18.8 19.4 19.4 7.4 13.71980-81 8,866 390.60 14.2 11.2 17.8 11.5 15.81982-83 3,939 392.20 18.6 22.5 17.3 13.4 15.4
1984-85 3,437 345.30 14.8 14.2 17.8 20.9 16.81986-87 2,740 533.90 34.3 50.5 24.1 n.a. 5/ 21.3
Not Revenue Gains or Losses ($000)Actual dollar amount 3/...............2,375.0
Present value of gains or losses 4/ ... 7,088.0
I/ The French associated country premium or discount (P/Df) has been computed from the following
formula:
(4) (P/Df = [(Uf - U9) * UgI x 100.
where Uf is the unit value for the French associates and U Is the unit value for thecomparator group of countries.
2/ Excludes the French associated countries in Africa.3/ The actual dollar amount of the gains and losses (Adf) has been computed from:
(5) Adf = (Uf - UO) x qf
where qf Is the quantity of French associated country Imports and U Is the average unit
value paid by all other developing countries. These values are then summed over the 1962-87
period.4/ The present value In 1987 of all annual gains or losses computed from equation (5). The
present value estimate Is based on an assumed discount rate of 8 per cent.5/ SufficIent French exports were not available to Latin America to compute a unit value for the
1986-87 period.
- 44 -
Appendix Table 13
Comparative Unit Value Information for France's Exports of SITC Product 673.51(Iron and Steel Simple Small Sections)
Premium or Discount Paid by French Associated Countries 1/French f.o.b. exports Developing Countriesto associated countries All AllValue Unit Value (S) Total 2/ Developed Non-French Latin America Middle-East
Year (5000)
1962-63 12,085 124.30 22.9 23.5 28.7 19.5 33.81964-65 14,439 124.90 16.0 16.4 31.0 2'.5 25.11966-67 10,408 117.40 19.5 20.7 22.4 8.5 11.71968-69 8,985 117.40 27.5 29.1 27.7 22.0 19.01970-71 8,836 150.40 10.4 11.1 9.1 12.5 0.81972-73 13,697 187.40 9.7 12.1 4.0 11.8 8.31974-75 28,444 313.60 7.3 7.0 2.5 6.3 6.31976-77 19,525 318.10 -9.3 -6.8 -16.1 4.8 -23.71978-79 1,963 358.10 -22.1 -24.5 -1.4 -69.2 1.81980-81 1.721 442.50 -11.4 -1.5 -56.2 -57.2 -55.91982-83 888 465.20 -5.7 2.9 -65.2 -81.7 -67.41984-85 896 385.70 -11.2 -7.6 -45.0 n.o. -2.71986-87 721 467.90 -31.0 -30.4 -78.4 -80.3 -43.5
Net Revenue Gains or Losses (O000)Actual dollar amount 3/............... 898.0Present value of gains or losses 4/ ... 43,908.0
I/ The French associated country premium or discount (P/Df) has been computed from the followingformula:
(4) (P/Df = U(Uf - U9) . UgI x 100.
where Uf Is the unit value for the French associates and U is the unit value for thecomparator group of countries.
2/ Excludes the French associated countries In Africa.3/ The actual dollar amount of the gains and losses (Adf) has been computed from:
(5) A dfC (Uf - UO) x qf
where qf is the quantity of French associated country imports and UO is the average unitvalue paid by all other developing countries. These values are then summed over the 1962-87period.
4/ The present value In 1987 of all annual gains or losses computed from equation (5). Thepresent value estimate Is based on an assumed discount rate of 8 per cent.
PPR Working Paper Series
Contactillift Author for paper
WPS237 The Curricular Content of Primary Aaron Benavot June 1989 C. CristobalEducation in Developing Countries David Kamens 33640
WPS238 The Distributional Consequences of Ehtisham Ahmad August 1989 A. Bhallaa Tax Reform on a VAT for Pakistan Stephen Ludlow 60359
WPS239 The Choice Between Unilateral and Julio Nogues July 1989 S. TorrijosMultilateral Trade Liberalization Strategies 33709
WPS240 The Public Role in Private Ake B' qvist August 1989 A. BhallaPost-Secondary Education: Emmanuel Jimenez 61059A Review of Issues and Options
WPS241 The Effect of Job Training on Ana-Maria Arriagada July 1989 C. CristobalPeruvian Women's Employment and 33640Wages
WPS242 A Multi-Level Model of School Marlaine E. Lockheed July 1989 C. CristobalEffectiveness in a Developing Nicholas T. Longford 33640Country
WPS243 Averting Financial Crisis - Fawzi H. Al-Sultan July 1989 R. SimaanKuwart 72167
WPS244 Do Caribbean Exporters Pay Alexander J. Yeats July 1989 J. EppsHigher Freight Costs? 33710
WPS245 Developing a Partnership of Peter Poole August 1989 S. DavisIndigenous Peoples, Conservationists, 38622and Land Use Planners in Latin America
WPS246 Causes o' Adult Deaths in Richard Hayes July 1989 S. AinsworthDeveloping Countries: A Review Thierry Mertens 31091of Data and Methods Geraldine Lockett
Laura Rodrigues
WPS247 Macroeconomic Policies for Carlos A. Rodriguez August 1989 R. LuzStructural Adjustment 61588
WPS248 Private Investment, Government Mansoor Dailami August 1989 M. RaggambiPolicy, and Foreign Capital in Michael Walton 61696Zimbabwe
WPS249 The Determinants of Hospital Ricardo B.-Dicowsky August 1989 V. IsraelAn Analysis of Ethiopia Dav d W. Dunlop 48121
WPS250 The Baker Plan: Progress, William R. Cline August 1989 S. King-WatsonShortcomings, and Future 33730
WPS251 Patents, Appropriate Technology Ishac Diwan August 1989 S. King-Watsonand North-South Trade Dani Rodrik 33730
PPR Working Paper Series
ContactIile Author Datforpaer
WPS252 Do the Secondary Markets V. A. Hajivassiliou August 1989 S. King-WatsonBelieve in Life After Debt 33730
WPS253 Public Debt, North and South Helmut Reisen August 1989 S. King-Watson33730
WPS254 Future Financing Needs of the lshrat Husain August 1939 S. King-WatsonHighly Indebted Countries Saumya Mitra 33730
WPS255 The External Debt Difficulties of Charles Humphreys August 1989 S. King-WatsonLow Income Africa John Underwood 33730
WPS256 Cash Debt Buybacks and the Sweder van WijnbergenInsurance Value of Reserves
WPS257 Growth, External Debt, and the Sweder van Wijnbergen August 1989 M. BaileyReal Exchange Rate in Mexico 31854
WPS258 Understanding Voluntary L. David Brown September 1989 Z. KranzerOrganizations: Guidelines for David C. Korten 69485Donors
WPS259 Dealing with Debt: The 1930s Barry Eichengreen August 1989 S. King-Watsonand the 1980s Richard Portes 33730
WPS260 Growth, Debt, and Sovereign Jagdeep S. Bhandari August 1989 R. LuzRisk in a Small, Open Economy Nadeem Ul Haque 61588
Stephen J. Turnovsky
WPS261 Inflation, External Debt and Sweder van Wijnbergen August 1989 M. BaileyFinancial Sector Reform: A Roberto Rocha 31854Quantitative Approach to Ritu AnandConsistent Fiscal Policy
WPS262 Adjustment and External Shocks Dermot McAleese August 1989 M. Divinoin Ireland F. Desmond McCarthy 33739
WPS263 How Has Instabiiity in World Peter Hazell August 1989 C. SpoonerMarkets Affected Agricultural Mauricio Jaramillo 30464Export Producers in Developing Amy WilliamsonCountries
WPS264 Two Irrigation Systems in Herve Plusquellec September 1989 H. PlusquellecColombia: Their Performance 30348and Transfer of Management toUsers' Associations
WPS265 Do African Countries Pay More Alexander Yeats September 1989 J. Eppsfor Imports? Yes 33710