Embed Size (px)
Citation preview
INDUSTRY AND ENERGY DEPARTMENT WORKING PAPERINDUSTRY SERIES PAPER No. 2
Emerging Patterns of InternationalCompetition in SelectedIndustrial Product Groups
February 1989
TherWorld Bank Industry and Energy Department, PPR
Pub
lic D
iscl
osur
e A
utho
rized
Pub
lic D
iscl
osur
e A
utho
rized
Pub
lic D
iscl
osur
e A
utho
rized
Pub
lic D
iscl
osur
e A
utho
rized

INDUSTRY SERIES PAPERS
No. 1 Japanese Direct Foreign Investment: Patterns and Implications forDeveloping Countries, February 1989
No. 3 Changing Firm Boundaries: Analysis of Technology-SharingAlliances, February 1989
EMERGING PATITERNS OF INTERNATIONAL
COMPETITION IN SELECTED
INDUSTRIAL PRODUCT GROUPS
Ashoka Mody, The World Bank
David Wheeler, Boston University
February, 1, 1989
A P S T R A C T
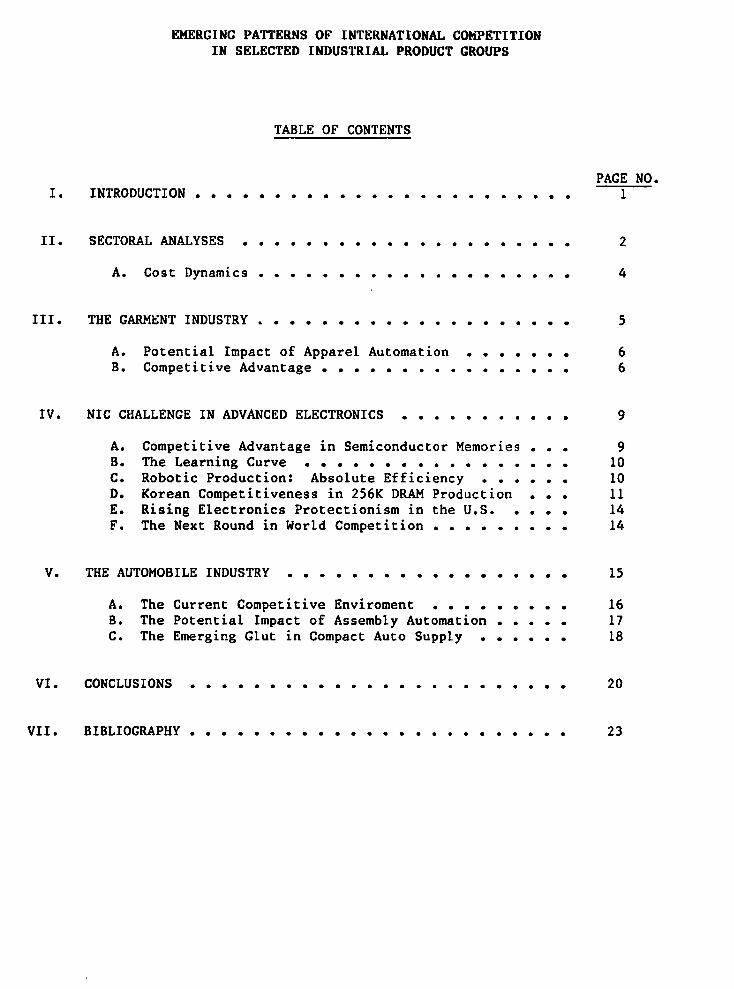
This paper examines the patterns of emerging internationalcompetitive dynamics in representative industrial products. Sources ofthese dynamics are, on the one hand, the increasing importance of newproduct and process technologies, and on the other, the emergence ofseveral large low wage countries as forces in international trade. We haveinvestigated the possible impact of these forces on the internationaldistribution of production and sales by studying three industry groups:garments, semiconductors, and automobilee.
Our study suggests that productivity and competitiveness will beincreased substantially by the appropriate use of new microelectronicstechnologies. The impact of microelectronics varies by subsectors,products, and processes. Such variations have major implications for thepresent and future location of production sites. In particular, the seriesof processes employed to produce a product are being affected quitedifferently by the ongoing technical change. Hence there are strongmotivations to split production sites for different process segments.
The subsector case studies evoke several common themes. Theavailability of microelectronics technologies has potentially improved thecompetitiveness of the advanced industrial countries. Some surprisingdevelopments may soon occur in subsectors whose maturity and traditionallabor intensity have consigned them to "sunset" status in the minds of manyobservers.
Another theme which emerges repeatedly is the importance ofstrategic behavior by firms and governments. Particularly in automobilesand semiconductors, incumbent firms are using a variety of strategies toinfluence new entry. The trend towards greater consolidation in thegarment industry may lead to similar behavior in that industry in thefuture. Rapid shifts in currency regimes, quota arrangements (implicit orexplicit), and protectionist sentiments can have short-run effects whichdominate the influence of other factors.
Middle income countries face a special dilemma since at thepresent time they have neither cheap robots nor low cost labor. Inresponse, some NIC firms are complementing offshore movement with largeinvestments to upgrade their technological capabilities. Our analysisshows that low wage countries also will need to upgrade technologicalabsorption, diffusion and human capabilities. It is critical that alldeveloping countries step up their information gathering on tech:uologytrends. Our report demonstrates that semi-automated processes are alreadydominating traditional methods in key products and processes.
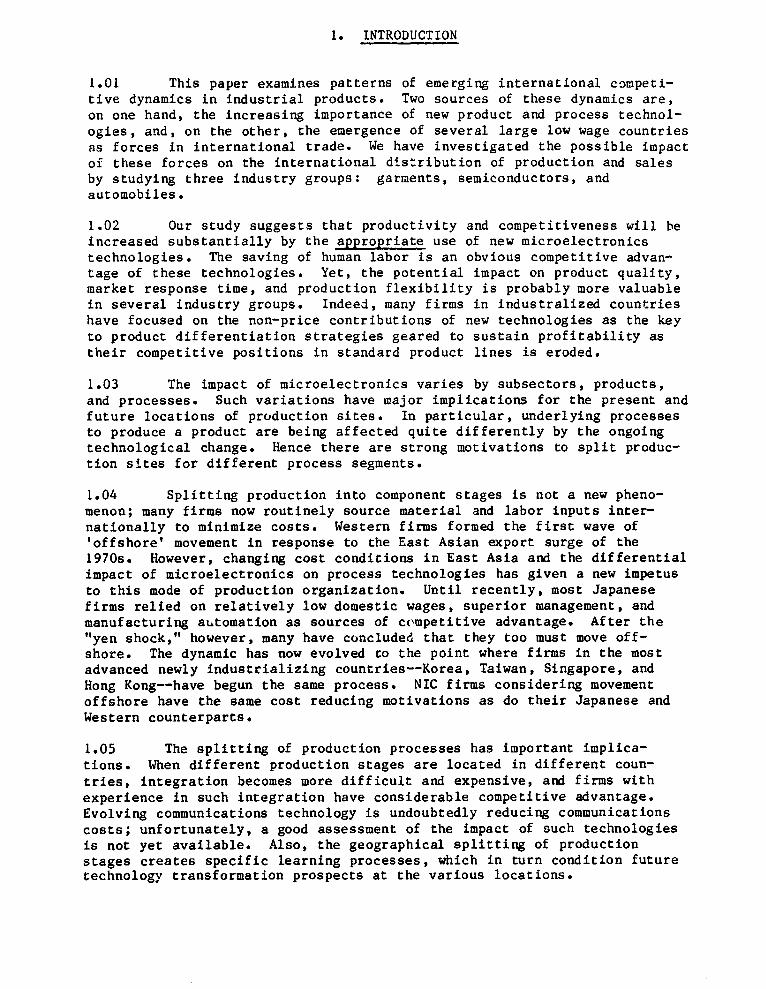
EMERGING PATTERNS OF INTERNATIONAL COMPETITIONIN SELECTED INDUSTRIAL PRODUCT GROUPS
TABLE OF CONTENTS
PAGE NO.I. INTRODUCTION . . . . . . . . . . . . . . . . . . . . . . . . 1
II. SECTORAL ANALYSES . . . . . . . . . . . . . . . . . . . . . 2
A. Cost Dynamics . . . . . . . . . . 4
III. THE GARMENT INDUSTRY . . . . . . . . . . . . . . . . . . . . 5
A. Potential Impact of Apparel Automation . . . . . . . 6B. Competitive Advantage . . . . . . . . . . . . . . . . 6
IV. NIC CHALLENGE IN ADVANCED ELECTRONICS . . . . . . . . . . . 9
A. Competitive Advantage in Semiconductor Memories . . . 9B. The Learning Curve . . . . . . . . . . . . . . . . . 10C. Robotic Production: Absolute Efficiency . . . . . . 10D. Korean Competitiveness in 256K DRAM Production . . . 11E. Rising Electronics Protectionism in the U.S. . . . . 14F. The Next Round in World Competition . . . . . . . . . 14
V. THE AUTOMOBILE INDUSTRY .................. 15
A. The Current Competitive Enviroment . . e . . . . . . 16B. The Potential Impact of Assembly Automation . . . . . 17C. The Emerging Glut in Compact Auto Supply . . . . . . 18
VI. CONCLUSIONS . . . . . . . . . . . . . . . . . . . . . . . . 20
VII. BIBLIOGRAPHY . . . . . . . . . . . . . . . . . . . . . . . . 23
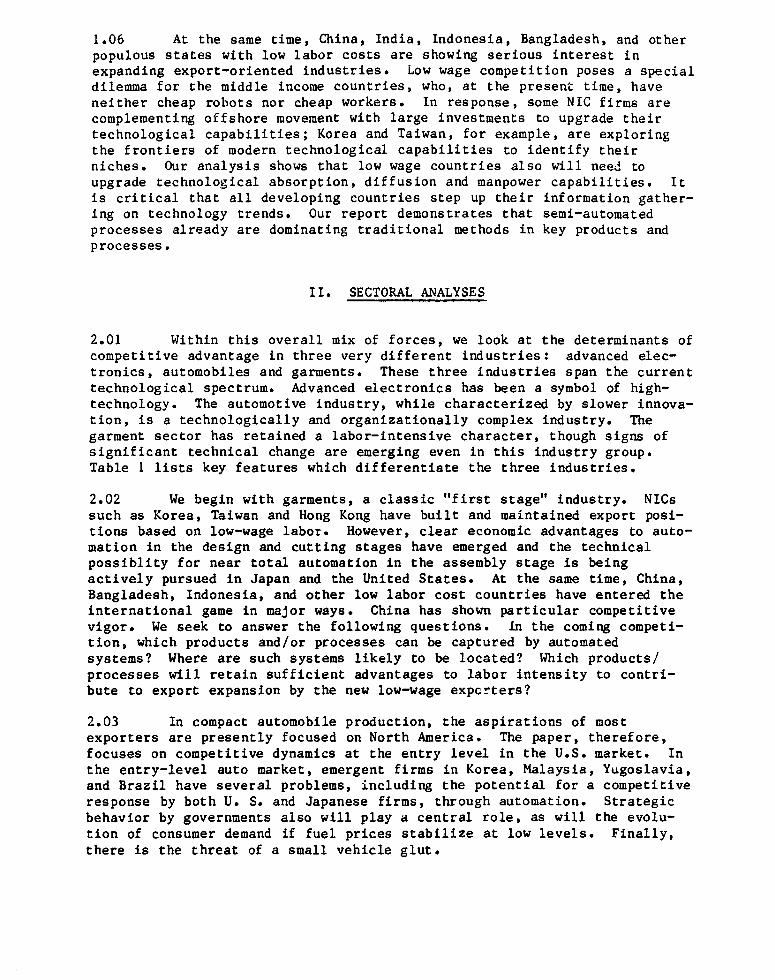
1. INTRODUCTION
1.01 This paper examines patterns of emerging international competi-tive dynamics in industrial products. Two sources of these dynamics are,on one hand, the increasing importance of new product and process technol-ogies, and, on the other, the emergence of several large low wage countriesas forces in international trade. We have investigated the possible impactof these forces on the international distribution of production and salesby studying three industry groups: garments, semiconductors, andautomobiles.
1.02 Our study suggests that productivity and competitiveness will beincreased substantially by the appropriate use of new microelectronicstechnologies. The saving of human labor is an obvious competitive advan-tage of these technologies. Yet, the potential impact on product quality,market response time, and production flexibility is probably more valuablein several industry groups. Indeed, many firms in industralized countrieshave focused on the non-price contributions of new technologies as the keyto product differentiation strategies geared to sustain profitability astheir competitive positions in standard product lines is eroded.
1.03 The impact of microelectronics varies by subsectors, products,and processes. Such variations have major implications for the present andfuture locations of production sites. In particular, underlying processesto produce a product are being affected quite differently by the ongoingtechnological change. Hence there are strong motivations to split produc-tion sites for different process segments.
1.04 Splitting production into component stages is not a new pheno-menon; many firms now routinely source material and labor inputs inter-nationally to minimize costs. Western firms formed the first wave of'offshore' movement in response to the East Asian export surge of the1970s. However, changing cost conditions in East Asia and the differentialimpact of microelectronics on process technologies has given a new impetusto this mode of production organization. Until recently, most Japanesefirms relied on relatively low domestic wages, superior management, andmanufacturing automation as sources of cvmpetitive advantage. After the"yen shock," however, many have concluded that they too must move off-shore. The dynamic has now evolved to the point where firms in the mostadvanced newly industrializing countries--Korea, Taiwan, Singapore, andHong Kong--have begun the same process. NIC firms considering movementoffshore have the same cost reducing motivations as do their Japanese andWestern counterparts.
1.05 The splitting of production processes has important implica-tions. When different production stages are located in different coun-tries, integration becomes more difficult and expensive, and firms withexperience in such integration have considerable competitive advantage.Evolving communications technology is undoubtedly reducing communicationscosts; unfortunately, a good assessment of the impact of such technologiesis not yet available. Also, the geographical splitting of productionstages creates specific learning processes, which in turn condition futuretechnology transformation prospects at the various locations.
1.06 At the same time, China, India, Indonesia, Bangladesh, and otherpopulous states with low labor costs are showing serious interest inexpanding export-oriented industries. Low wage competition poses a specialdilemma for the middle income countries, who, at the present time, haveneither cheap robots nor cheap workers. In response, some NIC firms arecomplementing offshore movement with large investments to upgrade theirtechnological capabilities; Korea and Taiwan, for example, are exploringthe frontiers of modern technological capabilities to identify theirniches. Our analysis shows that low wage countries also will need toupgrade technological absorption, diffusion and manpower capabilities. Itis critical that all developing countries step up their information gather-ing on technology trends. Our report demonstrates that semi-automatedprocesses already are dominating traditional methods in key products andprocesses.
II. SECTORAL ANALYSES
2.01 Within this overall mix of forces, we look at the determinants ofcompetitive advantage in three very different industries: advanced elec-tronics, automobiles and garments. These three industries span the currenttechnological spectrum. Advanced electronics has been a symbol of high-technology. The automotive industry, while characterized by slower innova-tion, is a technologically and organizationally complex industry. Thegarment sector has retained a labor-intensive character, though signs ofsignificant technical change are emerging even in this industry group.Table I lists key features which differentiate the three industries.
2.02 We begin with garments, a classic "first stage" industry. NICssuch as Korea, Taiwan and Hong Kong have built and maintained export posi-tions based on low-wage labor. However, clear economic advantages to auto-mation in the design and cutting stages have emerged and the technicalpossiblity for near total automation in the assembly stage is beingactively pursued in Japan and the United States. At the same time, China,Bangladesh, Indonesia, and other low labor cost countries have entered theinternational game in major ways. China has shown particular competitivevigor. We seek to answer the following questions. In the coming competi-tion, which products and/or processes can be captured by automatedsystems? Where are such systems likely to be located? Which products/processes will retain sufficient advantages to labor intensity to contri-bute to export expansion by the new low-wage expcrters?
2.03 In compact automobile production, the aspirations of mostexporters are presently focused on North America. The paper, therefore,focuses on competitive dynamics at the entry level in the U.S. market. Inthe entry-level auto market, emergent firms in Korea, Malaysia, Yugoslavia,and Brazil have several problems, including the potential for a competitiveresponse by both U. S. and Japanese firms, through automation. Strategicbehavior by governments also will play a central role, as will the evolu-tion of consumer demand if fuel prices stabilize at low levels. Finally,there is the threat of a small vehicle glut.
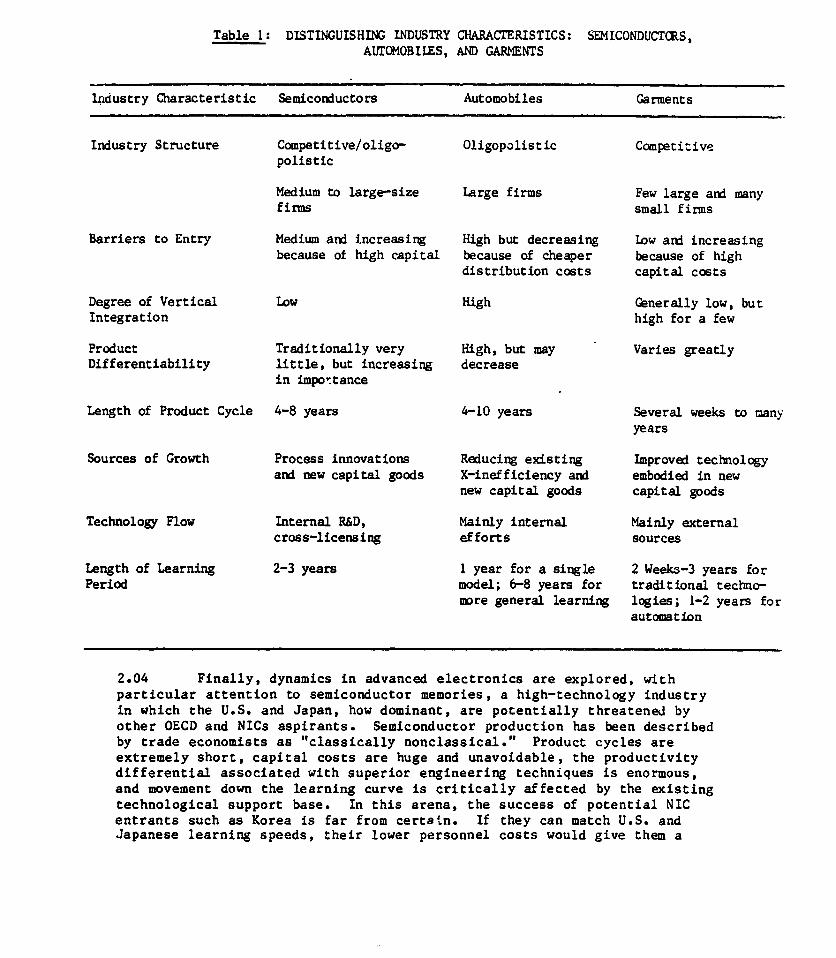
Table 1: DISTINGUISHING INDUSTRY CHARACrERISTICS: SEMICONDUCTCRS,AUrOMOBILES, AND GARMENTS
industry Characteristic Semiconductors Automobiles Garments
Industry Structure Competitive/oligo- Oligopolistic Competitivepolistic
Medium to large-size Large firms Few large and manyfirms small firms
Barriers to Entry Medium and increasing High but decreasing Low and increasingbecause of high capital because of cheaper because of high
distribution costs capital costs
Degree of Vertical Low High Generally low, butIntegration high for a few
Product Traditionally very High, but may Varies greatlyDifferentiability little, but increasing decrease
in impontance
Length of Product Cycle 4-8 years 4-10 years Several weeks to manyyears
Sources of Growth Process innovations Reducing existing Improved technologyand new capital goods X-inefficiency and embodied in new
new capital goods capital goods
Technology Flow Internal R&D, Mainly internal Mainly externalcross-licensing efforts sources
Length of Learning 2-3 years 1 year for a single 2 Weeks-3 years forPeriod model; 6-8 years for traditional techno-
more general learning logies; 1-2 years forautomation
2.04 Finally, dynamics in advanced electronics are explored, withparticular attention to semiconductor memories, a high-technology industryin which the U.S. and Japan, how dominant, are potentially threatened byother OECD and NICs aspirants. Semiconductor production has been describedby trade economists as "classically nonclassical." Product cycles areextremely short, capital costs are huge and unavoidable, the productivitydifferential associated with superior engineering techniques is enormous,and movement down the learning curve is critically affected by the existingtechnological support base. In this arena, the success of potential NICentrants such as Korea is far from certain. If they can match U.S. andJapanese learning speeds, their lower personnel costs would give them a
competitive advantage. Will their limited technological base allow them tomove down the learning curve fast enough to justify the enormous invest-ments which must be undertaken? With the advent of advanced automation andeven steeper learning curves in the U.S. and Japan, is NIC commitment toadvanced semiconductors too risky at this stage?
2.05 Cost dynamics. The three subsectoral analyses have made use of aquantitative model which combines engineering and economic data. Thedesign of an appropriate model reflects recognition of certain hardtruths. First, conventional econometric approaches have been abandoned.With robotic factories scarcely i. istence, no established databaseexists, and econometric estimation of production functions is impossible.Secor.ely, the assumption that broad product classes are meaningful aggre-gates had to be dropped. To learn about automation, one has to speak tothe engineers directly involved in introducing these processes. Engineerstalk not about making garments but cain talk all. day about producing men'slong-sleeve cotton dress shirts or women's high style printed polyesterdresses; particular garments are produced by processes so different thatthey can be regarded as economically 'similar' only to consumers.
2.06 Engineers als'o are uncomfortable with the notion of smoothsubstitution possibilities between labor and capital. In the real world ofmanufacturing, production proceeds in stages; each can be performed with avariety of possible technologies, with human workers and machines sharingtasks in different measure. At each process stage, technologies areclustered around capital/labor ratios roughly appropriate to differingeconomic circumstances. Once a basic process technology is chosen, thesubstitution process narrows.
2.07 We have constructed models for selected industries which aretightly focused on products, stages of production, and technologies. Whilelaying the foundation for such models is time-consuming, the engineeringapproach yields significant benefits. First, when production is modeled asa series of processes, the true international division of labor can bereplicated in many product lines. For example, it is quite common forgarments to be designed in one country, the fabric marked and cut in asecond, sewn in a third, and sold in a fourth. Secondly, the division ofproduction into stages allows for explicit consideration of differing ratesof technological progress. Fabrics are now routinely patterned, marked,and cut by automated systems; sewing has remained a hard, expensive automa-tion problem and labor-intensive sewing still dominates. Until recently,the same asymmetry between pre-assembly and assembly activities character-ized semiconductor memory production. In automobile assembly plants,painting and welding are now routinely done by robots but intricate compo-nent installation tasks require extremely expensive machines. By breakingthe treatment of production into process stages, it has been possible tomodel asymmetry.
2.08 Finally, the focus on engineering specifications enables us tobring the best engineering knowledge and experience to bear on centralquestions. During the next decade, what automation possibilities willexist, how much labor can be replaced, and at what cost? For each product,
p ess specifications have been broken down by stage of production. Ateach stage, *a variety of existing technologies and the next robotic tech-nology phase all are analyzed. In each case, all major input requirementsand costs are specified. The model is dynamic, providing engineeringestimates of process-specific learning speeds. The model also accounts forextra resources required for learning to be accelerated. The model has anexplicit locational compcnent, allowing production to be broken intostages; the model considers the relative economic efficiency of all exist-ing and arriving technologies, for each stage, at alternative productionsites. Differential transport costs are calculated. The model keeps timeas well as cost accounts; keeping track of time in production, in transitbetween process stages, and in inventory storage. The time-accountingfeature is important since the ability for rapid production response isincreasing as a source of competitive advantage. One advantage of advancedtechnologies is their rapid response capabilities relative to labor-intensive options.
2.09 In each subsector analysis, the most applicable capabilities ofthe model are used. In garments, for example, strong emphasis is given tolocation-specific costs by production stage. In garments and semiconduc-tors, we consider costs associated with multi-stage production undertakenwith alternative technologies at one site. For automobiles, we consideralternative technologies and costs for integrated final assembly plants.In all cases we allow for differential learning speeds.
III. THE GARMENT INDUSTRY
3.01 Two major forces are promoting dramatic change in internationaldivision of labor of garment manufacture. NIC producers now are threatenedby nascent garment operations of the Asian population giants, China, India,Indonesia, Bangladesh. While this wage-based competition is emerging,sophisticated microelectronics based systems for garment production andmarketing also are being introduced in the OECD countries. New technolo-gies are providing major possibilities for cost reeuction, particularly inthe pre-assembly stage. The new technologies also permit significantreductions in process time and response to demand changes. The appeal ofq!:ck market response has stimulated a growing tendency to restrict off-s.nore locations to nearby areas. The rate of new technology adoption isstill relatively slow, partly since the garment industry consists mainly ofsmall firms. However, several firms are consolidating and moving toconsolidate, moving to scales appropriate for automated manufacturing.
3.02 In important recent work, Hoffman and Rush conclude that micro-electronics technology will have an overwhelming influence on garmentmanufacturing (Hoffman, 1985 and Hoffman and Rush, 1987). Their extensivefield work documents that significant productivity gains are possible forlarge-scale OECD firms which automate. An analysis of capabilities andcosts of the new technologies indicates that adoption would improvecompetitive prospects of OECD firms vis-a-vis Korean, Taiwanese and HongKong competitors. Our analysis also points to the significance of the
- 6 -
large scale market entry by the low-wage population giants of Asia. SinceU.S. producers have been locating labor-intensive operations in low-wagecountries, new entrants are not entirely unwelcome. China is feared bymany and rightly so, as our modeling exercise will demonstrate. Incontrast, low-wage sites in the Caribbean, Mexico, and Central America cansupport U.S. strategies with domestic pre-assembly automation, low wageassembly, and quick response to market demand. For Taiwan and Korea,however, this new development implies a challenge to competitive status.
3.0 Potential Impc.ct of Apparel Automation. In garment production,th. potential for automation has increased rapidly in recent years.Important characteristics of t;'F new technologies are: (a) the rapidlyincreasing cost of capital equipment; (b) the sharp decline in labor inputfor given output; (c) the lower skills of operators; (d) the shorter train-ing period required of operators; (e) the new skills required software andhardware development and maintenance; and (f) increasing quality and effi-ciency possible with better use of materials, less work in progress andfewer rejects.
3.04 Garment production can be divided into three stages: pre-assembly (patterning, grading, marking), assembly (sewing), and post-assembly (finishing, inspection, packing). ln many cases, these threeproduction steps are accomplished in differen'. countries. Each productionstep also can be performed at varying levels of labor intensity. Garmentsdiffer greatly in Eheir quality, complexity and ease of assembly. Acarefully analysis of garment production therefore requires considerationof various product types. This study incorporated six garment types, withdifferent production economics reflected in widely differing import pene-tration levels in the U.S. market. The garments chosen for study were:men's slacks, men's single-needle long sleeve dress shirts, men's highstyle knit pullover shirts, women's high style printed polyester dresses,women's high style printed skirts, and women's low style knit pullovershirts.
3.05 Our results show that, in the domestic U.S. context, robotictechnology is the optimal technology for all garments and for textiles.Semi-automatic production is optimal elsewhere for most garment production,however, manual technology may be optimal for men's and women's knitshirts, particularly in China. Little difference exists in optimal tech-nology between countries such as Korea and Jamaica. In garments, a majoremployer of semi-skilled operators in developing countries, our resultsindicate that manual, labor-intensive methods seem to have lost the costadvantage in several products. The resultant decline in labor use could bequite dramatic. The number of operators is approximately halved at eachmove from manual to semi-automated and from semi-automated to robotic.While the number of engineers may increase with these transitions thereduction in all other categories of workers for a given output clearly iscause for concern.
3.06 Competitive Advantage. Three-stage production technologies havebeen specified for the six garment products studied. We have estimatedthroughput times, buffer stock delays, transport costs for air and sea
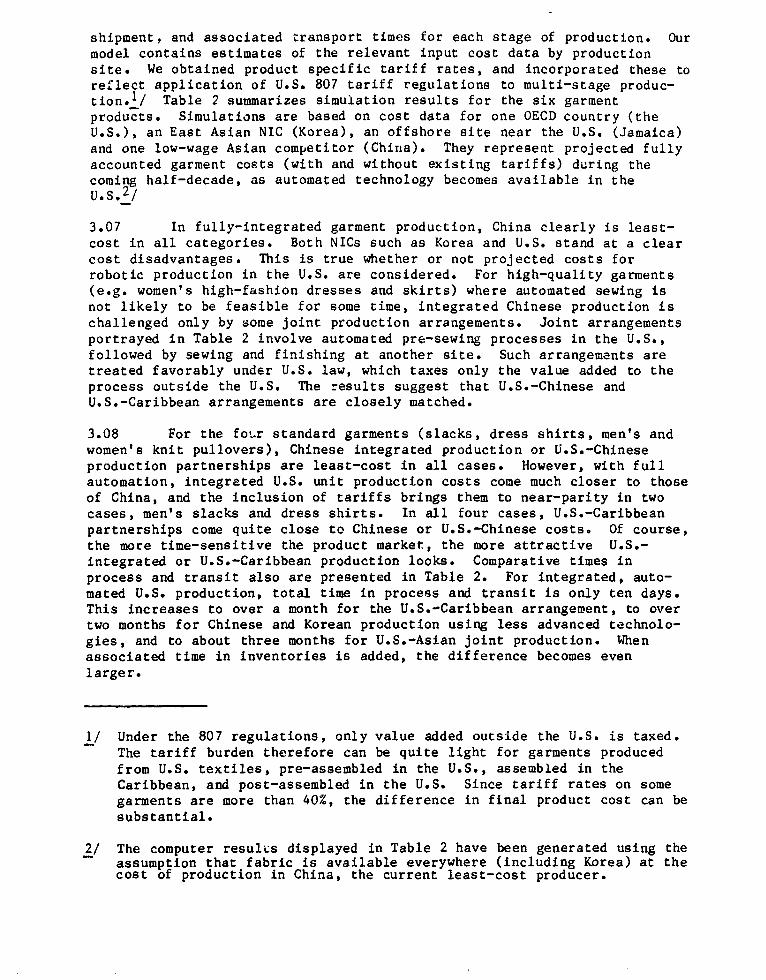
shipment, and associated transport times for each stage of production. Ourmodel contains estimates of the relevant input cost data by productionsite. We obtained product specific tariff rates, and incorporated these toreflect application of U.S. 807 tariff regulations to multi-stage produc-tion.l/ Table 2 summarizes simulation results for the six garmentproducts. Simulations are based on cost data for one OECD country (theU.S.), an East Asian NIC (Korea), an offshore site near the U.S. (Jamaica)and one low-wage Asian competitor (China). They represent projected fullyaccounted garment costs (with and without existing tariffs) during thecoming half-decade, as automated technology becomes available in theU.S. 2 /
3.07 In fully-integrated garment production, China clearly is least-cost in all categories. Both NICs such as Korea and U.S. stand at a clearcost disadvantages. This is true whether or not projected costs forrobotic production in the U.S. are considered. For high-quality garments(e.g. women's high-fashion dresses and skirts) where automated sewing isnot likely to be feasible for some time, integrated Chinese production ischallenged only by some joint production arrangements. Joint arrangementsportrayed in Table 2 involve automated pre-sewing processes in the U.S.,followed by sewing and finishing at another site. Such arrangements aretreated favorably under U.S. law, which taxes only the value added to theprocess outside the U.S. The results suggest that U.S.-Chinese andU.S.-Caribbean arrangements are closely matched.
3.08 For the four standard garments (slacks, dress shirts, men's andwomen's knit pullovers), Chinese integrated production or U.S.-Chineseproduction partnerships are least-cost in all cases. However, with fullautomation, integrated U.S. unit production costs come much closer to thoseof China, and the inclusion of tariffs brings them to near-parity in twocases, men's slacks and dress shirts. In all four cases, U.S.-Caribbeanpartnerships come quite close to Chinese or U.S.-Chinese costs. Of course,the more time-sensitive the product market, the more attractive U.S.-integrated or U.S.-Caribbean production looks. Comparative times inprocess and transit also are presented in Table 2. For integrated, auto-mated U.S. production, total time in process and transit is only ten days.This increases to over a month for the U.S.-Caribbean arrangement, to overtwo months for Chinese and Korean production using less advanced technolo-gies, and to about three months for U.S.-Asian joint production. Whenassociated time in inventories is added, the difference becomes evenlarger.
1/ Under the 807 regulations, only value added outside the U.S. is taxed.The tariff burden therefore can be quite light for garments producedfrom U.S. textiles, pre-assembled in the U.S., assembled in theCaribbean, and post-assembled in the U.S. Since tariff rates on somegarments are more than 40%, the difference in final product cost can besubstantial.
2/ The computer results displayed in Table 2 have been generated using theassumption that fabric is available everywhere (including Korea) at thecost of production in China, the current least-cost producer.
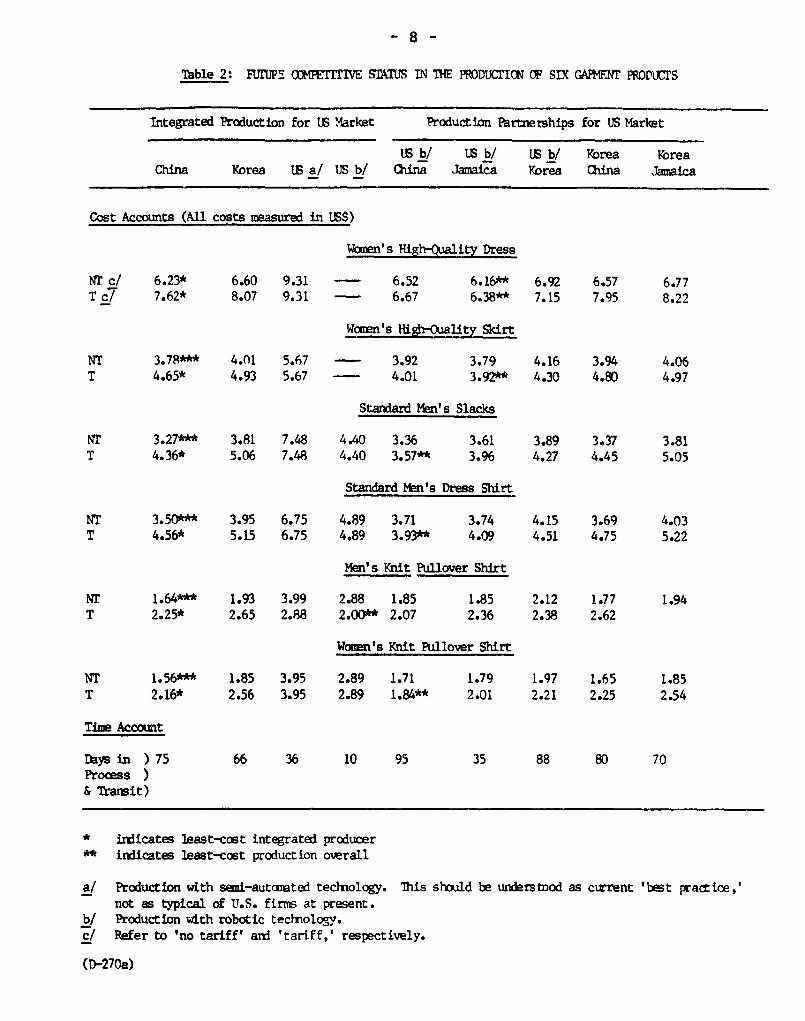
Table 2: FUIUP! (OMPET=ITVE STMIJS IN THE PR)D1MrNCT OF SIX GAR4ENT PRD1UCTS
Integrated Production for US Market Production Partnerships for US Market
Lr b/ US b/ US b/ Korea KoreaChina Korea US a/ US b/ Ciina Jamaica Korea China Jamaica
Cost Accounts (All costs measured in US$)
Women's High-Quality Dress
NT c/ 6.23* 6.60 9.31 - 6.52 6.16** 6.92 6.57 6.77T c/ 7.62* 8.07 9.31 - 6.67 6.38** 7.15 7.95 8.22
Women's HighrOuality Skirt
NT 3.78*** 4.01 5.67 - 3.92 3.79 4.16 3.94 4.06T 4.65* 4.93 5.67 - 4.01 3.92** 4.30 4.80 4.97
Standard Mmn's Slacks
NT 3.27*** 3.81 7.48 4.40 3.36 3.61 3.89 3.37 3.81T 4.36* 5.06 7.48 4.40 3.57** 3.96 4.27 4.45 5.05
Standard Men's Dress Shirt
NT 3.50*** 3.95 6.75 4.89 3.71 3.74 4.15 3.69 4.03T 4.56* 5.15 6.75 4.89 3.93** 4.09 4.51 4.75 5.22
Men's Knit Pullover Shirt
Nr 1.64*** 1.93 3.99 2.88 1.85 1.85 2.12 1.77 1.94T 2.25* 2.65 2.88 2.00** 2.07 2.36 2.38 2.62
Women's Knit Pullover Shirt
NT 1.56*** 1.85 3.95 2.89 1.71 1.79 1.97 1.65 1.85T 2.16* 2.56 3.95 2.89 1.84** 2.01 2.21 2.25 2.54
Time Account
Days in )75 66 36 10 95 35 88 80 70Proces )& Transit)
* indicates least-cost integrated producer** indicates let-cost production overall
a/ Production with semi-automated technology. This should be understood as current 'best practice,'not as typical of U.S. firms at present.
b/ Production with robotic technology.c/ Refer to 'no tariff' and 'tariFf,' respectively.
(D-270a)
3.09 To summarize, results suggest substantial changes in worldgarment competition during the next decade. In standard garment lines, theera of the NICs seems to be ebbing. The emerging race is between micro-electronics production and very low-wage labor in China, the Caribbean, andelsewhere. At prevailing levels of protection, automation appears competi-tive. Without protection, low-wage workers win. In high-quality garments,production by China or U.S.-Chinese and U.S.-Caribbean partnerships lookscompetitive.
3.10 The prospect of declining NIC competitiveness does not implyclear sailing for China and other low-wage countries. In high-qualitygarments, U.S.-Caribbean partnerships produce comparable costs with thoseof Asian producers, at shorter response times. While China and otherlow-wage states are formidable competitors at present, they will havedifficult choices soon. Technology will move, requiring that low-wagecountries make technological transitions of their own. To the extent thatcurrent relatively labor intensive methods are quite different from neweremerging technologies, transitions could be painful, unless human andphysical capital development moves are made new.
IV. NIC CHALLENGE IN ADVANCED ELECTRONICS
4.01 The main competitive assets of industrial coun.ries are relativedepth in technology, capital, and human resources. NICs which might becapable of mounting major challenges to the incumbents include Brazil,South Korea, Taiwan, and India. These countries all have a relativelydeveloped industrial base, a large stock of educated manpower, a commitmentto R&D and a national policy of promoting the electronics industry. Theyhave, however, pursued very different approaches to electronicsdevelopment.3!
4.02 Korea and Taiwan have established their international competi-tiveness in consumer electronics. Other developing countries seeking tomake similar moves need to deal with critical issues. Two questions bear aremarkable similarity to those confronted in the garment industry: (a) willa product-sequencing strategy in electronics work now, or has assemblyautomation already stripped away the key first rung previously climbed byKorea and Taiwan? and (b) given the rapid rise of protectionism in theWest, can countries expect to rely on needed export volumes to move inelectronics? The electronics industry is large and complex. This paperwill concentrate on an analysis of Korea's current efforts to reach ahigher, more technology intensive stage by attaining internationalcompetitiveness in semiconductor memories.
4.03 Competitive Advantage in Semiconductor Memories. Using a modelsimilar to the one employed for garments, we have simulated Korea's
3/ For an analysis of electronics industries in the NICs, see Mody (1986;1987).
- 10 -
competitive prospects in advanced memory production, particularly 256KDRAMs. Analysis suggests that these prospects turn crucially on threefactors: The slope of the industry learning curve in Korea; the speed withwhich automated systems are brought onstream by the U.S. and Japanesemajors; changes in the politics of protection and international finance.
The Learn 'ng Curve
4.04 In the semiconductor industry, much of the technological learningis embodied in successive generations of capital goods which are used toetch ever-finer circuit designs on silicon and other materials. Thisembodied learning is available to all who can afford the capital goods:Several major vendors of capital equipment exist, and the market seems tobe quite competitive. More important from the developmental perspective isthe technical progress that occurs after the equipment is installed. Thesemiconductor industry has a very pronounced learning curve. For estab-lished producers, at least, the costs of producing a new generation ofproduct typically fall sharply with experience, and the speed of such adecline determines the profits and hence the competitive dynamics.
4.05 Michael Spence (1981) has argued that reduction of costs vialearning will have its most significant impact when the speed of learningis neither too fast nor too slow. When learning rates are either very fastor very slow, the cost differentials between industry leaders and followerswill be relatively small and hence the industry will be fairly competi-tive. Other things equal, then, the steep learning curve in the semi-conductor would seem to reduce Korea's disadvantage as a latecomer. Otherthings, of course, are not equal. First, the starting position on thelearning curve is undoubtedly affected by prior experience. For a newproducer, the starting point is undoubtedly higher. Secondly, learningspeeds mean very little by themselves. They must be seen in relation tothe planning horizon or the length of the product cycle. In the case ofthe semiconductor industry, product cycles are also short: new productshave displaced old products at very short intervals.
Robotic Production: Absolute Efficiency?
4.06 Our simulation results for 64K and 256K dynamic random accessmemories (DRAMs) provide dramatic evidence that absolute efficiencycharacterizes the new automated technologies in semiconductor production.As long as one country has the resources to move to large-scale automatedor memory production, factor cost edvantages will not salvage the positionof its competitors. For Korea (and, indeed, for all developing countrieswhich are much poorer than Korea), these numbers suggest that internationalcompetition in advanced electronics may force an unpleasant choice. Tocompete at all, national producers will have to adopt relatively capital-intensive technologies. Obviously, major sources of employment for theunskilled or semiskilled will have to be found elsewhere, since even theemployment which is generated by capital-intensive technologies tends to beheavily weighted toward the upper end of the skill spectrum.
- 11 -
Korean Competitiveness in 256K DRAM Production
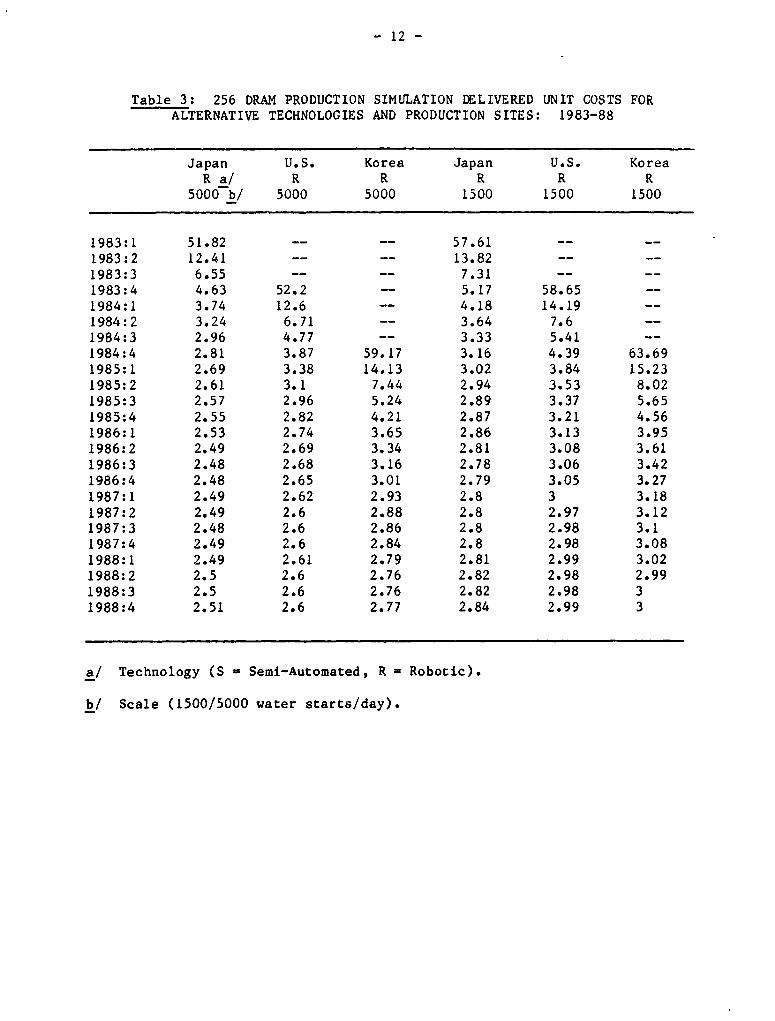
4.07 Our simulations for 256K DRAM production show that relativestartup dates, learning rates, and degree of automation have major dynamicimpacts on competitiveness in advanced electronics production. In two ofthese dimensions (startup date; degree of automation), Korean firms enteredthe 256K market with clear disadvantages in comparison with U.S. andJapanese firms. Measures of relative learning rates remain problema-tic,4 / so we have made the conservative case (for Korean prospects, thatis) that Korean firms have learning rates as fast as those of U.S. firms.
4.08 By the end of 1984, Japanese firms were fully ramped up for 256Kproduction and output was still growing by nearly 100% per quarter. U.S.firms began about 4 quarters behind (Japanese firms actually began shippingin sampling quantities in mid-1983), but by the end of 1984 they were alsoshowing signs of full preparation for mass production. The Koreans begansampling six quarters later. By the fast-moving standards of DRAM produc-tion, Korean firms were very late starters in 256K production. Our resultsfor 256K DRAMs are presented in Table 3. They represent an analysis of thememory market before the recent upsurge in U.S. electronics protectionism.As such, they represent a counterfactual: what probably would have
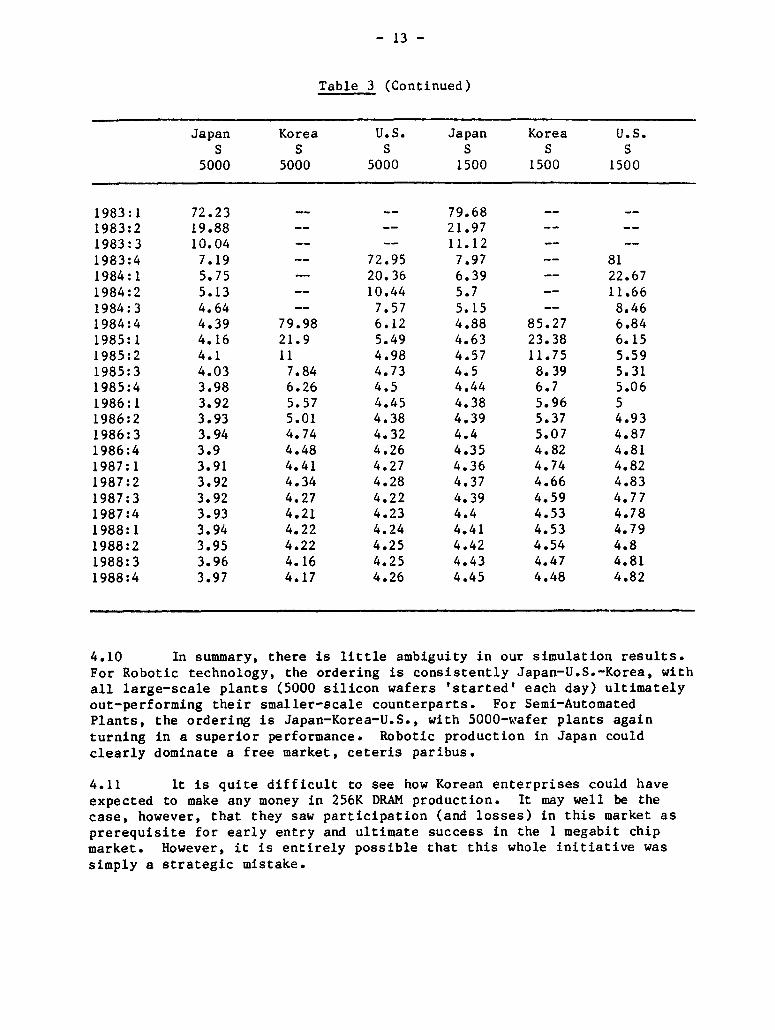
happened if the U.S. government had not intervened actively in the market.In the simulation, the Korean plants come onstream eight quarters into thesimulation, and their unit costs remain considerably higher than those ofthe U.S. and Japanese plants for much of the period of simulation. In thecase of 1500-start Semi-Automated plants, for example, Korean deliveredunit costs do not drop below those of the U.S. until the first quarter of1987.5/ The 256K market 'peaks' by 1987, and 1 megabit DRAMs startappearing in sampling quantities. By 1987, most of the profits in 256Kproduction have long since been made.
4.09 In a free market for chips, an unfortunate conclusion for Koreawould have followed. Early-entering Japanese and U.S. firms made money inthe first few years, exploiting relatively inelastic demand. By the firstquarter of 1986, only Robotic plants would still have been making profits;by early 1987, all profits would basically have evaporated. For Semi-Automatic plants, the denouement would have come much earlier.6/
4/ The Koreans insist that their learning curves are as steep asanybody's: Their plants are manned by some of their best high schoolgraduates while this is far from being the case in the U.S. and(increasingly) Japan. Their argument is reasonable, but we have noindependent confirmation. In addition, the education of operators isonly one determinant of learning speed. The education and experienceof process engineers is probably more critical, and here the U.S. andJapan retain a clear edge.
5/ The number of 'starts' is a measure of the scale of operation.
6/ Persistent loud complaints in the U.S. industry about inabflity to"make any money in 256K DRAM production seem to have re tiectedreality, if our numbers are roughly correct.
- 12 -
Table 3: 256 DRAM PRODUCTION SIMULATION DELIVERED UNIT COSTS FORALTERNATIVE TECHNOLOGIES AND PRODUCTION SITES: 1983-88
Japan U.S. Korea Japan U.S. KoreaR a/ R R R R R
5000 b/ 5000 5000 1500 1500 1500
1983:1 51.82 -- -- 57.61 -- --
1983:2 12.41 -- -- 13.82 -- --
1983:3 6.55 -- -- 7.31 -- --
1983:4 4.63 52.2 5.17 58.65 --
1984:1 3.74 12.6 -- 4.18 14.19 --
1984:2 3.24 6.71 -- 3.64 7.6 --
1984:3 2.96 4.77 -- 3.33 5.41 --
1984:4 2.81 3.87 59.17 3.16 4.39 63.691985:1 2.69 3.38 14.13 3.02 3.84 15.231985:2 2.61 3.1 7.44 2.94 3.53 8.021985:3 2.57 2.96 5.24 2.89 3.37 5.651985:4 2.55 2.82 4.21 2.87 3.21 4.561986:1 2.53 2.74 3.65 2.86 3.13 3.951986:2 2.49 2.69 3.34 2.81 3.08 3.611986:3 2.48 2.68 3.16 2.78 3.06 3.421986:4 2.48 2.65 3.01 2.79 3.05 3.271987:1 2.49 2.62 2.93 2.8 3 3.181987:2 2.49 2.6 2.88 2.8 2.97 3.121987:3 2.48 2.6 2.86 2.8 2.98 3.11987:4 2.49 2.6 2.84 2.8 2.98 3.081988:1 2.49 2.61 2.79 2.81 2.99 3.021988:2 2.5 2.6 2.76 2.82 2.98 2.991988:3 2.5 2.6 2.76 2.82 2.98 31988:4 2.51 2.6 2.77 2.84 2.99 3
a/ Technology (S - Semi-Automated, R = Robotic).
b/ Scale (1500/5000 water starts/day).
- 13 -
Table 3 (Continued)
Japan Korea U.S. Japan Korea U.S.S S S S S S
5000 5000 5000 1500 1500 1500
1983:1 72.23 -- -- 79.68 -- --
1983:2 19.88 -- -- 21.97 -- --
1983:3 10.04 -- -- 11.12 -- --
1983:4 7.19 -- 72.95 7.97 -- 811984:1 5.75 20.36 6.39 -- 22.671984:2 5.13 -- 10.44 5.7 -- 11.661984:3 4.64 -- 7.57 5.15 -- 8.461984:4 4.39 79.98 6.12 4.88 85.27 6.841985:1 4.16 21.9 5.49 4.63 23.38 6.151985:2 4.1 11 4.98 4.57 11.75 5.591985:3 4.03 7.84 4.73 4.5 8.39 5.311985:4 3.98 6.26 4.5 4.44 6.7 5.061986:1 3.92 5.57 4.45 4.38 5.96 51986:2 3.93 5.01 4.38 4.39 5.37 4.931986:3 3.94 4.74 4.32 4.4 5.07 4.871986:4 3.9 4.48 4.26 4.35 4.82 4.811987:1 3.91 4.41 4.27 4.36 4.74 4.821987:2 3.92 4.34 4.28 4.37 4.66 4.831987:3 3.92 4.27 4.22 4.39 4.59 4.771987:4 3.93 4.21 4.23 4.4 4.53 4.781988:1 3.94 4.22 4.24 4.41 4.53 4.791988:2 3.95 4.22 4.25 4.42 4.54 4.81988:3 3.96 4.16 4.25 4.43 4.47 4.811988:4 3.97 4.17 4.26 4.45 4.48 4.82
4.10 In summary, there is little ambiguity in our simulation results.For Robotic technology, the ordering is consistently Japan-U.S.-Korea, withall large-scale plants (5000 silicon wafers 'started' each day) ultimatelyout-performing their smaller-scale counterparts. For Semi-AutomatedPlants, the ordering is Japan-Korea-U.S., with 5000-wafer plants againturning in a superior performance. Robotic production in Japan couldclearly dominate a free market, ceteris paribus.
4.11 It is quite difficult to see how Korean enterprises could haveexpected to make any money in 256K DRAM production. It may well be thecase, however, that they saw participation (and losses) in this market asprerequisite for early entry and ultimate success in the 1 megabit chipmarket. However, it is entirely possible that this whole initiative wassimply a strategic mistake.
- 14 -
Rising Electronics Protectionism in the U.S.
4.12 During the past few years, the semiconductor memory business mayhave set a new standard for turbulence. The demand for semiconductormemories fell by about 25%, from $3.5 billion in 1984 to $2.6 billion in1985. The spectacular successes of 1984 had induced very heavy capitalinvestment. The prospects seemed good even to Korean conglomerates, whichannounced investments of over $1 billion. The sharp fall in demand in theface of growing production capacity led to dramatic price declines, even bythe standards of the semiconductor industry.
4.13 At this point, the major U.S. electronics firms abandoned theirhistorical stance in favor of free trade. Since 1985, "dumping" chargeshave been filed against a considerable variety of Japanese semiconductorproducts. In Japan, MITI was not slow to read the handwriting on the wall:Sharp production cutbacks were instituted and hefty price increasesensued. Four major results are observable so far, only one of them favora-ble for the long-term prospects of the U.S. electronics industry: (1)After the price increases, U.S. firms could make some profit in memoryproduction again; (2) The Japanese firms could make even higher profits,since their costs were lower. They are sinking these profits into next-generation products; (3) Small/midsize U.S. consumers of chips, principallycomputer companies, have lost substantial competitive advantage becausevertically-integrated Japanese firms can source chips at production cost;(4) The Koreans have been given a reprieve which the open market wouldnever have allowed them. At current prices, they are now far enough downthe learning curve to make money themselves in 256K chips.The Next Round in World Competition
4.14 While clearly, the relentless drive towards greater miniaturiza-tion will continue to have some of its past momentum, new forces are emerg-ing which are likely to change the pattern and speed of technical change.The forces include: (1) movement towards greater service and customerorientation; (2) higher prices for technology sales; (3) greater emphasison strategic alliances for technology and market sharing; and (4) greaterU.S. government involvement in protecting the U.S. industry. We havealready discussed the dumping issue and shall focus on the other threedimensions of change. The nature of competition in the semiconductorindustry was shaped during the last decade mainly by the aggressive pricecompetition of the Japanese firms. In response to their eroding marketshares, the U.S. firms have sought new ways of competing. First, there isgreeter emphasis on customization: the use of worldwide networking andcomputing capability to tailor products and services to the requirements ofindividual customers. It is hoped that high profits can be generated insuch proprietary arrangements.
4.15 Secondly, technology royalties are being hiked in order tocapitalize on past and present ability to innovate. Texas Instruments, forexample, has recently won some critical patent lawsuits which forceJapanese and Korean memory chip producers to pay much higher royalties orface closure of the U.S. market. TI has, in addition, filed a welter ofpatents on 4 M chip designs worldwide and will be in a strong position toextract royalties in the next chip market as well.
- 15 -
4.16 Finally, there is a strong trend towards forming strategicalliances. In the age of exploding information, a curious phenomenon hasoccurred. Exploitation of information requires greater specialization. Afirm operating in a particular market segment now has to devote greaterresources to deepening and broadening its technological information, lest acompetitor discover and exploit a competitive weapon. However, in seekingdeeper knowledge in its area of specialization, a firm acquires certaingeneral principles of operation which can be exploited across differentsectors. This provides the motivation for forming alliances. Thusincreasing information has had the effect of increasing the economies ofscale in the use of information. While the various antidumping suits havegot tremendous publicity, it is our judgment that the competitive changesbeing brought about by service differentiation, rising technology pricesand formation of strategic alliances are perhaps the more critical ones.An analysis of strategic alliances is presented in Mody (1988). A compa-nion paper on intellectual property is being prepared in IENIN.
V. THE AUTOMOBILE INDUSTRY
5.01 In broad outline, the emerging dynamics in the world automotiveindustry look similar to those in electronics. Three features of thecurrent competitive environment are particularly noteworthy. First, micro-electronics are having a powerful impact on production technologies in theindustrial countries. Possibilities for labor-saving mass production orflexible custom assembly are expanding rapidly. Secondly, product innova-tion continues at a rapid pace. Microelectronics and new materials arebeginning to have a pronounced impact on automotive products. Some currentmodels incorporate high-strength plastic body components and radically newtransmission and steering systems. The next few years will witnessreplacement of metal by ceramics in major engine components; replacement oftraditional wiring by single-cable communications systems linking smartpower chips; and the advent of computer mapping and first-generationvehicle guidance systems. Third, the world industry is rapidly evolvingtoward a new structure in the wake of Japan's meteoric rise, a reactivesurge of automotive protectionism in the West, and unprecedented recentswings in currency values. Competition is becoming more pronounced at allquality levels; companies are searching for positions of comparativeadvantage in complex, interlocking international alliances. Much greaterout-sourcing of components has been a prominent feature of the relentlesspressure to cut costs. In some cases, the new locational economics aredictating the return of components production to automated facilities nearassembly plants. Where automation remains too costly, new componentssuppliers in the NICs and developing countries are being offeredunprecedented opportunities for market expansion.
- 16 -
The Current Competitive Environment
5.02 In this section, we cannot hope to provide a full analysis ofemerging developments in the world's biggest industry.7 / Our major focuswill be on the economics of motor vehicle assembly as practiced by incum-bents (exemplified by U.S. companies), innovators (Japanese firms), and newentrants (exemplified by Korean firms). We will pay particular attentionto the future prospects of the Koreans, who have become aggressiveexporters during the past two years. As independent producers or contractsuppliers to U.S. firms, they have joined other NIC producers in the rushfor North American market share.
5.03 The competitive success of Korea and the other NICs in thisventure is far from assured. As in the case of garments, microelectronicsraises the prospect of "de-maturing" in automobile production--a radicalrestructuring of the industry. The difference lies in the greater likeli-hood of such restructuring. U.S. auto firms obviously have the money andthe will to undertake it. Many of their products have remained shelteredfrom foreign competition by the North American preference for large cars.Substantial market power, low fuel prices, a rising yen, and steady GNPgrowth in the U.S. have combined to yield big profits in recent years. TheBig Three have had the option of investing heavily in automation frominternal funds and have chosen to do so.
5.04 It should also be noted that the U.S. producers have been badlyshaken by Japanese successes in the small and mid-size markets. With therapid buildup of Japanese production capacity in the U.S., the domesticindustry has realized substantial gains in quality and efficiency.Finally, the U.S. auto producers are unlike many garment firms in thedegree of their historic commitment to manufacturing itself. Aside from arecent move toward purchase of small import units to protect their entry-level market share, they have not shared many garment firms' apparentinclination to favor merchandising over domestic production.
5.05 The stage therefore seems to be set for a period of rapidtechnological change and intense competition in the North American automarket. Our analysis of competitive prospects has yielded the followingconclusions.
(1) Because of the technological and organizational learning acquiredin developing other export products, Korea as an exporter of assembledvehicles and major mechanical components will not experience significantcompetition from low-labor cost countries such as China and India. Amongthe newly-industrializing countries, only Brazil is somewhat plausible as acompetitor.
7/ According to one recent estimate (Taylor, 1987), 175 automakersproduced over 45 million cars, trucks, and buses last year. Totalsales were approximately $384 billion--2.1% of world GNP.
- 17 -
(2) Microelectronics-induced automation, consumer product tailoring,and shortened response times have enhanced the prospect that U.S. manufac-turers can continue earning comfortable margins on larger vehicles duringthe next few years. Current joint production experience with Toyota in theNUMMI operation bodes well for compact auto production as well. Thus, thepresent move toward sourcing entry-level units from Korea and elsewhere maybe designed simply to buy time until newly-automated assembly operationscome onstream in the late 1980's.
(3) Whether or not U.S. firms become cost-competitive with newtechnology and restructuring, it is certain that Japanese firms are capableof producing compact units in North America at low cost. Thus, Koreanprospects for profitable sales depend heavily on strategic decisions by theJapanese. They are currently launching a new series of upscale products.It remains to be seen, however, whether they have any attention of cedingentry-level sales to the Koreans.
5.06 At present, Korea is enjoying competitive success in the U.S.subcompact market. While Korea is engaged in intensive learning abouttechnologies that are more or less "conventional," however, a new learningcurve is emerging in North America. The major Japanese and American firmsare all continuing massive investments in factory automation. Korea'sfortunes as an auto exporter in the next decade will be heavily affected bythe success of these investments.
The Potential Impact of Assembly Automation
5.07 In this section we use our dynamic costing model, auto technologyvectors produced by our research, and present and anticipated input pricesto explore the prospects of Korea's auto producers in the North Americanauto market during the coming decade. Our modeling approach for autos issimilar to that for semiconductors in the sense that we assume vertically-integrated production operations within each competitor country. Threecountries are considered: Korea, the U.S., and Japan. As before, threetechnologies (Manual, Semi-Automated, and Robotic) are specified, andresulting unit costs are calculated using data on local conditions andinput costs. For Robotic technology, we have assumed startup in 1988 inboth Japan and the U.S. We would expect productivity to be low initiallybut by the early 1990s, major producers should be well down the curve.
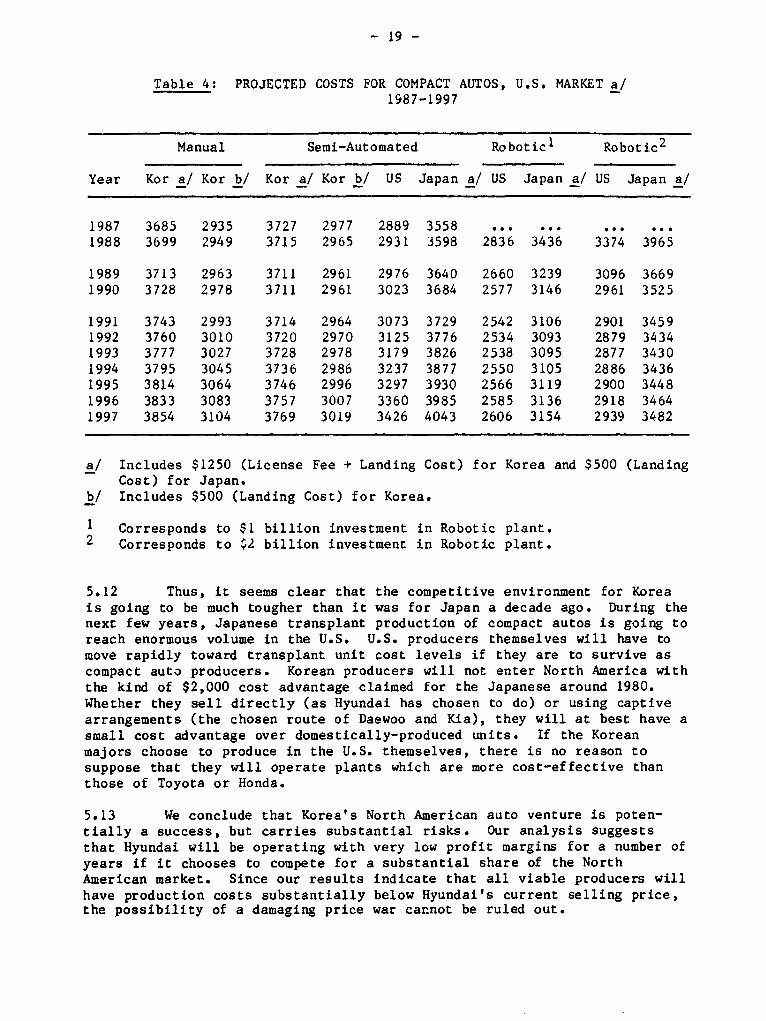
5.08 Table 4 portrays a representative set of results.8 / Theyprovide some insight into the probable future of competition in the NorthAmerican compact automobile market. The first column depicts unit costsfor Manual production technology in Korea from 1987 to 1997. Koreanproducers continue down the learning curve at a rapid pace, but increasedefficiency is balanced by rapidly-rising Korean wages. The next threecolumns forecast unit costs for Semi-Automated technology in Korea, theU.S., and Japan. The U.S. column provides a forecast of unit productioncosts in North America, but with technology currently employed by Toyota,
8/ These data take account of the Japanese "yen shock" and the Korean"wage shock" of late 1987.
- 18 -
Nissan, Honda, and other Japanese firms. Since this technology is mature,residual learning curve movement is not sufficient to overcome the impactof continuing wage inflation. Costs rise in consequence through 1995. InJapan, the unit cost with Semi-Automated technology also rises as wageinflation overcomes diminishing returns to learning. Since Semi-Automatedtechnology is currently operating in both North America and Japan, thesenumbers provide a framework within which the current competitive status ofKorean producers can be assessed. Two additional factors have to beconsidered before a consideration of true comparative cost in the U.S.market can be undertaken. First, technology license fees are an importantiactor for the Koreans. The Hyundai Excel, for example, is produced underagreements wich Mitsubishi which involve a fee of approximately 15% of thepurchase price. Since the lowest-priced Excel is currently selling for$4995 in the U.S., the implied license fee is $750. The full cost oftransportation from Korea and Japan to the U.S. can be estimated at $500.Therefore, $1250 and $500 are added to the unit cost of automobiles shippedfrom Korea and Japan for simulated comparison with U.S.-produced *mits.
5.09 The simulation results suggest that although Korean autos sold inthe U.S. are cur'ently more costly than their U.S. or Japanese counterpartsproduced by Semi-Automated technology, they become less costly as thedecade draws to a close. Korean producers continue down the learningcurve, while mature technologies in the U.S. and Japan cannot supportenough additional learning to overcome input price inflation. By 1995,Korean autos are least-cost if license fees are assumed to be terminated.Finally, we consider the possibility of Robotic production in the U.S. andJapan under two assumptions. Estimated U.S. market costs for $1 billionand $2 billion Robotic investmeuits are presented in the last four columnsof Table 4. On the assumption viable automated plants can start down thelearning curve by 1988, and that such plants cost $1 billion, Korea'scompetitive prospects become dimmer. Under continued license fee payment,Korean landed costs are actually above those characterizing both U.S. andJapanese robotic production. By 1995, U.S. Robotic production has unitcosts more than $1100 below those of Korean imports.
5.10 Robotically-produced Japanese imports are also lower than Koreanimports in cost. However, if we change the assumed cost of a Robotic plantto $2 billion and assume suspension of license fees, Korea's prospectsimprove. In the mid-1990s, U.S. Robotic production arrives at a unit costalmost identical to that of Korean imports. Japanese Robotic productionappears less competitive.
The Emerging Glut in Compact Auto Supply
5.11 Our estimates suggest that Korean automobiles are likely toremain in the competitive cost range in the U.S. market, even if Roboticproduction is successfully undertaken. Any optimism produced by theseresults should be tempered, however, by a fundamental point. As we notedpreviously, entry-level competition is now considered strategic by allmajor players in the auto market.
- 19 -
Table 4: PROJECTED COSTS FOR COMPACT AUTOS, U.S. MARKET a/1987-1997
Manual Semi-Automated Robotic1 Robotic2
Year Kor a/ Kor b/ Kor a/ Kor b/ US Japan a/ US Japan a/ US Japan a/
1987 3685 2935 3727 2977 2889 3558 ... ... ...
1988 3699 2949 3715 2965 2931 3598 2836 3436 3374 3965
1989 3713 2963 3711 2961 2976 3640 2660 3239 3096 36691990 3728 2978 3711 2961 3023 3684 2577 3146 2961 3525
1991 3743 2993 3714 2964 3073 3729 2542 3106 2901 34591992 3760 3010 3720 2970 3125 3776 2534 3093 2879 34341993 3777 3027 3728 2978 3179 3826 2538 3095 2877 34301994 3795 3045 3736 2986 3237 3877 2550 3105 2886 34361995 3814 3064 3746 2996 3297 3930 2566 3119 2900 34481996 3833 3083 3757 3007 3360 3985 2585 3136 2918 34641997 3854 3104 3769 3019 3426 4043 2606 3154 2939 3482
a/ Includes $1250 (License Fee + Landing Cost) for Korea and $500 (LandingCost) for Japan.
b/ Includes $500 (Landing Cost) for Korea.
1 Corresponds to $1 billion investment in Robotic plant.2 Corresponds to Y2 billion investment in Robotic plant.
5.12 Thus, it seems clear that the competitive environment for Koreais going to be much tougher than it was for Japan a decade ago. During thenext few years, Japanese transplant production of compact autos is going toreach enormous volume in the U.S. U.S. producers themselves will have tomove rapidly toward transplant unit cost levels if they are to survive ascompact auto producers. Korean producers will not enter North America withthe kind of $2,000 cost advantage claimed for the Japanese around 1980.Whether they sell directly (as Hyundai has chosen to do) or using captivearrangements (the chosen route of Daewoo and Kia), they will at best have asmall cost advantage over domestically-produced units. If the Koreanmajors choose to produce in the U.S. themselves, there is no reason tosuppose that they will operate plants which are more cost-effective thanthose of Toyota or Honda.
5.13 We conclude that Korea's North American auto venture is poten-tially a success, but carries substantial risks. Our analysis suggeststhat Hyundai will be operating with very low profit margins for a number ofyears if it chooses to compete for a substantial share of the NorthAmerican market. Since our results indicate that all viable producers willhave production costs substantially below Hyundai's current selling price,the possibility of a damaging price war cannot be ruled out.
- 20 -
VI. CONCLUSIONS
6.01 The case studies evoke several common themes. The availabilityof microelectronics technologies has potentially improved the competitive-ness of the advanced industrial countries. Particularly in cases wherethese countries have a significant lead in the adoption of such technolo-gies, they will be able to produce at lower costs and higher quality levelsfor markets with high income elasticities.
6.02 Microelectronics reduces the need for direct labor, and this isan obvious advantage. However, in some cases the advantage stems from amore fundamental source: the absolute superiority of the technology. Eventhough the new technologies are more capital intensive, they use lesscapital and labor per unit of output. They also create increased possi-bilities for product differentiation.
6.03 Our results suggest that the new technologies may profoundlyaffect existing patterns of trade. Their productive potential will shoreup the competitive positions of Western firms in many markets. Somesurprising developments may soon occur in sectors whose maturity andtraditional labor intensity have consigned them to "sunset" status in theminds of many observers. Particularly in automobiles and semiconductors,incumbent firms are using a variety of strategies to influence new entry.The trend toward greater consolidation in the garment industry may lead tosimilar behavior in that industry in the future. The major example fromour case studies is that of garments. In garments, automation will soonprogress to the point where U.S. firms, under existing tariff legislation,will have the potential for a return to profitable production in manyproduct lines which have been lost to East Asian competitors. For apparelproducts or production stages which remain resistant to full automation,U.S. producers will have the option of establishing process links withCaribbean, Mexican, or Central American sites where rapid market responsetimes are preserved.
6.04 Similarly, under the influence of rapid progress n microelectro-nics, automobile production has the potential for rejoining semiconductorsas an "immature" industrial process. Computer assisted design (CAD) andcomputer integrated manufacturing (CIM), along with newly integratedcommunications and information links between sellers and suppliers, haveallowed technologically progressive manufacturers in the OECD markets tolaun..h themselves down new organizational learning curves. As a result,our results suggest that robotic production of compact automobiles in NorthAmerica could be cost-corpetitive with current Korean offerings by theearly 1990s. In fact, the results show that Japanese production usingsemi-automated technology is already so efficient that Korean producerswill be at a slight cost disadvantage until they come somewhat further downthe learning curve.
6.05 Another theme which emerges repeatedly is the importance ofstrategic behavior by firms and governments. Rapid shifts in currencyregimes, quota arrangements (implicit or explicit), and protectionist
- 21 -
sentiment can have short-run effects which dominate the influence of otherfactors. We have documented their impact in all three case studies.
6.06 The recent success of the NICs in international competition seemsepitomized by the Korean experience. Korea's commitment to competition inall three sectors considered suggests the ambition to become a full playerin international industrial society more rapidly than any previous aspir-ant. Undeniably, the results to date have been impressive. Korea has beenstrong as a garment producer; it has enjoyed preliminary success in theexport of a first-generation compact automobile to the North Americanmarket; and it has become one of the few economies with strong competencein the fabrication of basic semiconductor memories. An uncritical look atthe current level of activity would certainly suggest a rosy outlook.Unfortunately, this outlook is not supported by an examination of currenttrends in technology, world labor supply, and strategic behavior by govern-ments and dominant firms in the OECD countries.
6.07 The challenge to Korea and the other NICs comes from all sides:advanced industrial nations, new aspirants to middle-income NIC status(Thailani and Malaysia, for example), and the low wage countries. The newaspirants have lower labor costs than Korea and Taiwan but already see theneed to move up scale technologically. How successful they will be in thisattempt at technological leapfrogging is difficult to assess at present.Much will depend on the provision of the type of infrastructure that Koreaand Taiwan are trying to develop. While cheaper information capital movescomparative advantage in the direction of OECD producers in certain productlines, cheaper basic labor moves it toward the Asian population giants inothers. At remarkably proximate points in time, all of the present andfuture population giants of Asia--China, India, Bangladesh, 7akistan, andIndonesia--have become much more interested in world market competition.All have an abundance of labor which is far cheaper than in the NICs or inthe countries we have labelled 'new aspirants'; and the two largest, Chinaand India, have ample reservoirs of well-trained, low-wage engineering andtechnical workers as well.
6.08 In some subsectors of garment production, it is currentlyapparent that only a worldwide system of quotas and restrictions preventsChinese producers from eliminating all competitors, including those in theU.S. and East Asia. Here, the NICs suffer from a double disadvantage. Insectors where labor-intensive modes at Chinese labor costs dominate allcurrently-foreseeable automated technologies, U.S. producers will undoubt-edly be shored up by entry restrictions. The fortunes of Korean andTaiwanese producers, on the other hand, will be subject to the whims of theU.S. political system. If entry quotas for garments are generalized, forexample, they will have a difficult time withstanding competition fromChina and other low wage producers.
6.09 The problem of strategic interaction is in fact much broader thensimple protectionism in the U.S. garment sector. The Japanese seementirely serious about protecting their hard-won competitive advantage insemiconductor memories and automobiles. Semiconductor memories and compactautomobiles are produced by a relative handful of large, politically-powerful firms. They have all been badly bruised by East Asian market
22 -
entrants in the past decade, and they are now inclined to take entry-levelcompetition much more seriously than in the past. Their limited politicalleverage, combined with the impact of microelectronics on cost-competitive-ness and the presence of the Japanese as powerful players, suggests thatthe NICs' major hope lies in rapid growth of the U.S. market. If market
size is relatively fixed (or even receding, as is possible in compactautomobiles), the struggle by the dominant firms to retain share willundoubtedly spell a sustained period of nearly-profitless production for
firms located in the NICs. Under such circumstances, a policy of promotingstrategic alliances with incumbent U.S. or Japanese firms might serve theirinterests better than direct competition. In the United States, there is
currently much discussion of the prospect of a "shrinking middle" in theincome distribution, as the advent of cheap information capital reduces the
demand for painstakingly-developed industrial skills. Our analysissuggests that similar trends are emerging internationally, and that theNICs may now find the period of their meteoric rise into the internationalmiddle class succeeded by an era in which growth expectations become more
modest.
6.10 Which is not to say, of course, that any economic catastrophelooms on the horizon. The NICs have developed their industrial and
technical resources so rapidly in recent years that their success hasbecome a model for many developing societies. They will undoubtedlycontinue to build a solid future as major industrial states with steadily
deepening human resources and in dustrial/technical capabilities.
- 23 -
BIBLIOGRAPHY
Hoffman, Kurt, 1985, "Clothing, Chips and Competitive Advantage: TheImpact of Microelectronics on Trade and Production in the GarmentIndustry," World Development, 13, No. 3, March.
Hoffman, Kurt and Howard Rush, 1987, Microelectronics and Clothing,New York, Praeger).
Spence, A. Michael, 1981, "The Learning Curve and Competition," BellJournal of Economics, 12(1), pp. 49-70.
Mody, Ashoka, 1986, "Recent Evolution of Microelectronics in Korea andTaiwan: An Institutional Approach to Comparative Advantage," BostonUniversity Center for Asian Development Studies, Discussion PaperNo. 36.
Mody, Ashoka, 1987, "Information Industries: The Changing Role of NewlyIndustrializing Countries," Paper presented to the Brookings onTechnology and Government Policy in Telecommunications and Computers,June 4-5, Washington, D.C.
Mody, Ashoka, 1988, "Changing Firm Boundaries: An Analysis of TechnologySharing Alliances," forthcoming.
Spence, A. Michael 1981, "The Learning Curve and Competition," BellJournal of Economics, 12(1), pp. 49-70.
Taylor, Alex, 1987, "Who's Ahead in the World Auto War," Fortune,November 9, pp. 22-32.
- 24 -
INDUSTRY SERIES PAPERS
No. 1 Japanese Direct Foreign Investment: Patterns and Implications forDeveloping Countries, February 1989.
No. 2 Emerging Patterns of International Competition in Selected IndustrialProduct Groups, February 1989.
No. 3 Changing Firm Boundaries: Analysis of Technology-Sharing Alliances,February 1989.
No. 4 Technological Advance and Organizational Innovation in theEngineering Industry, March 1989.
No. 5 Export Catalyst in Low-Income Countries, November 1989.
No. 6 Overview of Japanese Industrial Technology Development, March 1989.
No. 7 Reform of Ownership and Control Mechanisms in Hungary and China,April 1989.
No. 8 The Computer Industry in Industrialized Economies: Lessons for theNewly Industrializing, February 1989.
No. 9 Institutions and Dynamic Comparative Advantage Electronics Industryin South Korea and Taiwan, June 1989.
No. 10 New Environments for Intellectual Property, June 1989.
No. 11 Managing Entry Into International Markets: Lessons From the EastAsian Experience, June 1989.
No. 12 Impact of Technological Change on Industrial Prospects for the LDCs,June 1989.
No. 13 The Protection of Intellectual Property Rights and IndustrialTechnology Development in Brazil, September 1989.
No. 14 Regional Integration and Economic Development, November 1989.
No. 15 Specialization, Technical Change and Competitiveness in the BrazilianElectronics Industry, November 1989.
- 25 -
INDUSTRY SERIES PAPERS cont'd
No. 16 Small Trading Companies and a Successful Export Response: LessonsFrom Hong Kong, December 1989.
No. 17 Flowers: Global Subsector Study, December 1989.
No. 18 The Shrimp Industry: Global Subsector Study, December 1989.
No. 19 Garments: Global Subsector Study, December 1989.
No. 20 World Bank Lending for Small and Medium Enterprises: Fifteen Yearsof Experience, December 1989.
No. 21 Reputation in Manufactured Goods Trade, December 1989.
No. 22 Foreign Direct Investment From the Newly Industrialized Economies,December 1989.
No. 23 Buyer-Seller Links for Export Development, March 1990.
No. 24 Technology Strategy & Policy for Industrial Competitiveness: ACase Study of Thailand, February 1990.
No. 25 Investment, Productivity and Comparative Advantage, April 1990.
No. 26 Cost Reduction, Product Development and the Real Exchange Rate,April 1990.
No. 27 Overcoming Policy Endogeneity: Strategic Role for DomesticCompetition in Industrial Policy Reform, April 1990.
No. 28 Conditionality in Adjustment Lending FY80-89: The ALCID Database,May 1990.
No. 29 International Competitiveness: Determinants and Indicators,March 1990.
No. 30 FY89 Sector Review Industry, Trade and Finance, November 1989.
No. 31 The Design of Adjustment Lending for Industry: Review of Current Practice,June 1990.
- 26 -
INDUSTRY SERIES PAPERS cont 'd
N4o. 32 National Systems Supporting Technical Advance in Industry: The BrazilianExperience, June 26, 1990.
No. 33 Ghana's Small Enterprise Sector: Survey of Adjustment Response andConstraints, June 1990.
No. 34 Footwear: Global Subsector Study, June 1990.
No. 35 Tightening the Soft Budget Constraint in Reforming Socialist Economies,May 1990.
No. 36 Free Trade Zones in Export Strategies, December 1990.
No. 37 Electronics Development Strategy: The Role of Government, June 1990
No. 38 Export Finance in the Philippines: Opportunities and Constraints forDeveloping Country Suppliers, June 1990.
No. 39 The U.S. Automotive Aftermarket: Opportunities and Constraints forDeveloping Country Suppliers, June 1990
No. 40 Investment As A Determinant of Industrial Competitiveness and ComparativeAdvantage: Evidence from Six Countries, August 1990 (not yet published)
No. 41 Adjustment and Constrained Respons_: Malawi at the Threshold ofSustained Growth, October 1990.
No. 42 Export Finance - Issues and Directions Case Study of the Philippines,December 1990
No. 43 The Basics of Antitrust Policy: A Review of Ten Nations and the EEC,February 1991.
No. 44 Technology Strategy in the Economy of Taiwan: Exploiting Foregin Linkagesand Investing in Local Capability, January 1991
No. 45 The Impact of Adjustment Lending on Industry in African Countries,June 1991.
Note: For extra copies of these papers please contact Miss Wendy Young onextension 33618, Room S-4101
- 27 -
ENERGY SERIES PAPERS
No. 1 Energy Issues in the Developing World, February 1988.
No. 2 Review of World Bank Lending for Electric Power, March 1988.
No. 3 Some Considerations in Collecting Data on Household Energy Consumption,March 1988.
No. 4 Improving Power System Efficiency in the Developing Countries throughPerformance Contracting, May 1988.
No. 5 Impact of Lower Oil Prices on Renewable Energy Technologies, May 1988.
No. 6 A Comparison of Lamps for Domestic Lighting in Developing Countries, June1988.
No. 7 Recent World Bank Activities in Energy (Revised October 1989).
No. 8 A Visual Overview of the World Oil Markets, July 1988.
No. 9 Current International Gas Trades and Prices, November 1988.
No. 10 Promoting Investment for Natural Gas Exploration and Production inDeveloping Countries, January 1988.
No. 11 Technology Survey Report on Electric Power Systems, February 1989.
No. 12 Recent Developments in the U.S. Power Sector and Their Relevance for theDeveloping Countries, February 1989.
No. 13 Domestic Energy Pricing Policies, April 1989.
No. 14 Financing of the Energy Sector in Developing Countries, April 1989.
No. 15 The Future Role of Hydropower in Developing Countries, April 1989.
No. 16 Fuelwood Stumpage: Considerations for Developing Country Energy Planning,June 1989.
No. 17 Incorporating Risk and Uncertainty in Power System Planning, June 1989.
No. 18 Review and Evaluation of Historic Electricity Forecasting Experience, (1960-1985), June 1989.
- 28 -
ENERGY SERIES PAPERS cont'd
No. 19 Woodfuel Supply and Environmental Management, July 1989.
No. 20 The Malawi Charcoal Project - Experience and Lessons, January 1990.
No. 21 Capital Expenditures for Electric Power in the Developing Countries in the1990s, February, 1990.
No. 22 A Review of Regulation of the Power Sectors in Developing Countries,February 1990.
No. 23 Summary Data Sheets of 1987 Power and Commercial Energy Statistics for 100Developing Countries, March 1990.
No. 24 A Review of the Treatment of Environmental Aspects of Bank Energy Projects,March 1990.
No. 25 The Status of liquified Natural Gas Worldwide, March 1990.
No. 26 Population Growth, Wood Fuels, and Resource Problems in Sub-Saharan Africa,March 1990.
No. 27 The Status of Nuclear Power Technology - An Update, April 1990.
No. 28 Decommissioning of Nuclear Power Facilities, April 1990.
No. 29 Interfuel Substitution and Changes in the Way Households Use Energy:The Case of Cooking and lighting Behavior in Urban Java, October 1990.
No. 30 Regulation, Deregulation, or Reregulation-What is Needed in LDCs PowerSector? July 1990.
No. 31 Understanding the Costs and Schedules of World Bank Supported HydroelectricProjects, July 1990.
No. 32 Review of Electricity Tariffs in Developing Countries During the 1980s,November 1990.
No. 33 Private Sector Participation in Power through BOOT Schemes, December 1990.
Note: For extra copies of these papers please call Ms. Mary Fernandez on extension33637 in the morning between 10 am and 11 am and in the afternoon between1:30 to 2:30 pm. From outside the country call: Area Code (202) 473-3637.FAX No. (202) 477-0560.