Embed Size (px)
Citation preview

DNB Investor Meeting, London March 6, 2012
Per Sagbakken,
Head of Investor Relations, Long-term Funding
Harald Serck-Hanssen
Global Head of Shipping, Offshore and Logistics

Agenda
2
A 2011 DNB summary DNB’s shipping activities
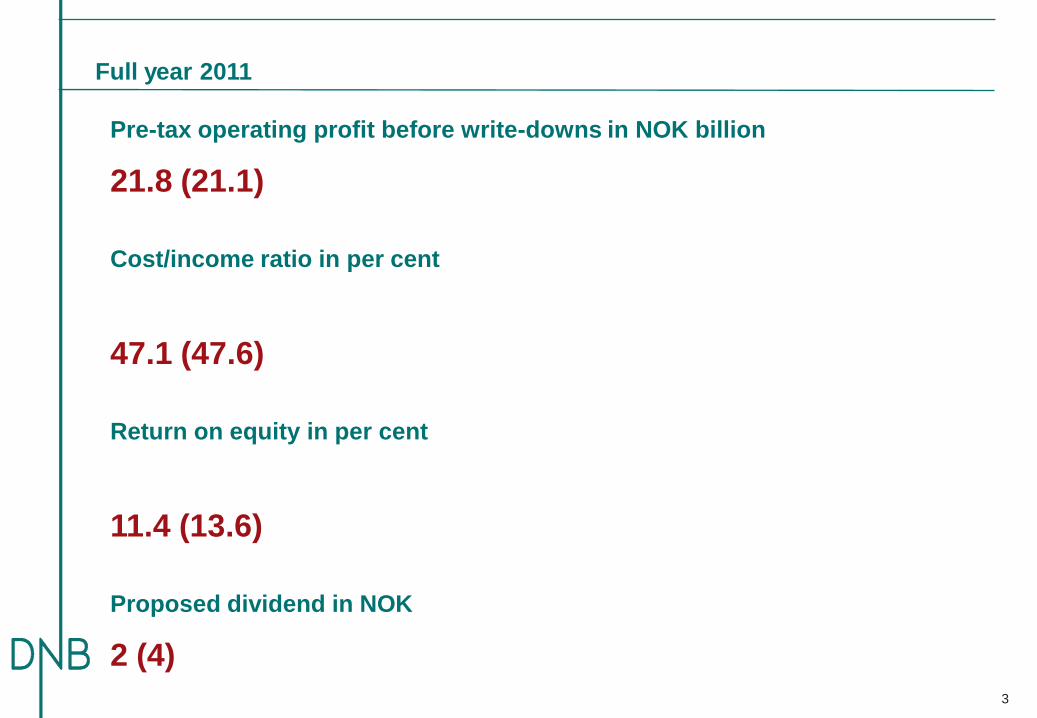
Full year 2011
3
Pre-tax operating profit before write-downs in NOK billion
21.8 (21.1)
Cost/income ratio in per cent
47.1 (47.6)
Return on equity in per cent
11.4 (13.6)
Proposed dividend in NOK
2 (4)

Key figures for the last three years
4
Earnings per share (NOK)
Return on equity (Per cent)
Cost/income ratio (Per cent)
Ratio of deposits to lending (Per cent)
10.6
13.6
11.4
2009 2010 2011
48.147.6
47.1
2009 2010 2011
53.054.8
57.8
2009 2010 2011
•
1.75
4.00
2.00
2009 2010 2011
Earnings per share Dividends/proposed dividend
8.66
6.43
7.98

Business areas
5

Net non-performing and net doubtful commitments 1)
6
4.2
11.9
19.1
21.8 21.4 20.8
18.4 18.9
16.114.5
19.5
0.42
0.99
1.711.88 1.81 1.77
1.55 1.56
1.311.14
1.50
0.35
0.73
1.051.22 1.14
1.040.88 0.93
0.69 0.63
1.10
31 Dec.2007
31 Dec.2008
31 Dec.2009
31March
30June
30Sept.
31Dec.
31March
30June
30Sept.
31Dec.
2010 2011
DNB Baltics and Poland
DNB Group excl. DNB Baltics and Poland
As a percentage of net lending
As a percentage of net lending excl. DNB Baltics and Poland
Per cent
NOK billion
1) Includes non-performing commitments and commitments subject toindividual write-downs. Accumulated individual write-downs are deducted.

Write-downs on loans and guarantees
7
Full year Full year
Amounts in NOK million 4Q11 3Q11 2Q11 1Q11 4Q10 2011 2010
Individual write-downs:
Retail Banking
- Private Customer Divisions 78 38 58 13 132 186 286
- SME Divisions 233 128 (45) 96 182 411 356
- DNB Finans 1) 29 106 97 138 49 370 582
Large Corporates and International
- Nordic Corporates Division 144 (3) 145 120 4 406 28
- International Corporates and
Institutions Division 29 110 (10) 273 196 402 249
- Shipping, Offshore and Logistics Division 143 17 (13) 13 3 160 219
- Energy Division 1 2 (11) 0 (10) (8) 88
- Other units 1 (1) 3 (4) (1) (1) 4
DNB excl. former DnB NORD 657 397 223 649 553 1 926 1 811
Former DnB NORD
- DNB Baltics and Poland 237 494 169 202 319 1 103 1 719
- Other units 126 28 15 19 88 188 543
Total individual write-downs 1 020 919 408 870 961 3 217 4 074
Collective write-downs:
DNB excl. DNB Baltics and Poland (44) 43 54 29 (329) 82 (628)
DNB Baltics and Poland (50) 208 (4) (8) (103) 146 (449)
Total collective write-downs on loans (94) 251 50 21 (432) 227 (1 077)
Write-downs on loans and guarantees 926 1 170 457 892 529 3 445 2 997
1) Includes leasing, factoring and credit card and consumer financing

Stable access to long-term funding
2012
2011
2010
NOK billion Maturity
Covered bonds 84.4 7.5 49
Senior bonds 32.3 7.3 84
Total 116.6 7.5 59 bp
Spread
3-month Euribor
NOK billion Maturity
Covered bonds 98.3 6.5 53
Senior bonds 27.8 8.8 108
Total 126.1 7.0 65 bp
In addition: LTRO funding 15.7 3.0 n.a.
Spread
3-month Euribor
Spread
NOK billion Maturity
Covered bonds 18.5 5.5 83
Senior bonds 22.7 7.9 196
Total 41.2 6.8 146 bp
Lower Tier 2 5.8 10nc5 340
Total 47.0
In addition: LTRO2 funding 9.0 3.0 n.a.
3-month Euribor
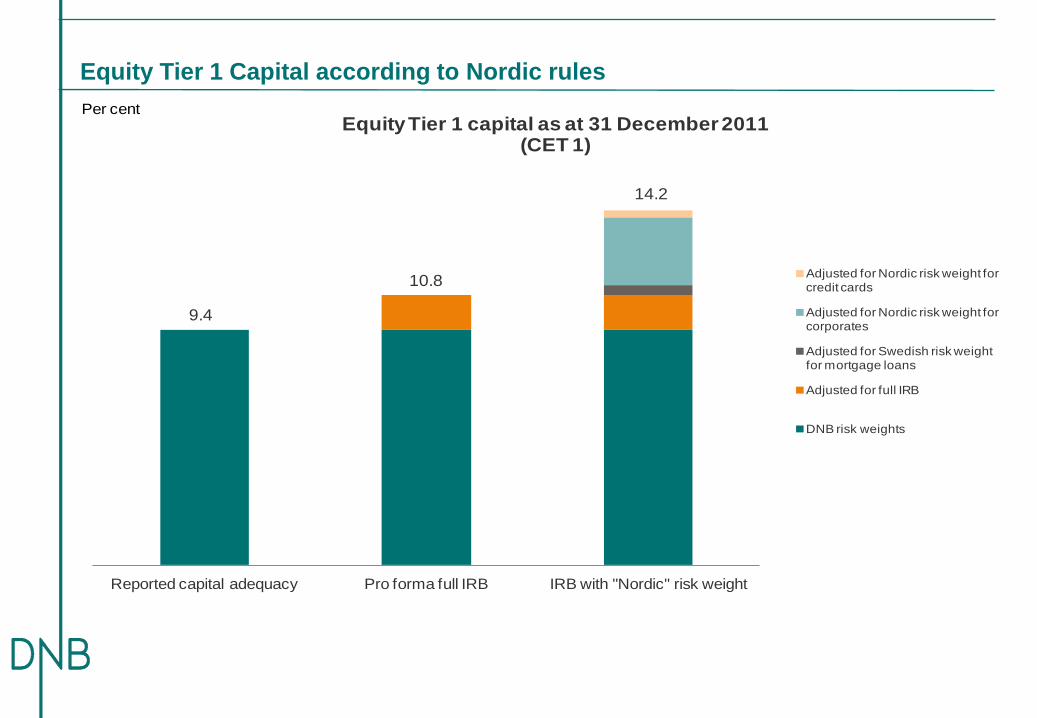
Equity Tier 1 Capital according to Nordic rules
Reported capital adequacy Pro forma full IRB IRB with "Nordic" risk weight
Adjusted for Nordic risk weight for credit cards
Adjusted for Nordic risk weight for corporates
Adjusted for Swedish risk weight for mortgage loans
Adjusted for full IRB
DNB risk weights
9.4
10.8
14.2
EquityTier 1 capital as at 31 December 2011 (CET 1)
Per cent
Agenda
10
DNB’s strategy and position
The shipping markets and the Norwegian
maritime industry
Special focus on the dry bulk, tanker and
container segments
The DNB shipping portfolio
DNB’s shipping activities

In shipping, the supply of new vessels remains a challenge in some segments.
The orderbook is, however, much lower than in 2008. ”Slippage” continues.
%
Source: Clarkson
Orderbook within the major shipping segments as a % of the existing fleet
Source: Clarkson

200
400
600
800
1000
1200
1400
1600
1800
2003 2005 2007 2009 2011 2013 2015
Million dwt
LPG carriers
Chemical tankers
Product tankers
Crude oil tankers
Dry bulk carriers
Containerships
Expected Worldwide Shipping Demand
Seaborne trade is expected to grow steadily within all sectors.
Source: Lorentzen & Stemoco

Shipping consists of many segments, with different drivers.
Our largest segment is offshore, where market conditions are positive.
Bulk Carrier/Dry Cargo
UltraLargeOreCarrier,
Cape Size, Panamax,
Handymax, Handysize
Crude Oil/Product
ULCC , VLCC, Suezmax,
Aframax, Panamax,
Product (LR1/LR2/MR)
Chemical Tankers
Container Vessel
Post Panamax,
Panamax, Sub
Panamax, Handy
Feedermax, Feeder
Liquid Natural
Gas (LNG)
Supply
vessels
PSV, AHTS,
Reefer vessel
Refrigerated cargo
RoRo / PCTC /
PCC
Cruise /
Passenger vessel
13
14
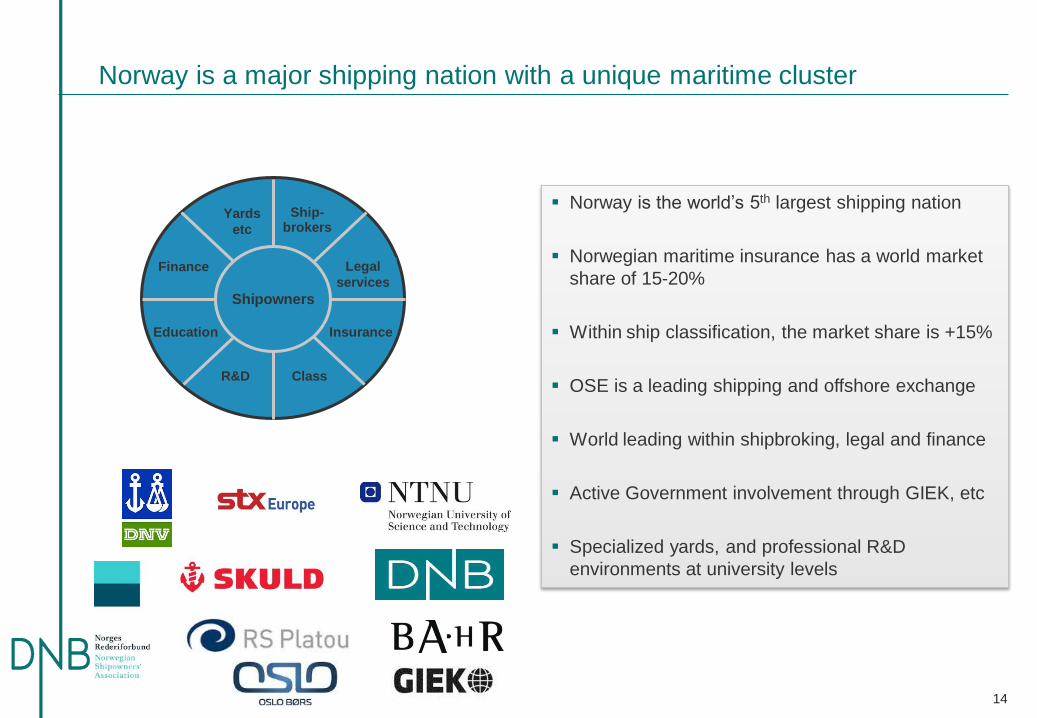
Norway is the world’s 5th largest shipping nation
Norwegian maritime insurance has a world market
share of 15-20%
Within ship classification, the market share is +15%
OSE is a leading shipping and offshore exchange
World leading within shipbroking, legal and finance
Active Government involvement through GIEK, etc
Specialized yards, and professional R&D
environments at university levels
Norway is a major shipping nation with a unique maritime cluster
Shipowners
Finance
Ship-brokers
Legal
services
Education Insurance
R&D
Yards
etc
Class

DNB is active in the maritime sector by choice, not by accident
15
DNB has been active within shipping for + 100 years
We are a one stop bank offering a complete set of
commercial and corporate finance services
With + 100 professionals in our offices in Oslo,
Bergen, New York, London, Athens, Singapore and
Shanghai, we follow our clients closely
Our clients are mainly larger, leading companies with
proven track records and transparent structures
”Far Samson”, owned and operated by Farstad Shipping

We are long term and relationship driven
16
• Our core clients are typically leading integrated shipping companies
• We prioritize clients where we have a good and close dialogue and
who use a broad range of DNB products
• We aim to keep a good credit quality, our credit guidelines being
based upon the “4 Cs”:
Client
Collateral
Cash flow
Covenants
The 4 C’s in the Credit Guidelines

DNB is maintaining a diversified portfolio within shipping and offshore
17
Offshore is the largest single segment with
27%. It is comprised of drilling rigs, support-
and specialized vessels
Industrial shipping, such as gas, ro/ro,
chemical and cruise totals 23%
Within tankers, dry bulk and container the
share is 14%, 12% and 11% respectively.

Dry bulk (USD/day)
Spot rates for dry-bulk capesize vessels last 10
years vs DNB's assumptions
Tankers (USD/day)
Spot rates for VLCC tanker vessels last 10 years vs
DNB 's assumptions
We have a conservative view when assessing risk
Sources: Fearnleys, Clarksons
18
Spot 2011 Avg
1 yr tc 3 yr tc Base Case
Risk Case
Cape 3.500 14.400 17.000 17.000 13.000 10.000
Spot 2011
Avg
1 yr tc 3 yr tc Base Risk
VL 23.400 16.900 20.500 26.000 15.000 10.000

19
In Offshore the activity is high, and the outlook positive
The sentiment is positive due to the high oil
price and increasing energy demand.
Especially the deep water drilling market is
seeing close to 100% utilization
Again, from the bank’s point of view, selecting
the right clients in a growing industry is key.
Sources: IHC Petrodata, Reuters

Sources: Clarkson, Galbraiths
Spot 2011 Avg
1 yr tc 3 yr tc Base Case
Risk Case
Cape 3.500 14.400 17.000 17.000 13.000 10.000
Panmx 5.400 11.340 11.250 11.600 12.000 8.000
Handy 5.700 10.900 7.250 10.000 12.000 8.000
Dry bulk: Lower spot rates, as expected. Some t/c activity at higher levels
The cape market experienced a strong 2nd half
2011, but the spot rates are now very low.
Currently, there are low spot rates in all
segments.
Somewhat higher forward rates.

Tanker markets are so far better than expected.
Spot 2011
Avg
1 yr tc 3 yr tc Base Risk
VL 23.400 16.900 20.500 26.000 15.000 10.000
Suez 21.600 19.200 16.000 20.000 15.000 10.000
Afra 12.700 13.500 13.750 16.000 14.000 8.000
Tanker spot rates have been increasing since
September 2011
Forward rates are lower, but at fairly acceptable
levels
Source: Clarkson

The 2nd hand values dropped substantially and rapidly in 2009. The reduction
has continued especially for older vessels, but at a slower pace.
VLCC 2012 values, vs the peak in 2008 and the
record low levels in 2002.
USD mill.
Source: Clarkson

Containers: Supply of new vessels is expected to increase more than
demand in 2012 and 2013. Rates appear to have bottomed out.
23
Rate developments 2009 - 2012
Source: Alphaliner

The shipping portfolio has been reduced since 2008, both in absolute numbers
and as a share of DNB’s total portfolio
EaD NOK bill.
The shipping exposure has been reduced since
2008, especially within Dry Bulk.
The portfolio is around 7% of the
bank’s total portfolio vs. 10% in 2008
24
Including Dry
Bulk and Tankers
NOK bill.

25
The total Division
The tanker segment The Dry Bulk segment
The container segment
Increasing PD levels in the division, especially within dry bulk, as expected.
NOK bill.

Client Grade Perfor-
ming
Segment Issue
Client A 7 Yes Dry bulk Breach of MVC
Client B 8 Yes Logistics High gearing
Client C 9 Yes Dry bulk High gearing
Client D 6 Yes Dry bulk Weak cash flow
Client E 6 Yes Dry bulk Breach of MVC,
financial covenants
Client F 10 Yes Tankers Breach of MVC,
financial covenants
Client G 6 Yes Containers Breach of financial
covenants
Client H 7 No Various Weak cash flow. Breach
of financial covenants
Client I 7 Yes Various Weak cash flow
Client J 6 Yes Various Weak cash flow
The internal Watch List has been reduced during the past 2 years, but we
expect an increase going forward.
Number of clients on the
bank’s internal Watch List
Some examples of our
clients on the Watch List

27
DNB reports the aggregate of Non-performing and Net doubtful commitments.
The aggregate of the Non-performing and Net
doubtful commitments for the DNB group totalled
NOK 19.5 billion at year end 2011.
The shipping share was 22% and was more than
75% performing.

The shipping companies and the banks usually find ways to solve
challenging situations. In very few cases, the bank becomes a shipowner
28
• Providing additional guarantees or
security
• Raising additional capital
• Reducing or stopping dividends
• Cancelling or postponing newbuildings
• Scrapping vessels
• Selling assets
• Cutting costs
• Modifying, postponing or waiving
covenants
• Moratorium, stretching the repayment
schedule
• "Bridge loans" - solving temporary
liquidity challenges
• Restructuring – in several ways
Bank Contribution Shipowner Contribution

ILLUSTRATIVE CASE: 70% Financing of a USD 1 bill. acquisition.
Values drop by 50% whereas the loan loss is 1% of the original loan amount.
29
2006: Our well established client acquires a fleet of modern
vessels. A bankgroup led by DNB provides 70% financing
based upon 1st pr. mortgages and a set of covenants. DNB’s
share of the loan is 30%. It is a 7 year facility with a 15 year
profile.
2008: Values are down 30%, the client cuts costs and stops
dividends. Expect satisfactory EBITDA next 2 years due to
contract coverage. The bank group reduces the min. value
clause (MVC) to 100% for 2 years.
2010: Values drop a further 15%, and the cash flow is
weak. The company attracts some new hybrid capital, the
banks agree to reduce the MVC for a further year and forego
installments.
2012: Values drop a further 15%. In a theoretical WORST
CASE scenario the Client gives up, and the banks sell the
assets, realizing a loss of MUSD 7, ie 1% of the original loan
amount. DNB’s share of the loss is MUSD 2.4.
70% financing of a USD 1.000 mill. investment
• Valued are provided by recognized brokers. We finance mostly
standard vessels
• We complete detailed cash flow analysis of our clients based
upon base- and risk case assumptions
MUSD

30
Writedowns: Shipping has a good track record
The accumulated specified SOL writedowns
during the past 3 years have been NOK 850
mill, ie. 0,15% p.a. of the portfolio
The shipping write-downs have been between 5%
and 9% of DNB’s total writedowns last 3 years

DNB maintains its position as a leading shipping, offshore and logistics bank,
delivering strong results each year
The Shipping division’s financial
performance, 2009 - 2011
Top maritime bookrunners according to Deallogic
NOK mill.
31

In Summary...
32
1. DNB is the leading bank in Norway with strong earnings and a sound capital base
2. DNB has a proven track record within shipping, delivering strong results each year
3. By concentrating on the larger and leading companies within each segment the risk
is acceptable, and these companies have a high demand for non-lending products
4. We are experiencing a challenging year, but we have substantial loss absorbing
capacity and are therefore confident that 2012 will be profitable for the division