Embed Size (px)
Citation preview
'BNL-72 423-2 004-BC
DNA Damage Quantitation by Alkaline Gel Electrophoresis
Running head: DNA damage quantitation
Betsy M. Sutherland, Ph.D.', Paula V. Bennett, M.S.' and John C. Sutherland, Ph.D.''2
Biology Department, Brookhaven National Laboratory, Upton, NY 1 1973-5000 USA
Department of Physics, East Carolina University, Greenville, NC 2785 8-4353
Corresponding Author: Dr. Betsy M. Sutherland, Biology Department, Bldg. 463, 50 Bell Ave, Brookhaven National Laboratory, Upton, NY 11973-5000 USA. voice: 63 1 344 3380, fax:63 1 344 3407, email: bms@,bnl.gov
1
2
Key words: DNA damage, pyrimidine dimers, agarose gel, gel electrophoresis
- _..
summary
Physical and chemical agents in the environment, those used in clinical applications, or encountered
during recreational exposures to sunlight, induce damages in DNA. Understanding the biological
impact of these agents requires quantitation of the levels of such damages in laboratory test systems as
well as in field or clinical samples. Alkaline gel electrophoresis provides a sensitive (down to - a few
lesions / 5Mb), rapid m ethod o f d irect quantitation o f a wide variety of DNA damages in nanogram
quantities of non-radioactive DNAs from laboratory, field, or clinical specimens, including higher
plants and animals. This method stems fi-om velocity sedimentation studies of DNA populations, and
from the simple methods of agarose gel electrophoresis. Our laboratories have developed quantitative
agarose gel methods, analytical descriptions of DNA migration during electrophoresis on agarose gels
(1-6), and electronic imaging for accurate determinations of DNA mass (7-9). Although all these
components improve sensitivity and throughput of large numbers of samples (7,8, lo), a simple version
using only standard molecular biology equipment allows routine analysis of DNA damages at moderate
frequencies. We present here a description of the methods, 'as well as a brief description of the
underlying principles, required for a simplified approach to quantitation of DNA damages by alkaline
gel electrophoresis.
Materials
All solutions for DNA isolation, cleavage and gel electrophoresis are sterilized by appropriate
means. Gels are handled using powder-fi-ee gloved hands.
7.7.7 Molecular 19ngth standards
1. A DNA, HindIII digest of h (Aliquot into single-use portions, store at -2OOC.)
2
2. TE (Tris-EDTA buffer; 10 mM Tris, pH 8.0, 1 mM EDTA)
.7.7.2 Experimental DNAs
1. Agarose for sample embedding (SeaPlaque or InCert agarose, FMC, Rockland ME)
7.2 Proteinase K, 10 mg/ml stock in 10 mM Tris-HCI, pH 7.5
7.3 Phenylrnethyl sulfonyl fluoride (PMSF) (40 pg/ml in isopropanol; store at -2OOC.)
. 1.4 Lesion-specific endonuclease (store enzymes in 40% glycerol at -0°C.)
1, Endonuclease (for cyclobutyl, pyrimidine dimers, Micrococcus luteus W endonuclease or T4
Endonuclease V) . 2. Endonuclease buffer (30 mM Tris-HC1, pH 7.6, 1 mM EDTA, 40 mM NaC1)
1.5 Ethidium bromide
1.6 Agarose gels (All solutions sterilized by appropriate means)
1. Bio-Rad Mini-Sub Cell, tray for 6.5 cm x 10 cm gel, or as appropriate for gel system used.
2. LE agarose (FMC)
3. Deionized, double-distilled water ’ .
4. 5MNaCl
5. 0.1 M EDTA, pH 8
6. Time tape (TimeMed Labeling Systems, Inc., Burr Ridge, IL)
7. Plastic ruler or spacer (0.02 ” thick)
8. Alkaline electrophoresis solution: 30 mM NaOH, 2 mM EDTA (1 1)
9. Leveling plate and small spirit level
10. Dust cover (plastic shoebox)
11. 70% ethanol
3
12. Lint-free tissue
13. Microwave oven
14. Plexiglas gel tray, cleaned thoroughly with hot water and detergent (ascertained not to produce
fluorescent residues) immediately after last use
15. Comb for tray (1 5 well)
16. A lkaline stop mix: one p art alkaline dye mix (0.25% bromocresol green in 0.25 N NaOH, 50%
glycerol): one part 6 N NaOH
17. Disposable bacteriological loop (1 ply USA Scientific, Ocala FL)
7.7 Materials for demonstration UV experiment
1. Low pressure Hg lamp; emits principally 254 m U V
2. Meter for 254 nm UV
3. Human cultured cells
4. Phosphate buffered saline (0.17 NaCl, 3.4 mM KC1, 10.1 mM Na2HP04, 1.8 mM KH2P04)
5. Plumb line
6. Trypsin (0.05 % in Hanks buffered saline plus 0.1% EDTA)
7. L buffer (20 mM NaCl, 0.1 M EDTA, 10 mM Tris-C1, pH 8.3)
8. L buffer containing 0.2% n-lauroyl sarcosine (Sigma, St. Louis, MO)
9. Red bulbs for room illumination (GE, 25 W red Party Bulb) (12)
7.8 Electrophoresis
1. Bio-Rad Minisub Cell electrophoresis apparatus or equivalent
2. Power supply, Hoefer PS250/2.5 Amp or equivalent
3. Pump for buffer recirculation
4. Chiller, Lauda WKL 230 or equivalent
4
. - - - -
5. Cooling bath for immersion of electrophoresis apparatus
1.9 Gel processing
1. Stainless steel or glass pan
2. Deionized, distilled water
3. 1 M Tis-HCI, pH 8 (stock)
4. Ethidium bromide stock, 10 mg/ml
5. Vinyl, powder-free gloves
6. Suction apparatus with water trap
7. Gel platform rocker, variable speed (Bellco, Vineland NJ)
1.70 DNA visualization and quantitation
1. U V transilluminator
2. Polaroid camera system and Polaroid type 55 P/N film
3. Densitometer
4. Step density wedge
’~ Methods
7.11 DNAs f
7.7 7.7 Molecular Length Standards
7.7 7.7.7 Selection of Appropriate Standards
DNA length standards . should span the lengths of experimental DNAs. Static field gel
electrophoresis resolves only molecules less than - 50 kb (1 1); thus standards should include DNAs
550 kb. Commercially available standards include h DNA (48:5 kb), and HindIII digest of h (23.1, 9.4,
.
- .-- 5
6.6,4.4,2.3,2 , 0.56 kb). S ince DNA c onformation affects mobility o n electrophoretic gels, neither
circular nor supercoiled DNAs should be used as molecular length standards for linear DNAs.
7.7 f . 7.2Evaluation of Length Standards
All DNA length standards should be checked for integrity on alkaline agarose gels. Commercial
DNAs are usually evaluated on neutral gels; such gels do not reveal single strand breaks that will
interfere with the use of the DNA as a length standard on alkaline gels. (Detailed procedures for
alkaline agarose electrophoresis are given in Section 3.2.4.1 .)
1. Electrophorese higher molecular length standard DNAs on a static field, alkaline, 0.4% agarose gel
(along with other DNAs of previously verified size); neutralize gel, stain with ethidium, destain and
photograph. The DNA should appear as a single band, with little evidence of heterodispersity fiom
single strand breaks.
3. Evaluate restriction digests for integrity (as above) and for complete digestion on a static field neutral
gel: the number and sizes of bands should correspond to those expected. Incomplete digests contain
partial digestion products, which may be conhsing if their lengths are assigned incorrectly. If
photographic conditions provide a linear response to DNA mass, the mass of DNA in each band should
be directly proportional to its length.
7.7 7.2 Experimental DNAs
DNA damages are induced by many chemical and physical agents in the environment, in everyday
life, in the workplace and during recreational activity. Analysis of the level of damage, cellular
metabolism of those damages, and the levels and kinds of residual, unrepaired damages that can lead to
mutations is essential ’ for understanding the consequences of exposure to such agents. The exact
experiment, which is carried out, will depend on the question being asked: what is the level of damage
6
induced by a certain concentration of chemical or dose of radiation? How efficiently does cell type A
remove those damages relative to cell type B, and so on,
7.77.2.7 Sample DNAs Suitable for Analysis by Alkaline Gel Electrophoresis
DNA damages inmost IinearDNAs can bemeasured, e.g. viralDNAs (13,14), bacterialDNAs,
simple eucaryotes, higher plants (10,15-20) and higher animals, including human tissues (6,21-26). For
each species, the isolation procedure must be verified to yield DNA of suitable size and amenity to
enzyme digestion. In the gel method, sensitivity (lower limit of lesion fi-equency measurable) depends
directly on the DNA size, and thus the larger the experimental DNA, the greater the sensitivity of lesion
measurement. For lesions other than fi-a& strand breaks, cleavage by a lesion-recognizing enzyme is
required for lesion quantitation; sample DNAs must be fi-ee fi-om contaminants that interfere with
enzyme cleavage at lesion sites or produce extraneous cleavages at non-lesion sites.
1.12 Preparation of Materials
7,72.7 Proteinase K
1. Prepare proteinase K solutions at 1 mg/ml in TE, and in 10 mM Tris, pH 7.5, 1 mM CaClz, then
predigest solutions for 1 hr at 37' C.
2. Check for endonuclease activity (integrity of supercoiled DNA); incubate supercoiled DNA with
proteinase K solutions at 37OC for 1 hr and overnight in both buffers. If satisfactory, purchase large
quantities of that lot.
3. Prepare stock, 10 mg/ml in L buffer with 1% sarcosyl (for cells) or 2% sarcasyl (for tissues).
7. 72-2 U V Endonuclease
Pyrimidine dimer-specific endonucleases include the Micrococcus luteus UV endonuclease and
bacteriophage T4 Endonuclease V (commercially available from Epicentre, Madison WI). Preparations
7
must be checked for non-specific nucleases (cleavage of supercoiled DNA without CPD), as well as
activity (CPD sites incised/volume/time in standard conditions, e.g., 4 x 10¹⁵ CPD incised /pl hour), or
. specific activity (CPD incised/protein/time). Activities reported as “pg irradiated DNA cleavedunit
proteidunit time” are not useful, since the level of dimers in “irradiated” DNA depends on the W
wavelength, exposure and DNA base composition.
I. 72.3 Ethidium bromide
Note that ethidium bromide is a mutagen. Investiga.xs should wear gloves, and handle the solution as a
potential hazard. Ethidium is also light-sensitive, keep stock in subdued light.
1. Prepare a 10 mg/ml ethdium bromide solution using double distilled water.
2. Stir the solution using an electric stirring motor and stirbar until the ethidium is well dissolved.
3. Filter the solution through a 0.2 pm filter.
4. Sub-divide the stock solution into portions appropriate to -1 week’s use.
5. Keep one tube (capped and wrapped with foil) at room temperature; store stock at -20°C.
7.72.4 Agarose Gels
Gels for quantitation must provide both a resolving medium to separate DNAs according to size, and
an optical medium for accurate measurement of DNA mass (low background fluorescence, no
extraneous particles, especially those fluorescing at the wavelengths emitted by the DNA-binding
fluorophore) .
7.72.4.7 Procedure
1. Rinse leveling plate with distilled water, then 70% ethanol, dry with lint-free tissue.
2. Wipe gel-tray and comb with ethanol, wipe with lint-free tissue.
3. Place Time tape neatly on open ends of gel tray, press tape to seal; tape under the tray must be flat
and even.
8
4. Adjust comb to proper height for gel tray.
5. Store tray and comb under clean dust cover.
6. Place 50 ml H20 in -250 ml bottle, place -100 ml H2O into a second 0 ml bottle.
7. Add 0.4 g LE agarose to 50 ml H20 in bottle. DO NOT CAP BOTTLES (HAZARD!)
8. Microwave bottles on high (650 W oven) for 8 min; watch to prevent liquid overflow or excess
evaporation. Add additional willlll' water to agarose solution if necessary. (Some specialty agaroses
should be autoclaved for 20 min on liquid cycle.)
9. Pour warmed water into clean, dust-fi-ee, sterile graduated cylinder. /
10. Add - 20 ml warm water to agarose solution, swirl; add 1 m15 M NaCI, 0.1 mlO.1 M EDTA (per
100 ml final volume), swirl to mix.
11. Discard water from warmed cylinder.
12. Pour agarose solution into warmed cylinder; bring to 100 ml with heated water. Pour agarose back
into (empty) warm bottle, swirl to mix. Inspect agarose solution for incomplete dissolution of
agarose particles, or dust, fibers or other particles.
13. Agarose solution may be capped and placed in a 55" C bath no more than 2 hr;; discard if solution
becomes inhomogeneous.
14. Using warmed (or re-warmed, if necessary) cylinder, measure required volume of agarose (35 ml
per 6.5 cm x 10 cm gel). With gel tray on leveling plate, remove comb from tray. Pour agarose
slowly into the gel tray. Reset comb exactly perpendicular to long axis of gel tray.
15. Replace dust cover over gel, allow to set - 1 hr (0.4 % gel, room temperature).
16. Pour cold electrophoresis solution over gel; pick comb up on a slant to remove one edge, then rest
of the comb.
17, Cover gel with electrophoresis solution (prevents well collapse, equilibrates gel).
9
18. Transferred gel to apparatus (pre-leveled and checked for solution recirculation) containing chilled
electrophoresis solution; equilibrate -1 hr by recirculating electrophoresis solution. Set apparatus
on black paper to aid visualizing the wells.
7.73 Example of Protocol €or DNA Damage Analysis
It is beyond the scope of this chapter to discuss planning and execution of all such experiments; I
will use as an example the quantitation of cyclobutyl pyrimidine dimer (CPD) induction in cultured
human cells by increasing W exposures.
7.73.7 W irradiation and room lighting
A low pressure Hg lamp provides DNA-damaging 254 nm (UVC) for samples with littl shielding
(e.g., monolayer of cultured human cells). UVC is an eye hazard; wear W-opaque glasses with side
shields !
1. Turn lamp on - 15 min before use; after warm up, wrap end -3 inches of bulb with foil.
2. Take care that dish sides of the dish do not shade cells at edge. Use plumb line to locate position for
cell irradiation exactly under the bulb.
3. Remove medium from cells; rinse 2-3X with ice-cold PBS. Keep cells cold to minimize repair.
Irradiate suspension cells in PBS at low optical density at 254 nm, (not i n a narrow tube from
above, which may suffer from inaccurate dosimetry).
4. To prevent photorepair, use red lamps (GE Party Bulb, 25 W red) for room lighting.
7.73.2 W meter
Commercial UV meters have filters transmitting limited wavebands, with the meter output weighted
to specific spectral distributions. Other spectral distributions will not be measured accurately, and
radiation of wavelengths not transmitted by the filter will not be recorded. Thus the output of a "UVA"
lamp reported by a UVA meter may give an accurate measure of UVA radiation, but this measurement 10
. ..-
I
will not reflect any UVB also emitted from the lamp. UVB radiation can be orders of magnitude more
effective in inducing biological damage than W A (1 7,24).
7.73.3 Preparation of Agarose Buttons
1. Melt FMC Sea Plaque or InCert agarose (2% in TE) and place at 45°C.
2. Immediately after UV, suspend cells in PBS (lo6 human celldml, -lo4 cells/lO pl).
3. Mix 1 ml of cells at 2 x lo6 celldm1 with 1 ml agarose.
4. Pipette 10 pl aliquots of suspension into “buttons” onto a petri dish on ice, solidify.
5. Immerse buttons immediately in Proteinase K solution, transfer to multiwell dish or 35-rnm
suspension culture dish, seal with Parafilm and incubate at 37OC.
7.73.4 Proteinase K digestion
1. Replace the proteinase K solution daily for four days.
2. Check complete removal of proteins by electrophoresing DNA on 0.4% alkaline agarose gels (rinse
buttons ‘with TE, and denature; see 3.3.5, steps 9-1 1). If DNA remains at the well-gel interface,
digestion is incomplete; after adequate removal of cellular proteins, DNA samples electrophorese
readily into an alkaline gel.
3. Treat samples showing incomplete digestion with Proteinase K as above.
4. Rinse buttons 2X with ice cold TE, 2X with 10 mM Tis-HC1, pH 7.6, 1 mM EDTA, 40 pg/ml
PMSF at 45’C for 1 h, then rinse with TE.
5. Store buttons at 4°C in L, buffer containing 2% sarcosyl.
7.13.5 Endonuclease digestion .
1. Wash in 5 vol ice cold TE and soak in TE (2X, 5 vol, 20 min each).
11
I
2. Transfer to buffer for lesion specific endonuclease, (2X, 1 hr), then to endonuclease buffer
containing 0.lmM dithiothreitol, 0.1 mg/ml purified bovine serum albumin (New England Biolabs,
Beverly MA).
3. Use companion buttons (replicate buttons from each experimental sample) for each dimer
determination.
4. Calculate the quantity of W endonuclease for the "+ endonuclease" sample from the endonuclease
activity (see section 3.2.2, U V Endonuclease), the quantity of DNA per button; and the maximum
expected CPD level. The validity of the assays depends on cleavage at all lesion sites; sufficient
endonuclease must be used to give complete cleavage. (Check by incubating replicate buttons
containing DNA with the highest damage levels --as well as undamaged DNA to check non-
specific cleavage--with increasing quantities of endonuclease. Determine quantity of endonuclease -
for complete cleavage, add excess enzyme to each "+ endonuclease" sample.)
5. Incubate samples on ice for at least 60 min.
. 6. In the 'I+ endonuclease sample," replace buffer by buffer plus endonuclease.
7. Add buffer without endonuclease to the "-endonuclease" sample.
8. Incubate the samples on ice for 30 min, then transfer to 37OC, incubate 60 min.
9. Rinse buttons with TE.
10. Add 10 1-11 of alkaline stop solution; incubate at room temperature for 30 min.
11. Rinse buttons with alkaline electrophoresis solution just prior to loading onto the gel.
7.73.6 Preparation of Molecular Length Standard DNAs for Electrophoresis
1. Dilute molecular length standard DNAs into TE at 5 80 ng/p1(27).
2. Add alkaline stop solution (2pl/lOpl DNA solution or button).
3. Incubate length standards under the same conditions as the experimental DNAs.
12
I
. 7.73.7 Gel Loading and Electrophoresis
7.73.7.7 Sample loading
Buttons are loaded into wells with the gel on a counter rather than in the apparatus:
1. Remove gel and tray from apparatus; place on a clean, lint-fi-ee tissue. Protect gel surface by
covering with plastic wrap or film.
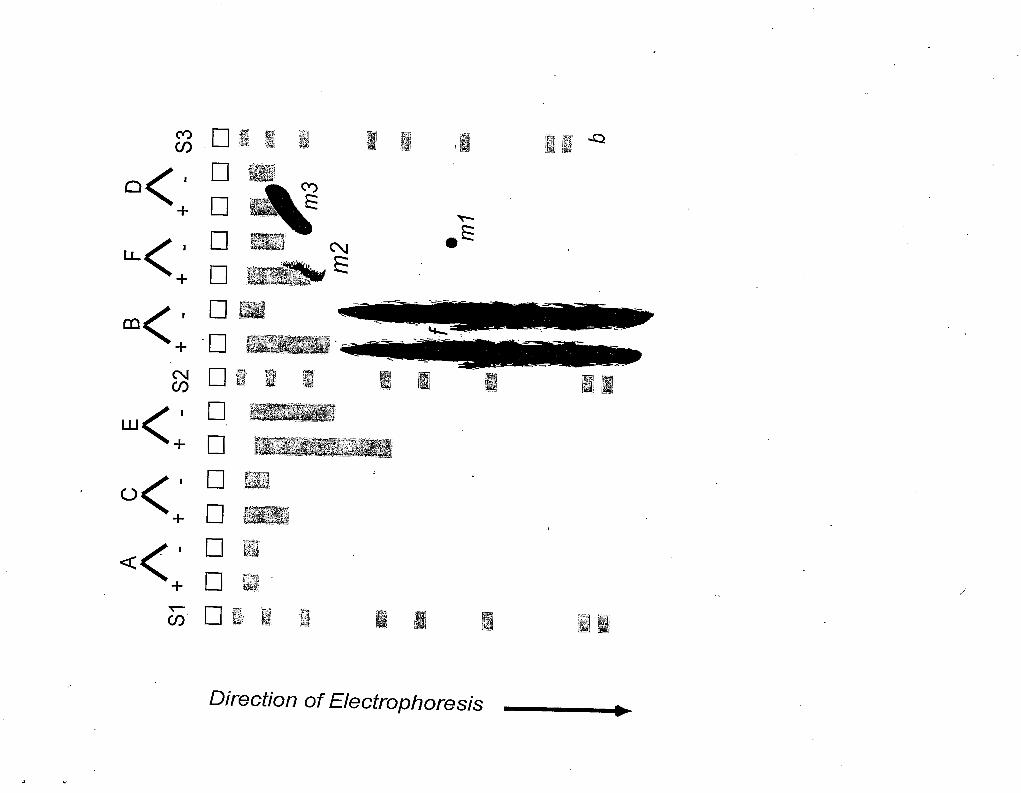
2. For a 15 well gel, use lanes 1, 8 and 15 for molecular length standards (See Figure l), leaving 12
lanes for 6 sample pairs. The ”+” and “-‘I endonuclease samples of each pair are placed in adjacent
lanes; to avoid bias in analysis, code experimental sample PARS; place members of different pairs
at coded locations on the gel.
3. Place tubes containing sample close to the gel,
4. Pick up iqdividual button from solution using plastic disposable loop.
5. Deposit each button in a well (containing alkaline electrophoresis solution); i, should slip readily i
into the well.
6. Generally buttons are not sealed into the wells; however, -5-15 yl of 0.4% agarose may be
micropipetted into each well so that button does not become displaced.
7. Molecular length standard DNAs formed into buttons are loaded in the gel along with the
experimental buttons. If the standards are in solution, they should be loaded after the gel is replaced
in the electrophoresis apparatus. Replicate length standards are in lanes 1, 8 and 15.
8. After the gel tray and all samples are inserted, check the apparatus with a spirit level, and level if
necessary before electrophoresis is begun.
7- 73- 7.2 Electrophoresis
7.73.7.2. ?Temperature control. DNA migration, and thus resolution of DNA molecules, on
electrophoretic gels can be affected by temperature. To achieve temperature uniformity, immerse the
13 . .
gel apparatus in a cooling, recirculating bath filled so that the cooling solution reaches the level of the
gel within the apparatus. Or, set the apparatus in a pan of crushed ice-water, taking care that ice does
not fall into the electrophoresis solution; replenish the ice periodically. Level the gel in the cooling
apparatus, (Note: potential safety hazard! Take care that leads from the power supply do not become
submerged in the cooling water!)
7.73.7.2.2Buffer recirculation. The BioRad Minisub Cell apparatus allows for recirculation of
electrophoretic solution using a simple pump. Set the apparatus up for recirculation.
1. Fill apparatus with 250 ml pre-chilled alkaline electrophoresis solution.
2. BEFORE inserting ge1,check that solution circulates and tubing apparatus does not leak.
7.73.7.2.3Measurement of voltage across a gel
1. Drill two small holes (each large enough for insertion of a volt meter probe) a known distance (e.g.,
10 cm) apart, in the top cover of the gel apparatus above the two ends of the gel.
2. Place gel of standard size and composition, and electrophoresis solution of standard composition
and volume in the apparatus as usual.
3. Insert the probes into the gel, and begin electrophoresis.
4. Read voltage on the voltmeter; knowing the distance between the two probes, calculate the
voltage/centimeter of a. (Note that voltages measured b etween e lectrodes o f t he gel apparatus
vary with the individual apparatus, and thus cannot be applied to a different apparatus, whereas
voltages per distance of the gel can be.)
I. 73.7.2.4 Gel Electrophoresis
1. Begin electrophoresis (-1.5 V/cm; the value depends on DNA size) for 30 min without recirculation
of electrophoresis solution.
2. Start recirculation of electrophoresis solution, and continue throughout the electrophoresis.
3. Use a timed, voltage-controlled power supply to electrophorese for the correct period.
14
4. After electrophoresis, remove gel and tray fiom the apparatus, and process the gel (see below).
5. Immediately after electrophoresis, remove electrophoresis solution fi-om apparatus (alkaline
solution is corrosive to electrodes).
6. Discard used alkaline electrophoresis solution.
7. Rinse apparatus and tubing thoroughly and invert on lint-free tissue in dust-fiee location to dry.
7.73.8 Gel Processing
?.?3.8.7 Neutralization of the Alkaline Gel
1. After electrophoresis, remove gel and tray from apparatus (alkaline solution makes gels slick, so
take care gel does not slide out of apparatus onto the floor!). Wear powder-free vinyl gloves to
protect hands, and to protect gel from fingers. 0.4% gels are ftagile, handle carefully.
2. Rinse gel surface (while gel is in gel tray) in a gentle, stream of distilled water.
3. Transfer gel gently to pan.
4. Add water carefully to pan, at a position away from gel.
5. Rock pan gently, remove water using suction device (holding suction device away from gel).
6. From stock 1 M Tris, pH 8, make 500 ml of neutralizing solution, 0.1 M Tris, pH 8 in ddH20.
7. Pour 250 ml into pan, away fiom gel; place pan on gel rocker for -20 min.
8. Remove the neutralizing solution carefully.
9. Add 250 ml fresh 0.1 M Tris, neutralize gel for at least 40 min. For high molecular length DNAs,
which diffuse slowly, gel can be neutralized overnight. For complex DNAs, complete renaturation
(i.e., restoration of the original double stranded conformation) is not usual; more likely is formation
of double stranded hairpins, which still retain partially single stranded character.
7.73.8.2DNA Staining
1. Prepare stain (250 ml, 1 pglml ethidium bromide in ddH2O) in clean, dust-free cylinder.
15
2. Remove final neutralizing solution, pour ethidium solution into pan, well away f?om gel. Do not
pipette stock ethidium solution just above gel surface, as this produces uneven gel staining.
3. Stain the gel for 15 min.
4. Remove the ethidium solution.
5. Rinse the gel gently with double distilled water.
6. Fill gel pan (-213 full) with water, and destain the gel for at least two chsuiges, 15 min each.
7. Additional destaining time (overnight for high molecular length DNAs) and f?esh water reduces
non-specific ethidium background. Gels may be destained at 4°C; however, bubbles appearing in L
the gel during warming will interfere with DNA quantitation.
I. 3.8,3DNA Visualization and Quantitation
For number average length calculations, we need to know position of DNA molecules on the gel
AND quantity of DNA at each position. We need know only relative-not absolutcmasses of DNA
molecules of hfferent sizes in different lanes. Thus, with uniform gel, ethidium background and
transilluminator, and DNA staining uniform across the gel (dependent only on DNA mass), we need a
recording system giving a signal proportional to DNA mass. Photographic film is. widely used for
recording fluorescence from DNA, but its response to fluorescence is linear over a very limited range,
determined by DNA concentrations, gel conditions and photographic conditions (film type, temperature
of storage and use, exposure, processing). See (28,29) for a discussion.
,- To determine the linear range for specific experimental conditions, prepare a standard alkaline
agarose gel, and electrophorese increasing DNA masses (a few to several hundred nanograms per lane)
in different gel lanes. Electrophorese and process the gel as usual; photograph the gel, scan the DNA
lanes recorded on the film with a densitometer, and determine the relation of quantity of DNA to
densitometric response ("area" of each band). Plot DNA quantity vs. "area" of that band, noting the
16
threshold, linear response range and saturation. In all damage determinations, use DNA concentrations
within the linear range.
7.73.8.4 Photography of Ethidium Fluorescence on Electrophoretic Gels
1. Place neutralized, stained and destained gel on the transilluminator. If transilluminator is uneven
(shows "stripes" corresponding to lamps), orient gel so that illumination down a lane is constant.
2. Photograph gel with film generating a negative. Do not attempt to obtain quantitative data from a
positive print, as its darkening (measured in reflectance) does not reflect reliably the fluorescence to
which it was exposed.
3. Process the film according to standardized conditions (see calibration, above).
4, Dry in a dust-li-ee environment. Streaking or fingerprints on the negative interfere with accurate
DNA mass quantitation.
7.73.9 Densitometry
Test the densitometer's linearity of response to film darkening:
1. Align gel precisely on transilluminator. Since DNA migration is a function of its molecular length,
the film must be aligned precisely so that an x position on the densitometer trace uniformly
represents DNA migration in all lanes. Align same-sized molecular length standards in different
gel lanes at the same x migration position on the densitometer trace.
2. Obtain traces (intensity o f f luorescence a s a function o f m igration p osition o n the g el) for e ach
molecular length and experimental sample lane. For densitometers with computer output, data may
be stored and the quantitative values used for fwther manipulations. However, analog outputs
(traces of DNA mass as a function of lane migration) can also be used.
17
I. 73.70 Theory of Analysis
Suppose that an initial DNA population contains NO moledules, and k strand breaks are introduced
directly (e.g., by x-rays) or by lesion-specific endonucleases. Each strand break increases the total
number of DNA molecules by one, resulting in a final population of N+ = No + k DNA molecules. To
determine the number of strand breaks we count the number of DNA molecules before and after
introduction of the breaks, i .e., k = N + - No. W hile this theory i s s imple, there are problems with
implementation. First, we must count DNA molecules; accuracy in this simple counting approach
would require samples of exactly the same size, which is never easy. Normalizing by the total mass of
DNA avoids both problems.
7.73.70.7 “Normalizing” removes the need for samples of equal DNA mass.
Rather than determining the number of inolecules, we determine the number of molecules per unit
mass o f D NA. This ratio is not changed by variations in the sample size if the sampled material is
homogeneous. We could express the DNA mass in a variety of units. The most useful are the total
,, number of individual bases or base pairs. (We use bases if we are measuring lesions affecting one
DNA strand, e.g., single. strand breaks, and base pairs for damages involving both strands such as
double strand breaks. In all that follows, “or base pairs” is implied whenever we give DNA masses in
“bases”). We can imagine assigning an index number, i, to each DNA molecule, and determining its
length in bases: If L, represents the length (mass) of that molecule and if there are N DNA molecules in
the sample, then the total mass of DNA is Ci L, where i goes &om 1 to N. Our measure of strand breaks
is N /Ci Li. The units are “molecules per base,’’ but we usually express DNA mass in some multiple of
bases, hence giving normalized values of e.g., molecules per Megabases. The reciprocal of the
molecules per base is the average number of bases per molecule. Formally, this is called the number
average length of the population, <L>.,. From the definitions given above, <L>, = (Ci Li )/N. Inducing
breaks increases the number of molecules and decreases their .average length. Our measure of the 18
breaks produced by a given treatment is the number of breaks per unit length of DNA, i.e., the the
frequency of strand breaks, 4, which is expressed in terms of number average lengths by the equation
(b = <Dn,+-’ - <Dn,)-l, Equation 1
where the subscripts 0 and + indicate initial and final (untreated and treated) populations, respectively.
7.73-70.2 Determining the number of DNA molecules per unit DNA length by gel electrophoresis
Fluorescence fi-om ethidium bromide is directly proportional to the mass of each molecule. That is,
fi = k b, where fi is the fluorescence fi-om molecule i, and k is a constant of proportionality that
depends on many experimental factors. Mass normalization eliminates the need to determine the value
of k, as long as it is the same for all DNA molecules in a’sample (i.e., lane of a gel). Instead o f
determining <L>n by summing over i, suppose we separate the DNA molecules as a function of length,
e.g., by gel electrophoresis. If nL is the number of molecules in a sample of length L, then the total
fluorescence due to all the molecules of this length, fL, is‘ given by fL = k nL L. The total number of
DNA molecules in the sample is CL nL and the total number of bases in the same sample is CLnL L,
where the sums extend from 1 to the number of bases in the largest DNA molecule. In terms of these
S m S , <L3>, = [ZL nL L]![ CL n ~ ] . We can replace nL by fL /(k L) and the product nL L by fL /k. Thus, if
k is the same for all molecules in the sample, -
ELL < L > n = fL
E L y
This equation for <Dn indicates a sum over all values of L, the length of the DNA molecules, but we
obtain the distribution of the DNA as a function of e.g., the distance of travel during electrophoresis.
While DNA lengths can only be discrete (integer) values, the distances moved by molecules of different
lengths are continuous values (real numbers). Thus, the sums in the expression for <L>, are replaced
by integrals
19
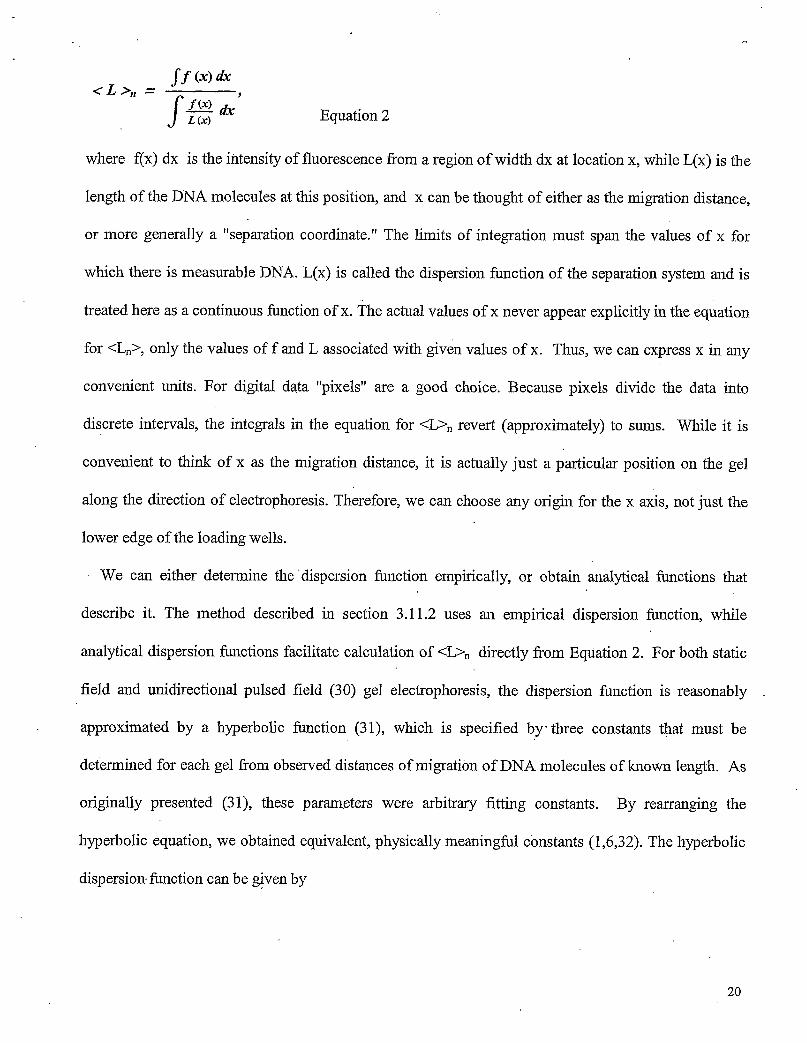
Jf < L > , =
Equation 2
where f(x) dx is the intensity of fluorescence -&om a region of width dx at location x, while L(x) is the
length of the DNA molecules at this position, and x can be thought of either as the migration distance,
or more generally a "separation coordinate." The limits of integration must span the values of x for
which there is measurable DNA. L(x) is called the dispersion function of the separation system and is
treated here as a continuous function of x. The actual values of x never appear explicitly in the equation
for <L,p, only the values o f f and L associated with given values of x. Thus, we can express x in any
convenient units. For digital data ''pixels" are a good choice. Because pixels divide the data into
discrete intervals, the integrals in the equation for <L>n revert (approximately) to sums. While it is
convenient to think of x as the migration distance, it is actually just a particular position on the gel
along the direction of electrophoresis. Therefore, we can choose any origin for the x axis, not just the
lower edge of the loading wells,
We can either determine the 'dispersion function empirically, or obtain analytical functions that
describe it. The method described in section 3.11.2 uses an empirical dispersion function, while
analytical dispersion functions facilitate calculation of <L>n directly from Equation 2. For both static
field and unidirectional pulsed field (30) gel electrophoresis, the dispersion function is reasonably
approximated by a hyperbolic function (31), which is specified by* three constants that must be
determined for each gel from observed distances of migration of DNA molecules of known length. As
originally presented (3 l), these parameters were arbitrary fitting constants. By rearranging the
hyperbolic equation, we obtained equivalent, physically meaningful constants (1,6,32). The hyperbolic
dispersion-function can be given by
20
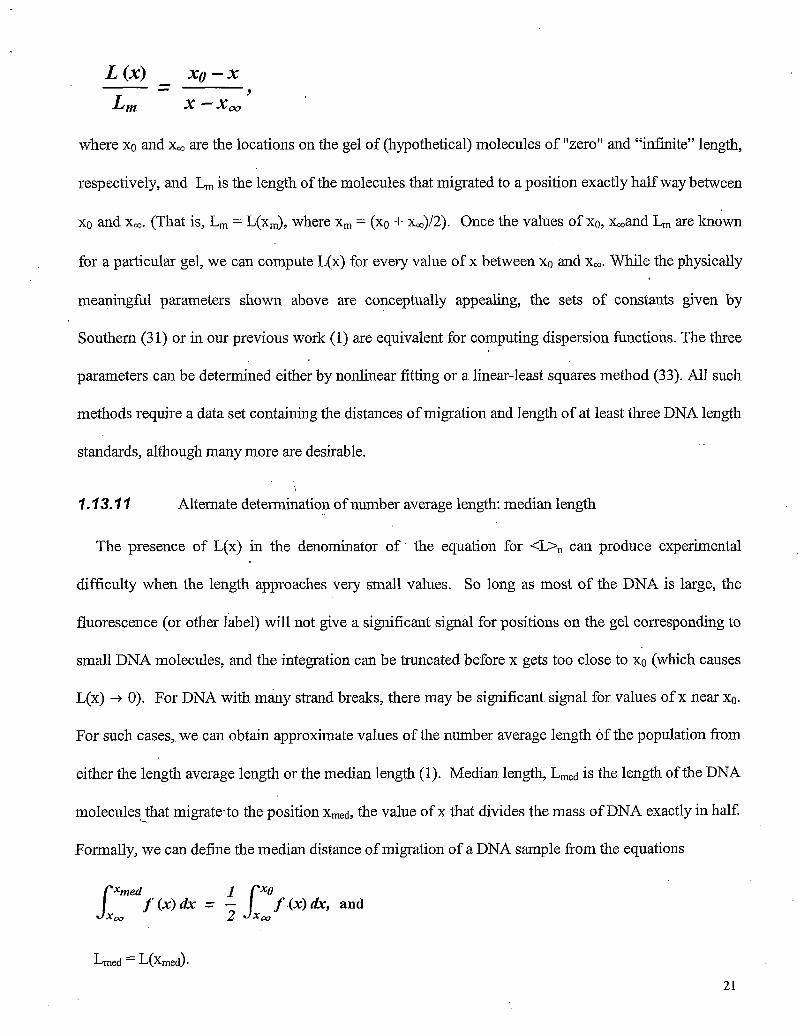
xo --x - 9 - L (XI
L m x -x,
where xo and x, are the locations on the gel of (hypothetical) molecules of "zero" and "infinite" length,
respectively, and L, is the length of the molecules that migrated to a position exactly half way between
xg and x,. (That is, Lm = L(Xm), where Xm = (xo + xJ2). Once the values of xo, x,and L, are known
for a particular gel, we can compute L(x) for every value of x between xo and x,. While the physically
meaningful parameters shown above are conceptually appealing, the sets of constants given by
Southern (3 1) or in our previous work (1) are equivalent for computing dispersion functions. The three
parameters can be determined either by nonlinear fitting or a linear-least squares method (33). All such
methods require a data set containing the distances of migration and length of at least three DNA length
standards, although many more are desirable.
?.?3.?1 Alternate determination of nmber average length: median length
The presence of L(x) in the denominator of the equation for <L>, can produce experimental
difficulty when the length approaches very small values. So long as most of the DNA is large, the
fluorescence (or other label) will not give a significant signal for positions on the gel corresponding to
small DNA molecules, and the integration can be truncated before x gets too close to xo (which causes
L(x) + 0). For DNA with many strand breaks, there may be significant signal for values of x near XO.
For such cases,. we can obtain approximate values of the number average length of the population from
either the length average length or the median length (1). Median length, Lmed is the length of the DNA
molecules L- that migrate,to the position Xmed, the value of x that divides the mass of DNA exactly in half.
Formally, we can define the median distance of migration of a DNA sample fi-om the equations
7.13.7 7.7 Relation of median lengths to number average length.
There are two special cases where there are known relationships between <L>n and L e d . For a
population of molecules all of which are exactly the same size, <L>n = L e d . If the population contains
molecules of more than one length, L e d will be greater than <L>n, because larger molecules are
weighted more heavily. The second special case is where each molecule in an initial homogeneous
'
population has been broken randomly several times, as, for example, during extraction. A population
of DNA molecules fiom higher organisms (where the initial length is the length of the chromosomes)
that has been reduced in length sufficiently that the resulting distribution can be separated in a static
field gel should fit this requirement quite well. Under these conditions, the number average length of
the population is given by the equation (34)
<L>, N 0.6 L e d .
Thus, the error associated with estimating the number average length of a population using the median
Equation 3
length is never worse than a factor of 5/3, and in the co rnon situation of DNA broken extensively
during extraction, should be much better.
7.74 Obtaining Median Lengths and Calculating Lesion Frequencies
This discussion presumes access to molecular biology equipment, but not specialized equipment for
high sensitivity, high throughput DNA lesion quantitation (alkaline pulsed field gels, quantitative
electronic imaging, computerized analysis). In this simple approach DNA median molecular lengthsare
calculated (13) and fiom them, number average molecular lengths (34).
7, 74.7 Detemination of DNA Dispersion Function
1. Compare lane traces of molecular length standards. The peak positions of the DNAs of the same
molecular length should exactly coincide. If so, one lane of standards establishes a DNA dispersion
-
function for the entire gel. If the traces do not coincide, standard lanes near individual experimental
samples should be used to calculate separate DNA dispersion in different gel areas.
2. Determine X, Y coordinates of each DNA length standard. (X corresponds to the migration position
of the peak of a DNA band; Y is the molecular length of that DNA in base pairs.)
3. Plot these points on linear-linear scales.
4. Fit a curve through data points. This DNA dispersion h c t i o n relates size of DNA molecules to
migration position on this gel. Since migration position is affected by exact electrophoresis
conditions, DNA dispersion curves must be determined for each gel (or gel region, see above).
7.74.2 Determination of Median and Number Average Molecular Lengths
The median molecular length is the molecular length in the middle of DNA mass, i.e., the molecular
size of which one half-the DNA molecular mass is larger, and one-half is smaller. The manual method
described below indicates the calculation; it could also be done by a computer “area” computation.
1. Photocopy the DNA lane (photocopier paper is quite uniform).
2. Handle photocopies with powder-fi-ee gloves to insure that neither oils nor moisture fi-om hands, nor
powder fi-om the gloves interferes with measurement.
3. Cut out the trace of an experimental DNA lane carefully with scissors.
4. Determine the weight (W) of the trace using an analytical balance; calculate W/2.
5. Estimate x position (XI) corresponding to middle of DNA mass; cut trace vertically at XI.
6. Weigh one of the resulting half-traces, yielding w1.
7. If w1 = W/2, refer x1 to the dispersion plot, and determine the corresponding molecular length Lmed,
the median molecular length of that DNA population.
8. If w1 f W/2, gradually slice the larger half vertically until its weight equals W/2.
23
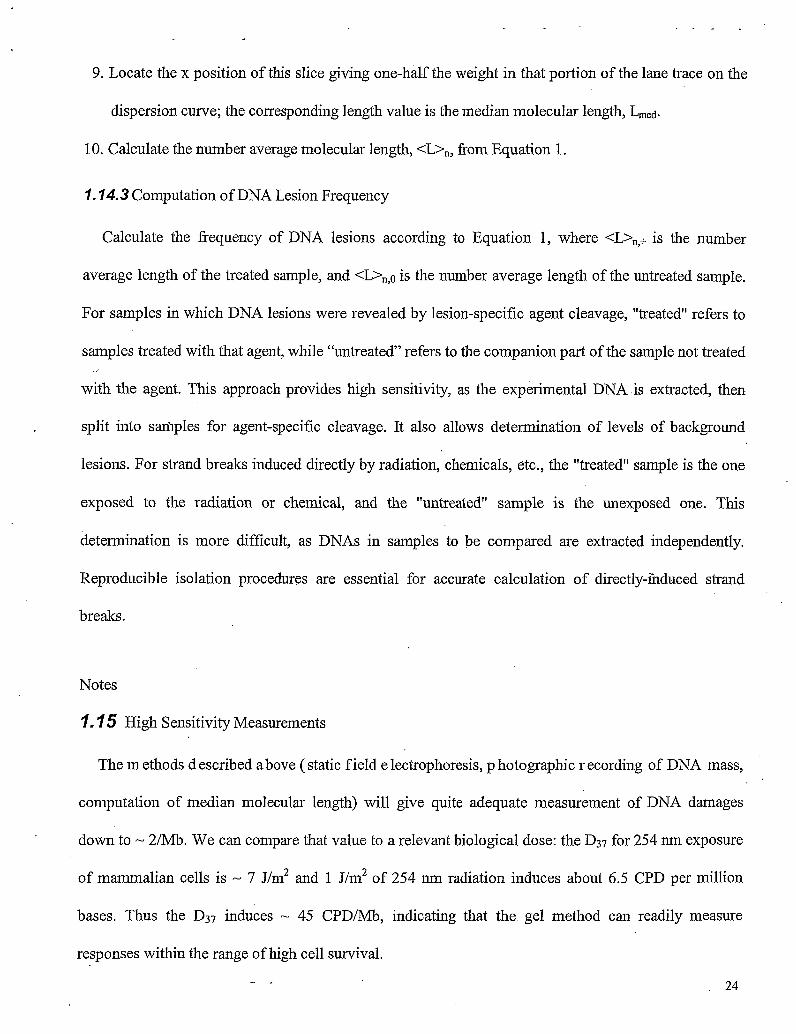
9. Locate the x position of this slice giving one-ha1.f the weight in that portion of the lane trace on the
dispersion curve; the corresponding length value is the median molecular length, L e d .
10. Calculate the number average molecular length, <Dn, fiom Equation 1.
7.74.3 Computation of DNA Lesion Frequency
Calculate the frequency of DNA lesions according to Equation 1, where <L>,,+ is the number
average length of the treated sample, and <L>n,o is the number average length of the untreated sample.
For samples in which DNA lesions were revealed by lesion-specific agent cleavage, "treated" refers to
samples treated with that agent, while "untreated" refers to the companion part of the sample not treated
with the agent. This approach provides high sensitivity, as the experimental DNA .is extracted, then
split into smples for agent-specific cleavage. It also allows determination of levels of background
lesions. For strand breaks induced directly by radiation, chemicals, etc., the "treated" sample is the one
exposed to the radiation or chemical, and the "untreated" sample is the unexposed one. This
determination is more difficult, as DNAs in samples to be compared are extracted independently.
Reproducible isolation procedures are essential for accurate calculation of directly-fnduced strand
breaks.
Notes
1.15 High Sensitivity Measurements
The m ethods d escnbed above ( stati field I ztrophoresis, hot graphi cordin f DNA m
computation of median molecular length) will give quite adequate measurement of DNA damages
down to - 2Mb. We can compare that value to a relevant biological dose: the D37 for 254 nm exposure
of mammalian cells is - 7 J/m2 and 1 J/m2 of 254 nm radiation induces about 6.5 CPD per million
bases. Thus the D37 induces - 45 CPD/Mb, indicating that the gel method can readily measure
responses within the range of high cell survival.
. 24 - -
For higher sensitivity measurement, three major changes are required: first, higher molecular length
DNAs are needed; for methods of obtaining high molecular length DNA fiom various higher
organisms, the reader is referred to references (6,19,35,36). Second, these large DNAs must be
separated, readily carried out by pulsed field electrophoresis (30,37-43). Third, a method of quantitating
DNA with a linear response and large dynamic range (7,44) allows more accurate measurement of
DNA mass, especially at the leading edge of the DNA peak, corresponding to the, smaller molecules in
the population. Fourth, computerized calculation of the number average molecular length, rather than
through its estimation through calculation of the median molecular length, allows much higher . I
sensitivity of lesion measurement.
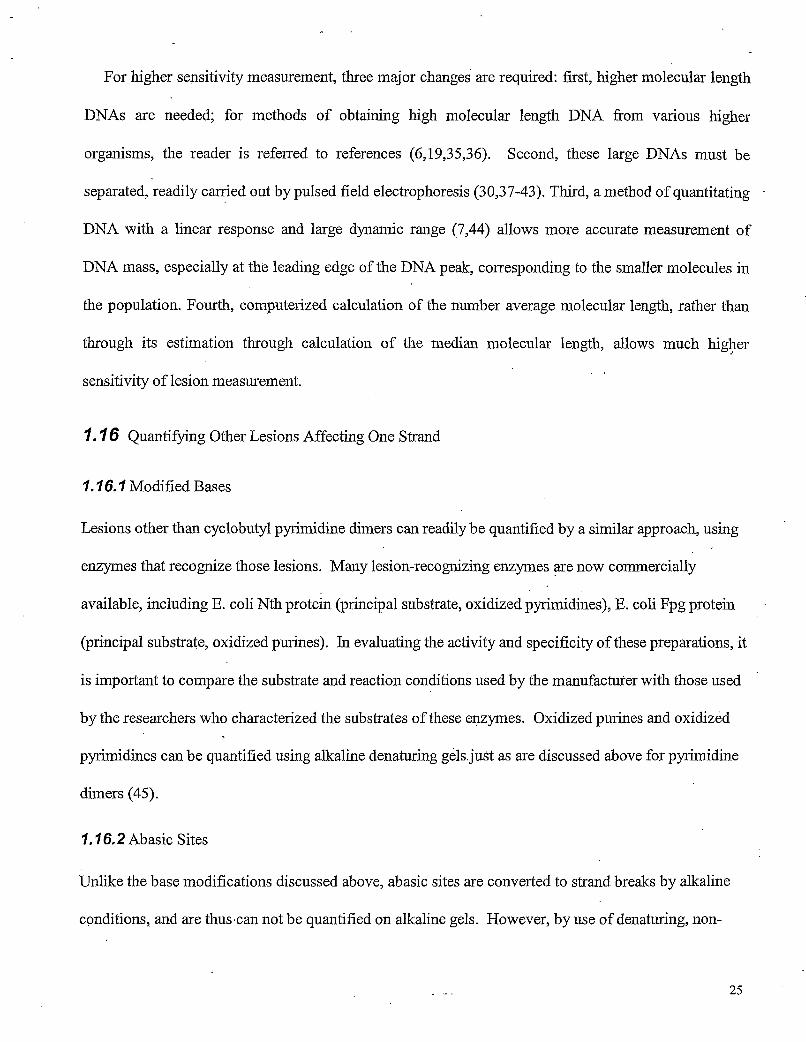
7-76 Quantifjmg Other Lesions Affecting One Strand
7.76.7 Modified Bases
Lesions other than cyclobutyl pyrimidine dimers can readily be quantified by a similar approach, using
enzymes that recognize those lesions. Many lesion-recognizing enzymes are now commercially
available, including E. coli Nth protein (principal substrate, oxidized pyrimidines), E. coli Fpg protein
(principal substrate, oxidized purines). In evaluating the activity and specificity of these preparations, it
is important to compare the substrate and reaction conditions used by the manufacturer with those used
by the researchers who characterized the substrates of these enzymes. Oxidized purines and oxidized
pyrimidines can be quantified using alkaline denaturing gels.just as are discussed above for pyrimidine
dimers (45).
7,76.2 Abasic Sites
Unlike the base modifications discussed above, abasic sites are converted to strand breaks by alkaline
conditions, and are thuscan not be quantified on alkaline gels. However, by use of denaturing, non-
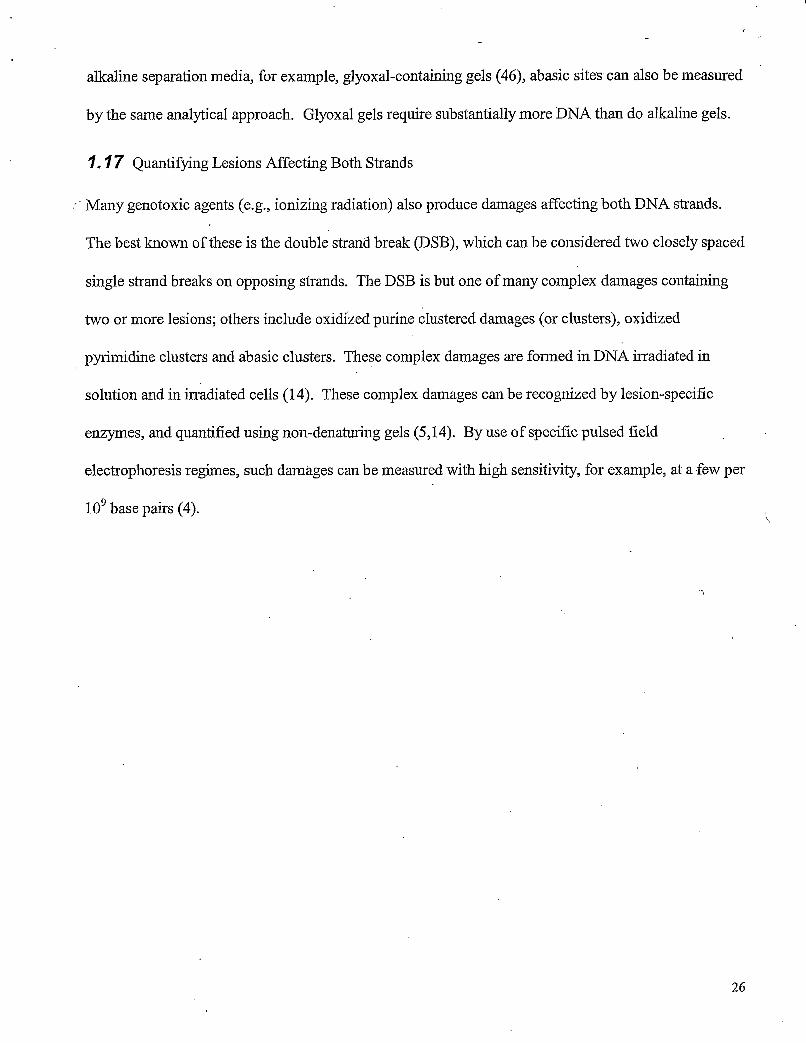
alkaline separation media, for example, glyoxal-containing gels (46), abasic sitess-can also be measured
by the same analytical approach. Glyoxal gels require substantially more DNA than do alkaline gels.
7.77 Quantifjmg Lesions Affecting Both Strands
Many genotoxic agents (e.g., ionizing radiation) also produce damages affecting both DNA strands.
The best known of these is the double strand break (DSB), which can be considered two closely spaced
single strand breaks on opposing strands. The DSB is but one of many complex damages containing
two or more lesions; others include oxidized purine clustered damages (or clusters), oxidized
pyrimidine clusters and abasic clusters. These complex damages are formed in DNA irradiated in
solution and in irradiated cells (14). These complex damages can be recognized by lesion-specific
enzymes, and quantified using non-denaturing gels (5,14). By use of specific pulsed field
electrophoresis regimes, such damages can be measured with high sensitivity, for example, at a.few per
1 O9 base pairs (4).
26
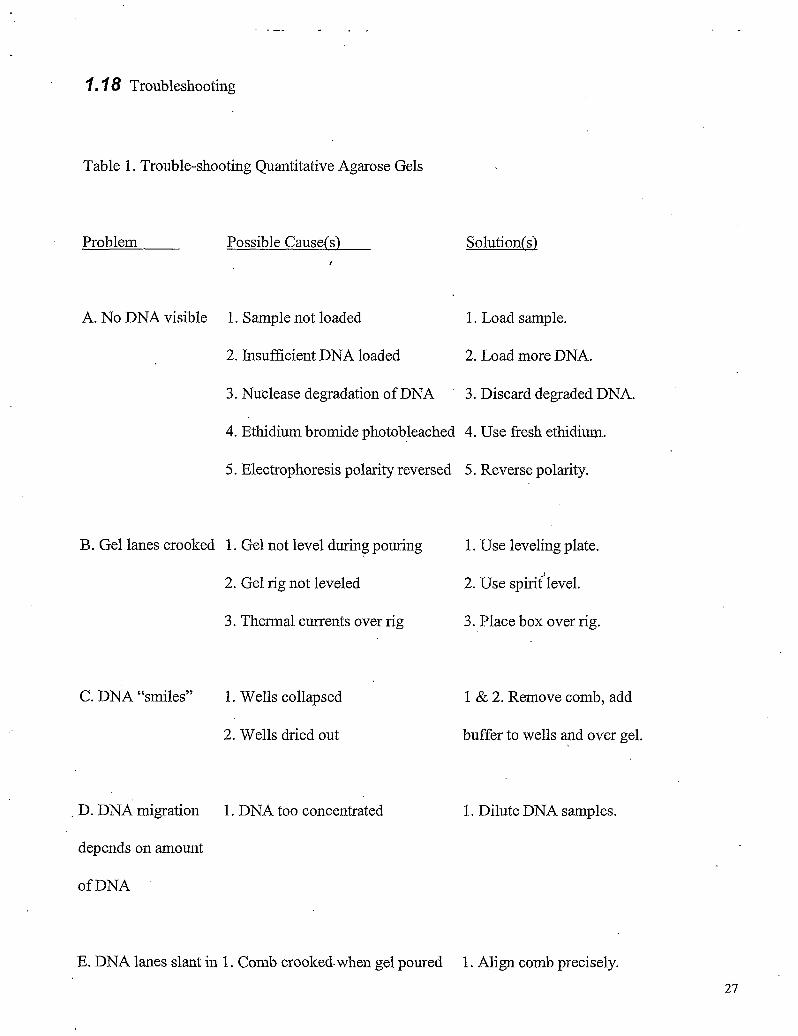
7-78 Troubleshooting
Table 1. Trouble-shooting Quantitative Agarose Gels
Problem Possible Cause(s) Solution(s)
A. No DNA visible 1. Sample not loaded
2. Insufficient DNA loaded
3. Nuclease degradation of DNA ‘ 3. Discard degraded DNA.
4. Ethidium bromide photobleached 4. Use fresh ethidium.
5. Electrophoresis polarity reversed 5. Reverse polarity.
1. Load sample.
2. Load more DNA.
B. Gel lanes crooked 1. Gel not level during pouring 1. Use leveling plate.
2. Gel rig not leveled 3
2. Use spirit level.
3. Thermal currents over rig 3. Place box over rig.
C. DNA “smiles” 1. Wells collapsed
2. Wells dried out
D. DNA migration
depends on mount
of DNA
1. DNA too concentrated
1 & 2. Remove comb, add
buffer to wells and over gel.
1. Dilute DNA samples.
E. DNA lanes slant in 1. Comb crooked-when gel poured 1. Align comb precisely. 27
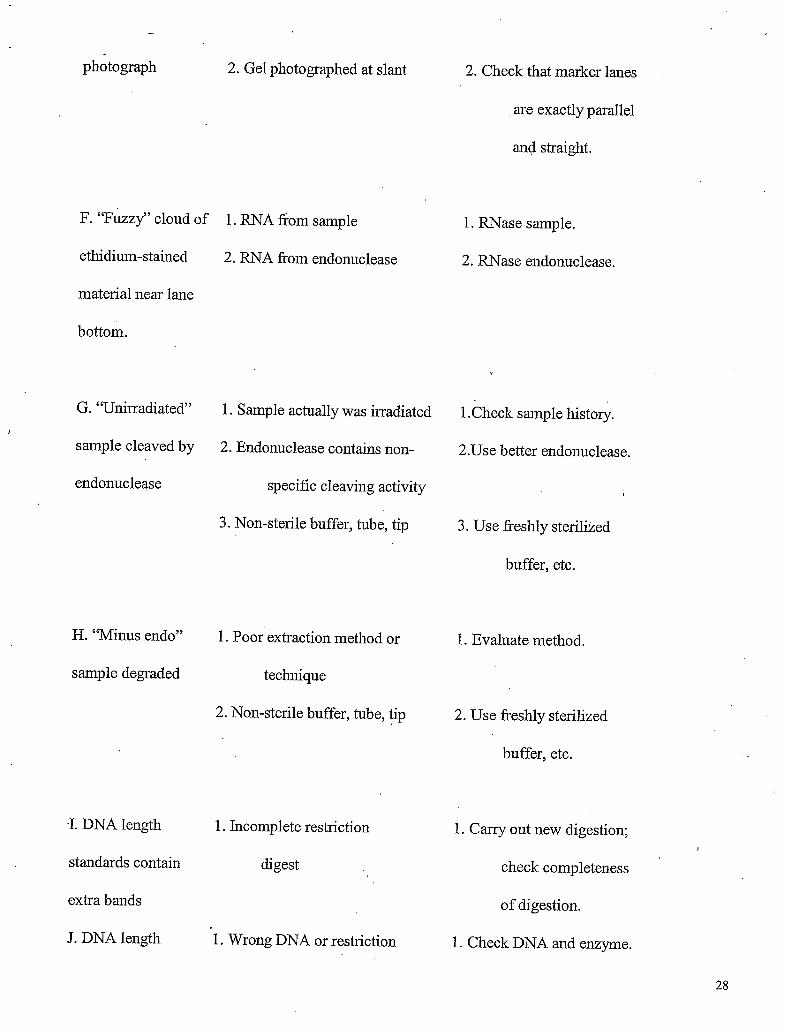
photograph 2. Gel photographed at slant
F. “FUZZY’~ cloud of 1. RNA from sample
ethidium-stained
material near lane
bottom.
G. “Unirradiated”
sample cleaved by
endonuclease
H. “Minus endo”
sample degraded
.I. DNA length
standards contain
extra bands
J. DNA length
2. RNA fi-om endonuclease
1. Sample actually was irradiated
2. Endonuclease contains non-
specific cleaving activity
3. Non-sterile buffer, tube, tip
1. Poor extraction method or
technique
2. Non-sterile buffer, tube, tip
1. Incomplete restriction
digest
1. Wrong DNA or restriction
2. Check that marker lanes
are exactly parallel
and straight.
1. RNase sample.
2. RNase endonuclease.
1 .Check sample history.
2 .Use better endonuclease.
3. Use freshly sterilized
buffer, etc.
1. Evaluate method.
2. Use freshly sterilized
buffer, etc.
1. Cany out new digestion;
check completeness I
of digestion.
1. Check DNA and enzyme.
28
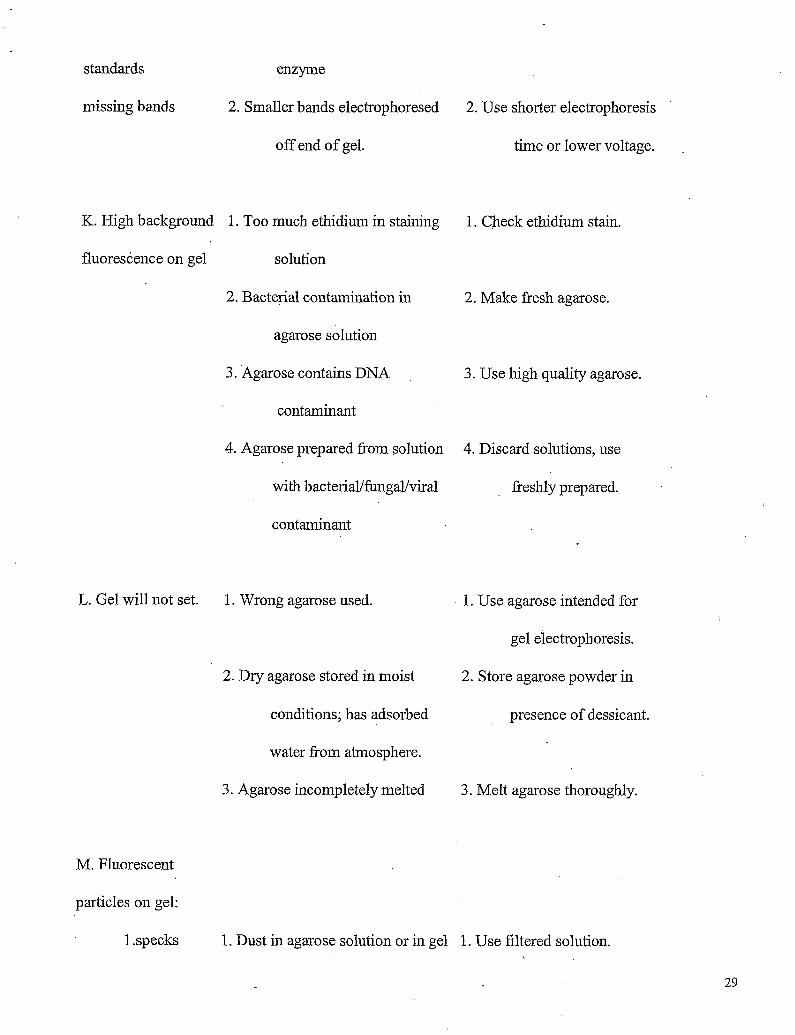
standards enzyme
missing bands 2. Smaller bands electrophoresed
off end of gel.
K. High background
fluorescence on gel
. Too much ethidium in staining
solution
2. Bacterial contamination in
agarose solution
3. Agarose contains DNA
contaminant
4. Agarose prepared from solution
with b ac t erial/fungal/viral
contaminant
2. Use shorter electrophoresis
time or lower voltage.
1. Check ethidium stain.
2. Make fresh agarose.
3. Use hgh quality agarose.
4. Discard solutions, use
freshly prepared.
L. Gel will not set. 1. Wrong agarose used. 1. Use agarose intended for
gel electrophoresis.
2. Store agarose powder in 2. Dry agarose stored in moist
conditions; has adsorbed
water from atmosphere.
3. Agarose incompletely melted
presence of dessicant.
3. Melt agarose thoroughly.
M. Fluorescent
particles on gel:
1 specks 1. Dust in agarose solution or in gel 1. Use filtered solution.
29
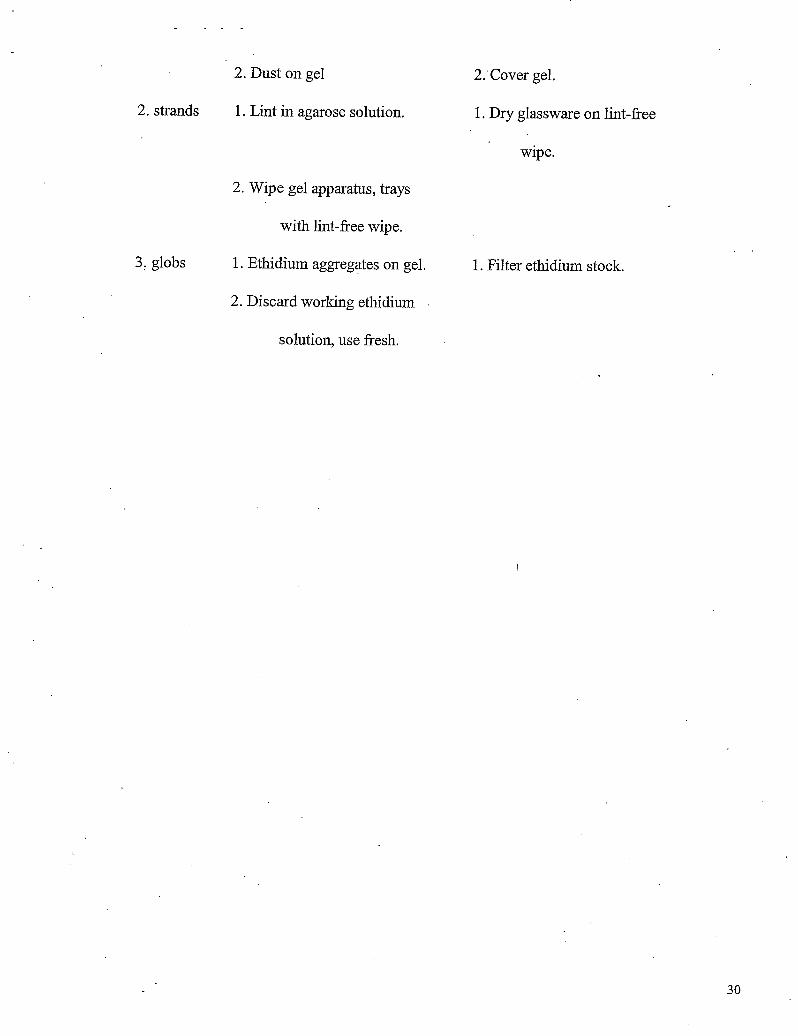
2. Dust on gel
1. Lint in agarose solution.
2:Cover gel.
1. Dry glassware on lint-free 2. strands
wipe.
2. Wipe gel apparatus, trays
with lint-free wipe.
3, globs 1. Ethidium aggregates on gel. 1. Filter ethidium stock.
2. Discard working ethidium
solution, use fresh.
30
Acknowledgments
Research supported by grants from the Low DQse Program of the Office of Biological and
Environmental Research of the US Department of Energy, from the US National Aeronautics and
Space ,Administration from the National Space Biomedical Research Institute, and fiom the National
Institutes of Health HG00371 to JCS and CA86897 to BMS.
*This work w a s performed under t h e auspices of U.S.D.O.E., Contract No.
Figure Legends DE -AC02 -9 8 C H I 0 8 8 6 .
Figure 1. Schematic diagram of an alkaline electrophoretic gel for DNA damage quantitation.
Molecular length standard DNAs (Ml, M2 and M3) are shown in lanes 1, 8 and 15. In the experiment
shown, 6 experimental sample pairs (A, B, Cy D, E, F) included on the gel. The "+ endonuclease" and
"- endonuclease^' members of each sample pair are placed in adjacent lanes, but (to avoid bias in
analysis) the pairs are not necessarily arranged in experimental order. The italic labels refer to specific
experimental problems frequently encountered (See Notes section).
31
References
1.
2.
3.
4.
5 .
6.
Freeman, S.E., Blackett, A.D., Monteleone, D.C., Setlow, R.B., Sutherland, B.M. and
Sutherland, J.C. (1 986) Quantitation of radiation-, chemical-, or enzyme-induced single strand
breaks in nonradioactive DNA by alkaline gel electrophoresis: application to pyrimidine dimers.
Anal. Biochem. 158, 119-129.
Sutherland, J.C., Bergman, A.M., Chen, C.-Z., Monteleone, D.C., Trunk, J. and Sutherland,
B.M. (1988) Measurement of DNA Damage Using Gel Electrophoresis and Electronic Imaging,
in Electrophoresis 88 (Schafer-Nielsen, C., ed. VCH Verlagsgesellschaft, Weinheim, pp. 485-
499.
Sutherland, J.C., Monteleone, D.C., Trunk, J.G., Bennett, P.V. and Sutherland, B.M. (2001)
Quantifylng DNA Damage by Gel Electrophoresis, Electronic Imaging and Number Average
Length Analysis. Electrophoresis 22,843-854.
Sutherland, B.M., Bennett, P.V., Georgakilas, A.G. and Sutherland, J.C. (2003) Evaluation of
number average length analysis in quantifylng double strand breaks in genomic DNAs.
Biochemistry 42,3375-3384. -
Sutherland, B.M., Bennett, P.V. and Sutherland, J.C. (1996) Double Strand Breaks Induced by
Low Doses of Gamma Rays or Heavy Ions: Quantitation in Non-radioactive Human DNA.
Anal. Biochem. 239,53-60.
Bennett, P.V., Gange, R.W., Hacham, H., Hejmadi, V., Moran, M., Ray, S. and Sutherland,
B.M. (1996) Isolation of High Molecular Length DNA from Human Skin. BioTechniques 21,
,
458-463.
32
7.
8.
9.
10.
11.
12.
13.
14.
Sutherland, J.C., Lin, B., Monteleone, D.C., Mugavero, J., Sutherland, B.M. and Trunk, J.
(1987) Electronic imaging system for direct and rapid quantitation of fluorescence fiom
electrophoretic gels: application to ethidium bromide-stained DNA. Anal. Biochem. 163,446-
457.
Sutherland, J.C. (1 990) Electronic Imaging Systems for Quantitative Electrophoresis of DNA,
in Non-invasive Techniques in Biology andMedicine (Freeman, S . E., Fukishima, E. and Green,
E. R., eds.), San Francisco Press, San Francisco, pp. 125-134.
Sutherland, J.C. (1993) Electronic Imaging of Electrophoretic Gels and Blots, in Advances in
Electrophoresis (Chrambach, A., D m , M. J. and Radola, B. J., eds.), VCH Publishers, New
York and Weinheim, Vol. 6, pp. 1-42.
Sutherland, J.C., Monteleone, D.C. and Sutherland, B.M. (1997) Computer network for data
acquisition, storage and analysis. JPhotochem Photobiol B 40, 14-22.
McDonell, M., Simon, M.N. and Studier, F.W. (1977) Analysis of restriction fi-agments of T7
DNA and determination of molecular weights of electrophoresis of neutral and alkaline gels.
Journal of Molecular Biology 110, 119-143.
Sutherland, J.C. and Sutherland, B.M. (1975) Human Photoreactivating Enzyme: Action
Spectrum and Safelight Conditions. Biophysical Journal 15,435-440.
Sutherland, B.M.'and Shih, A.G. (1983) Quantitation of Pyrimidine Dimer Content of
Nonradioactive Deoxyribonucleic Acid by Electrophoresis in Alkaline Agarose Gels.
Biochemistry 22,745-749.
Sutherland, B.M., Bennett, P.V., Sidorkina, 0. and Laval, J. (2000) DNA Damage Clusters
Induced by Ionizing Radiation in Isolated DNA and in Human Cells. Proc. Natl. Acad. Sci. USA
97, 103-108.
33
15.
16.
17.
18.
19.
20.
22.
0 .
Sutherland, B.M., Quaite, F.E. and Sutherland, J.C. (1994) DNA damage action spectroscopy
and DNA repair in intact organisms: alfalfa seedlings, in Stratospheris - ozone Depletion/UV-B
Radiation in the Biosphere (Biggs, R. H. and Joyner, M. E. B., eds.), NATO AS1 Series ed
Springer-Verlag, Berlin, Vol. 18, pp. 97-106.
Hidema, J., Kumagai, T., Sutherland, J.C. and Sutherland, B.M. (1996) Ultraviolet B-sensitive
rice cultivar deficient in cyclobutyl pyrimidine dimer repair. Plant Physiology 113,39-44.
Quaite, F.E., Sutherland, B.M. and Sutherland, J.C. (1992) Action spectrum for DNA damage in
alfalfa lowers predicted impact of ozone depletion. Nature 358,576-578.
Quaite, F.E., Sutherland, B.M. and Sutherland, J.C. (1992) Quantitation of pyrimidine dimers in
DNA from UVB-irradiated alfalfa (Medicago sativa L.) seedlings. Applied and Theoretical
Electrophovesis 2, 171 -1 75.
\
Quaite, F.E., Sutherland, J.C. and Sutherland, B.M. (1 994) Isolation of high-molecular-weight
plant DNA for DNA damage quantitation: relative effects of solar 297 nm UVB and 365 nm
radiation. Plant Molecular Biology 24,475-483.
Quaite, F.E., Takayanagi, S., Ruffini, J., Sutherland, J.C. and Sutherland, B.M. (1994) DNA
damage levels determine cyclobutyl pyrimidine dimer repair mechanisms in alfalfa seedlings.
The Plant Cell 6,1635-1641.
Freeman, S.E., Gange, R.W., Matzinger, E.A. and Sutherland, B.M. (1986) Higher pyrimidine
dimer yields in skin of normal humans with higher UVB sensitivity. Journal of Investigative
Dermatology 86,34-36.
Freeman, S.E., Gange, R.W., Sutherland; J.C. and Sutherland, B.M. (1987) Pyrimidine dimer
formation in human skin. Photochemistvy and Photobiology 46,207-2 12.
34
23.
24. -
25.
26.
27.
28.
29.
30.
31.
Freeman, S.E., Gange, R.W., Sutherland, J.C., Matzinger, E.A. and Sutherland, B.M. (1987)
Production of pyrimidine dimers in DNA of human skin exposed in situ to W A radiation.
Journal of Investigative.Dermatology 88,430-433.
Freeman, S.E., Hacham, H., Gange, R. W., Maytum, D., Sutherland, J.C. and Sutherland, B.M.
(1 989) Wavelength dependence of pyrimidine dimer formation in DNA of human slun
irradiated in situ. Proc. Natl. Acad. Sci. U.S.A. 86,5605-5609.
Hacham, H., Freeman, S.E., Gange, R.W., Maytum, D.J., Sutherland, J.C. and Sutherland, B.M.
(1990) Does exposure of human skin in situ to 385 or 405 nm UV induce pyrimidine dimers in
DNA? Photochem. Photobiol. 52,893-896.
Sutherland, B.M. and Bennett, P.V. (1995) Human white blood cells contain cyclobutyl
pyrimidine dimer photolyase. Proc. Natl. Acad. Sci., USA 92,9732-9736.
Doggett, N.A., Smith, C.L. and Cantor, C.R. (1992) The effect of DNA concentration on
mobility in pulsed field gel electrophoresis. Nucleic Acids Res 20,859-864.
Ribeiro, E.A. and Sutherland, J.C. (1991) Quantitative gel electrophoresis of DNA: Resolution
of overlapping bands of restriction endonuclease digests. Analytical Biochemistvy 194,174- 184.
Ribeiro, E., Larcom, L.L. and Miller, D.P. (1989) Quantitative Fluorescence of DNA
intercalated Ethidium Bromide on Agarose Gels. Analytical Biochemistry 181, 197-208.
Sutherland, J.C., Monteleone, D.C., Mugavero, J.H. and Trunk, J. (1987) Unidirectional pulsed-
1
field electrophoresis of single- and double-stranded DNA in agarose gels: analytical expression
relating mobility and molecular length and their application in the measurement of strand
breaks. Anal. Biochem. 162,511-520.
Southern, E.M. (1979) Measurement of DNA length by gel electrophoresis. Anal Biochem 100,
3 19-323.
35
32.
33.
34.
35.
36.
37.
38.
39.
40.
Sutherland, J.C., Reynolds, K.J. and Fisk, D.J. (1996) Dispersion hc t ions and factors that
determine resolution for DNA sequencing by gel electrophoresis. Proceedings of the Society for
Photo Optical Instrumentation Engineers 268 0,3 26-340.
Schaffer, H.E. and Sederoff, R.R. (1981) Improved estimation of DNA fiagment lengths fiom
agarose gels. Anal Biochem 11 5, 1 13-1 22.
Veatch, W. and Okada, S. (1969) Radiation-induced breaks of DNA in cultured mammalian
cells. Biophys J9,330-346.
Bennett, P.V. and Sutherland, B.M. (1993) Quantitative detection of single-copy genes in
nanogram samples of human genomic DNA. BioTechniques 15,520-525.
Bennett, P.V., Hada, M., Hidema, J., Lepre, A.M., Pope, L.C., Quaite, F.E., Sullivan, J.H.,
Takayanagi, S., Sutherland, J.C. and Sutherland, B.M. (2001) Isolation of High Molecular
Length DNA: Alfalfa, Pea, Rice, Sorghum, Soybean and Spinach, Crop Sciences. Crop Science
41, 167-172.
Chu, G., Vollrath, D. and Davis, R.W. (1986) Separation of large DNA molecules by contour-
clamped homogeneous electric fields. Science 234, 1582-1 585.
Gardiner, K., Laas, W. and Patterson, D. (1986) Fractionation of large mammalian DNA
restriction fiagments using vertical pulsed-field gradient gel electrophoresis. Somat Cell Mol
Genet 12,185-195.
Serwer, P. (1987) Gel electrophoresis with discontinuous rotation of the gel: An alternative to
gel electrophoresis with changing direction of the electrical field. Electrophoresis 8,301-304.
Sutherland, J.C., Emrick, A.B. and Ti-unk, J. (1989) Separation of Chromosomal Length DNA
Molecules: Pneumatic Apparatus for Rotating Gels During Electrophoresis. Electrophoresis 10,
315-3 17.
36
41.
42.
43.
44.
. 45.
46.
Chu, G., Vollrath, D. and Davis, R.W. (1986) Separation of large DNA molecules by contour-
clamped homogeneous electric field. Science 234,1582-1 585.
Gardiner, K., Laas, W. and Patterson, D. (1986) Fractionation of large mammalian DNA
restriction fiagments using vertical pulsed-field gradient gel electrophoresis. Somatic Cell and
Molecular Genetics 12, 185- 195.
Sutherland, J.C., Emrick, A.B. and Trunk, J. (1990) Separation of Chromosomal Length DNA
Molecules: Pneumatic Apparatus for Rotating Gels During Electrophoresis. Electrophoresis 10,
3 15-3 17.
Sutherland, J.C., Sutherland, B.M., Emrick, A., Monteleone, D.C., Ribeiro, E.A., Trunk, J.,
Son, M., Sewer, P., Poddar, S.K. and Maniloff, J. (1991) Quantitative electronic imaging of gel
fluorescence with charged coupled device cameras: applications in molecular biology.
BioTechniques 10,492-497.
Sutherland, B.M., Bennett, P.V., Sidorkina, 0. and Laval, J. (2000) Clustered Damages and
Total Lesions Induced in DNA by Ionizing Radiation: Oxidized Bases and Strand Breaks.
Biochemisty 39, 8026-803 1.
Drouin, R., Rodriguez, H., Gao, S.W., Gebreyes, Z., O'Connor, T.R., Holmquist, G.P. and
b a n , S.A. (1 996) Cupric iodascorbatehydrogen peroxide-induced DNA damage: DNA-
bound copper ion primarily induces base modifications. Free Radic Biol Med 21,261-273.
37
Direction of Electrophoresis -e
I '
DISCLAIMER
This report was prepared as an account of work sponsored by an agency of the United States Government. Neither the United States Government nor any agency thereof, nor any of their employees, nor any of their contractors, subcontractors or their employees, makes any warranty, express or implied, or assumes any legal liability or responsibility for the accuracy, completeness, or any third party’s use or the results of such use of any information, apparatus, product, or process disclosed, or represents that its use would not infi-inge privately owned rights. Reference herein to any specific commercial product, process, or service by trade name, trademark, manufacturer, or otherwise, does not necessarily constitute or imply its endorsement, recommendation, or favoring by the United States Government or any agency thereof or its contractors or subcontractors. The views and opinions of authors expressed herein do not necessarily state or reflect those of the United States Government or any agency thereof


![Thioredoxin System from Deinococcus radioduransand resuspended in 5 mM EDTA, 50 mM Tris-HCl at pH 8.0, 0.5% Triton X-100, 1 mM AEBSF [4-(2-aminoethyl)-benzenesulfonyl fluoride], 20](https://img.pdfslide.us/doc/110x75/5fb1f26774eb6b5dd84e81ad/thioredoxin-system-from-deinococcus-radiodurans-and-resuspended-in-5-mm-edta-50.jpg)


![Bis[tris(1,10-phenanthroline)nickel(II)] tris ... · Bis[tris(1,10-phenanthroline)nickel(II)] tris[dicyanidoargentate(I)] nitrate 4.2-hydrate Muhammad Monim-ul-Mehboob,a Muhammad](https://img.pdfslide.us/doc/110x75/5f74462041fcef38863090d7/bistris110-phenanthrolinenickelii-tris-bistris110-phenanthrolinenickelii.jpg)