Embed Size (px)
Citation preview
Resource
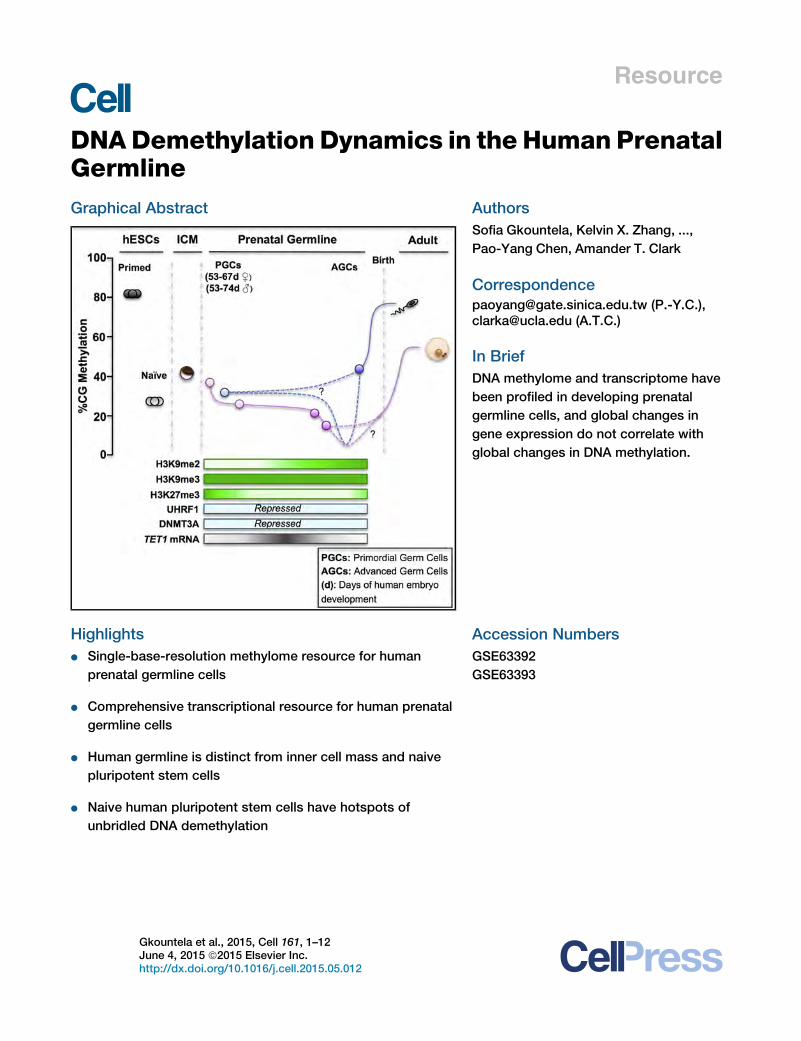
DNADemethylation Dynamics in the Human Prenatal
GermlineGraphical Abstract
Highlights
d Single-base-resolution methylome resource for human
prenatal germline cells
d Comprehensive transcriptional resource for human prenatal
germline cells
d Human germline is distinct from inner cell mass and naive
pluripotent stem cells
d Naive human pluripotent stem cells have hotspots of
unbridled DNA demethylation
Gkountela et al., 2015, Cell 161, 1–12June 4, 2015 ª2015 Elsevier Inc.http://dx.doi.org/10.1016/j.cell.2015.05.012
Authors
Sofia Gkountela, Kelvin X. Zhang, ...,
Pao-Yang Chen, Amander T. Clark
[email protected] (P.-Y.C.),[email protected] (A.T.C.)
In Brief
DNA methylome and transcriptome have
been profiled in developing prenatal
germline cells, and global changes in
gene expression do not correlate with
global changes in DNA methylation.
Accession Numbers
GSE63392
GSE63393
Please cite this article in press as: Gkountela et al., DNA Demethylation Dynamics in the Human Prenatal Germline, Cell (2015), http://dx.doi.org/10.1016/j.cell.2015.05.012
Resource
DNA Demethylation Dynamicsin the Human Prenatal GermlineSofia Gkountela,1 Kelvin X. Zhang,2 Tiasha A. Shafiq,1 Wen-Wei Liao,6 Joseph Hargan-Calvopina,1 Pao-Yang Chen,6,7,*and Amander T. Clark1,2,3,4,5,7,*1Department of Molecular Cell and Developmental Biology2Department of Biological Chemistry3Eli and Edythe Broad Center of Regenerative Medicine and Stem Cell Research4Jonsson Comprehensive Cancer Center5Molecular Biology Institute
University of California, Los Angeles, Los Angeles, CA 90095, USA6Institute of Plant and Microbial Biology, Academia Sinica, Taipei 11529, Taiwan7Co-senior author
*Correspondence: [email protected] (P.-Y.C.), [email protected] (A.T.C.)
http://dx.doi.org/10.1016/j.cell.2015.05.012
SUMMARY
Global DNA demethylation in humans is a funda-mental process that occurs in pre-implantation em-bryos and reversion to naive ground state pluripotentstem cells (PSCs). However, the extent of DNAmethylation reprogramming in human germline cellsis unknown. Here, we performed whole-genomebisulfite sequencing (WGBS) and RNA-sequencing(RNA-seq) of human prenatal germline cells from 53to 137 days of development. We discovered thatthe transcriptome and methylome of human germ-line is distinct from both human PSCs and the innercell mass (ICM) of human blastocysts. Using thisresource to monitor the outcome of global DNA de-methylation with reversion of primed PSCs to thenaive ground state, we uncovered hotspots of ultra-low methylation at transposons that are protectedfrom demethylation in the germline and ICM. Takentogether, the human germline serves as a valuablein vivo tool for monitoring the epigenome of cellsthat have emerged from a global DNA demethylationevent.
INTRODUCTION
Genome-wide DNA demethylation is essential in the pre-implan-
tation embryo and in the prenatal germline to prevent the herita-
ble transmission of abnormal cytosine methylation (epialleles)
from parent to child (Heard and Martienssen, 2014). In the pre-
implantation embryo, this involves removal of the cytosine
methylation acquired in the parental gametes prior to fertiliza-
tion. In the prenatal germline, this involves removing cytosine
methylation in primitive germline cells called primordial germ
cells (PGCs), the precursors of eggs and sperm. The dynamics
of DNA demethylation during these two periods has been exten-
sively studied in the mouse, with DNA methylation reaching
the lowest point during PGC development at embryonic day
13.5 (E13.5) of mouse gestation. At this time point, less than
10% of cytosines in a CpG sequence context remain methylated
in genomic DNA (Seisenberger et al., 2012; Kobayashi et al.,
2013; Wang et al., 2014b). Therefore, E13.5 of mouse PGC
development is often referred to as the germline epigenetic
ground state (Hajkova, 2011).
In vitro, DNA demethylation occurs when primed human em-
bryonic stem cells (hESCs) and serum-grown mouse ESCs are
reset to the naive ground state (Habibi et al., 2013; Ficz et al.,
2013; Takashima et al., 2014). In humans, converting primed
hESCs to the naive ground state causesmore than a 50% reduc-
tion in CpG methylation, together with the removal of non-CpG
methylation (Takashima et al., 2014). It is unknown whether
loss of CpG methylation in naive ground state of human pluripo-
tent stem cells resembles the hypomethylated state of the hu-
man inner cell mass (ICM) or possibly the methylation of human
germline cells.
In humans, the dynamics of cytosine demethylation in pre-
implantation embryos shares tremendous similarity with mouse
embryos of the equivalent stage (Smith et al., 2014; Guo et al.,
2014). However, a distinction between the two species occurs
at transposons and, in particular, the long interspersed nuclear
element (LINE) subfamilies in which DNA sequence differs sub-
stantially between the two species (Smith et al., 2014; Guo
et al., 2014). Even though pre-implantation embryos are consid-
erably hypomethylated relative to the gametes from which they
originate, there remains significant CpG methylation in the ICM
of both species, leading to the hypothesis that, similar to the
mouse, the bulk of DNA demethylation during development
in vivo occurs in the germline.
In humans, there is limited information on the dynamics of DNA
demethylation in the germline during prenatal life, except for
immunofluorescence studies revealing that the germline is glob-
ally hypomethylated from at least 42 days post-fertilization
(Gkountela et al., 2013). To determine whether the human germ-
line undergoes more extensive DNA demethylation than the ICM
and to evaluate whether naive hESCs resemble the demethyla-
tion observed in human germline, we performed whole-genome
bisulfite sequencing (WGBS) of the human prenatal germline
genome to create a comprehensive single-base resolution map
Cell 161, 1–12, June 4, 2015 ª2015 Elsevier Inc. 1
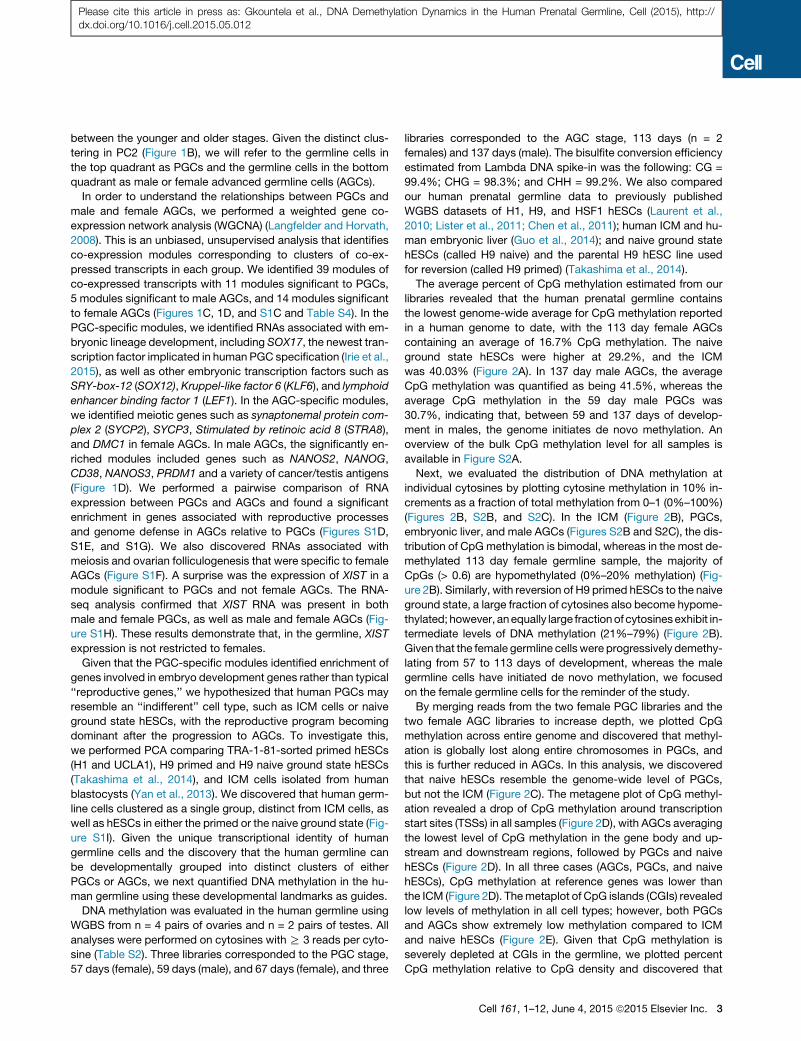
Figure 1. Human Germ Cells Are Distinct
from hESCs
(A) Unsupervised hierarchical clustering of hESCs
and cKIT-expressing germline cells isolated from
human prenatal testes (blue) or ovaries (pink). Day
(d) of prenatal development post-fertilization is
shown.
(B) PCA. Each dot represents a sample. Blue,
male; pink, female germline cells; green, hESCs.
Germline samples separate into three clusters in
PC2, including PGCs and AGCs, which are either
male or female.
(C) Weighted gene co-expression network analysis
of hESC, PGC, and AGC samples showing a hier-
archical cluster tree of co-expression modules.
Eachmodule corresponds to a branch labeled by a
distinct color shown underneath.
(D) Heatmap showing relative expression of 6,583
genes in 4 representative modules across all
samples. For each developmental window, only
the most highly correlatedmodules are shownwith
assigned biological names: hESCs (module 1),
PGCs (module 16), male AGCs (module 24), and
female AGCs (module 2). Representative gene
ontology terms enriched in the highest correlated
module are shown below, as well as representative
hESC and germ cell-related genes found in the
statistically significant modules for that group. The
specific module is shown in parentheses.
See also Figure S1.
Please cite this article in press as: Gkountela et al., DNA Demethylation Dynamics in the Human Prenatal Germline, Cell (2015), http://dx.doi.org/10.1016/j.cell.2015.05.012
of DNA demethylation dynamics of human prenatal germline
cells. This resource is critical not only for understanding the
resetting of epialleles prior to birth in vivo but also for measuring
genome-wide DNA methylation reprogramming in in vitro sys-
tems such as the generation of hESCs in the naive ground state.
RESULTS
We began by establishing transcriptional landmarks of human
prenatal germline development using RNA sequencing (RNA-
seq) of purified germ cells from n = 9 ovaries and n = 6 testes
from 53 to 137 days of life post-fertilization. Human germline
cells were isolated from individual ovaries and testes using fluo-
rescence activated cell sorting (FACS) for the surface receptor
cKIT (Figure S1A). No pooling of samples was performed for
2 Cell 161, 1–12, June 4, 2015 ª2015 Elsevier Inc.
this study. We have previously shown
that germline cells sorted using this
strategy are 100% pure by single-cell
RT-PCR (Gkountela et al., 2013). Here,
we confirmed the purity of human germ-
line samples using an expanded panel
of germ-cell-expressed genes on single
cells, including SOX17, which was posi-
tive in almost every BLIMP1, NANOS3
double-positive cell (Figure S1B).
RNA-seq of 15 human prenatal germ-
line samples yielded 633 million trimmed
50bp reads, with almost 500 million reads
uniquely mapped to the human genome
(Table S1). RNA-seq was also performed on equivalent numbersof TRA-1-81-sorted primed hESCs called UCLA1 (n = 2) and H1
(n = 2). Using unsupervised hierarchical clustering, as well as
principle component analysis (PCA), we discovered that all hu-
man cKIT-positive germline cells clustered separately from
TRA-1-81-positive hESCs (Figures 1A and 1B and Table S4).
We note that one female sample (67 days) clustered with the
male cKIT sorted germline cells in unsupervised hierarchical
clustering (Figure 1A), yet clustered together with the younger
germline group composed of male and female germline cells in
PCA (Figure 1B). Similarly, we also found that the 74 day male
germline cells clusteredwith the older male germline group in un-
supervised hierarchical clustering, but with the younger group in
PCA. Therefore, we speculate that, at around 67 days in females
and 74 days in males, the germline cells are transitioning
Please cite this article in press as: Gkountela et al., DNA Demethylation Dynamics in the Human Prenatal Germline, Cell (2015), http://dx.doi.org/10.1016/j.cell.2015.05.012
between the younger and older stages. Given the distinct clus-
tering in PC2 (Figure 1B), we will refer to the germline cells in
the top quadrant as PGCs and the germline cells in the bottom
quadrant as male or female advanced germline cells (AGCs).
In order to understand the relationships between PGCs and
male and female AGCs, we performed a weighted gene co-
expression network analysis (WGCNA) (Langfelder and Horvath,
2008). This is an unbiased, unsupervised analysis that identifies
co-expression modules corresponding to clusters of co-ex-
pressed transcripts in each group. We identified 39 modules of
co-expressed transcripts with 11 modules significant to PGCs,
5 modules significant to male AGCs, and 14 modules significant
to female AGCs (Figures 1C, 1D, and S1C and Table S4). In the
PGC-specific modules, we identified RNAs associated with em-
bryonic lineage development, including SOX17, the newest tran-
scription factor implicated in human PGC specification (Irie et al.,
2015), as well as other embryonic transcription factors such as
SRY-box-12 (SOX12), Kruppel-like factor 6 (KLF6), and lymphoid
enhancer binding factor 1 (LEF1). In the AGC-specific modules,
we identified meiotic genes such as synaptonemal protein com-
plex 2 (SYCP2), SYCP3, Stimulated by retinoic acid 8 (STRA8),
and DMC1 in female AGCs. In male AGCs, the significantly en-
riched modules included genes such as NANOS2, NANOG,
CD38, NANOS3, PRDM1 and a variety of cancer/testis antigens
(Figure 1D). We performed a pairwise comparison of RNA
expression between PGCs and AGCs and found a significant
enrichment in genes associated with reproductive processes
and genome defense in AGCs relative to PGCs (Figures S1D,
S1E, and S1G). We also discovered RNAs associated with
meiosis and ovarian folliculogenesis that were specific to female
AGCs (Figure S1F). A surprise was the expression of XIST in a
module significant to PGCs and not female AGCs. The RNA-
seq analysis confirmed that XIST RNA was present in both
male and female PGCs, as well as male and female AGCs (Fig-
ure S1H). These results demonstrate that, in the germline, XIST
expression is not restricted to females.
Given that the PGC-specific modules identified enrichment of
genes involved in embryo development genes rather than typical
‘‘reproductive genes,’’ we hypothesized that human PGCs may
resemble an ‘‘indifferent’’ cell type, such as ICM cells or naive
ground state hESCs, with the reproductive program becoming
dominant after the progression to AGCs. To investigate this,
we performed PCA comparing TRA-1-81-sorted primed hESCs
(H1 and UCLA1), H9 primed and H9 naive ground state hESCs
(Takashima et al., 2014), and ICM cells isolated from human
blastocysts (Yan et al., 2013). We discovered that human germ-
line cells clustered as a single group, distinct from ICM cells, as
well as hESCs in either the primed or the naive ground state (Fig-
ure S1I). Given the unique transcriptional identity of human
germline cells and the discovery that the human germline can
be developmentally grouped into distinct clusters of either
PGCs or AGCs, we next quantified DNA methylation in the hu-
man germline using these developmental landmarks as guides.
DNA methylation was evaluated in the human germline using
WGBS from n = 4 pairs of ovaries and n = 2 pairs of testes. All
analyses were performed on cytosines withR 3 reads per cyto-
sine (Table S2). Three libraries corresponded to the PGC stage,
57 days (female), 59 days (male), and 67 days (female), and three
libraries corresponded to the AGC stage, 113 days (n = 2
females) and 137 days (male). The bisulfite conversion efficiency
estimated from Lambda DNA spike-in was the following: CG =
99.4%; CHG = 98.3%; and CHH = 99.2%. We also compared
our human prenatal germline data to previously published
WGBS datasets of H1, H9, and HSF1 hESCs (Laurent et al.,
2010; Lister et al., 2011; Chen et al., 2011); human ICM and hu-
man embryonic liver (Guo et al., 2014); and naive ground state
hESCs (called H9 naive) and the parental H9 hESC line used
for reversion (called H9 primed) (Takashima et al., 2014).
The average percent of CpG methylation estimated from our
libraries revealed that the human prenatal germline contains
the lowest genome-wide average for CpG methylation reported
in a human genome to date, with the 113 day female AGCs
containing an average of 16.7% CpG methylation. The naive
ground state hESCs were higher at 29.2%, and the ICM
was 40.03% (Figure 2A). In 137 day male AGCs, the average
CpG methylation was quantified as being 41.5%, whereas the
average CpG methylation in the 59 day male PGCs was
30.7%, indicating that, between 59 and 137 days of develop-
ment in males, the genome initiates de novo methylation. An
overview of the bulk CpG methylation level for all samples is
available in Figure S2A.
Next, we evaluated the distribution of DNA methylation at
individual cytosines by plotting cytosine methylation in 10% in-
crements as a fraction of total methylation from 0–1 (0%–100%)
(Figures 2B, S2B, and S2C). In the ICM (Figure 2B), PGCs,
embryonic liver, and male AGCs (Figures S2B and S2C), the dis-
tribution of CpGmethylation is bimodal, whereas in the most de-
methylated 113 day female germline sample, the majority of
CpGs (> 0.6) are hypomethylated (0%–20% methylation) (Fig-
ure 2B). Similarly, with reversion of H9 primed hESCs to the naive
ground state, a large fraction of cytosines also become hypome-
thylated; however, anequally large fractionof cytosinesexhibit in-
termediate levels of DNA methylation (21%–79%) (Figure 2B).
Given that the female germline cellswere progressively demethy-
lating from 57 to 113 days of development, whereas the male
germline cells have initiated de novo methylation, we focused
on the female germline cells for the reminder of the study.
By merging reads from the two female PGC libraries and the
two female AGC libraries to increase depth, we plotted CpG
methylation across entire genome and discovered that methyl-
ation is globally lost along entire chromosomes in PGCs, and
this is further reduced in AGCs. In this analysis, we discovered
that naive hESCs resemble the genome-wide level of PGCs,
but not the ICM (Figure 2C). The metagene plot of CpG methyl-
ation revealed a drop of CpG methylation around transcription
start sites (TSSs) in all samples (Figure 2D), with AGCs averaging
the lowest level of CpG methylation in the gene body and up-
stream and downstream regions, followed by PGCs and naive
hESCs (Figure 2D). In all three cases (AGCs, PGCs, and naive
hESCs), CpG methylation at reference genes was lower than
the ICM (Figure 2D). Themetaplot of CpG islands (CGIs) revealed
low levels of methylation in all cell types; however, both PGCs
and AGCs show extremely low methylation compared to ICM
and naive hESCs (Figure 2E). Given that CpG methylation is
severely depleted at CGIs in the germline, we plotted percent
CpG methylation relative to CpG density and discovered that
Cell 161, 1–12, June 4, 2015 ª2015 Elsevier Inc. 3
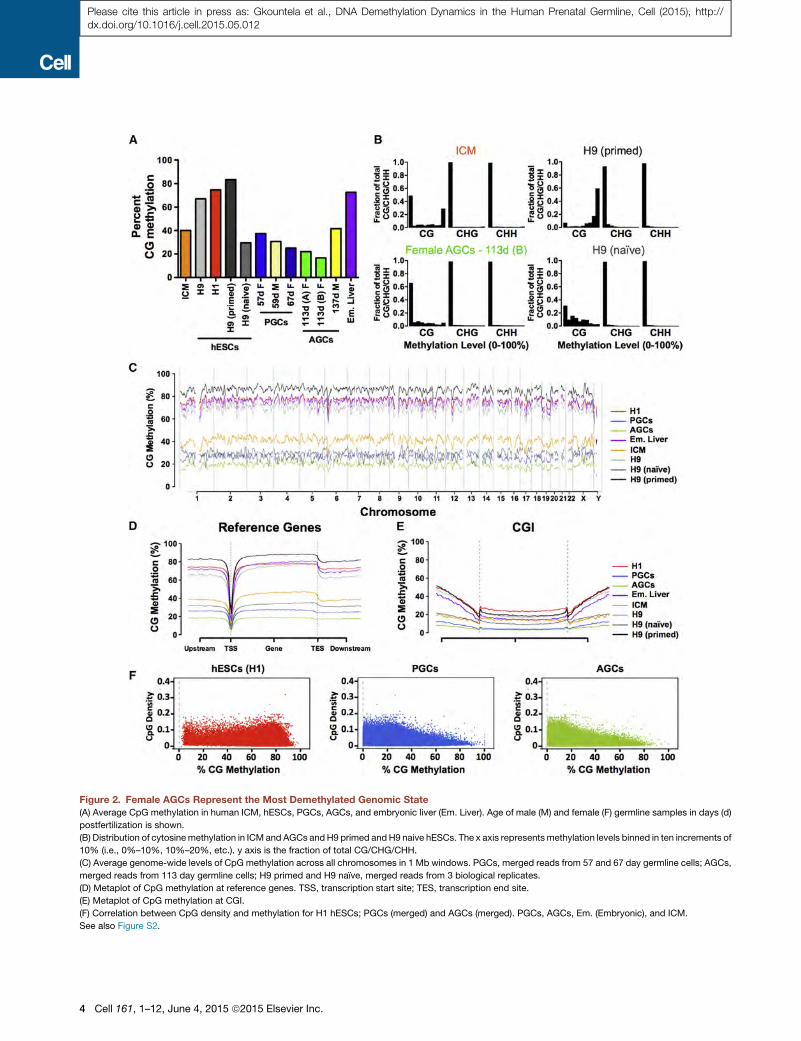
Figure 2. Female AGCs Represent the Most Demethylated Genomic State(A) Average CpG methylation in human ICM, hESCs, PGCs, AGCs, and embryonic liver (Em. Liver). Age of male (M) and female (F) germline samples in days (d)
postfertilization is shown.
(B) Distribution of cytosinemethylation in ICM and AGCs andH9 primed andH9 naive hESCs. The x axis representsmethylation levels binned in ten increments of
10% (i.e., 0%–10%, 10%–20%, etc.). y axis is the fraction of total CG/CHG/CHH.
(C) Average genome-wide levels of CpG methylation across all chromosomes in 1 Mb windows. PGCs, merged reads from 57 and 67 day germline cells; AGCs,
merged reads from 113 day germline cells; H9 primed and H9 naıve, merged reads from 3 biological replicates.
(D) Metaplot of CpG methylation at reference genes. TSS, transcription start site; TES, transcription end site.
(E) Metaplot of CpG methylation at CGI.
(F) Correlation between CpG density and methylation for H1 hESCs; PGCs (merged) and AGCs (merged). PGCs, AGCs, Em. (Embryonic), and ICM.
See also Figure S2.
4 Cell 161, 1–12, June 4, 2015 ª2015 Elsevier Inc.
Please cite this article in press as: Gkountela et al., DNA Demethylation Dynamics in the Human Prenatal Germline, Cell (2015), http://dx.doi.org/10.1016/j.cell.2015.05.012
Please cite this article in press as: Gkountela et al., DNA Demethylation Dynamics in the Human Prenatal Germline, Cell (2015), http://dx.doi.org/10.1016/j.cell.2015.05.012
cytosines with >80% CpG methylation in PGCs and AGCs are
generally located in regions of low CpG density (Figure 2F).
In order to evaluate CpG methylation reprogramming in vivo,
we generated boxplots of cytosine methylation in 5 kb windows
and evaluated the fate of hypermethylated (R80%) and hypo-
methylated (%20%)windows common to ICMand germline cells
(Figures 3A and 3B). We also evaluated these same parameters
in primed hESCs and embryonic liver, where DNA methylation
levels are consistently high (Figures S3A and S3B). The purpose
of this analysis was to determine whether highly methylated cy-
tosines in ICM are erased in the germline and vice versa. In gen-
eral, our results show that hypermethylated windows in the ICM
(n = 8,850) are hypomethylated in PGCs and AGCs. Conversely,
hypermethylated windows in PGCs and AGCs (n = 21) generally
retain somemethylation in the ICM (Figure 3A). Analysis of hypo-
methylated windows in ICM and germline cells reveals similarly
low methylation levels in both cell types (Figure 3B). This is in
contrast to hESCs and embryonic liver, which on average main-
tained highly methylated cytosines at these windows. Taken
together, these data demonstrate that themost hypermethylated
windows of the ICM exhibit demethylation in the germline,
whereas hypermethylated germline windows are only partially
demethylated in the ICM. Therefore, methylation reprogramming
in vivo involves greater reliance on the germline.
In order to identify regions of variable methylation in ICM,
PGCs, and AGCs, we evaluated methylation in 5 kb windows
common to the datasets shown (n = 565,299) (Figures 3C and
S3C). As expected, we discovered that most methylation vari-
able regions in ICM, PGCs, and AGCs were hypomethylated
relative to embryonic liver and primed hESCs. However, we
also identified variable regions that were more methylated in
AGCs than in PGCs (Figure S3C). To probe this further, we calcu-
lated statistically significant (p < 0.05) differentially methylated
regions (DMRs) with a >80% methylation difference in 200 bp
windows (n = 1,049,420 windows analyzed total). This analysis
yielded 3,445 DMRs between PGCs and AGCs, with a false dis-
covery rate of < 0.001% (Figure 3D). We discovered that 3,255
DMRs lose methylation (94.5%) and 190 DMRs (5.5%) gain
methylation in AGCs relative to PGCs. The hypomethylated
DMRs were associated with 1,899 genes, and the hypermethy-
lated DMRs were associated with 118 genes (Table S4). Analysis
of intragenic genomic features containing hypo- and hyperme-
thylated DMRs revealed particular enrichment at DMR-contain-
ing CGIs located within exons, splice sites, promoters, and
30 UTRs (Figures 3E and 3F). We also evaluated cytosine methyl-
ation at imprinting control centers (ICCs) for two paternally meth-
ylated imprinted genes, H19 and MEG3, and two maternally
methylated imprinted genes, PEG3 and KCNQ1 (Figure S3D).
Our results show that, consistent with previous data (Gkountela
et al., 2013), there is an almost complete loss of cytosine methyl-
ation at ICCs in AGCs relative to PGCs.
In order to determine whether DMRs between PGCs and
AGCs correlated with changes in gene expression, we com-
pared the RNA-seq of female germline cells at the equivalent
ages to the germline cells used for WGBS (Figure 3G). This com-
parison revealed 12 DMR-associated genes that were also
differentially expressed. All 12 genes were hypomethylated in
AGCs relative to PGCs, and 2/12 were associated with meiosis
(TEX14 and SYCE2). Taken together, our data reveal a remark-
able and pervasive loss of DNA methylation in human PGCs
and AGCs during prenatal life that has almost no relationship
to changes in gene expression. Our results unexpectedly show
that the female germline undergoes locus-specific changes in
intragenic DNA methylation at exons, splice sites, and pro-
moters, as well as small amounts of de novo methylation in the
background of a demethylated genome.
Given these dynamic changes in the human germline, we also
re-examined CpG methylation in the mouse germline (Seisen-
berger et al., 2012).We remapped the dataset to themm9mouse
genome, with all analyses performed on cytosines withR3 reads
per cytosine (Table S3). Similar to the human study, we mapped
methylation 5 kb windows common to the dataset shown (n =
499,541) and identified variably methylated regions (Figure 3H).
We found that the female mouse germline also undergoes
modest gains in cytosine methylation, particularly between
E13.5 and E16.5 (Figure 3H), which can be quantified as an in-
crease from 4.68% at E13.5 to 9.13% at E16.5 (Figure S3E).
The hypo- and hyper-methylated DMRs between female germ-
line cells at E13.5 and E16.5 revealed particular enrichment at
CGI-containing DMRs in exons, splice sites, promoters, and
30UTRs (Figure S3G). These are the same intragenic regions ex-
hibiting DMRs in the human germline between PGCs and AGCs.
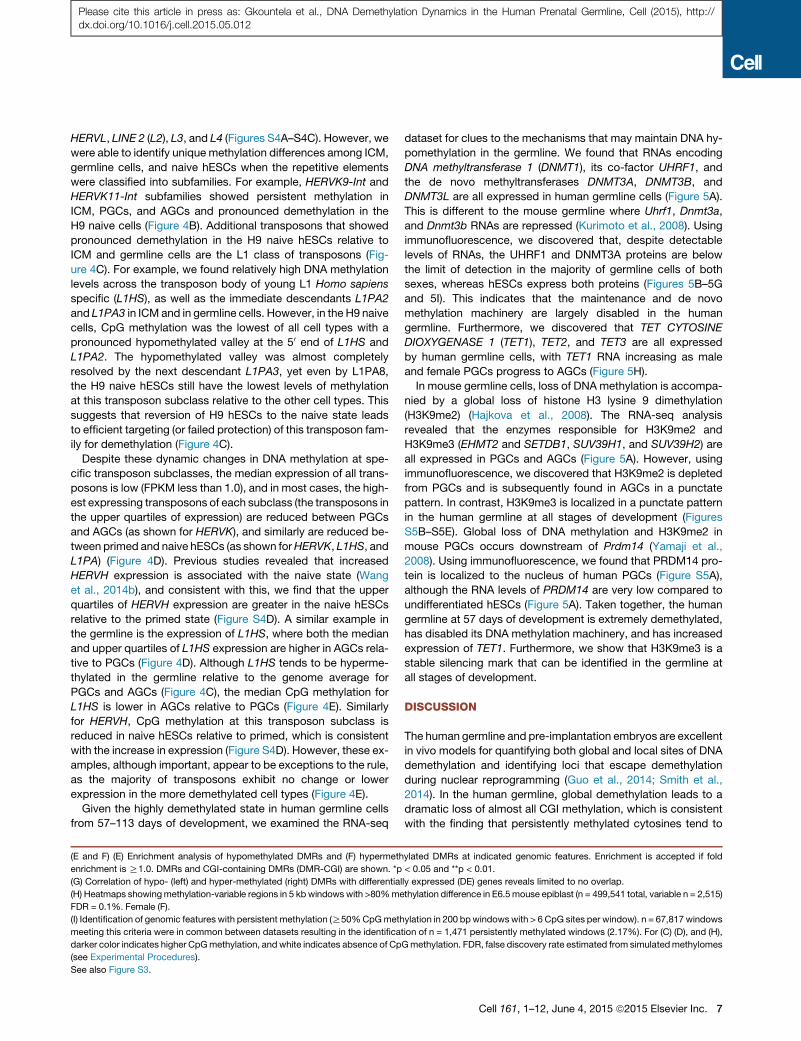
Given that the human germline does not demethylate by
113 days of life to the epigenetic ground-state levels quantified
for the mouse genome at E13.5, we hypothesized that some re-
gions of the genome are resistant to demethylation, therefore
persisting in the globally demethylated genome. To identify
these sites, we evaluated common 200 bp windows in ICM,
PGCs, and AGCs containing at least 6 CpG sites (n = 67,817
windows). Using a cutoff of R50% average CpG methylation
in each 200 bp window, we identified 1,471 persistently methyl-
ated regions in all three samples (Figure 3I). Analysis of genomic
features containing persistent methylation identified enrichment,
particularly at exons. CGI-containing persistent regions ex-
hibited a further enrichment at exons, as well as in 30UTRs, pro-moters, and splice sites (Figure 3I). To identify genes associated
with persistently methylated regions, we used the genomic re-
gions enrichment of annotations tool (GREAT) (McLean et al.,
2010). We restricted our analysis to the identification of genes
with persistent methylation within gene bodies or ± 5kb of the
TSS. This uncovered 585 genes (Table S4). These genes are
not necessarily repressed in PGCs and represent diverse mech-
anisms, including chromatin remodeling (SETDB1, SETD1A,
UHRF1, and Chromodomain helicase 6 [CHD6]), cell adhesion
(CDH4 and CDH12), and map kinase signaling (MAPK8 and
MAPK10).
In the mouse germline, persistently methylated regions are
associated with murine-specific endogenous retroviruses
(ERV) known as intracisternal particle A (IAP) (Rebollo et al.,
2012). IAP sequences do not exist in the human genome; there-
fore, we evaluated DNA demethylation at ERVs, as well as LINEs.
For this analysis, we evaluated methylation in the human germ-
line cells, as well as hESCs (naive and primed), ICM, and embry-
onic liver. Our results show that demethylation of all transposons
as an aggregate follows the trend for the genome average
(Figure 4A). Some specific examples include HERVK, HERV1,
Cell 161, 1–12, June 4, 2015 ª2015 Elsevier Inc. 5
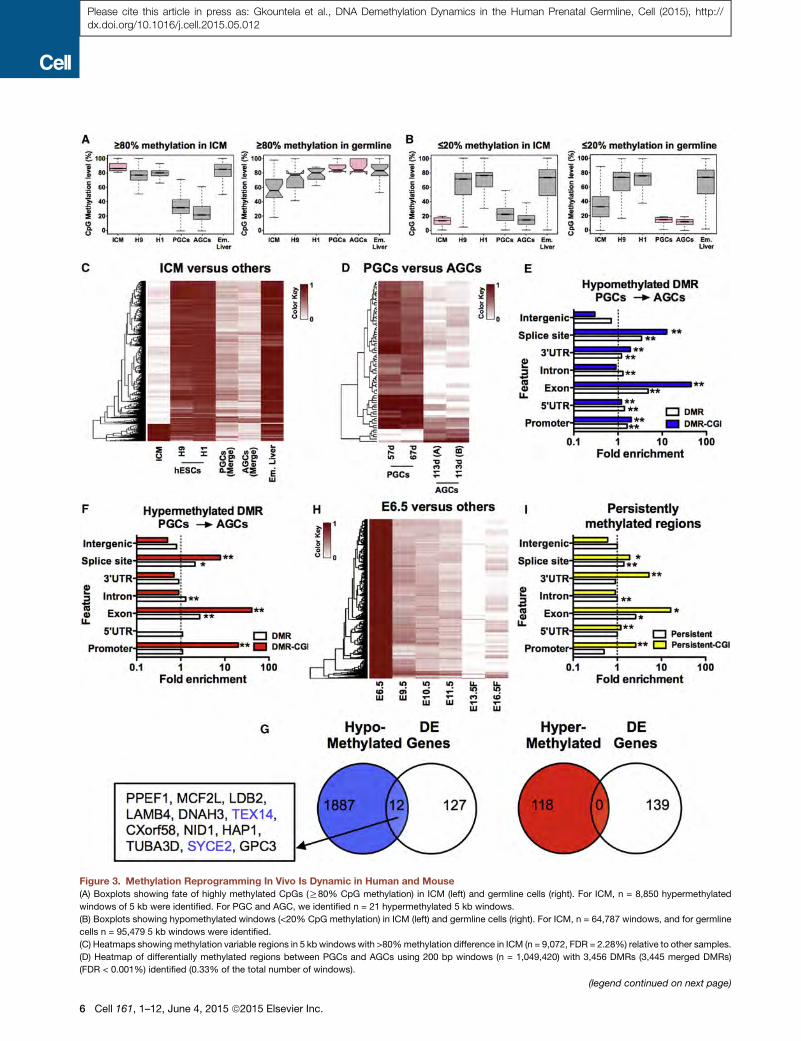
Figure 3. Methylation Reprogramming In Vivo Is Dynamic in Human and Mouse
(A) Boxplots showing fate of highly methylated CpGs (R80% CpG methylation) in ICM (left) and germline cells (right). For ICM, n = 8,850 hypermethylated
windows of 5 kb were identified. For PGC and AGC, we identified n = 21 hypermethylated 5 kb windows.
(B) Boxplots showing hypomethylated windows (<20% CpG methylation) in ICM (left) and germline cells (right). For ICM, n = 64,787 windows, and for germline
cells n = 95,479 5 kb windows were identified.
(C) Heatmaps showing methylation variable regions in 5 kb windows with >80%methylation difference in ICM (n = 9,072, FDR = 2.28%) relative to other samples.
(D) Heatmap of differentially methylated regions between PGCs and AGCs using 200 bp windows (n = 1,049,420) with 3,456 DMRs (3,445 merged DMRs)
(FDR < 0.001%) identified (0.33% of the total number of windows).
(legend continued on next page)
6 Cell 161, 1–12, June 4, 2015 ª2015 Elsevier Inc.
Please cite this article in press as: Gkountela et al., DNA Demethylation Dynamics in the Human Prenatal Germline, Cell (2015), http://dx.doi.org/10.1016/j.cell.2015.05.012
Please cite this article in press as: Gkountela et al., DNA Demethylation Dynamics in the Human Prenatal Germline, Cell (2015), http://dx.doi.org/10.1016/j.cell.2015.05.012
HERVL, LINE 2 (L2), L3, and L4 (Figures S4A–S4C). However, we
were able to identify unique methylation differences among ICM,
germline cells, and naive hESCs when the repetitive elements
were classified into subfamilies. For example, HERVK9-Int and
HERVK11-Int subfamilies showed persistent methylation in
ICM, PGCs, and AGCs and pronounced demethylation in the
H9 naive cells (Figure 4B). Additional transposons that showed
pronounced demethylation in the H9 naive hESCs relative to
ICM and germline cells are the L1 class of transposons (Fig-
ure 4C). For example, we found relatively high DNA methylation
levels across the transposon body of young L1 Homo sapiens
specific (L1HS), as well as the immediate descendants L1PA2
and L1PA3 in ICM and in germline cells. However, in the H9 naive
cells, CpG methylation was the lowest of all cell types with a
pronounced hypomethylated valley at the 50 end of L1HS and
L1PA2. The hypomethylated valley was almost completely
resolved by the next descendant L1PA3, yet even by L1PA8,
the H9 naive hESCs still have the lowest levels of methylation
at this transposon subclass relative to the other cell types. This
suggests that reversion of H9 hESCs to the naive state leads
to efficient targeting (or failed protection) of this transposon fam-
ily for demethylation (Figure 4C).
Despite these dynamic changes in DNA methylation at spe-
cific transposon subclasses, the median expression of all trans-
posons is low (FPKM less than 1.0), and in most cases, the high-
est expressing transposons of each subclass (the transposons in
the upper quartiles of expression) are reduced between PGCs
and AGCs (as shown for HERVK), and similarly are reduced be-
tween primed and naive hESCs (as shown forHERVK, L1HS, and
L1PA) (Figure 4D). Previous studies revealed that increased
HERVH expression is associated with the naive state (Wang
et al., 2014b), and consistent with this, we find that the upper
quartiles of HERVH expression are greater in the naive hESCs
relative to the primed state (Figure S4D). A similar example in
the germline is the expression of L1HS, where both the median
and upper quartiles of L1HS expression are higher in AGCs rela-
tive to PGCs (Figure 4D). Although L1HS tends to be hyperme-
thylated in the germline relative to the genome average for
PGCs and AGCs (Figure 4C), the median CpG methylation for
L1HS is lower in AGCs relative to PGCs (Figure 4E). Similarly
for HERVH, CpG methylation at this transposon subclass is
reduced in naive hESCs relative to primed, which is consistent
with the increase in expression (Figure S4D). However, these ex-
amples, although important, appear to be exceptions to the rule,
as the majority of transposons exhibit no change or lower
expression in the more demethylated cell types (Figure 4E).
Given the highly demethylated state in human germline cells
from 57–113 days of development, we examined the RNA-seq
(E and F) (E) Enrichment analysis of hypomethylated DMRs and (F) hypermeth
enrichment is R1.0. DMRs and CGI-containing DMRs (DMR-CGI) are shown. *p
(G) Correlation of hypo- (left) and hyper-methylated (right) DMRs with differential
(H) Heatmaps showingmethylation-variable regions in 5 kbwindows with >80%me
FDR = 0.1%. Female (F).
(I) Identification of genomic features with persistent methylation (R50%CpGmeth
meeting this criteria were in common between datasets resulting in the identifica
darker color indicates higher CpGmethylation, and white indicates absence of Cp
(see Experimental Procedures).
See also Figure S3.
dataset for clues to the mechanisms that may maintain DNA hy-
pomethylation in the germline. We found that RNAs encoding
DNA methyltransferase 1 (DNMT1), its co-factor UHRF1, and
the de novo methyltransferases DNMT3A, DNMT3B, and
DNMT3L are all expressed in human germline cells (Figure 5A).
This is different to the mouse germline where Uhrf1, Dnmt3a,
and Dnmt3b RNAs are repressed (Kurimoto et al., 2008). Using
immunofluorescence, we discovered that, despite detectable
levels of RNAs, the UHRF1 and DNMT3A proteins are below
the limit of detection in the majority of germline cells of both
sexes, whereas hESCs express both proteins (Figures 5B–5G
and 5I). This indicates that the maintenance and de novo
methylation machinery are largely disabled in the human
germline. Furthermore, we discovered that TET CYTOSINE
DIOXYGENASE 1 (TET1), TET2, and TET3 are all expressed
by human germline cells, with TET1 RNA increasing as male
and female PGCs progress to AGCs (Figure 5H).
In mouse germline cells, loss of DNA methylation is accompa-
nied by a global loss of histone H3 lysine 9 dimethylation
(H3K9me2) (Hajkova et al., 2008). The RNA-seq analysis
revealed that the enzymes responsible for H3K9me2 and
H3K9me3 (EHMT2 and SETDB1, SUV39H1, and SUV39H2) are
all expressed in PGCs and AGCs (Figure 5A). However, using
immunofluorescence, we discovered that H3K9me2 is depleted
from PGCs and is subsequently found in AGCs in a punctate
pattern. In contrast, H3K9me3 is localized in a punctate pattern
in the human germline at all stages of development (Figures
S5B–S5E). Global loss of DNA methylation and H3K9me2 in
mouse PGCs occurs downstream of Prdm14 (Yamaji et al.,
2008). Using immunofluorescence, we found that PRDM14 pro-
tein is localized to the nucleus of human PGCs (Figure S5A),
although the RNA levels of PRDM14 are very low compared to
undifferentiated hESCs (Figure 5A). Taken together, the human
germline at 57 days of development is extremely demethylated,
has disabled its DNA methylation machinery, and has increased
expression of TET1. Furthermore, we show that H3K9me3 is a
stable silencing mark that can be identified in the germline at
all stages of development.
DISCUSSION
The human germline and pre-implantation embryos are excellent
in vivo models for quantifying both global and local sites of DNA
demethylation and identifying loci that escape demethylation
during nuclear reprogramming (Guo et al., 2014; Smith et al.,
2014). In the human germline, global demethylation leads to a
dramatic loss of almost all CGI methylation, which is consistent
with the finding that persistently methylated cytosines tend to
ylated DMRs at indicated genomic features. Enrichment is accepted if fold
< 0.05 and **p < 0.01.
ly expressed (DE) genes reveals limited to no overlap.
thylation difference in E6.5mouse epiblast (n = 499,541 total, variable n = 2,515)
ylation in 200 bpwindowswith > 6 CpG sites per window). n = 67,817 windows
tion of n = 1,471 persistently methylated windows (2.17%). For (C) (D), and (H),
Gmethylation. FDR, false discovery rate estimated from simulatedmethylomes
Cell 161, 1–12, June 4, 2015 ª2015 Elsevier Inc. 7
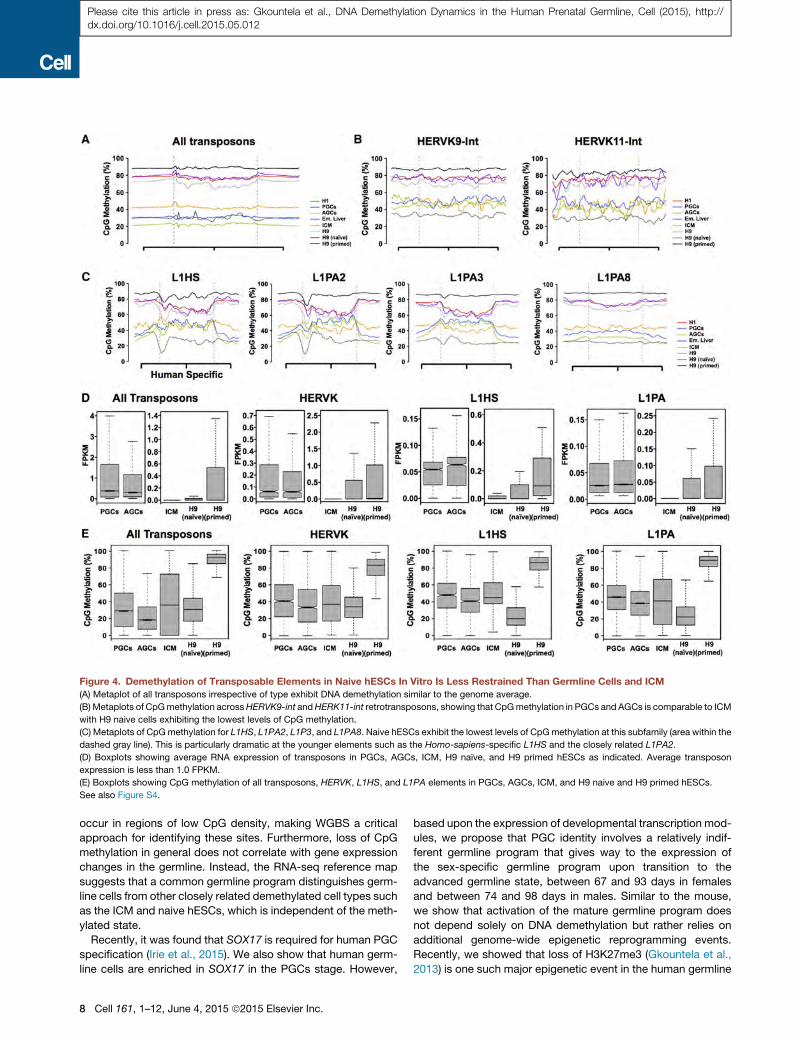
Figure 4. Demethylation of Transposable Elements in Naive hESCs In Vitro Is Less Restrained Than Germline Cells and ICM
(A) Metaplot of all transposons irrespective of type exhibit DNA demethylation similar to the genome average.
(B) Metaplots of CpGmethylation acrossHERVK9-int andHERK11-int retrotransposons, showing that CpGmethylation in PGCs and AGCs is comparable to ICM
with H9 naive cells exhibiting the lowest levels of CpG methylation.
(C) Metaplots of CpGmethylation for L1HS, L1PA2, L1P3, and L1PA8. Naive hESCs exhibit the lowest levels of CpGmethylation at this subfamily (area within the
dashed gray line). This is particularly dramatic at the younger elements such as the Homo-sapiens-specific L1HS and the closely related L1PA2.
(D) Boxplots showing average RNA expression of transposons in PGCs, AGCs, ICM, H9 naıve, and H9 primed hESCs as indicated. Average transposon
expression is less than 1.0 FPKM.
(E) Boxplots showing CpG methylation of all transposons, HERVK, L1HS, and L1PA elements in PGCs, AGCs, ICM, and H9 naive and H9 primed hESCs.
See also Figure S4.
Please cite this article in press as: Gkountela et al., DNA Demethylation Dynamics in the Human Prenatal Germline, Cell (2015), http://dx.doi.org/10.1016/j.cell.2015.05.012
occur in regions of low CpG density, making WGBS a critical
approach for identifying these sites. Furthermore, loss of CpG
methylation in general does not correlate with gene expression
changes in the germline. Instead, the RNA-seq reference map
suggests that a common germline program distinguishes germ-
line cells from other closely related demethylated cell types such
as the ICM and naive hESCs, which is independent of the meth-
ylated state.
Recently, it was found that SOX17 is required for human PGC
specification (Irie et al., 2015). We also show that human germ-
line cells are enriched in SOX17 in the PGCs stage. However,
8 Cell 161, 1–12, June 4, 2015 ª2015 Elsevier Inc.
based upon the expression of developmental transcription mod-
ules, we propose that PGC identity involves a relatively indif-
ferent germline program that gives way to the expression of
the sex-specific germline program upon transition to the
advanced germline state, between 67 and 93 days in females
and between 74 and 98 days in males. Similar to the mouse,
we show that activation of the mature germline program does
not depend solely on DNA demethylation but rather relies on
additional genome-wide epigenetic reprogramming events.
Recently, we showed that loss of H3K27me3 (Gkountela et al.,
2013) is one such major epigenetic event in the human germline
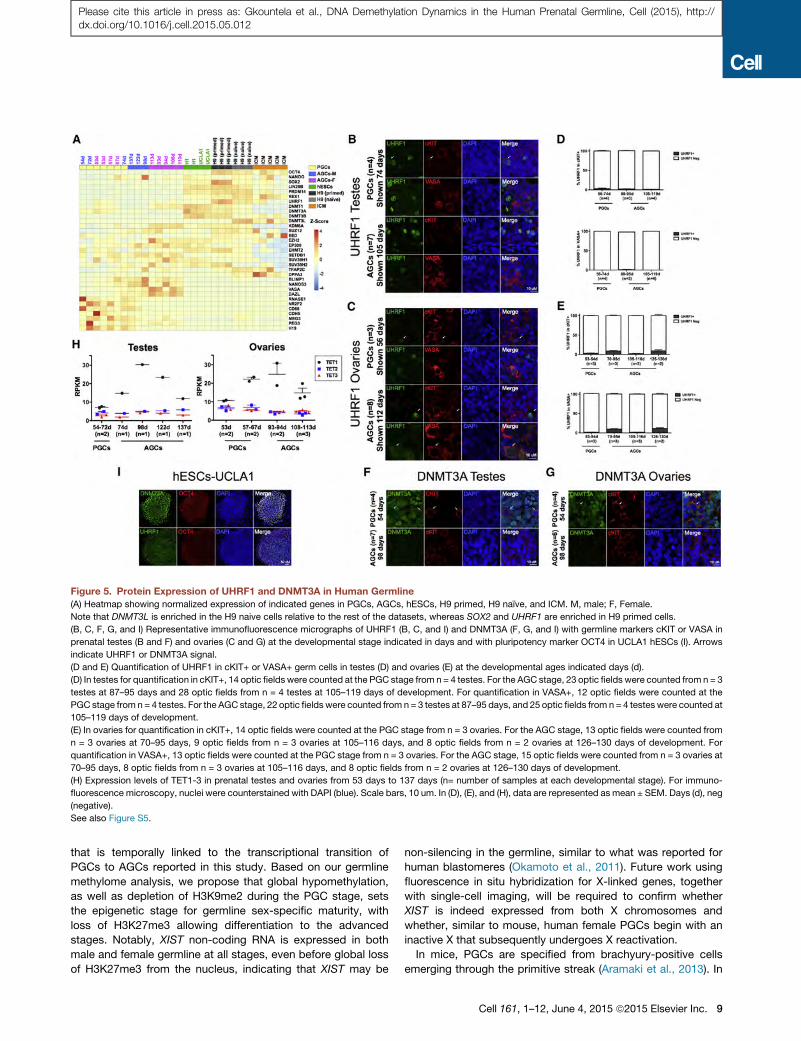
Figure 5. Protein Expression of UHRF1 and DNMT3A in Human Germline
(A) Heatmap showing normalized expression of indicated genes in PGCs, AGCs, hESCs, H9 primed, H9 naıve, and ICM. M, male; F, Female.
Note that DNMT3L is enriched in the H9 naive cells relative to the rest of the datasets, whereas SOX2 and UHRF1 are enriched in H9 primed cells.
(B, C, F, G, and I) Representative immunofluorescence micrographs of UHRF1 (B, C, and I) and DNMT3A (F, G, and I) with germline markers cKIT or VASA in
prenatal testes (B and F) and ovaries (C and G) at the developmental stage indicated in days and with pluripotency marker OCT4 in UCLA1 hESCs (I). Arrows
indicate UHRF1 or DNMT3A signal.
(D and E) Quantification of UHRF1 in cKIT+ or VASA+ germ cells in testes (D) and ovaries (E) at the developmental ages indicated days (d).
(D) In testes for quantification in cKIT+, 14 optic fields were counted at the PGC stage from n = 4 testes. For the AGC stage, 23 optic fields were counted from n = 3
testes at 87–95 days and 28 optic fields from n = 4 testes at 105–119 days of development. For quantification in VASA+, 12 optic fields were counted at the
PGC stage from n = 4 testes. For the AGC stage, 22 optic fields were counted from n = 3 testes at 87–95 days, and 25 optic fields from n = 4 testes were counted at
105–119 days of development.
(E) In ovaries for quantification in cKIT+, 14 optic fields were counted at the PGC stage from n = 3 ovaries. For the AGC stage, 13 optic fields were counted from
n = 3 ovaries at 70–95 days, 9 optic fields from n = 3 ovaries at 105–116 days, and 8 optic fields from n = 2 ovaries at 126–130 days of development. For
quantification in VASA+, 13 optic fields were counted at the PGC stage from n = 3 ovaries. For the AGC stage, 15 optic fields were counted from n = 3 ovaries at
70–95 days, 8 optic fields from n = 3 ovaries at 105–116 days, and 8 optic fields from n = 2 ovaries at 126–130 days of development.
(H) Expression levels of TET1-3 in prenatal testes and ovaries from 53 days to 137 days (n= number of samples at each developmental stage). For immuno-
fluorescence microscopy, nuclei were counterstained with DAPI (blue). Scale bars, 10 um. In (D), (E), and (H), data are represented as mean ± SEM. Days (d), neg
(negative).
See also Figure S5.
Please cite this article in press as: Gkountela et al., DNA Demethylation Dynamics in the Human Prenatal Germline, Cell (2015), http://dx.doi.org/10.1016/j.cell.2015.05.012
that is temporally linked to the transcriptional transition of
PGCs to AGCs reported in this study. Based on our germline
methylome analysis, we propose that global hypomethylation,
as well as depletion of H3K9me2 during the PGC stage, sets
the epigenetic stage for germline sex-specific maturity, with
loss of H3K27me3 allowing differentiation to the advanced
stages. Notably, XIST non-coding RNA is expressed in both
male and female germline at all stages, even before global loss
of H3K27me3 from the nucleus, indicating that XIST may be
non-silencing in the germline, similar to what was reported for
human blastomeres (Okamoto et al., 2011). Future work using
fluorescence in situ hybridization for X-linked genes, together
with single-cell imaging, will be required to confirm whether
XIST is indeed expressed from both X chromosomes and
whether, similar to mouse, human female PGCs begin with an
inactive X that subsequently undergoes X reactivation.
In mice, PGCs are specified from brachyury-positive cells
emerging through the primitive streak (Aramaki et al., 2013). In
Cell 161, 1–12, June 4, 2015 ª2015 Elsevier Inc. 9
Please cite this article in press as: Gkountela et al., DNA Demethylation Dynamics in the Human Prenatal Germline, Cell (2015), http://dx.doi.org/10.1016/j.cell.2015.05.012
contrast, sox17/SOX17 is considered a marker of definitive
endoderm and hemogenic endothelium in themouse and human
(Choi et al., 2012; D’Amour et al., 2005; Nakajima-Takagi et al.,
2013). This raises a critical question as to the germ layer origin
of PGCs in humans. Our data support the hypothesis that the hu-
man germline is not set aside in the ICMof human blastocysts, as
the transcriptome andmethylome of PGCs are distinct from ICM.
Instead, our data show that the transcriptome of germline cells
(but not the methylome) is closer to primed hESCs relative to
hESCs in the naive state or ICM. Human ESCs do not exist in
the embryo (they are in vitro cell types); therefore, the closer tran-
scriptional relationship of germline cells to primed hESCsmay be
due to expression of RNAs involved in embryo development
(Takashima et al., 2014). In future studies, our reference map
of the human germline transcriptome can be used to uncover
the transcriptional relationship between human PGCs and the
earliest germ layers in order to address this question.
In the current study, we used the RNA-seq and WGBS data of
naive hESCs cultured in t2iL+Go (Takashima et al., 2014). How-
ever, there are multiple approaches for generating naive hESCs
beginning with the first report using naive human stem cell media
(NHSM) to the more recent media called 5i/L/FA (Gafni et al.,
2013; Chan et al., 2013; Valamehr et al., 2014; Ware et al.,
2014; Takashima et al., 2014; Theunissen et al., 2014). PCA of
the published transcriptomes indicates that all approaches
generate naive cell types slightly different from each other, with
5iL/FA closest to t2iL+Go (Theunissen et al., 2014). We focused
on the t2iL+Go naive hESCs for our study because it was the only
dataset to include both WGBS and RNA-seq on the same
sequencing platform. Our results indicate that reversion to the
naive state in t2iL+Go creates an in vitro cell type that is more de-
methylated compared to the ICM it is hypothesized to represent.
We found that a consistent occurrence in this media was the
unbridled demethylation at young L1 transposable elements
L1HS and L1PA2. The more restrained demethylation at these
features in ICM and germline suggests that the mechanisms
either targeting or preventing demethylation at these discreet
sites are different in vivo relative to reversion in vitro. Alterna-
tively, the HERV expression pattern in the naive hESCs and
especially the elevated HERVH family levels could serve as a
cellular identity marker in naive hESCs, essential for safeguard-
ing self-renewal (Wang et al., 2014a; Goke et al., 2015). In future
studies, it will be critical to determine whether the other naive
medias, or reversion of other cell types in the same media, ac-
quire a similar demethylated state as H9 in t2iL+Go. We show
that our reference map of human germline cells combined with
the work in the human pre-implantation embryo will be critical
for interpreting future reversion strategies to the naive state.
Global demethylation at transposable elements in general
does not lead to transcriptional activation, raising an important
question as to the mechanisms by which active transposons
are silenced in the human germline during prenatal life, given
the depletion of repressive chromatin marks such as H3K9me2
and H3K27me3 (Gkountela et al., 2013). The finding that L1HS
transposons are highly methylated at all stages of germline
development relative to the older and extinct L1PA ancestors
could indicate that methylation is employed as a first line of de-
fense by the germline for the transcriptional repression of L1HS.
10 Cell 161, 1–12, June 4, 2015 ª2015 Elsevier Inc.
This is supported by the finding that a small decrease in methyl-
ation between PGCs and AGCs is associated with a median
increase in L1HS expression in AGCs. One purpose for themain-
tained DNA methylation at young potentially active transposons
could be to facilitate C-Tmutations and transposon extinction. In
support of this, extinct L1PA ancestors have progressively fewer
CpG nucleotides as a result of C-T conversion than the younger
active elements (Walser et al., 2008). Alternatively, active trans-
posons that escape demethylation may impact silencing of sur-
rounding genomic regions leading to positional effects in vivo.
The primed to naive reversion and ultralow methylation at the
50end of L1HS could be used as a tractable model to test this.
In the current study, we did not distinguish between 5mC and
5hmC in the human germline genome. In the mouse germline,
5mC is rapidly oxidized to 5hmC in a very discreet window be-
tween E10.5 to E12.5 (Hackett et al., 2013), which is now referred
to as stage II germline DNA demethylation (reviewed by Lee
et al., 2014; Vincent et al., 2013; Yamaguchi et al., 2013). In
contrast, stage I DNA demethylation (which occurs from E7.5
to E9.5) removes around 50% of methylated CpGs from the
genome using a Tet-independent mechanism (Vincent et al.,
2013). Given that the human germline has already completed
stage I DNA demethylation by 57 days of life (the equivalent of
E9.5 in mice), we hypothesize that the removal of DNA methyl-
ation between 57 and 113 days also involves oxidation to
5hmC at discreet loci. Indeed, in previous studies, we could
simultaneously identify both 5mC and 5hmC during DNA deme-
thylation (Gkountela et al., 2013), indicating that conversion of
5mC to 5hmC is heterogeneous both at individual loci and also
at individual cells within a gonad. Given that we continue to
see DNA demethylation from 67 to 113 days, our study suggests
that stage II demethylation in humans takes months (rather
than days) and that re-methylation at discreet genomic features
occurs before demethylation is complete. Notably, the small
amount of re-methylation in female mouse germline cells be-
tween E13.5 and E16.5 at intragenic CGI-containing DMRs is
conserved in humans. However, unlike mice, it temporally over-
laps with the final stages of demethylation. Therefore, given the
protracted stage II demethylation in the human germline relative
to the mouse, the analysis of 5hmC in future studies should
involve analysis of 5hmC and 5mC in the same gonad or alterna-
tively single-cell 5hmC analysis within the one gonad when the
technology becomes available.
Taken together, the RNA-seq and WGBS reference maps of
the human germline described here provide a critical reference
for in vivo DNA demethylation beyond the methylated state at-
tained in the human blastocyst (Guo et al., 2014; Smith et al.,
2014). Specifically, we have identified methylated regions in
the human germline that are targeted for deeper demethylation
in H9 naive hESCs, suggesting that these transposons should
be carefully monitored in naive hESC cultures with extended cul-
ture. We also discovered dynamic locus-specific maintenance
and de novo DNAmethylation in a background of extreme global
genome demethylation, a phenomenon also reported in human
embryos in which a number of loci are seen to escape DNA de-
methylation (Smith et al., 2014). Thus, global DNA demethylation
is a complex process in which global and local mechanismswork
together to shape the epigenome.
Please cite this article in press as: Gkountela et al., DNA Demethylation Dynamics in the Human Prenatal Germline, Cell (2015), http://dx.doi.org/10.1016/j.cell.2015.05.012
EXPERIMENTAL PROCEDURES
RNA-Seq Data Analysis
Differential gene expression analysis was performed using the packages DE-
Seq (Anders and Huber, 2010) and edgeR (Robinson et al., 2010) in R (http://
www.R-project.org). Raw read counts (GEO accession number GSE63392)
were used and modeled based on a negative binomial distribution. We filtered
out genes with RPKM < 1 in both groups. The multiple testing errors were
corrected by the false discovery rate (FDR). In addition to the FDR of < 0.05,
we considered differentially expressed genes as having >2-fold difference.
Thus, in summary, we considered genes as differentially expressed if (1) the
FDR was less than 0.05; (2) the expression ratio between two time points
was >23; (3) the maximal RPKM value for at least one group in the comparison
was >1; and (4) there was agreement between DESeq and edgeR. See also the
Supplemental Experimental Procedures.
Weighted Gene Co-expression Network Analysis
To understand which gene networks determine gene expression difference
between cell populations at a systems level, we performed WGCNA (Lang-
felder and Horvath, 2008). This unsupervised and unbiased analysis identified
distinct co-expression modules by clustering transcripts with the similar
expression pattern across samples. To further understand the cell population
specificity of the modules, we correlated the identified module eigengenes
with traits represented as the theoretical expression patterns for all cell popu-
lations in a binary fashion.
Genome-wide DNA Methylation Profiles
The raw data have been deposited to GEO (accession number GSE63392).
Bisulfite converted reads were aligned to the reference genome (hg19) using
BS Seeker 2 (Guo et al., 2013). Genome-wide DNA methylation profiles were
generated by determining methylation levels for each cytosine in the genome.
Because bisulfite treatment converts unmethylated cytosines (Cs) to thymines
(Ts) after PCR amplification, the methylation level at each cytosine was esti-
mated as #C/(#C+#T), where #C is the number of methylated reads and #T
is the number of unmethylated reads. The methylation level per cytosine
serves as an estimate of the percentage of cells that have a methylated cyto-
sine at a specific locus.We only included cytosines that are covered by at least
three reads. The resulting methylation profiles from germ cells covered up to
77% of the cytosines genome wide (see Table S2).
ACCESSION NUMBERS
The accession numbers for the raw data reported in this paper are GEO:
GSE63392 and GEO: GSE63393.
SUPPLEMENTAL INFORMATION
Supplemental Information includes Supplemental Experimental Procedures,
five figures, and four tables and can be found with this article online at
http://dx.doi.org/10.1016/j.cell.2015.05.012.
AUTHOR CONTRIBUTIONS
S.G. performed experiments and data interpretation and wrote manuscript;
K.X.Z. performed RNA-seq data analysis; T.A.S. performed immunofluores-
cence staining; W.-W.L. performed WGBS data analysis; J.H.-C. performed
confocal microscopy; P.-Y.C. designed and performed the RNA-seq, WGBS
data analysis, and interpretation and wrote the manuscript; and A.T.C.
conceived experiments, performed data analysis, and wrote the manuscript.
ACKNOWLEDGMENTS
The authors would like to thank the UCLA BSCRC flow cytometry core for flow
and FACS assistance and BSCRC High Throughput Sequencing core. This
work was supported by grants from the NIH (NIH/NICHD HD058047 and
NIH/NICHD HD079546) awarded to A.T.C., as well as the Eli and Edythe Broad
Center of Regenerative Medicine and Stem Cell Research and by grants from
Academia Sinica and National Health Research Institutes, Taiwan (NHRI-
EXI03-10324SC) to P.-Y.C. We would also like to acknowledge the support
of the California Institute for Regenerative Medicine (CIRM) Predoctoral
training grant (TG2-01169) for funding J.H.-C.
Received: November 14, 2014
Revised: February 13, 2015
Accepted: March 25, 2015
Published: May 21, 2015
REFERENCES
Anders, S., and Huber,W. (2010). Differential expression analysis for sequence
count data. Genome Biol. 11, R106.
Aramaki, S., Hayashi, K., Kurimoto, K., Ohta, H., Yabuta, Y., Iwanari, H., Mo-
chizuki, Y., Hamakubo, T., Kato, Y., Shirahige, K., and Saitou, M. (2013). A
mesodermal factor, T, specifies mouse germ cell fate by directly activating
germline determinants. Dev. Cell 27, 516–529.
Chan, Y.S., Goke, J., Ng, J.H., Lu, X., Gonzales, K.A., Tan, C.P., Tng, W.Q.,
Hong, Z.Z., Lim, Y.S., and Ng, H.H. (2013). Induction of a human pluripotent
state with distinct regulatory circuitry that resembles preimplantation epiblast.
Cell Stem Cell 13, 663–675.
Chen, P.Y., Feng, S., Joo, J.W., Jacobsen, S.E., and Pellegrini, M. (2011). A
comparative analysis of DNA methylation across human embryonic stem
cell lines. Genome Biol. 12, R62.
Choi, E., Kraus, M.R., Lemaire, L.A., Yoshimoto, M., Vemula, S., Potter, L.A.,
Manduchi, E., Stoeckert, C.J., Jr., Grapin-Botton, A., and Magnuson, M.A.
(2012). Dual lineage-specific expression of Sox17 during mouse embryogen-
esis. Stem Cells 30, 2297–2308.
D’Amour, K.A., Agulnick, A.D., Eliazer, S., Kelly, O.G., Kroon, E., and Baetge,
E.E. (2005). Efficient differentiation of human embryonic stem cells to definitive
endoderm. Nat. Biotechnol. 23, 1534–1541.
Ficz, G., Hore, T.A., Santos, F., Lee, H.J., Dean, W., Arand, J., Krueger, F., Ox-
ley, D., Paul, Y.L., Walter, J., et al. (2013). FGF signaling inhibition in ESCs
drives rapid genome-wide demethylation to the epigenetic ground state of plu-
ripotency. Cell Stem Cell 13, 351–359.
Gafni, O., Weinberger, L., Mansour, A.A., Manor, Y.S., Chomsky, E., Ben-Yo-
sef, D., Kalma, Y., Viukov, S., Maza, I., Zviran, A., et al. (2013). Derivation of
novel human ground state naive pluripotent stem cells. Nature 504, 282–286.
Gkountela, S., Li, Z., Vincent, J.J., Zhang, K.X., Chen, A., Pellegrini, M., and
Clark, A.T. (2013). The ontogeny of cKIT+ human primordial germ cells proves
to be a resource for human germ line reprogramming, imprint erasure and
in vitro differentiation. Nat. Cell Biol. 15, 113–122.
Goke, J., Lu, X., Chan, Y.S., Ng, H.H., Ly, L.H., Sachs, F., and Szczerbinska, I.
(2015). Dynamic transcription of distinct classes of endogenous retroviral ele-
ments marks specific populations of early human embryonic cells. Cell Stem
Cell 16, 135–141.
Guo, W., Fiziev, P., Yan, W., Cokus, S., Sun, X., Zhang, M.Q., Chen, P.Y., and
Pellegrini, M. (2013). BS-Seeker2: a versatile aligning pipeline for bisulfite
sequencing data. BMC Genomics 14, 774.
Guo, H., Zhu, P., Yan, L., Li, R., Hu, B., Lian, Y., Yan, J., Ren, X., Lin, S., Li, J.,
et al. (2014). The DNA methylation landscape of human early embryos. Nature
511, 606–610.
Habibi, E., Brinkman, A.B., Arand, J., Kroeze, L.I., Kerstens, H.H., Matarese,
F., Lepikhov, K., Gut, M., Brun-Heath, I., Hubner, N.C., et al. (2013). Whole-
genome bisulfite sequencing of two distinct interconvertible DNA methylomes
of mouse embryonic stem cells. Cell Stem Cell 13, 360–369.
Hackett, J.A., Sengupta, R., Zylicz, J.J., Murakami, K., Lee, C., Down, T.A.,
and Surani, M.A. (2013). Germline DNA demethylation dynamics and imprint
erasure through 5-hydroxymethylcytosine. Science 339, 448–452.
Hajkova, P. (2011). Epigenetic reprogramming in the germline: towards the
ground state of the epigenome. Philos. Trans. R. Soc. Lond. B Biol. Sci. 366,
2266–2273.
Cell 161, 1–12, June 4, 2015 ª2015 Elsevier Inc. 11
Please cite this article in press as: Gkountela et al., DNA Demethylation Dynamics in the Human Prenatal Germline, Cell (2015), http://dx.doi.org/10.1016/j.cell.2015.05.012
Hajkova, P., Ancelin, K., Waldmann, T., Lacoste, N., Lange, U.C., Cesari, F.,
Lee, C., Almouzni, G., Schneider, R., and Surani, M.A. (2008). Chromatin dy-
namics during epigenetic reprogramming in the mouse germ line. Nature
452, 877–881.
Heard, E., and Martienssen, R.A. (2014). Transgenerational epigenetic inheri-
tance: myths and mechanisms. Cell 157, 95–109.
Irie, N., Weinberger, L., Tang, W.W., Kobayashi, T., Viukov, S., Manor, Y.S., Di-
etmann, S., Hanna, J.H., and Surani, M.A. (2015). SOX17 is a critical specifier
of human primordial germ cell fate. Cell 160, 253–268.
Kobayashi, H., Sakurai, T., Miura, F., Imai, M., Mochiduki, K., Yanagisawa, E.,
Sakashita, A., Wakai, T., Suzuki, Y., Ito, T., et al. (2013). High-resolution DNA
methylome analysis of primordial germ cells identifies gender-specific reprog-
ramming in mice. Genome Res. 23, 616–627.
Kurimoto, K., Yabuta, Y., Ohinata, Y., Shigeta, M., Yamanaka, K., and Saitou,
M. (2008). Complex genome-wide transcription dynamics orchestrated by
Blimp1 for the specification of the germ cell lineage in mice. Genes Dev. 22,
1617–1635.
Langfelder, P., and Horvath, S. (2008). WGCNA: an R package for weighted
correlation network analysis. BMC Bioinformatics 9, 559.
Laurent, L., Wong, E., Li, G., Huynh, T., Tsirigos, A., Ong, C.T., Low, H.M., Kin
Sung, K.W., Rigoutsos, I., Loring, J., andWei, C.L. (2010). Dynamic changes in
the human methylome during differentiation. Genome Res. 20, 320–331.
Lee, H.J., Hore, T.A., and Reik, W. (2014). Reprogramming the methylome:
erasing memory and creating diversity. Cell Stem Cell 14, 710–719.
Lister, R., Pelizzola, M., Kida, Y.S., Hawkins, R.D., Nery, J.R., Hon, G., Antosie-
wicz-Bourget, J., O’Malley, R., Castanon, R., Klugman, S., et al. (2011). Hot-
spots of aberrant epigenomic reprogramming in human induced pluripotent
stem cells. Nature 471, 68–73.
McLean, C.Y., Bristor, D., Hiller, M., Clarke, S.L., Schaar, B.T., Lowe, C.B.,
Wenger, A.M., and Bejerano, G. (2010). GREAT improves functional interpre-
tation of cis-regulatory regions. Nat. Biotechnol. 28, 495–501.
Nakajima-Takagi, Y., Osawa, M., Oshima, M., Takagi, H., Miyagi, S., Endoh,
M., Endo, T.A., Takayama, N., Eto, K., Toyoda, T., et al. (2013). Role of
SOX17 in hematopoietic development from human embryonic stem cells.
Blood 121, 447–458.
Okamoto, I., Patrat, C., Thepot, D., Peynot, N., Fauque, P., Daniel, N., Diaban-
gouaya, P., Wolf, J.P., Renard, J.P., Duranthon, V., and Heard, E. (2011).
Eutherian mammals use diverse strategies to initiate X-chromosome inactiva-
tion during development. Nature 472, 370–374.
Rebollo, R., Miceli-Royer, K., Zhang, Y., Farivar, S., Gagnier, L., and Mager,
D.L. (2012). Epigenetic interplay between mouse endogenous retroviruses
and host genes. Genome Biol. 13, R89.
Robinson, M.D., McCarthy, D.J., and Smyth, G.K. (2010). edgeR: a Bio-
conductor package for differential expression analysis of digital gene expres-
sion data. Bioinformatics 26, 139–140.
12 Cell 161, 1–12, June 4, 2015 ª2015 Elsevier Inc.
Seisenberger, S., Andrews, S., Krueger, F., Arand, J., Walter, J., Santos, F.,
Popp, C., Thienpont, B., Dean, W., and Reik, W. (2012). The dynamics of
genome-wide DNA methylation reprogramming in mouse primordial germ
cells. Mol. Cell 48, 849–862.
Smith, Z.D., Chan, M.M., Humm, K.C., Karnik, R., Mekhoubad, S., Regev, A.,
Eggan, K., and Meissner, A. (2014). DNA methylation dynamics of the human
preimplantation embryo. Nature 511, 611–615.
Takashima, Y., Guo, G., Loos, R., Nichols, J., Ficz, G., Krueger, F., Oxley, D.,
Santos, F., Clarke, J., Mansfield,W., et al. (2014). Resetting transcription factor
control circuitry toward ground-state pluripotency in human. Cell 158, 1254–
1269.
Theunissen, T.W., Powell, B.E., Wang, H., Mitalipova, M., Faddah, D.A.,
Reddy, J., Fan, Z.P., Maetzel, D., Ganz, K., Shi, L., Lungjangwa, T., et al.
(2014). Systematic identification of culture conditions for induction and main-
tenance of naive human pluripotency. Cell Stem Cell 15, 471–487.
Valamehr, B., Robinson, M., Abujarour, R., Rezner, B., Vranceanu, F., Le, T.,
Medcalf, A., Lee, T.T., Fitch, M., Robbins, D., and Flynn, P. (2014). Platform
for induction and maintenance of transgene-free hiPSCs resembling ground
state pluripotent stem cells. Stem Cell Reports 2, 366–381.
Vincent, J.J., Huang, Y., Chen, P.Y., Feng, S., Calvopina, J.H., Nee, K., Lee,
S.A., Le, T., Yoon, A.J., Faull, K., et al. (2013). Stage-specific roles for tet1
and tet2 in DNA demethylation in primordial germ cells. Cell Stem Cell 12,
470–478.
Walser, J.C., Ponger, L., and Furano, A.V. (2008). CpG dinucleotides and the
mutation rate of non-CpG DNA. Genome Res. 18, 1403–1414.
Wang, J., Xie, G., Singh, M., Ghanbarian, A.T., Rasko, T., Szvetnik, A., Cai, H.,
Besser, D., Prigione, A., Fuchs, N.V., et al. (2014a). Primate-specific endoge-
nous retrovirus-driven transcription defines naive-like stem cells. Nature 516,
405–409.
Wang, L., Zhang, J., Duan, J., Gao, X., Zhu, W., Lu, X., Yang, L., Zhang, J., Li,
G., Ci, W., et al. (2014b). Programming and inheritance of parental DNA meth-
ylomes in mammals. Cell 157, 979–991.
Ware, C.B., Nelson, A.M., Mecham, B., Hesson, J., Zhou, W., Jonlin, E.C., Ji-
menez-Caliani, A.J., Deng, X., Cavanaugh, C., Cook, S., et al. (2014). Deriva-
tion of naive human embryonic stem cells. Proc. Natl. Acad. Sci. USA 111,
4484–4489.
Yamaguchi, S., Hong, K., Liu, R., Inoue, A., Shen, L., Zhang, K., and Zhang, Y.
(2013). Dynamics of 5-methylcytosine and 5-hydroxymethylcytosine during
germ cell reprogramming. Cell Res. 23, 329–339.
Yamaji, M., Seki, Y., Kurimoto, K., Yabuta, Y., Yuasa, M., Shigeta, M., Yama-
naka, K., Ohinata, Y., and Saitou, M. (2008). Critical function of Prdm14 for the
establishment of the germ cell lineage in mice. Nat. Genet. 40, 1016–1022.
Yan, L., Yang, M., Guo, H., Yang, L., Wu, J., Li, R., Liu, P., Lian, Y., Zheng, X.,
Yan, J., et al. (2013). Single-cell RNA-Seq profiling of human preimplantation
embryos and embryonic stem cells. Nat. Struct. Mol. Biol. 20, 1131–1139.