Embed Size (px)
Citation preview

Table of Contents
October 2017 Addendum 1 to the
August 2016 Cancer Data Review
(1985-2013) – Selected Zip Codes
of Warminster (18974), Warrington
(18976) and Horsham (19044),
Pennsylvania
Division of Environmental Health Epidemiology
October 2017

2
October 2017 Addendum 1 to the August 2016 Cancer Data Review (1985-2013) – Selected Zip Codes of Warminster (18974), Warrington (18976) and Horsham (19044), Pennsylvania
DEPARTMENT OF HEALTH
Table of Contents
Executive Summary 3
Purpose 5
Background 6
Methodology 6
Results 9
Pancreatic Cancer Results (all ages) 9
Pediatric (0-19 years) Cancer Results 10
Discussion 11
Pancreatic Cancer Discussion 12
Pediatric Cancer Discussion 14
Limitations 17
Conclusions 18
Citations 20

3
October 2017 Addendum 1 to the August 2016 Cancer Data Review (1985-2013) – Selected Zip Codes of Warminster (18974), Warrington (18976) and Horsham (19044), Pennsylvania
DEPARTMENT OF HEALTH
Executive Summary
This update is addendum 1 to the cancer review and update for the Warminster, Warrington
and Horsham community released in August 2016. The Pennsylvania Department of Health
(DOH) completed this update in response to community questions about pancreatic and
pediatric cancer rates in the area.
• For pancreatic cancer, there appears to be an increase in the number of new
pancreatic cancer cases in the zip codes reviewed relative to the state when
comparing the time periods evaluated in this update.
o Further analysis of the pancreatic cancer rates for this community is
recommended. Additional mapping and other analyses will help us better
understand the pancreatic cancer rates in this area.
o It is important to keep in mind the limited information supporting links between
chemical exposures and pancreatic cancer.
• Cancers and birth defects in children have been of special concern in this community
for many years. The number of pediatric cancer cases reported to the state cancer
registry was too small to support analysis at the individual zip code level. Therefore,
pediatric cancers were evaluated across all three zip codes of interest combined in
this analysis. Pediatric cancer rates did not show any statistically significant change
in comparison to the state rates in the zip codes (combined) over the three time
periods of interest or over the entire duration of 1985-2013.
• Given these findings and the legacy of environmental contamination in this area,
DOH remains committed to evaluating new data or additional information as it
becomes available for this community. Further, an addendum 2 to this work is also
planned. This second update will produce new calculated rates for all of the cancer
types in the original 2016 document (as well as these two additional cancer types)
using the public water system boundaries instead of zip codes as the basis of for the
population in the evaluation. This will more accurately represent the population of

4
October 2017 Addendum 1 to the August 2016 Cancer Data Review (1985-2013) – Selected Zip Codes of Warminster (18974), Warrington (18976) and Horsham (19044), Pennsylvania
DEPARTMENT OF HEALTH
people exposed to the contaminate on in the public drinking water supply. DOH will
also consider further analyses of the pancreatic cancer information for this area,
including mapping the locations of the pancreatic cases over time.

5
October 2017 Addendum 1 to the August 2016 Cancer Data Review (1985-2013) – Selected Zip Codes of Warminster (18974), Warrington (18976) and Horsham (19044), Pennsylvania
DEPARTMENT OF HEALTH
Purpose
DOH developed this addendum to provide information about pancreatic and pediatric cancer
incidence rates for communities living in zip codes surrounding the former Naval Air Warfare
Center in Warminster, Bucks County, Pa. and the Willow Grove Naval Air and Air Reserve
Station, Horsham, Montgomery County, Pa. for the period 1985–2013.
Previously, the Agency for Toxic Substances and Disease Registry (ATSDR) and DOH
assessed incidence rates of seven selected cancers (bladder, kidney, liver, non-Hodgkin’s
lymphoma, multiple myeloma, prostate and testicular) in communities living in zip codes 18974,
18976 and 19044 (Figure 1). The cancer review was published in a document released in
August 2016 and is available at https://www.atsdr.cdc.gov/HAC/pha/CancerDataReviewPA/
CancerDataReview_PA_508.pdf. These original seven cancers were selected based
on associations in the literature of these cancer types
and the historical environmental contaminants of
concern in drinking water in this area. Please see the
background section below for a description of the
specific chemicals found in drinking water in this
community.
This addendum was prepared to respond to requests
from the public to also examine the incidence rates of
pancreatic and pediatric cancers (pediatric cancers in
this review are defined as cancers diagnosed in
newborns through adolescence, or children 0-19
years of age) in the same region and over the same
time period previously assessed. Note: previous studies have not reported firm associations
between pancreatic and pediatric cancers and the contaminants of concern identified in
drinking water in the area.
Figure 1: Zip Code Areas Near Warminster and Willow Grove
Naval Sites
Source: August 2016 Cancer Data Review Report

6
October 2017 Addendum 1 to the August 2016 Cancer Data Review (1985-2013) – Selected Zip Codes of Warminster (18974), Warrington (18976) and Horsham (19044), Pennsylvania
DEPARTMENT OF HEALTH
Background
Residents have raised concerns about environmental contamination and health problems over
many years in the Warminster and Willow Grove area. Specific contaminants detected in public
and/or private drinking water in the area include:
• in the 1970s, volatile chemicals such as tetrachlorethene (PCE), trichloroethylene
(TCE), 1,2-dichloroethene (1,2, DCE) and carbon tetrachloride); and
• more recently in 2014, perfluoroalkyl substances (PFAS) such as perfluorooctane
sulfonate (PFOS) and perfluorooctanoic acid (PFOA). These chemicals were likely used
in firefighting foams for decades in this area.
Methodology
A cancer incidence analysis is the primary tool used by DOH to investigate the possibility of
excess cancer in a community. For a cancer incidence analysis, DOH calculates incidence
rates using information reported by hospitals and health care providers to the Pennsylvania
state cancer registry and compares this information at the zip code level to state- or county-
wide rates by calculating standardized incidence ratios. A cancer incidence analysis is
specifically intended to address the question “Is there an excess of cancer in the area or
population of concern?” It cannot determine if past exposures to contaminants caused, or
contributed to, the observed cancer cases. DOH follows guidelines recommended by CDC and
the Council of State and Territorial Epidemiologists (CSTE) for investigating concerns about
cancer clusters available at https://www.cdc.gov/mmwr/preview/mmwrhtml/rr6208a1.htm. If
DOH determines that further investigation into a cancer cluster concern is warranted, DOH will
consider further epidemiologic evidence and analyses, as feasible, and site-specific
circumstances. DOH must also factor into consideration that excesses of cancer may occur by
chance alone. For this community, DOH and ATSDR evaluated time trends by evaluating three
time periods: 1985 to 1994, 1995 to 2004 and 2005 to 2013. DOH also reviewed cancer
incidence rates for the combined three zip codes over these time periods.

7
October 2017 Addendum 1 to the August 2016 Cancer Data Review (1985-2013) – Selected Zip Codes of Warminster (18974), Warrington (18976) and Horsham (19044), Pennsylvania
DEPARTMENT OF HEALTH
To determine whether a statistically significant excess of cancer existed in the geographic
areas of concern, the number of observed cases was compared to what would be "expected"
based on the state cancer rates. Calculating the expected number(s) of cancer cases takes
into consideration the sex and ages of people who are diagnosed with cancer. This is important
because sex and age impact cancer rates. If we are trying to determine if there is more or less
cancer in a community compared to the rest of the state or county, we must make sure that the
difference in cancer rates is not simply due to one of these factors.
For this cancer incidence analysis as well as in the August 2016 review, DOH calculated
incidence rates of pancreatic and pediatric cancers using information reported to the
Pennsylvania state cancer registry and compared this information at the zip code level to
statewide rates by calculating standardized incidence ratios (SIRs). DOH also reviewed cancer
incidence rates for the combined three zip codes over these time periods. To determine
whether a statistically significant excess of cancer existed in the geographic areas of concern,
the number of observed cases was compared to what would be “expected” based on the state
cancer rates.
Statistical significance implies that less than a certain percent chance (usually selected as 5
percent) exists that the observed difference is merely the result of random fluctuation in the
number of observed cancer cases. Statistical significance is impacted by variability (or random
fluctuations in the number of cancer cases reported) and sample size. Differences between
populations may not achieve statistical significance if sample sizes are small, even if an actual
difference exists. Statistical significance can be determined by examining the confidence
interval, which is the computed interval with a given confidence (usually 95 percent) that the
true value of an estimate is contained within the interval. For example, if the confidence interval
does not include 1.0 and the interval is below 1.0, then the number of cases is significantly
lower than expected. Similarly, if the confidence interval does not include 1.0 and the interval
is above 1.0, then a statistically significant excess exists in the number of cases. If the
confidence interval includes 1.0, then the true ratio may be 1.0, and the conclusion cannot be
made with sufficient confidence that the observed number of cases reflects a real excess or
deficit. As long as the 95% confidence interval contains 1.0, the indication is that the SIR is still

8
October 2017 Addendum 1 to the August 2016 Cancer Data Review (1985-2013) – Selected Zip Codes of Warminster (18974), Warrington (18976) and Horsham (19044), Pennsylvania
DEPARTMENT OF HEALTH
within the range expected on the basis of the disease experience of the comparison population.
Note, it may be worthwhile to further consider cancer rates in a community that do not reach
statistical significance if there is strong scientific information supporting an association between
the cancer(s) of interest and an identified chemical exposure in a community, as well as
plausibility with the exposure scenario. As stated in the CDC and CSTE cancer cluster
guidelines referenced earlier, “In addition to whether the SIR is statistically significant, the
investigators should consider the suspected cluster in the context of the plausibility that the
cancers could share a common etiology based on the latency, on community patterns of
migration in and out, known risk factors for the cancer of concern, and the potential for exposure
to a contaminant of concern, as well as other factors.”
The width of the confidence interval also reflects the stability of the ratio estimate. For example,
a narrow confidence interval (e.g., 1.03–1.15) allows a fair level of certainty that the calculated
ratio is close to the true ratio for the population. A wide interval (e.g., 0.85–4.50) leaves
considerable doubt about the true ratio, which could be much lower or much higher than the
calculated ratio1.
DOH summed together cases of different cancer types in children aged 0-19 to evaluate rates
of pediatric cancers in this community. The cancer types considered were leukemia,
myeloproliferative diseases and myelodysplastic diseases; lymphomas and reticuloendothelial
neoplasms; CNS and miscellaneous intracranial and intra-spinal neoplasms; neuroblastoma
and other peripheral nervous cell tumors; soft tissue and other extra osseous sarcomas;
retinoblastoma; renal tumors; hepatic tumors; malignant bone tumors; germ cell tumors,
trophoblastic tumors and neoplasms of gonads; other malignant epithelial neoplasms and
malignant melanomas; and other unspecified malignant neoplasms. Due to small numbers for
pediatric cancers (1) the zip codes were combined for calculating pediatric SIRs for the three
separate time periods; and (2) the time periods were combined for calculating pediatric SIRS
for the three separate zip codes.

9
October 2017 Addendum 1 to the August 2016 Cancer Data Review (1985-2013) – Selected Zip Codes of Warminster (18974), Warrington (18976) and Horsham (19044), Pennsylvania
DEPARTMENT OF HEALTH
Results
Pancreatic Cancer Results (all ages)
Table 1 summarizes the pancreatic cancer results for this community. In the earliest time period
reviewed (1985-1994), the rates for pancreatic cancer were lower than the state rates for both
sexes in all the three zip codes, including few statistically significant reductions.
• For males, 1985-1994, pancreatic incidence rate was approximately 0.4 times lower
than the statewide rate in zip code 18974.
• For females, 1985-1994, pancreatic incidence rate was approximately 0.3 times lower
than the statewide rate in zip code 18976.
• For males, 1985-1994, pancreatic incidence rate was approximately 0.5 times lower
than the statewide rate in the three zip codes combined (18974, 18976, 19044).
• For females, 1985-1994, pancreatic incidence rate was approximately 0.6 times lower
than the statewide rate in the three zip codes combined (18974, 18976, 19044).
Table 1. Pancreatic Cancer Incidence in Warminster, Warrington and Horsham, Pa. (1985-2013)
**Statistically significant, lower relative to state; p < 0.05; *Statistically significant, higher relative to state; p < 0.05; Data source – Pennsylvania Cancer Registry, U.S. Census Bureau
From 1995-2004, none of the rates for pancreatic cancer were statistically different from those
of the state in any of the zip codes.
Observed Expected SIR 95% CI Observed Expected SIR 95% CI Observed Expected SIR 95% CI
Male 9 25 0.36** 0.16 - 0.68 29 24 1.21 0.81 - 1.74 38 22 1.71* 1.21 - 2.35
Female 19 29 0.65 0.39 - 1.02 25 22 1.12 0.73 - 1.66 47 20 2.36* 1.73 - 3.14
Male 9 9 0.95 0.44 - 1.81 8 7 1.07 0.46 - 2.11 9 7 1.3 0.59 - 2.47
Female 3 10 0.29** 0.06 - 0.85 11 6 1.72 0.86 - 3.07 14 6 2.09* 1.2 - 3.67
Male 2 6 0.34 0.04 - 1.24 12 7 1.76 0.91 - 3.07 9 6 1.52 0.69 - 2.88
Female 4 6 0.68 0.19 - 1.74 4 6 0.67 0.18 - 1.72 13 6 2.23* 1.19 - 3.81
Male 20 40 0.50** 0.3 - 0.77 49 38 1.28 0.95 - 1.69 56 35 1.60* 1.21 - 2.08
Female 26 45 0.57** 0.37 - 0.84 40 35 1.15 0.82 - 1.57 74 32 2.30* 1.81 - 2.89
1985-1994 1995-2004 2005-2013
19044
Combined (3
Zips)
18974
18976
Zip code Sex

10
October 2017 Addendum 1 to the August 2016 Cancer Data Review (1985-2013) – Selected Zip Codes of Warminster (18974), Warrington (18976) and Horsham (19044), Pennsylvania
DEPARTMENT OF HEALTH
In the most recent time period reviewed (2005-2013), the pancreatic rates for both sexes in all
of the three zip codes combined and in the three individual zip codes were significantly higher
than the statewide rates, with the exception of the rate for males in zip codes 18976 and 19044.
• For males, 2005-2013, pancreatic incidence rate was approximately 1.7 times higher
than the statewide rate in zip code 18974.
• For females, 2005-2013, pancreatic incidence rate was approximately 2.4 times higher
than the statewide rate in zip code 18974.
• For females, 2005-2013, pancreatic incidence rate was approximately 2.1 times higher
than the statewide rate in zip code 18976.
• For females, 2005-2013, pancreatic incidence rate was approximately 2.2 times higher
than the statewide rate in zip code 19044.
• For males, 2005-2013, pancreatic incidence rate was approximately 1.6 times higher
than the statewide rate in the three zip codes combined (18974, 18976, 19044).
• For females, 2005-2013, pancreatic incidence rate was approximately 2.3 times the
statewide rate in the three zip codes combined (18974, 18976, 19044).
Pediatric (0-19 years) Cancers Results
There were fewer than 50 pediatric cancer cases for each time period for the combined three
zip codes area (see Table 2). This number of pediatric cancer cases was too small to support
analysis at the individual zip code level. Therefore, pediatric cancers were only evaluated
across all three zip codes of interest combined in this analysis.
Table 2: Pediatric Cancer Incidence in Warminster, Warrington and Horsham, Pa. (1985-2013)
Data source – Pennsylvania Cancer Registry, U.S. Census Bureau
The observed numbers of childhood cancers in three zip codes combined were not statistically
different from the expected numbers in all three time periods (1985-1994, 1995-2004 and 2005-
Observed Expected SIR 95% CI Observed Expected SIR 95% CI Observed Expected SIR 95% CI
Male 21 17.2 1.22 0.76 - 1.87 21 18.62 1.13 0.7-1.72 26 19.61 1.33 0.87-1.94
Female 19 16.5 1.15 0.69 - 1.8 24 16.85 1.42 0.91-2.12 18 17.98 1 0.59-1.58
Sex1985-1994 1994-2004 2005-2013

11
October 2017 Addendum 1 to the August 2016 Cancer Data Review (1985-2013) – Selected Zip Codes of Warminster (18974), Warrington (18976) and Horsham (19044), Pennsylvania
DEPARTMENT OF HEALTH
2013). Further, no statistically significant childhood cancer elevations were found in any of the
three zip codes comparing to statewide rates for the overall time period of 1985-2013.
Discussion
Figures 2-5 depict the pancreatic and pediatric cancer rates relative to statewide rates in the
three zip codes individually and combined over the time periods of interest.
Figure 2. SIR for Horsham (19044) By Cancer Type, Year and Sex
Data source – Pennsylvania Cancer Registry, U.S. Census Bureau
Data source – Pennsylvania Cancer Registry, U.S. Census Bureau
Figure 3. SIR for Warminster (18974) By Cancer Type, Year and Sex

12
October 2017 Addendum 1 to the August 2016 Cancer Data Review (1985-2013) – Selected Zip Codes of Warminster (18974), Warrington (18976) and Horsham (19044), Pennsylvania
DEPARTMENT OF HEALTH
Pancreatic Cancer Discussion
There appears to be an increase in the number of new pancreatic cancer cases relative to the
state when comparing the time periods evaluated in this update. A formal trend analysis was
not performed for these specific zip codes in Bucks and Montgomery counties. However, as
shown in Table 1, contrasting the different time periods shows the earliest time period with
fewer pancreatic cancers than expected compared to the state, the middle time period showing
what is expected compared to the state, and the most recent time period with more than
expected pancreatic cancer cases compared to the state. Note, pancreatic cancer is a relatively
Figure 4. SIR for Warrington (18976) By Cancer Type, Year and Sex
Data source – Pennsylvania Cancer Registry, U.S. Census Bureau
Figure 5. SIRs for Combined Zip Codes (19044, 18974 and 18976) By Cancer Types, Year and Sex
Data source – Pennsylvania Cancer Registry, U.S. Census Bureau

13
October 2017 Addendum 1 to the August 2016 Cancer Data Review (1985-2013) – Selected Zip Codes of Warminster (18974), Warrington (18976) and Horsham (19044), Pennsylvania
DEPARTMENT OF HEALTH
rare cancer and, therefore, these calculations for some of the zip codes of interest are based
on small numbers of cases resulting in wide confidence intervals.
Figure 6 displays pancreatic cancer rates at the county, state and national level. The national
cancer incidence information is based on the Surveillance, Epidemiology and End Results
(SEER) Program of the National Cancer Institute (NCI). SEER currently collects and publishes
cancer incidence and survival data from population-based cancer registries covering
approximately 28 percent of the U.S. population.
Data source: Pennsylvania Cancer Registry, U.S. Census Bureau, SEER cancer incidence data. Note: “SEER 18” refers to national cancer incidence information from the Surveillance, Epidemiology, and End Results (SEER) Program of the National Cancer Institute (NCI). SEER currently collects and publishes cancer incidence and survival data from population-based cancer registries covering approximately 28 percent of the US population in 18 different cancer registries with data going back to 2000.
It is important to keep in mind the limited information supporting links between chemical
exposures and pancreatic cancer. The data available at this time are very limited and the
0
2
4
6
8
10
12
14
16
18
2 0 0 0 2 0 0 1 2 0 0 2 2 0 0 3 2 0 0 4 2 0 0 5 2 0 0 6 2 0 0 7 2 0 0 8 2 0 0 9 2 0 1 0 2 0 1 1 2 0 1 2 2 0 1 3 2 0 1 4
Figure 6. Age-Adjusted Pancreat ic Cancer Incidence Rates in U.S. (SEER 18), State of Pennsylvania and
Montgomery and Bucks Count ies, 2000 -2014
Bucks Montgomery Pennsylvania SEER 18 areas
Age-a
dju
ste
d p
ancre
atic c
ancer
incid
ence
rate
Year
14
October 2017 Addendum 1 to the August 2016 Cancer Data Review (1985-2013) – Selected Zip Codes of Warminster (18974), Warrington (18976) and Horsham (19044), Pennsylvania
DEPARTMENT OF HEALTH
studies are often inconclusive. As reviewed in ATSDR’s Toxicological Profiles available at
https://www.atsdr.cdc.gov/toxprofiles/index.asp and summarized by the American Cancer
Society at https://www.cancer.org/cancer/pancreatic-cancer/causes-risks-prevention/risk-
factors.html, some studies have suggested that exposure to pesticides, asbestos, benzene and
chlorinated hydrocarbons may increase pancreatic cancer risk, but a causal relationship has
not been confirmed. Although benzene and chlorinated hydrocarbons have been contaminants
of concern in some of the historical drinking water contamination in this area, exposures to
these chemicals in drinking water were addressed via public water hookups and treatment
systems in the 1990s. Exposure to PFAS was the most recent widespread chemical exposure
in this community’s drinking water supply, and a link between pancreatic cancer and this class
of chemicals has not been established. Two community-based studies2,3 looking at community
drinking water exposures to PFAS did not find an association with pancreatic cancer, but one
PFAS (PFOA) has been found to cause pancreatic tumors in rodents4. As stated in ATSDR’s
Draft Toxicological Profile for Perfluoroalkyls, a number of factors related to differences
between rodents and humans suggest that PFOA probably does not represent a significant
pancreatic cancer hazard for humans. Studies of PFOA exposure and pancreatic cancer in
worker populations are limited by very small numbers of exposed cases. It is more firmly
established that people with certain risk factors such as smoking, diabetes, pancreatitis, obesity
and certain genetic factors may be more likely than others to develop pancreatic cancer.
However, the information contained in cancer registry records available for this review does
not include these risk factors. Therefore, the analysis in this addendum was not able to
consider the important prevalence of these risk factors in the populations studied, limiting the
interpretation of these pancreatic cancer results.
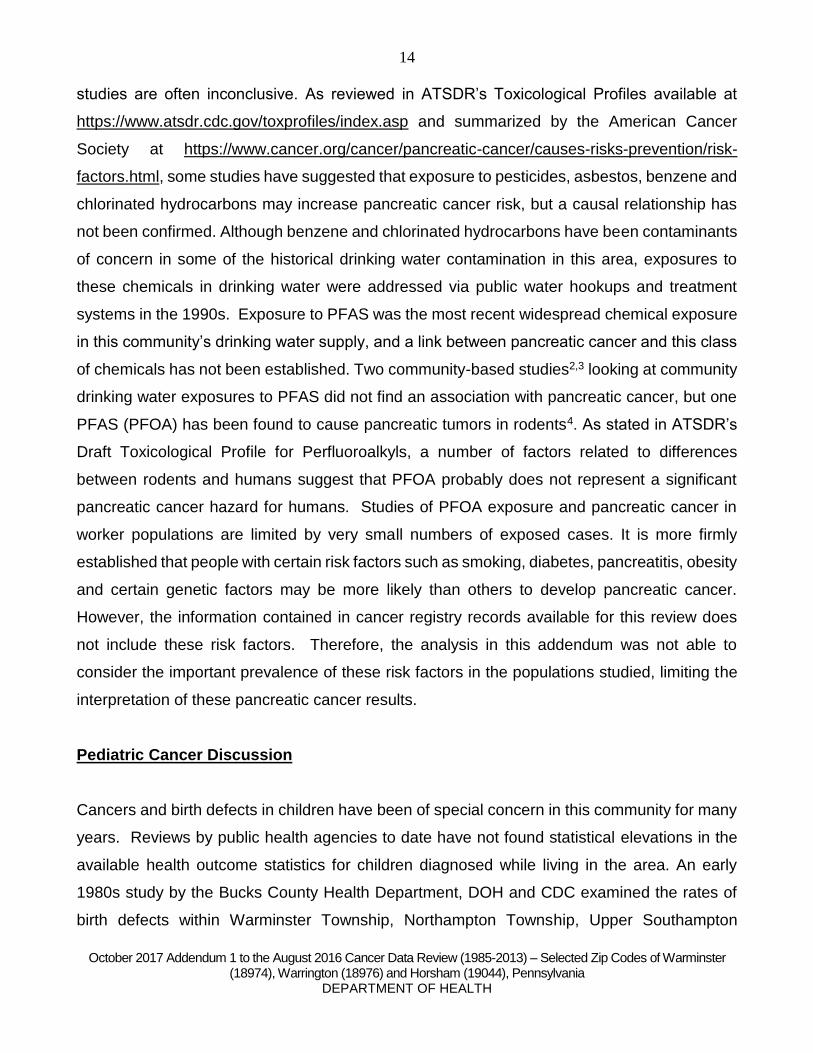
Pediatric Cancer Discussion
Cancers and birth defects in children have been of special concern in this community for many
years. Reviews by public health agencies to date have not found statistical elevations in the
available health outcome statistics for children diagnosed while living in the area. An early
1980s study by the Bucks County Health Department, DOH and CDC examined the rates of
birth defects within Warminster Township, Northampton Township, Upper Southampton
15
October 2017 Addendum 1 to the August 2016 Cancer Data Review (1985-2013) – Selected Zip Codes of Warminster (18974), Warrington (18976) and Horsham (19044), Pennsylvania
DEPARTMENT OF HEALTH
Township and Ivyland Borough. Results showed the birth defect rate in the area was within
expected levels. In 2006, DOH published a report reviewing cases of brain cancer in children
and young adults under the age of 25 living in the Warminster area from 1993–2004. The
information available at that time did not indicate a higher occurrence in the number of brain
cancers among that age group in the Warminster area.
For this addendum, DOH evaluated rates for pediatric cancers in the Warminster, Warrington
and Horsham zip codes from 1985-2013. Results showed that all cancer types diagnosed in
children from 0-19 years of age from this area were similar to statewide rates.
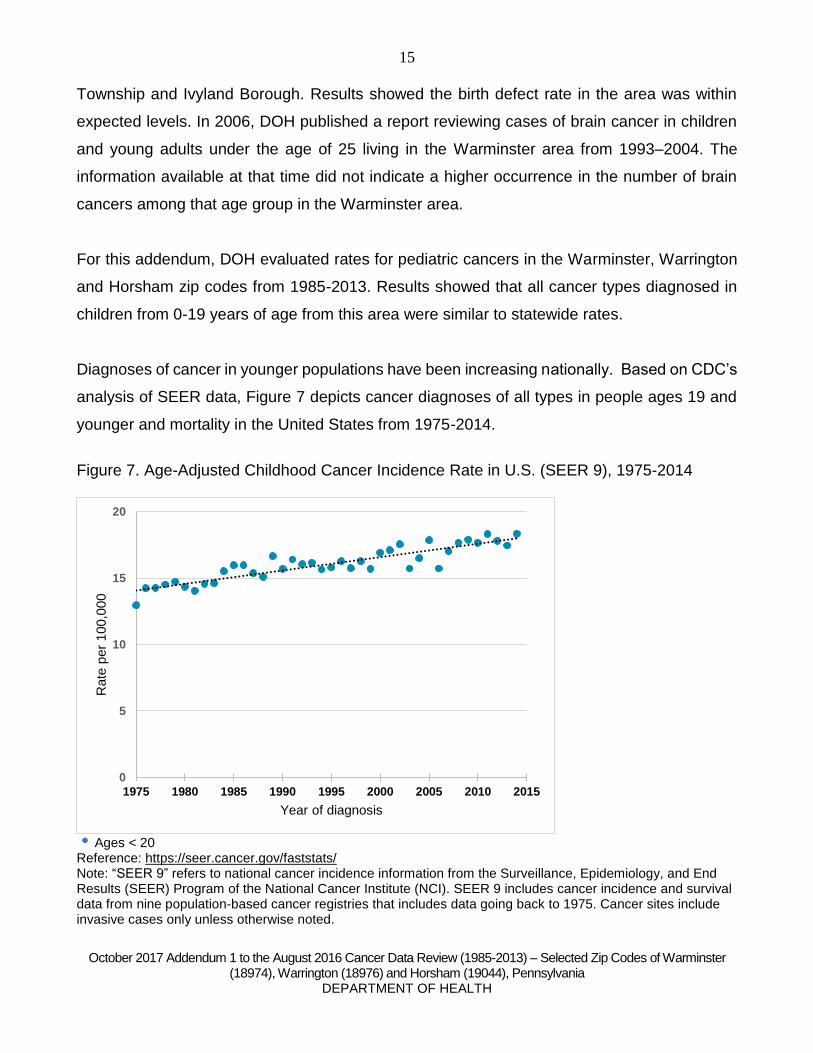
Diagnoses of cancer in younger populations have been increasing nationally. Based on CDC’s
analysis of SEER data, Figure 7 depicts cancer diagnoses of all types in people ages 19 and
younger and mortality in the United States from 1975-2014.
Figure 7. Age-Adjusted Childhood Cancer Incidence Rate in U.S. (SEER 9), 1975-2014
Ages < 20
Reference: https://seer.cancer.gov/faststats/ Note: “SEER 9” refers to national cancer incidence information from the Surveillance, Epidemiology, and End Results (SEER) Program of the National Cancer Institute (NCI). SEER 9 includes cancer incidence and survival data from nine population-based cancer registries that includes data going back to 1975. Cancer sites include invasive cases only unless otherwise noted.
0
5
10
15
20
1975 1980 1985 1990 1995 2000 2005 2010 2015
Rate
per
100,0
00
Year of diagnosis

16
October 2017 Addendum 1 to the August 2016 Cancer Data Review (1985-2013) – Selected Zip Codes of Warminster (18974), Warrington (18976) and Horsham (19044), Pennsylvania
DEPARTMENT OF HEALTH
Figure 8 depicts age-adjusted childhood cancer incidence rates in Pennsylvania, Montgomery
and Bucks counties, as well as nationally across 18 SEER areas.
Data source: Pennsylvania Cancer Registry, U.S. Census Bureau, SEER cancer incidence data. Note: “SEER 18” refers to national cancer incidence information from the Surveillance, Epidemiology, and End Results (SEER) Program of the National Cancer Institute (NCI). SEER currently collects and publishes cancer incidence and survival data from population-based cancer registries covering approximately 28 percent of the U.S. population in 18 different cancer registries with data going back to 2000.
Researchers still do not know much about what causes cancer in children. Most children’s
cancers are caused by random genetic mutations. For some of these mutations, there are
some environmental and genetic factors that can contribute to the cancer, but we still do not
know what causes most childhood cancers.
0
5
10
15
20
25
30
35
2 0 0 0 2 0 0 1 2 0 0 2 2 0 0 3 2 0 0 4 2 0 0 5 2 0 0 6 2 0 0 7 2 0 0 8 2 0 0 9 2 0 1 0 2 0 1 1 2 0 1 2 2 0 1 3 2 0 1 4
Figure 8. Age-Adjusted Chi ldhood Cancer Incidence Rates in U.S. (SEER 18), State of Pennsylvania and
Montgomery and Bucks Count ies, 2000-2014
Bucks Montgomery Pennsylvania SEER 18 areas
Age-a
dju
ste
d c
hild
ho
od
ca
ncer
incid
ence
rate
17
October 2017 Addendum 1 to the August 2016 Cancer Data Review (1985-2013) – Selected Zip Codes of Warminster (18974), Warrington (18976) and Horsham (19044), Pennsylvania
DEPARTMENT OF HEALTH
Limitations
Caution should be exercised when interpreting an SIR. The interpretation of an SIR depends
on both the size and the stability of the SIR. Two SIRs can have the same size but not the
same stability. For example, an SIR of 150 based on four expected cases and six observed
cases indicates a 50 percent excess in cancer, but the excess is actually only two cases.
Conversely, an SIR of 150 based on 400 expected cases and 600 observed cases represents
the same 50 percent excess in cancer, but, because the SIR is based on a greater number of
cases, the estimate is more stable. It is very unlikely that 200 excess cases of cancer would
occur by chance alone.
There may be underreporting of cancers diagnosed in veterans and their families from the area.
Veterans who worked at the Willow Grove and Warminster bases and their families may have
moved out of the state by the time their cancers were diagnosed. Further, DOH notes that there
appears to be incomplete cancer incidence reporting from the Veterans Administration
hospitals to the Pennsylvania Cancer Registry.
As summarized in the August 2016 cancer data review for this community, overall limitations
in this kind of zip code level cancer data review include the following:
• A review of cancer incidence data does not determine the cause of any observed
increases or decreases in cancer types.
• Zip code level analyses can provide a helpful preliminary screen of cancer registry data,
but zip code boundaries may only approximate potential geographic areas of interest.
• Cancer registry incidence data are based on residence location at the time of diagnosis.
Cancers can take years, or even decades, to develop following exposure to a cancer-
causing agent. Cancers diagnosed in people right now may have been influenced by
something that happened somewhere else a long time ago.
• Although cancer overall is a common diagnosis, there may only be a small number of a
particular cancer type in a particular zip code. Researchers need larger numbers of

18
October 2017 Addendum 1 to the August 2016 Cancer Data Review (1985-2013) – Selected Zip Codes of Warminster (18974), Warrington (18976) and Horsham (19044), Pennsylvania
DEPARTMENT OF HEALTH
persons in order to have a more accurate and representative picture of the reality of a
community.
• Cancer registry data only includes very limited or no information on lifestyle,
demographic or occupational risk factors. Science does not know the causes of most
types of cancer. For each person, cancer is thought to be a caused by a combination of
many factors, genetic and environmental.
Conclusions
The 2016 cancer data review showed an inconclusive picture of cancer incidence rates in the
area. Statistically significant increases were found for bladder, myeloma, non-Hodgkin’s
lymphoma and testis for different time periods, gender and zip codes, and statistically
significant decreases were found for bladder and prostate cancer for males in different time
periods and zip codes. This 2017 addendum adds two other cancer categories (pancreatic
cancer and all cancer types in pediatric populations) to the prior review. For pancreatic cancer,
there appears to be an increase in the number of new pancreatic cancer cases in the zip codes
reviewed relative to the state when comparing the time periods evaluated in this update.
Pediatric cancer rates did not show any statistically significant change in comparison to the
state rates in the zip codes (combined) over the three time periods of interest or over the entire
duration of 1985-2013.
Further analysis of the pancreatic cancer rates for this area is recommended. More refined
geospatial analyses will help us better understand the pancreatic cancer rates in this area. It is
important to keep in mind the limited information supporting links between chemical exposures
and pancreatic cancer and the history of chemical contamination in drinking water in this area.
Data are very limited and the studies are often inconclusive for links between chemical
exposures and pancreatic cancer. It is more firmly established that people with certain risk
factors such as smoking, diabetes, pancreatitis, obesity and certain genetic factors may be
more likely than others to develop pancreatic cancer. However, the information contained in
cancer registry records available for this review does not include these risk factors. Therefore,

19
October 2017 Addendum 1 to the August 2016 Cancer Data Review (1985-2013) – Selected Zip Codes of Warminster (18974), Warrington (18976) and Horsham (19044), Pennsylvania
DEPARTMENT OF HEALTH
the analysis in this addendum was not able to consider the important prevalence of these risk
factors in the populations studied, limiting the interpretation of these pancreatic cancer results.
There are important limitations with these kinds of zip code level cancer incidence reviews,
including likely underreporting of cancers diagnosed in veterans and their families from the
area. Even when a statistically significant increase in cancer incidence is detected, determining
the validity of an association between an environmental agent and the development of cancer
is difficult as behavioral, genetic and environmental factors interact and affect cancer growth.
These factors may act together or in sequence to initiate or promote cancer. Furthermore,
difficulties in identifying the mode of transmission or a biological pathway, the level of exposure,
and amount of exposure time all contribute to the complexities of cancer inquiry investigations.
Given these findings and the legacy of environmental contamination in this area, DOH remains
committed to evaluating new data or additional information as it becomes available for this
community. Further, an addendum 2 to this work is also planned. This second update will
produce new calculated rates for all of the cancer types in the original 2016 document (as well
as these two additional cancer types), using the public water system boundaries instead of zip
codes as the denominator population. DOH will also consider further analyses of the pancreatic
cancer information for this area, including additional geographic analyses.

20
October 2017 Addendum 1 to the August 2016 Cancer Data Review (1985-2013) – Selected Zip Codes of Warminster (18974), Warrington (18976) and Horsham (19044), Pennsylvania
DEPARTMENT OF HEALTH
Citations
1. Pennsylvania Department of Health, Tools of the Trade, Data Analysis.
http://www.statistics.health.pa.gov/StatisticalResources/UnderstandingHealthStats/ToolsoftheTrade/Documents/Comparing_Age_Adjusted_Rates.pdf accessed April 2017.
2. Eriksen KT, Sørensen M, McLaughlin JK, Lipworth L, Tjønneland A, Overvad K,
Raaschou-Nielsen O. Perfluorooctanoate and perfluorooctanesulfonate plasma levels and risk of cancer in the general Danish population. J Natl Cancer Inst 101 (2009):605-609.
3. Steenland K, Fletcher T, Savitz DA. Epidemiologic Evidence on the Health Effects of
Perfluorooctanoic Acid (PFOA). Environmental Health Perspectives 118(2010):1100-1108.
4. Biegel LB, Hurtt ME, Frame SR, et al. Mechanisms of extrahepatic tumor induction by
peroxisome proliferators in male CD rats. Toxicol Sci 60(2001):44-55; as cited in ATSDR Draft Toxicological Profile for Perfluoroalkyls. August 2015. Available at: https://www.atsdr.cdc.gov/toxprofiles/tp200.pdf.