Embed Size (px)
Citation preview
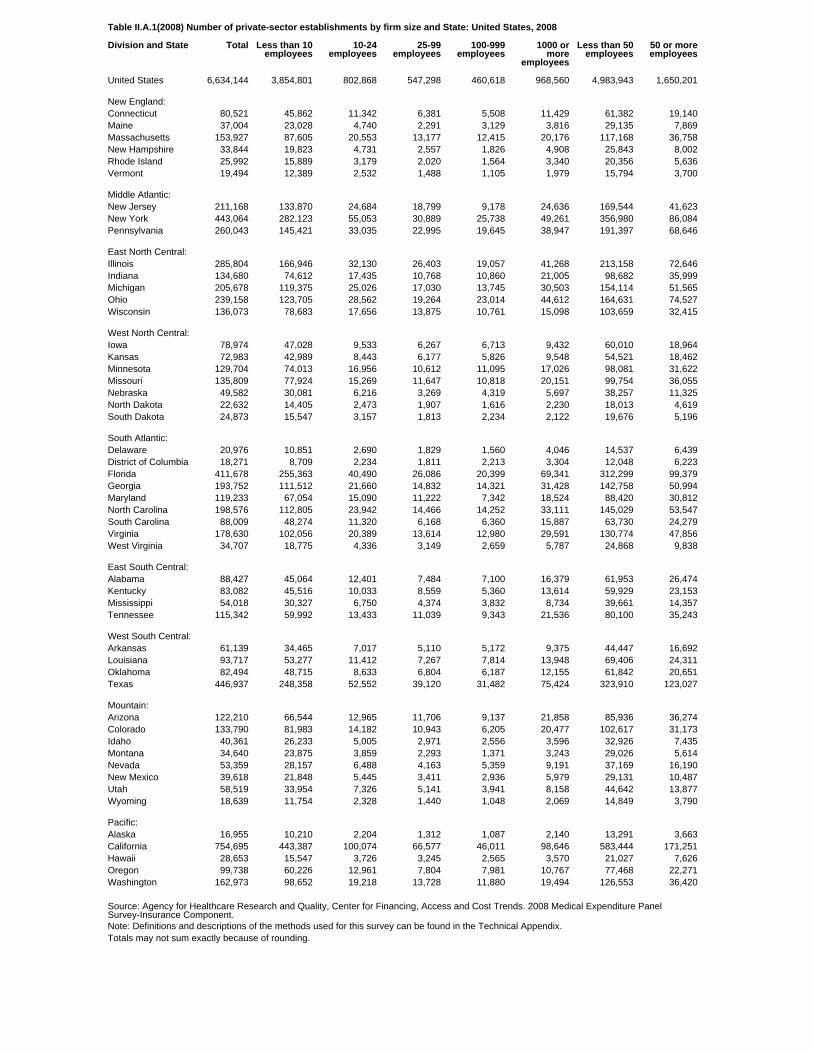
Table II.A.1(2008) Number of private-sector establishments by firm size and State: United States, 2008
Division and State Total Less than 10employees
10-24employees
25-99employees
100-999employees
1000 ormore
employees
Less than 50employees
50 or moreemployees
United States 6,634,144 3,854,801 802,868 547,298 460,618 968,560 4,983,943 1,650,201
New England:Connecticut 80,521 45,862 11,342 6,381 5,508 11,429 61,382 19,140Maine 37,004 23,028 4,740 2,291 3,129 3,816 29,135 7,869Massachusetts 153,927 87,605 20,553 13,177 12,415 20,176 117,168 36,758New Hampshire 33,844 19,823 4,731 2,557 1,826 4,908 25,843 8,002Rhode Island 25,992 15,889 3,179 2,020 1,564 3,340 20,356 5,636Vermont 19,494 12,389 2,532 1,488 1,105 1,979 15,794 3,700
Middle Atlantic:New Jersey 211,168 133,870 24,684 18,799 9,178 24,636 169,544 41,623New York 443,064 282,123 55,053 30,889 25,738 49,261 356,980 86,084Pennsylvania 260,043 145,421 33,035 22,995 19,645 38,947 191,397 68,646
East North Central:Illinois 285,804 166,946 32,130 26,403 19,057 41,268 213,158 72,646Indiana 134,680 74,612 17,435 10,768 10,860 21,005 98,682 35,999Michigan 205,678 119,375 25,026 17,030 13,745 30,503 154,114 51,565Ohio 239,158 123,705 28,562 19,264 23,014 44,612 164,631 74,527Wisconsin 136,073 78,683 17,656 13,875 10,761 15,098 103,659 32,415
West North Central:Iowa 78,974 47,028 9,533 6,267 6,713 9,432 60,010 18,964Kansas 72,983 42,989 8,443 6,177 5,826 9,548 54,521 18,462Minnesota 129,704 74,013 16,956 10,612 11,095 17,026 98,081 31,622Missouri 135,809 77,924 15,269 11,647 10,818 20,151 99,754 36,055Nebraska 49,582 30,081 6,216 3,269 4,319 5,697 38,257 11,325North Dakota 22,632 14,405 2,473 1,907 1,616 2,230 18,013 4,619South Dakota 24,873 15,547 3,157 1,813 2,234 2,122 19,676 5,196
South Atlantic:Delaware 20,976 10,851 2,690 1,829 1,560 4,046 14,537 6,439District of Columbia 18,271 8,709 2,234 1,811 2,213 3,304 12,048 6,223Florida 411,678 255,363 40,490 26,086 20,399 69,341 312,299 99,379Georgia 193,752 111,512 21,660 14,832 14,321 31,428 142,758 50,994Maryland 119,233 67,054 15,090 11,222 7,342 18,524 88,420 30,812North Carolina 198,576 112,805 23,942 14,466 14,252 33,111 145,029 53,547South Carolina 88,009 48,274 11,320 6,168 6,360 15,887 63,730 24,279Virginia 178,630 102,056 20,389 13,614 12,980 29,591 130,774 47,856West Virginia 34,707 18,775 4,336 3,149 2,659 5,787 24,868 9,838
East South Central:Alabama 88,427 45,064 12,401 7,484 7,100 16,379 61,953 26,474Kentucky 83,082 45,516 10,033 8,559 5,360 13,614 59,929 23,153Mississippi 54,018 30,327 6,750 4,374 3,832 8,734 39,661 14,357Tennessee 115,342 59,992 13,433 11,039 9,343 21,536 80,100 35,243
West South Central:Arkansas 61,139 34,465 7,017 5,110 5,172 9,375 44,447 16,692Louisiana 93,717 53,277 11,412 7,267 7,814 13,948 69,406 24,311Oklahoma 82,494 48,715 8,633 6,804 6,187 12,155 61,842 20,651Texas 446,937 248,358 52,552 39,120 31,482 75,424 323,910 123,027
Mountain:Arizona 122,210 66,544 12,965 11,706 9,137 21,858 85,936 36,274Colorado 133,790 81,983 14,182 10,943 6,205 20,477 102,617 31,173Idaho 40,361 26,233 5,005 2,971 2,556 3,596 32,926 7,435Montana 34,640 23,875 3,859 2,293 1,371 3,243 29,026 5,614Nevada 53,359 28,157 6,488 4,163 5,359 9,191 37,169 16,190New Mexico 39,618 21,848 5,445 3,411 2,936 5,979 29,131 10,487Utah 58,519 33,954 7,326 5,141 3,941 8,158 44,642 13,877Wyoming 18,639 11,754 2,328 1,440 1,048 2,069 14,849 3,790
Pacific:Alaska 16,955 10,210 2,204 1,312 1,087 2,140 13,291 3,663California 754,695 443,387 100,074 66,577 46,011 98,646 583,444 171,251Hawaii 28,653 15,547 3,726 3,245 2,565 3,570 21,027 7,626Oregon 99,738 60,226 12,961 7,804 7,981 10,767 77,468 22,271Washington 162,973 98,652 19,218 13,728 11,880 19,494 126,553 36,420
Source: Agency for Healthcare Research and Quality, Center for Financing, Access and Cost Trends. 2008 Medical Expenditure PanelSurvey-Insurance Component.Note: Definitions and descriptions of the methods used for this survey can be found in the Technical Appendix.Totals may not sum exactly because of rounding.
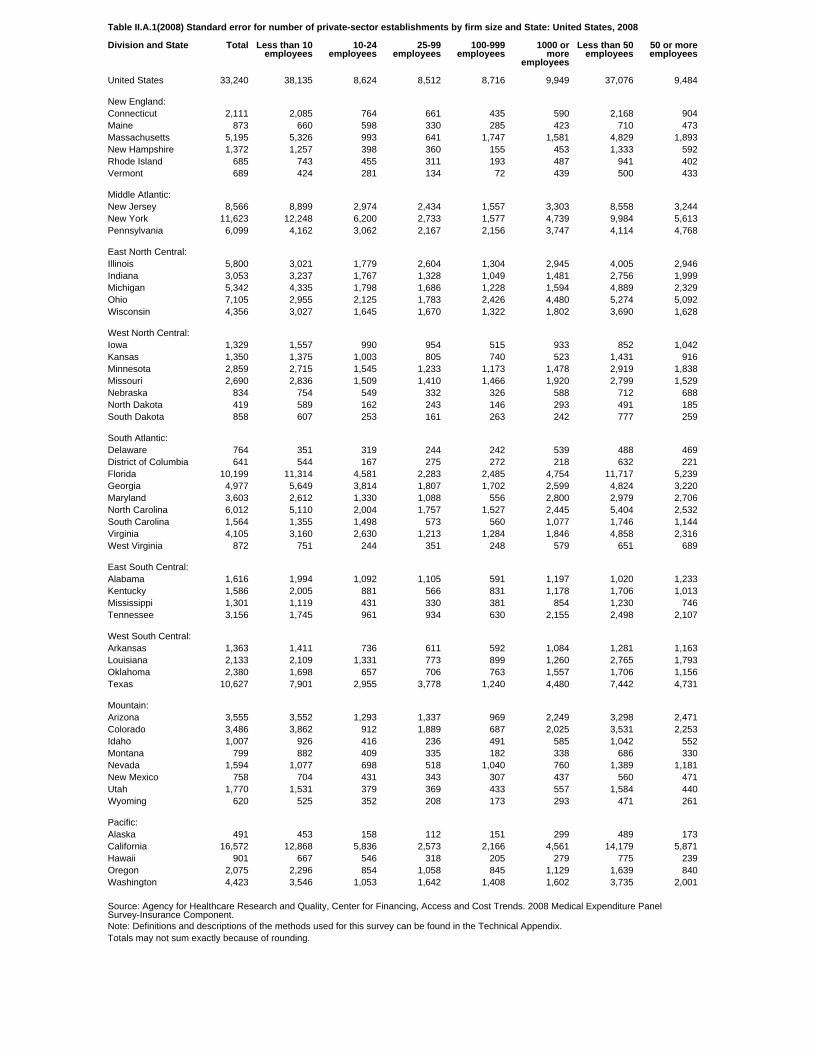
Table II.A.1(2008) Standard error for number of private-sector establishments by firm size and State: United States, 2008
Division and State Total Less than 10employees
10-24employees
25-99employees
100-999employees
1000 ormore
employees
Less than 50employees
50 or moreemployees
United States 33,240 38,135 8,624 8,512 8,716 9,949 37,076 9,484
New England:Connecticut 2,111 2,085 764 661 435 590 2,168 904Maine 873 660 598 330 285 423 710 473Massachusetts 5,195 5,326 993 641 1,747 1,581 4,829 1,893New Hampshire 1,372 1,257 398 360 155 453 1,333 592Rhode Island 685 743 455 311 193 487 941 402Vermont 689 424 281 134 72 439 500 433
Middle Atlantic:New Jersey 8,566 8,899 2,974 2,434 1,557 3,303 8,558 3,244New York 11,623 12,248 6,200 2,733 1,577 4,739 9,984 5,613Pennsylvania 6,099 4,162 3,062 2,167 2,156 3,747 4,114 4,768
East North Central:Illinois 5,800 3,021 1,779 2,604 1,304 2,945 4,005 2,946Indiana 3,053 3,237 1,767 1,328 1,049 1,481 2,756 1,999Michigan 5,342 4,335 1,798 1,686 1,228 1,594 4,889 2,329Ohio 7,105 2,955 2,125 1,783 2,426 4,480 5,274 5,092Wisconsin 4,356 3,027 1,645 1,670 1,322 1,802 3,690 1,628
West North Central:Iowa 1,329 1,557 990 954 515 933 852 1,042Kansas 1,350 1,375 1,003 805 740 523 1,431 916Minnesota 2,859 2,715 1,545 1,233 1,173 1,478 2,919 1,838Missouri 2,690 2,836 1,509 1,410 1,466 1,920 2,799 1,529Nebraska 834 754 549 332 326 588 712 688North Dakota 419 589 162 243 146 293 491 185South Dakota 858 607 253 161 263 242 777 259
South Atlantic:Delaware 764 351 319 244 242 539 488 469District of Columbia 641 544 167 275 272 218 632 221Florida 10,199 11,314 4,581 2,283 2,485 4,754 11,717 5,239Georgia 4,977 5,649 3,814 1,807 1,702 2,599 4,824 3,220Maryland 3,603 2,612 1,330 1,088 556 2,800 2,979 2,706North Carolina 6,012 5,110 2,004 1,757 1,527 2,445 5,404 2,532South Carolina 1,564 1,355 1,498 573 560 1,077 1,746 1,144Virginia 4,105 3,160 2,630 1,213 1,284 1,846 4,858 2,316West Virginia 872 751 244 351 248 579 651 689
East South Central:Alabama 1,616 1,994 1,092 1,105 591 1,197 1,020 1,233Kentucky 1,586 2,005 881 566 831 1,178 1,706 1,013Mississippi 1,301 1,119 431 330 381 854 1,230 746Tennessee 3,156 1,745 961 934 630 2,155 2,498 2,107
West South Central:Arkansas 1,363 1,411 736 611 592 1,084 1,281 1,163Louisiana 2,133 2,109 1,331 773 899 1,260 2,765 1,793Oklahoma 2,380 1,698 657 706 763 1,557 1,706 1,156Texas 10,627 7,901 2,955 3,778 1,240 4,480 7,442 4,731
Mountain:Arizona 3,555 3,552 1,293 1,337 969 2,249 3,298 2,471Colorado 3,486 3,862 912 1,889 687 2,025 3,531 2,253Idaho 1,007 926 416 236 491 585 1,042 552Montana 799 882 409 335 182 338 686 330Nevada 1,594 1,077 698 518 1,040 760 1,389 1,181New Mexico 758 704 431 343 307 437 560 471Utah 1,770 1,531 379 369 433 557 1,584 440Wyoming 620 525 352 208 173 293 471 261
Pacific:Alaska 491 453 158 112 151 299 489 173California 16,572 12,868 5,836 2,573 2,166 4,561 14,179 5,871Hawaii 901 667 546 318 205 279 775 239Oregon 2,075 2,296 854 1,058 845 1,129 1,639 840Washington 4,423 3,546 1,053 1,642 1,408 1,602 3,735 2,001
Source: Agency for Healthcare Research and Quality, Center for Financing, Access and Cost Trends. 2008 Medical Expenditure PanelSurvey-Insurance Component.Note: Definitions and descriptions of the methods used for this survey can be found in the Technical Appendix.Totals may not sum exactly because of rounding.
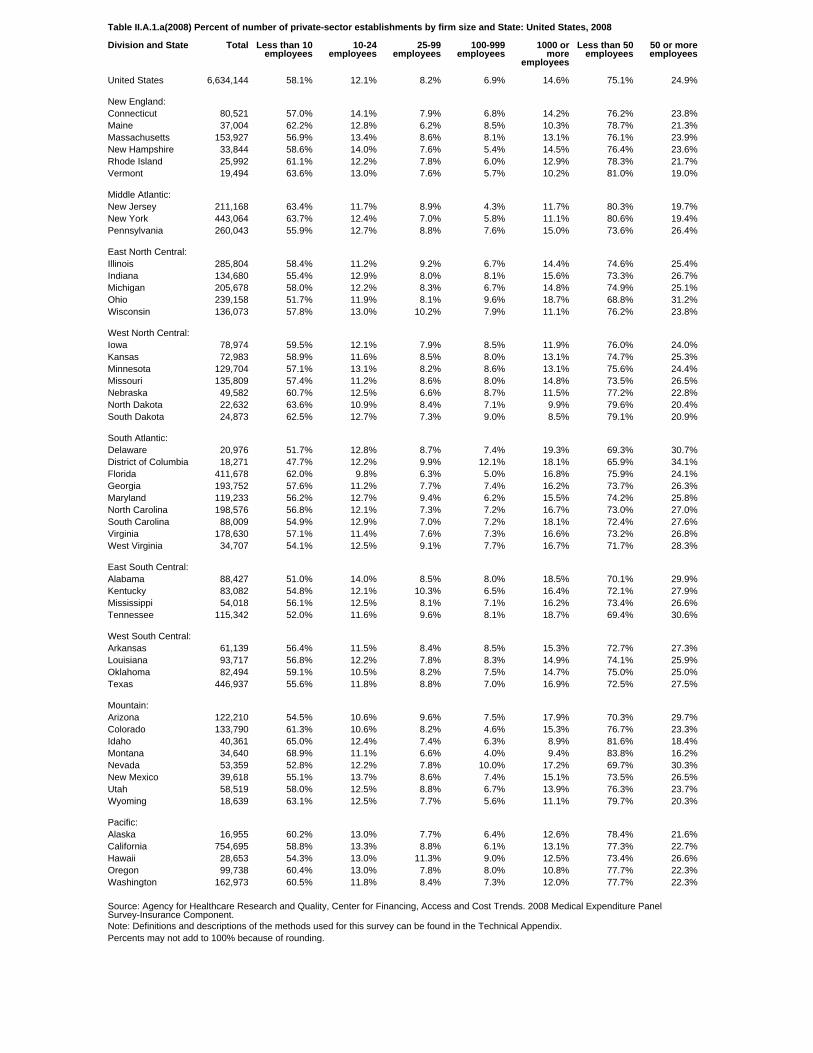
Table II.A.1.a(2008) Percent of number of private-sector establishments by firm size and State: United States, 2008
Division and State Total Less than 10employees
10-24employees
25-99employees
100-999employees
1000 ormore
employees
Less than 50employees
50 or moreemployees
United States 6,634,144 58.1% 12.1% 8.2% 6.9% 14.6% 75.1% 24.9%
New England:Connecticut 80,521 57.0% 14.1% 7.9% 6.8% 14.2% 76.2% 23.8%Maine 37,004 62.2% 12.8% 6.2% 8.5% 10.3% 78.7% 21.3%Massachusetts 153,927 56.9% 13.4% 8.6% 8.1% 13.1% 76.1% 23.9%New Hampshire 33,844 58.6% 14.0% 7.6% 5.4% 14.5% 76.4% 23.6%Rhode Island 25,992 61.1% 12.2% 7.8% 6.0% 12.9% 78.3% 21.7%Vermont 19,494 63.6% 13.0% 7.6% 5.7% 10.2% 81.0% 19.0%
Middle Atlantic:New Jersey 211,168 63.4% 11.7% 8.9% 4.3% 11.7% 80.3% 19.7%New York 443,064 63.7% 12.4% 7.0% 5.8% 11.1% 80.6% 19.4%Pennsylvania 260,043 55.9% 12.7% 8.8% 7.6% 15.0% 73.6% 26.4%
East North Central:Illinois 285,804 58.4% 11.2% 9.2% 6.7% 14.4% 74.6% 25.4%Indiana 134,680 55.4% 12.9% 8.0% 8.1% 15.6% 73.3% 26.7%Michigan 205,678 58.0% 12.2% 8.3% 6.7% 14.8% 74.9% 25.1%Ohio 239,158 51.7% 11.9% 8.1% 9.6% 18.7% 68.8% 31.2%Wisconsin 136,073 57.8% 13.0% 10.2% 7.9% 11.1% 76.2% 23.8%
West North Central:Iowa 78,974 59.5% 12.1% 7.9% 8.5% 11.9% 76.0% 24.0%Kansas 72,983 58.9% 11.6% 8.5% 8.0% 13.1% 74.7% 25.3%Minnesota 129,704 57.1% 13.1% 8.2% 8.6% 13.1% 75.6% 24.4%Missouri 135,809 57.4% 11.2% 8.6% 8.0% 14.8% 73.5% 26.5%Nebraska 49,582 60.7% 12.5% 6.6% 8.7% 11.5% 77.2% 22.8%North Dakota 22,632 63.6% 10.9% 8.4% 7.1% 9.9% 79.6% 20.4%South Dakota 24,873 62.5% 12.7% 7.3% 9.0% 8.5% 79.1% 20.9%
South Atlantic:Delaware 20,976 51.7% 12.8% 8.7% 7.4% 19.3% 69.3% 30.7%District of Columbia 18,271 47.7% 12.2% 9.9% 12.1% 18.1% 65.9% 34.1%Florida 411,678 62.0% 9.8% 6.3% 5.0% 16.8% 75.9% 24.1%Georgia 193,752 57.6% 11.2% 7.7% 7.4% 16.2% 73.7% 26.3%Maryland 119,233 56.2% 12.7% 9.4% 6.2% 15.5% 74.2% 25.8%North Carolina 198,576 56.8% 12.1% 7.3% 7.2% 16.7% 73.0% 27.0%South Carolina 88,009 54.9% 12.9% 7.0% 7.2% 18.1% 72.4% 27.6%Virginia 178,630 57.1% 11.4% 7.6% 7.3% 16.6% 73.2% 26.8%West Virginia 34,707 54.1% 12.5% 9.1% 7.7% 16.7% 71.7% 28.3%
East South Central:Alabama 88,427 51.0% 14.0% 8.5% 8.0% 18.5% 70.1% 29.9%Kentucky 83,082 54.8% 12.1% 10.3% 6.5% 16.4% 72.1% 27.9%Mississippi 54,018 56.1% 12.5% 8.1% 7.1% 16.2% 73.4% 26.6%Tennessee 115,342 52.0% 11.6% 9.6% 8.1% 18.7% 69.4% 30.6%
West South Central:Arkansas 61,139 56.4% 11.5% 8.4% 8.5% 15.3% 72.7% 27.3%Louisiana 93,717 56.8% 12.2% 7.8% 8.3% 14.9% 74.1% 25.9%Oklahoma 82,494 59.1% 10.5% 8.2% 7.5% 14.7% 75.0% 25.0%Texas 446,937 55.6% 11.8% 8.8% 7.0% 16.9% 72.5% 27.5%
Mountain:Arizona 122,210 54.5% 10.6% 9.6% 7.5% 17.9% 70.3% 29.7%Colorado 133,790 61.3% 10.6% 8.2% 4.6% 15.3% 76.7% 23.3%Idaho 40,361 65.0% 12.4% 7.4% 6.3% 8.9% 81.6% 18.4%Montana 34,640 68.9% 11.1% 6.6% 4.0% 9.4% 83.8% 16.2%Nevada 53,359 52.8% 12.2% 7.8% 10.0% 17.2% 69.7% 30.3%New Mexico 39,618 55.1% 13.7% 8.6% 7.4% 15.1% 73.5% 26.5%Utah 58,519 58.0% 12.5% 8.8% 6.7% 13.9% 76.3% 23.7%Wyoming 18,639 63.1% 12.5% 7.7% 5.6% 11.1% 79.7% 20.3%
Pacific:Alaska 16,955 60.2% 13.0% 7.7% 6.4% 12.6% 78.4% 21.6%California 754,695 58.8% 13.3% 8.8% 6.1% 13.1% 77.3% 22.7%Hawaii 28,653 54.3% 13.0% 11.3% 9.0% 12.5% 73.4% 26.6%Oregon 99,738 60.4% 13.0% 7.8% 8.0% 10.8% 77.7% 22.3%Washington 162,973 60.5% 11.8% 8.4% 7.3% 12.0% 77.7% 22.3%
Source: Agency for Healthcare Research and Quality, Center for Financing, Access and Cost Trends. 2008 Medical Expenditure PanelSurvey-Insurance Component.Note: Definitions and descriptions of the methods used for this survey can be found in the Technical Appendix.Percents may not add to 100% because of rounding.
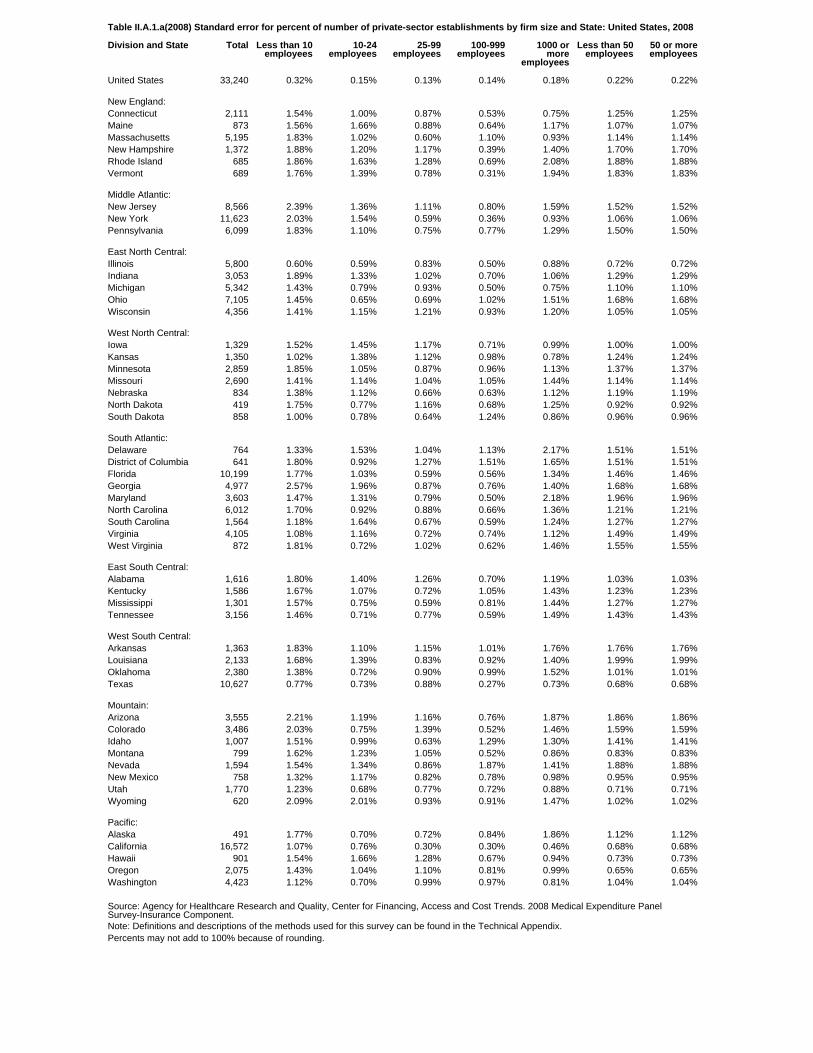
Table II.A.1.a(2008) Standard error for percent of number of private-sector establishments by firm size and State: United States, 2008
Division and State Total Less than 10employees
10-24employees
25-99employees
100-999employees
1000 ormore
employees
Less than 50employees
50 or moreemployees
United States 33,240 0.32% 0.15% 0.13% 0.14% 0.18% 0.22% 0.22%
New England:Connecticut 2,111 1.54% 1.00% 0.87% 0.53% 0.75% 1.25% 1.25%Maine 873 1.56% 1.66% 0.88% 0.64% 1.17% 1.07% 1.07%Massachusetts 5,195 1.83% 1.02% 0.60% 1.10% 0.93% 1.14% 1.14%New Hampshire 1,372 1.88% 1.20% 1.17% 0.39% 1.40% 1.70% 1.70%Rhode Island 685 1.86% 1.63% 1.28% 0.69% 2.08% 1.88% 1.88%Vermont 689 1.76% 1.39% 0.78% 0.31% 1.94% 1.83% 1.83%
Middle Atlantic:New Jersey 8,566 2.39% 1.36% 1.11% 0.80% 1.59% 1.52% 1.52%New York 11,623 2.03% 1.54% 0.59% 0.36% 0.93% 1.06% 1.06%Pennsylvania 6,099 1.83% 1.10% 0.75% 0.77% 1.29% 1.50% 1.50%
East North Central:Illinois 5,800 0.60% 0.59% 0.83% 0.50% 0.88% 0.72% 0.72%Indiana 3,053 1.89% 1.33% 1.02% 0.70% 1.06% 1.29% 1.29%Michigan 5,342 1.43% 0.79% 0.93% 0.50% 0.75% 1.10% 1.10%Ohio 7,105 1.45% 0.65% 0.69% 1.02% 1.51% 1.68% 1.68%Wisconsin 4,356 1.41% 1.15% 1.21% 0.93% 1.20% 1.05% 1.05%
West North Central:Iowa 1,329 1.52% 1.45% 1.17% 0.71% 0.99% 1.00% 1.00%Kansas 1,350 1.02% 1.38% 1.12% 0.98% 0.78% 1.24% 1.24%Minnesota 2,859 1.85% 1.05% 0.87% 0.96% 1.13% 1.37% 1.37%Missouri 2,690 1.41% 1.14% 1.04% 1.05% 1.44% 1.14% 1.14%Nebraska 834 1.38% 1.12% 0.66% 0.63% 1.12% 1.19% 1.19%North Dakota 419 1.75% 0.77% 1.16% 0.68% 1.25% 0.92% 0.92%South Dakota 858 1.00% 0.78% 0.64% 1.24% 0.86% 0.96% 0.96%
South Atlantic:Delaware 764 1.33% 1.53% 1.04% 1.13% 2.17% 1.51% 1.51%District of Columbia 641 1.80% 0.92% 1.27% 1.51% 1.65% 1.51% 1.51%Florida 10,199 1.77% 1.03% 0.59% 0.56% 1.34% 1.46% 1.46%Georgia 4,977 2.57% 1.96% 0.87% 0.76% 1.40% 1.68% 1.68%Maryland 3,603 1.47% 1.31% 0.79% 0.50% 2.18% 1.96% 1.96%North Carolina 6,012 1.70% 0.92% 0.88% 0.66% 1.36% 1.21% 1.21%South Carolina 1,564 1.18% 1.64% 0.67% 0.59% 1.24% 1.27% 1.27%Virginia 4,105 1.08% 1.16% 0.72% 0.74% 1.12% 1.49% 1.49%West Virginia 872 1.81% 0.72% 1.02% 0.62% 1.46% 1.55% 1.55%
East South Central:Alabama 1,616 1.80% 1.40% 1.26% 0.70% 1.19% 1.03% 1.03%Kentucky 1,586 1.67% 1.07% 0.72% 1.05% 1.43% 1.23% 1.23%Mississippi 1,301 1.57% 0.75% 0.59% 0.81% 1.44% 1.27% 1.27%Tennessee 3,156 1.46% 0.71% 0.77% 0.59% 1.49% 1.43% 1.43%
West South Central:Arkansas 1,363 1.83% 1.10% 1.15% 1.01% 1.76% 1.76% 1.76%Louisiana 2,133 1.68% 1.39% 0.83% 0.92% 1.40% 1.99% 1.99%Oklahoma 2,380 1.38% 0.72% 0.90% 0.99% 1.52% 1.01% 1.01%Texas 10,627 0.77% 0.73% 0.88% 0.27% 0.73% 0.68% 0.68%
Mountain:Arizona 3,555 2.21% 1.19% 1.16% 0.76% 1.87% 1.86% 1.86%Colorado 3,486 2.03% 0.75% 1.39% 0.52% 1.46% 1.59% 1.59%Idaho 1,007 1.51% 0.99% 0.63% 1.29% 1.30% 1.41% 1.41%Montana 799 1.62% 1.23% 1.05% 0.52% 0.86% 0.83% 0.83%Nevada 1,594 1.54% 1.34% 0.86% 1.87% 1.41% 1.88% 1.88%New Mexico 758 1.32% 1.17% 0.82% 0.78% 0.98% 0.95% 0.95%Utah 1,770 1.23% 0.68% 0.77% 0.72% 0.88% 0.71% 0.71%Wyoming 620 2.09% 2.01% 0.93% 0.91% 1.47% 1.02% 1.02%
Pacific:Alaska 491 1.77% 0.70% 0.72% 0.84% 1.86% 1.12% 1.12%California 16,572 1.07% 0.76% 0.30% 0.30% 0.46% 0.68% 0.68%Hawaii 901 1.54% 1.66% 1.28% 0.67% 0.94% 0.73% 0.73%Oregon 2,075 1.43% 1.04% 1.10% 0.81% 0.99% 0.65% 0.65%Washington 4,423 1.12% 0.70% 0.99% 0.97% 0.81% 1.04% 1.04%
Source: Agency for Healthcare Research and Quality, Center for Financing, Access and Cost Trends. 2008 Medical Expenditure PanelSurvey-Insurance Component.Note: Definitions and descriptions of the methods used for this survey can be found in the Technical Appendix.Percents may not add to 100% because of rounding.
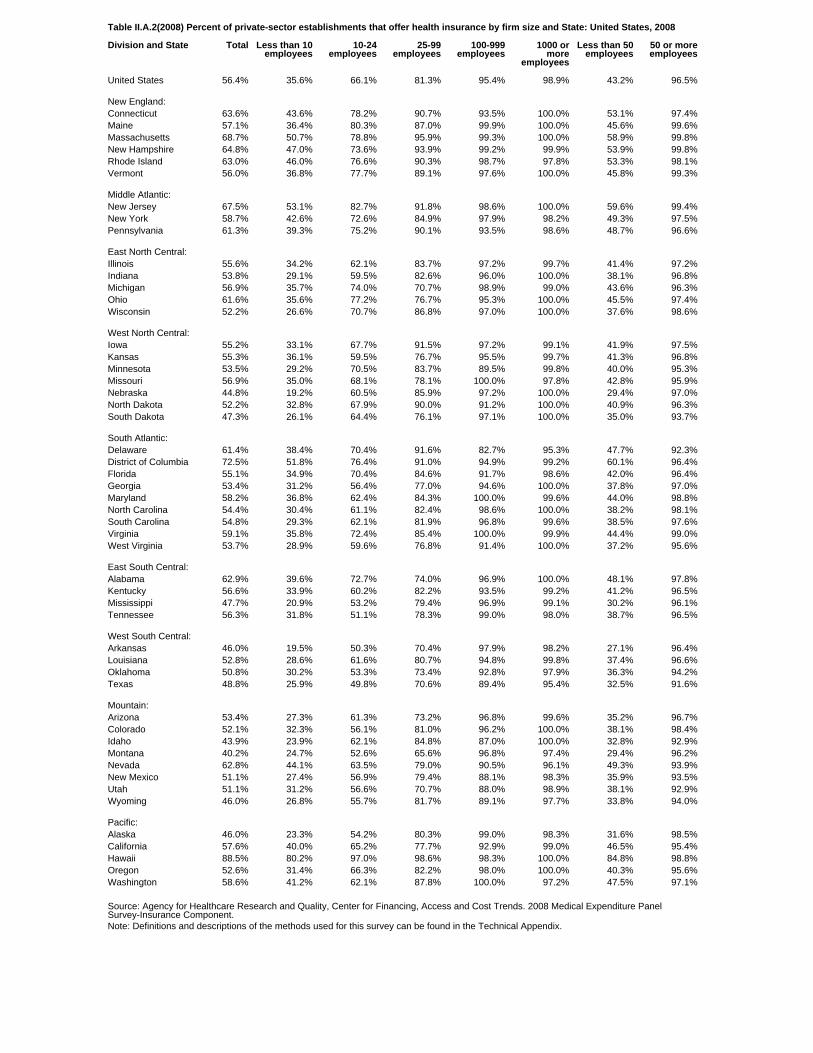
Table II.A.2(2008) Percent of private-sector establishments that offer health insurance by firm size and State: United States, 2008
Division and State Total Less than 10employees
10-24employees
25-99employees
100-999employees
1000 ormore
employees
Less than 50employees
50 or moreemployees
United States 56.4% 35.6% 66.1% 81.3% 95.4% 98.9% 43.2% 96.5%
New England:Connecticut 63.6% 43.6% 78.2% 90.7% 93.5% 100.0% 53.1% 97.4%Maine 57.1% 36.4% 80.3% 87.0% 99.9% 100.0% 45.6% 99.6%Massachusetts 68.7% 50.7% 78.8% 95.9% 99.3% 100.0% 58.9% 99.8%New Hampshire 64.8% 47.0% 73.6% 93.9% 99.2% 99.9% 53.9% 99.8%Rhode Island 63.0% 46.0% 76.6% 90.3% 98.7% 97.8% 53.3% 98.1%Vermont 56.0% 36.8% 77.7% 89.1% 97.6% 100.0% 45.8% 99.3%
Middle Atlantic:New Jersey 67.5% 53.1% 82.7% 91.8% 98.6% 100.0% 59.6% 99.4%New York 58.7% 42.6% 72.6% 84.9% 97.9% 98.2% 49.3% 97.5%Pennsylvania 61.3% 39.3% 75.2% 90.1% 93.5% 98.6% 48.7% 96.6%
East North Central:Illinois 55.6% 34.2% 62.1% 83.7% 97.2% 99.7% 41.4% 97.2%Indiana 53.8% 29.1% 59.5% 82.6% 96.0% 100.0% 38.1% 96.8%Michigan 56.9% 35.7% 74.0% 70.7% 98.9% 99.0% 43.6% 96.3%Ohio 61.6% 35.6% 77.2% 76.7% 95.3% 100.0% 45.5% 97.4%Wisconsin 52.2% 26.6% 70.7% 86.8% 97.0% 100.0% 37.6% 98.6%
West North Central:Iowa 55.2% 33.1% 67.7% 91.5% 97.2% 99.1% 41.9% 97.5%Kansas 55.3% 36.1% 59.5% 76.7% 95.5% 99.7% 41.3% 96.8%Minnesota 53.5% 29.2% 70.5% 83.7% 89.5% 99.8% 40.0% 95.3%Missouri 56.9% 35.0% 68.1% 78.1% 100.0% 97.8% 42.8% 95.9%Nebraska 44.8% 19.2% 60.5% 85.9% 97.2% 100.0% 29.4% 97.0%North Dakota 52.2% 32.8% 67.9% 90.0% 91.2% 100.0% 40.9% 96.3%South Dakota 47.3% 26.1% 64.4% 76.1% 97.1% 100.0% 35.0% 93.7%
South Atlantic:Delaware 61.4% 38.4% 70.4% 91.6% 82.7% 95.3% 47.7% 92.3%District of Columbia 72.5% 51.8% 76.4% 91.0% 94.9% 99.2% 60.1% 96.4%Florida 55.1% 34.9% 70.4% 84.6% 91.7% 98.6% 42.0% 96.4%Georgia 53.4% 31.2% 56.4% 77.0% 94.6% 100.0% 37.8% 97.0%Maryland 58.2% 36.8% 62.4% 84.3% 100.0% 99.6% 44.0% 98.8%North Carolina 54.4% 30.4% 61.1% 82.4% 98.6% 100.0% 38.2% 98.1%South Carolina 54.8% 29.3% 62.1% 81.9% 96.8% 99.6% 38.5% 97.6%Virginia 59.1% 35.8% 72.4% 85.4% 100.0% 99.9% 44.4% 99.0%West Virginia 53.7% 28.9% 59.6% 76.8% 91.4% 100.0% 37.2% 95.6%
East South Central:Alabama 62.9% 39.6% 72.7% 74.0% 96.9% 100.0% 48.1% 97.8%Kentucky 56.6% 33.9% 60.2% 82.2% 93.5% 99.2% 41.2% 96.5%Mississippi 47.7% 20.9% 53.2% 79.4% 96.9% 99.1% 30.2% 96.1%Tennessee 56.3% 31.8% 51.1% 78.3% 99.0% 98.0% 38.7% 96.5%
West South Central:Arkansas 46.0% 19.5% 50.3% 70.4% 97.9% 98.2% 27.1% 96.4%Louisiana 52.8% 28.6% 61.6% 80.7% 94.8% 99.8% 37.4% 96.6%Oklahoma 50.8% 30.2% 53.3% 73.4% 92.8% 97.9% 36.3% 94.2%Texas 48.8% 25.9% 49.8% 70.6% 89.4% 95.4% 32.5% 91.6%
Mountain:Arizona 53.4% 27.3% 61.3% 73.2% 96.8% 99.6% 35.2% 96.7%Colorado 52.1% 32.3% 56.1% 81.0% 96.2% 100.0% 38.1% 98.4%Idaho 43.9% 23.9% 62.1% 84.8% 87.0% 100.0% 32.8% 92.9%Montana 40.2% 24.7% 52.6% 65.6% 96.8% 97.4% 29.4% 96.2%Nevada 62.8% 44.1% 63.5% 79.0% 90.5% 96.1% 49.3% 93.9%New Mexico 51.1% 27.4% 56.9% 79.4% 88.1% 98.3% 35.9% 93.5%Utah 51.1% 31.2% 56.6% 70.7% 88.0% 98.9% 38.1% 92.9%Wyoming 46.0% 26.8% 55.7% 81.7% 89.1% 97.7% 33.8% 94.0%
Pacific:Alaska 46.0% 23.3% 54.2% 80.3% 99.0% 98.3% 31.6% 98.5%California 57.6% 40.0% 65.2% 77.7% 92.9% 99.0% 46.5% 95.4%Hawaii 88.5% 80.2% 97.0% 98.6% 98.3% 100.0% 84.8% 98.8%Oregon 52.6% 31.4% 66.3% 82.2% 98.0% 100.0% 40.3% 95.6%Washington 58.6% 41.2% 62.1% 87.8% 100.0% 97.2% 47.5% 97.1%
Source: Agency for Healthcare Research and Quality, Center for Financing, Access and Cost Trends. 2008 Medical Expenditure PanelSurvey-Insurance Component.Note: Definitions and descriptions of the methods used for this survey can be found in the Technical Appendix.
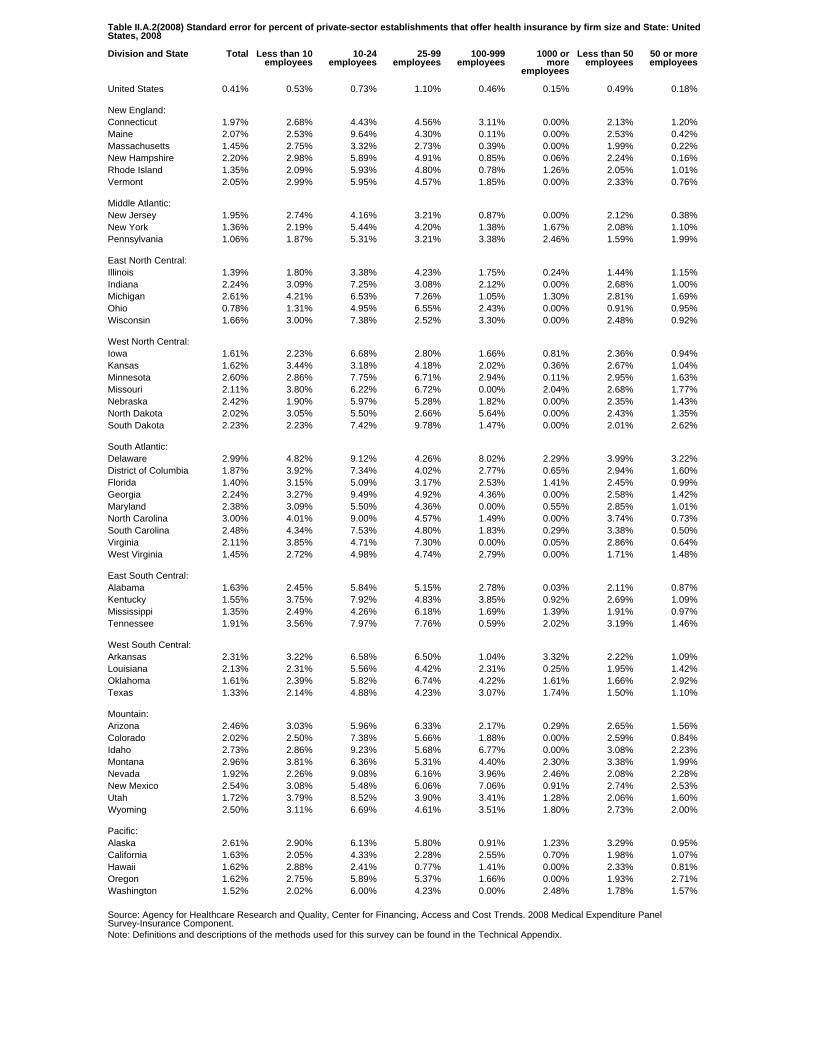
Table II.A.2(2008) Standard error for percent of private-sector establishments that offer health insurance by firm size and State: UnitedStates, 2008
Division and State Total Less than 10employees
10-24employees
25-99employees
100-999employees
1000 ormore
employees
Less than 50employees
50 or moreemployees
United States 0.41% 0.53% 0.73% 1.10% 0.46% 0.15% 0.49% 0.18%
New England:Connecticut 1.97% 2.68% 4.43% 4.56% 3.11% 0.00% 2.13% 1.20%Maine 2.07% 2.53% 9.64% 4.30% 0.11% 0.00% 2.53% 0.42%Massachusetts 1.45% 2.75% 3.32% 2.73% 0.39% 0.00% 1.99% 0.22%New Hampshire 2.20% 2.98% 5.89% 4.91% 0.85% 0.06% 2.24% 0.16%Rhode Island 1.35% 2.09% 5.93% 4.80% 0.78% 1.26% 2.05% 1.01%Vermont 2.05% 2.99% 5.95% 4.57% 1.85% 0.00% 2.33% 0.76%
Middle Atlantic:New Jersey 1.95% 2.74% 4.16% 3.21% 0.87% 0.00% 2.12% 0.38%New York 1.36% 2.19% 5.44% 4.20% 1.38% 1.67% 2.08% 1.10%Pennsylvania 1.06% 1.87% 5.31% 3.21% 3.38% 2.46% 1.59% 1.99%
East North Central:Illinois 1.39% 1.80% 3.38% 4.23% 1.75% 0.24% 1.44% 1.15%Indiana 2.24% 3.09% 7.25% 3.08% 2.12% 0.00% 2.68% 1.00%Michigan 2.61% 4.21% 6.53% 7.26% 1.05% 1.30% 2.81% 1.69%Ohio 0.78% 1.31% 4.95% 6.55% 2.43% 0.00% 0.91% 0.95%Wisconsin 1.66% 3.00% 7.38% 2.52% 3.30% 0.00% 2.48% 0.92%
West North Central:Iowa 1.61% 2.23% 6.68% 2.80% 1.66% 0.81% 2.36% 0.94%Kansas 1.62% 3.44% 3.18% 4.18% 2.02% 0.36% 2.67% 1.04%Minnesota 2.60% 2.86% 7.75% 6.71% 2.94% 0.11% 2.95% 1.63%Missouri 2.11% 3.80% 6.22% 6.72% 0.00% 2.04% 2.68% 1.77%Nebraska 2.42% 1.90% 5.97% 5.28% 1.82% 0.00% 2.35% 1.43%North Dakota 2.02% 3.05% 5.50% 2.66% 5.64% 0.00% 2.43% 1.35%South Dakota 2.23% 2.23% 7.42% 9.78% 1.47% 0.00% 2.01% 2.62%
South Atlantic:Delaware 2.99% 4.82% 9.12% 4.26% 8.02% 2.29% 3.99% 3.22%District of Columbia 1.87% 3.92% 7.34% 4.02% 2.77% 0.65% 2.94% 1.60%Florida 1.40% 3.15% 5.09% 3.17% 2.53% 1.41% 2.45% 0.99%Georgia 2.24% 3.27% 9.49% 4.92% 4.36% 0.00% 2.58% 1.42%Maryland 2.38% 3.09% 5.50% 4.36% 0.00% 0.55% 2.85% 1.01%North Carolina 3.00% 4.01% 9.00% 4.57% 1.49% 0.00% 3.74% 0.73%South Carolina 2.48% 4.34% 7.53% 4.80% 1.83% 0.29% 3.38% 0.50%Virginia 2.11% 3.85% 4.71% 7.30% 0.00% 0.05% 2.86% 0.64%West Virginia 1.45% 2.72% 4.98% 4.74% 2.79% 0.00% 1.71% 1.48%
East South Central:Alabama 1.63% 2.45% 5.84% 5.15% 2.78% 0.03% 2.11% 0.87%Kentucky 1.55% 3.75% 7.92% 4.83% 3.85% 0.92% 2.69% 1.09%Mississippi 1.35% 2.49% 4.26% 6.18% 1.69% 1.39% 1.91% 0.97%Tennessee 1.91% 3.56% 7.97% 7.76% 0.59% 2.02% 3.19% 1.46%
West South Central:Arkansas 2.31% 3.22% 6.58% 6.50% 1.04% 3.32% 2.22% 1.09%Louisiana 2.13% 2.31% 5.56% 4.42% 2.31% 0.25% 1.95% 1.42%Oklahoma 1.61% 2.39% 5.82% 6.74% 4.22% 1.61% 1.66% 2.92%Texas 1.33% 2.14% 4.88% 4.23% 3.07% 1.74% 1.50% 1.10%
Mountain:Arizona 2.46% 3.03% 5.96% 6.33% 2.17% 0.29% 2.65% 1.56%Colorado 2.02% 2.50% 7.38% 5.66% 1.88% 0.00% 2.59% 0.84%Idaho 2.73% 2.86% 9.23% 5.68% 6.77% 0.00% 3.08% 2.23%Montana 2.96% 3.81% 6.36% 5.31% 4.40% 2.30% 3.38% 1.99%Nevada 1.92% 2.26% 9.08% 6.16% 3.96% 2.46% 2.08% 2.28%New Mexico 2.54% 3.08% 5.48% 6.06% 7.06% 0.91% 2.74% 2.53%Utah 1.72% 3.79% 8.52% 3.90% 3.41% 1.28% 2.06% 1.60%Wyoming 2.50% 3.11% 6.69% 4.61% 3.51% 1.80% 2.73% 2.00%
Pacific:Alaska 2.61% 2.90% 6.13% 5.80% 0.91% 1.23% 3.29% 0.95%California 1.63% 2.05% 4.33% 2.28% 2.55% 0.70% 1.98% 1.07%Hawaii 1.62% 2.88% 2.41% 0.77% 1.41% 0.00% 2.33% 0.81%Oregon 1.62% 2.75% 5.89% 5.37% 1.66% 0.00% 1.93% 2.71%Washington 1.52% 2.02% 6.00% 4.23% 0.00% 2.48% 1.78% 1.57%
Source: Agency for Healthcare Research and Quality, Center for Financing, Access and Cost Trends. 2008 Medical Expenditure PanelSurvey-Insurance Component.Note: Definitions and descriptions of the methods used for this survey can be found in the Technical Appendix.
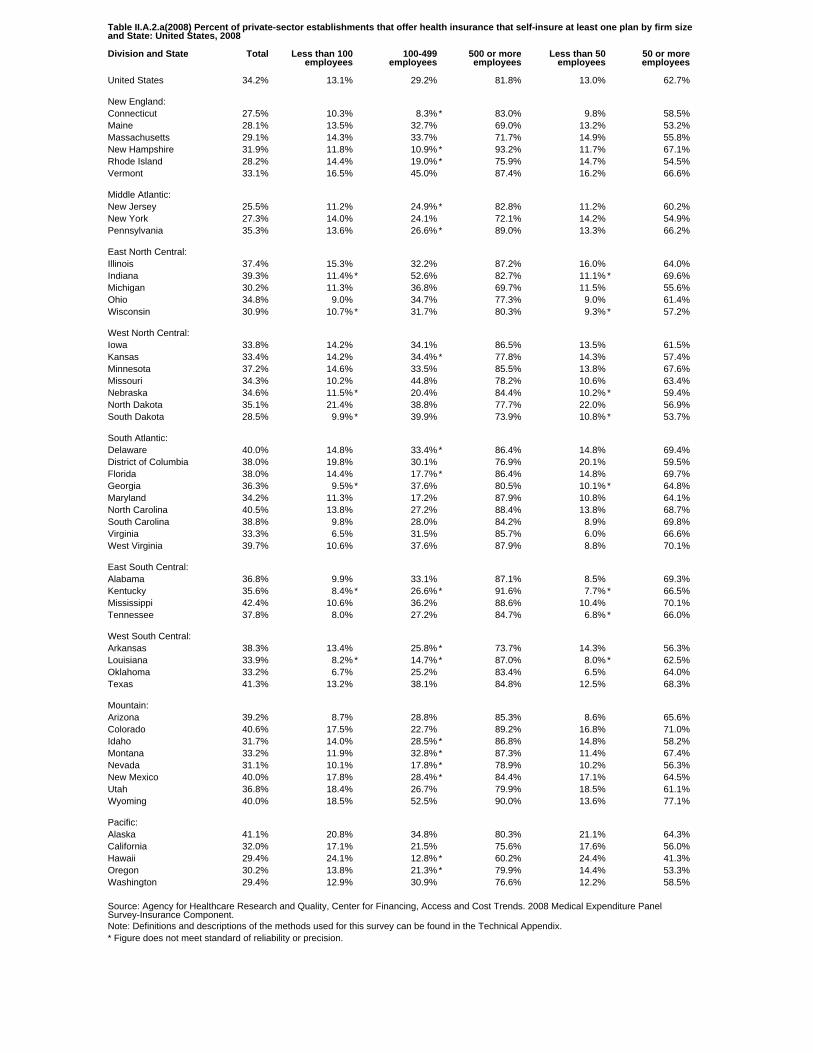
Table II.A.2.a(2008) Percent of private-sector establishments that offer health insurance that self-insure at least one plan by firm sizeand State: United States, 2008
Division and State Total Less than 100employees
100-499employees
500 or moreemployees
Less than 50employees
50 or moreemployees
United States 34.2% 13.1% 29.2% 81.8% 13.0% 62.7%
New England:Connecticut 27.5% 10.3% 8.3% * 83.0% 9.8% 58.5%Maine 28.1% 13.5% 32.7% 69.0% 13.2% 53.2%Massachusetts 29.1% 14.3% 33.7% 71.7% 14.9% 55.8%New Hampshire 31.9% 11.8% 10.9% * 93.2% 11.7% 67.1%Rhode Island 28.2% 14.4% 19.0% * 75.9% 14.7% 54.5%Vermont 33.1% 16.5% 45.0% 87.4% 16.2% 66.6%
Middle Atlantic:New Jersey 25.5% 11.2% 24.9% * 82.8% 11.2% 60.2%New York 27.3% 14.0% 24.1% 72.1% 14.2% 54.9%Pennsylvania 35.3% 13.6% 26.6% * 89.0% 13.3% 66.2%
East North Central:Illinois 37.4% 15.3% 32.2% 87.2% 16.0% 64.0%Indiana 39.3% 11.4% * 52.6% 82.7% 11.1% * 69.6%Michigan 30.2% 11.3% 36.8% 69.7% 11.5% 55.6%Ohio 34.8% 9.0% 34.7% 77.3% 9.0% 61.4%Wisconsin 30.9% 10.7% * 31.7% 80.3% 9.3% * 57.2%
West North Central:Iowa 33.8% 14.2% 34.1% 86.5% 13.5% 61.5%Kansas 33.4% 14.2% 34.4% * 77.8% 14.3% 57.4%Minnesota 37.2% 14.6% 33.5% 85.5% 13.8% 67.6%Missouri 34.3% 10.2% 44.8% 78.2% 10.6% 63.4%Nebraska 34.6% 11.5% * 20.4% 84.4% 10.2% * 59.4%North Dakota 35.1% 21.4% 38.8% 77.7% 22.0% 56.9%South Dakota 28.5% 9.9% * 39.9% 73.9% 10.8% * 53.7%
South Atlantic:Delaware 40.0% 14.8% 33.4% * 86.4% 14.8% 69.4%District of Columbia 38.0% 19.8% 30.1% 76.9% 20.1% 59.5%Florida 38.0% 14.4% 17.7% * 86.4% 14.8% 69.7%Georgia 36.3% 9.5% * 37.6% 80.5% 10.1% * 64.8%Maryland 34.2% 11.3% 17.2% 87.9% 10.8% 64.1%North Carolina 40.5% 13.8% 27.2% 88.4% 13.8% 68.7%South Carolina 38.8% 9.8% 28.0% 84.2% 8.9% 69.8%Virginia 33.3% 6.5% 31.5% 85.7% 6.0% 66.6%West Virginia 39.7% 10.6% 37.6% 87.9% 8.8% 70.1%
East South Central:Alabama 36.8% 9.9% 33.1% 87.1% 8.5% 69.3%Kentucky 35.6% 8.4% * 26.6% * 91.6% 7.7% * 66.5%Mississippi 42.4% 10.6% 36.2% 88.6% 10.4% 70.1%Tennessee 37.8% 8.0% 27.2% 84.7% 6.8% * 66.0%
West South Central:Arkansas 38.3% 13.4% 25.8% * 73.7% 14.3% 56.3%Louisiana 33.9% 8.2% * 14.7% * 87.0% 8.0% * 62.5%Oklahoma 33.2% 6.7% 25.2% 83.4% 6.5% 64.0%Texas 41.3% 13.2% 38.1% 84.8% 12.5% 68.3%
Mountain:Arizona 39.2% 8.7% 28.8% 85.3% 8.6% 65.6%Colorado 40.6% 17.5% 22.7% 89.2% 16.8% 71.0%Idaho 31.7% 14.0% 28.5% * 86.8% 14.8% 58.2%Montana 33.2% 11.9% 32.8% * 87.3% 11.4% 67.4%Nevada 31.1% 10.1% 17.8% * 78.9% 10.2% 56.3%New Mexico 40.0% 17.8% 28.4% * 84.4% 17.1% 64.5%Utah 36.8% 18.4% 26.7% 79.9% 18.5% 61.1%Wyoming 40.0% 18.5% 52.5% 90.0% 13.6% 77.1%
Pacific:Alaska 41.1% 20.8% 34.8% 80.3% 21.1% 64.3%California 32.0% 17.1% 21.5% 75.6% 17.6% 56.0%Hawaii 29.4% 24.1% 12.8% * 60.2% 24.4% 41.3%Oregon 30.2% 13.8% 21.3% * 79.9% 14.4% 53.3%Washington 29.4% 12.9% 30.9% 76.6% 12.2% 58.5%
Source: Agency for Healthcare Research and Quality, Center for Financing, Access and Cost Trends. 2008 Medical Expenditure PanelSurvey-Insurance Component.Note: Definitions and descriptions of the methods used for this survey can be found in the Technical Appendix.* Figure does not meet standard of reliability or precision.
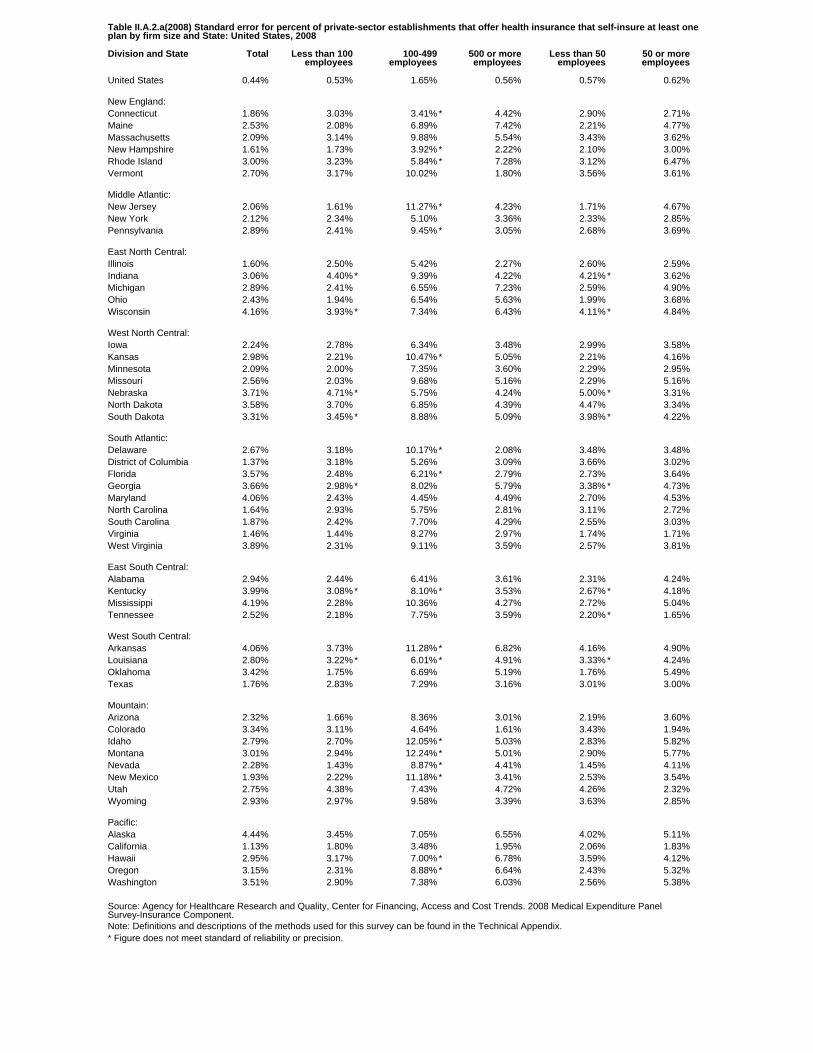
Table II.A.2.a(2008) Standard error for percent of private-sector establishments that offer health insurance that self-insure at least oneplan by firm size and State: United States, 2008
Division and State Total Less than 100employees
100-499employees
500 or moreemployees
Less than 50employees
50 or moreemployees
United States 0.44% 0.53% 1.65% 0.56% 0.57% 0.62%
New England:Connecticut 1.86% 3.03% 3.41% * 4.42% 2.90% 2.71%Maine 2.53% 2.08% 6.89% 7.42% 2.21% 4.77%Massachusetts 2.09% 3.14% 9.88% 5.54% 3.43% 3.62%New Hampshire 1.61% 1.73% 3.92% * 2.22% 2.10% 3.00%Rhode Island 3.00% 3.23% 5.84% * 7.28% 3.12% 6.47%Vermont 2.70% 3.17% 10.02% 1.80% 3.56% 3.61%
Middle Atlantic:New Jersey 2.06% 1.61% 11.27% * 4.23% 1.71% 4.67%New York 2.12% 2.34% 5.10% 3.36% 2.33% 2.85%Pennsylvania 2.89% 2.41% 9.45% * 3.05% 2.68% 3.69%
East North Central:Illinois 1.60% 2.50% 5.42% 2.27% 2.60% 2.59%Indiana 3.06% 4.40% * 9.39% 4.22% 4.21% * 3.62%Michigan 2.89% 2.41% 6.55% 7.23% 2.59% 4.90%Ohio 2.43% 1.94% 6.54% 5.63% 1.99% 3.68%Wisconsin 4.16% 3.93% * 7.34% 6.43% 4.11% * 4.84%
West North Central:Iowa 2.24% 2.78% 6.34% 3.48% 2.99% 3.58%Kansas 2.98% 2.21% 10.47% * 5.05% 2.21% 4.16%Minnesota 2.09% 2.00% 7.35% 3.60% 2.29% 2.95%Missouri 2.56% 2.03% 9.68% 5.16% 2.29% 5.16%Nebraska 3.71% 4.71% * 5.75% 4.24% 5.00% * 3.31%North Dakota 3.58% 3.70% 6.85% 4.39% 4.47% 3.34%South Dakota 3.31% 3.45% * 8.88% 5.09% 3.98% * 4.22%
South Atlantic:Delaware 2.67% 3.18% 10.17% * 2.08% 3.48% 3.48%District of Columbia 1.37% 3.18% 5.26% 3.09% 3.66% 3.02%Florida 3.57% 2.48% 6.21% * 2.79% 2.73% 3.64%Georgia 3.66% 2.98% * 8.02% 5.79% 3.38% * 4.73%Maryland 4.06% 2.43% 4.45% 4.49% 2.70% 4.53%North Carolina 1.64% 2.93% 5.75% 2.81% 3.11% 2.72%South Carolina 1.87% 2.42% 7.70% 4.29% 2.55% 3.03%Virginia 1.46% 1.44% 8.27% 2.97% 1.74% 1.71%West Virginia 3.89% 2.31% 9.11% 3.59% 2.57% 3.81%
East South Central:Alabama 2.94% 2.44% 6.41% 3.61% 2.31% 4.24%Kentucky 3.99% 3.08% * 8.10% * 3.53% 2.67% * 4.18%Mississippi 4.19% 2.28% 10.36% 4.27% 2.72% 5.04%Tennessee 2.52% 2.18% 7.75% 3.59% 2.20% * 1.65%
West South Central:Arkansas 4.06% 3.73% 11.28% * 6.82% 4.16% 4.90%Louisiana 2.80% 3.22% * 6.01% * 4.91% 3.33% * 4.24%Oklahoma 3.42% 1.75% 6.69% 5.19% 1.76% 5.49%Texas 1.76% 2.83% 7.29% 3.16% 3.01% 3.00%
Mountain:Arizona 2.32% 1.66% 8.36% 3.01% 2.19% 3.60%Colorado 3.34% 3.11% 4.64% 1.61% 3.43% 1.94%Idaho 2.79% 2.70% 12.05% * 5.03% 2.83% 5.82%Montana 3.01% 2.94% 12.24% * 5.01% 2.90% 5.77%Nevada 2.28% 1.43% 8.87% * 4.41% 1.45% 4.11%New Mexico 1.93% 2.22% 11.18% * 3.41% 2.53% 3.54%Utah 2.75% 4.38% 7.43% 4.72% 4.26% 2.32%Wyoming 2.93% 2.97% 9.58% 3.39% 3.63% 2.85%
Pacific:Alaska 4.44% 3.45% 7.05% 6.55% 4.02% 5.11%California 1.13% 1.80% 3.48% 1.95% 2.06% 1.83%Hawaii 2.95% 3.17% 7.00% * 6.78% 3.59% 4.12%Oregon 3.15% 2.31% 8.88% * 6.64% 2.43% 5.32%Washington 3.51% 2.90% 7.38% 6.03% 2.56% 5.38%
Source: Agency for Healthcare Research and Quality, Center for Financing, Access and Cost Trends. 2008 Medical Expenditure PanelSurvey-Insurance Component.Note: Definitions and descriptions of the methods used for this survey can be found in the Technical Appendix.* Figure does not meet standard of reliability or precision.
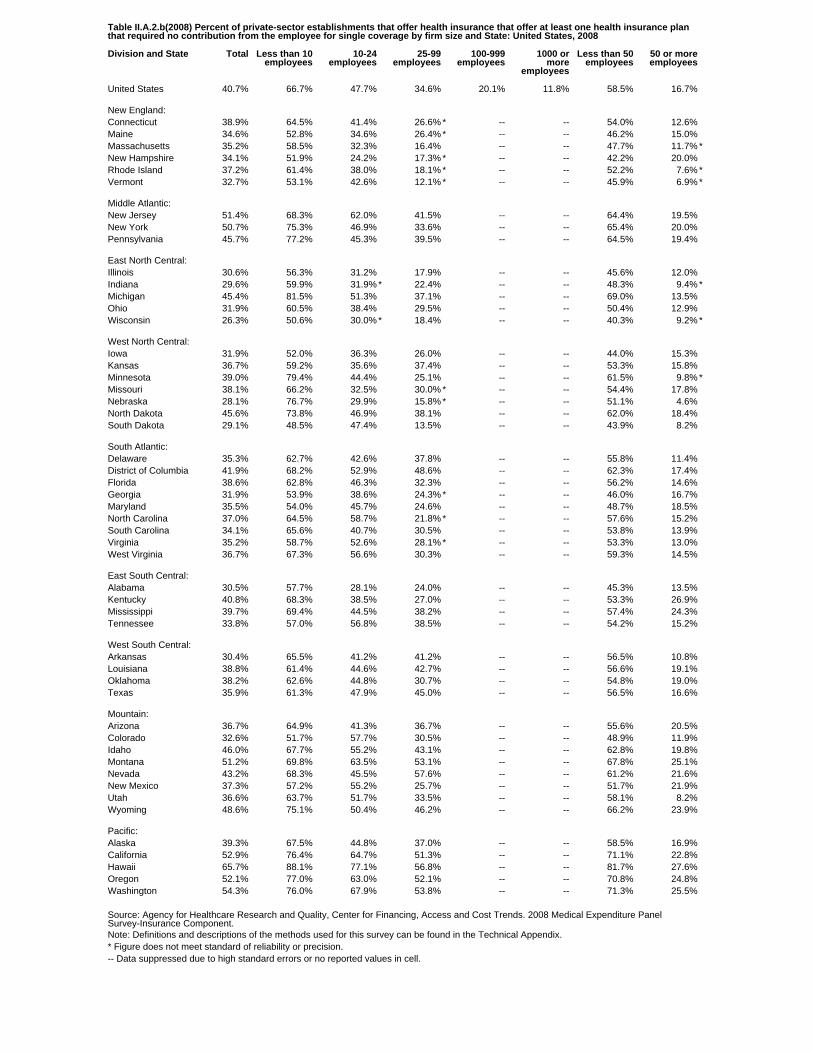
Table II.A.2.b(2008) Percent of private-sector establishments that offer health insurance that offer at least one health insurance planthat required no contribution from the employee for single coverage by firm size and State: United States, 2008
Division and State Total Less than 10employees
10-24employees
25-99employees
100-999employees
1000 ormore
employees
Less than 50employees
50 or moreemployees
United States 40.7% 66.7% 47.7% 34.6% 20.1% 11.8% 58.5% 16.7%
New England:Connecticut 38.9% 64.5% 41.4% 26.6% * -- -- 54.0% 12.6%Maine 34.6% 52.8% 34.6% 26.4% * -- -- 46.2% 15.0%Massachusetts 35.2% 58.5% 32.3% 16.4% -- -- 47.7% 11.7% *New Hampshire 34.1% 51.9% 24.2% 17.3% * -- -- 42.2% 20.0%Rhode Island 37.2% 61.4% 38.0% 18.1% * -- -- 52.2% 7.6% *Vermont 32.7% 53.1% 42.6% 12.1% * -- -- 45.9% 6.9% *
Middle Atlantic:New Jersey 51.4% 68.3% 62.0% 41.5% -- -- 64.4% 19.5%New York 50.7% 75.3% 46.9% 33.6% -- -- 65.4% 20.0%Pennsylvania 45.7% 77.2% 45.3% 39.5% -- -- 64.5% 19.4%
East North Central:Illinois 30.6% 56.3% 31.2% 17.9% -- -- 45.6% 12.0%Indiana 29.6% 59.9% 31.9% * 22.4% -- -- 48.3% 9.4% *Michigan 45.4% 81.5% 51.3% 37.1% -- -- 69.0% 13.5%Ohio 31.9% 60.5% 38.4% 29.5% -- -- 50.4% 12.9%Wisconsin 26.3% 50.6% 30.0% * 18.4% -- -- 40.3% 9.2% *
West North Central:Iowa 31.9% 52.0% 36.3% 26.0% -- -- 44.0% 15.3%Kansas 36.7% 59.2% 35.6% 37.4% -- -- 53.3% 15.8%Minnesota 39.0% 79.4% 44.4% 25.1% -- -- 61.5% 9.8% *Missouri 38.1% 66.2% 32.5% 30.0% * -- -- 54.4% 17.8%Nebraska 28.1% 76.7% 29.9% 15.8% * -- -- 51.1% 4.6%North Dakota 45.6% 73.8% 46.9% 38.1% -- -- 62.0% 18.4%South Dakota 29.1% 48.5% 47.4% 13.5% -- -- 43.9% 8.2%
South Atlantic:Delaware 35.3% 62.7% 42.6% 37.8% -- -- 55.8% 11.4%District of Columbia 41.9% 68.2% 52.9% 48.6% -- -- 62.3% 17.4%Florida 38.6% 62.8% 46.3% 32.3% -- -- 56.2% 14.6%Georgia 31.9% 53.9% 38.6% 24.3% * -- -- 46.0% 16.7%Maryland 35.5% 54.0% 45.7% 24.6% -- -- 48.7% 18.5%North Carolina 37.0% 64.5% 58.7% 21.8% * -- -- 57.6% 15.2%South Carolina 34.1% 65.6% 40.7% 30.5% -- -- 53.8% 13.9%Virginia 35.2% 58.7% 52.6% 28.1% * -- -- 53.3% 13.0%West Virginia 36.7% 67.3% 56.6% 30.3% -- -- 59.3% 14.5%
East South Central:Alabama 30.5% 57.7% 28.1% 24.0% -- -- 45.3% 13.5%Kentucky 40.8% 68.3% 38.5% 27.0% -- -- 53.3% 26.9%Mississippi 39.7% 69.4% 44.5% 38.2% -- -- 57.4% 24.3%Tennessee 33.8% 57.0% 56.8% 38.5% -- -- 54.2% 15.2%
West South Central:Arkansas 30.4% 65.5% 41.2% 41.2% -- -- 56.5% 10.8%Louisiana 38.8% 61.4% 44.6% 42.7% -- -- 56.6% 19.1%Oklahoma 38.2% 62.6% 44.8% 30.7% -- -- 54.8% 19.0%Texas 35.9% 61.3% 47.9% 45.0% -- -- 56.5% 16.6%
Mountain:Arizona 36.7% 64.9% 41.3% 36.7% -- -- 55.6% 20.5%Colorado 32.6% 51.7% 57.7% 30.5% -- -- 48.9% 11.9%Idaho 46.0% 67.7% 55.2% 43.1% -- -- 62.8% 19.8%Montana 51.2% 69.8% 63.5% 53.1% -- -- 67.8% 25.1%Nevada 43.2% 68.3% 45.5% 57.6% -- -- 61.2% 21.6%New Mexico 37.3% 57.2% 55.2% 25.7% -- -- 51.7% 21.9%Utah 36.6% 63.7% 51.7% 33.5% -- -- 58.1% 8.2%Wyoming 48.6% 75.1% 50.4% 46.2% -- -- 66.2% 23.9%
Pacific:Alaska 39.3% 67.5% 44.8% 37.0% -- -- 58.5% 16.9%California 52.9% 76.4% 64.7% 51.3% -- -- 71.1% 22.8%Hawaii 65.7% 88.1% 77.1% 56.8% -- -- 81.7% 27.6%Oregon 52.1% 77.0% 63.0% 52.1% -- -- 70.8% 24.8%Washington 54.3% 76.0% 67.9% 53.8% -- -- 71.3% 25.5%
Source: Agency for Healthcare Research and Quality, Center for Financing, Access and Cost Trends. 2008 Medical Expenditure PanelSurvey-Insurance Component.Note: Definitions and descriptions of the methods used for this survey can be found in the Technical Appendix.* Figure does not meet standard of reliability or precision.-- Data suppressed due to high standard errors or no reported values in cell.
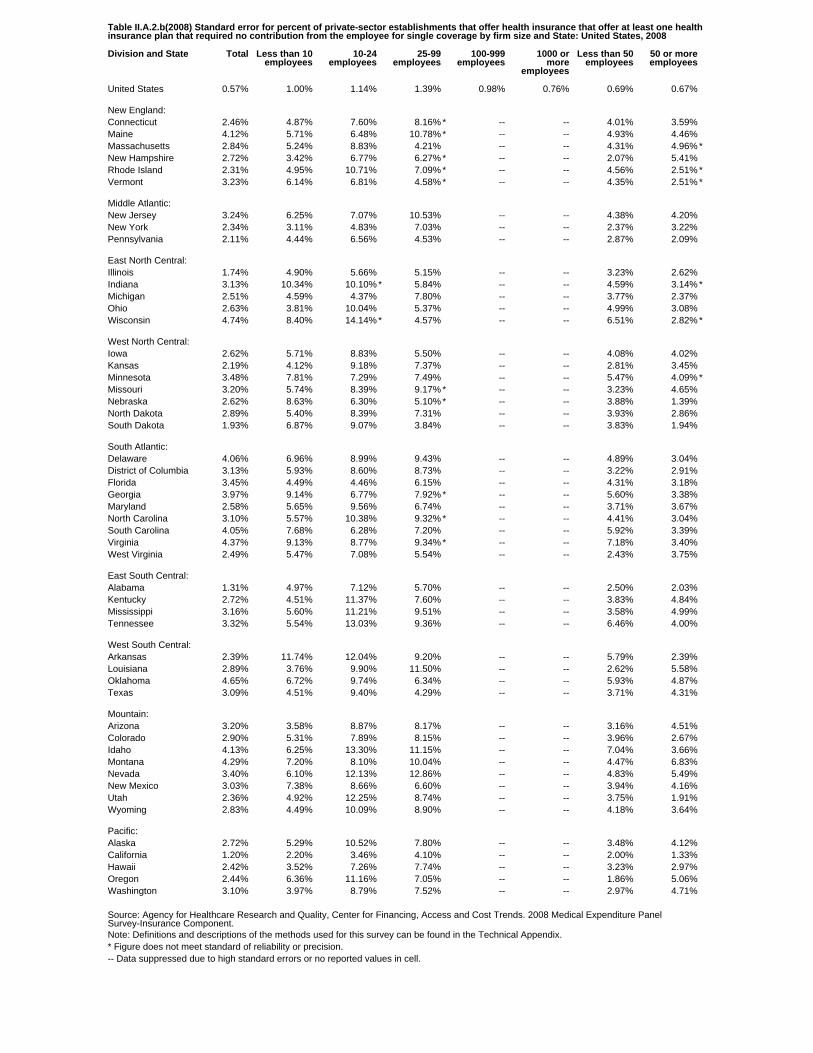
Table II.A.2.b(2008) Standard error for percent of private-sector establishments that offer health insurance that offer at least one healthinsurance plan that required no contribution from the employee for single coverage by firm size and State: United States, 2008
Division and State Total Less than 10employees
10-24employees
25-99employees
100-999employees
1000 ormore
employees
Less than 50employees
50 or moreemployees
United States 0.57% 1.00% 1.14% 1.39% 0.98% 0.76% 0.69% 0.67%
New England:Connecticut 2.46% 4.87% 7.60% 8.16% * -- -- 4.01% 3.59%Maine 4.12% 5.71% 6.48% 10.78% * -- -- 4.93% 4.46%Massachusetts 2.84% 5.24% 8.83% 4.21% -- -- 4.31% 4.96% *New Hampshire 2.72% 3.42% 6.77% 6.27% * -- -- 2.07% 5.41%Rhode Island 2.31% 4.95% 10.71% 7.09% * -- -- 4.56% 2.51% *Vermont 3.23% 6.14% 6.81% 4.58% * -- -- 4.35% 2.51% *
Middle Atlantic:New Jersey 3.24% 6.25% 7.07% 10.53% -- -- 4.38% 4.20%New York 2.34% 3.11% 4.83% 7.03% -- -- 2.37% 3.22%Pennsylvania 2.11% 4.44% 6.56% 4.53% -- -- 2.87% 2.09%
East North Central:Illinois 1.74% 4.90% 5.66% 5.15% -- -- 3.23% 2.62%Indiana 3.13% 10.34% 10.10% * 5.84% -- -- 4.59% 3.14% *Michigan 2.51% 4.59% 4.37% 7.80% -- -- 3.77% 2.37%Ohio 2.63% 3.81% 10.04% 5.37% -- -- 4.99% 3.08%Wisconsin 4.74% 8.40% 14.14% * 4.57% -- -- 6.51% 2.82% *
West North Central:Iowa 2.62% 5.71% 8.83% 5.50% -- -- 4.08% 4.02%Kansas 2.19% 4.12% 9.18% 7.37% -- -- 2.81% 3.45%Minnesota 3.48% 7.81% 7.29% 7.49% -- -- 5.47% 4.09% *Missouri 3.20% 5.74% 8.39% 9.17% * -- -- 3.23% 4.65%Nebraska 2.62% 8.63% 6.30% 5.10% * -- -- 3.88% 1.39%North Dakota 2.89% 5.40% 8.39% 7.31% -- -- 3.93% 2.86%South Dakota 1.93% 6.87% 9.07% 3.84% -- -- 3.83% 1.94%
South Atlantic:Delaware 4.06% 6.96% 8.99% 9.43% -- -- 4.89% 3.04%District of Columbia 3.13% 5.93% 8.60% 8.73% -- -- 3.22% 2.91%Florida 3.45% 4.49% 4.46% 6.15% -- -- 4.31% 3.18%Georgia 3.97% 9.14% 6.77% 7.92% * -- -- 5.60% 3.38%Maryland 2.58% 5.65% 9.56% 6.74% -- -- 3.71% 3.67%North Carolina 3.10% 5.57% 10.38% 9.32% * -- -- 4.41% 3.04%South Carolina 4.05% 7.68% 6.28% 7.20% -- -- 5.92% 3.39%Virginia 4.37% 9.13% 8.77% 9.34% * -- -- 7.18% 3.40%West Virginia 2.49% 5.47% 7.08% 5.54% -- -- 2.43% 3.75%
East South Central:Alabama 1.31% 4.97% 7.12% 5.70% -- -- 2.50% 2.03%Kentucky 2.72% 4.51% 11.37% 7.60% -- -- 3.83% 4.84%Mississippi 3.16% 5.60% 11.21% 9.51% -- -- 3.58% 4.99%Tennessee 3.32% 5.54% 13.03% 9.36% -- -- 6.46% 4.00%
West South Central:Arkansas 2.39% 11.74% 12.04% 9.20% -- -- 5.79% 2.39%Louisiana 2.89% 3.76% 9.90% 11.50% -- -- 2.62% 5.58%Oklahoma 4.65% 6.72% 9.74% 6.34% -- -- 5.93% 4.87%Texas 3.09% 4.51% 9.40% 4.29% -- -- 3.71% 4.31%
Mountain:Arizona 3.20% 3.58% 8.87% 8.17% -- -- 3.16% 4.51%Colorado 2.90% 5.31% 7.89% 8.15% -- -- 3.96% 2.67%Idaho 4.13% 6.25% 13.30% 11.15% -- -- 7.04% 3.66%Montana 4.29% 7.20% 8.10% 10.04% -- -- 4.47% 6.83%Nevada 3.40% 6.10% 12.13% 12.86% -- -- 4.83% 5.49%New Mexico 3.03% 7.38% 8.66% 6.60% -- -- 3.94% 4.16%Utah 2.36% 4.92% 12.25% 8.74% -- -- 3.75% 1.91%Wyoming 2.83% 4.49% 10.09% 8.90% -- -- 4.18% 3.64%
Pacific:Alaska 2.72% 5.29% 10.52% 7.80% -- -- 3.48% 4.12%California 1.20% 2.20% 3.46% 4.10% -- -- 2.00% 1.33%Hawaii 2.42% 3.52% 7.26% 7.74% -- -- 3.23% 2.97%Oregon 2.44% 6.36% 11.16% 7.05% -- -- 1.86% 5.06%Washington 3.10% 3.97% 8.79% 7.52% -- -- 2.97% 4.71%
Source: Agency for Healthcare Research and Quality, Center for Financing, Access and Cost Trends. 2008 Medical Expenditure PanelSurvey-Insurance Component.Note: Definitions and descriptions of the methods used for this survey can be found in the Technical Appendix.* Figure does not meet standard of reliability or precision.-- Data suppressed due to high standard errors or no reported values in cell.
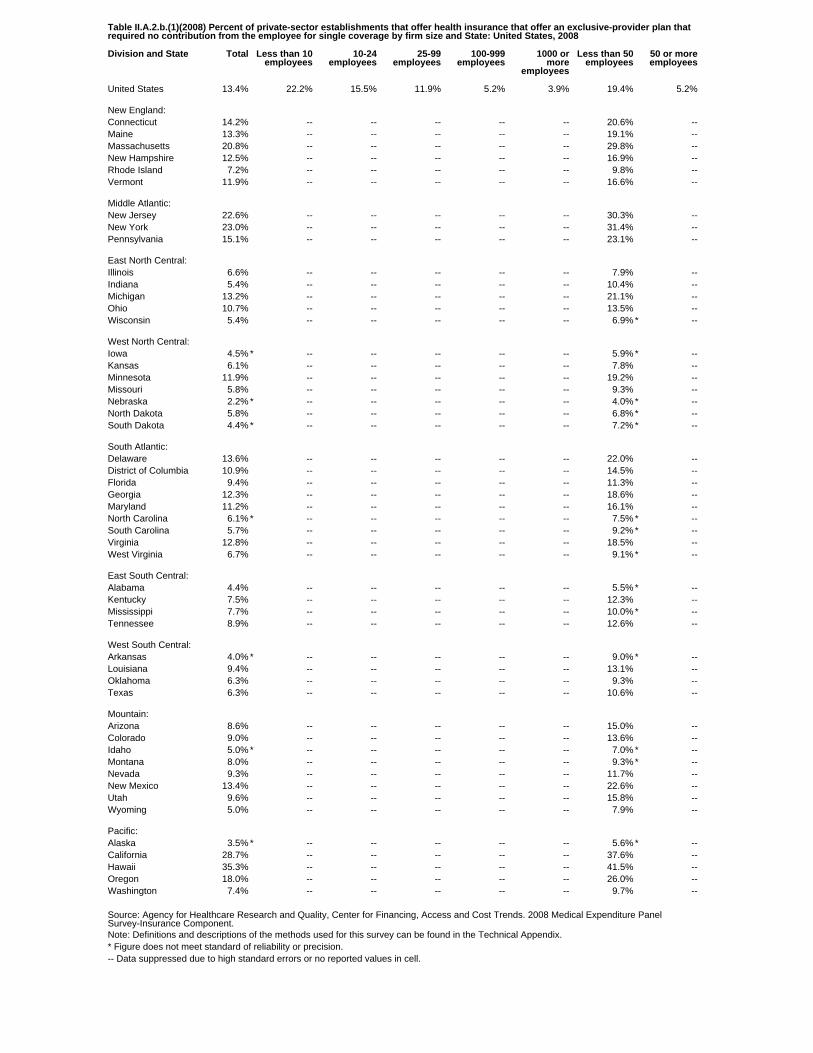
Table II.A.2.b.(1)(2008) Percent of private-sector establishments that offer health insurance that offer an exclusive-provider plan thatrequired no contribution from the employee for single coverage by firm size and State: United States, 2008
Division and State Total Less than 10employees
10-24employees
25-99employees
100-999employees
1000 ormore
employees
Less than 50employees
50 or moreemployees
United States 13.4% 22.2% 15.5% 11.9% 5.2% 3.9% 19.4% 5.2%
New England:Connecticut 14.2% -- -- -- -- -- 20.6% --Maine 13.3% -- -- -- -- -- 19.1% --Massachusetts 20.8% -- -- -- -- -- 29.8% --New Hampshire 12.5% -- -- -- -- -- 16.9% --Rhode Island 7.2% -- -- -- -- -- 9.8% --Vermont 11.9% -- -- -- -- -- 16.6% --
Middle Atlantic:New Jersey 22.6% -- -- -- -- -- 30.3% --New York 23.0% -- -- -- -- -- 31.4% --Pennsylvania 15.1% -- -- -- -- -- 23.1% --
East North Central:Illinois 6.6% -- -- -- -- -- 7.9% --Indiana 5.4% -- -- -- -- -- 10.4% --Michigan 13.2% -- -- -- -- -- 21.1% --Ohio 10.7% -- -- -- -- -- 13.5% --Wisconsin 5.4% -- -- -- -- -- 6.9% * --
West North Central:Iowa 4.5% * -- -- -- -- -- 5.9% * --Kansas 6.1% -- -- -- -- -- 7.8% --Minnesota 11.9% -- -- -- -- -- 19.2% --Missouri 5.8% -- -- -- -- -- 9.3% --Nebraska 2.2% * -- -- -- -- -- 4.0% * --North Dakota 5.8% -- -- -- -- -- 6.8% * --South Dakota 4.4% * -- -- -- -- -- 7.2% * --
South Atlantic:Delaware 13.6% -- -- -- -- -- 22.0% --District of Columbia 10.9% -- -- -- -- -- 14.5% --Florida 9.4% -- -- -- -- -- 11.3% --Georgia 12.3% -- -- -- -- -- 18.6% --Maryland 11.2% -- -- -- -- -- 16.1% --North Carolina 6.1% * -- -- -- -- -- 7.5% * --South Carolina 5.7% -- -- -- -- -- 9.2% * --Virginia 12.8% -- -- -- -- -- 18.5% --West Virginia 6.7% -- -- -- -- -- 9.1% * --
East South Central:Alabama 4.4% -- -- -- -- -- 5.5% * --Kentucky 7.5% -- -- -- -- -- 12.3% --Mississippi 7.7% -- -- -- -- -- 10.0% * --Tennessee 8.9% -- -- -- -- -- 12.6% --
West South Central:Arkansas 4.0% * -- -- -- -- -- 9.0% * --Louisiana 9.4% -- -- -- -- -- 13.1% --Oklahoma 6.3% -- -- -- -- -- 9.3% --Texas 6.3% -- -- -- -- -- 10.6% --
Mountain:Arizona 8.6% -- -- -- -- -- 15.0% --Colorado 9.0% -- -- -- -- -- 13.6% --Idaho 5.0% * -- -- -- -- -- 7.0% * --Montana 8.0% -- -- -- -- -- 9.3% * --Nevada 9.3% -- -- -- -- -- 11.7% --New Mexico 13.4% -- -- -- -- -- 22.6% --Utah 9.6% -- -- -- -- -- 15.8% --Wyoming 5.0% -- -- -- -- -- 7.9% --
Pacific:Alaska 3.5% * -- -- -- -- -- 5.6% * --California 28.7% -- -- -- -- -- 37.6% --Hawaii 35.3% -- -- -- -- -- 41.5% --Oregon 18.0% -- -- -- -- -- 26.0% --Washington 7.4% -- -- -- -- -- 9.7% --
Source: Agency for Healthcare Research and Quality, Center for Financing, Access and Cost Trends. 2008 Medical Expenditure PanelSurvey-Insurance Component.Note: Definitions and descriptions of the methods used for this survey can be found in the Technical Appendix.* Figure does not meet standard of reliability or precision.-- Data suppressed due to high standard errors or no reported values in cell.
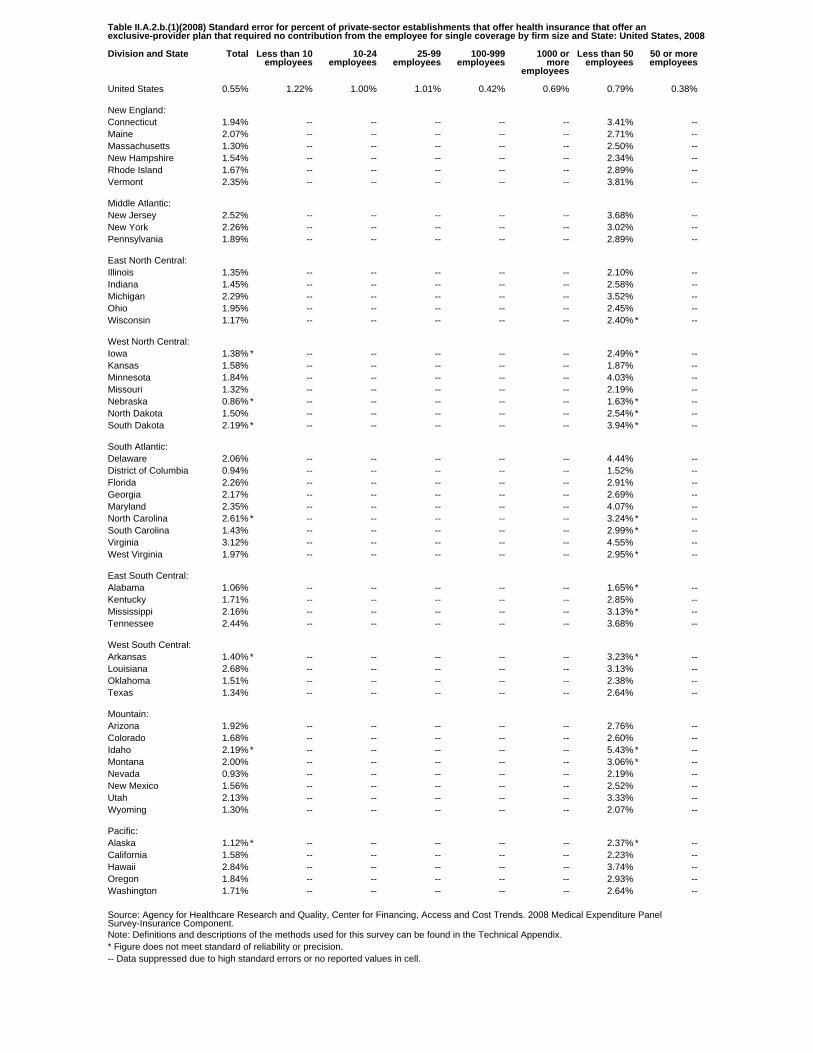
Table II.A.2.b.(1)(2008) Standard error for percent of private-sector establishments that offer health insurance that offer anexclusive-provider plan that required no contribution from the employee for single coverage by firm size and State: United States, 2008
Division and State Total Less than 10employees
10-24employees
25-99employees
100-999employees
1000 ormore
employees
Less than 50employees
50 or moreemployees
United States 0.55% 1.22% 1.00% 1.01% 0.42% 0.69% 0.79% 0.38%
New England:Connecticut 1.94% -- -- -- -- -- 3.41% --Maine 2.07% -- -- -- -- -- 2.71% --Massachusetts 1.30% -- -- -- -- -- 2.50% --New Hampshire 1.54% -- -- -- -- -- 2.34% --Rhode Island 1.67% -- -- -- -- -- 2.89% --Vermont 2.35% -- -- -- -- -- 3.81% --
Middle Atlantic:New Jersey 2.52% -- -- -- -- -- 3.68% --New York 2.26% -- -- -- -- -- 3.02% --Pennsylvania 1.89% -- -- -- -- -- 2.89% --
East North Central:Illinois 1.35% -- -- -- -- -- 2.10% --Indiana 1.45% -- -- -- -- -- 2.58% --Michigan 2.29% -- -- -- -- -- 3.52% --Ohio 1.95% -- -- -- -- -- 2.45% --Wisconsin 1.17% -- -- -- -- -- 2.40% * --
West North Central:Iowa 1.38% * -- -- -- -- -- 2.49% * --Kansas 1.58% -- -- -- -- -- 1.87% --Minnesota 1.84% -- -- -- -- -- 4.03% --Missouri 1.32% -- -- -- -- -- 2.19% --Nebraska 0.86% * -- -- -- -- -- 1.63% * --North Dakota 1.50% -- -- -- -- -- 2.54% * --South Dakota 2.19% * -- -- -- -- -- 3.94% * --
South Atlantic:Delaware 2.06% -- -- -- -- -- 4.44% --District of Columbia 0.94% -- -- -- -- -- 1.52% --Florida 2.26% -- -- -- -- -- 2.91% --Georgia 2.17% -- -- -- -- -- 2.69% --Maryland 2.35% -- -- -- -- -- 4.07% --North Carolina 2.61% * -- -- -- -- -- 3.24% * --South Carolina 1.43% -- -- -- -- -- 2.99% * --Virginia 3.12% -- -- -- -- -- 4.55% --West Virginia 1.97% -- -- -- -- -- 2.95% * --
East South Central:Alabama 1.06% -- -- -- -- -- 1.65% * --Kentucky 1.71% -- -- -- -- -- 2.85% --Mississippi 2.16% -- -- -- -- -- 3.13% * --Tennessee 2.44% -- -- -- -- -- 3.68% --
West South Central:Arkansas 1.40% * -- -- -- -- -- 3.23% * --Louisiana 2.68% -- -- -- -- -- 3.13% --Oklahoma 1.51% -- -- -- -- -- 2.38% --Texas 1.34% -- -- -- -- -- 2.64% --
Mountain:Arizona 1.92% -- -- -- -- -- 2.76% --Colorado 1.68% -- -- -- -- -- 2.60% --Idaho 2.19% * -- -- -- -- -- 5.43% * --Montana 2.00% -- -- -- -- -- 3.06% * --Nevada 0.93% -- -- -- -- -- 2.19% --New Mexico 1.56% -- -- -- -- -- 2.52% --Utah 2.13% -- -- -- -- -- 3.33% --Wyoming 1.30% -- -- -- -- -- 2.07% --
Pacific:Alaska 1.12% * -- -- -- -- -- 2.37% * --California 1.58% -- -- -- -- -- 2.23% --Hawaii 2.84% -- -- -- -- -- 3.74% --Oregon 1.84% -- -- -- -- -- 2.93% --Washington 1.71% -- -- -- -- -- 2.64% --
Source: Agency for Healthcare Research and Quality, Center for Financing, Access and Cost Trends. 2008 Medical Expenditure PanelSurvey-Insurance Component.Note: Definitions and descriptions of the methods used for this survey can be found in the Technical Appendix.* Figure does not meet standard of reliability or precision.-- Data suppressed due to high standard errors or no reported values in cell.
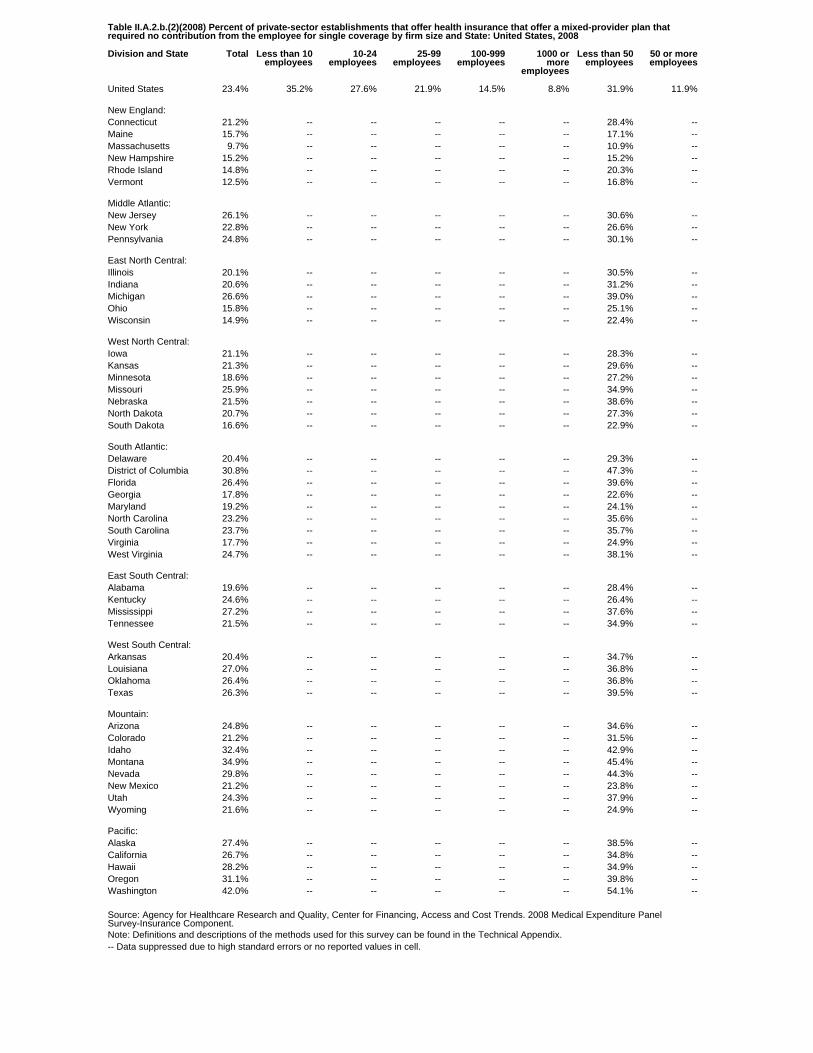
Table II.A.2.b.(2)(2008) Percent of private-sector establishments that offer health insurance that offer a mixed-provider plan thatrequired no contribution from the employee for single coverage by firm size and State: United States, 2008
Division and State Total Less than 10employees
10-24employees
25-99employees
100-999employees
1000 ormore
employees
Less than 50employees
50 or moreemployees
United States 23.4% 35.2% 27.6% 21.9% 14.5% 8.8% 31.9% 11.9%
New England:Connecticut 21.2% -- -- -- -- -- 28.4% --Maine 15.7% -- -- -- -- -- 17.1% --Massachusetts 9.7% -- -- -- -- -- 10.9% --New Hampshire 15.2% -- -- -- -- -- 15.2% --Rhode Island 14.8% -- -- -- -- -- 20.3% --Vermont 12.5% -- -- -- -- -- 16.8% --
Middle Atlantic:New Jersey 26.1% -- -- -- -- -- 30.6% --New York 22.8% -- -- -- -- -- 26.6% --Pennsylvania 24.8% -- -- -- -- -- 30.1% --
East North Central:Illinois 20.1% -- -- -- -- -- 30.5% --Indiana 20.6% -- -- -- -- -- 31.2% --Michigan 26.6% -- -- -- -- -- 39.0% --Ohio 15.8% -- -- -- -- -- 25.1% --Wisconsin 14.9% -- -- -- -- -- 22.4% --
West North Central:Iowa 21.1% -- -- -- -- -- 28.3% --Kansas 21.3% -- -- -- -- -- 29.6% --Minnesota 18.6% -- -- -- -- -- 27.2% --Missouri 25.9% -- -- -- -- -- 34.9% --Nebraska 21.5% -- -- -- -- -- 38.6% --North Dakota 20.7% -- -- -- -- -- 27.3% --South Dakota 16.6% -- -- -- -- -- 22.9% --
South Atlantic:Delaware 20.4% -- -- -- -- -- 29.3% --District of Columbia 30.8% -- -- -- -- -- 47.3% --Florida 26.4% -- -- -- -- -- 39.6% --Georgia 17.8% -- -- -- -- -- 22.6% --Maryland 19.2% -- -- -- -- -- 24.1% --North Carolina 23.2% -- -- -- -- -- 35.6% --South Carolina 23.7% -- -- -- -- -- 35.7% --Virginia 17.7% -- -- -- -- -- 24.9% --West Virginia 24.7% -- -- -- -- -- 38.1% --
East South Central:Alabama 19.6% -- -- -- -- -- 28.4% --Kentucky 24.6% -- -- -- -- -- 26.4% --Mississippi 27.2% -- -- -- -- -- 37.6% --Tennessee 21.5% -- -- -- -- -- 34.9% --
West South Central:Arkansas 20.4% -- -- -- -- -- 34.7% --Louisiana 27.0% -- -- -- -- -- 36.8% --Oklahoma 26.4% -- -- -- -- -- 36.8% --Texas 26.3% -- -- -- -- -- 39.5% --
Mountain:Arizona 24.8% -- -- -- -- -- 34.6% --Colorado 21.2% -- -- -- -- -- 31.5% --Idaho 32.4% -- -- -- -- -- 42.9% --Montana 34.9% -- -- -- -- -- 45.4% --Nevada 29.8% -- -- -- -- -- 44.3% --New Mexico 21.2% -- -- -- -- -- 23.8% --Utah 24.3% -- -- -- -- -- 37.9% --Wyoming 21.6% -- -- -- -- -- 24.9% --
Pacific:Alaska 27.4% -- -- -- -- -- 38.5% --California 26.7% -- -- -- -- -- 34.8% --Hawaii 28.2% -- -- -- -- -- 34.9% --Oregon 31.1% -- -- -- -- -- 39.8% --Washington 42.0% -- -- -- -- -- 54.1% --
Source: Agency for Healthcare Research and Quality, Center for Financing, Access and Cost Trends. 2008 Medical Expenditure PanelSurvey-Insurance Component.Note: Definitions and descriptions of the methods used for this survey can be found in the Technical Appendix.-- Data suppressed due to high standard errors or no reported values in cell.
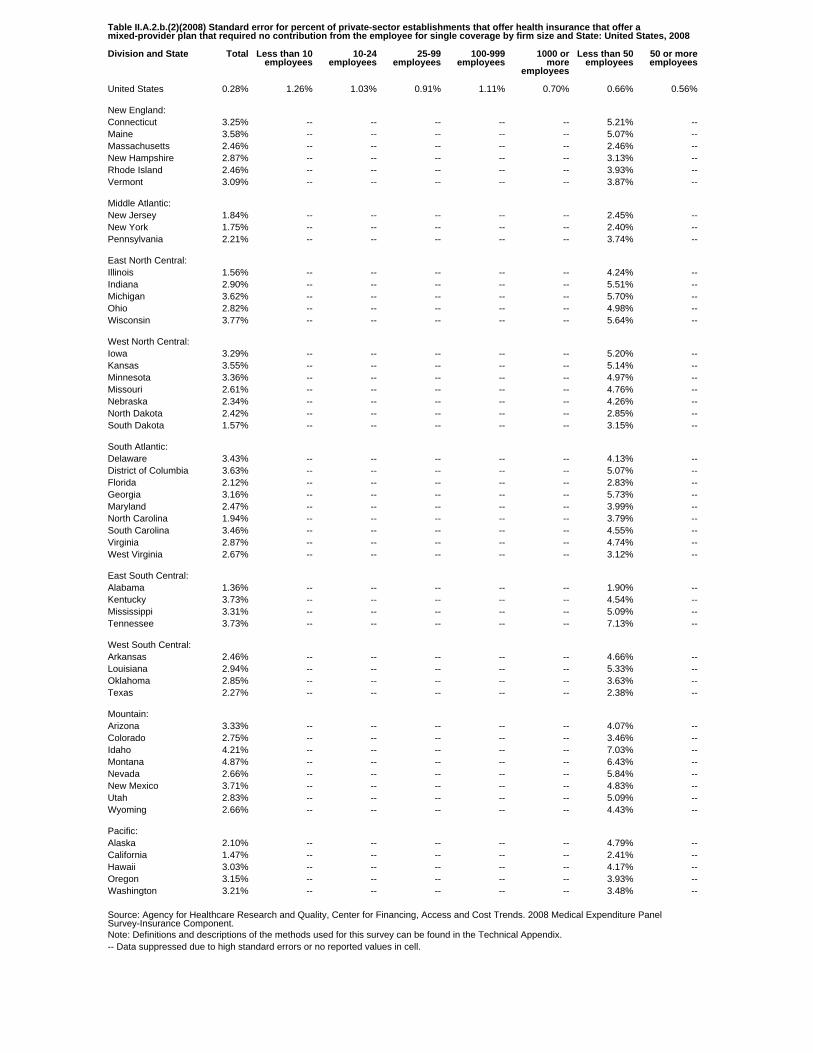
Table II.A.2.b.(2)(2008) Standard error for percent of private-sector establishments that offer health insurance that offer amixed-provider plan that required no contribution from the employee for single coverage by firm size and State: United States, 2008
Division and State Total Less than 10employees
10-24employees
25-99employees
100-999employees
1000 ormore
employees
Less than 50employees
50 or moreemployees
United States 0.28% 1.26% 1.03% 0.91% 1.11% 0.70% 0.66% 0.56%
New England:Connecticut 3.25% -- -- -- -- -- 5.21% --Maine 3.58% -- -- -- -- -- 5.07% --Massachusetts 2.46% -- -- -- -- -- 2.46% --New Hampshire 2.87% -- -- -- -- -- 3.13% --Rhode Island 2.46% -- -- -- -- -- 3.93% --Vermont 3.09% -- -- -- -- -- 3.87% --
Middle Atlantic:New Jersey 1.84% -- -- -- -- -- 2.45% --New York 1.75% -- -- -- -- -- 2.40% --Pennsylvania 2.21% -- -- -- -- -- 3.74% --
East North Central:Illinois 1.56% -- -- -- -- -- 4.24% --Indiana 2.90% -- -- -- -- -- 5.51% --Michigan 3.62% -- -- -- -- -- 5.70% --Ohio 2.82% -- -- -- -- -- 4.98% --Wisconsin 3.77% -- -- -- -- -- 5.64% --
West North Central:Iowa 3.29% -- -- -- -- -- 5.20% --Kansas 3.55% -- -- -- -- -- 5.14% --Minnesota 3.36% -- -- -- -- -- 4.97% --Missouri 2.61% -- -- -- -- -- 4.76% --Nebraska 2.34% -- -- -- -- -- 4.26% --North Dakota 2.42% -- -- -- -- -- 2.85% --South Dakota 1.57% -- -- -- -- -- 3.15% --
South Atlantic:Delaware 3.43% -- -- -- -- -- 4.13% --District of Columbia 3.63% -- -- -- -- -- 5.07% --Florida 2.12% -- -- -- -- -- 2.83% --Georgia 3.16% -- -- -- -- -- 5.73% --Maryland 2.47% -- -- -- -- -- 3.99% --North Carolina 1.94% -- -- -- -- -- 3.79% --South Carolina 3.46% -- -- -- -- -- 4.55% --Virginia 2.87% -- -- -- -- -- 4.74% --West Virginia 2.67% -- -- -- -- -- 3.12% --
East South Central:Alabama 1.36% -- -- -- -- -- 1.90% --Kentucky 3.73% -- -- -- -- -- 4.54% --Mississippi 3.31% -- -- -- -- -- 5.09% --Tennessee 3.73% -- -- -- -- -- 7.13% --
West South Central:Arkansas 2.46% -- -- -- -- -- 4.66% --Louisiana 2.94% -- -- -- -- -- 5.33% --Oklahoma 2.85% -- -- -- -- -- 3.63% --Texas 2.27% -- -- -- -- -- 2.38% --
Mountain:Arizona 3.33% -- -- -- -- -- 4.07% --Colorado 2.75% -- -- -- -- -- 3.46% --Idaho 4.21% -- -- -- -- -- 7.03% --Montana 4.87% -- -- -- -- -- 6.43% --Nevada 2.66% -- -- -- -- -- 5.84% --New Mexico 3.71% -- -- -- -- -- 4.83% --Utah 2.83% -- -- -- -- -- 5.09% --Wyoming 2.66% -- -- -- -- -- 4.43% --
Pacific:Alaska 2.10% -- -- -- -- -- 4.79% --California 1.47% -- -- -- -- -- 2.41% --Hawaii 3.03% -- -- -- -- -- 4.17% --Oregon 3.15% -- -- -- -- -- 3.93% --Washington 3.21% -- -- -- -- -- 3.48% --
Source: Agency for Healthcare Research and Quality, Center for Financing, Access and Cost Trends. 2008 Medical Expenditure PanelSurvey-Insurance Component.Note: Definitions and descriptions of the methods used for this survey can be found in the Technical Appendix.-- Data suppressed due to high standard errors or no reported values in cell.
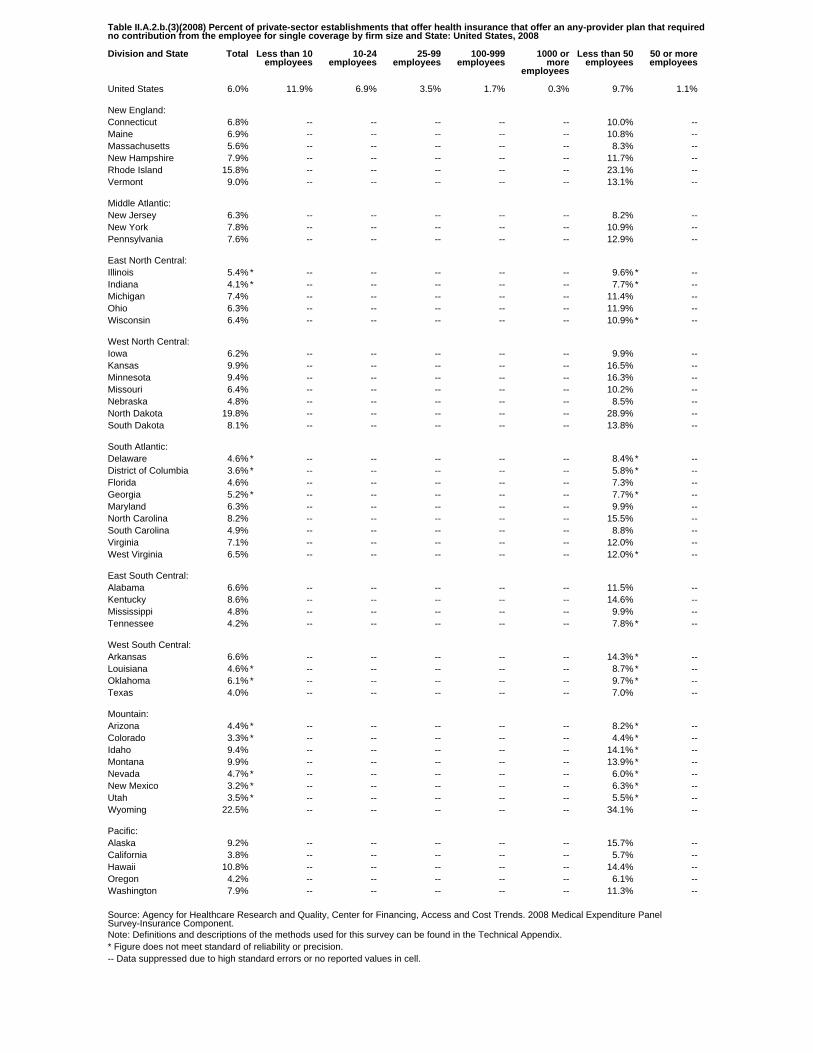
Table II.A.2.b.(3)(2008) Percent of private-sector establishments that offer health insurance that offer an any-provider plan that requiredno contribution from the employee for single coverage by firm size and State: United States, 2008
Division and State Total Less than 10employees
10-24employees
25-99employees
100-999employees
1000 ormore
employees
Less than 50employees
50 or moreemployees
United States 6.0% 11.9% 6.9% 3.5% 1.7% 0.3% 9.7% 1.1%
New England:Connecticut 6.8% -- -- -- -- -- 10.0% --Maine 6.9% -- -- -- -- -- 10.8% --Massachusetts 5.6% -- -- -- -- -- 8.3% --New Hampshire 7.9% -- -- -- -- -- 11.7% --Rhode Island 15.8% -- -- -- -- -- 23.1% --Vermont 9.0% -- -- -- -- -- 13.1% --
Middle Atlantic:New Jersey 6.3% -- -- -- -- -- 8.2% --New York 7.8% -- -- -- -- -- 10.9% --Pennsylvania 7.6% -- -- -- -- -- 12.9% --
East North Central:Illinois 5.4% * -- -- -- -- -- 9.6% * --Indiana 4.1% * -- -- -- -- -- 7.7% * --Michigan 7.4% -- -- -- -- -- 11.4% --Ohio 6.3% -- -- -- -- -- 11.9% --Wisconsin 6.4% -- -- -- -- -- 10.9% * --
West North Central:Iowa 6.2% -- -- -- -- -- 9.9% --Kansas 9.9% -- -- -- -- -- 16.5% --Minnesota 9.4% -- -- -- -- -- 16.3% --Missouri 6.4% -- -- -- -- -- 10.2% --Nebraska 4.8% -- -- -- -- -- 8.5% --North Dakota 19.8% -- -- -- -- -- 28.9% --South Dakota 8.1% -- -- -- -- -- 13.8% --
South Atlantic:Delaware 4.6% * -- -- -- -- -- 8.4% * --District of Columbia 3.6% * -- -- -- -- -- 5.8% * --Florida 4.6% -- -- -- -- -- 7.3% --Georgia 5.2% * -- -- -- -- -- 7.7% * --Maryland 6.3% -- -- -- -- -- 9.9% --North Carolina 8.2% -- -- -- -- -- 15.5% --South Carolina 4.9% -- -- -- -- -- 8.8% --Virginia 7.1% -- -- -- -- -- 12.0% --West Virginia 6.5% -- -- -- -- -- 12.0% * --
East South Central:Alabama 6.6% -- -- -- -- -- 11.5% --Kentucky 8.6% -- -- -- -- -- 14.6% --Mississippi 4.8% -- -- -- -- -- 9.9% --Tennessee 4.2% -- -- -- -- -- 7.8% * --
West South Central:Arkansas 6.6% -- -- -- -- -- 14.3% * --Louisiana 4.6% * -- -- -- -- -- 8.7% * --Oklahoma 6.1% * -- -- -- -- -- 9.7% * --Texas 4.0% -- -- -- -- -- 7.0% --
Mountain:Arizona 4.4% * -- -- -- -- -- 8.2% * --Colorado 3.3% * -- -- -- -- -- 4.4% * --Idaho 9.4% -- -- -- -- -- 14.1% * --Montana 9.9% -- -- -- -- -- 13.9% * --Nevada 4.7% * -- -- -- -- -- 6.0% * --New Mexico 3.2% * -- -- -- -- -- 6.3% * --Utah 3.5% * -- -- -- -- -- 5.5% * --Wyoming 22.5% -- -- -- -- -- 34.1% --
Pacific:Alaska 9.2% -- -- -- -- -- 15.7% --California 3.8% -- -- -- -- -- 5.7% --Hawaii 10.8% -- -- -- -- -- 14.4% --Oregon 4.2% -- -- -- -- -- 6.1% --Washington 7.9% -- -- -- -- -- 11.3% --
Source: Agency for Healthcare Research and Quality, Center for Financing, Access and Cost Trends. 2008 Medical Expenditure PanelSurvey-Insurance Component.Note: Definitions and descriptions of the methods used for this survey can be found in the Technical Appendix.* Figure does not meet standard of reliability or precision.-- Data suppressed due to high standard errors or no reported values in cell.

Table II.A.2.b.(3)(2008) Standard error for percent of private-sector establishments that offer health insurance that offer an any-providerplan that required no contribution from the employee for single coverage by firm size and State: United States, 2008
Division and State Total Less than 10employees
10-24employees
25-99employees
100-999employees
1000 ormore
employees
Less than 50employees
50 or moreemployees
United States 0.26% 0.45% 0.71% 0.35% 0.27% 0.09% 0.38% 0.13%
New England:Connecticut 1.75% -- -- -- -- -- 2.26% --Maine 1.75% -- -- -- -- -- 2.71% --Massachusetts 1.41% -- -- -- -- -- 2.19% --New Hampshire 1.32% -- -- -- -- -- 2.24% --Rhode Island 1.42% -- -- -- -- -- 2.77% --Vermont 1.60% -- -- -- -- -- 2.35% --
Middle Atlantic:New Jersey 1.71% -- -- -- -- -- 2.35% --New York 1.15% -- -- -- -- -- 1.57% --Pennsylvania 1.21% -- -- -- -- -- 2.32% --
East North Central:Illinois 1.93% * -- -- -- -- -- 3.26% * --Indiana 1.47% * -- -- -- -- -- 3.54% * --Michigan 1.17% -- -- -- -- -- 2.01% --Ohio 1.44% -- -- -- -- -- 3.08% --Wisconsin 1.83% -- -- -- -- -- 3.32% * --
West North Central:Iowa 1.03% -- -- -- -- -- 2.19% --Kansas 1.82% -- -- -- -- -- 3.48% --Minnesota 2.28% -- -- -- -- -- 3.61% --Missouri 1.24% -- -- -- -- -- 2.37% --Nebraska 1.25% -- -- -- -- -- 2.29% --North Dakota 1.91% -- -- -- -- -- 2.84% --South Dakota 2.20% -- -- -- -- -- 3.74% --
South Atlantic:Delaware 1.54% * -- -- -- -- -- 3.20% * --District of Columbia 1.10% * -- -- -- -- -- 2.12% * --Florida 1.34% -- -- -- -- -- 2.03% --Georgia 1.63% * -- -- -- -- -- 2.40% * --Maryland 1.62% -- -- -- -- -- 2.56% --North Carolina 1.32% -- -- -- -- -- 2.57% --South Carolina 1.02% -- -- -- -- -- 1.59% --Virginia 1.38% -- -- -- -- -- 2.72% --West Virginia 1.87% -- -- -- -- -- 3.70% * --
East South Central:Alabama 1.39% -- -- -- -- -- 2.59% --Kentucky 1.71% -- -- -- -- -- 3.59% --Mississippi 1.31% -- -- -- -- -- 2.56% --Tennessee 1.25% -- -- -- -- -- 3.05% * --
West South Central:Arkansas 1.96% -- -- -- -- -- 4.69% * --Louisiana 2.27% * -- -- -- -- -- 3.94% * --Oklahoma 2.17% * -- -- -- -- -- 4.99% * --Texas 0.71% -- -- -- -- -- 1.54% --
Mountain:Arizona 1.56% * -- -- -- -- -- 3.19% * --Colorado 1.27% * -- -- -- -- -- 2.70% * --Idaho 2.76% -- -- -- -- -- 4.31% * --Montana 2.17% -- -- -- -- -- 5.05% * --Nevada 2.07% * -- -- -- -- -- 1.84% * --New Mexico 1.29% * -- -- -- -- -- 2.29% * --Utah 1.65% * -- -- -- -- -- 2.52% * --Wyoming 3.68% -- -- -- -- -- 4.97% --
Pacific:Alaska 2.21% -- -- -- -- -- 3.95% --California 0.70% -- -- -- -- -- 1.17% --Hawaii 2.15% -- -- -- -- -- 3.30% --Oregon 0.64% -- -- -- -- -- 1.25% --Washington 1.45% -- -- -- -- -- 2.47% --
Source: Agency for Healthcare Research and Quality, Center for Financing, Access and Cost Trends. 2008 Medical Expenditure PanelSurvey-Insurance Component.Note: Definitions and descriptions of the methods used for this survey can be found in the Technical Appendix.* Figure does not meet standard of reliability or precision.-- Data suppressed due to high standard errors or no reported values in cell.
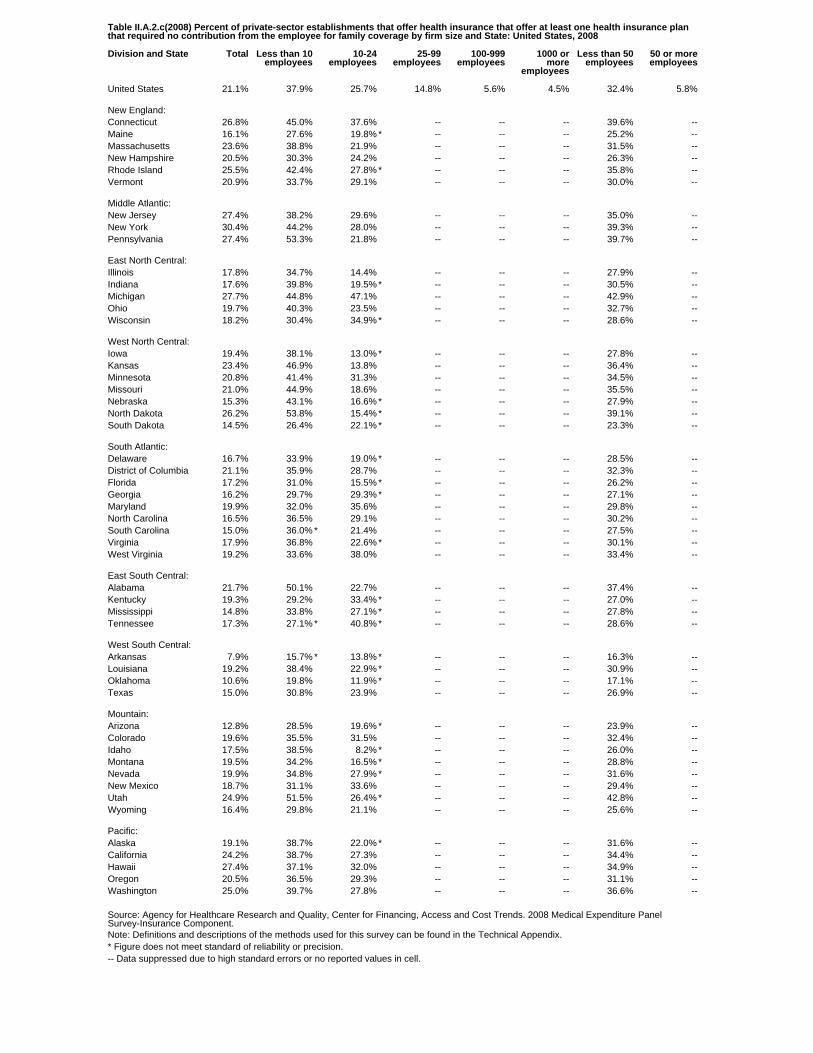
Table II.A.2.c(2008) Percent of private-sector establishments that offer health insurance that offer at least one health insurance planthat required no contribution from the employee for family coverage by firm size and State: United States, 2008
Division and State Total Less than 10employees
10-24employees
25-99employees
100-999employees
1000 ormore
employees
Less than 50employees
50 or moreemployees
United States 21.1% 37.9% 25.7% 14.8% 5.6% 4.5% 32.4% 5.8%
New England:Connecticut 26.8% 45.0% 37.6% -- -- -- 39.6% --Maine 16.1% 27.6% 19.8% * -- -- -- 25.2% --Massachusetts 23.6% 38.8% 21.9% -- -- -- 31.5% --New Hampshire 20.5% 30.3% 24.2% -- -- -- 26.3% --Rhode Island 25.5% 42.4% 27.8% * -- -- -- 35.8% --Vermont 20.9% 33.7% 29.1% -- -- -- 30.0% --
Middle Atlantic:New Jersey 27.4% 38.2% 29.6% -- -- -- 35.0% --New York 30.4% 44.2% 28.0% -- -- -- 39.3% --Pennsylvania 27.4% 53.3% 21.8% -- -- -- 39.7% --
East North Central:Illinois 17.8% 34.7% 14.4% -- -- -- 27.9% --Indiana 17.6% 39.8% 19.5% * -- -- -- 30.5% --Michigan 27.7% 44.8% 47.1% -- -- -- 42.9% --Ohio 19.7% 40.3% 23.5% -- -- -- 32.7% --Wisconsin 18.2% 30.4% 34.9% * -- -- -- 28.6% --
West North Central:Iowa 19.4% 38.1% 13.0% * -- -- -- 27.8% --Kansas 23.4% 46.9% 13.8% -- -- -- 36.4% --Minnesota 20.8% 41.4% 31.3% -- -- -- 34.5% --Missouri 21.0% 44.9% 18.6% -- -- -- 35.5% --Nebraska 15.3% 43.1% 16.6% * -- -- -- 27.9% --North Dakota 26.2% 53.8% 15.4% * -- -- -- 39.1% --South Dakota 14.5% 26.4% 22.1% * -- -- -- 23.3% --
South Atlantic:Delaware 16.7% 33.9% 19.0% * -- -- -- 28.5% --District of Columbia 21.1% 35.9% 28.7% -- -- -- 32.3% --Florida 17.2% 31.0% 15.5% * -- -- -- 26.2% --Georgia 16.2% 29.7% 29.3% * -- -- -- 27.1% --Maryland 19.9% 32.0% 35.6% -- -- -- 29.8% --North Carolina 16.5% 36.5% 29.1% -- -- -- 30.2% --South Carolina 15.0% 36.0% * 21.4% -- -- -- 27.5% --Virginia 17.9% 36.8% 22.6% * -- -- -- 30.1% --West Virginia 19.2% 33.6% 38.0% -- -- -- 33.4% --
East South Central:Alabama 21.7% 50.1% 22.7% -- -- -- 37.4% --Kentucky 19.3% 29.2% 33.4% * -- -- -- 27.0% --Mississippi 14.8% 33.8% 27.1% * -- -- -- 27.8% --Tennessee 17.3% 27.1% * 40.8% * -- -- -- 28.6% --
West South Central:Arkansas 7.9% 15.7% * 13.8% * -- -- -- 16.3% --Louisiana 19.2% 38.4% 22.9% * -- -- -- 30.9% --Oklahoma 10.6% 19.8% 11.9% * -- -- -- 17.1% --Texas 15.0% 30.8% 23.9% -- -- -- 26.9% --
Mountain:Arizona 12.8% 28.5% 19.6% * -- -- -- 23.9% --Colorado 19.6% 35.5% 31.5% -- -- -- 32.4% --Idaho 17.5% 38.5% 8.2% * -- -- -- 26.0% --Montana 19.5% 34.2% 16.5% * -- -- -- 28.8% --Nevada 19.9% 34.8% 27.9% * -- -- -- 31.6% --New Mexico 18.7% 31.1% 33.6% -- -- -- 29.4% --Utah 24.9% 51.5% 26.4% * -- -- -- 42.8% --Wyoming 16.4% 29.8% 21.1% -- -- -- 25.6% --
Pacific:Alaska 19.1% 38.7% 22.0% * -- -- -- 31.6% --California 24.2% 38.7% 27.3% -- -- -- 34.4% --Hawaii 27.4% 37.1% 32.0% -- -- -- 34.9% --Oregon 20.5% 36.5% 29.3% -- -- -- 31.1% --Washington 25.0% 39.7% 27.8% -- -- -- 36.6% --
Source: Agency for Healthcare Research and Quality, Center for Financing, Access and Cost Trends. 2008 Medical Expenditure PanelSurvey-Insurance Component.Note: Definitions and descriptions of the methods used for this survey can be found in the Technical Appendix.* Figure does not meet standard of reliability or precision.-- Data suppressed due to high standard errors or no reported values in cell.
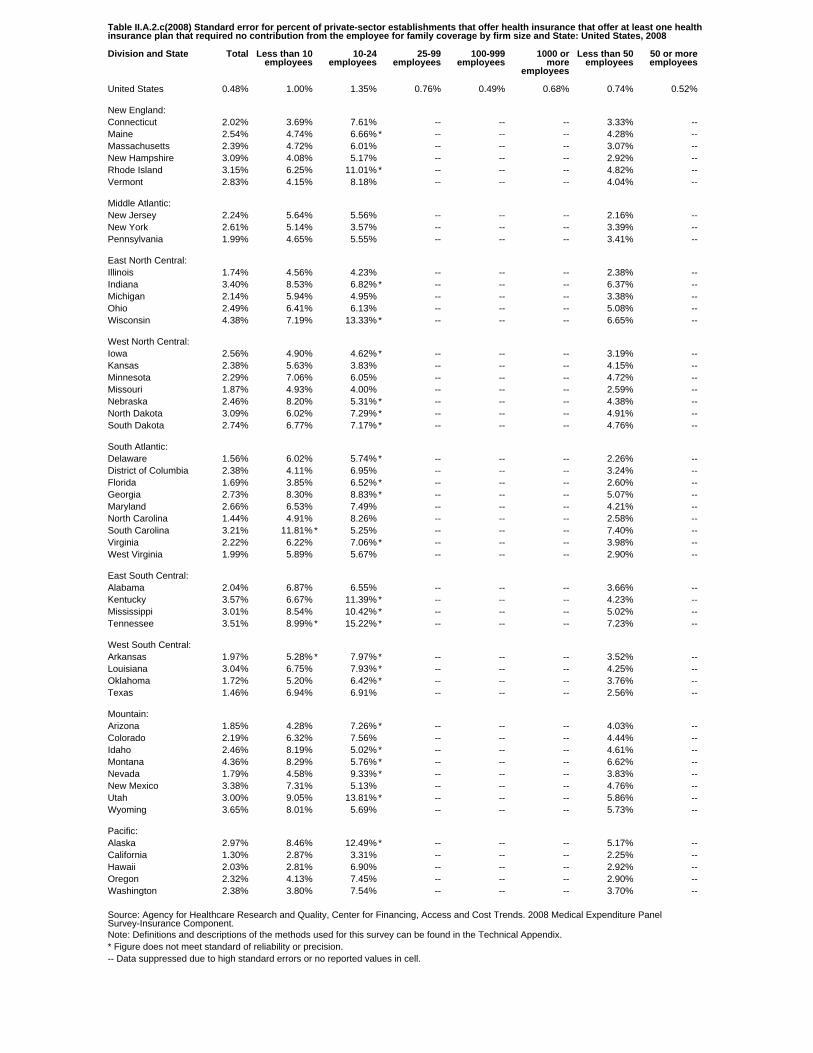
Table II.A.2.c(2008) Standard error for percent of private-sector establishments that offer health insurance that offer at least one healthinsurance plan that required no contribution from the employee for family coverage by firm size and State: United States, 2008
Division and State Total Less than 10employees
10-24employees
25-99employees
100-999employees
1000 ormore
employees
Less than 50employees
50 or moreemployees
United States 0.48% 1.00% 1.35% 0.76% 0.49% 0.68% 0.74% 0.52%
New England:Connecticut 2.02% 3.69% 7.61% -- -- -- 3.33% --Maine 2.54% 4.74% 6.66% * -- -- -- 4.28% --Massachusetts 2.39% 4.72% 6.01% -- -- -- 3.07% --New Hampshire 3.09% 4.08% 5.17% -- -- -- 2.92% --Rhode Island 3.15% 6.25% 11.01% * -- -- -- 4.82% --Vermont 2.83% 4.15% 8.18% -- -- -- 4.04% --
Middle Atlantic:New Jersey 2.24% 5.64% 5.56% -- -- -- 2.16% --New York 2.61% 5.14% 3.57% -- -- -- 3.39% --Pennsylvania 1.99% 4.65% 5.55% -- -- -- 3.41% --
East North Central:Illinois 1.74% 4.56% 4.23% -- -- -- 2.38% --Indiana 3.40% 8.53% 6.82% * -- -- -- 6.37% --Michigan 2.14% 5.94% 4.95% -- -- -- 3.38% --Ohio 2.49% 6.41% 6.13% -- -- -- 5.08% --Wisconsin 4.38% 7.19% 13.33% * -- -- -- 6.65% --
West North Central:Iowa 2.56% 4.90% 4.62% * -- -- -- 3.19% --Kansas 2.38% 5.63% 3.83% -- -- -- 4.15% --Minnesota 2.29% 7.06% 6.05% -- -- -- 4.72% --Missouri 1.87% 4.93% 4.00% -- -- -- 2.59% --Nebraska 2.46% 8.20% 5.31% * -- -- -- 4.38% --North Dakota 3.09% 6.02% 7.29% * -- -- -- 4.91% --South Dakota 2.74% 6.77% 7.17% * -- -- -- 4.76% --
South Atlantic:Delaware 1.56% 6.02% 5.74% * -- -- -- 2.26% --District of Columbia 2.38% 4.11% 6.95% -- -- -- 3.24% --Florida 1.69% 3.85% 6.52% * -- -- -- 2.60% --Georgia 2.73% 8.30% 8.83% * -- -- -- 5.07% --Maryland 2.66% 6.53% 7.49% -- -- -- 4.21% --North Carolina 1.44% 4.91% 8.26% -- -- -- 2.58% --South Carolina 3.21% 11.81% * 5.25% -- -- -- 7.40% --Virginia 2.22% 6.22% 7.06% * -- -- -- 3.98% --West Virginia 1.99% 5.89% 5.67% -- -- -- 2.90% --
East South Central:Alabama 2.04% 6.87% 6.55% -- -- -- 3.66% --Kentucky 3.57% 6.67% 11.39% * -- -- -- 4.23% --Mississippi 3.01% 8.54% 10.42% * -- -- -- 5.02% --Tennessee 3.51% 8.99% * 15.22% * -- -- -- 7.23% --
West South Central:Arkansas 1.97% 5.28% * 7.97% * -- -- -- 3.52% --Louisiana 3.04% 6.75% 7.93% * -- -- -- 4.25% --Oklahoma 1.72% 5.20% 6.42% * -- -- -- 3.76% --Texas 1.46% 6.94% 6.91% -- -- -- 2.56% --
Mountain:Arizona 1.85% 4.28% 7.26% * -- -- -- 4.03% --Colorado 2.19% 6.32% 7.56% -- -- -- 4.44% --Idaho 2.46% 8.19% 5.02% * -- -- -- 4.61% --Montana 4.36% 8.29% 5.76% * -- -- -- 6.62% --Nevada 1.79% 4.58% 9.33% * -- -- -- 3.83% --New Mexico 3.38% 7.31% 5.13% -- -- -- 4.76% --Utah 3.00% 9.05% 13.81% * -- -- -- 5.86% --Wyoming 3.65% 8.01% 5.69% -- -- -- 5.73% --
Pacific:Alaska 2.97% 8.46% 12.49% * -- -- -- 5.17% --California 1.30% 2.87% 3.31% -- -- -- 2.25% --Hawaii 2.03% 2.81% 6.90% -- -- -- 2.92% --Oregon 2.32% 4.13% 7.45% -- -- -- 2.90% --Washington 2.38% 3.80% 7.54% -- -- -- 3.70% --
Source: Agency for Healthcare Research and Quality, Center for Financing, Access and Cost Trends. 2008 Medical Expenditure PanelSurvey-Insurance Component.Note: Definitions and descriptions of the methods used for this survey can be found in the Technical Appendix.* Figure does not meet standard of reliability or precision.-- Data suppressed due to high standard errors or no reported values in cell.

Table II.A.2.c.(1)(2008) Percent of private-sector establishments that offer health insurance that offer an exclusive-provider plan thatrequired no contribution from the employee for family coverage by firm size and State: United States, 2008
Division and State Total Less than 10employees
10-24employees
25-99employees
100-999employees
1000 ormore
employees
Less than 50employees
50 or moreemployees
United States 6.2% 10.9% 7.5% 5.4% 1.3% 1.6% 9.5% 1.8%
New England:Connecticut 9.0% -- -- -- -- -- -- --Maine 4.0% -- -- -- -- -- -- --Massachusetts 12.2% -- -- -- -- -- -- --New Hampshire 6.9% -- -- -- -- -- -- --Rhode Island 6.7% * -- -- -- -- -- -- --Vermont 6.9% -- -- -- -- -- -- --
Middle Atlantic:New Jersey 10.7% -- -- -- -- -- -- --New York 12.5% -- -- -- -- -- -- --Pennsylvania 8.7% -- -- -- -- -- -- --
East North Central:Illinois 5.8% -- -- -- -- -- -- --Indiana 2.1% * -- -- -- -- -- -- --Michigan 6.6% -- -- -- -- -- -- --Ohio 4.5% * -- -- -- -- -- -- --Wisconsin 3.1% * -- -- -- -- -- -- --
West North Central:Iowa 2.1% * -- -- -- -- -- -- --Kansas 3.2% * -- -- -- -- -- -- --Minnesota 5.0% * -- -- -- -- -- -- --Missouri 3.7% -- -- -- -- -- -- --Nebraska 1.3% * -- -- -- -- -- -- --North Dakota 3.6% * -- -- -- -- -- -- --South Dakota 1.9% * -- -- -- -- -- -- --
South Atlantic:Delaware 5.9% -- -- -- -- -- -- --District of Columbia 3.7% -- -- -- -- -- -- --Florida 3.9% * -- -- -- -- -- -- --Georgia 6.4% -- -- -- -- -- -- --Maryland 7.6% -- -- -- -- -- -- --North Carolina 1.4% * -- -- -- -- -- -- --South Carolina 1.6% * -- -- -- -- -- -- --Virginia 5.9% * -- -- -- -- -- -- --West Virginia 1.3% * -- -- -- -- -- -- --
East South Central:Alabama 2.3% * -- -- -- -- -- -- --Kentucky 5.0% * -- -- -- -- -- -- --Mississippi 0.8% * -- -- -- -- -- -- --Tennessee 3.2% * -- -- -- -- -- -- --
West South Central:Arkansas 1.4% * -- -- -- -- -- -- --Louisiana 1.9% * -- -- -- -- -- -- --Oklahoma 1.2% * -- -- -- -- -- -- --Texas 3.0% -- -- -- -- -- -- --
Mountain:Arizona 3.2% * -- -- -- -- -- -- --Colorado 5.1% * -- -- -- -- -- -- --Idaho 2.5% * -- -- -- -- -- -- --Montana 2.4% * -- -- -- -- -- -- --Nevada 4.0% -- -- -- -- -- -- --New Mexico 4.9% * -- -- -- -- -- -- --Utah 7.1% * -- -- -- -- -- -- --Wyoming 0.8% * -- -- -- -- -- -- --
Pacific:Alaska 1.9% * -- -- -- -- -- -- --California 11.3% -- -- -- -- -- -- --Hawaii 12.5% -- -- -- -- -- -- --Oregon 5.8% * -- -- -- -- -- -- --Washington 2.5% * -- -- -- -- -- -- --
Source: Agency for Healthcare Research and Quality, Center for Financing, Access and Cost Trends. 2008 Medical Expenditure PanelSurvey-Insurance Component.Note: Definitions and descriptions of the methods used for this survey can be found in the Technical Appendix.* Figure does not meet standard of reliability or precision.-- Data suppressed due to high standard errors or no reported values in cell.

Table II.A.2.c.(1)(2008) Standard error for percent of private-sector establishments that offer health insurance that offer anexclusive-provider plan that required no contribution from the employee for family coverage by firm size and State: United States, 2008
Division and State Total Less than 10employees
10-24employees
25-99employees
100-999employees
1000 ormore
employees
Less than 50employees
50 or moreemployees
United States 0.35% 0.86% 0.41% 0.52% 0.24% 0.33% 0.57% 0.22%
New England:Connecticut 1.56% -- -- -- -- -- -- --Maine 1.12% -- -- -- -- -- -- --Massachusetts 1.68% -- -- -- -- -- -- --New Hampshire 1.23% -- -- -- -- -- -- --Rhode Island 2.23% * -- -- -- -- -- -- --Vermont 1.89% -- -- -- -- -- -- --
Middle Atlantic:New Jersey 1.86% -- -- -- -- -- -- --New York 1.08% -- -- -- -- -- -- --Pennsylvania 1.68% -- -- -- -- -- -- --
East North Central:Illinois 1.37% -- -- -- -- -- -- --Indiana 1.23% * -- -- -- -- -- -- --Michigan 1.66% -- -- -- -- -- -- --Ohio 1.61% * -- -- -- -- -- -- --Wisconsin 1.27% * -- -- -- -- -- -- --
West North Central:Iowa 1.07% * -- -- -- -- -- -- --Kansas 1.45% * -- -- -- -- -- -- --Minnesota 2.05% * -- -- -- -- -- -- --Missouri 0.88% -- -- -- -- -- -- --Nebraska 0.86% * -- -- -- -- -- -- --North Dakota 1.47% * -- -- -- -- -- -- --South Dakota 0.90% * -- -- -- -- -- -- --
South Atlantic:Delaware 1.04% -- -- -- -- -- -- --District of Columbia 0.77% -- -- -- -- -- -- --Florida 1.30% * -- -- -- -- -- -- --Georgia 1.48% -- -- -- -- -- -- --Maryland 1.48% -- -- -- -- -- -- --North Carolina 0.91% * -- -- -- -- -- -- --South Carolina 1.10% * -- -- -- -- -- -- --Virginia 1.85% * -- -- -- -- -- -- --West Virginia 0.69% * -- -- -- -- -- -- --
East South Central:Alabama 0.77% * -- -- -- -- -- -- --Kentucky 1.58% * -- -- -- -- -- -- --Mississippi 0.51% * -- -- -- -- -- -- --Tennessee 2.23% * -- -- -- -- -- -- --
West South Central:Arkansas 0.95% * -- -- -- -- -- -- --Louisiana 0.83% * -- -- -- -- -- -- --Oklahoma 0.66% * -- -- -- -- -- -- --Texas 0.84% -- -- -- -- -- -- --
Mountain:Arizona 0.99% * -- -- -- -- -- -- --Colorado 1.67% * -- -- -- -- -- -- --Idaho 1.12% * -- -- -- -- -- -- --Montana 1.14% * -- -- -- -- -- -- --Nevada 1.13% -- -- -- -- -- -- --New Mexico 1.69% * -- -- -- -- -- -- --Utah 2.16% * -- -- -- -- -- -- --Wyoming 0.77% * -- -- -- -- -- -- --
Pacific:Alaska 1.09% * -- -- -- -- -- -- --California 1.16% -- -- -- -- -- -- --Hawaii 1.83% -- -- -- -- -- -- --Oregon 1.86% * -- -- -- -- -- -- --Washington 0.97% * -- -- -- -- -- -- --
Source: Agency for Healthcare Research and Quality, Center for Financing, Access and Cost Trends. 2008 Medical Expenditure PanelSurvey-Insurance Component.Note: Definitions and descriptions of the methods used for this survey can be found in the Technical Appendix.* Figure does not meet standard of reliability or precision.-- Data suppressed due to high standard errors or no reported values in cell.

Table II.A.2.c.(2)(2008) Percent of private-sector establishments that offer health insurance that offer a mixed-provider plan thatrequired no contribution from the employee for family coverage by firm size and State: United States, 2008
Division and State Total Less than 10employees
10-24employees
25-99employees
100-999employees
1000 ormore
employees
Less than 50employees
50 or moreemployees
United States 12.4% 21.7% 15.2% 8.7% 4.2% 2.9% 18.6% 3.9%
New England:Connecticut 14.8% -- -- -- -- -- -- --Maine 7.3% -- -- -- -- -- -- --Massachusetts 7.5% * -- -- -- -- -- -- --New Hampshire 9.8% -- -- -- -- -- -- --Rhode Island 8.0% -- -- -- -- -- -- --Vermont 6.3% -- -- -- -- -- -- --
Middle Atlantic:New Jersey 15.8% -- -- -- -- -- -- --New York 14.6% -- -- -- -- -- -- --Pennsylvania 14.6% -- -- -- -- -- -- --
East North Central:Illinois 10.2% -- -- -- -- -- -- --Indiana 13.3% -- -- -- -- -- -- --Michigan 18.8% -- -- -- -- -- -- --Ohio 11.4% -- -- -- -- -- -- --Wisconsin 12.7% -- -- -- -- -- -- --
West North Central:Iowa 13.0% -- -- -- -- -- -- --Kansas 14.1% -- -- -- -- -- -- --Minnesota 10.8% -- -- -- -- -- -- --Missouri 15.3% -- -- -- -- -- -- --Nebraska 10.8% -- -- -- -- -- -- --North Dakota 10.4% -- -- -- -- -- -- --South Dakota 7.1% * -- -- -- -- -- -- --
South Atlantic:Delaware 7.9% -- -- -- -- -- -- --District of Columbia 16.2% -- -- -- -- -- -- --Florida 12.0% -- -- -- -- -- -- --Georgia 8.9% -- -- -- -- -- -- --Maryland 10.5% -- -- -- -- -- -- --North Carolina 11.5% -- -- -- -- -- -- --South Carolina 10.2% -- -- -- -- -- -- --Virginia 8.2% -- -- -- -- -- -- --West Virginia 14.1% -- -- -- -- -- -- --
East South Central:Alabama 12.5% -- -- -- -- -- -- --Kentucky 8.8% * -- -- -- -- -- -- --Mississippi 11.0% -- -- -- -- -- -- --Tennessee 11.7% -- -- -- -- -- -- --
West South Central:Arkansas 4.5% -- -- -- -- -- -- --Louisiana 15.3% -- -- -- -- -- -- --Oklahoma 6.5% -- -- -- -- -- -- --Texas 9.3% -- -- -- -- -- -- --
Mountain:Arizona 8.4% -- -- -- -- -- -- --Colorado 13.3% -- -- -- -- -- -- --Idaho 11.3% -- -- -- -- -- -- --Montana 13.6% -- -- -- -- -- -- --Nevada 13.4% -- -- -- -- -- -- --New Mexico 11.3% -- -- -- -- -- -- --Utah 16.7% -- -- -- -- -- -- --Wyoming 7.4% * -- -- -- -- -- -- --
Pacific:Alaska 11.4% -- -- -- -- -- -- --California 13.8% -- -- -- -- -- -- --Hawaii 12.9% -- -- -- -- -- -- --Oregon 11.6% -- -- -- -- -- -- --Washington 20.0% -- -- -- -- -- -- --
Source: Agency for Healthcare Research and Quality, Center for Financing, Access and Cost Trends. 2008 Medical Expenditure PanelSurvey-Insurance Component.Note: Definitions and descriptions of the methods used for this survey can be found in the Technical Appendix.* Figure does not meet standard of reliability or precision.-- Data suppressed due to high standard errors or no reported values in cell.

Table II.A.2.c.(2)(2008) Standard error for percent of private-sector establishments that offer health insurance that offer amixed-provider plan that required no contribution from the employee for family coverage by firm size and State: United States, 2008
Division and State Total Less than 10employees
10-24employees
25-99employees
100-999employees
1000 ormore
employees
Less than 50employees
50 or moreemployees
United States 0.38% 0.86% 1.01% 0.55% 0.54% 0.60% 0.72% 0.43%
New England:Connecticut 1.86% -- -- -- -- -- -- --Maine 2.09% -- -- -- -- -- -- --Massachusetts 2.24% * -- -- -- -- -- -- --New Hampshire 2.31% -- -- -- -- -- -- --Rhode Island 1.89% -- -- -- -- -- -- --Vermont 1.62% -- -- -- -- -- -- --
Middle Atlantic:New Jersey 2.01% -- -- -- -- -- -- --New York 2.07% -- -- -- -- -- -- --Pennsylvania 2.08% -- -- -- -- -- -- --
East North Central:Illinois 1.38% -- -- -- -- -- -- --Indiana 2.36% -- -- -- -- -- -- --Michigan 2.28% -- -- -- -- -- -- --Ohio 2.80% -- -- -- -- -- -- --Wisconsin 3.63% -- -- -- -- -- -- --
West North Central:Iowa 2.31% -- -- -- -- -- -- --Kansas 2.58% -- -- -- -- -- -- --Minnesota 1.94% -- -- -- -- -- -- --Missouri 1.77% -- -- -- -- -- -- --Nebraska 2.16% -- -- -- -- -- -- --North Dakota 1.81% -- -- -- -- -- -- --South Dakota 2.26% * -- -- -- -- -- -- --
South Atlantic:Delaware 1.35% -- -- -- -- -- -- --District of Columbia 3.00% -- -- -- -- -- -- --Florida 1.50% -- -- -- -- -- -- --Georgia 2.11% -- -- -- -- -- -- --Maryland 2.48% -- -- -- -- -- -- --North Carolina 1.87% -- -- -- -- -- -- --South Carolina 2.43% -- -- -- -- -- -- --Virginia 1.68% -- -- -- -- -- -- --West Virginia 2.07% -- -- -- -- -- -- --
East South Central:Alabama 1.49% -- -- -- -- -- -- --Kentucky 3.05% * -- -- -- -- -- -- --Mississippi 2.31% -- -- -- -- -- -- --Tennessee 3.31% -- -- -- -- -- -- --
West South Central:Arkansas 1.21% -- -- -- -- -- -- --Louisiana 2.75% -- -- -- -- -- -- --Oklahoma 1.11% -- -- -- -- -- -- --Texas 1.00% -- -- -- -- -- -- --
Mountain:Arizona 1.45% -- -- -- -- -- -- --Colorado 1.81% -- -- -- -- -- -- --Idaho 2.02% -- -- -- -- -- -- --Montana 2.64% -- -- -- -- -- -- --Nevada 2.27% -- -- -- -- -- -- --New Mexico 3.01% -- -- -- -- -- -- --Utah 2.21% -- -- -- -- -- -- --Wyoming 2.49% * -- -- -- -- -- -- --
Pacific:Alaska 2.13% -- -- -- -- -- -- --California 1.07% -- -- -- -- -- -- --Hawaii 1.11% -- -- -- -- -- -- --Oregon 1.88% -- -- -- -- -- -- --Washington 2.55% -- -- -- -- -- -- --
Source: Agency for Healthcare Research and Quality, Center for Financing, Access and Cost Trends. 2008 Medical Expenditure PanelSurvey-Insurance Component.Note: Definitions and descriptions of the methods used for this survey can be found in the Technical Appendix.* Figure does not meet standard of reliability or precision.-- Data suppressed due to high standard errors or no reported values in cell.
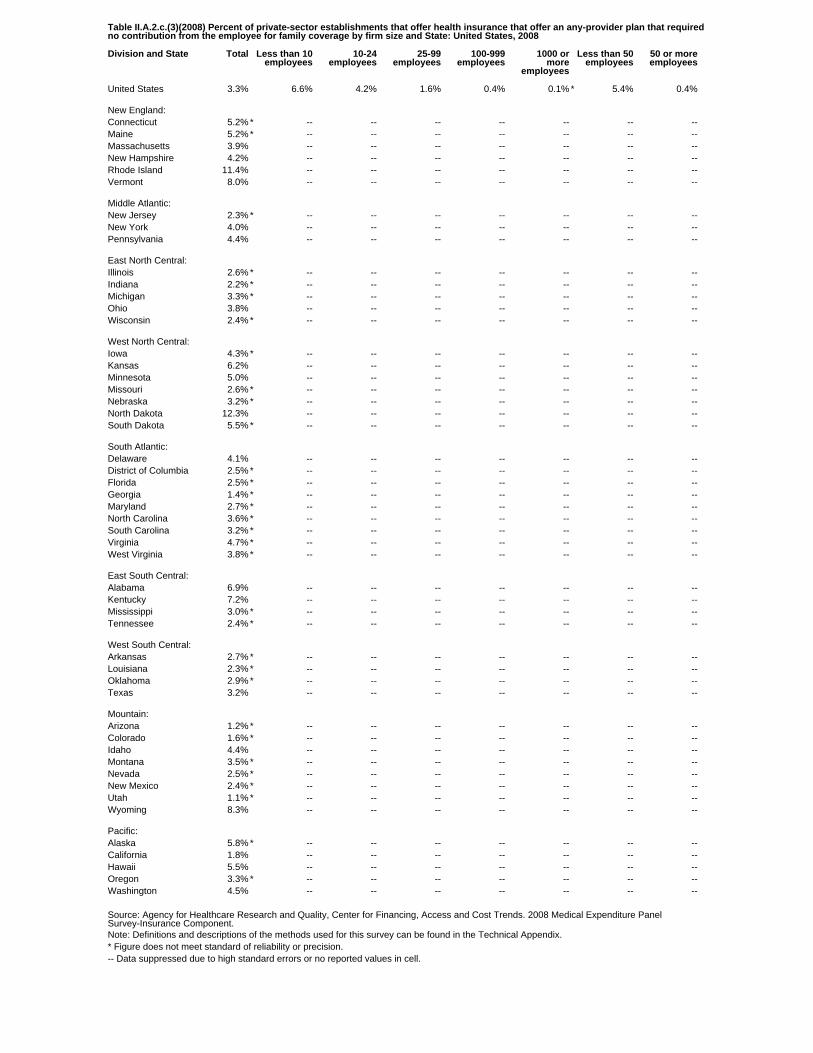
Table II.A.2.c.(3)(2008) Percent of private-sector establishments that offer health insurance that offer an any-provider plan that requiredno contribution from the employee for family coverage by firm size and State: United States, 2008
Division and State Total Less than 10employees
10-24employees
25-99employees
100-999employees
1000 ormore
employees
Less than 50employees
50 or moreemployees
United States 3.3% 6.6% 4.2% 1.6% 0.4% 0.1% * 5.4% 0.4%
New England:Connecticut 5.2% * -- -- -- -- -- -- --Maine 5.2% * -- -- -- -- -- -- --Massachusetts 3.9% -- -- -- -- -- -- --New Hampshire 4.2% -- -- -- -- -- -- --Rhode Island 11.4% -- -- -- -- -- -- --Vermont 8.0% -- -- -- -- -- -- --
Middle Atlantic:New Jersey 2.3% * -- -- -- -- -- -- --New York 4.0% -- -- -- -- -- -- --Pennsylvania 4.4% -- -- -- -- -- -- --
East North Central:Illinois 2.6% * -- -- -- -- -- -- --Indiana 2.2% * -- -- -- -- -- -- --Michigan 3.3% * -- -- -- -- -- -- --Ohio 3.8% -- -- -- -- -- -- --Wisconsin 2.4% * -- -- -- -- -- -- --
West North Central:Iowa 4.3% * -- -- -- -- -- -- --Kansas 6.2% -- -- -- -- -- -- --Minnesota 5.0% -- -- -- -- -- -- --Missouri 2.6% * -- -- -- -- -- -- --Nebraska 3.2% * -- -- -- -- -- -- --North Dakota 12.3% -- -- -- -- -- -- --South Dakota 5.5% * -- -- -- -- -- -- --
South Atlantic:Delaware 4.1% -- -- -- -- -- -- --District of Columbia 2.5% * -- -- -- -- -- -- --Florida 2.5% * -- -- -- -- -- -- --Georgia 1.4% * -- -- -- -- -- -- --Maryland 2.7% * -- -- -- -- -- -- --North Carolina 3.6% * -- -- -- -- -- -- --South Carolina 3.2% * -- -- -- -- -- -- --Virginia 4.7% * -- -- -- -- -- -- --West Virginia 3.8% * -- -- -- -- -- -- --
East South Central:Alabama 6.9% -- -- -- -- -- -- --Kentucky 7.2% -- -- -- -- -- -- --Mississippi 3.0% * -- -- -- -- -- -- --Tennessee 2.4% * -- -- -- -- -- -- --
West South Central:Arkansas 2.7% * -- -- -- -- -- -- --Louisiana 2.3% * -- -- -- -- -- -- --Oklahoma 2.9% * -- -- -- -- -- -- --Texas 3.2% -- -- -- -- -- -- --
Mountain:Arizona 1.2% * -- -- -- -- -- -- --Colorado 1.6% * -- -- -- -- -- -- --Idaho 4.4% -- -- -- -- -- -- --Montana 3.5% * -- -- -- -- -- -- --Nevada 2.5% * -- -- -- -- -- -- --New Mexico 2.4% * -- -- -- -- -- -- --Utah 1.1% * -- -- -- -- -- -- --Wyoming 8.3% -- -- -- -- -- -- --
Pacific:Alaska 5.8% * -- -- -- -- -- -- --California 1.8% -- -- -- -- -- -- --Hawaii 5.5% -- -- -- -- -- -- --Oregon 3.3% * -- -- -- -- -- -- --Washington 4.5% -- -- -- -- -- -- --
Source: Agency for Healthcare Research and Quality, Center for Financing, Access and Cost Trends. 2008 Medical Expenditure PanelSurvey-Insurance Component.Note: Definitions and descriptions of the methods used for this survey can be found in the Technical Appendix.* Figure does not meet standard of reliability or precision.-- Data suppressed due to high standard errors or no reported values in cell.
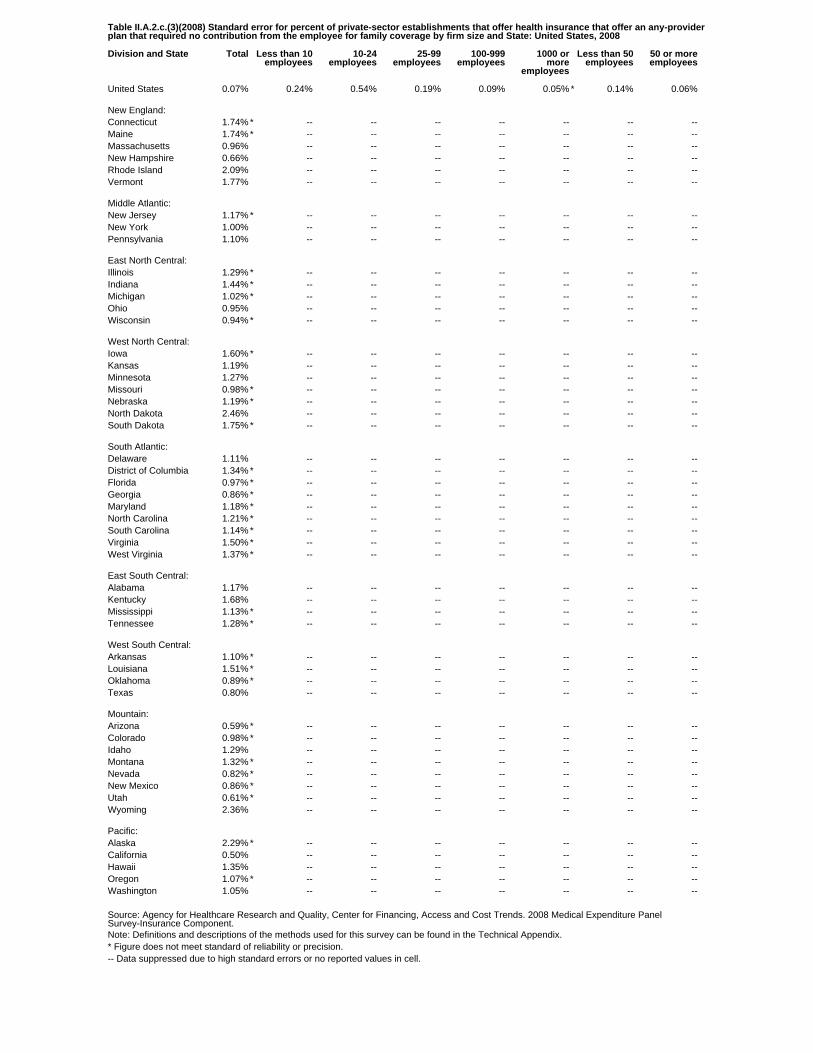
Table II.A.2.c.(3)(2008) Standard error for percent of private-sector establishments that offer health insurance that offer an any-providerplan that required no contribution from the employee for family coverage by firm size and State: United States, 2008
Division and State Total Less than 10employees
10-24employees
25-99employees
100-999employees
1000 ormore
employees
Less than 50employees
50 or moreemployees
United States 0.07% 0.24% 0.54% 0.19% 0.09% 0.05% * 0.14% 0.06%
New England:Connecticut 1.74% * -- -- -- -- -- -- --Maine 1.74% * -- -- -- -- -- -- --Massachusetts 0.96% -- -- -- -- -- -- --New Hampshire 0.66% -- -- -- -- -- -- --Rhode Island 2.09% -- -- -- -- -- -- --Vermont 1.77% -- -- -- -- -- -- --
Middle Atlantic:New Jersey 1.17% * -- -- -- -- -- -- --New York 1.00% -- -- -- -- -- -- --Pennsylvania 1.10% -- -- -- -- -- -- --
East North Central:Illinois 1.29% * -- -- -- -- -- -- --Indiana 1.44% * -- -- -- -- -- -- --Michigan 1.02% * -- -- -- -- -- -- --Ohio 0.95% -- -- -- -- -- -- --Wisconsin 0.94% * -- -- -- -- -- -- --
West North Central:Iowa 1.60% * -- -- -- -- -- -- --Kansas 1.19% -- -- -- -- -- -- --Minnesota 1.27% -- -- -- -- -- -- --Missouri 0.98% * -- -- -- -- -- -- --Nebraska 1.19% * -- -- -- -- -- -- --North Dakota 2.46% -- -- -- -- -- -- --South Dakota 1.75% * -- -- -- -- -- -- --
South Atlantic:Delaware 1.11% -- -- -- -- -- -- --District of Columbia 1.34% * -- -- -- -- -- -- --Florida 0.97% * -- -- -- -- -- -- --Georgia 0.86% * -- -- -- -- -- -- --Maryland 1.18% * -- -- -- -- -- -- --North Carolina 1.21% * -- -- -- -- -- -- --South Carolina 1.14% * -- -- -- -- -- -- --Virginia 1.50% * -- -- -- -- -- -- --West Virginia 1.37% * -- -- -- -- -- -- --
East South Central:Alabama 1.17% -- -- -- -- -- -- --Kentucky 1.68% -- -- -- -- -- -- --Mississippi 1.13% * -- -- -- -- -- -- --Tennessee 1.28% * -- -- -- -- -- -- --
West South Central:Arkansas 1.10% * -- -- -- -- -- -- --Louisiana 1.51% * -- -- -- -- -- -- --Oklahoma 0.89% * -- -- -- -- -- -- --Texas 0.80% -- -- -- -- -- -- --
Mountain:Arizona 0.59% * -- -- -- -- -- -- --Colorado 0.98% * -- -- -- -- -- -- --Idaho 1.29% -- -- -- -- -- -- --Montana 1.32% * -- -- -- -- -- -- --Nevada 0.82% * -- -- -- -- -- -- --New Mexico 0.86% * -- -- -- -- -- -- --Utah 0.61% * -- -- -- -- -- -- --Wyoming 2.36% -- -- -- -- -- -- --
Pacific:Alaska 2.29% * -- -- -- -- -- -- --California 0.50% -- -- -- -- -- -- --Hawaii 1.35% -- -- -- -- -- -- --Oregon 1.07% * -- -- -- -- -- -- --Washington 1.05% -- -- -- -- -- -- --
Source: Agency for Healthcare Research and Quality, Center for Financing, Access and Cost Trends. 2008 Medical Expenditure PanelSurvey-Insurance Component.Note: Definitions and descriptions of the methods used for this survey can be found in the Technical Appendix.* Figure does not meet standard of reliability or precision.-- Data suppressed due to high standard errors or no reported values in cell.

Table II.A.2.d(2008) Percent of private-sector establishments that offer health insurance that offer two or more health insurance plansby firm size and State: United States, 2008
Division and State Total Less than 10employees
10-24employees
25-99employees
100-999employees
1000 ormore
employees
Less than 50employees
50 or moreemployees
United States 38.7% 14.0% 22.3% 34.9% 48.4% 80.7% 18.0% 66.7%
New England:Connecticut 42.8% -- -- -- 59.6% 76.6% 27.4% 69.8%Maine 36.0% -- -- -- 55.2% 85.0% 16.7% 68.7%Massachusetts 30.3% -- -- -- 67.6% 71.9% 11.4% 66.1%New Hampshire 33.6% -- -- -- 54.0% 73.7% 15.0% 66.0%Rhode Island 24.6% -- -- -- 30.6% 81.8% 6.4% 60.5%Vermont 24.0% -- -- -- 42.1% 63.1% 11.5% 48.6%
Middle Atlantic:New Jersey 34.2% -- -- -- 63.9% 76.9% 19.9% 69.1%New York 36.9% -- -- -- 55.6% 84.8% 20.2% 72.1%Pennsylvania 35.7% -- -- -- 53.2% 79.7% 15.4% 64.1%
East North Central:Illinois 42.0% -- -- -- 45.7% 82.0% 23.5% 65.1%Indiana 41.8% -- -- -- 50.2% 79.6% 18.7% * 66.6%Michigan 38.9% -- -- -- 58.9% 82.4% 13.8% 72.9%Ohio 38.4% -- -- -- 44.4% 76.0% 15.8% 61.8%Wisconsin 32.8% -- -- -- 51.3% 70.4% 14.6% 55.1%
West North Central:Iowa 31.8% -- -- -- 50.8% 69.7% 12.6% 58.0%Kansas 34.3% -- -- -- 41.9% 84.9% 8.5% * 66.8%Minnesota 35.1% -- -- -- 33.0% 83.8% 14.9% 61.4%Missouri 30.8% -- -- -- 37.9% 71.2% 10.2% * 56.3%Nebraska 29.0% -- -- -- 26.8% 74.9% 8.3% * 50.1%North Dakota 19.7% -- -- -- 12.3% * 68.7% 6.7% * 41.3%South Dakota 23.5% -- -- -- 35.7% 74.4% 4.4% * 50.6%
South Atlantic:Delaware 44.5% -- -- -- 44.8% 84.4% 22.8% 69.8%District of Columbia 45.8% -- -- -- 58.1% 78.8% 25.9% 69.8%Florida 42.3% -- -- -- 48.2% 87.8% 17.9% 75.7%Georgia 45.3% -- -- -- 43.5% 87.2% 20.9% 71.9%Maryland 47.2% -- -- -- 59.9% 83.6% 25.8% 74.7%North Carolina 38.1% -- -- -- 50.4% 71.1% 15.6% 61.8%South Carolina 36.8% -- -- -- 34.9% 80.4% 9.6% 64.9%Virginia 47.1% -- -- -- 48.2% 91.8% 23.0% 76.7%West Virginia 33.3% -- -- -- 34.6% * 79.5% 5.5% 60.7%
East South Central:Alabama 27.4% -- -- -- 24.1% 74.1% 4.0% * 54.3%Kentucky 42.8% -- -- -- 47.5% 88.0% 18.0% 70.3%Mississippi 32.2% -- -- -- 14.0% * 70.6% 13.1% 48.8%Tennessee 39.5% -- -- -- 45.4% 79.3% 11.6% 65.0%
West South Central:Arkansas 30.7% -- -- -- 27.5% * 63.3% 10.3% * 46.0%Louisiana 34.9% -- -- -- 40.8% 74.7% 13.5% 58.7%Oklahoma 38.3% -- -- -- 39.1% 79.1% 15.5% 64.7%Texas 41.1% -- -- -- 44.3% 74.1% 17.7% 62.9%
Mountain:Arizona 43.8% -- -- -- 45.2% 73.6% 20.6% 63.8%Colorado 38.6% -- -- -- 57.6% 83.0% 13.1% 71.2%Idaho 26.1% -- -- -- 14.9% * 73.5% 14.4% 44.6%Montana 25.9% -- -- -- 27.0% 74.0% 8.6% 53.3%Nevada 39.1% -- -- -- 41.1% 82.0% 20.3% 61.7%New Mexico 35.1% -- -- -- 27.9% 86.6% 10.2% 61.7%Utah 38.1% -- -- -- 37.6% 82.3% 17.5% 65.4%Wyoming 27.1% -- -- -- 23.5% * 81.2% 8.1% 53.9%
Pacific:Alaska 23.0% -- -- -- 19.4% 57.1% 7.4% 41.3%California 47.7% -- -- -- 66.6% 91.2% 28.2% 80.0%Hawaii 43.6% -- -- -- 81.1% 91.0% 26.4% 84.5%Oregon 26.9% -- -- -- 44.2% 70.0% 9.3% * 52.6%Washington 30.0% -- -- -- 36.8% 83.9% 11.4% 61.6%
Source: Agency for Healthcare Research and Quality, Center for Financing, Access and Cost Trends. 2008 Medical Expenditure PanelSurvey-Insurance Component.Note: Definitions and descriptions of the methods used for this survey can be found in the Technical Appendix.* Figure does not meet standard of reliability or precision.-- Data suppressed due to high standard errors or no reported values in cell.

Table II.A.2.d(2008) Standard error for percent of private-sector establishments that offer health insurance that offer two or more healthinsurance plans by firm size and State: United States, 2008
Division and State Total Less than 10employees
10-24employees
25-99employees
100-999employees
1000 ormore
employees
Less than 50employees
50 or moreemployees
United States 0.39% 0.59% 0.81% 0.93% 0.88% 0.88% 0.44% 0.63%
New England:Connecticut 2.43% -- -- -- 9.99% 5.96% 3.54% 3.95%Maine 3.94% -- -- -- 9.67% 7.59% 4.11% 5.71%Massachusetts 2.68% -- -- -- 8.22% 7.85% 3.14% 4.65%New Hampshire 2.48% -- -- -- 8.79% 5.35% 2.18% 4.14%Rhode Island 3.80% -- -- -- 6.95% 9.79% 1.41% 6.76%Vermont 2.45% -- -- -- 7.03% 8.74% 1.87% 5.05%
Middle Atlantic:New Jersey 2.40% -- -- -- 7.55% 6.64% 2.40% 4.70%New York 2.12% -- -- -- 5.61% 2.92% 2.17% 2.84%Pennsylvania 2.34% -- -- -- 6.60% 5.71% 2.39% 3.26%
East North Central:Illinois 2.66% -- -- -- 5.15% 3.84% 3.22% 3.45%Indiana 4.61% -- -- -- 8.43% 6.78% 5.64% * 4.89%Michigan 2.88% -- -- -- 7.32% 5.47% 3.36% 5.05%Ohio 2.50% -- -- -- 4.88% 4.22% 3.43% 2.85%Wisconsin 2.43% -- -- -- 8.68% 5.68% 2.93% 3.03%
West North Central:Iowa 3.30% -- -- -- 7.96% 7.67% 2.90% 5.71%Kansas 3.33% -- -- -- 6.98% 4.36% 3.66% * 3.88%Minnesota 3.14% -- -- -- 8.56% 5.06% 3.16% 4.64%Missouri 2.58% -- -- -- 9.21% 6.17% 3.09% * 4.41%Nebraska 2.65% -- -- -- 4.72% 7.14% 3.89% * 5.59%North Dakota 2.80% -- -- -- 4.88% * 6.91% 2.53% * 5.00%South Dakota 2.07% -- -- -- 3.52% 8.44% 2.10% * 3.85%
South Atlantic:Delaware 2.54% -- -- -- 10.30% 3.94% 4.17% 5.93%District of Columbia 2.48% -- -- -- 5.72% 5.42% 2.79% 3.95%Florida 2.73% -- -- -- 4.69% 4.13% 2.37% 3.46%Georgia 3.21% -- -- -- 6.83% 3.82% 5.83% 4.47%Maryland 3.74% -- -- -- 6.53% 3.43% 3.83% 4.23%North Carolina 2.85% -- -- -- 9.78% 4.90% 3.77% 2.00%South Carolina 2.12% -- -- -- 8.07% 4.49% 2.16% 4.65%Virginia 1.95% -- -- -- 9.01% 1.74% 2.69% 3.24%West Virginia 2.87% -- -- -- 10.41% * 4.53% 1.45% 3.89%
East South Central:Alabama 2.44% -- -- -- 6.84% 5.49% 1.20% * 4.28%Kentucky 3.56% -- -- -- 4.94% 6.33% 3.73% 3.31%Mississippi 2.57% -- -- -- 4.34% * 5.81% 2.82% 3.97%Tennessee 3.10% -- -- -- 4.27% 5.31% 2.86% 3.80%
West South Central:Arkansas 2.67% -- -- -- 9.21% * 7.21% 3.10% * 3.93%Louisiana 3.27% -- -- -- 5.63% 7.21% 2.89% 4.62%Oklahoma 3.15% -- -- -- 9.24% 5.27% 3.02% 5.88%Texas 2.29% -- -- -- 3.73% 6.18% 2.32% 4.34%
Mountain:Arizona 3.22% -- -- -- 6.91% 6.35% 3.81% 5.14%Colorado 3.50% -- -- -- 10.39% 5.47% 3.29% 4.02%Idaho 3.35% -- -- -- 5.00% * 5.03% 3.29% 3.91%Montana 2.40% -- -- -- 6.90% 6.83% 2.05% 5.01%Nevada 3.18% -- -- -- 7.64% 6.09% 2.71% 4.84%New Mexico 2.60% -- -- -- 4.55% 5.23% 2.33% 3.93%Utah 2.72% -- -- -- 9.50% 3.68% 3.26% 3.44%Wyoming 2.97% -- -- -- 8.94% * 6.05% 2.29% 6.10%
Pacific:Alaska 3.17% -- -- -- 5.15% 7.42% 2.17% 5.58%California 0.90% -- -- -- 4.07% 1.80% 0.84% 1.40%Hawaii 3.55% -- -- -- 6.51% 4.18% 3.83% 3.39%Oregon 2.74% -- -- -- 8.13% 5.73% 3.00% * 5.02%Washington 2.07% -- -- -- 9.38% 2.97% 2.27% 4.20%
Source: Agency for Healthcare Research and Quality, Center for Financing, Access and Cost Trends. 2008 Medical Expenditure PanelSurvey-Insurance Component.Note: Definitions and descriptions of the methods used for this survey can be found in the Technical Appendix.* Figure does not meet standard of reliability or precision.-- Data suppressed due to high standard errors or no reported values in cell.
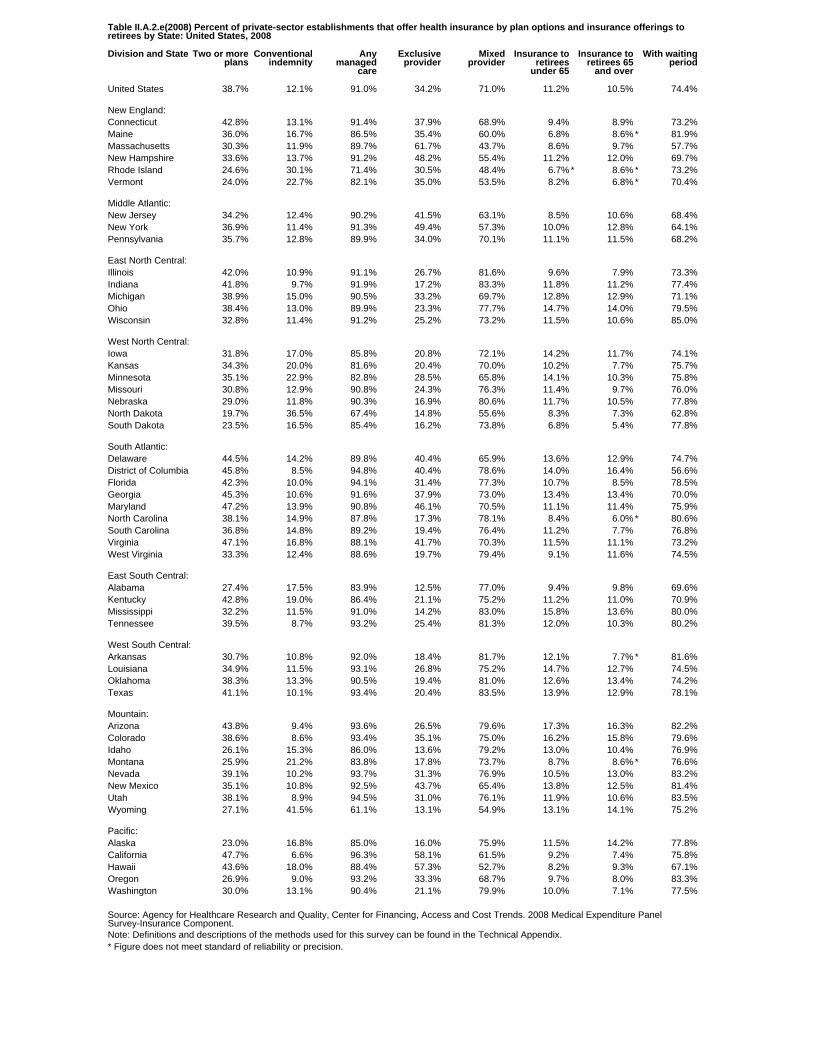
Table II.A.2.e(2008) Percent of private-sector establishments that offer health insurance by plan options and insurance offerings toretirees by State: United States, 2008
Division and State Two or moreplans
Conventionalindemnity
Anymanaged
care
Exclusiveprovider
Mixedprovider
Insurance toretirees
under 65
Insurance toretirees 65
and over
With waitingperiod
United States 38.7% 12.1% 91.0% 34.2% 71.0% 11.2% 10.5% 74.4%
New England:Connecticut 42.8% 13.1% 91.4% 37.9% 68.9% 9.4% 8.9% 73.2%Maine 36.0% 16.7% 86.5% 35.4% 60.0% 6.8% 8.6% * 81.9%Massachusetts 30.3% 11.9% 89.7% 61.7% 43.7% 8.6% 9.7% 57.7%New Hampshire 33.6% 13.7% 91.2% 48.2% 55.4% 11.2% 12.0% 69.7%Rhode Island 24.6% 30.1% 71.4% 30.5% 48.4% 6.7% * 8.6% * 73.2%Vermont 24.0% 22.7% 82.1% 35.0% 53.5% 8.2% 6.8% * 70.4%
Middle Atlantic:New Jersey 34.2% 12.4% 90.2% 41.5% 63.1% 8.5% 10.6% 68.4%New York 36.9% 11.4% 91.3% 49.4% 57.3% 10.0% 12.8% 64.1%Pennsylvania 35.7% 12.8% 89.9% 34.0% 70.1% 11.1% 11.5% 68.2%
East North Central:Illinois 42.0% 10.9% 91.1% 26.7% 81.6% 9.6% 7.9% 73.3%Indiana 41.8% 9.7% 91.9% 17.2% 83.3% 11.8% 11.2% 77.4%Michigan 38.9% 15.0% 90.5% 33.2% 69.7% 12.8% 12.9% 71.1%Ohio 38.4% 13.0% 89.9% 23.3% 77.7% 14.7% 14.0% 79.5%Wisconsin 32.8% 11.4% 91.2% 25.2% 73.2% 11.5% 10.6% 85.0%
West North Central:Iowa 31.8% 17.0% 85.8% 20.8% 72.1% 14.2% 11.7% 74.1%Kansas 34.3% 20.0% 81.6% 20.4% 70.0% 10.2% 7.7% 75.7%Minnesota 35.1% 22.9% 82.8% 28.5% 65.8% 14.1% 10.3% 75.8%Missouri 30.8% 12.9% 90.8% 24.3% 76.3% 11.4% 9.7% 76.0%Nebraska 29.0% 11.8% 90.3% 16.9% 80.6% 11.7% 10.5% 77.8%North Dakota 19.7% 36.5% 67.4% 14.8% 55.6% 8.3% 7.3% 62.8%South Dakota 23.5% 16.5% 85.4% 16.2% 73.8% 6.8% 5.4% 77.8%
South Atlantic:Delaware 44.5% 14.2% 89.8% 40.4% 65.9% 13.6% 12.9% 74.7%District of Columbia 45.8% 8.5% 94.8% 40.4% 78.6% 14.0% 16.4% 56.6%Florida 42.3% 10.0% 94.1% 31.4% 77.3% 10.7% 8.5% 78.5%Georgia 45.3% 10.6% 91.6% 37.9% 73.0% 13.4% 13.4% 70.0%Maryland 47.2% 13.9% 90.8% 46.1% 70.5% 11.1% 11.4% 75.9%North Carolina 38.1% 14.9% 87.8% 17.3% 78.1% 8.4% 6.0% * 80.6%South Carolina 36.8% 14.8% 89.2% 19.4% 76.4% 11.2% 7.7% 76.8%Virginia 47.1% 16.8% 88.1% 41.7% 70.3% 11.5% 11.1% 73.2%West Virginia 33.3% 12.4% 88.6% 19.7% 79.4% 9.1% 11.6% 74.5%
East South Central:Alabama 27.4% 17.5% 83.9% 12.5% 77.0% 9.4% 9.8% 69.6%Kentucky 42.8% 19.0% 86.4% 21.1% 75.2% 11.2% 11.0% 70.9%Mississippi 32.2% 11.5% 91.0% 14.2% 83.0% 15.8% 13.6% 80.0%Tennessee 39.5% 8.7% 93.2% 25.4% 81.3% 12.0% 10.3% 80.2%
West South Central:Arkansas 30.7% 10.8% 92.0% 18.4% 81.7% 12.1% 7.7% * 81.6%Louisiana 34.9% 11.5% 93.1% 26.8% 75.2% 14.7% 12.7% 74.5%Oklahoma 38.3% 13.3% 90.5% 19.4% 81.0% 12.6% 13.4% 74.2%Texas 41.1% 10.1% 93.4% 20.4% 83.5% 13.9% 12.9% 78.1%
Mountain:Arizona 43.8% 9.4% 93.6% 26.5% 79.6% 17.3% 16.3% 82.2%Colorado 38.6% 8.6% 93.4% 35.1% 75.0% 16.2% 15.8% 79.6%Idaho 26.1% 15.3% 86.0% 13.6% 79.2% 13.0% 10.4% 76.9%Montana 25.9% 21.2% 83.8% 17.8% 73.7% 8.7% 8.6% * 76.6%Nevada 39.1% 10.2% 93.7% 31.3% 76.9% 10.5% 13.0% 83.2%New Mexico 35.1% 10.8% 92.5% 43.7% 65.4% 13.8% 12.5% 81.4%Utah 38.1% 8.9% 94.5% 31.0% 76.1% 11.9% 10.6% 83.5%Wyoming 27.1% 41.5% 61.1% 13.1% 54.9% 13.1% 14.1% 75.2%
Pacific:Alaska 23.0% 16.8% 85.0% 16.0% 75.9% 11.5% 14.2% 77.8%California 47.7% 6.6% 96.3% 58.1% 61.5% 9.2% 7.4% 75.8%Hawaii 43.6% 18.0% 88.4% 57.3% 52.7% 8.2% 9.3% 67.1%Oregon 26.9% 9.0% 93.2% 33.3% 68.7% 9.7% 8.0% 83.3%Washington 30.0% 13.1% 90.4% 21.1% 79.9% 10.0% 7.1% 77.5%
Source: Agency for Healthcare Research and Quality, Center for Financing, Access and Cost Trends. 2008 Medical Expenditure PanelSurvey-Insurance Component.Note: Definitions and descriptions of the methods used for this survey can be found in the Technical Appendix.* Figure does not meet standard of reliability or precision.
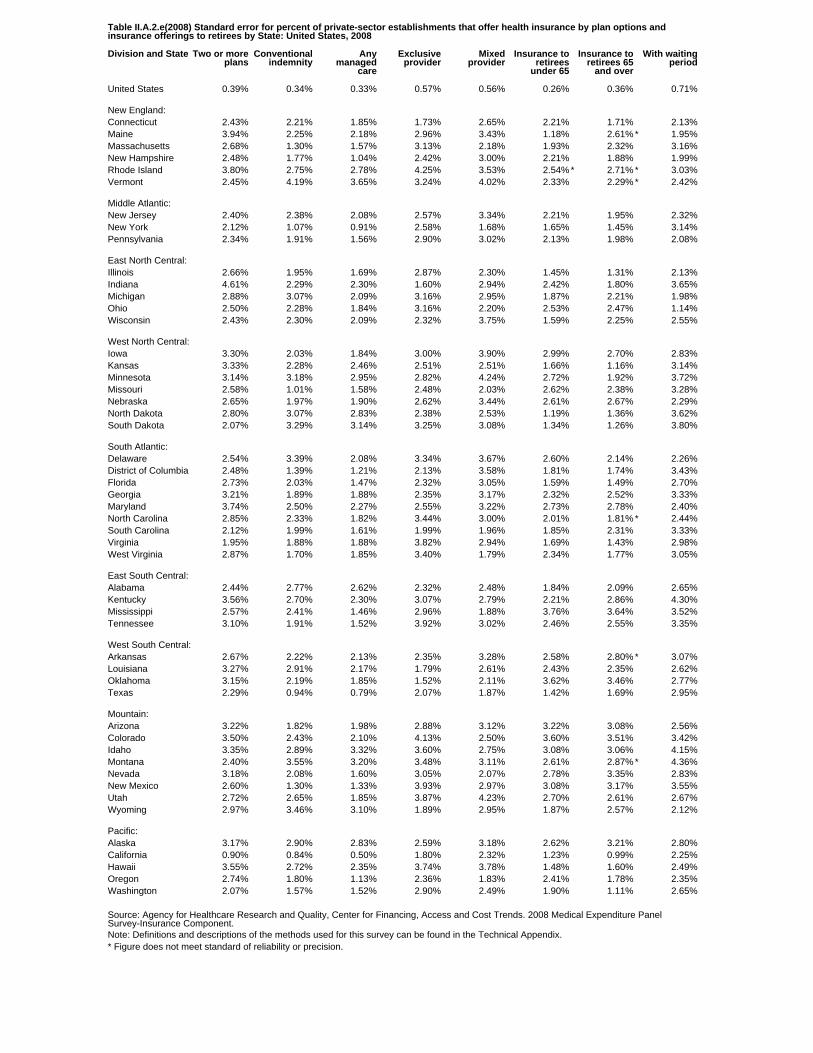
Table II.A.2.e(2008) Standard error for percent of private-sector establishments that offer health insurance by plan options andinsurance offerings to retirees by State: United States, 2008
Division and State Two or moreplans
Conventionalindemnity
Anymanaged
care
Exclusiveprovider
Mixedprovider
Insurance toretirees
under 65
Insurance toretirees 65
and over
With waitingperiod
United States 0.39% 0.34% 0.33% 0.57% 0.56% 0.26% 0.36% 0.71%
New England:Connecticut 2.43% 2.21% 1.85% 1.73% 2.65% 2.21% 1.71% 2.13%Maine 3.94% 2.25% 2.18% 2.96% 3.43% 1.18% 2.61% * 1.95%Massachusetts 2.68% 1.30% 1.57% 3.13% 2.18% 1.93% 2.32% 3.16%New Hampshire 2.48% 1.77% 1.04% 2.42% 3.00% 2.21% 1.88% 1.99%Rhode Island 3.80% 2.75% 2.78% 4.25% 3.53% 2.54% * 2.71% * 3.03%Vermont 2.45% 4.19% 3.65% 3.24% 4.02% 2.33% 2.29% * 2.42%
Middle Atlantic:New Jersey 2.40% 2.38% 2.08% 2.57% 3.34% 2.21% 1.95% 2.32%New York 2.12% 1.07% 0.91% 2.58% 1.68% 1.65% 1.45% 3.14%Pennsylvania 2.34% 1.91% 1.56% 2.90% 3.02% 2.13% 1.98% 2.08%
East North Central:Illinois 2.66% 1.95% 1.69% 2.87% 2.30% 1.45% 1.31% 2.13%Indiana 4.61% 2.29% 2.30% 1.60% 2.94% 2.42% 1.80% 3.65%Michigan 2.88% 3.07% 2.09% 3.16% 2.95% 1.87% 2.21% 1.98%Ohio 2.50% 2.28% 1.84% 3.16% 2.20% 2.53% 2.47% 1.14%Wisconsin 2.43% 2.30% 2.09% 2.32% 3.75% 1.59% 2.25% 2.55%
West North Central:Iowa 3.30% 2.03% 1.84% 3.00% 3.90% 2.99% 2.70% 2.83%Kansas 3.33% 2.28% 2.46% 2.51% 2.51% 1.66% 1.16% 3.14%Minnesota 3.14% 3.18% 2.95% 2.82% 4.24% 2.72% 1.92% 3.72%Missouri 2.58% 1.01% 1.58% 2.48% 2.03% 2.62% 2.38% 3.28%Nebraska 2.65% 1.97% 1.90% 2.62% 3.44% 2.61% 2.67% 2.29%North Dakota 2.80% 3.07% 2.83% 2.38% 2.53% 1.19% 1.36% 3.62%South Dakota 2.07% 3.29% 3.14% 3.25% 3.08% 1.34% 1.26% 3.80%
South Atlantic:Delaware 2.54% 3.39% 2.08% 3.34% 3.67% 2.60% 2.14% 2.26%District of Columbia 2.48% 1.39% 1.21% 2.13% 3.58% 1.81% 1.74% 3.43%Florida 2.73% 2.03% 1.47% 2.32% 3.05% 1.59% 1.49% 2.70%Georgia 3.21% 1.89% 1.88% 2.35% 3.17% 2.32% 2.52% 3.33%Maryland 3.74% 2.50% 2.27% 2.55% 3.22% 2.73% 2.78% 2.40%North Carolina 2.85% 2.33% 1.82% 3.44% 3.00% 2.01% 1.81% * 2.44%South Carolina 2.12% 1.99% 1.61% 1.99% 1.96% 1.85% 2.31% 3.33%Virginia 1.95% 1.88% 1.88% 3.82% 2.94% 1.69% 1.43% 2.98%West Virginia 2.87% 1.70% 1.85% 3.40% 1.79% 2.34% 1.77% 3.05%
East South Central:Alabama 2.44% 2.77% 2.62% 2.32% 2.48% 1.84% 2.09% 2.65%Kentucky 3.56% 2.70% 2.30% 3.07% 2.79% 2.21% 2.86% 4.30%Mississippi 2.57% 2.41% 1.46% 2.96% 1.88% 3.76% 3.64% 3.52%Tennessee 3.10% 1.91% 1.52% 3.92% 3.02% 2.46% 2.55% 3.35%
West South Central:Arkansas 2.67% 2.22% 2.13% 2.35% 3.28% 2.58% 2.80% * 3.07%Louisiana 3.27% 2.91% 2.17% 1.79% 2.61% 2.43% 2.35% 2.62%Oklahoma 3.15% 2.19% 1.85% 1.52% 2.11% 3.62% 3.46% 2.77%Texas 2.29% 0.94% 0.79% 2.07% 1.87% 1.42% 1.69% 2.95%
Mountain:Arizona 3.22% 1.82% 1.98% 2.88% 3.12% 3.22% 3.08% 2.56%Colorado 3.50% 2.43% 2.10% 4.13% 2.50% 3.60% 3.51% 3.42%Idaho 3.35% 2.89% 3.32% 3.60% 2.75% 3.08% 3.06% 4.15%Montana 2.40% 3.55% 3.20% 3.48% 3.11% 2.61% 2.87% * 4.36%Nevada 3.18% 2.08% 1.60% 3.05% 2.07% 2.78% 3.35% 2.83%New Mexico 2.60% 1.30% 1.33% 3.93% 2.97% 3.08% 3.17% 3.55%Utah 2.72% 2.65% 1.85% 3.87% 4.23% 2.70% 2.61% 2.67%Wyoming 2.97% 3.46% 3.10% 1.89% 2.95% 1.87% 2.57% 2.12%
Pacific:Alaska 3.17% 2.90% 2.83% 2.59% 3.18% 2.62% 3.21% 2.80%California 0.90% 0.84% 0.50% 1.80% 2.32% 1.23% 0.99% 2.25%Hawaii 3.55% 2.72% 2.35% 3.74% 3.78% 1.48% 1.60% 2.49%Oregon 2.74% 1.80% 1.13% 2.36% 1.83% 2.41% 1.78% 2.35%Washington 2.07% 1.57% 1.52% 2.90% 2.49% 1.90% 1.11% 2.65%
Source: Agency for Healthcare Research and Quality, Center for Financing, Access and Cost Trends. 2008 Medical Expenditure PanelSurvey-Insurance Component.Note: Definitions and descriptions of the methods used for this survey can be found in the Technical Appendix.* Figure does not meet standard of reliability or precision.

Table II.A.2.f(2008) Percent of private-sector establishments that offer health insurance that required a waiting period before newemployees were eligible for health insurance by firm size and State: United States, 2008
Division and State Total Less than 10employees
10-24employees
25-99employees
100-999employees
1000 ormore
employees
Less than 50employees
50 or moreemployees
United States 74.4% 55.9% 81.8% 87.2% 91.6% 82.9% 65.8% 86.0%
New England:Connecticut 73.2% 54.5% 86.1% 95.0% 94.3% 75.5% 67.8% 82.7%Maine 81.9% 63.7% 95.2% 92.2% 92.6% 94.7% 74.5% 94.5%Massachusetts 57.7% 40.0% 69.9% 62.5% 71.9% 75.1% 50.3% 71.6%New Hampshire 69.7% 51.7% 89.5% 90.9% 96.3% 70.0% 64.3% 79.3%Rhode Island 73.2% 60.3% 78.0% 92.0% 89.7% 80.4% 67.5% 84.4%Vermont 70.4% 53.7% 78.8% 87.8% 95.2% 75.1% 63.8% 83.2%
Middle Atlantic:New Jersey 68.4% 56.9% 73.2% 83.4% 87.7% 80.0% 62.0% 84.0%New York 64.1% 44.0% 80.6% 81.1% 89.7% 78.1% 55.2% 83.0%Pennsylvania 68.2% 50.3% 62.4% 80.6% 89.0% 81.7% 56.7% 84.2%
East North Central:Illinois 73.3% 53.6% 79.2% 91.1% 82.8% 83.8% 64.0% 84.8%Indiana 77.4% 55.4% 86.5% 89.6% 93.0% 82.8% 68.6% 86.8%Michigan 71.1% 47.2% 86.2% 83.0% 92.8% 81.0% 61.0% 84.7%Ohio 79.5% 65.9% 70.8% 87.3% 89.5% 89.7% 69.7% 89.6%Wisconsin 85.0% 66.2% 87.8% 92.4% 99.1% 93.1% 76.5% 95.4%
West North Central:Iowa 74.1% 54.1% 80.7% 83.8% 94.3% 82.7% 64.5% 87.1%Kansas 75.7% 48.7% 89.7% 95.5% 88.9% 94.6% 61.9% 93.0%Minnesota 75.8% 54.3% 70.8% 88.6% 93.6% 89.7% 63.9% 91.3%Missouri 76.0% 56.3% 89.8% 91.2% 96.4% 77.8% 68.0% 86.0%Nebraska 77.8% 42.0% 82.6% 91.8% 97.0% 89.6% 63.9% 92.0%North Dakota 62.8% 40.3% 68.9% 78.5% 87.0% 77.6% 51.7% 81.0%South Dakota 77.8% 58.8% 70.5% 85.5% 94.8% 98.9% 65.2% 95.7%
South Atlantic:Delaware 74.7% 58.0% 85.8% 89.6% 88.9% 76.1% 69.7% 80.6%District of Columbia 56.6% 37.0% 56.0% 69.9% 83.2% 60.3% 44.7% 71.1%Florida 78.5% 62.2% 92.8% 92.8% 92.4% 85.3% 71.9% 87.4%Georgia 70.0% 49.8% 86.8% 79.7% 89.3% 73.9% 62.0% 78.7%Maryland 75.9% 62.9% 80.2% 80.5% 92.0% 82.2% 69.5% 84.0%North Carolina 80.6% 57.3% 88.1% 95.7% 94.8% 89.9% 70.0% 91.7%South Carolina 76.8% 52.6% 80.7% 84.7% 85.3% 90.9% 64.3% 89.7%Virginia 73.2% 50.1% 83.6% 81.2% 97.0% 83.1% 62.6% 86.2%West Virginia 74.5% 65.6% 69.8% 79.9% 83.0% 79.0% 68.4% 80.5%
East South Central:Alabama 69.6% 38.6% 75.2% 77.3% 95.1% 87.1% 53.7% 87.9%Kentucky 70.9% 46.4% 72.6% 91.5% 95.6% 78.3% 58.6% 84.5%Mississippi 80.0% 67.2% 87.8% 93.2% 85.9% 78.3% 78.3% 81.5%Tennessee 80.2% 59.9% 72.3% 87.6% 95.5% 91.3% 67.4% 91.8%
West South Central:Arkansas 81.6% 49.4% 84.1% 94.2% 97.8% 90.3% 66.4% 93.0%Louisiana 74.5% 57.8% 75.0% 79.1% 88.7% 83.1% 64.3% 85.8%Oklahoma 74.2% 59.1% 92.4% 88.7% 96.9% 68.7% 70.5% 78.4%Texas 78.1% 65.9% 84.8% 87.1% 90.3% 78.5% 73.6% 82.4%
Mountain:Arizona 82.2% 52.3% 94.7% 92.6% 98.3% 92.0% 68.7% 94.0%Colorado 79.6% 66.6% 78.5% 84.4% 96.2% 89.7% 70.5% 91.1%Idaho 76.9% 59.0% 79.3% 89.5% 92.8% 87.2% 67.9% 91.0%Montana 76.6% 59.7% 89.8% 97.3% 93.9% 82.4% 69.7% 87.4%Nevada 83.2% 67.5% 91.9% 100.0% 100.0% 86.0% 76.1% 91.8%New Mexico 81.4% 62.2% 81.1% 93.9% 90.2% 91.6% 71.2% 92.4%Utah 83.5% 80.0% 91.4% 95.6% 92.2% 74.9% 85.0% 81.5%Wyoming 75.2% 55.7% 78.6% 89.5% 90.3% 88.1% 65.4% 89.0%
Pacific:Alaska 77.8% 62.2% 80.6% 87.2% 94.0% 81.0% 70.4% 86.4%California 75.8% 61.2% 86.8% 91.0% 92.8% 79.3% 70.7% 84.2%Hawaii 67.1% 48.1% 84.4% 85.3% 97.3% 78.3% 58.5% 87.4%Oregon 83.3% 68.1% 93.8% 96.6% 96.5% 84.1% 79.0% 89.7%Washington 77.5% 58.7% 84.7% 96.5% 93.5% 91.1% 68.4% 93.0%
Source: Agency for Healthcare Research and Quality, Center for Financing, Access and Cost Trends. 2008 Medical Expenditure PanelSurvey-Insurance Component.Note: Definitions and descriptions of the methods used for this survey can be found in the Technical Appendix.

Table II.A.2.f(2008) Standard error for percent of private-sector establishments that offer health insurance that required a waitingperiod before new employees were eligible for health insurance by firm size and State: United States, 2008
Division and State Total Less than 10employees
10-24employees
25-99employees
100-999employees
1000 ormore
employees
Less than 50employees
50 or moreemployees
United States 0.71% 1.43% 1.14% 0.87% 0.51% 1.06% 1.03% 0.63%
New England:Connecticut 2.13% 5.88% 4.96% 2.83% 3.68% 7.68% 3.55% 4.94%Maine 1.95% 5.30% 10.45% 5.46% 4.72% 4.43% 3.20% 3.04%Massachusetts 3.16% 4.65% 4.49% 6.85% 5.49% 6.34% 4.62% 4.18%New Hampshire 1.99% 3.78% 3.86% 3.24% 1.65% 6.70% 2.60% 4.32%Rhode Island 3.03% 6.26% 11.55% 2.47% 3.65% 6.36% 4.10% 3.73%Vermont 2.42% 5.51% 7.05% 4.77% 1.85% 8.65% 3.52% 4.54%
Middle Atlantic:New Jersey 2.32% 5.55% 7.26% 5.44% 6.25% 6.63% 3.74% 5.11%New York 3.14% 4.10% 5.91% 4.16% 2.38% 5.68% 4.01% 4.09%Pennsylvania 2.08% 3.75% 7.03% 3.16% 2.58% 4.62% 3.25% 2.54%
East North Central:Illinois 2.13% 5.07% 5.73% 3.13% 4.26% 5.15% 3.56% 3.32%Indiana 3.65% 7.66% 12.27% 4.58% 2.24% 5.72% 6.17% 3.51%Michigan 1.98% 4.12% 5.59% 3.73% 3.23% 5.22% 3.47% 3.62%Ohio 1.14% 2.98% 6.65% 4.07% 6.33% 3.63% 2.17% 2.31%Wisconsin 2.55% 4.84% 5.31% 4.07% 0.84% 2.47% 4.20% 1.53%
West North Central:Iowa 2.83% 3.81% 7.32% 4.39% 3.49% 7.15% 3.05% 4.55%Kansas 3.14% 6.63% 5.80% 3.00% 5.31% 1.85% 5.30% 1.95%Minnesota 3.72% 6.95% 9.10% 5.53% 5.71% 4.83% 5.55% 3.06%Missouri 3.28% 6.43% 4.10% 6.88% 2.61% 7.29% 4.32% 5.70%Nebraska 2.29% 5.59% 6.11% 3.27% 2.06% 4.03% 3.42% 1.85%North Dakota 3.62% 5.45% 7.95% 5.56% 4.59% 5.70% 5.17% 3.03%South Dakota 3.80% 9.81% 6.42% 9.85% 2.78% 0.67% 6.05% 1.64%
South Atlantic:Delaware 2.26% 4.36% 10.09% 6.25% 4.78% 7.45% 2.72% 4.71%District of Columbia 3.43% 6.91% 10.12% 5.95% 4.71% 7.01% 3.14% 4.56%Florida 2.70% 5.13% 3.17% 3.37% 2.14% 3.05% 3.49% 2.61%Georgia 3.33% 5.77% 13.96% 9.63% 5.44% 6.38% 5.30% 4.13%Maryland 2.40% 5.52% 7.34% 4.78% 3.51% 5.15% 4.01% 3.91%North Carolina 2.44% 7.54% 5.15% 1.83% 3.55% 3.25% 5.24% 2.69%South Carolina 3.33% 7.04% 11.87% 6.65% 6.28% 3.66% 6.03% 2.73%Virginia 2.98% 6.58% 9.90% 5.29% 1.42% 4.05% 4.99% 3.19%West Virginia 3.05% 5.35% 7.31% 6.10% 4.81% 3.91% 4.98% 2.15%
East South Central:Alabama 2.65% 6.06% 7.05% 6.63% 2.47% 3.77% 4.74% 2.65%Kentucky 4.30% 6.76% 9.31% 4.52% 2.38% 6.07% 5.90% 4.07%Mississippi 3.52% 9.38% 6.30% 3.44% 4.06% 5.28% 6.64% 3.82%Tennessee 3.35% 5.88% 8.23% 10.00% 2.60% 2.99% 5.08% 2.11%
West South Central:Arkansas 3.07% 12.16% 11.24% 4.39% 9.64% 3.95% 5.96% 3.01%Louisiana 2.62% 5.58% 4.72% 6.92% 4.21% 6.05% 3.79% 4.00%Oklahoma 2.77% 6.41% 3.98% 4.36% 1.57% 6.56% 3.73% 5.14%Texas 2.95% 5.91% 5.31% 2.29% 3.48% 5.14% 4.37% 3.03%
Mountain:Arizona 2.56% 9.87% 3.40% 5.11% 1.23% 2.64% 4.69% 1.84%Colorado 3.42% 5.24% 12.92% 4.91% 2.14% 3.22% 5.15% 2.39%Idaho 4.15% 10.34% 12.88% 4.34% 2.67% 4.81% 6.14% 3.22%Montana 4.36% 8.15% 4.60% 1.15% 2.48% 6.18% 5.93% 3.77%Nevada 2.83% 5.99% 10.61% 0.00% 0.00% 5.39% 3.67% 2.79%New Mexico 3.55% 7.22% 5.06% 5.47% 3.51% 2.91% 5.15% 1.95%Utah 2.67% 4.18% 2.99% 3.39% 4.18% 7.89% 2.34% 5.19%Wyoming 2.12% 5.50% 5.99% 5.40% 3.68% 4.12% 2.76% 2.20%
Pacific:Alaska 2.80% 6.96% 7.82% 4.61% 3.02% 5.61% 4.39% 3.19%California 2.25% 3.63% 3.53% 2.15% 1.25% 4.96% 2.96% 2.83%Hawaii 2.49% 3.01% 10.33% 5.30% 2.12% 7.36% 2.96% 3.07%Oregon 2.35% 5.23% 2.86% 3.36% 2.36% 6.93% 3.48% 4.85%Washington 2.65% 4.03% 5.23% 1.99% 3.41% 3.47% 3.33% 2.44%
Source: Agency for Healthcare Research and Quality, Center for Financing, Access and Cost Trends. 2008 Medical Expenditure PanelSurvey-Insurance Component.Note: Definitions and descriptions of the methods used for this survey can be found in the Technical Appendix.
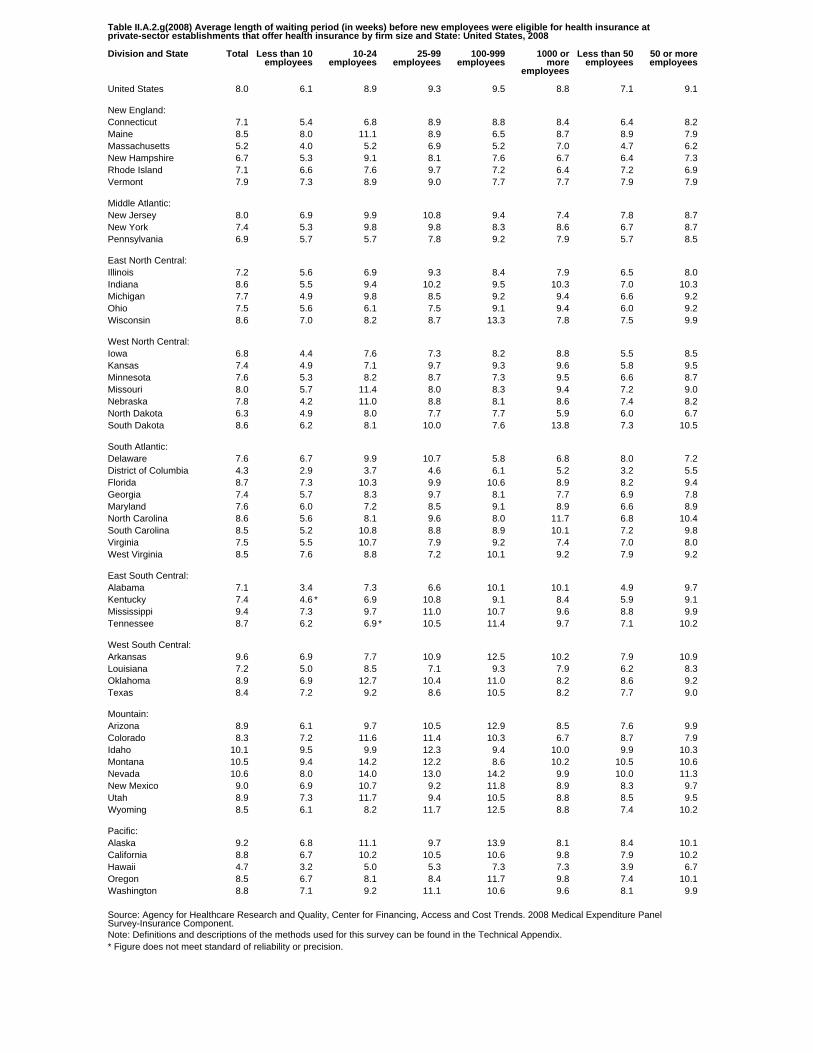
Table II.A.2.g(2008) Average length of waiting period (in weeks) before new employees were eligible for health insurance atprivate-sector establishments that offer health insurance by firm size and State: United States, 2008
Division and State Total Less than 10employees
10-24employees
25-99employees
100-999employees
1000 ormore
employees
Less than 50employees
50 or moreemployees
United States 8.0 6.1 8.9 9.3 9.5 8.8 7.1 9.1
New England:Connecticut 7.1 5.4 6.8 8.9 8.8 8.4 6.4 8.2Maine 8.5 8.0 11.1 8.9 6.5 8.7 8.9 7.9Massachusetts 5.2 4.0 5.2 6.9 5.2 7.0 4.7 6.2New Hampshire 6.7 5.3 9.1 8.1 7.6 6.7 6.4 7.3Rhode Island 7.1 6.6 7.6 9.7 7.2 6.4 7.2 6.9Vermont 7.9 7.3 8.9 9.0 7.7 7.7 7.9 7.9
Middle Atlantic:New Jersey 8.0 6.9 9.9 10.8 9.4 7.4 7.8 8.7New York 7.4 5.3 9.8 9.8 8.3 8.6 6.7 8.7Pennsylvania 6.9 5.7 5.7 7.8 9.2 7.9 5.7 8.5
East North Central:Illinois 7.2 5.6 6.9 9.3 8.4 7.9 6.5 8.0Indiana 8.6 5.5 9.4 10.2 9.5 10.3 7.0 10.3Michigan 7.7 4.9 9.8 8.5 9.2 9.4 6.6 9.2Ohio 7.5 5.6 6.1 7.5 9.1 9.4 6.0 9.2Wisconsin 8.6 7.0 8.2 8.7 13.3 7.8 7.5 9.9
West North Central:Iowa 6.8 4.4 7.6 7.3 8.2 8.8 5.5 8.5Kansas 7.4 4.9 7.1 9.7 9.3 9.6 5.8 9.5Minnesota 7.6 5.3 8.2 8.7 7.3 9.5 6.6 8.7Missouri 8.0 5.7 11.4 8.0 8.3 9.4 7.2 9.0Nebraska 7.8 4.2 11.0 8.8 8.1 8.6 7.4 8.2North Dakota 6.3 4.9 8.0 7.7 7.7 5.9 6.0 6.7South Dakota 8.6 6.2 8.1 10.0 7.6 13.8 7.3 10.5
South Atlantic:Delaware 7.6 6.7 9.9 10.7 5.8 6.8 8.0 7.2District of Columbia 4.3 2.9 3.7 4.6 6.1 5.2 3.2 5.5Florida 8.7 7.3 10.3 9.9 10.6 8.9 8.2 9.4Georgia 7.4 5.7 8.3 9.7 8.1 7.7 6.9 7.8Maryland 7.6 6.0 7.2 8.5 9.1 8.9 6.6 8.9North Carolina 8.6 5.6 8.1 9.6 8.0 11.7 6.8 10.4South Carolina 8.5 5.2 10.8 8.8 8.9 10.1 7.2 9.8Virginia 7.5 5.5 10.7 7.9 9.2 7.4 7.0 8.0West Virginia 8.5 7.6 8.8 7.2 10.1 9.2 7.9 9.2
East South Central:Alabama 7.1 3.4 7.3 6.6 10.1 10.1 4.9 9.7Kentucky 7.4 4.6 * 6.9 10.8 9.1 8.4 5.9 9.1Mississippi 9.4 7.3 9.7 11.0 10.7 9.6 8.8 9.9Tennessee 8.7 6.2 6.9 * 10.5 11.4 9.7 7.1 10.2
West South Central:Arkansas 9.6 6.9 7.7 10.9 12.5 10.2 7.9 10.9Louisiana 7.2 5.0 8.5 7.1 9.3 7.9 6.2 8.3Oklahoma 8.9 6.9 12.7 10.4 11.0 8.2 8.6 9.2Texas 8.4 7.2 9.2 8.6 10.5 8.2 7.7 9.0
Mountain:Arizona 8.9 6.1 9.7 10.5 12.9 8.5 7.6 9.9Colorado 8.3 7.2 11.6 11.4 10.3 6.7 8.7 7.9Idaho 10.1 9.5 9.9 12.3 9.4 10.0 9.9 10.3Montana 10.5 9.4 14.2 12.2 8.6 10.2 10.5 10.6Nevada 10.6 8.0 14.0 13.0 14.2 9.9 10.0 11.3New Mexico 9.0 6.9 10.7 9.2 11.8 8.9 8.3 9.7Utah 8.9 7.3 11.7 9.4 10.5 8.8 8.5 9.5Wyoming 8.5 6.1 8.2 11.7 12.5 8.8 7.4 10.2
Pacific:Alaska 9.2 6.8 11.1 9.7 13.9 8.1 8.4 10.1California 8.8 6.7 10.2 10.5 10.6 9.8 7.9 10.2Hawaii 4.7 3.2 5.0 5.3 7.3 7.3 3.9 6.7Oregon 8.5 6.7 8.1 8.4 11.7 9.8 7.4 10.1Washington 8.8 7.1 9.2 11.1 10.6 9.6 8.1 9.9
Source: Agency for Healthcare Research and Quality, Center for Financing, Access and Cost Trends. 2008 Medical Expenditure PanelSurvey-Insurance Component.Note: Definitions and descriptions of the methods used for this survey can be found in the Technical Appendix.* Figure does not meet standard of reliability or precision.
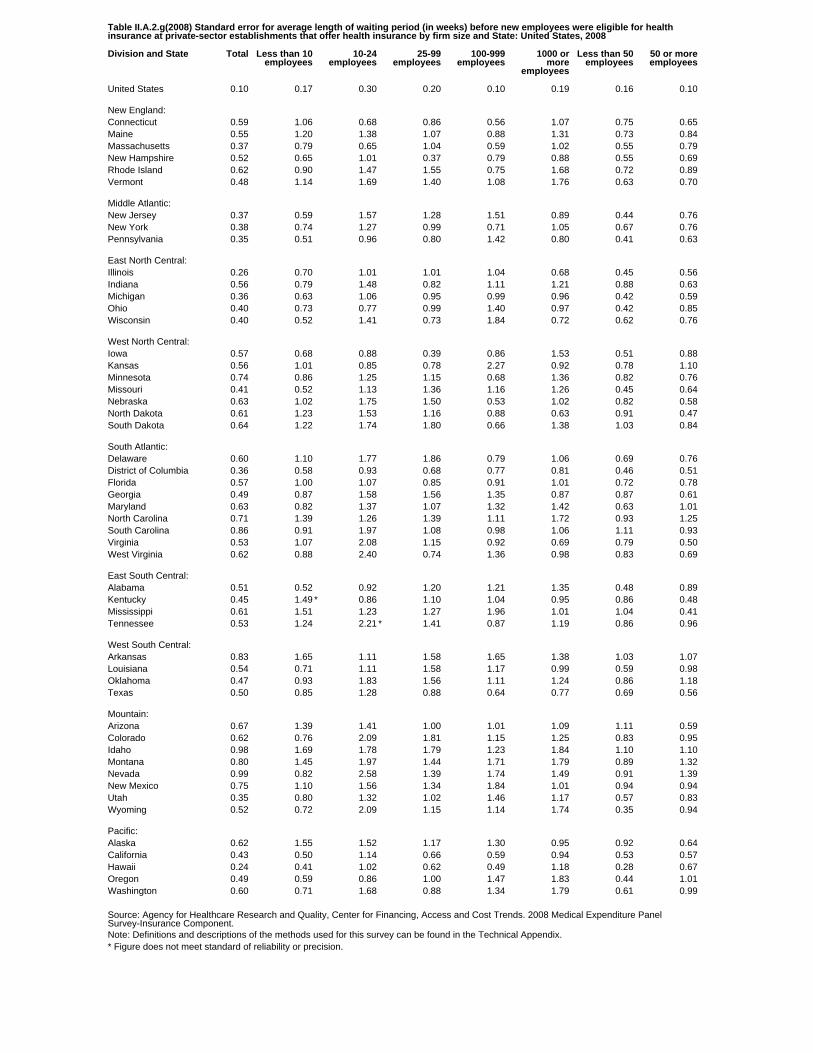
Table II.A.2.g(2008) Standard error for average length of waiting period (in weeks) before new employees were eligible for healthinsurance at private-sector establishments that offer health insurance by firm size and State: United States, 2008
Division and State Total Less than 10employees
10-24employees
25-99employees
100-999employees
1000 ormore
employees
Less than 50employees
50 or moreemployees
United States 0.10 0.17 0.30 0.20 0.10 0.19 0.16 0.10
New England:Connecticut 0.59 1.06 0.68 0.86 0.56 1.07 0.75 0.65Maine 0.55 1.20 1.38 1.07 0.88 1.31 0.73 0.84Massachusetts 0.37 0.79 0.65 1.04 0.59 1.02 0.55 0.79New Hampshire 0.52 0.65 1.01 0.37 0.79 0.88 0.55 0.69Rhode Island 0.62 0.90 1.47 1.55 0.75 1.68 0.72 0.89Vermont 0.48 1.14 1.69 1.40 1.08 1.76 0.63 0.70
Middle Atlantic:New Jersey 0.37 0.59 1.57 1.28 1.51 0.89 0.44 0.76New York 0.38 0.74 1.27 0.99 0.71 1.05 0.67 0.76Pennsylvania 0.35 0.51 0.96 0.80 1.42 0.80 0.41 0.63
East North Central:Illinois 0.26 0.70 1.01 1.01 1.04 0.68 0.45 0.56Indiana 0.56 0.79 1.48 0.82 1.11 1.21 0.88 0.63Michigan 0.36 0.63 1.06 0.95 0.99 0.96 0.42 0.59Ohio 0.40 0.73 0.77 0.99 1.40 0.97 0.42 0.85Wisconsin 0.40 0.52 1.41 0.73 1.84 0.72 0.62 0.76
West North Central:Iowa 0.57 0.68 0.88 0.39 0.86 1.53 0.51 0.88Kansas 0.56 1.01 0.85 0.78 2.27 0.92 0.78 1.10Minnesota 0.74 0.86 1.25 1.15 0.68 1.36 0.82 0.76Missouri 0.41 0.52 1.13 1.36 1.16 1.26 0.45 0.64Nebraska 0.63 1.02 1.75 1.50 0.53 1.02 0.82 0.58North Dakota 0.61 1.23 1.53 1.16 0.88 0.63 0.91 0.47South Dakota 0.64 1.22 1.74 1.80 0.66 1.38 1.03 0.84
South Atlantic:Delaware 0.60 1.10 1.77 1.86 0.79 1.06 0.69 0.76District of Columbia 0.36 0.58 0.93 0.68 0.77 0.81 0.46 0.51Florida 0.57 1.00 1.07 0.85 0.91 1.01 0.72 0.78Georgia 0.49 0.87 1.58 1.56 1.35 0.87 0.87 0.61Maryland 0.63 0.82 1.37 1.07 1.32 1.42 0.63 1.01North Carolina 0.71 1.39 1.26 1.39 1.11 1.72 0.93 1.25South Carolina 0.86 0.91 1.97 1.08 0.98 1.06 1.11 0.93Virginia 0.53 1.07 2.08 1.15 0.92 0.69 0.79 0.50West Virginia 0.62 0.88 2.40 0.74 1.36 0.98 0.83 0.69
East South Central:Alabama 0.51 0.52 0.92 1.20 1.21 1.35 0.48 0.89Kentucky 0.45 1.49 * 0.86 1.10 1.04 0.95 0.86 0.48Mississippi 0.61 1.51 1.23 1.27 1.96 1.01 1.04 0.41Tennessee 0.53 1.24 2.21 * 1.41 0.87 1.19 0.86 0.96
West South Central:Arkansas 0.83 1.65 1.11 1.58 1.65 1.38 1.03 1.07Louisiana 0.54 0.71 1.11 1.58 1.17 0.99 0.59 0.98Oklahoma 0.47 0.93 1.83 1.56 1.11 1.24 0.86 1.18Texas 0.50 0.85 1.28 0.88 0.64 0.77 0.69 0.56
Mountain:Arizona 0.67 1.39 1.41 1.00 1.01 1.09 1.11 0.59Colorado 0.62 0.76 2.09 1.81 1.15 1.25 0.83 0.95Idaho 0.98 1.69 1.78 1.79 1.23 1.84 1.10 1.10Montana 0.80 1.45 1.97 1.44 1.71 1.79 0.89 1.32Nevada 0.99 0.82 2.58 1.39 1.74 1.49 0.91 1.39New Mexico 0.75 1.10 1.56 1.34 1.84 1.01 0.94 0.94Utah 0.35 0.80 1.32 1.02 1.46 1.17 0.57 0.83Wyoming 0.52 0.72 2.09 1.15 1.14 1.74 0.35 0.94
Pacific:Alaska 0.62 1.55 1.52 1.17 1.30 0.95 0.92 0.64California 0.43 0.50 1.14 0.66 0.59 0.94 0.53 0.57Hawaii 0.24 0.41 1.02 0.62 0.49 1.18 0.28 0.67Oregon 0.49 0.59 0.86 1.00 1.47 1.83 0.44 1.01Washington 0.60 0.71 1.68 0.88 1.34 1.79 0.61 0.99
Source: Agency for Healthcare Research and Quality, Center for Financing, Access and Cost Trends. 2008 Medical Expenditure PanelSurvey-Insurance Component.Note: Definitions and descriptions of the methods used for this survey can be found in the Technical Appendix.* Figure does not meet standard of reliability or precision.

Table II.B.1(2008) Number of private-sector employees by firm size and State: United States, 2008
Division and State Total Less than 10employees
10-24employees
25-99employees
100-999employees
1000 ormore
employees
Less than 50employees
50 or moreemployees
United States 116,141,515 13,273,104 10,199,219 16,489,281 21,368,386 54,811,525 31,372,909 84,768,606
New England:Connecticut 1,465,237 155,964 146,992 178,766 280,520 702,997 399,675 1,065,563Maine 492,211 78,790 59,548 70,914 124,969 157,991 175,589 316,621Massachusetts 3,001,586 296,826 254,632 411,780 589,209 1,449,139 758,505 2,243,081New Hampshire 561,196 76,345 67,725 83,667 110,309 223,150 184,920 376,277Rhode Island 427,164 54,842 43,063 55,931 92,348 180,980 130,341 296,823Vermont 251,353 43,705 31,693 39,096 50,818 86,042 * 96,613 154,740
Middle Atlantic:New Jersey 3,561,007 486,390 305,838 612,767 621,034 1,534,978 1,074,506 2,486,501New York 7,469,664 914,899 774,614 969,149 1,500,615 3,310,387 2,195,223 5,274,442Pennsylvania 5,094,013 550,957 433,399 746,164 1,069,528 2,293,965 1,369,406 3,724,607
East North Central:Illinois 5,405,168 570,933 380,188 789,903 1,042,803 2,621,341 1,269,731 4,135,436Indiana 2,507,330 255,496 223,273 351,157 503,521 1,173,884 661,457 1,845,873Michigan 3,449,973 428,671 337,867 506,077 725,848 1,451,509 1,004,358 2,445,615Ohio 4,702,840 445,989 394,332 629,958 1,033,527 2,199,034 1,137,870 3,564,970Wisconsin 2,558,435 325,577 232,108 416,520 496,678 1,087,552 719,331 1,839,103
West North Central:Iowa 1,304,443 148,897 128,895 203,591 273,742 549,317 375,175 929,268Kansas 1,109,140 144,978 103,007 197,521 209,812 453,822 332,305 776,835Minnesota 2,468,336 245,051 251,253 342,158 505,258 1,124,617 662,853 1,805,484Missouri 2,332,099 259,444 180,833 337,874 419,280 1,134,668 617,031 1,715,068Nebraska 806,602 94,027 84,542 104,558 136,552 386,923 233,573 573,029North Dakota 294,768 43,972 31,569 54,445 58,863 105,920 101,351 193,417South Dakota 320,175 49,445 40,786 50,058 72,012 107,874 117,767 202,408
South Atlantic:Delaware 376,347 35,867 35,818 58,615 61,212 184,835 97,515 278,832District of Columbia 464,559 32,071 34,804 60,070 119,311 218,303 93,755 370,804Florida 6,891,517 836,866 504,471 758,560 917,390 3,874,231 1,690,739 5,200,778Georgia 3,354,107 368,039 263,247 380,744 608,239 1,733,838 809,371 2,544,736Maryland 2,082,590 237,061 187,959 335,775 324,644 997,151 587,078 1,495,512North Carolina 3,440,453 400,570 313,033 433,099 694,502 1,599,249 936,590 2,503,864South Carolina 1,528,356 164,942 140,193 206,156 278,469 738,596 414,113 1,114,243Virginia 2,989,600 316,393 238,096 430,931 536,669 1,467,510 732,629 2,256,971West Virginia 557,756 73,393 55,521 78,080 102,579 248,184 161,232 396,524
East South Central:Alabama 1,574,811 162,929 162,434 224,569 273,021 751,858 429,232 1,145,579Kentucky 1,501,784 158,524 124,525 205,216 250,701 762,817 380,202 1,121,582Mississippi 866,754 108,953 79,168 125,295 149,654 403,683 249,271 617,483Tennessee 2,428,872 226,241 171,543 309,098 443,109 1,278,881 543,354 1,885,519
West South Central:Arkansas 993,395 116,775 82,888 125,248 207,435 461,048 261,804 731,591Louisiana 1,509,297 186,328 139,894 212,056 304,356 666,663 435,484 1,073,813Oklahoma 1,219,330 160,458 107,809 199,034 240,299 511,731 365,674 853,656Texas 8,741,171 874,861 653,894 1,248,234 1,303,154 4,661,028 2,169,751 6,571,420
Mountain:Arizona 2,205,122 220,887 152,780 319,428 368,966 1,143,061 519,045 1,686,076Colorado 1,968,132 259,305 200,468 316,547 278,334 913,479 610,548 1,357,585Idaho 537,075 88,161 65,143 81,003 75,256 227,511 195,647 341,429Montana 359,099 79,450 46,970 63,794 79,018 89,867 160,081 199,018Nevada 1,124,623 95,361 82,625 134,394 263,135 549,108 236,440 888,183New Mexico 675,889 71,090 66,121 111,211 112,417 315,050 184,415 491,474Utah 1,066,544 122,380 86,934 156,217 215,743 485,270 298,390 768,154Wyoming 207,629 40,616 30,883 33,387 30,211 72,531 88,956 118,673
Pacific:Alaska 230,911 39,755 27,396 29,147 48,706 85,907 83,338 147,574California 13,376,056 1,520,547 1,169,970 2,029,917 2,383,997 6,271,626 3,621,268 9,754,789Hawaii 499,367 56,903 44,575 83,845 134,885 179,159 142,744 356,623Oregon 1,435,738 193,524 165,003 234,709 233,735 608,767 460,902 974,837Washington 2,351,885 353,655 258,895 352,847 411,994 974,494 795,761 1,556,124
Source: Agency for Healthcare Research and Quality, Center for Financing, Access and Cost Trends. 2008 Medical Expenditure PanelSurvey-Insurance Component.Note: Definitions and descriptions of the methods used for this survey can be found in the Technical Appendix.* Figure does not meet standard of reliability or precision.Totals may not sum exactly because of rounding.
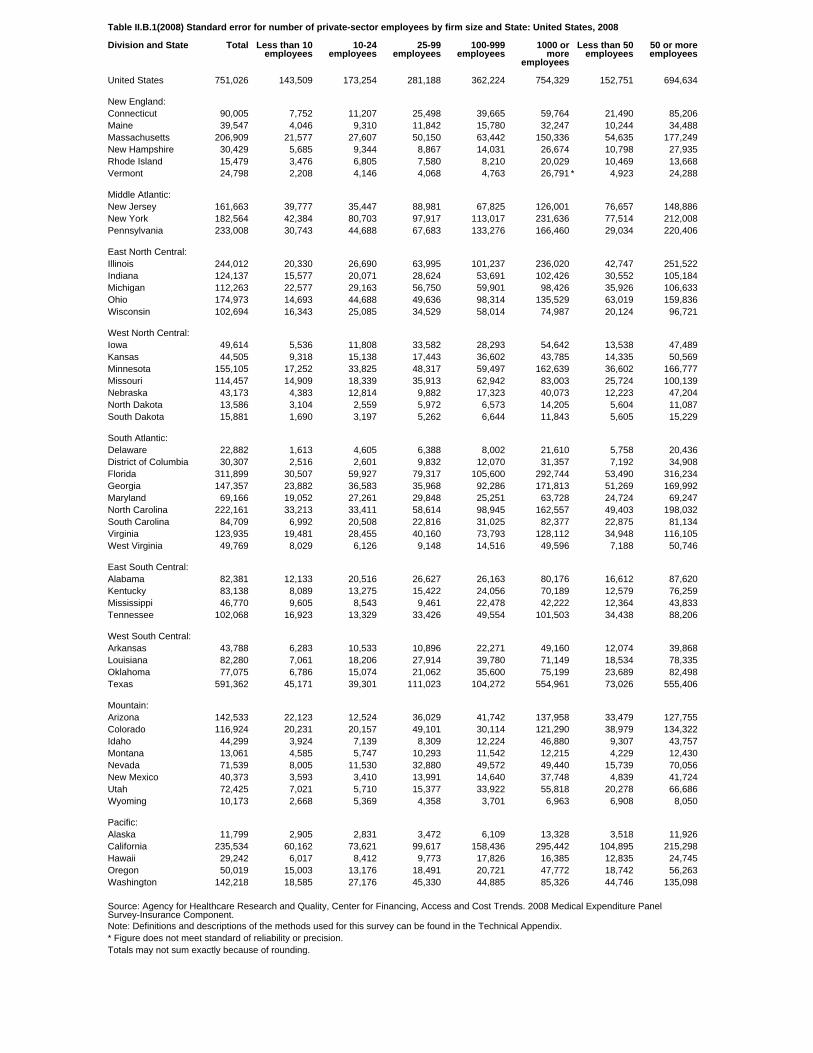
Table II.B.1(2008) Standard error for number of private-sector employees by firm size and State: United States, 2008
Division and State Total Less than 10employees
10-24employees
25-99employees
100-999employees
1000 ormore
employees
Less than 50employees
50 or moreemployees
United States 751,026 143,509 173,254 281,188 362,224 754,329 152,751 694,634
New England:Connecticut 90,005 7,752 11,207 25,498 39,665 59,764 21,490 85,206Maine 39,547 4,046 9,310 11,842 15,780 32,247 10,244 34,488Massachusetts 206,909 21,577 27,607 50,150 63,442 150,336 54,635 177,249New Hampshire 30,429 5,685 9,344 8,867 14,031 26,674 10,798 27,935Rhode Island 15,479 3,476 6,805 7,580 8,210 20,029 10,469 13,668Vermont 24,798 2,208 4,146 4,068 4,763 26,791 * 4,923 24,288
Middle Atlantic:New Jersey 161,663 39,777 35,447 88,981 67,825 126,001 76,657 148,886New York 182,564 42,384 80,703 97,917 113,017 231,636 77,514 212,008Pennsylvania 233,008 30,743 44,688 67,683 133,276 166,460 29,034 220,406
East North Central:Illinois 244,012 20,330 26,690 63,995 101,237 236,020 42,747 251,522Indiana 124,137 15,577 20,071 28,624 53,691 102,426 30,552 105,184Michigan 112,263 22,577 29,163 56,750 59,901 98,426 35,926 106,633Ohio 174,973 14,693 44,688 49,636 98,314 135,529 63,019 159,836Wisconsin 102,694 16,343 25,085 34,529 58,014 74,987 20,124 96,721
West North Central:Iowa 49,614 5,536 11,808 33,582 28,293 54,642 13,538 47,489Kansas 44,505 9,318 15,138 17,443 36,602 43,785 14,335 50,569Minnesota 155,105 17,252 33,825 48,317 59,497 162,639 36,602 166,777Missouri 114,457 14,909 18,339 35,913 62,942 83,003 25,724 100,139Nebraska 43,173 4,383 12,814 9,882 17,323 40,073 12,223 47,204North Dakota 13,586 3,104 2,559 5,972 6,573 14,205 5,604 11,087South Dakota 15,881 1,690 3,197 5,262 6,644 11,843 5,605 15,229
South Atlantic:Delaware 22,882 1,613 4,605 6,388 8,002 21,610 5,758 20,436District of Columbia 30,307 2,516 2,601 9,832 12,070 31,357 7,192 34,908Florida 311,899 30,507 59,927 79,317 105,600 292,744 53,490 316,234Georgia 147,357 23,882 36,583 35,968 92,286 171,813 51,269 169,992Maryland 69,166 19,052 27,261 29,848 25,251 63,728 24,724 69,247North Carolina 222,161 33,213 33,411 58,614 98,945 162,557 49,403 198,032South Carolina 84,709 6,992 20,508 22,816 31,025 82,377 22,875 81,134Virginia 123,935 19,481 28,455 40,160 73,793 128,112 34,948 116,105West Virginia 49,769 8,029 6,126 9,148 14,516 49,596 7,188 50,746
East South Central:Alabama 82,381 12,133 20,516 26,627 26,163 80,176 16,612 87,620Kentucky 83,138 8,089 13,275 15,422 24,056 70,189 12,579 76,259Mississippi 46,770 9,605 8,543 9,461 22,478 42,222 12,364 43,833Tennessee 102,068 16,923 13,329 33,426 49,554 101,503 34,438 88,206
West South Central:Arkansas 43,788 6,283 10,533 10,896 22,271 49,160 12,074 39,868Louisiana 82,280 7,061 18,206 27,914 39,780 71,149 18,534 78,335Oklahoma 77,075 6,786 15,074 21,062 35,600 75,199 23,689 82,498Texas 591,362 45,171 39,301 111,023 104,272 554,961 73,026 555,406
Mountain:Arizona 142,533 22,123 12,524 36,029 41,742 137,958 33,479 127,755Colorado 116,924 20,231 20,157 49,101 30,114 121,290 38,979 134,322Idaho 44,299 3,924 7,139 8,309 12,224 46,880 9,307 43,757Montana 13,061 4,585 5,747 10,293 11,542 12,215 4,229 12,430Nevada 71,539 8,005 11,530 32,880 49,572 49,440 15,739 70,056New Mexico 40,373 3,593 3,410 13,991 14,640 37,748 4,839 41,724Utah 72,425 7,021 5,710 15,377 33,922 55,818 20,278 66,686Wyoming 10,173 2,668 5,369 4,358 3,701 6,963 6,908 8,050
Pacific:Alaska 11,799 2,905 2,831 3,472 6,109 13,328 3,518 11,926California 235,534 60,162 73,621 99,617 158,436 295,442 104,895 215,298Hawaii 29,242 6,017 8,412 9,773 17,826 16,385 12,835 24,745Oregon 50,019 15,003 13,176 18,491 20,721 47,772 18,742 56,263Washington 142,218 18,585 27,176 45,330 44,885 85,326 44,746 135,098
Source: Agency for Healthcare Research and Quality, Center for Financing, Access and Cost Trends. 2008 Medical Expenditure PanelSurvey-Insurance Component.Note: Definitions and descriptions of the methods used for this survey can be found in the Technical Appendix.* Figure does not meet standard of reliability or precision.Totals may not sum exactly because of rounding.
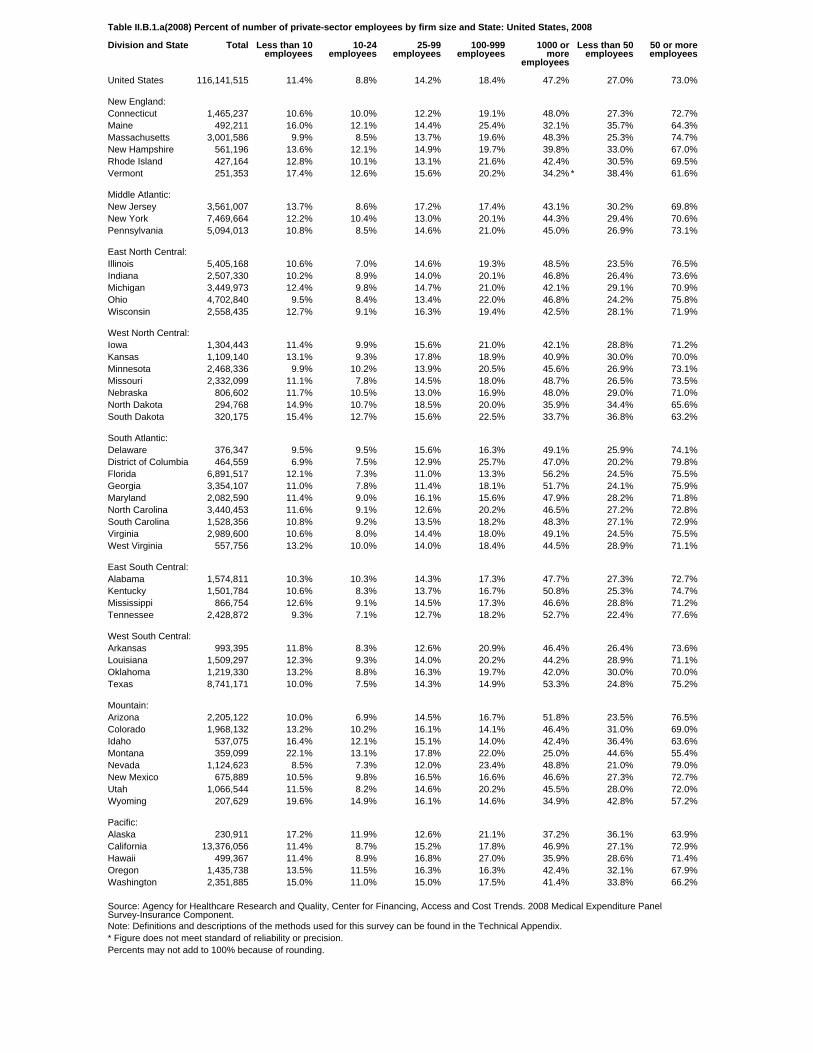
Table II.B.1.a(2008) Percent of number of private-sector employees by firm size and State: United States, 2008
Division and State Total Less than 10employees
10-24employees
25-99employees
100-999employees
1000 ormore
employees
Less than 50employees
50 or moreemployees
United States 116,141,515 11.4% 8.8% 14.2% 18.4% 47.2% 27.0% 73.0%
New England:Connecticut 1,465,237 10.6% 10.0% 12.2% 19.1% 48.0% 27.3% 72.7%Maine 492,211 16.0% 12.1% 14.4% 25.4% 32.1% 35.7% 64.3%Massachusetts 3,001,586 9.9% 8.5% 13.7% 19.6% 48.3% 25.3% 74.7%New Hampshire 561,196 13.6% 12.1% 14.9% 19.7% 39.8% 33.0% 67.0%Rhode Island 427,164 12.8% 10.1% 13.1% 21.6% 42.4% 30.5% 69.5%Vermont 251,353 17.4% 12.6% 15.6% 20.2% 34.2% * 38.4% 61.6%
Middle Atlantic:New Jersey 3,561,007 13.7% 8.6% 17.2% 17.4% 43.1% 30.2% 69.8%New York 7,469,664 12.2% 10.4% 13.0% 20.1% 44.3% 29.4% 70.6%Pennsylvania 5,094,013 10.8% 8.5% 14.6% 21.0% 45.0% 26.9% 73.1%
East North Central:Illinois 5,405,168 10.6% 7.0% 14.6% 19.3% 48.5% 23.5% 76.5%Indiana 2,507,330 10.2% 8.9% 14.0% 20.1% 46.8% 26.4% 73.6%Michigan 3,449,973 12.4% 9.8% 14.7% 21.0% 42.1% 29.1% 70.9%Ohio 4,702,840 9.5% 8.4% 13.4% 22.0% 46.8% 24.2% 75.8%Wisconsin 2,558,435 12.7% 9.1% 16.3% 19.4% 42.5% 28.1% 71.9%
West North Central:Iowa 1,304,443 11.4% 9.9% 15.6% 21.0% 42.1% 28.8% 71.2%Kansas 1,109,140 13.1% 9.3% 17.8% 18.9% 40.9% 30.0% 70.0%Minnesota 2,468,336 9.9% 10.2% 13.9% 20.5% 45.6% 26.9% 73.1%Missouri 2,332,099 11.1% 7.8% 14.5% 18.0% 48.7% 26.5% 73.5%Nebraska 806,602 11.7% 10.5% 13.0% 16.9% 48.0% 29.0% 71.0%North Dakota 294,768 14.9% 10.7% 18.5% 20.0% 35.9% 34.4% 65.6%South Dakota 320,175 15.4% 12.7% 15.6% 22.5% 33.7% 36.8% 63.2%
South Atlantic:Delaware 376,347 9.5% 9.5% 15.6% 16.3% 49.1% 25.9% 74.1%District of Columbia 464,559 6.9% 7.5% 12.9% 25.7% 47.0% 20.2% 79.8%Florida 6,891,517 12.1% 7.3% 11.0% 13.3% 56.2% 24.5% 75.5%Georgia 3,354,107 11.0% 7.8% 11.4% 18.1% 51.7% 24.1% 75.9%Maryland 2,082,590 11.4% 9.0% 16.1% 15.6% 47.9% 28.2% 71.8%North Carolina 3,440,453 11.6% 9.1% 12.6% 20.2% 46.5% 27.2% 72.8%South Carolina 1,528,356 10.8% 9.2% 13.5% 18.2% 48.3% 27.1% 72.9%Virginia 2,989,600 10.6% 8.0% 14.4% 18.0% 49.1% 24.5% 75.5%West Virginia 557,756 13.2% 10.0% 14.0% 18.4% 44.5% 28.9% 71.1%
East South Central:Alabama 1,574,811 10.3% 10.3% 14.3% 17.3% 47.7% 27.3% 72.7%Kentucky 1,501,784 10.6% 8.3% 13.7% 16.7% 50.8% 25.3% 74.7%Mississippi 866,754 12.6% 9.1% 14.5% 17.3% 46.6% 28.8% 71.2%Tennessee 2,428,872 9.3% 7.1% 12.7% 18.2% 52.7% 22.4% 77.6%
West South Central:Arkansas 993,395 11.8% 8.3% 12.6% 20.9% 46.4% 26.4% 73.6%Louisiana 1,509,297 12.3% 9.3% 14.0% 20.2% 44.2% 28.9% 71.1%Oklahoma 1,219,330 13.2% 8.8% 16.3% 19.7% 42.0% 30.0% 70.0%Texas 8,741,171 10.0% 7.5% 14.3% 14.9% 53.3% 24.8% 75.2%
Mountain:Arizona 2,205,122 10.0% 6.9% 14.5% 16.7% 51.8% 23.5% 76.5%Colorado 1,968,132 13.2% 10.2% 16.1% 14.1% 46.4% 31.0% 69.0%Idaho 537,075 16.4% 12.1% 15.1% 14.0% 42.4% 36.4% 63.6%Montana 359,099 22.1% 13.1% 17.8% 22.0% 25.0% 44.6% 55.4%Nevada 1,124,623 8.5% 7.3% 12.0% 23.4% 48.8% 21.0% 79.0%New Mexico 675,889 10.5% 9.8% 16.5% 16.6% 46.6% 27.3% 72.7%Utah 1,066,544 11.5% 8.2% 14.6% 20.2% 45.5% 28.0% 72.0%Wyoming 207,629 19.6% 14.9% 16.1% 14.6% 34.9% 42.8% 57.2%
Pacific:Alaska 230,911 17.2% 11.9% 12.6% 21.1% 37.2% 36.1% 63.9%California 13,376,056 11.4% 8.7% 15.2% 17.8% 46.9% 27.1% 72.9%Hawaii 499,367 11.4% 8.9% 16.8% 27.0% 35.9% 28.6% 71.4%Oregon 1,435,738 13.5% 11.5% 16.3% 16.3% 42.4% 32.1% 67.9%Washington 2,351,885 15.0% 11.0% 15.0% 17.5% 41.4% 33.8% 66.2%
Source: Agency for Healthcare Research and Quality, Center for Financing, Access and Cost Trends. 2008 Medical Expenditure PanelSurvey-Insurance Component.Note: Definitions and descriptions of the methods used for this survey can be found in the Technical Appendix.* Figure does not meet standard of reliability or precision.Percents may not add to 100% because of rounding.

Table II.B.1.a(2008) Standard error for percent of number of private-sector employees by firm size and State: United States, 2008
Division and State Total Less than 10employees
10-24employees
25-99employees
100-999employees
1000 ormore
employees
Less than 50employees
50 or moreemployees
United States 751,026 0.13% 0.16% 0.22% 0.31% 0.48% 0.16% 0.16%
New England:Connecticut 90,005 1.02% 1.01% 1.81% 1.79% 2.42% 1.93% 1.93%Maine 39,547 1.61% 1.88% 3.03% 2.54% 4.24% 2.44% 2.44%Massachusetts 206,909 0.64% 1.02% 1.51% 2.29% 2.20% 1.58% 1.58%New Hampshire 30,429 0.81% 1.80% 2.02% 2.85% 3.30% 2.07% 2.07%Rhode Island 15,479 1.03% 1.34% 1.90% 1.97% 3.85% 2.15% 2.15%Vermont 24,798 1.36% 1.88% 1.94% 2.54% 5.53% * 3.17% 3.17%
Middle Atlantic:New Jersey 161,663 1.28% 0.91% 2.08% 1.96% 2.88% 1.97% 1.97%New York 182,564 0.69% 1.11% 1.31% 1.46% 2.46% 1.32% 1.32%Pennsylvania 233,008 0.90% 0.99% 1.21% 2.24% 1.79% 1.25% 1.25%
East North Central:Illinois 244,012 0.60% 0.67% 1.38% 1.68% 2.26% 1.31% 1.31%Indiana 124,137 0.86% 0.64% 1.56% 2.09% 2.43% 1.00% 1.00%Michigan 112,263 0.67% 0.89% 1.72% 1.82% 1.69% 1.15% 1.15%Ohio 174,973 0.50% 0.70% 1.30% 1.73% 2.14% 1.27% 1.27%Wisconsin 102,694 0.71% 0.86% 1.80% 1.65% 1.96% 1.21% 1.21%
West North Central:Iowa 49,614 0.58% 1.17% 2.62% 2.70% 2.82% 1.36% 1.36%Kansas 44,505 1.17% 1.58% 2.13% 2.93% 3.21% 2.10% 2.10%Minnesota 155,105 0.97% 1.77% 2.35% 2.81% 3.69% 2.39% 2.39%Missouri 114,457 0.73% 0.90% 1.42% 1.99% 2.73% 1.07% 1.07%Nebraska 43,173 0.75% 1.87% 1.32% 1.82% 3.20% 2.27% 2.27%North Dakota 13,586 1.21% 0.93% 1.70% 2.83% 3.74% 1.72% 1.72%South Dakota 15,881 1.01% 0.86% 1.96% 1.91% 2.10% 2.21% 2.21%
South Atlantic:Delaware 22,882 0.75% 1.46% 1.91% 2.23% 3.31% 1.57% 1.57%District of Columbia 30,307 1.01% 0.66% 2.67% 2.43% 4.57% 2.68% 2.68%Florida 311,899 0.60% 0.81% 1.61% 1.29% 2.49% 1.59% 1.59%Georgia 147,357 0.86% 1.28% 1.20% 2.55% 3.61% 2.11% 2.11%Maryland 69,166 0.86% 1.54% 1.36% 1.18% 2.06% 1.47% 1.47%North Carolina 222,161 0.95% 1.07% 1.36% 2.56% 3.07% 1.46% 1.46%South Carolina 84,709 0.66% 1.39% 1.75% 2.02% 3.21% 1.95% 1.95%Virginia 123,935 0.57% 1.02% 1.64% 2.56% 2.68% 1.31% 1.31%West Virginia 49,769 1.97% 1.21% 1.95% 2.84% 4.09% 2.34% 2.34%
East South Central:Alabama 82,381 0.90% 1.60% 1.65% 1.68% 2.76% 1.91% 1.91%Kentucky 83,138 0.95% 0.77% 1.19% 1.53% 2.26% 1.09% 1.09%Mississippi 46,770 1.49% 0.99% 1.23% 2.34% 3.08% 1.61% 1.61%Tennessee 102,068 0.77% 0.53% 1.54% 1.94% 2.94% 1.23% 1.23%
West South Central:Arkansas 43,788 0.75% 1.06% 1.17% 2.53% 3.21% 1.32% 1.32%Louisiana 82,280 1.05% 1.25% 1.88% 2.21% 3.31% 1.75% 1.75%Oklahoma 77,075 0.90% 1.32% 2.29% 2.75% 3.56% 2.69% 2.69%Texas 591,362 0.68% 0.66% 0.95% 1.44% 2.30% 1.33% 1.33%
Mountain:Arizona 142,533 1.20% 0.45% 1.83% 2.13% 3.33% 1.49% 1.49%Colorado 116,924 1.44% 1.23% 2.81% 1.10% 3.60% 3.01% 3.01%Idaho 44,299 1.61% 1.32% 1.81% 2.95% 4.82% 2.67% 2.67%Montana 13,061 1.55% 1.83% 2.71% 2.92% 2.79% 1.91% 1.91%Nevada 71,539 0.99% 1.52% 2.43% 3.35% 4.24% 2.06% 2.06%New Mexico 40,373 0.76% 0.79% 2.32% 2.05% 3.18% 1.95% 1.95%Utah 72,425 0.68% 0.93% 1.74% 2.32% 3.28% 2.08% 2.08%Wyoming 10,173 1.54% 2.29% 1.91% 1.54% 2.81% 2.56% 2.56%
Pacific:Alaska 11,799 1.72% 1.31% 1.40% 2.69% 4.21% 2.42% 2.42%California 235,534 0.50% 0.49% 0.81% 1.21% 1.69% 0.74% 0.74%Hawaii 29,242 0.98% 1.54% 1.69% 2.41% 2.94% 1.94% 1.94%Oregon 50,019 1.11% 1.24% 0.99% 1.51% 2.49% 1.96% 1.96%Washington 142,218 0.83% 0.82% 1.92% 1.73% 2.34% 2.41% 2.41%
Source: Agency for Healthcare Research and Quality, Center for Financing, Access and Cost Trends. 2008 Medical Expenditure PanelSurvey-Insurance Component.Note: Definitions and descriptions of the methods used for this survey can be found in the Technical Appendix.* Figure does not meet standard of reliability or precision.Percents may not add to 100% because of rounding.
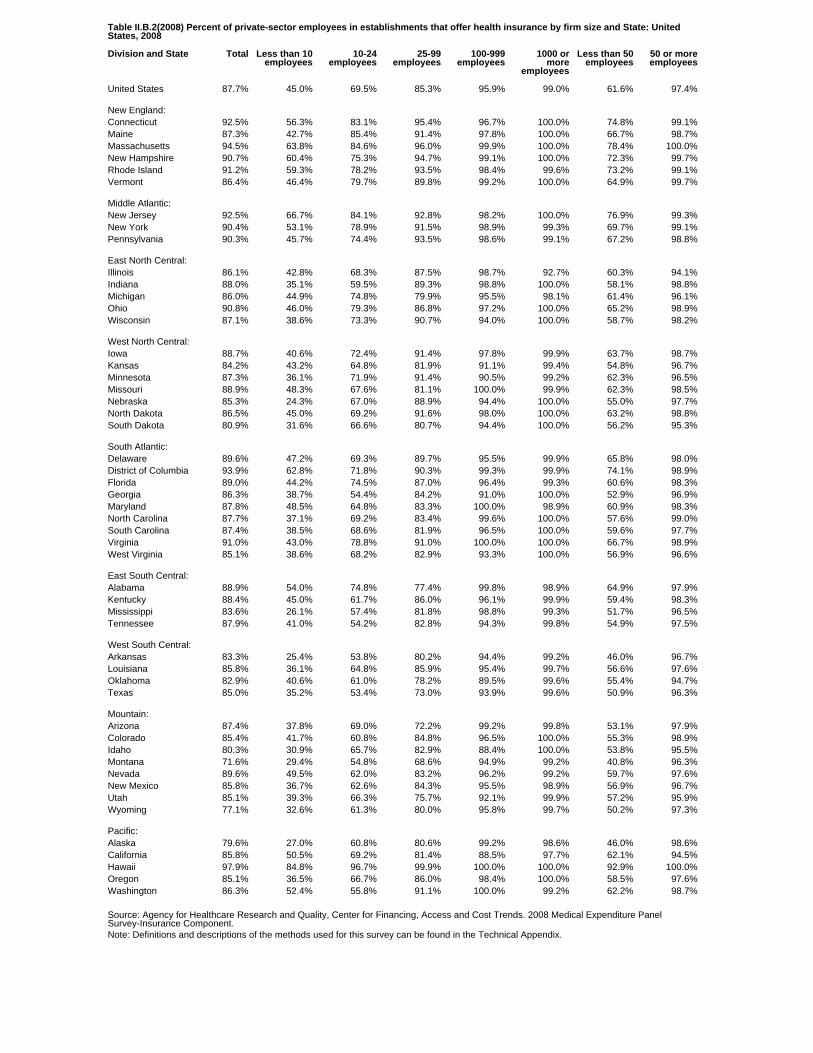
Table II.B.2(2008) Percent of private-sector employees in establishments that offer health insurance by firm size and State: UnitedStates, 2008
Division and State Total Less than 10employees
10-24employees
25-99employees
100-999employees
1000 ormore
employees
Less than 50employees
50 or moreemployees
United States 87.7% 45.0% 69.5% 85.3% 95.9% 99.0% 61.6% 97.4%
New England:Connecticut 92.5% 56.3% 83.1% 95.4% 96.7% 100.0% 74.8% 99.1%Maine 87.3% 42.7% 85.4% 91.4% 97.8% 100.0% 66.7% 98.7%Massachusetts 94.5% 63.8% 84.6% 96.0% 99.9% 100.0% 78.4% 100.0%New Hampshire 90.7% 60.4% 75.3% 94.7% 99.1% 100.0% 72.3% 99.7%Rhode Island 91.2% 59.3% 78.2% 93.5% 98.4% 99.6% 73.2% 99.1%Vermont 86.4% 46.4% 79.7% 89.8% 99.2% 100.0% 64.9% 99.7%
Middle Atlantic:New Jersey 92.5% 66.7% 84.1% 92.8% 98.2% 100.0% 76.9% 99.3%New York 90.4% 53.1% 78.9% 91.5% 98.9% 99.3% 69.7% 99.1%Pennsylvania 90.3% 45.7% 74.4% 93.5% 98.6% 99.1% 67.2% 98.8%
East North Central:Illinois 86.1% 42.8% 68.3% 87.5% 98.7% 92.7% 60.3% 94.1%Indiana 88.0% 35.1% 59.5% 89.3% 98.8% 100.0% 58.1% 98.8%Michigan 86.0% 44.9% 74.8% 79.9% 95.5% 98.1% 61.4% 96.1%Ohio 90.8% 46.0% 79.3% 86.8% 97.2% 100.0% 65.2% 98.9%Wisconsin 87.1% 38.6% 73.3% 90.7% 94.0% 100.0% 58.7% 98.2%
West North Central:Iowa 88.7% 40.6% 72.4% 91.4% 97.8% 99.9% 63.7% 98.7%Kansas 84.2% 43.2% 64.8% 81.9% 91.1% 99.4% 54.8% 96.7%Minnesota 87.3% 36.1% 71.9% 91.4% 90.5% 99.2% 62.3% 96.5%Missouri 88.9% 48.3% 67.6% 81.1% 100.0% 99.9% 62.3% 98.5%Nebraska 85.3% 24.3% 67.0% 88.9% 94.4% 100.0% 55.0% 97.7%North Dakota 86.5% 45.0% 69.2% 91.6% 98.0% 100.0% 63.2% 98.8%South Dakota 80.9% 31.6% 66.6% 80.7% 94.4% 100.0% 56.2% 95.3%
South Atlantic:Delaware 89.6% 47.2% 69.3% 89.7% 95.5% 99.9% 65.8% 98.0%District of Columbia 93.9% 62.8% 71.8% 90.3% 99.3% 99.9% 74.1% 98.9%Florida 89.0% 44.2% 74.5% 87.0% 96.4% 99.3% 60.6% 98.3%Georgia 86.3% 38.7% 54.4% 84.2% 91.0% 100.0% 52.9% 96.9%Maryland 87.8% 48.5% 64.8% 83.3% 100.0% 98.9% 60.9% 98.3%North Carolina 87.7% 37.1% 69.2% 83.4% 99.6% 100.0% 57.6% 99.0%South Carolina 87.4% 38.5% 68.6% 81.9% 96.5% 100.0% 59.6% 97.7%Virginia 91.0% 43.0% 78.8% 91.0% 100.0% 100.0% 66.7% 98.9%West Virginia 85.1% 38.6% 68.2% 82.9% 93.3% 100.0% 56.9% 96.6%
East South Central:Alabama 88.9% 54.0% 74.8% 77.4% 99.8% 98.9% 64.9% 97.9%Kentucky 88.4% 45.0% 61.7% 86.0% 96.1% 99.9% 59.4% 98.3%Mississippi 83.6% 26.1% 57.4% 81.8% 98.8% 99.3% 51.7% 96.5%Tennessee 87.9% 41.0% 54.2% 82.8% 94.3% 99.8% 54.9% 97.5%
West South Central:Arkansas 83.3% 25.4% 53.8% 80.2% 94.4% 99.2% 46.0% 96.7%Louisiana 85.8% 36.1% 64.8% 85.9% 95.4% 99.7% 56.6% 97.6%Oklahoma 82.9% 40.6% 61.0% 78.2% 89.5% 99.6% 55.4% 94.7%Texas 85.0% 35.2% 53.4% 73.0% 93.9% 99.6% 50.9% 96.3%
Mountain:Arizona 87.4% 37.8% 69.0% 72.2% 99.2% 99.8% 53.1% 97.9%Colorado 85.4% 41.7% 60.8% 84.8% 96.5% 100.0% 55.3% 98.9%Idaho 80.3% 30.9% 65.7% 82.9% 88.4% 100.0% 53.8% 95.5%Montana 71.6% 29.4% 54.8% 68.6% 94.9% 99.2% 40.8% 96.3%Nevada 89.6% 49.5% 62.0% 83.2% 96.2% 99.2% 59.7% 97.6%New Mexico 85.8% 36.7% 62.6% 84.3% 95.5% 98.9% 56.9% 96.7%Utah 85.1% 39.3% 66.3% 75.7% 92.1% 99.9% 57.2% 95.9%Wyoming 77.1% 32.6% 61.3% 80.0% 95.8% 99.7% 50.2% 97.3%
Pacific:Alaska 79.6% 27.0% 60.8% 80.6% 99.2% 98.6% 46.0% 98.6%California 85.8% 50.5% 69.2% 81.4% 88.5% 97.7% 62.1% 94.5%Hawaii 97.9% 84.8% 96.7% 99.9% 100.0% 100.0% 92.9% 100.0%Oregon 85.1% 36.5% 66.7% 86.0% 98.4% 100.0% 58.5% 97.6%Washington 86.3% 52.4% 55.8% 91.1% 100.0% 99.2% 62.2% 98.7%
Source: Agency for Healthcare Research and Quality, Center for Financing, Access and Cost Trends. 2008 Medical Expenditure PanelSurvey-Insurance Component.Note: Definitions and descriptions of the methods used for this survey can be found in the Technical Appendix.
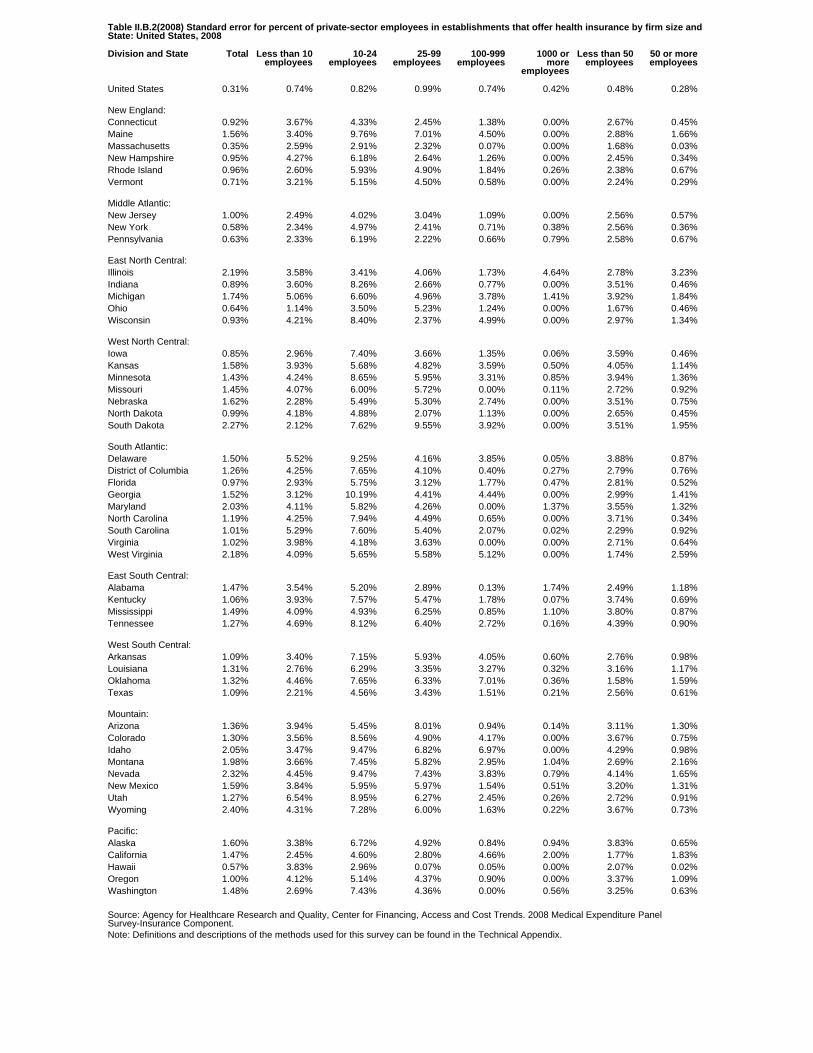
Table II.B.2(2008) Standard error for percent of private-sector employees in establishments that offer health insurance by firm size andState: United States, 2008
Division and State Total Less than 10employees
10-24employees
25-99employees
100-999employees
1000 ormore
employees
Less than 50employees
50 or moreemployees
United States 0.31% 0.74% 0.82% 0.99% 0.74% 0.42% 0.48% 0.28%
New England:Connecticut 0.92% 3.67% 4.33% 2.45% 1.38% 0.00% 2.67% 0.45%Maine 1.56% 3.40% 9.76% 7.01% 4.50% 0.00% 2.88% 1.66%Massachusetts 0.35% 2.59% 2.91% 2.32% 0.07% 0.00% 1.68% 0.03%New Hampshire 0.95% 4.27% 6.18% 2.64% 1.26% 0.00% 2.45% 0.34%Rhode Island 0.96% 2.60% 5.93% 4.90% 1.84% 0.26% 2.38% 0.67%Vermont 0.71% 3.21% 5.15% 4.50% 0.58% 0.00% 2.24% 0.29%
Middle Atlantic:New Jersey 1.00% 2.49% 4.02% 3.04% 1.09% 0.00% 2.56% 0.57%New York 0.58% 2.34% 4.97% 2.41% 0.71% 0.38% 2.56% 0.36%Pennsylvania 0.63% 2.33% 6.19% 2.22% 0.66% 0.79% 2.58% 0.67%
East North Central:Illinois 2.19% 3.58% 3.41% 4.06% 1.73% 4.64% 2.78% 3.23%Indiana 0.89% 3.60% 8.26% 2.66% 0.77% 0.00% 3.51% 0.46%Michigan 1.74% 5.06% 6.60% 4.96% 3.78% 1.41% 3.92% 1.84%Ohio 0.64% 1.14% 3.50% 5.23% 1.24% 0.00% 1.67% 0.46%Wisconsin 0.93% 4.21% 8.40% 2.37% 4.99% 0.00% 2.97% 1.34%
West North Central:Iowa 0.85% 2.96% 7.40% 3.66% 1.35% 0.06% 3.59% 0.46%Kansas 1.58% 3.93% 5.68% 4.82% 3.59% 0.50% 4.05% 1.14%Minnesota 1.43% 4.24% 8.65% 5.95% 3.31% 0.85% 3.94% 1.36%Missouri 1.45% 4.07% 6.00% 5.72% 0.00% 0.11% 2.72% 0.92%Nebraska 1.62% 2.28% 5.49% 5.30% 2.74% 0.00% 3.51% 0.75%North Dakota 0.99% 4.18% 4.88% 2.07% 1.13% 0.00% 2.65% 0.45%South Dakota 2.27% 2.12% 7.62% 9.55% 3.92% 0.00% 3.51% 1.95%
South Atlantic:Delaware 1.50% 5.52% 9.25% 4.16% 3.85% 0.05% 3.88% 0.87%District of Columbia 1.26% 4.25% 7.65% 4.10% 0.40% 0.27% 2.79% 0.76%Florida 0.97% 2.93% 5.75% 3.12% 1.77% 0.47% 2.81% 0.52%Georgia 1.52% 3.12% 10.19% 4.41% 4.44% 0.00% 2.99% 1.41%Maryland 2.03% 4.11% 5.82% 4.26% 0.00% 1.37% 3.55% 1.32%North Carolina 1.19% 4.25% 7.94% 4.49% 0.65% 0.00% 3.71% 0.34%South Carolina 1.01% 5.29% 7.60% 5.40% 2.07% 0.02% 2.29% 0.92%Virginia 1.02% 3.98% 4.18% 3.63% 0.00% 0.00% 2.71% 0.64%West Virginia 2.18% 4.09% 5.65% 5.58% 5.12% 0.00% 1.74% 2.59%
East South Central:Alabama 1.47% 3.54% 5.20% 2.89% 0.13% 1.74% 2.49% 1.18%Kentucky 1.06% 3.93% 7.57% 5.47% 1.78% 0.07% 3.74% 0.69%Mississippi 1.49% 4.09% 4.93% 6.25% 0.85% 1.10% 3.80% 0.87%Tennessee 1.27% 4.69% 8.12% 6.40% 2.72% 0.16% 4.39% 0.90%
West South Central:Arkansas 1.09% 3.40% 7.15% 5.93% 4.05% 0.60% 2.76% 0.98%Louisiana 1.31% 2.76% 6.29% 3.35% 3.27% 0.32% 3.16% 1.17%Oklahoma 1.32% 4.46% 7.65% 6.33% 7.01% 0.36% 1.58% 1.59%Texas 1.09% 2.21% 4.56% 3.43% 1.51% 0.21% 2.56% 0.61%
Mountain:Arizona 1.36% 3.94% 5.45% 8.01% 0.94% 0.14% 3.11% 1.30%Colorado 1.30% 3.56% 8.56% 4.90% 4.17% 0.00% 3.67% 0.75%Idaho 2.05% 3.47% 9.47% 6.82% 6.97% 0.00% 4.29% 0.98%Montana 1.98% 3.66% 7.45% 5.82% 2.95% 1.04% 2.69% 2.16%Nevada 2.32% 4.45% 9.47% 7.43% 3.83% 0.79% 4.14% 1.65%New Mexico 1.59% 3.84% 5.95% 5.97% 1.54% 0.51% 3.20% 1.31%Utah 1.27% 6.54% 8.95% 6.27% 2.45% 0.26% 2.72% 0.91%Wyoming 2.40% 4.31% 7.28% 6.00% 1.63% 0.22% 3.67% 0.73%
Pacific:Alaska 1.60% 3.38% 6.72% 4.92% 0.84% 0.94% 3.83% 0.65%California 1.47% 2.45% 4.60% 2.80% 4.66% 2.00% 1.77% 1.83%Hawaii 0.57% 3.83% 2.96% 0.07% 0.05% 0.00% 2.07% 0.02%Oregon 1.00% 4.12% 5.14% 4.37% 0.90% 0.00% 3.37% 1.09%Washington 1.48% 2.69% 7.43% 4.36% 0.00% 0.56% 3.25% 0.63%
Source: Agency for Healthcare Research and Quality, Center for Financing, Access and Cost Trends. 2008 Medical Expenditure PanelSurvey-Insurance Component.Note: Definitions and descriptions of the methods used for this survey can be found in the Technical Appendix.
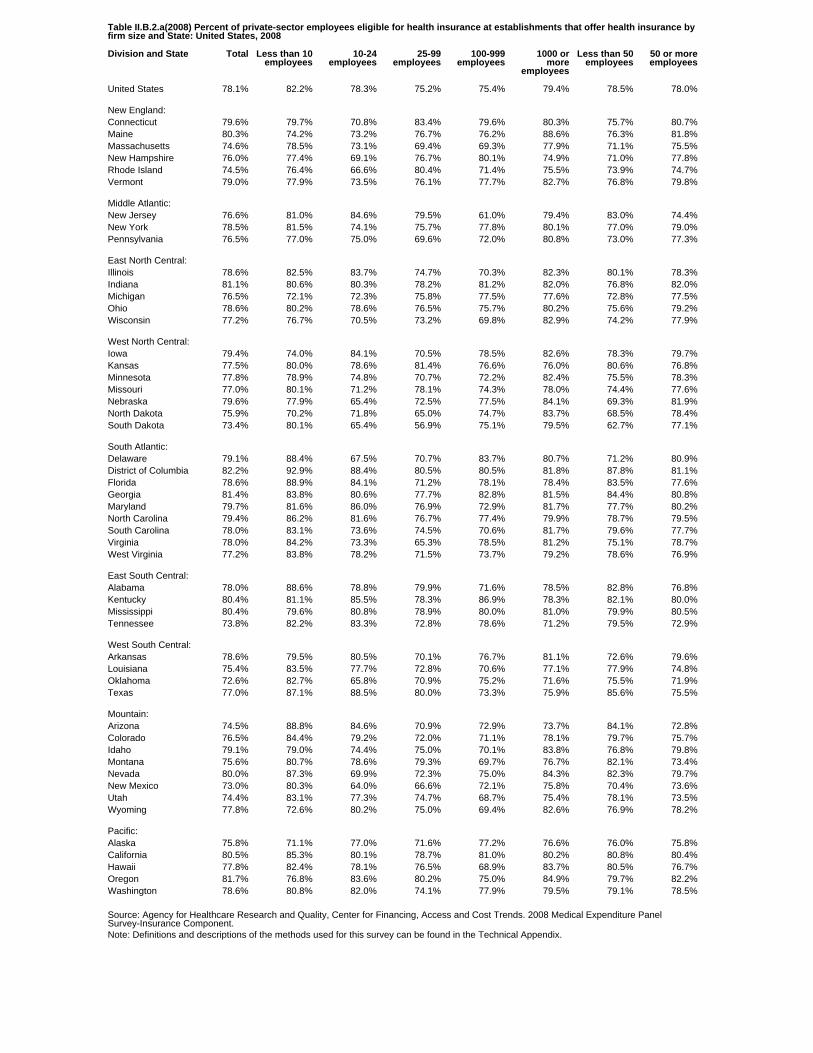
Table II.B.2.a(2008) Percent of private-sector employees eligible for health insurance at establishments that offer health insurance byfirm size and State: United States, 2008
Division and State Total Less than 10employees
10-24employees
25-99employees
100-999employees
1000 ormore
employees
Less than 50employees
50 or moreemployees
United States 78.1% 82.2% 78.3% 75.2% 75.4% 79.4% 78.5% 78.0%
New England:Connecticut 79.6% 79.7% 70.8% 83.4% 79.6% 80.3% 75.7% 80.7%Maine 80.3% 74.2% 73.2% 76.7% 76.2% 88.6% 76.3% 81.8%Massachusetts 74.6% 78.5% 73.1% 69.4% 69.3% 77.9% 71.1% 75.5%New Hampshire 76.0% 77.4% 69.1% 76.7% 80.1% 74.9% 71.0% 77.8%Rhode Island 74.5% 76.4% 66.6% 80.4% 71.4% 75.5% 73.9% 74.7%Vermont 79.0% 77.9% 73.5% 76.1% 77.7% 82.7% 76.8% 79.8%
Middle Atlantic:New Jersey 76.6% 81.0% 84.6% 79.5% 61.0% 79.4% 83.0% 74.4%New York 78.5% 81.5% 74.1% 75.7% 77.8% 80.1% 77.0% 79.0%Pennsylvania 76.5% 77.0% 75.0% 69.6% 72.0% 80.8% 73.0% 77.3%
East North Central:Illinois 78.6% 82.5% 83.7% 74.7% 70.3% 82.3% 80.1% 78.3%Indiana 81.1% 80.6% 80.3% 78.2% 81.2% 82.0% 76.8% 82.0%Michigan 76.5% 72.1% 72.3% 75.8% 77.5% 77.6% 72.8% 77.5%Ohio 78.6% 80.2% 78.6% 76.5% 75.7% 80.2% 75.6% 79.2%Wisconsin 77.2% 76.7% 70.5% 73.2% 69.8% 82.9% 74.2% 77.9%
West North Central:Iowa 79.4% 74.0% 84.1% 70.5% 78.5% 82.6% 78.3% 79.7%Kansas 77.5% 80.0% 78.6% 81.4% 76.6% 76.0% 80.6% 76.8%Minnesota 77.8% 78.9% 74.8% 70.7% 72.2% 82.4% 75.5% 78.3%Missouri 77.0% 80.1% 71.2% 78.1% 74.3% 78.0% 74.4% 77.6%Nebraska 79.6% 77.9% 65.4% 72.5% 77.5% 84.1% 69.3% 81.9%North Dakota 75.9% 70.2% 71.8% 65.0% 74.7% 83.7% 68.5% 78.4%South Dakota 73.4% 80.1% 65.4% 56.9% 75.1% 79.5% 62.7% 77.1%
South Atlantic:Delaware 79.1% 88.4% 67.5% 70.7% 83.7% 80.7% 71.2% 80.9%District of Columbia 82.2% 92.9% 88.4% 80.5% 80.5% 81.8% 87.8% 81.1%Florida 78.6% 88.9% 84.1% 71.2% 78.1% 78.4% 83.5% 77.6%Georgia 81.4% 83.8% 80.6% 77.7% 82.8% 81.5% 84.4% 80.8%Maryland 79.7% 81.6% 86.0% 76.9% 72.9% 81.7% 77.7% 80.2%North Carolina 79.4% 86.2% 81.6% 76.7% 77.4% 79.9% 78.7% 79.5%South Carolina 78.0% 83.1% 73.6% 74.5% 70.6% 81.7% 79.6% 77.7%Virginia 78.0% 84.2% 73.3% 65.3% 78.5% 81.2% 75.1% 78.7%West Virginia 77.2% 83.8% 78.2% 71.5% 73.7% 79.2% 78.6% 76.9%
East South Central:Alabama 78.0% 88.6% 78.8% 79.9% 71.6% 78.5% 82.8% 76.8%Kentucky 80.4% 81.1% 85.5% 78.3% 86.9% 78.3% 82.1% 80.0%Mississippi 80.4% 79.6% 80.8% 78.9% 80.0% 81.0% 79.9% 80.5%Tennessee 73.8% 82.2% 83.3% 72.8% 78.6% 71.2% 79.5% 72.9%
West South Central:Arkansas 78.6% 79.5% 80.5% 70.1% 76.7% 81.1% 72.6% 79.6%Louisiana 75.4% 83.5% 77.7% 72.8% 70.6% 77.1% 77.9% 74.8%Oklahoma 72.6% 82.7% 65.8% 70.9% 75.2% 71.6% 75.5% 71.9%Texas 77.0% 87.1% 88.5% 80.0% 73.3% 75.9% 85.6% 75.5%
Mountain:Arizona 74.5% 88.8% 84.6% 70.9% 72.9% 73.7% 84.1% 72.8%Colorado 76.5% 84.4% 79.2% 72.0% 71.1% 78.1% 79.7% 75.7%Idaho 79.1% 79.0% 74.4% 75.0% 70.1% 83.8% 76.8% 79.8%Montana 75.6% 80.7% 78.6% 79.3% 69.7% 76.7% 82.1% 73.4%Nevada 80.0% 87.3% 69.9% 72.3% 75.0% 84.3% 82.3% 79.7%New Mexico 73.0% 80.3% 64.0% 66.6% 72.1% 75.8% 70.4% 73.6%Utah 74.4% 83.1% 77.3% 74.7% 68.7% 75.4% 78.1% 73.5%Wyoming 77.8% 72.6% 80.2% 75.0% 69.4% 82.6% 76.9% 78.2%
Pacific:Alaska 75.8% 71.1% 77.0% 71.6% 77.2% 76.6% 76.0% 75.8%California 80.5% 85.3% 80.1% 78.7% 81.0% 80.2% 80.8% 80.4%Hawaii 77.8% 82.4% 78.1% 76.5% 68.9% 83.7% 80.5% 76.7%Oregon 81.7% 76.8% 83.6% 80.2% 75.0% 84.9% 79.7% 82.2%Washington 78.6% 80.8% 82.0% 74.1% 77.9% 79.5% 79.1% 78.5%
Source: Agency for Healthcare Research and Quality, Center for Financing, Access and Cost Trends. 2008 Medical Expenditure PanelSurvey-Insurance Component.Note: Definitions and descriptions of the methods used for this survey can be found in the Technical Appendix.
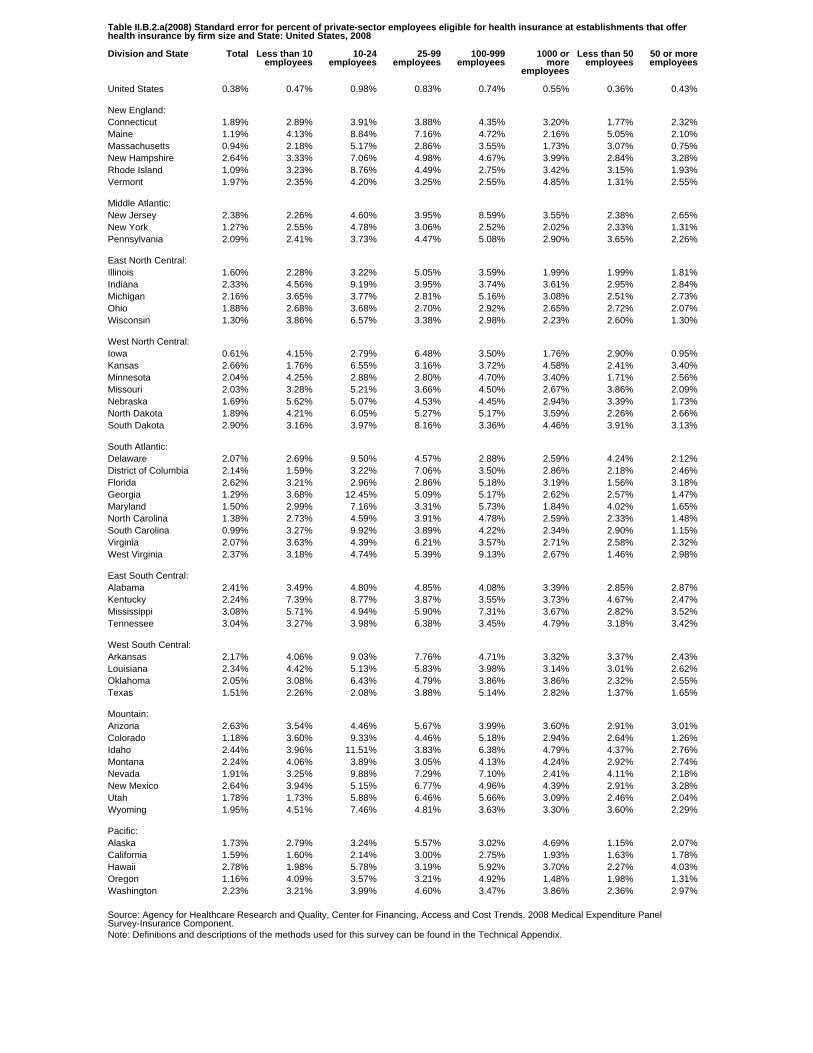
Table II.B.2.a(2008) Standard error for percent of private-sector employees eligible for health insurance at establishments that offerhealth insurance by firm size and State: United States, 2008
Division and State Total Less than 10employees
10-24employees
25-99employees
100-999employees
1000 ormore
employees
Less than 50employees
50 or moreemployees
United States 0.38% 0.47% 0.98% 0.83% 0.74% 0.55% 0.36% 0.43%
New England:Connecticut 1.89% 2.89% 3.91% 3.88% 4.35% 3.20% 1.77% 2.32%Maine 1.19% 4.13% 8.84% 7.16% 4.72% 2.16% 5.05% 2.10%Massachusetts 0.94% 2.18% 5.17% 2.86% 3.55% 1.73% 3.07% 0.75%New Hampshire 2.64% 3.33% 7.06% 4.98% 4.67% 3.99% 2.84% 3.28%Rhode Island 1.09% 3.23% 8.76% 4.49% 2.75% 3.42% 3.15% 1.93%Vermont 1.97% 2.35% 4.20% 3.25% 2.55% 4.85% 1.31% 2.55%
Middle Atlantic:New Jersey 2.38% 2.26% 4.60% 3.95% 8.59% 3.55% 2.38% 2.65%New York 1.27% 2.55% 4.78% 3.06% 2.52% 2.02% 2.33% 1.31%Pennsylvania 2.09% 2.41% 3.73% 4.47% 5.08% 2.90% 3.65% 2.26%
East North Central:Illinois 1.60% 2.28% 3.22% 5.05% 3.59% 1.99% 1.99% 1.81%Indiana 2.33% 4.56% 9.19% 3.95% 3.74% 3.61% 2.95% 2.84%Michigan 2.16% 3.65% 3.77% 2.81% 5.16% 3.08% 2.51% 2.73%Ohio 1.88% 2.68% 3.68% 2.70% 2.92% 2.65% 2.72% 2.07%Wisconsin 1.30% 3.86% 6.57% 3.38% 2.98% 2.23% 2.60% 1.30%
West North Central:Iowa 0.61% 4.15% 2.79% 6.48% 3.50% 1.76% 2.90% 0.95%Kansas 2.66% 1.76% 6.55% 3.16% 3.72% 4.58% 2.41% 3.40%Minnesota 2.04% 4.25% 2.88% 2.80% 4.70% 3.40% 1.71% 2.56%Missouri 2.03% 3.28% 5.21% 3.66% 4.50% 2.67% 3.86% 2.09%Nebraska 1.69% 5.62% 5.07% 4.53% 4.45% 2.94% 3.39% 1.73%North Dakota 1.89% 4.21% 6.05% 5.27% 5.17% 3.59% 2.26% 2.66%South Dakota 2.90% 3.16% 3.97% 8.16% 3.36% 4.46% 3.91% 3.13%
South Atlantic:Delaware 2.07% 2.69% 9.50% 4.57% 2.88% 2.59% 4.24% 2.12%District of Columbia 2.14% 1.59% 3.22% 7.06% 3.50% 2.86% 2.18% 2.46%Florida 2.62% 3.21% 2.96% 2.86% 5.18% 3.19% 1.56% 3.18%Georgia 1.29% 3.68% 12.45% 5.09% 5.17% 2.62% 2.57% 1.47%Maryland 1.50% 2.99% 7.16% 3.31% 5.73% 1.84% 4.02% 1.65%North Carolina 1.38% 2.73% 4.59% 3.91% 4.78% 2.59% 2.33% 1.48%South Carolina 0.99% 3.27% 9.92% 3.89% 4.22% 2.34% 2.90% 1.15%Virginia 2.07% 3.63% 4.39% 6.21% 3.57% 2.71% 2.58% 2.32%West Virginia 2.37% 3.18% 4.74% 5.39% 9.13% 2.67% 1.46% 2.98%
East South Central:Alabama 2.41% 3.49% 4.80% 4.85% 4.08% 3.39% 2.85% 2.87%Kentucky 2.24% 7.39% 8.77% 3.87% 3.55% 3.73% 4.67% 2.47%Mississippi 3.08% 5.71% 4.94% 5.90% 7.31% 3.67% 2.82% 3.52%Tennessee 3.04% 3.27% 3.98% 6.38% 3.45% 4.79% 3.18% 3.42%
West South Central:Arkansas 2.17% 4.06% 9.03% 7.76% 4.71% 3.32% 3.37% 2.43%Louisiana 2.34% 4.42% 5.13% 5.83% 3.98% 3.14% 3.01% 2.62%Oklahoma 2.05% 3.08% 6.43% 4.79% 3.86% 3.86% 2.32% 2.55%Texas 1.51% 2.26% 2.08% 3.88% 5.14% 2.82% 1.37% 1.65%
Mountain:Arizona 2.63% 3.54% 4.46% 5.67% 3.99% 3.60% 2.91% 3.01%Colorado 1.18% 3.60% 9.33% 4.46% 5.18% 2.94% 2.64% 1.26%Idaho 2.44% 3.96% 11.51% 3.83% 6.38% 4.79% 4.37% 2.76%Montana 2.24% 4.06% 3.89% 3.05% 4.13% 4.24% 2.92% 2.74%Nevada 1.91% 3.25% 9.88% 7.29% 7.10% 2.41% 4.11% 2.18%New Mexico 2.64% 3.94% 5.15% 6.77% 4.96% 4.39% 2.91% 3.28%Utah 1.78% 1.73% 5.88% 6.46% 5.66% 3.09% 2.46% 2.04%Wyoming 1.95% 4.51% 7.46% 4.81% 3.63% 3.30% 3.60% 2.29%
Pacific:Alaska 1.73% 2.79% 3.24% 5.57% 3.02% 4.69% 1.15% 2.07%California 1.59% 1.60% 2.14% 3.00% 2.75% 1.93% 1.63% 1.78%Hawaii 2.78% 1.98% 5.78% 3.19% 5.92% 3.70% 2.27% 4.03%Oregon 1.16% 4.09% 3.57% 3.21% 4.92% 1.48% 1.98% 1.31%Washington 2.23% 3.21% 3.99% 4.60% 3.47% 3.86% 2.36% 2.97%
Source: Agency for Healthcare Research and Quality, Center for Financing, Access and Cost Trends. 2008 Medical Expenditure PanelSurvey-Insurance Component.Note: Definitions and descriptions of the methods used for this survey can be found in the Technical Appendix.
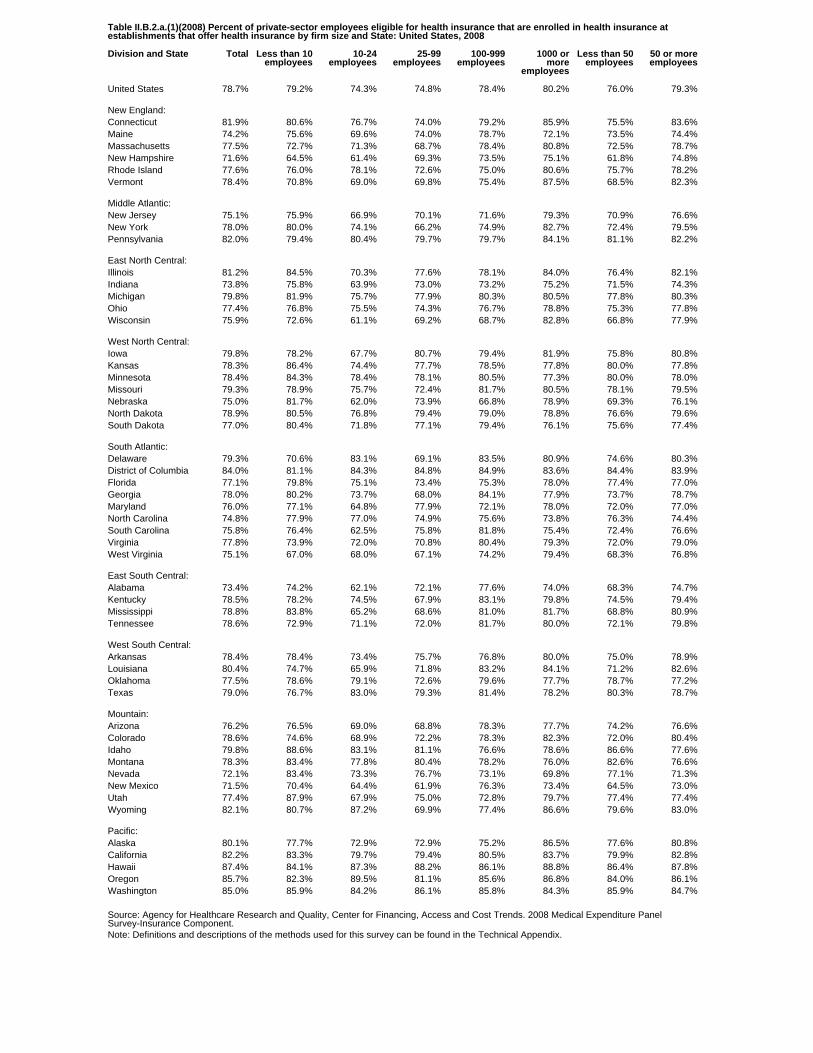
Table II.B.2.a.(1)(2008) Percent of private-sector employees eligible for health insurance that are enrolled in health insurance atestablishments that offer health insurance by firm size and State: United States, 2008
Division and State Total Less than 10employees
10-24employees
25-99employees
100-999employees
1000 ormore
employees
Less than 50employees
50 or moreemployees
United States 78.7% 79.2% 74.3% 74.8% 78.4% 80.2% 76.0% 79.3%
New England:Connecticut 81.9% 80.6% 76.7% 74.0% 79.2% 85.9% 75.5% 83.6%Maine 74.2% 75.6% 69.6% 74.0% 78.7% 72.1% 73.5% 74.4%Massachusetts 77.5% 72.7% 71.3% 68.7% 78.4% 80.8% 72.5% 78.7%New Hampshire 71.6% 64.5% 61.4% 69.3% 73.5% 75.1% 61.8% 74.8%Rhode Island 77.6% 76.0% 78.1% 72.6% 75.0% 80.6% 75.7% 78.2%Vermont 78.4% 70.8% 69.0% 69.8% 75.4% 87.5% 68.5% 82.3%
Middle Atlantic:New Jersey 75.1% 75.9% 66.9% 70.1% 71.6% 79.3% 70.9% 76.6%New York 78.0% 80.0% 74.1% 66.2% 74.9% 82.7% 72.4% 79.5%Pennsylvania 82.0% 79.4% 80.4% 79.7% 79.7% 84.1% 81.1% 82.2%
East North Central:Illinois 81.2% 84.5% 70.3% 77.6% 78.1% 84.0% 76.4% 82.1%Indiana 73.8% 75.8% 63.9% 73.0% 73.2% 75.2% 71.5% 74.3%Michigan 79.8% 81.9% 75.7% 77.9% 80.3% 80.5% 77.8% 80.3%Ohio 77.4% 76.8% 75.5% 74.3% 76.7% 78.8% 75.3% 77.8%Wisconsin 75.9% 72.6% 61.1% 69.2% 68.7% 82.8% 66.8% 77.9%
West North Central:Iowa 79.8% 78.2% 67.7% 80.7% 79.4% 81.9% 75.8% 80.8%Kansas 78.3% 86.4% 74.4% 77.7% 78.5% 77.8% 80.0% 77.8%Minnesota 78.4% 84.3% 78.4% 78.1% 80.5% 77.3% 80.0% 78.0%Missouri 79.3% 78.9% 75.7% 72.4% 81.7% 80.5% 78.1% 79.5%Nebraska 75.0% 81.7% 62.0% 73.9% 66.8% 78.9% 69.3% 76.1%North Dakota 78.9% 80.5% 76.8% 79.4% 79.0% 78.8% 76.6% 79.6%South Dakota 77.0% 80.4% 71.8% 77.1% 79.4% 76.1% 75.6% 77.4%
South Atlantic:Delaware 79.3% 70.6% 83.1% 69.1% 83.5% 80.9% 74.6% 80.3%District of Columbia 84.0% 81.1% 84.3% 84.8% 84.9% 83.6% 84.4% 83.9%Florida 77.1% 79.8% 75.1% 73.4% 75.3% 78.0% 77.4% 77.0%Georgia 78.0% 80.2% 73.7% 68.0% 84.1% 77.9% 73.7% 78.7%Maryland 76.0% 77.1% 64.8% 77.9% 72.1% 78.0% 72.0% 77.0%North Carolina 74.8% 77.9% 77.0% 74.9% 75.6% 73.8% 76.3% 74.4%South Carolina 75.8% 76.4% 62.5% 75.8% 81.8% 75.4% 72.4% 76.6%Virginia 77.8% 73.9% 72.0% 70.8% 80.4% 79.3% 72.0% 79.0%West Virginia 75.1% 67.0% 68.0% 67.1% 74.2% 79.4% 68.3% 76.8%
East South Central:Alabama 73.4% 74.2% 62.1% 72.1% 77.6% 74.0% 68.3% 74.7%Kentucky 78.5% 78.2% 74.5% 67.9% 83.1% 79.8% 74.5% 79.4%Mississippi 78.8% 83.8% 65.2% 68.6% 81.0% 81.7% 68.8% 80.9%Tennessee 78.6% 72.9% 71.1% 72.0% 81.7% 80.0% 72.1% 79.8%
West South Central:Arkansas 78.4% 78.4% 73.4% 75.7% 76.8% 80.0% 75.0% 78.9%Louisiana 80.4% 74.7% 65.9% 71.8% 83.2% 84.1% 71.2% 82.6%Oklahoma 77.5% 78.6% 79.1% 72.6% 79.6% 77.7% 78.7% 77.2%Texas 79.0% 76.7% 83.0% 79.3% 81.4% 78.2% 80.3% 78.7%
Mountain:Arizona 76.2% 76.5% 69.0% 68.8% 78.3% 77.7% 74.2% 76.6%Colorado 78.6% 74.6% 68.9% 72.2% 78.3% 82.3% 72.0% 80.4%Idaho 79.8% 88.6% 83.1% 81.1% 76.6% 78.6% 86.6% 77.6%Montana 78.3% 83.4% 77.8% 80.4% 78.2% 76.0% 82.6% 76.6%Nevada 72.1% 83.4% 73.3% 76.7% 73.1% 69.8% 77.1% 71.3%New Mexico 71.5% 70.4% 64.4% 61.9% 76.3% 73.4% 64.5% 73.0%Utah 77.4% 87.9% 67.9% 75.0% 72.8% 79.7% 77.4% 77.4%Wyoming 82.1% 80.7% 87.2% 69.9% 77.4% 86.6% 79.6% 83.0%
Pacific:Alaska 80.1% 77.7% 72.9% 72.9% 75.2% 86.5% 77.6% 80.8%California 82.2% 83.3% 79.7% 79.4% 80.5% 83.7% 79.9% 82.8%Hawaii 87.4% 84.1% 87.3% 88.2% 86.1% 88.8% 86.4% 87.8%Oregon 85.7% 82.3% 89.5% 81.1% 85.6% 86.8% 84.0% 86.1%Washington 85.0% 85.9% 84.2% 86.1% 85.8% 84.3% 85.9% 84.7%
Source: Agency for Healthcare Research and Quality, Center for Financing, Access and Cost Trends. 2008 Medical Expenditure PanelSurvey-Insurance Component.Note: Definitions and descriptions of the methods used for this survey can be found in the Technical Appendix.

Table II.B.2.a.(1)(2008) Standard error for percent of private-sector employees eligible for health insurance that are enrolled in healthinsurance at establishments that offer health insurance by firm size and State: United States, 2008
Division and State Total Less than 10employees
10-24employees
25-99employees
100-999employees
1000 ormore
employees
Less than 50employees
50 or moreemployees
United States 0.34% 0.51% 0.44% 0.37% 0.25% 0.63% 0.28% 0.40%
New England:Connecticut 1.16% 2.29% 3.48% 3.66% 2.60% 2.05% 2.26% 1.41%Maine 2.14% 3.21% 7.85% 6.14% 3.25% 3.18% 3.36% 2.56%Massachusetts 1.60% 3.53% 4.04% 3.84% 3.39% 3.02% 2.09% 2.12%New Hampshire 1.83% 3.61% 4.65% 3.33% 3.04% 2.75% 2.42% 2.00%Rhode Island 1.31% 2.63% 4.80% 4.04% 2.04% 2.83% 2.27% 1.46%Vermont 1.65% 2.43% 4.84% 4.68% 2.82% 2.02% 3.36% 1.48%
Middle Atlantic:New Jersey 1.65% 3.65% 5.46% 4.63% 5.90% 2.71% 2.70% 2.34%New York 1.15% 1.67% 3.26% 3.02% 1.64% 2.15% 1.94% 1.35%Pennsylvania 1.47% 3.46% 2.36% 2.69% 1.67% 1.91% 1.89% 1.57%
East North Central:Illinois 1.40% 2.88% 3.80% 2.52% 2.50% 1.60% 2.79% 1.41%Indiana 1.01% 3.39% 9.13% 4.57% 2.72% 2.23% 2.68% 0.98%Michigan 1.22% 2.68% 3.45% 1.69% 2.38% 2.56% 1.27% 1.76%Ohio 1.32% 3.22% 3.79% 2.19% 2.96% 1.72% 2.69% 1.54%Wisconsin 0.76% 4.57% 6.46% 1.75% 1.88% 1.02% 2.47% 0.97%
West North Central:Iowa 0.62% 3.53% 4.26% 3.82% 2.36% 1.72% 3.24% 0.86%Kansas 1.09% 2.64% 2.79% 3.18% 3.87% 2.31% 2.65% 1.15%Minnesota 2.16% 2.39% 3.99% 2.63% 4.23% 2.35% 2.48% 2.29%Missouri 1.73% 3.37% 4.89% 4.81% 3.43% 2.67% 2.38% 2.14%Nebraska 1.04% 3.99% 4.40% 4.20% 4.02% 1.44% 3.85% 1.16%North Dakota 1.43% 3.49% 3.64% 4.13% 3.88% 2.20% 2.44% 1.85%South Dakota 1.92% 4.26% 4.82% 8.39% 3.23% 5.21% 2.68% 2.80%
South Atlantic:Delaware 1.78% 5.39% 9.03% 6.10% 3.43% 2.33% 2.93% 1.92%District of Columbia 1.69% 3.45% 3.09% 2.56% 1.85% 2.08% 1.61% 1.76%Florida 1.64% 2.88% 4.30% 5.01% 2.27% 2.33% 3.11% 1.66%Georgia 1.15% 4.39% 11.34% 4.96% 3.53% 1.44% 1.82% 1.15%Maryland 1.40% 2.21% 3.69% 2.67% 3.30% 2.42% 2.47% 1.77%North Carolina 1.37% 4.10% 5.13% 3.98% 5.06% 3.21% 2.24% 1.79%South Carolina 1.92% 4.27% 8.63% 5.04% 4.45% 2.43% 3.20% 2.47%Virginia 0.96% 2.97% 5.56% 6.71% 3.29% 1.97% 2.71% 1.38%West Virginia 1.60% 5.91% 6.29% 5.05% 3.98% 1.08% 3.57% 1.42%
East South Central:Alabama 0.89% 3.94% 1.88% 4.37% 3.56% 1.79% 1.74% 1.03%Kentucky 0.99% 2.98% 4.81% 3.62% 3.47% 1.25% 2.87% 0.98%Mississippi 1.75% 4.00% 8.08% 5.73% 4.40% 2.35% 3.42% 2.23%Tennessee 2.08% 5.89% 4.90% 4.55% 2.75% 3.14% 3.41% 2.17%
West South Central:Arkansas 1.87% 4.98% 9.40% 4.41% 1.85% 2.74% 3.68% 2.07%Louisiana 1.48% 5.72% 6.85% 5.34% 2.81% 1.14% 3.75% 1.37%Oklahoma 1.88% 2.87% 6.72% 4.16% 4.48% 3.93% 2.56% 2.59%Texas 1.85% 4.83% 3.91% 1.45% 2.34% 2.90% 1.88% 2.31%
Mountain:Arizona 2.37% 5.01% 3.05% 5.57% 3.43% 3.62% 2.41% 2.66%Colorado 1.71% 3.23% 10.37% 4.44% 3.26% 2.20% 4.23% 1.81%Idaho 2.71% 2.38% 9.16% 3.91% 4.52% 4.58% 1.37% 3.48%Montana 2.43% 4.50% 4.07% 4.39% 4.08% 5.45% 1.96% 3.57%Nevada 2.27% 3.59% 9.55% 4.66% 4.40% 3.65% 2.92% 2.52%New Mexico 2.82% 3.75% 4.49% 4.89% 4.01% 3.82% 3.03% 3.41%Utah 2.42% 4.70% 5.37% 3.90% 5.70% 4.15% 3.22% 3.02%Wyoming 1.71% 4.36% 6.26% 3.70% 3.54% 3.25% 4.72% 1.88%
Pacific:Alaska 2.27% 4.25% 6.78% 4.01% 3.34% 3.23% 2.24% 3.27%California 0.61% 1.99% 2.52% 1.52% 1.41% 1.14% 1.70% 0.81%Hawaii 0.90% 1.83% 2.35% 2.84% 2.87% 1.54% 1.59% 1.09%Oregon 1.56% 3.25% 3.43% 3.45% 4.43% 1.99% 2.30% 1.81%Washington 2.02% 3.35% 3.20% 3.78% 3.15% 2.96% 1.93% 2.52%
Source: Agency for Healthcare Research and Quality, Center for Financing, Access and Cost Trends. 2008 Medical Expenditure PanelSurvey-Insurance Component.Note: Definitions and descriptions of the methods used for this survey can be found in the Technical Appendix.
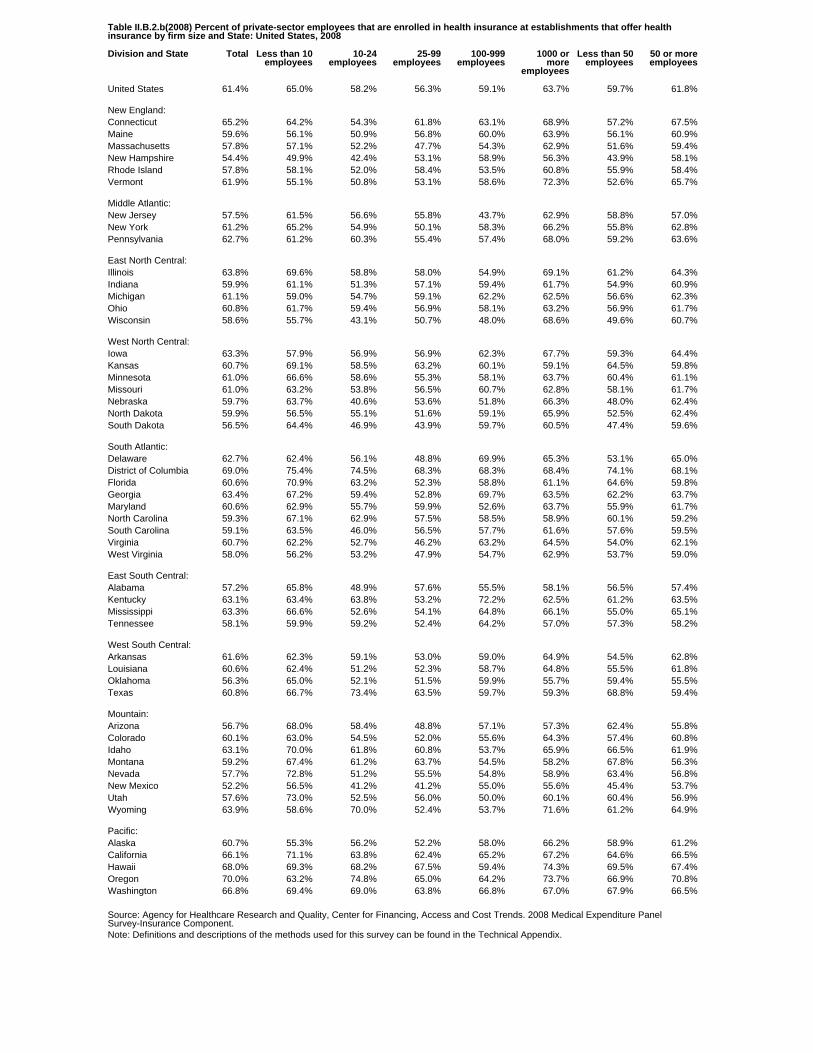
Table II.B.2.b(2008) Percent of private-sector employees that are enrolled in health insurance at establishments that offer healthinsurance by firm size and State: United States, 2008
Division and State Total Less than 10employees
10-24employees
25-99employees
100-999employees
1000 ormore
employees
Less than 50employees
50 or moreemployees
United States 61.4% 65.0% 58.2% 56.3% 59.1% 63.7% 59.7% 61.8%
New England:Connecticut 65.2% 64.2% 54.3% 61.8% 63.1% 68.9% 57.2% 67.5%Maine 59.6% 56.1% 50.9% 56.8% 60.0% 63.9% 56.1% 60.9%Massachusetts 57.8% 57.1% 52.2% 47.7% 54.3% 62.9% 51.6% 59.4%New Hampshire 54.4% 49.9% 42.4% 53.1% 58.9% 56.3% 43.9% 58.1%Rhode Island 57.8% 58.1% 52.0% 58.4% 53.5% 60.8% 55.9% 58.4%Vermont 61.9% 55.1% 50.8% 53.1% 58.6% 72.3% 52.6% 65.7%
Middle Atlantic:New Jersey 57.5% 61.5% 56.6% 55.8% 43.7% 62.9% 58.8% 57.0%New York 61.2% 65.2% 54.9% 50.1% 58.3% 66.2% 55.8% 62.8%Pennsylvania 62.7% 61.2% 60.3% 55.4% 57.4% 68.0% 59.2% 63.6%
East North Central:Illinois 63.8% 69.6% 58.8% 58.0% 54.9% 69.1% 61.2% 64.3%Indiana 59.9% 61.1% 51.3% 57.1% 59.4% 61.7% 54.9% 60.9%Michigan 61.1% 59.0% 54.7% 59.1% 62.2% 62.5% 56.6% 62.3%Ohio 60.8% 61.7% 59.4% 56.9% 58.1% 63.2% 56.9% 61.7%Wisconsin 58.6% 55.7% 43.1% 50.7% 48.0% 68.6% 49.6% 60.7%
West North Central:Iowa 63.3% 57.9% 56.9% 56.9% 62.3% 67.7% 59.3% 64.4%Kansas 60.7% 69.1% 58.5% 63.2% 60.1% 59.1% 64.5% 59.8%Minnesota 61.0% 66.6% 58.6% 55.3% 58.1% 63.7% 60.4% 61.1%Missouri 61.0% 63.2% 53.8% 56.5% 60.7% 62.8% 58.1% 61.7%Nebraska 59.7% 63.7% 40.6% 53.6% 51.8% 66.3% 48.0% 62.4%North Dakota 59.9% 56.5% 55.1% 51.6% 59.1% 65.9% 52.5% 62.4%South Dakota 56.5% 64.4% 46.9% 43.9% 59.7% 60.5% 47.4% 59.6%
South Atlantic:Delaware 62.7% 62.4% 56.1% 48.8% 69.9% 65.3% 53.1% 65.0%District of Columbia 69.0% 75.4% 74.5% 68.3% 68.3% 68.4% 74.1% 68.1%Florida 60.6% 70.9% 63.2% 52.3% 58.8% 61.1% 64.6% 59.8%Georgia 63.4% 67.2% 59.4% 52.8% 69.7% 63.5% 62.2% 63.7%Maryland 60.6% 62.9% 55.7% 59.9% 52.6% 63.7% 55.9% 61.7%North Carolina 59.3% 67.1% 62.9% 57.5% 58.5% 58.9% 60.1% 59.2%South Carolina 59.1% 63.5% 46.0% 56.5% 57.7% 61.6% 57.6% 59.5%Virginia 60.7% 62.2% 52.7% 46.2% 63.2% 64.5% 54.0% 62.1%West Virginia 58.0% 56.2% 53.2% 47.9% 54.7% 62.9% 53.7% 59.0%
East South Central:Alabama 57.2% 65.8% 48.9% 57.6% 55.5% 58.1% 56.5% 57.4%Kentucky 63.1% 63.4% 63.8% 53.2% 72.2% 62.5% 61.2% 63.5%Mississippi 63.3% 66.6% 52.6% 54.1% 64.8% 66.1% 55.0% 65.1%Tennessee 58.1% 59.9% 59.2% 52.4% 64.2% 57.0% 57.3% 58.2%
West South Central:Arkansas 61.6% 62.3% 59.1% 53.0% 59.0% 64.9% 54.5% 62.8%Louisiana 60.6% 62.4% 51.2% 52.3% 58.7% 64.8% 55.5% 61.8%Oklahoma 56.3% 65.0% 52.1% 51.5% 59.9% 55.7% 59.4% 55.5%Texas 60.8% 66.7% 73.4% 63.5% 59.7% 59.3% 68.8% 59.4%
Mountain:Arizona 56.7% 68.0% 58.4% 48.8% 57.1% 57.3% 62.4% 55.8%Colorado 60.1% 63.0% 54.5% 52.0% 55.6% 64.3% 57.4% 60.8%Idaho 63.1% 70.0% 61.8% 60.8% 53.7% 65.9% 66.5% 61.9%Montana 59.2% 67.4% 61.2% 63.7% 54.5% 58.2% 67.8% 56.3%Nevada 57.7% 72.8% 51.2% 55.5% 54.8% 58.9% 63.4% 56.8%New Mexico 52.2% 56.5% 41.2% 41.2% 55.0% 55.6% 45.4% 53.7%Utah 57.6% 73.0% 52.5% 56.0% 50.0% 60.1% 60.4% 56.9%Wyoming 63.9% 58.6% 70.0% 52.4% 53.7% 71.6% 61.2% 64.9%
Pacific:Alaska 60.7% 55.3% 56.2% 52.2% 58.0% 66.2% 58.9% 61.2%California 66.1% 71.1% 63.8% 62.4% 65.2% 67.2% 64.6% 66.5%Hawaii 68.0% 69.3% 68.2% 67.5% 59.4% 74.3% 69.5% 67.4%Oregon 70.0% 63.2% 74.8% 65.0% 64.2% 73.7% 66.9% 70.8%Washington 66.8% 69.4% 69.0% 63.8% 66.8% 67.0% 67.9% 66.5%
Source: Agency for Healthcare Research and Quality, Center for Financing, Access and Cost Trends. 2008 Medical Expenditure PanelSurvey-Insurance Component.Note: Definitions and descriptions of the methods used for this survey can be found in the Technical Appendix.
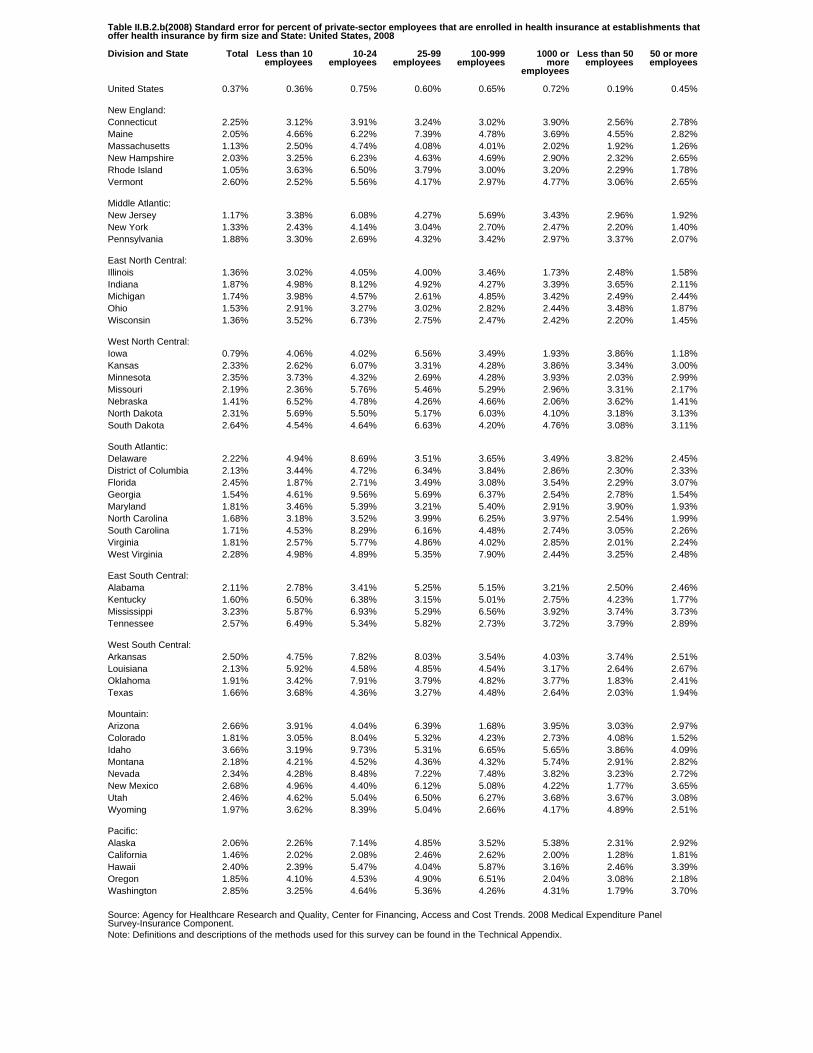
Table II.B.2.b(2008) Standard error for percent of private-sector employees that are enrolled in health insurance at establishments thatoffer health insurance by firm size and State: United States, 2008
Division and State Total Less than 10employees
10-24employees
25-99employees
100-999employees
1000 ormore
employees
Less than 50employees
50 or moreemployees
United States 0.37% 0.36% 0.75% 0.60% 0.65% 0.72% 0.19% 0.45%
New England:Connecticut 2.25% 3.12% 3.91% 3.24% 3.02% 3.90% 2.56% 2.78%Maine 2.05% 4.66% 6.22% 7.39% 4.78% 3.69% 4.55% 2.82%Massachusetts 1.13% 2.50% 4.74% 4.08% 4.01% 2.02% 1.92% 1.26%New Hampshire 2.03% 3.25% 6.23% 4.63% 4.69% 2.90% 2.32% 2.65%Rhode Island 1.05% 3.63% 6.50% 3.79% 3.00% 3.20% 2.29% 1.78%Vermont 2.60% 2.52% 5.56% 4.17% 2.97% 4.77% 3.06% 2.65%
Middle Atlantic:New Jersey 1.17% 3.38% 6.08% 4.27% 5.69% 3.43% 2.96% 1.92%New York 1.33% 2.43% 4.14% 3.04% 2.70% 2.47% 2.20% 1.40%Pennsylvania 1.88% 3.30% 2.69% 4.32% 3.42% 2.97% 3.37% 2.07%
East North Central:Illinois 1.36% 3.02% 4.05% 4.00% 3.46% 1.73% 2.48% 1.58%Indiana 1.87% 4.98% 8.12% 4.92% 4.27% 3.39% 3.65% 2.11%Michigan 1.74% 3.98% 4.57% 2.61% 4.85% 3.42% 2.49% 2.44%Ohio 1.53% 2.91% 3.27% 3.02% 2.82% 2.44% 3.48% 1.87%Wisconsin 1.36% 3.52% 6.73% 2.75% 2.47% 2.42% 2.20% 1.45%
West North Central:Iowa 0.79% 4.06% 4.02% 6.56% 3.49% 1.93% 3.86% 1.18%Kansas 2.33% 2.62% 6.07% 3.31% 4.28% 3.86% 3.34% 3.00%Minnesota 2.35% 3.73% 4.32% 2.69% 4.28% 3.93% 2.03% 2.99%Missouri 2.19% 2.36% 5.76% 5.46% 5.29% 2.96% 3.31% 2.17%Nebraska 1.41% 6.52% 4.78% 4.26% 4.66% 2.06% 3.62% 1.41%North Dakota 2.31% 5.69% 5.50% 5.17% 6.03% 4.10% 3.18% 3.13%South Dakota 2.64% 4.54% 4.64% 6.63% 4.20% 4.76% 3.08% 3.11%
South Atlantic:Delaware 2.22% 4.94% 8.69% 3.51% 3.65% 3.49% 3.82% 2.45%District of Columbia 2.13% 3.44% 4.72% 6.34% 3.84% 2.86% 2.30% 2.33%Florida 2.45% 1.87% 2.71% 3.49% 3.08% 3.54% 2.29% 3.07%Georgia 1.54% 4.61% 9.56% 5.69% 6.37% 2.54% 2.78% 1.54%Maryland 1.81% 3.46% 5.39% 3.21% 5.40% 2.91% 3.90% 1.93%North Carolina 1.68% 3.18% 3.52% 3.99% 6.25% 3.97% 2.54% 1.99%South Carolina 1.71% 4.53% 8.29% 6.16% 4.48% 2.74% 3.05% 2.26%Virginia 1.81% 2.57% 5.77% 4.86% 4.02% 2.85% 2.01% 2.24%West Virginia 2.28% 4.98% 4.89% 5.35% 7.90% 2.44% 3.25% 2.48%
East South Central:Alabama 2.11% 2.78% 3.41% 5.25% 5.15% 3.21% 2.50% 2.46%Kentucky 1.60% 6.50% 6.38% 3.15% 5.01% 2.75% 4.23% 1.77%Mississippi 3.23% 5.87% 6.93% 5.29% 6.56% 3.92% 3.74% 3.73%Tennessee 2.57% 6.49% 5.34% 5.82% 2.73% 3.72% 3.79% 2.89%
West South Central:Arkansas 2.50% 4.75% 7.82% 8.03% 3.54% 4.03% 3.74% 2.51%Louisiana 2.13% 5.92% 4.58% 4.85% 4.54% 3.17% 2.64% 2.67%Oklahoma 1.91% 3.42% 7.91% 3.79% 4.82% 3.77% 1.83% 2.41%Texas 1.66% 3.68% 4.36% 3.27% 4.48% 2.64% 2.03% 1.94%
Mountain:Arizona 2.66% 3.91% 4.04% 6.39% 1.68% 3.95% 3.03% 2.97%Colorado 1.81% 3.05% 8.04% 5.32% 4.23% 2.73% 4.08% 1.52%Idaho 3.66% 3.19% 9.73% 5.31% 6.65% 5.65% 3.86% 4.09%Montana 2.18% 4.21% 4.52% 4.36% 4.32% 5.74% 2.91% 2.82%Nevada 2.34% 4.28% 8.48% 7.22% 7.48% 3.82% 3.23% 2.72%New Mexico 2.68% 4.96% 4.40% 6.12% 5.08% 4.22% 1.77% 3.65%Utah 2.46% 4.62% 5.04% 6.50% 6.27% 3.68% 3.67% 3.08%Wyoming 1.97% 3.62% 8.39% 5.04% 2.66% 4.17% 4.89% 2.51%
Pacific:Alaska 2.06% 2.26% 7.14% 4.85% 3.52% 5.38% 2.31% 2.92%California 1.46% 2.02% 2.08% 2.46% 2.62% 2.00% 1.28% 1.81%Hawaii 2.40% 2.39% 5.47% 4.04% 5.87% 3.16% 2.46% 3.39%Oregon 1.85% 4.10% 4.53% 4.90% 6.51% 2.04% 3.08% 2.18%Washington 2.85% 3.25% 4.64% 5.36% 4.26% 4.31% 1.79% 3.70%
Source: Agency for Healthcare Research and Quality, Center for Financing, Access and Cost Trends. 2008 Medical Expenditure PanelSurvey-Insurance Component.Note: Definitions and descriptions of the methods used for this survey can be found in the Technical Appendix.
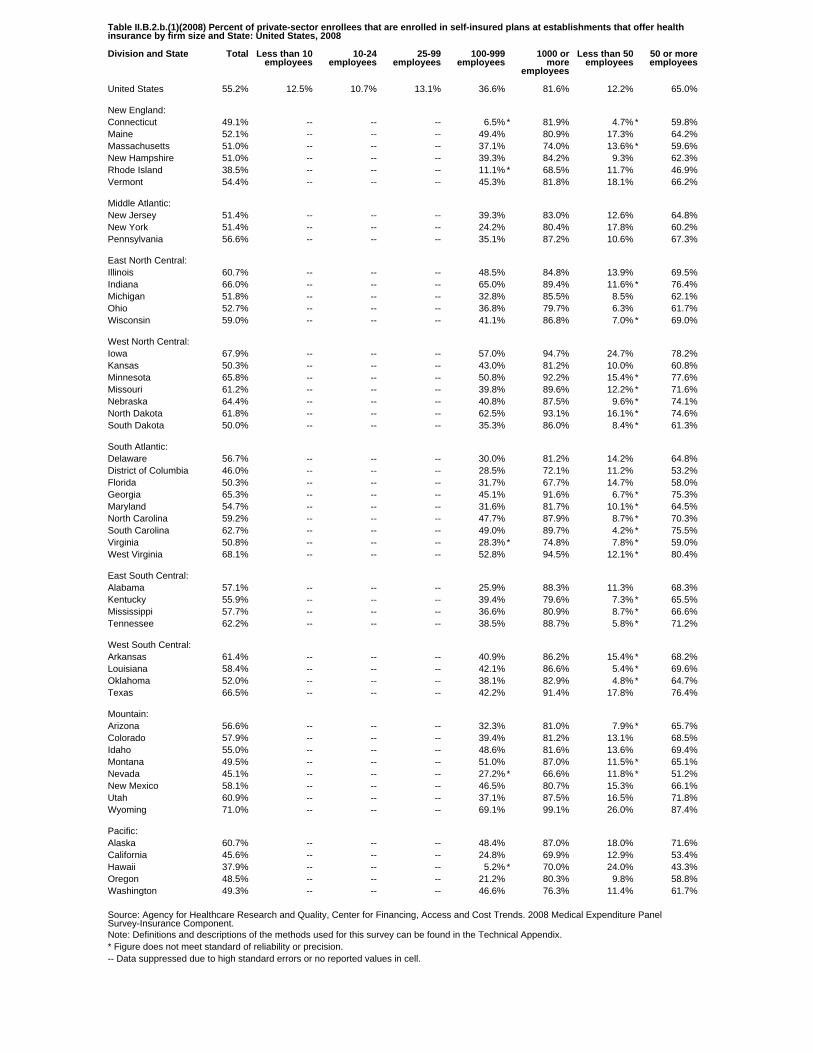
Table II.B.2.b.(1)(2008) Percent of private-sector enrollees that are enrolled in self-insured plans at establishments that offer healthinsurance by firm size and State: United States, 2008
Division and State Total Less than 10employees
10-24employees
25-99employees
100-999employees
1000 ormore
employees
Less than 50employees
50 or moreemployees
United States 55.2% 12.5% 10.7% 13.1% 36.6% 81.6% 12.2% 65.0%
New England:Connecticut 49.1% -- -- -- 6.5% * 81.9% 4.7% * 59.8%Maine 52.1% -- -- -- 49.4% 80.9% 17.3% 64.2%Massachusetts 51.0% -- -- -- 37.1% 74.0% 13.6% * 59.6%New Hampshire 51.0% -- -- -- 39.3% 84.2% 9.3% 62.3%Rhode Island 38.5% -- -- -- 11.1% * 68.5% 11.7% 46.9%Vermont 54.4% -- -- -- 45.3% 81.8% 18.1% 66.2%
Middle Atlantic:New Jersey 51.4% -- -- -- 39.3% 83.0% 12.6% 64.8%New York 51.4% -- -- -- 24.2% 80.4% 17.8% 60.2%Pennsylvania 56.6% -- -- -- 35.1% 87.2% 10.6% 67.3%
East North Central:Illinois 60.7% -- -- -- 48.5% 84.8% 13.9% 69.5%Indiana 66.0% -- -- -- 65.0% 89.4% 11.6% * 76.4%Michigan 51.8% -- -- -- 32.8% 85.5% 8.5% 62.1%Ohio 52.7% -- -- -- 36.8% 79.7% 6.3% 61.7%Wisconsin 59.0% -- -- -- 41.1% 86.8% 7.0% * 69.0%
West North Central:Iowa 67.9% -- -- -- 57.0% 94.7% 24.7% 78.2%Kansas 50.3% -- -- -- 43.0% 81.2% 10.0% 60.8%Minnesota 65.8% -- -- -- 50.8% 92.2% 15.4% * 77.6%Missouri 61.2% -- -- -- 39.8% 89.6% 12.2% * 71.6%Nebraska 64.4% -- -- -- 40.8% 87.5% 9.6% * 74.1%North Dakota 61.8% -- -- -- 62.5% 93.1% 16.1% * 74.6%South Dakota 50.0% -- -- -- 35.3% 86.0% 8.4% * 61.3%
South Atlantic:Delaware 56.7% -- -- -- 30.0% 81.2% 14.2% 64.8%District of Columbia 46.0% -- -- -- 28.5% 72.1% 11.2% 53.2%Florida 50.3% -- -- -- 31.7% 67.7% 14.7% 58.0%Georgia 65.3% -- -- -- 45.1% 91.6% 6.7% * 75.3%Maryland 54.7% -- -- -- 31.6% 81.7% 10.1% * 64.5%North Carolina 59.2% -- -- -- 47.7% 87.9% 8.7% * 70.3%South Carolina 62.7% -- -- -- 49.0% 89.7% 4.2% * 75.5%Virginia 50.8% -- -- -- 28.3% * 74.8% 7.8% * 59.0%West Virginia 68.1% -- -- -- 52.8% 94.5% 12.1% * 80.4%
East South Central:Alabama 57.1% -- -- -- 25.9% 88.3% 11.3% 68.3%Kentucky 55.9% -- -- -- 39.4% 79.6% 7.3% * 65.5%Mississippi 57.7% -- -- -- 36.6% 80.9% 8.7% * 66.6%Tennessee 62.2% -- -- -- 38.5% 88.7% 5.8% * 71.2%
West South Central:Arkansas 61.4% -- -- -- 40.9% 86.2% 15.4% * 68.2%Louisiana 58.4% -- -- -- 42.1% 86.6% 5.4% * 69.6%Oklahoma 52.0% -- -- -- 38.1% 82.9% 4.8% * 64.7%Texas 66.5% -- -- -- 42.2% 91.4% 17.8% 76.4%
Mountain:Arizona 56.6% -- -- -- 32.3% 81.0% 7.9% * 65.7%Colorado 57.9% -- -- -- 39.4% 81.2% 13.1% 68.5%Idaho 55.0% -- -- -- 48.6% 81.6% 13.6% 69.4%Montana 49.5% -- -- -- 51.0% 87.0% 11.5% * 65.1%Nevada 45.1% -- -- -- 27.2% * 66.6% 11.8% * 51.2%New Mexico 58.1% -- -- -- 46.5% 80.7% 15.3% 66.1%Utah 60.9% -- -- -- 37.1% 87.5% 16.5% 71.8%Wyoming 71.0% -- -- -- 69.1% 99.1% 26.0% 87.4%
Pacific:Alaska 60.7% -- -- -- 48.4% 87.0% 18.0% 71.6%California 45.6% -- -- -- 24.8% 69.9% 12.9% 53.4%Hawaii 37.9% -- -- -- 5.2% * 70.0% 24.0% 43.3%Oregon 48.5% -- -- -- 21.2% 80.3% 9.8% 58.8%Washington 49.3% -- -- -- 46.6% 76.3% 11.4% 61.7%
Source: Agency for Healthcare Research and Quality, Center for Financing, Access and Cost Trends. 2008 Medical Expenditure PanelSurvey-Insurance Component.Note: Definitions and descriptions of the methods used for this survey can be found in the Technical Appendix.* Figure does not meet standard of reliability or precision.-- Data suppressed due to high standard errors or no reported values in cell.
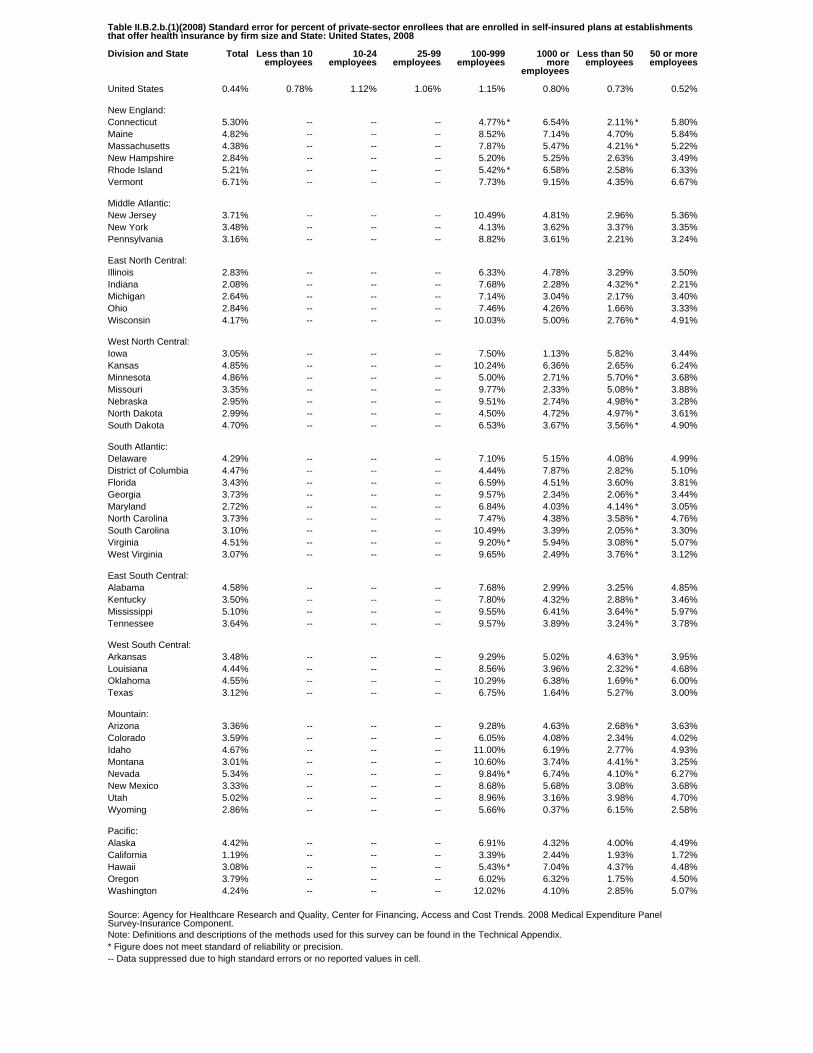
Table II.B.2.b.(1)(2008) Standard error for percent of private-sector enrollees that are enrolled in self-insured plans at establishmentsthat offer health insurance by firm size and State: United States, 2008
Division and State Total Less than 10employees
10-24employees
25-99employees
100-999employees
1000 ormore
employees
Less than 50employees
50 or moreemployees
United States 0.44% 0.78% 1.12% 1.06% 1.15% 0.80% 0.73% 0.52%
New England:Connecticut 5.30% -- -- -- 4.77% * 6.54% 2.11% * 5.80%Maine 4.82% -- -- -- 8.52% 7.14% 4.70% 5.84%Massachusetts 4.38% -- -- -- 7.87% 5.47% 4.21% * 5.22%New Hampshire 2.84% -- -- -- 5.20% 5.25% 2.63% 3.49%Rhode Island 5.21% -- -- -- 5.42% * 6.58% 2.58% 6.33%Vermont 6.71% -- -- -- 7.73% 9.15% 4.35% 6.67%
Middle Atlantic:New Jersey 3.71% -- -- -- 10.49% 4.81% 2.96% 5.36%New York 3.48% -- -- -- 4.13% 3.62% 3.37% 3.35%Pennsylvania 3.16% -- -- -- 8.82% 3.61% 2.21% 3.24%
East North Central:Illinois 2.83% -- -- -- 6.33% 4.78% 3.29% 3.50%Indiana 2.08% -- -- -- 7.68% 2.28% 4.32% * 2.21%Michigan 2.64% -- -- -- 7.14% 3.04% 2.17% 3.40%Ohio 2.84% -- -- -- 7.46% 4.26% 1.66% 3.33%Wisconsin 4.17% -- -- -- 10.03% 5.00% 2.76% * 4.91%
West North Central:Iowa 3.05% -- -- -- 7.50% 1.13% 5.82% 3.44%Kansas 4.85% -- -- -- 10.24% 6.36% 2.65% 6.24%Minnesota 4.86% -- -- -- 5.00% 2.71% 5.70% * 3.68%Missouri 3.35% -- -- -- 9.77% 2.33% 5.08% * 3.88%Nebraska 2.95% -- -- -- 9.51% 2.74% 4.98% * 3.28%North Dakota 2.99% -- -- -- 4.50% 4.72% 4.97% * 3.61%South Dakota 4.70% -- -- -- 6.53% 3.67% 3.56% * 4.90%
South Atlantic:Delaware 4.29% -- -- -- 7.10% 5.15% 4.08% 4.99%District of Columbia 4.47% -- -- -- 4.44% 7.87% 2.82% 5.10%Florida 3.43% -- -- -- 6.59% 4.51% 3.60% 3.81%Georgia 3.73% -- -- -- 9.57% 2.34% 2.06% * 3.44%Maryland 2.72% -- -- -- 6.84% 4.03% 4.14% * 3.05%North Carolina 3.73% -- -- -- 7.47% 4.38% 3.58% * 4.76%South Carolina 3.10% -- -- -- 10.49% 3.39% 2.05% * 3.30%Virginia 4.51% -- -- -- 9.20% * 5.94% 3.08% * 5.07%West Virginia 3.07% -- -- -- 9.65% 2.49% 3.76% * 3.12%
East South Central:Alabama 4.58% -- -- -- 7.68% 2.99% 3.25% 4.85%Kentucky 3.50% -- -- -- 7.80% 4.32% 2.88% * 3.46%Mississippi 5.10% -- -- -- 9.55% 6.41% 3.64% * 5.97%Tennessee 3.64% -- -- -- 9.57% 3.89% 3.24% * 3.78%
West South Central:Arkansas 3.48% -- -- -- 9.29% 5.02% 4.63% * 3.95%Louisiana 4.44% -- -- -- 8.56% 3.96% 2.32% * 4.68%Oklahoma 4.55% -- -- -- 10.29% 6.38% 1.69% * 6.00%Texas 3.12% -- -- -- 6.75% 1.64% 5.27% 3.00%
Mountain:Arizona 3.36% -- -- -- 9.28% 4.63% 2.68% * 3.63%Colorado 3.59% -- -- -- 6.05% 4.08% 2.34% 4.02%Idaho 4.67% -- -- -- 11.00% 6.19% 2.77% 4.93%Montana 3.01% -- -- -- 10.60% 3.74% 4.41% * 3.25%Nevada 5.34% -- -- -- 9.84% * 6.74% 4.10% * 6.27%New Mexico 3.33% -- -- -- 8.68% 5.68% 3.08% 3.68%Utah 5.02% -- -- -- 8.96% 3.16% 3.98% 4.70%Wyoming 2.86% -- -- -- 5.66% 0.37% 6.15% 2.58%
Pacific:Alaska 4.42% -- -- -- 6.91% 4.32% 4.00% 4.49%California 1.19% -- -- -- 3.39% 2.44% 1.93% 1.72%Hawaii 3.08% -- -- -- 5.43% * 7.04% 4.37% 4.48%Oregon 3.79% -- -- -- 6.02% 6.32% 1.75% 4.50%Washington 4.24% -- -- -- 12.02% 4.10% 2.85% 5.07%
Source: Agency for Healthcare Research and Quality, Center for Financing, Access and Cost Trends. 2008 Medical Expenditure PanelSurvey-Insurance Component.Note: Definitions and descriptions of the methods used for this survey can be found in the Technical Appendix.* Figure does not meet standard of reliability or precision.-- Data suppressed due to high standard errors or no reported values in cell.
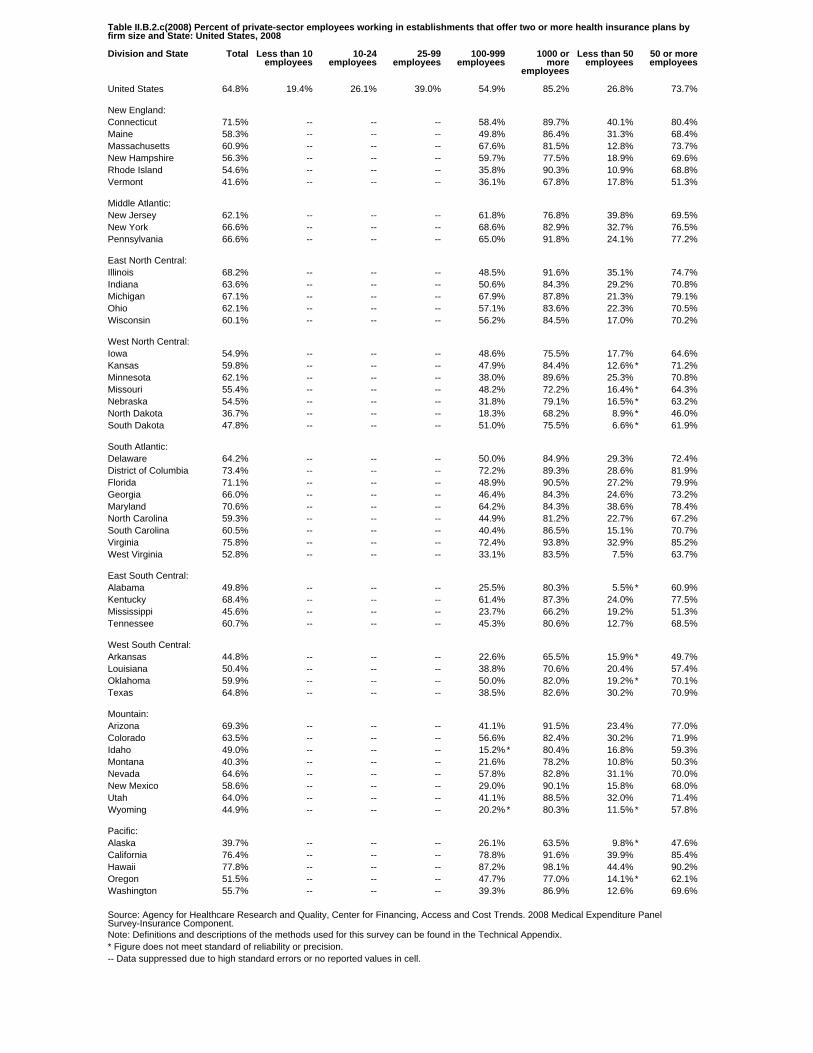
Table II.B.2.c(2008) Percent of private-sector employees working in establishments that offer two or more health insurance plans byfirm size and State: United States, 2008
Division and State Total Less than 10employees
10-24employees
25-99employees
100-999employees
1000 ormore
employees
Less than 50employees
50 or moreemployees
United States 64.8% 19.4% 26.1% 39.0% 54.9% 85.2% 26.8% 73.7%
New England:Connecticut 71.5% -- -- -- 58.4% 89.7% 40.1% 80.4%Maine 58.3% -- -- -- 49.8% 86.4% 31.3% 68.4%Massachusetts 60.9% -- -- -- 67.6% 81.5% 12.8% 73.7%New Hampshire 56.3% -- -- -- 59.7% 77.5% 18.9% 69.6%Rhode Island 54.6% -- -- -- 35.8% 90.3% 10.9% 68.8%Vermont 41.6% -- -- -- 36.1% 67.8% 17.8% 51.3%
Middle Atlantic:New Jersey 62.1% -- -- -- 61.8% 76.8% 39.8% 69.5%New York 66.6% -- -- -- 68.6% 82.9% 32.7% 76.5%Pennsylvania 66.6% -- -- -- 65.0% 91.8% 24.1% 77.2%
East North Central:Illinois 68.2% -- -- -- 48.5% 91.6% 35.1% 74.7%Indiana 63.6% -- -- -- 50.6% 84.3% 29.2% 70.8%Michigan 67.1% -- -- -- 67.9% 87.8% 21.3% 79.1%Ohio 62.1% -- -- -- 57.1% 83.6% 22.3% 70.5%Wisconsin 60.1% -- -- -- 56.2% 84.5% 17.0% 70.2%
West North Central:Iowa 54.9% -- -- -- 48.6% 75.5% 17.7% 64.6%Kansas 59.8% -- -- -- 47.9% 84.4% 12.6% * 71.2%Minnesota 62.1% -- -- -- 38.0% 89.6% 25.3% 70.8%Missouri 55.4% -- -- -- 48.2% 72.2% 16.4% * 64.3%Nebraska 54.5% -- -- -- 31.8% 79.1% 16.5% * 63.2%North Dakota 36.7% -- -- -- 18.3% 68.2% 8.9% * 46.0%South Dakota 47.8% -- -- -- 51.0% 75.5% 6.6% * 61.9%
South Atlantic:Delaware 64.2% -- -- -- 50.0% 84.9% 29.3% 72.4%District of Columbia 73.4% -- -- -- 72.2% 89.3% 28.6% 81.9%Florida 71.1% -- -- -- 48.9% 90.5% 27.2% 79.9%Georgia 66.0% -- -- -- 46.4% 84.3% 24.6% 73.2%Maryland 70.6% -- -- -- 64.2% 84.3% 38.6% 78.4%North Carolina 59.3% -- -- -- 44.9% 81.2% 22.7% 67.2%South Carolina 60.5% -- -- -- 40.4% 86.5% 15.1% 70.7%Virginia 75.8% -- -- -- 72.4% 93.8% 32.9% 85.2%West Virginia 52.8% -- -- -- 33.1% 83.5% 7.5% 63.7%
East South Central:Alabama 49.8% -- -- -- 25.5% 80.3% 5.5% * 60.9%Kentucky 68.4% -- -- -- 61.4% 87.3% 24.0% 77.5%Mississippi 45.6% -- -- -- 23.7% 66.2% 19.2% 51.3%Tennessee 60.7% -- -- -- 45.3% 80.6% 12.7% 68.5%
West South Central:Arkansas 44.8% -- -- -- 22.6% 65.5% 15.9% * 49.7%Louisiana 50.4% -- -- -- 38.8% 70.6% 20.4% 57.4%Oklahoma 59.9% -- -- -- 50.0% 82.0% 19.2% * 70.1%Texas 64.8% -- -- -- 38.5% 82.6% 30.2% 70.9%
Mountain:Arizona 69.3% -- -- -- 41.1% 91.5% 23.4% 77.0%Colorado 63.5% -- -- -- 56.6% 82.4% 30.2% 71.9%Idaho 49.0% -- -- -- 15.2% * 80.4% 16.8% 59.3%Montana 40.3% -- -- -- 21.6% 78.2% 10.8% 50.3%Nevada 64.6% -- -- -- 57.8% 82.8% 31.1% 70.0%New Mexico 58.6% -- -- -- 29.0% 90.1% 15.8% 68.0%Utah 64.0% -- -- -- 41.1% 88.5% 32.0% 71.4%Wyoming 44.9% -- -- -- 20.2% * 80.3% 11.5% * 57.8%
Pacific:Alaska 39.7% -- -- -- 26.1% 63.5% 9.8% * 47.6%California 76.4% -- -- -- 78.8% 91.6% 39.9% 85.4%Hawaii 77.8% -- -- -- 87.2% 98.1% 44.4% 90.2%Oregon 51.5% -- -- -- 47.7% 77.0% 14.1% * 62.1%Washington 55.7% -- -- -- 39.3% 86.9% 12.6% 69.6%
Source: Agency for Healthcare Research and Quality, Center for Financing, Access and Cost Trends. 2008 Medical Expenditure PanelSurvey-Insurance Component.Note: Definitions and descriptions of the methods used for this survey can be found in the Technical Appendix.* Figure does not meet standard of reliability or precision.-- Data suppressed due to high standard errors or no reported values in cell.

Table II.B.2.c(2008) Standard error for percent of private-sector employees working in establishments that offer two or more healthinsurance plans by firm size and State: United States, 2008
Division and State Total Less than 10employees
10-24employees
25-99employees
100-999employees
1000 ormore
employees
Less than 50employees
50 or moreemployees
United States 0.61% 0.89% 1.16% 1.13% 1.27% 0.94% 0.73% 0.72%
New England:Connecticut 2.41% -- -- -- 8.87% 4.32% 3.88% 3.25%Maine 6.41% -- -- -- 11.42% 8.42% 7.49% 7.00%Massachusetts 3.62% -- -- -- 6.89% 5.20% 3.18% 4.01%New Hampshire 3.70% -- -- -- 9.40% 4.32% 2.68% 4.14%Rhode Island 4.05% -- -- -- 7.92% 5.33% 2.59% 4.61%Vermont 6.21% -- -- -- 5.99% 11.47% 2.98% 7.24%
Middle Atlantic:New Jersey 4.32% -- -- -- 5.28% 5.72% 4.53% 5.12%New York 2.19% -- -- -- 5.46% 3.77% 2.11% 2.86%Pennsylvania 1.86% -- -- -- 4.44% 3.05% 3.19% 2.27%
East North Central:Illinois 3.10% -- -- -- 4.64% 2.87% 4.84% 2.93%Indiana 1.73% -- -- -- 8.92% 4.32% 6.18% 2.19%Michigan 2.85% -- -- -- 7.37% 2.63% 4.60% 3.33%Ohio 3.54% -- -- -- 7.60% 3.66% 5.27% 3.76%Wisconsin 2.54% -- -- -- 7.60% 4.16% 3.41% 2.33%
West North Central:Iowa 2.34% -- -- -- 7.76% 4.02% 4.49% 2.47%Kansas 2.93% -- -- -- 5.97% 4.79% 4.56% * 3.60%Minnesota 3.08% -- -- -- 6.98% 3.12% 5.47% 2.85%Missouri 3.72% -- -- -- 6.42% 7.04% 5.60% * 4.37%Nebraska 2.49% -- -- -- 7.37% 2.90% 6.29% * 3.64%North Dakota 5.08% -- -- -- 5.35% 9.25% 3.24% * 6.84%South Dakota 2.63% -- -- -- 4.09% 4.87% 3.09% * 2.91%
South Atlantic:Delaware 2.22% -- -- -- 8.77% 5.70% 5.52% 3.19%District of Columbia 3.26% -- -- -- 6.42% 3.92% 4.34% 3.39%Florida 2.50% -- -- -- 4.07% 3.15% 4.76% 2.82%Georgia 3.07% -- -- -- 11.09% 4.27% 6.43% 3.48%Maryland 2.95% -- -- -- 5.40% 4.24% 5.96% 3.40%North Carolina 3.67% -- -- -- 7.92% 4.12% 4.48% 4.99%South Carolina 3.34% -- -- -- 9.65% 4.32% 3.10% 4.36%Virginia 2.21% -- -- -- 10.32% 1.96% 3.14% 2.69%West Virginia 4.18% -- -- -- 9.52% 5.53% 2.02% 4.59%
East South Central:Alabama 3.26% -- -- -- 6.26% 3.56% 2.12% * 3.06%Kentucky 4.48% -- -- -- 6.28% 4.87% 4.38% 4.59%Mississippi 5.13% -- -- -- 5.14% 6.24% 4.38% 5.57%Tennessee 3.59% -- -- -- 6.74% 4.42% 3.17% 3.62%
West South Central:Arkansas 4.02% -- -- -- 5.51% 4.72% 6.17% * 4.01%Louisiana 3.17% -- -- -- 5.97% 5.63% 4.64% 3.97%Oklahoma 2.98% -- -- -- 8.44% 4.58% 7.03% * 3.40%Texas 3.95% -- -- -- 6.82% 4.35% 4.13% 4.11%
Mountain:Arizona 3.08% -- -- -- 9.44% 5.17% 5.08% 3.61%Colorado 4.59% -- -- -- 8.24% 4.08% 6.27% 5.02%Idaho 6.48% -- -- -- 5.69% * 6.93% 3.25% 7.03%Montana 3.98% -- -- -- 5.53% 5.36% 3.06% 5.16%Nevada 5.72% -- -- -- 11.27% 5.35% 4.27% 6.61%New Mexico 2.82% -- -- -- 5.64% 3.22% 4.14% 2.97%Utah 3.71% -- -- -- 8.49% 4.92% 5.45% 4.48%Wyoming 4.57% -- -- -- 7.63% * 6.81% 3.72% * 5.94%
Pacific:Alaska 6.10% -- -- -- 6.68% 8.29% 3.21% * 6.99%California 1.53% -- -- -- 3.39% 1.54% 2.40% 1.69%Hawaii 4.09% -- -- -- 7.22% 1.88% 6.45% 4.47%Oregon 2.07% -- -- -- 9.50% 4.12% 4.34% * 2.80%Washington 2.69% -- -- -- 7.95% 2.48% 2.93% 1.73%
Source: Agency for Healthcare Research and Quality, Center for Financing, Access and Cost Trends. 2008 Medical Expenditure PanelSurvey-Insurance Component.Note: Definitions and descriptions of the methods used for this survey can be found in the Technical Appendix.* Figure does not meet standard of reliability or precision.-- Data suppressed due to high standard errors or no reported values in cell.
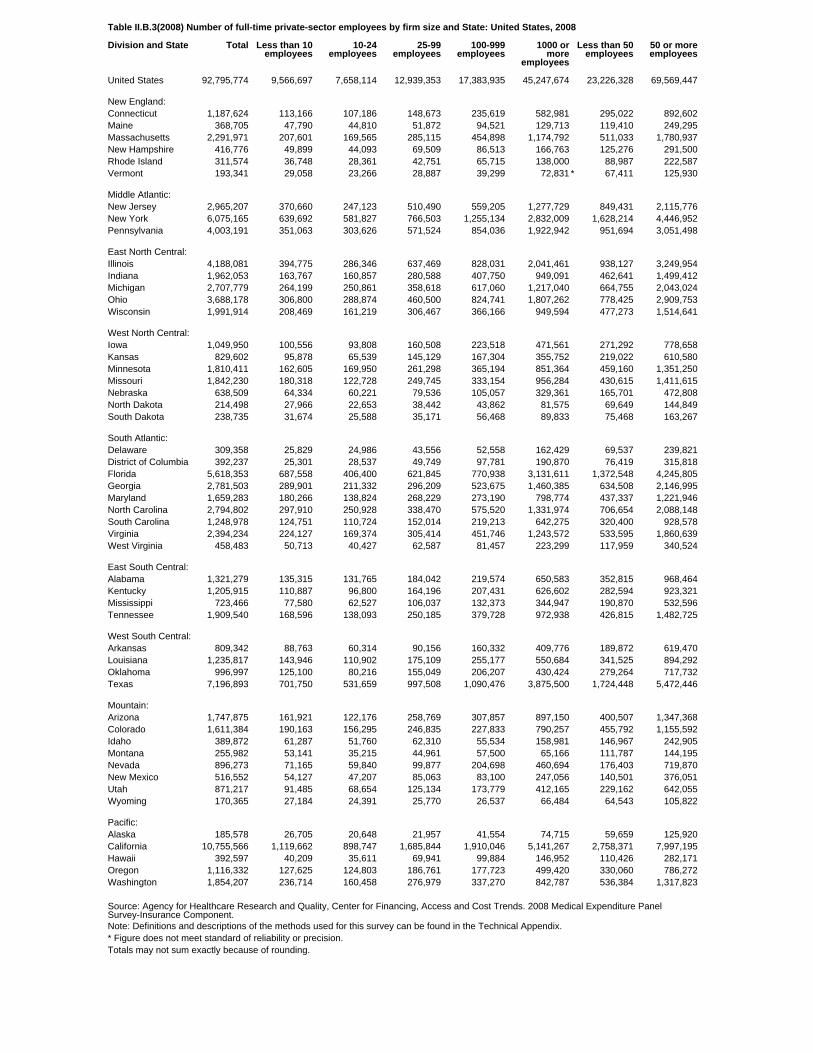
Table II.B.3(2008) Number of full-time private-sector employees by firm size and State: United States, 2008
Division and State Total Less than 10employees
10-24employees
25-99employees
100-999employees
1000 ormore
employees
Less than 50employees
50 or moreemployees
United States 92,795,774 9,566,697 7,658,114 12,939,353 17,383,935 45,247,674 23,226,328 69,569,447
New England:Connecticut 1,187,624 113,166 107,186 148,673 235,619 582,981 295,022 892,602Maine 368,705 47,790 44,810 51,872 94,521 129,713 119,410 249,295Massachusetts 2,291,971 207,601 169,565 285,115 454,898 1,174,792 511,033 1,780,937New Hampshire 416,776 49,899 44,093 69,509 86,513 166,763 125,276 291,500Rhode Island 311,574 36,748 28,361 42,751 65,715 138,000 88,987 222,587Vermont 193,341 29,058 23,266 28,887 39,299 72,831 * 67,411 125,930
Middle Atlantic:New Jersey 2,965,207 370,660 247,123 510,490 559,205 1,277,729 849,431 2,115,776New York 6,075,165 639,692 581,827 766,503 1,255,134 2,832,009 1,628,214 4,446,952Pennsylvania 4,003,191 351,063 303,626 571,524 854,036 1,922,942 951,694 3,051,498
East North Central:Illinois 4,188,081 394,775 286,346 637,469 828,031 2,041,461 938,127 3,249,954Indiana 1,962,053 163,767 160,857 280,588 407,750 949,091 462,641 1,499,412Michigan 2,707,779 264,199 250,861 358,618 617,060 1,217,040 664,755 2,043,024Ohio 3,688,178 306,800 288,874 460,500 824,741 1,807,262 778,425 2,909,753Wisconsin 1,991,914 208,469 161,219 306,467 366,166 949,594 477,273 1,514,641
West North Central:Iowa 1,049,950 100,556 93,808 160,508 223,518 471,561 271,292 778,658Kansas 829,602 95,878 65,539 145,129 167,304 355,752 219,022 610,580Minnesota 1,810,411 162,605 169,950 261,298 365,194 851,364 459,160 1,351,250Missouri 1,842,230 180,318 122,728 249,745 333,154 956,284 430,615 1,411,615Nebraska 638,509 64,334 60,221 79,536 105,057 329,361 165,701 472,808North Dakota 214,498 27,966 22,653 38,442 43,862 81,575 69,649 144,849South Dakota 238,735 31,674 25,588 35,171 56,468 89,833 75,468 163,267
South Atlantic:Delaware 309,358 25,829 24,986 43,556 52,558 162,429 69,537 239,821District of Columbia 392,237 25,301 28,537 49,749 97,781 190,870 76,419 315,818Florida 5,618,353 687,558 406,400 621,845 770,938 3,131,611 1,372,548 4,245,805Georgia 2,781,503 289,901 211,332 296,209 523,675 1,460,385 634,508 2,146,995Maryland 1,659,283 180,266 138,824 268,229 273,190 798,774 437,337 1,221,946North Carolina 2,794,802 297,910 250,928 338,470 575,520 1,331,974 706,654 2,088,148South Carolina 1,248,978 124,751 110,724 152,014 219,213 642,275 320,400 928,578Virginia 2,394,234 224,127 169,374 305,414 451,746 1,243,572 533,595 1,860,639West Virginia 458,483 50,713 40,427 62,587 81,457 223,299 117,959 340,524
East South Central:Alabama 1,321,279 135,315 131,765 184,042 219,574 650,583 352,815 968,464Kentucky 1,205,915 110,887 96,800 164,196 207,431 626,602 282,594 923,321Mississippi 723,466 77,580 62,527 106,037 132,373 344,947 190,870 532,596Tennessee 1,909,540 168,596 138,093 250,185 379,728 972,938 426,815 1,482,725
West South Central:Arkansas 809,342 88,763 60,314 90,156 160,332 409,776 189,872 619,470Louisiana 1,235,817 143,946 110,902 175,109 255,177 550,684 341,525 894,292Oklahoma 996,997 125,100 80,216 155,049 206,207 430,424 279,264 717,732Texas 7,196,893 701,750 531,659 997,508 1,090,476 3,875,500 1,724,448 5,472,446
Mountain:Arizona 1,747,875 161,921 122,176 258,769 307,857 897,150 400,507 1,347,368Colorado 1,611,384 190,163 156,295 246,835 227,833 790,257 455,792 1,155,592Idaho 389,872 61,287 51,760 62,310 55,534 158,981 146,967 242,905Montana 255,982 53,141 35,215 44,961 57,500 65,166 111,787 144,195Nevada 896,273 71,165 59,840 99,877 204,698 460,694 176,403 719,870New Mexico 516,552 54,127 47,207 85,063 83,100 247,056 140,501 376,051Utah 871,217 91,485 68,654 125,134 173,779 412,165 229,162 642,055Wyoming 170,365 27,184 24,391 25,770 26,537 66,484 64,543 105,822
Pacific:Alaska 185,578 26,705 20,648 21,957 41,554 74,715 59,659 125,920California 10,755,566 1,119,662 898,747 1,685,844 1,910,046 5,141,267 2,758,371 7,997,195Hawaii 392,597 40,209 35,611 69,941 99,884 146,952 110,426 282,171Oregon 1,116,332 127,625 124,803 186,761 177,723 499,420 330,060 786,272Washington 1,854,207 236,714 160,458 276,979 337,270 842,787 536,384 1,317,823
Source: Agency for Healthcare Research and Quality, Center for Financing, Access and Cost Trends. 2008 Medical Expenditure PanelSurvey-Insurance Component.Note: Definitions and descriptions of the methods used for this survey can be found in the Technical Appendix.* Figure does not meet standard of reliability or precision.Totals may not sum exactly because of rounding.
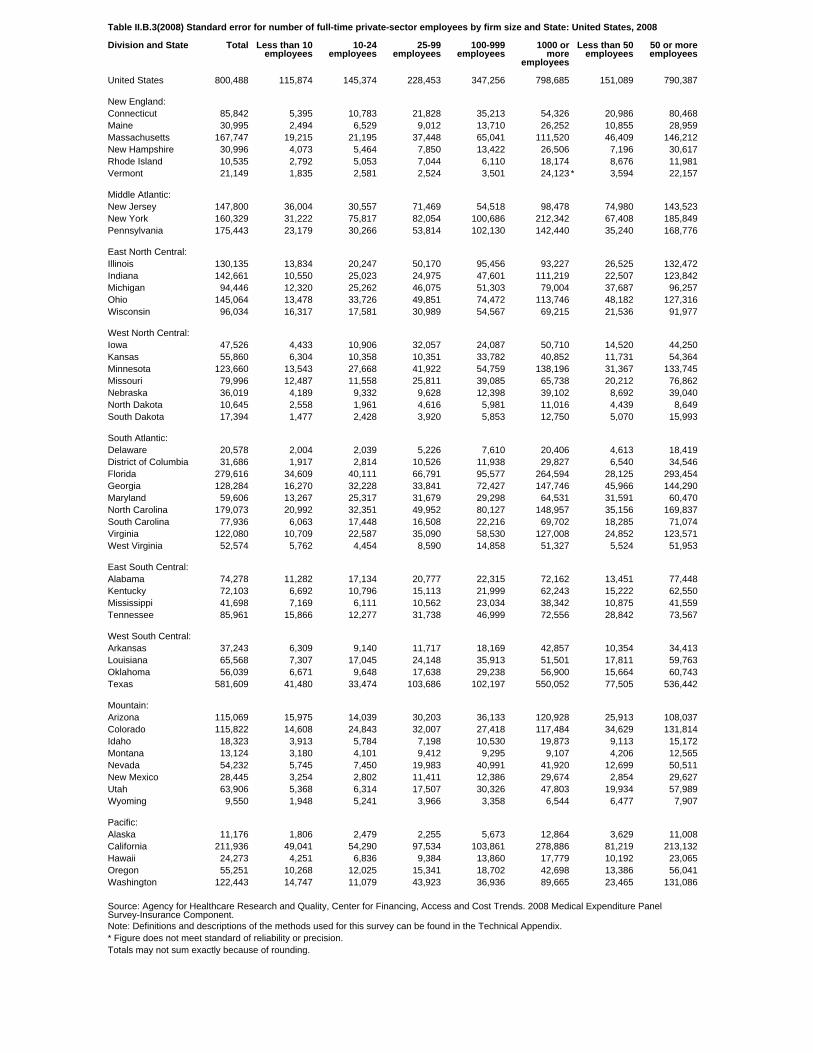
Table II.B.3(2008) Standard error for number of full-time private-sector employees by firm size and State: United States, 2008
Division and State Total Less than 10employees
10-24employees
25-99employees
100-999employees
1000 ormore
employees
Less than 50employees
50 or moreemployees
United States 800,488 115,874 145,374 228,453 347,256 798,685 151,089 790,387
New England:Connecticut 85,842 5,395 10,783 21,828 35,213 54,326 20,986 80,468Maine 30,995 2,494 6,529 9,012 13,710 26,252 10,855 28,959Massachusetts 167,747 19,215 21,195 37,448 65,041 111,520 46,409 146,212New Hampshire 30,996 4,073 5,464 7,850 13,422 26,506 7,196 30,617Rhode Island 10,535 2,792 5,053 7,044 6,110 18,174 8,676 11,981Vermont 21,149 1,835 2,581 2,524 3,501 24,123 * 3,594 22,157
Middle Atlantic:New Jersey 147,800 36,004 30,557 71,469 54,518 98,478 74,980 143,523New York 160,329 31,222 75,817 82,054 100,686 212,342 67,408 185,849Pennsylvania 175,443 23,179 30,266 53,814 102,130 142,440 35,240 168,776
East North Central:Illinois 130,135 13,834 20,247 50,170 95,456 93,227 26,525 132,472Indiana 142,661 10,550 25,023 24,975 47,601 111,219 22,507 123,842Michigan 94,446 12,320 25,262 46,075 51,303 79,004 37,687 96,257Ohio 145,064 13,478 33,726 49,851 74,472 113,746 48,182 127,316Wisconsin 96,034 16,317 17,581 30,989 54,567 69,215 21,536 91,977
West North Central:Iowa 47,526 4,433 10,906 32,057 24,087 50,710 14,520 44,250Kansas 55,860 6,304 10,358 10,351 33,782 40,852 11,731 54,364Minnesota 123,660 13,543 27,668 41,922 54,759 138,196 31,367 133,745Missouri 79,996 12,487 11,558 25,811 39,085 65,738 20,212 76,862Nebraska 36,019 4,189 9,332 9,628 12,398 39,102 8,692 39,040North Dakota 10,645 2,558 1,961 4,616 5,981 11,016 4,439 8,649South Dakota 17,394 1,477 2,428 3,920 5,853 12,750 5,070 15,993
South Atlantic:Delaware 20,578 2,004 2,039 5,226 7,610 20,406 4,613 18,419District of Columbia 31,686 1,917 2,814 10,526 11,938 29,827 6,540 34,546Florida 279,616 34,609 40,111 66,791 95,577 264,594 28,125 293,454Georgia 128,284 16,270 32,228 33,841 72,427 147,746 45,966 144,290Maryland 59,606 13,267 25,317 31,679 29,298 64,531 31,591 60,470North Carolina 179,073 20,992 32,351 49,952 80,127 148,957 35,156 169,837South Carolina 77,936 6,063 17,448 16,508 22,216 69,702 18,285 71,074Virginia 122,080 10,709 22,587 35,090 58,530 127,008 24,852 123,571West Virginia 52,574 5,762 4,454 8,590 14,858 51,327 5,524 51,953
East South Central:Alabama 74,278 11,282 17,134 20,777 22,315 72,162 13,451 77,448Kentucky 72,103 6,692 10,796 15,113 21,999 62,243 15,222 62,550Mississippi 41,698 7,169 6,111 10,562 23,034 38,342 10,875 41,559Tennessee 85,961 15,866 12,277 31,738 46,999 72,556 28,842 73,567
West South Central:Arkansas 37,243 6,309 9,140 11,717 18,169 42,857 10,354 34,413Louisiana 65,568 7,307 17,045 24,148 35,913 51,501 17,811 59,763Oklahoma 56,039 6,671 9,648 17,638 29,238 56,900 15,664 60,743Texas 581,609 41,480 33,474 103,686 102,197 550,052 77,505 536,442
Mountain:Arizona 115,069 15,975 14,039 30,203 36,133 120,928 25,913 108,037Colorado 115,822 14,608 24,843 32,007 27,418 117,484 34,629 131,814Idaho 18,323 3,913 5,784 7,198 10,530 19,873 9,113 15,172Montana 13,124 3,180 4,101 9,412 9,295 9,107 4,206 12,565Nevada 54,232 5,745 7,450 19,983 40,991 41,920 12,699 50,511New Mexico 28,445 3,254 2,802 11,411 12,386 29,674 2,854 29,627Utah 63,906 5,368 6,314 17,507 30,326 47,803 19,934 57,989Wyoming 9,550 1,948 5,241 3,966 3,358 6,544 6,477 7,907
Pacific:Alaska 11,176 1,806 2,479 2,255 5,673 12,864 3,629 11,008California 211,936 49,041 54,290 97,534 103,861 278,886 81,219 213,132Hawaii 24,273 4,251 6,836 9,384 13,860 17,779 10,192 23,065Oregon 55,251 10,268 12,025 15,341 18,702 42,698 13,386 56,041Washington 122,443 14,747 11,079 43,923 36,936 89,665 23,465 131,086
Source: Agency for Healthcare Research and Quality, Center for Financing, Access and Cost Trends. 2008 Medical Expenditure PanelSurvey-Insurance Component.Note: Definitions and descriptions of the methods used for this survey can be found in the Technical Appendix.* Figure does not meet standard of reliability or precision.Totals may not sum exactly because of rounding.
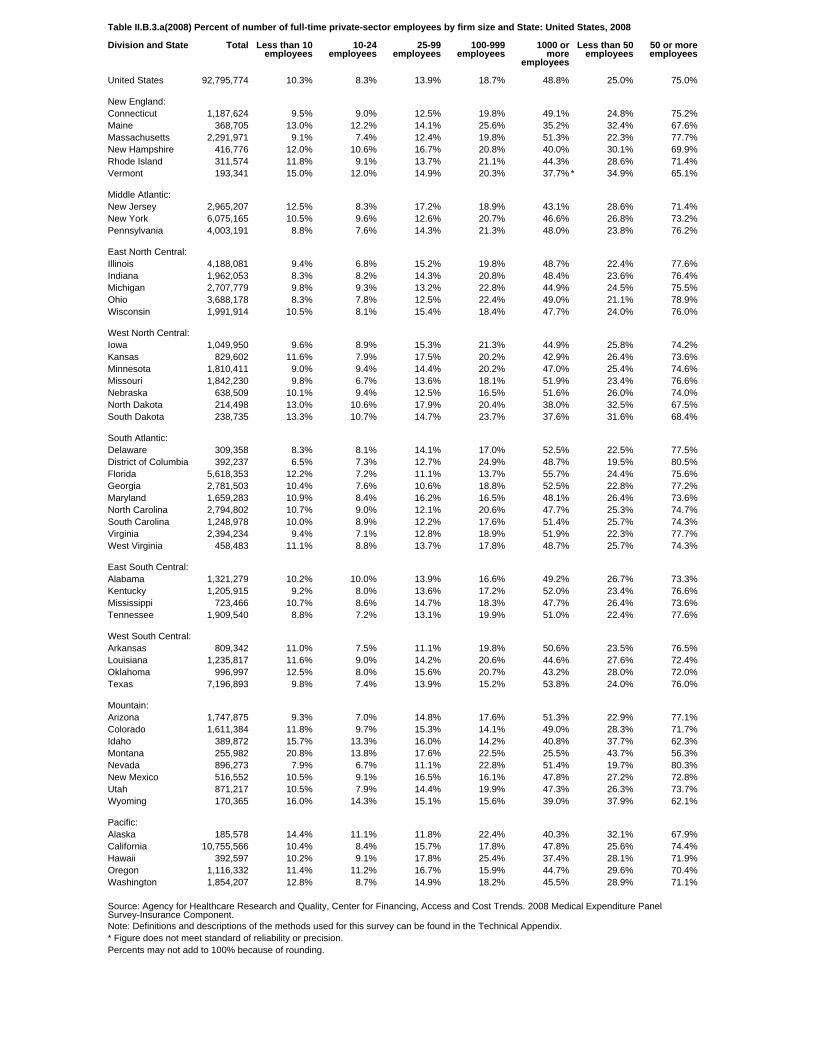
Table II.B.3.a(2008) Percent of number of full-time private-sector employees by firm size and State: United States, 2008
Division and State Total Less than 10employees
10-24employees
25-99employees
100-999employees
1000 ormore
employees
Less than 50employees
50 or moreemployees
United States 92,795,774 10.3% 8.3% 13.9% 18.7% 48.8% 25.0% 75.0%
New England:Connecticut 1,187,624 9.5% 9.0% 12.5% 19.8% 49.1% 24.8% 75.2%Maine 368,705 13.0% 12.2% 14.1% 25.6% 35.2% 32.4% 67.6%Massachusetts 2,291,971 9.1% 7.4% 12.4% 19.8% 51.3% 22.3% 77.7%New Hampshire 416,776 12.0% 10.6% 16.7% 20.8% 40.0% 30.1% 69.9%Rhode Island 311,574 11.8% 9.1% 13.7% 21.1% 44.3% 28.6% 71.4%Vermont 193,341 15.0% 12.0% 14.9% 20.3% 37.7% * 34.9% 65.1%
Middle Atlantic:New Jersey 2,965,207 12.5% 8.3% 17.2% 18.9% 43.1% 28.6% 71.4%New York 6,075,165 10.5% 9.6% 12.6% 20.7% 46.6% 26.8% 73.2%Pennsylvania 4,003,191 8.8% 7.6% 14.3% 21.3% 48.0% 23.8% 76.2%
East North Central:Illinois 4,188,081 9.4% 6.8% 15.2% 19.8% 48.7% 22.4% 77.6%Indiana 1,962,053 8.3% 8.2% 14.3% 20.8% 48.4% 23.6% 76.4%Michigan 2,707,779 9.8% 9.3% 13.2% 22.8% 44.9% 24.5% 75.5%Ohio 3,688,178 8.3% 7.8% 12.5% 22.4% 49.0% 21.1% 78.9%Wisconsin 1,991,914 10.5% 8.1% 15.4% 18.4% 47.7% 24.0% 76.0%
West North Central:Iowa 1,049,950 9.6% 8.9% 15.3% 21.3% 44.9% 25.8% 74.2%Kansas 829,602 11.6% 7.9% 17.5% 20.2% 42.9% 26.4% 73.6%Minnesota 1,810,411 9.0% 9.4% 14.4% 20.2% 47.0% 25.4% 74.6%Missouri 1,842,230 9.8% 6.7% 13.6% 18.1% 51.9% 23.4% 76.6%Nebraska 638,509 10.1% 9.4% 12.5% 16.5% 51.6% 26.0% 74.0%North Dakota 214,498 13.0% 10.6% 17.9% 20.4% 38.0% 32.5% 67.5%South Dakota 238,735 13.3% 10.7% 14.7% 23.7% 37.6% 31.6% 68.4%
South Atlantic:Delaware 309,358 8.3% 8.1% 14.1% 17.0% 52.5% 22.5% 77.5%District of Columbia 392,237 6.5% 7.3% 12.7% 24.9% 48.7% 19.5% 80.5%Florida 5,618,353 12.2% 7.2% 11.1% 13.7% 55.7% 24.4% 75.6%Georgia 2,781,503 10.4% 7.6% 10.6% 18.8% 52.5% 22.8% 77.2%Maryland 1,659,283 10.9% 8.4% 16.2% 16.5% 48.1% 26.4% 73.6%North Carolina 2,794,802 10.7% 9.0% 12.1% 20.6% 47.7% 25.3% 74.7%South Carolina 1,248,978 10.0% 8.9% 12.2% 17.6% 51.4% 25.7% 74.3%Virginia 2,394,234 9.4% 7.1% 12.8% 18.9% 51.9% 22.3% 77.7%West Virginia 458,483 11.1% 8.8% 13.7% 17.8% 48.7% 25.7% 74.3%
East South Central:Alabama 1,321,279 10.2% 10.0% 13.9% 16.6% 49.2% 26.7% 73.3%Kentucky 1,205,915 9.2% 8.0% 13.6% 17.2% 52.0% 23.4% 76.6%Mississippi 723,466 10.7% 8.6% 14.7% 18.3% 47.7% 26.4% 73.6%Tennessee 1,909,540 8.8% 7.2% 13.1% 19.9% 51.0% 22.4% 77.6%
West South Central:Arkansas 809,342 11.0% 7.5% 11.1% 19.8% 50.6% 23.5% 76.5%Louisiana 1,235,817 11.6% 9.0% 14.2% 20.6% 44.6% 27.6% 72.4%Oklahoma 996,997 12.5% 8.0% 15.6% 20.7% 43.2% 28.0% 72.0%Texas 7,196,893 9.8% 7.4% 13.9% 15.2% 53.8% 24.0% 76.0%
Mountain:Arizona 1,747,875 9.3% 7.0% 14.8% 17.6% 51.3% 22.9% 77.1%Colorado 1,611,384 11.8% 9.7% 15.3% 14.1% 49.0% 28.3% 71.7%Idaho 389,872 15.7% 13.3% 16.0% 14.2% 40.8% 37.7% 62.3%Montana 255,982 20.8% 13.8% 17.6% 22.5% 25.5% 43.7% 56.3%Nevada 896,273 7.9% 6.7% 11.1% 22.8% 51.4% 19.7% 80.3%New Mexico 516,552 10.5% 9.1% 16.5% 16.1% 47.8% 27.2% 72.8%Utah 871,217 10.5% 7.9% 14.4% 19.9% 47.3% 26.3% 73.7%Wyoming 170,365 16.0% 14.3% 15.1% 15.6% 39.0% 37.9% 62.1%
Pacific:Alaska 185,578 14.4% 11.1% 11.8% 22.4% 40.3% 32.1% 67.9%California 10,755,566 10.4% 8.4% 15.7% 17.8% 47.8% 25.6% 74.4%Hawaii 392,597 10.2% 9.1% 17.8% 25.4% 37.4% 28.1% 71.9%Oregon 1,116,332 11.4% 11.2% 16.7% 15.9% 44.7% 29.6% 70.4%Washington 1,854,207 12.8% 8.7% 14.9% 18.2% 45.5% 28.9% 71.1%
Source: Agency for Healthcare Research and Quality, Center for Financing, Access and Cost Trends. 2008 Medical Expenditure PanelSurvey-Insurance Component.Note: Definitions and descriptions of the methods used for this survey can be found in the Technical Appendix.* Figure does not meet standard of reliability or precision.Percents may not add to 100% because of rounding.
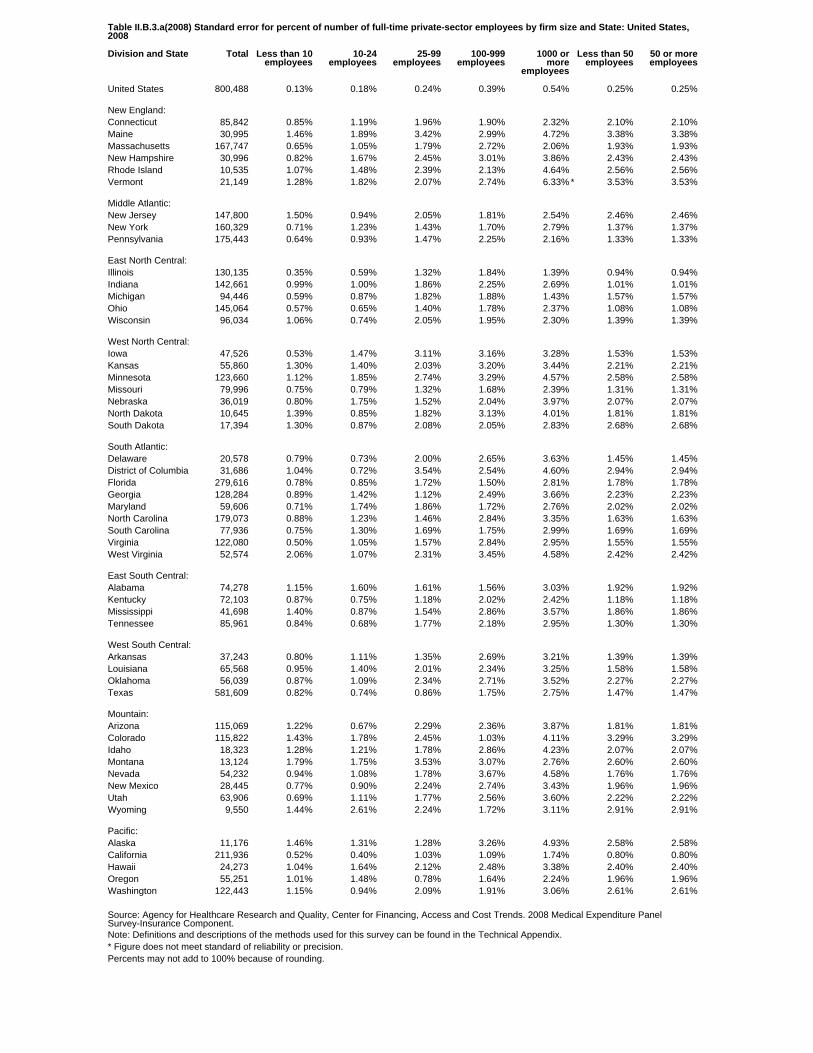
Table II.B.3.a(2008) Standard error for percent of number of full-time private-sector employees by firm size and State: United States,2008
Division and State Total Less than 10employees
10-24employees
25-99employees
100-999employees
1000 ormore
employees
Less than 50employees
50 or moreemployees
United States 800,488 0.13% 0.18% 0.24% 0.39% 0.54% 0.25% 0.25%
New England:Connecticut 85,842 0.85% 1.19% 1.96% 1.90% 2.32% 2.10% 2.10%Maine 30,995 1.46% 1.89% 3.42% 2.99% 4.72% 3.38% 3.38%Massachusetts 167,747 0.65% 1.05% 1.79% 2.72% 2.06% 1.93% 1.93%New Hampshire 30,996 0.82% 1.67% 2.45% 3.01% 3.86% 2.43% 2.43%Rhode Island 10,535 1.07% 1.48% 2.39% 2.13% 4.64% 2.56% 2.56%Vermont 21,149 1.28% 1.82% 2.07% 2.74% 6.33% * 3.53% 3.53%
Middle Atlantic:New Jersey 147,800 1.50% 0.94% 2.05% 1.81% 2.54% 2.46% 2.46%New York 160,329 0.71% 1.23% 1.43% 1.70% 2.79% 1.37% 1.37%Pennsylvania 175,443 0.64% 0.93% 1.47% 2.25% 2.16% 1.33% 1.33%
East North Central:Illinois 130,135 0.35% 0.59% 1.32% 1.84% 1.39% 0.94% 0.94%Indiana 142,661 0.99% 1.00% 1.86% 2.25% 2.69% 1.01% 1.01%Michigan 94,446 0.59% 0.87% 1.82% 1.88% 1.43% 1.57% 1.57%Ohio 145,064 0.57% 0.65% 1.40% 1.78% 2.37% 1.08% 1.08%Wisconsin 96,034 1.06% 0.74% 2.05% 1.95% 2.30% 1.39% 1.39%
West North Central:Iowa 47,526 0.53% 1.47% 3.11% 3.16% 3.28% 1.53% 1.53%Kansas 55,860 1.30% 1.40% 2.03% 3.20% 3.44% 2.21% 2.21%Minnesota 123,660 1.12% 1.85% 2.74% 3.29% 4.57% 2.58% 2.58%Missouri 79,996 0.75% 0.79% 1.32% 1.68% 2.39% 1.31% 1.31%Nebraska 36,019 0.80% 1.75% 1.52% 2.04% 3.97% 2.07% 2.07%North Dakota 10,645 1.39% 0.85% 1.82% 3.13% 4.01% 1.81% 1.81%South Dakota 17,394 1.30% 0.87% 2.08% 2.05% 2.83% 2.68% 2.68%
South Atlantic:Delaware 20,578 0.79% 0.73% 2.00% 2.65% 3.63% 1.45% 1.45%District of Columbia 31,686 1.04% 0.72% 3.54% 2.54% 4.60% 2.94% 2.94%Florida 279,616 0.78% 0.85% 1.72% 1.50% 2.81% 1.78% 1.78%Georgia 128,284 0.89% 1.42% 1.12% 2.49% 3.66% 2.23% 2.23%Maryland 59,606 0.71% 1.74% 1.86% 1.72% 2.76% 2.02% 2.02%North Carolina 179,073 0.88% 1.23% 1.46% 2.84% 3.35% 1.63% 1.63%South Carolina 77,936 0.75% 1.30% 1.69% 1.75% 2.99% 1.69% 1.69%Virginia 122,080 0.50% 1.05% 1.57% 2.84% 2.95% 1.55% 1.55%West Virginia 52,574 2.06% 1.07% 2.31% 3.45% 4.58% 2.42% 2.42%
East South Central:Alabama 74,278 1.15% 1.60% 1.61% 1.56% 3.03% 1.92% 1.92%Kentucky 72,103 0.87% 0.75% 1.18% 2.02% 2.42% 1.18% 1.18%Mississippi 41,698 1.40% 0.87% 1.54% 2.86% 3.57% 1.86% 1.86%Tennessee 85,961 0.84% 0.68% 1.77% 2.18% 2.95% 1.30% 1.30%
West South Central:Arkansas 37,243 0.80% 1.11% 1.35% 2.69% 3.21% 1.39% 1.39%Louisiana 65,568 0.95% 1.40% 2.01% 2.34% 3.25% 1.58% 1.58%Oklahoma 56,039 0.87% 1.09% 2.34% 2.71% 3.52% 2.27% 2.27%Texas 581,609 0.82% 0.74% 0.86% 1.75% 2.75% 1.47% 1.47%
Mountain:Arizona 115,069 1.22% 0.67% 2.29% 2.36% 3.87% 1.81% 1.81%Colorado 115,822 1.43% 1.78% 2.45% 1.03% 4.11% 3.29% 3.29%Idaho 18,323 1.28% 1.21% 1.78% 2.86% 4.23% 2.07% 2.07%Montana 13,124 1.79% 1.75% 3.53% 3.07% 2.76% 2.60% 2.60%Nevada 54,232 0.94% 1.08% 1.78% 3.67% 4.58% 1.76% 1.76%New Mexico 28,445 0.77% 0.90% 2.24% 2.74% 3.43% 1.96% 1.96%Utah 63,906 0.69% 1.11% 1.77% 2.56% 3.60% 2.22% 2.22%Wyoming 9,550 1.44% 2.61% 2.24% 1.72% 3.11% 2.91% 2.91%
Pacific:Alaska 11,176 1.46% 1.31% 1.28% 3.26% 4.93% 2.58% 2.58%California 211,936 0.52% 0.40% 1.03% 1.09% 1.74% 0.80% 0.80%Hawaii 24,273 1.04% 1.64% 2.12% 2.48% 3.38% 2.40% 2.40%Oregon 55,251 1.01% 1.48% 0.78% 1.64% 2.24% 1.96% 1.96%Washington 122,443 1.15% 0.94% 2.09% 1.91% 3.06% 2.61% 2.61%
Source: Agency for Healthcare Research and Quality, Center for Financing, Access and Cost Trends. 2008 Medical Expenditure PanelSurvey-Insurance Component.Note: Definitions and descriptions of the methods used for this survey can be found in the Technical Appendix.* Figure does not meet standard of reliability or precision.Percents may not add to 100% because of rounding.
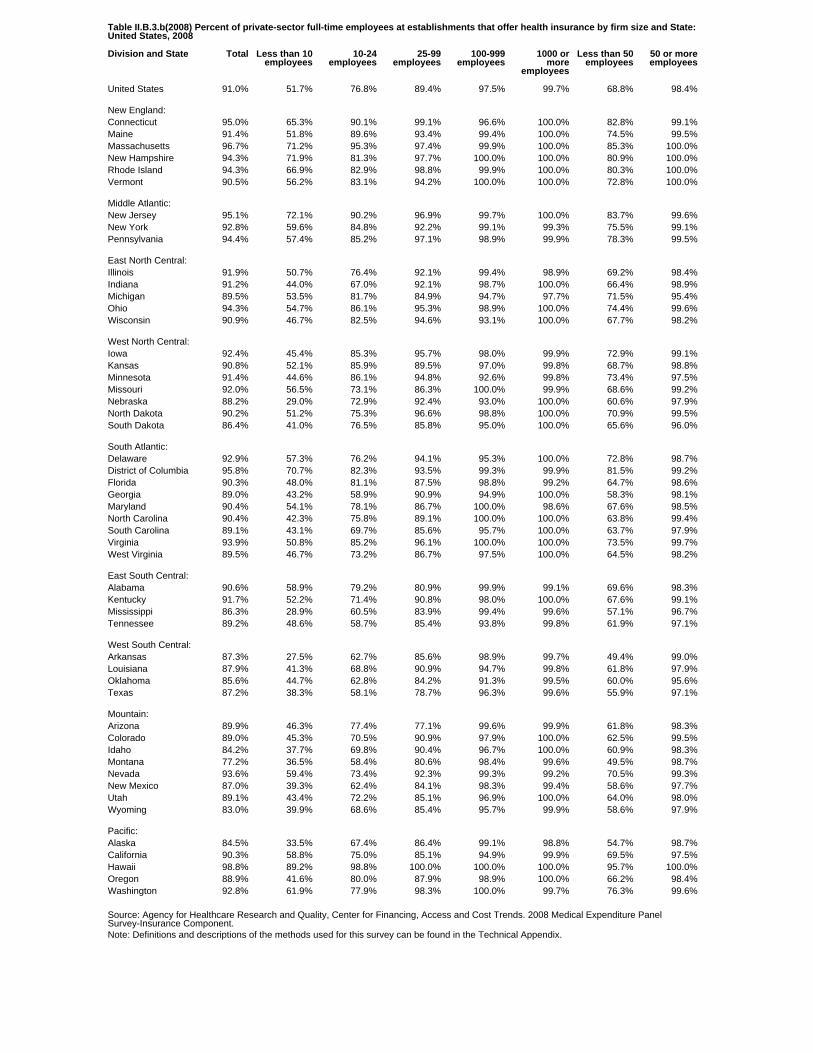
Table II.B.3.b(2008) Percent of private-sector full-time employees at establishments that offer health insurance by firm size and State:United States, 2008
Division and State Total Less than 10employees
10-24employees
25-99employees
100-999employees
1000 ormore
employees
Less than 50employees
50 or moreemployees
United States 91.0% 51.7% 76.8% 89.4% 97.5% 99.7% 68.8% 98.4%
New England:Connecticut 95.0% 65.3% 90.1% 99.1% 96.6% 100.0% 82.8% 99.1%Maine 91.4% 51.8% 89.6% 93.4% 99.4% 100.0% 74.5% 99.5%Massachusetts 96.7% 71.2% 95.3% 97.4% 99.9% 100.0% 85.3% 100.0%New Hampshire 94.3% 71.9% 81.3% 97.7% 100.0% 100.0% 80.9% 100.0%Rhode Island 94.3% 66.9% 82.9% 98.8% 99.9% 100.0% 80.3% 100.0%Vermont 90.5% 56.2% 83.1% 94.2% 100.0% 100.0% 72.8% 100.0%
Middle Atlantic:New Jersey 95.1% 72.1% 90.2% 96.9% 99.7% 100.0% 83.7% 99.6%New York 92.8% 59.6% 84.8% 92.2% 99.1% 99.3% 75.5% 99.1%Pennsylvania 94.4% 57.4% 85.2% 97.1% 98.9% 99.9% 78.3% 99.5%
East North Central:Illinois 91.9% 50.7% 76.4% 92.1% 99.4% 98.9% 69.2% 98.4%Indiana 91.2% 44.0% 67.0% 92.1% 98.7% 100.0% 66.4% 98.9%Michigan 89.5% 53.5% 81.7% 84.9% 94.7% 97.7% 71.5% 95.4%Ohio 94.3% 54.7% 86.1% 95.3% 98.9% 100.0% 74.4% 99.6%Wisconsin 90.9% 46.7% 82.5% 94.6% 93.1% 100.0% 67.7% 98.2%
West North Central:Iowa 92.4% 45.4% 85.3% 95.7% 98.0% 99.9% 72.9% 99.1%Kansas 90.8% 52.1% 85.9% 89.5% 97.0% 99.8% 68.7% 98.8%Minnesota 91.4% 44.6% 86.1% 94.8% 92.6% 99.8% 73.4% 97.5%Missouri 92.0% 56.5% 73.1% 86.3% 100.0% 99.9% 68.6% 99.2%Nebraska 88.2% 29.0% 72.9% 92.4% 93.0% 100.0% 60.6% 97.9%North Dakota 90.2% 51.2% 75.3% 96.6% 98.8% 100.0% 70.9% 99.5%South Dakota 86.4% 41.0% 76.5% 85.8% 95.0% 100.0% 65.6% 96.0%
South Atlantic:Delaware 92.9% 57.3% 76.2% 94.1% 95.3% 100.0% 72.8% 98.7%District of Columbia 95.8% 70.7% 82.3% 93.5% 99.3% 99.9% 81.5% 99.2%Florida 90.3% 48.0% 81.1% 87.5% 98.8% 99.2% 64.7% 98.6%Georgia 89.0% 43.2% 58.9% 90.9% 94.9% 100.0% 58.3% 98.1%Maryland 90.4% 54.1% 78.1% 86.7% 100.0% 98.6% 67.6% 98.5%North Carolina 90.4% 42.3% 75.8% 89.1% 100.0% 100.0% 63.8% 99.4%South Carolina 89.1% 43.1% 69.7% 85.6% 95.7% 100.0% 63.7% 97.9%Virginia 93.9% 50.8% 85.2% 96.1% 100.0% 100.0% 73.5% 99.7%West Virginia 89.5% 46.7% 73.2% 86.7% 97.5% 100.0% 64.5% 98.2%
East South Central:Alabama 90.6% 58.9% 79.2% 80.9% 99.9% 99.1% 69.6% 98.3%Kentucky 91.7% 52.2% 71.4% 90.8% 98.0% 100.0% 67.6% 99.1%Mississippi 86.3% 28.9% 60.5% 83.9% 99.4% 99.6% 57.1% 96.7%Tennessee 89.2% 48.6% 58.7% 85.4% 93.8% 99.8% 61.9% 97.1%
West South Central:Arkansas 87.3% 27.5% 62.7% 85.6% 98.9% 99.7% 49.4% 99.0%Louisiana 87.9% 41.3% 68.8% 90.9% 94.7% 99.8% 61.8% 97.9%Oklahoma 85.6% 44.7% 62.8% 84.2% 91.3% 99.5% 60.0% 95.6%Texas 87.2% 38.3% 58.1% 78.7% 96.3% 99.6% 55.9% 97.1%
Mountain:Arizona 89.9% 46.3% 77.4% 77.1% 99.6% 99.9% 61.8% 98.3%Colorado 89.0% 45.3% 70.5% 90.9% 97.9% 100.0% 62.5% 99.5%Idaho 84.2% 37.7% 69.8% 90.4% 96.7% 100.0% 60.9% 98.3%Montana 77.2% 36.5% 58.4% 80.6% 98.4% 99.6% 49.5% 98.7%Nevada 93.6% 59.4% 73.4% 92.3% 99.3% 99.2% 70.5% 99.3%New Mexico 87.0% 39.3% 62.4% 84.1% 98.3% 99.4% 58.6% 97.7%Utah 89.1% 43.4% 72.2% 85.1% 96.9% 100.0% 64.0% 98.0%Wyoming 83.0% 39.9% 68.6% 85.4% 95.7% 99.9% 58.6% 97.9%
Pacific:Alaska 84.5% 33.5% 67.4% 86.4% 99.1% 98.8% 54.7% 98.7%California 90.3% 58.8% 75.0% 85.1% 94.9% 99.9% 69.5% 97.5%Hawaii 98.8% 89.2% 98.8% 100.0% 100.0% 100.0% 95.7% 100.0%Oregon 88.9% 41.6% 80.0% 87.9% 98.9% 100.0% 66.2% 98.4%Washington 92.8% 61.9% 77.9% 98.3% 100.0% 99.7% 76.3% 99.6%
Source: Agency for Healthcare Research and Quality, Center for Financing, Access and Cost Trends. 2008 Medical Expenditure PanelSurvey-Insurance Component.Note: Definitions and descriptions of the methods used for this survey can be found in the Technical Appendix.
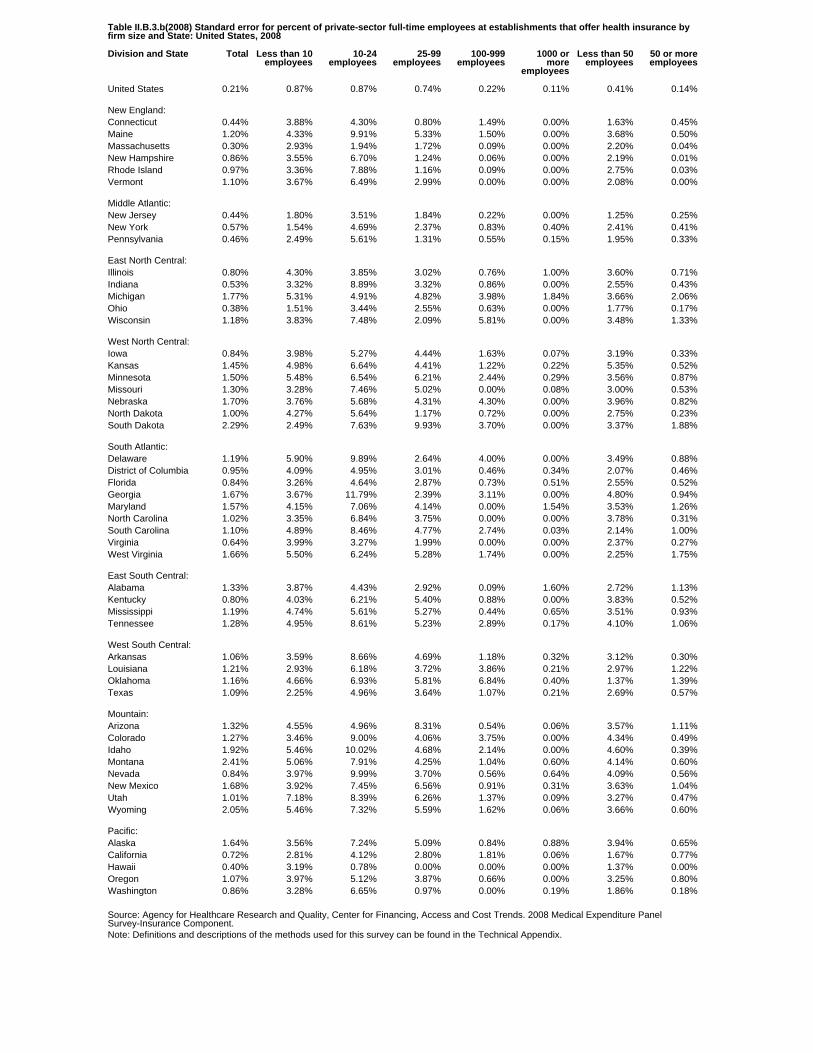
Table II.B.3.b(2008) Standard error for percent of private-sector full-time employees at establishments that offer health insurance byfirm size and State: United States, 2008
Division and State Total Less than 10employees
10-24employees
25-99employees
100-999employees
1000 ormore
employees
Less than 50employees
50 or moreemployees
United States 0.21% 0.87% 0.87% 0.74% 0.22% 0.11% 0.41% 0.14%
New England:Connecticut 0.44% 3.88% 4.30% 0.80% 1.49% 0.00% 1.63% 0.45%Maine 1.20% 4.33% 9.91% 5.33% 1.50% 0.00% 3.68% 0.50%Massachusetts 0.30% 2.93% 1.94% 1.72% 0.09% 0.00% 2.20% 0.04%New Hampshire 0.86% 3.55% 6.70% 1.24% 0.06% 0.00% 2.19% 0.01%Rhode Island 0.97% 3.36% 7.88% 1.16% 0.09% 0.00% 2.75% 0.03%Vermont 1.10% 3.67% 6.49% 2.99% 0.00% 0.00% 2.08% 0.00%
Middle Atlantic:New Jersey 0.44% 1.80% 3.51% 1.84% 0.22% 0.00% 1.25% 0.25%New York 0.57% 1.54% 4.69% 2.37% 0.83% 0.40% 2.41% 0.41%Pennsylvania 0.46% 2.49% 5.61% 1.31% 0.55% 0.15% 1.95% 0.33%
East North Central:Illinois 0.80% 4.30% 3.85% 3.02% 0.76% 1.00% 3.60% 0.71%Indiana 0.53% 3.32% 8.89% 3.32% 0.86% 0.00% 2.55% 0.43%Michigan 1.77% 5.31% 4.91% 4.82% 3.98% 1.84% 3.66% 2.06%Ohio 0.38% 1.51% 3.44% 2.55% 0.63% 0.00% 1.77% 0.17%Wisconsin 1.18% 3.83% 7.48% 2.09% 5.81% 0.00% 3.48% 1.33%
West North Central:Iowa 0.84% 3.98% 5.27% 4.44% 1.63% 0.07% 3.19% 0.33%Kansas 1.45% 4.98% 6.64% 4.41% 1.22% 0.22% 5.35% 0.52%Minnesota 1.50% 5.48% 6.54% 6.21% 2.44% 0.29% 3.56% 0.87%Missouri 1.30% 3.28% 7.46% 5.02% 0.00% 0.08% 3.00% 0.53%Nebraska 1.70% 3.76% 5.68% 4.31% 4.30% 0.00% 3.96% 0.82%North Dakota 1.00% 4.27% 5.64% 1.17% 0.72% 0.00% 2.75% 0.23%South Dakota 2.29% 2.49% 7.63% 9.93% 3.70% 0.00% 3.37% 1.88%
South Atlantic:Delaware 1.19% 5.90% 9.89% 2.64% 4.00% 0.00% 3.49% 0.88%District of Columbia 0.95% 4.09% 4.95% 3.01% 0.46% 0.34% 2.07% 0.46%Florida 0.84% 3.26% 4.64% 2.87% 0.73% 0.51% 2.55% 0.52%Georgia 1.67% 3.67% 11.79% 2.39% 3.11% 0.00% 4.80% 0.94%Maryland 1.57% 4.15% 7.06% 4.14% 0.00% 1.54% 3.53% 1.26%North Carolina 1.02% 3.35% 6.84% 3.75% 0.00% 0.00% 3.78% 0.31%South Carolina 1.10% 4.89% 8.46% 4.77% 2.74% 0.03% 2.14% 1.00%Virginia 0.64% 3.99% 3.27% 1.99% 0.00% 0.00% 2.37% 0.27%West Virginia 1.66% 5.50% 6.24% 5.28% 1.74% 0.00% 2.25% 1.75%
East South Central:Alabama 1.33% 3.87% 4.43% 2.92% 0.09% 1.60% 2.72% 1.13%Kentucky 0.80% 4.03% 6.21% 5.40% 0.88% 0.00% 3.83% 0.52%Mississippi 1.19% 4.74% 5.61% 5.27% 0.44% 0.65% 3.51% 0.93%Tennessee 1.28% 4.95% 8.61% 5.23% 2.89% 0.17% 4.10% 1.06%
West South Central:Arkansas 1.06% 3.59% 8.66% 4.69% 1.18% 0.32% 3.12% 0.30%Louisiana 1.21% 2.93% 6.18% 3.72% 3.86% 0.21% 2.97% 1.22%Oklahoma 1.16% 4.66% 6.93% 5.81% 6.84% 0.40% 1.37% 1.39%Texas 1.09% 2.25% 4.96% 3.64% 1.07% 0.21% 2.69% 0.57%
Mountain:Arizona 1.32% 4.55% 4.96% 8.31% 0.54% 0.06% 3.57% 1.11%Colorado 1.27% 3.46% 9.00% 4.06% 3.75% 0.00% 4.34% 0.49%Idaho 1.92% 5.46% 10.02% 4.68% 2.14% 0.00% 4.60% 0.39%Montana 2.41% 5.06% 7.91% 4.25% 1.04% 0.60% 4.14% 0.60%Nevada 0.84% 3.97% 9.99% 3.70% 0.56% 0.64% 4.09% 0.56%New Mexico 1.68% 3.92% 7.45% 6.56% 0.91% 0.31% 3.63% 1.04%Utah 1.01% 7.18% 8.39% 6.26% 1.37% 0.09% 3.27% 0.47%Wyoming 2.05% 5.46% 7.32% 5.59% 1.62% 0.06% 3.66% 0.60%
Pacific:Alaska 1.64% 3.56% 7.24% 5.09% 0.84% 0.88% 3.94% 0.65%California 0.72% 2.81% 4.12% 2.80% 1.81% 0.06% 1.67% 0.77%Hawaii 0.40% 3.19% 0.78% 0.00% 0.00% 0.00% 1.37% 0.00%Oregon 1.07% 3.97% 5.12% 3.87% 0.66% 0.00% 3.25% 0.80%Washington 0.86% 3.28% 6.65% 0.97% 0.00% 0.19% 1.86% 0.18%
Source: Agency for Healthcare Research and Quality, Center for Financing, Access and Cost Trends. 2008 Medical Expenditure PanelSurvey-Insurance Component.Note: Definitions and descriptions of the methods used for this survey can be found in the Technical Appendix.

Table II.B.3.b.(1)(2008) Percent of private-sector full-time employees eligible for health insurance at establishments that offer healthinsurance by firm size and State: United States, 2008
Division and State Total Less than 10employees
10-24employees
25-99employees
100-999employees
1000 ormore
employees
Less than 50employees
50 or moreemployees
United States 87.4% 92.4% 89.8% 87.5% 86.3% 86.9% 89.9% 86.8%
New England:Connecticut 88.8% 92.2% 86.6% 95.4% 90.2% 86.5% 90.4% 88.4%Maine 89.7% 92.8% 84.2% 92.2% 89.4% 90.3% 90.4% 89.5%Massachusetts 87.3% 89.4% 93.0% 94.2% 84.9% 85.5% 91.0% 86.4%New Hampshire 90.1% 91.2% 89.0% 87.5% 91.5% 90.4% 87.0% 91.1%Rhode Island 88.8% 90.0% 88.6% 96.4% 90.6% 85.5% 91.3% 88.1%Vermont 88.0% 90.0% 88.6% 91.2% 89.4% 85.4% 90.7% 86.9%
Middle Atlantic:New Jersey 84.0% 90.5% 93.6% 88.8% 65.5% 87.2% 91.3% 81.6%New York 87.3% 93.9% 85.8% 88.8% 85.4% 87.1% 88.5% 86.9%Pennsylvania 86.8% 90.2% 87.6% 85.0% 82.3% 88.9% 86.1% 87.0%
East North Central:Illinois 87.7% 92.0% 94.3% 86.1% 82.9% 88.9% 89.7% 87.2%Indiana 91.8% 93.1% 90.2% 91.9% 92.4% 91.6% 90.0% 92.2%Michigan 87.5% 91.8% 87.5% 95.9% 87.0% 85.1% 90.6% 86.7%Ohio 90.5% 92.4% 96.4% 92.0% 89.6% 89.6% 92.4% 90.1%Wisconsin 89.3% 92.5% 88.2% 90.2% 87.8% 89.3% 91.1% 88.9%
West North Central:Iowa 89.4% 90.2% 95.6% 82.8% 92.2% 89.1% 91.3% 88.9%Kansas 89.1% 93.5% 89.9% 94.1% 86.4% 87.8% 92.8% 88.2%Minnesota 91.3% 89.7% 87.9% 86.4% 89.9% 94.0% 89.1% 91.8%Missouri 88.4% 92.6% 92.5% 90.6% 89.3% 86.8% 89.5% 88.2%Nebraska 90.9% 91.6% 82.4% 88.6% 91.9% 92.2% 85.9% 92.0%North Dakota 89.4% 88.8% 87.2% 82.7% 86.9% 94.4% 84.3% 91.2%South Dakota 86.7% 90.7% 88.7% 73.6% 88.5% 89.1% 81.1% 88.5%
South Atlantic:Delaware 87.8% 94.5% 82.8% 82.9% 91.7% 87.9% 86.2% 88.2%District of Columbia 90.9% 97.6% 92.5% 89.5% 90.3% 90.8% 93.4% 90.4%Florida 86.6% 94.4% 91.2% 82.9% 86.7% 86.0% 92.5% 85.4%Georgia 87.9% 92.9% 88.7% 88.2% 89.4% 86.8% 92.4% 87.1%Maryland 88.0% 90.6% 92.7% 90.1% 81.4% 88.7% 89.6% 87.6%North Carolina 86.5% 93.6% 87.2% 88.2% 85.2% 85.8% 88.8% 86.0%South Carolina 88.2% 92.8% 87.6% 90.7% 88.5% 87.2% 91.7% 87.4%Virginia 88.6% 95.2% 89.8% 85.6% 89.8% 88.2% 89.4% 88.5%West Virginia 84.9% 94.3% 89.5% 83.2% 83.2% 84.3% 88.8% 84.0%
East South Central:Alabama 86.2% 93.9% 89.0% 89.2% 85.6% 84.2% 91.4% 84.8%Kentucky 90.0% 91.8% 90.7% 89.2% 95.2% 88.2% 92.3% 89.5%Mississippi 88.0% 93.2% 87.6% 86.2% 87.8% 88.3% 87.8% 88.1%Tennessee 85.7% 90.0% 91.6% 85.4% 89.0% 83.7% 86.8% 85.5%
West South Central:Arkansas 87.1% 87.9% 92.7% 86.4% 89.9% 85.6% 87.3% 87.1%Louisiana 84.4% 91.3% 88.7% 77.6% 82.4% 85.9% 86.9% 83.8%Oklahoma 81.7% 91.8% 83.6% 82.7% 83.2% 79.1% 88.3% 80.0%Texas 85.5% 95.7% 94.5% 88.2% 83.0% 84.2% 93.7% 84.0%
Mountain:Arizona 83.7% 93.5% 90.7% 78.3% 84.0% 83.2% 90.0% 82.5%Colorado 85.5% 94.2% 86.1% 81.7% 81.4% 86.7% 89.3% 84.5%Idaho 85.2% 87.4% 83.4% 86.2% 83.1% 85.6% 85.4% 85.1%Montana 85.9% 90.6% 89.5% 88.6% 81.0% 86.0% 90.6% 84.0%Nevada 89.2% 94.1% 79.8% 85.8% 89.2% 90.3% 90.5% 88.9%New Mexico 85.5% 89.4% 84.2% 83.9% 83.7% 86.4% 84.8% 85.7%Utah 82.8% 93.8% 89.0% 82.7% 80.2% 82.0% 88.7% 81.4%Wyoming 85.9% 83.6% 89.4% 88.0% 77.1% 88.1% 87.8% 85.3%
Pacific:Alaska 82.4% 76.5% 86.4% 82.9% 84.4% 81.2% 83.1% 82.3%California 87.5% 91.5% 89.7% 85.8% 91.1% 86.0% 88.6% 87.3%Hawaii 88.4% 95.5% 89.4% 85.8% 83.4% 91.1% 92.9% 86.8%Oregon 89.9% 90.0% 89.9% 94.0% 85.9% 90.0% 91.8% 89.4%Washington 86.6% 93.3% 89.3% 85.8% 88.4% 84.5% 90.1% 85.5%
Source: Agency for Healthcare Research and Quality, Center for Financing, Access and Cost Trends. 2008 Medical Expenditure PanelSurvey-Insurance Component.Note: Definitions and descriptions of the methods used for this survey can be found in the Technical Appendix.
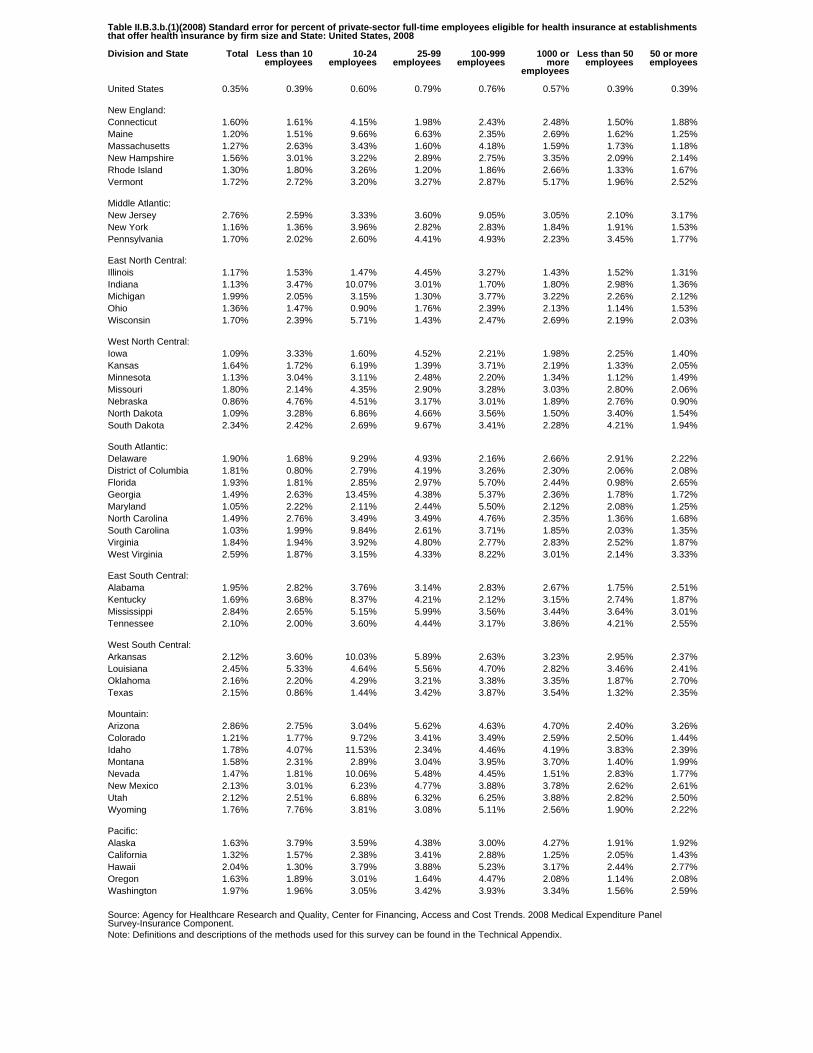
Table II.B.3.b.(1)(2008) Standard error for percent of private-sector full-time employees eligible for health insurance at establishmentsthat offer health insurance by firm size and State: United States, 2008
Division and State Total Less than 10employees
10-24employees
25-99employees
100-999employees
1000 ormore
employees
Less than 50employees
50 or moreemployees
United States 0.35% 0.39% 0.60% 0.79% 0.76% 0.57% 0.39% 0.39%
New England:Connecticut 1.60% 1.61% 4.15% 1.98% 2.43% 2.48% 1.50% 1.88%Maine 1.20% 1.51% 9.66% 6.63% 2.35% 2.69% 1.62% 1.25%Massachusetts 1.27% 2.63% 3.43% 1.60% 4.18% 1.59% 1.73% 1.18%New Hampshire 1.56% 3.01% 3.22% 2.89% 2.75% 3.35% 2.09% 2.14%Rhode Island 1.30% 1.80% 3.26% 1.20% 1.86% 2.66% 1.33% 1.67%Vermont 1.72% 2.72% 3.20% 3.27% 2.87% 5.17% 1.96% 2.52%
Middle Atlantic:New Jersey 2.76% 2.59% 3.33% 3.60% 9.05% 3.05% 2.10% 3.17%New York 1.16% 1.36% 3.96% 2.82% 2.83% 1.84% 1.91% 1.53%Pennsylvania 1.70% 2.02% 2.60% 4.41% 4.93% 2.23% 3.45% 1.77%
East North Central:Illinois 1.17% 1.53% 1.47% 4.45% 3.27% 1.43% 1.52% 1.31%Indiana 1.13% 3.47% 10.07% 3.01% 1.70% 1.80% 2.98% 1.36%Michigan 1.99% 2.05% 3.15% 1.30% 3.77% 3.22% 2.26% 2.12%Ohio 1.36% 1.47% 0.90% 1.76% 2.39% 2.13% 1.14% 1.53%Wisconsin 1.70% 2.39% 5.71% 1.43% 2.47% 2.69% 2.19% 2.03%
West North Central:Iowa 1.09% 3.33% 1.60% 4.52% 2.21% 1.98% 2.25% 1.40%Kansas 1.64% 1.72% 6.19% 1.39% 3.71% 2.19% 1.33% 2.05%Minnesota 1.13% 3.04% 3.11% 2.48% 2.20% 1.34% 1.12% 1.49%Missouri 1.80% 2.14% 4.35% 2.90% 3.28% 3.03% 2.80% 2.06%Nebraska 0.86% 4.76% 4.51% 3.17% 3.01% 1.89% 2.76% 0.90%North Dakota 1.09% 3.28% 6.86% 4.66% 3.56% 1.50% 3.40% 1.54%South Dakota 2.34% 2.42% 2.69% 9.67% 3.41% 2.28% 4.21% 1.94%
South Atlantic:Delaware 1.90% 1.68% 9.29% 4.93% 2.16% 2.66% 2.91% 2.22%District of Columbia 1.81% 0.80% 2.79% 4.19% 3.26% 2.30% 2.06% 2.08%Florida 1.93% 1.81% 2.85% 2.97% 5.70% 2.44% 0.98% 2.65%Georgia 1.49% 2.63% 13.45% 4.38% 5.37% 2.36% 1.78% 1.72%Maryland 1.05% 2.22% 2.11% 2.44% 5.50% 2.12% 2.08% 1.25%North Carolina 1.49% 2.76% 3.49% 3.49% 4.76% 2.35% 1.36% 1.68%South Carolina 1.03% 1.99% 9.84% 2.61% 3.71% 1.85% 2.03% 1.35%Virginia 1.84% 1.94% 3.92% 4.80% 2.77% 2.83% 2.52% 1.87%West Virginia 2.59% 1.87% 3.15% 4.33% 8.22% 3.01% 2.14% 3.33%
East South Central:Alabama 1.95% 2.82% 3.76% 3.14% 2.83% 2.67% 1.75% 2.51%Kentucky 1.69% 3.68% 8.37% 4.21% 2.12% 3.15% 2.74% 1.87%Mississippi 2.84% 2.65% 5.15% 5.99% 3.56% 3.44% 3.64% 3.01%Tennessee 2.10% 2.00% 3.60% 4.44% 3.17% 3.86% 4.21% 2.55%
West South Central:Arkansas 2.12% 3.60% 10.03% 5.89% 2.63% 3.23% 2.95% 2.37%Louisiana 2.45% 5.33% 4.64% 5.56% 4.70% 2.82% 3.46% 2.41%Oklahoma 2.16% 2.20% 4.29% 3.21% 3.38% 3.35% 1.87% 2.70%Texas 2.15% 0.86% 1.44% 3.42% 3.87% 3.54% 1.32% 2.35%
Mountain:Arizona 2.86% 2.75% 3.04% 5.62% 4.63% 4.70% 2.40% 3.26%Colorado 1.21% 1.77% 9.72% 3.41% 3.49% 2.59% 2.50% 1.44%Idaho 1.78% 4.07% 11.53% 2.34% 4.46% 4.19% 3.83% 2.39%Montana 1.58% 2.31% 2.89% 3.04% 3.95% 3.70% 1.40% 1.99%Nevada 1.47% 1.81% 10.06% 5.48% 4.45% 1.51% 2.83% 1.77%New Mexico 2.13% 3.01% 6.23% 4.77% 3.88% 3.78% 2.62% 2.61%Utah 2.12% 2.51% 6.88% 6.32% 6.25% 3.88% 2.82% 2.50%Wyoming 1.76% 7.76% 3.81% 3.08% 5.11% 2.56% 1.90% 2.22%
Pacific:Alaska 1.63% 3.79% 3.59% 4.38% 3.00% 4.27% 1.91% 1.92%California 1.32% 1.57% 2.38% 3.41% 2.88% 1.25% 2.05% 1.43%Hawaii 2.04% 1.30% 3.79% 3.88% 5.23% 3.17% 2.44% 2.77%Oregon 1.63% 1.89% 3.01% 1.64% 4.47% 2.08% 1.14% 2.08%Washington 1.97% 1.96% 3.05% 3.42% 3.93% 3.34% 1.56% 2.59%
Source: Agency for Healthcare Research and Quality, Center for Financing, Access and Cost Trends. 2008 Medical Expenditure PanelSurvey-Insurance Component.Note: Definitions and descriptions of the methods used for this survey can be found in the Technical Appendix.
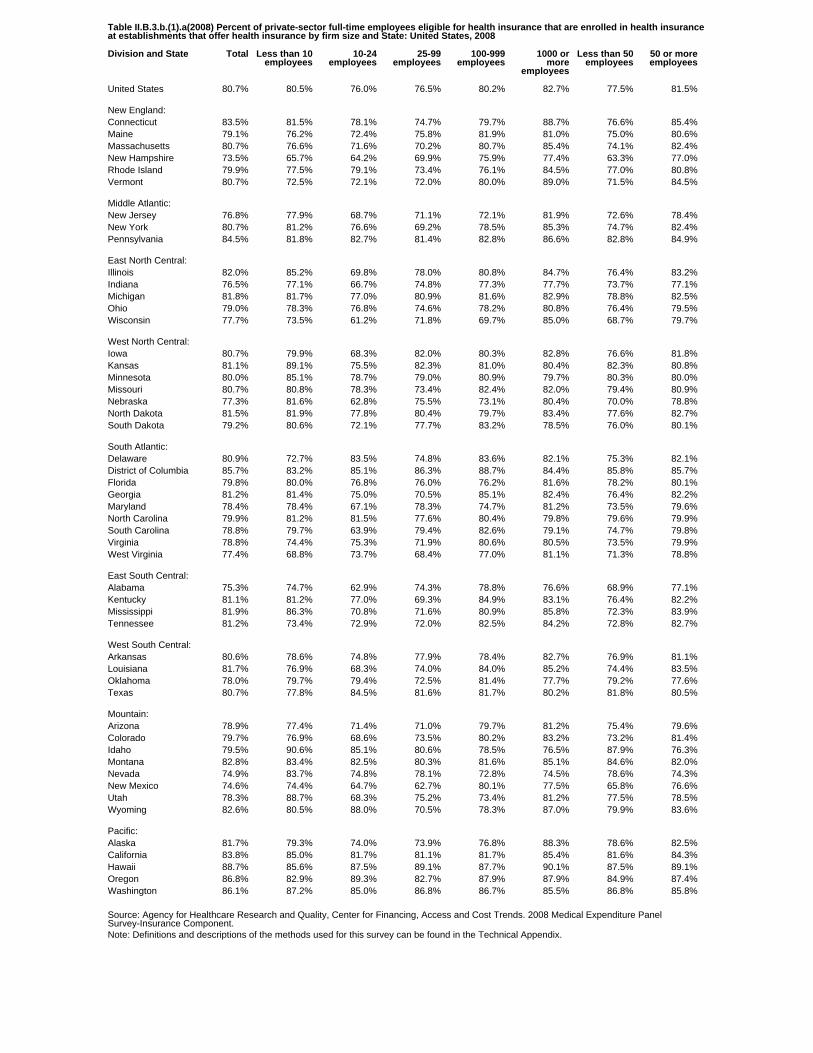
Table II.B.3.b.(1).a(2008) Percent of private-sector full-time employees eligible for health insurance that are enrolled in health insuranceat establishments that offer health insurance by firm size and State: United States, 2008
Division and State Total Less than 10employees
10-24employees
25-99employees
100-999employees
1000 ormore
employees
Less than 50employees
50 or moreemployees
United States 80.7% 80.5% 76.0% 76.5% 80.2% 82.7% 77.5% 81.5%
New England:Connecticut 83.5% 81.5% 78.1% 74.7% 79.7% 88.7% 76.6% 85.4%Maine 79.1% 76.2% 72.4% 75.8% 81.9% 81.0% 75.0% 80.6%Massachusetts 80.7% 76.6% 71.6% 70.2% 80.7% 85.4% 74.1% 82.4%New Hampshire 73.5% 65.7% 64.2% 69.9% 75.9% 77.4% 63.3% 77.0%Rhode Island 79.9% 77.5% 79.1% 73.4% 76.1% 84.5% 77.0% 80.8%Vermont 80.7% 72.5% 72.1% 72.0% 80.0% 89.0% 71.5% 84.5%
Middle Atlantic:New Jersey 76.8% 77.9% 68.7% 71.1% 72.1% 81.9% 72.6% 78.4%New York 80.7% 81.2% 76.6% 69.2% 78.5% 85.3% 74.7% 82.4%Pennsylvania 84.5% 81.8% 82.7% 81.4% 82.8% 86.6% 82.8% 84.9%
East North Central:Illinois 82.0% 85.2% 69.8% 78.0% 80.8% 84.7% 76.4% 83.2%Indiana 76.5% 77.1% 66.7% 74.8% 77.3% 77.7% 73.7% 77.1%Michigan 81.8% 81.7% 77.0% 80.9% 81.6% 82.9% 78.8% 82.5%Ohio 79.0% 78.3% 76.8% 74.6% 78.2% 80.8% 76.4% 79.5%Wisconsin 77.7% 73.5% 61.2% 71.8% 69.7% 85.0% 68.7% 79.7%
West North Central:Iowa 80.7% 79.9% 68.3% 82.0% 80.3% 82.8% 76.6% 81.8%Kansas 81.1% 89.1% 75.5% 82.3% 81.0% 80.4% 82.3% 80.8%Minnesota 80.0% 85.1% 78.7% 79.0% 80.9% 79.7% 80.3% 80.0%Missouri 80.7% 80.8% 78.3% 73.4% 82.4% 82.0% 79.4% 80.9%Nebraska 77.3% 81.6% 62.8% 75.5% 73.1% 80.4% 70.0% 78.8%North Dakota 81.5% 81.9% 77.8% 80.4% 79.7% 83.4% 77.6% 82.7%South Dakota 79.2% 80.6% 72.1% 77.7% 83.2% 78.5% 76.0% 80.1%
South Atlantic:Delaware 80.9% 72.7% 83.5% 74.8% 83.6% 82.1% 75.3% 82.1%District of Columbia 85.7% 83.2% 85.1% 86.3% 88.7% 84.4% 85.8% 85.7%Florida 79.8% 80.0% 76.8% 76.0% 76.2% 81.6% 78.2% 80.1%Georgia 81.2% 81.4% 75.0% 70.5% 85.1% 82.4% 76.4% 82.2%Maryland 78.4% 78.4% 67.1% 78.3% 74.7% 81.2% 73.5% 79.6%North Carolina 79.9% 81.2% 81.5% 77.6% 80.4% 79.8% 79.6% 79.9%South Carolina 78.8% 79.7% 63.9% 79.4% 82.6% 79.1% 74.7% 79.8%Virginia 78.8% 74.4% 75.3% 71.9% 80.6% 80.5% 73.5% 79.9%West Virginia 77.4% 68.8% 73.7% 68.4% 77.0% 81.1% 71.3% 78.8%
East South Central:Alabama 75.3% 74.7% 62.9% 74.3% 78.8% 76.6% 68.9% 77.1%Kentucky 81.1% 81.2% 77.0% 69.3% 84.9% 83.1% 76.4% 82.2%Mississippi 81.9% 86.3% 70.8% 71.6% 80.9% 85.8% 72.3% 83.9%Tennessee 81.2% 73.4% 72.9% 72.0% 82.5% 84.2% 72.8% 82.7%
West South Central:Arkansas 80.6% 78.6% 74.8% 77.9% 78.4% 82.7% 76.9% 81.1%Louisiana 81.7% 76.9% 68.3% 74.0% 84.0% 85.2% 74.4% 83.5%Oklahoma 78.0% 79.7% 79.4% 72.5% 81.4% 77.7% 79.2% 77.6%Texas 80.7% 77.8% 84.5% 81.6% 81.7% 80.2% 81.8% 80.5%
Mountain:Arizona 78.9% 77.4% 71.4% 71.0% 79.7% 81.2% 75.4% 79.6%Colorado 79.7% 76.9% 68.6% 73.5% 80.2% 83.2% 73.2% 81.4%Idaho 79.5% 90.6% 85.1% 80.6% 78.5% 76.5% 87.9% 76.3%Montana 82.8% 83.4% 82.5% 80.3% 81.6% 85.1% 84.6% 82.0%Nevada 74.9% 83.7% 74.8% 78.1% 72.8% 74.5% 78.6% 74.3%New Mexico 74.6% 74.4% 64.7% 62.7% 80.1% 77.5% 65.8% 76.6%Utah 78.3% 88.7% 68.3% 75.2% 73.4% 81.2% 77.5% 78.5%Wyoming 82.6% 80.5% 88.0% 70.5% 78.3% 87.0% 79.9% 83.6%
Pacific:Alaska 81.7% 79.3% 74.0% 73.9% 76.8% 88.3% 78.6% 82.5%California 83.8% 85.0% 81.7% 81.1% 81.7% 85.4% 81.6% 84.3%Hawaii 88.7% 85.6% 87.5% 89.1% 87.7% 90.1% 87.5% 89.1%Oregon 86.8% 82.9% 89.3% 82.7% 87.9% 87.9% 84.9% 87.4%Washington 86.1% 87.2% 85.0% 86.8% 86.7% 85.5% 86.8% 85.8%
Source: Agency for Healthcare Research and Quality, Center for Financing, Access and Cost Trends. 2008 Medical Expenditure PanelSurvey-Insurance Component.Note: Definitions and descriptions of the methods used for this survey can be found in the Technical Appendix.
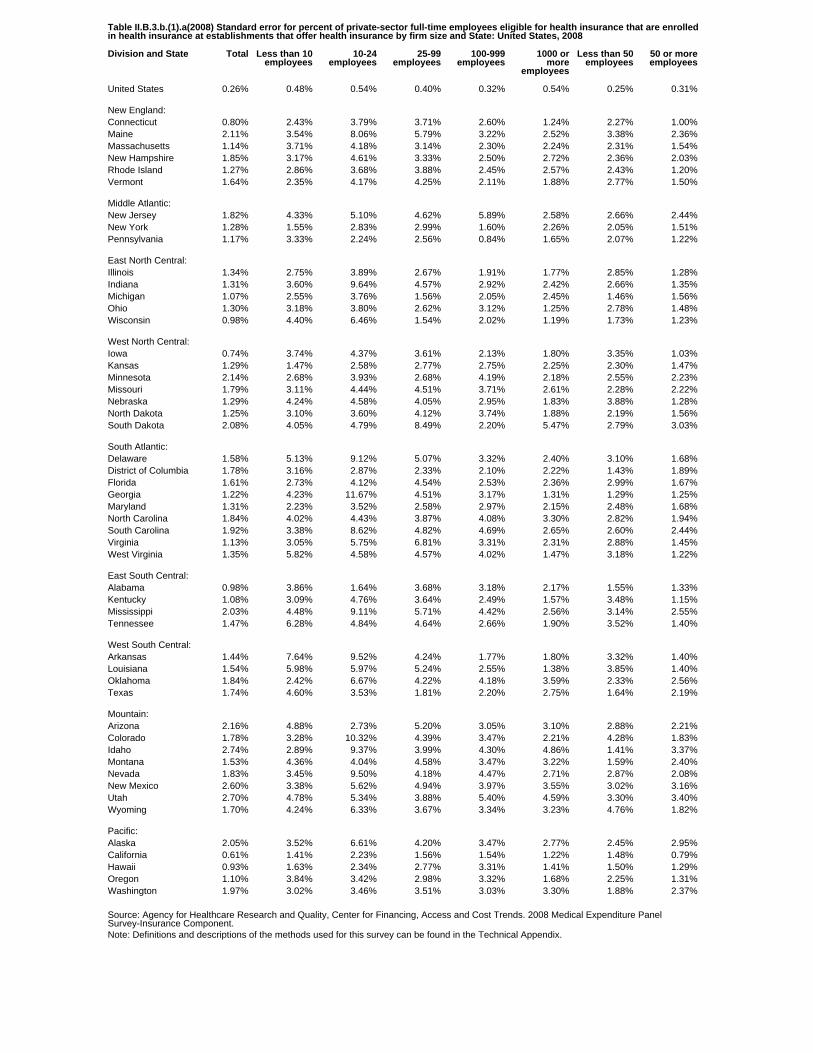
Table II.B.3.b.(1).a(2008) Standard error for percent of private-sector full-time employees eligible for health insurance that are enrolledin health insurance at establishments that offer health insurance by firm size and State: United States, 2008
Division and State Total Less than 10employees
10-24employees
25-99employees
100-999employees
1000 ormore
employees
Less than 50employees
50 or moreemployees
United States 0.26% 0.48% 0.54% 0.40% 0.32% 0.54% 0.25% 0.31%
New England:Connecticut 0.80% 2.43% 3.79% 3.71% 2.60% 1.24% 2.27% 1.00%Maine 2.11% 3.54% 8.06% 5.79% 3.22% 2.52% 3.38% 2.36%Massachusetts 1.14% 3.71% 4.18% 3.14% 2.30% 2.24% 2.31% 1.54%New Hampshire 1.85% 3.17% 4.61% 3.33% 2.50% 2.72% 2.36% 2.03%Rhode Island 1.27% 2.86% 3.68% 3.88% 2.45% 2.57% 2.43% 1.20%Vermont 1.64% 2.35% 4.17% 4.25% 2.11% 1.88% 2.77% 1.50%
Middle Atlantic:New Jersey 1.82% 4.33% 5.10% 4.62% 5.89% 2.58% 2.66% 2.44%New York 1.28% 1.55% 2.83% 2.99% 1.60% 2.26% 2.05% 1.51%Pennsylvania 1.17% 3.33% 2.24% 2.56% 0.84% 1.65% 2.07% 1.22%
East North Central:Illinois 1.34% 2.75% 3.89% 2.67% 1.91% 1.77% 2.85% 1.28%Indiana 1.31% 3.60% 9.64% 4.57% 2.92% 2.42% 2.66% 1.35%Michigan 1.07% 2.55% 3.76% 1.56% 2.05% 2.45% 1.46% 1.56%Ohio 1.30% 3.18% 3.80% 2.62% 3.12% 1.25% 2.78% 1.48%Wisconsin 0.98% 4.40% 6.46% 1.54% 2.02% 1.19% 1.73% 1.23%
West North Central:Iowa 0.74% 3.74% 4.37% 3.61% 2.13% 1.80% 3.35% 1.03%Kansas 1.29% 1.47% 2.58% 2.77% 2.75% 2.25% 2.30% 1.47%Minnesota 2.14% 2.68% 3.93% 2.68% 4.19% 2.18% 2.55% 2.23%Missouri 1.79% 3.11% 4.44% 4.51% 3.71% 2.61% 2.28% 2.22%Nebraska 1.29% 4.24% 4.58% 4.05% 2.95% 1.83% 3.88% 1.28%North Dakota 1.25% 3.10% 3.60% 4.12% 3.74% 1.88% 2.19% 1.56%South Dakota 2.08% 4.05% 4.79% 8.49% 2.20% 5.47% 2.79% 3.03%
South Atlantic:Delaware 1.58% 5.13% 9.12% 5.07% 3.32% 2.40% 3.10% 1.68%District of Columbia 1.78% 3.16% 2.87% 2.33% 2.10% 2.22% 1.43% 1.89%Florida 1.61% 2.73% 4.12% 4.54% 2.53% 2.36% 2.99% 1.67%Georgia 1.22% 4.23% 11.67% 4.51% 3.17% 1.31% 1.29% 1.25%Maryland 1.31% 2.23% 3.52% 2.58% 2.97% 2.15% 2.48% 1.68%North Carolina 1.84% 4.02% 4.43% 3.87% 4.08% 3.30% 2.82% 1.94%South Carolina 1.92% 3.38% 8.62% 4.82% 4.69% 2.65% 2.60% 2.44%Virginia 1.13% 3.05% 5.75% 6.81% 3.31% 2.31% 2.88% 1.45%West Virginia 1.35% 5.82% 4.58% 4.57% 4.02% 1.47% 3.18% 1.22%
East South Central:Alabama 0.98% 3.86% 1.64% 3.68% 3.18% 2.17% 1.55% 1.33%Kentucky 1.08% 3.09% 4.76% 3.64% 2.49% 1.57% 3.48% 1.15%Mississippi 2.03% 4.48% 9.11% 5.71% 4.42% 2.56% 3.14% 2.55%Tennessee 1.47% 6.28% 4.84% 4.64% 2.66% 1.90% 3.52% 1.40%
West South Central:Arkansas 1.44% 7.64% 9.52% 4.24% 1.77% 1.80% 3.32% 1.40%Louisiana 1.54% 5.98% 5.97% 5.24% 2.55% 1.38% 3.85% 1.40%Oklahoma 1.84% 2.42% 6.67% 4.22% 4.18% 3.59% 2.33% 2.56%Texas 1.74% 4.60% 3.53% 1.81% 2.20% 2.75% 1.64% 2.19%
Mountain:Arizona 2.16% 4.88% 2.73% 5.20% 3.05% 3.10% 2.88% 2.21%Colorado 1.78% 3.28% 10.32% 4.39% 3.47% 2.21% 4.28% 1.83%Idaho 2.74% 2.89% 9.37% 3.99% 4.30% 4.86% 1.41% 3.37%Montana 1.53% 4.36% 4.04% 4.58% 3.47% 3.22% 1.59% 2.40%Nevada 1.83% 3.45% 9.50% 4.18% 4.47% 2.71% 2.87% 2.08%New Mexico 2.60% 3.38% 5.62% 4.94% 3.97% 3.55% 3.02% 3.16%Utah 2.70% 4.78% 5.34% 3.88% 5.40% 4.59% 3.30% 3.40%Wyoming 1.70% 4.24% 6.33% 3.67% 3.34% 3.23% 4.76% 1.82%
Pacific:Alaska 2.05% 3.52% 6.61% 4.20% 3.47% 2.77% 2.45% 2.95%California 0.61% 1.41% 2.23% 1.56% 1.54% 1.22% 1.48% 0.79%Hawaii 0.93% 1.63% 2.34% 2.77% 3.31% 1.41% 1.50% 1.29%Oregon 1.10% 3.84% 3.42% 2.98% 3.32% 1.68% 2.25% 1.31%Washington 1.97% 3.02% 3.46% 3.51% 3.03% 3.30% 1.88% 2.37%
Source: Agency for Healthcare Research and Quality, Center for Financing, Access and Cost Trends. 2008 Medical Expenditure PanelSurvey-Insurance Component.Note: Definitions and descriptions of the methods used for this survey can be found in the Technical Appendix.
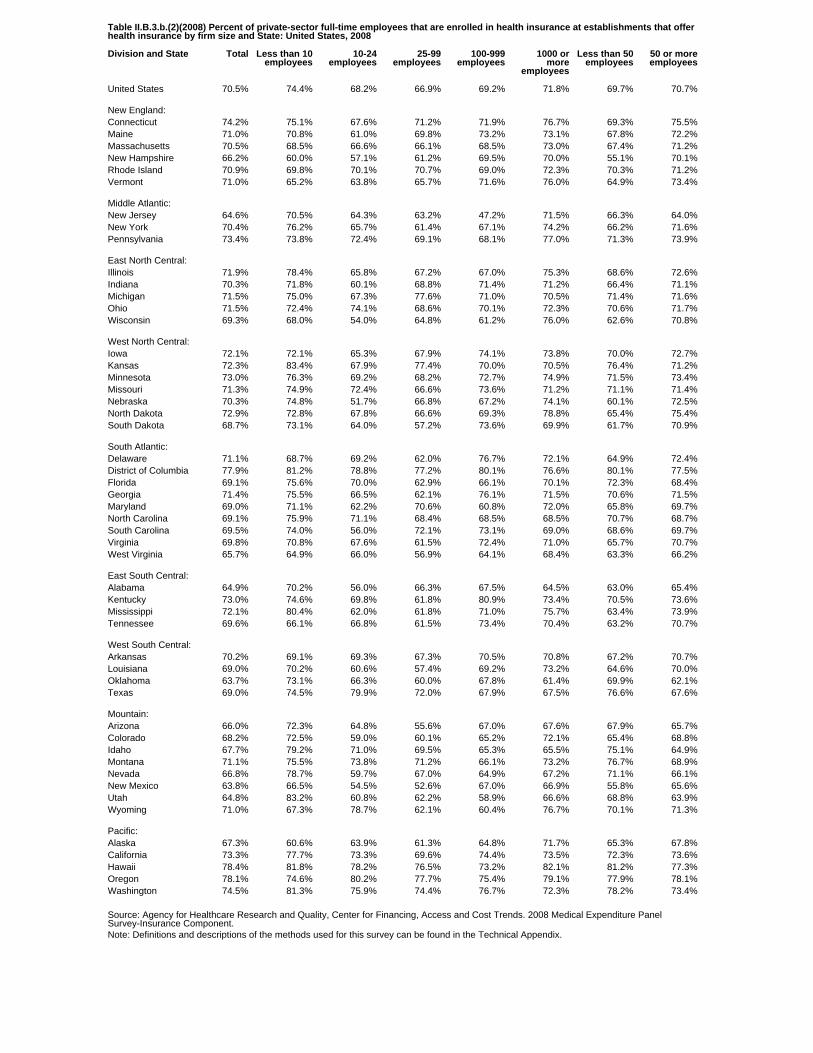
Table II.B.3.b.(2)(2008) Percent of private-sector full-time employees that are enrolled in health insurance at establishments that offerhealth insurance by firm size and State: United States, 2008
Division and State Total Less than 10employees
10-24employees
25-99employees
100-999employees
1000 ormore
employees
Less than 50employees
50 or moreemployees
United States 70.5% 74.4% 68.2% 66.9% 69.2% 71.8% 69.7% 70.7%
New England:Connecticut 74.2% 75.1% 67.6% 71.2% 71.9% 76.7% 69.3% 75.5%Maine 71.0% 70.8% 61.0% 69.8% 73.2% 73.1% 67.8% 72.2%Massachusetts 70.5% 68.5% 66.6% 66.1% 68.5% 73.0% 67.4% 71.2%New Hampshire 66.2% 60.0% 57.1% 61.2% 69.5% 70.0% 55.1% 70.1%Rhode Island 70.9% 69.8% 70.1% 70.7% 69.0% 72.3% 70.3% 71.2%Vermont 71.0% 65.2% 63.8% 65.7% 71.6% 76.0% 64.9% 73.4%
Middle Atlantic:New Jersey 64.6% 70.5% 64.3% 63.2% 47.2% 71.5% 66.3% 64.0%New York 70.4% 76.2% 65.7% 61.4% 67.1% 74.2% 66.2% 71.6%Pennsylvania 73.4% 73.8% 72.4% 69.1% 68.1% 77.0% 71.3% 73.9%
East North Central:Illinois 71.9% 78.4% 65.8% 67.2% 67.0% 75.3% 68.6% 72.6%Indiana 70.3% 71.8% 60.1% 68.8% 71.4% 71.2% 66.4% 71.1%Michigan 71.5% 75.0% 67.3% 77.6% 71.0% 70.5% 71.4% 71.6%Ohio 71.5% 72.4% 74.1% 68.6% 70.1% 72.3% 70.6% 71.7%Wisconsin 69.3% 68.0% 54.0% 64.8% 61.2% 76.0% 62.6% 70.8%
West North Central:Iowa 72.1% 72.1% 65.3% 67.9% 74.1% 73.8% 70.0% 72.7%Kansas 72.3% 83.4% 67.9% 77.4% 70.0% 70.5% 76.4% 71.2%Minnesota 73.0% 76.3% 69.2% 68.2% 72.7% 74.9% 71.5% 73.4%Missouri 71.3% 74.9% 72.4% 66.6% 73.6% 71.2% 71.1% 71.4%Nebraska 70.3% 74.8% 51.7% 66.8% 67.2% 74.1% 60.1% 72.5%North Dakota 72.9% 72.8% 67.8% 66.6% 69.3% 78.8% 65.4% 75.4%South Dakota 68.7% 73.1% 64.0% 57.2% 73.6% 69.9% 61.7% 70.9%
South Atlantic:Delaware 71.1% 68.7% 69.2% 62.0% 76.7% 72.1% 64.9% 72.4%District of Columbia 77.9% 81.2% 78.8% 77.2% 80.1% 76.6% 80.1% 77.5%Florida 69.1% 75.6% 70.0% 62.9% 66.1% 70.1% 72.3% 68.4%Georgia 71.4% 75.5% 66.5% 62.1% 76.1% 71.5% 70.6% 71.5%Maryland 69.0% 71.1% 62.2% 70.6% 60.8% 72.0% 65.8% 69.7%North Carolina 69.1% 75.9% 71.1% 68.4% 68.5% 68.5% 70.7% 68.7%South Carolina 69.5% 74.0% 56.0% 72.1% 73.1% 69.0% 68.6% 69.7%Virginia 69.8% 70.8% 67.6% 61.5% 72.4% 71.0% 65.7% 70.7%West Virginia 65.7% 64.9% 66.0% 56.9% 64.1% 68.4% 63.3% 66.2%
East South Central:Alabama 64.9% 70.2% 56.0% 66.3% 67.5% 64.5% 63.0% 65.4%Kentucky 73.0% 74.6% 69.8% 61.8% 80.9% 73.4% 70.5% 73.6%Mississippi 72.1% 80.4% 62.0% 61.8% 71.0% 75.7% 63.4% 73.9%Tennessee 69.6% 66.1% 66.8% 61.5% 73.4% 70.4% 63.2% 70.7%
West South Central:Arkansas 70.2% 69.1% 69.3% 67.3% 70.5% 70.8% 67.2% 70.7%Louisiana 69.0% 70.2% 60.6% 57.4% 69.2% 73.2% 64.6% 70.0%Oklahoma 63.7% 73.1% 66.3% 60.0% 67.8% 61.4% 69.9% 62.1%Texas 69.0% 74.5% 79.9% 72.0% 67.9% 67.5% 76.6% 67.6%
Mountain:Arizona 66.0% 72.3% 64.8% 55.6% 67.0% 67.6% 67.9% 65.7%Colorado 68.2% 72.5% 59.0% 60.1% 65.2% 72.1% 65.4% 68.8%Idaho 67.7% 79.2% 71.0% 69.5% 65.3% 65.5% 75.1% 64.9%Montana 71.1% 75.5% 73.8% 71.2% 66.1% 73.2% 76.7% 68.9%Nevada 66.8% 78.7% 59.7% 67.0% 64.9% 67.2% 71.1% 66.1%New Mexico 63.8% 66.5% 54.5% 52.6% 67.0% 66.9% 55.8% 65.6%Utah 64.8% 83.2% 60.8% 62.2% 58.9% 66.6% 68.8% 63.9%Wyoming 71.0% 67.3% 78.7% 62.1% 60.4% 76.7% 70.1% 71.3%
Pacific:Alaska 67.3% 60.6% 63.9% 61.3% 64.8% 71.7% 65.3% 67.8%California 73.3% 77.7% 73.3% 69.6% 74.4% 73.5% 72.3% 73.6%Hawaii 78.4% 81.8% 78.2% 76.5% 73.2% 82.1% 81.2% 77.3%Oregon 78.1% 74.6% 80.2% 77.7% 75.4% 79.1% 77.9% 78.1%Washington 74.5% 81.3% 75.9% 74.4% 76.7% 72.3% 78.2% 73.4%
Source: Agency for Healthcare Research and Quality, Center for Financing, Access and Cost Trends. 2008 Medical Expenditure PanelSurvey-Insurance Component.Note: Definitions and descriptions of the methods used for this survey can be found in the Technical Appendix.
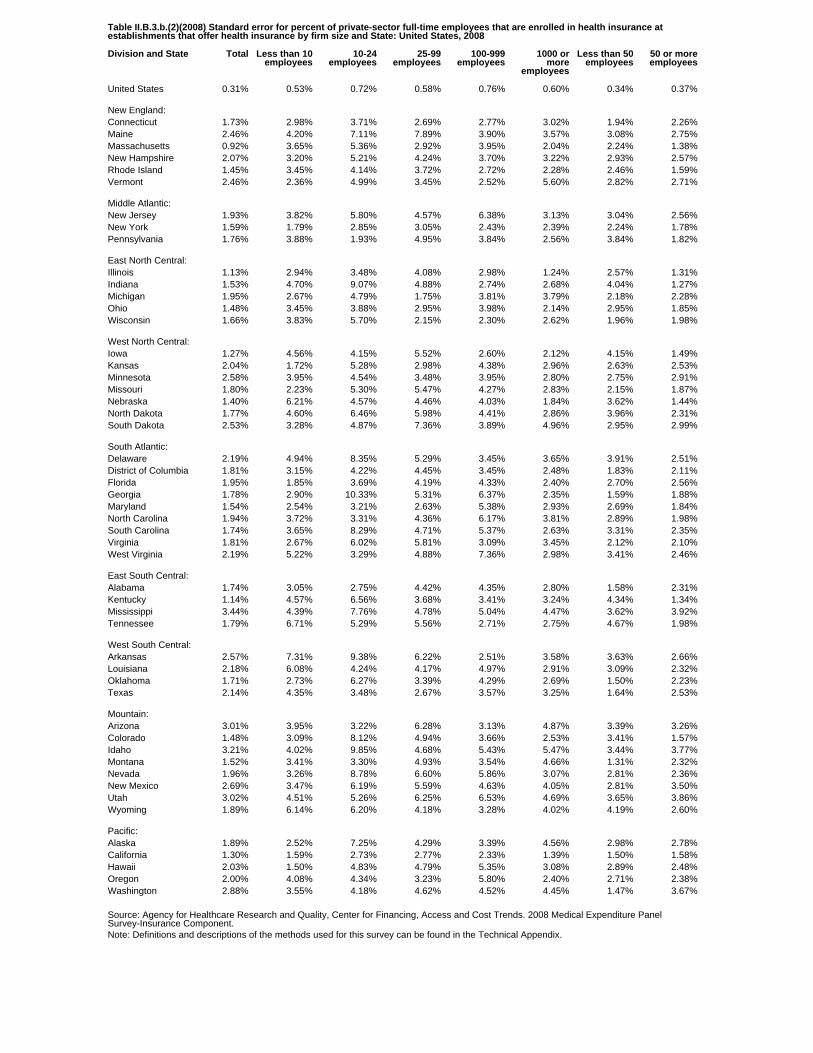
Table II.B.3.b.(2)(2008) Standard error for percent of private-sector full-time employees that are enrolled in health insurance atestablishments that offer health insurance by firm size and State: United States, 2008
Division and State Total Less than 10employees
10-24employees
25-99employees
100-999employees
1000 ormore
employees
Less than 50employees
50 or moreemployees
United States 0.31% 0.53% 0.72% 0.58% 0.76% 0.60% 0.34% 0.37%
New England:Connecticut 1.73% 2.98% 3.71% 2.69% 2.77% 3.02% 1.94% 2.26%Maine 2.46% 4.20% 7.11% 7.89% 3.90% 3.57% 3.08% 2.75%Massachusetts 0.92% 3.65% 5.36% 2.92% 3.95% 2.04% 2.24% 1.38%New Hampshire 2.07% 3.20% 5.21% 4.24% 3.70% 3.22% 2.93% 2.57%Rhode Island 1.45% 3.45% 4.14% 3.72% 2.72% 2.28% 2.46% 1.59%Vermont 2.46% 2.36% 4.99% 3.45% 2.52% 5.60% 2.82% 2.71%
Middle Atlantic:New Jersey 1.93% 3.82% 5.80% 4.57% 6.38% 3.13% 3.04% 2.56%New York 1.59% 1.79% 2.85% 3.05% 2.43% 2.39% 2.24% 1.78%Pennsylvania 1.76% 3.88% 1.93% 4.95% 3.84% 2.56% 3.84% 1.82%
East North Central:Illinois 1.13% 2.94% 3.48% 4.08% 2.98% 1.24% 2.57% 1.31%Indiana 1.53% 4.70% 9.07% 4.88% 2.74% 2.68% 4.04% 1.27%Michigan 1.95% 2.67% 4.79% 1.75% 3.81% 3.79% 2.18% 2.28%Ohio 1.48% 3.45% 3.88% 2.95% 3.98% 2.14% 2.95% 1.85%Wisconsin 1.66% 3.83% 5.70% 2.15% 2.30% 2.62% 1.96% 1.98%
West North Central:Iowa 1.27% 4.56% 4.15% 5.52% 2.60% 2.12% 4.15% 1.49%Kansas 2.04% 1.72% 5.28% 2.98% 4.38% 2.96% 2.63% 2.53%Minnesota 2.58% 3.95% 4.54% 3.48% 3.95% 2.80% 2.75% 2.91%Missouri 1.80% 2.23% 5.30% 5.47% 4.27% 2.83% 2.15% 1.87%Nebraska 1.40% 6.21% 4.57% 4.46% 4.03% 1.84% 3.62% 1.44%North Dakota 1.77% 4.60% 6.46% 5.98% 4.41% 2.86% 3.96% 2.31%South Dakota 2.53% 3.28% 4.87% 7.36% 3.89% 4.96% 2.95% 2.99%
South Atlantic:Delaware 2.19% 4.94% 8.35% 5.29% 3.45% 3.65% 3.91% 2.51%District of Columbia 1.81% 3.15% 4.22% 4.45% 3.45% 2.48% 1.83% 2.11%Florida 1.95% 1.85% 3.69% 4.19% 4.33% 2.40% 2.70% 2.56%Georgia 1.78% 2.90% 10.33% 5.31% 6.37% 2.35% 1.59% 1.88%Maryland 1.54% 2.54% 3.21% 2.63% 5.38% 2.93% 2.69% 1.84%North Carolina 1.94% 3.72% 3.31% 4.36% 6.17% 3.81% 2.89% 1.98%South Carolina 1.74% 3.65% 8.29% 4.71% 5.37% 2.63% 3.31% 2.35%Virginia 1.81% 2.67% 6.02% 5.81% 3.09% 3.45% 2.12% 2.10%West Virginia 2.19% 5.22% 3.29% 4.88% 7.36% 2.98% 3.41% 2.46%
East South Central:Alabama 1.74% 3.05% 2.75% 4.42% 4.35% 2.80% 1.58% 2.31%Kentucky 1.14% 4.57% 6.56% 3.68% 3.41% 3.24% 4.34% 1.34%Mississippi 3.44% 4.39% 7.76% 4.78% 5.04% 4.47% 3.62% 3.92%Tennessee 1.79% 6.71% 5.29% 5.56% 2.71% 2.75% 4.67% 1.98%
West South Central:Arkansas 2.57% 7.31% 9.38% 6.22% 2.51% 3.58% 3.63% 2.66%Louisiana 2.18% 6.08% 4.24% 4.17% 4.97% 2.91% 3.09% 2.32%Oklahoma 1.71% 2.73% 6.27% 3.39% 4.29% 2.69% 1.50% 2.23%Texas 2.14% 4.35% 3.48% 2.67% 3.57% 3.25% 1.64% 2.53%
Mountain:Arizona 3.01% 3.95% 3.22% 6.28% 3.13% 4.87% 3.39% 3.26%Colorado 1.48% 3.09% 8.12% 4.94% 3.66% 2.53% 3.41% 1.57%Idaho 3.21% 4.02% 9.85% 4.68% 5.43% 5.47% 3.44% 3.77%Montana 1.52% 3.41% 3.30% 4.93% 3.54% 4.66% 1.31% 2.32%Nevada 1.96% 3.26% 8.78% 6.60% 5.86% 3.07% 2.81% 2.36%New Mexico 2.69% 3.47% 6.19% 5.59% 4.63% 4.05% 2.81% 3.50%Utah 3.02% 4.51% 5.26% 6.25% 6.53% 4.69% 3.65% 3.86%Wyoming 1.89% 6.14% 6.20% 4.18% 3.28% 4.02% 4.19% 2.60%
Pacific:Alaska 1.89% 2.52% 7.25% 4.29% 3.39% 4.56% 2.98% 2.78%California 1.30% 1.59% 2.73% 2.77% 2.33% 1.39% 1.50% 1.58%Hawaii 2.03% 1.50% 4.83% 4.79% 5.35% 3.08% 2.89% 2.48%Oregon 2.00% 4.08% 4.34% 3.23% 5.80% 2.40% 2.71% 2.38%Washington 2.88% 3.55% 4.18% 4.62% 4.52% 4.45% 1.47% 3.67%
Source: Agency for Healthcare Research and Quality, Center for Financing, Access and Cost Trends. 2008 Medical Expenditure PanelSurvey-Insurance Component.Note: Definitions and descriptions of the methods used for this survey can be found in the Technical Appendix.
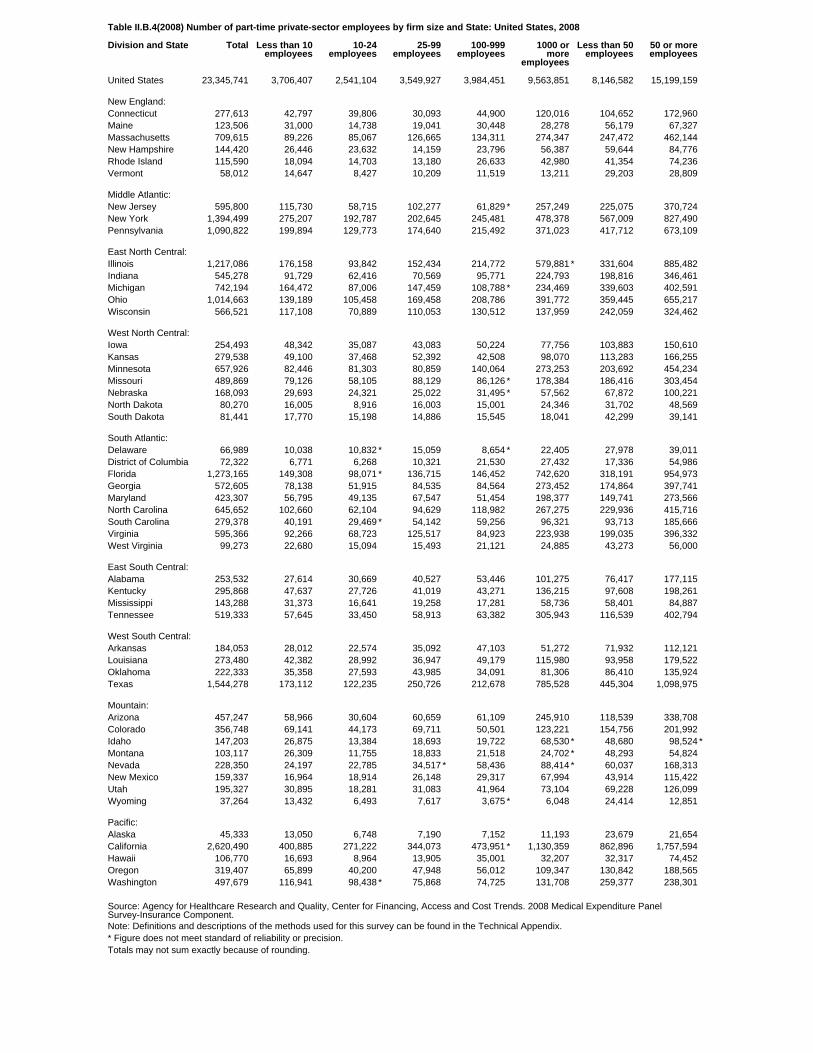
Table II.B.4(2008) Number of part-time private-sector employees by firm size and State: United States, 2008
Division and State Total Less than 10employees
10-24employees
25-99employees
100-999employees
1000 ormore
employees
Less than 50employees
50 or moreemployees
United States 23,345,741 3,706,407 2,541,104 3,549,927 3,984,451 9,563,851 8,146,582 15,199,159
New England:Connecticut 277,613 42,797 39,806 30,093 44,900 120,016 104,652 172,960Maine 123,506 31,000 14,738 19,041 30,448 28,278 56,179 67,327Massachusetts 709,615 89,226 85,067 126,665 134,311 274,347 247,472 462,144New Hampshire 144,420 26,446 23,632 14,159 23,796 56,387 59,644 84,776Rhode Island 115,590 18,094 14,703 13,180 26,633 42,980 41,354 74,236Vermont 58,012 14,647 8,427 10,209 11,519 13,211 29,203 28,809
Middle Atlantic:New Jersey 595,800 115,730 58,715 102,277 61,829 * 257,249 225,075 370,724New York 1,394,499 275,207 192,787 202,645 245,481 478,378 567,009 827,490Pennsylvania 1,090,822 199,894 129,773 174,640 215,492 371,023 417,712 673,109
East North Central:Illinois 1,217,086 176,158 93,842 152,434 214,772 579,881 * 331,604 885,482Indiana 545,278 91,729 62,416 70,569 95,771 224,793 198,816 346,461Michigan 742,194 164,472 87,006 147,459 108,788 * 234,469 339,603 402,591Ohio 1,014,663 139,189 105,458 169,458 208,786 391,772 359,445 655,217Wisconsin 566,521 117,108 70,889 110,053 130,512 137,959 242,059 324,462
West North Central:Iowa 254,493 48,342 35,087 43,083 50,224 77,756 103,883 150,610Kansas 279,538 49,100 37,468 52,392 42,508 98,070 113,283 166,255Minnesota 657,926 82,446 81,303 80,859 140,064 273,253 203,692 454,234Missouri 489,869 79,126 58,105 88,129 86,126 * 178,384 186,416 303,454Nebraska 168,093 29,693 24,321 25,022 31,495 * 57,562 67,872 100,221North Dakota 80,270 16,005 8,916 16,003 15,001 24,346 31,702 48,569South Dakota 81,441 17,770 15,198 14,886 15,545 18,041 42,299 39,141
South Atlantic:Delaware 66,989 10,038 10,832 * 15,059 8,654 * 22,405 27,978 39,011District of Columbia 72,322 6,771 6,268 10,321 21,530 27,432 17,336 54,986Florida 1,273,165 149,308 98,071 * 136,715 146,452 742,620 318,191 954,973Georgia 572,605 78,138 51,915 84,535 84,564 273,452 174,864 397,741Maryland 423,307 56,795 49,135 67,547 51,454 198,377 149,741 273,566North Carolina 645,652 102,660 62,104 94,629 118,982 267,275 229,936 415,716South Carolina 279,378 40,191 29,469 * 54,142 59,256 96,321 93,713 185,666Virginia 595,366 92,266 68,723 125,517 84,923 223,938 199,035 396,332West Virginia 99,273 22,680 15,094 15,493 21,121 24,885 43,273 56,000
East South Central:Alabama 253,532 27,614 30,669 40,527 53,446 101,275 76,417 177,115Kentucky 295,868 47,637 27,726 41,019 43,271 136,215 97,608 198,261Mississippi 143,288 31,373 16,641 19,258 17,281 58,736 58,401 84,887Tennessee 519,333 57,645 33,450 58,913 63,382 305,943 116,539 402,794
West South Central:Arkansas 184,053 28,012 22,574 35,092 47,103 51,272 71,932 112,121Louisiana 273,480 42,382 28,992 36,947 49,179 115,980 93,958 179,522Oklahoma 222,333 35,358 27,593 43,985 34,091 81,306 86,410 135,924Texas 1,544,278 173,112 122,235 250,726 212,678 785,528 445,304 1,098,975
Mountain:Arizona 457,247 58,966 30,604 60,659 61,109 245,910 118,539 338,708Colorado 356,748 69,141 44,173 69,711 50,501 123,221 154,756 201,992Idaho 147,203 26,875 13,384 18,693 19,722 68,530 * 48,680 98,524 *Montana 103,117 26,309 11,755 18,833 21,518 24,702 * 48,293 54,824Nevada 228,350 24,197 22,785 34,517 * 58,436 88,414 * 60,037 168,313New Mexico 159,337 16,964 18,914 26,148 29,317 67,994 43,914 115,422Utah 195,327 30,895 18,281 31,083 41,964 73,104 69,228 126,099Wyoming 37,264 13,432 6,493 7,617 3,675 * 6,048 24,414 12,851
Pacific:Alaska 45,333 13,050 6,748 7,190 7,152 11,193 23,679 21,654California 2,620,490 400,885 271,222 344,073 473,951 * 1,130,359 862,896 1,757,594Hawaii 106,770 16,693 8,964 13,905 35,001 32,207 32,317 74,452Oregon 319,407 65,899 40,200 47,948 56,012 109,347 130,842 188,565Washington 497,679 116,941 98,438 * 75,868 74,725 131,708 259,377 238,301
Source: Agency for Healthcare Research and Quality, Center for Financing, Access and Cost Trends. 2008 Medical Expenditure PanelSurvey-Insurance Component.Note: Definitions and descriptions of the methods used for this survey can be found in the Technical Appendix.* Figure does not meet standard of reliability or precision.Totals may not sum exactly because of rounding.
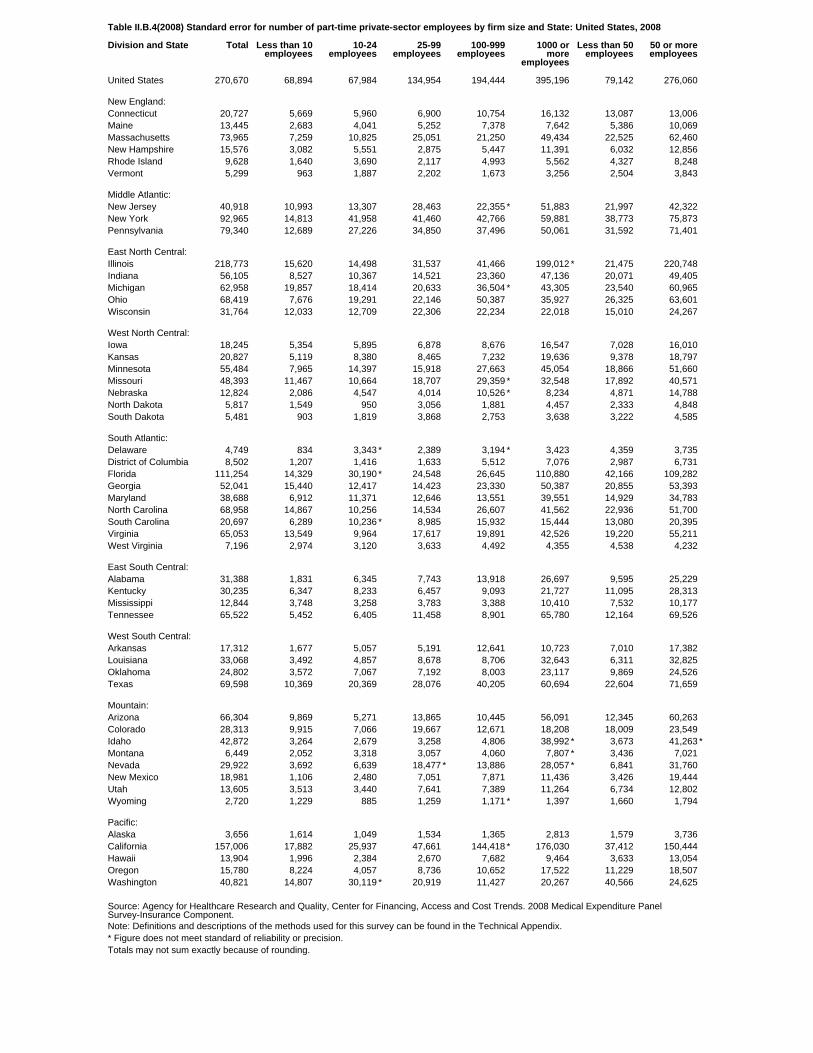
Table II.B.4(2008) Standard error for number of part-time private-sector employees by firm size and State: United States, 2008
Division and State Total Less than 10employees
10-24employees
25-99employees
100-999employees
1000 ormore
employees
Less than 50employees
50 or moreemployees
United States 270,670 68,894 67,984 134,954 194,444 395,196 79,142 276,060
New England:Connecticut 20,727 5,669 5,960 6,900 10,754 16,132 13,087 13,006Maine 13,445 2,683 4,041 5,252 7,378 7,642 5,386 10,069Massachusetts 73,965 7,259 10,825 25,051 21,250 49,434 22,525 62,460New Hampshire 15,576 3,082 5,551 2,875 5,447 11,391 6,032 12,856Rhode Island 9,628 1,640 3,690 2,117 4,993 5,562 4,327 8,248Vermont 5,299 963 1,887 2,202 1,673 3,256 2,504 3,843
Middle Atlantic:New Jersey 40,918 10,993 13,307 28,463 22,355 * 51,883 21,997 42,322New York 92,965 14,813 41,958 41,460 42,766 59,881 38,773 75,873Pennsylvania 79,340 12,689 27,226 34,850 37,496 50,061 31,592 71,401
East North Central:Illinois 218,773 15,620 14,498 31,537 41,466 199,012 * 21,475 220,748Indiana 56,105 8,527 10,367 14,521 23,360 47,136 20,071 49,405Michigan 62,958 19,857 18,414 20,633 36,504 * 43,305 23,540 60,965Ohio 68,419 7,676 19,291 22,146 50,387 35,927 26,325 63,601Wisconsin 31,764 12,033 12,709 22,306 22,234 22,018 15,010 24,267
West North Central:Iowa 18,245 5,354 5,895 6,878 8,676 16,547 7,028 16,010Kansas 20,827 5,119 8,380 8,465 7,232 19,636 9,378 18,797Minnesota 55,484 7,965 14,397 15,918 27,663 45,054 18,866 51,660Missouri 48,393 11,467 10,664 18,707 29,359 * 32,548 17,892 40,571Nebraska 12,824 2,086 4,547 4,014 10,526 * 8,234 4,871 14,788North Dakota 5,817 1,549 950 3,056 1,881 4,457 2,333 4,848South Dakota 5,481 903 1,819 3,868 2,753 3,638 3,222 4,585
South Atlantic:Delaware 4,749 834 3,343 * 2,389 3,194 * 3,423 4,359 3,735District of Columbia 8,502 1,207 1,416 1,633 5,512 7,076 2,987 6,731Florida 111,254 14,329 30,190 * 24,548 26,645 110,880 42,166 109,282Georgia 52,041 15,440 12,417 14,423 23,330 50,387 20,855 53,393Maryland 38,688 6,912 11,371 12,646 13,551 39,551 14,929 34,783North Carolina 68,958 14,867 10,256 14,534 26,607 41,562 22,936 51,700South Carolina 20,697 6,289 10,236 * 8,985 15,932 15,444 13,080 20,395Virginia 65,053 13,549 9,964 17,617 19,891 42,526 19,220 55,211West Virginia 7,196 2,974 3,120 3,633 4,492 4,355 4,538 4,232
East South Central:Alabama 31,388 1,831 6,345 7,743 13,918 26,697 9,595 25,229Kentucky 30,235 6,347 8,233 6,457 9,093 21,727 11,095 28,313Mississippi 12,844 3,748 3,258 3,783 3,388 10,410 7,532 10,177Tennessee 65,522 5,452 6,405 11,458 8,901 65,780 12,164 69,526
West South Central:Arkansas 17,312 1,677 5,057 5,191 12,641 10,723 7,010 17,382Louisiana 33,068 3,492 4,857 8,678 8,706 32,643 6,311 32,825Oklahoma 24,802 3,572 7,067 7,192 8,003 23,117 9,869 24,526Texas 69,598 10,369 20,369 28,076 40,205 60,694 22,604 71,659
Mountain:Arizona 66,304 9,869 5,271 13,865 10,445 56,091 12,345 60,263Colorado 28,313 9,915 7,066 19,667 12,671 18,208 18,009 23,549Idaho 42,872 3,264 2,679 3,258 4,806 38,992 * 3,673 41,263 *Montana 6,449 2,052 3,318 3,057 4,060 7,807 * 3,436 7,021Nevada 29,922 3,692 6,639 18,477 * 13,886 28,057 * 6,841 31,760New Mexico 18,981 1,106 2,480 7,051 7,871 11,436 3,426 19,444Utah 13,605 3,513 3,440 7,641 7,389 11,264 6,734 12,802Wyoming 2,720 1,229 885 1,259 1,171 * 1,397 1,660 1,794
Pacific:Alaska 3,656 1,614 1,049 1,534 1,365 2,813 1,579 3,736California 157,006 17,882 25,937 47,661 144,418 * 176,030 37,412 150,444Hawaii 13,904 1,996 2,384 2,670 7,682 9,464 3,633 13,054Oregon 15,780 8,224 4,057 8,736 10,652 17,522 11,229 18,507Washington 40,821 14,807 30,119 * 20,919 11,427 20,267 40,566 24,625
Source: Agency for Healthcare Research and Quality, Center for Financing, Access and Cost Trends. 2008 Medical Expenditure PanelSurvey-Insurance Component.Note: Definitions and descriptions of the methods used for this survey can be found in the Technical Appendix.* Figure does not meet standard of reliability or precision.Totals may not sum exactly because of rounding.
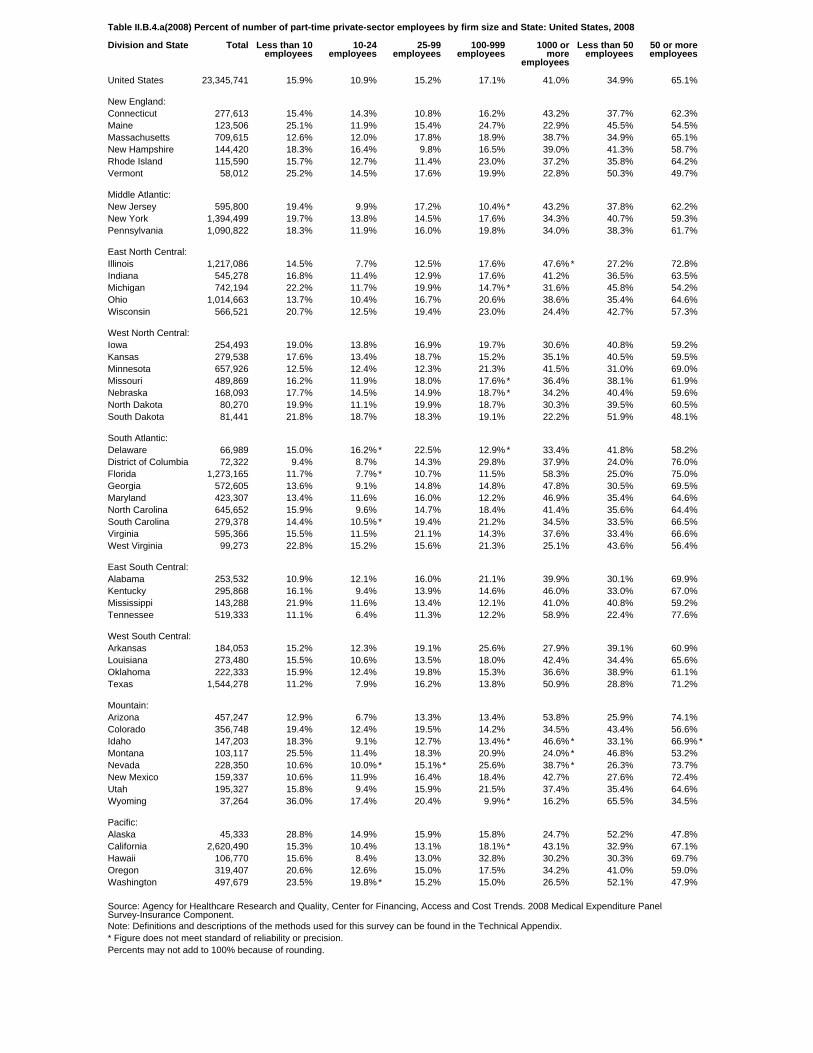
Table II.B.4.a(2008) Percent of number of part-time private-sector employees by firm size and State: United States, 2008
Division and State Total Less than 10employees
10-24employees
25-99employees
100-999employees
1000 ormore
employees
Less than 50employees
50 or moreemployees
United States 23,345,741 15.9% 10.9% 15.2% 17.1% 41.0% 34.9% 65.1%
New England:Connecticut 277,613 15.4% 14.3% 10.8% 16.2% 43.2% 37.7% 62.3%Maine 123,506 25.1% 11.9% 15.4% 24.7% 22.9% 45.5% 54.5%Massachusetts 709,615 12.6% 12.0% 17.8% 18.9% 38.7% 34.9% 65.1%New Hampshire 144,420 18.3% 16.4% 9.8% 16.5% 39.0% 41.3% 58.7%Rhode Island 115,590 15.7% 12.7% 11.4% 23.0% 37.2% 35.8% 64.2%Vermont 58,012 25.2% 14.5% 17.6% 19.9% 22.8% 50.3% 49.7%
Middle Atlantic:New Jersey 595,800 19.4% 9.9% 17.2% 10.4% * 43.2% 37.8% 62.2%New York 1,394,499 19.7% 13.8% 14.5% 17.6% 34.3% 40.7% 59.3%Pennsylvania 1,090,822 18.3% 11.9% 16.0% 19.8% 34.0% 38.3% 61.7%
East North Central:Illinois 1,217,086 14.5% 7.7% 12.5% 17.6% 47.6% * 27.2% 72.8%Indiana 545,278 16.8% 11.4% 12.9% 17.6% 41.2% 36.5% 63.5%Michigan 742,194 22.2% 11.7% 19.9% 14.7% * 31.6% 45.8% 54.2%Ohio 1,014,663 13.7% 10.4% 16.7% 20.6% 38.6% 35.4% 64.6%Wisconsin 566,521 20.7% 12.5% 19.4% 23.0% 24.4% 42.7% 57.3%
West North Central:Iowa 254,493 19.0% 13.8% 16.9% 19.7% 30.6% 40.8% 59.2%Kansas 279,538 17.6% 13.4% 18.7% 15.2% 35.1% 40.5% 59.5%Minnesota 657,926 12.5% 12.4% 12.3% 21.3% 41.5% 31.0% 69.0%Missouri 489,869 16.2% 11.9% 18.0% 17.6% * 36.4% 38.1% 61.9%Nebraska 168,093 17.7% 14.5% 14.9% 18.7% * 34.2% 40.4% 59.6%North Dakota 80,270 19.9% 11.1% 19.9% 18.7% 30.3% 39.5% 60.5%South Dakota 81,441 21.8% 18.7% 18.3% 19.1% 22.2% 51.9% 48.1%
South Atlantic:Delaware 66,989 15.0% 16.2% * 22.5% 12.9% * 33.4% 41.8% 58.2%District of Columbia 72,322 9.4% 8.7% 14.3% 29.8% 37.9% 24.0% 76.0%Florida 1,273,165 11.7% 7.7% * 10.7% 11.5% 58.3% 25.0% 75.0%Georgia 572,605 13.6% 9.1% 14.8% 14.8% 47.8% 30.5% 69.5%Maryland 423,307 13.4% 11.6% 16.0% 12.2% 46.9% 35.4% 64.6%North Carolina 645,652 15.9% 9.6% 14.7% 18.4% 41.4% 35.6% 64.4%South Carolina 279,378 14.4% 10.5% * 19.4% 21.2% 34.5% 33.5% 66.5%Virginia 595,366 15.5% 11.5% 21.1% 14.3% 37.6% 33.4% 66.6%West Virginia 99,273 22.8% 15.2% 15.6% 21.3% 25.1% 43.6% 56.4%
East South Central:Alabama 253,532 10.9% 12.1% 16.0% 21.1% 39.9% 30.1% 69.9%Kentucky 295,868 16.1% 9.4% 13.9% 14.6% 46.0% 33.0% 67.0%Mississippi 143,288 21.9% 11.6% 13.4% 12.1% 41.0% 40.8% 59.2%Tennessee 519,333 11.1% 6.4% 11.3% 12.2% 58.9% 22.4% 77.6%
West South Central:Arkansas 184,053 15.2% 12.3% 19.1% 25.6% 27.9% 39.1% 60.9%Louisiana 273,480 15.5% 10.6% 13.5% 18.0% 42.4% 34.4% 65.6%Oklahoma 222,333 15.9% 12.4% 19.8% 15.3% 36.6% 38.9% 61.1%Texas 1,544,278 11.2% 7.9% 16.2% 13.8% 50.9% 28.8% 71.2%
Mountain:Arizona 457,247 12.9% 6.7% 13.3% 13.4% 53.8% 25.9% 74.1%Colorado 356,748 19.4% 12.4% 19.5% 14.2% 34.5% 43.4% 56.6%Idaho 147,203 18.3% 9.1% 12.7% 13.4% * 46.6% * 33.1% 66.9% *Montana 103,117 25.5% 11.4% 18.3% 20.9% 24.0% * 46.8% 53.2%Nevada 228,350 10.6% 10.0% * 15.1% * 25.6% 38.7% * 26.3% 73.7%New Mexico 159,337 10.6% 11.9% 16.4% 18.4% 42.7% 27.6% 72.4%Utah 195,327 15.8% 9.4% 15.9% 21.5% 37.4% 35.4% 64.6%Wyoming 37,264 36.0% 17.4% 20.4% 9.9% * 16.2% 65.5% 34.5%
Pacific:Alaska 45,333 28.8% 14.9% 15.9% 15.8% 24.7% 52.2% 47.8%California 2,620,490 15.3% 10.4% 13.1% 18.1% * 43.1% 32.9% 67.1%Hawaii 106,770 15.6% 8.4% 13.0% 32.8% 30.2% 30.3% 69.7%Oregon 319,407 20.6% 12.6% 15.0% 17.5% 34.2% 41.0% 59.0%Washington 497,679 23.5% 19.8% * 15.2% 15.0% 26.5% 52.1% 47.9%
Source: Agency for Healthcare Research and Quality, Center for Financing, Access and Cost Trends. 2008 Medical Expenditure PanelSurvey-Insurance Component.Note: Definitions and descriptions of the methods used for this survey can be found in the Technical Appendix.* Figure does not meet standard of reliability or precision.Percents may not add to 100% because of rounding.

Table II.B.4.a(2008) Standard error for percent of number of part-time private-sector employees by firm size and State: United States,2008
Division and State Total Less than 10employees
10-24employees
25-99employees
100-999employees
1000 ormore
employees
Less than 50employees
50 or moreemployees
United States 270,670 0.39% 0.35% 0.50% 0.90% 1.40% 0.51% 0.51%
New England:Connecticut 20,727 1.96% 1.82% 1.93% 4.03% 4.78% 3.10% 3.10%Maine 13,445 2.71% 3.31% 3.79% 4.58% 4.48% 3.44% 3.44%Massachusetts 73,965 1.48% 1.97% 1.91% 3.51% 3.66% 2.98% 2.98%New Hampshire 15,576 3.36% 3.13% 1.76% 3.53% 4.92% 3.73% 3.73%Rhode Island 9,628 2.18% 2.74% 2.03% 2.58% 3.63% 3.55% 3.55%Vermont 5,299 2.55% 2.90% 2.69% 3.14% 3.87% 3.27% 3.27%
Middle Atlantic:New Jersey 40,918 2.72% 2.52% 4.60% 3.77% * 6.62% 4.84% 4.84%New York 92,965 1.49% 2.28% 2.64% 2.79% 2.95% 2.45% 2.45%Pennsylvania 79,340 2.58% 2.08% 2.93% 3.25% 2.73% 3.06% 3.06%
East North Central:Illinois 218,773 2.73% 2.03% 2.78% 3.26% 6.28% * 4.35% 4.35%Indiana 56,105 2.52% 1.89% 2.44% 3.60% 5.31% 3.30% 3.30%Michigan 62,958 3.22% 2.64% 2.63% 3.89% * 3.72% 4.54% 4.54%Ohio 68,419 1.40% 1.84% 2.36% 3.65% 2.42% 2.74% 2.74%Wisconsin 31,764 2.20% 2.10% 4.11% 3.12% 3.39% 2.12% 2.12%
West North Central:Iowa 18,245 2.19% 2.68% 3.23% 3.10% 4.28% 2.97% 2.97%Kansas 20,827 1.63% 2.98% 3.33% 2.59% 4.48% 3.12% 3.12%Minnesota 55,484 1.41% 2.88% 2.23% 3.56% 4.05% 3.07% 3.07%Missouri 48,393 1.75% 2.11% 4.66% 3.92% * 6.01% 3.12% 3.12%Nebraska 12,824 2.11% 3.18% 2.13% 4.78% * 3.72% 4.79% 4.79%North Dakota 5,817 1.77% 1.84% 3.44% 3.26% 4.21% 2.72% 2.72%South Dakota 5,481 2.53% 2.77% 3.85% 2.71% 3.76% 4.00% 4.00%
South Atlantic:Delaware 4,749 1.59% 4.30% * 3.38% 3.21% * 5.53% 4.78% 4.78%District of Columbia 8,502 1.33% 1.46% 2.43% 6.83% 7.37% 3.18% 3.18%Florida 111,254 1.79% 1.72% * 2.22% 2.61% 4.20% 3.05% 3.05%Georgia 52,041 2.69% 2.22% 2.96% 3.91% 5.35% 3.92% 3.92%Maryland 38,688 2.60% 2.68% 2.87% 3.08% 5.03% 3.08% 3.08%North Carolina 68,958 1.86% 2.45% 2.09% 3.34% 4.62% 2.69% 2.69%South Carolina 20,697 2.37% 3.35% * 3.12% 4.45% 5.01% 3.94% 3.94%Virginia 65,053 1.72% 1.84% 3.46% 3.11% 3.65% 3.10% 3.10%West Virginia 7,196 2.43% 2.82% 3.14% 4.71% 3.88% 2.41% 2.41%
East South Central:Alabama 31,388 1.57% 2.27% 3.66% 5.00% 4.79% 2.90% 2.90%Kentucky 30,235 2.01% 2.62% 2.49% 2.12% 2.65% 3.69% 3.69%Mississippi 12,844 2.61% 1.97% 2.24% 3.34% 3.98% 3.92% 3.92%Tennessee 65,522 1.76% 1.36% 2.38% 1.92% 4.07% 3.08% 3.08%
West South Central:Arkansas 17,312 1.38% 3.38% 4.03% 5.65% 4.59% 4.71% 4.71%Louisiana 33,068 2.63% 2.73% 3.78% 3.03% 5.27% 4.72% 4.72%Oklahoma 24,802 1.99% 2.91% 3.87% 4.11% 6.73% 5.52% 5.52%Texas 69,598 1.00% 1.33% 1.77% 2.51% 3.03% 1.90% 1.90%
Mountain:Arizona 66,304 2.41% 1.76% 3.06% 2.83% 5.62% 3.72% 3.72%Colorado 28,313 3.26% 1.96% 4.56% 3.36% 3.29% 3.73% 3.73%Idaho 42,872 4.20% 2.71% 3.55% 4.78% * 9.44% * 5.47% 5.47% *Montana 6,449 3.71% 3.20% 3.00% 3.64% 5.99% * 4.58% 4.58%Nevada 29,922 2.86% 3.54% * 7.23% * 5.19% 6.75% * 5.23% 5.23%New Mexico 18,981 1.95% 2.21% 3.22% 3.33% 4.72% 4.32% 4.32%Utah 13,605 1.60% 1.90% 4.61% 3.33% 4.01% 3.15% 3.15%Wyoming 2,720 3.46% 2.15% 2.98% 2.65% * 3.03% 3.04% 3.04%
Pacific:Alaska 3,656 3.43% 2.98% 3.48% 2.75% 4.89% 5.28% 5.28%California 157,006 0.97% 1.38% 1.31% 4.78% * 5.03% 2.22% 2.22%Hawaii 13,904 2.46% 2.41% 3.07% 4.43% 5.49% 6.24% 6.24%Oregon 15,780 2.59% 1.63% 3.15% 3.09% 4.92% 3.97% 3.97%Washington 40,821 2.52% 4.67% * 3.21% 2.12% 5.27% 5.37% 5.37%
Source: Agency for Healthcare Research and Quality, Center for Financing, Access and Cost Trends. 2008 Medical Expenditure PanelSurvey-Insurance Component.Note: Definitions and descriptions of the methods used for this survey can be found in the Technical Appendix.* Figure does not meet standard of reliability or precision.Percents may not add to 100% because of rounding.
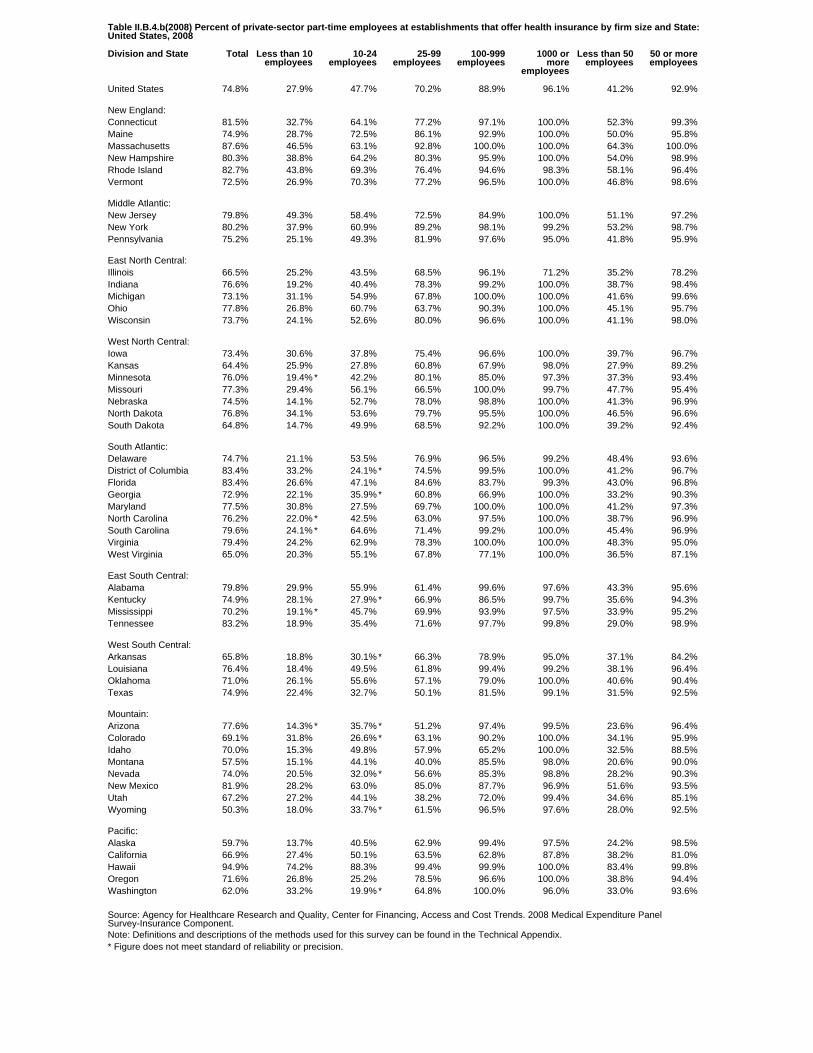
Table II.B.4.b(2008) Percent of private-sector part-time employees at establishments that offer health insurance by firm size and State:United States, 2008
Division and State Total Less than 10employees
10-24employees
25-99employees
100-999employees
1000 ormore
employees
Less than 50employees
50 or moreemployees
United States 74.8% 27.9% 47.7% 70.2% 88.9% 96.1% 41.2% 92.9%
New England:Connecticut 81.5% 32.7% 64.1% 77.2% 97.1% 100.0% 52.3% 99.3%Maine 74.9% 28.7% 72.5% 86.1% 92.9% 100.0% 50.0% 95.8%Massachusetts 87.6% 46.5% 63.1% 92.8% 100.0% 100.0% 64.3% 100.0%New Hampshire 80.3% 38.8% 64.2% 80.3% 95.9% 100.0% 54.0% 98.9%Rhode Island 82.7% 43.8% 69.3% 76.4% 94.6% 98.3% 58.1% 96.4%Vermont 72.5% 26.9% 70.3% 77.2% 96.5% 100.0% 46.8% 98.6%
Middle Atlantic:New Jersey 79.8% 49.3% 58.4% 72.5% 84.9% 100.0% 51.1% 97.2%New York 80.2% 37.9% 60.9% 89.2% 98.1% 99.2% 53.2% 98.7%Pennsylvania 75.2% 25.1% 49.3% 81.9% 97.6% 95.0% 41.8% 95.9%
East North Central:Illinois 66.5% 25.2% 43.5% 68.5% 96.1% 71.2% 35.2% 78.2%Indiana 76.6% 19.2% 40.4% 78.3% 99.2% 100.0% 38.7% 98.4%Michigan 73.1% 31.1% 54.9% 67.8% 100.0% 100.0% 41.6% 99.6%Ohio 77.8% 26.8% 60.7% 63.7% 90.3% 100.0% 45.1% 95.7%Wisconsin 73.7% 24.1% 52.6% 80.0% 96.6% 100.0% 41.1% 98.0%
West North Central:Iowa 73.4% 30.6% 37.8% 75.4% 96.6% 100.0% 39.7% 96.7%Kansas 64.4% 25.9% 27.8% 60.8% 67.9% 98.0% 27.9% 89.2%Minnesota 76.0% 19.4% * 42.2% 80.1% 85.0% 97.3% 37.3% 93.4%Missouri 77.3% 29.4% 56.1% 66.5% 100.0% 99.7% 47.7% 95.4%Nebraska 74.5% 14.1% 52.7% 78.0% 98.8% 100.0% 41.3% 96.9%North Dakota 76.8% 34.1% 53.6% 79.7% 95.5% 100.0% 46.5% 96.6%South Dakota 64.8% 14.7% 49.9% 68.5% 92.2% 100.0% 39.2% 92.4%
South Atlantic:Delaware 74.7% 21.1% 53.5% 76.9% 96.5% 99.2% 48.4% 93.6%District of Columbia 83.4% 33.2% 24.1% * 74.5% 99.5% 100.0% 41.2% 96.7%Florida 83.4% 26.6% 47.1% 84.6% 83.7% 99.3% 43.0% 96.8%Georgia 72.9% 22.1% 35.9% * 60.8% 66.9% 100.0% 33.2% 90.3%Maryland 77.5% 30.8% 27.5% 69.7% 100.0% 100.0% 41.2% 97.3%North Carolina 76.2% 22.0% * 42.5% 63.0% 97.5% 100.0% 38.7% 96.9%South Carolina 79.6% 24.1% * 64.6% 71.4% 99.2% 100.0% 45.4% 96.9%Virginia 79.4% 24.2% 62.9% 78.3% 100.0% 100.0% 48.3% 95.0%West Virginia 65.0% 20.3% 55.1% 67.8% 77.1% 100.0% 36.5% 87.1%
East South Central:Alabama 79.8% 29.9% 55.9% 61.4% 99.6% 97.6% 43.3% 95.6%Kentucky 74.9% 28.1% 27.9% * 66.9% 86.5% 99.7% 35.6% 94.3%Mississippi 70.2% 19.1% * 45.7% 69.9% 93.9% 97.5% 33.9% 95.2%Tennessee 83.2% 18.9% 35.4% 71.6% 97.7% 99.8% 29.0% 98.9%
West South Central:Arkansas 65.8% 18.8% 30.1% * 66.3% 78.9% 95.0% 37.1% 84.2%Louisiana 76.4% 18.4% 49.5% 61.8% 99.4% 99.2% 38.1% 96.4%Oklahoma 71.0% 26.1% 55.6% 57.1% 79.0% 100.0% 40.6% 90.4%Texas 74.9% 22.4% 32.7% 50.1% 81.5% 99.1% 31.5% 92.5%
Mountain:Arizona 77.6% 14.3% * 35.7% * 51.2% 97.4% 99.5% 23.6% 96.4%Colorado 69.1% 31.8% 26.6% * 63.1% 90.2% 100.0% 34.1% 95.9%Idaho 70.0% 15.3% 49.8% 57.9% 65.2% 100.0% 32.5% 88.5%Montana 57.5% 15.1% 44.1% 40.0% 85.5% 98.0% 20.6% 90.0%Nevada 74.0% 20.5% 32.0% * 56.6% 85.3% 98.8% 28.2% 90.3%New Mexico 81.9% 28.2% 63.0% 85.0% 87.7% 96.9% 51.6% 93.5%Utah 67.2% 27.2% 44.1% 38.2% 72.0% 99.4% 34.6% 85.1%Wyoming 50.3% 18.0% 33.7% * 61.5% 96.5% 97.6% 28.0% 92.5%
Pacific:Alaska 59.7% 13.7% 40.5% 62.9% 99.4% 97.5% 24.2% 98.5%California 66.9% 27.4% 50.1% 63.5% 62.8% 87.8% 38.2% 81.0%Hawaii 94.9% 74.2% 88.3% 99.4% 99.9% 100.0% 83.4% 99.8%Oregon 71.6% 26.8% 25.2% 78.5% 96.6% 100.0% 38.8% 94.4%Washington 62.0% 33.2% 19.9% * 64.8% 100.0% 96.0% 33.0% 93.6%
Source: Agency for Healthcare Research and Quality, Center for Financing, Access and Cost Trends. 2008 Medical Expenditure PanelSurvey-Insurance Component.Note: Definitions and descriptions of the methods used for this survey can be found in the Technical Appendix.* Figure does not meet standard of reliability or precision.
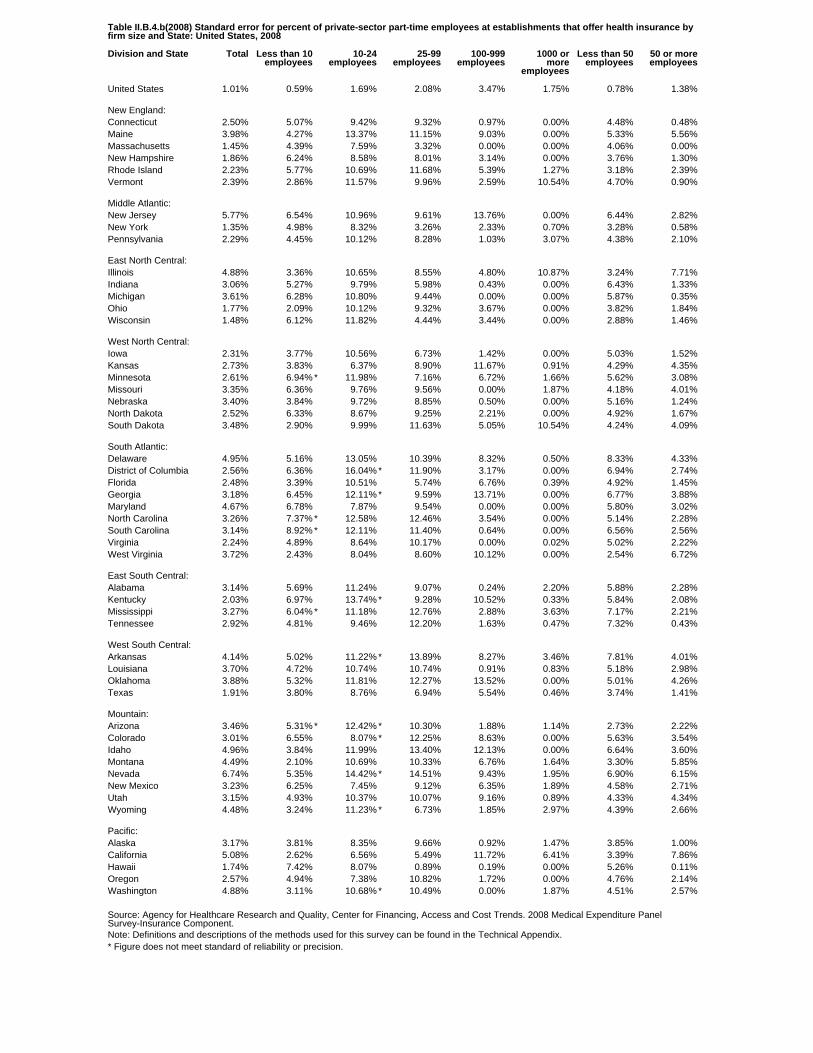
Table II.B.4.b(2008) Standard error for percent of private-sector part-time employees at establishments that offer health insurance byfirm size and State: United States, 2008
Division and State Total Less than 10employees
10-24employees
25-99employees
100-999employees
1000 ormore
employees
Less than 50employees
50 or moreemployees
United States 1.01% 0.59% 1.69% 2.08% 3.47% 1.75% 0.78% 1.38%
New England:Connecticut 2.50% 5.07% 9.42% 9.32% 0.97% 0.00% 4.48% 0.48%Maine 3.98% 4.27% 13.37% 11.15% 9.03% 0.00% 5.33% 5.56%Massachusetts 1.45% 4.39% 7.59% 3.32% 0.00% 0.00% 4.06% 0.00%New Hampshire 1.86% 6.24% 8.58% 8.01% 3.14% 0.00% 3.76% 1.30%Rhode Island 2.23% 5.77% 10.69% 11.68% 5.39% 1.27% 3.18% 2.39%Vermont 2.39% 2.86% 11.57% 9.96% 2.59% 10.54% 4.70% 0.90%
Middle Atlantic:New Jersey 5.77% 6.54% 10.96% 9.61% 13.76% 0.00% 6.44% 2.82%New York 1.35% 4.98% 8.32% 3.26% 2.33% 0.70% 3.28% 0.58%Pennsylvania 2.29% 4.45% 10.12% 8.28% 1.03% 3.07% 4.38% 2.10%
East North Central:Illinois 4.88% 3.36% 10.65% 8.55% 4.80% 10.87% 3.24% 7.71%Indiana 3.06% 5.27% 9.79% 5.98% 0.43% 0.00% 6.43% 1.33%Michigan 3.61% 6.28% 10.80% 9.44% 0.00% 0.00% 5.87% 0.35%Ohio 1.77% 2.09% 10.12% 9.32% 3.67% 0.00% 3.82% 1.84%Wisconsin 1.48% 6.12% 11.82% 4.44% 3.44% 0.00% 2.88% 1.46%
West North Central:Iowa 2.31% 3.77% 10.56% 6.73% 1.42% 0.00% 5.03% 1.52%Kansas 2.73% 3.83% 6.37% 8.90% 11.67% 0.91% 4.29% 4.35%Minnesota 2.61% 6.94% * 11.98% 7.16% 6.72% 1.66% 5.62% 3.08%Missouri 3.35% 6.36% 9.76% 9.56% 0.00% 1.87% 4.18% 4.01%Nebraska 3.40% 3.84% 9.72% 8.85% 0.50% 0.00% 5.16% 1.24%North Dakota 2.52% 6.33% 8.67% 9.25% 2.21% 0.00% 4.92% 1.67%South Dakota 3.48% 2.90% 9.99% 11.63% 5.05% 10.54% 4.24% 4.09%
South Atlantic:Delaware 4.95% 5.16% 13.05% 10.39% 8.32% 0.50% 8.33% 4.33%District of Columbia 2.56% 6.36% 16.04% * 11.90% 3.17% 0.00% 6.94% 2.74%Florida 2.48% 3.39% 10.51% 5.74% 6.76% 0.39% 4.92% 1.45%Georgia 3.18% 6.45% 12.11% * 9.59% 13.71% 0.00% 6.77% 3.88%Maryland 4.67% 6.78% 7.87% 9.54% 0.00% 0.00% 5.80% 3.02%North Carolina 3.26% 7.37% * 12.58% 12.46% 3.54% 0.00% 5.14% 2.28%South Carolina 3.14% 8.92% * 12.11% 11.40% 0.64% 0.00% 6.56% 2.56%Virginia 2.24% 4.89% 8.64% 10.17% 0.00% 0.02% 5.02% 2.22%West Virginia 3.72% 2.43% 8.04% 8.60% 10.12% 0.00% 2.54% 6.72%
East South Central:Alabama 3.14% 5.69% 11.24% 9.07% 0.24% 2.20% 5.88% 2.28%Kentucky 2.03% 6.97% 13.74% * 9.28% 10.52% 0.33% 5.84% 2.08%Mississippi 3.27% 6.04% * 11.18% 12.76% 2.88% 3.63% 7.17% 2.21%Tennessee 2.92% 4.81% 9.46% 12.20% 1.63% 0.47% 7.32% 0.43%
West South Central:Arkansas 4.14% 5.02% 11.22% * 13.89% 8.27% 3.46% 7.81% 4.01%Louisiana 3.70% 4.72% 10.74% 10.74% 0.91% 0.83% 5.18% 2.98%Oklahoma 3.88% 5.32% 11.81% 12.27% 13.52% 0.00% 5.01% 4.26%Texas 1.91% 3.80% 8.76% 6.94% 5.54% 0.46% 3.74% 1.41%
Mountain:Arizona 3.46% 5.31% * 12.42% * 10.30% 1.88% 1.14% 2.73% 2.22%Colorado 3.01% 6.55% 8.07% * 12.25% 8.63% 0.00% 5.63% 3.54%Idaho 4.96% 3.84% 11.99% 13.40% 12.13% 0.00% 6.64% 3.60%Montana 4.49% 2.10% 10.69% 10.33% 6.76% 1.64% 3.30% 5.85%Nevada 6.74% 5.35% 14.42% * 14.51% 9.43% 1.95% 6.90% 6.15%New Mexico 3.23% 6.25% 7.45% 9.12% 6.35% 1.89% 4.58% 2.71%Utah 3.15% 4.93% 10.37% 10.07% 9.16% 0.89% 4.33% 4.34%Wyoming 4.48% 3.24% 11.23% * 6.73% 1.85% 2.97% 4.39% 2.66%
Pacific:Alaska 3.17% 3.81% 8.35% 9.66% 0.92% 1.47% 3.85% 1.00%California 5.08% 2.62% 6.56% 5.49% 11.72% 6.41% 3.39% 7.86%Hawaii 1.74% 7.42% 8.07% 0.89% 0.19% 0.00% 5.26% 0.11%Oregon 2.57% 4.94% 7.38% 10.82% 1.72% 0.00% 4.76% 2.14%Washington 4.88% 3.11% 10.68% * 10.49% 0.00% 1.87% 4.51% 2.57%
Source: Agency for Healthcare Research and Quality, Center for Financing, Access and Cost Trends. 2008 Medical Expenditure PanelSurvey-Insurance Component.Note: Definitions and descriptions of the methods used for this survey can be found in the Technical Appendix.* Figure does not meet standard of reliability or precision.
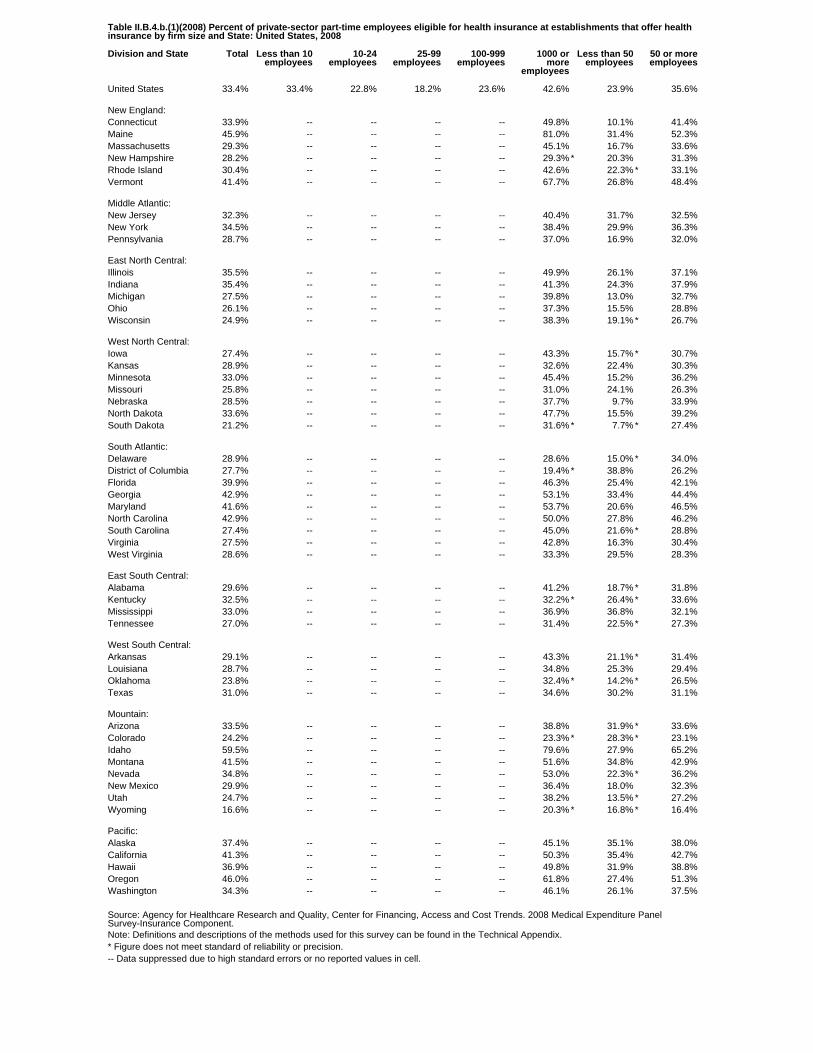
Table II.B.4.b.(1)(2008) Percent of private-sector part-time employees eligible for health insurance at establishments that offer healthinsurance by firm size and State: United States, 2008
Division and State Total Less than 10employees
10-24employees
25-99employees
100-999employees
1000 ormore
employees
Less than 50employees
50 or moreemployees
United States 33.4% 33.4% 22.8% 18.2% 23.6% 42.6% 23.9% 35.6%
New England:Connecticut 33.9% -- -- -- -- 49.8% 10.1% 41.4%Maine 45.9% -- -- -- -- 81.0% 31.4% 52.3%Massachusetts 29.3% -- -- -- -- 45.1% 16.7% 33.6%New Hampshire 28.2% -- -- -- -- 29.3% * 20.3% 31.3%Rhode Island 30.4% -- -- -- -- 42.6% 22.3% * 33.1%Vermont 41.4% -- -- -- -- 67.7% 26.8% 48.4%
Middle Atlantic:New Jersey 32.3% -- -- -- -- 40.4% 31.7% 32.5%New York 34.5% -- -- -- -- 38.4% 29.9% 36.3%Pennsylvania 28.7% -- -- -- -- 37.0% 16.9% 32.0%
East North Central:Illinois 35.5% -- -- -- -- 49.9% 26.1% 37.1%Indiana 35.4% -- -- -- -- 41.3% 24.3% 37.9%Michigan 27.5% -- -- -- -- 39.8% 13.0% 32.7%Ohio 26.1% -- -- -- -- 37.3% 15.5% 28.8%Wisconsin 24.9% -- -- -- -- 38.3% 19.1% * 26.7%
West North Central:Iowa 27.4% -- -- -- -- 43.3% 15.7% * 30.7%Kansas 28.9% -- -- -- -- 32.6% 22.4% 30.3%Minnesota 33.0% -- -- -- -- 45.4% 15.2% 36.2%Missouri 25.8% -- -- -- -- 31.0% 24.1% 26.3%Nebraska 28.5% -- -- -- -- 37.7% 9.7% 33.9%North Dakota 33.6% -- -- -- -- 47.7% 15.5% 39.2%South Dakota 21.2% -- -- -- -- 31.6% * 7.7% * 27.4%
South Atlantic:Delaware 28.9% -- -- -- -- 28.6% 15.0% * 34.0%District of Columbia 27.7% -- -- -- -- 19.4% * 38.8% 26.2%Florida 39.9% -- -- -- -- 46.3% 25.4% 42.1%Georgia 42.9% -- -- -- -- 53.1% 33.4% 44.4%Maryland 41.6% -- -- -- -- 53.7% 20.6% 46.5%North Carolina 42.9% -- -- -- -- 50.0% 27.8% 46.2%South Carolina 27.4% -- -- -- -- 45.0% 21.6% * 28.8%Virginia 27.5% -- -- -- -- 42.8% 16.3% 30.4%West Virginia 28.6% -- -- -- -- 33.3% 29.5% 28.3%
East South Central:Alabama 29.6% -- -- -- -- 41.2% 18.7% * 31.8%Kentucky 32.5% -- -- -- -- 32.2% * 26.4% * 33.6%Mississippi 33.0% -- -- -- -- 36.9% 36.8% 32.1%Tennessee 27.0% -- -- -- -- 31.4% 22.5% * 27.3%
West South Central:Arkansas 29.1% -- -- -- -- 43.3% 21.1% * 31.4%Louisiana 28.7% -- -- -- -- 34.8% 25.3% 29.4%Oklahoma 23.8% -- -- -- -- 32.4% * 14.2% * 26.5%Texas 31.0% -- -- -- -- 34.6% 30.2% 31.1%
Mountain:Arizona 33.5% -- -- -- -- 38.8% 31.9% * 33.6%Colorado 24.2% -- -- -- -- 23.3% * 28.3% * 23.1%Idaho 59.5% -- -- -- -- 79.6% 27.9% 65.2%Montana 41.5% -- -- -- -- 51.6% 34.8% 42.9%Nevada 34.8% -- -- -- -- 53.0% 22.3% * 36.2%New Mexico 29.9% -- -- -- -- 36.4% 18.0% 32.3%Utah 24.7% -- -- -- -- 38.2% 13.5% * 27.2%Wyoming 16.6% -- -- -- -- 20.3% * 16.8% * 16.4%
Pacific:Alaska 37.4% -- -- -- -- 45.1% 35.1% 38.0%California 41.3% -- -- -- -- 50.3% 35.4% 42.7%Hawaii 36.9% -- -- -- -- 49.8% 31.9% 38.8%Oregon 46.0% -- -- -- -- 61.8% 27.4% 51.3%Washington 34.3% -- -- -- -- 46.1% 26.1% 37.5%
Source: Agency for Healthcare Research and Quality, Center for Financing, Access and Cost Trends. 2008 Medical Expenditure PanelSurvey-Insurance Component.Note: Definitions and descriptions of the methods used for this survey can be found in the Technical Appendix.* Figure does not meet standard of reliability or precision.-- Data suppressed due to high standard errors or no reported values in cell.
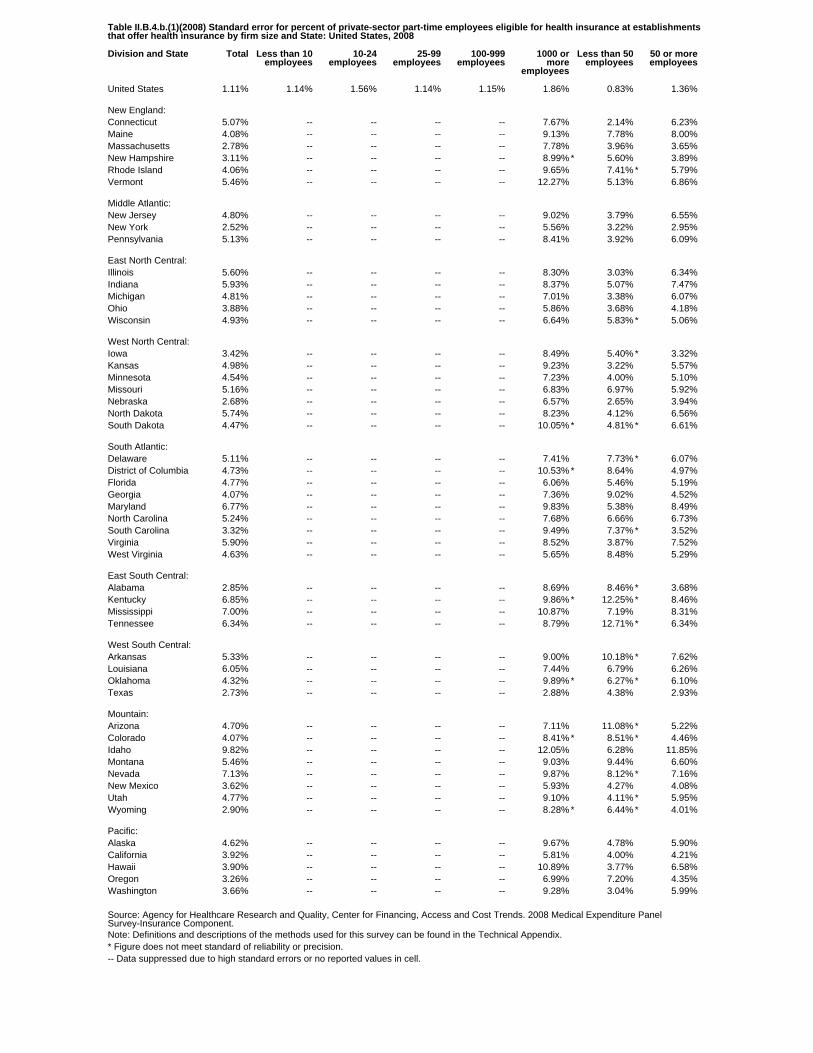
Table II.B.4.b.(1)(2008) Standard error for percent of private-sector part-time employees eligible for health insurance at establishmentsthat offer health insurance by firm size and State: United States, 2008
Division and State Total Less than 10employees
10-24employees
25-99employees
100-999employees
1000 ormore
employees
Less than 50employees
50 or moreemployees
United States 1.11% 1.14% 1.56% 1.14% 1.15% 1.86% 0.83% 1.36%
New England:Connecticut 5.07% -- -- -- -- 7.67% 2.14% 6.23%Maine 4.08% -- -- -- -- 9.13% 7.78% 8.00%Massachusetts 2.78% -- -- -- -- 7.78% 3.96% 3.65%New Hampshire 3.11% -- -- -- -- 8.99% * 5.60% 3.89%Rhode Island 4.06% -- -- -- -- 9.65% 7.41% * 5.79%Vermont 5.46% -- -- -- -- 12.27% 5.13% 6.86%
Middle Atlantic:New Jersey 4.80% -- -- -- -- 9.02% 3.79% 6.55%New York 2.52% -- -- -- -- 5.56% 3.22% 2.95%Pennsylvania 5.13% -- -- -- -- 8.41% 3.92% 6.09%
East North Central:Illinois 5.60% -- -- -- -- 8.30% 3.03% 6.34%Indiana 5.93% -- -- -- -- 8.37% 5.07% 7.47%Michigan 4.81% -- -- -- -- 7.01% 3.38% 6.07%Ohio 3.88% -- -- -- -- 5.86% 3.68% 4.18%Wisconsin 4.93% -- -- -- -- 6.64% 5.83% * 5.06%
West North Central:Iowa 3.42% -- -- -- -- 8.49% 5.40% * 3.32%Kansas 4.98% -- -- -- -- 9.23% 3.22% 5.57%Minnesota 4.54% -- -- -- -- 7.23% 4.00% 5.10%Missouri 5.16% -- -- -- -- 6.83% 6.97% 5.92%Nebraska 2.68% -- -- -- -- 6.57% 2.65% 3.94%North Dakota 5.74% -- -- -- -- 8.23% 4.12% 6.56%South Dakota 4.47% -- -- -- -- 10.05% * 4.81% * 6.61%
South Atlantic:Delaware 5.11% -- -- -- -- 7.41% 7.73% * 6.07%District of Columbia 4.73% -- -- -- -- 10.53% * 8.64% 4.97%Florida 4.77% -- -- -- -- 6.06% 5.46% 5.19%Georgia 4.07% -- -- -- -- 7.36% 9.02% 4.52%Maryland 6.77% -- -- -- -- 9.83% 5.38% 8.49%North Carolina 5.24% -- -- -- -- 7.68% 6.66% 6.73%South Carolina 3.32% -- -- -- -- 9.49% 7.37% * 3.52%Virginia 5.90% -- -- -- -- 8.52% 3.87% 7.52%West Virginia 4.63% -- -- -- -- 5.65% 8.48% 5.29%
East South Central:Alabama 2.85% -- -- -- -- 8.69% 8.46% * 3.68%Kentucky 6.85% -- -- -- -- 9.86% * 12.25% * 8.46%Mississippi 7.00% -- -- -- -- 10.87% 7.19% 8.31%Tennessee 6.34% -- -- -- -- 8.79% 12.71% * 6.34%
West South Central:Arkansas 5.33% -- -- -- -- 9.00% 10.18% * 7.62%Louisiana 6.05% -- -- -- -- 7.44% 6.79% 6.26%Oklahoma 4.32% -- -- -- -- 9.89% * 6.27% * 6.10%Texas 2.73% -- -- -- -- 2.88% 4.38% 2.93%
Mountain:Arizona 4.70% -- -- -- -- 7.11% 11.08% * 5.22%Colorado 4.07% -- -- -- -- 8.41% * 8.51% * 4.46%Idaho 9.82% -- -- -- -- 12.05% 6.28% 11.85%Montana 5.46% -- -- -- -- 9.03% 9.44% 6.60%Nevada 7.13% -- -- -- -- 9.87% 8.12% * 7.16%New Mexico 3.62% -- -- -- -- 5.93% 4.27% 4.08%Utah 4.77% -- -- -- -- 9.10% 4.11% * 5.95%Wyoming 2.90% -- -- -- -- 8.28% * 6.44% * 4.01%
Pacific:Alaska 4.62% -- -- -- -- 9.67% 4.78% 5.90%California 3.92% -- -- -- -- 5.81% 4.00% 4.21%Hawaii 3.90% -- -- -- -- 10.89% 3.77% 6.58%Oregon 3.26% -- -- -- -- 6.99% 7.20% 4.35%Washington 3.66% -- -- -- -- 9.28% 3.04% 5.99%
Source: Agency for Healthcare Research and Quality, Center for Financing, Access and Cost Trends. 2008 Medical Expenditure PanelSurvey-Insurance Component.Note: Definitions and descriptions of the methods used for this survey can be found in the Technical Appendix.* Figure does not meet standard of reliability or precision.-- Data suppressed due to high standard errors or no reported values in cell.

Table II.B.4.b.(1).(a)(2008) Percent of private-sector part-time employees eligible for health insurance that are enrolled in healthinsurance at establishments that offer health insurance by firm size and State: United States, 2008
Division and State Total Less than 10employees
10-24employees
25-99employees
100-999employees
1000 ormore
employees
Less than 50employees
50 or moreemployees
United States 52.3% 60.8% 43.0% 36.8% 47.4% 55.0% 49.3% 52.8%
New England:Connecticut 61.0% -- -- -- -- 62.2% 33.6% * 63.2%Maine 38.7% -- -- -- -- 26.9% * 60.2% 33.1%Massachusetts 43.0% -- -- -- -- 43.1% 48.7% 42.0%New Hampshire 50.4% -- -- -- -- 53.8% 42.7% 52.3%Rhode Island 57.2% -- -- -- -- 54.5% 59.5% 56.7%Vermont 58.0% -- -- -- -- 77.1% 31.2% * 65.2%
Middle Atlantic:New Jersey 47.8% -- -- -- -- 50.7% 40.0% 50.2%New York 43.0% -- -- -- -- 47.9% 44.7% 42.5%Pennsylvania 47.3% -- -- -- -- 50.6% 43.7% 47.8%
East North Central:Illinois 71.0% -- -- -- -- 78.4% 76.7% 70.3%Indiana 43.4% -- -- -- -- 51.8% 38.4% * 44.2%Michigan 52.1% -- -- -- -- 54.2% 53.8% 51.8%Ohio 53.7% -- -- -- -- 56.6% 51.9% 53.9%Wisconsin 47.9% -- -- -- -- 47.6% 38.2% 50.1%
West North Central:Iowa 64.1% -- -- -- -- 71.0% 52.0% 65.8%Kansas 42.1% -- -- -- -- 52.2% 34.3% 43.3%Minnesota 63.5% -- -- -- -- 60.8% 72.9% 62.8%Missouri 57.9% -- -- -- -- 58.0% 62.1% 56.7%Nebraska 42.4% -- -- -- -- 57.9% 45.7% 42.2%North Dakota 57.2% -- -- -- -- 47.7% 58.3% 57.0%South Dakota 42.3% -- -- -- -- 42.7% 61.2% 39.9%
South Atlantic:Delaware 51.0% -- -- -- -- 55.7% 59.6% 49.6%District of Columbia 48.8% -- -- -- -- 56.9% 54.8% 47.6%Florida 49.4% -- -- -- -- 50.1% 59.3% 48.5%Georgia 38.2% -- -- -- -- 38.4% 26.1% * 39.6%Maryland 53.3% -- -- -- -- 57.5% 42.1% 54.5%North Carolina 22.1% -- -- -- -- 22.4% * 23.1% * 22.0% *South Carolina 27.1% -- -- -- -- 27.2% 24.7% * 27.5%Virginia 62.4% -- -- -- -- 66.3% 38.4% 65.6%West Virginia 32.6% -- -- -- -- 39.7% 25.3% * 35.1%
East South Central:Alabama 39.6% -- -- -- -- 39.5% 46.6% 38.7%Kentucky 42.2% -- -- -- -- 37.7% 37.3% * 42.9%Mississippi 27.0% -- -- -- -- 23.1% 23.7% * 27.9%Tennessee 47.2% -- -- -- -- 45.2% 52.5% 46.8%
West South Central:Arkansas 39.8% -- -- -- -- 34.9% 47.3% 38.4%Louisiana 59.6% -- -- -- -- 70.2% 7.6% * 68.9%Oklahoma 68.8% -- -- -- -- 77.6% 62.7% 69.7%Texas 53.0% -- -- -- -- 54.0% 49.5% 53.5%
Mountain:Arizona 46.6% -- -- -- -- 50.0% 45.5% * 46.7%Colorado 55.7% -- -- -- -- 60.8% 50.7% 57.3%Idaho 81.0% -- -- -- -- 83.9% 64.3% 82.3%Montana 47.3% -- -- -- -- 35.4% * 53.2% 46.3%Nevada 36.2% -- -- -- -- 28.6% * 32.1% * 36.5%New Mexico 40.5% -- -- -- -- 37.1% 41.1% 40.4%Utah 60.3% -- -- -- -- 62.0% 70.7% 59.1%Wyoming 61.6% -- -- -- -- 70.5% 73.6% 54.5%
Pacific:Alaska 60.4% -- -- -- -- 64.6% 63.8% 59.5%California 63.7% -- -- -- -- 68.8% 55.3% 65.3%Hawaii 76.1% -- -- -- -- 77.9% 74.4% 76.6%Oregon 75.8% -- -- -- -- 79.7% 71.0% 76.6%Washington 70.0% -- -- -- -- 69.7% 71.9% 69.5%
Source: Agency for Healthcare Research and Quality, Center for Financing, Access and Cost Trends. 2008 Medical Expenditure PanelSurvey-Insurance Component.Note: Definitions and descriptions of the methods used for this survey can be found in the Technical Appendix.* Figure does not meet standard of reliability or precision.-- Data suppressed due to high standard errors or no reported values in cell.

Table II.B.4.b.(1).(a)(2008) Standard error for percent of private-sector part-time employees eligible for health insurance that areenrolled in health insurance at establishments that offer health insurance by firm size and State: United States, 2008
Division and State Total Less than 10employees
10-24employees
25-99employees
100-999employees
1000 ormore
employees
Less than 50employees
50 or moreemployees
United States 2.29% 2.64% 3.55% 2.09% 2.92% 2.76% 1.70% 2.51%
New England:Connecticut 9.37% -- -- -- -- 11.01% 12.43% * 10.30%Maine 5.63% -- -- -- -- 13.79% * 12.08% 6.56%Massachusetts 5.85% -- -- -- -- 7.65% 6.52% 7.14%New Hampshire 5.20% -- -- -- -- 8.25% 7.81% 6.85%Rhode Island 6.76% -- -- -- -- 10.30% 9.29% 8.13%Vermont 5.24% -- -- -- -- 9.57% 10.87% * 6.57%
Middle Atlantic:New Jersey 6.69% -- -- -- -- 10.59% 10.14% 9.53%New York 4.11% -- -- -- -- 6.39% 4.52% 4.75%Pennsylvania 4.35% -- -- -- -- 7.61% 9.81% 4.92%
East North Central:Illinois 7.74% -- -- -- -- 9.45% 8.80% 8.67%Indiana 6.71% -- -- -- -- 8.70% 12.73% * 7.42%Michigan 6.01% -- -- -- -- 8.14% 10.52% 6.43%Ohio 4.66% -- -- -- -- 6.79% 6.32% 5.58%Wisconsin 4.30% -- -- -- -- 5.98% 6.90% 4.69%
West North Central:Iowa 6.93% -- -- -- -- 9.83% 11.75% 7.94%Kansas 4.21% -- -- -- -- 8.69% 9.12% 5.23%Minnesota 7.45% -- -- -- -- 9.65% 10.13% 8.47%Missouri 8.99% -- -- -- -- 11.20% 12.01% 9.10%Nebraska 6.82% -- -- -- -- 6.65% 11.38% 7.86%North Dakota 5.88% -- -- -- -- 7.63% 12.28% 6.52%South Dakota 6.82% -- -- -- -- 10.71% 14.75% 7.76%
South Atlantic:Delaware 6.43% -- -- -- -- 9.81% 11.91% 7.29%District of Columbia 5.25% -- -- -- -- 9.62% 10.73% 5.70%Florida 5.15% -- -- -- -- 5.54% 10.60% 4.87%Georgia 6.60% -- -- -- -- 7.06% 10.51% * 6.79%Maryland 6.97% -- -- -- -- 10.17% 11.94% 8.35%North Carolina 6.55% -- -- -- -- 8.84% * 12.65% * 6.77% *South Carolina 5.36% -- -- -- -- 5.85% 10.71% * 6.10%Virginia 7.20% -- -- -- -- 9.16% 10.34% 7.79%West Virginia 4.81% -- -- -- -- 7.19% 12.88% * 4.94%
East South Central:Alabama 6.48% -- -- -- -- 10.02% 13.14% 6.45%Kentucky 6.96% -- -- -- -- 7.45% 14.13% * 7.13%Mississippi 5.69% -- -- -- -- 6.71% 11.05% * 8.19%Tennessee 7.54% -- -- -- -- 8.52% 13.06% 7.93%
West South Central:Arkansas 8.56% -- -- -- -- 9.98% 11.23% 10.00%Louisiana 8.12% -- -- -- -- 11.02% 3.07% * 8.60%Oklahoma 9.86% -- -- -- -- 15.63% 13.95% 12.44%Texas 6.40% -- -- -- -- 6.84% 9.27% 6.92%
Mountain:Arizona 7.29% -- -- -- -- 9.11% 14.61% * 7.13%Colorado 6.16% -- -- -- -- 9.68% 9.92% 7.50%Idaho 9.61% -- -- -- -- 14.34% 12.10% 11.44%Montana 7.73% -- -- -- -- 12.09% * 14.07% 7.62%Nevada 8.04% -- -- -- -- 12.68% * 12.30% * 10.10%New Mexico 5.78% -- -- -- -- 7.86% 11.99% 6.52%Utah 5.55% -- -- -- -- 8.21% 16.09% 8.27%Wyoming 10.40% -- -- -- -- 15.11% 15.97% 12.32%
Pacific:Alaska 5.25% -- -- -- -- 11.48% 10.33% 6.83%California 3.17% -- -- -- -- 3.99% 7.08% 4.06%Hawaii 4.07% -- -- -- -- 6.42% 5.51% 6.30%Oregon 5.49% -- -- -- -- 6.80% 8.07% 5.88%Washington 6.16% -- -- -- -- 8.82% 7.95% 7.55%
Source: Agency for Healthcare Research and Quality, Center for Financing, Access and Cost Trends. 2008 Medical Expenditure PanelSurvey-Insurance Component.Note: Definitions and descriptions of the methods used for this survey can be found in the Technical Appendix.* Figure does not meet standard of reliability or precision.-- Data suppressed due to high standard errors or no reported values in cell.
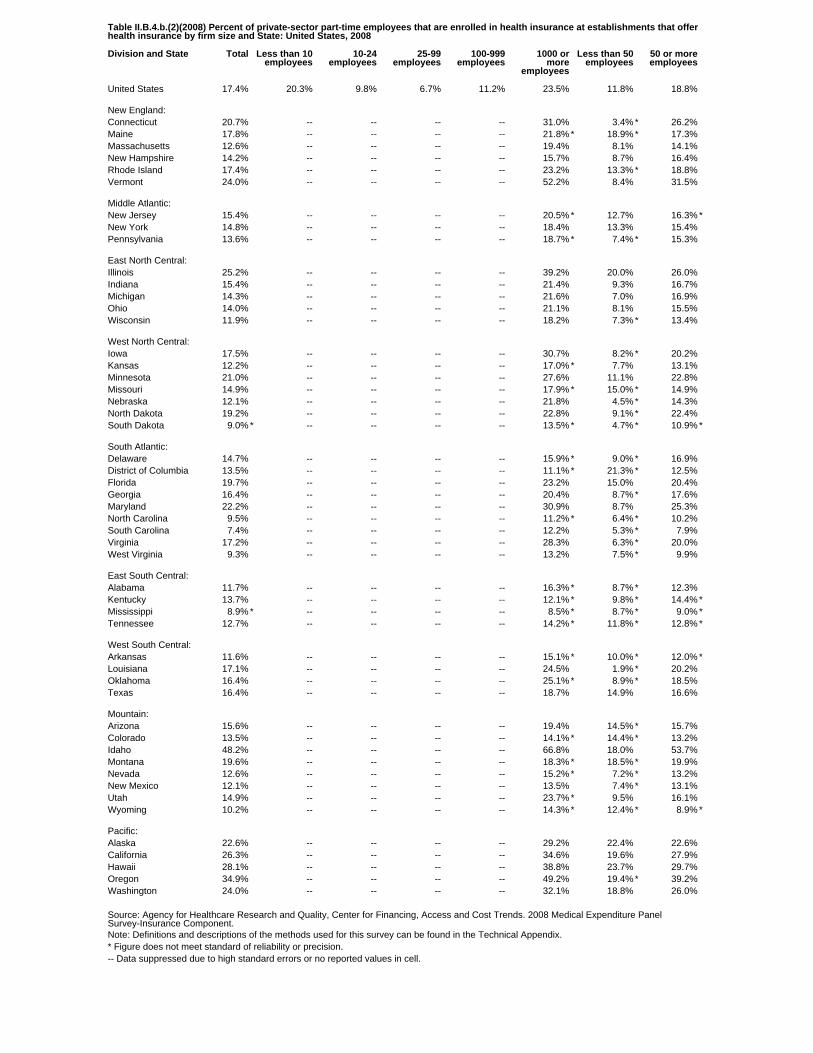
Table II.B.4.b.(2)(2008) Percent of private-sector part-time employees that are enrolled in health insurance at establishments that offerhealth insurance by firm size and State: United States, 2008
Division and State Total Less than 10employees
10-24employees
25-99employees
100-999employees
1000 ormore
employees
Less than 50employees
50 or moreemployees
United States 17.4% 20.3% 9.8% 6.7% 11.2% 23.5% 11.8% 18.8%
New England:Connecticut 20.7% -- -- -- -- 31.0% 3.4% * 26.2%Maine 17.8% -- -- -- -- 21.8% * 18.9% * 17.3%Massachusetts 12.6% -- -- -- -- 19.4% 8.1% 14.1%New Hampshire 14.2% -- -- -- -- 15.7% 8.7% 16.4%Rhode Island 17.4% -- -- -- -- 23.2% 13.3% * 18.8%Vermont 24.0% -- -- -- -- 52.2% 8.4% 31.5%
Middle Atlantic:New Jersey 15.4% -- -- -- -- 20.5% * 12.7% 16.3% *New York 14.8% -- -- -- -- 18.4% 13.3% 15.4%Pennsylvania 13.6% -- -- -- -- 18.7% * 7.4% * 15.3%
East North Central:Illinois 25.2% -- -- -- -- 39.2% 20.0% 26.0%Indiana 15.4% -- -- -- -- 21.4% 9.3% 16.7%Michigan 14.3% -- -- -- -- 21.6% 7.0% 16.9%Ohio 14.0% -- -- -- -- 21.1% 8.1% 15.5%Wisconsin 11.9% -- -- -- -- 18.2% 7.3% * 13.4%
West North Central:Iowa 17.5% -- -- -- -- 30.7% 8.2% * 20.2%Kansas 12.2% -- -- -- -- 17.0% * 7.7% 13.1%Minnesota 21.0% -- -- -- -- 27.6% 11.1% 22.8%Missouri 14.9% -- -- -- -- 17.9% * 15.0% * 14.9%Nebraska 12.1% -- -- -- -- 21.8% 4.5% * 14.3%North Dakota 19.2% -- -- -- -- 22.8% 9.1% * 22.4%South Dakota 9.0% * -- -- -- -- 13.5% * 4.7% * 10.9% *
South Atlantic:Delaware 14.7% -- -- -- -- 15.9% * 9.0% * 16.9%District of Columbia 13.5% -- -- -- -- 11.1% * 21.3% * 12.5%Florida 19.7% -- -- -- -- 23.2% 15.0% 20.4%Georgia 16.4% -- -- -- -- 20.4% 8.7% * 17.6%Maryland 22.2% -- -- -- -- 30.9% 8.7% 25.3%North Carolina 9.5% -- -- -- -- 11.2% * 6.4% * 10.2%South Carolina 7.4% -- -- -- -- 12.2% 5.3% * 7.9%Virginia 17.2% -- -- -- -- 28.3% 6.3% * 20.0%West Virginia 9.3% -- -- -- -- 13.2% 7.5% * 9.9%
East South Central:Alabama 11.7% -- -- -- -- 16.3% * 8.7% * 12.3%Kentucky 13.7% -- -- -- -- 12.1% * 9.8% * 14.4% *Mississippi 8.9% * -- -- -- -- 8.5% * 8.7% * 9.0% *Tennessee 12.7% -- -- -- -- 14.2% * 11.8% * 12.8% *
West South Central:Arkansas 11.6% -- -- -- -- 15.1% * 10.0% * 12.0% *Louisiana 17.1% -- -- -- -- 24.5% 1.9% * 20.2%Oklahoma 16.4% -- -- -- -- 25.1% * 8.9% * 18.5%Texas 16.4% -- -- -- -- 18.7% 14.9% 16.6%
Mountain:Arizona 15.6% -- -- -- -- 19.4% 14.5% * 15.7%Colorado 13.5% -- -- -- -- 14.1% * 14.4% * 13.2%Idaho 48.2% -- -- -- -- 66.8% 18.0% 53.7%Montana 19.6% -- -- -- -- 18.3% * 18.5% * 19.9%Nevada 12.6% -- -- -- -- 15.2% * 7.2% * 13.2%New Mexico 12.1% -- -- -- -- 13.5% 7.4% * 13.1%Utah 14.9% -- -- -- -- 23.7% * 9.5% 16.1%Wyoming 10.2% -- -- -- -- 14.3% * 12.4% * 8.9% *
Pacific:Alaska 22.6% -- -- -- -- 29.2% 22.4% 22.6%California 26.3% -- -- -- -- 34.6% 19.6% 27.9%Hawaii 28.1% -- -- -- -- 38.8% 23.7% 29.7%Oregon 34.9% -- -- -- -- 49.2% 19.4% * 39.2%Washington 24.0% -- -- -- -- 32.1% 18.8% 26.0%
Source: Agency for Healthcare Research and Quality, Center for Financing, Access and Cost Trends. 2008 Medical Expenditure PanelSurvey-Insurance Component.Note: Definitions and descriptions of the methods used for this survey can be found in the Technical Appendix.* Figure does not meet standard of reliability or precision.-- Data suppressed due to high standard errors or no reported values in cell.
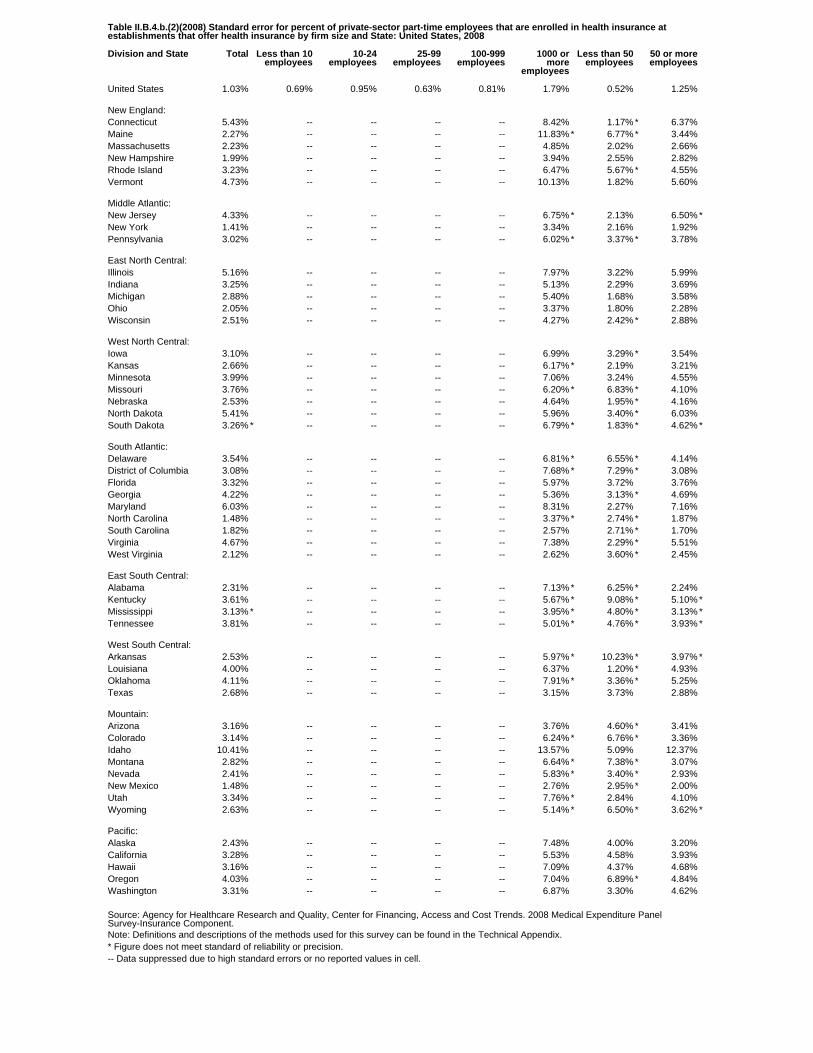
Table II.B.4.b.(2)(2008) Standard error for percent of private-sector part-time employees that are enrolled in health insurance atestablishments that offer health insurance by firm size and State: United States, 2008
Division and State Total Less than 10employees
10-24employees
25-99employees
100-999employees
1000 ormore
employees
Less than 50employees
50 or moreemployees
United States 1.03% 0.69% 0.95% 0.63% 0.81% 1.79% 0.52% 1.25%
New England:Connecticut 5.43% -- -- -- -- 8.42% 1.17% * 6.37%Maine 2.27% -- -- -- -- 11.83% * 6.77% * 3.44%Massachusetts 2.23% -- -- -- -- 4.85% 2.02% 2.66%New Hampshire 1.99% -- -- -- -- 3.94% 2.55% 2.82%Rhode Island 3.23% -- -- -- -- 6.47% 5.67% * 4.55%Vermont 4.73% -- -- -- -- 10.13% 1.82% 5.60%
Middle Atlantic:New Jersey 4.33% -- -- -- -- 6.75% * 2.13% 6.50% *New York 1.41% -- -- -- -- 3.34% 2.16% 1.92%Pennsylvania 3.02% -- -- -- -- 6.02% * 3.37% * 3.78%
East North Central:Illinois 5.16% -- -- -- -- 7.97% 3.22% 5.99%Indiana 3.25% -- -- -- -- 5.13% 2.29% 3.69%Michigan 2.88% -- -- -- -- 5.40% 1.68% 3.58%Ohio 2.05% -- -- -- -- 3.37% 1.80% 2.28%Wisconsin 2.51% -- -- -- -- 4.27% 2.42% * 2.88%
West North Central:Iowa 3.10% -- -- -- -- 6.99% 3.29% * 3.54%Kansas 2.66% -- -- -- -- 6.17% * 2.19% 3.21%Minnesota 3.99% -- -- -- -- 7.06% 3.24% 4.55%Missouri 3.76% -- -- -- -- 6.20% * 6.83% * 4.10%Nebraska 2.53% -- -- -- -- 4.64% 1.95% * 4.16%North Dakota 5.41% -- -- -- -- 5.96% 3.40% * 6.03%South Dakota 3.26% * -- -- -- -- 6.79% * 1.83% * 4.62% *
South Atlantic:Delaware 3.54% -- -- -- -- 6.81% * 6.55% * 4.14%District of Columbia 3.08% -- -- -- -- 7.68% * 7.29% * 3.08%Florida 3.32% -- -- -- -- 5.97% 3.72% 3.76%Georgia 4.22% -- -- -- -- 5.36% 3.13% * 4.69%Maryland 6.03% -- -- -- -- 8.31% 2.27% 7.16%North Carolina 1.48% -- -- -- -- 3.37% * 2.74% * 1.87%South Carolina 1.82% -- -- -- -- 2.57% 2.71% * 1.70%Virginia 4.67% -- -- -- -- 7.38% 2.29% * 5.51%West Virginia 2.12% -- -- -- -- 2.62% 3.60% * 2.45%
East South Central:Alabama 2.31% -- -- -- -- 7.13% * 6.25% * 2.24%Kentucky 3.61% -- -- -- -- 5.67% * 9.08% * 5.10% *Mississippi 3.13% * -- -- -- -- 3.95% * 4.80% * 3.13% *Tennessee 3.81% -- -- -- -- 5.01% * 4.76% * 3.93% *
West South Central:Arkansas 2.53% -- -- -- -- 5.97% * 10.23% * 3.97% *Louisiana 4.00% -- -- -- -- 6.37% 1.20% * 4.93%Oklahoma 4.11% -- -- -- -- 7.91% * 3.36% * 5.25%Texas 2.68% -- -- -- -- 3.15% 3.73% 2.88%
Mountain:Arizona 3.16% -- -- -- -- 3.76% 4.60% * 3.41%Colorado 3.14% -- -- -- -- 6.24% * 6.76% * 3.36%Idaho 10.41% -- -- -- -- 13.57% 5.09% 12.37%Montana 2.82% -- -- -- -- 6.64% * 7.38% * 3.07%Nevada 2.41% -- -- -- -- 5.83% * 3.40% * 2.93%New Mexico 1.48% -- -- -- -- 2.76% 2.95% * 2.00%Utah 3.34% -- -- -- -- 7.76% * 2.84% 4.10%Wyoming 2.63% -- -- -- -- 5.14% * 6.50% * 3.62% *
Pacific:Alaska 2.43% -- -- -- -- 7.48% 4.00% 3.20%California 3.28% -- -- -- -- 5.53% 4.58% 3.93%Hawaii 3.16% -- -- -- -- 7.09% 4.37% 4.68%Oregon 4.03% -- -- -- -- 7.04% 6.89% * 4.84%Washington 3.31% -- -- -- -- 6.87% 3.30% 4.62%
Source: Agency for Healthcare Research and Quality, Center for Financing, Access and Cost Trends. 2008 Medical Expenditure PanelSurvey-Insurance Component.Note: Definitions and descriptions of the methods used for this survey can be found in the Technical Appendix.* Figure does not meet standard of reliability or precision.-- Data suppressed due to high standard errors or no reported values in cell.
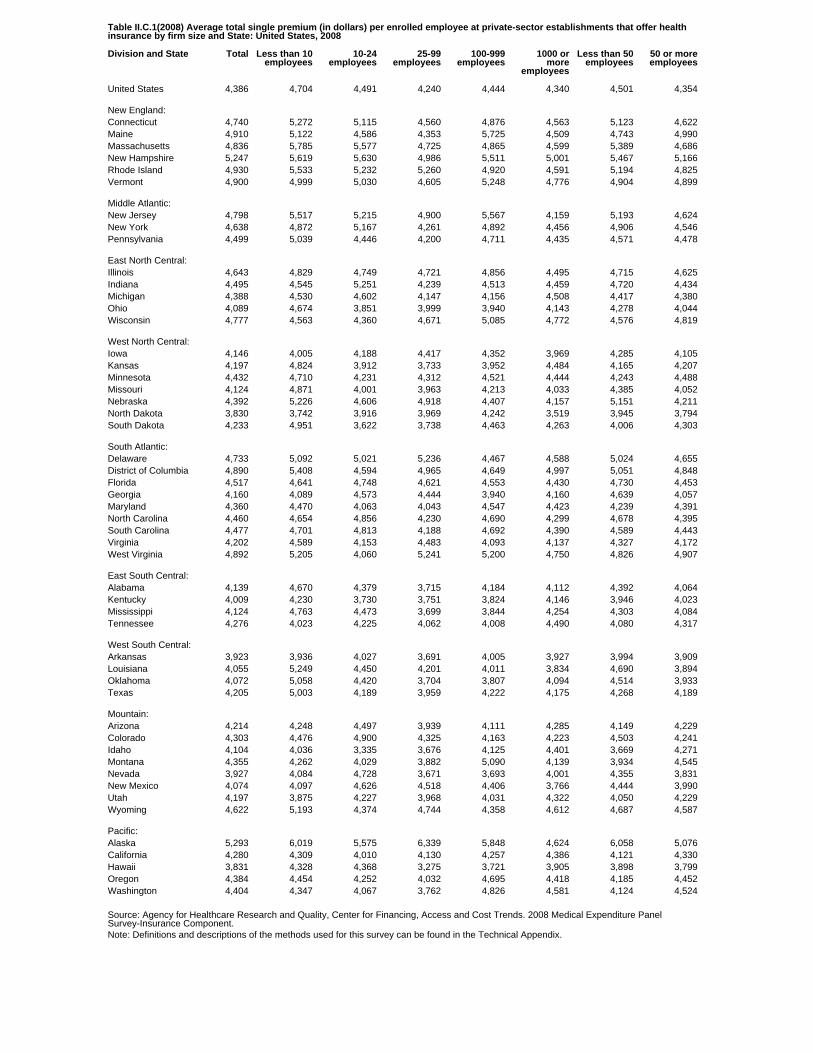
Table II.C.1(2008) Average total single premium (in dollars) per enrolled employee at private-sector establishments that offer healthinsurance by firm size and State: United States, 2008
Division and State Total Less than 10employees
10-24employees
25-99employees
100-999employees
1000 ormore
employees
Less than 50employees
50 or moreemployees
United States 4,386 4,704 4,491 4,240 4,444 4,340 4,501 4,354
New England:Connecticut 4,740 5,272 5,115 4,560 4,876 4,563 5,123 4,622Maine 4,910 5,122 4,586 4,353 5,725 4,509 4,743 4,990Massachusetts 4,836 5,785 5,577 4,725 4,865 4,599 5,389 4,686New Hampshire 5,247 5,619 5,630 4,986 5,511 5,001 5,467 5,166Rhode Island 4,930 5,533 5,232 5,260 4,920 4,591 5,194 4,825Vermont 4,900 4,999 5,030 4,605 5,248 4,776 4,904 4,899
Middle Atlantic:New Jersey 4,798 5,517 5,215 4,900 5,567 4,159 5,193 4,624New York 4,638 4,872 5,167 4,261 4,892 4,456 4,906 4,546Pennsylvania 4,499 5,039 4,446 4,200 4,711 4,435 4,571 4,478
East North Central:Illinois 4,643 4,829 4,749 4,721 4,856 4,495 4,715 4,625Indiana 4,495 4,545 5,251 4,239 4,513 4,459 4,720 4,434Michigan 4,388 4,530 4,602 4,147 4,156 4,508 4,417 4,380Ohio 4,089 4,674 3,851 3,999 3,940 4,143 4,278 4,044Wisconsin 4,777 4,563 4,360 4,671 5,085 4,772 4,576 4,819
West North Central:Iowa 4,146 4,005 4,188 4,417 4,352 3,969 4,285 4,105Kansas 4,197 4,824 3,912 3,733 3,952 4,484 4,165 4,207Minnesota 4,432 4,710 4,231 4,312 4,521 4,444 4,243 4,488Missouri 4,124 4,871 4,001 3,963 4,213 4,033 4,385 4,052Nebraska 4,392 5,226 4,606 4,918 4,407 4,157 5,151 4,211North Dakota 3,830 3,742 3,916 3,969 4,242 3,519 3,945 3,794South Dakota 4,233 4,951 3,622 3,738 4,463 4,263 4,006 4,303
South Atlantic:Delaware 4,733 5,092 5,021 5,236 4,467 4,588 5,024 4,655District of Columbia 4,890 5,408 4,594 4,965 4,649 4,997 5,051 4,848Florida 4,517 4,641 4,748 4,621 4,553 4,430 4,730 4,453Georgia 4,160 4,089 4,573 4,444 3,940 4,160 4,639 4,057Maryland 4,360 4,470 4,063 4,043 4,547 4,423 4,239 4,391North Carolina 4,460 4,654 4,856 4,230 4,690 4,299 4,678 4,395South Carolina 4,477 4,701 4,813 4,188 4,692 4,390 4,589 4,443Virginia 4,202 4,589 4,153 4,483 4,093 4,137 4,327 4,172West Virginia 4,892 5,205 4,060 5,241 5,200 4,750 4,826 4,907
East South Central:Alabama 4,139 4,670 4,379 3,715 4,184 4,112 4,392 4,064Kentucky 4,009 4,230 3,730 3,751 3,824 4,146 3,946 4,023Mississippi 4,124 4,763 4,473 3,699 3,844 4,254 4,303 4,084Tennessee 4,276 4,023 4,225 4,062 4,008 4,490 4,080 4,317
West South Central:Arkansas 3,923 3,936 4,027 3,691 4,005 3,927 3,994 3,909Louisiana 4,055 5,249 4,450 4,201 4,011 3,834 4,690 3,894Oklahoma 4,072 5,058 4,420 3,704 3,807 4,094 4,514 3,933Texas 4,205 5,003 4,189 3,959 4,222 4,175 4,268 4,189
Mountain:Arizona 4,214 4,248 4,497 3,939 4,111 4,285 4,149 4,229Colorado 4,303 4,476 4,900 4,325 4,163 4,223 4,503 4,241Idaho 4,104 4,036 3,335 3,676 4,125 4,401 3,669 4,271Montana 4,355 4,262 4,029 3,882 5,090 4,139 3,934 4,545Nevada 3,927 4,084 4,728 3,671 3,693 4,001 4,355 3,831New Mexico 4,074 4,097 4,626 4,518 4,406 3,766 4,444 3,990Utah 4,197 3,875 4,227 3,968 4,031 4,322 4,050 4,229Wyoming 4,622 5,193 4,374 4,744 4,358 4,612 4,687 4,587
Pacific:Alaska 5,293 6,019 5,575 6,339 5,848 4,624 6,058 5,076California 4,280 4,309 4,010 4,130 4,257 4,386 4,121 4,330Hawaii 3,831 4,328 4,368 3,275 3,721 3,905 3,898 3,799Oregon 4,384 4,454 4,252 4,032 4,695 4,418 4,185 4,452Washington 4,404 4,347 4,067 3,762 4,826 4,581 4,124 4,524
Source: Agency for Healthcare Research and Quality, Center for Financing, Access and Cost Trends. 2008 Medical Expenditure PanelSurvey-Insurance Component.Note: Definitions and descriptions of the methods used for this survey can be found in the Technical Appendix.
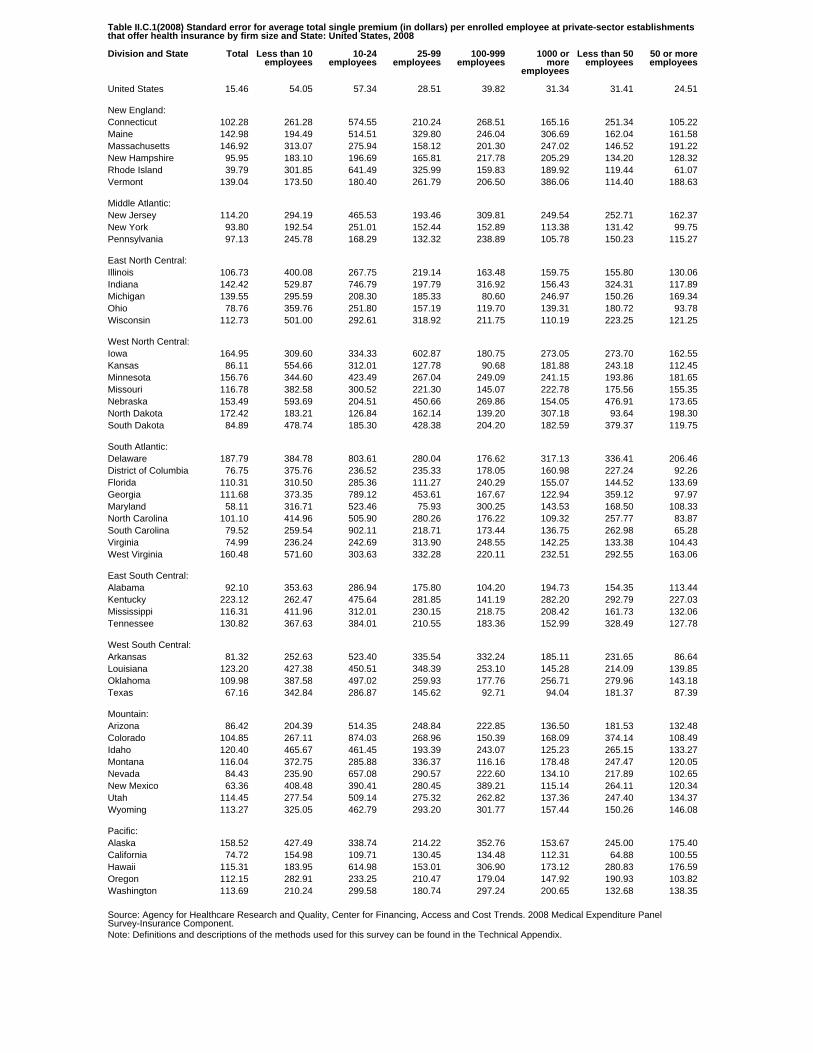
Table II.C.1(2008) Standard error for average total single premium (in dollars) per enrolled employee at private-sector establishmentsthat offer health insurance by firm size and State: United States, 2008
Division and State Total Less than 10employees
10-24employees
25-99employees
100-999employees
1000 ormore
employees
Less than 50employees
50 or moreemployees
United States 15.46 54.05 57.34 28.51 39.82 31.34 31.41 24.51
New England:Connecticut 102.28 261.28 574.55 210.24 268.51 165.16 251.34 105.22Maine 142.98 194.49 514.51 329.80 246.04 306.69 162.04 161.58Massachusetts 146.92 313.07 275.94 158.12 201.30 247.02 146.52 191.22New Hampshire 95.95 183.10 196.69 165.81 217.78 205.29 134.20 128.32Rhode Island 39.79 301.85 641.49 325.99 159.83 189.92 119.44 61.07Vermont 139.04 173.50 180.40 261.79 206.50 386.06 114.40 188.63
Middle Atlantic:New Jersey 114.20 294.19 465.53 193.46 309.81 249.54 252.71 162.37New York 93.80 192.54 251.01 152.44 152.89 113.38 131.42 99.75Pennsylvania 97.13 245.78 168.29 132.32 238.89 105.78 150.23 115.27
East North Central:Illinois 106.73 400.08 267.75 219.14 163.48 159.75 155.80 130.06Indiana 142.42 529.87 746.79 197.79 316.92 156.43 324.31 117.89Michigan 139.55 295.59 208.30 185.33 80.60 246.97 150.26 169.34Ohio 78.76 359.76 251.80 157.19 119.70 139.31 180.72 93.78Wisconsin 112.73 501.00 292.61 318.92 211.75 110.19 223.25 121.25
West North Central:Iowa 164.95 309.60 334.33 602.87 180.75 273.05 273.70 162.55Kansas 86.11 554.66 312.01 127.78 90.68 181.88 243.18 112.45Minnesota 156.76 344.60 423.49 267.04 249.09 241.15 193.86 181.65Missouri 116.78 382.58 300.52 221.30 145.07 222.78 175.56 155.35Nebraska 153.49 593.69 204.51 450.66 269.86 154.05 476.91 173.65North Dakota 172.42 183.21 126.84 162.14 139.20 307.18 93.64 198.30South Dakota 84.89 478.74 185.30 428.38 204.20 182.59 379.37 119.75
South Atlantic:Delaware 187.79 384.78 803.61 280.04 176.62 317.13 336.41 206.46District of Columbia 76.75 375.76 236.52 235.33 178.05 160.98 227.24 92.26Florida 110.31 310.50 285.36 111.27 240.29 155.07 144.52 133.69Georgia 111.68 373.35 789.12 453.61 167.67 122.94 359.12 97.97Maryland 58.11 316.71 523.46 75.93 300.25 143.53 168.50 108.33North Carolina 101.10 414.96 505.90 280.26 176.22 109.32 257.77 83.87South Carolina 79.52 259.54 902.11 218.71 173.44 136.75 262.98 65.28Virginia 74.99 236.24 242.69 313.90 248.55 142.25 133.38 104.43West Virginia 160.48 571.60 303.63 332.28 220.11 232.51 292.55 163.06
East South Central:Alabama 92.10 353.63 286.94 175.80 104.20 194.73 154.35 113.44Kentucky 223.12 262.47 475.64 281.85 141.19 282.20 292.79 227.03Mississippi 116.31 411.96 312.01 230.15 218.75 208.42 161.73 132.06Tennessee 130.82 367.63 384.01 210.55 183.36 152.99 328.49 127.78
West South Central:Arkansas 81.32 252.63 523.40 335.54 332.24 185.11 231.65 86.64Louisiana 123.20 427.38 450.51 348.39 253.10 145.28 214.09 139.85Oklahoma 109.98 387.58 497.02 259.93 177.76 256.71 279.96 143.18Texas 67.16 342.84 286.87 145.62 92.71 94.04 181.37 87.39
Mountain:Arizona 86.42 204.39 514.35 248.84 222.85 136.50 181.53 132.48Colorado 104.85 267.11 874.03 268.96 150.39 168.09 374.14 108.49Idaho 120.40 465.67 461.45 193.39 243.07 125.23 265.15 133.27Montana 116.04 372.75 285.88 336.37 116.16 178.48 247.47 120.05Nevada 84.43 235.90 657.08 290.57 222.60 134.10 217.89 102.65New Mexico 63.36 408.48 390.41 280.45 389.21 115.14 264.11 120.34Utah 114.45 277.54 509.14 275.32 262.82 137.36 247.40 134.37Wyoming 113.27 325.05 462.79 293.20 301.77 157.44 150.26 146.08
Pacific:Alaska 158.52 427.49 338.74 214.22 352.76 153.67 245.00 175.40California 74.72 154.98 109.71 130.45 134.48 112.31 64.88 100.55Hawaii 115.31 183.95 614.98 153.01 306.90 173.12 280.83 176.59Oregon 112.15 282.91 233.25 210.47 179.04 147.92 190.93 103.82Washington 113.69 210.24 299.58 180.74 297.24 200.65 132.68 138.35
Source: Agency for Healthcare Research and Quality, Center for Financing, Access and Cost Trends. 2008 Medical Expenditure PanelSurvey-Insurance Component.Note: Definitions and descriptions of the methods used for this survey can be found in the Technical Appendix.
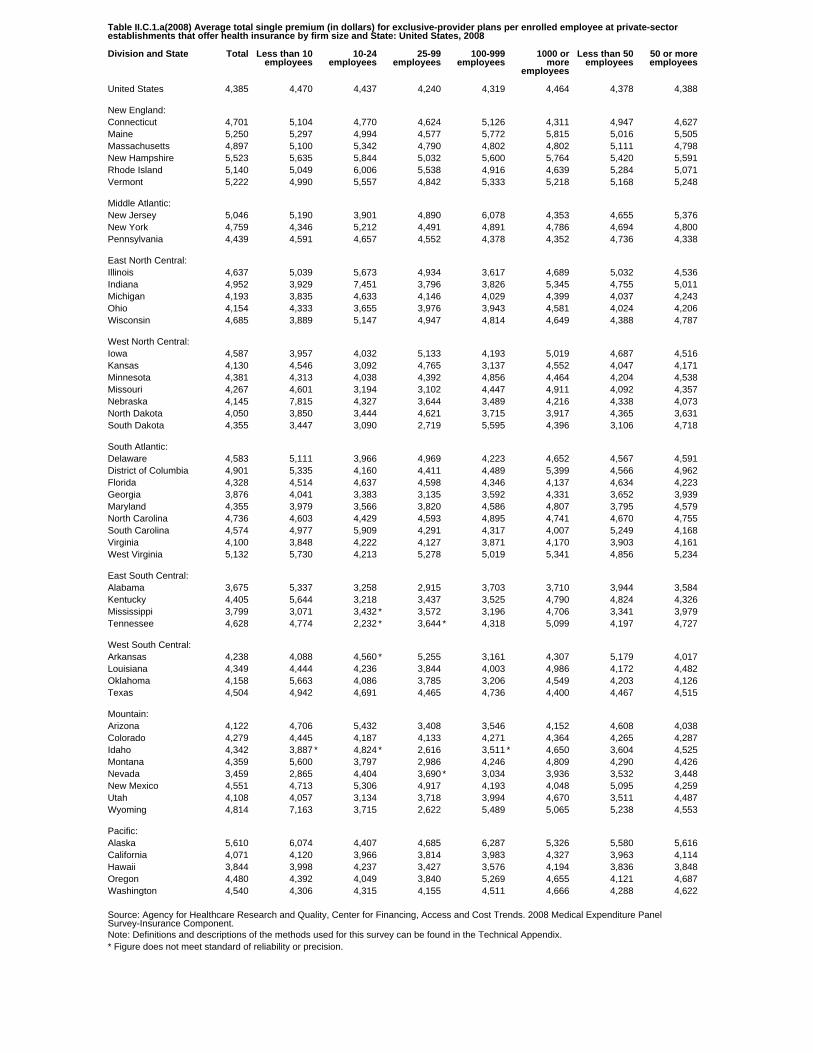
Table II.C.1.a(2008) Average total single premium (in dollars) for exclusive-provider plans per enrolled employee at private-sectorestablishments that offer health insurance by firm size and State: United States, 2008
Division and State Total Less than 10employees
10-24employees
25-99employees
100-999employees
1000 ormore
employees
Less than 50employees
50 or moreemployees
United States 4,385 4,470 4,437 4,240 4,319 4,464 4,378 4,388
New England:Connecticut 4,701 5,104 4,770 4,624 5,126 4,311 4,947 4,627Maine 5,250 5,297 4,994 4,577 5,772 5,815 5,016 5,505Massachusetts 4,897 5,100 5,342 4,790 4,802 4,802 5,111 4,798New Hampshire 5,523 5,635 5,844 5,032 5,600 5,764 5,420 5,591Rhode Island 5,140 5,049 6,006 5,538 4,916 4,639 5,284 5,071Vermont 5,222 4,990 5,557 4,842 5,333 5,218 5,168 5,248
Middle Atlantic:New Jersey 5,046 5,190 3,901 4,890 6,078 4,353 4,655 5,376New York 4,759 4,346 5,212 4,491 4,891 4,786 4,694 4,800Pennsylvania 4,439 4,591 4,657 4,552 4,378 4,352 4,736 4,338
East North Central:Illinois 4,637 5,039 5,673 4,934 3,617 4,689 5,032 4,536Indiana 4,952 3,929 7,451 3,796 3,826 5,345 4,755 5,011Michigan 4,193 3,835 4,633 4,146 4,029 4,399 4,037 4,243Ohio 4,154 4,333 3,655 3,976 3,943 4,581 4,024 4,206Wisconsin 4,685 3,889 5,147 4,947 4,814 4,649 4,388 4,787
West North Central:Iowa 4,587 3,957 4,032 5,133 4,193 5,019 4,687 4,516Kansas 4,130 4,546 3,092 4,765 3,137 4,552 4,047 4,171Minnesota 4,381 4,313 4,038 4,392 4,856 4,464 4,204 4,538Missouri 4,267 4,601 3,194 3,102 4,447 4,911 4,092 4,357Nebraska 4,145 7,815 4,327 3,644 3,489 4,216 4,338 4,073North Dakota 4,050 3,850 3,444 4,621 3,715 3,917 4,365 3,631South Dakota 4,355 3,447 3,090 2,719 5,595 4,396 3,106 4,718
South Atlantic:Delaware 4,583 5,111 3,966 4,969 4,223 4,652 4,567 4,591District of Columbia 4,901 5,335 4,160 4,411 4,489 5,399 4,566 4,962Florida 4,328 4,514 4,637 4,598 4,346 4,137 4,634 4,223Georgia 3,876 4,041 3,383 3,135 3,592 4,331 3,652 3,939Maryland 4,355 3,979 3,566 3,820 4,586 4,807 3,795 4,579North Carolina 4,736 4,603 4,429 4,593 4,895 4,741 4,670 4,755South Carolina 4,574 4,977 5,909 4,291 4,317 4,007 5,249 4,168Virginia 4,100 3,848 4,222 4,127 3,871 4,170 3,903 4,161West Virginia 5,132 5,730 4,213 5,278 5,019 5,341 4,856 5,234
East South Central:Alabama 3,675 5,337 3,258 2,915 3,703 3,710 3,944 3,584Kentucky 4,405 5,644 3,218 3,437 3,525 4,790 4,824 4,326Mississippi 3,799 3,071 3,432 * 3,572 3,196 4,706 3,341 3,979Tennessee 4,628 4,774 2,232 * 3,644 * 4,318 5,099 4,197 4,727
West South Central:Arkansas 4,238 4,088 4,560 * 5,255 3,161 4,307 5,179 4,017Louisiana 4,349 4,444 4,236 3,844 4,003 4,986 4,172 4,482Oklahoma 4,158 5,663 4,086 3,785 3,206 4,549 4,203 4,126Texas 4,504 4,942 4,691 4,465 4,736 4,400 4,467 4,515
Mountain:Arizona 4,122 4,706 5,432 3,408 3,546 4,152 4,608 4,038Colorado 4,279 4,445 4,187 4,133 4,271 4,364 4,265 4,287Idaho 4,342 3,887 * 4,824 * 2,616 3,511 * 4,650 3,604 4,525Montana 4,359 5,600 3,797 2,986 4,246 4,809 4,290 4,426Nevada 3,459 2,865 4,404 3,690 * 3,034 3,936 3,532 3,448New Mexico 4,551 4,713 5,306 4,917 4,193 4,048 5,095 4,259Utah 4,108 4,057 3,134 3,718 3,994 4,670 3,511 4,487Wyoming 4,814 7,163 3,715 2,622 5,489 5,065 5,238 4,553
Pacific:Alaska 5,610 6,074 4,407 4,685 6,287 5,326 5,580 5,616California 4,071 4,120 3,966 3,814 3,983 4,327 3,963 4,114Hawaii 3,844 3,998 4,237 3,427 3,576 4,194 3,836 3,848Oregon 4,480 4,392 4,049 3,840 5,269 4,655 4,121 4,687Washington 4,540 4,306 4,315 4,155 4,511 4,666 4,288 4,622
Source: Agency for Healthcare Research and Quality, Center for Financing, Access and Cost Trends. 2008 Medical Expenditure PanelSurvey-Insurance Component.Note: Definitions and descriptions of the methods used for this survey can be found in the Technical Appendix.* Figure does not meet standard of reliability or precision.
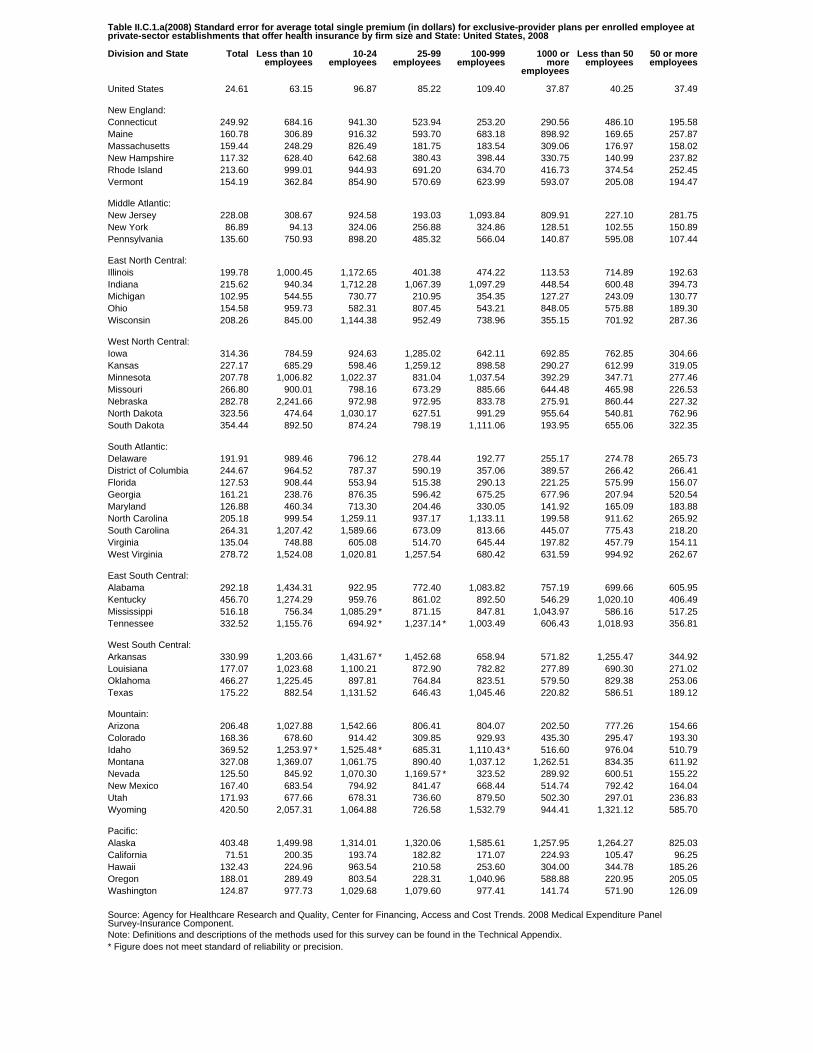
Table II.C.1.a(2008) Standard error for average total single premium (in dollars) for exclusive-provider plans per enrolled employee atprivate-sector establishments that offer health insurance by firm size and State: United States, 2008
Division and State Total Less than 10employees
10-24employees
25-99employees
100-999employees
1000 ormore
employees
Less than 50employees
50 or moreemployees
United States 24.61 63.15 96.87 85.22 109.40 37.87 40.25 37.49
New England:Connecticut 249.92 684.16 941.30 523.94 253.20 290.56 486.10 195.58Maine 160.78 306.89 916.32 593.70 683.18 898.92 169.65 257.87Massachusetts 159.44 248.29 826.49 181.75 183.54 309.06 176.97 158.02New Hampshire 117.32 628.40 642.68 380.43 398.44 330.75 140.99 237.82Rhode Island 213.60 999.01 944.93 691.20 634.70 416.73 374.54 252.45Vermont 154.19 362.84 854.90 570.69 623.99 593.07 205.08 194.47
Middle Atlantic:New Jersey 228.08 308.67 924.58 193.03 1,093.84 809.91 227.10 281.75New York 86.89 94.13 324.06 256.88 324.86 128.51 102.55 150.89Pennsylvania 135.60 750.93 898.20 485.32 566.04 140.87 595.08 107.44
East North Central:Illinois 199.78 1,000.45 1,172.65 401.38 474.22 113.53 714.89 192.63Indiana 215.62 940.34 1,712.28 1,067.39 1,097.29 448.54 600.48 394.73Michigan 102.95 544.55 730.77 210.95 354.35 127.27 243.09 130.77Ohio 154.58 959.73 582.31 807.45 543.21 848.05 575.88 189.30Wisconsin 208.26 845.00 1,144.38 952.49 738.96 355.15 701.92 287.36
West North Central:Iowa 314.36 784.59 924.63 1,285.02 642.11 692.85 762.85 304.66Kansas 227.17 685.29 598.46 1,259.12 898.58 290.27 612.99 319.05Minnesota 207.78 1,006.82 1,022.37 831.04 1,037.54 392.29 347.71 277.46Missouri 266.80 900.01 798.16 673.29 885.66 644.48 465.98 226.53Nebraska 282.78 2,241.66 972.98 972.95 833.78 275.91 860.44 227.32North Dakota 323.56 474.64 1,030.17 627.51 991.29 955.64 540.81 762.96South Dakota 354.44 892.50 874.24 798.19 1,111.06 193.95 655.06 322.35
South Atlantic:Delaware 191.91 989.46 796.12 278.44 192.77 255.17 274.78 265.73District of Columbia 244.67 964.52 787.37 590.19 357.06 389.57 266.42 266.41Florida 127.53 908.44 553.94 515.38 290.13 221.25 575.99 156.07Georgia 161.21 238.76 876.35 596.42 675.25 677.96 207.94 520.54Maryland 126.88 460.34 713.30 204.46 330.05 141.92 165.09 183.88North Carolina 205.18 999.54 1,259.11 937.17 1,133.11 199.58 911.62 265.92South Carolina 264.31 1,207.42 1,589.66 673.09 813.66 445.07 775.43 218.20Virginia 135.04 748.88 605.08 514.70 645.44 197.82 457.79 154.11West Virginia 278.72 1,524.08 1,020.81 1,257.54 680.42 631.59 994.92 262.67
East South Central:Alabama 292.18 1,434.31 922.95 772.40 1,083.82 757.19 699.66 605.95Kentucky 456.70 1,274.29 959.76 861.02 892.50 546.29 1,020.10 406.49Mississippi 516.18 756.34 1,085.29 * 871.15 847.81 1,043.97 586.16 517.25Tennessee 332.52 1,155.76 694.92 * 1,237.14 * 1,003.49 606.43 1,018.93 356.81
West South Central:Arkansas 330.99 1,203.66 1,431.67 * 1,452.68 658.94 571.82 1,255.47 344.92Louisiana 177.07 1,023.68 1,100.21 872.90 782.82 277.89 690.30 271.02Oklahoma 466.27 1,225.45 897.81 764.84 823.51 579.50 829.38 253.06Texas 175.22 882.54 1,131.52 646.43 1,045.46 220.82 586.51 189.12
Mountain:Arizona 206.48 1,027.88 1,542.66 806.41 804.07 202.50 777.26 154.66Colorado 168.36 678.60 914.42 309.85 929.93 435.30 295.47 193.30Idaho 369.52 1,253.97 * 1,525.48 * 685.31 1,110.43 * 516.60 976.04 510.79Montana 327.08 1,369.07 1,061.75 890.40 1,037.12 1,262.51 834.35 611.92Nevada 125.50 845.92 1,070.30 1,169.57 * 323.52 289.92 600.51 155.22New Mexico 167.40 683.54 794.92 841.47 668.44 514.74 792.42 164.04Utah 171.93 677.66 678.31 736.60 879.50 502.30 297.01 236.83Wyoming 420.50 2,057.31 1,064.88 726.58 1,532.79 944.41 1,321.12 585.70
Pacific:Alaska 403.48 1,499.98 1,314.01 1,320.06 1,585.61 1,257.95 1,264.27 825.03California 71.51 200.35 193.74 182.82 171.07 224.93 105.47 96.25Hawaii 132.43 224.96 963.54 210.58 253.60 304.00 344.78 185.26Oregon 188.01 289.49 803.54 228.31 1,040.96 588.88 220.95 205.05Washington 124.87 977.73 1,029.68 1,079.60 977.41 141.74 571.90 126.09
Source: Agency for Healthcare Research and Quality, Center for Financing, Access and Cost Trends. 2008 Medical Expenditure PanelSurvey-Insurance Component.Note: Definitions and descriptions of the methods used for this survey can be found in the Technical Appendix.* Figure does not meet standard of reliability or precision.
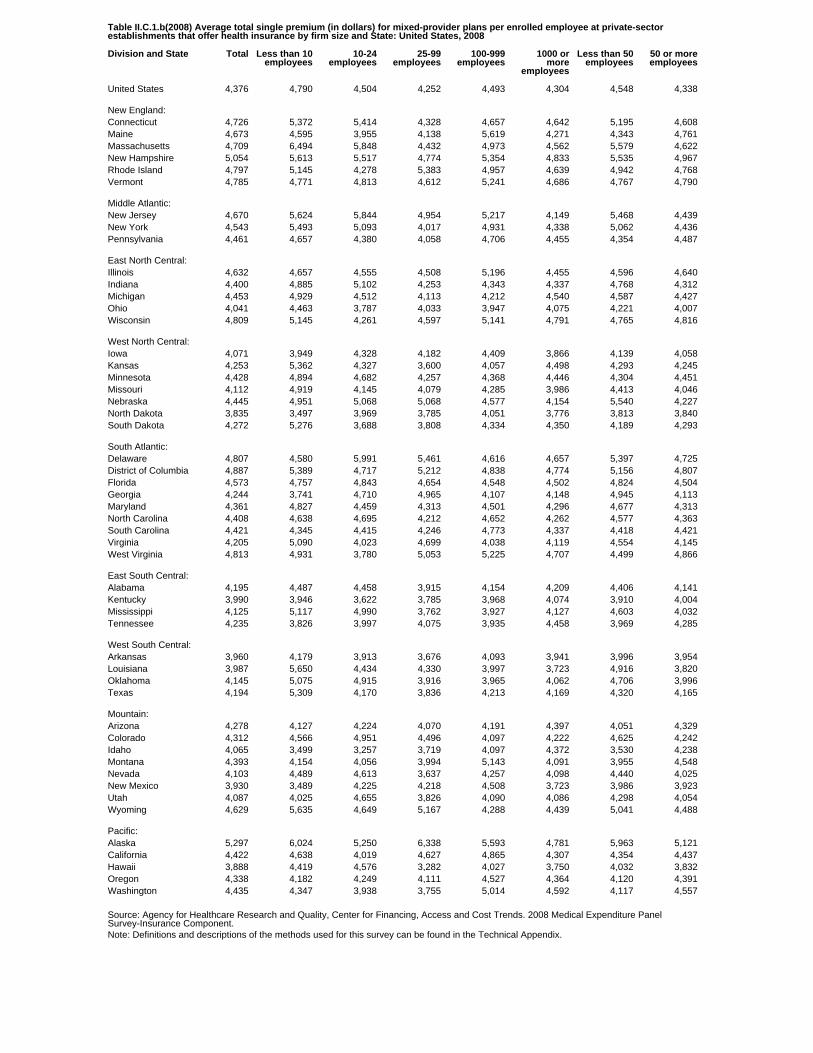
Table II.C.1.b(2008) Average total single premium (in dollars) for mixed-provider plans per enrolled employee at private-sectorestablishments that offer health insurance by firm size and State: United States, 2008
Division and State Total Less than 10employees
10-24employees
25-99employees
100-999employees
1000 ormore
employees
Less than 50employees
50 or moreemployees
United States 4,376 4,790 4,504 4,252 4,493 4,304 4,548 4,338
New England:Connecticut 4,726 5,372 5,414 4,328 4,657 4,642 5,195 4,608Maine 4,673 4,595 3,955 4,138 5,619 4,271 4,343 4,761Massachusetts 4,709 6,494 5,848 4,432 4,973 4,562 5,579 4,622New Hampshire 5,054 5,613 5,517 4,774 5,354 4,833 5,535 4,967Rhode Island 4,797 5,145 4,278 5,383 4,957 4,639 4,942 4,768Vermont 4,785 4,771 4,813 4,612 5,241 4,686 4,767 4,790
Middle Atlantic:New Jersey 4,670 5,624 5,844 4,954 5,217 4,149 5,468 4,439New York 4,543 5,493 5,093 4,017 4,931 4,338 5,062 4,436Pennsylvania 4,461 4,657 4,380 4,058 4,706 4,455 4,354 4,487
East North Central:Illinois 4,632 4,657 4,555 4,508 5,196 4,455 4,596 4,640Indiana 4,400 4,885 5,102 4,253 4,343 4,337 4,768 4,312Michigan 4,453 4,929 4,512 4,113 4,212 4,540 4,587 4,427Ohio 4,041 4,463 3,787 4,033 3,947 4,075 4,221 4,007Wisconsin 4,809 5,145 4,261 4,597 5,141 4,791 4,765 4,816
West North Central:Iowa 4,071 3,949 4,328 4,182 4,409 3,866 4,139 4,058Kansas 4,253 5,362 4,327 3,600 4,057 4,498 4,293 4,245Minnesota 4,428 4,894 4,682 4,257 4,368 4,446 4,304 4,451Missouri 4,112 4,919 4,145 4,079 4,285 3,986 4,413 4,046Nebraska 4,445 4,951 5,068 5,068 4,577 4,154 5,540 4,227North Dakota 3,835 3,497 3,969 3,785 4,051 3,776 3,813 3,840South Dakota 4,272 5,276 3,688 3,808 4,334 4,350 4,189 4,293
South Atlantic:Delaware 4,807 4,580 5,991 5,461 4,616 4,657 5,397 4,725District of Columbia 4,887 5,389 4,717 5,212 4,838 4,774 5,156 4,807Florida 4,573 4,757 4,843 4,654 4,548 4,502 4,824 4,504Georgia 4,244 3,741 4,710 4,965 4,107 4,148 4,945 4,113Maryland 4,361 4,827 4,459 4,313 4,501 4,296 4,677 4,313North Carolina 4,408 4,638 4,695 4,212 4,652 4,262 4,577 4,363South Carolina 4,421 4,345 4,415 4,246 4,773 4,337 4,418 4,421Virginia 4,205 5,090 4,023 4,699 4,038 4,119 4,554 4,145West Virginia 4,813 4,931 3,780 5,053 5,225 4,707 4,499 4,866
East South Central:Alabama 4,195 4,487 4,458 3,915 4,154 4,209 4,406 4,141Kentucky 3,990 3,946 3,622 3,785 3,968 4,074 3,910 4,004Mississippi 4,125 5,117 4,990 3,762 3,927 4,127 4,603 4,032Tennessee 4,235 3,826 3,997 4,075 3,935 4,458 3,969 4,285
West South Central:Arkansas 3,960 4,179 3,913 3,676 4,093 3,941 3,996 3,954Louisiana 3,987 5,650 4,434 4,330 3,997 3,723 4,916 3,820Oklahoma 4,145 5,075 4,915 3,916 3,965 4,062 4,706 3,996Texas 4,194 5,309 4,170 3,836 4,213 4,169 4,320 4,165
Mountain:Arizona 4,278 4,127 4,224 4,070 4,191 4,397 4,051 4,329Colorado 4,312 4,566 4,951 4,496 4,097 4,222 4,625 4,242Idaho 4,065 3,499 3,257 3,719 4,097 4,372 3,530 4,238Montana 4,393 4,154 4,056 3,994 5,143 4,091 3,955 4,548Nevada 4,103 4,489 4,613 3,637 4,257 4,098 4,440 4,025New Mexico 3,930 3,489 4,225 4,218 4,508 3,723 3,986 3,923Utah 4,087 4,025 4,655 3,826 4,090 4,086 4,298 4,054Wyoming 4,629 5,635 4,649 5,167 4,288 4,439 5,041 4,488
Pacific:Alaska 5,297 6,024 5,250 6,338 5,593 4,781 5,963 5,121California 4,422 4,638 4,019 4,627 4,865 4,307 4,354 4,437Hawaii 3,888 4,419 4,576 3,282 4,027 3,750 4,032 3,832Oregon 4,338 4,182 4,249 4,111 4,527 4,364 4,120 4,391Washington 4,435 4,347 3,938 3,755 5,014 4,592 4,117 4,557
Source: Agency for Healthcare Research and Quality, Center for Financing, Access and Cost Trends. 2008 Medical Expenditure PanelSurvey-Insurance Component.Note: Definitions and descriptions of the methods used for this survey can be found in the Technical Appendix.
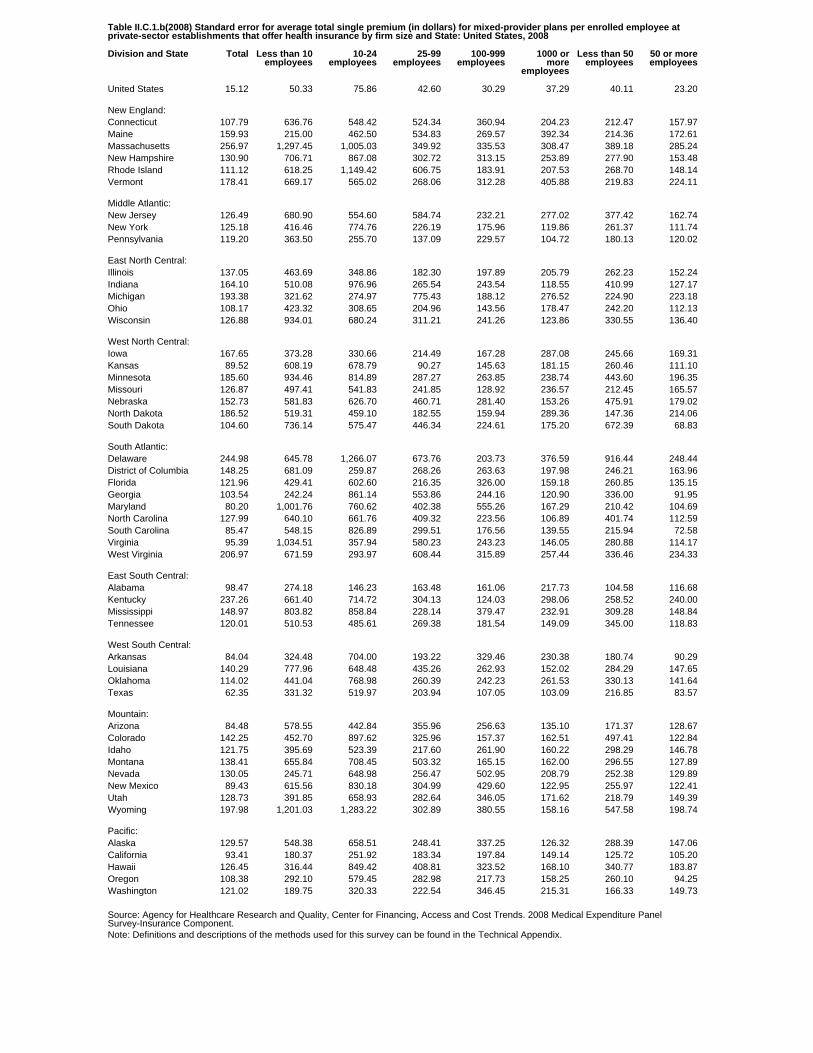
Table II.C.1.b(2008) Standard error for average total single premium (in dollars) for mixed-provider plans per enrolled employee atprivate-sector establishments that offer health insurance by firm size and State: United States, 2008
Division and State Total Less than 10employees
10-24employees
25-99employees
100-999employees
1000 ormore
employees
Less than 50employees
50 or moreemployees
United States 15.12 50.33 75.86 42.60 30.29 37.29 40.11 23.20
New England:Connecticut 107.79 636.76 548.42 524.34 360.94 204.23 212.47 157.97Maine 159.93 215.00 462.50 534.83 269.57 392.34 214.36 172.61Massachusetts 256.97 1,297.45 1,005.03 349.92 335.53 308.47 389.18 285.24New Hampshire 130.90 706.71 867.08 302.72 313.15 253.89 277.90 153.48Rhode Island 111.12 618.25 1,149.42 606.75 183.91 207.53 268.70 148.14Vermont 178.41 669.17 565.02 268.06 312.28 405.88 219.83 224.11
Middle Atlantic:New Jersey 126.49 680.90 554.60 584.74 232.21 277.02 377.42 162.74New York 125.18 416.46 774.76 226.19 175.96 119.86 261.37 111.74Pennsylvania 119.20 363.50 255.70 137.09 229.57 104.72 180.13 120.02
East North Central:Illinois 137.05 463.69 348.86 182.30 197.89 205.79 262.23 152.24Indiana 164.10 510.08 976.96 265.54 243.54 118.55 410.99 127.17Michigan 193.38 321.62 274.97 775.43 188.12 276.52 224.90 223.18Ohio 108.17 423.32 308.65 204.96 143.56 178.47 242.20 112.13Wisconsin 126.88 934.01 680.24 311.21 241.26 123.86 330.55 136.40
West North Central:Iowa 167.65 373.28 330.66 214.49 167.28 287.08 245.66 169.31Kansas 89.52 608.19 678.79 90.27 145.63 181.15 260.46 111.10Minnesota 185.60 934.46 814.89 287.27 263.85 238.74 443.60 196.35Missouri 126.87 497.41 541.83 241.85 128.92 236.57 212.45 165.57Nebraska 152.73 581.83 626.70 460.71 281.40 153.26 475.91 179.02North Dakota 186.52 519.31 459.10 182.55 159.94 289.36 147.36 214.06South Dakota 104.60 736.14 575.47 446.34 224.61 175.20 672.39 68.83
South Atlantic:Delaware 244.98 645.78 1,266.07 673.76 203.73 376.59 916.44 248.44District of Columbia 148.25 681.09 259.87 268.26 263.63 197.98 246.21 163.96Florida 121.96 429.41 602.60 216.35 326.00 159.18 260.85 135.15Georgia 103.54 242.24 861.14 553.86 244.16 120.90 336.00 91.95Maryland 80.20 1,001.76 760.62 402.38 555.26 167.29 210.42 104.69North Carolina 127.99 640.10 661.76 409.32 223.56 106.89 401.74 112.59South Carolina 85.47 548.15 826.89 299.51 176.56 139.55 215.94 72.58Virginia 95.39 1,034.51 357.94 580.23 243.23 146.05 280.88 114.17West Virginia 206.97 671.59 293.97 608.44 315.89 257.44 336.46 234.33
East South Central:Alabama 98.47 274.18 146.23 163.48 161.06 217.73 104.58 116.68Kentucky 237.26 661.40 714.72 304.13 124.03 298.06 258.52 240.00Mississippi 148.97 803.82 858.84 228.14 379.47 232.91 309.28 148.84Tennessee 120.01 510.53 485.61 269.38 181.54 149.09 345.00 118.83
West South Central:Arkansas 84.04 324.48 704.00 193.22 329.46 230.38 180.74 90.29Louisiana 140.29 777.96 648.48 435.26 262.93 152.02 284.29 147.65Oklahoma 114.02 441.04 768.98 260.39 242.23 261.53 330.13 141.64Texas 62.35 331.32 519.97 203.94 107.05 103.09 216.85 83.57
Mountain:Arizona 84.48 578.55 442.84 355.96 256.63 135.10 171.37 128.67Colorado 142.25 452.70 897.62 325.96 157.37 162.51 497.41 122.84Idaho 121.75 395.69 523.39 217.60 261.90 160.22 298.29 146.78Montana 138.41 655.84 708.45 503.32 165.15 162.00 296.55 127.89Nevada 130.05 245.71 648.98 256.47 502.95 208.79 252.38 129.89New Mexico 89.43 615.56 830.18 304.99 429.60 122.95 255.97 122.41Utah 128.73 391.85 658.93 282.64 346.05 171.62 218.79 149.39Wyoming 197.98 1,201.03 1,283.22 302.89 380.55 158.16 547.58 198.74
Pacific:Alaska 129.57 548.38 658.51 248.41 337.25 126.32 288.39 147.06California 93.41 180.37 251.92 183.34 197.84 149.14 125.72 105.20Hawaii 126.45 316.44 849.42 408.81 323.52 168.10 340.77 183.87Oregon 108.38 292.10 579.45 282.98 217.73 158.25 260.10 94.25Washington 121.02 189.75 320.33 222.54 346.45 215.31 166.33 149.73
Source: Agency for Healthcare Research and Quality, Center for Financing, Access and Cost Trends. 2008 Medical Expenditure PanelSurvey-Insurance Component.Note: Definitions and descriptions of the methods used for this survey can be found in the Technical Appendix.
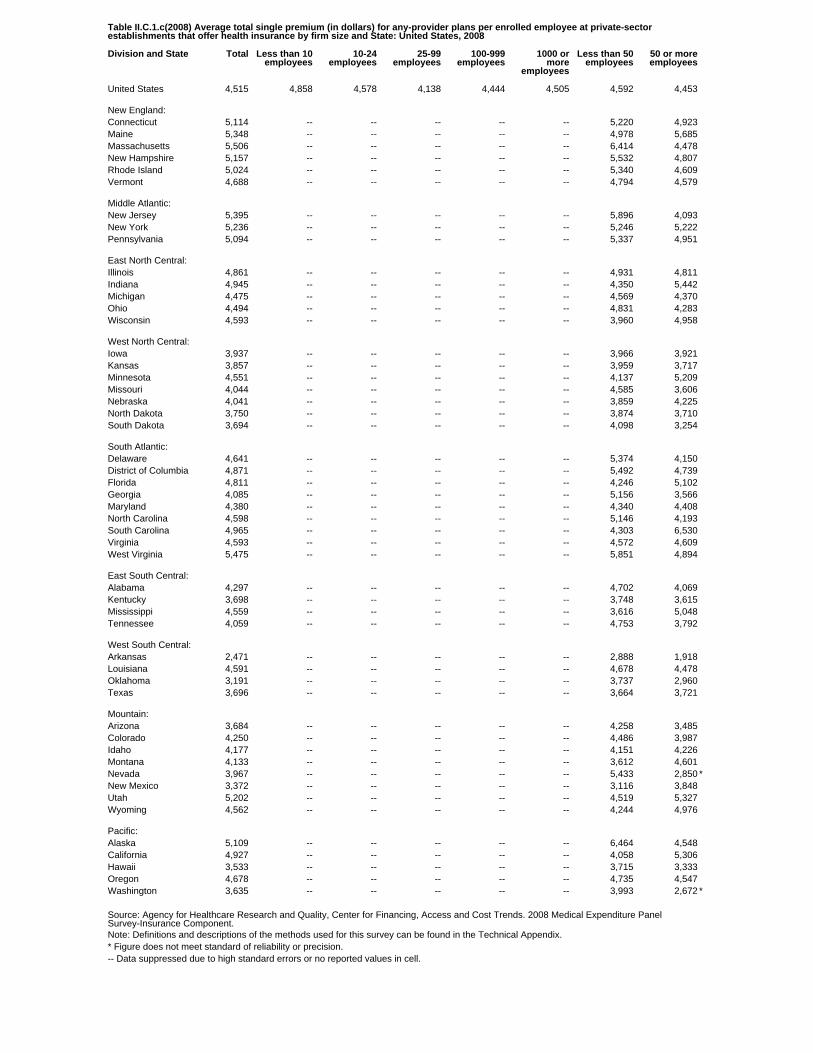
Table II.C.1.c(2008) Average total single premium (in dollars) for any-provider plans per enrolled employee at private-sectorestablishments that offer health insurance by firm size and State: United States, 2008
Division and State Total Less than 10employees
10-24employees
25-99employees
100-999employees
1000 ormore
employees
Less than 50employees
50 or moreemployees
United States 4,515 4,858 4,578 4,138 4,444 4,505 4,592 4,453
New England:Connecticut 5,114 -- -- -- -- -- 5,220 4,923Maine 5,348 -- -- -- -- -- 4,978 5,685Massachusetts 5,506 -- -- -- -- -- 6,414 4,478New Hampshire 5,157 -- -- -- -- -- 5,532 4,807Rhode Island 5,024 -- -- -- -- -- 5,340 4,609Vermont 4,688 -- -- -- -- -- 4,794 4,579
Middle Atlantic:New Jersey 5,395 -- -- -- -- -- 5,896 4,093New York 5,236 -- -- -- -- -- 5,246 5,222Pennsylvania 5,094 -- -- -- -- -- 5,337 4,951
East North Central:Illinois 4,861 -- -- -- -- -- 4,931 4,811Indiana 4,945 -- -- -- -- -- 4,350 5,442Michigan 4,475 -- -- -- -- -- 4,569 4,370Ohio 4,494 -- -- -- -- -- 4,831 4,283Wisconsin 4,593 -- -- -- -- -- 3,960 4,958
West North Central:Iowa 3,937 -- -- -- -- -- 3,966 3,921Kansas 3,857 -- -- -- -- -- 3,959 3,717Minnesota 4,551 -- -- -- -- -- 4,137 5,209Missouri 4,044 -- -- -- -- -- 4,585 3,606Nebraska 4,041 -- -- -- -- -- 3,859 4,225North Dakota 3,750 -- -- -- -- -- 3,874 3,710South Dakota 3,694 -- -- -- -- -- 4,098 3,254
South Atlantic:Delaware 4,641 -- -- -- -- -- 5,374 4,150District of Columbia 4,871 -- -- -- -- -- 5,492 4,739Florida 4,811 -- -- -- -- -- 4,246 5,102Georgia 4,085 -- -- -- -- -- 5,156 3,566Maryland 4,380 -- -- -- -- -- 4,340 4,408North Carolina 4,598 -- -- -- -- -- 5,146 4,193South Carolina 4,965 -- -- -- -- -- 4,303 6,530Virginia 4,593 -- -- -- -- -- 4,572 4,609West Virginia 5,475 -- -- -- -- -- 5,851 4,894
East South Central:Alabama 4,297 -- -- -- -- -- 4,702 4,069Kentucky 3,698 -- -- -- -- -- 3,748 3,615Mississippi 4,559 -- -- -- -- -- 3,616 5,048Tennessee 4,059 -- -- -- -- -- 4,753 3,792
West South Central:Arkansas 2,471 -- -- -- -- -- 2,888 1,918Louisiana 4,591 -- -- -- -- -- 4,678 4,478Oklahoma 3,191 -- -- -- -- -- 3,737 2,960Texas 3,696 -- -- -- -- -- 3,664 3,721
Mountain:Arizona 3,684 -- -- -- -- -- 4,258 3,485Colorado 4,250 -- -- -- -- -- 4,486 3,987Idaho 4,177 -- -- -- -- -- 4,151 4,226Montana 4,133 -- -- -- -- -- 3,612 4,601Nevada 3,967 -- -- -- -- -- 5,433 2,850 *New Mexico 3,372 -- -- -- -- -- 3,116 3,848Utah 5,202 -- -- -- -- -- 4,519 5,327Wyoming 4,562 -- -- -- -- -- 4,244 4,976
Pacific:Alaska 5,109 -- -- -- -- -- 6,464 4,548California 4,927 -- -- -- -- -- 4,058 5,306Hawaii 3,533 -- -- -- -- -- 3,715 3,333Oregon 4,678 -- -- -- -- -- 4,735 4,547Washington 3,635 -- -- -- -- -- 3,993 2,672 *
Source: Agency for Healthcare Research and Quality, Center for Financing, Access and Cost Trends. 2008 Medical Expenditure PanelSurvey-Insurance Component.Note: Definitions and descriptions of the methods used for this survey can be found in the Technical Appendix.* Figure does not meet standard of reliability or precision.-- Data suppressed due to high standard errors or no reported values in cell.
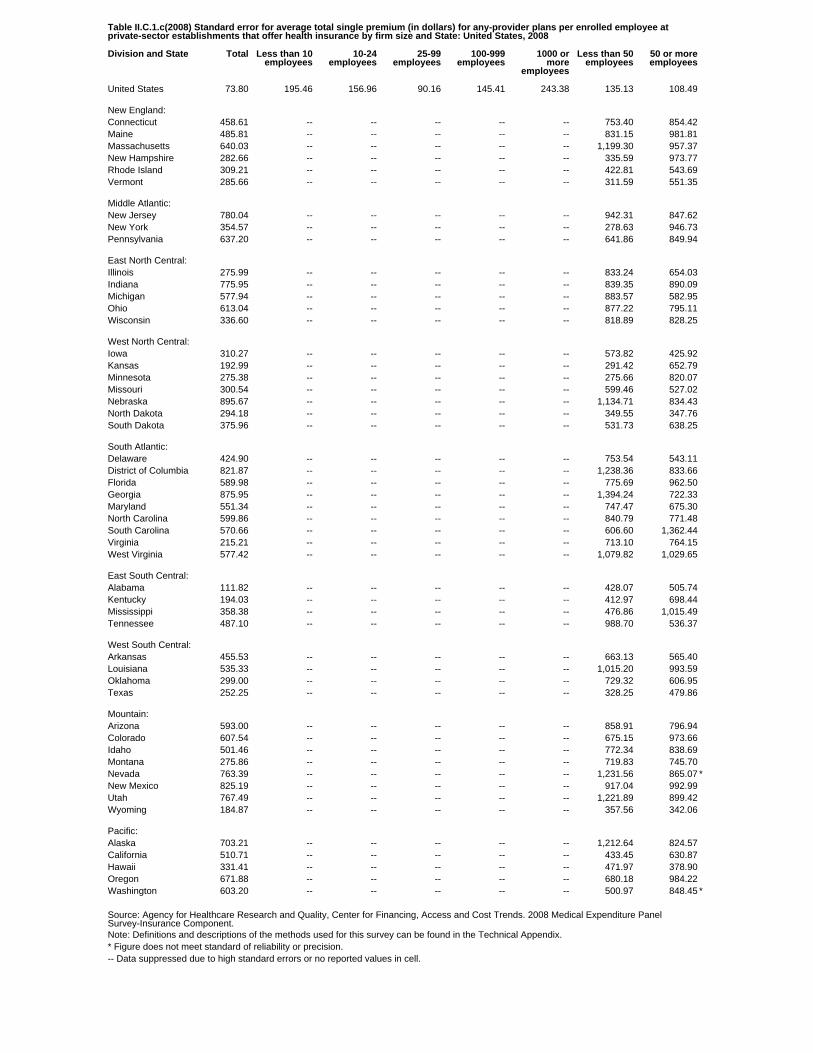
Table II.C.1.c(2008) Standard error for average total single premium (in dollars) for any-provider plans per enrolled employee atprivate-sector establishments that offer health insurance by firm size and State: United States, 2008
Division and State Total Less than 10employees
10-24employees
25-99employees
100-999employees
1000 ormore
employees
Less than 50employees
50 or moreemployees
United States 73.80 195.46 156.96 90.16 145.41 243.38 135.13 108.49
New England:Connecticut 458.61 -- -- -- -- -- 753.40 854.42Maine 485.81 -- -- -- -- -- 831.15 981.81Massachusetts 640.03 -- -- -- -- -- 1,199.30 957.37New Hampshire 282.66 -- -- -- -- -- 335.59 973.77Rhode Island 309.21 -- -- -- -- -- 422.81 543.69Vermont 285.66 -- -- -- -- -- 311.59 551.35
Middle Atlantic:New Jersey 780.04 -- -- -- -- -- 942.31 847.62New York 354.57 -- -- -- -- -- 278.63 946.73Pennsylvania 637.20 -- -- -- -- -- 641.86 849.94
East North Central:Illinois 275.99 -- -- -- -- -- 833.24 654.03Indiana 775.95 -- -- -- -- -- 839.35 890.09Michigan 577.94 -- -- -- -- -- 883.57 582.95Ohio 613.04 -- -- -- -- -- 877.22 795.11Wisconsin 336.60 -- -- -- -- -- 818.89 828.25
West North Central:Iowa 310.27 -- -- -- -- -- 573.82 425.92Kansas 192.99 -- -- -- -- -- 291.42 652.79Minnesota 275.38 -- -- -- -- -- 275.66 820.07Missouri 300.54 -- -- -- -- -- 599.46 527.02Nebraska 895.67 -- -- -- -- -- 1,134.71 834.43North Dakota 294.18 -- -- -- -- -- 349.55 347.76South Dakota 375.96 -- -- -- -- -- 531.73 638.25
South Atlantic:Delaware 424.90 -- -- -- -- -- 753.54 543.11District of Columbia 821.87 -- -- -- -- -- 1,238.36 833.66Florida 589.98 -- -- -- -- -- 775.69 962.50Georgia 875.95 -- -- -- -- -- 1,394.24 722.33Maryland 551.34 -- -- -- -- -- 747.47 675.30North Carolina 599.86 -- -- -- -- -- 840.79 771.48South Carolina 570.66 -- -- -- -- -- 606.60 1,362.44Virginia 215.21 -- -- -- -- -- 713.10 764.15West Virginia 577.42 -- -- -- -- -- 1,079.82 1,029.65
East South Central:Alabama 111.82 -- -- -- -- -- 428.07 505.74Kentucky 194.03 -- -- -- -- -- 412.97 698.44Mississippi 358.38 -- -- -- -- -- 476.86 1,015.49Tennessee 487.10 -- -- -- -- -- 988.70 536.37
West South Central:Arkansas 455.53 -- -- -- -- -- 663.13 565.40Louisiana 535.33 -- -- -- -- -- 1,015.20 993.59Oklahoma 299.00 -- -- -- -- -- 729.32 606.95Texas 252.25 -- -- -- -- -- 328.25 479.86
Mountain:Arizona 593.00 -- -- -- -- -- 858.91 796.94Colorado 607.54 -- -- -- -- -- 675.15 973.66Idaho 501.46 -- -- -- -- -- 772.34 838.69Montana 275.86 -- -- -- -- -- 719.83 745.70Nevada 763.39 -- -- -- -- -- 1,231.56 865.07 *New Mexico 825.19 -- -- -- -- -- 917.04 992.99Utah 767.49 -- -- -- -- -- 1,221.89 899.42Wyoming 184.87 -- -- -- -- -- 357.56 342.06
Pacific:Alaska 703.21 -- -- -- -- -- 1,212.64 824.57California 510.71 -- -- -- -- -- 433.45 630.87Hawaii 331.41 -- -- -- -- -- 471.97 378.90Oregon 671.88 -- -- -- -- -- 680.18 984.22Washington 603.20 -- -- -- -- -- 500.97 848.45 *
Source: Agency for Healthcare Research and Quality, Center for Financing, Access and Cost Trends. 2008 Medical Expenditure PanelSurvey-Insurance Component.Note: Definitions and descriptions of the methods used for this survey can be found in the Technical Appendix.* Figure does not meet standard of reliability or precision.-- Data suppressed due to high standard errors or no reported values in cell.
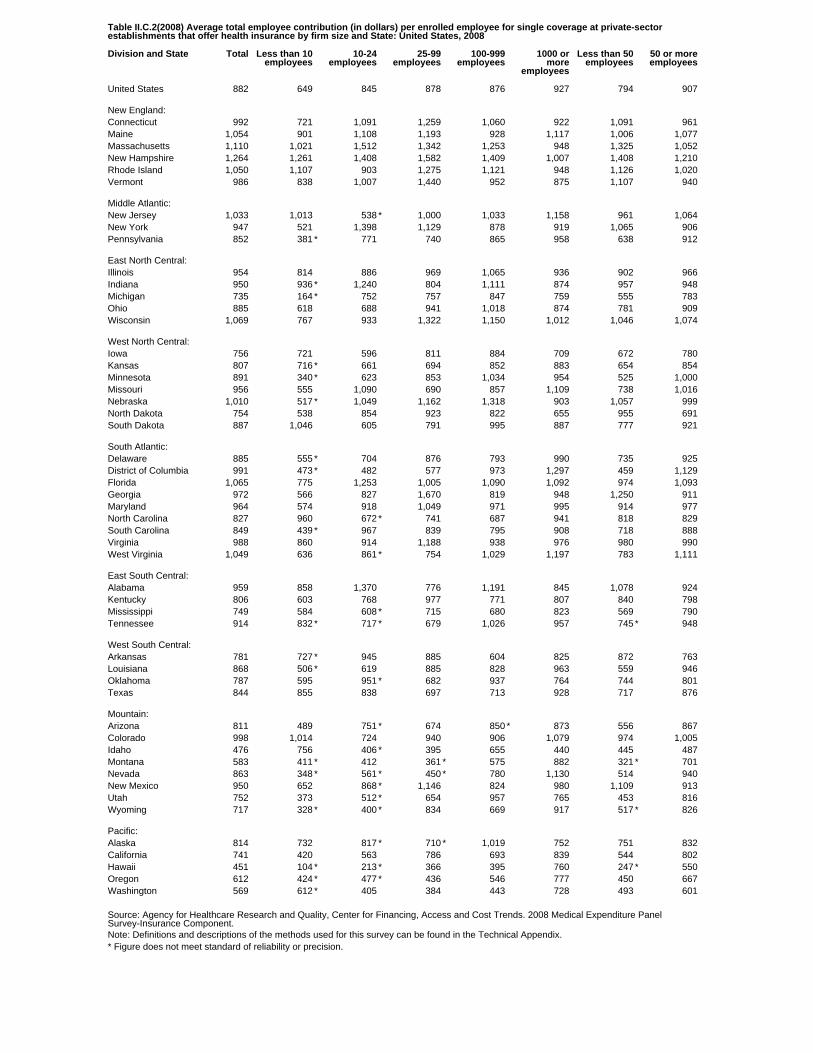
Table II.C.2(2008) Average total employee contribution (in dollars) per enrolled employee for single coverage at private-sectorestablishments that offer health insurance by firm size and State: United States, 2008
Division and State Total Less than 10employees
10-24employees
25-99employees
100-999employees
1000 ormore
employees
Less than 50employees
50 or moreemployees
United States 882 649 845 878 876 927 794 907
New England:Connecticut 992 721 1,091 1,259 1,060 922 1,091 961Maine 1,054 901 1,108 1,193 928 1,117 1,006 1,077Massachusetts 1,110 1,021 1,512 1,342 1,253 948 1,325 1,052New Hampshire 1,264 1,261 1,408 1,582 1,409 1,007 1,408 1,210Rhode Island 1,050 1,107 903 1,275 1,121 948 1,126 1,020Vermont 986 838 1,007 1,440 952 875 1,107 940
Middle Atlantic:New Jersey 1,033 1,013 538 * 1,000 1,033 1,158 961 1,064New York 947 521 1,398 1,129 878 919 1,065 906Pennsylvania 852 381 * 771 740 865 958 638 912
East North Central:Illinois 954 814 886 969 1,065 936 902 966Indiana 950 936 * 1,240 804 1,111 874 957 948Michigan 735 164 * 752 757 847 759 555 783Ohio 885 618 688 941 1,018 874 781 909Wisconsin 1,069 767 933 1,322 1,150 1,012 1,046 1,074
West North Central:Iowa 756 721 596 811 884 709 672 780Kansas 807 716 * 661 694 852 883 654 854Minnesota 891 340 * 623 853 1,034 954 525 1,000Missouri 956 555 1,090 690 857 1,109 738 1,016Nebraska 1,010 517 * 1,049 1,162 1,318 903 1,057 999North Dakota 754 538 854 923 822 655 955 691South Dakota 887 1,046 605 791 995 887 777 921
South Atlantic:Delaware 885 555 * 704 876 793 990 735 925District of Columbia 991 473 * 482 577 973 1,297 459 1,129Florida 1,065 775 1,253 1,005 1,090 1,092 974 1,093Georgia 972 566 827 1,670 819 948 1,250 911Maryland 964 574 918 1,049 971 995 914 977North Carolina 827 960 672 * 741 687 941 818 829South Carolina 849 439 * 967 839 795 908 718 888Virginia 988 860 914 1,188 938 976 980 990West Virginia 1,049 636 861 * 754 1,029 1,197 783 1,111
East South Central:Alabama 959 858 1,370 776 1,191 845 1,078 924Kentucky 806 603 768 977 771 807 840 798Mississippi 749 584 608 * 715 680 823 569 790Tennessee 914 832 * 717 * 679 1,026 957 745 * 948
West South Central:Arkansas 781 727 * 945 885 604 825 872 763Louisiana 868 506 * 619 885 828 963 559 946Oklahoma 787 595 951 * 682 937 764 744 801Texas 844 855 838 697 713 928 717 876
Mountain:Arizona 811 489 751 * 674 850 * 873 556 867Colorado 998 1,014 724 940 906 1,079 974 1,005Idaho 476 756 406 * 395 655 440 445 487Montana 583 411 * 412 361 * 575 882 321 * 701Nevada 863 348 * 561 * 450 * 780 1,130 514 940New Mexico 950 652 868 * 1,146 824 980 1,109 913Utah 752 373 512 * 654 957 765 453 816Wyoming 717 328 * 400 * 834 669 917 517 * 826
Pacific:Alaska 814 732 817 * 710 * 1,019 752 751 832California 741 420 563 786 693 839 544 802Hawaii 451 104 * 213 * 366 395 760 247 * 550Oregon 612 424 * 477 * 436 546 777 450 667Washington 569 612 * 405 384 443 728 493 601
Source: Agency for Healthcare Research and Quality, Center for Financing, Access and Cost Trends. 2008 Medical Expenditure PanelSurvey-Insurance Component.Note: Definitions and descriptions of the methods used for this survey can be found in the Technical Appendix.* Figure does not meet standard of reliability or precision.
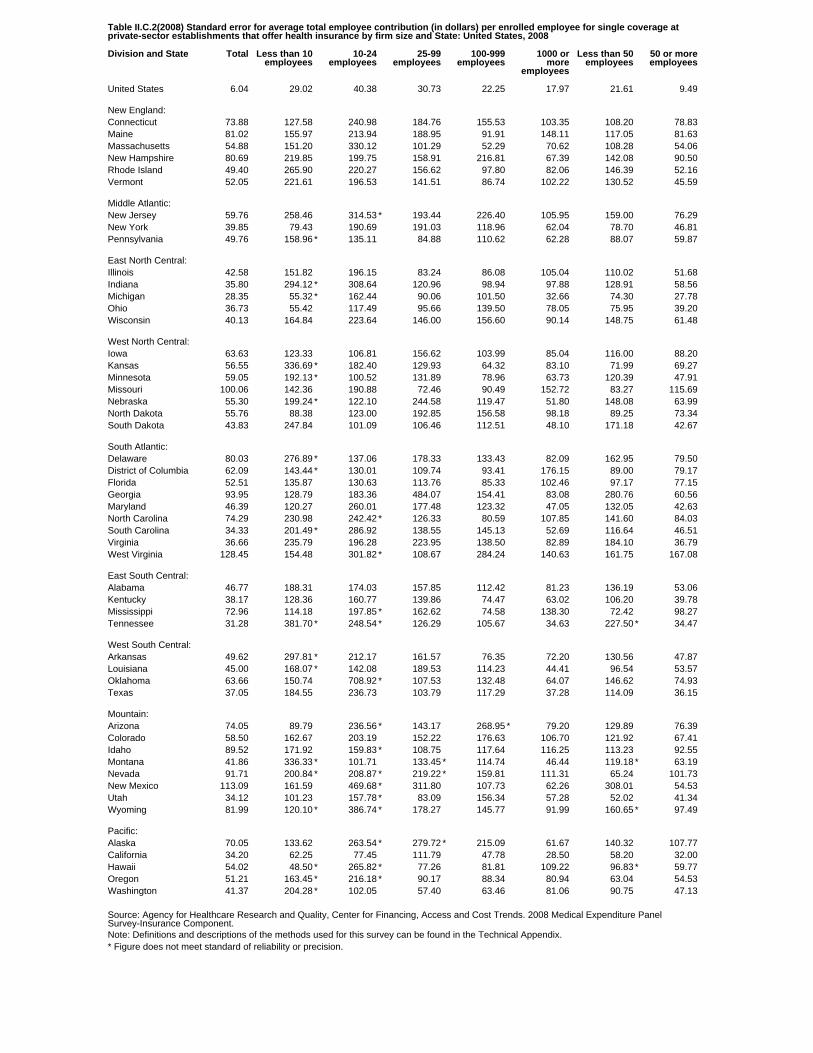
Table II.C.2(2008) Standard error for average total employee contribution (in dollars) per enrolled employee for single coverage atprivate-sector establishments that offer health insurance by firm size and State: United States, 2008
Division and State Total Less than 10employees
10-24employees
25-99employees
100-999employees
1000 ormore
employees
Less than 50employees
50 or moreemployees
United States 6.04 29.02 40.38 30.73 22.25 17.97 21.61 9.49
New England:Connecticut 73.88 127.58 240.98 184.76 155.53 103.35 108.20 78.83Maine 81.02 155.97 213.94 188.95 91.91 148.11 117.05 81.63Massachusetts 54.88 151.20 330.12 101.29 52.29 70.62 108.28 54.06New Hampshire 80.69 219.85 199.75 158.91 216.81 67.39 142.08 90.50Rhode Island 49.40 265.90 220.27 156.62 97.80 82.06 146.39 52.16Vermont 52.05 221.61 196.53 141.51 86.74 102.22 130.52 45.59
Middle Atlantic:New Jersey 59.76 258.46 314.53 * 193.44 226.40 105.95 159.00 76.29New York 39.85 79.43 190.69 191.03 118.96 62.04 78.70 46.81Pennsylvania 49.76 158.96 * 135.11 84.88 110.62 62.28 88.07 59.87
East North Central:Illinois 42.58 151.82 196.15 83.24 86.08 105.04 110.02 51.68Indiana 35.80 294.12 * 308.64 120.96 98.94 97.88 128.91 58.56Michigan 28.35 55.32 * 162.44 90.06 101.50 32.66 74.30 27.78Ohio 36.73 55.42 117.49 95.66 139.50 78.05 75.95 39.20Wisconsin 40.13 164.84 223.64 146.00 156.60 90.14 148.75 61.48
West North Central:Iowa 63.63 123.33 106.81 156.62 103.99 85.04 116.00 88.20Kansas 56.55 336.69 * 182.40 129.93 64.32 83.10 71.99 69.27Minnesota 59.05 192.13 * 100.52 131.89 78.96 63.73 120.39 47.91Missouri 100.06 142.36 190.88 72.46 90.49 152.72 83.27 115.69Nebraska 55.30 199.24 * 122.10 244.58 119.47 51.80 148.08 63.99North Dakota 55.76 88.38 123.00 192.85 156.58 98.18 89.25 73.34South Dakota 43.83 247.84 101.09 106.46 112.51 48.10 171.18 42.67
South Atlantic:Delaware 80.03 276.89 * 137.06 178.33 133.43 82.09 162.95 79.50District of Columbia 62.09 143.44 * 130.01 109.74 93.41 176.15 89.00 79.17Florida 52.51 135.87 130.63 113.76 85.33 102.46 97.17 77.15Georgia 93.95 128.79 183.36 484.07 154.41 83.08 280.76 60.56Maryland 46.39 120.27 260.01 177.48 123.32 47.05 132.05 42.63North Carolina 74.29 230.98 242.42 * 126.33 80.59 107.85 141.60 84.03South Carolina 34.33 201.49 * 286.92 138.55 145.13 52.69 116.64 46.51Virginia 36.66 235.79 196.28 223.95 138.50 82.89 184.10 36.79West Virginia 128.45 154.48 301.82 * 108.67 284.24 140.63 161.75 167.08
East South Central:Alabama 46.77 188.31 174.03 157.85 112.42 81.23 136.19 53.06Kentucky 38.17 128.36 160.77 139.86 74.47 63.02 106.20 39.78Mississippi 72.96 114.18 197.85 * 162.62 74.58 138.30 72.42 98.27Tennessee 31.28 381.70 * 248.54 * 126.29 105.67 34.63 227.50 * 34.47
West South Central:Arkansas 49.62 297.81 * 212.17 161.57 76.35 72.20 130.56 47.87Louisiana 45.00 168.07 * 142.08 189.53 114.23 44.41 96.54 53.57Oklahoma 63.66 150.74 708.92 * 107.53 132.48 64.07 146.62 74.93Texas 37.05 184.55 236.73 103.79 117.29 37.28 114.09 36.15
Mountain:Arizona 74.05 89.79 236.56 * 143.17 268.95 * 79.20 129.89 76.39Colorado 58.50 162.67 203.19 152.22 176.63 106.70 121.92 67.41Idaho 89.52 171.92 159.83 * 108.75 117.64 116.25 113.23 92.55Montana 41.86 336.33 * 101.71 133.45 * 114.74 46.44 119.18 * 63.19Nevada 91.71 200.84 * 208.87 * 219.22 * 159.81 111.31 65.24 101.73New Mexico 113.09 161.59 469.68 * 311.80 107.73 62.26 308.01 54.53Utah 34.12 101.23 157.78 * 83.09 156.34 57.28 52.02 41.34Wyoming 81.99 120.10 * 386.74 * 178.27 145.77 91.99 160.65 * 97.49
Pacific:Alaska 70.05 133.62 263.54 * 279.72 * 215.09 61.67 140.32 107.77California 34.20 62.25 77.45 111.79 47.78 28.50 58.20 32.00Hawaii 54.02 48.50 * 265.82 * 77.26 81.81 109.22 96.83 * 59.77Oregon 51.21 163.45 * 216.18 * 90.17 88.34 80.94 63.04 54.53Washington 41.37 204.28 * 102.05 57.40 63.46 81.06 90.75 47.13
Source: Agency for Healthcare Research and Quality, Center for Financing, Access and Cost Trends. 2008 Medical Expenditure PanelSurvey-Insurance Component.Note: Definitions and descriptions of the methods used for this survey can be found in the Technical Appendix.* Figure does not meet standard of reliability or precision.

Table II.C.2.a(2008) Average total employee contribution (in dollars) for exclusive-provider plans per enrolled employee for singlecoverage at private-sector establishments that offer health insurance by firm size and State: United States, 2008
Division and State Total Less than 10employees
10-24employees
25-99employees
100-999employees
1000 ormore
employees
Less than 50employees
50 or moreemployees
United States 880 542 846 941 888 943 774 924
New England:Connecticut 921 -- -- -- -- -- 1,121 861Maine 1,135 -- -- -- -- -- 962 1,322Massachusetts 1,253 -- -- -- -- -- 1,329 1,217New Hampshire 1,434 -- -- -- -- -- 1,487 1,398Rhode Island 1,148 -- -- -- -- -- 1,351 1,051Vermont 888 -- -- -- -- -- 1,052 811
Middle Atlantic:New Jersey 1,023 -- -- -- -- -- 852 1,167New York 937 -- -- -- -- -- 988 905Pennsylvania 823 -- -- -- -- -- 520 926
East North Central:Illinois 901 -- -- -- -- -- 905 900Indiana 1,401 -- -- -- -- -- 1,069 * 1,501Michigan 794 -- -- -- -- -- 592 * 860Ohio 923 -- -- -- -- -- 742 994Wisconsin 1,307 -- -- -- -- -- 786 1,487
West North Central:Iowa 835 -- -- -- -- -- 714 923Kansas 838 -- -- -- -- -- 719 897Minnesota 732 -- -- -- -- -- 458 * 974Missouri 1,014 -- -- -- -- -- 863 1,091Nebraska 1,086 -- -- -- -- -- 906 * 1,153North Dakota 1,069 * -- -- -- -- -- 1,140 * 974South Dakota 1,072 -- -- -- -- -- 568 * 1,218
South Atlantic:Delaware 772 -- -- -- -- -- 396 986District of Columbia 1,104 -- -- -- -- -- 521 * 1,210Florida 1,008 -- -- -- -- -- 1,133 965Georgia 847 -- -- -- -- -- 375 978Maryland 1,019 -- -- -- -- -- 1,053 1,005North Carolina 925 -- -- -- -- -- 919 927South Carolina 872 -- -- -- -- -- 927 * 839Virginia 1,010 -- -- -- -- -- 758 1,089West Virginia 1,515 * -- -- -- -- -- 652 * 1,835
East South Central:Alabama 736 -- -- -- -- -- 561 * 795Kentucky 903 -- -- -- -- -- 406 * 996Mississippi 921 -- -- -- -- -- 543 * 1,070Tennessee 999 -- -- -- -- -- 738 * 1,060
West South Central:Arkansas 580 -- -- -- -- -- 642 * 565Louisiana 842 -- -- -- -- -- 439 * 1,145Oklahoma 617 -- -- -- -- -- 637 602Texas 880 -- -- -- -- -- 536 * 979
Mountain:Arizona 815 -- -- -- -- -- 645 844Colorado 1,016 -- -- -- -- -- 1,129 948Idaho 482 * -- -- -- -- -- 669 * 436 *Montana 595 * -- -- -- -- -- 387 * 796Nevada 925 * -- -- -- -- -- 401 * 1,005 *New Mexico 1,262 -- -- -- -- -- 1,616 1,072Utah 730 -- -- -- -- -- 422 * 925Wyoming 749 -- -- -- -- -- 137 * 1,126
Pacific:Alaska 1,575 -- -- -- -- -- 1,143 1,665 *California 685 -- -- -- -- -- 560 735Hawaii 336 -- -- -- -- -- 111 446Oregon 601 -- -- -- -- -- 401 717Washington 793 -- -- -- -- -- 404 * 920
Source: Agency for Healthcare Research and Quality, Center for Financing, Access and Cost Trends. 2008 Medical Expenditure PanelSurvey-Insurance Component.Note: Definitions and descriptions of the methods used for this survey can be found in the Technical Appendix.* Figure does not meet standard of reliability or precision.-- Data suppressed due to high standard errors or no reported values in cell.
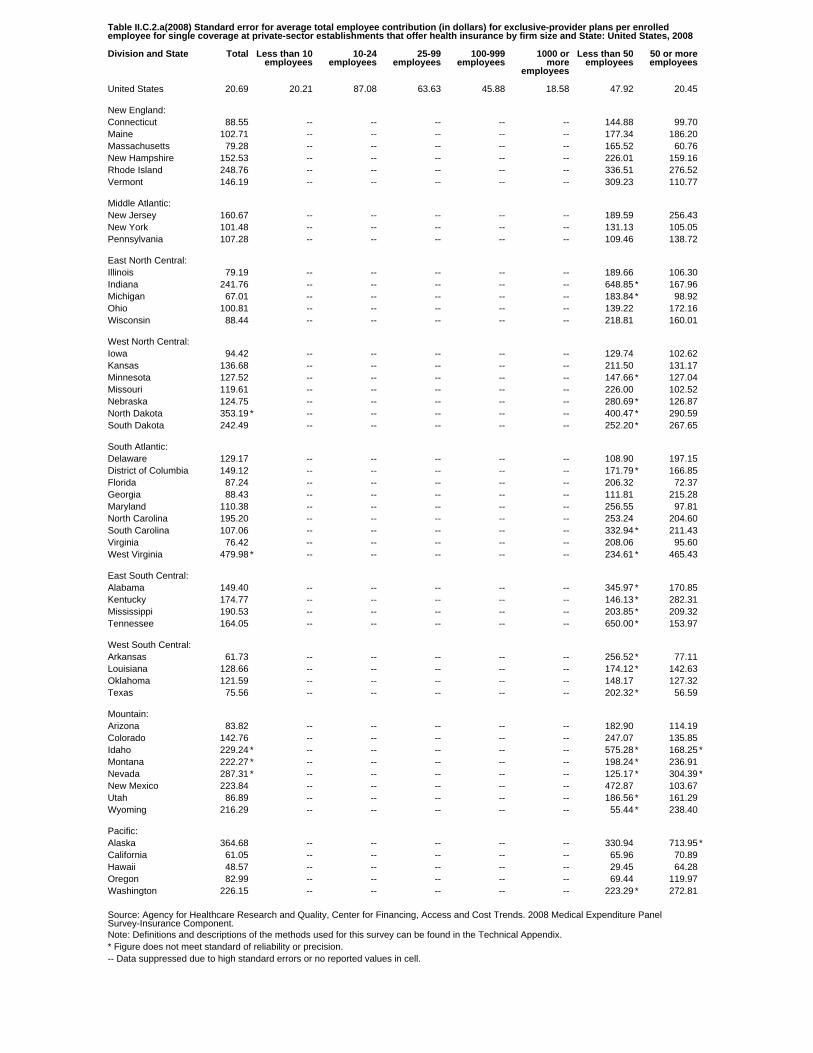
Table II.C.2.a(2008) Standard error for average total employee contribution (in dollars) for exclusive-provider plans per enrolledemployee for single coverage at private-sector establishments that offer health insurance by firm size and State: United States, 2008
Division and State Total Less than 10employees
10-24employees
25-99employees
100-999employees
1000 ormore
employees
Less than 50employees
50 or moreemployees
United States 20.69 20.21 87.08 63.63 45.88 18.58 47.92 20.45
New England:Connecticut 88.55 -- -- -- -- -- 144.88 99.70Maine 102.71 -- -- -- -- -- 177.34 186.20Massachusetts 79.28 -- -- -- -- -- 165.52 60.76New Hampshire 152.53 -- -- -- -- -- 226.01 159.16Rhode Island 248.76 -- -- -- -- -- 336.51 276.52Vermont 146.19 -- -- -- -- -- 309.23 110.77
Middle Atlantic:New Jersey 160.67 -- -- -- -- -- 189.59 256.43New York 101.48 -- -- -- -- -- 131.13 105.05Pennsylvania 107.28 -- -- -- -- -- 109.46 138.72
East North Central:Illinois 79.19 -- -- -- -- -- 189.66 106.30Indiana 241.76 -- -- -- -- -- 648.85 * 167.96Michigan 67.01 -- -- -- -- -- 183.84 * 98.92Ohio 100.81 -- -- -- -- -- 139.22 172.16Wisconsin 88.44 -- -- -- -- -- 218.81 160.01
West North Central:Iowa 94.42 -- -- -- -- -- 129.74 102.62Kansas 136.68 -- -- -- -- -- 211.50 131.17Minnesota 127.52 -- -- -- -- -- 147.66 * 127.04Missouri 119.61 -- -- -- -- -- 226.00 102.52Nebraska 124.75 -- -- -- -- -- 280.69 * 126.87North Dakota 353.19 * -- -- -- -- -- 400.47 * 290.59South Dakota 242.49 -- -- -- -- -- 252.20 * 267.65
South Atlantic:Delaware 129.17 -- -- -- -- -- 108.90 197.15District of Columbia 149.12 -- -- -- -- -- 171.79 * 166.85Florida 87.24 -- -- -- -- -- 206.32 72.37Georgia 88.43 -- -- -- -- -- 111.81 215.28Maryland 110.38 -- -- -- -- -- 256.55 97.81North Carolina 195.20 -- -- -- -- -- 253.24 204.60South Carolina 107.06 -- -- -- -- -- 332.94 * 211.43Virginia 76.42 -- -- -- -- -- 208.06 95.60West Virginia 479.98 * -- -- -- -- -- 234.61 * 465.43
East South Central:Alabama 149.40 -- -- -- -- -- 345.97 * 170.85Kentucky 174.77 -- -- -- -- -- 146.13 * 282.31Mississippi 190.53 -- -- -- -- -- 203.85 * 209.32Tennessee 164.05 -- -- -- -- -- 650.00 * 153.97
West South Central:Arkansas 61.73 -- -- -- -- -- 256.52 * 77.11Louisiana 128.66 -- -- -- -- -- 174.12 * 142.63Oklahoma 121.59 -- -- -- -- -- 148.17 127.32Texas 75.56 -- -- -- -- -- 202.32 * 56.59
Mountain:Arizona 83.82 -- -- -- -- -- 182.90 114.19Colorado 142.76 -- -- -- -- -- 247.07 135.85Idaho 229.24 * -- -- -- -- -- 575.28 * 168.25 *Montana 222.27 * -- -- -- -- -- 198.24 * 236.91Nevada 287.31 * -- -- -- -- -- 125.17 * 304.39 *New Mexico 223.84 -- -- -- -- -- 472.87 103.67Utah 86.89 -- -- -- -- -- 186.56 * 161.29Wyoming 216.29 -- -- -- -- -- 55.44 * 238.40
Pacific:Alaska 364.68 -- -- -- -- -- 330.94 713.95 *California 61.05 -- -- -- -- -- 65.96 70.89Hawaii 48.57 -- -- -- -- -- 29.45 64.28Oregon 82.99 -- -- -- -- -- 69.44 119.97Washington 226.15 -- -- -- -- -- 223.29 * 272.81
Source: Agency for Healthcare Research and Quality, Center for Financing, Access and Cost Trends. 2008 Medical Expenditure PanelSurvey-Insurance Component.Note: Definitions and descriptions of the methods used for this survey can be found in the Technical Appendix.* Figure does not meet standard of reliability or precision.-- Data suppressed due to high standard errors or no reported values in cell.
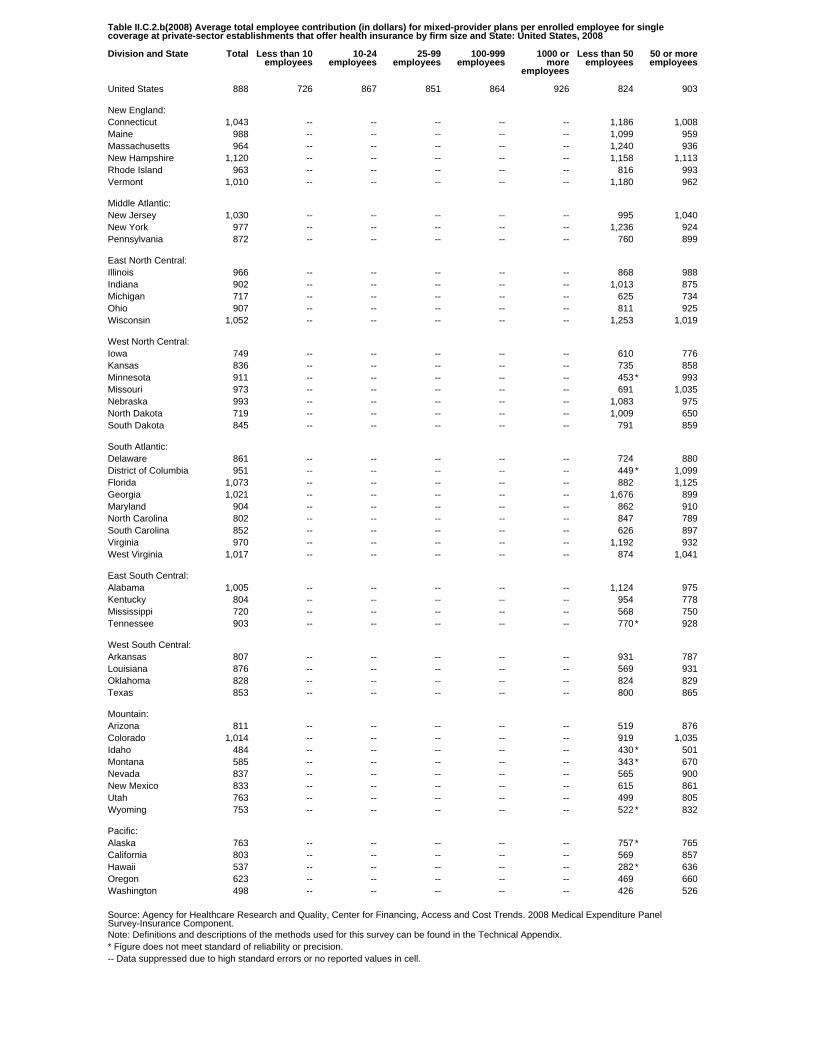
Table II.C.2.b(2008) Average total employee contribution (in dollars) for mixed-provider plans per enrolled employee for singlecoverage at private-sector establishments that offer health insurance by firm size and State: United States, 2008
Division and State Total Less than 10employees
10-24employees
25-99employees
100-999employees
1000 ormore
employees
Less than 50employees
50 or moreemployees
United States 888 726 867 851 864 926 824 903
New England:Connecticut 1,043 -- -- -- -- -- 1,186 1,008Maine 988 -- -- -- -- -- 1,099 959Massachusetts 964 -- -- -- -- -- 1,240 936New Hampshire 1,120 -- -- -- -- -- 1,158 1,113Rhode Island 963 -- -- -- -- -- 816 993Vermont 1,010 -- -- -- -- -- 1,180 962
Middle Atlantic:New Jersey 1,030 -- -- -- -- -- 995 1,040New York 977 -- -- -- -- -- 1,236 924Pennsylvania 872 -- -- -- -- -- 760 899
East North Central:Illinois 966 -- -- -- -- -- 868 988Indiana 902 -- -- -- -- -- 1,013 875Michigan 717 -- -- -- -- -- 625 734Ohio 907 -- -- -- -- -- 811 925Wisconsin 1,052 -- -- -- -- -- 1,253 1,019
West North Central:Iowa 749 -- -- -- -- -- 610 776Kansas 836 -- -- -- -- -- 735 858Minnesota 911 -- -- -- -- -- 453 * 993Missouri 973 -- -- -- -- -- 691 1,035Nebraska 993 -- -- -- -- -- 1,083 975North Dakota 719 -- -- -- -- -- 1,009 650South Dakota 845 -- -- -- -- -- 791 859
South Atlantic:Delaware 861 -- -- -- -- -- 724 880District of Columbia 951 -- -- -- -- -- 449 * 1,099Florida 1,073 -- -- -- -- -- 882 1,125Georgia 1,021 -- -- -- -- -- 1,676 899Maryland 904 -- -- -- -- -- 862 910North Carolina 802 -- -- -- -- -- 847 789South Carolina 852 -- -- -- -- -- 626 897Virginia 970 -- -- -- -- -- 1,192 932West Virginia 1,017 -- -- -- -- -- 874 1,041
East South Central:Alabama 1,005 -- -- -- -- -- 1,124 975Kentucky 804 -- -- -- -- -- 954 778Mississippi 720 -- -- -- -- -- 568 750Tennessee 903 -- -- -- -- -- 770 * 928
West South Central:Arkansas 807 -- -- -- -- -- 931 787Louisiana 876 -- -- -- -- -- 569 931Oklahoma 828 -- -- -- -- -- 824 829Texas 853 -- -- -- -- -- 800 865
Mountain:Arizona 811 -- -- -- -- -- 519 876Colorado 1,014 -- -- -- -- -- 919 1,035Idaho 484 -- -- -- -- -- 430 * 501Montana 585 -- -- -- -- -- 343 * 670Nevada 837 -- -- -- -- -- 565 900New Mexico 833 -- -- -- -- -- 615 861Utah 763 -- -- -- -- -- 499 805Wyoming 753 -- -- -- -- -- 522 * 832
Pacific:Alaska 763 -- -- -- -- -- 757 * 765California 803 -- -- -- -- -- 569 857Hawaii 537 -- -- -- -- -- 282 * 636Oregon 623 -- -- -- -- -- 469 660Washington 498 -- -- -- -- -- 426 526
Source: Agency for Healthcare Research and Quality, Center for Financing, Access and Cost Trends. 2008 Medical Expenditure PanelSurvey-Insurance Component.Note: Definitions and descriptions of the methods used for this survey can be found in the Technical Appendix.* Figure does not meet standard of reliability or precision.-- Data suppressed due to high standard errors or no reported values in cell.
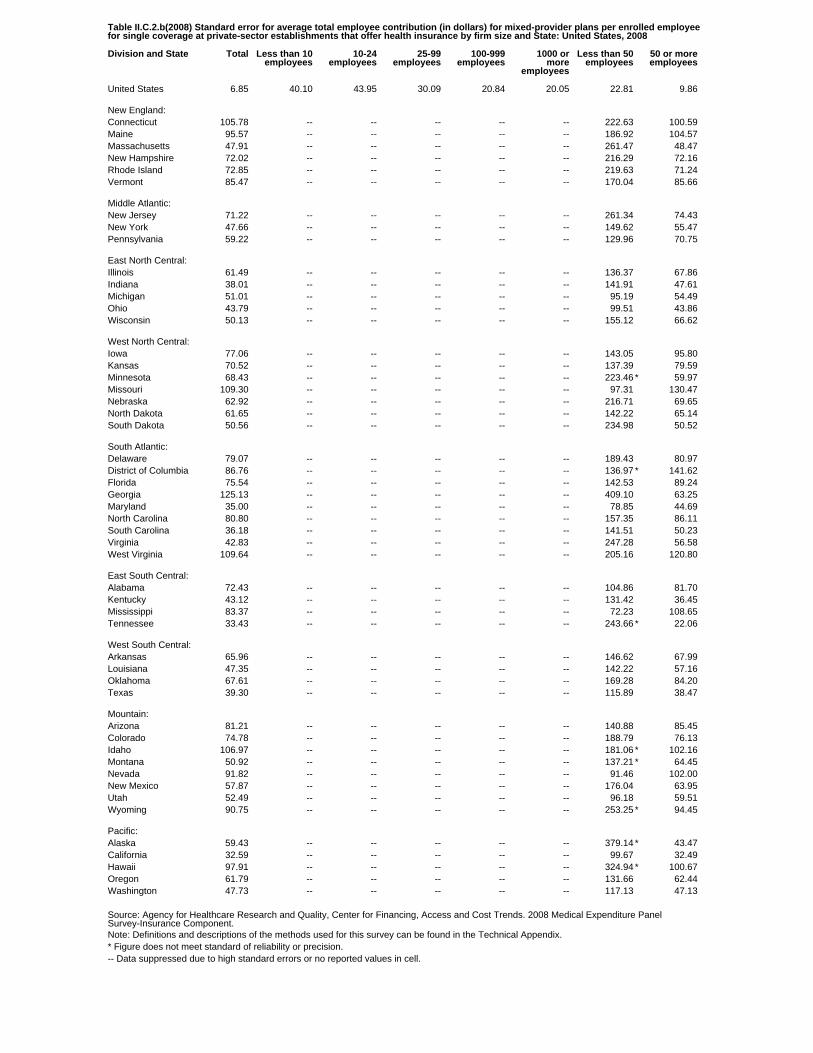
Table II.C.2.b(2008) Standard error for average total employee contribution (in dollars) for mixed-provider plans per enrolled employeefor single coverage at private-sector establishments that offer health insurance by firm size and State: United States, 2008
Division and State Total Less than 10employees
10-24employees
25-99employees
100-999employees
1000 ormore
employees
Less than 50employees
50 or moreemployees
United States 6.85 40.10 43.95 30.09 20.84 20.05 22.81 9.86
New England:Connecticut 105.78 -- -- -- -- -- 222.63 100.59Maine 95.57 -- -- -- -- -- 186.92 104.57Massachusetts 47.91 -- -- -- -- -- 261.47 48.47New Hampshire 72.02 -- -- -- -- -- 216.29 72.16Rhode Island 72.85 -- -- -- -- -- 219.63 71.24Vermont 85.47 -- -- -- -- -- 170.04 85.66
Middle Atlantic:New Jersey 71.22 -- -- -- -- -- 261.34 74.43New York 47.66 -- -- -- -- -- 149.62 55.47Pennsylvania 59.22 -- -- -- -- -- 129.96 70.75
East North Central:Illinois 61.49 -- -- -- -- -- 136.37 67.86Indiana 38.01 -- -- -- -- -- 141.91 47.61Michigan 51.01 -- -- -- -- -- 95.19 54.49Ohio 43.79 -- -- -- -- -- 99.51 43.86Wisconsin 50.13 -- -- -- -- -- 155.12 66.62
West North Central:Iowa 77.06 -- -- -- -- -- 143.05 95.80Kansas 70.52 -- -- -- -- -- 137.39 79.59Minnesota 68.43 -- -- -- -- -- 223.46 * 59.97Missouri 109.30 -- -- -- -- -- 97.31 130.47Nebraska 62.92 -- -- -- -- -- 216.71 69.65North Dakota 61.65 -- -- -- -- -- 142.22 65.14South Dakota 50.56 -- -- -- -- -- 234.98 50.52
South Atlantic:Delaware 79.07 -- -- -- -- -- 189.43 80.97District of Columbia 86.76 -- -- -- -- -- 136.97 * 141.62Florida 75.54 -- -- -- -- -- 142.53 89.24Georgia 125.13 -- -- -- -- -- 409.10 63.25Maryland 35.00 -- -- -- -- -- 78.85 44.69North Carolina 80.80 -- -- -- -- -- 157.35 86.11South Carolina 36.18 -- -- -- -- -- 141.51 50.23Virginia 42.83 -- -- -- -- -- 247.28 56.58West Virginia 109.64 -- -- -- -- -- 205.16 120.80
East South Central:Alabama 72.43 -- -- -- -- -- 104.86 81.70Kentucky 43.12 -- -- -- -- -- 131.42 36.45Mississippi 83.37 -- -- -- -- -- 72.23 108.65Tennessee 33.43 -- -- -- -- -- 243.66 * 22.06
West South Central:Arkansas 65.96 -- -- -- -- -- 146.62 67.99Louisiana 47.35 -- -- -- -- -- 142.22 57.16Oklahoma 67.61 -- -- -- -- -- 169.28 84.20Texas 39.30 -- -- -- -- -- 115.89 38.47
Mountain:Arizona 81.21 -- -- -- -- -- 140.88 85.45Colorado 74.78 -- -- -- -- -- 188.79 76.13Idaho 106.97 -- -- -- -- -- 181.06 * 102.16Montana 50.92 -- -- -- -- -- 137.21 * 64.45Nevada 91.82 -- -- -- -- -- 91.46 102.00New Mexico 57.87 -- -- -- -- -- 176.04 63.95Utah 52.49 -- -- -- -- -- 96.18 59.51Wyoming 90.75 -- -- -- -- -- 253.25 * 94.45
Pacific:Alaska 59.43 -- -- -- -- -- 379.14 * 43.47California 32.59 -- -- -- -- -- 99.67 32.49Hawaii 97.91 -- -- -- -- -- 324.94 * 100.67Oregon 61.79 -- -- -- -- -- 131.66 62.44Washington 47.73 -- -- -- -- -- 117.13 47.13
Source: Agency for Healthcare Research and Quality, Center for Financing, Access and Cost Trends. 2008 Medical Expenditure PanelSurvey-Insurance Component.Note: Definitions and descriptions of the methods used for this survey can be found in the Technical Appendix.* Figure does not meet standard of reliability or precision.-- Data suppressed due to high standard errors or no reported values in cell.
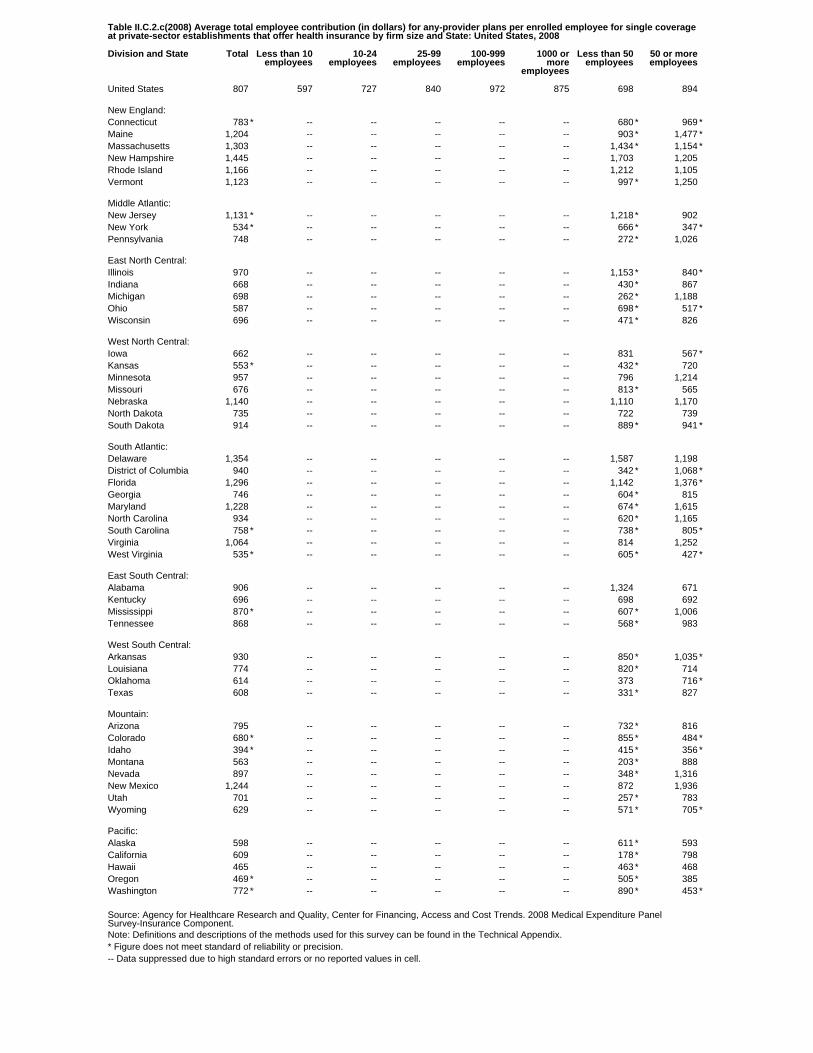
Table II.C.2.c(2008) Average total employee contribution (in dollars) for any-provider plans per enrolled employee for single coverageat private-sector establishments that offer health insurance by firm size and State: United States, 2008
Division and State Total Less than 10employees
10-24employees
25-99employees
100-999employees
1000 ormore
employees
Less than 50employees
50 or moreemployees
United States 807 597 727 840 972 875 698 894
New England:Connecticut 783 * -- -- -- -- -- 680 * 969 *Maine 1,204 -- -- -- -- -- 903 * 1,477 *Massachusetts 1,303 -- -- -- -- -- 1,434 * 1,154 *New Hampshire 1,445 -- -- -- -- -- 1,703 1,205Rhode Island 1,166 -- -- -- -- -- 1,212 1,105Vermont 1,123 -- -- -- -- -- 997 * 1,250
Middle Atlantic:New Jersey 1,131 * -- -- -- -- -- 1,218 * 902New York 534 * -- -- -- -- -- 666 * 347 *Pennsylvania 748 -- -- -- -- -- 272 * 1,026
East North Central:Illinois 970 -- -- -- -- -- 1,153 * 840 *Indiana 668 -- -- -- -- -- 430 * 867Michigan 698 -- -- -- -- -- 262 * 1,188Ohio 587 -- -- -- -- -- 698 * 517 *Wisconsin 696 -- -- -- -- -- 471 * 826
West North Central:Iowa 662 -- -- -- -- -- 831 567 *Kansas 553 * -- -- -- -- -- 432 * 720Minnesota 957 -- -- -- -- -- 796 1,214Missouri 676 -- -- -- -- -- 813 * 565Nebraska 1,140 -- -- -- -- -- 1,110 1,170North Dakota 735 -- -- -- -- -- 722 739South Dakota 914 -- -- -- -- -- 889 * 941 *
South Atlantic:Delaware 1,354 -- -- -- -- -- 1,587 1,198District of Columbia 940 -- -- -- -- -- 342 * 1,068 *Florida 1,296 -- -- -- -- -- 1,142 1,376 *Georgia 746 -- -- -- -- -- 604 * 815Maryland 1,228 -- -- -- -- -- 674 * 1,615North Carolina 934 -- -- -- -- -- 620 * 1,165South Carolina 758 * -- -- -- -- -- 738 * 805 *Virginia 1,064 -- -- -- -- -- 814 1,252West Virginia 535 * -- -- -- -- -- 605 * 427 *
East South Central:Alabama 906 -- -- -- -- -- 1,324 671Kentucky 696 -- -- -- -- -- 698 692Mississippi 870 * -- -- -- -- -- 607 * 1,006Tennessee 868 -- -- -- -- -- 568 * 983
West South Central:Arkansas 930 -- -- -- -- -- 850 * 1,035 *Louisiana 774 -- -- -- -- -- 820 * 714Oklahoma 614 -- -- -- -- -- 373 716 *Texas 608 -- -- -- -- -- 331 * 827
Mountain:Arizona 795 -- -- -- -- -- 732 * 816Colorado 680 * -- -- -- -- -- 855 * 484 *Idaho 394 * -- -- -- -- -- 415 * 356 *Montana 563 -- -- -- -- -- 203 * 888Nevada 897 -- -- -- -- -- 348 * 1,316New Mexico 1,244 -- -- -- -- -- 872 1,936Utah 701 -- -- -- -- -- 257 * 783Wyoming 629 -- -- -- -- -- 571 * 705 *
Pacific:Alaska 598 -- -- -- -- -- 611 * 593California 609 -- -- -- -- -- 178 * 798Hawaii 465 -- -- -- -- -- 463 * 468Oregon 469 * -- -- -- -- -- 505 * 385Washington 772 * -- -- -- -- -- 890 * 453 *
Source: Agency for Healthcare Research and Quality, Center for Financing, Access and Cost Trends. 2008 Medical Expenditure PanelSurvey-Insurance Component.Note: Definitions and descriptions of the methods used for this survey can be found in the Technical Appendix.* Figure does not meet standard of reliability or precision.-- Data suppressed due to high standard errors or no reported values in cell.
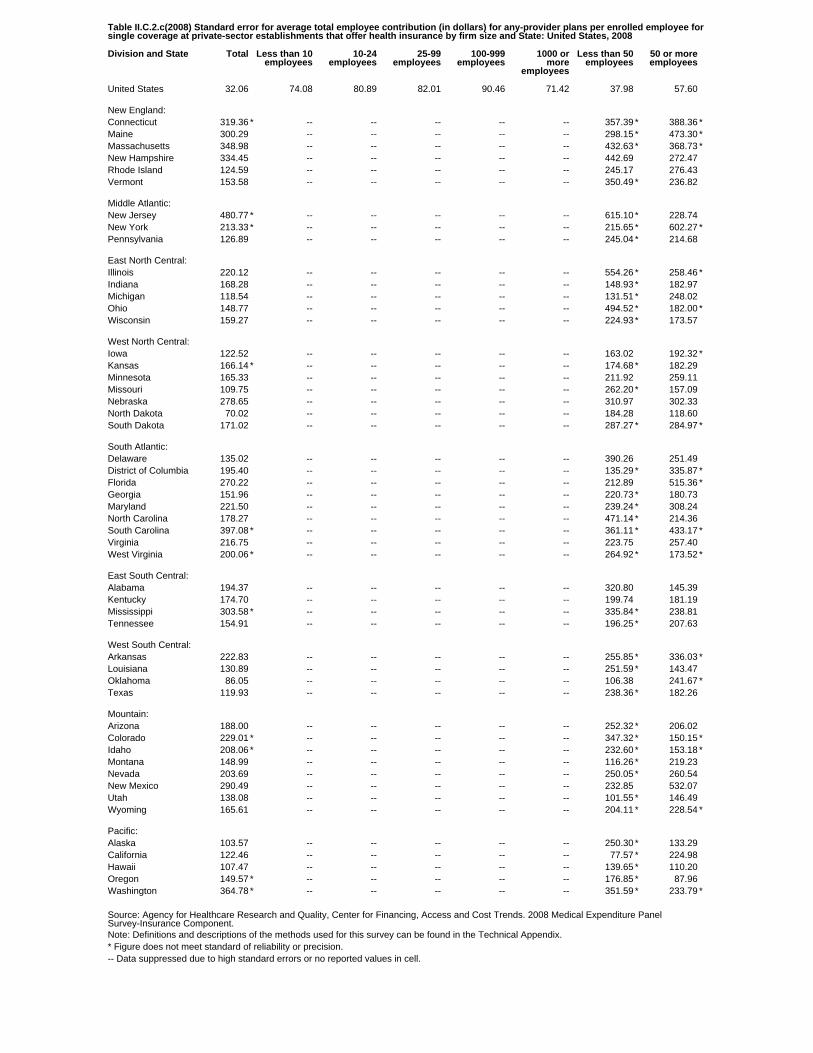
Table II.C.2.c(2008) Standard error for average total employee contribution (in dollars) for any-provider plans per enrolled employee forsingle coverage at private-sector establishments that offer health insurance by firm size and State: United States, 2008
Division and State Total Less than 10employees
10-24employees
25-99employees
100-999employees
1000 ormore
employees
Less than 50employees
50 or moreemployees
United States 32.06 74.08 80.89 82.01 90.46 71.42 37.98 57.60
New England:Connecticut 319.36 * -- -- -- -- -- 357.39 * 388.36 *Maine 300.29 -- -- -- -- -- 298.15 * 473.30 *Massachusetts 348.98 -- -- -- -- -- 432.63 * 368.73 *New Hampshire 334.45 -- -- -- -- -- 442.69 272.47Rhode Island 124.59 -- -- -- -- -- 245.17 276.43Vermont 153.58 -- -- -- -- -- 350.49 * 236.82
Middle Atlantic:New Jersey 480.77 * -- -- -- -- -- 615.10 * 228.74New York 213.33 * -- -- -- -- -- 215.65 * 602.27 *Pennsylvania 126.89 -- -- -- -- -- 245.04 * 214.68
East North Central:Illinois 220.12 -- -- -- -- -- 554.26 * 258.46 *Indiana 168.28 -- -- -- -- -- 148.93 * 182.97Michigan 118.54 -- -- -- -- -- 131.51 * 248.02Ohio 148.77 -- -- -- -- -- 494.52 * 182.00 *Wisconsin 159.27 -- -- -- -- -- 224.93 * 173.57
West North Central:Iowa 122.52 -- -- -- -- -- 163.02 192.32 *Kansas 166.14 * -- -- -- -- -- 174.68 * 182.29Minnesota 165.33 -- -- -- -- -- 211.92 259.11Missouri 109.75 -- -- -- -- -- 262.20 * 157.09Nebraska 278.65 -- -- -- -- -- 310.97 302.33North Dakota 70.02 -- -- -- -- -- 184.28 118.60South Dakota 171.02 -- -- -- -- -- 287.27 * 284.97 *
South Atlantic:Delaware 135.02 -- -- -- -- -- 390.26 251.49District of Columbia 195.40 -- -- -- -- -- 135.29 * 335.87 *Florida 270.22 -- -- -- -- -- 212.89 515.36 *Georgia 151.96 -- -- -- -- -- 220.73 * 180.73Maryland 221.50 -- -- -- -- -- 239.24 * 308.24North Carolina 178.27 -- -- -- -- -- 471.14 * 214.36South Carolina 397.08 * -- -- -- -- -- 361.11 * 433.17 *Virginia 216.75 -- -- -- -- -- 223.75 257.40West Virginia 200.06 * -- -- -- -- -- 264.92 * 173.52 *
East South Central:Alabama 194.37 -- -- -- -- -- 320.80 145.39Kentucky 174.70 -- -- -- -- -- 199.74 181.19Mississippi 303.58 * -- -- -- -- -- 335.84 * 238.81Tennessee 154.91 -- -- -- -- -- 196.25 * 207.63
West South Central:Arkansas 222.83 -- -- -- -- -- 255.85 * 336.03 *Louisiana 130.89 -- -- -- -- -- 251.59 * 143.47Oklahoma 86.05 -- -- -- -- -- 106.38 241.67 *Texas 119.93 -- -- -- -- -- 238.36 * 182.26
Mountain:Arizona 188.00 -- -- -- -- -- 252.32 * 206.02Colorado 229.01 * -- -- -- -- -- 347.32 * 150.15 *Idaho 208.06 * -- -- -- -- -- 232.60 * 153.18 *Montana 148.99 -- -- -- -- -- 116.26 * 219.23Nevada 203.69 -- -- -- -- -- 250.05 * 260.54New Mexico 290.49 -- -- -- -- -- 232.85 532.07Utah 138.08 -- -- -- -- -- 101.55 * 146.49Wyoming 165.61 -- -- -- -- -- 204.11 * 228.54 *
Pacific:Alaska 103.57 -- -- -- -- -- 250.30 * 133.29California 122.46 -- -- -- -- -- 77.57 * 224.98Hawaii 107.47 -- -- -- -- -- 139.65 * 110.20Oregon 149.57 * -- -- -- -- -- 176.85 * 87.96Washington 364.78 * -- -- -- -- -- 351.59 * 233.79 *
Source: Agency for Healthcare Research and Quality, Center for Financing, Access and Cost Trends. 2008 Medical Expenditure PanelSurvey-Insurance Component.Note: Definitions and descriptions of the methods used for this survey can be found in the Technical Appendix.* Figure does not meet standard of reliability or precision.-- Data suppressed due to high standard errors or no reported values in cell.
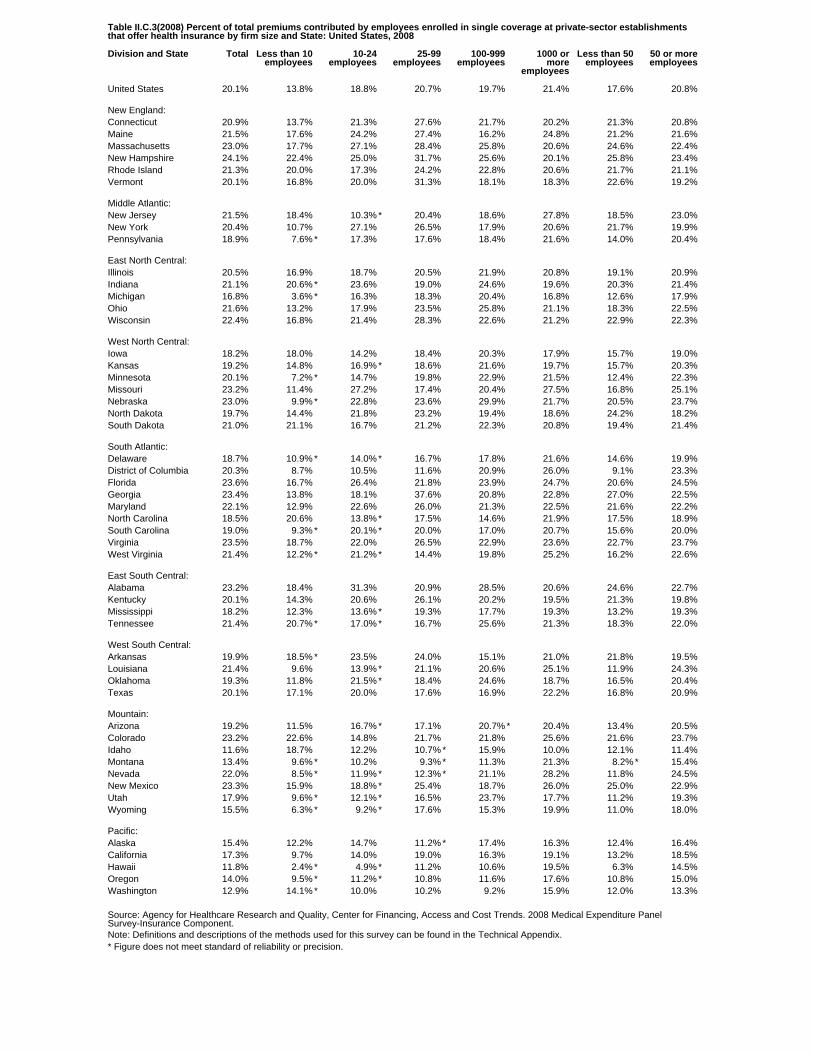
Table II.C.3(2008) Percent of total premiums contributed by employees enrolled in single coverage at private-sector establishmentsthat offer health insurance by firm size and State: United States, 2008
Division and State Total Less than 10employees
10-24employees
25-99employees
100-999employees
1000 ormore
employees
Less than 50employees
50 or moreemployees
United States 20.1% 13.8% 18.8% 20.7% 19.7% 21.4% 17.6% 20.8%
New England:Connecticut 20.9% 13.7% 21.3% 27.6% 21.7% 20.2% 21.3% 20.8%Maine 21.5% 17.6% 24.2% 27.4% 16.2% 24.8% 21.2% 21.6%Massachusetts 23.0% 17.7% 27.1% 28.4% 25.8% 20.6% 24.6% 22.4%New Hampshire 24.1% 22.4% 25.0% 31.7% 25.6% 20.1% 25.8% 23.4%Rhode Island 21.3% 20.0% 17.3% 24.2% 22.8% 20.6% 21.7% 21.1%Vermont 20.1% 16.8% 20.0% 31.3% 18.1% 18.3% 22.6% 19.2%
Middle Atlantic:New Jersey 21.5% 18.4% 10.3% * 20.4% 18.6% 27.8% 18.5% 23.0%New York 20.4% 10.7% 27.1% 26.5% 17.9% 20.6% 21.7% 19.9%Pennsylvania 18.9% 7.6% * 17.3% 17.6% 18.4% 21.6% 14.0% 20.4%
East North Central:Illinois 20.5% 16.9% 18.7% 20.5% 21.9% 20.8% 19.1% 20.9%Indiana 21.1% 20.6% * 23.6% 19.0% 24.6% 19.6% 20.3% 21.4%Michigan 16.8% 3.6% * 16.3% 18.3% 20.4% 16.8% 12.6% 17.9%Ohio 21.6% 13.2% 17.9% 23.5% 25.8% 21.1% 18.3% 22.5%Wisconsin 22.4% 16.8% 21.4% 28.3% 22.6% 21.2% 22.9% 22.3%
West North Central:Iowa 18.2% 18.0% 14.2% 18.4% 20.3% 17.9% 15.7% 19.0%Kansas 19.2% 14.8% 16.9% * 18.6% 21.6% 19.7% 15.7% 20.3%Minnesota 20.1% 7.2% * 14.7% 19.8% 22.9% 21.5% 12.4% 22.3%Missouri 23.2% 11.4% 27.2% 17.4% 20.4% 27.5% 16.8% 25.1%Nebraska 23.0% 9.9% * 22.8% 23.6% 29.9% 21.7% 20.5% 23.7%North Dakota 19.7% 14.4% 21.8% 23.2% 19.4% 18.6% 24.2% 18.2%South Dakota 21.0% 21.1% 16.7% 21.2% 22.3% 20.8% 19.4% 21.4%
South Atlantic:Delaware 18.7% 10.9% * 14.0% * 16.7% 17.8% 21.6% 14.6% 19.9%District of Columbia 20.3% 8.7% 10.5% 11.6% 20.9% 26.0% 9.1% 23.3%Florida 23.6% 16.7% 26.4% 21.8% 23.9% 24.7% 20.6% 24.5%Georgia 23.4% 13.8% 18.1% 37.6% 20.8% 22.8% 27.0% 22.5%Maryland 22.1% 12.9% 22.6% 26.0% 21.3% 22.5% 21.6% 22.2%North Carolina 18.5% 20.6% 13.8% * 17.5% 14.6% 21.9% 17.5% 18.9%South Carolina 19.0% 9.3% * 20.1% * 20.0% 17.0% 20.7% 15.6% 20.0%Virginia 23.5% 18.7% 22.0% 26.5% 22.9% 23.6% 22.7% 23.7%West Virginia 21.4% 12.2% * 21.2% * 14.4% 19.8% 25.2% 16.2% 22.6%
East South Central:Alabama 23.2% 18.4% 31.3% 20.9% 28.5% 20.6% 24.6% 22.7%Kentucky 20.1% 14.3% 20.6% 26.1% 20.2% 19.5% 21.3% 19.8%Mississippi 18.2% 12.3% 13.6% * 19.3% 17.7% 19.3% 13.2% 19.3%Tennessee 21.4% 20.7% * 17.0% * 16.7% 25.6% 21.3% 18.3% 22.0%
West South Central:Arkansas 19.9% 18.5% * 23.5% 24.0% 15.1% 21.0% 21.8% 19.5%Louisiana 21.4% 9.6% 13.9% * 21.1% 20.6% 25.1% 11.9% 24.3%Oklahoma 19.3% 11.8% 21.5% * 18.4% 24.6% 18.7% 16.5% 20.4%Texas 20.1% 17.1% 20.0% 17.6% 16.9% 22.2% 16.8% 20.9%
Mountain:Arizona 19.2% 11.5% 16.7% * 17.1% 20.7% * 20.4% 13.4% 20.5%Colorado 23.2% 22.6% 14.8% 21.7% 21.8% 25.6% 21.6% 23.7%Idaho 11.6% 18.7% 12.2% 10.7% * 15.9% 10.0% 12.1% 11.4%Montana 13.4% 9.6% * 10.2% 9.3% * 11.3% 21.3% 8.2% * 15.4%Nevada 22.0% 8.5% * 11.9% * 12.3% * 21.1% 28.2% 11.8% 24.5%New Mexico 23.3% 15.9% 18.8% * 25.4% 18.7% 26.0% 25.0% 22.9%Utah 17.9% 9.6% * 12.1% * 16.5% 23.7% 17.7% 11.2% 19.3%Wyoming 15.5% 6.3% * 9.2% * 17.6% 15.3% 19.9% 11.0% 18.0%
Pacific:Alaska 15.4% 12.2% 14.7% 11.2% * 17.4% 16.3% 12.4% 16.4%California 17.3% 9.7% 14.0% 19.0% 16.3% 19.1% 13.2% 18.5%Hawaii 11.8% 2.4% * 4.9% * 11.2% 10.6% 19.5% 6.3% 14.5%Oregon 14.0% 9.5% * 11.2% * 10.8% 11.6% 17.6% 10.8% 15.0%Washington 12.9% 14.1% * 10.0% 10.2% 9.2% 15.9% 12.0% 13.3%
Source: Agency for Healthcare Research and Quality, Center for Financing, Access and Cost Trends. 2008 Medical Expenditure PanelSurvey-Insurance Component.Note: Definitions and descriptions of the methods used for this survey can be found in the Technical Appendix.* Figure does not meet standard of reliability or precision.
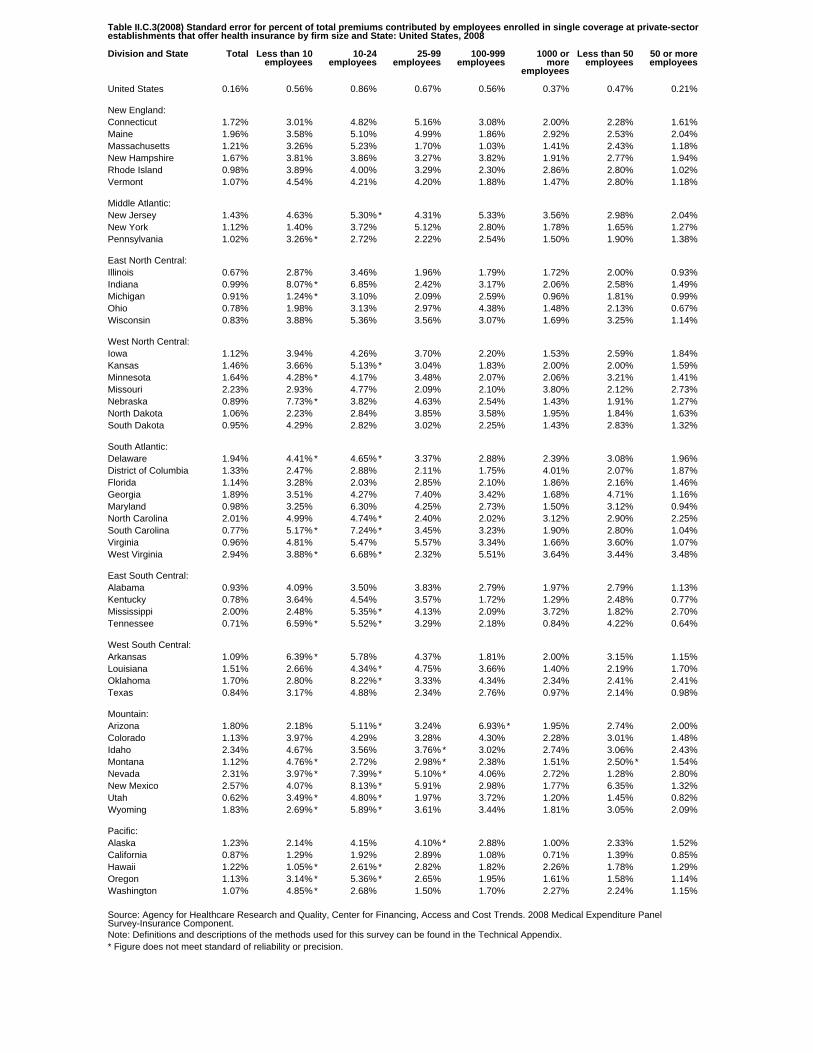
Table II.C.3(2008) Standard error for percent of total premiums contributed by employees enrolled in single coverage at private-sectorestablishments that offer health insurance by firm size and State: United States, 2008
Division and State Total Less than 10employees
10-24employees
25-99employees
100-999employees
1000 ormore
employees
Less than 50employees
50 or moreemployees
United States 0.16% 0.56% 0.86% 0.67% 0.56% 0.37% 0.47% 0.21%
New England:Connecticut 1.72% 3.01% 4.82% 5.16% 3.08% 2.00% 2.28% 1.61%Maine 1.96% 3.58% 5.10% 4.99% 1.86% 2.92% 2.53% 2.04%Massachusetts 1.21% 3.26% 5.23% 1.70% 1.03% 1.41% 2.43% 1.18%New Hampshire 1.67% 3.81% 3.86% 3.27% 3.82% 1.91% 2.77% 1.94%Rhode Island 0.98% 3.89% 4.00% 3.29% 2.30% 2.86% 2.80% 1.02%Vermont 1.07% 4.54% 4.21% 4.20% 1.88% 1.47% 2.80% 1.18%
Middle Atlantic:New Jersey 1.43% 4.63% 5.30% * 4.31% 5.33% 3.56% 2.98% 2.04%New York 1.12% 1.40% 3.72% 5.12% 2.80% 1.78% 1.65% 1.27%Pennsylvania 1.02% 3.26% * 2.72% 2.22% 2.54% 1.50% 1.90% 1.38%
East North Central:Illinois 0.67% 2.87% 3.46% 1.96% 1.79% 1.72% 2.00% 0.93%Indiana 0.99% 8.07% * 6.85% 2.42% 3.17% 2.06% 2.58% 1.49%Michigan 0.91% 1.24% * 3.10% 2.09% 2.59% 0.96% 1.81% 0.99%Ohio 0.78% 1.98% 3.13% 2.97% 4.38% 1.48% 2.13% 0.67%Wisconsin 0.83% 3.88% 5.36% 3.56% 3.07% 1.69% 3.25% 1.14%
West North Central:Iowa 1.12% 3.94% 4.26% 3.70% 2.20% 1.53% 2.59% 1.84%Kansas 1.46% 3.66% 5.13% * 3.04% 1.83% 2.00% 2.00% 1.59%Minnesota 1.64% 4.28% * 4.17% 3.48% 2.07% 2.06% 3.21% 1.41%Missouri 2.23% 2.93% 4.77% 2.09% 2.10% 3.80% 2.12% 2.73%Nebraska 0.89% 7.73% * 3.82% 4.63% 2.54% 1.43% 1.91% 1.27%North Dakota 1.06% 2.23% 2.84% 3.85% 3.58% 1.95% 1.84% 1.63%South Dakota 0.95% 4.29% 2.82% 3.02% 2.25% 1.43% 2.83% 1.32%
South Atlantic:Delaware 1.94% 4.41% * 4.65% * 3.37% 2.88% 2.39% 3.08% 1.96%District of Columbia 1.33% 2.47% 2.88% 2.11% 1.75% 4.01% 2.07% 1.87%Florida 1.14% 3.28% 2.03% 2.85% 2.10% 1.86% 2.16% 1.46%Georgia 1.89% 3.51% 4.27% 7.40% 3.42% 1.68% 4.71% 1.16%Maryland 0.98% 3.25% 6.30% 4.25% 2.73% 1.50% 3.12% 0.94%North Carolina 2.01% 4.99% 4.74% * 2.40% 2.02% 3.12% 2.90% 2.25%South Carolina 0.77% 5.17% * 7.24% * 3.45% 3.23% 1.90% 2.80% 1.04%Virginia 0.96% 4.81% 5.47% 5.57% 3.34% 1.66% 3.60% 1.07%West Virginia 2.94% 3.88% * 6.68% * 2.32% 5.51% 3.64% 3.44% 3.48%
East South Central:Alabama 0.93% 4.09% 3.50% 3.83% 2.79% 1.97% 2.79% 1.13%Kentucky 0.78% 3.64% 4.54% 3.57% 1.72% 1.29% 2.48% 0.77%Mississippi 2.00% 2.48% 5.35% * 4.13% 2.09% 3.72% 1.82% 2.70%Tennessee 0.71% 6.59% * 5.52% * 3.29% 2.18% 0.84% 4.22% 0.64%
West South Central:Arkansas 1.09% 6.39% * 5.78% 4.37% 1.81% 2.00% 3.15% 1.15%Louisiana 1.51% 2.66% 4.34% * 4.75% 3.66% 1.40% 2.19% 1.70%Oklahoma 1.70% 2.80% 8.22% * 3.33% 4.34% 2.34% 2.41% 2.41%Texas 0.84% 3.17% 4.88% 2.34% 2.76% 0.97% 2.14% 0.98%
Mountain:Arizona 1.80% 2.18% 5.11% * 3.24% 6.93% * 1.95% 2.74% 2.00%Colorado 1.13% 3.97% 4.29% 3.28% 4.30% 2.28% 3.01% 1.48%Idaho 2.34% 4.67% 3.56% 3.76% * 3.02% 2.74% 3.06% 2.43%Montana 1.12% 4.76% * 2.72% 2.98% * 2.38% 1.51% 2.50% * 1.54%Nevada 2.31% 3.97% * 7.39% * 5.10% * 4.06% 2.72% 1.28% 2.80%New Mexico 2.57% 4.07% 8.13% * 5.91% 2.98% 1.77% 6.35% 1.32%Utah 0.62% 3.49% * 4.80% * 1.97% 3.72% 1.20% 1.45% 0.82%Wyoming 1.83% 2.69% * 5.89% * 3.61% 3.44% 1.81% 3.05% 2.09%
Pacific:Alaska 1.23% 2.14% 4.15% 4.10% * 2.88% 1.00% 2.33% 1.52%California 0.87% 1.29% 1.92% 2.89% 1.08% 0.71% 1.39% 0.85%Hawaii 1.22% 1.05% * 2.61% * 2.82% 1.82% 2.26% 1.78% 1.29%Oregon 1.13% 3.14% * 5.36% * 2.65% 1.95% 1.61% 1.58% 1.14%Washington 1.07% 4.85% * 2.68% 1.50% 1.70% 2.27% 2.24% 1.15%
Source: Agency for Healthcare Research and Quality, Center for Financing, Access and Cost Trends. 2008 Medical Expenditure PanelSurvey-Insurance Component.Note: Definitions and descriptions of the methods used for this survey can be found in the Technical Appendix.* Figure does not meet standard of reliability or precision.
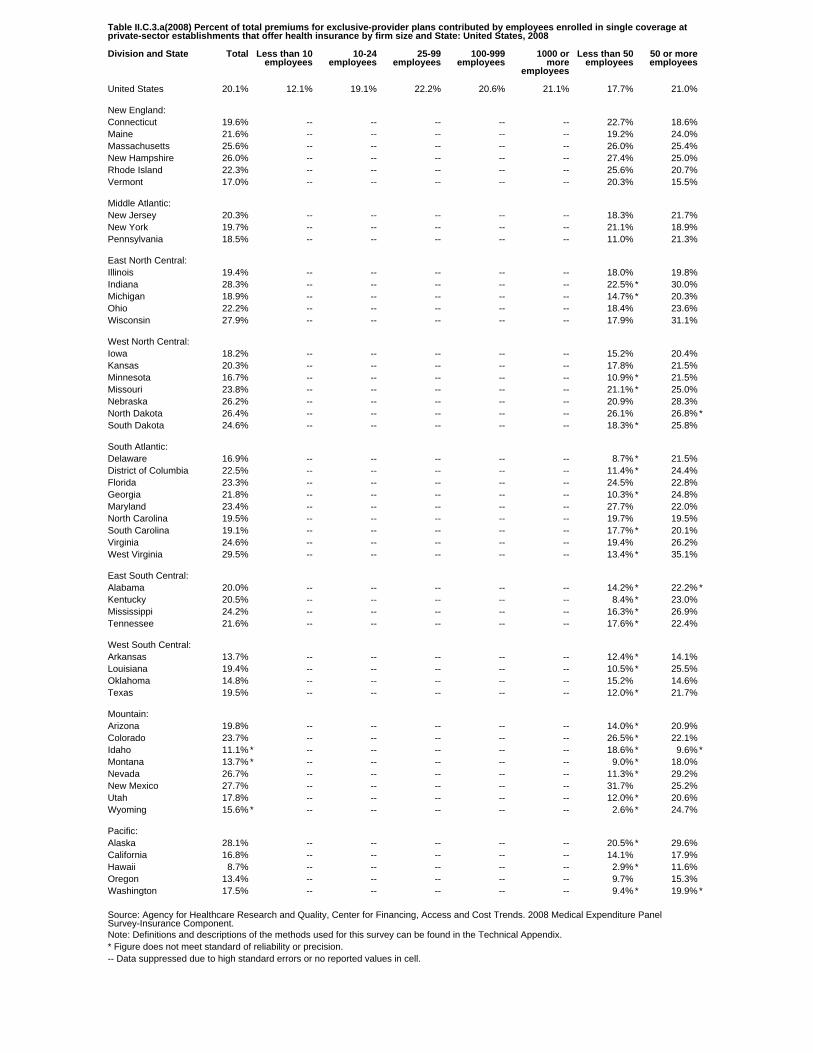
Table II.C.3.a(2008) Percent of total premiums for exclusive-provider plans contributed by employees enrolled in single coverage atprivate-sector establishments that offer health insurance by firm size and State: United States, 2008
Division and State Total Less than 10employees
10-24employees
25-99employees
100-999employees
1000 ormore
employees
Less than 50employees
50 or moreemployees
United States 20.1% 12.1% 19.1% 22.2% 20.6% 21.1% 17.7% 21.0%
New England:Connecticut 19.6% -- -- -- -- -- 22.7% 18.6%Maine 21.6% -- -- -- -- -- 19.2% 24.0%Massachusetts 25.6% -- -- -- -- -- 26.0% 25.4%New Hampshire 26.0% -- -- -- -- -- 27.4% 25.0%Rhode Island 22.3% -- -- -- -- -- 25.6% 20.7%Vermont 17.0% -- -- -- -- -- 20.3% 15.5%
Middle Atlantic:New Jersey 20.3% -- -- -- -- -- 18.3% 21.7%New York 19.7% -- -- -- -- -- 21.1% 18.9%Pennsylvania 18.5% -- -- -- -- -- 11.0% 21.3%
East North Central:Illinois 19.4% -- -- -- -- -- 18.0% 19.8%Indiana 28.3% -- -- -- -- -- 22.5% * 30.0%Michigan 18.9% -- -- -- -- -- 14.7% * 20.3%Ohio 22.2% -- -- -- -- -- 18.4% 23.6%Wisconsin 27.9% -- -- -- -- -- 17.9% 31.1%
West North Central:Iowa 18.2% -- -- -- -- -- 15.2% 20.4%Kansas 20.3% -- -- -- -- -- 17.8% 21.5%Minnesota 16.7% -- -- -- -- -- 10.9% * 21.5%Missouri 23.8% -- -- -- -- -- 21.1% * 25.0%Nebraska 26.2% -- -- -- -- -- 20.9% 28.3%North Dakota 26.4% -- -- -- -- -- 26.1% 26.8% *South Dakota 24.6% -- -- -- -- -- 18.3% * 25.8%
South Atlantic:Delaware 16.9% -- -- -- -- -- 8.7% * 21.5%District of Columbia 22.5% -- -- -- -- -- 11.4% * 24.4%Florida 23.3% -- -- -- -- -- 24.5% 22.8%Georgia 21.8% -- -- -- -- -- 10.3% * 24.8%Maryland 23.4% -- -- -- -- -- 27.7% 22.0%North Carolina 19.5% -- -- -- -- -- 19.7% 19.5%South Carolina 19.1% -- -- -- -- -- 17.7% * 20.1%Virginia 24.6% -- -- -- -- -- 19.4% 26.2%West Virginia 29.5% -- -- -- -- -- 13.4% * 35.1%
East South Central:Alabama 20.0% -- -- -- -- -- 14.2% * 22.2% *Kentucky 20.5% -- -- -- -- -- 8.4% * 23.0%Mississippi 24.2% -- -- -- -- -- 16.3% * 26.9%Tennessee 21.6% -- -- -- -- -- 17.6% * 22.4%
West South Central:Arkansas 13.7% -- -- -- -- -- 12.4% * 14.1%Louisiana 19.4% -- -- -- -- -- 10.5% * 25.5%Oklahoma 14.8% -- -- -- -- -- 15.2% 14.6%Texas 19.5% -- -- -- -- -- 12.0% * 21.7%
Mountain:Arizona 19.8% -- -- -- -- -- 14.0% * 20.9%Colorado 23.7% -- -- -- -- -- 26.5% * 22.1%Idaho 11.1% * -- -- -- -- -- 18.6% * 9.6% *Montana 13.7% * -- -- -- -- -- 9.0% * 18.0%Nevada 26.7% -- -- -- -- -- 11.3% * 29.2%New Mexico 27.7% -- -- -- -- -- 31.7% 25.2%Utah 17.8% -- -- -- -- -- 12.0% * 20.6%Wyoming 15.6% * -- -- -- -- -- 2.6% * 24.7%
Pacific:Alaska 28.1% -- -- -- -- -- 20.5% * 29.6%California 16.8% -- -- -- -- -- 14.1% 17.9%Hawaii 8.7% -- -- -- -- -- 2.9% * 11.6%Oregon 13.4% -- -- -- -- -- 9.7% 15.3%Washington 17.5% -- -- -- -- -- 9.4% * 19.9% *
Source: Agency for Healthcare Research and Quality, Center for Financing, Access and Cost Trends. 2008 Medical Expenditure PanelSurvey-Insurance Component.Note: Definitions and descriptions of the methods used for this survey can be found in the Technical Appendix.* Figure does not meet standard of reliability or precision.-- Data suppressed due to high standard errors or no reported values in cell.

Table II.C.3.a(2008) Standard error for percent of total premiums for exclusive-provider plans contributed by employees enrolled insingle coverage at private-sector establishments that offer health insurance by firm size and State: United States, 2008
Division and State Total Less than 10employees
10-24employees
25-99employees
100-999employees
1000 ormore
employees
Less than 50employees
50 or moreemployees
United States 0.53% 0.45% 1.68% 1.71% 1.47% 0.45% 1.05% 0.52%
New England:Connecticut 2.60% -- -- -- -- -- 3.51% 2.99%Maine 2.07% -- -- -- -- -- 2.98% 3.69%Massachusetts 2.11% -- -- -- -- -- 3.89% 1.61%New Hampshire 2.77% -- -- -- -- -- 4.13% 2.93%Rhode Island 4.37% -- -- -- -- -- 5.88% 5.17%Vermont 2.60% -- -- -- -- -- 5.48% 2.24%
Middle Atlantic:New Jersey 3.76% -- -- -- -- -- 4.03% 5.58%New York 2.38% -- -- -- -- -- 2.77% 2.36%Pennsylvania 2.48% -- -- -- -- -- 2.53% 3.15%
East North Central:Illinois 1.72% -- -- -- -- -- 3.74% 2.33%Indiana 4.77% -- -- -- -- -- 9.10% * 3.17%Michigan 1.89% -- -- -- -- -- 4.60% * 2.38%Ohio 2.30% -- -- -- -- -- 4.94% 3.76%Wisconsin 1.67% -- -- -- -- -- 4.97% 1.92%
West North Central:Iowa 1.99% -- -- -- -- -- 3.29% 3.59%Kansas 3.39% -- -- -- -- -- 4.62% 3.38%Minnesota 3.22% -- -- -- -- -- 4.25% * 2.56%Missouri 2.93% -- -- -- -- -- 6.54% * 2.31%Nebraska 2.73% -- -- -- -- -- 6.11% 2.91%North Dakota 5.88% -- -- -- -- -- 7.68% 8.72% *South Dakota 5.76% -- -- -- -- -- 7.06% * 6.17%
South Atlantic:Delaware 2.66% -- -- -- -- -- 2.86% * 4.16%District of Columbia 2.26% -- -- -- -- -- 3.72% * 2.57%Florida 2.05% -- -- -- -- -- 5.44% 1.50%Georgia 2.50% -- -- -- -- -- 3.18% * 3.99%Maryland 2.41% -- -- -- -- -- 5.79% 2.21%North Carolina 3.64% -- -- -- -- -- 5.89% 3.49%South Carolina 2.47% -- -- -- -- -- 5.99% * 4.63%Virginia 2.10% -- -- -- -- -- 5.34% 2.27%West Virginia 7.36% -- -- -- -- -- 4.30% * 7.02%
East South Central:Alabama 3.61% -- -- -- -- -- 9.35% * 8.61% *Kentucky 4.22% -- -- -- -- -- 4.38% * 5.94%Mississippi 4.92% -- -- -- -- -- 6.03% * 5.21%Tennessee 4.91% -- -- -- -- -- 7.69% * 4.54%
West South Central:Arkansas 2.85% -- -- -- -- -- 7.07% * 4.05%Louisiana 3.43% -- -- -- -- -- 5.31% * 3.09%Oklahoma 3.00% -- -- -- -- -- 3.31% 3.18%Texas 2.15% -- -- -- -- -- 5.16% * 1.76%
Mountain:Arizona 2.10% -- -- -- -- -- 4.53% * 2.36%Colorado 3.46% -- -- -- -- -- 9.46% * 3.09%Idaho 4.99% * -- -- -- -- -- 8.66% * 3.98% *Montana 5.69% * -- -- -- -- -- 5.40% * 5.39%Nevada 6.58% -- -- -- -- -- 4.24% * 7.25%New Mexico 4.44% -- -- -- -- -- 9.08% 2.52%Utah 1.60% -- -- -- -- -- 4.59% * 2.76%Wyoming 4.81% * -- -- -- -- -- 1.80% * 5.37%
Pacific:Alaska 5.77% -- -- -- -- -- 6.59% * 7.81%California 1.64% -- -- -- -- -- 1.82% 1.75%Hawaii 1.31% -- -- -- -- -- 0.93% * 1.72%Oregon 2.19% -- -- -- -- -- 1.83% 2.98%Washington 5.00% -- -- -- -- -- 5.22% * 6.12% *
Source: Agency for Healthcare Research and Quality, Center for Financing, Access and Cost Trends. 2008 Medical Expenditure PanelSurvey-Insurance Component.Note: Definitions and descriptions of the methods used for this survey can be found in the Technical Appendix.* Figure does not meet standard of reliability or precision.-- Data suppressed due to high standard errors or no reported values in cell.
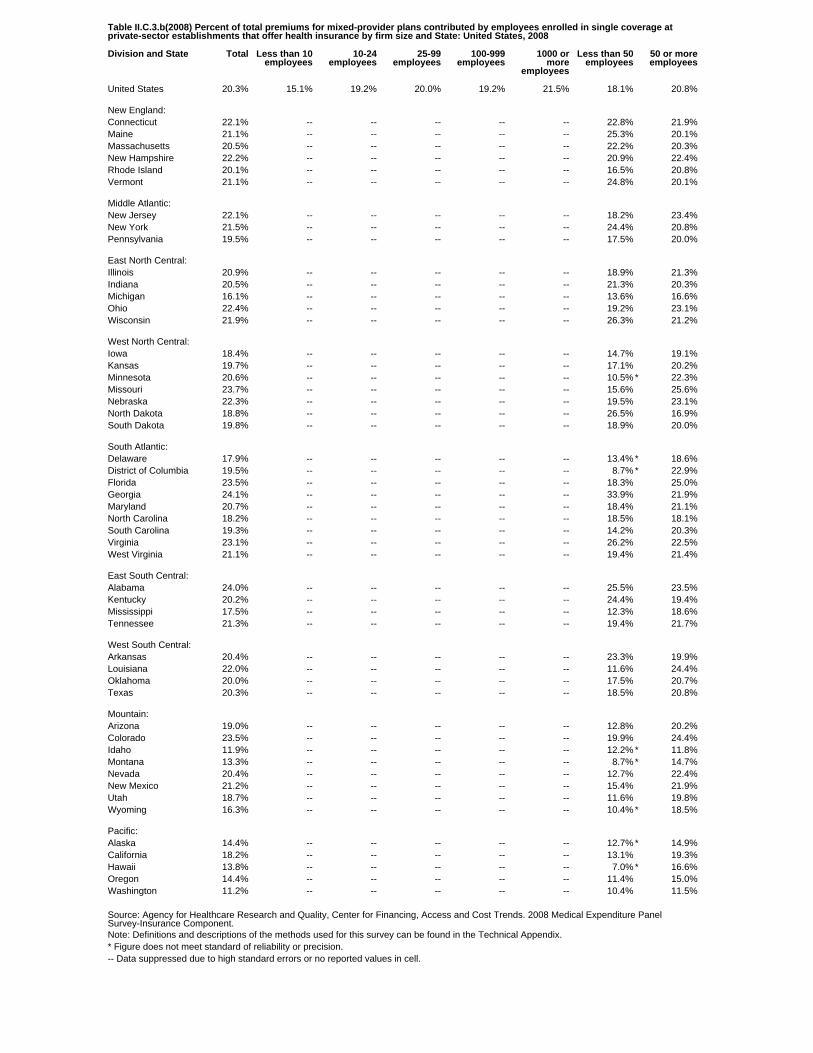
Table II.C.3.b(2008) Percent of total premiums for mixed-provider plans contributed by employees enrolled in single coverage atprivate-sector establishments that offer health insurance by firm size and State: United States, 2008
Division and State Total Less than 10employees
10-24employees
25-99employees
100-999employees
1000 ormore
employees
Less than 50employees
50 or moreemployees
United States 20.3% 15.1% 19.2% 20.0% 19.2% 21.5% 18.1% 20.8%
New England:Connecticut 22.1% -- -- -- -- -- 22.8% 21.9%Maine 21.1% -- -- -- -- -- 25.3% 20.1%Massachusetts 20.5% -- -- -- -- -- 22.2% 20.3%New Hampshire 22.2% -- -- -- -- -- 20.9% 22.4%Rhode Island 20.1% -- -- -- -- -- 16.5% 20.8%Vermont 21.1% -- -- -- -- -- 24.8% 20.1%
Middle Atlantic:New Jersey 22.1% -- -- -- -- -- 18.2% 23.4%New York 21.5% -- -- -- -- -- 24.4% 20.8%Pennsylvania 19.5% -- -- -- -- -- 17.5% 20.0%
East North Central:Illinois 20.9% -- -- -- -- -- 18.9% 21.3%Indiana 20.5% -- -- -- -- -- 21.3% 20.3%Michigan 16.1% -- -- -- -- -- 13.6% 16.6%Ohio 22.4% -- -- -- -- -- 19.2% 23.1%Wisconsin 21.9% -- -- -- -- -- 26.3% 21.2%
West North Central:Iowa 18.4% -- -- -- -- -- 14.7% 19.1%Kansas 19.7% -- -- -- -- -- 17.1% 20.2%Minnesota 20.6% -- -- -- -- -- 10.5% * 22.3%Missouri 23.7% -- -- -- -- -- 15.6% 25.6%Nebraska 22.3% -- -- -- -- -- 19.5% 23.1%North Dakota 18.8% -- -- -- -- -- 26.5% 16.9%South Dakota 19.8% -- -- -- -- -- 18.9% 20.0%
South Atlantic:Delaware 17.9% -- -- -- -- -- 13.4% * 18.6%District of Columbia 19.5% -- -- -- -- -- 8.7% * 22.9%Florida 23.5% -- -- -- -- -- 18.3% 25.0%Georgia 24.1% -- -- -- -- -- 33.9% 21.9%Maryland 20.7% -- -- -- -- -- 18.4% 21.1%North Carolina 18.2% -- -- -- -- -- 18.5% 18.1%South Carolina 19.3% -- -- -- -- -- 14.2% 20.3%Virginia 23.1% -- -- -- -- -- 26.2% 22.5%West Virginia 21.1% -- -- -- -- -- 19.4% 21.4%
East South Central:Alabama 24.0% -- -- -- -- -- 25.5% 23.5%Kentucky 20.2% -- -- -- -- -- 24.4% 19.4%Mississippi 17.5% -- -- -- -- -- 12.3% 18.6%Tennessee 21.3% -- -- -- -- -- 19.4% 21.7%
West South Central:Arkansas 20.4% -- -- -- -- -- 23.3% 19.9%Louisiana 22.0% -- -- -- -- -- 11.6% 24.4%Oklahoma 20.0% -- -- -- -- -- 17.5% 20.7%Texas 20.3% -- -- -- -- -- 18.5% 20.8%
Mountain:Arizona 19.0% -- -- -- -- -- 12.8% 20.2%Colorado 23.5% -- -- -- -- -- 19.9% 24.4%Idaho 11.9% -- -- -- -- -- 12.2% * 11.8%Montana 13.3% -- -- -- -- -- 8.7% * 14.7%Nevada 20.4% -- -- -- -- -- 12.7% 22.4%New Mexico 21.2% -- -- -- -- -- 15.4% 21.9%Utah 18.7% -- -- -- -- -- 11.6% 19.8%Wyoming 16.3% -- -- -- -- -- 10.4% * 18.5%
Pacific:Alaska 14.4% -- -- -- -- -- 12.7% * 14.9%California 18.2% -- -- -- -- -- 13.1% 19.3%Hawaii 13.8% -- -- -- -- -- 7.0% * 16.6%Oregon 14.4% -- -- -- -- -- 11.4% 15.0%Washington 11.2% -- -- -- -- -- 10.4% 11.5%
Source: Agency for Healthcare Research and Quality, Center for Financing, Access and Cost Trends. 2008 Medical Expenditure PanelSurvey-Insurance Component.Note: Definitions and descriptions of the methods used for this survey can be found in the Technical Appendix.* Figure does not meet standard of reliability or precision.-- Data suppressed due to high standard errors or no reported values in cell.
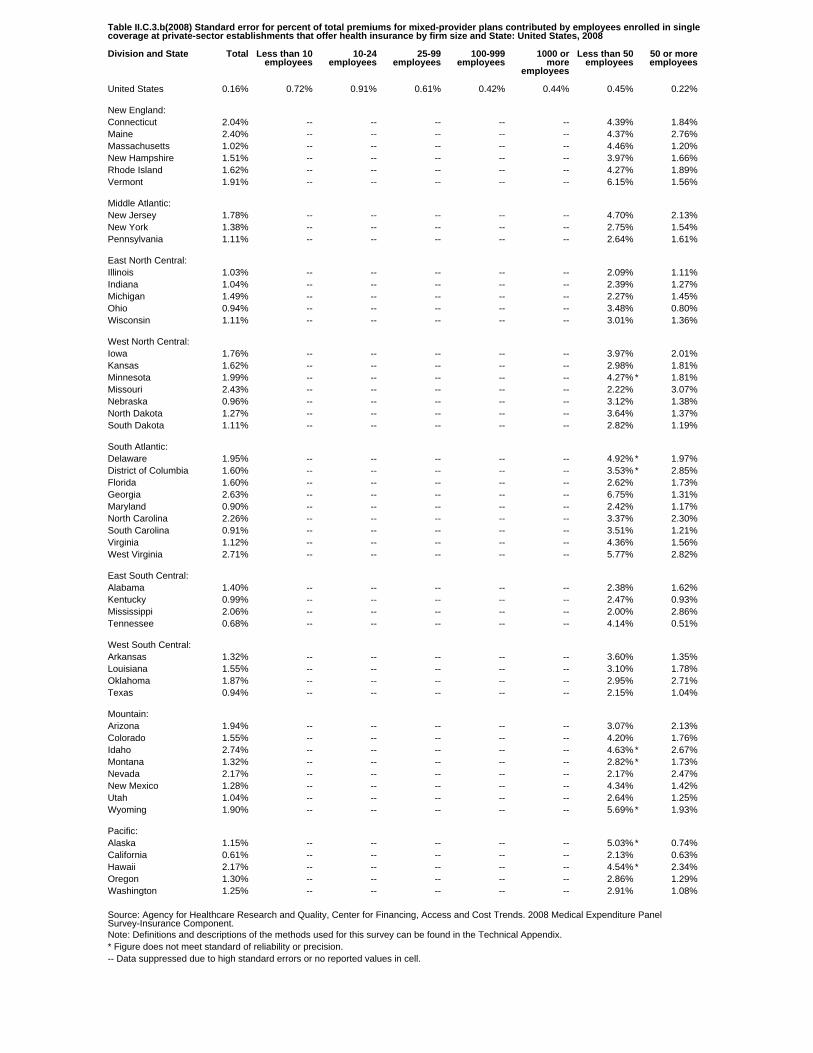
Table II.C.3.b(2008) Standard error for percent of total premiums for mixed-provider plans contributed by employees enrolled in singlecoverage at private-sector establishments that offer health insurance by firm size and State: United States, 2008
Division and State Total Less than 10employees
10-24employees
25-99employees
100-999employees
1000 ormore
employees
Less than 50employees
50 or moreemployees
United States 0.16% 0.72% 0.91% 0.61% 0.42% 0.44% 0.45% 0.22%
New England:Connecticut 2.04% -- -- -- -- -- 4.39% 1.84%Maine 2.40% -- -- -- -- -- 4.37% 2.76%Massachusetts 1.02% -- -- -- -- -- 4.46% 1.20%New Hampshire 1.51% -- -- -- -- -- 3.97% 1.66%Rhode Island 1.62% -- -- -- -- -- 4.27% 1.89%Vermont 1.91% -- -- -- -- -- 6.15% 1.56%
Middle Atlantic:New Jersey 1.78% -- -- -- -- -- 4.70% 2.13%New York 1.38% -- -- -- -- -- 2.75% 1.54%Pennsylvania 1.11% -- -- -- -- -- 2.64% 1.61%
East North Central:Illinois 1.03% -- -- -- -- -- 2.09% 1.11%Indiana 1.04% -- -- -- -- -- 2.39% 1.27%Michigan 1.49% -- -- -- -- -- 2.27% 1.45%Ohio 0.94% -- -- -- -- -- 3.48% 0.80%Wisconsin 1.11% -- -- -- -- -- 3.01% 1.36%
West North Central:Iowa 1.76% -- -- -- -- -- 3.97% 2.01%Kansas 1.62% -- -- -- -- -- 2.98% 1.81%Minnesota 1.99% -- -- -- -- -- 4.27% * 1.81%Missouri 2.43% -- -- -- -- -- 2.22% 3.07%Nebraska 0.96% -- -- -- -- -- 3.12% 1.38%North Dakota 1.27% -- -- -- -- -- 3.64% 1.37%South Dakota 1.11% -- -- -- -- -- 2.82% 1.19%
South Atlantic:Delaware 1.95% -- -- -- -- -- 4.92% * 1.97%District of Columbia 1.60% -- -- -- -- -- 3.53% * 2.85%Florida 1.60% -- -- -- -- -- 2.62% 1.73%Georgia 2.63% -- -- -- -- -- 6.75% 1.31%Maryland 0.90% -- -- -- -- -- 2.42% 1.17%North Carolina 2.26% -- -- -- -- -- 3.37% 2.30%South Carolina 0.91% -- -- -- -- -- 3.51% 1.21%Virginia 1.12% -- -- -- -- -- 4.36% 1.56%West Virginia 2.71% -- -- -- -- -- 5.77% 2.82%
East South Central:Alabama 1.40% -- -- -- -- -- 2.38% 1.62%Kentucky 0.99% -- -- -- -- -- 2.47% 0.93%Mississippi 2.06% -- -- -- -- -- 2.00% 2.86%Tennessee 0.68% -- -- -- -- -- 4.14% 0.51%
West South Central:Arkansas 1.32% -- -- -- -- -- 3.60% 1.35%Louisiana 1.55% -- -- -- -- -- 3.10% 1.78%Oklahoma 1.87% -- -- -- -- -- 2.95% 2.71%Texas 0.94% -- -- -- -- -- 2.15% 1.04%
Mountain:Arizona 1.94% -- -- -- -- -- 3.07% 2.13%Colorado 1.55% -- -- -- -- -- 4.20% 1.76%Idaho 2.74% -- -- -- -- -- 4.63% * 2.67%Montana 1.32% -- -- -- -- -- 2.82% * 1.73%Nevada 2.17% -- -- -- -- -- 2.17% 2.47%New Mexico 1.28% -- -- -- -- -- 4.34% 1.42%Utah 1.04% -- -- -- -- -- 2.64% 1.25%Wyoming 1.90% -- -- -- -- -- 5.69% * 1.93%
Pacific:Alaska 1.15% -- -- -- -- -- 5.03% * 0.74%California 0.61% -- -- -- -- -- 2.13% 0.63%Hawaii 2.17% -- -- -- -- -- 4.54% * 2.34%Oregon 1.30% -- -- -- -- -- 2.86% 1.29%Washington 1.25% -- -- -- -- -- 2.91% 1.08%
Source: Agency for Healthcare Research and Quality, Center for Financing, Access and Cost Trends. 2008 Medical Expenditure PanelSurvey-Insurance Component.Note: Definitions and descriptions of the methods used for this survey can be found in the Technical Appendix.* Figure does not meet standard of reliability or precision.-- Data suppressed due to high standard errors or no reported values in cell.

Table II.C.3.c(2008) Percent of total premiums for any-provider plans contributed by employees enrolled in single coverage atprivate-sector establishments that offer health insurance by firm size and State: United States, 2008
Division and State Total Less than 10employees
10-24employees
25-99employees
100-999employees
1000 ormore
employees
Less than 50employees
50 or moreemployees
United States 17.9% 12.3% 15.9% 20.3% 21.9% 19.4% 15.2% 20.1%
New England:Connecticut 15.3% -- -- -- -- -- 13.0% * 19.7% *Maine 22.5% * -- -- -- -- -- 18.1% * 26.0% *Massachusetts 23.7% -- -- -- -- -- 22.4% * 25.8%New Hampshire 28.0% -- -- -- -- -- 30.8% 25.1%Rhode Island 23.2% -- -- -- -- -- 22.7% 24.0% *Vermont 23.9% -- -- -- -- -- 20.8% * 27.3% *
Middle Atlantic:New Jersey 21.0% * -- -- -- -- -- 20.7% * 22.1% *New York 10.2% * -- -- -- -- -- 12.7% * 6.6% *Pennsylvania 14.7% -- -- -- -- -- 5.1% * 20.7%
East North Central:Illinois 20.0% -- -- -- -- -- 23.4% * 17.5%Indiana 13.5% * -- -- -- -- -- 9.9% * 15.9% *Michigan 15.6% -- -- -- -- -- 5.7% * 27.2%Ohio 13.1% * -- -- -- -- -- 14.5% * 12.1% *Wisconsin 15.2% -- -- -- -- -- 11.9% * 16.7%
West North Central:Iowa 16.8% -- -- -- -- -- 20.9% 14.5% *Kansas 14.3% -- -- -- -- -- 10.9% * 19.4%Minnesota 21.0% -- -- -- -- -- 19.2% 23.3%Missouri 16.7% -- -- -- -- -- 17.7% * 15.7% *Nebraska 28.2% -- -- -- -- -- 28.8% 27.7%North Dakota 19.6% -- -- -- -- -- 18.6% 19.9%South Dakota 24.7% -- -- -- -- -- 21.7% * 28.9%
South Atlantic:Delaware 29.2% -- -- -- -- -- 29.5% 28.9%District of Columbia 19.3% -- -- -- -- -- 6.2% * 22.5%Florida 26.9% -- -- -- -- -- 26.9% 27.0% *Georgia 18.3% * -- -- -- -- -- 11.7% * 22.9%Maryland 28.0% * -- -- -- -- -- 15.5% * 36.6%North Carolina 20.3% -- -- -- -- -- 12.0% * 27.8% *South Carolina 15.3% * -- -- -- -- -- 17.1% * 12.3% *Virginia 23.2% -- -- -- -- -- 17.8% 27.2%West Virginia 9.8% * -- -- -- -- -- 10.3% * 8.7% *
East South Central:Alabama 21.1% -- -- -- -- -- 28.2% 16.5%Kentucky 18.8% -- -- -- -- -- 18.6% 19.1%Mississippi 19.1% * -- -- -- -- -- 16.8% * 19.9%Tennessee 21.4% * -- -- -- -- -- 11.9% * 25.9% *
West South Central:Arkansas 37.6% -- -- -- -- -- 29.4% 54.0%Louisiana 16.9% * -- -- -- -- -- 17.5% * 15.9% *Oklahoma 19.2% -- -- -- -- -- 10.0% * 24.2% *Texas 16.5% -- -- -- -- -- 9.0% * 22.2% *
Mountain:Arizona 21.6% * -- -- -- -- -- 17.2% * 23.4% *Colorado 16.0% * -- -- -- -- -- 19.1% * 12.2% *Idaho 9.4% * -- -- -- -- -- 10.0% * 8.4% *Montana 13.6% -- -- -- -- -- 5.6% * 19.3%Nevada 22.6% * -- -- -- -- -- 6.4% * 46.2%New Mexico 36.9% -- -- -- -- -- 28.0% 50.3%Utah 13.5% -- -- -- -- -- 5.7% * 14.7%Wyoming 13.8% -- -- -- -- -- 13.4% 14.2% *
Pacific:Alaska 11.7% -- -- -- -- -- 9.5% 13.0% *California 12.4% -- -- -- -- -- 4.4% * 15.0%Hawaii 13.2% -- -- -- -- -- 12.5% * 14.0% *Oregon 10.0% * -- -- -- -- -- 10.7% * 8.5% *Washington 21.2% * -- -- -- -- -- 22.3% * 17.0% *
Source: Agency for Healthcare Research and Quality, Center for Financing, Access and Cost Trends. 2008 Medical Expenditure PanelSurvey-Insurance Component.Note: Definitions and descriptions of the methods used for this survey can be found in the Technical Appendix.* Figure does not meet standard of reliability or precision.-- Data suppressed due to high standard errors or no reported values in cell.

Table II.C.3.c(2008) Standard error for percent of total premiums for any-provider plans contributed by employees enrolled in singlecoverage at private-sector establishments that offer health insurance by firm size and State: United States, 2008
Division and State Total Less than 10employees
10-24employees
25-99employees
100-999employees
1000 ormore
employees
Less than 50employees
50 or moreemployees
United States 0.60% 1.65% 1.81% 1.70% 1.89% 0.96% 1.05% 1.25%
New England:Connecticut 4.55% -- -- -- -- -- 5.13% * 11.31% *Maine 9.91% * -- -- -- -- -- 9.67% * 8.17% *Massachusetts 6.02% -- -- -- -- -- 6.92% * 6.74%New Hampshire 6.15% -- -- -- -- -- 7.13% 7.34%Rhode Island 5.08% -- -- -- -- -- 4.39% 9.39% *Vermont 3.47% -- -- -- -- -- 8.02% * 10.09% *
Middle Atlantic:New Jersey 10.58% * -- -- -- -- -- 8.20% * 9.92% *New York 4.43% * -- -- -- -- -- 4.38% * 8.05% *Pennsylvania 2.39% -- -- -- -- -- 3.43% * 3.77%
East North Central:Illinois 3.75% -- -- -- -- -- 10.77% * 5.04%Indiana 7.47% * -- -- -- -- -- 6.50% * 9.89% *Michigan 2.99% -- -- -- -- -- 2.89% * 5.35%Ohio 8.92% * -- -- -- -- -- 9.51% * 10.98% *Wisconsin 3.59% -- -- -- -- -- 5.78% * 3.63%
West North Central:Iowa 3.11% -- -- -- -- -- 5.50% 4.40% *Kansas 4.13% -- -- -- -- -- 6.65% * 3.89%Minnesota 3.11% -- -- -- -- -- 4.23% 4.41%Missouri 2.72% -- -- -- -- -- 5.36% * 9.41% *Nebraska 7.00% -- -- -- -- -- 8.07% 7.76%North Dakota 2.65% -- -- -- -- -- 3.85% 4.86%South Dakota 3.73% -- -- -- -- -- 6.57% * 6.11%
South Atlantic:Delaware 3.46% -- -- -- -- -- 6.58% 6.07%District of Columbia 1.79% -- -- -- -- -- 4.36% * 5.88%Florida 5.92% -- -- -- -- -- 5.40% 10.79% *Georgia 6.67% * -- -- -- -- -- 7.66% * 5.61%Maryland 9.13% * -- -- -- -- -- 10.39% * 6.94%North Carolina 5.22% -- -- -- -- -- 5.95% * 9.81% *South Carolina 12.09% * -- -- -- -- -- 11.17% * 9.80% *Virginia 4.64% -- -- -- -- -- 4.63% 6.06%West Virginia 4.91% * -- -- -- -- -- 3.48% * 5.03% *
East South Central:Alabama 4.59% -- -- -- -- -- 6.40% 3.93%Kentucky 4.03% -- -- -- -- -- 5.09% 5.40%Mississippi 9.28% * -- -- -- -- -- 10.16% * 4.99%Tennessee 6.42% * -- -- -- -- -- 4.03% * 11.98% *
West South Central:Arkansas 8.31% -- -- -- -- -- 8.10% 14.50%Louisiana 5.16% * -- -- -- -- -- 5.81% * 5.50% *Oklahoma 2.10% -- -- -- -- -- 3.46% * 9.30% *Texas 4.18% -- -- -- -- -- 5.03% * 6.73% *
Mountain:Arizona 9.60% * -- -- -- -- -- 5.46% * 13.17% *Colorado 7.98% * -- -- -- -- -- 9.97% * 5.03% *Idaho 5.21% * -- -- -- -- -- 5.21% * 9.99% *Montana 3.13% -- -- -- -- -- 3.52% * 4.07%Nevada 8.65% * -- -- -- -- -- 4.76% * 11.87%New Mexico 8.72% -- -- -- -- -- 7.59% 13.50%Utah 3.56% -- -- -- -- -- 3.59% * 3.23%Wyoming 3.18% -- -- -- -- -- 3.89% 6.45% *
Pacific:Alaska 2.12% -- -- -- -- -- 2.63% 9.46% *California 2.20% -- -- -- -- -- 2.07% * 3.55%Hawaii 3.45% -- -- -- -- -- 4.23% * 4.23% *Oregon 3.11% * -- -- -- -- -- 3.67% * 3.43% *Washington 6.72% * -- -- -- -- -- 7.38% * 9.91% *
Source: Agency for Healthcare Research and Quality, Center for Financing, Access and Cost Trends. 2008 Medical Expenditure PanelSurvey-Insurance Component.Note: Definitions and descriptions of the methods used for this survey can be found in the Technical Appendix.* Figure does not meet standard of reliability or precision.-- Data suppressed due to high standard errors or no reported values in cell.

Table II.C.4(2008) Percent of private-sector employees enrolled in a health insurance plan that take single coverage by firm size andState: United States, 2008
Division and State Total Less than 10employees
10-24employees
25-99employees
100-999employees
1000 ormore
employees
Less than 50employees
50 or moreemployees
United States 50.2% 61.7% 62.1% 58.2% 52.8% 44.8% 60.7% 47.9%
New England:Connecticut 45.3% 59.3% 57.8% 46.6% 48.8% 40.5% 55.0% 43.0%Maine 52.6% 61.7% 68.5% 64.3% 55.1% 40.8% 66.6% 47.8%Massachusetts 49.3% 56.4% 57.9% 55.7% 49.8% 45.9% 56.4% 47.7%New Hampshire 46.7% 61.7% 58.7% 51.1% 46.5% 40.4% 59.4% 43.2%Rhode Island 47.9% 57.8% 61.4% 55.2% 50.8% 40.8% 57.3% 45.0%Vermont 49.9% 51.8% 59.3% 52.5% 48.7% 47.4% 56.0% 47.9%
Middle Atlantic:New Jersey 49.3% 64.9% 58.8% 54.9% 54.0% 41.6% 58.8% 46.1%New York 49.6% 62.0% 63.1% 55.8% 50.3% 44.1% 61.3% 46.6%Pennsylvania 48.8% 58.2% 57.7% 57.0% 52.0% 43.4% 57.3% 46.8%
East North Central:Illinois 49.8% 68.4% 61.5% 57.2% 51.3% 44.6% 62.0% 47.5%Indiana 44.7% 54.3% 60.5% 55.4% 50.0% 37.6% 59.5% 41.9%Michigan 43.1% 50.1% 44.8% 43.0% 42.2% 42.4% 46.3% 42.3%Ohio 44.5% 59.0% 49.7% 51.0% 44.7% 41.0% 52.3% 43.0%Wisconsin 46.9% 50.6% 50.0% 52.1% 50.4% 43.9% 50.1% 46.3%
West North Central:Iowa 47.7% 53.6% 58.2% 49.3% 48.4% 44.9% 55.7% 45.8%Kansas 48.2% 53.8% 53.6% 53.3% 54.6% 41.8% 54.8% 46.5%Minnesota 49.0% 55.0% 63.9% 56.2% 52.3% 43.3% 59.3% 46.6%Missouri 52.3% 65.7% 64.5% 58.4% 52.5% 48.3% 64.1% 49.8%Nebraska 47.8% 54.6% 67.8% 58.0% 52.0% 42.6% 61.4% 45.4%North Dakota 50.4% 43.6% 60.0% 51.7% 57.0% 46.2% 55.2% 49.1%South Dakota 52.7% 52.7% 60.5% 57.7% 53.7% 49.2% 57.8% 51.3%
South Atlantic:Delaware 50.9% 59.5% 68.0% 65.2% 49.9% 45.6% 66.9% 47.9%District of Columbia 55.5% 67.5% 68.9% 64.1% 57.5% 49.5% 66.8% 53.2%Florida 52.6% 70.5% 69.2% 66.6% 55.9% 46.1% 68.5% 49.1%Georgia 49.3% 64.5% 59.2% 64.0% 55.1% 42.9% 60.5% 47.4%Maryland 53.2% 59.2% 57.2% 58.1% 56.5% 50.0% 59.2% 51.9%North Carolina 57.4% 66.2% 75.0% 70.8% 60.1% 49.7% 73.1% 53.9%South Carolina 51.9% 65.6% 73.8% 63.7% 55.2% 45.0% 66.4% 48.8%Virginia 50.1% 49.9% 62.5% 67.2% 55.8% 43.5% 60.2% 48.2%West Virginia 44.8% 54.9% 41.2% 41.1% 55.2% 41.4% 46.8% 44.3%
East South Central:Alabama 49.5% 53.3% 63.3% 57.0% 55.3% 43.3% 57.3% 47.6%Kentucky 46.9% 60.9% 50.5% 55.9% 45.2% 44.0% 53.9% 45.5%Mississippi 55.4% 67.5% 69.6% 60.3% 62.4% 49.7% 66.5% 53.4%Tennessee 46.7% 62.9% 51.2% 62.1% 49.7% 41.2% 57.6% 45.0%
West South Central:Arkansas 51.7% 59.4% 74.1% 66.1% 58.2% 44.2% 68.0% 49.3%Louisiana 52.1% 61.5% 65.7% 53.3% 55.2% 48.2% 60.5% 50.3%Oklahoma 53.9% 62.3% 64.0% 63.3% 52.6% 49.3% 61.3% 51.9%Texas 50.6% 68.6% 64.9% 56.0% 58.6% 44.7% 61.4% 48.4%
Mountain:Arizona 51.7% 62.7% 53.3% 66.7% 54.5% 47.2% 59.5% 50.3%Colorado 49.3% 66.2% 54.6% 57.7% 52.3% 44.0% 60.4% 46.7%Idaho 51.1% 50.5% 55.4% 59.8% 45.0% 49.5% 54.8% 49.9%Montana 51.2% 54.0% 61.3% 55.4% 53.7% 43.2% 54.7% 49.8%Nevada 54.2% 59.8% 74.5% 65.1% 61.0% 46.9% 64.2% 52.4%New Mexico 55.2% 61.6% 67.4% 63.5% 53.1% 52.3% 64.9% 53.4%Utah 44.2% 35.0% 41.6% 42.5% 42.3% 46.7% 39.8% 45.3%Wyoming 44.1% 63.6% 54.5% 57.0% 44.5% 34.9% 58.2% 39.0%
Pacific:Alaska 54.6% 69.6% 59.3% 58.7% 50.9% 53.3% 59.6% 53.4%California 52.8% 64.0% 71.1% 61.0% 54.9% 46.3% 65.2% 49.9%Hawaii 60.3% 66.4% 76.1% 69.1% 67.6% 47.1% 70.9% 56.2%Oregon 52.6% 57.8% 63.1% 64.4% 60.9% 44.0% 63.7% 49.6%Washington 54.7% 63.9% 66.6% 66.8% 51.3% 48.6% 66.2% 50.9%
Source: Agency for Healthcare Research and Quality, Center for Financing, Access and Cost Trends. 2008 Medical Expenditure PanelSurvey-Insurance Component.Note: Definitions and descriptions of the methods used for this survey can be found in the Technical Appendix.
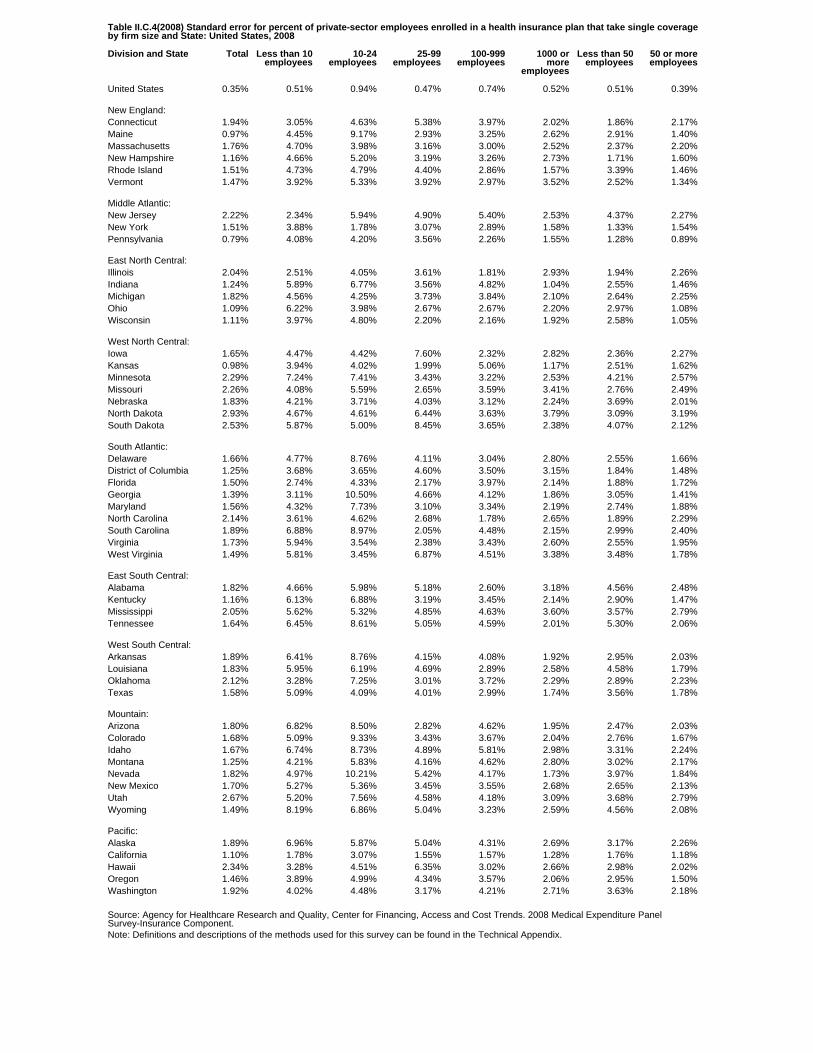
Table II.C.4(2008) Standard error for percent of private-sector employees enrolled in a health insurance plan that take single coverageby firm size and State: United States, 2008
Division and State Total Less than 10employees
10-24employees
25-99employees
100-999employees
1000 ormore
employees
Less than 50employees
50 or moreemployees
United States 0.35% 0.51% 0.94% 0.47% 0.74% 0.52% 0.51% 0.39%
New England:Connecticut 1.94% 3.05% 4.63% 5.38% 3.97% 2.02% 1.86% 2.17%Maine 0.97% 4.45% 9.17% 2.93% 3.25% 2.62% 2.91% 1.40%Massachusetts 1.76% 4.70% 3.98% 3.16% 3.00% 2.52% 2.37% 2.20%New Hampshire 1.16% 4.66% 5.20% 3.19% 3.26% 2.73% 1.71% 1.60%Rhode Island 1.51% 4.73% 4.79% 4.40% 2.86% 1.57% 3.39% 1.46%Vermont 1.47% 3.92% 5.33% 3.92% 2.97% 3.52% 2.52% 1.34%
Middle Atlantic:New Jersey 2.22% 2.34% 5.94% 4.90% 5.40% 2.53% 4.37% 2.27%New York 1.51% 3.88% 1.78% 3.07% 2.89% 1.58% 1.33% 1.54%Pennsylvania 0.79% 4.08% 4.20% 3.56% 2.26% 1.55% 1.28% 0.89%
East North Central:Illinois 2.04% 2.51% 4.05% 3.61% 1.81% 2.93% 1.94% 2.26%Indiana 1.24% 5.89% 6.77% 3.56% 4.82% 1.04% 2.55% 1.46%Michigan 1.82% 4.56% 4.25% 3.73% 3.84% 2.10% 2.64% 2.25%Ohio 1.09% 6.22% 3.98% 2.67% 2.67% 2.20% 2.97% 1.08%Wisconsin 1.11% 3.97% 4.80% 2.20% 2.16% 1.92% 2.58% 1.05%
West North Central:Iowa 1.65% 4.47% 4.42% 7.60% 2.32% 2.82% 2.36% 2.27%Kansas 0.98% 3.94% 4.02% 1.99% 5.06% 1.17% 2.51% 1.62%Minnesota 2.29% 7.24% 7.41% 3.43% 3.22% 2.53% 4.21% 2.57%Missouri 2.26% 4.08% 5.59% 2.65% 3.59% 3.41% 2.76% 2.49%Nebraska 1.83% 4.21% 3.71% 4.03% 3.12% 2.24% 3.69% 2.01%North Dakota 2.93% 4.67% 4.61% 6.44% 3.63% 3.79% 3.09% 3.19%South Dakota 2.53% 5.87% 5.00% 8.45% 3.65% 2.38% 4.07% 2.12%
South Atlantic:Delaware 1.66% 4.77% 8.76% 4.11% 3.04% 2.80% 2.55% 1.66%District of Columbia 1.25% 3.68% 3.65% 4.60% 3.50% 3.15% 1.84% 1.48%Florida 1.50% 2.74% 4.33% 2.17% 3.97% 2.14% 1.88% 1.72%Georgia 1.39% 3.11% 10.50% 4.66% 4.12% 1.86% 3.05% 1.41%Maryland 1.56% 4.32% 7.73% 3.10% 3.34% 2.19% 2.74% 1.88%North Carolina 2.14% 3.61% 4.62% 2.68% 1.78% 2.65% 1.89% 2.29%South Carolina 1.89% 6.88% 8.97% 2.05% 4.48% 2.15% 2.99% 2.40%Virginia 1.73% 5.94% 3.54% 2.38% 3.43% 2.60% 2.55% 1.95%West Virginia 1.49% 5.81% 3.45% 6.87% 4.51% 3.38% 3.48% 1.78%
East South Central:Alabama 1.82% 4.66% 5.98% 5.18% 2.60% 3.18% 4.56% 2.48%Kentucky 1.16% 6.13% 6.88% 3.19% 3.45% 2.14% 2.90% 1.47%Mississippi 2.05% 5.62% 5.32% 4.85% 4.63% 3.60% 3.57% 2.79%Tennessee 1.64% 6.45% 8.61% 5.05% 4.59% 2.01% 5.30% 2.06%
West South Central:Arkansas 1.89% 6.41% 8.76% 4.15% 4.08% 1.92% 2.95% 2.03%Louisiana 1.83% 5.95% 6.19% 4.69% 2.89% 2.58% 4.58% 1.79%Oklahoma 2.12% 3.28% 7.25% 3.01% 3.72% 2.29% 2.89% 2.23%Texas 1.58% 5.09% 4.09% 4.01% 2.99% 1.74% 3.56% 1.78%
Mountain:Arizona 1.80% 6.82% 8.50% 2.82% 4.62% 1.95% 2.47% 2.03%Colorado 1.68% 5.09% 9.33% 3.43% 3.67% 2.04% 2.76% 1.67%Idaho 1.67% 6.74% 8.73% 4.89% 5.81% 2.98% 3.31% 2.24%Montana 1.25% 4.21% 5.83% 4.16% 4.62% 2.80% 3.02% 2.17%Nevada 1.82% 4.97% 10.21% 5.42% 4.17% 1.73% 3.97% 1.84%New Mexico 1.70% 5.27% 5.36% 3.45% 3.55% 2.68% 2.65% 2.13%Utah 2.67% 5.20% 7.56% 4.58% 4.18% 3.09% 3.68% 2.79%Wyoming 1.49% 8.19% 6.86% 5.04% 3.23% 2.59% 4.56% 2.08%
Pacific:Alaska 1.89% 6.96% 5.87% 5.04% 4.31% 2.69% 3.17% 2.26%California 1.10% 1.78% 3.07% 1.55% 1.57% 1.28% 1.76% 1.18%Hawaii 2.34% 3.28% 4.51% 6.35% 3.02% 2.66% 2.98% 2.02%Oregon 1.46% 3.89% 4.99% 4.34% 3.57% 2.06% 2.95% 1.50%Washington 1.92% 4.02% 4.48% 3.17% 4.21% 2.71% 3.63% 2.18%
Source: Agency for Healthcare Research and Quality, Center for Financing, Access and Cost Trends. 2008 Medical Expenditure PanelSurvey-Insurance Component.Note: Definitions and descriptions of the methods used for this survey can be found in the Technical Appendix.
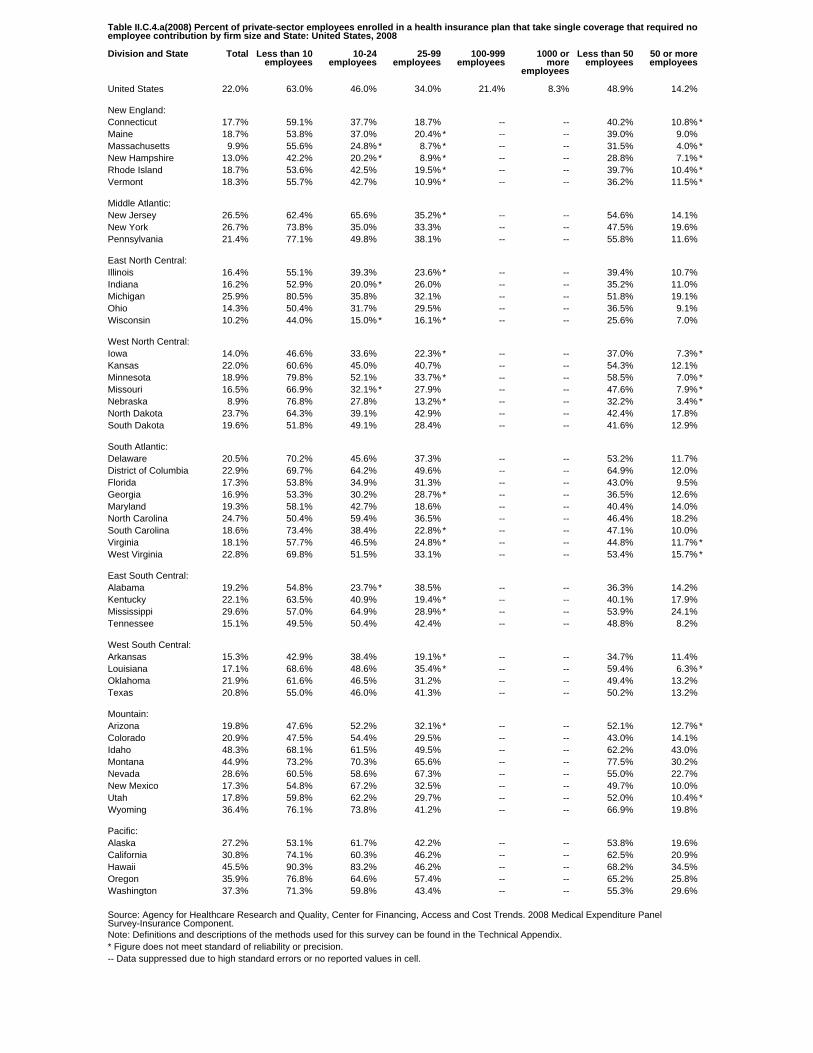
Table II.C.4.a(2008) Percent of private-sector employees enrolled in a health insurance plan that take single coverage that required noemployee contribution by firm size and State: United States, 2008
Division and State Total Less than 10employees
10-24employees
25-99employees
100-999employees
1000 ormore
employees
Less than 50employees
50 or moreemployees
United States 22.0% 63.0% 46.0% 34.0% 21.4% 8.3% 48.9% 14.2%
New England:Connecticut 17.7% 59.1% 37.7% 18.7% -- -- 40.2% 10.8% *Maine 18.7% 53.8% 37.0% 20.4% * -- -- 39.0% 9.0%Massachusetts 9.9% 55.6% 24.8% * 8.7% * -- -- 31.5% 4.0% *New Hampshire 13.0% 42.2% 20.2% * 8.9% * -- -- 28.8% 7.1% *Rhode Island 18.7% 53.6% 42.5% 19.5% * -- -- 39.7% 10.4% *Vermont 18.3% 55.7% 42.7% 10.9% * -- -- 36.2% 11.5% *
Middle Atlantic:New Jersey 26.5% 62.4% 65.6% 35.2% * -- -- 54.6% 14.1%New York 26.7% 73.8% 35.0% 33.3% -- -- 47.5% 19.6%Pennsylvania 21.4% 77.1% 49.8% 38.1% -- -- 55.8% 11.6%
East North Central:Illinois 16.4% 55.1% 39.3% 23.6% * -- -- 39.4% 10.7%Indiana 16.2% 52.9% 20.0% * 26.0% -- -- 35.2% 11.0%Michigan 25.9% 80.5% 35.8% 32.1% -- -- 51.8% 19.1%Ohio 14.3% 50.4% 31.7% 29.5% -- -- 36.5% 9.1%Wisconsin 10.2% 44.0% 15.0% * 16.1% * -- -- 25.6% 7.0%
West North Central:Iowa 14.0% 46.6% 33.6% 22.3% * -- -- 37.0% 7.3% *Kansas 22.0% 60.6% 45.0% 40.7% -- -- 54.3% 12.1%Minnesota 18.9% 79.8% 52.1% 33.7% * -- -- 58.5% 7.0% *Missouri 16.5% 66.9% 32.1% * 27.9% -- -- 47.6% 7.9% *Nebraska 8.9% 76.8% 27.8% 13.2% * -- -- 32.2% 3.4% *North Dakota 23.7% 64.3% 39.1% 42.9% -- -- 42.4% 17.8%South Dakota 19.6% 51.8% 49.1% 28.4% -- -- 41.6% 12.9%
South Atlantic:Delaware 20.5% 70.2% 45.6% 37.3% -- -- 53.2% 11.7%District of Columbia 22.9% 69.7% 64.2% 49.6% -- -- 64.9% 12.0%Florida 17.3% 53.8% 34.9% 31.3% -- -- 43.0% 9.5%Georgia 16.9% 53.3% 30.2% 28.7% * -- -- 36.5% 12.6%Maryland 19.3% 58.1% 42.7% 18.6% -- -- 40.4% 14.0%North Carolina 24.7% 50.4% 59.4% 36.5% -- -- 46.4% 18.2%South Carolina 18.6% 73.4% 38.4% 22.8% * -- -- 47.1% 10.0%Virginia 18.1% 57.7% 46.5% 24.8% * -- -- 44.8% 11.7% *West Virginia 22.8% 69.8% 51.5% 33.1% -- -- 53.4% 15.7% *
East South Central:Alabama 19.2% 54.8% 23.7% * 38.5% -- -- 36.3% 14.2%Kentucky 22.1% 63.5% 40.9% 19.4% * -- -- 40.1% 17.9%Mississippi 29.6% 57.0% 64.9% 28.9% * -- -- 53.9% 24.1%Tennessee 15.1% 49.5% 50.4% 42.4% -- -- 48.8% 8.2%
West South Central:Arkansas 15.3% 42.9% 38.4% 19.1% * -- -- 34.7% 11.4%Louisiana 17.1% 68.6% 48.6% 35.4% * -- -- 59.4% 6.3% *Oklahoma 21.9% 61.6% 46.5% 31.2% -- -- 49.4% 13.2%Texas 20.8% 55.0% 46.0% 41.3% -- -- 50.2% 13.2%
Mountain:Arizona 19.8% 47.6% 52.2% 32.1% * -- -- 52.1% 12.7% *Colorado 20.9% 47.5% 54.4% 29.5% -- -- 43.0% 14.1%Idaho 48.3% 68.1% 61.5% 49.5% -- -- 62.2% 43.0%Montana 44.9% 73.2% 70.3% 65.6% -- -- 77.5% 30.2%Nevada 28.6% 60.5% 58.6% 67.3% -- -- 55.0% 22.7%New Mexico 17.3% 54.8% 67.2% 32.5% -- -- 49.7% 10.0%Utah 17.8% 59.8% 62.2% 29.7% -- -- 52.0% 10.4% *Wyoming 36.4% 76.1% 73.8% 41.2% -- -- 66.9% 19.8%
Pacific:Alaska 27.2% 53.1% 61.7% 42.2% -- -- 53.8% 19.6%California 30.8% 74.1% 60.3% 46.2% -- -- 62.5% 20.9%Hawaii 45.5% 90.3% 83.2% 46.2% -- -- 68.2% 34.5%Oregon 35.9% 76.8% 64.6% 57.4% -- -- 65.2% 25.8%Washington 37.3% 71.3% 59.8% 43.4% -- -- 55.3% 29.6%
Source: Agency for Healthcare Research and Quality, Center for Financing, Access and Cost Trends. 2008 Medical Expenditure PanelSurvey-Insurance Component.Note: Definitions and descriptions of the methods used for this survey can be found in the Technical Appendix.* Figure does not meet standard of reliability or precision.-- Data suppressed due to high standard errors or no reported values in cell.
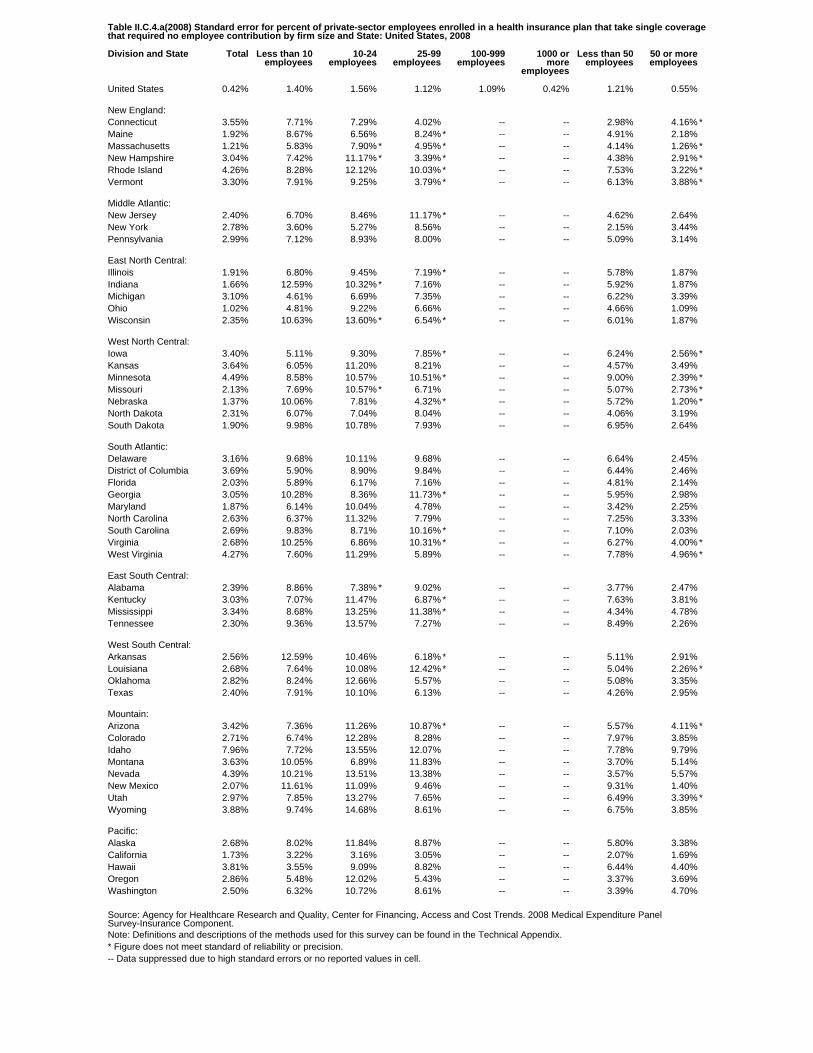
Table II.C.4.a(2008) Standard error for percent of private-sector employees enrolled in a health insurance plan that take single coveragethat required no employee contribution by firm size and State: United States, 2008
Division and State Total Less than 10employees
10-24employees
25-99employees
100-999employees
1000 ormore
employees
Less than 50employees
50 or moreemployees
United States 0.42% 1.40% 1.56% 1.12% 1.09% 0.42% 1.21% 0.55%
New England:Connecticut 3.55% 7.71% 7.29% 4.02% -- -- 2.98% 4.16% *Maine 1.92% 8.67% 6.56% 8.24% * -- -- 4.91% 2.18%Massachusetts 1.21% 5.83% 7.90% * 4.95% * -- -- 4.14% 1.26% *New Hampshire 3.04% 7.42% 11.17% * 3.39% * -- -- 4.38% 2.91% *Rhode Island 4.26% 8.28% 12.12% 10.03% * -- -- 7.53% 3.22% *Vermont 3.30% 7.91% 9.25% 3.79% * -- -- 6.13% 3.88% *
Middle Atlantic:New Jersey 2.40% 6.70% 8.46% 11.17% * -- -- 4.62% 2.64%New York 2.78% 3.60% 5.27% 8.56% -- -- 2.15% 3.44%Pennsylvania 2.99% 7.12% 8.93% 8.00% -- -- 5.09% 3.14%
East North Central:Illinois 1.91% 6.80% 9.45% 7.19% * -- -- 5.78% 1.87%Indiana 1.66% 12.59% 10.32% * 7.16% -- -- 5.92% 1.87%Michigan 3.10% 4.61% 6.69% 7.35% -- -- 6.22% 3.39%Ohio 1.02% 4.81% 9.22% 6.66% -- -- 4.66% 1.09%Wisconsin 2.35% 10.63% 13.60% * 6.54% * -- -- 6.01% 1.87%
West North Central:Iowa 3.40% 5.11% 9.30% 7.85% * -- -- 6.24% 2.56% *Kansas 3.64% 6.05% 11.20% 8.21% -- -- 4.57% 3.49%Minnesota 4.49% 8.58% 10.57% 10.51% * -- -- 9.00% 2.39% *Missouri 2.13% 7.69% 10.57% * 6.71% -- -- 5.07% 2.73% *Nebraska 1.37% 10.06% 7.81% 4.32% * -- -- 5.72% 1.20% *North Dakota 2.31% 6.07% 7.04% 8.04% -- -- 4.06% 3.19%South Dakota 1.90% 9.98% 10.78% 7.93% -- -- 6.95% 2.64%
South Atlantic:Delaware 3.16% 9.68% 10.11% 9.68% -- -- 6.64% 2.45%District of Columbia 3.69% 5.90% 8.90% 9.84% -- -- 6.44% 2.46%Florida 2.03% 5.89% 6.17% 7.16% -- -- 4.81% 2.14%Georgia 3.05% 10.28% 8.36% 11.73% * -- -- 5.95% 2.98%Maryland 1.87% 6.14% 10.04% 4.78% -- -- 3.42% 2.25%North Carolina 2.63% 6.37% 11.32% 7.79% -- -- 7.25% 3.33%South Carolina 2.69% 9.83% 8.71% 10.16% * -- -- 7.10% 2.03%Virginia 2.68% 10.25% 6.86% 10.31% * -- -- 6.27% 4.00% *West Virginia 4.27% 7.60% 11.29% 5.89% -- -- 7.78% 4.96% *
East South Central:Alabama 2.39% 8.86% 7.38% * 9.02% -- -- 3.77% 2.47%Kentucky 3.03% 7.07% 11.47% 6.87% * -- -- 7.63% 3.81%Mississippi 3.34% 8.68% 13.25% 11.38% * -- -- 4.34% 4.78%Tennessee 2.30% 9.36% 13.57% 7.27% -- -- 8.49% 2.26%
West South Central:Arkansas 2.56% 12.59% 10.46% 6.18% * -- -- 5.11% 2.91%Louisiana 2.68% 7.64% 10.08% 12.42% * -- -- 5.04% 2.26% *Oklahoma 2.82% 8.24% 12.66% 5.57% -- -- 5.08% 3.35%Texas 2.40% 7.91% 10.10% 6.13% -- -- 4.26% 2.95%
Mountain:Arizona 3.42% 7.36% 11.26% 10.87% * -- -- 5.57% 4.11% *Colorado 2.71% 6.74% 12.28% 8.28% -- -- 7.97% 3.85%Idaho 7.96% 7.72% 13.55% 12.07% -- -- 7.78% 9.79%Montana 3.63% 10.05% 6.89% 11.83% -- -- 3.70% 5.14%Nevada 4.39% 10.21% 13.51% 13.38% -- -- 3.57% 5.57%New Mexico 2.07% 11.61% 11.09% 9.46% -- -- 9.31% 1.40%Utah 2.97% 7.85% 13.27% 7.65% -- -- 6.49% 3.39% *Wyoming 3.88% 9.74% 14.68% 8.61% -- -- 6.75% 3.85%
Pacific:Alaska 2.68% 8.02% 11.84% 8.87% -- -- 5.80% 3.38%California 1.73% 3.22% 3.16% 3.05% -- -- 2.07% 1.69%Hawaii 3.81% 3.55% 9.09% 8.82% -- -- 6.44% 4.40%Oregon 2.86% 5.48% 12.02% 5.43% -- -- 3.37% 3.69%Washington 2.50% 6.32% 10.72% 8.61% -- -- 3.39% 4.70%
Source: Agency for Healthcare Research and Quality, Center for Financing, Access and Cost Trends. 2008 Medical Expenditure PanelSurvey-Insurance Component.Note: Definitions and descriptions of the methods used for this survey can be found in the Technical Appendix.* Figure does not meet standard of reliability or precision.-- Data suppressed due to high standard errors or no reported values in cell.
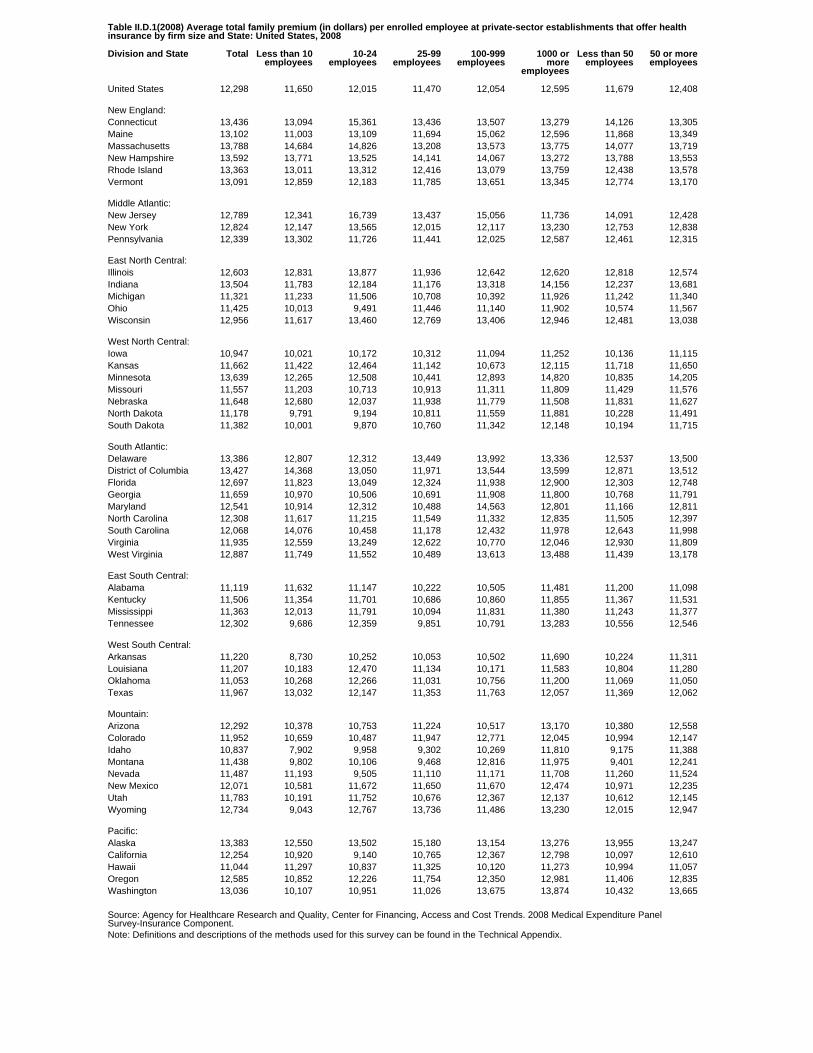
Table II.D.1(2008) Average total family premium (in dollars) per enrolled employee at private-sector establishments that offer healthinsurance by firm size and State: United States, 2008
Division and State Total Less than 10employees
10-24employees
25-99employees
100-999employees
1000 ormore
employees
Less than 50employees
50 or moreemployees
United States 12,298 11,650 12,015 11,470 12,054 12,595 11,679 12,408
New England:Connecticut 13,436 13,094 15,361 13,436 13,507 13,279 14,126 13,305Maine 13,102 11,003 13,109 11,694 15,062 12,596 11,868 13,349Massachusetts 13,788 14,684 14,826 13,208 13,573 13,775 14,077 13,719New Hampshire 13,592 13,771 13,525 14,141 14,067 13,272 13,788 13,553Rhode Island 13,363 13,011 13,312 12,416 13,079 13,759 12,438 13,578Vermont 13,091 12,859 12,183 11,785 13,651 13,345 12,774 13,170
Middle Atlantic:New Jersey 12,789 12,341 16,739 13,437 15,056 11,736 14,091 12,428New York 12,824 12,147 13,565 12,015 12,117 13,230 12,753 12,838Pennsylvania 12,339 13,302 11,726 11,441 12,025 12,587 12,461 12,315
East North Central:Illinois 12,603 12,831 13,877 11,936 12,642 12,620 12,818 12,574Indiana 13,504 11,783 12,184 11,176 13,318 14,156 12,237 13,681Michigan 11,321 11,233 11,506 10,708 10,392 11,926 11,242 11,340Ohio 11,425 10,013 9,491 11,446 11,140 11,902 10,574 11,567Wisconsin 12,956 11,617 13,460 12,769 13,406 12,946 12,481 13,038
West North Central:Iowa 10,947 10,021 10,172 10,312 11,094 11,252 10,136 11,115Kansas 11,662 11,422 12,464 11,142 10,673 12,115 11,718 11,650Minnesota 13,639 12,265 12,508 10,441 12,893 14,820 10,835 14,205Missouri 11,557 11,203 10,713 10,913 11,311 11,809 11,429 11,576Nebraska 11,648 12,680 12,037 11,938 11,779 11,508 11,831 11,627North Dakota 11,178 9,791 9,194 10,811 11,559 11,881 10,228 11,491South Dakota 11,382 10,001 9,870 10,760 11,342 12,148 10,194 11,715
South Atlantic:Delaware 13,386 12,807 12,312 13,449 13,992 13,336 12,537 13,500District of Columbia 13,427 14,368 13,050 11,971 13,544 13,599 12,871 13,512Florida 12,697 11,823 13,049 12,324 11,938 12,900 12,303 12,748Georgia 11,659 10,970 10,506 10,691 11,908 11,800 10,768 11,791Maryland 12,541 10,914 12,312 10,488 14,563 12,801 11,166 12,811North Carolina 12,308 11,617 11,215 11,549 11,332 12,835 11,505 12,397South Carolina 12,068 14,076 10,458 11,178 12,432 11,978 12,643 11,998Virginia 11,935 12,559 13,249 12,622 10,770 12,046 12,930 11,809West Virginia 12,887 11,749 11,552 10,489 13,613 13,488 11,439 13,178
East South Central:Alabama 11,119 11,632 11,147 10,222 10,505 11,481 11,200 11,098Kentucky 11,506 11,354 11,701 10,686 10,860 11,855 11,367 11,531Mississippi 11,363 12,013 11,791 10,094 11,831 11,380 11,243 11,377Tennessee 12,302 9,686 12,359 9,851 10,791 13,283 10,556 12,546
West South Central:Arkansas 11,220 8,730 10,252 10,053 10,502 11,690 10,224 11,311Louisiana 11,207 10,183 12,470 11,134 10,171 11,583 10,804 11,280Oklahoma 11,053 10,268 12,266 11,031 10,756 11,200 11,069 11,050Texas 11,967 13,032 12,147 11,353 11,763 12,057 11,369 12,062
Mountain:Arizona 12,292 10,378 10,753 11,224 10,517 13,170 10,380 12,558Colorado 11,952 10,659 10,487 11,947 12,771 12,045 10,994 12,147Idaho 10,837 7,902 9,958 9,302 10,269 11,810 9,175 11,388Montana 11,438 9,802 10,106 9,468 12,816 11,975 9,401 12,241Nevada 11,487 11,193 9,505 11,110 11,171 11,708 11,260 11,524New Mexico 12,071 10,581 11,672 11,650 11,670 12,474 10,971 12,235Utah 11,783 10,191 11,752 10,676 12,367 12,137 10,612 12,145Wyoming 12,734 9,043 12,767 13,736 11,486 13,230 12,015 12,947
Pacific:Alaska 13,383 12,550 13,502 15,180 13,154 13,276 13,955 13,247California 12,254 10,920 9,140 10,765 12,367 12,798 10,097 12,610Hawaii 11,044 11,297 10,837 11,325 10,120 11,273 10,994 11,057Oregon 12,585 10,852 12,226 11,754 12,350 12,981 11,406 12,835Washington 13,036 10,107 10,951 11,026 13,675 13,874 10,432 13,665
Source: Agency for Healthcare Research and Quality, Center for Financing, Access and Cost Trends. 2008 Medical Expenditure PanelSurvey-Insurance Component.Note: Definitions and descriptions of the methods used for this survey can be found in the Technical Appendix.
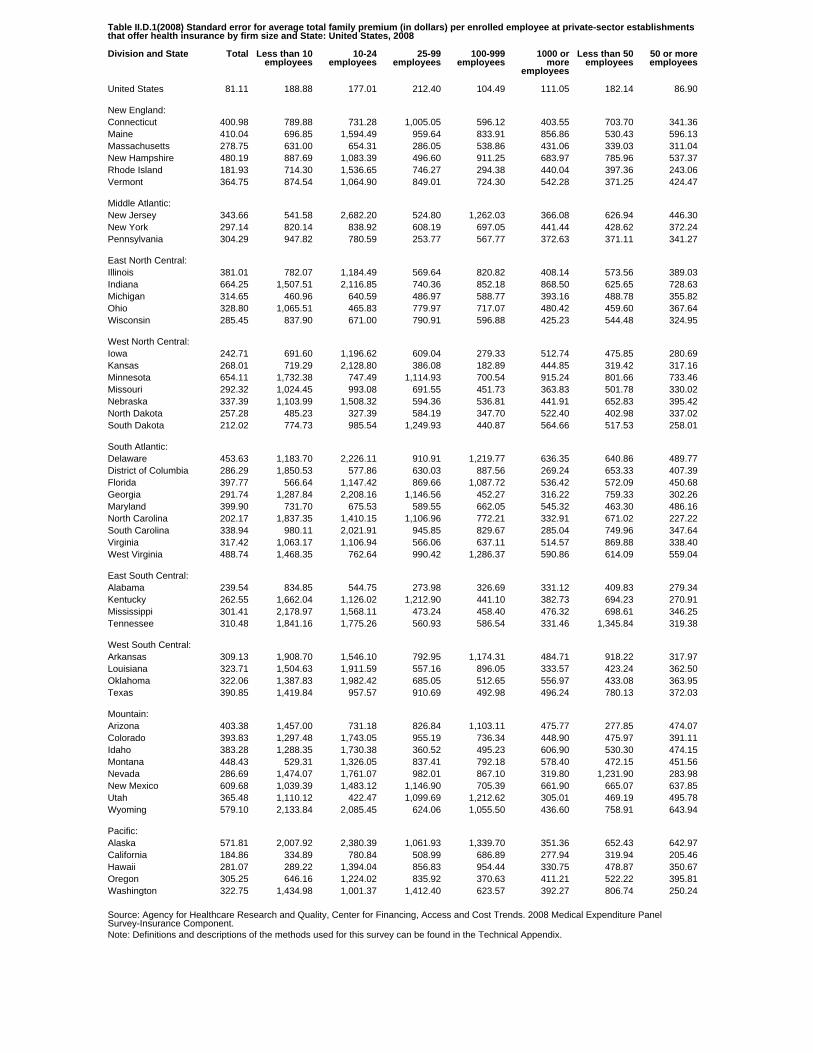
Table II.D.1(2008) Standard error for average total family premium (in dollars) per enrolled employee at private-sector establishmentsthat offer health insurance by firm size and State: United States, 2008
Division and State Total Less than 10employees
10-24employees
25-99employees
100-999employees
1000 ormore
employees
Less than 50employees
50 or moreemployees
United States 81.11 188.88 177.01 212.40 104.49 111.05 182.14 86.90
New England:Connecticut 400.98 789.88 731.28 1,005.05 596.12 403.55 703.70 341.36Maine 410.04 696.85 1,594.49 959.64 833.91 856.86 530.43 596.13Massachusetts 278.75 631.00 654.31 286.05 538.86 431.06 339.03 311.04New Hampshire 480.19 887.69 1,083.39 496.60 911.25 683.97 785.96 537.37Rhode Island 181.93 714.30 1,536.65 746.27 294.38 440.04 397.36 243.06Vermont 364.75 874.54 1,064.90 849.01 724.30 542.28 371.25 424.47
Middle Atlantic:New Jersey 343.66 541.58 2,682.20 524.80 1,262.03 366.08 626.94 446.30New York 297.14 820.14 838.92 608.19 697.05 441.44 428.62 372.24Pennsylvania 304.29 947.82 780.59 253.77 567.77 372.63 371.11 341.27
East North Central:Illinois 381.01 782.07 1,184.49 569.64 820.82 408.14 573.56 389.03Indiana 664.25 1,507.51 2,116.85 740.36 852.18 868.50 625.65 728.63Michigan 314.65 460.96 640.59 486.97 588.77 393.16 488.78 355.82Ohio 328.80 1,065.51 465.83 779.97 717.07 480.42 459.60 367.64Wisconsin 285.45 837.90 671.00 790.91 596.88 425.23 544.48 324.95
West North Central:Iowa 242.71 691.60 1,196.62 609.04 279.33 512.74 475.85 280.69Kansas 268.01 719.29 2,128.80 386.08 182.89 444.85 319.42 317.16Minnesota 654.11 1,732.38 747.49 1,114.93 700.54 915.24 801.66 733.46Missouri 292.32 1,024.45 993.08 691.55 451.73 363.83 501.78 330.02Nebraska 337.39 1,103.99 1,508.32 594.36 536.81 441.91 652.83 395.42North Dakota 257.28 485.23 327.39 584.19 347.70 522.40 402.98 337.02South Dakota 212.02 774.73 985.54 1,249.93 440.87 564.66 517.53 258.01
South Atlantic:Delaware 453.63 1,183.70 2,226.11 910.91 1,219.77 636.35 640.86 489.77District of Columbia 286.29 1,850.53 577.86 630.03 887.56 269.24 653.33 407.39Florida 397.77 566.64 1,147.42 869.66 1,087.72 536.42 572.09 450.68Georgia 291.74 1,287.84 2,208.16 1,146.56 452.27 316.22 759.33 302.26Maryland 399.90 731.70 675.53 589.55 662.05 545.32 463.30 486.16North Carolina 202.17 1,837.35 1,410.15 1,106.96 772.21 332.91 671.02 227.22South Carolina 338.94 980.11 2,021.91 945.85 829.67 285.04 749.96 347.64Virginia 317.42 1,063.17 1,106.94 566.06 637.11 514.57 869.88 338.40West Virginia 488.74 1,468.35 762.64 990.42 1,286.37 590.86 614.09 559.04
East South Central:Alabama 239.54 834.85 544.75 273.98 326.69 331.12 409.83 279.34Kentucky 262.55 1,662.04 1,126.02 1,212.90 441.10 382.73 694.23 270.91Mississippi 301.41 2,178.97 1,568.11 473.24 458.40 476.32 698.61 346.25Tennessee 310.48 1,841.16 1,775.26 560.93 586.54 331.46 1,345.84 319.38
West South Central:Arkansas 309.13 1,908.70 1,546.10 792.95 1,174.31 484.71 918.22 317.97Louisiana 323.71 1,504.63 1,911.59 557.16 896.05 333.57 423.24 362.50Oklahoma 322.06 1,387.83 1,982.42 685.05 512.65 556.97 433.08 363.95Texas 390.85 1,419.84 957.57 910.69 492.98 496.24 780.13 372.03
Mountain:Arizona 403.38 1,457.00 731.18 826.84 1,103.11 475.77 277.85 474.07Colorado 393.83 1,297.48 1,743.05 955.19 736.34 448.90 475.97 391.11Idaho 383.28 1,288.35 1,730.38 360.52 495.23 606.90 530.30 474.15Montana 448.43 529.31 1,326.05 837.41 792.18 578.40 472.15 451.56Nevada 286.69 1,474.07 1,761.07 982.01 867.10 319.80 1,231.90 283.98New Mexico 609.68 1,039.39 1,483.12 1,146.90 705.39 661.90 665.07 637.85Utah 365.48 1,110.12 422.47 1,099.69 1,212.62 305.01 469.19 495.78Wyoming 579.10 2,133.84 2,085.45 624.06 1,055.50 436.60 758.91 643.94
Pacific:Alaska 571.81 2,007.92 2,380.39 1,061.93 1,339.70 351.36 652.43 642.97California 184.86 334.89 780.84 508.99 686.89 277.94 319.94 205.46Hawaii 281.07 289.22 1,394.04 856.83 954.44 330.75 478.87 350.67Oregon 305.25 646.16 1,224.02 835.92 370.63 411.21 522.22 395.81Washington 322.75 1,434.98 1,001.37 1,412.40 623.57 392.27 806.74 250.24
Source: Agency for Healthcare Research and Quality, Center for Financing, Access and Cost Trends. 2008 Medical Expenditure PanelSurvey-Insurance Component.Note: Definitions and descriptions of the methods used for this survey can be found in the Technical Appendix.
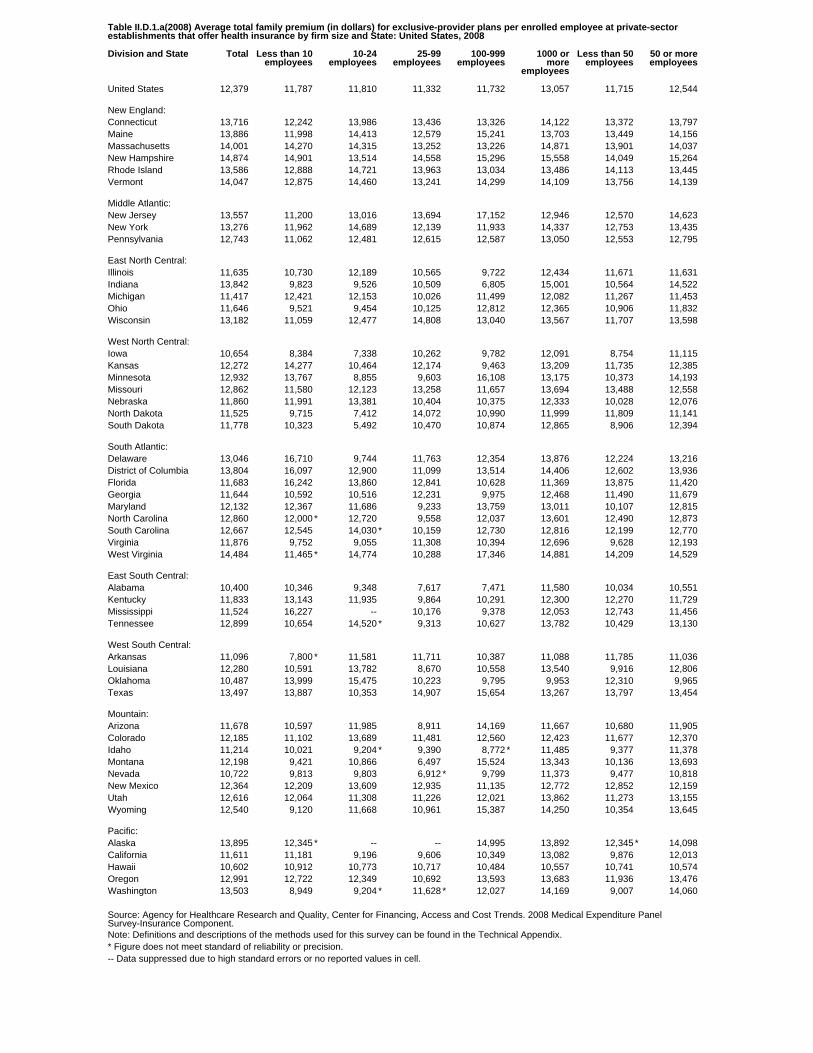
Table II.D.1.a(2008) Average total family premium (in dollars) for exclusive-provider plans per enrolled employee at private-sectorestablishments that offer health insurance by firm size and State: United States, 2008
Division and State Total Less than 10employees
10-24employees
25-99employees
100-999employees
1000 ormore
employees
Less than 50employees
50 or moreemployees
United States 12,379 11,787 11,810 11,332 11,732 13,057 11,715 12,544
New England:Connecticut 13,716 12,242 13,986 13,436 13,326 14,122 13,372 13,797Maine 13,886 11,998 14,413 12,579 15,241 13,703 13,449 14,156Massachusetts 14,001 14,270 14,315 13,252 13,226 14,871 13,901 14,037New Hampshire 14,874 14,901 13,514 14,558 15,296 15,558 14,049 15,264Rhode Island 13,586 12,888 14,721 13,963 13,034 13,486 14,113 13,445Vermont 14,047 12,875 14,460 13,241 14,299 14,109 13,756 14,139
Middle Atlantic:New Jersey 13,557 11,200 13,016 13,694 17,152 12,946 12,570 14,623New York 13,276 11,962 14,689 12,139 11,933 14,337 12,753 13,435Pennsylvania 12,743 11,062 12,481 12,615 12,587 13,050 12,553 12,795
East North Central:Illinois 11,635 10,730 12,189 10,565 9,722 12,434 11,671 11,631Indiana 13,842 9,823 9,526 10,509 6,805 15,001 10,564 14,522Michigan 11,417 12,421 12,153 10,026 11,499 12,082 11,267 11,453Ohio 11,646 9,521 9,454 10,125 12,812 12,365 10,906 11,832Wisconsin 13,182 11,059 12,477 14,808 13,040 13,567 11,707 13,598
West North Central:Iowa 10,654 8,384 7,338 10,262 9,782 12,091 8,754 11,115Kansas 12,272 14,277 10,464 12,174 9,463 13,209 11,735 12,385Minnesota 12,932 13,767 8,855 9,603 16,108 13,175 10,373 14,193Missouri 12,862 11,580 12,123 13,258 11,657 13,694 13,488 12,558Nebraska 11,860 11,991 13,381 10,404 10,375 12,333 10,028 12,076North Dakota 11,525 9,715 7,412 14,072 10,990 11,999 11,809 11,141South Dakota 11,778 10,323 5,492 10,470 10,874 12,865 8,906 12,394
South Atlantic:Delaware 13,046 16,710 9,744 11,763 12,354 13,876 12,224 13,216District of Columbia 13,804 16,097 12,900 11,099 13,514 14,406 12,602 13,936Florida 11,683 16,242 13,860 12,841 10,628 11,369 13,875 11,420Georgia 11,644 10,592 10,516 12,231 9,975 12,468 11,490 11,679Maryland 12,132 12,367 11,686 9,233 13,759 13,011 10,107 12,815North Carolina 12,860 12,000 * 12,720 9,558 12,037 13,601 12,490 12,873South Carolina 12,667 12,545 14,030 * 10,159 12,730 12,816 12,199 12,770Virginia 11,876 9,752 9,055 11,308 10,394 12,696 9,628 12,193West Virginia 14,484 11,465 * 14,774 10,288 17,346 14,881 14,209 14,529
East South Central:Alabama 10,400 10,346 9,348 7,617 7,471 11,580 10,034 10,551Kentucky 11,833 13,143 11,935 9,864 10,291 12,300 12,270 11,729Mississippi 11,524 16,227 -- 10,176 9,378 12,053 12,743 11,456Tennessee 12,899 10,654 14,520 * 9,313 10,627 13,782 10,429 13,130
West South Central:Arkansas 11,096 7,800 * 11,581 11,711 10,387 11,088 11,785 11,036Louisiana 12,280 10,591 13,782 8,670 10,558 13,540 9,916 12,806Oklahoma 10,487 13,999 15,475 10,223 9,795 9,953 12,310 9,965Texas 13,497 13,887 10,353 14,907 15,654 13,267 13,797 13,454
Mountain:Arizona 11,678 10,597 11,985 8,911 14,169 11,667 10,680 11,905Colorado 12,185 11,102 13,689 11,481 12,560 12,423 11,677 12,370Idaho 11,214 10,021 9,204 * 9,390 8,772 * 11,485 9,377 11,378Montana 12,198 9,421 10,866 6,497 15,524 13,343 10,136 13,693Nevada 10,722 9,813 9,803 6,912 * 9,799 11,373 9,477 10,818New Mexico 12,364 12,209 13,609 12,935 11,135 12,772 12,852 12,159Utah 12,616 12,064 11,308 11,226 12,021 13,862 11,273 13,155Wyoming 12,540 9,120 11,668 10,961 15,387 14,250 10,354 13,645
Pacific:Alaska 13,895 12,345 * -- -- 14,995 13,892 12,345 * 14,098California 11,611 11,181 9,196 9,606 10,349 13,082 9,876 12,013Hawaii 10,602 10,912 10,773 10,717 10,484 10,557 10,741 10,574Oregon 12,991 12,722 12,349 10,692 13,593 13,683 11,936 13,476Washington 13,503 8,949 9,204 * 11,628 * 12,027 14,169 9,007 14,060
Source: Agency for Healthcare Research and Quality, Center for Financing, Access and Cost Trends. 2008 Medical Expenditure PanelSurvey-Insurance Component.Note: Definitions and descriptions of the methods used for this survey can be found in the Technical Appendix.* Figure does not meet standard of reliability or precision.-- Data suppressed due to high standard errors or no reported values in cell.
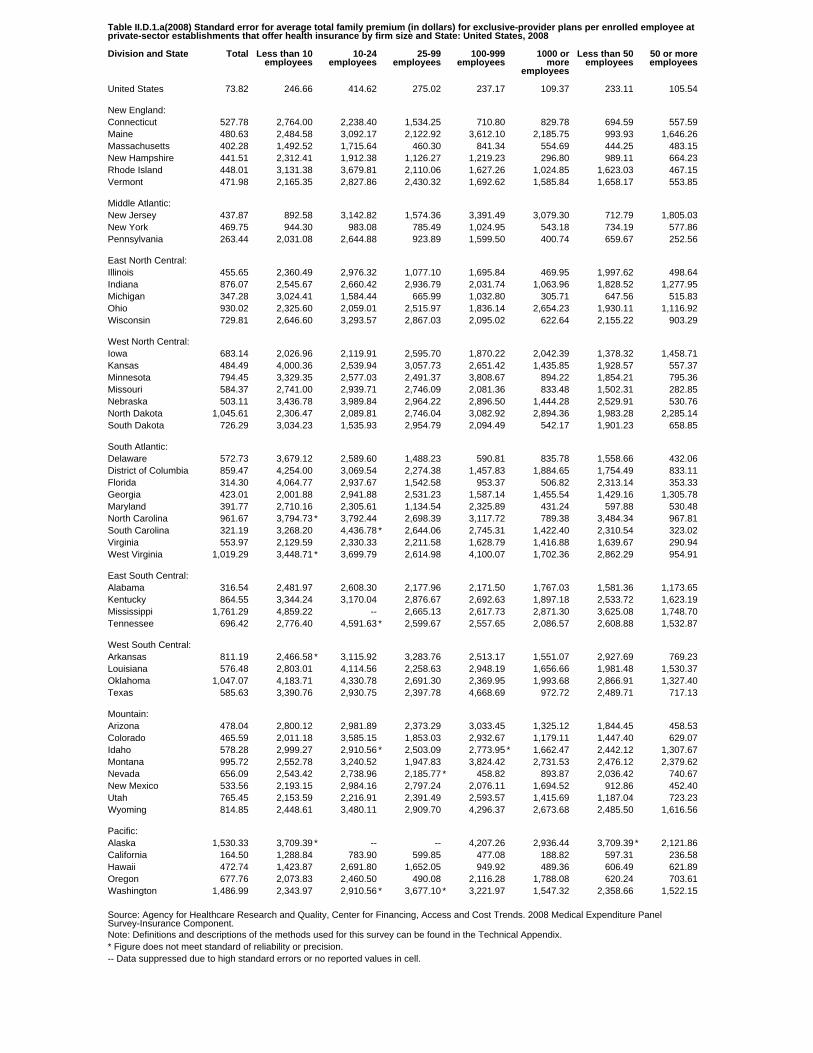
Table II.D.1.a(2008) Standard error for average total family premium (in dollars) for exclusive-provider plans per enrolled employee atprivate-sector establishments that offer health insurance by firm size and State: United States, 2008
Division and State Total Less than 10employees
10-24employees
25-99employees
100-999employees
1000 ormore
employees
Less than 50employees
50 or moreemployees
United States 73.82 246.66 414.62 275.02 237.17 109.37 233.11 105.54
New England:Connecticut 527.78 2,764.00 2,238.40 1,534.25 710.80 829.78 694.59 557.59Maine 480.63 2,484.58 3,092.17 2,122.92 3,612.10 2,185.75 993.93 1,646.26Massachusetts 402.28 1,492.52 1,715.64 460.30 841.34 554.69 444.25 483.15New Hampshire 441.51 2,312.41 1,912.38 1,126.27 1,219.23 296.80 989.11 664.23Rhode Island 448.01 3,131.38 3,679.81 2,110.06 1,627.26 1,024.85 1,623.03 467.15Vermont 471.98 2,165.35 2,827.86 2,430.32 1,692.62 1,585.84 1,658.17 553.85
Middle Atlantic:New Jersey 437.87 892.58 3,142.82 1,574.36 3,391.49 3,079.30 712.79 1,805.03New York 469.75 944.30 983.08 785.49 1,024.95 543.18 734.19 577.86Pennsylvania 263.44 2,031.08 2,644.88 923.89 1,599.50 400.74 659.67 252.56
East North Central:Illinois 455.65 2,360.49 2,976.32 1,077.10 1,695.84 469.95 1,997.62 498.64Indiana 876.07 2,545.67 2,660.42 2,936.79 2,031.74 1,063.96 1,828.52 1,277.95Michigan 347.28 3,024.41 1,584.44 665.99 1,032.80 305.71 647.56 515.83Ohio 930.02 2,325.60 2,059.01 2,515.97 1,836.14 2,654.23 1,930.11 1,116.92Wisconsin 729.81 2,646.60 3,293.57 2,867.03 2,095.02 622.64 2,155.22 903.29
West North Central:Iowa 683.14 2,026.96 2,119.91 2,595.70 1,870.22 2,042.39 1,378.32 1,458.71Kansas 484.49 4,000.36 2,539.94 3,057.73 2,651.42 1,435.85 1,928.57 557.37Minnesota 794.45 3,329.35 2,577.03 2,491.37 3,808.67 894.22 1,854.21 795.36Missouri 584.37 2,741.00 2,939.71 2,746.09 2,081.36 833.48 1,502.31 282.85Nebraska 503.11 3,436.78 3,989.84 2,964.22 2,896.50 1,444.28 2,529.91 530.76North Dakota 1,045.61 2,306.47 2,089.81 2,746.04 3,082.92 2,894.36 1,983.28 2,285.14South Dakota 726.29 3,034.23 1,535.93 2,954.79 2,094.49 542.17 1,901.23 658.85
South Atlantic:Delaware 572.73 3,679.12 2,589.60 1,488.23 590.81 835.78 1,558.66 432.06District of Columbia 859.47 4,254.00 3,069.54 2,274.38 1,457.83 1,884.65 1,754.49 833.11Florida 314.30 4,064.77 2,937.67 1,542.58 953.37 506.82 2,313.14 353.33Georgia 423.01 2,001.88 2,941.88 2,531.23 1,587.14 1,455.54 1,429.16 1,305.78Maryland 391.77 2,710.16 2,305.61 1,134.54 2,325.89 431.24 597.88 530.48North Carolina 961.67 3,794.73 * 3,792.44 2,698.39 3,117.72 789.38 3,484.34 967.81South Carolina 321.19 3,268.20 4,436.78 * 2,644.06 2,745.31 1,422.40 2,310.54 323.02Virginia 553.97 2,129.59 2,330.33 2,211.58 1,628.79 1,416.88 1,639.67 290.94West Virginia 1,019.29 3,448.71 * 3,699.79 2,614.98 4,100.07 1,702.36 2,862.29 954.91
East South Central:Alabama 316.54 2,481.97 2,608.30 2,177.96 2,171.50 1,767.03 1,581.36 1,173.65Kentucky 864.55 3,344.24 3,170.04 2,876.67 2,692.63 1,897.18 2,533.72 1,623.19Mississippi 1,761.29 4,859.22 -- 2,665.13 2,617.73 2,871.30 3,625.08 1,748.70Tennessee 696.42 2,776.40 4,591.63 * 2,599.67 2,557.65 2,086.57 2,608.88 1,532.87
West South Central:Arkansas 811.19 2,466.58 * 3,115.92 3,283.76 2,513.17 1,551.07 2,927.69 769.23Louisiana 576.48 2,803.01 4,114.56 2,258.63 2,948.19 1,656.66 1,981.48 1,530.37Oklahoma 1,047.07 4,183.71 4,330.78 2,691.30 2,369.95 1,993.68 2,866.91 1,327.40Texas 585.63 3,390.76 2,930.75 2,397.78 4,668.69 972.72 2,489.71 717.13
Mountain:Arizona 478.04 2,800.12 2,981.89 2,373.29 3,033.45 1,325.12 1,844.45 458.53Colorado 465.59 2,011.18 3,585.15 1,853.03 2,932.67 1,179.11 1,447.40 629.07Idaho 578.28 2,999.27 2,910.56 * 2,503.09 2,773.95 * 1,662.47 2,442.12 1,307.67Montana 995.72 2,552.78 3,240.52 1,947.83 3,824.42 2,731.53 2,476.12 2,379.62Nevada 656.09 2,543.42 2,738.96 2,185.77 * 458.82 893.87 2,036.42 740.67New Mexico 533.56 2,193.15 2,984.16 2,797.24 2,076.11 1,694.52 912.86 452.40Utah 765.45 2,153.59 2,216.91 2,391.49 2,593.57 1,415.69 1,187.04 723.23Wyoming 814.85 2,448.61 3,480.11 2,909.70 4,296.37 2,673.68 2,485.50 1,616.56
Pacific:Alaska 1,530.33 3,709.39 * -- -- 4,207.26 2,936.44 3,709.39 * 2,121.86California 164.50 1,288.84 783.90 599.85 477.08 188.82 597.31 236.58Hawaii 472.74 1,423.87 2,691.80 1,652.05 949.92 489.36 606.49 621.89Oregon 677.76 2,073.83 2,460.50 490.08 2,116.28 1,788.08 620.24 703.61Washington 1,486.99 2,343.97 2,910.56 * 3,677.10 * 3,221.97 1,547.32 2,358.66 1,522.15
Source: Agency for Healthcare Research and Quality, Center for Financing, Access and Cost Trends. 2008 Medical Expenditure PanelSurvey-Insurance Component.Note: Definitions and descriptions of the methods used for this survey can be found in the Technical Appendix.* Figure does not meet standard of reliability or precision.-- Data suppressed due to high standard errors or no reported values in cell.
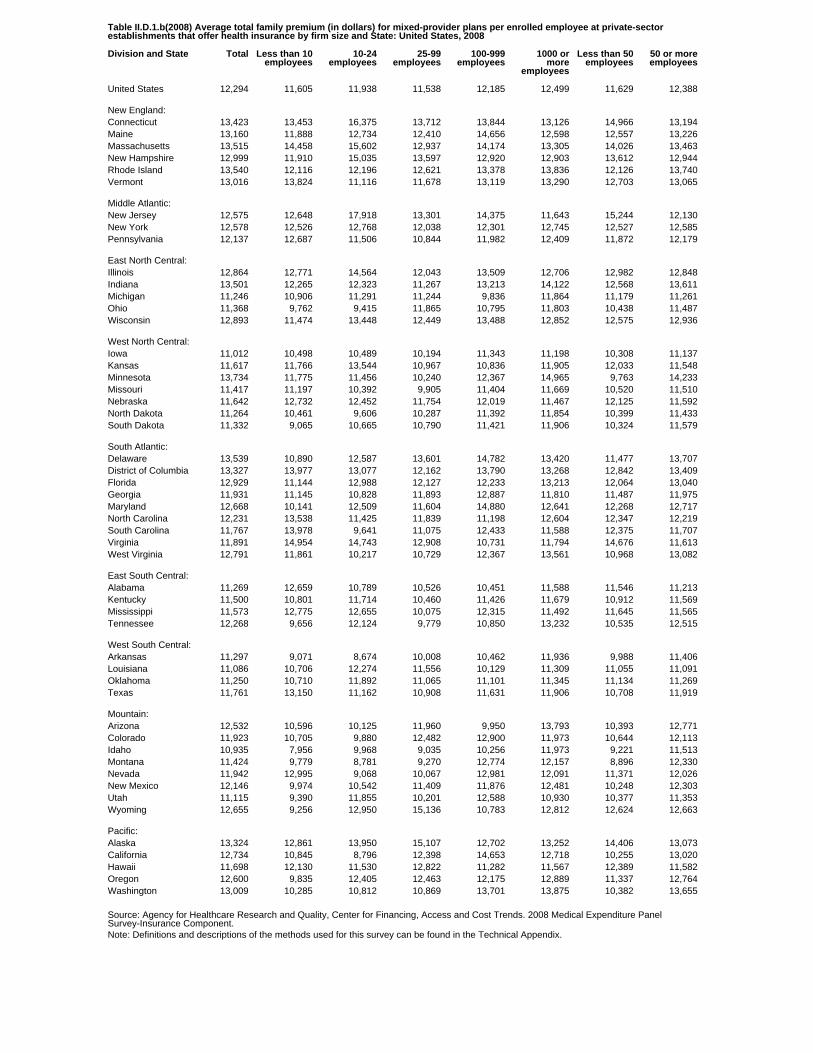
Table II.D.1.b(2008) Average total family premium (in dollars) for mixed-provider plans per enrolled employee at private-sectorestablishments that offer health insurance by firm size and State: United States, 2008
Division and State Total Less than 10employees
10-24employees
25-99employees
100-999employees
1000 ormore
employees
Less than 50employees
50 or moreemployees
United States 12,294 11,605 11,938 11,538 12,185 12,499 11,629 12,388
New England:Connecticut 13,423 13,453 16,375 13,712 13,844 13,126 14,966 13,194Maine 13,160 11,888 12,734 12,410 14,656 12,598 12,557 13,226Massachusetts 13,515 14,458 15,602 12,937 14,174 13,305 14,026 13,463New Hampshire 12,999 11,910 15,035 13,597 12,920 12,903 13,612 12,944Rhode Island 13,540 12,116 12,196 12,621 13,378 13,836 12,126 13,740Vermont 13,016 13,824 11,116 11,678 13,119 13,290 12,703 13,065
Middle Atlantic:New Jersey 12,575 12,648 17,918 13,301 14,375 11,643 15,244 12,130New York 12,578 12,526 12,768 12,038 12,301 12,745 12,527 12,585Pennsylvania 12,137 12,687 11,506 10,844 11,982 12,409 11,872 12,179
East North Central:Illinois 12,864 12,771 14,564 12,043 13,509 12,706 12,982 12,848Indiana 13,501 12,265 12,323 11,267 13,213 14,122 12,568 13,611Michigan 11,246 10,906 11,291 11,244 9,836 11,864 11,179 11,261Ohio 11,368 9,762 9,415 11,865 10,795 11,803 10,438 11,487Wisconsin 12,893 11,474 13,448 12,449 13,488 12,852 12,575 12,936
West North Central:Iowa 11,012 10,498 10,489 10,194 11,343 11,198 10,308 11,137Kansas 11,617 11,766 13,544 10,967 10,836 11,905 12,033 11,548Minnesota 13,734 11,775 11,456 10,240 12,367 14,965 9,763 14,233Missouri 11,417 11,197 10,392 9,905 11,404 11,669 10,520 11,510Nebraska 11,642 12,732 12,452 11,754 12,019 11,467 12,125 11,592North Dakota 11,264 10,461 9,606 10,287 11,392 11,854 10,399 11,433South Dakota 11,332 9,065 10,665 10,790 11,421 11,906 10,324 11,579
South Atlantic:Delaware 13,539 10,890 12,587 13,601 14,782 13,420 11,477 13,707District of Columbia 13,327 13,977 13,077 12,162 13,790 13,268 12,842 13,409Florida 12,929 11,144 12,988 12,127 12,233 13,213 12,064 13,040Georgia 11,931 11,145 10,828 11,893 12,887 11,810 11,487 11,975Maryland 12,668 10,141 12,509 11,604 14,880 12,641 12,268 12,717North Carolina 12,231 13,538 11,425 11,839 11,198 12,604 12,347 12,219South Carolina 11,767 13,978 9,641 11,075 12,433 11,588 12,375 11,707Virginia 11,891 14,954 14,743 12,908 10,731 11,794 14,676 11,613West Virginia 12,791 11,861 10,217 10,729 12,367 13,561 10,968 13,082
East South Central:Alabama 11,269 12,659 10,789 10,526 10,451 11,588 11,546 11,213Kentucky 11,500 10,801 11,714 10,460 11,426 11,679 10,912 11,569Mississippi 11,573 12,775 12,655 10,075 12,315 11,492 11,645 11,565Tennessee 12,268 9,656 12,124 9,779 10,850 13,232 10,535 12,515
West South Central:Arkansas 11,297 9,071 8,674 10,008 10,462 11,936 9,988 11,406Louisiana 11,086 10,706 12,274 11,556 10,129 11,309 11,055 11,091Oklahoma 11,250 10,710 11,892 11,065 11,101 11,345 11,134 11,269Texas 11,761 13,150 11,162 10,908 11,631 11,906 10,708 11,919
Mountain:Arizona 12,532 10,596 10,125 11,960 9,950 13,793 10,393 12,771Colorado 11,923 10,705 9,880 12,482 12,900 11,973 10,644 12,113Idaho 10,935 7,956 9,968 9,035 10,256 11,973 9,221 11,513Montana 11,424 9,779 8,781 9,270 12,774 12,157 8,896 12,330Nevada 11,942 12,995 9,068 10,067 12,981 12,091 11,371 12,026New Mexico 12,146 9,974 10,542 11,409 11,876 12,481 10,248 12,303Utah 11,115 9,390 11,855 10,201 12,588 10,930 10,377 11,353Wyoming 12,655 9,256 12,950 15,136 10,783 12,812 12,624 12,663
Pacific:Alaska 13,324 12,861 13,950 15,107 12,702 13,252 14,406 13,073California 12,734 10,845 8,796 12,398 14,653 12,718 10,255 13,020Hawaii 11,698 12,130 11,530 12,822 11,282 11,567 12,389 11,582Oregon 12,600 9,835 12,405 12,463 12,175 12,889 11,337 12,764Washington 13,009 10,285 10,812 10,869 13,701 13,875 10,382 13,655
Source: Agency for Healthcare Research and Quality, Center for Financing, Access and Cost Trends. 2008 Medical Expenditure PanelSurvey-Insurance Component.Note: Definitions and descriptions of the methods used for this survey can be found in the Technical Appendix.
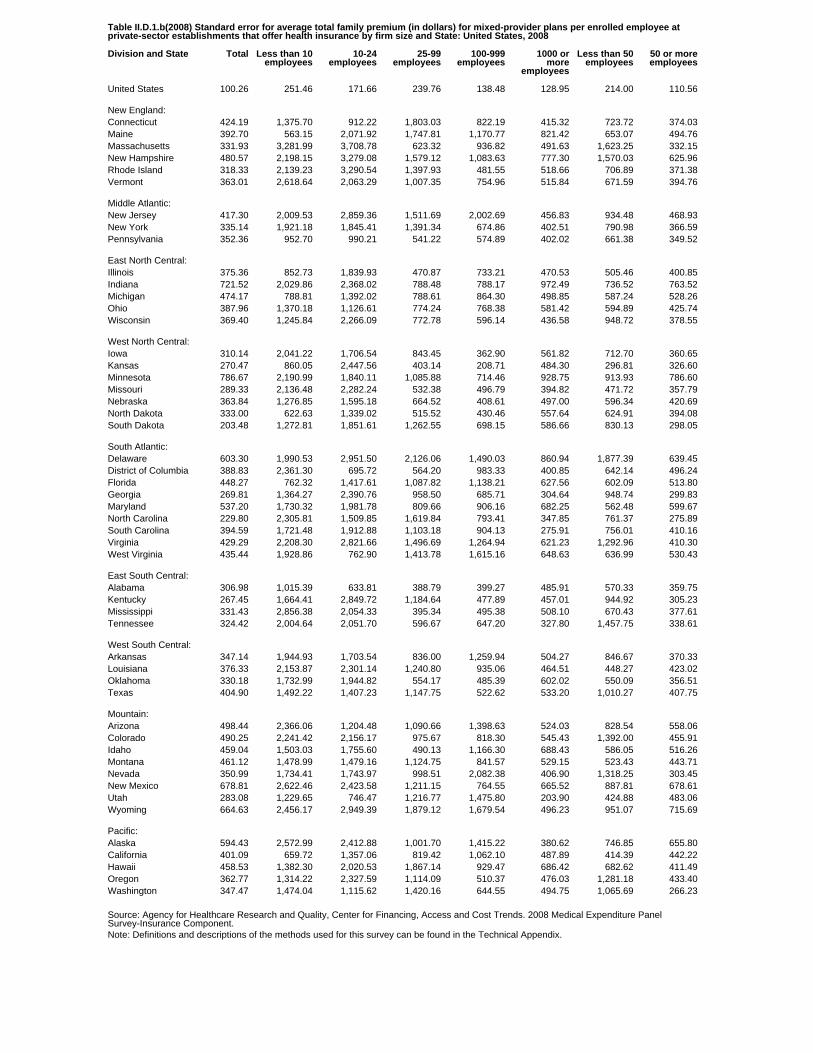
Table II.D.1.b(2008) Standard error for average total family premium (in dollars) for mixed-provider plans per enrolled employee atprivate-sector establishments that offer health insurance by firm size and State: United States, 2008
Division and State Total Less than 10employees
10-24employees
25-99employees
100-999employees
1000 ormore
employees
Less than 50employees
50 or moreemployees
United States 100.26 251.46 171.66 239.76 138.48 128.95 214.00 110.56
New England:Connecticut 424.19 1,375.70 912.22 1,803.03 822.19 415.32 723.72 374.03Maine 392.70 563.15 2,071.92 1,747.81 1,170.77 821.42 653.07 494.76Massachusetts 331.93 3,281.99 3,708.78 623.32 936.82 491.63 1,623.25 332.15New Hampshire 480.57 2,198.15 3,279.08 1,579.12 1,083.63 777.30 1,570.03 625.96Rhode Island 318.33 2,139.23 3,290.54 1,397.93 481.55 518.66 706.89 371.38Vermont 363.01 2,618.64 2,063.29 1,007.35 754.96 515.84 671.59 394.76
Middle Atlantic:New Jersey 417.30 2,009.53 2,859.36 1,511.69 2,002.69 456.83 934.48 468.93New York 335.14 1,921.18 1,845.41 1,391.34 674.86 402.51 790.98 366.59Pennsylvania 352.36 952.70 990.21 541.22 574.89 402.02 661.38 349.52
East North Central:Illinois 375.36 852.73 1,839.93 470.87 733.21 470.53 505.46 400.85Indiana 721.52 2,029.86 2,368.02 788.48 788.17 972.49 736.52 763.52Michigan 474.17 788.81 1,392.02 788.61 864.30 498.85 587.24 528.26Ohio 387.96 1,370.18 1,126.61 774.24 768.38 581.42 594.89 425.74Wisconsin 369.40 1,245.84 2,266.09 772.78 596.14 436.58 948.72 378.55
West North Central:Iowa 310.14 2,041.22 1,706.54 843.45 362.90 561.82 712.70 360.65Kansas 270.47 860.05 2,447.56 403.14 208.71 484.30 296.81 326.60Minnesota 786.67 2,190.99 1,840.11 1,085.88 714.46 928.75 913.93 786.60Missouri 289.33 2,136.48 2,282.24 532.38 496.79 394.82 471.72 357.79Nebraska 363.84 1,276.85 1,595.18 664.52 408.61 497.00 596.34 420.69North Dakota 333.00 622.63 1,339.02 515.52 430.46 557.64 624.91 394.08South Dakota 203.48 1,272.81 1,851.61 1,262.55 698.15 586.66 830.13 298.05
South Atlantic:Delaware 603.30 1,990.53 2,951.50 2,126.06 1,490.03 860.94 1,877.39 639.45District of Columbia 388.83 2,361.30 695.72 564.20 983.33 400.85 642.14 496.24Florida 448.27 762.32 1,417.61 1,087.82 1,138.21 627.56 602.09 513.80Georgia 269.81 1,364.27 2,390.76 958.50 685.71 304.64 948.74 299.83Maryland 537.20 1,730.32 1,981.78 809.66 906.16 682.25 562.48 599.67North Carolina 229.80 2,305.81 1,509.85 1,619.84 793.41 347.85 761.37 275.89South Carolina 394.59 1,721.48 1,912.88 1,103.18 904.13 275.91 756.01 410.16Virginia 429.29 2,208.30 2,821.66 1,496.69 1,264.94 621.23 1,292.96 410.30West Virginia 435.44 1,928.86 762.90 1,413.78 1,615.16 648.63 636.99 530.43
East South Central:Alabama 306.98 1,015.39 633.81 388.79 399.27 485.91 570.33 359.75Kentucky 267.45 1,664.41 2,849.72 1,184.64 477.89 457.01 944.92 305.23Mississippi 331.43 2,856.38 2,054.33 395.34 495.38 508.10 670.43 377.61Tennessee 324.42 2,004.64 2,051.70 596.67 647.20 327.80 1,457.75 338.61
West South Central:Arkansas 347.14 1,944.93 1,703.54 836.00 1,259.94 504.27 846.67 370.33Louisiana 376.33 2,153.87 2,301.14 1,240.80 935.06 464.51 448.27 423.02Oklahoma 330.18 1,732.99 1,944.82 554.17 485.39 602.02 550.09 356.51Texas 404.90 1,492.22 1,407.23 1,147.75 522.62 533.20 1,010.27 407.75
Mountain:Arizona 498.44 2,366.06 1,204.48 1,090.66 1,398.63 524.03 828.54 558.06Colorado 490.25 2,241.42 2,156.17 975.67 818.30 545.43 1,392.00 455.91Idaho 459.04 1,503.03 1,755.60 490.13 1,166.30 688.43 586.05 516.26Montana 461.12 1,478.99 1,479.16 1,124.75 841.57 529.15 523.43 443.71Nevada 350.99 1,734.41 1,743.97 998.51 2,082.38 406.90 1,318.25 303.45New Mexico 678.81 2,622.46 2,423.58 1,211.15 764.55 665.52 887.81 678.61Utah 283.08 1,229.65 746.47 1,216.77 1,475.80 203.90 424.88 483.06Wyoming 664.63 2,456.17 2,949.39 1,879.12 1,679.54 496.23 951.07 715.69
Pacific:Alaska 594.43 2,572.99 2,412.88 1,001.70 1,415.22 380.62 746.85 655.80California 401.09 659.72 1,357.06 819.42 1,062.10 487.89 414.39 442.22Hawaii 458.53 1,382.30 2,020.53 1,867.14 929.47 686.42 682.62 411.49Oregon 362.77 1,314.22 2,327.59 1,114.09 510.37 476.03 1,281.18 433.40Washington 347.47 1,474.04 1,115.62 1,420.16 644.55 494.75 1,065.69 266.23
Source: Agency for Healthcare Research and Quality, Center for Financing, Access and Cost Trends. 2008 Medical Expenditure PanelSurvey-Insurance Component.Note: Definitions and descriptions of the methods used for this survey can be found in the Technical Appendix.
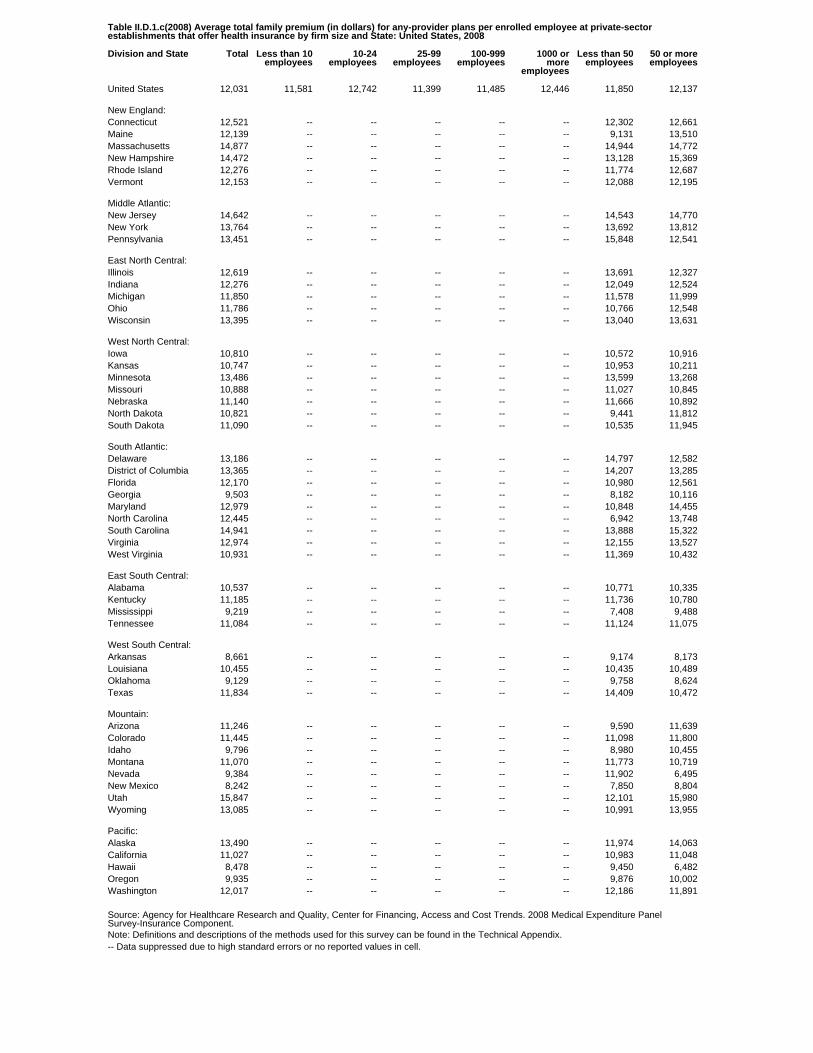
Table II.D.1.c(2008) Average total family premium (in dollars) for any-provider plans per enrolled employee at private-sectorestablishments that offer health insurance by firm size and State: United States, 2008
Division and State Total Less than 10employees
10-24employees
25-99employees
100-999employees
1000 ormore
employees
Less than 50employees
50 or moreemployees
United States 12,031 11,581 12,742 11,399 11,485 12,446 11,850 12,137
New England:Connecticut 12,521 -- -- -- -- -- 12,302 12,661Maine 12,139 -- -- -- -- -- 9,131 13,510Massachusetts 14,877 -- -- -- -- -- 14,944 14,772New Hampshire 14,472 -- -- -- -- -- 13,128 15,369Rhode Island 12,276 -- -- -- -- -- 11,774 12,687Vermont 12,153 -- -- -- -- -- 12,088 12,195
Middle Atlantic:New Jersey 14,642 -- -- -- -- -- 14,543 14,770New York 13,764 -- -- -- -- -- 13,692 13,812Pennsylvania 13,451 -- -- -- -- -- 15,848 12,541
East North Central:Illinois 12,619 -- -- -- -- -- 13,691 12,327Indiana 12,276 -- -- -- -- -- 12,049 12,524Michigan 11,850 -- -- -- -- -- 11,578 11,999Ohio 11,786 -- -- -- -- -- 10,766 12,548Wisconsin 13,395 -- -- -- -- -- 13,040 13,631
West North Central:Iowa 10,810 -- -- -- -- -- 10,572 10,916Kansas 10,747 -- -- -- -- -- 10,953 10,211Minnesota 13,486 -- -- -- -- -- 13,599 13,268Missouri 10,888 -- -- -- -- -- 11,027 10,845Nebraska 11,140 -- -- -- -- -- 11,666 10,892North Dakota 10,821 -- -- -- -- -- 9,441 11,812South Dakota 11,090 -- -- -- -- -- 10,535 11,945
South Atlantic:Delaware 13,186 -- -- -- -- -- 14,797 12,582District of Columbia 13,365 -- -- -- -- -- 14,207 13,285Florida 12,170 -- -- -- -- -- 10,980 12,561Georgia 9,503 -- -- -- -- -- 8,182 10,116Maryland 12,979 -- -- -- -- -- 10,848 14,455North Carolina 12,445 -- -- -- -- -- 6,942 13,748South Carolina 14,941 -- -- -- -- -- 13,888 15,322Virginia 12,974 -- -- -- -- -- 12,155 13,527West Virginia 10,931 -- -- -- -- -- 11,369 10,432
East South Central:Alabama 10,537 -- -- -- -- -- 10,771 10,335Kentucky 11,185 -- -- -- -- -- 11,736 10,780Mississippi 9,219 -- -- -- -- -- 7,408 9,488Tennessee 11,084 -- -- -- -- -- 11,124 11,075
West South Central:Arkansas 8,661 -- -- -- -- -- 9,174 8,173Louisiana 10,455 -- -- -- -- -- 10,435 10,489Oklahoma 9,129 -- -- -- -- -- 9,758 8,624Texas 11,834 -- -- -- -- -- 14,409 10,472
Mountain:Arizona 11,246 -- -- -- -- -- 9,590 11,639Colorado 11,445 -- -- -- -- -- 11,098 11,800Idaho 9,796 -- -- -- -- -- 8,980 10,455Montana 11,070 -- -- -- -- -- 11,773 10,719Nevada 9,384 -- -- -- -- -- 11,902 6,495New Mexico 8,242 -- -- -- -- -- 7,850 8,804Utah 15,847 -- -- -- -- -- 12,101 15,980Wyoming 13,085 -- -- -- -- -- 10,991 13,955
Pacific:Alaska 13,490 -- -- -- -- -- 11,974 14,063California 11,027 -- -- -- -- -- 10,983 11,048Hawaii 8,478 -- -- -- -- -- 9,450 6,482Oregon 9,935 -- -- -- -- -- 9,876 10,002Washington 12,017 -- -- -- -- -- 12,186 11,891
Source: Agency for Healthcare Research and Quality, Center for Financing, Access and Cost Trends. 2008 Medical Expenditure PanelSurvey-Insurance Component.Note: Definitions and descriptions of the methods used for this survey can be found in the Technical Appendix.-- Data suppressed due to high standard errors or no reported values in cell.
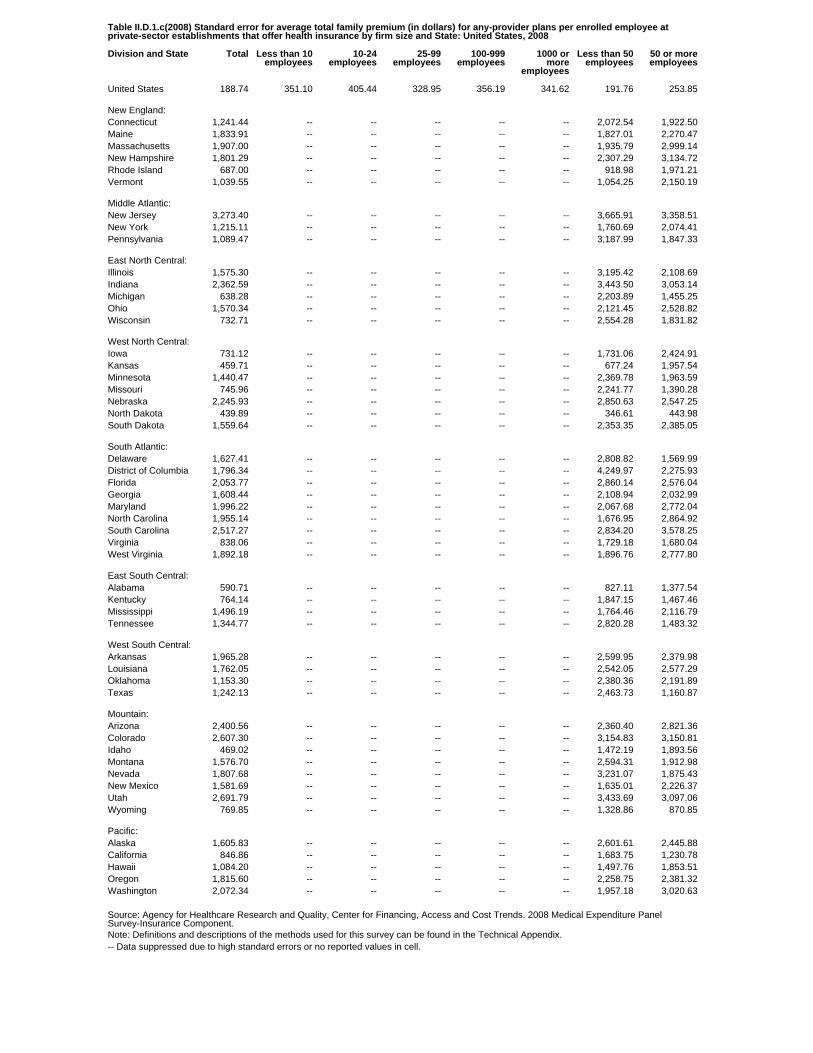
Table II.D.1.c(2008) Standard error for average total family premium (in dollars) for any-provider plans per enrolled employee atprivate-sector establishments that offer health insurance by firm size and State: United States, 2008
Division and State Total Less than 10employees
10-24employees
25-99employees
100-999employees
1000 ormore
employees
Less than 50employees
50 or moreemployees
United States 188.74 351.10 405.44 328.95 356.19 341.62 191.76 253.85
New England:Connecticut 1,241.44 -- -- -- -- -- 2,072.54 1,922.50Maine 1,833.91 -- -- -- -- -- 1,827.01 2,270.47Massachusetts 1,907.00 -- -- -- -- -- 1,935.79 2,999.14New Hampshire 1,801.29 -- -- -- -- -- 2,307.29 3,134.72Rhode Island 687.00 -- -- -- -- -- 918.98 1,971.21Vermont 1,039.55 -- -- -- -- -- 1,054.25 2,150.19
Middle Atlantic:New Jersey 3,273.40 -- -- -- -- -- 3,665.91 3,358.51New York 1,215.11 -- -- -- -- -- 1,760.69 2,074.41Pennsylvania 1,089.47 -- -- -- -- -- 3,187.99 1,847.33
East North Central:Illinois 1,575.30 -- -- -- -- -- 3,195.42 2,108.69Indiana 2,362.59 -- -- -- -- -- 3,443.50 3,053.14Michigan 638.28 -- -- -- -- -- 2,203.89 1,455.25Ohio 1,570.34 -- -- -- -- -- 2,121.45 2,528.82Wisconsin 732.71 -- -- -- -- -- 2,554.28 1,831.82
West North Central:Iowa 731.12 -- -- -- -- -- 1,731.06 2,424.91Kansas 459.71 -- -- -- -- -- 677.24 1,957.54Minnesota 1,440.47 -- -- -- -- -- 2,369.78 1,963.59Missouri 745.96 -- -- -- -- -- 2,241.77 1,390.28Nebraska 2,245.93 -- -- -- -- -- 2,850.63 2,547.25North Dakota 439.89 -- -- -- -- -- 346.61 443.98South Dakota 1,559.64 -- -- -- -- -- 2,353.35 2,385.05
South Atlantic:Delaware 1,627.41 -- -- -- -- -- 2,808.82 1,569.99District of Columbia 1,796.34 -- -- -- -- -- 4,249.97 2,275.93Florida 2,053.77 -- -- -- -- -- 2,860.14 2,576.04Georgia 1,608.44 -- -- -- -- -- 2,108.94 2,032.99Maryland 1,996.22 -- -- -- -- -- 2,067.68 2,772.04North Carolina 1,955.14 -- -- -- -- -- 1,676.95 2,864.92South Carolina 2,517.27 -- -- -- -- -- 2,834.20 3,578.25Virginia 838.06 -- -- -- -- -- 1,729.18 1,680.04West Virginia 1,892.18 -- -- -- -- -- 1,896.76 2,777.80
East South Central:Alabama 590.71 -- -- -- -- -- 827.11 1,377.54Kentucky 764.14 -- -- -- -- -- 1,847.15 1,467.46Mississippi 1,496.19 -- -- -- -- -- 1,764.46 2,116.79Tennessee 1,344.77 -- -- -- -- -- 2,820.28 1,483.32
West South Central:Arkansas 1,965.28 -- -- -- -- -- 2,599.95 2,379.98Louisiana 1,762.05 -- -- -- -- -- 2,542.05 2,577.29Oklahoma 1,153.30 -- -- -- -- -- 2,380.36 2,191.89Texas 1,242.13 -- -- -- -- -- 2,463.73 1,160.87
Mountain:Arizona 2,400.56 -- -- -- -- -- 2,360.40 2,821.36Colorado 2,607.30 -- -- -- -- -- 3,154.83 3,150.81Idaho 469.02 -- -- -- -- -- 1,472.19 1,893.56Montana 1,576.70 -- -- -- -- -- 2,594.31 1,912.98Nevada 1,807.68 -- -- -- -- -- 3,231.07 1,875.43New Mexico 1,581.69 -- -- -- -- -- 1,635.01 2,226.37Utah 2,691.79 -- -- -- -- -- 3,433.69 3,097.06Wyoming 769.85 -- -- -- -- -- 1,328.86 870.85
Pacific:Alaska 1,605.83 -- -- -- -- -- 2,601.61 2,445.88California 846.86 -- -- -- -- -- 1,683.75 1,230.78Hawaii 1,084.20 -- -- -- -- -- 1,497.76 1,853.51Oregon 1,815.60 -- -- -- -- -- 2,258.75 2,381.32Washington 2,072.34 -- -- -- -- -- 1,957.18 3,020.63
Source: Agency for Healthcare Research and Quality, Center for Financing, Access and Cost Trends. 2008 Medical Expenditure PanelSurvey-Insurance Component.Note: Definitions and descriptions of the methods used for this survey can be found in the Technical Appendix.-- Data suppressed due to high standard errors or no reported values in cell.
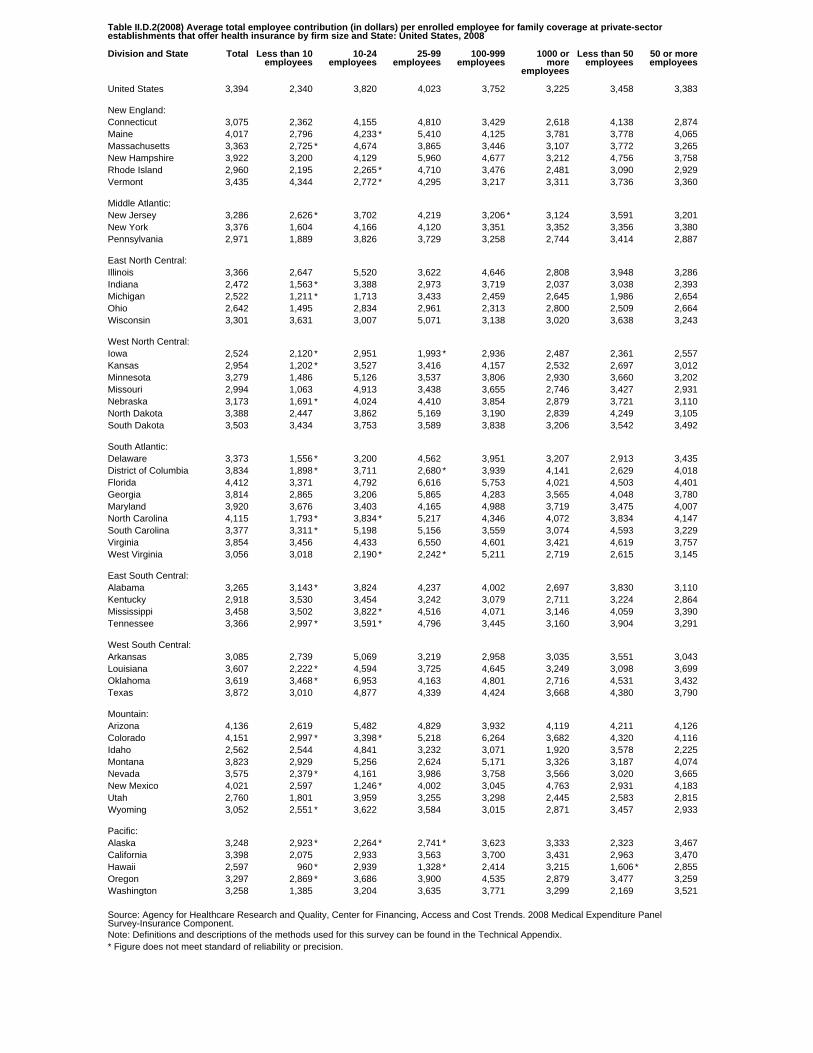
Table II.D.2(2008) Average total employee contribution (in dollars) per enrolled employee for family coverage at private-sectorestablishments that offer health insurance by firm size and State: United States, 2008
Division and State Total Less than 10employees
10-24employees
25-99employees
100-999employees
1000 ormore
employees
Less than 50employees
50 or moreemployees
United States 3,394 2,340 3,820 4,023 3,752 3,225 3,458 3,383
New England:Connecticut 3,075 2,362 4,155 4,810 3,429 2,618 4,138 2,874Maine 4,017 2,796 4,233 * 5,410 4,125 3,781 3,778 4,065Massachusetts 3,363 2,725 * 4,674 3,865 3,446 3,107 3,772 3,265New Hampshire 3,922 3,200 4,129 5,960 4,677 3,212 4,756 3,758Rhode Island 2,960 2,195 2,265 * 4,710 3,476 2,481 3,090 2,929Vermont 3,435 4,344 2,772 * 4,295 3,217 3,311 3,736 3,360
Middle Atlantic:New Jersey 3,286 2,626 * 3,702 4,219 3,206 * 3,124 3,591 3,201New York 3,376 1,604 4,166 4,120 3,351 3,352 3,356 3,380Pennsylvania 2,971 1,889 3,826 3,729 3,258 2,744 3,414 2,887
East North Central:Illinois 3,366 2,647 5,520 3,622 4,646 2,808 3,948 3,286Indiana 2,472 1,563 * 3,388 2,973 3,719 2,037 3,038 2,393Michigan 2,522 1,211 * 1,713 3,433 2,459 2,645 1,986 2,654Ohio 2,642 1,495 2,834 2,961 2,313 2,800 2,509 2,664Wisconsin 3,301 3,631 3,007 5,071 3,138 3,020 3,638 3,243
West North Central:Iowa 2,524 2,120 * 2,951 1,993 * 2,936 2,487 2,361 2,557Kansas 2,954 1,202 * 3,527 3,416 4,157 2,532 2,697 3,012Minnesota 3,279 1,486 5,126 3,537 3,806 2,930 3,660 3,202Missouri 2,994 1,063 4,913 3,438 3,655 2,746 3,427 2,931Nebraska 3,173 1,691 * 4,024 4,410 3,854 2,879 3,721 3,110North Dakota 3,388 2,447 3,862 5,169 3,190 2,839 4,249 3,105South Dakota 3,503 3,434 3,753 3,589 3,838 3,206 3,542 3,492
South Atlantic:Delaware 3,373 1,556 * 3,200 4,562 3,951 3,207 2,913 3,435District of Columbia 3,834 1,898 * 3,711 2,680 * 3,939 4,141 2,629 4,018Florida 4,412 3,371 4,792 6,616 5,753 4,021 4,503 4,401Georgia 3,814 2,865 3,206 5,865 4,283 3,565 4,048 3,780Maryland 3,920 3,676 3,403 4,165 4,988 3,719 3,475 4,007North Carolina 4,115 1,793 * 3,834 * 5,217 4,346 4,072 3,834 4,147South Carolina 3,377 3,311 * 5,198 5,156 3,559 3,074 4,593 3,229Virginia 3,854 3,456 4,433 6,550 4,601 3,421 4,619 3,757West Virginia 3,056 3,018 2,190 * 2,242 * 5,211 2,719 2,615 3,145
East South Central:Alabama 3,265 3,143 * 3,824 4,237 4,002 2,697 3,830 3,110Kentucky 2,918 3,530 3,454 3,242 3,079 2,711 3,224 2,864Mississippi 3,458 3,502 3,822 * 4,516 4,071 3,146 4,059 3,390Tennessee 3,366 2,997 * 3,591 * 4,796 3,445 3,160 3,904 3,291
West South Central:Arkansas 3,085 2,739 5,069 3,219 2,958 3,035 3,551 3,043Louisiana 3,607 2,222 * 4,594 3,725 4,645 3,249 3,098 3,699Oklahoma 3,619 3,468 * 6,953 4,163 4,801 2,716 4,531 3,432Texas 3,872 3,010 4,877 4,339 4,424 3,668 4,380 3,790
Mountain:Arizona 4,136 2,619 5,482 4,829 3,932 4,119 4,211 4,126Colorado 4,151 2,997 * 3,398 * 5,218 6,264 3,682 4,320 4,116Idaho 2,562 2,544 4,841 3,232 3,071 1,920 3,578 2,225Montana 3,823 2,929 5,256 2,624 5,171 3,326 3,187 4,074Nevada 3,575 2,379 * 4,161 3,986 3,758 3,566 3,020 3,665New Mexico 4,021 2,597 1,246 * 4,002 3,045 4,763 2,931 4,183Utah 2,760 1,801 3,959 3,255 3,298 2,445 2,583 2,815Wyoming 3,052 2,551 * 3,622 3,584 3,015 2,871 3,457 2,933
Pacific:Alaska 3,248 2,923 * 2,264 * 2,741 * 3,623 3,333 2,323 3,467California 3,398 2,075 2,933 3,563 3,700 3,431 2,963 3,470Hawaii 2,597 960 * 2,939 1,328 * 2,414 3,215 1,606 * 2,855Oregon 3,297 2,869 * 3,686 3,900 4,535 2,879 3,477 3,259Washington 3,258 1,385 3,204 3,635 3,771 3,299 2,169 3,521
Source: Agency for Healthcare Research and Quality, Center for Financing, Access and Cost Trends. 2008 Medical Expenditure PanelSurvey-Insurance Component.Note: Definitions and descriptions of the methods used for this survey can be found in the Technical Appendix.* Figure does not meet standard of reliability or precision.
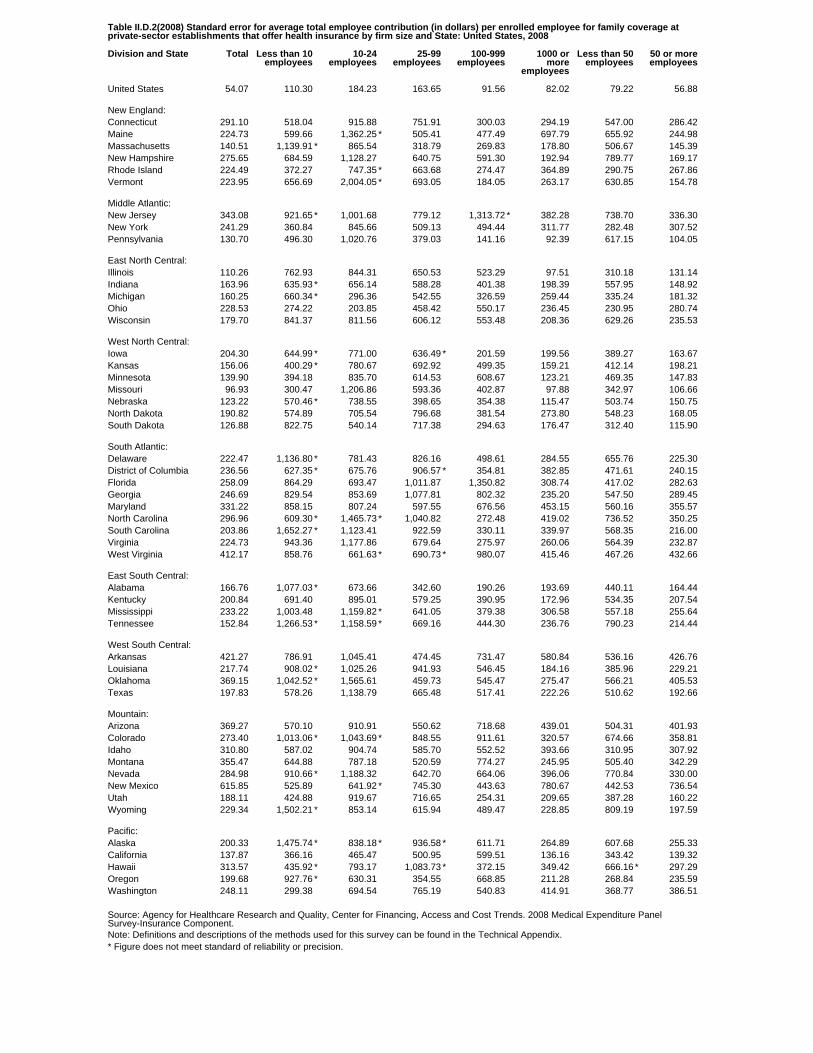
Table II.D.2(2008) Standard error for average total employee contribution (in dollars) per enrolled employee for family coverage atprivate-sector establishments that offer health insurance by firm size and State: United States, 2008
Division and State Total Less than 10employees
10-24employees
25-99employees
100-999employees
1000 ormore
employees
Less than 50employees
50 or moreemployees
United States 54.07 110.30 184.23 163.65 91.56 82.02 79.22 56.88
New England:Connecticut 291.10 518.04 915.88 751.91 300.03 294.19 547.00 286.42Maine 224.73 599.66 1,362.25 * 505.41 477.49 697.79 655.92 244.98Massachusetts 140.51 1,139.91 * 865.54 318.79 269.83 178.80 506.67 145.39New Hampshire 275.65 684.59 1,128.27 640.75 591.30 192.94 789.77 169.17Rhode Island 224.49 372.27 747.35 * 663.68 274.47 364.89 290.75 267.86Vermont 223.95 656.69 2,004.05 * 693.05 184.05 263.17 630.85 154.78
Middle Atlantic:New Jersey 343.08 921.65 * 1,001.68 779.12 1,313.72 * 382.28 738.70 336.30New York 241.29 360.84 845.66 509.13 494.44 311.77 282.48 307.52Pennsylvania 130.70 496.30 1,020.76 379.03 141.16 92.39 617.15 104.05
East North Central:Illinois 110.26 762.93 844.31 650.53 523.29 97.51 310.18 131.14Indiana 163.96 635.93 * 656.14 588.28 401.38 198.39 557.95 148.92Michigan 160.25 660.34 * 296.36 542.55 326.59 259.44 335.24 181.32Ohio 228.53 274.22 203.85 458.42 550.17 236.45 230.95 280.74Wisconsin 179.70 841.37 811.56 606.12 553.48 208.36 629.26 235.53
West North Central:Iowa 204.30 644.99 * 771.00 636.49 * 201.59 199.56 389.27 163.67Kansas 156.06 400.29 * 780.67 692.92 499.35 159.21 412.14 198.21Minnesota 139.90 394.18 835.70 614.53 608.67 123.21 469.35 147.83Missouri 96.93 300.47 1,206.86 593.36 402.87 97.88 342.97 106.66Nebraska 123.22 570.46 * 738.55 398.65 354.38 115.47 503.74 150.75North Dakota 190.82 574.89 705.54 796.68 381.54 273.80 548.23 168.05South Dakota 126.88 822.75 540.14 717.38 294.63 176.47 312.40 115.90
South Atlantic:Delaware 222.47 1,136.80 * 781.43 826.16 498.61 284.55 655.76 225.30District of Columbia 236.56 627.35 * 675.76 906.57 * 354.81 382.85 471.61 240.15Florida 258.09 864.29 693.47 1,011.87 1,350.82 308.74 417.02 282.63Georgia 246.69 829.54 853.69 1,077.81 802.32 235.20 547.50 289.45Maryland 331.22 858.15 807.24 597.55 676.56 453.15 560.16 355.57North Carolina 296.96 609.30 * 1,465.73 * 1,040.82 272.48 419.02 736.52 350.25South Carolina 203.86 1,652.27 * 1,123.41 922.59 330.11 339.97 568.35 216.00Virginia 224.73 943.36 1,177.86 679.64 275.97 260.06 564.39 232.87West Virginia 412.17 858.76 661.63 * 690.73 * 980.07 415.46 467.26 432.66
East South Central:Alabama 166.76 1,077.03 * 673.66 342.60 190.26 193.69 440.11 164.44Kentucky 200.84 691.40 895.01 579.25 390.95 172.96 534.35 207.54Mississippi 233.22 1,003.48 1,159.82 * 641.05 379.38 306.58 557.18 255.64Tennessee 152.84 1,266.53 * 1,158.59 * 669.16 444.30 236.76 790.23 214.44
West South Central:Arkansas 421.27 786.91 1,045.41 474.45 731.47 580.84 536.16 426.76Louisiana 217.74 908.02 * 1,025.26 941.93 546.45 184.16 385.96 229.21Oklahoma 369.15 1,042.52 * 1,565.61 459.73 545.47 275.47 566.21 405.53Texas 197.83 578.26 1,138.79 665.48 517.41 222.26 510.62 192.66
Mountain:Arizona 369.27 570.10 910.91 550.62 718.68 439.01 504.31 401.93Colorado 273.40 1,013.06 * 1,043.69 * 848.55 911.61 320.57 674.66 358.81Idaho 310.80 587.02 904.74 585.70 552.52 393.66 310.95 307.92Montana 355.47 644.88 787.18 520.59 774.27 245.95 505.40 342.29Nevada 284.98 910.66 * 1,188.32 642.70 664.06 396.06 770.84 330.00New Mexico 615.85 525.89 641.92 * 745.30 443.63 780.67 442.53 736.54Utah 188.11 424.88 919.67 716.65 254.31 209.65 387.28 160.22Wyoming 229.34 1,502.21 * 853.14 615.94 489.47 228.85 809.19 197.59
Pacific:Alaska 200.33 1,475.74 * 838.18 * 936.58 * 611.71 264.89 607.68 255.33California 137.87 366.16 465.47 500.95 599.51 136.16 343.42 139.32Hawaii 313.57 435.92 * 793.17 1,083.73 * 372.15 349.42 666.16 * 297.29Oregon 199.68 927.76 * 630.31 354.55 668.85 211.28 268.84 235.59Washington 248.11 299.38 694.54 765.19 540.83 414.91 368.77 386.51
Source: Agency for Healthcare Research and Quality, Center for Financing, Access and Cost Trends. 2008 Medical Expenditure PanelSurvey-Insurance Component.Note: Definitions and descriptions of the methods used for this survey can be found in the Technical Appendix.* Figure does not meet standard of reliability or precision.

Table II.D.2.a(2008) Average total employee contribution (in dollars) for exclusive-provider plans per enrolled employee for familycoverage at private-sector establishments that offer health insurance by firm size and State: United States, 2008
Division and State Total Less than 10employees
10-24employees
25-99employees
100-999employees
1000 ormore
employees
Less than 50employees
50 or moreemployees
United States 3,499 2,564 3,692 3,889 3,931 3,323 3,406 3,522
New England:Connecticut 3,836 -- -- -- -- -- 3,355 3,949Maine 4,642 -- -- -- -- -- 4,144 4,950Massachusetts 3,537 -- -- -- -- -- 3,804 3,439New Hampshire 4,392 -- -- -- -- -- 4,858 4,172Rhode Island 3,427 -- -- -- -- -- 2,871 * 3,576Vermont 4,105 -- -- -- -- -- 5,598 * 3,633
Middle Atlantic:New Jersey 4,190 -- -- -- -- -- 4,120 * 4,266New York 3,454 -- -- -- -- -- 3,186 3,535Pennsylvania 2,825 -- -- -- -- -- 1,802 * 3,105
East North Central:Illinois 3,042 -- -- -- -- -- 3,063 3,040Indiana 3,476 -- -- -- -- -- 2,436 * 3,691Michigan 2,780 -- -- -- -- -- 2,585 2,826Ohio 3,000 -- -- -- -- -- 3,223 2,944 *Wisconsin 3,796 -- -- -- -- -- 3,312 3,932
West North Central:Iowa 2,846 -- -- -- -- -- 3,102 2,783Kansas 2,257 -- -- -- -- -- 1,842 * 2,344Minnesota 3,274 -- -- -- -- -- 1,775 * 4,012Missouri 3,566 -- -- -- -- -- 3,706 3,499Nebraska 3,917 -- -- -- -- -- 4,685 3,826North Dakota 4,820 -- -- -- -- -- 6,424 2,641 *South Dakota 3,911 -- -- -- -- -- 4,195 3,850
South Atlantic:Delaware 2,838 -- -- -- -- -- 2,372 * 2,934District of Columbia 3,983 -- -- -- -- -- 2,498 4,147Florida 4,054 -- -- -- -- -- 5,818 3,842Georgia 3,654 -- -- -- -- -- 3,144 * 3,768Maryland 3,600 -- -- -- -- -- 3,680 3,573North Carolina 4,401 -- -- -- -- -- 3,865 * 4,420South Carolina 3,573 -- -- -- -- -- 4,040 * 3,471Virginia 3,862 -- -- -- -- -- 3,319 3,939West Virginia 4,500 -- -- -- -- -- 2,858 * 4,769 *
East South Central:Alabama 3,280 -- -- -- -- -- 3,132 * 3,341Kentucky 3,202 -- -- -- -- -- 2,130 3,457Mississippi 3,493 -- -- -- -- -- 5,820 * 3,363Tennessee 4,124 -- -- -- -- -- 5,912 3,957
West South Central:Arkansas 4,249 -- -- -- -- -- 4,181 4,255Louisiana 3,578 -- -- -- -- -- 3,537 * 3,587Oklahoma 3,420 -- -- -- -- -- 4,754 3,037Texas 3,905 -- -- -- -- -- 4,994 3,748
Mountain:Arizona 4,038 -- -- -- -- -- 4,788 3,868Colorado 5,396 -- -- -- -- -- 5,143 * 5,489Idaho 1,199 * -- -- -- -- -- 4,084 941 *Montana 4,635 -- -- -- -- -- 5,606 3,931Nevada 4,389 -- -- -- -- -- 2,674 4,522New Mexico 3,760 -- -- -- -- -- 2,664 * 4,221Utah 3,051 -- -- -- -- -- 2,874 3,122Wyoming 4,461 -- -- -- -- -- 5,437 3,968
Pacific:Alaska 2,851 * -- -- -- -- -- -- 3,225 *California 3,245 -- -- -- -- -- 3,014 3,299Hawaii 2,742 -- -- -- -- -- 1,545 * 2,991Oregon 3,932 -- -- -- -- -- 4,491 3,675Washington 4,204 -- -- -- -- -- 2,648 4,397
Source: Agency for Healthcare Research and Quality, Center for Financing, Access and Cost Trends. 2008 Medical Expenditure PanelSurvey-Insurance Component.Note: Definitions and descriptions of the methods used for this survey can be found in the Technical Appendix.* Figure does not meet standard of reliability or precision.-- Data suppressed due to high standard errors or no reported values in cell.

Table II.D.2.a(2008) Standard error for average total employee contribution (in dollars) for exclusive-provider plans per enrolledemployee for family coverage at private-sector establishments that offer health insurance by firm size and State: United States, 2008
Division and State Total Less than 10employees
10-24employees
25-99employees
100-999employees
1000 ormore
employees
Less than 50employees
50 or moreemployees
United States 94.33 267.27 285.01 322.06 186.60 77.63 212.17 89.14
New England:Connecticut 422.72 -- -- -- -- -- 793.78 255.88Maine 418.44 -- -- -- -- -- 775.68 786.97Massachusetts 142.23 -- -- -- -- -- 574.25 153.24New Hampshire 274.64 -- -- -- -- -- 885.61 303.85Rhode Island 971.06 -- -- -- -- -- 935.78 * 934.17Vermont 621.81 -- -- -- -- -- 1,983.29 * 641.76
Middle Atlantic:New Jersey 698.03 -- -- -- -- -- 1,423.63 * 1,007.18New York 223.81 -- -- -- -- -- 532.64 290.34Pennsylvania 243.91 -- -- -- -- -- 542.55 * 217.82
East North Central:Illinois 232.21 -- -- -- -- -- 784.42 279.68Indiana 355.39 -- -- -- -- -- 1,012.54 * 283.59Michigan 281.38 -- -- -- -- -- 697.07 556.87Ohio 713.54 -- -- -- -- -- 814.54 934.29 *Wisconsin 321.52 -- -- -- -- -- 744.97 471.86
West North Central:Iowa 273.94 -- -- -- -- -- 877.45 479.28Kansas 644.58 -- -- -- -- -- 1,225.92 * 599.86Minnesota 380.27 -- -- -- -- -- 769.05 * 555.90Missouri 191.20 -- -- -- -- -- 524.65 245.22Nebraska 341.89 -- -- -- -- -- 1,271.08 398.03North Dakota 1,118.38 -- -- -- -- -- 1,502.98 939.15 *South Dakota 510.40 -- -- -- -- -- 1,075.24 592.11
South Atlantic:Delaware 481.59 -- -- -- -- -- 1,042.49 * 413.75District of Columbia 321.89 -- -- -- -- -- 726.25 347.61Florida 444.16 -- -- -- -- -- 1,102.78 408.27Georgia 336.20 -- -- -- -- -- 1,064.15 * 528.32Maryland 403.89 -- -- -- -- -- 954.70 449.79North Carolina 514.55 -- -- -- -- -- 1,363.60 * 503.00South Carolina 732.85 -- -- -- -- -- 1,379.73 * 424.58Virginia 218.58 -- -- -- -- -- 656.25 153.31West Virginia 1,250.02 -- -- -- -- -- 1,381.31 * 1,480.55 *
East South Central:Alabama 698.25 -- -- -- -- -- 1,053.54 * 526.52Kentucky 348.78 -- -- -- -- -- 634.64 586.78Mississippi 872.33 -- -- -- -- -- 1,764.22 * 924.69Tennessee 393.81 -- -- -- -- -- 1,572.01 544.63
West South Central:Arkansas 632.70 -- -- -- -- -- 1,179.94 617.30Louisiana 985.08 -- -- -- -- -- 1,241.12 * 610.68Oklahoma 905.61 -- -- -- -- -- 1,149.25 873.92Texas 330.53 -- -- -- -- -- 1,237.00 216.89
Mountain:Arizona 699.04 -- -- -- -- -- 1,198.57 773.87Colorado 977.37 -- -- -- -- -- 2,168.96 * 894.89Idaho 647.18 * -- -- -- -- -- 1,154.07 627.56 *Montana 549.00 -- -- -- -- -- 1,617.46 740.06Nevada 814.38 -- -- -- -- -- 769.61 819.61New Mexico 636.33 -- -- -- -- -- 856.23 * 700.49Utah 357.07 -- -- -- -- -- 470.54 371.57Wyoming 617.67 -- -- -- -- -- 1,436.66 759.34
Pacific:Alaska 1,086.70 * -- -- -- -- -- -- 1,141.34 *California 255.01 -- -- -- -- -- 621.71 253.53Hawaii 368.72 -- -- -- -- -- 597.07 * 476.68Oregon 551.23 -- -- -- -- -- 987.16 859.54Washington 947.94 -- -- -- -- -- 775.60 931.52
Source: Agency for Healthcare Research and Quality, Center for Financing, Access and Cost Trends. 2008 Medical Expenditure PanelSurvey-Insurance Component.Note: Definitions and descriptions of the methods used for this survey can be found in the Technical Appendix.* Figure does not meet standard of reliability or precision.-- Data suppressed due to high standard errors or no reported values in cell.
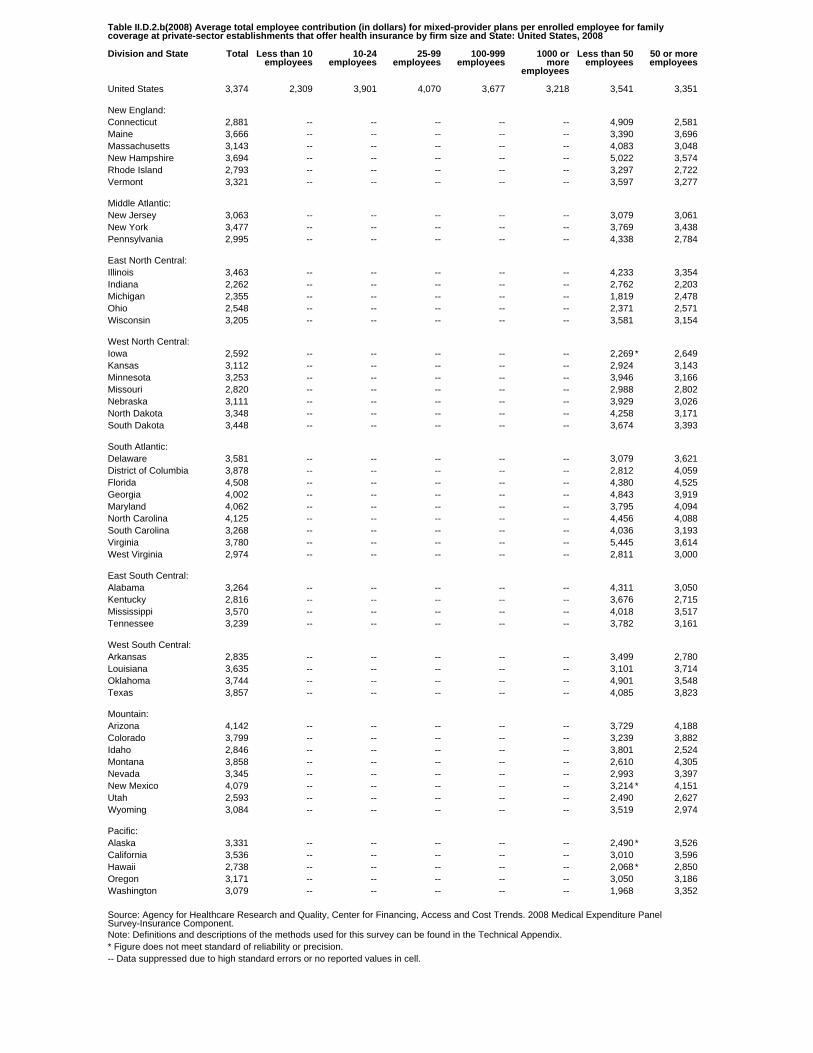
Table II.D.2.b(2008) Average total employee contribution (in dollars) for mixed-provider plans per enrolled employee for familycoverage at private-sector establishments that offer health insurance by firm size and State: United States, 2008
Division and State Total Less than 10employees
10-24employees
25-99employees
100-999employees
1000 ormore
employees
Less than 50employees
50 or moreemployees
United States 3,374 2,309 3,901 4,070 3,677 3,218 3,541 3,351
New England:Connecticut 2,881 -- -- -- -- -- 4,909 2,581Maine 3,666 -- -- -- -- -- 3,390 3,696Massachusetts 3,143 -- -- -- -- -- 4,083 3,048New Hampshire 3,694 -- -- -- -- -- 5,022 3,574Rhode Island 2,793 -- -- -- -- -- 3,297 2,722Vermont 3,321 -- -- -- -- -- 3,597 3,277
Middle Atlantic:New Jersey 3,063 -- -- -- -- -- 3,079 3,061New York 3,477 -- -- -- -- -- 3,769 3,438Pennsylvania 2,995 -- -- -- -- -- 4,338 2,784
East North Central:Illinois 3,463 -- -- -- -- -- 4,233 3,354Indiana 2,262 -- -- -- -- -- 2,762 2,203Michigan 2,355 -- -- -- -- -- 1,819 2,478Ohio 2,548 -- -- -- -- -- 2,371 2,571Wisconsin 3,205 -- -- -- -- -- 3,581 3,154
West North Central:Iowa 2,592 -- -- -- -- -- 2,269 * 2,649Kansas 3,112 -- -- -- -- -- 2,924 3,143Minnesota 3,253 -- -- -- -- -- 3,946 3,166Missouri 2,820 -- -- -- -- -- 2,988 2,802Nebraska 3,111 -- -- -- -- -- 3,929 3,026North Dakota 3,348 -- -- -- -- -- 4,258 3,171South Dakota 3,448 -- -- -- -- -- 3,674 3,393
South Atlantic:Delaware 3,581 -- -- -- -- -- 3,079 3,621District of Columbia 3,878 -- -- -- -- -- 2,812 4,059Florida 4,508 -- -- -- -- -- 4,380 4,525Georgia 4,002 -- -- -- -- -- 4,843 3,919Maryland 4,062 -- -- -- -- -- 3,795 4,094North Carolina 4,125 -- -- -- -- -- 4,456 4,088South Carolina 3,268 -- -- -- -- -- 4,036 3,193Virginia 3,780 -- -- -- -- -- 5,445 3,614West Virginia 2,974 -- -- -- -- -- 2,811 3,000
East South Central:Alabama 3,264 -- -- -- -- -- 4,311 3,050Kentucky 2,816 -- -- -- -- -- 3,676 2,715Mississippi 3,570 -- -- -- -- -- 4,018 3,517Tennessee 3,239 -- -- -- -- -- 3,782 3,161
West South Central:Arkansas 2,835 -- -- -- -- -- 3,499 2,780Louisiana 3,635 -- -- -- -- -- 3,101 3,714Oklahoma 3,744 -- -- -- -- -- 4,901 3,548Texas 3,857 -- -- -- -- -- 4,085 3,823
Mountain:Arizona 4,142 -- -- -- -- -- 3,729 4,188Colorado 3,799 -- -- -- -- -- 3,239 3,882Idaho 2,846 -- -- -- -- -- 3,801 2,524Montana 3,858 -- -- -- -- -- 2,610 4,305Nevada 3,345 -- -- -- -- -- 2,993 3,397New Mexico 4,079 -- -- -- -- -- 3,214 * 4,151Utah 2,593 -- -- -- -- -- 2,490 2,627Wyoming 3,084 -- -- -- -- -- 3,519 2,974
Pacific:Alaska 3,331 -- -- -- -- -- 2,490 * 3,526California 3,536 -- -- -- -- -- 3,010 3,596Hawaii 2,738 -- -- -- -- -- 2,068 * 2,850Oregon 3,171 -- -- -- -- -- 3,050 3,186Washington 3,079 -- -- -- -- -- 1,968 3,352
Source: Agency for Healthcare Research and Quality, Center for Financing, Access and Cost Trends. 2008 Medical Expenditure PanelSurvey-Insurance Component.Note: Definitions and descriptions of the methods used for this survey can be found in the Technical Appendix.* Figure does not meet standard of reliability or precision.-- Data suppressed due to high standard errors or no reported values in cell.

Table II.D.2.b(2008) Standard error for average total employee contribution (in dollars) for mixed-provider plans per enrolled employeefor family coverage at private-sector establishments that offer health insurance by firm size and State: United States, 2008
Division and State Total Less than 10employees
10-24employees
25-99employees
100-999employees
1000 ormore
employees
Less than 50employees
50 or moreemployees
United States 51.02 137.61 179.57 178.01 106.37 87.23 114.96 60.78
New England:Connecticut 362.19 -- -- -- -- -- 824.73 313.13Maine 163.29 -- -- -- -- -- 643.51 174.31Massachusetts 233.07 -- -- -- -- -- 950.49 231.58New Hampshire 362.56 -- -- -- -- -- 1,172.16 323.91Rhode Island 257.35 -- -- -- -- -- 673.83 314.33Vermont 233.65 -- -- -- -- -- 849.95 196.39
Middle Atlantic:New Jersey 354.87 -- -- -- -- -- 720.80 365.07New York 333.08 -- -- -- -- -- 656.84 373.13Pennsylvania 135.27 -- -- -- -- -- 1,060.67 80.51
East North Central:Illinois 148.68 -- -- -- -- -- 486.12 153.85Indiana 159.08 -- -- -- -- -- 442.34 209.12Michigan 223.25 -- -- -- -- -- 429.71 247.93Ohio 190.01 -- -- -- -- -- 224.15 223.77Wisconsin 221.92 -- -- -- -- -- 672.74 238.72
West North Central:Iowa 223.23 -- -- -- -- -- 685.22 * 159.26Kansas 143.90 -- -- -- -- -- 599.55 194.07Minnesota 135.27 -- -- -- -- -- 753.58 162.23Missouri 91.49 -- -- -- -- -- 562.96 122.23Nebraska 137.58 -- -- -- -- -- 596.49 169.43North Dakota 201.92 -- -- -- -- -- 717.12 200.06South Dakota 179.43 -- -- -- -- -- 510.06 134.36
South Atlantic:Delaware 230.24 -- -- -- -- -- 901.14 236.81District of Columbia 289.08 -- -- -- -- -- 467.12 286.31Florida 324.10 -- -- -- -- -- 515.97 345.65Georgia 352.36 -- -- -- -- -- 986.40 340.28Maryland 366.00 -- -- -- -- -- 637.67 383.37North Carolina 323.82 -- -- -- -- -- 977.87 387.45South Carolina 188.62 -- -- -- -- -- 523.94 207.24Virginia 290.33 -- -- -- -- -- 1,167.88 281.37West Virginia 261.30 -- -- -- -- -- 561.15 303.90
East South Central:Alabama 225.74 -- -- -- -- -- 612.12 208.24Kentucky 190.49 -- -- -- -- -- 1,076.52 207.84Mississippi 216.08 -- -- -- -- -- 728.92 256.99Tennessee 158.50 -- -- -- -- -- 953.32 230.36
West South Central:Arkansas 349.50 -- -- -- -- -- 684.08 334.60Louisiana 221.96 -- -- -- -- -- 583.08 238.73Oklahoma 370.95 -- -- -- -- -- 635.01 406.42Texas 231.14 -- -- -- -- -- 482.26 229.19
Mountain:Arizona 352.50 -- -- -- -- -- 713.34 400.24Colorado 349.97 -- -- -- -- -- 797.52 330.67Idaho 308.15 -- -- -- -- -- 430.82 266.87Montana 391.64 -- -- -- -- -- 591.88 356.79Nevada 259.22 -- -- -- -- -- 851.42 256.65New Mexico 737.22 -- -- -- -- -- 1,194.01 * 843.00Utah 205.65 -- -- -- -- -- 390.67 178.56Wyoming 278.43 -- -- -- -- -- 834.05 212.25
Pacific:Alaska 173.47 -- -- -- -- -- 1,066.14 * 284.85California 210.29 -- -- -- -- -- 459.14 209.93Hawaii 349.94 -- -- -- -- -- 817.40 * 303.83Oregon 223.89 -- -- -- -- -- 355.17 232.60Washington 216.55 -- -- -- -- -- 285.78 358.46
Source: Agency for Healthcare Research and Quality, Center for Financing, Access and Cost Trends. 2008 Medical Expenditure PanelSurvey-Insurance Component.Note: Definitions and descriptions of the methods used for this survey can be found in the Technical Appendix.* Figure does not meet standard of reliability or precision.-- Data suppressed due to high standard errors or no reported values in cell.

Table II.D.2.c(2008) Average total employee contribution (in dollars) for any-provider plans per enrolled employee for family coverageat private-sector establishments that offer health insurance by firm size and State: United States, 2008
Division and State Total Less than 10employees
10-24employees
25-99employees
100-999employees
1000 ormore
employees
Less than 50employees
50 or moreemployees
United States 3,270 2,054 3,666 4,106 4,109 2,863 3,165 3,332
New England:Connecticut 2,433 -- -- -- -- -- 2,635 * 2,304 *Maine 5,199 -- -- -- -- -- 3,991 5,749Massachusetts 4,202 -- -- -- -- -- 3,086 * 5,966New Hampshire 4,395 -- -- -- -- -- 3,569 * 4,946Rhode Island 3,079 -- -- -- -- -- 2,975 3,164Vermont 3,018 -- -- -- -- -- 2,445 * 3,381 *
Middle Atlantic:New Jersey 4,302 -- -- -- -- -- 4,544 3,994New York 1,542 * -- -- -- -- -- 2,182 * 1,116 *Pennsylvania 3,185 * -- -- -- -- -- 2,103 * 3,595 *
East North Central:Illinois 3,187 * -- -- -- -- -- 2,719 * 3,314 *Indiana 5,934 -- -- -- -- -- 5,783 * 6,099Michigan 3,535 * -- -- -- -- -- 1,837 * 4,465 *Ohio 3,235 -- -- -- -- -- 2,365 * 3,885Wisconsin 3,629 -- -- -- -- -- 4,312 * 3,174 *
West North Central:Iowa 1,600 * -- -- -- -- -- 2,124 1,366 *Kansas 2,707 -- -- -- -- -- 2,647 * 2,861Minnesota 3,634 -- -- -- -- -- 4,488 1,975 *Missouri 4,787 -- -- -- -- -- 5,683 4,507Nebraska 2,326 * -- -- -- -- -- 1,370 * 2,777North Dakota 3,126 -- -- -- -- -- 3,437 2,902South Dakota 3,254 -- -- -- -- -- 2,537 4,358
South Atlantic:Delaware 3,268 -- -- -- -- -- 3,380 * 3,225District of Columbia 2,992 -- -- -- -- -- -- 3,277Florida 3,718 -- -- -- -- -- 2,089 * 4,253Georgia 2,666 -- -- -- -- -- 3,407 * 2,322Maryland 3,766 -- -- -- -- -- 1,899 * 5,059North Carolina 3,696 -- -- -- -- -- 600 * 4,429South Carolina 4,428 -- -- -- -- -- 6,982 3,501Virginia 5,017 -- -- -- -- -- 3,805 5,834West Virginia 1,245 * -- -- -- -- -- 1,958 * 433 *
East South Central:Alabama 3,263 -- -- -- -- -- 2,931 3,550Kentucky 3,346 -- -- -- -- -- 2,955 * 3,634Mississippi 2,384 -- -- -- -- -- 3,440 * 2,227Tennessee 4,157 -- -- -- -- -- 2,901 * 4,462
West South Central:Arkansas 2,581 -- -- -- -- -- 2,775 2,397Louisiana 3,032 -- -- -- -- -- 2,645 * 3,698Oklahoma 2,130 * -- -- -- -- -- 2,604 * 1,750 *Texas 4,104 -- -- -- -- -- 6,296 2,946
Mountain:Arizona 4,312 -- -- -- -- -- 5,537 4,021Colorado 5,386 -- -- -- -- -- 7,880 * 2,834Idaho 2,710 -- -- -- -- -- 2,744 2,683Montana 3,053 -- -- -- -- -- 4,639 2,264Nevada 2,947 * -- -- -- -- -- 3,276 * 2,570 *New Mexico 3,998 -- -- -- -- -- 2,723 * 5,827Utah 3,568 -- -- -- -- -- 2,518 * 3,605Wyoming 2,532 -- -- -- -- -- 2,654 * 2,482
Pacific:Alaska 2,867 * -- -- -- -- -- 2,107 * 3,155 *California 2,512 -- -- -- -- -- 2,095 * 2,713 *Hawaii 1,377 * -- -- -- -- -- 1,079 * 1,988 *Oregon 2,079 * -- -- -- -- -- 1,794 * 2,403 *Washington 3,860 -- -- -- -- -- 3,739 * 3,950
Source: Agency for Healthcare Research and Quality, Center for Financing, Access and Cost Trends. 2008 Medical Expenditure PanelSurvey-Insurance Component.Note: Definitions and descriptions of the methods used for this survey can be found in the Technical Appendix.* Figure does not meet standard of reliability or precision.-- Data suppressed due to high standard errors or no reported values in cell.

Table II.D.2.c(2008) Standard error for average total employee contribution (in dollars) for any-provider plans per enrolled employee forfamily coverage at private-sector establishments that offer health insurance by firm size and State: United States, 2008
Division and State Total Less than 10employees
10-24employees
25-99employees
100-999employees
1000 ormore
employees
Less than 50employees
50 or moreemployees
United States 202.13 235.70 429.96 341.87 293.75 254.20 249.83 237.87
New England:Connecticut 695.68 -- -- -- -- -- 991.33 * 1,230.67 *Maine 1,061.48 -- -- -- -- -- 1,019.95 1,360.71Massachusetts 918.87 -- -- -- -- -- 992.04 * 1,269.29New Hampshire 925.69 -- -- -- -- -- 1,089.57 * 1,028.39Rhode Island 631.04 -- -- -- -- -- 663.25 863.94Vermont 426.91 -- -- -- -- -- 1,080.66 * 1,299.59 *
Middle Atlantic:New Jersey 1,177.47 -- -- -- -- -- 1,351.24 1,039.68New York 1,076.99 * -- -- -- -- -- 1,197.55 * 1,688.05 *Pennsylvania 1,573.07 * -- -- -- -- -- 716.14 * 1,564.95 *
East North Central:Illinois 1,801.24 * -- -- -- -- -- 1,871.50 * 1,610.72 *Indiana 1,581.71 -- -- -- -- -- 1,829.51 * 1,696.74Michigan 1,078.48 * -- -- -- -- -- 602.25 * 1,375.06 *Ohio 554.81 -- -- -- -- -- 791.97 * 861.37Wisconsin 959.73 -- -- -- -- -- 1,482.86 * 1,304.17 *
West North Central:Iowa 531.44 * -- -- -- -- -- 566.20 576.56 *Kansas 596.73 -- -- -- -- -- 818.91 * 830.45Minnesota 569.65 -- -- -- -- -- 1,044.56 773.67 *Missouri 1,166.24 -- -- -- -- -- 1,623.13 881.22Nebraska 741.25 * -- -- -- -- -- 819.02 * 708.41North Dakota 370.52 -- -- -- -- -- 829.47 428.93South Dakota 602.64 -- -- -- -- -- 723.56 953.86
South Atlantic:Delaware 598.94 -- -- -- -- -- 1,065.47 * 478.51District of Columbia 702.39 -- -- -- -- -- -- 679.49Florida 880.88 -- -- -- -- -- 636.29 * 983.54Georgia 568.97 -- -- -- -- -- 1,028.48 * 503.47Maryland 846.60 -- -- -- -- -- 712.50 * 1,280.04North Carolina 768.33 -- -- -- -- -- 226.07 * 981.04South Carolina 1,013.88 -- -- -- -- -- 1,704.12 953.58Virginia 527.31 -- -- -- -- -- 821.07 971.42West Virginia 929.34 * -- -- -- -- -- 996.21 * 597.81 *
East South Central:Alabama 448.93 -- -- -- -- -- 568.73 430.67Kentucky 702.20 -- -- -- -- -- 1,087.18 * 756.82Mississippi 711.63 -- -- -- -- -- 1,075.19 * 538.00Tennessee 927.82 -- -- -- -- -- 1,669.57 * 677.74
West South Central:Arkansas 508.40 -- -- -- -- -- 817.40 582.49Louisiana 751.54 -- -- -- -- -- 844.11 * 944.75Oklahoma 692.92 * -- -- -- -- -- 901.16 * 1,058.19 *Texas 524.30 -- -- -- -- -- 1,508.14 352.53
Mountain:Arizona 1,170.73 -- -- -- -- -- 1,444.14 1,136.87Colorado 1,443.91 -- -- -- -- -- 2,367.10 * 781.42Idaho 642.83 -- -- -- -- -- 810.04 564.37Montana 727.83 -- -- -- -- -- 1,149.08 639.90Nevada 1,210.04 * -- -- -- -- -- 1,266.05 * 968.94 *New Mexico 1,134.42 -- -- -- -- -- 869.91 * 1,649.51Utah 640.06 -- -- -- -- -- 783.02 * 719.40Wyoming 607.18 -- -- -- -- -- 1,082.99 * 699.56
Pacific:Alaska 1,234.34 * -- -- -- -- -- 946.64 * 1,097.27 *California 574.49 -- -- -- -- -- 1,068.30 * 877.86 *Hawaii 451.29 * -- -- -- -- -- 1,264.14 * 1,011.29 *Oregon 786.17 * -- -- -- -- -- 1,184.06 * 736.56 *Washington 1,037.76 -- -- -- -- -- 1,302.24 * 1,007.24
Source: Agency for Healthcare Research and Quality, Center for Financing, Access and Cost Trends. 2008 Medical Expenditure PanelSurvey-Insurance Component.Note: Definitions and descriptions of the methods used for this survey can be found in the Technical Appendix.* Figure does not meet standard of reliability or precision.-- Data suppressed due to high standard errors or no reported values in cell.
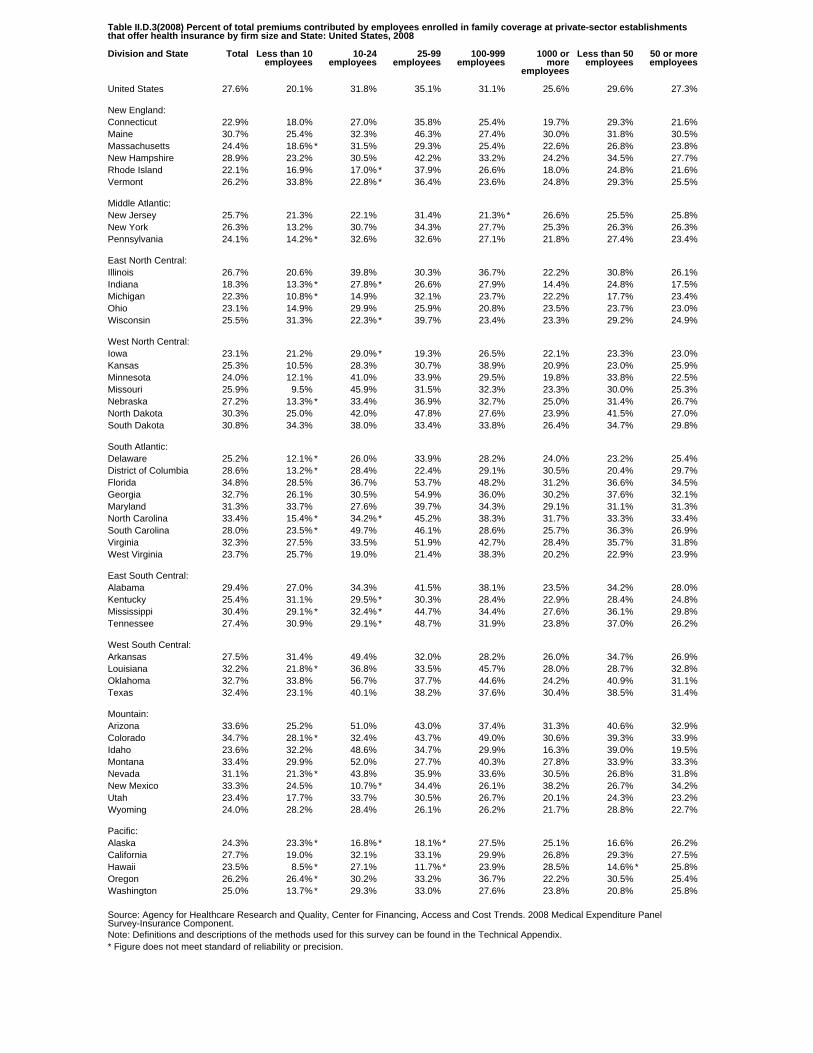
Table II.D.3(2008) Percent of total premiums contributed by employees enrolled in family coverage at private-sector establishmentsthat offer health insurance by firm size and State: United States, 2008
Division and State Total Less than 10employees
10-24employees
25-99employees
100-999employees
1000 ormore
employees
Less than 50employees
50 or moreemployees
United States 27.6% 20.1% 31.8% 35.1% 31.1% 25.6% 29.6% 27.3%
New England:Connecticut 22.9% 18.0% 27.0% 35.8% 25.4% 19.7% 29.3% 21.6%Maine 30.7% 25.4% 32.3% 46.3% 27.4% 30.0% 31.8% 30.5%Massachusetts 24.4% 18.6% * 31.5% 29.3% 25.4% 22.6% 26.8% 23.8%New Hampshire 28.9% 23.2% 30.5% 42.2% 33.2% 24.2% 34.5% 27.7%Rhode Island 22.1% 16.9% 17.0% * 37.9% 26.6% 18.0% 24.8% 21.6%Vermont 26.2% 33.8% 22.8% * 36.4% 23.6% 24.8% 29.3% 25.5%
Middle Atlantic:New Jersey 25.7% 21.3% 22.1% 31.4% 21.3% * 26.6% 25.5% 25.8%New York 26.3% 13.2% 30.7% 34.3% 27.7% 25.3% 26.3% 26.3%Pennsylvania 24.1% 14.2% * 32.6% 32.6% 27.1% 21.8% 27.4% 23.4%
East North Central:Illinois 26.7% 20.6% 39.8% 30.3% 36.7% 22.2% 30.8% 26.1%Indiana 18.3% 13.3% * 27.8% * 26.6% 27.9% 14.4% 24.8% 17.5%Michigan 22.3% 10.8% * 14.9% 32.1% 23.7% 22.2% 17.7% 23.4%Ohio 23.1% 14.9% 29.9% 25.9% 20.8% 23.5% 23.7% 23.0%Wisconsin 25.5% 31.3% 22.3% * 39.7% 23.4% 23.3% 29.2% 24.9%
West North Central:Iowa 23.1% 21.2% 29.0% * 19.3% 26.5% 22.1% 23.3% 23.0%Kansas 25.3% 10.5% 28.3% 30.7% 38.9% 20.9% 23.0% 25.9%Minnesota 24.0% 12.1% 41.0% 33.9% 29.5% 19.8% 33.8% 22.5%Missouri 25.9% 9.5% 45.9% 31.5% 32.3% 23.3% 30.0% 25.3%Nebraska 27.2% 13.3% * 33.4% 36.9% 32.7% 25.0% 31.4% 26.7%North Dakota 30.3% 25.0% 42.0% 47.8% 27.6% 23.9% 41.5% 27.0%South Dakota 30.8% 34.3% 38.0% 33.4% 33.8% 26.4% 34.7% 29.8%
South Atlantic:Delaware 25.2% 12.1% * 26.0% 33.9% 28.2% 24.0% 23.2% 25.4%District of Columbia 28.6% 13.2% * 28.4% 22.4% 29.1% 30.5% 20.4% 29.7%Florida 34.8% 28.5% 36.7% 53.7% 48.2% 31.2% 36.6% 34.5%Georgia 32.7% 26.1% 30.5% 54.9% 36.0% 30.2% 37.6% 32.1%Maryland 31.3% 33.7% 27.6% 39.7% 34.3% 29.1% 31.1% 31.3%North Carolina 33.4% 15.4% * 34.2% * 45.2% 38.3% 31.7% 33.3% 33.4%South Carolina 28.0% 23.5% * 49.7% 46.1% 28.6% 25.7% 36.3% 26.9%Virginia 32.3% 27.5% 33.5% 51.9% 42.7% 28.4% 35.7% 31.8%West Virginia 23.7% 25.7% 19.0% 21.4% 38.3% 20.2% 22.9% 23.9%
East South Central:Alabama 29.4% 27.0% 34.3% 41.5% 38.1% 23.5% 34.2% 28.0%Kentucky 25.4% 31.1% 29.5% * 30.3% 28.4% 22.9% 28.4% 24.8%Mississippi 30.4% 29.1% * 32.4% * 44.7% 34.4% 27.6% 36.1% 29.8%Tennessee 27.4% 30.9% 29.1% * 48.7% 31.9% 23.8% 37.0% 26.2%
West South Central:Arkansas 27.5% 31.4% 49.4% 32.0% 28.2% 26.0% 34.7% 26.9%Louisiana 32.2% 21.8% * 36.8% 33.5% 45.7% 28.0% 28.7% 32.8%Oklahoma 32.7% 33.8% 56.7% 37.7% 44.6% 24.2% 40.9% 31.1%Texas 32.4% 23.1% 40.1% 38.2% 37.6% 30.4% 38.5% 31.4%
Mountain:Arizona 33.6% 25.2% 51.0% 43.0% 37.4% 31.3% 40.6% 32.9%Colorado 34.7% 28.1% * 32.4% 43.7% 49.0% 30.6% 39.3% 33.9%Idaho 23.6% 32.2% 48.6% 34.7% 29.9% 16.3% 39.0% 19.5%Montana 33.4% 29.9% 52.0% 27.7% 40.3% 27.8% 33.9% 33.3%Nevada 31.1% 21.3% * 43.8% 35.9% 33.6% 30.5% 26.8% 31.8%New Mexico 33.3% 24.5% 10.7% * 34.4% 26.1% 38.2% 26.7% 34.2%Utah 23.4% 17.7% 33.7% 30.5% 26.7% 20.1% 24.3% 23.2%Wyoming 24.0% 28.2% 28.4% 26.1% 26.2% 21.7% 28.8% 22.7%
Pacific:Alaska 24.3% 23.3% * 16.8% * 18.1% * 27.5% 25.1% 16.6% 26.2%California 27.7% 19.0% 32.1% 33.1% 29.9% 26.8% 29.3% 27.5%Hawaii 23.5% 8.5% * 27.1% 11.7% * 23.9% 28.5% 14.6% * 25.8%Oregon 26.2% 26.4% * 30.2% 33.2% 36.7% 22.2% 30.5% 25.4%Washington 25.0% 13.7% * 29.3% 33.0% 27.6% 23.8% 20.8% 25.8%
Source: Agency for Healthcare Research and Quality, Center for Financing, Access and Cost Trends. 2008 Medical Expenditure PanelSurvey-Insurance Component.Note: Definitions and descriptions of the methods used for this survey can be found in the Technical Appendix.* Figure does not meet standard of reliability or precision.
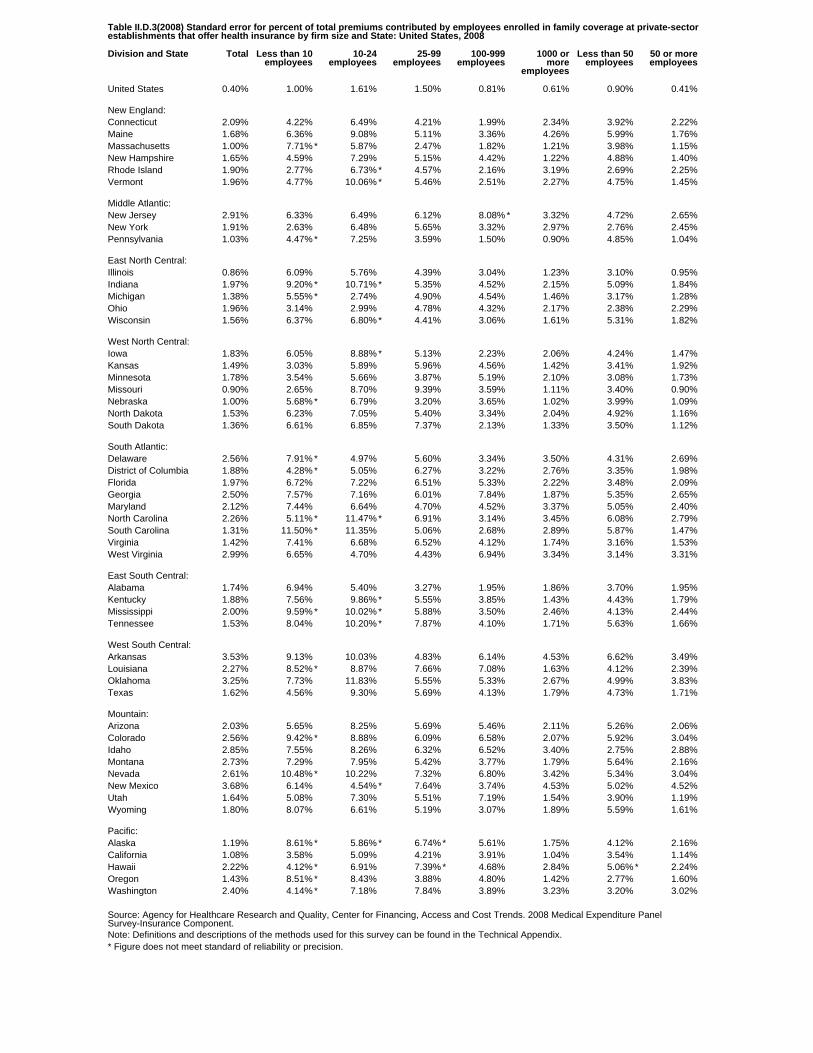
Table II.D.3(2008) Standard error for percent of total premiums contributed by employees enrolled in family coverage at private-sectorestablishments that offer health insurance by firm size and State: United States, 2008
Division and State Total Less than 10employees
10-24employees
25-99employees
100-999employees
1000 ormore
employees
Less than 50employees
50 or moreemployees
United States 0.40% 1.00% 1.61% 1.50% 0.81% 0.61% 0.90% 0.41%
New England:Connecticut 2.09% 4.22% 6.49% 4.21% 1.99% 2.34% 3.92% 2.22%Maine 1.68% 6.36% 9.08% 5.11% 3.36% 4.26% 5.99% 1.76%Massachusetts 1.00% 7.71% * 5.87% 2.47% 1.82% 1.21% 3.98% 1.15%New Hampshire 1.65% 4.59% 7.29% 5.15% 4.42% 1.22% 4.88% 1.40%Rhode Island 1.90% 2.77% 6.73% * 4.57% 2.16% 3.19% 2.69% 2.25%Vermont 1.96% 4.77% 10.06% * 5.46% 2.51% 2.27% 4.75% 1.45%
Middle Atlantic:New Jersey 2.91% 6.33% 6.49% 6.12% 8.08% * 3.32% 4.72% 2.65%New York 1.91% 2.63% 6.48% 5.65% 3.32% 2.97% 2.76% 2.45%Pennsylvania 1.03% 4.47% * 7.25% 3.59% 1.50% 0.90% 4.85% 1.04%
East North Central:Illinois 0.86% 6.09% 5.76% 4.39% 3.04% 1.23% 3.10% 0.95%Indiana 1.97% 9.20% * 10.71% * 5.35% 4.52% 2.15% 5.09% 1.84%Michigan 1.38% 5.55% * 2.74% 4.90% 4.54% 1.46% 3.17% 1.28%Ohio 1.96% 3.14% 2.99% 4.78% 4.32% 2.17% 2.38% 2.29%Wisconsin 1.56% 6.37% 6.80% * 4.41% 3.06% 1.61% 5.31% 1.82%
West North Central:Iowa 1.83% 6.05% 8.88% * 5.13% 2.23% 2.06% 4.24% 1.47%Kansas 1.49% 3.03% 5.89% 5.96% 4.56% 1.42% 3.41% 1.92%Minnesota 1.78% 3.54% 5.66% 3.87% 5.19% 2.10% 3.08% 1.73%Missouri 0.90% 2.65% 8.70% 9.39% 3.59% 1.11% 3.40% 0.90%Nebraska 1.00% 5.68% * 6.79% 3.20% 3.65% 1.02% 3.99% 1.09%North Dakota 1.53% 6.23% 7.05% 5.40% 3.34% 2.04% 4.92% 1.16%South Dakota 1.36% 6.61% 6.85% 7.37% 2.13% 1.33% 3.50% 1.12%
South Atlantic:Delaware 2.56% 7.91% * 4.97% 5.60% 3.34% 3.50% 4.31% 2.69%District of Columbia 1.88% 4.28% * 5.05% 6.27% 3.22% 2.76% 3.35% 1.98%Florida 1.97% 6.72% 7.22% 6.51% 5.33% 2.22% 3.48% 2.09%Georgia 2.50% 7.57% 7.16% 6.01% 7.84% 1.87% 5.35% 2.65%Maryland 2.12% 7.44% 6.64% 4.70% 4.52% 3.37% 5.05% 2.40%North Carolina 2.26% 5.11% * 11.47% * 6.91% 3.14% 3.45% 6.08% 2.79%South Carolina 1.31% 11.50% * 11.35% 5.06% 2.68% 2.89% 5.87% 1.47%Virginia 1.42% 7.41% 6.68% 6.52% 4.12% 1.74% 3.16% 1.53%West Virginia 2.99% 6.65% 4.70% 4.43% 6.94% 3.34% 3.14% 3.31%
East South Central:Alabama 1.74% 6.94% 5.40% 3.27% 1.95% 1.86% 3.70% 1.95%Kentucky 1.88% 7.56% 9.86% * 5.55% 3.85% 1.43% 4.43% 1.79%Mississippi 2.00% 9.59% * 10.02% * 5.88% 3.50% 2.46% 4.13% 2.44%Tennessee 1.53% 8.04% 10.20% * 7.87% 4.10% 1.71% 5.63% 1.66%
West South Central:Arkansas 3.53% 9.13% 10.03% 4.83% 6.14% 4.53% 6.62% 3.49%Louisiana 2.27% 8.52% * 8.87% 7.66% 7.08% 1.63% 4.12% 2.39%Oklahoma 3.25% 7.73% 11.83% 5.55% 5.33% 2.67% 4.99% 3.83%Texas 1.62% 4.56% 9.30% 5.69% 4.13% 1.79% 4.73% 1.71%
Mountain:Arizona 2.03% 5.65% 8.25% 5.69% 5.46% 2.11% 5.26% 2.06%Colorado 2.56% 9.42% * 8.88% 6.09% 6.58% 2.07% 5.92% 3.04%Idaho 2.85% 7.55% 8.26% 6.32% 6.52% 3.40% 2.75% 2.88%Montana 2.73% 7.29% 7.95% 5.42% 3.77% 1.79% 5.64% 2.16%Nevada 2.61% 10.48% * 10.22% 7.32% 6.80% 3.42% 5.34% 3.04%New Mexico 3.68% 6.14% 4.54% * 7.64% 3.74% 4.53% 5.02% 4.52%Utah 1.64% 5.08% 7.30% 5.51% 7.19% 1.54% 3.90% 1.19%Wyoming 1.80% 8.07% 6.61% 5.19% 3.07% 1.89% 5.59% 1.61%
Pacific:Alaska 1.19% 8.61% * 5.86% * 6.74% * 5.61% 1.75% 4.12% 2.16%California 1.08% 3.58% 5.09% 4.21% 3.91% 1.04% 3.54% 1.14%Hawaii 2.22% 4.12% * 6.91% 7.39% * 4.68% 2.84% 5.06% * 2.24%Oregon 1.43% 8.51% * 8.43% 3.88% 4.80% 1.42% 2.77% 1.60%Washington 2.40% 4.14% * 7.18% 7.84% 3.89% 3.23% 3.20% 3.02%
Source: Agency for Healthcare Research and Quality, Center for Financing, Access and Cost Trends. 2008 Medical Expenditure PanelSurvey-Insurance Component.Note: Definitions and descriptions of the methods used for this survey can be found in the Technical Appendix.* Figure does not meet standard of reliability or precision.
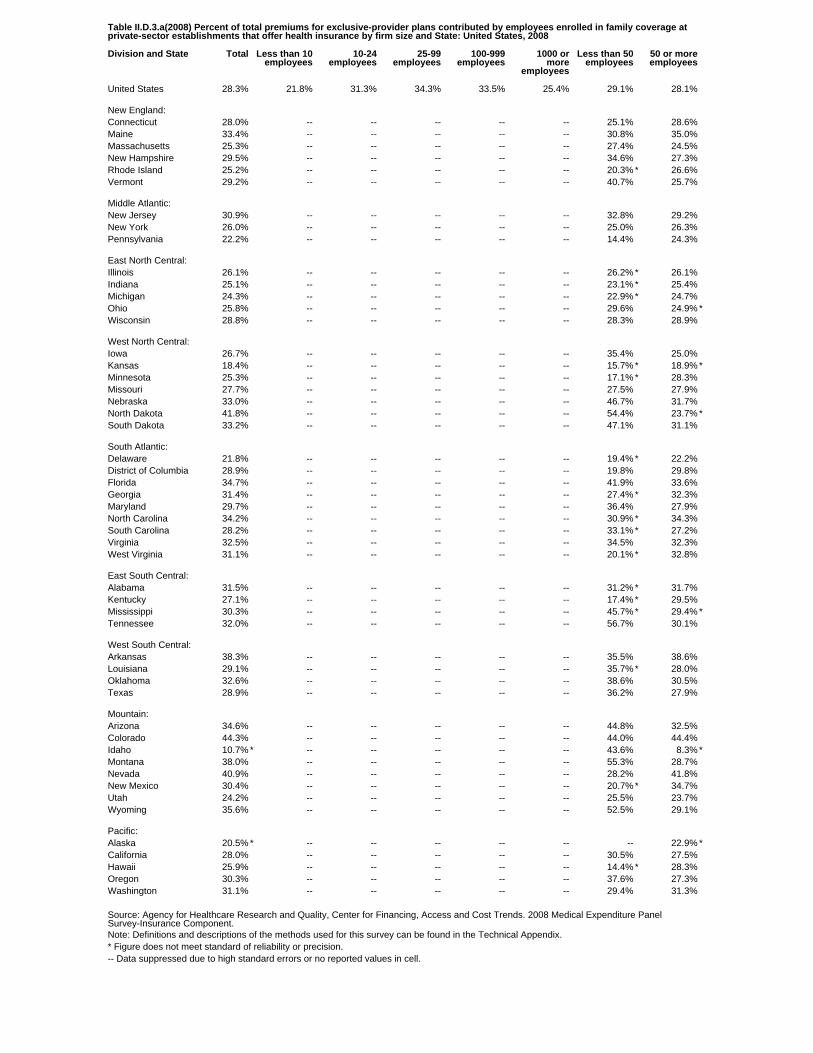
Table II.D.3.a(2008) Percent of total premiums for exclusive-provider plans contributed by employees enrolled in family coverage atprivate-sector establishments that offer health insurance by firm size and State: United States, 2008
Division and State Total Less than 10employees
10-24employees
25-99employees
100-999employees
1000 ormore
employees
Less than 50employees
50 or moreemployees
United States 28.3% 21.8% 31.3% 34.3% 33.5% 25.4% 29.1% 28.1%
New England:Connecticut 28.0% -- -- -- -- -- 25.1% 28.6%Maine 33.4% -- -- -- -- -- 30.8% 35.0%Massachusetts 25.3% -- -- -- -- -- 27.4% 24.5%New Hampshire 29.5% -- -- -- -- -- 34.6% 27.3%Rhode Island 25.2% -- -- -- -- -- 20.3% * 26.6%Vermont 29.2% -- -- -- -- -- 40.7% 25.7%
Middle Atlantic:New Jersey 30.9% -- -- -- -- -- 32.8% 29.2%New York 26.0% -- -- -- -- -- 25.0% 26.3%Pennsylvania 22.2% -- -- -- -- -- 14.4% 24.3%
East North Central:Illinois 26.1% -- -- -- -- -- 26.2% * 26.1%Indiana 25.1% -- -- -- -- -- 23.1% * 25.4%Michigan 24.3% -- -- -- -- -- 22.9% * 24.7%Ohio 25.8% -- -- -- -- -- 29.6% 24.9% *Wisconsin 28.8% -- -- -- -- -- 28.3% 28.9%
West North Central:Iowa 26.7% -- -- -- -- -- 35.4% 25.0%Kansas 18.4% -- -- -- -- -- 15.7% * 18.9% *Minnesota 25.3% -- -- -- -- -- 17.1% * 28.3%Missouri 27.7% -- -- -- -- -- 27.5% 27.9%Nebraska 33.0% -- -- -- -- -- 46.7% 31.7%North Dakota 41.8% -- -- -- -- -- 54.4% 23.7% *South Dakota 33.2% -- -- -- -- -- 47.1% 31.1%
South Atlantic:Delaware 21.8% -- -- -- -- -- 19.4% * 22.2%District of Columbia 28.9% -- -- -- -- -- 19.8% 29.8%Florida 34.7% -- -- -- -- -- 41.9% 33.6%Georgia 31.4% -- -- -- -- -- 27.4% * 32.3%Maryland 29.7% -- -- -- -- -- 36.4% 27.9%North Carolina 34.2% -- -- -- -- -- 30.9% * 34.3%South Carolina 28.2% -- -- -- -- -- 33.1% * 27.2%Virginia 32.5% -- -- -- -- -- 34.5% 32.3%West Virginia 31.1% -- -- -- -- -- 20.1% * 32.8%
East South Central:Alabama 31.5% -- -- -- -- -- 31.2% * 31.7%Kentucky 27.1% -- -- -- -- -- 17.4% * 29.5%Mississippi 30.3% -- -- -- -- -- 45.7% * 29.4% *Tennessee 32.0% -- -- -- -- -- 56.7% 30.1%
West South Central:Arkansas 38.3% -- -- -- -- -- 35.5% 38.6%Louisiana 29.1% -- -- -- -- -- 35.7% * 28.0%Oklahoma 32.6% -- -- -- -- -- 38.6% 30.5%Texas 28.9% -- -- -- -- -- 36.2% 27.9%
Mountain:Arizona 34.6% -- -- -- -- -- 44.8% 32.5%Colorado 44.3% -- -- -- -- -- 44.0% 44.4%Idaho 10.7% * -- -- -- -- -- 43.6% 8.3% *Montana 38.0% -- -- -- -- -- 55.3% 28.7%Nevada 40.9% -- -- -- -- -- 28.2% 41.8%New Mexico 30.4% -- -- -- -- -- 20.7% * 34.7%Utah 24.2% -- -- -- -- -- 25.5% 23.7%Wyoming 35.6% -- -- -- -- -- 52.5% 29.1%
Pacific:Alaska 20.5% * -- -- -- -- -- -- 22.9% *California 28.0% -- -- -- -- -- 30.5% 27.5%Hawaii 25.9% -- -- -- -- -- 14.4% * 28.3%Oregon 30.3% -- -- -- -- -- 37.6% 27.3%Washington 31.1% -- -- -- -- -- 29.4% 31.3%
Source: Agency for Healthcare Research and Quality, Center for Financing, Access and Cost Trends. 2008 Medical Expenditure PanelSurvey-Insurance Component.Note: Definitions and descriptions of the methods used for this survey can be found in the Technical Appendix.* Figure does not meet standard of reliability or precision.-- Data suppressed due to high standard errors or no reported values in cell.

Table II.D.3.a(2008) Standard error for percent of total premiums for exclusive-provider plans contributed by employees enrolled infamily coverage at private-sector establishments that offer health insurance by firm size and State: United States, 2008
Division and State Total Less than 10employees
10-24employees
25-99employees
100-999employees
1000 ormore
employees
Less than 50employees
50 or moreemployees
United States 0.75% 1.97% 2.14% 2.85% 1.91% 0.47% 1.69% 0.68%
New England:Connecticut 3.35% -- -- -- -- -- 6.33% 2.26%Maine 3.16% -- -- -- -- -- 5.74% 5.69%Massachusetts 0.99% -- -- -- -- -- 4.29% 1.47%New Hampshire 1.45% -- -- -- -- -- 5.55% 3.41%Rhode Island 5.48% -- -- -- -- -- 7.20% * 5.24%Vermont 4.72% -- -- -- -- -- 11.75% 5.46%
Middle Atlantic:New Jersey 5.21% -- -- -- -- -- 8.90% 8.65%New York 1.95% -- -- -- -- -- 4.44% 2.35%Pennsylvania 1.93% -- -- -- -- -- 4.26% 1.74%
East North Central:Illinois 1.77% -- -- -- -- -- 10.35% * 2.12%Indiana 2.54% -- -- -- -- -- 8.39% * 3.44%Michigan 2.23% -- -- -- -- -- 6.96% * 3.51%Ohio 5.38% -- -- -- -- -- 7.10% 7.61% *Wisconsin 1.75% -- -- -- -- -- 6.55% 2.50%
West North Central:Iowa 3.09% -- -- -- -- -- 10.63% 4.14%Kansas 5.44% -- -- -- -- -- 13.57% * 5.75% *Minnesota 2.36% -- -- -- -- -- 6.05% * 3.13%Missouri 2.02% -- -- -- -- -- 7.15% 2.09%Nebraska 2.71% -- -- -- -- -- 13.04% 2.72%North Dakota 8.05% -- -- -- -- -- 11.13% 9.30% *South Dakota 5.06% -- -- -- -- -- 12.45% 5.74%
South Atlantic:Delaware 3.88% -- -- -- -- -- 7.25% * 3.48%District of Columbia 1.64% -- -- -- -- -- 4.90% 1.78%Florida 4.15% -- -- -- -- -- 8.46% 4.02%Georgia 2.92% -- -- -- -- -- 9.19% * 4.84%Maryland 3.71% -- -- -- -- -- 8.37% 3.59%North Carolina 7.42% -- -- -- -- -- 10.59% * 7.38%South Carolina 6.60% -- -- -- -- -- 11.89% * 3.57%Virginia 1.52% -- -- -- -- -- 7.52% 1.32%West Virginia 8.65% -- -- -- -- -- 9.09% * 9.01%
East South Central:Alabama 6.40% -- -- -- -- -- 10.30% * 5.62%Kentucky 5.30% -- -- -- -- -- 6.00% * 8.73%Mississippi 8.43% -- -- -- -- -- 14.19% * 8.96% *Tennessee 3.09% -- -- -- -- -- 15.19% 3.95%
West South Central:Arkansas 5.14% -- -- -- -- -- 9.48% 5.32%Louisiana 8.54% -- -- -- -- -- 12.84% * 5.25%Oklahoma 6.12% -- -- -- -- -- 9.04% 6.69%Texas 3.41% -- -- -- -- -- 8.46% 2.51%
Mountain:Arizona 5.20% -- -- -- -- -- 10.95% 5.62%Colorado 7.91% -- -- -- -- -- 10.65% 7.49%Idaho 6.48% * -- -- -- -- -- 12.45% 6.05% *Montana 6.07% -- -- -- -- -- 15.41% 5.60%Nevada 6.98% -- -- -- -- -- 8.36% 7.13%New Mexico 5.48% -- -- -- -- -- 8.68% * 5.43%Utah 2.73% -- -- -- -- -- 5.58% 2.73%Wyoming 5.37% -- -- -- -- -- 14.66% 5.19%
Pacific:Alaska 6.63% * -- -- -- -- -- -- 7.15% *California 2.35% -- -- -- -- -- 5.14% 2.24%Hawaii 3.04% -- -- -- -- -- 5.90% * 4.01%Oregon 4.62% -- -- -- -- -- 8.47% 5.66%Washington 6.08% -- -- -- -- -- 8.73% 6.05%
Source: Agency for Healthcare Research and Quality, Center for Financing, Access and Cost Trends. 2008 Medical Expenditure PanelSurvey-Insurance Component.Note: Definitions and descriptions of the methods used for this survey can be found in the Technical Appendix.* Figure does not meet standard of reliability or precision.-- Data suppressed due to high standard errors or no reported values in cell.
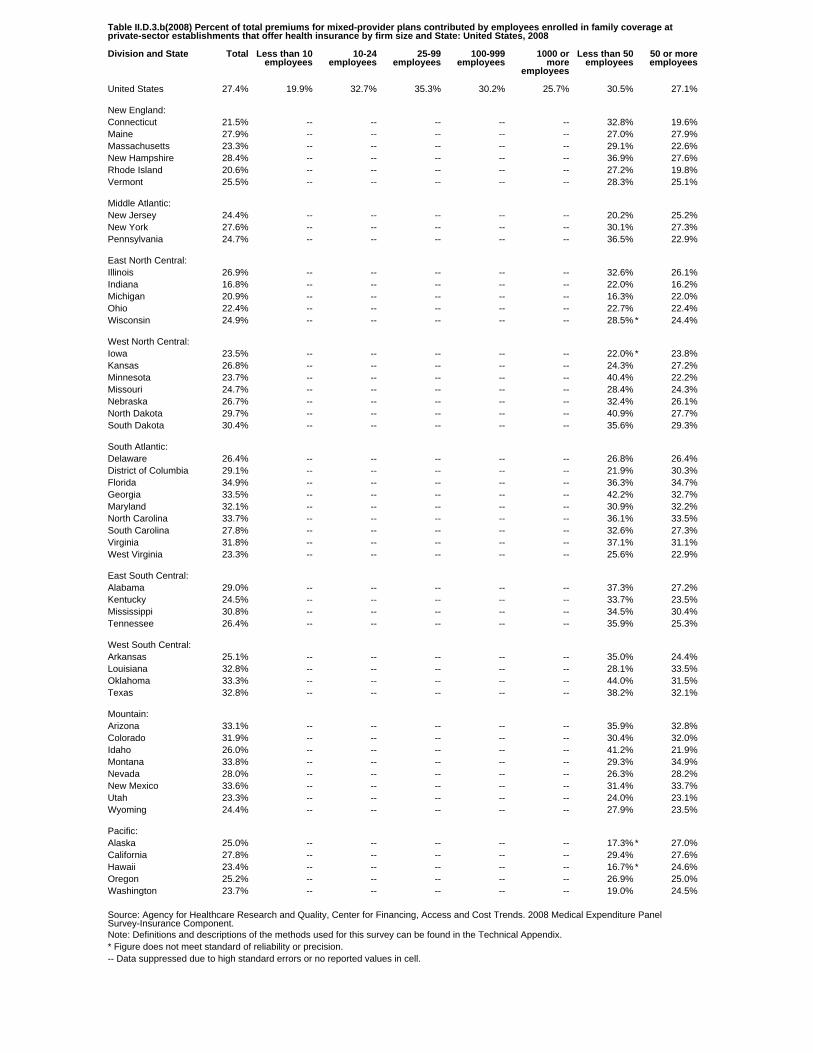
Table II.D.3.b(2008) Percent of total premiums for mixed-provider plans contributed by employees enrolled in family coverage atprivate-sector establishments that offer health insurance by firm size and State: United States, 2008
Division and State Total Less than 10employees
10-24employees
25-99employees
100-999employees
1000 ormore
employees
Less than 50employees
50 or moreemployees
United States 27.4% 19.9% 32.7% 35.3% 30.2% 25.7% 30.5% 27.1%
New England:Connecticut 21.5% -- -- -- -- -- 32.8% 19.6%Maine 27.9% -- -- -- -- -- 27.0% 27.9%Massachusetts 23.3% -- -- -- -- -- 29.1% 22.6%New Hampshire 28.4% -- -- -- -- -- 36.9% 27.6%Rhode Island 20.6% -- -- -- -- -- 27.2% 19.8%Vermont 25.5% -- -- -- -- -- 28.3% 25.1%
Middle Atlantic:New Jersey 24.4% -- -- -- -- -- 20.2% 25.2%New York 27.6% -- -- -- -- -- 30.1% 27.3%Pennsylvania 24.7% -- -- -- -- -- 36.5% 22.9%
East North Central:Illinois 26.9% -- -- -- -- -- 32.6% 26.1%Indiana 16.8% -- -- -- -- -- 22.0% 16.2%Michigan 20.9% -- -- -- -- -- 16.3% 22.0%Ohio 22.4% -- -- -- -- -- 22.7% 22.4%Wisconsin 24.9% -- -- -- -- -- 28.5% * 24.4%
West North Central:Iowa 23.5% -- -- -- -- -- 22.0% * 23.8%Kansas 26.8% -- -- -- -- -- 24.3% 27.2%Minnesota 23.7% -- -- -- -- -- 40.4% 22.2%Missouri 24.7% -- -- -- -- -- 28.4% 24.3%Nebraska 26.7% -- -- -- -- -- 32.4% 26.1%North Dakota 29.7% -- -- -- -- -- 40.9% 27.7%South Dakota 30.4% -- -- -- -- -- 35.6% 29.3%
South Atlantic:Delaware 26.4% -- -- -- -- -- 26.8% 26.4%District of Columbia 29.1% -- -- -- -- -- 21.9% 30.3%Florida 34.9% -- -- -- -- -- 36.3% 34.7%Georgia 33.5% -- -- -- -- -- 42.2% 32.7%Maryland 32.1% -- -- -- -- -- 30.9% 32.2%North Carolina 33.7% -- -- -- -- -- 36.1% 33.5%South Carolina 27.8% -- -- -- -- -- 32.6% 27.3%Virginia 31.8% -- -- -- -- -- 37.1% 31.1%West Virginia 23.3% -- -- -- -- -- 25.6% 22.9%
East South Central:Alabama 29.0% -- -- -- -- -- 37.3% 27.2%Kentucky 24.5% -- -- -- -- -- 33.7% 23.5%Mississippi 30.8% -- -- -- -- -- 34.5% 30.4%Tennessee 26.4% -- -- -- -- -- 35.9% 25.3%
West South Central:Arkansas 25.1% -- -- -- -- -- 35.0% 24.4%Louisiana 32.8% -- -- -- -- -- 28.1% 33.5%Oklahoma 33.3% -- -- -- -- -- 44.0% 31.5%Texas 32.8% -- -- -- -- -- 38.2% 32.1%
Mountain:Arizona 33.1% -- -- -- -- -- 35.9% 32.8%Colorado 31.9% -- -- -- -- -- 30.4% 32.0%Idaho 26.0% -- -- -- -- -- 41.2% 21.9%Montana 33.8% -- -- -- -- -- 29.3% 34.9%Nevada 28.0% -- -- -- -- -- 26.3% 28.2%New Mexico 33.6% -- -- -- -- -- 31.4% 33.7%Utah 23.3% -- -- -- -- -- 24.0% 23.1%Wyoming 24.4% -- -- -- -- -- 27.9% 23.5%
Pacific:Alaska 25.0% -- -- -- -- -- 17.3% * 27.0%California 27.8% -- -- -- -- -- 29.4% 27.6%Hawaii 23.4% -- -- -- -- -- 16.7% * 24.6%Oregon 25.2% -- -- -- -- -- 26.9% 25.0%Washington 23.7% -- -- -- -- -- 19.0% 24.5%
Source: Agency for Healthcare Research and Quality, Center for Financing, Access and Cost Trends. 2008 Medical Expenditure PanelSurvey-Insurance Component.Note: Definitions and descriptions of the methods used for this survey can be found in the Technical Appendix.* Figure does not meet standard of reliability or precision.-- Data suppressed due to high standard errors or no reported values in cell.

Table II.D.3.b(2008) Standard error for percent of total premiums for mixed-provider plans contributed by employees enrolled in familycoverage at private-sector establishments that offer health insurance by firm size and State: United States, 2008
Division and State Total Less than 10employees
10-24employees
25-99employees
100-999employees
1000 ormore
employees
Less than 50employees
50 or moreemployees
United States 0.38% 1.27% 1.82% 1.43% 0.84% 0.64% 1.08% 0.43%
New England:Connecticut 2.51% -- -- -- -- -- 5.66% 2.59%Maine 1.36% -- -- -- -- -- 6.02% 2.06%Massachusetts 1.69% -- -- -- -- -- 7.11% 1.78%New Hampshire 2.33% -- -- -- -- -- 8.15% 2.05%Rhode Island 2.24% -- -- -- -- -- 6.35% 2.66%Vermont 2.06% -- -- -- -- -- 6.70% 1.86%
Middle Atlantic:New Jersey 3.03% -- -- -- -- -- 4.75% 2.87%New York 2.51% -- -- -- -- -- 5.05% 2.79%Pennsylvania 1.26% -- -- -- -- -- 6.55% 1.07%
East North Central:Illinois 1.12% -- -- -- -- -- 3.74% 1.11%Indiana 1.77% -- -- -- -- -- 3.90% 2.21%Michigan 1.80% -- -- -- -- -- 3.84% 1.62%Ohio 1.93% -- -- -- -- -- 2.34% 2.23%Wisconsin 1.99% -- -- -- -- -- 8.83% * 1.97%
West North Central:Iowa 1.99% -- -- -- -- -- 6.68% * 1.45%Kansas 1.35% -- -- -- -- -- 4.75% 1.72%Minnesota 1.93% -- -- -- -- -- 6.12% 1.93%Missouri 0.82% -- -- -- -- -- 5.39% 0.99%Nebraska 1.05% -- -- -- -- -- 4.89% 1.16%North Dakota 2.25% -- -- -- -- -- 6.08% 1.93%South Dakota 1.57% -- -- -- -- -- 4.34% 1.24%
South Atlantic:Delaware 2.64% -- -- -- -- -- 7.32% 2.67%District of Columbia 2.22% -- -- -- -- -- 3.58% 2.25%Florida 2.58% -- -- -- -- -- 4.94% 2.56%Georgia 2.87% -- -- -- -- -- 7.04% 2.95%Maryland 2.44% -- -- -- -- -- 5.25% 2.77%North Carolina 2.48% -- -- -- -- -- 7.01% 3.16%South Carolina 1.27% -- -- -- -- -- 5.88% 1.40%Virginia 1.86% -- -- -- -- -- 6.39% 1.80%West Virginia 1.99% -- -- -- -- -- 4.29% 2.44%
East South Central:Alabama 1.86% -- -- -- -- -- 4.81% 1.96%Kentucky 1.62% -- -- -- -- -- 6.23% 1.69%Mississippi 1.93% -- -- -- -- -- 5.69% 2.35%Tennessee 1.51% -- -- -- -- -- 6.27% 1.74%
West South Central:Arkansas 3.20% -- -- -- -- -- 8.23% 2.88%Louisiana 2.20% -- -- -- -- -- 5.82% 2.44%Oklahoma 3.48% -- -- -- -- -- 5.43% 3.82%Texas 1.96% -- -- -- -- -- 5.35% 1.99%
Mountain:Arizona 1.98% -- -- -- -- -- 6.68% 2.16%Colorado 2.28% -- -- -- -- -- 6.54% 2.17%Idaho 2.79% -- -- -- -- -- 4.02% 2.50%Montana 2.74% -- -- -- -- -- 6.69% 2.25%Nevada 1.99% -- -- -- -- -- 7.16% 2.13%New Mexico 4.36% -- -- -- -- -- 9.24% 5.26%Utah 2.06% -- -- -- -- -- 3.94% 1.87%Wyoming 2.28% -- -- -- -- -- 8.29% 1.95%
Pacific:Alaska 1.02% -- -- -- -- -- 6.93% * 2.63%California 1.27% -- -- -- -- -- 3.94% 1.36%Hawaii 2.48% -- -- -- -- -- 5.04% * 2.53%Oregon 1.50% -- -- -- -- -- 5.68% 1.46%Washington 2.10% -- -- -- -- -- 2.39% 2.74%
Source: Agency for Healthcare Research and Quality, Center for Financing, Access and Cost Trends. 2008 Medical Expenditure PanelSurvey-Insurance Component.Note: Definitions and descriptions of the methods used for this survey can be found in the Technical Appendix.* Figure does not meet standard of reliability or precision.-- Data suppressed due to high standard errors or no reported values in cell.

Table II.D.3.c(2008) Percent of total premiums for any-provider plans contributed by employees enrolled in family coverage atprivate-sector establishments that offer health insurance by firm size and State: United States, 2008
Division and State Total Less than 10employees
10-24employees
25-99employees
100-999employees
1000 ormore
employees
Less than 50employees
50 or moreemployees
United States 27.2% 17.7% 28.8% 36.0% 35.8% 23.0% 26.7% 27.4%
New England:Connecticut 19.4% * -- -- -- -- -- 21.4% * 18.2% *Maine 42.8% -- -- -- -- -- 43.7% 42.6%Massachusetts 28.2% -- -- -- -- -- 20.7% 40.4%New Hampshire 30.4% -- -- -- -- -- 27.2% 32.2%Rhode Island 25.1% -- -- -- -- -- 25.3% 24.9% *Vermont 24.8% -- -- -- -- -- 20.2% * 27.7% *
Middle Atlantic:New Jersey 29.4% * -- -- -- -- -- 31.2% * 27.0% *New York 11.2% * -- -- -- -- -- 15.9% * 8.1% *Pennsylvania 23.7% * -- -- -- -- -- 13.3% * 28.7% *
East North Central:Illinois 25.3% * -- -- -- -- -- 19.9% * 26.9% *Indiana 48.3% -- -- -- -- -- 48.0% * 48.7%Michigan 29.8% -- -- -- -- -- 15.9% * 37.2%Ohio 27.4% * -- -- -- -- -- 22.0% * 31.0% *Wisconsin 27.1% -- -- -- -- -- 33.1% * 23.3% *
West North Central:Iowa 14.8% -- -- -- -- -- 20.1% 12.5% *Kansas 25.2% -- -- -- -- -- 24.2% 28.0% *Minnesota 26.9% -- -- -- -- -- 33.0% 14.9% *Missouri 44.0% -- -- -- -- -- 51.5% 41.6%Nebraska 20.9% * -- -- -- -- -- 11.7% * 25.5% *North Dakota 28.9% -- -- -- -- -- 36.4% 24.6%South Dakota 29.3% * -- -- -- -- -- 24.1% * 36.5%
South Atlantic:Delaware 24.8% -- -- -- -- -- 22.8% 25.6%District of Columbia 22.4% -- -- -- -- -- -- 24.7%Florida 30.5% * -- -- -- -- -- 19.0% * 33.9% *Georgia 28.1% -- -- -- -- -- 41.6% 22.9% *Maryland 29.0% -- -- -- -- -- 17.5% * 35.0%North Carolina 29.7% -- -- -- -- -- 8.6% * 32.2%South Carolina 29.6% -- -- -- -- -- 50.3% 22.9% *Virginia 38.7% -- -- -- -- -- 31.3% 43.1%West Virginia 11.4% * -- -- -- -- -- 17.2% * 4.1% *
East South Central:Alabama 31.0% -- -- -- -- -- 27.2% 34.3%Kentucky 29.9% -- -- -- -- -- 25.2% * 33.7%Mississippi 25.9% * -- -- -- -- -- 46.4% * 23.5% *Tennessee 37.5% -- -- -- -- -- 26.1% * 40.3%
West South Central:Arkansas 29.8% * -- -- -- -- -- 30.3% 29.3% *Louisiana 29.0% -- -- -- -- -- 25.3% * 35.3%Oklahoma 23.3% -- -- -- -- -- 26.7% * 20.3% *Texas 34.7% * -- -- -- -- -- 43.7% 28.1% *
Mountain:Arizona 38.3% * -- -- -- -- -- 57.7% 34.5% *Colorado 47.1% -- -- -- -- -- 71.0% * 24.0% *Idaho 27.7% -- -- -- -- -- 30.6% * 25.7% *Montana 27.6% -- -- -- -- -- 39.4% 21.1%Nevada 31.4% -- -- -- -- -- 27.5% * 39.6%New Mexico 48.5% -- -- -- -- -- 34.7% * 66.2%Utah 22.5% -- -- -- -- -- 20.8% * 22.6%Wyoming 19.4% -- -- -- -- -- 24.1% * 17.8% *
Pacific:Alaska 21.3% * -- -- -- -- -- 17.6% * 22.4% *California 22.8% -- -- -- -- -- 19.1% * 24.6%Hawaii 16.2% * -- -- -- -- -- 11.4% * 30.7%Oregon 20.9% * -- -- -- -- -- 18.2% * 24.0% *Washington 32.1% * -- -- -- -- -- 30.7% * 33.2% *
Source: Agency for Healthcare Research and Quality, Center for Financing, Access and Cost Trends. 2008 Medical Expenditure PanelSurvey-Insurance Component.Note: Definitions and descriptions of the methods used for this survey can be found in the Technical Appendix.* Figure does not meet standard of reliability or precision.-- Data suppressed due to high standard errors or no reported values in cell.

Table II.D.3.c(2008) Standard error for percent of total premiums for any-provider plans contributed by employees enrolled in familycoverage at private-sector establishments that offer health insurance by firm size and State: United States, 2008
Division and State Total Less than 10employees
10-24employees
25-99employees
100-999employees
1000 ormore
employees
Less than 50employees
50 or moreemployees
United States 1.75% 2.09% 3.20% 3.03% 2.03% 2.23% 2.12% 1.94%
New England:Connecticut 9.66% * -- -- -- -- -- 6.55% * 11.65% *Maine 9.24% -- -- -- -- -- 11.12% 9.75%Massachusetts 6.24% -- -- -- -- -- 6.06% 8.20%New Hampshire 6.22% -- -- -- -- -- 8.10% 8.26%Rhode Island 5.32% -- -- -- -- -- 5.47% 8.27% *Vermont 3.88% -- -- -- -- -- 6.57% * 10.87% *
Middle Atlantic:New Jersey 10.41% * -- -- -- -- -- 11.25% * 10.29% *New York 7.70% * -- -- -- -- -- 8.18% * 12.08% *Pennsylvania 8.82% * -- -- -- -- -- 4.90% * 8.85% *
East North Central:Illinois 10.57% * -- -- -- -- -- 14.84% * 9.18% *Indiana 10.76% -- -- -- -- -- 15.47% * 12.78%Michigan 7.99% -- -- -- -- -- 4.98% * 10.00%Ohio 8.99% * -- -- -- -- -- 9.79% * 10.16% *Wisconsin 6.50% -- -- -- -- -- 9.96% * 7.85% *
West North Central:Iowa 4.12% -- -- -- -- -- 5.45% 4.00% *Kansas 4.98% -- -- -- -- -- 7.24% 9.31% *Minnesota 4.26% -- -- -- -- -- 8.11% 7.33% *Missouri 9.06% -- -- -- -- -- 13.10% 9.07%Nebraska 10.71% * -- -- -- -- -- 10.14% * 11.08% *North Dakota 3.56% -- -- -- -- -- 9.85% 4.73%South Dakota 9.76% * -- -- -- -- -- 8.35% * 10.45%
South Atlantic:Delaware 6.59% -- -- -- -- -- 6.73% 6.58%District of Columbia 4.39% -- -- -- -- -- -- 4.19%Florida 10.50% * -- -- -- -- -- 6.11% * 11.05% *Georgia 6.81% -- -- -- -- -- 11.58% 9.23% *Maryland 6.48% -- -- -- -- -- 6.90% * 8.11%North Carolina 5.40% -- -- -- -- -- 3.96% * 6.73%South Carolina 8.39% -- -- -- -- -- 12.06% 7.22% *Virginia 4.68% -- -- -- -- -- 7.11% 7.19%West Virginia 6.76% * -- -- -- -- -- 11.04% * 6.96% *
East South Central:Alabama 4.60% -- -- -- -- -- 6.91% 5.55%Kentucky 8.16% -- -- -- -- -- 9.07% * 8.40%Mississippi 12.07% * -- -- -- -- -- 15.30% * 10.08% *Tennessee 8.60% -- -- -- -- -- 9.30% * 10.53%
West South Central:Arkansas 10.71% * -- -- -- -- -- 9.06% 11.50% *Louisiana 7.61% -- -- -- -- -- 7.93% * 9.29%Oklahoma 6.04% -- -- -- -- -- 8.70% * 11.12% *Texas 10.56% * -- -- -- -- -- 9.65% 10.93% *
Mountain:Arizona 13.41% * -- -- -- -- -- 14.42% 16.35% *Colorado 12.53% -- -- -- -- -- 21.44% * 7.42% *Idaho 7.60% -- -- -- -- -- 9.56% * 9.23% *Montana 7.05% -- -- -- -- -- 9.63% 6.22%Nevada 8.60% -- -- -- -- -- 11.55% * 10.29%New Mexico 13.63% -- -- -- -- -- 10.93% * 18.34%Utah 3.67% -- -- -- -- -- 6.28% * 4.33%Wyoming 5.05% -- -- -- -- -- 8.22% * 6.70% *
Pacific:Alaska 9.12% * -- -- -- -- -- 6.86% * 11.67% *California 5.00% -- -- -- -- -- 9.52% * 6.76%Hawaii 7.35% * -- -- -- -- -- 11.01% * 8.43%Oregon 10.10% * -- -- -- -- -- 7.85% * 10.32% *Washington 11.82% * -- -- -- -- -- 11.93% * 10.25% *
Source: Agency for Healthcare Research and Quality, Center for Financing, Access and Cost Trends. 2008 Medical Expenditure PanelSurvey-Insurance Component.Note: Definitions and descriptions of the methods used for this survey can be found in the Technical Appendix.* Figure does not meet standard of reliability or precision.-- Data suppressed due to high standard errors or no reported values in cell.

Table II.D.4(2008) Percent of private-sector employees enrolled in a health insurance plan that take family coverage by firm size andState: United States, 2008
Division and State Total Less than 10employees
10-24employees
25-99employees
100-999employees
1000 ormore
employees
Less than 50employees
50 or moreemployees
United States 31.8% 25.6% 25.4% 26.5% 30.5% 34.9% 26.0% 33.1%
New England:Connecticut 34.8% 26.9% 24.5% 34.2% 29.3% 39.2% 28.6% 36.3%Maine 27.9% 21.5% 14.6% 20.9% 26.3% 36.1% 18.1% 31.2%Massachusetts 37.4% 33.3% 38.4% 41.7% 39.9% 35.9% 38.5% 37.1%New Hampshire 33.8% 22.5% 30.5% 27.2% 30.8% 40.3% 26.3% 35.9%Rhode Island 40.3% 30.1% 28.3% 36.6% 43.8% 43.4% 32.1% 42.9%Vermont 28.7% 23.9% 25.6% 24.7% 27.6% 31.9% 23.2% 30.4%
Middle Atlantic:New Jersey 31.9% 25.6% 23.0% 27.9% 32.6% 35.7% 27.0% 33.6%New York 33.8% 25.4% 27.6% 29.1% 36.9% 35.8% 26.9% 35.7%Pennsylvania 31.3% 30.0% 27.1% 26.2% 28.1% 34.4% 26.5% 32.4%
East North Central:Illinois 33.5% 21.5% 25.8% 28.5% 34.8% 36.1% 25.6% 34.9%Indiana 34.8% 31.9% 24.8% 29.3% 27.4% 40.3% 26.6% 36.3%Michigan 34.7% 38.2% 37.7% 32.9% 35.2% 34.1% 35.7% 34.5%Ohio 36.2% 29.6% 35.2% 27.3% 40.8% 37.0% 31.7% 37.1%Wisconsin 36.9% 34.9% 36.8% 28.6% 32.2% 40.6% 33.8% 37.4%
West North Central:Iowa 38.1% 37.4% 28.9% 42.0% 39.9% 37.6% 33.8% 39.1%Kansas 34.3% 31.2% 32.6% 29.2% 32.5% 37.7% 30.5% 35.3%Minnesota 34.7% 28.0% 29.8% 32.9% 34.1% 36.7% 30.7% 35.7%Missouri 31.0% 21.2% 19.9% 26.3% 29.9% 34.6% 22.4% 32.9%Nebraska 35.9% 35.2% 17.5% 28.8% 35.2% 39.1% 24.8% 37.8%North Dakota 33.3% 48.9% 34.0% 37.8% 26.5% 32.3% 37.4% 32.1%South Dakota 34.5% 40.9% 34.0% 31.8% 37.2% 32.7% 35.3% 34.3%
South Atlantic:Delaware 29.7% 30.4% 20.9% 21.9% 26.9% 33.3% 21.9% 31.2%District of Columbia 27.0% 20.5% 21.5% 21.4% 28.4% 29.0% 20.9% 28.3%Florida 29.6% 18.1% 20.7% 18.7% 28.5% 33.7% 19.2% 31.9%Georgia 32.7% 25.7% 26.7% 24.9% 28.1% 36.5% 29.0% 33.3%Maryland 28.5% 26.0% 24.8% * 27.4% 22.7% 31.0% 25.8% 29.1%North Carolina 26.4% 18.6% 15.6% 17.3% 24.1% 31.9% 14.7% 29.1%South Carolina 31.2% 26.7% 15.6% 16.6% 32.1% 35.8% 18.7% 33.9%Virginia 30.7% 24.8% 23.9% 16.0% 26.0% 36.4% 21.5% 32.4%West Virginia 37.1% 30.8% 40.7% 42.2% 33.5% 37.5% 34.7% 37.7%
East South Central:Alabama 37.5% 44.5% 35.7% 40.5% 36.8% 36.4% 41.0% 36.7%Kentucky 33.2% 25.6% 35.9% 23.1% 36.5% 34.4% 30.0% 33.8%Mississippi 29.4% 22.5% 17.6% 23.1% 22.8% 34.6% 19.4% 31.2%Tennessee 34.9% 29.5% 36.7% 26.1% 33.9% 37.1% 31.0% 35.5%
West South Central:Arkansas 31.3% 24.9% 18.9% 18.5% 27.9% 36.5% 20.4% 32.9%Louisiana 30.4% 25.1% 20.5% 33.8% 28.7% 32.0% 26.7% 31.2%Oklahoma 26.3% 21.7% 17.4% 19.6% 29.8% 28.3% 21.1% 27.7%Texas 30.2% 20.0% 20.7% 28.9% 23.3% 34.0% 24.8% 31.3%
Mountain:Arizona 28.3% 21.9% 26.9% 16.0% 29.3% 30.9% 21.9% 29.5%Colorado 31.1% 22.3% 33.3% 26.8% 27.6% 33.8% 27.5% 31.9%Idaho 31.5% 32.8% 30.5% 23.4% 36.4% 32.5% 30.5% 31.8%Montana 30.9% 29.5% 24.3% 26.4% 30.5% 36.0% 29.9% 31.3%Nevada 26.4% 27.3% 15.4% * 22.1% 16.3% 32.5% 24.0% 26.9%New Mexico 27.4% 27.0% 18.5% 20.9% 35.3% 27.1% 22.6% 28.3%Utah 37.3% 52.9% 40.4% 38.4% 40.4% 33.7% 44.5% 35.5%Wyoming 36.1% 25.2% * 33.9% 31.1% 37.7% 39.1% 30.8% 38.0%
Pacific:Alaska 27.3% 21.4% 31.0% 19.5% 30.2% 27.5% 25.8% 27.6%California 29.2% 21.0% 17.8% 23.9% 25.7% 34.3% 21.7% 31.0%Hawaii 25.5% 19.0% 15.0% 22.7% * 19.8% 34.1% 19.1% 28.0%Oregon 27.0% 25.3% 24.1% 19.7% 22.1% 31.4% 22.4% 28.2%Washington 26.2% 26.0% 19.0% * 17.1% 30.5% 28.4% 20.6% 28.0%
Source: Agency for Healthcare Research and Quality, Center for Financing, Access and Cost Trends. 2008 Medical Expenditure PanelSurvey-Insurance Component.Note: Definitions and descriptions of the methods used for this survey can be found in the Technical Appendix.* Figure does not meet standard of reliability or precision.
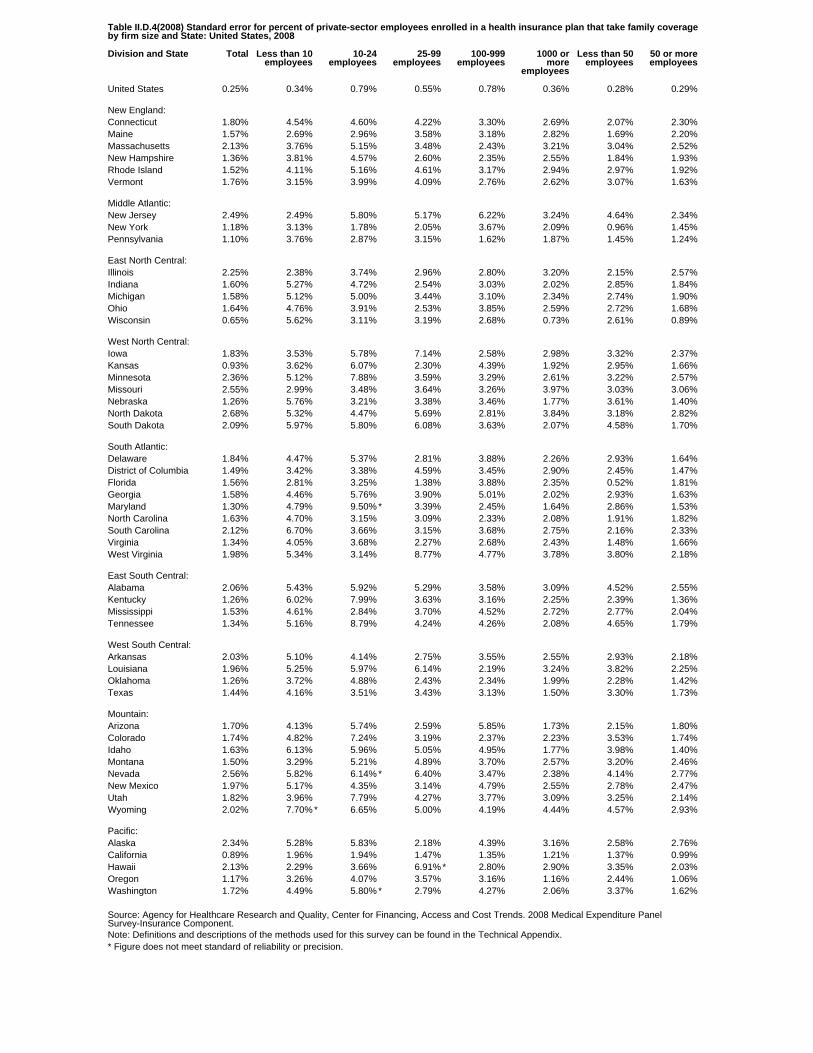
Table II.D.4(2008) Standard error for percent of private-sector employees enrolled in a health insurance plan that take family coverageby firm size and State: United States, 2008
Division and State Total Less than 10employees
10-24employees
25-99employees
100-999employees
1000 ormore
employees
Less than 50employees
50 or moreemployees
United States 0.25% 0.34% 0.79% 0.55% 0.78% 0.36% 0.28% 0.29%
New England:Connecticut 1.80% 4.54% 4.60% 4.22% 3.30% 2.69% 2.07% 2.30%Maine 1.57% 2.69% 2.96% 3.58% 3.18% 2.82% 1.69% 2.20%Massachusetts 2.13% 3.76% 5.15% 3.48% 2.43% 3.21% 3.04% 2.52%New Hampshire 1.36% 3.81% 4.57% 2.60% 2.35% 2.55% 1.84% 1.93%Rhode Island 1.52% 4.11% 5.16% 4.61% 3.17% 2.94% 2.97% 1.92%Vermont 1.76% 3.15% 3.99% 4.09% 2.76% 2.62% 3.07% 1.63%
Middle Atlantic:New Jersey 2.49% 2.49% 5.80% 5.17% 6.22% 3.24% 4.64% 2.34%New York 1.18% 3.13% 1.78% 2.05% 3.67% 2.09% 0.96% 1.45%Pennsylvania 1.10% 3.76% 2.87% 3.15% 1.62% 1.87% 1.45% 1.24%
East North Central:Illinois 2.25% 2.38% 3.74% 2.96% 2.80% 3.20% 2.15% 2.57%Indiana 1.60% 5.27% 4.72% 2.54% 3.03% 2.02% 2.85% 1.84%Michigan 1.58% 5.12% 5.00% 3.44% 3.10% 2.34% 2.74% 1.90%Ohio 1.64% 4.76% 3.91% 2.53% 3.85% 2.59% 2.72% 1.68%Wisconsin 0.65% 5.62% 3.11% 3.19% 2.68% 0.73% 2.61% 0.89%
West North Central:Iowa 1.83% 3.53% 5.78% 7.14% 2.58% 2.98% 3.32% 2.37%Kansas 0.93% 3.62% 6.07% 2.30% 4.39% 1.92% 2.95% 1.66%Minnesota 2.36% 5.12% 7.88% 3.59% 3.29% 2.61% 3.22% 2.57%Missouri 2.55% 2.99% 3.48% 3.64% 3.26% 3.97% 3.03% 3.06%Nebraska 1.26% 5.76% 3.21% 3.38% 3.46% 1.77% 3.61% 1.40%North Dakota 2.68% 5.32% 4.47% 5.69% 2.81% 3.84% 3.18% 2.82%South Dakota 2.09% 5.97% 5.80% 6.08% 3.63% 2.07% 4.58% 1.70%
South Atlantic:Delaware 1.84% 4.47% 5.37% 2.81% 3.88% 2.26% 2.93% 1.64%District of Columbia 1.49% 3.42% 3.38% 4.59% 3.45% 2.90% 2.45% 1.47%Florida 1.56% 2.81% 3.25% 1.38% 3.88% 2.35% 0.52% 1.81%Georgia 1.58% 4.46% 5.76% 3.90% 5.01% 2.02% 2.93% 1.63%Maryland 1.30% 4.79% 9.50% * 3.39% 2.45% 1.64% 2.86% 1.53%North Carolina 1.63% 4.70% 3.15% 3.09% 2.33% 2.08% 1.91% 1.82%South Carolina 2.12% 6.70% 3.66% 3.15% 3.68% 2.75% 2.16% 2.33%Virginia 1.34% 4.05% 3.68% 2.27% 2.68% 2.43% 1.48% 1.66%West Virginia 1.98% 5.34% 3.14% 8.77% 4.77% 3.78% 3.80% 2.18%
East South Central:Alabama 2.06% 5.43% 5.92% 5.29% 3.58% 3.09% 4.52% 2.55%Kentucky 1.26% 6.02% 7.99% 3.63% 3.16% 2.25% 2.39% 1.36%Mississippi 1.53% 4.61% 2.84% 3.70% 4.52% 2.72% 2.77% 2.04%Tennessee 1.34% 5.16% 8.79% 4.24% 4.26% 2.08% 4.65% 1.79%
West South Central:Arkansas 2.03% 5.10% 4.14% 2.75% 3.55% 2.55% 2.93% 2.18%Louisiana 1.96% 5.25% 5.97% 6.14% 2.19% 3.24% 3.82% 2.25%Oklahoma 1.26% 3.72% 4.88% 2.43% 2.34% 1.99% 2.28% 1.42%Texas 1.44% 4.16% 3.51% 3.43% 3.13% 1.50% 3.30% 1.73%
Mountain:Arizona 1.70% 4.13% 5.74% 2.59% 5.85% 1.73% 2.15% 1.80%Colorado 1.74% 4.82% 7.24% 3.19% 2.37% 2.23% 3.53% 1.74%Idaho 1.63% 6.13% 5.96% 5.05% 4.95% 1.77% 3.98% 1.40%Montana 1.50% 3.29% 5.21% 4.89% 3.70% 2.57% 3.20% 2.46%Nevada 2.56% 5.82% 6.14% * 6.40% 3.47% 2.38% 4.14% 2.77%New Mexico 1.97% 5.17% 4.35% 3.14% 4.79% 2.55% 2.78% 2.47%Utah 1.82% 3.96% 7.79% 4.27% 3.77% 3.09% 3.25% 2.14%Wyoming 2.02% 7.70% * 6.65% 5.00% 4.19% 4.44% 4.57% 2.93%
Pacific:Alaska 2.34% 5.28% 5.83% 2.18% 4.39% 3.16% 2.58% 2.76%California 0.89% 1.96% 1.94% 1.47% 1.35% 1.21% 1.37% 0.99%Hawaii 2.13% 2.29% 3.66% 6.91% * 2.80% 2.90% 3.35% 2.03%Oregon 1.17% 3.26% 4.07% 3.57% 3.16% 1.16% 2.44% 1.06%Washington 1.72% 4.49% 5.80% * 2.79% 4.27% 2.06% 3.37% 1.62%
Source: Agency for Healthcare Research and Quality, Center for Financing, Access and Cost Trends. 2008 Medical Expenditure PanelSurvey-Insurance Component.Note: Definitions and descriptions of the methods used for this survey can be found in the Technical Appendix.* Figure does not meet standard of reliability or precision.
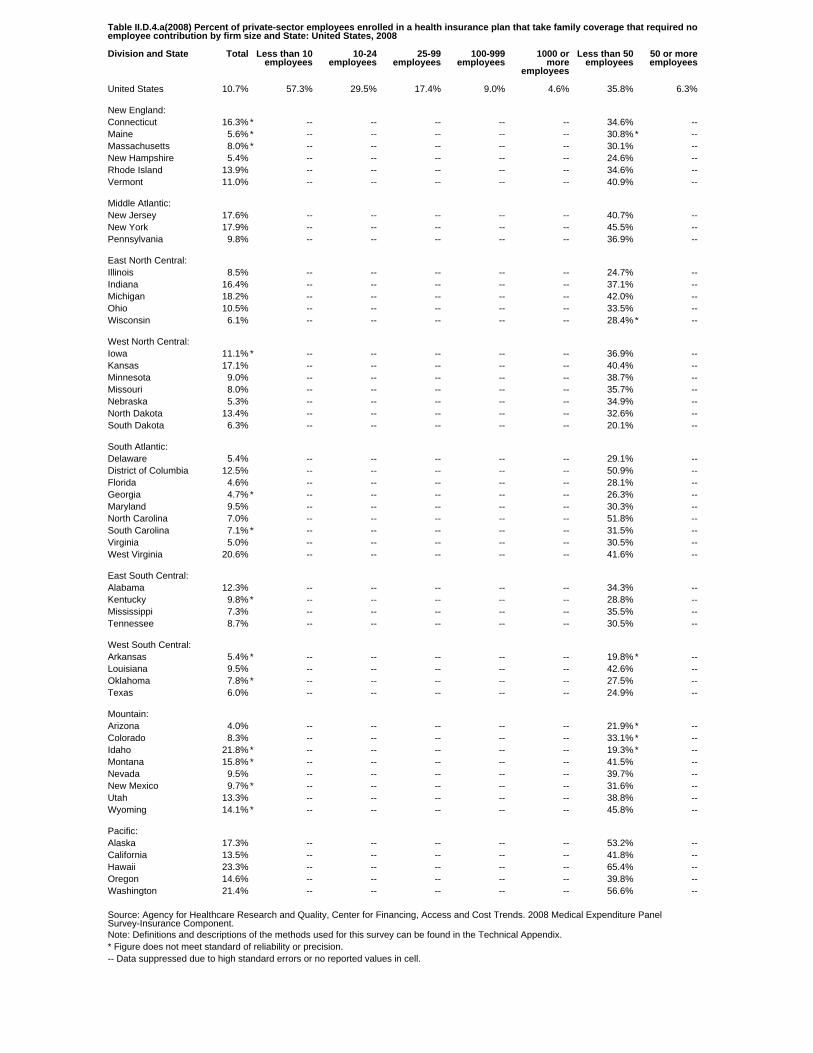
Table II.D.4.a(2008) Percent of private-sector employees enrolled in a health insurance plan that take family coverage that required noemployee contribution by firm size and State: United States, 2008
Division and State Total Less than 10employees
10-24employees
25-99employees
100-999employees
1000 ormore
employees
Less than 50employees
50 or moreemployees
United States 10.7% 57.3% 29.5% 17.4% 9.0% 4.6% 35.8% 6.3%
New England:Connecticut 16.3% * -- -- -- -- -- 34.6% --Maine 5.6% * -- -- -- -- -- 30.8% * --Massachusetts 8.0% * -- -- -- -- -- 30.1% --New Hampshire 5.4% -- -- -- -- -- 24.6% --Rhode Island 13.9% -- -- -- -- -- 34.6% --Vermont 11.0% -- -- -- -- -- 40.9% --
Middle Atlantic:New Jersey 17.6% -- -- -- -- -- 40.7% --New York 17.9% -- -- -- -- -- 45.5% --Pennsylvania 9.8% -- -- -- -- -- 36.9% --
East North Central:Illinois 8.5% -- -- -- -- -- 24.7% --Indiana 16.4% -- -- -- -- -- 37.1% --Michigan 18.2% -- -- -- -- -- 42.0% --Ohio 10.5% -- -- -- -- -- 33.5% --Wisconsin 6.1% -- -- -- -- -- 28.4% * --
West North Central:Iowa 11.1% * -- -- -- -- -- 36.9% --Kansas 17.1% -- -- -- -- -- 40.4% --Minnesota 9.0% -- -- -- -- -- 38.7% --Missouri 8.0% -- -- -- -- -- 35.7% --Nebraska 5.3% -- -- -- -- -- 34.9% --North Dakota 13.4% -- -- -- -- -- 32.6% --South Dakota 6.3% -- -- -- -- -- 20.1% --
South Atlantic:Delaware 5.4% -- -- -- -- -- 29.1% --District of Columbia 12.5% -- -- -- -- -- 50.9% --Florida 4.6% -- -- -- -- -- 28.1% --Georgia 4.7% * -- -- -- -- -- 26.3% --Maryland 9.5% -- -- -- -- -- 30.3% --North Carolina 7.0% -- -- -- -- -- 51.8% --South Carolina 7.1% * -- -- -- -- -- 31.5% --Virginia 5.0% -- -- -- -- -- 30.5% --West Virginia 20.6% -- -- -- -- -- 41.6% --
East South Central:Alabama 12.3% -- -- -- -- -- 34.3% --Kentucky 9.8% * -- -- -- -- -- 28.8% --Mississippi 7.3% -- -- -- -- -- 35.5% --Tennessee 8.7% -- -- -- -- -- 30.5% --
West South Central:Arkansas 5.4% * -- -- -- -- -- 19.8% * --Louisiana 9.5% -- -- -- -- -- 42.6% --Oklahoma 7.8% * -- -- -- -- -- 27.5% --Texas 6.0% -- -- -- -- -- 24.9% --
Mountain:Arizona 4.0% -- -- -- -- -- 21.9% * --Colorado 8.3% -- -- -- -- -- 33.1% * --Idaho 21.8% * -- -- -- -- -- 19.3% * --Montana 15.8% * -- -- -- -- -- 41.5% --Nevada 9.5% -- -- -- -- -- 39.7% --New Mexico 9.7% * -- -- -- -- -- 31.6% --Utah 13.3% -- -- -- -- -- 38.8% --Wyoming 14.1% * -- -- -- -- -- 45.8% --
Pacific:Alaska 17.3% -- -- -- -- -- 53.2% --California 13.5% -- -- -- -- -- 41.8% --Hawaii 23.3% -- -- -- -- -- 65.4% --Oregon 14.6% -- -- -- -- -- 39.8% --Washington 21.4% -- -- -- -- -- 56.6% --
Source: Agency for Healthcare Research and Quality, Center for Financing, Access and Cost Trends. 2008 Medical Expenditure PanelSurvey-Insurance Component.Note: Definitions and descriptions of the methods used for this survey can be found in the Technical Appendix.* Figure does not meet standard of reliability or precision.-- Data suppressed due to high standard errors or no reported values in cell.
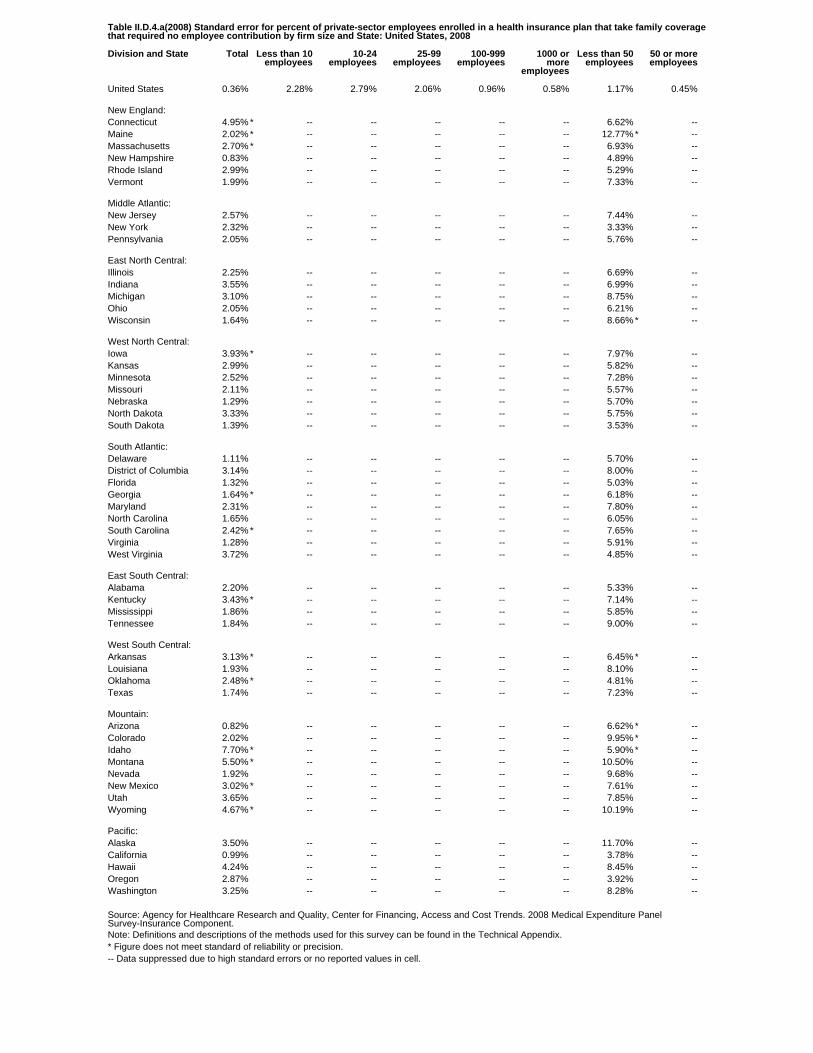
Table II.D.4.a(2008) Standard error for percent of private-sector employees enrolled in a health insurance plan that take family coveragethat required no employee contribution by firm size and State: United States, 2008
Division and State Total Less than 10employees
10-24employees
25-99employees
100-999employees
1000 ormore
employees
Less than 50employees
50 or moreemployees
United States 0.36% 2.28% 2.79% 2.06% 0.96% 0.58% 1.17% 0.45%
New England:Connecticut 4.95% * -- -- -- -- -- 6.62% --Maine 2.02% * -- -- -- -- -- 12.77% * --Massachusetts 2.70% * -- -- -- -- -- 6.93% --New Hampshire 0.83% -- -- -- -- -- 4.89% --Rhode Island 2.99% -- -- -- -- -- 5.29% --Vermont 1.99% -- -- -- -- -- 7.33% --
Middle Atlantic:New Jersey 2.57% -- -- -- -- -- 7.44% --New York 2.32% -- -- -- -- -- 3.33% --Pennsylvania 2.05% -- -- -- -- -- 5.76% --
East North Central:Illinois 2.25% -- -- -- -- -- 6.69% --Indiana 3.55% -- -- -- -- -- 6.99% --Michigan 3.10% -- -- -- -- -- 8.75% --Ohio 2.05% -- -- -- -- -- 6.21% --Wisconsin 1.64% -- -- -- -- -- 8.66% * --
West North Central:Iowa 3.93% * -- -- -- -- -- 7.97% --Kansas 2.99% -- -- -- -- -- 5.82% --Minnesota 2.52% -- -- -- -- -- 7.28% --Missouri 2.11% -- -- -- -- -- 5.57% --Nebraska 1.29% -- -- -- -- -- 5.70% --North Dakota 3.33% -- -- -- -- -- 5.75% --South Dakota 1.39% -- -- -- -- -- 3.53% --
South Atlantic:Delaware 1.11% -- -- -- -- -- 5.70% --District of Columbia 3.14% -- -- -- -- -- 8.00% --Florida 1.32% -- -- -- -- -- 5.03% --Georgia 1.64% * -- -- -- -- -- 6.18% --Maryland 2.31% -- -- -- -- -- 7.80% --North Carolina 1.65% -- -- -- -- -- 6.05% --South Carolina 2.42% * -- -- -- -- -- 7.65% --Virginia 1.28% -- -- -- -- -- 5.91% --West Virginia 3.72% -- -- -- -- -- 4.85% --
East South Central:Alabama 2.20% -- -- -- -- -- 5.33% --Kentucky 3.43% * -- -- -- -- -- 7.14% --Mississippi 1.86% -- -- -- -- -- 5.85% --Tennessee 1.84% -- -- -- -- -- 9.00% --
West South Central:Arkansas 3.13% * -- -- -- -- -- 6.45% * --Louisiana 1.93% -- -- -- -- -- 8.10% --Oklahoma 2.48% * -- -- -- -- -- 4.81% --Texas 1.74% -- -- -- -- -- 7.23% --
Mountain:Arizona 0.82% -- -- -- -- -- 6.62% * --Colorado 2.02% -- -- -- -- -- 9.95% * --Idaho 7.70% * -- -- -- -- -- 5.90% * --Montana 5.50% * -- -- -- -- -- 10.50% --Nevada 1.92% -- -- -- -- -- 9.68% --New Mexico 3.02% * -- -- -- -- -- 7.61% --Utah 3.65% -- -- -- -- -- 7.85% --Wyoming 4.67% * -- -- -- -- -- 10.19% --
Pacific:Alaska 3.50% -- -- -- -- -- 11.70% --California 0.99% -- -- -- -- -- 3.78% --Hawaii 4.24% -- -- -- -- -- 8.45% --Oregon 2.87% -- -- -- -- -- 3.92% --Washington 3.25% -- -- -- -- -- 8.28% --
Source: Agency for Healthcare Research and Quality, Center for Financing, Access and Cost Trends. 2008 Medical Expenditure PanelSurvey-Insurance Component.Note: Definitions and descriptions of the methods used for this survey can be found in the Technical Appendix.* Figure does not meet standard of reliability or precision.-- Data suppressed due to high standard errors or no reported values in cell.
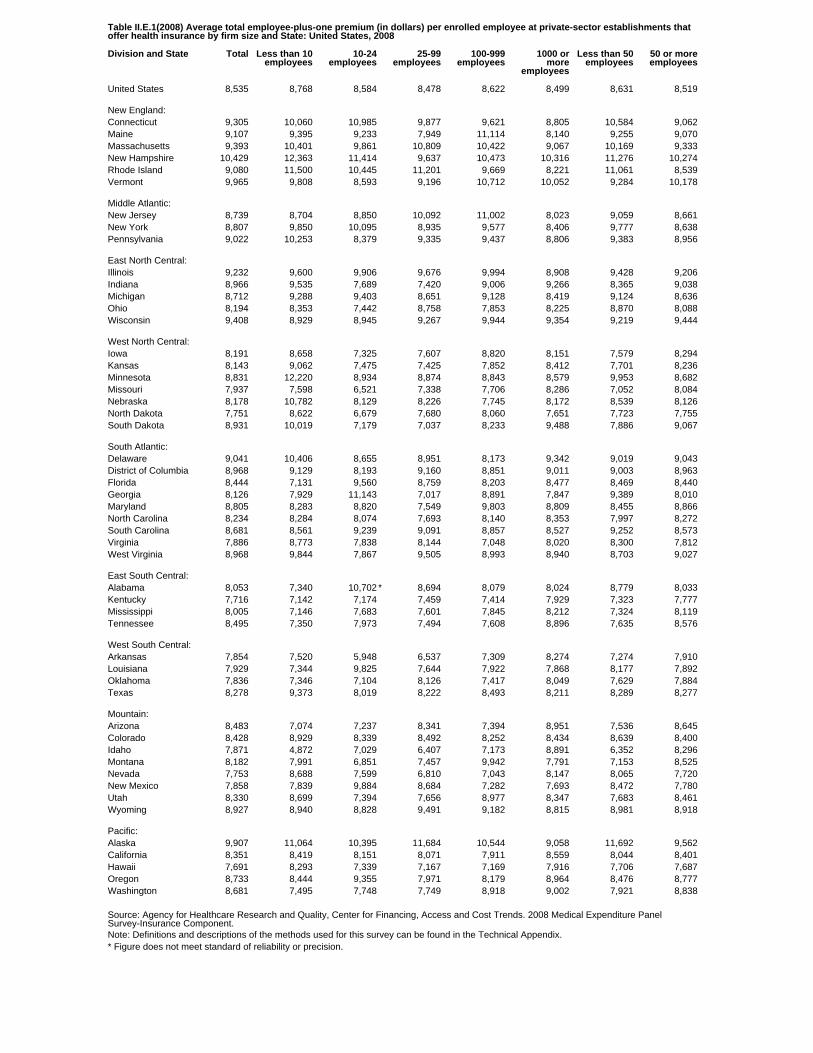
Table II.E.1(2008) Average total employee-plus-one premium (in dollars) per enrolled employee at private-sector establishments thatoffer health insurance by firm size and State: United States, 2008
Division and State Total Less than 10employees
10-24employees
25-99employees
100-999employees
1000 ormore
employees
Less than 50employees
50 or moreemployees
United States 8,535 8,768 8,584 8,478 8,622 8,499 8,631 8,519
New England:Connecticut 9,305 10,060 10,985 9,877 9,621 8,805 10,584 9,062Maine 9,107 9,395 9,233 7,949 11,114 8,140 9,255 9,070Massachusetts 9,393 10,401 9,861 10,809 10,422 9,067 10,169 9,333New Hampshire 10,429 12,363 11,414 9,637 10,473 10,316 11,276 10,274Rhode Island 9,080 11,500 10,445 11,201 9,669 8,221 11,061 8,539Vermont 9,965 9,808 8,593 9,196 10,712 10,052 9,284 10,178
Middle Atlantic:New Jersey 8,739 8,704 8,850 10,092 11,002 8,023 9,059 8,661New York 8,807 9,850 10,095 8,935 9,577 8,406 9,777 8,638Pennsylvania 9,022 10,253 8,379 9,335 9,437 8,806 9,383 8,956
East North Central:Illinois 9,232 9,600 9,906 9,676 9,994 8,908 9,428 9,206Indiana 8,966 9,535 7,689 7,420 9,006 9,266 8,365 9,038Michigan 8,712 9,288 9,403 8,651 9,128 8,419 9,124 8,636Ohio 8,194 8,353 7,442 8,758 7,853 8,225 8,870 8,088Wisconsin 9,408 8,929 8,945 9,267 9,944 9,354 9,219 9,444
West North Central:Iowa 8,191 8,658 7,325 7,607 8,820 8,151 7,579 8,294Kansas 8,143 9,062 7,475 7,425 7,852 8,412 7,701 8,236Minnesota 8,831 12,220 8,934 8,874 8,843 8,579 9,953 8,682Missouri 7,937 7,598 6,521 7,338 7,706 8,286 7,052 8,084Nebraska 8,178 10,782 8,129 8,226 7,745 8,172 8,539 8,126North Dakota 7,751 8,622 6,679 7,680 8,060 7,651 7,723 7,755South Dakota 8,931 10,019 7,179 7,037 8,233 9,488 7,886 9,067
South Atlantic:Delaware 9,041 10,406 8,655 8,951 8,173 9,342 9,019 9,043District of Columbia 8,968 9,129 8,193 9,160 8,851 9,011 9,003 8,963Florida 8,444 7,131 9,560 8,759 8,203 8,477 8,469 8,440Georgia 8,126 7,929 11,143 7,017 8,891 7,847 9,389 8,010Maryland 8,805 8,283 8,820 7,549 9,803 8,809 8,455 8,866North Carolina 8,234 8,284 8,074 7,693 8,140 8,353 7,997 8,272South Carolina 8,681 8,561 9,239 9,091 8,857 8,527 9,252 8,573Virginia 7,886 8,773 7,838 8,144 7,048 8,020 8,300 7,812West Virginia 8,968 9,844 7,867 9,505 8,993 8,940 8,703 9,027
East South Central:Alabama 8,053 7,340 10,702 * 8,694 8,079 8,024 8,779 8,033Kentucky 7,716 7,142 7,174 7,459 7,414 7,929 7,323 7,777Mississippi 8,005 7,146 7,683 7,601 7,845 8,212 7,324 8,119Tennessee 8,495 7,350 7,973 7,494 7,608 8,896 7,635 8,576
West South Central:Arkansas 7,854 7,520 5,948 6,537 7,309 8,274 7,274 7,910Louisiana 7,929 7,344 9,825 7,644 7,922 7,868 8,177 7,892Oklahoma 7,836 7,346 7,104 8,126 7,417 8,049 7,629 7,884Texas 8,278 9,373 8,019 8,222 8,493 8,211 8,289 8,277
Mountain:Arizona 8,483 7,074 7,237 8,341 7,394 8,951 7,536 8,645Colorado 8,428 8,929 8,339 8,492 8,252 8,434 8,639 8,400Idaho 7,871 4,872 7,029 6,407 7,173 8,891 6,352 8,296Montana 8,182 7,991 6,851 7,457 9,942 7,791 7,153 8,525Nevada 7,753 8,688 7,599 6,810 7,043 8,147 8,065 7,720New Mexico 7,858 7,839 9,884 8,684 7,282 7,693 8,472 7,780Utah 8,330 8,699 7,394 7,656 8,977 8,347 7,683 8,461Wyoming 8,927 8,940 8,828 9,491 9,182 8,815 8,981 8,918
Pacific:Alaska 9,907 11,064 10,395 11,684 10,544 9,058 11,692 9,562California 8,351 8,419 8,151 8,071 7,911 8,559 8,044 8,401Hawaii 7,691 8,293 7,339 7,167 7,169 7,916 7,706 7,687Oregon 8,733 8,444 9,355 7,971 8,179 8,964 8,476 8,777Washington 8,681 7,495 7,748 7,749 8,918 9,002 7,921 8,838
Source: Agency for Healthcare Research and Quality, Center for Financing, Access and Cost Trends. 2008 Medical Expenditure PanelSurvey-Insurance Component.Note: Definitions and descriptions of the methods used for this survey can be found in the Technical Appendix.* Figure does not meet standard of reliability or precision.
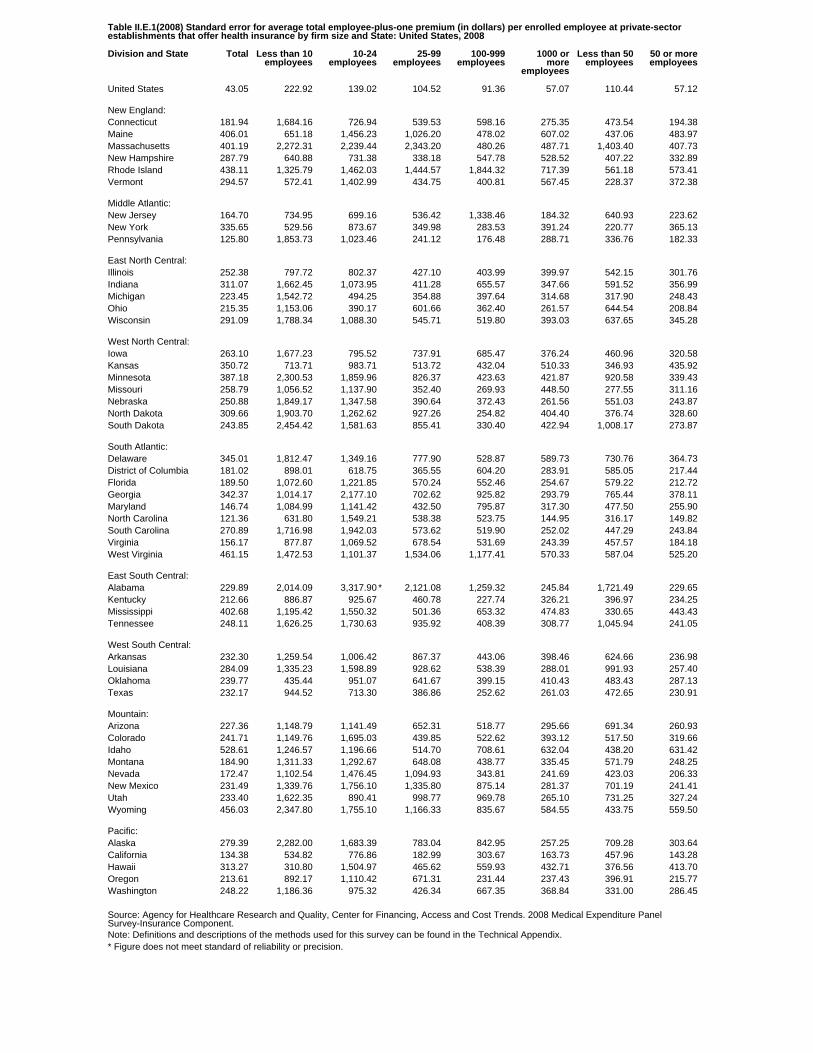
Table II.E.1(2008) Standard error for average total employee-plus-one premium (in dollars) per enrolled employee at private-sectorestablishments that offer health insurance by firm size and State: United States, 2008
Division and State Total Less than 10employees
10-24employees
25-99employees
100-999employees
1000 ormore
employees
Less than 50employees
50 or moreemployees
United States 43.05 222.92 139.02 104.52 91.36 57.07 110.44 57.12
New England:Connecticut 181.94 1,684.16 726.94 539.53 598.16 275.35 473.54 194.38Maine 406.01 651.18 1,456.23 1,026.20 478.02 607.02 437.06 483.97Massachusetts 401.19 2,272.31 2,239.44 2,343.20 480.26 487.71 1,403.40 407.73New Hampshire 287.79 640.88 731.38 338.18 547.78 528.52 407.22 332.89Rhode Island 438.11 1,325.79 1,462.03 1,444.57 1,844.32 717.39 561.18 573.41Vermont 294.57 572.41 1,402.99 434.75 400.81 567.45 228.37 372.38
Middle Atlantic:New Jersey 164.70 734.95 699.16 536.42 1,338.46 184.32 640.93 223.62New York 335.65 529.56 873.67 349.98 283.53 391.24 220.77 365.13Pennsylvania 125.80 1,853.73 1,023.46 241.12 176.48 288.71 336.76 182.33
East North Central:Illinois 252.38 797.72 802.37 427.10 403.99 399.97 542.15 301.76Indiana 311.07 1,662.45 1,073.95 411.28 655.57 347.66 591.52 356.99Michigan 223.45 1,542.72 494.25 354.88 397.64 314.68 317.90 248.43Ohio 215.35 1,153.06 390.17 601.66 362.40 261.57 644.54 208.84Wisconsin 291.09 1,788.34 1,088.30 545.71 519.80 393.03 637.65 345.28
West North Central:Iowa 263.10 1,677.23 795.52 737.91 685.47 376.24 460.96 320.58Kansas 350.72 713.71 983.71 513.72 432.04 510.33 346.93 435.92Minnesota 387.18 2,300.53 1,859.96 826.37 423.63 421.87 920.58 339.43Missouri 258.79 1,056.52 1,137.90 352.40 269.93 448.50 277.55 311.16Nebraska 250.88 1,849.17 1,347.58 390.64 372.43 261.56 551.03 243.87North Dakota 309.66 1,903.70 1,262.62 927.26 254.82 404.40 376.74 328.60South Dakota 243.85 2,454.42 1,581.63 855.41 330.40 422.94 1,008.17 273.87
South Atlantic:Delaware 345.01 1,812.47 1,349.16 777.90 528.87 589.73 730.76 364.73District of Columbia 181.02 898.01 618.75 365.55 604.20 283.91 585.05 217.44Florida 189.50 1,072.60 1,221.85 570.24 552.46 254.67 579.22 212.72Georgia 342.37 1,014.17 2,177.10 702.62 925.82 293.79 765.44 378.11Maryland 146.74 1,084.99 1,141.42 432.50 795.87 317.30 477.50 255.90North Carolina 121.36 631.80 1,549.21 538.38 523.75 144.95 316.17 149.82South Carolina 270.89 1,716.98 1,942.03 573.62 519.90 252.02 447.29 243.84Virginia 156.17 877.87 1,069.52 678.54 531.69 243.39 457.57 184.18West Virginia 461.15 1,472.53 1,101.37 1,534.06 1,177.41 570.33 587.04 525.20
East South Central:Alabama 229.89 2,014.09 3,317.90 * 2,121.08 1,259.32 245.84 1,721.49 229.65Kentucky 212.66 886.87 925.67 460.78 227.74 326.21 396.97 234.25Mississippi 402.68 1,195.42 1,550.32 501.36 653.32 474.83 330.65 443.43Tennessee 248.11 1,626.25 1,730.63 935.92 408.39 308.77 1,045.94 241.05
West South Central:Arkansas 232.30 1,259.54 1,006.42 867.37 443.06 398.46 624.66 236.98Louisiana 284.09 1,335.23 1,598.89 928.62 538.39 288.01 991.93 257.40Oklahoma 239.77 435.44 951.07 641.67 399.15 410.43 483.43 287.13Texas 232.17 944.52 713.30 386.86 252.62 261.03 472.65 230.91
Mountain:Arizona 227.36 1,148.79 1,141.49 652.31 518.77 295.66 691.34 260.93Colorado 241.71 1,149.76 1,695.03 439.85 522.62 393.12 517.50 319.66Idaho 528.61 1,246.57 1,196.66 514.70 708.61 632.04 438.20 631.42Montana 184.90 1,311.33 1,292.67 648.08 438.77 335.45 571.79 248.25Nevada 172.47 1,102.54 1,476.45 1,094.93 343.81 241.69 423.03 206.33New Mexico 231.49 1,339.76 1,756.10 1,335.80 875.14 281.37 701.19 241.41Utah 233.40 1,622.35 890.41 998.77 969.78 265.10 731.25 327.24Wyoming 456.03 2,347.80 1,755.10 1,166.33 835.67 584.55 433.75 559.50
Pacific:Alaska 279.39 2,282.00 1,683.39 783.04 842.95 257.25 709.28 303.64California 134.38 534.82 776.86 182.99 303.67 163.73 457.96 143.28Hawaii 313.27 310.80 1,504.97 465.62 559.93 432.71 376.56 413.70Oregon 213.61 892.17 1,110.42 671.31 231.44 237.43 396.91 215.77Washington 248.22 1,186.36 975.32 426.34 667.35 368.84 331.00 286.45
Source: Agency for Healthcare Research and Quality, Center for Financing, Access and Cost Trends. 2008 Medical Expenditure PanelSurvey-Insurance Component.Note: Definitions and descriptions of the methods used for this survey can be found in the Technical Appendix.* Figure does not meet standard of reliability or precision.
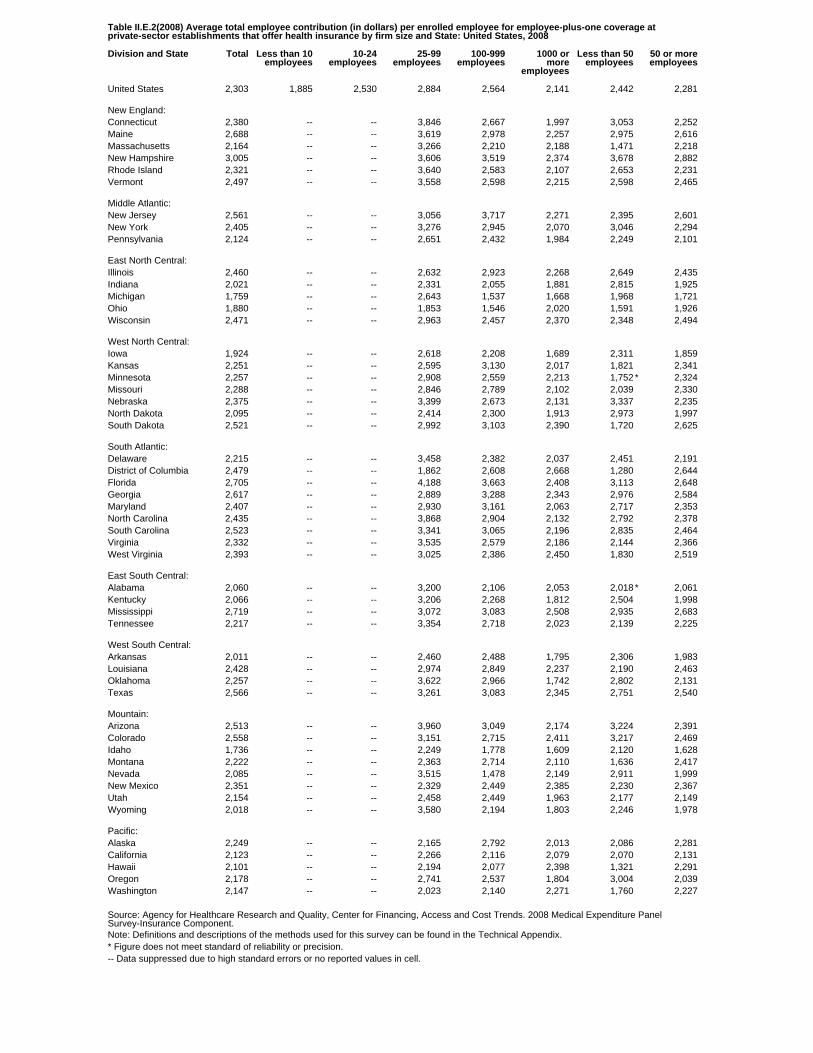
Table II.E.2(2008) Average total employee contribution (in dollars) per enrolled employee for employee-plus-one coverage atprivate-sector establishments that offer health insurance by firm size and State: United States, 2008
Division and State Total Less than 10employees
10-24employees
25-99employees
100-999employees
1000 ormore
employees
Less than 50employees
50 or moreemployees
United States 2,303 1,885 2,530 2,884 2,564 2,141 2,442 2,281
New England:Connecticut 2,380 -- -- 3,846 2,667 1,997 3,053 2,252Maine 2,688 -- -- 3,619 2,978 2,257 2,975 2,616Massachusetts 2,164 -- -- 3,266 2,210 2,188 1,471 2,218New Hampshire 3,005 -- -- 3,606 3,519 2,374 3,678 2,882Rhode Island 2,321 -- -- 3,640 2,583 2,107 2,653 2,231Vermont 2,497 -- -- 3,558 2,598 2,215 2,598 2,465
Middle Atlantic:New Jersey 2,561 -- -- 3,056 3,717 2,271 2,395 2,601New York 2,405 -- -- 3,276 2,945 2,070 3,046 2,294Pennsylvania 2,124 -- -- 2,651 2,432 1,984 2,249 2,101
East North Central:Illinois 2,460 -- -- 2,632 2,923 2,268 2,649 2,435Indiana 2,021 -- -- 2,331 2,055 1,881 2,815 1,925Michigan 1,759 -- -- 2,643 1,537 1,668 1,968 1,721Ohio 1,880 -- -- 1,853 1,546 2,020 1,591 1,926Wisconsin 2,471 -- -- 2,963 2,457 2,370 2,348 2,494
West North Central:Iowa 1,924 -- -- 2,618 2,208 1,689 2,311 1,859Kansas 2,251 -- -- 2,595 3,130 2,017 1,821 2,341Minnesota 2,257 -- -- 2,908 2,559 2,213 1,752 * 2,324Missouri 2,288 -- -- 2,846 2,789 2,102 2,039 2,330Nebraska 2,375 -- -- 3,399 2,673 2,131 3,337 2,235North Dakota 2,095 -- -- 2,414 2,300 1,913 2,973 1,997South Dakota 2,521 -- -- 2,992 3,103 2,390 1,720 2,625
South Atlantic:Delaware 2,215 -- -- 3,458 2,382 2,037 2,451 2,191District of Columbia 2,479 -- -- 1,862 2,608 2,668 1,280 2,644Florida 2,705 -- -- 4,188 3,663 2,408 3,113 2,648Georgia 2,617 -- -- 2,889 3,288 2,343 2,976 2,584Maryland 2,407 -- -- 2,930 3,161 2,063 2,717 2,353North Carolina 2,435 -- -- 3,868 2,904 2,132 2,792 2,378South Carolina 2,523 -- -- 3,341 3,065 2,196 2,835 2,464Virginia 2,332 -- -- 3,535 2,579 2,186 2,144 2,366West Virginia 2,393 -- -- 3,025 2,386 2,450 1,830 2,519
East South Central:Alabama 2,060 -- -- 3,200 2,106 2,053 2,018 * 2,061Kentucky 2,066 -- -- 3,206 2,268 1,812 2,504 1,998Mississippi 2,719 -- -- 3,072 3,083 2,508 2,935 2,683Tennessee 2,217 -- -- 3,354 2,718 2,023 2,139 2,225
West South Central:Arkansas 2,011 -- -- 2,460 2,488 1,795 2,306 1,983Louisiana 2,428 -- -- 2,974 2,849 2,237 2,190 2,463Oklahoma 2,257 -- -- 3,622 2,966 1,742 2,802 2,131Texas 2,566 -- -- 3,261 3,083 2,345 2,751 2,540
Mountain:Arizona 2,513 -- -- 3,960 3,049 2,174 3,224 2,391Colorado 2,558 -- -- 3,151 2,715 2,411 3,217 2,469Idaho 1,736 -- -- 2,249 1,778 1,609 2,120 1,628Montana 2,222 -- -- 2,363 2,714 2,110 1,636 2,417Nevada 2,085 -- -- 3,515 1,478 2,149 2,911 1,999New Mexico 2,351 -- -- 2,329 2,449 2,385 2,230 2,367Utah 2,154 -- -- 2,458 2,449 1,963 2,177 2,149Wyoming 2,018 -- -- 3,580 2,194 1,803 2,246 1,978
Pacific:Alaska 2,249 -- -- 2,165 2,792 2,013 2,086 2,281California 2,123 -- -- 2,266 2,116 2,079 2,070 2,131Hawaii 2,101 -- -- 2,194 2,077 2,398 1,321 2,291Oregon 2,178 -- -- 2,741 2,537 1,804 3,004 2,039Washington 2,147 -- -- 2,023 2,140 2,271 1,760 2,227
Source: Agency for Healthcare Research and Quality, Center for Financing, Access and Cost Trends. 2008 Medical Expenditure PanelSurvey-Insurance Component.Note: Definitions and descriptions of the methods used for this survey can be found in the Technical Appendix.* Figure does not meet standard of reliability or precision.-- Data suppressed due to high standard errors or no reported values in cell.
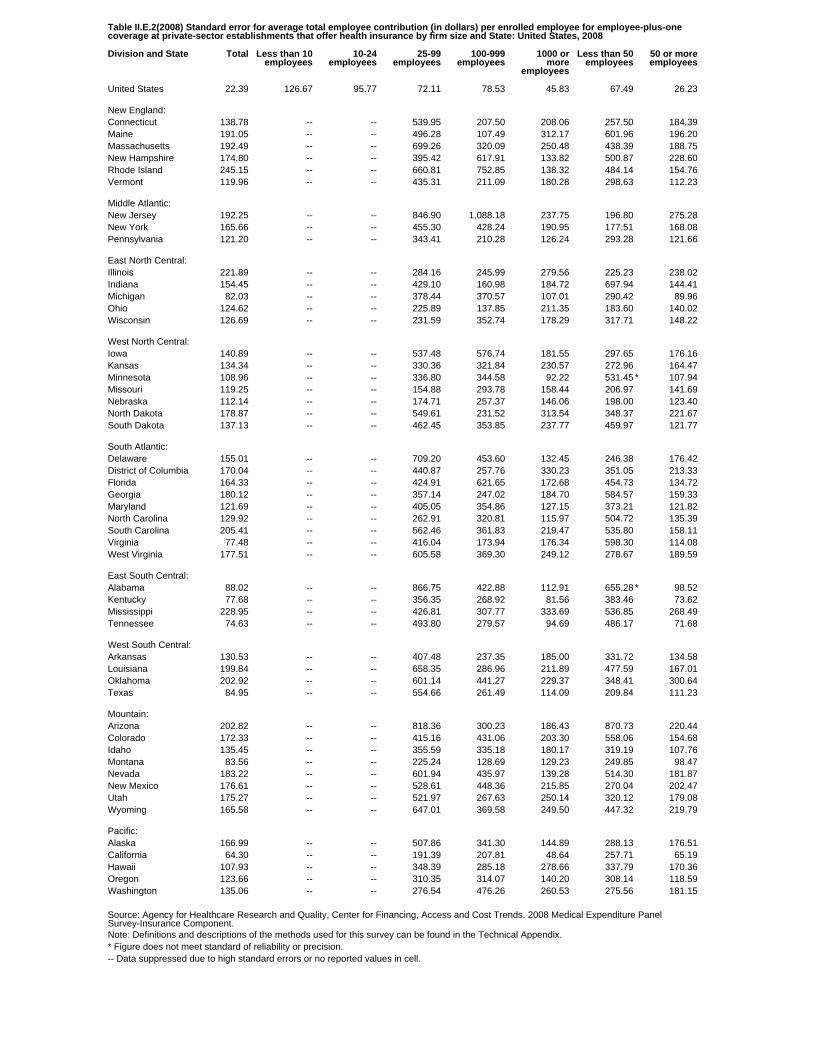
Table II.E.2(2008) Standard error for average total employee contribution (in dollars) per enrolled employee for employee-plus-onecoverage at private-sector establishments that offer health insurance by firm size and State: United States, 2008
Division and State Total Less than 10employees
10-24employees
25-99employees
100-999employees
1000 ormore
employees
Less than 50employees
50 or moreemployees
United States 22.39 126.67 95.77 72.11 78.53 45.83 67.49 26.23
New England:Connecticut 138.78 -- -- 539.95 207.50 208.06 257.50 184.39Maine 191.05 -- -- 496.28 107.49 312.17 601.96 196.20Massachusetts 192.49 -- -- 699.26 320.09 250.48 438.39 188.75New Hampshire 174.80 -- -- 395.42 617.91 133.82 500.87 228.60Rhode Island 245.15 -- -- 660.81 752.85 138.32 484.14 154.76Vermont 119.96 -- -- 435.31 211.09 180.28 298.63 112.23
Middle Atlantic:New Jersey 192.25 -- -- 846.90 1,088.18 237.75 196.80 275.28New York 165.66 -- -- 455.30 428.24 190.95 177.51 168.08Pennsylvania 121.20 -- -- 343.41 210.28 126.24 293.28 121.66
East North Central:Illinois 221.89 -- -- 284.16 245.99 279.56 225.23 238.02Indiana 154.45 -- -- 429.10 160.98 184.72 697.94 144.41Michigan 82.03 -- -- 378.44 370.57 107.01 290.42 89.96Ohio 124.62 -- -- 225.89 137.85 211.35 183.60 140.02Wisconsin 126.69 -- -- 231.59 352.74 178.29 317.71 148.22
West North Central:Iowa 140.89 -- -- 537.48 576.74 181.55 297.65 176.16Kansas 134.34 -- -- 330.36 321.84 230.57 272.96 164.47Minnesota 108.96 -- -- 336.80 344.58 92.22 531.45 * 107.94Missouri 119.25 -- -- 154.88 293.78 158.44 206.97 141.69Nebraska 112.14 -- -- 174.71 257.37 146.06 198.00 123.40North Dakota 178.87 -- -- 549.61 231.52 313.54 348.37 221.67South Dakota 137.13 -- -- 462.45 353.85 237.77 459.97 121.77
South Atlantic:Delaware 155.01 -- -- 709.20 453.60 132.45 246.38 176.42District of Columbia 170.04 -- -- 440.87 257.76 330.23 351.05 213.33Florida 164.33 -- -- 424.91 621.65 172.68 454.73 134.72Georgia 180.12 -- -- 357.14 247.02 184.70 584.57 159.33Maryland 121.69 -- -- 405.05 354.86 127.15 373.21 121.82North Carolina 129.92 -- -- 262.91 320.81 115.97 504.72 135.39South Carolina 205.41 -- -- 562.46 361.83 219.47 535.80 158.11Virginia 77.48 -- -- 416.04 173.94 176.34 598.30 114.08West Virginia 177.51 -- -- 605.58 369.30 249.12 278.67 189.59
East South Central:Alabama 88.02 -- -- 866.75 422.88 112.91 655.28 * 98.52Kentucky 77.68 -- -- 356.35 268.92 81.56 383.46 73.62Mississippi 228.95 -- -- 426.81 307.77 333.69 536.85 268.49Tennessee 74.63 -- -- 493.80 279.57 94.69 486.17 71.68
West South Central:Arkansas 130.53 -- -- 407.48 237.35 185.00 331.72 134.58Louisiana 199.84 -- -- 658.35 286.96 211.89 477.59 167.01Oklahoma 202.92 -- -- 601.14 441.27 229.37 348.41 300.64Texas 84.95 -- -- 554.66 261.49 114.09 209.84 111.23
Mountain:Arizona 202.82 -- -- 818.36 300.23 186.43 870.73 220.44Colorado 172.33 -- -- 415.16 431.06 203.30 558.06 154.68Idaho 135.45 -- -- 355.59 335.18 180.17 319.19 107.76Montana 83.56 -- -- 225.24 128.69 129.23 249.85 98.47Nevada 183.22 -- -- 601.94 435.97 139.28 514.30 181.87New Mexico 176.61 -- -- 528.61 448.36 215.85 270.04 202.47Utah 175.27 -- -- 521.97 267.63 250.14 320.12 179.08Wyoming 165.58 -- -- 647.01 369.58 249.50 447.32 219.79
Pacific:Alaska 166.99 -- -- 507.86 341.30 144.89 288.13 176.51California 64.30 -- -- 191.39 207.81 48.64 257.71 65.19Hawaii 107.93 -- -- 348.39 285.18 278.66 337.79 170.36Oregon 123.66 -- -- 310.35 314.07 140.20 308.14 118.59Washington 135.06 -- -- 276.54 476.26 260.53 275.56 181.15
Source: Agency for Healthcare Research and Quality, Center for Financing, Access and Cost Trends. 2008 Medical Expenditure PanelSurvey-Insurance Component.Note: Definitions and descriptions of the methods used for this survey can be found in the Technical Appendix.* Figure does not meet standard of reliability or precision.-- Data suppressed due to high standard errors or no reported values in cell.
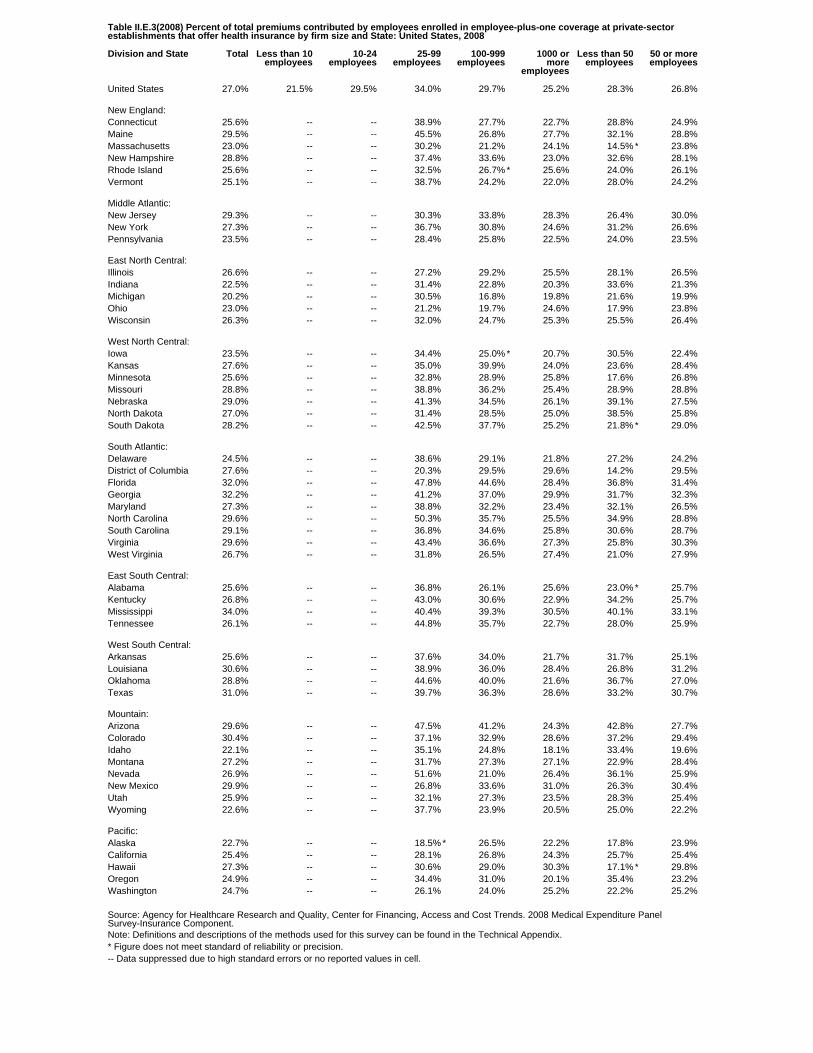
Table II.E.3(2008) Percent of total premiums contributed by employees enrolled in employee-plus-one coverage at private-sectorestablishments that offer health insurance by firm size and State: United States, 2008
Division and State Total Less than 10employees
10-24employees
25-99employees
100-999employees
1000 ormore
employees
Less than 50employees
50 or moreemployees
United States 27.0% 21.5% 29.5% 34.0% 29.7% 25.2% 28.3% 26.8%
New England:Connecticut 25.6% -- -- 38.9% 27.7% 22.7% 28.8% 24.9%Maine 29.5% -- -- 45.5% 26.8% 27.7% 32.1% 28.8%Massachusetts 23.0% -- -- 30.2% 21.2% 24.1% 14.5% * 23.8%New Hampshire 28.8% -- -- 37.4% 33.6% 23.0% 32.6% 28.1%Rhode Island 25.6% -- -- 32.5% 26.7% * 25.6% 24.0% 26.1%Vermont 25.1% -- -- 38.7% 24.2% 22.0% 28.0% 24.2%
Middle Atlantic:New Jersey 29.3% -- -- 30.3% 33.8% 28.3% 26.4% 30.0%New York 27.3% -- -- 36.7% 30.8% 24.6% 31.2% 26.6%Pennsylvania 23.5% -- -- 28.4% 25.8% 22.5% 24.0% 23.5%
East North Central:Illinois 26.6% -- -- 27.2% 29.2% 25.5% 28.1% 26.5%Indiana 22.5% -- -- 31.4% 22.8% 20.3% 33.6% 21.3%Michigan 20.2% -- -- 30.5% 16.8% 19.8% 21.6% 19.9%Ohio 23.0% -- -- 21.2% 19.7% 24.6% 17.9% 23.8%Wisconsin 26.3% -- -- 32.0% 24.7% 25.3% 25.5% 26.4%
West North Central:Iowa 23.5% -- -- 34.4% 25.0% * 20.7% 30.5% 22.4%Kansas 27.6% -- -- 35.0% 39.9% 24.0% 23.6% 28.4%Minnesota 25.6% -- -- 32.8% 28.9% 25.8% 17.6% 26.8%Missouri 28.8% -- -- 38.8% 36.2% 25.4% 28.9% 28.8%Nebraska 29.0% -- -- 41.3% 34.5% 26.1% 39.1% 27.5%North Dakota 27.0% -- -- 31.4% 28.5% 25.0% 38.5% 25.8%South Dakota 28.2% -- -- 42.5% 37.7% 25.2% 21.8% * 29.0%
South Atlantic:Delaware 24.5% -- -- 38.6% 29.1% 21.8% 27.2% 24.2%District of Columbia 27.6% -- -- 20.3% 29.5% 29.6% 14.2% 29.5%Florida 32.0% -- -- 47.8% 44.6% 28.4% 36.8% 31.4%Georgia 32.2% -- -- 41.2% 37.0% 29.9% 31.7% 32.3%Maryland 27.3% -- -- 38.8% 32.2% 23.4% 32.1% 26.5%North Carolina 29.6% -- -- 50.3% 35.7% 25.5% 34.9% 28.8%South Carolina 29.1% -- -- 36.8% 34.6% 25.8% 30.6% 28.7%Virginia 29.6% -- -- 43.4% 36.6% 27.3% 25.8% 30.3%West Virginia 26.7% -- -- 31.8% 26.5% 27.4% 21.0% 27.9%
East South Central:Alabama 25.6% -- -- 36.8% 26.1% 25.6% 23.0% * 25.7%Kentucky 26.8% -- -- 43.0% 30.6% 22.9% 34.2% 25.7%Mississippi 34.0% -- -- 40.4% 39.3% 30.5% 40.1% 33.1%Tennessee 26.1% -- -- 44.8% 35.7% 22.7% 28.0% 25.9%
West South Central:Arkansas 25.6% -- -- 37.6% 34.0% 21.7% 31.7% 25.1%Louisiana 30.6% -- -- 38.9% 36.0% 28.4% 26.8% 31.2%Oklahoma 28.8% -- -- 44.6% 40.0% 21.6% 36.7% 27.0%Texas 31.0% -- -- 39.7% 36.3% 28.6% 33.2% 30.7%
Mountain:Arizona 29.6% -- -- 47.5% 41.2% 24.3% 42.8% 27.7%Colorado 30.4% -- -- 37.1% 32.9% 28.6% 37.2% 29.4%Idaho 22.1% -- -- 35.1% 24.8% 18.1% 33.4% 19.6%Montana 27.2% -- -- 31.7% 27.3% 27.1% 22.9% 28.4%Nevada 26.9% -- -- 51.6% 21.0% 26.4% 36.1% 25.9%New Mexico 29.9% -- -- 26.8% 33.6% 31.0% 26.3% 30.4%Utah 25.9% -- -- 32.1% 27.3% 23.5% 28.3% 25.4%Wyoming 22.6% -- -- 37.7% 23.9% 20.5% 25.0% 22.2%
Pacific:Alaska 22.7% -- -- 18.5% * 26.5% 22.2% 17.8% 23.9%California 25.4% -- -- 28.1% 26.8% 24.3% 25.7% 25.4%Hawaii 27.3% -- -- 30.6% 29.0% 30.3% 17.1% * 29.8%Oregon 24.9% -- -- 34.4% 31.0% 20.1% 35.4% 23.2%Washington 24.7% -- -- 26.1% 24.0% 25.2% 22.2% 25.2%
Source: Agency for Healthcare Research and Quality, Center for Financing, Access and Cost Trends. 2008 Medical Expenditure PanelSurvey-Insurance Component.Note: Definitions and descriptions of the methods used for this survey can be found in the Technical Appendix.* Figure does not meet standard of reliability or precision.-- Data suppressed due to high standard errors or no reported values in cell.
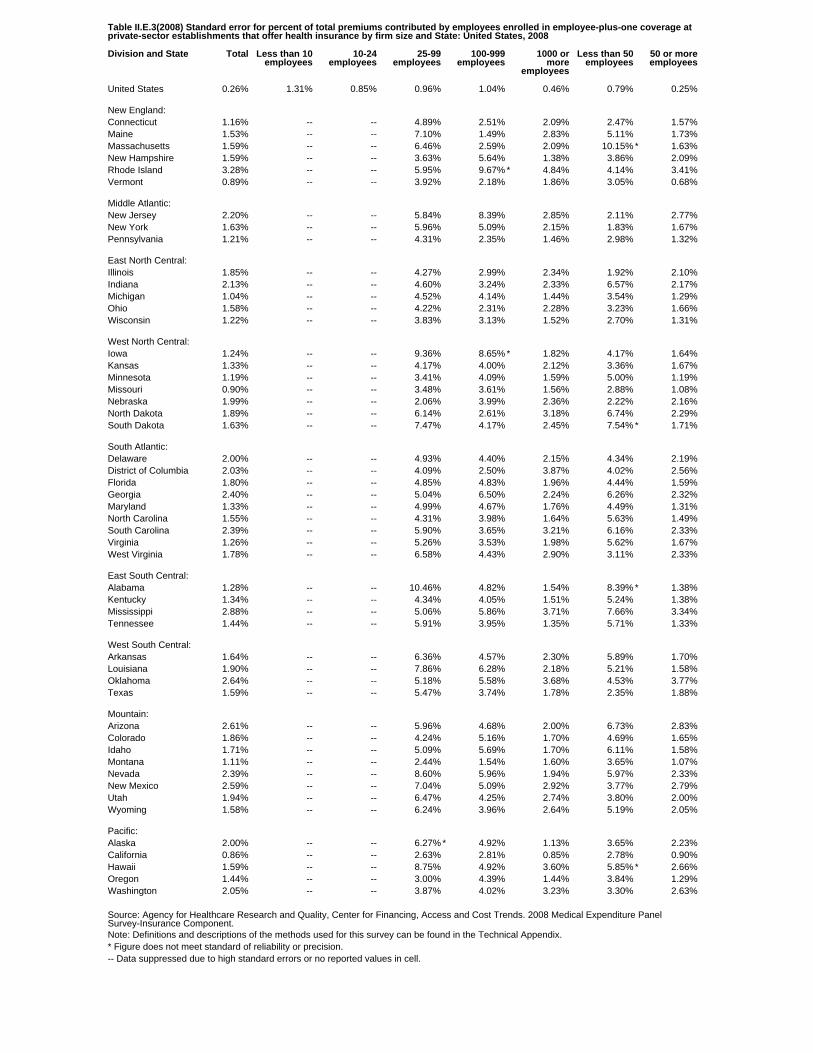
Table II.E.3(2008) Standard error for percent of total premiums contributed by employees enrolled in employee-plus-one coverage atprivate-sector establishments that offer health insurance by firm size and State: United States, 2008
Division and State Total Less than 10employees
10-24employees
25-99employees
100-999employees
1000 ormore
employees
Less than 50employees
50 or moreemployees
United States 0.26% 1.31% 0.85% 0.96% 1.04% 0.46% 0.79% 0.25%
New England:Connecticut 1.16% -- -- 4.89% 2.51% 2.09% 2.47% 1.57%Maine 1.53% -- -- 7.10% 1.49% 2.83% 5.11% 1.73%Massachusetts 1.59% -- -- 6.46% 2.59% 2.09% 10.15% * 1.63%New Hampshire 1.59% -- -- 3.63% 5.64% 1.38% 3.86% 2.09%Rhode Island 3.28% -- -- 5.95% 9.67% * 4.84% 4.14% 3.41%Vermont 0.89% -- -- 3.92% 2.18% 1.86% 3.05% 0.68%
Middle Atlantic:New Jersey 2.20% -- -- 5.84% 8.39% 2.85% 2.11% 2.77%New York 1.63% -- -- 5.96% 5.09% 2.15% 1.83% 1.67%Pennsylvania 1.21% -- -- 4.31% 2.35% 1.46% 2.98% 1.32%
East North Central:Illinois 1.85% -- -- 4.27% 2.99% 2.34% 1.92% 2.10%Indiana 2.13% -- -- 4.60% 3.24% 2.33% 6.57% 2.17%Michigan 1.04% -- -- 4.52% 4.14% 1.44% 3.54% 1.29%Ohio 1.58% -- -- 4.22% 2.31% 2.28% 3.23% 1.66%Wisconsin 1.22% -- -- 3.83% 3.13% 1.52% 2.70% 1.31%
West North Central:Iowa 1.24% -- -- 9.36% 8.65% * 1.82% 4.17% 1.64%Kansas 1.33% -- -- 4.17% 4.00% 2.12% 3.36% 1.67%Minnesota 1.19% -- -- 3.41% 4.09% 1.59% 5.00% 1.19%Missouri 0.90% -- -- 3.48% 3.61% 1.56% 2.88% 1.08%Nebraska 1.99% -- -- 2.06% 3.99% 2.36% 2.22% 2.16%North Dakota 1.89% -- -- 6.14% 2.61% 3.18% 6.74% 2.29%South Dakota 1.63% -- -- 7.47% 4.17% 2.45% 7.54% * 1.71%
South Atlantic:Delaware 2.00% -- -- 4.93% 4.40% 2.15% 4.34% 2.19%District of Columbia 2.03% -- -- 4.09% 2.50% 3.87% 4.02% 2.56%Florida 1.80% -- -- 4.85% 4.83% 1.96% 4.44% 1.59%Georgia 2.40% -- -- 5.04% 6.50% 2.24% 6.26% 2.32%Maryland 1.33% -- -- 4.99% 4.67% 1.76% 4.49% 1.31%North Carolina 1.55% -- -- 4.31% 3.98% 1.64% 5.63% 1.49%South Carolina 2.39% -- -- 5.90% 3.65% 3.21% 6.16% 2.33%Virginia 1.26% -- -- 5.26% 3.53% 1.98% 5.62% 1.67%West Virginia 1.78% -- -- 6.58% 4.43% 2.90% 3.11% 2.33%
East South Central:Alabama 1.28% -- -- 10.46% 4.82% 1.54% 8.39% * 1.38%Kentucky 1.34% -- -- 4.34% 4.05% 1.51% 5.24% 1.38%Mississippi 2.88% -- -- 5.06% 5.86% 3.71% 7.66% 3.34%Tennessee 1.44% -- -- 5.91% 3.95% 1.35% 5.71% 1.33%
West South Central:Arkansas 1.64% -- -- 6.36% 4.57% 2.30% 5.89% 1.70%Louisiana 1.90% -- -- 7.86% 6.28% 2.18% 5.21% 1.58%Oklahoma 2.64% -- -- 5.18% 5.58% 3.68% 4.53% 3.77%Texas 1.59% -- -- 5.47% 3.74% 1.78% 2.35% 1.88%
Mountain:Arizona 2.61% -- -- 5.96% 4.68% 2.00% 6.73% 2.83%Colorado 1.86% -- -- 4.24% 5.16% 1.70% 4.69% 1.65%Idaho 1.71% -- -- 5.09% 5.69% 1.70% 6.11% 1.58%Montana 1.11% -- -- 2.44% 1.54% 1.60% 3.65% 1.07%Nevada 2.39% -- -- 8.60% 5.96% 1.94% 5.97% 2.33%New Mexico 2.59% -- -- 7.04% 5.09% 2.92% 3.77% 2.79%Utah 1.94% -- -- 6.47% 4.25% 2.74% 3.80% 2.00%Wyoming 1.58% -- -- 6.24% 3.96% 2.64% 5.19% 2.05%
Pacific:Alaska 2.00% -- -- 6.27% * 4.92% 1.13% 3.65% 2.23%California 0.86% -- -- 2.63% 2.81% 0.85% 2.78% 0.90%Hawaii 1.59% -- -- 8.75% 4.92% 3.60% 5.85% * 2.66%Oregon 1.44% -- -- 3.00% 4.39% 1.44% 3.84% 1.29%Washington 2.05% -- -- 3.87% 4.02% 3.23% 3.30% 2.63%
Source: Agency for Healthcare Research and Quality, Center for Financing, Access and Cost Trends. 2008 Medical Expenditure PanelSurvey-Insurance Component.Note: Definitions and descriptions of the methods used for this survey can be found in the Technical Appendix.* Figure does not meet standard of reliability or precision.-- Data suppressed due to high standard errors or no reported values in cell.
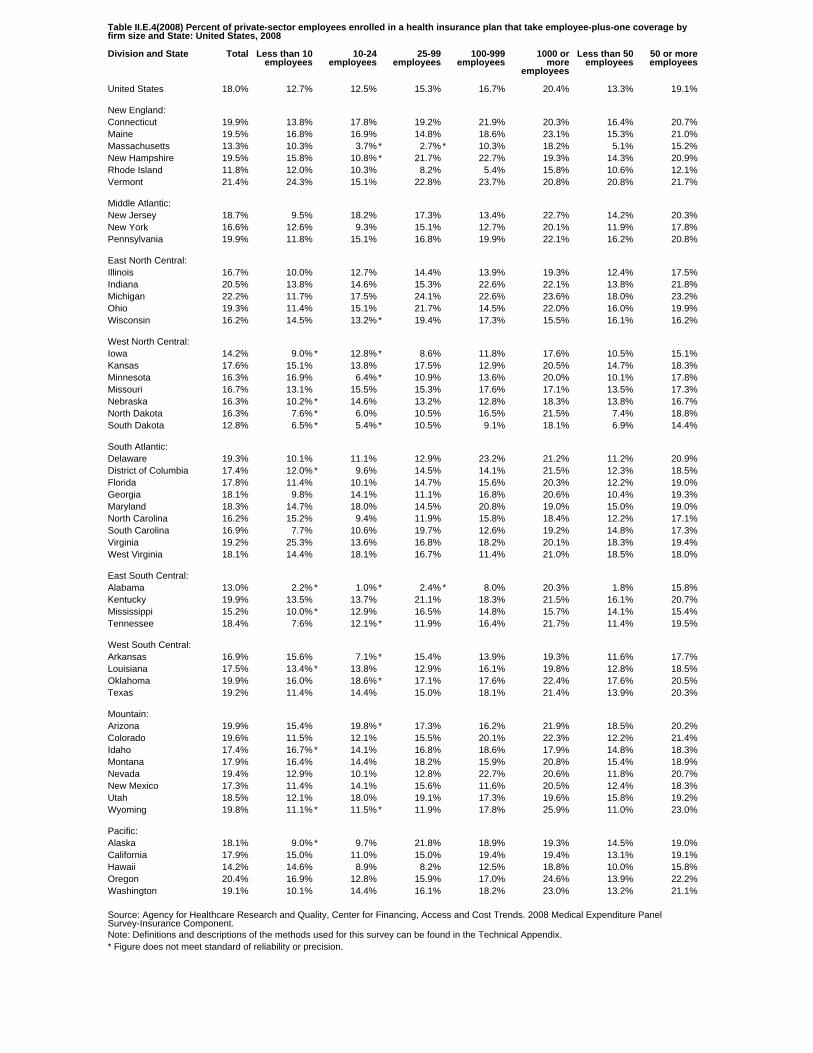
Table II.E.4(2008) Percent of private-sector employees enrolled in a health insurance plan that take employee-plus-one coverage byfirm size and State: United States, 2008
Division and State Total Less than 10employees
10-24employees
25-99employees
100-999employees
1000 ormore
employees
Less than 50employees
50 or moreemployees
United States 18.0% 12.7% 12.5% 15.3% 16.7% 20.4% 13.3% 19.1%
New England:Connecticut 19.9% 13.8% 17.8% 19.2% 21.9% 20.3% 16.4% 20.7%Maine 19.5% 16.8% 16.9% 14.8% 18.6% 23.1% 15.3% 21.0%Massachusetts 13.3% 10.3% 3.7% * 2.7% * 10.3% 18.2% 5.1% 15.2%New Hampshire 19.5% 15.8% 10.8% * 21.7% 22.7% 19.3% 14.3% 20.9%Rhode Island 11.8% 12.0% 10.3% 8.2% 5.4% 15.8% 10.6% 12.1%Vermont 21.4% 24.3% 15.1% 22.8% 23.7% 20.8% 20.8% 21.7%
Middle Atlantic:New Jersey 18.7% 9.5% 18.2% 17.3% 13.4% 22.7% 14.2% 20.3%New York 16.6% 12.6% 9.3% 15.1% 12.7% 20.1% 11.9% 17.8%Pennsylvania 19.9% 11.8% 15.1% 16.8% 19.9% 22.1% 16.2% 20.8%
East North Central:Illinois 16.7% 10.0% 12.7% 14.4% 13.9% 19.3% 12.4% 17.5%Indiana 20.5% 13.8% 14.6% 15.3% 22.6% 22.1% 13.8% 21.8%Michigan 22.2% 11.7% 17.5% 24.1% 22.6% 23.6% 18.0% 23.2%Ohio 19.3% 11.4% 15.1% 21.7% 14.5% 22.0% 16.0% 19.9%Wisconsin 16.2% 14.5% 13.2% * 19.4% 17.3% 15.5% 16.1% 16.2%
West North Central:Iowa 14.2% 9.0% * 12.8% * 8.6% 11.8% 17.6% 10.5% 15.1%Kansas 17.6% 15.1% 13.8% 17.5% 12.9% 20.5% 14.7% 18.3%Minnesota 16.3% 16.9% 6.4% * 10.9% 13.6% 20.0% 10.1% 17.8%Missouri 16.7% 13.1% 15.5% 15.3% 17.6% 17.1% 13.5% 17.3%Nebraska 16.3% 10.2% * 14.6% 13.2% 12.8% 18.3% 13.8% 16.7%North Dakota 16.3% 7.6% * 6.0% 10.5% 16.5% 21.5% 7.4% 18.8%South Dakota 12.8% 6.5% * 5.4% * 10.5% 9.1% 18.1% 6.9% 14.4%
South Atlantic:Delaware 19.3% 10.1% 11.1% 12.9% 23.2% 21.2% 11.2% 20.9%District of Columbia 17.4% 12.0% * 9.6% 14.5% 14.1% 21.5% 12.3% 18.5%Florida 17.8% 11.4% 10.1% 14.7% 15.6% 20.3% 12.2% 19.0%Georgia 18.1% 9.8% 14.1% 11.1% 16.8% 20.6% 10.4% 19.3%Maryland 18.3% 14.7% 18.0% 14.5% 20.8% 19.0% 15.0% 19.0%North Carolina 16.2% 15.2% 9.4% 11.9% 15.8% 18.4% 12.2% 17.1%South Carolina 16.9% 7.7% 10.6% 19.7% 12.6% 19.2% 14.8% 17.3%Virginia 19.2% 25.3% 13.6% 16.8% 18.2% 20.1% 18.3% 19.4%West Virginia 18.1% 14.4% 18.1% 16.7% 11.4% 21.0% 18.5% 18.0%
East South Central:Alabama 13.0% 2.2% * 1.0% * 2.4% * 8.0% 20.3% 1.8% 15.8%Kentucky 19.9% 13.5% 13.7% 21.1% 18.3% 21.5% 16.1% 20.7%Mississippi 15.2% 10.0% * 12.9% 16.5% 14.8% 15.7% 14.1% 15.4%Tennessee 18.4% 7.6% 12.1% * 11.9% 16.4% 21.7% 11.4% 19.5%
West South Central:Arkansas 16.9% 15.6% 7.1% * 15.4% 13.9% 19.3% 11.6% 17.7%Louisiana 17.5% 13.4% * 13.8% 12.9% 16.1% 19.8% 12.8% 18.5%Oklahoma 19.9% 16.0% 18.6% * 17.1% 17.6% 22.4% 17.6% 20.5%Texas 19.2% 11.4% 14.4% 15.0% 18.1% 21.4% 13.9% 20.3%
Mountain:Arizona 19.9% 15.4% 19.8% * 17.3% 16.2% 21.9% 18.5% 20.2%Colorado 19.6% 11.5% 12.1% 15.5% 20.1% 22.3% 12.2% 21.4%Idaho 17.4% 16.7% * 14.1% 16.8% 18.6% 17.9% 14.8% 18.3%Montana 17.9% 16.4% 14.4% 18.2% 15.9% 20.8% 15.4% 18.9%Nevada 19.4% 12.9% 10.1% 12.8% 22.7% 20.6% 11.8% 20.7%New Mexico 17.3% 11.4% 14.1% 15.6% 11.6% 20.5% 12.4% 18.3%Utah 18.5% 12.1% 18.0% 19.1% 17.3% 19.6% 15.8% 19.2%Wyoming 19.8% 11.1% * 11.5% * 11.9% 17.8% 25.9% 11.0% 23.0%
Pacific:Alaska 18.1% 9.0% * 9.7% 21.8% 18.9% 19.3% 14.5% 19.0%California 17.9% 15.0% 11.0% 15.0% 19.4% 19.4% 13.1% 19.1%Hawaii 14.2% 14.6% 8.9% 8.2% 12.5% 18.8% 10.0% 15.8%Oregon 20.4% 16.9% 12.8% 15.9% 17.0% 24.6% 13.9% 22.2%Washington 19.1% 10.1% 14.4% 16.1% 18.2% 23.0% 13.2% 21.1%
Source: Agency for Healthcare Research and Quality, Center for Financing, Access and Cost Trends. 2008 Medical Expenditure PanelSurvey-Insurance Component.Note: Definitions and descriptions of the methods used for this survey can be found in the Technical Appendix.* Figure does not meet standard of reliability or precision.
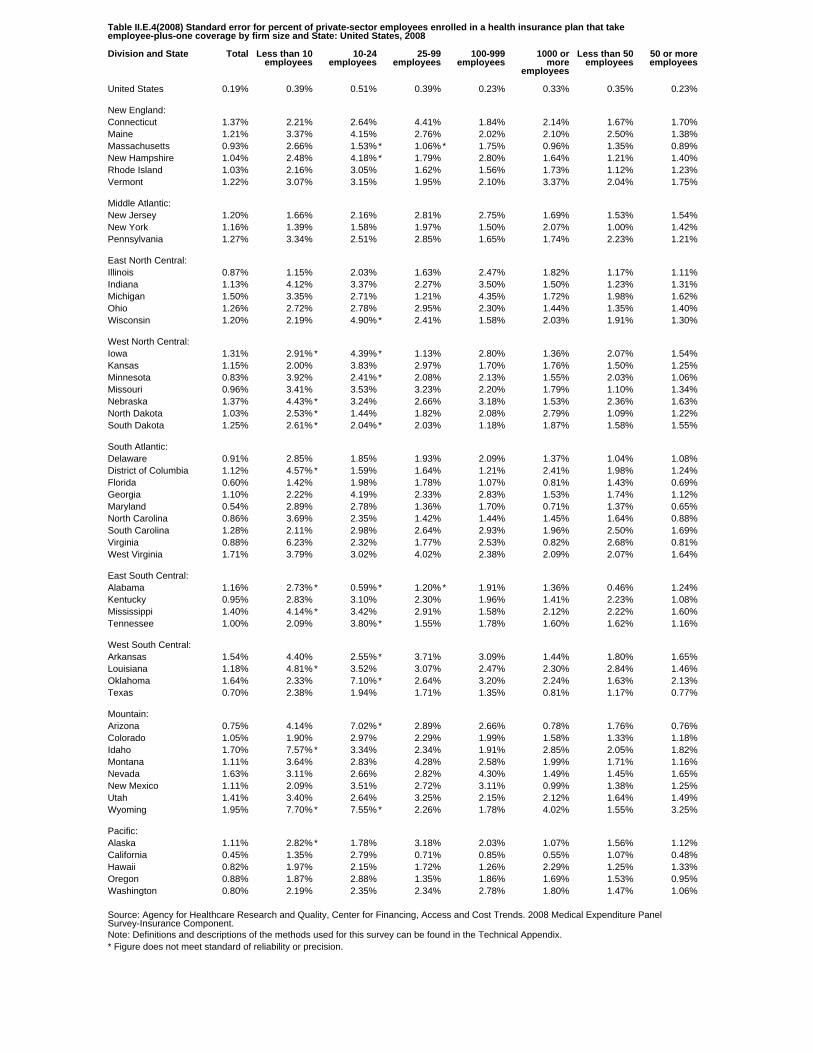
Table II.E.4(2008) Standard error for percent of private-sector employees enrolled in a health insurance plan that takeemployee-plus-one coverage by firm size and State: United States, 2008
Division and State Total Less than 10employees
10-24employees
25-99employees
100-999employees
1000 ormore
employees
Less than 50employees
50 or moreemployees
United States 0.19% 0.39% 0.51% 0.39% 0.23% 0.33% 0.35% 0.23%
New England:Connecticut 1.37% 2.21% 2.64% 4.41% 1.84% 2.14% 1.67% 1.70%Maine 1.21% 3.37% 4.15% 2.76% 2.02% 2.10% 2.50% 1.38%Massachusetts 0.93% 2.66% 1.53% * 1.06% * 1.75% 0.96% 1.35% 0.89%New Hampshire 1.04% 2.48% 4.18% * 1.79% 2.80% 1.64% 1.21% 1.40%Rhode Island 1.03% 2.16% 3.05% 1.62% 1.56% 1.73% 1.12% 1.23%Vermont 1.22% 3.07% 3.15% 1.95% 2.10% 3.37% 2.04% 1.75%
Middle Atlantic:New Jersey 1.20% 1.66% 2.16% 2.81% 2.75% 1.69% 1.53% 1.54%New York 1.16% 1.39% 1.58% 1.97% 1.50% 2.07% 1.00% 1.42%Pennsylvania 1.27% 3.34% 2.51% 2.85% 1.65% 1.74% 2.23% 1.21%
East North Central:Illinois 0.87% 1.15% 2.03% 1.63% 2.47% 1.82% 1.17% 1.11%Indiana 1.13% 4.12% 3.37% 2.27% 3.50% 1.50% 1.23% 1.31%Michigan 1.50% 3.35% 2.71% 1.21% 4.35% 1.72% 1.98% 1.62%Ohio 1.26% 2.72% 2.78% 2.95% 2.30% 1.44% 1.35% 1.40%Wisconsin 1.20% 2.19% 4.90% * 2.41% 1.58% 2.03% 1.91% 1.30%
West North Central:Iowa 1.31% 2.91% * 4.39% * 1.13% 2.80% 1.36% 2.07% 1.54%Kansas 1.15% 2.00% 3.83% 2.97% 1.70% 1.76% 1.50% 1.25%Minnesota 0.83% 3.92% 2.41% * 2.08% 2.13% 1.55% 2.03% 1.06%Missouri 0.96% 3.41% 3.53% 3.23% 2.20% 1.79% 1.10% 1.34%Nebraska 1.37% 4.43% * 3.24% 2.66% 3.18% 1.53% 2.36% 1.63%North Dakota 1.03% 2.53% * 1.44% 1.82% 2.08% 2.79% 1.09% 1.22%South Dakota 1.25% 2.61% * 2.04% * 2.03% 1.18% 1.87% 1.58% 1.55%
South Atlantic:Delaware 0.91% 2.85% 1.85% 1.93% 2.09% 1.37% 1.04% 1.08%District of Columbia 1.12% 4.57% * 1.59% 1.64% 1.21% 2.41% 1.98% 1.24%Florida 0.60% 1.42% 1.98% 1.78% 1.07% 0.81% 1.43% 0.69%Georgia 1.10% 2.22% 4.19% 2.33% 2.83% 1.53% 1.74% 1.12%Maryland 0.54% 2.89% 2.78% 1.36% 1.70% 0.71% 1.37% 0.65%North Carolina 0.86% 3.69% 2.35% 1.42% 1.44% 1.45% 1.64% 0.88%South Carolina 1.28% 2.11% 2.98% 2.64% 2.93% 1.96% 2.50% 1.69%Virginia 0.88% 6.23% 2.32% 1.77% 2.53% 0.82% 2.68% 0.81%West Virginia 1.71% 3.79% 3.02% 4.02% 2.38% 2.09% 2.07% 1.64%
East South Central:Alabama 1.16% 2.73% * 0.59% * 1.20% * 1.91% 1.36% 0.46% 1.24%Kentucky 0.95% 2.83% 3.10% 2.30% 1.96% 1.41% 2.23% 1.08%Mississippi 1.40% 4.14% * 3.42% 2.91% 1.58% 2.12% 2.22% 1.60%Tennessee 1.00% 2.09% 3.80% * 1.55% 1.78% 1.60% 1.62% 1.16%
West South Central:Arkansas 1.54% 4.40% 2.55% * 3.71% 3.09% 1.44% 1.80% 1.65%Louisiana 1.18% 4.81% * 3.52% 3.07% 2.47% 2.30% 2.84% 1.46%Oklahoma 1.64% 2.33% 7.10% * 2.64% 3.20% 2.24% 1.63% 2.13%Texas 0.70% 2.38% 1.94% 1.71% 1.35% 0.81% 1.17% 0.77%
Mountain:Arizona 0.75% 4.14% 7.02% * 2.89% 2.66% 0.78% 1.76% 0.76%Colorado 1.05% 1.90% 2.97% 2.29% 1.99% 1.58% 1.33% 1.18%Idaho 1.70% 7.57% * 3.34% 2.34% 1.91% 2.85% 2.05% 1.82%Montana 1.11% 3.64% 2.83% 4.28% 2.58% 1.99% 1.71% 1.16%Nevada 1.63% 3.11% 2.66% 2.82% 4.30% 1.49% 1.45% 1.65%New Mexico 1.11% 2.09% 3.51% 2.72% 3.11% 0.99% 1.38% 1.25%Utah 1.41% 3.40% 2.64% 3.25% 2.15% 2.12% 1.64% 1.49%Wyoming 1.95% 7.70% * 7.55% * 2.26% 1.78% 4.02% 1.55% 3.25%
Pacific:Alaska 1.11% 2.82% * 1.78% 3.18% 2.03% 1.07% 1.56% 1.12%California 0.45% 1.35% 2.79% 0.71% 0.85% 0.55% 1.07% 0.48%Hawaii 0.82% 1.97% 2.15% 1.72% 1.26% 2.29% 1.25% 1.33%Oregon 0.88% 1.87% 2.88% 1.35% 1.86% 1.69% 1.53% 0.95%Washington 0.80% 2.19% 2.35% 2.34% 2.78% 1.80% 1.47% 1.06%
Source: Agency for Healthcare Research and Quality, Center for Financing, Access and Cost Trends. 2008 Medical Expenditure PanelSurvey-Insurance Component.Note: Definitions and descriptions of the methods used for this survey can be found in the Technical Appendix.* Figure does not meet standard of reliability or precision.
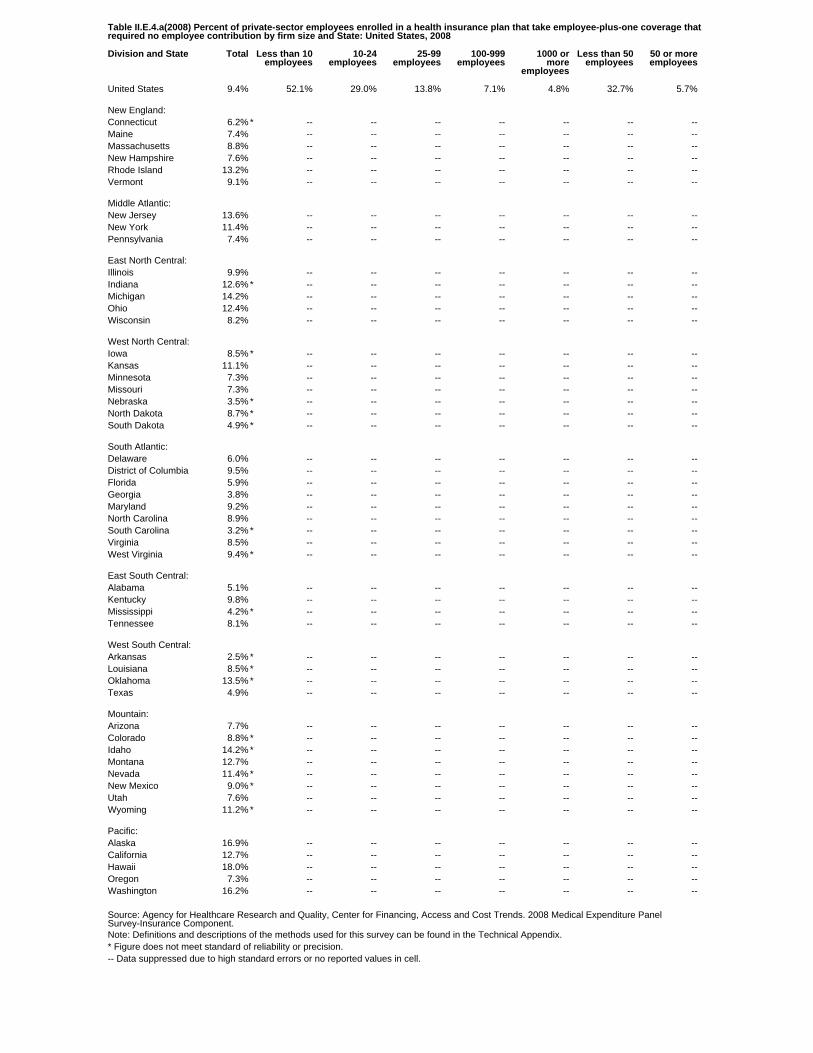
Table II.E.4.a(2008) Percent of private-sector employees enrolled in a health insurance plan that take employee-plus-one coverage thatrequired no employee contribution by firm size and State: United States, 2008
Division and State Total Less than 10employees
10-24employees
25-99employees
100-999employees
1000 ormore
employees
Less than 50employees
50 or moreemployees
United States 9.4% 52.1% 29.0% 13.8% 7.1% 4.8% 32.7% 5.7%
New England:Connecticut 6.2% * -- -- -- -- -- -- --Maine 7.4% -- -- -- -- -- -- --Massachusetts 8.8% -- -- -- -- -- -- --New Hampshire 7.6% -- -- -- -- -- -- --Rhode Island 13.2% -- -- -- -- -- -- --Vermont 9.1% -- -- -- -- -- -- --
Middle Atlantic:New Jersey 13.6% -- -- -- -- -- -- --New York 11.4% -- -- -- -- -- -- --Pennsylvania 7.4% -- -- -- -- -- -- --
East North Central:Illinois 9.9% -- -- -- -- -- -- --Indiana 12.6% * -- -- -- -- -- -- --Michigan 14.2% -- -- -- -- -- -- --Ohio 12.4% -- -- -- -- -- -- --Wisconsin 8.2% -- -- -- -- -- -- --
West North Central:Iowa 8.5% * -- -- -- -- -- -- --Kansas 11.1% -- -- -- -- -- -- --Minnesota 7.3% -- -- -- -- -- -- --Missouri 7.3% -- -- -- -- -- -- --Nebraska 3.5% * -- -- -- -- -- -- --North Dakota 8.7% * -- -- -- -- -- -- --South Dakota 4.9% * -- -- -- -- -- -- --
South Atlantic:Delaware 6.0% -- -- -- -- -- -- --District of Columbia 9.5% -- -- -- -- -- -- --Florida 5.9% -- -- -- -- -- -- --Georgia 3.8% -- -- -- -- -- -- --Maryland 9.2% -- -- -- -- -- -- --North Carolina 8.9% -- -- -- -- -- -- --South Carolina 3.2% * -- -- -- -- -- -- --Virginia 8.5% -- -- -- -- -- -- --West Virginia 9.4% * -- -- -- -- -- -- --
East South Central:Alabama 5.1% -- -- -- -- -- -- --Kentucky 9.8% -- -- -- -- -- -- --Mississippi 4.2% * -- -- -- -- -- -- --Tennessee 8.1% -- -- -- -- -- -- --
West South Central:Arkansas 2.5% * -- -- -- -- -- -- --Louisiana 8.5% * -- -- -- -- -- -- --Oklahoma 13.5% * -- -- -- -- -- -- --Texas 4.9% -- -- -- -- -- -- --
Mountain:Arizona 7.7% -- -- -- -- -- -- --Colorado 8.8% * -- -- -- -- -- -- --Idaho 14.2% * -- -- -- -- -- -- --Montana 12.7% -- -- -- -- -- -- --Nevada 11.4% * -- -- -- -- -- -- --New Mexico 9.0% * -- -- -- -- -- -- --Utah 7.6% -- -- -- -- -- -- --Wyoming 11.2% * -- -- -- -- -- -- --
Pacific:Alaska 16.9% -- -- -- -- -- -- --California 12.7% -- -- -- -- -- -- --Hawaii 18.0% -- -- -- -- -- -- --Oregon 7.3% -- -- -- -- -- -- --Washington 16.2% -- -- -- -- -- -- --
Source: Agency for Healthcare Research and Quality, Center for Financing, Access and Cost Trends. 2008 Medical Expenditure PanelSurvey-Insurance Component.Note: Definitions and descriptions of the methods used for this survey can be found in the Technical Appendix.* Figure does not meet standard of reliability or precision.-- Data suppressed due to high standard errors or no reported values in cell.
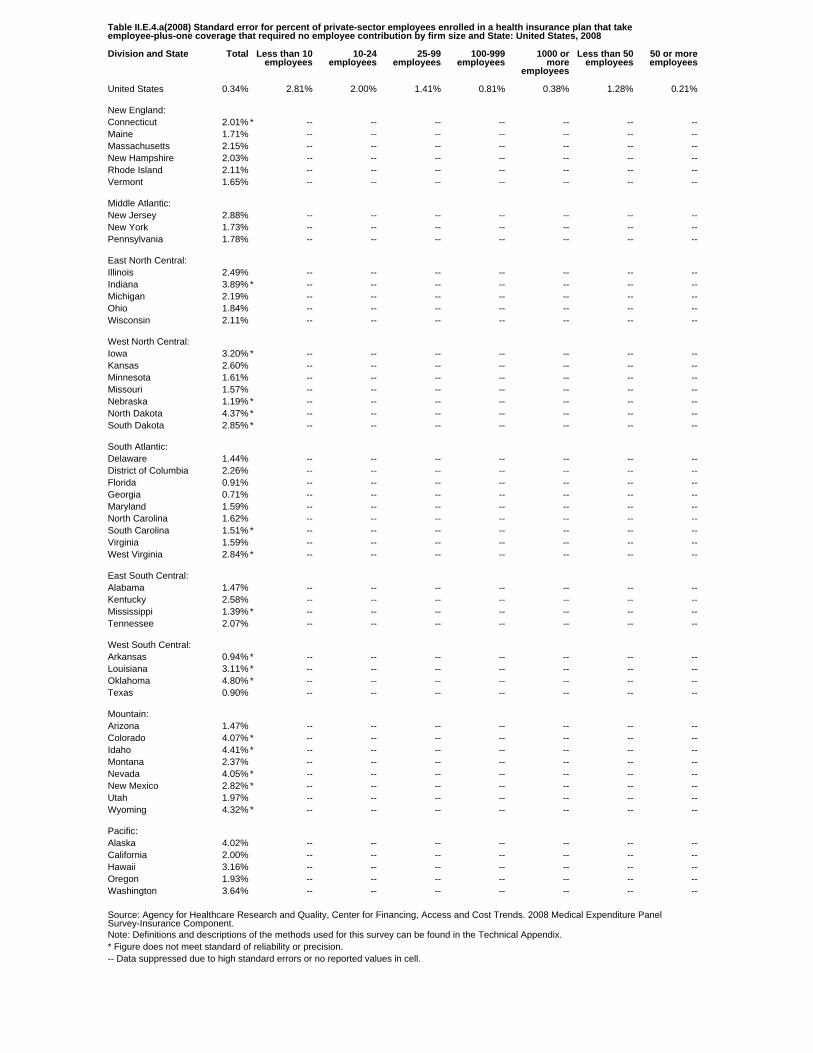
Table II.E.4.a(2008) Standard error for percent of private-sector employees enrolled in a health insurance plan that takeemployee-plus-one coverage that required no employee contribution by firm size and State: United States, 2008
Division and State Total Less than 10employees
10-24employees
25-99employees
100-999employees
1000 ormore
employees
Less than 50employees
50 or moreemployees
United States 0.34% 2.81% 2.00% 1.41% 0.81% 0.38% 1.28% 0.21%
New England:Connecticut 2.01% * -- -- -- -- -- -- --Maine 1.71% -- -- -- -- -- -- --Massachusetts 2.15% -- -- -- -- -- -- --New Hampshire 2.03% -- -- -- -- -- -- --Rhode Island 2.11% -- -- -- -- -- -- --Vermont 1.65% -- -- -- -- -- -- --
Middle Atlantic:New Jersey 2.88% -- -- -- -- -- -- --New York 1.73% -- -- -- -- -- -- --Pennsylvania 1.78% -- -- -- -- -- -- --
East North Central:Illinois 2.49% -- -- -- -- -- -- --Indiana 3.89% * -- -- -- -- -- -- --Michigan 2.19% -- -- -- -- -- -- --Ohio 1.84% -- -- -- -- -- -- --Wisconsin 2.11% -- -- -- -- -- -- --
West North Central:Iowa 3.20% * -- -- -- -- -- -- --Kansas 2.60% -- -- -- -- -- -- --Minnesota 1.61% -- -- -- -- -- -- --Missouri 1.57% -- -- -- -- -- -- --Nebraska 1.19% * -- -- -- -- -- -- --North Dakota 4.37% * -- -- -- -- -- -- --South Dakota 2.85% * -- -- -- -- -- -- --
South Atlantic:Delaware 1.44% -- -- -- -- -- -- --District of Columbia 2.26% -- -- -- -- -- -- --Florida 0.91% -- -- -- -- -- -- --Georgia 0.71% -- -- -- -- -- -- --Maryland 1.59% -- -- -- -- -- -- --North Carolina 1.62% -- -- -- -- -- -- --South Carolina 1.51% * -- -- -- -- -- -- --Virginia 1.59% -- -- -- -- -- -- --West Virginia 2.84% * -- -- -- -- -- -- --
East South Central:Alabama 1.47% -- -- -- -- -- -- --Kentucky 2.58% -- -- -- -- -- -- --Mississippi 1.39% * -- -- -- -- -- -- --Tennessee 2.07% -- -- -- -- -- -- --
West South Central:Arkansas 0.94% * -- -- -- -- -- -- --Louisiana 3.11% * -- -- -- -- -- -- --Oklahoma 4.80% * -- -- -- -- -- -- --Texas 0.90% -- -- -- -- -- -- --
Mountain:Arizona 1.47% -- -- -- -- -- -- --Colorado 4.07% * -- -- -- -- -- -- --Idaho 4.41% * -- -- -- -- -- -- --Montana 2.37% -- -- -- -- -- -- --Nevada 4.05% * -- -- -- -- -- -- --New Mexico 2.82% * -- -- -- -- -- -- --Utah 1.97% -- -- -- -- -- -- --Wyoming 4.32% * -- -- -- -- -- -- --
Pacific:Alaska 4.02% -- -- -- -- -- -- --California 2.00% -- -- -- -- -- -- --Hawaii 3.16% -- -- -- -- -- -- --Oregon 1.93% -- -- -- -- -- -- --Washington 3.64% -- -- -- -- -- -- --
Source: Agency for Healthcare Research and Quality, Center for Financing, Access and Cost Trends. 2008 Medical Expenditure PanelSurvey-Insurance Component.Note: Definitions and descriptions of the methods used for this survey can be found in the Technical Appendix.* Figure does not meet standard of reliability or precision.-- Data suppressed due to high standard errors or no reported values in cell.
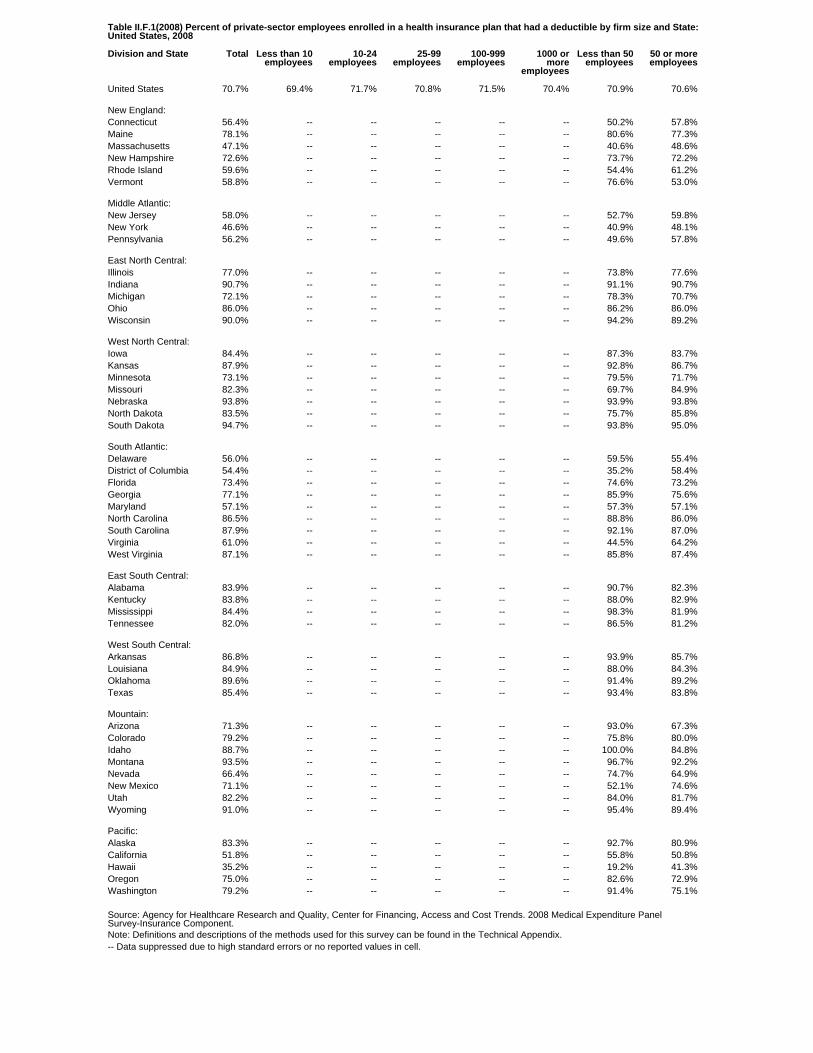
Table II.F.1(2008) Percent of private-sector employees enrolled in a health insurance plan that had a deductible by firm size and State:United States, 2008
Division and State Total Less than 10employees
10-24employees
25-99employees
100-999employees
1000 ormore
employees
Less than 50employees
50 or moreemployees
United States 70.7% 69.4% 71.7% 70.8% 71.5% 70.4% 70.9% 70.6%
New England:Connecticut 56.4% -- -- -- -- -- 50.2% 57.8%Maine 78.1% -- -- -- -- -- 80.6% 77.3%Massachusetts 47.1% -- -- -- -- -- 40.6% 48.6%New Hampshire 72.6% -- -- -- -- -- 73.7% 72.2%Rhode Island 59.6% -- -- -- -- -- 54.4% 61.2%Vermont 58.8% -- -- -- -- -- 76.6% 53.0%
Middle Atlantic:New Jersey 58.0% -- -- -- -- -- 52.7% 59.8%New York 46.6% -- -- -- -- -- 40.9% 48.1%Pennsylvania 56.2% -- -- -- -- -- 49.6% 57.8%
East North Central:Illinois 77.0% -- -- -- -- -- 73.8% 77.6%Indiana 90.7% -- -- -- -- -- 91.1% 90.7%Michigan 72.1% -- -- -- -- -- 78.3% 70.7%Ohio 86.0% -- -- -- -- -- 86.2% 86.0%Wisconsin 90.0% -- -- -- -- -- 94.2% 89.2%
West North Central:Iowa 84.4% -- -- -- -- -- 87.3% 83.7%Kansas 87.9% -- -- -- -- -- 92.8% 86.7%Minnesota 73.1% -- -- -- -- -- 79.5% 71.7%Missouri 82.3% -- -- -- -- -- 69.7% 84.9%Nebraska 93.8% -- -- -- -- -- 93.9% 93.8%North Dakota 83.5% -- -- -- -- -- 75.7% 85.8%South Dakota 94.7% -- -- -- -- -- 93.8% 95.0%
South Atlantic:Delaware 56.0% -- -- -- -- -- 59.5% 55.4%District of Columbia 54.4% -- -- -- -- -- 35.2% 58.4%Florida 73.4% -- -- -- -- -- 74.6% 73.2%Georgia 77.1% -- -- -- -- -- 85.9% 75.6%Maryland 57.1% -- -- -- -- -- 57.3% 57.1%North Carolina 86.5% -- -- -- -- -- 88.8% 86.0%South Carolina 87.9% -- -- -- -- -- 92.1% 87.0%Virginia 61.0% -- -- -- -- -- 44.5% 64.2%West Virginia 87.1% -- -- -- -- -- 85.8% 87.4%
East South Central:Alabama 83.9% -- -- -- -- -- 90.7% 82.3%Kentucky 83.8% -- -- -- -- -- 88.0% 82.9%Mississippi 84.4% -- -- -- -- -- 98.3% 81.9%Tennessee 82.0% -- -- -- -- -- 86.5% 81.2%
West South Central:Arkansas 86.8% -- -- -- -- -- 93.9% 85.7%Louisiana 84.9% -- -- -- -- -- 88.0% 84.3%Oklahoma 89.6% -- -- -- -- -- 91.4% 89.2%Texas 85.4% -- -- -- -- -- 93.4% 83.8%
Mountain:Arizona 71.3% -- -- -- -- -- 93.0% 67.3%Colorado 79.2% -- -- -- -- -- 75.8% 80.0%Idaho 88.7% -- -- -- -- -- 100.0% 84.8%Montana 93.5% -- -- -- -- -- 96.7% 92.2%Nevada 66.4% -- -- -- -- -- 74.7% 64.9%New Mexico 71.1% -- -- -- -- -- 52.1% 74.6%Utah 82.2% -- -- -- -- -- 84.0% 81.7%Wyoming 91.0% -- -- -- -- -- 95.4% 89.4%
Pacific:Alaska 83.3% -- -- -- -- -- 92.7% 80.9%California 51.8% -- -- -- -- -- 55.8% 50.8%Hawaii 35.2% -- -- -- -- -- 19.2% 41.3%Oregon 75.0% -- -- -- -- -- 82.6% 72.9%Washington 79.2% -- -- -- -- -- 91.4% 75.1%
Source: Agency for Healthcare Research and Quality, Center for Financing, Access and Cost Trends. 2008 Medical Expenditure PanelSurvey-Insurance Component.Note: Definitions and descriptions of the methods used for this survey can be found in the Technical Appendix.-- Data suppressed due to high standard errors or no reported values in cell.

Table II.F.1(2008) Standard error for percent of private-sector employees enrolled in a health insurance plan that had a deductible byfirm size and State: United States, 2008
Division and State Total Less than 10employees
10-24employees
25-99employees
100-999employees
1000 ormore
employees
Less than 50employees
50 or moreemployees
United States 0.48% 1.09% 1.30% 0.91% 0.81% 0.94% 0.66% 0.61%
New England:Connecticut 4.63% -- -- -- -- -- 4.01% 5.35%Maine 2.88% -- -- -- -- -- 4.51% 5.60%Massachusetts 4.44% -- -- -- -- -- 4.03% 5.14%New Hampshire 4.42% -- -- -- -- -- 4.74% 4.95%Rhode Island 3.34% -- -- -- -- -- 4.06% 4.93%Vermont 4.82% -- -- -- -- -- 5.13% 5.59%
Middle Atlantic:New Jersey 3.47% -- -- -- -- -- 4.27% 4.33%New York 3.46% -- -- -- -- -- 2.58% 4.03%Pennsylvania 1.57% -- -- -- -- -- 4.89% 1.69%
East North Central:Illinois 1.57% -- -- -- -- -- 2.19% 2.01%Indiana 1.71% -- -- -- -- -- 2.33% 2.04%Michigan 2.71% -- -- -- -- -- 3.84% 3.08%Ohio 1.95% -- -- -- -- -- 2.38% 2.38%Wisconsin 2.29% -- -- -- -- -- 1.84% 2.79%
West North Central:Iowa 2.93% -- -- -- -- -- 5.83% 3.15%Kansas 1.08% -- -- -- -- -- 2.54% 1.38%Minnesota 3.82% -- -- -- -- -- 6.68% 3.97%Missouri 2.73% -- -- -- -- -- 4.37% 3.75%Nebraska 1.97% -- -- -- -- -- 3.22% 2.18%North Dakota 3.25% -- -- -- -- -- 3.79% 3.85%South Dakota 1.63% -- -- -- -- -- 2.19% 1.82%
South Atlantic:Delaware 4.45% -- -- -- -- -- 8.31% 4.59%District of Columbia 4.10% -- -- -- -- -- 4.27% 4.91%Florida 2.67% -- -- -- -- -- 4.05% 3.39%Georgia 3.11% -- -- -- -- -- 4.44% 3.91%Maryland 5.43% -- -- -- -- -- 5.81% 6.17%North Carolina 2.41% -- -- -- -- -- 2.14% 3.12%South Carolina 2.49% -- -- -- -- -- 3.18% 2.52%Virginia 3.06% -- -- -- -- -- 5.46% 3.61%West Virginia 3.09% -- -- -- -- -- 2.83% 3.54%
East South Central:Alabama 3.56% -- -- -- -- -- 1.63% 4.32%Kentucky 2.99% -- -- -- -- -- 4.54% 3.87%Mississippi 3.64% -- -- -- -- -- 1.29% 4.29%Tennessee 3.51% -- -- -- -- -- 4.07% 4.18%
West South Central:Arkansas 3.62% -- -- -- -- -- 2.49% 3.90%Louisiana 2.34% -- -- -- -- -- 3.18% 2.68%Oklahoma 1.45% -- -- -- -- -- 3.03% 2.26%Texas 1.39% -- -- -- -- -- 0.90% 1.62%
Mountain:Arizona 4.04% -- -- -- -- -- 3.30% 5.31%Colorado 2.78% -- -- -- -- -- 5.74% 3.36%Idaho 2.88% -- -- -- -- -- 0.00% 3.32%Montana 1.17% -- -- -- -- -- 1.73% 1.73%Nevada 3.46% -- -- -- -- -- 6.51% 3.77%New Mexico 5.48% -- -- -- -- -- 7.25% 6.39%Utah 3.42% -- -- -- -- -- 5.14% 3.50%Wyoming 1.18% -- -- -- -- -- 2.91% 1.46%
Pacific:Alaska 3.60% -- -- -- -- -- 3.80% 4.30%California 1.86% -- -- -- -- -- 2.34% 2.07%Hawaii 3.30% -- -- -- -- -- 2.79% 3.94%Oregon 3.02% -- -- -- -- -- 3.24% 3.99%Washington 4.43% -- -- -- -- -- 3.17% 5.67%
Source: Agency for Healthcare Research and Quality, Center for Financing, Access and Cost Trends. 2008 Medical Expenditure PanelSurvey-Insurance Component.Note: Definitions and descriptions of the methods used for this survey can be found in the Technical Appendix.-- Data suppressed due to high standard errors or no reported values in cell.
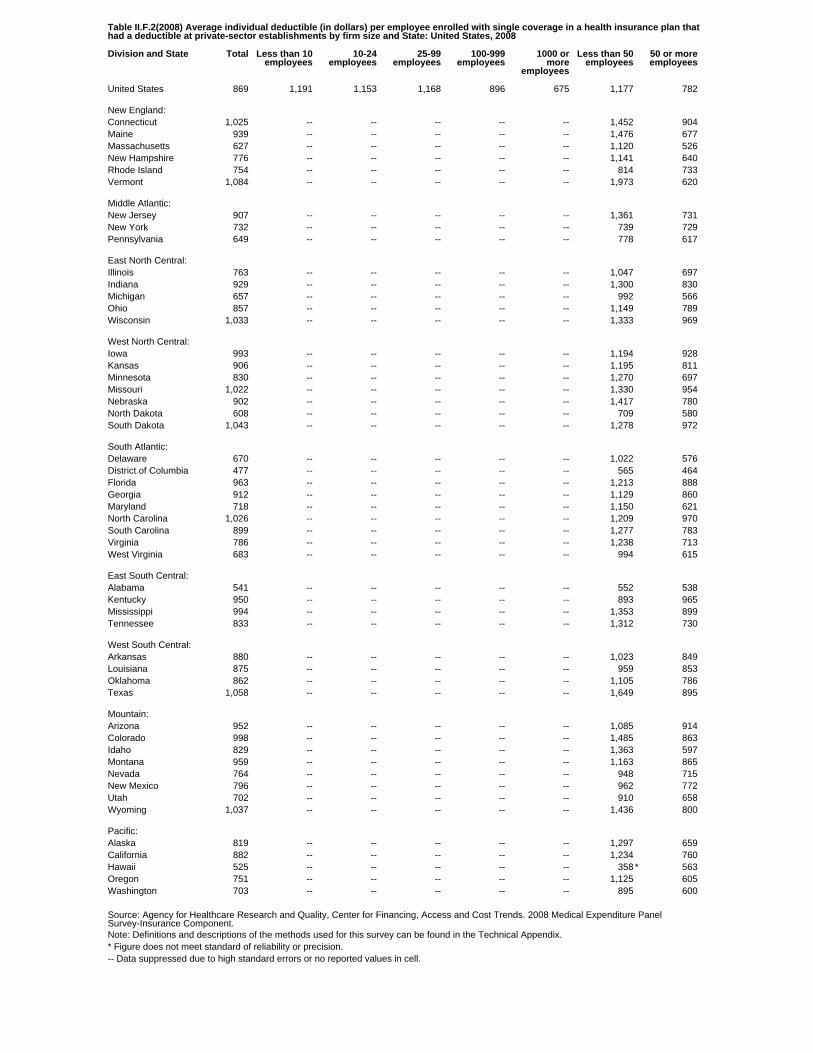
Table II.F.2(2008) Average individual deductible (in dollars) per employee enrolled with single coverage in a health insurance plan thathad a deductible at private-sector establishments by firm size and State: United States, 2008
Division and State Total Less than 10employees
10-24employees
25-99employees
100-999employees
1000 ormore
employees
Less than 50employees
50 or moreemployees
United States 869 1,191 1,153 1,168 896 675 1,177 782
New England:Connecticut 1,025 -- -- -- -- -- 1,452 904Maine 939 -- -- -- -- -- 1,476 677Massachusetts 627 -- -- -- -- -- 1,120 526New Hampshire 776 -- -- -- -- -- 1,141 640Rhode Island 754 -- -- -- -- -- 814 733Vermont 1,084 -- -- -- -- -- 1,973 620
Middle Atlantic:New Jersey 907 -- -- -- -- -- 1,361 731New York 732 -- -- -- -- -- 739 729Pennsylvania 649 -- -- -- -- -- 778 617
East North Central:Illinois 763 -- -- -- -- -- 1,047 697Indiana 929 -- -- -- -- -- 1,300 830Michigan 657 -- -- -- -- -- 992 566Ohio 857 -- -- -- -- -- 1,149 789Wisconsin 1,033 -- -- -- -- -- 1,333 969
West North Central:Iowa 993 -- -- -- -- -- 1,194 928Kansas 906 -- -- -- -- -- 1,195 811Minnesota 830 -- -- -- -- -- 1,270 697Missouri 1,022 -- -- -- -- -- 1,330 954Nebraska 902 -- -- -- -- -- 1,417 780North Dakota 608 -- -- -- -- -- 709 580South Dakota 1,043 -- -- -- -- -- 1,278 972
South Atlantic:Delaware 670 -- -- -- -- -- 1,022 576District of Columbia 477 -- -- -- -- -- 565 464Florida 963 -- -- -- -- -- 1,213 888Georgia 912 -- -- -- -- -- 1,129 860Maryland 718 -- -- -- -- -- 1,150 621North Carolina 1,026 -- -- -- -- -- 1,209 970South Carolina 899 -- -- -- -- -- 1,277 783Virginia 786 -- -- -- -- -- 1,238 713West Virginia 683 -- -- -- -- -- 994 615
East South Central:Alabama 541 -- -- -- -- -- 552 538Kentucky 950 -- -- -- -- -- 893 965Mississippi 994 -- -- -- -- -- 1,353 899Tennessee 833 -- -- -- -- -- 1,312 730
West South Central:Arkansas 880 -- -- -- -- -- 1,023 849Louisiana 875 -- -- -- -- -- 959 853Oklahoma 862 -- -- -- -- -- 1,105 786Texas 1,058 -- -- -- -- -- 1,649 895
Mountain:Arizona 952 -- -- -- -- -- 1,085 914Colorado 998 -- -- -- -- -- 1,485 863Idaho 829 -- -- -- -- -- 1,363 597Montana 959 -- -- -- -- -- 1,163 865Nevada 764 -- -- -- -- -- 948 715New Mexico 796 -- -- -- -- -- 962 772Utah 702 -- -- -- -- -- 910 658Wyoming 1,037 -- -- -- -- -- 1,436 800
Pacific:Alaska 819 -- -- -- -- -- 1,297 659California 882 -- -- -- -- -- 1,234 760Hawaii 525 -- -- -- -- -- 358 * 563Oregon 751 -- -- -- -- -- 1,125 605Washington 703 -- -- -- -- -- 895 600
Source: Agency for Healthcare Research and Quality, Center for Financing, Access and Cost Trends. 2008 Medical Expenditure PanelSurvey-Insurance Component.Note: Definitions and descriptions of the methods used for this survey can be found in the Technical Appendix.* Figure does not meet standard of reliability or precision.-- Data suppressed due to high standard errors or no reported values in cell.
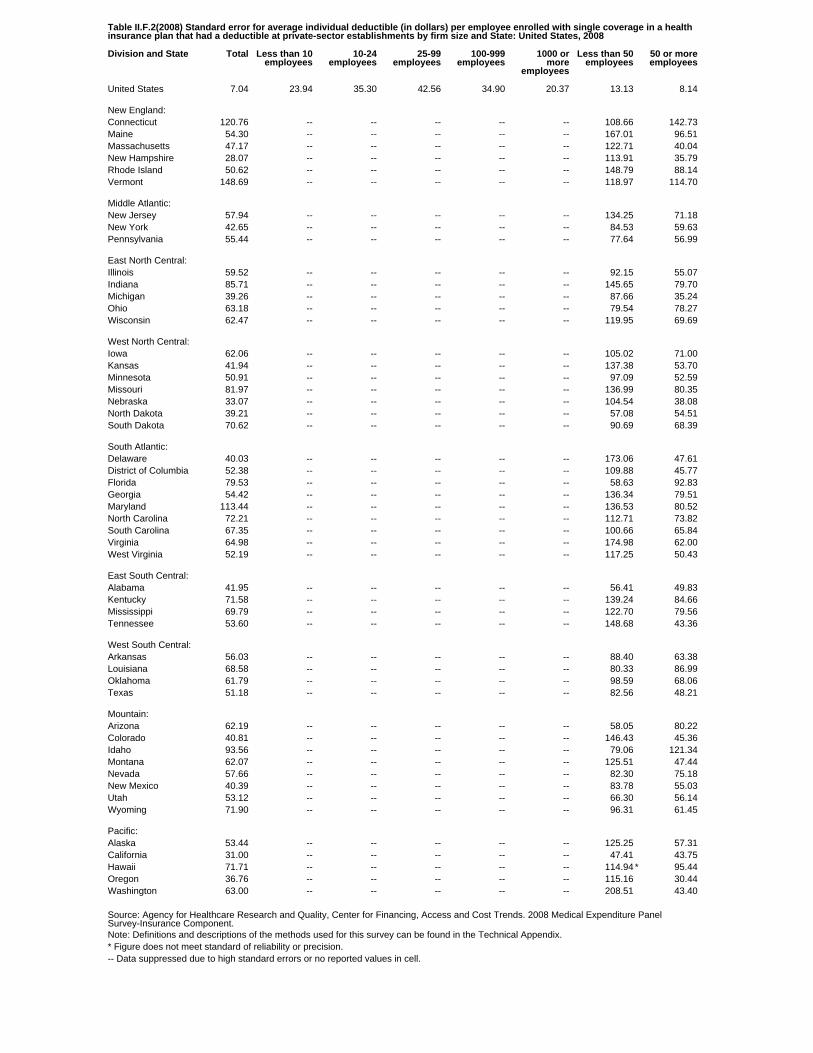
Table II.F.2(2008) Standard error for average individual deductible (in dollars) per employee enrolled with single coverage in a healthinsurance plan that had a deductible at private-sector establishments by firm size and State: United States, 2008
Division and State Total Less than 10employees
10-24employees
25-99employees
100-999employees
1000 ormore
employees
Less than 50employees
50 or moreemployees
United States 7.04 23.94 35.30 42.56 34.90 20.37 13.13 8.14
New England:Connecticut 120.76 -- -- -- -- -- 108.66 142.73Maine 54.30 -- -- -- -- -- 167.01 96.51Massachusetts 47.17 -- -- -- -- -- 122.71 40.04New Hampshire 28.07 -- -- -- -- -- 113.91 35.79Rhode Island 50.62 -- -- -- -- -- 148.79 88.14Vermont 148.69 -- -- -- -- -- 118.97 114.70
Middle Atlantic:New Jersey 57.94 -- -- -- -- -- 134.25 71.18New York 42.65 -- -- -- -- -- 84.53 59.63Pennsylvania 55.44 -- -- -- -- -- 77.64 56.99
East North Central:Illinois 59.52 -- -- -- -- -- 92.15 55.07Indiana 85.71 -- -- -- -- -- 145.65 79.70Michigan 39.26 -- -- -- -- -- 87.66 35.24Ohio 63.18 -- -- -- -- -- 79.54 78.27Wisconsin 62.47 -- -- -- -- -- 119.95 69.69
West North Central:Iowa 62.06 -- -- -- -- -- 105.02 71.00Kansas 41.94 -- -- -- -- -- 137.38 53.70Minnesota 50.91 -- -- -- -- -- 97.09 52.59Missouri 81.97 -- -- -- -- -- 136.99 80.35Nebraska 33.07 -- -- -- -- -- 104.54 38.08North Dakota 39.21 -- -- -- -- -- 57.08 54.51South Dakota 70.62 -- -- -- -- -- 90.69 68.39
South Atlantic:Delaware 40.03 -- -- -- -- -- 173.06 47.61District of Columbia 52.38 -- -- -- -- -- 109.88 45.77Florida 79.53 -- -- -- -- -- 58.63 92.83Georgia 54.42 -- -- -- -- -- 136.34 79.51Maryland 113.44 -- -- -- -- -- 136.53 80.52North Carolina 72.21 -- -- -- -- -- 112.71 73.82South Carolina 67.35 -- -- -- -- -- 100.66 65.84Virginia 64.98 -- -- -- -- -- 174.98 62.00West Virginia 52.19 -- -- -- -- -- 117.25 50.43
East South Central:Alabama 41.95 -- -- -- -- -- 56.41 49.83Kentucky 71.58 -- -- -- -- -- 139.24 84.66Mississippi 69.79 -- -- -- -- -- 122.70 79.56Tennessee 53.60 -- -- -- -- -- 148.68 43.36
West South Central:Arkansas 56.03 -- -- -- -- -- 88.40 63.38Louisiana 68.58 -- -- -- -- -- 80.33 86.99Oklahoma 61.79 -- -- -- -- -- 98.59 68.06Texas 51.18 -- -- -- -- -- 82.56 48.21
Mountain:Arizona 62.19 -- -- -- -- -- 58.05 80.22Colorado 40.81 -- -- -- -- -- 146.43 45.36Idaho 93.56 -- -- -- -- -- 79.06 121.34Montana 62.07 -- -- -- -- -- 125.51 47.44Nevada 57.66 -- -- -- -- -- 82.30 75.18New Mexico 40.39 -- -- -- -- -- 83.78 55.03Utah 53.12 -- -- -- -- -- 66.30 56.14Wyoming 71.90 -- -- -- -- -- 96.31 61.45
Pacific:Alaska 53.44 -- -- -- -- -- 125.25 57.31California 31.00 -- -- -- -- -- 47.41 43.75Hawaii 71.71 -- -- -- -- -- 114.94 * 95.44Oregon 36.76 -- -- -- -- -- 115.16 30.44Washington 63.00 -- -- -- -- -- 208.51 43.40
Source: Agency for Healthcare Research and Quality, Center for Financing, Access and Cost Trends. 2008 Medical Expenditure PanelSurvey-Insurance Component.Note: Definitions and descriptions of the methods used for this survey can be found in the Technical Appendix.* Figure does not meet standard of reliability or precision.-- Data suppressed due to high standard errors or no reported values in cell.
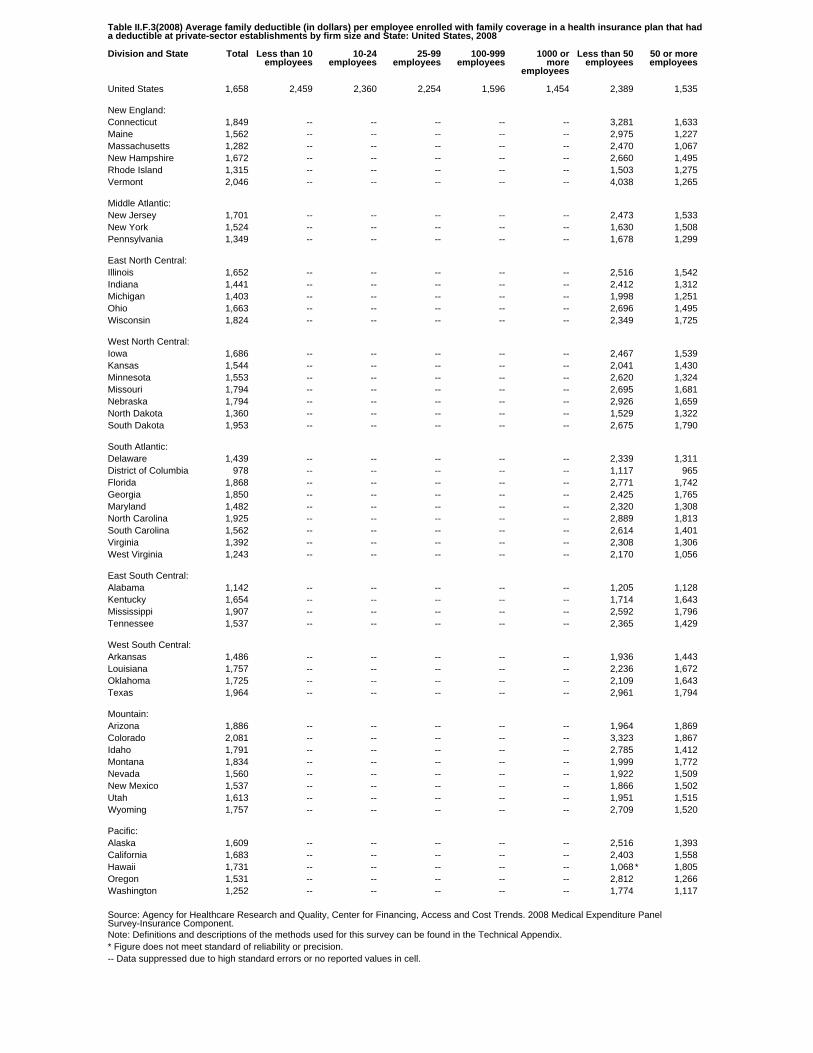
Table II.F.3(2008) Average family deductible (in dollars) per employee enrolled with family coverage in a health insurance plan that hada deductible at private-sector establishments by firm size and State: United States, 2008
Division and State Total Less than 10employees
10-24employees
25-99employees
100-999employees
1000 ormore
employees
Less than 50employees
50 or moreemployees
United States 1,658 2,459 2,360 2,254 1,596 1,454 2,389 1,535
New England:Connecticut 1,849 -- -- -- -- -- 3,281 1,633Maine 1,562 -- -- -- -- -- 2,975 1,227Massachusetts 1,282 -- -- -- -- -- 2,470 1,067New Hampshire 1,672 -- -- -- -- -- 2,660 1,495Rhode Island 1,315 -- -- -- -- -- 1,503 1,275Vermont 2,046 -- -- -- -- -- 4,038 1,265
Middle Atlantic:New Jersey 1,701 -- -- -- -- -- 2,473 1,533New York 1,524 -- -- -- -- -- 1,630 1,508Pennsylvania 1,349 -- -- -- -- -- 1,678 1,299
East North Central:Illinois 1,652 -- -- -- -- -- 2,516 1,542Indiana 1,441 -- -- -- -- -- 2,412 1,312Michigan 1,403 -- -- -- -- -- 1,998 1,251Ohio 1,663 -- -- -- -- -- 2,696 1,495Wisconsin 1,824 -- -- -- -- -- 2,349 1,725
West North Central:Iowa 1,686 -- -- -- -- -- 2,467 1,539Kansas 1,544 -- -- -- -- -- 2,041 1,430Minnesota 1,553 -- -- -- -- -- 2,620 1,324Missouri 1,794 -- -- -- -- -- 2,695 1,681Nebraska 1,794 -- -- -- -- -- 2,926 1,659North Dakota 1,360 -- -- -- -- -- 1,529 1,322South Dakota 1,953 -- -- -- -- -- 2,675 1,790
South Atlantic:Delaware 1,439 -- -- -- -- -- 2,339 1,311District of Columbia 978 -- -- -- -- -- 1,117 965Florida 1,868 -- -- -- -- -- 2,771 1,742Georgia 1,850 -- -- -- -- -- 2,425 1,765Maryland 1,482 -- -- -- -- -- 2,320 1,308North Carolina 1,925 -- -- -- -- -- 2,889 1,813South Carolina 1,562 -- -- -- -- -- 2,614 1,401Virginia 1,392 -- -- -- -- -- 2,308 1,306West Virginia 1,243 -- -- -- -- -- 2,170 1,056
East South Central:Alabama 1,142 -- -- -- -- -- 1,205 1,128Kentucky 1,654 -- -- -- -- -- 1,714 1,643Mississippi 1,907 -- -- -- -- -- 2,592 1,796Tennessee 1,537 -- -- -- -- -- 2,365 1,429
West South Central:Arkansas 1,486 -- -- -- -- -- 1,936 1,443Louisiana 1,757 -- -- -- -- -- 2,236 1,672Oklahoma 1,725 -- -- -- -- -- 2,109 1,643Texas 1,964 -- -- -- -- -- 2,961 1,794
Mountain:Arizona 1,886 -- -- -- -- -- 1,964 1,869Colorado 2,081 -- -- -- -- -- 3,323 1,867Idaho 1,791 -- -- -- -- -- 2,785 1,412Montana 1,834 -- -- -- -- -- 1,999 1,772Nevada 1,560 -- -- -- -- -- 1,922 1,509New Mexico 1,537 -- -- -- -- -- 1,866 1,502Utah 1,613 -- -- -- -- -- 1,951 1,515Wyoming 1,757 -- -- -- -- -- 2,709 1,520
Pacific:Alaska 1,609 -- -- -- -- -- 2,516 1,393California 1,683 -- -- -- -- -- 2,403 1,558Hawaii 1,731 -- -- -- -- -- 1,068 * 1,805Oregon 1,531 -- -- -- -- -- 2,812 1,266Washington 1,252 -- -- -- -- -- 1,774 1,117
Source: Agency for Healthcare Research and Quality, Center for Financing, Access and Cost Trends. 2008 Medical Expenditure PanelSurvey-Insurance Component.Note: Definitions and descriptions of the methods used for this survey can be found in the Technical Appendix.* Figure does not meet standard of reliability or precision.-- Data suppressed due to high standard errors or no reported values in cell.

Table II.F.3(2008) Standard error for average family deductible (in dollars) per employee enrolled with family coverage in a healthinsurance plan that had a deductible at private-sector establishments by firm size and State: United States, 2008
Division and State Total Less than 10employees
10-24employees
25-99employees
100-999employees
1000 ormore
employees
Less than 50employees
50 or moreemployees
United States 20.79 79.06 95.55 86.73 86.54 40.85 55.69 22.91
New England:Connecticut 219.20 -- -- -- -- -- 292.32 247.77Maine 84.86 -- -- -- -- -- 354.58 90.10Massachusetts 149.08 -- -- -- -- -- 538.42 74.23New Hampshire 109.01 -- -- -- -- -- 245.37 135.56Rhode Island 163.78 -- -- -- -- -- 256.88 213.48Vermont 229.64 -- -- -- -- -- 217.72 167.43
Middle Atlantic:New Jersey 110.26 -- -- -- -- -- 343.49 150.59New York 131.23 -- -- -- -- -- 263.87 139.08Pennsylvania 124.72 -- -- -- -- -- 162.60 134.19
East North Central:Illinois 174.96 -- -- -- -- -- 337.98 187.36Indiana 125.10 -- -- -- -- -- 279.44 135.53Michigan 90.60 -- -- -- -- -- 161.22 106.58Ohio 130.57 -- -- -- -- -- 288.66 128.76Wisconsin 102.67 -- -- -- -- -- 299.39 105.88
West North Central:Iowa 80.35 -- -- -- -- -- 181.57 99.17Kansas 56.71 -- -- -- -- -- 165.68 45.66Minnesota 144.39 -- -- -- -- -- 320.78 103.84Missouri 114.64 -- -- -- -- -- 281.94 120.10Nebraska 109.68 -- -- -- -- -- 275.20 112.26North Dakota 111.49 -- -- -- -- -- 146.31 140.36South Dakota 125.33 -- -- -- -- -- 238.21 142.61
South Atlantic:Delaware 98.96 -- -- -- -- -- 530.69 112.87District of Columbia 88.74 -- -- -- -- -- 159.98 114.00Florida 123.86 -- -- -- -- -- 222.38 168.85Georgia 152.70 -- -- -- -- -- 323.17 172.69Maryland 191.30 -- -- -- -- -- 285.19 168.90North Carolina 204.05 -- -- -- -- -- 349.02 220.87South Carolina 80.32 -- -- -- -- -- 240.71 91.63Virginia 131.56 -- -- -- -- -- 402.49 144.68West Virginia 93.41 -- -- -- -- -- 322.33 68.44
East South Central:Alabama 82.95 -- -- -- -- -- 126.11 100.25Kentucky 124.55 -- -- -- -- -- 225.99 154.11Mississippi 320.10 -- -- -- -- -- 345.05 337.81Tennessee 94.83 -- -- -- -- -- 273.33 108.88
West South Central:Arkansas 124.39 -- -- -- -- -- 312.12 130.46Louisiana 111.75 -- -- -- -- -- 281.00 95.89Oklahoma 80.06 -- -- -- -- -- 245.48 117.74Texas 137.82 -- -- -- -- -- 394.14 102.54
Mountain:Arizona 174.00 -- -- -- -- -- 165.89 195.08Colorado 116.86 -- -- -- -- -- 347.20 103.67Idaho 168.93 -- -- -- -- -- 374.60 139.28Montana 127.16 -- -- -- -- -- 219.91 142.13Nevada 103.75 -- -- -- -- -- 266.86 128.71New Mexico 102.97 -- -- -- -- -- 360.16 110.06Utah 118.64 -- -- -- -- -- 188.91 143.25Wyoming 171.55 -- -- -- -- -- 431.42 128.13
Pacific:Alaska 71.87 -- -- -- -- -- 327.71 79.88California 69.39 -- -- -- -- -- 195.32 80.19Hawaii 309.16 -- -- -- -- -- 465.96 * 340.24Oregon 108.17 -- -- -- -- -- 499.94 71.30Washington 101.21 -- -- -- -- -- 346.42 115.94
Source: Agency for Healthcare Research and Quality, Center for Financing, Access and Cost Trends. 2008 Medical Expenditure PanelSurvey-Insurance Component.Note: Definitions and descriptions of the methods used for this survey can be found in the Technical Appendix.* Figure does not meet standard of reliability or precision.-- Data suppressed due to high standard errors or no reported values in cell.
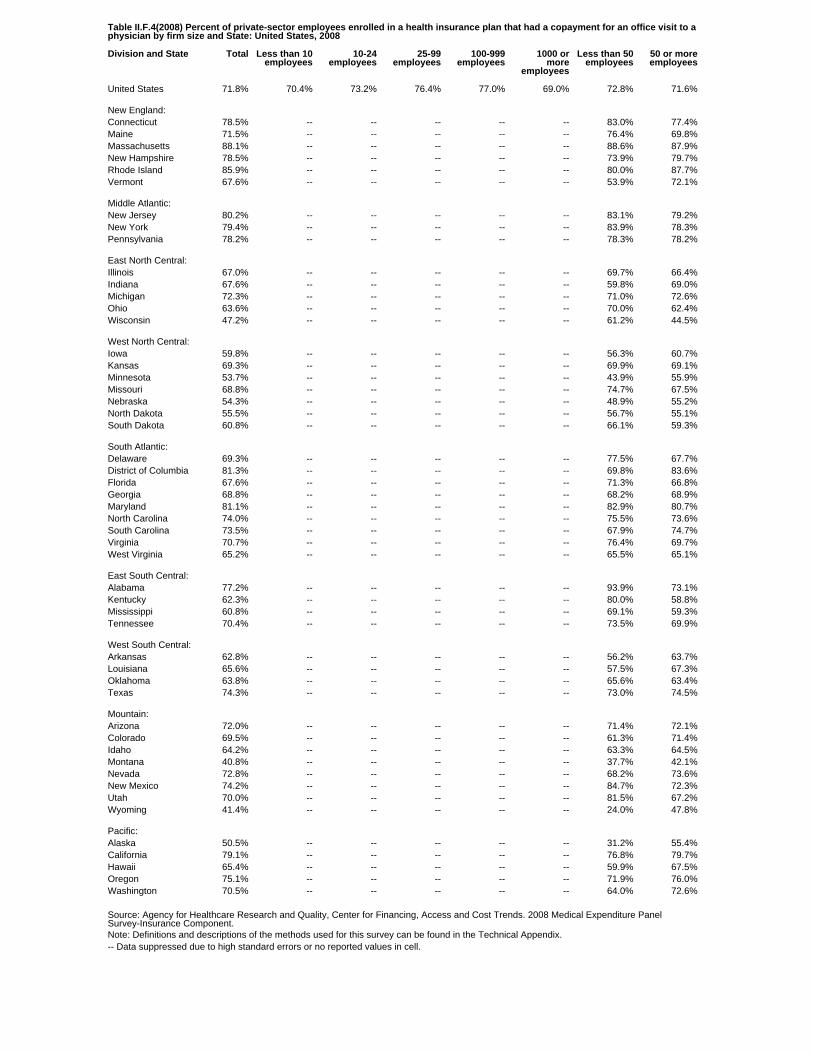
Table II.F.4(2008) Percent of private-sector employees enrolled in a health insurance plan that had a copayment for an office visit to aphysician by firm size and State: United States, 2008
Division and State Total Less than 10employees
10-24employees
25-99employees
100-999employees
1000 ormore
employees
Less than 50employees
50 or moreemployees
United States 71.8% 70.4% 73.2% 76.4% 77.0% 69.0% 72.8% 71.6%
New England:Connecticut 78.5% -- -- -- -- -- 83.0% 77.4%Maine 71.5% -- -- -- -- -- 76.4% 69.8%Massachusetts 88.1% -- -- -- -- -- 88.6% 87.9%New Hampshire 78.5% -- -- -- -- -- 73.9% 79.7%Rhode Island 85.9% -- -- -- -- -- 80.0% 87.7%Vermont 67.6% -- -- -- -- -- 53.9% 72.1%
Middle Atlantic:New Jersey 80.2% -- -- -- -- -- 83.1% 79.2%New York 79.4% -- -- -- -- -- 83.9% 78.3%Pennsylvania 78.2% -- -- -- -- -- 78.3% 78.2%
East North Central:Illinois 67.0% -- -- -- -- -- 69.7% 66.4%Indiana 67.6% -- -- -- -- -- 59.8% 69.0%Michigan 72.3% -- -- -- -- -- 71.0% 72.6%Ohio 63.6% -- -- -- -- -- 70.0% 62.4%Wisconsin 47.2% -- -- -- -- -- 61.2% 44.5%
West North Central:Iowa 59.8% -- -- -- -- -- 56.3% 60.7%Kansas 69.3% -- -- -- -- -- 69.9% 69.1%Minnesota 53.7% -- -- -- -- -- 43.9% 55.9%Missouri 68.8% -- -- -- -- -- 74.7% 67.5%Nebraska 54.3% -- -- -- -- -- 48.9% 55.2%North Dakota 55.5% -- -- -- -- -- 56.7% 55.1%South Dakota 60.8% -- -- -- -- -- 66.1% 59.3%
South Atlantic:Delaware 69.3% -- -- -- -- -- 77.5% 67.7%District of Columbia 81.3% -- -- -- -- -- 69.8% 83.6%Florida 67.6% -- -- -- -- -- 71.3% 66.8%Georgia 68.8% -- -- -- -- -- 68.2% 68.9%Maryland 81.1% -- -- -- -- -- 82.9% 80.7%North Carolina 74.0% -- -- -- -- -- 75.5% 73.6%South Carolina 73.5% -- -- -- -- -- 67.9% 74.7%Virginia 70.7% -- -- -- -- -- 76.4% 69.7%West Virginia 65.2% -- -- -- -- -- 65.5% 65.1%
East South Central:Alabama 77.2% -- -- -- -- -- 93.9% 73.1%Kentucky 62.3% -- -- -- -- -- 80.0% 58.8%Mississippi 60.8% -- -- -- -- -- 69.1% 59.3%Tennessee 70.4% -- -- -- -- -- 73.5% 69.9%
West South Central:Arkansas 62.8% -- -- -- -- -- 56.2% 63.7%Louisiana 65.6% -- -- -- -- -- 57.5% 67.3%Oklahoma 63.8% -- -- -- -- -- 65.6% 63.4%Texas 74.3% -- -- -- -- -- 73.0% 74.5%
Mountain:Arizona 72.0% -- -- -- -- -- 71.4% 72.1%Colorado 69.5% -- -- -- -- -- 61.3% 71.4%Idaho 64.2% -- -- -- -- -- 63.3% 64.5%Montana 40.8% -- -- -- -- -- 37.7% 42.1%Nevada 72.8% -- -- -- -- -- 68.2% 73.6%New Mexico 74.2% -- -- -- -- -- 84.7% 72.3%Utah 70.0% -- -- -- -- -- 81.5% 67.2%Wyoming 41.4% -- -- -- -- -- 24.0% 47.8%
Pacific:Alaska 50.5% -- -- -- -- -- 31.2% 55.4%California 79.1% -- -- -- -- -- 76.8% 79.7%Hawaii 65.4% -- -- -- -- -- 59.9% 67.5%Oregon 75.1% -- -- -- -- -- 71.9% 76.0%Washington 70.5% -- -- -- -- -- 64.0% 72.6%
Source: Agency for Healthcare Research and Quality, Center for Financing, Access and Cost Trends. 2008 Medical Expenditure PanelSurvey-Insurance Component.Note: Definitions and descriptions of the methods used for this survey can be found in the Technical Appendix.-- Data suppressed due to high standard errors or no reported values in cell.
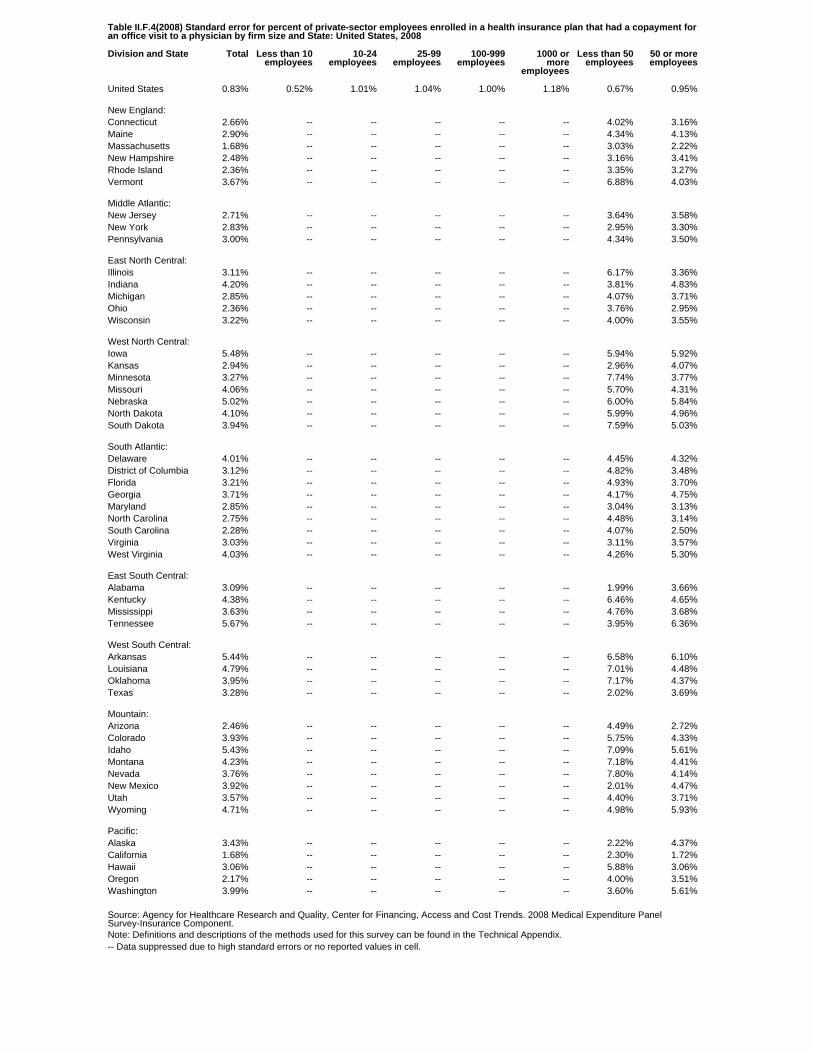
Table II.F.4(2008) Standard error for percent of private-sector employees enrolled in a health insurance plan that had a copayment foran office visit to a physician by firm size and State: United States, 2008
Division and State Total Less than 10employees
10-24employees
25-99employees
100-999employees
1000 ormore
employees
Less than 50employees
50 or moreemployees
United States 0.83% 0.52% 1.01% 1.04% 1.00% 1.18% 0.67% 0.95%
New England:Connecticut 2.66% -- -- -- -- -- 4.02% 3.16%Maine 2.90% -- -- -- -- -- 4.34% 4.13%Massachusetts 1.68% -- -- -- -- -- 3.03% 2.22%New Hampshire 2.48% -- -- -- -- -- 3.16% 3.41%Rhode Island 2.36% -- -- -- -- -- 3.35% 3.27%Vermont 3.67% -- -- -- -- -- 6.88% 4.03%
Middle Atlantic:New Jersey 2.71% -- -- -- -- -- 3.64% 3.58%New York 2.83% -- -- -- -- -- 2.95% 3.30%Pennsylvania 3.00% -- -- -- -- -- 4.34% 3.50%
East North Central:Illinois 3.11% -- -- -- -- -- 6.17% 3.36%Indiana 4.20% -- -- -- -- -- 3.81% 4.83%Michigan 2.85% -- -- -- -- -- 4.07% 3.71%Ohio 2.36% -- -- -- -- -- 3.76% 2.95%Wisconsin 3.22% -- -- -- -- -- 4.00% 3.55%
West North Central:Iowa 5.48% -- -- -- -- -- 5.94% 5.92%Kansas 2.94% -- -- -- -- -- 2.96% 4.07%Minnesota 3.27% -- -- -- -- -- 7.74% 3.77%Missouri 4.06% -- -- -- -- -- 5.70% 4.31%Nebraska 5.02% -- -- -- -- -- 6.00% 5.84%North Dakota 4.10% -- -- -- -- -- 5.99% 4.96%South Dakota 3.94% -- -- -- -- -- 7.59% 5.03%
South Atlantic:Delaware 4.01% -- -- -- -- -- 4.45% 4.32%District of Columbia 3.12% -- -- -- -- -- 4.82% 3.48%Florida 3.21% -- -- -- -- -- 4.93% 3.70%Georgia 3.71% -- -- -- -- -- 4.17% 4.75%Maryland 2.85% -- -- -- -- -- 3.04% 3.13%North Carolina 2.75% -- -- -- -- -- 4.48% 3.14%South Carolina 2.28% -- -- -- -- -- 4.07% 2.50%Virginia 3.03% -- -- -- -- -- 3.11% 3.57%West Virginia 4.03% -- -- -- -- -- 4.26% 5.30%
East South Central:Alabama 3.09% -- -- -- -- -- 1.99% 3.66%Kentucky 4.38% -- -- -- -- -- 6.46% 4.65%Mississippi 3.63% -- -- -- -- -- 4.76% 3.68%Tennessee 5.67% -- -- -- -- -- 3.95% 6.36%
West South Central:Arkansas 5.44% -- -- -- -- -- 6.58% 6.10%Louisiana 4.79% -- -- -- -- -- 7.01% 4.48%Oklahoma 3.95% -- -- -- -- -- 7.17% 4.37%Texas 3.28% -- -- -- -- -- 2.02% 3.69%
Mountain:Arizona 2.46% -- -- -- -- -- 4.49% 2.72%Colorado 3.93% -- -- -- -- -- 5.75% 4.33%Idaho 5.43% -- -- -- -- -- 7.09% 5.61%Montana 4.23% -- -- -- -- -- 7.18% 4.41%Nevada 3.76% -- -- -- -- -- 7.80% 4.14%New Mexico 3.92% -- -- -- -- -- 2.01% 4.47%Utah 3.57% -- -- -- -- -- 4.40% 3.71%Wyoming 4.71% -- -- -- -- -- 4.98% 5.93%
Pacific:Alaska 3.43% -- -- -- -- -- 2.22% 4.37%California 1.68% -- -- -- -- -- 2.30% 1.72%Hawaii 3.06% -- -- -- -- -- 5.88% 3.06%Oregon 2.17% -- -- -- -- -- 4.00% 3.51%Washington 3.99% -- -- -- -- -- 3.60% 5.61%
Source: Agency for Healthcare Research and Quality, Center for Financing, Access and Cost Trends. 2008 Medical Expenditure PanelSurvey-Insurance Component.Note: Definitions and descriptions of the methods used for this survey can be found in the Technical Appendix.-- Data suppressed due to high standard errors or no reported values in cell.
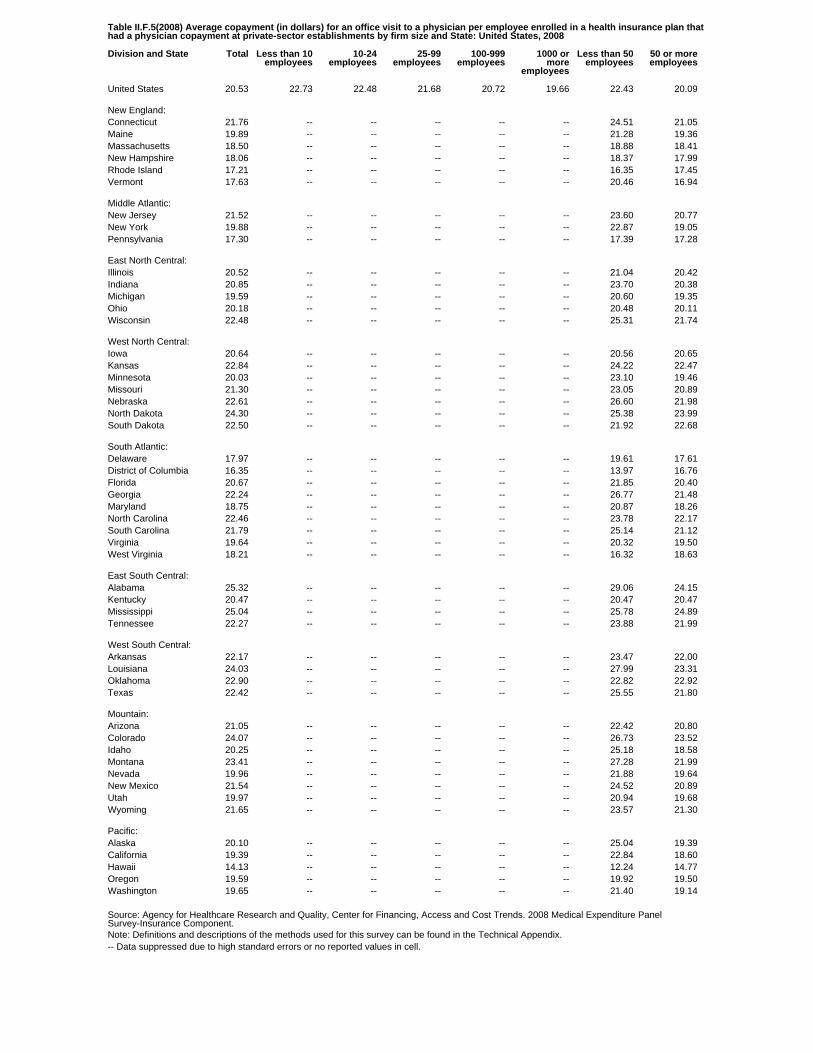
Table II.F.5(2008) Average copayment (in dollars) for an office visit to a physician per employee enrolled in a health insurance plan thathad a physician copayment at private-sector establishments by firm size and State: United States, 2008
Division and State Total Less than 10employees
10-24employees
25-99employees
100-999employees
1000 ormore
employees
Less than 50employees
50 or moreemployees
United States 20.53 22.73 22.48 21.68 20.72 19.66 22.43 20.09
New England:Connecticut 21.76 -- -- -- -- -- 24.51 21.05Maine 19.89 -- -- -- -- -- 21.28 19.36Massachusetts 18.50 -- -- -- -- -- 18.88 18.41New Hampshire 18.06 -- -- -- -- -- 18.37 17.99Rhode Island 17.21 -- -- -- -- -- 16.35 17.45Vermont 17.63 -- -- -- -- -- 20.46 16.94
Middle Atlantic:New Jersey 21.52 -- -- -- -- -- 23.60 20.77New York 19.88 -- -- -- -- -- 22.87 19.05Pennsylvania 17.30 -- -- -- -- -- 17.39 17.28
East North Central:Illinois 20.52 -- -- -- -- -- 21.04 20.42Indiana 20.85 -- -- -- -- -- 23.70 20.38Michigan 19.59 -- -- -- -- -- 20.60 19.35Ohio 20.18 -- -- -- -- -- 20.48 20.11Wisconsin 22.48 -- -- -- -- -- 25.31 21.74
West North Central:Iowa 20.64 -- -- -- -- -- 20.56 20.65Kansas 22.84 -- -- -- -- -- 24.22 22.47Minnesota 20.03 -- -- -- -- -- 23.10 19.46Missouri 21.30 -- -- -- -- -- 23.05 20.89Nebraska 22.61 -- -- -- -- -- 26.60 21.98North Dakota 24.30 -- -- -- -- -- 25.38 23.99South Dakota 22.50 -- -- -- -- -- 21.92 22.68
South Atlantic:Delaware 17.97 -- -- -- -- -- 19.61 17.61District of Columbia 16.35 -- -- -- -- -- 13.97 16.76Florida 20.67 -- -- -- -- -- 21.85 20.40Georgia 22.24 -- -- -- -- -- 26.77 21.48Maryland 18.75 -- -- -- -- -- 20.87 18.26North Carolina 22.46 -- -- -- -- -- 23.78 22.17South Carolina 21.79 -- -- -- -- -- 25.14 21.12Virginia 19.64 -- -- -- -- -- 20.32 19.50West Virginia 18.21 -- -- -- -- -- 16.32 18.63
East South Central:Alabama 25.32 -- -- -- -- -- 29.06 24.15Kentucky 20.47 -- -- -- -- -- 20.47 20.47Mississippi 25.04 -- -- -- -- -- 25.78 24.89Tennessee 22.27 -- -- -- -- -- 23.88 21.99
West South Central:Arkansas 22.17 -- -- -- -- -- 23.47 22.00Louisiana 24.03 -- -- -- -- -- 27.99 23.31Oklahoma 22.90 -- -- -- -- -- 22.82 22.92Texas 22.42 -- -- -- -- -- 25.55 21.80
Mountain:Arizona 21.05 -- -- -- -- -- 22.42 20.80Colorado 24.07 -- -- -- -- -- 26.73 23.52Idaho 20.25 -- -- -- -- -- 25.18 18.58Montana 23.41 -- -- -- -- -- 27.28 21.99Nevada 19.96 -- -- -- -- -- 21.88 19.64New Mexico 21.54 -- -- -- -- -- 24.52 20.89Utah 19.97 -- -- -- -- -- 20.94 19.68Wyoming 21.65 -- -- -- -- -- 23.57 21.30
Pacific:Alaska 20.10 -- -- -- -- -- 25.04 19.39California 19.39 -- -- -- -- -- 22.84 18.60Hawaii 14.13 -- -- -- -- -- 12.24 14.77Oregon 19.59 -- -- -- -- -- 19.92 19.50Washington 19.65 -- -- -- -- -- 21.40 19.14
Source: Agency for Healthcare Research and Quality, Center for Financing, Access and Cost Trends. 2008 Medical Expenditure PanelSurvey-Insurance Component.Note: Definitions and descriptions of the methods used for this survey can be found in the Technical Appendix.-- Data suppressed due to high standard errors or no reported values in cell.
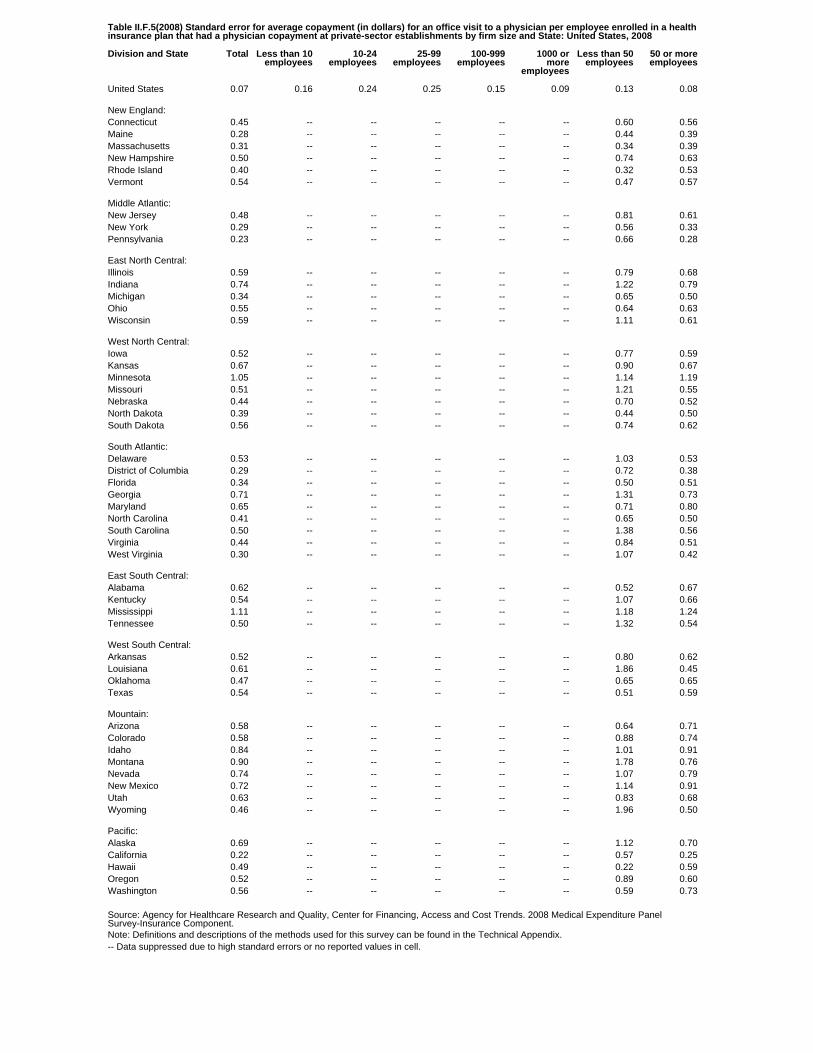
Table II.F.5(2008) Standard error for average copayment (in dollars) for an office visit to a physician per employee enrolled in a healthinsurance plan that had a physician copayment at private-sector establishments by firm size and State: United States, 2008
Division and State Total Less than 10employees
10-24employees
25-99employees
100-999employees
1000 ormore
employees
Less than 50employees
50 or moreemployees
United States 0.07 0.16 0.24 0.25 0.15 0.09 0.13 0.08
New England:Connecticut 0.45 -- -- -- -- -- 0.60 0.56Maine 0.28 -- -- -- -- -- 0.44 0.39Massachusetts 0.31 -- -- -- -- -- 0.34 0.39New Hampshire 0.50 -- -- -- -- -- 0.74 0.63Rhode Island 0.40 -- -- -- -- -- 0.32 0.53Vermont 0.54 -- -- -- -- -- 0.47 0.57
Middle Atlantic:New Jersey 0.48 -- -- -- -- -- 0.81 0.61New York 0.29 -- -- -- -- -- 0.56 0.33Pennsylvania 0.23 -- -- -- -- -- 0.66 0.28
East North Central:Illinois 0.59 -- -- -- -- -- 0.79 0.68Indiana 0.74 -- -- -- -- -- 1.22 0.79Michigan 0.34 -- -- -- -- -- 0.65 0.50Ohio 0.55 -- -- -- -- -- 0.64 0.63Wisconsin 0.59 -- -- -- -- -- 1.11 0.61
West North Central:Iowa 0.52 -- -- -- -- -- 0.77 0.59Kansas 0.67 -- -- -- -- -- 0.90 0.67Minnesota 1.05 -- -- -- -- -- 1.14 1.19Missouri 0.51 -- -- -- -- -- 1.21 0.55Nebraska 0.44 -- -- -- -- -- 0.70 0.52North Dakota 0.39 -- -- -- -- -- 0.44 0.50South Dakota 0.56 -- -- -- -- -- 0.74 0.62
South Atlantic:Delaware 0.53 -- -- -- -- -- 1.03 0.53District of Columbia 0.29 -- -- -- -- -- 0.72 0.38Florida 0.34 -- -- -- -- -- 0.50 0.51Georgia 0.71 -- -- -- -- -- 1.31 0.73Maryland 0.65 -- -- -- -- -- 0.71 0.80North Carolina 0.41 -- -- -- -- -- 0.65 0.50South Carolina 0.50 -- -- -- -- -- 1.38 0.56Virginia 0.44 -- -- -- -- -- 0.84 0.51West Virginia 0.30 -- -- -- -- -- 1.07 0.42
East South Central:Alabama 0.62 -- -- -- -- -- 0.52 0.67Kentucky 0.54 -- -- -- -- -- 1.07 0.66Mississippi 1.11 -- -- -- -- -- 1.18 1.24Tennessee 0.50 -- -- -- -- -- 1.32 0.54
West South Central:Arkansas 0.52 -- -- -- -- -- 0.80 0.62Louisiana 0.61 -- -- -- -- -- 1.86 0.45Oklahoma 0.47 -- -- -- -- -- 0.65 0.65Texas 0.54 -- -- -- -- -- 0.51 0.59
Mountain:Arizona 0.58 -- -- -- -- -- 0.64 0.71Colorado 0.58 -- -- -- -- -- 0.88 0.74Idaho 0.84 -- -- -- -- -- 1.01 0.91Montana 0.90 -- -- -- -- -- 1.78 0.76Nevada 0.74 -- -- -- -- -- 1.07 0.79New Mexico 0.72 -- -- -- -- -- 1.14 0.91Utah 0.63 -- -- -- -- -- 0.83 0.68Wyoming 0.46 -- -- -- -- -- 1.96 0.50
Pacific:Alaska 0.69 -- -- -- -- -- 1.12 0.70California 0.22 -- -- -- -- -- 0.57 0.25Hawaii 0.49 -- -- -- -- -- 0.22 0.59Oregon 0.52 -- -- -- -- -- 0.89 0.60Washington 0.56 -- -- -- -- -- 0.59 0.73
Source: Agency for Healthcare Research and Quality, Center for Financing, Access and Cost Trends. 2008 Medical Expenditure PanelSurvey-Insurance Component.Note: Definitions and descriptions of the methods used for this survey can be found in the Technical Appendix.-- Data suppressed due to high standard errors or no reported values in cell.
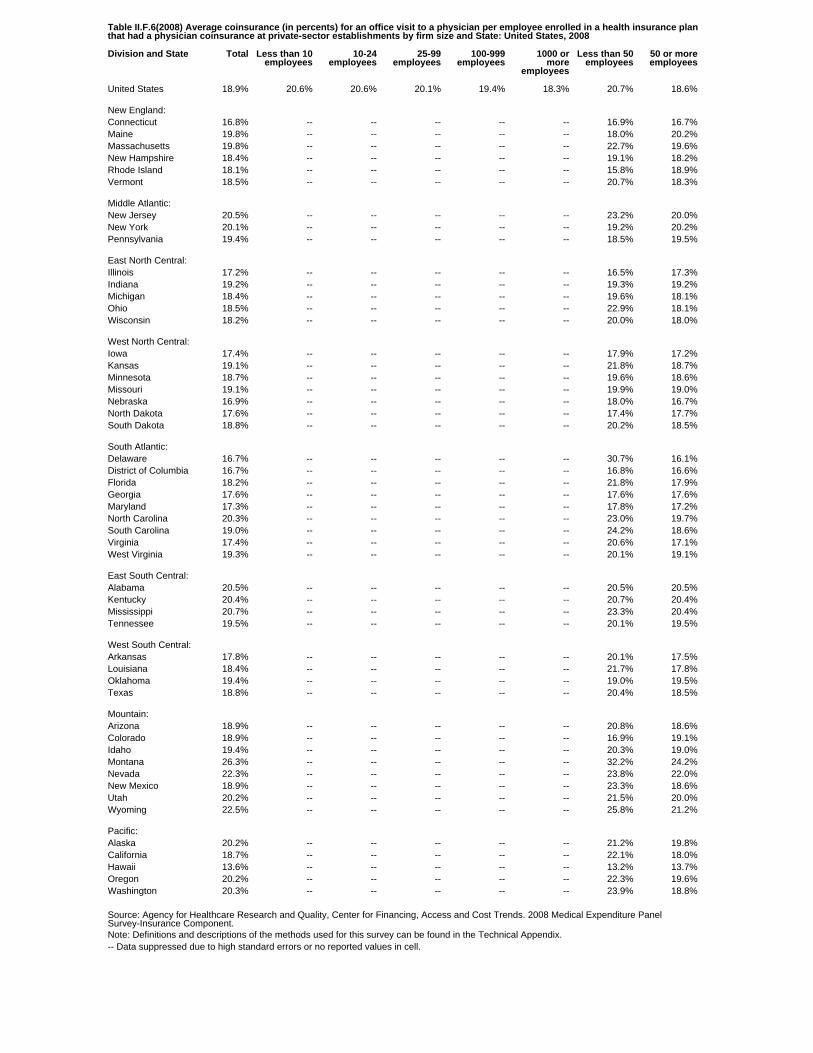
Table II.F.6(2008) Average coinsurance (in percents) for an office visit to a physician per employee enrolled in a health insurance planthat had a physician coinsurance at private-sector establishments by firm size and State: United States, 2008
Division and State Total Less than 10employees
10-24employees
25-99employees
100-999employees
1000 ormore
employees
Less than 50employees
50 or moreemployees
United States 18.9% 20.6% 20.6% 20.1% 19.4% 18.3% 20.7% 18.6%
New England:Connecticut 16.8% -- -- -- -- -- 16.9% 16.7%Maine 19.8% -- -- -- -- -- 18.0% 20.2%Massachusetts 19.8% -- -- -- -- -- 22.7% 19.6%New Hampshire 18.4% -- -- -- -- -- 19.1% 18.2%Rhode Island 18.1% -- -- -- -- -- 15.8% 18.9%Vermont 18.5% -- -- -- -- -- 20.7% 18.3%
Middle Atlantic:New Jersey 20.5% -- -- -- -- -- 23.2% 20.0%New York 20.1% -- -- -- -- -- 19.2% 20.2%Pennsylvania 19.4% -- -- -- -- -- 18.5% 19.5%
East North Central:Illinois 17.2% -- -- -- -- -- 16.5% 17.3%Indiana 19.2% -- -- -- -- -- 19.3% 19.2%Michigan 18.4% -- -- -- -- -- 19.6% 18.1%Ohio 18.5% -- -- -- -- -- 22.9% 18.1%Wisconsin 18.2% -- -- -- -- -- 20.0% 18.0%
West North Central:Iowa 17.4% -- -- -- -- -- 17.9% 17.2%Kansas 19.1% -- -- -- -- -- 21.8% 18.7%Minnesota 18.7% -- -- -- -- -- 19.6% 18.6%Missouri 19.1% -- -- -- -- -- 19.9% 19.0%Nebraska 16.9% -- -- -- -- -- 18.0% 16.7%North Dakota 17.6% -- -- -- -- -- 17.4% 17.7%South Dakota 18.8% -- -- -- -- -- 20.2% 18.5%
South Atlantic:Delaware 16.7% -- -- -- -- -- 30.7% 16.1%District of Columbia 16.7% -- -- -- -- -- 16.8% 16.6%Florida 18.2% -- -- -- -- -- 21.8% 17.9%Georgia 17.6% -- -- -- -- -- 17.6% 17.6%Maryland 17.3% -- -- -- -- -- 17.8% 17.2%North Carolina 20.3% -- -- -- -- -- 23.0% 19.7%South Carolina 19.0% -- -- -- -- -- 24.2% 18.6%Virginia 17.4% -- -- -- -- -- 20.6% 17.1%West Virginia 19.3% -- -- -- -- -- 20.1% 19.1%
East South Central:Alabama 20.5% -- -- -- -- -- 20.5% 20.5%Kentucky 20.4% -- -- -- -- -- 20.7% 20.4%Mississippi 20.7% -- -- -- -- -- 23.3% 20.4%Tennessee 19.5% -- -- -- -- -- 20.1% 19.5%
West South Central:Arkansas 17.8% -- -- -- -- -- 20.1% 17.5%Louisiana 18.4% -- -- -- -- -- 21.7% 17.8%Oklahoma 19.4% -- -- -- -- -- 19.0% 19.5%Texas 18.8% -- -- -- -- -- 20.4% 18.5%
Mountain:Arizona 18.9% -- -- -- -- -- 20.8% 18.6%Colorado 18.9% -- -- -- -- -- 16.9% 19.1%Idaho 19.4% -- -- -- -- -- 20.3% 19.0%Montana 26.3% -- -- -- -- -- 32.2% 24.2%Nevada 22.3% -- -- -- -- -- 23.8% 22.0%New Mexico 18.9% -- -- -- -- -- 23.3% 18.6%Utah 20.2% -- -- -- -- -- 21.5% 20.0%Wyoming 22.5% -- -- -- -- -- 25.8% 21.2%
Pacific:Alaska 20.2% -- -- -- -- -- 21.2% 19.8%California 18.7% -- -- -- -- -- 22.1% 18.0%Hawaii 13.6% -- -- -- -- -- 13.2% 13.7%Oregon 20.2% -- -- -- -- -- 22.3% 19.6%Washington 20.3% -- -- -- -- -- 23.9% 18.8%
Source: Agency for Healthcare Research and Quality, Center for Financing, Access and Cost Trends. 2008 Medical Expenditure PanelSurvey-Insurance Component.Note: Definitions and descriptions of the methods used for this survey can be found in the Technical Appendix.-- Data suppressed due to high standard errors or no reported values in cell.
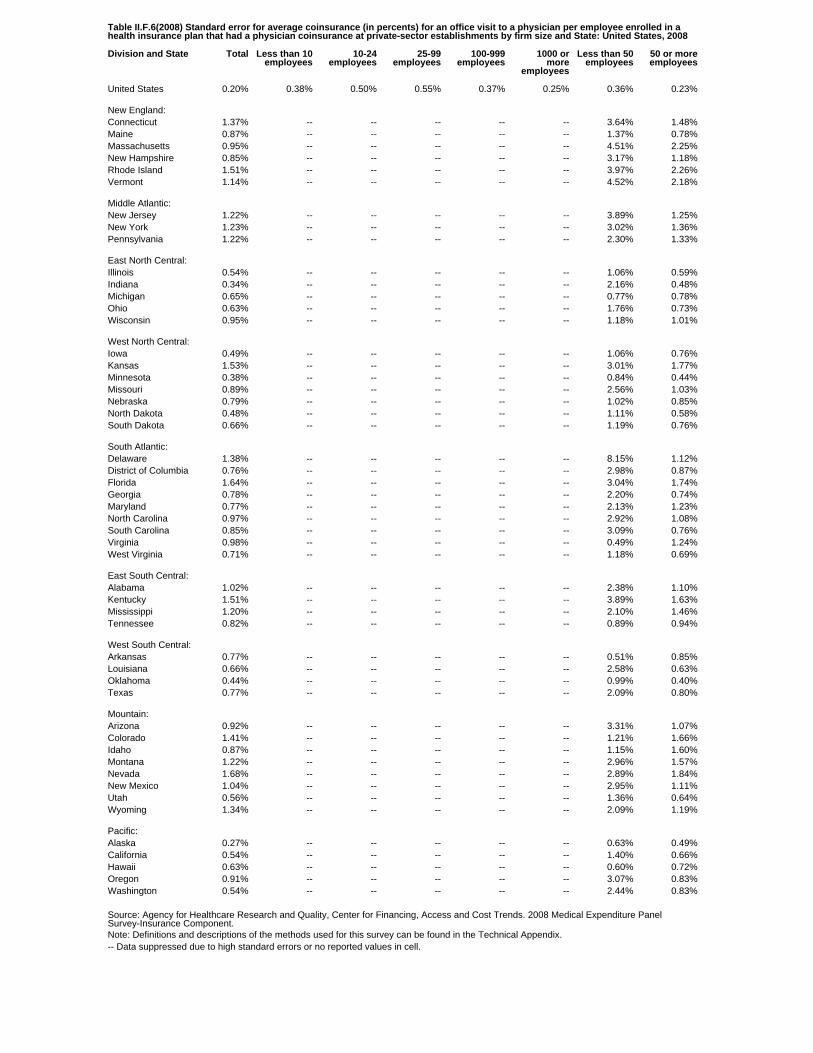
Table II.F.6(2008) Standard error for average coinsurance (in percents) for an office visit to a physician per employee enrolled in ahealth insurance plan that had a physician coinsurance at private-sector establishments by firm size and State: United States, 2008
Division and State Total Less than 10employees
10-24employees
25-99employees
100-999employees
1000 ormore
employees
Less than 50employees
50 or moreemployees
United States 0.20% 0.38% 0.50% 0.55% 0.37% 0.25% 0.36% 0.23%
New England:Connecticut 1.37% -- -- -- -- -- 3.64% 1.48%Maine 0.87% -- -- -- -- -- 1.37% 0.78%Massachusetts 0.95% -- -- -- -- -- 4.51% 2.25%New Hampshire 0.85% -- -- -- -- -- 3.17% 1.18%Rhode Island 1.51% -- -- -- -- -- 3.97% 2.26%Vermont 1.14% -- -- -- -- -- 4.52% 2.18%
Middle Atlantic:New Jersey 1.22% -- -- -- -- -- 3.89% 1.25%New York 1.23% -- -- -- -- -- 3.02% 1.36%Pennsylvania 1.22% -- -- -- -- -- 2.30% 1.33%
East North Central:Illinois 0.54% -- -- -- -- -- 1.06% 0.59%Indiana 0.34% -- -- -- -- -- 2.16% 0.48%Michigan 0.65% -- -- -- -- -- 0.77% 0.78%Ohio 0.63% -- -- -- -- -- 1.76% 0.73%Wisconsin 0.95% -- -- -- -- -- 1.18% 1.01%
West North Central:Iowa 0.49% -- -- -- -- -- 1.06% 0.76%Kansas 1.53% -- -- -- -- -- 3.01% 1.77%Minnesota 0.38% -- -- -- -- -- 0.84% 0.44%Missouri 0.89% -- -- -- -- -- 2.56% 1.03%Nebraska 0.79% -- -- -- -- -- 1.02% 0.85%North Dakota 0.48% -- -- -- -- -- 1.11% 0.58%South Dakota 0.66% -- -- -- -- -- 1.19% 0.76%
South Atlantic:Delaware 1.38% -- -- -- -- -- 8.15% 1.12%District of Columbia 0.76% -- -- -- -- -- 2.98% 0.87%Florida 1.64% -- -- -- -- -- 3.04% 1.74%Georgia 0.78% -- -- -- -- -- 2.20% 0.74%Maryland 0.77% -- -- -- -- -- 2.13% 1.23%North Carolina 0.97% -- -- -- -- -- 2.92% 1.08%South Carolina 0.85% -- -- -- -- -- 3.09% 0.76%Virginia 0.98% -- -- -- -- -- 0.49% 1.24%West Virginia 0.71% -- -- -- -- -- 1.18% 0.69%
East South Central:Alabama 1.02% -- -- -- -- -- 2.38% 1.10%Kentucky 1.51% -- -- -- -- -- 3.89% 1.63%Mississippi 1.20% -- -- -- -- -- 2.10% 1.46%Tennessee 0.82% -- -- -- -- -- 0.89% 0.94%
West South Central:Arkansas 0.77% -- -- -- -- -- 0.51% 0.85%Louisiana 0.66% -- -- -- -- -- 2.58% 0.63%Oklahoma 0.44% -- -- -- -- -- 0.99% 0.40%Texas 0.77% -- -- -- -- -- 2.09% 0.80%
Mountain:Arizona 0.92% -- -- -- -- -- 3.31% 1.07%Colorado 1.41% -- -- -- -- -- 1.21% 1.66%Idaho 0.87% -- -- -- -- -- 1.15% 1.60%Montana 1.22% -- -- -- -- -- 2.96% 1.57%Nevada 1.68% -- -- -- -- -- 2.89% 1.84%New Mexico 1.04% -- -- -- -- -- 2.95% 1.11%Utah 0.56% -- -- -- -- -- 1.36% 0.64%Wyoming 1.34% -- -- -- -- -- 2.09% 1.19%
Pacific:Alaska 0.27% -- -- -- -- -- 0.63% 0.49%California 0.54% -- -- -- -- -- 1.40% 0.66%Hawaii 0.63% -- -- -- -- -- 0.60% 0.72%Oregon 0.91% -- -- -- -- -- 3.07% 0.83%Washington 0.54% -- -- -- -- -- 2.44% 0.83%
Source: Agency for Healthcare Research and Quality, Center for Financing, Access and Cost Trends. 2008 Medical Expenditure PanelSurvey-Insurance Component.Note: Definitions and descriptions of the methods used for this survey can be found in the Technical Appendix.-- Data suppressed due to high standard errors or no reported values in cell.
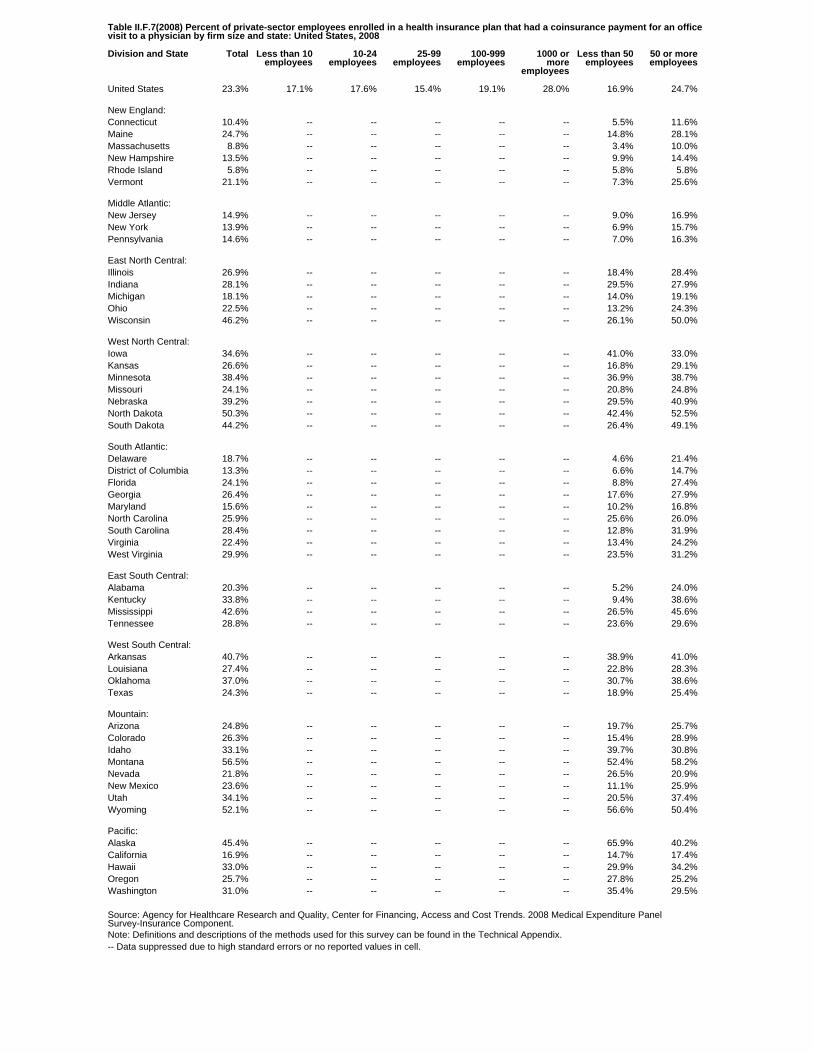
Table II.F.7(2008) Percent of private-sector employees enrolled in a health insurance plan that had a coinsurance payment for an officevisit to a physician by firm size and state: United States, 2008
Division and State Total Less than 10employees
10-24employees
25-99employees
100-999employees
1000 ormore
employees
Less than 50employees
50 or moreemployees
United States 23.3% 17.1% 17.6% 15.4% 19.1% 28.0% 16.9% 24.7%
New England:Connecticut 10.4% -- -- -- -- -- 5.5% 11.6%Maine 24.7% -- -- -- -- -- 14.8% 28.1%Massachusetts 8.8% -- -- -- -- -- 3.4% 10.0%New Hampshire 13.5% -- -- -- -- -- 9.9% 14.4%Rhode Island 5.8% -- -- -- -- -- 5.8% 5.8%Vermont 21.1% -- -- -- -- -- 7.3% 25.6%
Middle Atlantic:New Jersey 14.9% -- -- -- -- -- 9.0% 16.9%New York 13.9% -- -- -- -- -- 6.9% 15.7%Pennsylvania 14.6% -- -- -- -- -- 7.0% 16.3%
East North Central:Illinois 26.9% -- -- -- -- -- 18.4% 28.4%Indiana 28.1% -- -- -- -- -- 29.5% 27.9%Michigan 18.1% -- -- -- -- -- 14.0% 19.1%Ohio 22.5% -- -- -- -- -- 13.2% 24.3%Wisconsin 46.2% -- -- -- -- -- 26.1% 50.0%
West North Central:Iowa 34.6% -- -- -- -- -- 41.0% 33.0%Kansas 26.6% -- -- -- -- -- 16.8% 29.1%Minnesota 38.4% -- -- -- -- -- 36.9% 38.7%Missouri 24.1% -- -- -- -- -- 20.8% 24.8%Nebraska 39.2% -- -- -- -- -- 29.5% 40.9%North Dakota 50.3% -- -- -- -- -- 42.4% 52.5%South Dakota 44.2% -- -- -- -- -- 26.4% 49.1%
South Atlantic:Delaware 18.7% -- -- -- -- -- 4.6% 21.4%District of Columbia 13.3% -- -- -- -- -- 6.6% 14.7%Florida 24.1% -- -- -- -- -- 8.8% 27.4%Georgia 26.4% -- -- -- -- -- 17.6% 27.9%Maryland 15.6% -- -- -- -- -- 10.2% 16.8%North Carolina 25.9% -- -- -- -- -- 25.6% 26.0%South Carolina 28.4% -- -- -- -- -- 12.8% 31.9%Virginia 22.4% -- -- -- -- -- 13.4% 24.2%West Virginia 29.9% -- -- -- -- -- 23.5% 31.2%
East South Central:Alabama 20.3% -- -- -- -- -- 5.2% 24.0%Kentucky 33.8% -- -- -- -- -- 9.4% 38.6%Mississippi 42.6% -- -- -- -- -- 26.5% 45.6%Tennessee 28.8% -- -- -- -- -- 23.6% 29.6%
West South Central:Arkansas 40.7% -- -- -- -- -- 38.9% 41.0%Louisiana 27.4% -- -- -- -- -- 22.8% 28.3%Oklahoma 37.0% -- -- -- -- -- 30.7% 38.6%Texas 24.3% -- -- -- -- -- 18.9% 25.4%
Mountain:Arizona 24.8% -- -- -- -- -- 19.7% 25.7%Colorado 26.3% -- -- -- -- -- 15.4% 28.9%Idaho 33.1% -- -- -- -- -- 39.7% 30.8%Montana 56.5% -- -- -- -- -- 52.4% 58.2%Nevada 21.8% -- -- -- -- -- 26.5% 20.9%New Mexico 23.6% -- -- -- -- -- 11.1% 25.9%Utah 34.1% -- -- -- -- -- 20.5% 37.4%Wyoming 52.1% -- -- -- -- -- 56.6% 50.4%
Pacific:Alaska 45.4% -- -- -- -- -- 65.9% 40.2%California 16.9% -- -- -- -- -- 14.7% 17.4%Hawaii 33.0% -- -- -- -- -- 29.9% 34.2%Oregon 25.7% -- -- -- -- -- 27.8% 25.2%Washington 31.0% -- -- -- -- -- 35.4% 29.5%
Source: Agency for Healthcare Research and Quality, Center for Financing, Access and Cost Trends. 2008 Medical Expenditure PanelSurvey-Insurance Component.Note: Definitions and descriptions of the methods used for this survey can be found in the Technical Appendix.-- Data suppressed due to high standard errors or no reported values in cell.

Table II.F.7(2008) Standard error for percent of private-sector employees enrolled in a health insurance plan that had a coinsurancepayment for an office visit to a physician by firm size and state: United States, 2008
Division and State Total Less than 10employees
10-24employees
25-99employees
100-999employees
1000 ormore
employees
Less than 50employees
50 or moreemployees
United States 0.73% 0.77% 1.08% 0.61% 1.10% 1.09% 0.42% 0.87%
New England:Connecticut 1.68% -- -- -- -- -- 2.55% 2.17%Maine 3.06% -- -- -- -- -- 4.73% 4.57%Massachusetts 1.54% -- -- -- -- -- 1.55% 2.04%New Hampshire 1.88% -- -- -- -- -- 2.27% 2.25%Rhode Island 1.24% -- -- -- -- -- 2.55% 2.01%Vermont 4.36% -- -- -- -- -- 2.15% 5.16%
Middle Atlantic:New Jersey 2.08% -- -- -- -- -- 1.93% 2.86%New York 2.10% -- -- -- -- -- 2.62% 2.71%Pennsylvania 2.21% -- -- -- -- -- 1.69% 3.05%
East North Central:Illinois 3.12% -- -- -- -- -- 2.29% 3.86%Indiana 3.41% -- -- -- -- -- 5.39% 4.28%Michigan 2.74% -- -- -- -- -- 2.52% 3.33%Ohio 2.75% -- -- -- -- -- 2.41% 3.50%Wisconsin 3.40% -- -- -- -- -- 2.98% 3.81%
West North Central:Iowa 3.67% -- -- -- -- -- 5.55% 4.24%Kansas 4.30% -- -- -- -- -- 3.87% 4.95%Minnesota 3.13% -- -- -- -- -- 8.82% 3.90%Missouri 3.31% -- -- -- -- -- 5.12% 4.23%Nebraska 4.28% -- -- -- -- -- 4.65% 5.82%North Dakota 4.59% -- -- -- -- -- 4.63% 5.07%South Dakota 2.96% -- -- -- -- -- 5.88% 2.79%
South Atlantic:Delaware 2.99% -- -- -- -- -- 1.52% 3.79%District of Columbia 2.46% -- -- -- -- -- 1.97% 3.00%Florida 2.84% -- -- -- -- -- 3.55% 3.31%Georgia 4.46% -- -- -- -- -- 4.11% 5.21%Maryland 3.23% -- -- -- -- -- 3.45% 3.46%North Carolina 2.87% -- -- -- -- -- 4.89% 3.98%South Carolina 2.47% -- -- -- -- -- 2.91% 2.54%Virginia 3.75% -- -- -- -- -- 1.87% 4.64%West Virginia 4.07% -- -- -- -- -- 3.45% 4.68%
East South Central:Alabama 3.01% -- -- -- -- -- 1.37% 3.76%Kentucky 4.35% -- -- -- -- -- 2.92% 5.00%Mississippi 5.05% -- -- -- -- -- 5.76% 5.63%Tennessee 4.97% -- -- -- -- -- 3.15% 5.87%
West South Central:Arkansas 5.93% -- -- -- -- -- 7.79% 6.43%Louisiana 3.37% -- -- -- -- -- 7.15% 3.40%Oklahoma 4.63% -- -- -- -- -- 5.44% 4.94%Texas 2.93% -- -- -- -- -- 2.66% 3.45%
Mountain:Arizona 2.64% -- -- -- -- -- 4.12% 2.95%Colorado 3.35% -- -- -- -- -- 2.71% 3.69%Idaho 5.13% -- -- -- -- -- 6.66% 5.81%Montana 3.66% -- -- -- -- -- 5.70% 3.70%Nevada 3.33% -- -- -- -- -- 6.15% 3.70%New Mexico 4.51% -- -- -- -- -- 2.80% 5.08%Utah 3.32% -- -- -- -- -- 3.92% 3.40%Wyoming 4.88% -- -- -- -- -- 4.00% 5.73%
Pacific:Alaska 3.04% -- -- -- -- -- 2.90% 4.64%California 1.15% -- -- -- -- -- 1.85% 1.36%Hawaii 3.55% -- -- -- -- -- 5.43% 3.62%Oregon 2.59% -- -- -- -- -- 3.54% 3.89%Washington 3.79% -- -- -- -- -- 4.53% 5.58%
Source: Agency for Healthcare Research and Quality, Center for Financing, Access and Cost Trends. 2008 Medical Expenditure PanelSurvey-Insurance Component.Note: Definitions and descriptions of the methods used for this survey can be found in the Technical Appendix.-- Data suppressed due to high standard errors or no reported values in cell.