Embed Size (px)
Citation preview

DI
SC
US
SI
ON
P
AP
ER
S
ER
IE
S
Forschungsinstitut zur Zukunft der ArbeitInstitute for the Study of Labor
Diversity and Public Goods: A Natural Experiment with Exogenous Residential Allocation
IZA DP No. 6053
October 2011
Yann AlganCamille HémetDavid Laitin
Diversity and Public Goods: A Natural Experiment with
Exogenous Residential Allocation
Yann Algan Sciences Po
and IZA
Camille Hémet Sciences Po
David Laitin Stanford University
and IZA
Discussion Paper No. 6053 October 2011
IZA
P.O. Box 7240 53072 Bonn
Germany
Phone: +49-228-3894-0 Fax: +49-228-3894-180
E-mail: [email protected]
Any opinions expressed here are those of the author(s) and not those of IZA. Research published in this series may include views on policy, but the institute itself takes no institutional policy positions. The Institute for the Study of Labor (IZA) in Bonn is a local and virtual international research center and a place of communication between science, politics and business. IZA is an independent nonprofit organization supported by Deutsche Post Foundation. The center is associated with the University of Bonn and offers a stimulating research environment through its international network, workshops and conferences, data service, project support, research visits and doctoral program. IZA engages in (i) original and internationally competitive research in all fields of labor economics, (ii) development of policy concepts, and (iii) dissemination of research results and concepts to the interested public. IZA Discussion Papers often represent preliminary work and are circulated to encourage discussion. Citation of such a paper should account for its provisional character. A revised version may be available directly from the author.

IZA Discussion Paper No. 6053 October 2011
ABSTRACT
Diversity and Public Goods: A Natural Experiment with Exogenous Residential Allocation* This paper demonstrates the effects of ethnic and religious diversity on the quality of public spaces. Its identification strategy relies on the exogeneity of public housing allocations in France, and thereby eliminates the bias from endogenous sorting. The paper uses micro evidence of social interactions within housing blocks from the representative French Housing survey, which allows for a detailed identification of the channels through which diversity operates. Differentiating among three channels of public goods provision, the paper finds that heterogeneity in the housing block leads to low levels of sanctions for anti-social behavior and low levels of collective action to improve housing conditions, but no losses in public safety. JEL Classification: H10, H41 Keywords: fractionalization, public goods, collective action, discrimination Corresponding author: Yann Algan Sciences Po 28 rue des Saints-Pères 75007 Paris France E-mail: [email protected]
* The authors acknowledge financial support from the France-Stanford Center and the European Starting Grant (ERC) for enabling this cross Atlantic collaboration. We thank Larry Katz, Edward Miguel, Daniel Posner and seminar participants at Stanford, CA, Sciences Po, Paris and CREST (French research center in economics and statistics) for useful comments. We are grateful to Corinne Prost, head of the Employment Division at INSEE (French National Statistical Institute) for permitting access to key data through a convention between INSEE and Sciences Po.

1 Introduction
Recent research has drawn ominous implications of cultural heterogeneity for social peace and
economic growth. In US cities, the more the diversity, the less the social trust (Putnam 2007)
and the lower the quality of public goods (Alesina, Baquir and Easterly 1999; Alesina and La
Ferrara 2000). In Western Kenya, the greater the mixing of tribes, the less everyone is in public
spiritedness, and the poorer the contributions to public goods (Miguel 2004, Miguel and Gugerty
2005). In cross-national surveys, diversity correlates with low growth in GDP and low quality
of institutions (Easterly and Levine 1997, Alesina et al. 2003). Worse, Alesina and Zhuravskaya
(2011) show that islands of homogeneity amid a broadly diverse country do not decrease the negative
e�ects of diversity. These �ndings are depressing normatively for those who herald the gains from
diversity (Page 2007); and depressing empirically, as in our globalized world, local cultural diversity
is increasingly common (Dancygier 2010).
The degree of generality of these �ndings and the channels at work remain however to be
determined. Putnam (2007) is careful to underline that his data allow him only to claim a short run
correlation between diversity and trust. Miguel (2004) �nds no diversity impacts on local outcomes
in Tanzania, a country in which the ruling authorities have sought to ameliorate ethnic cleavages by
promoting a common language. Posner (2004) shows that changed electoral rules can create broader
ethnic identities thereby reducing fragmentation. Finally, Glennerster, Miguel and Rothenberg
(2010) argue that the presence of strong chiefs at the local level, although reinforcing the salience
of ethnicity, translates into e�ective inter-ethnic cooperation. It follows that the implications of
cultural and ethnic diversity on economic outcomes can exhibit some variation according to the
political setting and processes that create more inclusive identities.
Therefore, before we take the negative �ndings on public goods as generalized implications of
cultural diversity for all settings, we must ascertain whether (a) the direction of causality goes from
diversity to the quality of public goods; (b) religious diversity � a bigger threat to social peace in
the minds of many � has the same implications as ethnic diversity; and (c) the negative implications
of diversity can be ameliorated by republican public policies, that is, those that encourage common
citizenship.1
This paper makes contributions on each of these questions by examing how local (block-level)
ethnic and religious diversity is related to the residents' perception of the quality of public spaces.
Our �rst contribution is to deal with the issue of causality from diversity to economic and social
outcomes by exploiting the random allocation of ethnic groups within French public housing blocks.
This allocation policy helps alleviate the general concern in this literature that the endogenous
residential sorting of individuals on ethnic grounds biases the diversity impact. Housing policies
in France over the past half-century allow for a cleaner test of this causal story than heretofore
1Republicanism refers to the policy project of the Opportunist Republicans who came to power in 1877 in theThird Republic, opposing the last vestiges of monarchism, and promoting a secular project (known as laïcité) withthe goal of erasing all ascriptive ties, whether ethnic or religious, as compromising common citizenship. In today'sFrance, republicanism opposes itself to multiculturalism.
2
performed by providing a natural experiment of an exogenous residential allocation of ethnic groups.
Due to a strongly republican ideology built into law, the French government has allocated state
planned moderate cost rental apartments (HLMs � Habitations à Loyer Modéré) to natives and
immigrants without concern for their cultural background, mixing people indiscriminately. Some
HLM neighborhoods are consequently quite diverse, and others quite homogeneous. Furthermore,
HLM inhabitants rarely move, as the rents are much lower than market rates, and movement
between HLMs is quite di�cult to do. Therefore, residents cannot choose whether to live nearby
people like themselves; rather, they accept their placement and do their best whether next to
co-ethnics or strangers. Methodologically, this means that we can take the degree of diversity in
any one HLM as exogenous, and trace the implications of the housing situation to see if greater
heterogeneity leads to poorer provision of public goods and social relationships in French society.2
We con�rm with a variety of tests that the allocation in the public housing market can be
considered to a large extent as exogenous relative to ethnic characteristics. In particular, we show
that the repartition of ethnic minorities across HLMs does not depart signi�cantly from a randomly
simulated distribution, contrary to what is observed in the private housing market. Besides we are
able to get a sense of the bias in the estimated impact of diversity in the presence of endogenous
sorting of individuals by comparing the public and the private housing markets. This paper thus
makes progress on the identi�cation of the causal impact of ethnic diversity on public goods by
providing a natural experiment with exogenous residential allocation to individuals.
Naturally, this paper is not the �rst one to deal with the issue of causality. But previous
attempts to establish causality have mainly relied on instrumental variables, since the seminal con-
tribution of Alesina et al. (1999). However convincing the instruments might be, this strategy
still raises the concern whether the instruments ful�ll the exclusion restriction and do not have a
direct e�ect on public goods. For instance, Miguel (2004) and Miguel and Gugerty (2005) use the
pre-colonial patterns of settlement as instruments, assuming that these variables have no direct
impact on present-day ethnic relations. More recently Glennerster et al. (2010) have also relied on
historical data of fractionalization as an instrument. But since past settlement patterns are likely to
have at least some direct impact on present-day ethnic relations, the identi�cation with intrumental
variables raises a concern on the ability of instruments to ful�ll the exclusion restriction. Using a
natural experiment with exogenous allocation of ethnic groups is thus an alternative strategy to
deal with these worrisome caveats.
The second contribution of this paper is the identi�cation of the exact nature of diversity that
a�ects social relationships and the quality of public goods, and of the channels through which it
operates at the micro level. The French public housing situation allows us to address this issue
by disentangling di�erent channels and various dimensions of diversity, both ethnic and religious,
within the same natural experiment framework and at a micro level of analysis: the unit of analysis
2We are not the �rst to rely on the HLM sector for exogenous placement. Goux and Maurin (2006) test theneighborhood e�ects on education in the French context. Similar strategies to ours are employed by Oreopoulos,(2003) who examines the long-term individual economic outcomes in the Canadian context, and Katz et al. (2001)who use a randomized mobility experiment to analyze the socio-economic e�ects of neighborhood placement.
3

of the surveys is at the block level which allows a much more precise analysis of how diversity shapes
social relationships than the previous literature based on macro analysis at the county, regional or
country levels. Available national statistics provide a unique way to di�erentiate the channels
through which diversity could a�ect public goods and social relationships. The Housing Survey
reports both general information on housing conditions and more speci�c information about the
neglect of and vandalism within the public areas, about the quality of the housing, and about direct
interpersonal con�icts. This enables us to explore more deeply the possible channels through which
diversity a�ects the various outcomes. When residents report that vandalism is rife in their housing
unit, we interpret this as a result of the failure on the part of residents to develop norms that would
punish defectors. When residents report the breakdowns and the poor quality of basic facilities (such
as heating and soundproo�ng), we interpret this as a result of diminished collective action for social
improvement. In this case, the result may well be supported in equilibrium through recognition by
the housing directorate that in ethnically or religiously heterogeneous apartments, it can permit
the decline of facilities, knowing that it will not face collective action from its residents demanding
better services. Finally, when residents report incidents of direct civil con�icts, we can interpret
this as failure by the state to give proper police protection in selected housing establishments.
One might be worried that our analysis draw exclusively on the resident self-reports of the quality
of public spaces rather than on objective outcomes. Since we have a more detailed level of analysis
of public spaces at the housing block level compared to the previous literature, we do not have
access to objective indicators. Without taking a de�nite stand on the pros and cons of self-reported
measures, we claim that this approach is still relevant in our context. First, objective indicators
for say violence tend to underestimate the victimization rate, since con�icts are not systemically
reported to o�cal authorities. Understanding how ethnic diversity a�ects the perception of the
quality and safety of public spaces is important in its own right. Besides, the household survey
reports precise questions on the origins of the quality of public spaces, distinguishing between
voluntary degradations, the lack of improvement of the facilities or direct violence. Finally, we
show that self-reported assessments of the quality of public spaces are likely to capture part of
their true quality since all the neigborhoods living in a given housing block tend to have the same
appreciation, whatever their ethnic origin and individual characteristics.
One of the main results of this paper is that diversity has a much bigger impact on the failure to
develop punishment norms and to organize collective action than on civil con�ict, perhaps because
diversity is associated with social anomie rather than inter-ethnic hatred in French housing units.
In addition to identifying the channels through which diversity operates, this paper investigates
whether religious diversity � a form of diversity that has caused far more worry in Europe than
ethnic � has the same implications as ethnic. One might surmise that the standard unit for eth-
nic diversity � the linguistic group � might have special qualities that make speakers of di�erent
languages less diversity-acceptant. For one, linguistic groups can communicate among themselves
more e�ciently than with outsiders, such that diversity may raise the costs of collective decision
making. Second, linguistic survival of small groups requires territorial concentration, and therefore
4

ethnic diversity may be seen as a threat to the core foundation of any ethno-linguistic group's
solidarity. Religious diversity may yield alternative routes toward public goods failure and social
relationships, but as of now we do not know whether such diversity has implications for the pro-
duction and maintenance of public goods and the quality of social relationships. This paper o�ers
a �rst test as to whether religious diversity (Christian vs. Muslim) has the same implications as
ethnic/linguistic diversity. The French Housing surveys do not report the religious a�liation but
the �rst names of all the members of the households within a given block. We provide tentative
evidence on the role of religious diversity by distinguishing individuals with Christian Saints' �rst
names and Muslim �rst names. We �nd that both dimensions of diversity have a negative e�ect on
the general opinion of residents on their housing quality.
The third contribution of this paper is to take a stand on the previous literature in which
the direction of the e�ect of ethnic diversity varies with the political setting. We test whether
the results coming from western Kenya or from neighborhoods in American cities are robust to a
changed policy environment. In Kenya, for example, tribal memberships are the key to resources
coming from the center; therefore distrust of the ethnic other may not be the result of diversity in
itself but of the ethnic patronage system that pervades Kenyan politics. Findings from the US as
well, where the census and public policy recognize ethnic identi�cations, may highlight diversity in
a way to exacerbate distrust. France, with its resolute republican ideology, may therefore be less
subject to the distrust which comes from diversity. For example, in the 19th arrondissement of
Paris, made famous for its diversity in the �lm Entre les Murs (titled �The Class� in the English-
language version), still 63.5 percent of the residents were born in France. While this is signi�cantly
lower than the �gure for all of Paris (82.4 percent), it demonstrates that homogeneous ghettos do
not exist in Paris the way they do in the US, or Kenya.3 Even in public housing, and this because
the rents are so attractive to native French, we rarely �nd in France public housing structures
that are fully ghettoized. This paper shows that in a Republican setting, the e�ects of ethnic and
religious diversity are signi�cant, raising questions about the e�ciency of the integration process
within this institutional framework, and as to whether the e�ects of diversity are impervious to
institutional design.
The remainder of this paper is organized as follows. Section 2 presents the data. Section 3
provides various tests to assess the random nature of the allocation process of individuals across
public housing units. Section 4 reports the impact of ethnic and religious diversity on public goods
and social relationships in public housing. Section 5 provides additional tests of the validity of our
results. Section 6 concludes.
3Data supplied by the mayor's o�ce at the 19th district. On foreign born in Paris, seehttp://www.migrationinformation.org/dataHub/GCMM/Parisdatasheet.pdf
5

2 Presentation of the data
2.1 Data sets
In this paper, we use two French national surveys: on the one hand, we use the continuous version
of the French Labor Force Survey (Enquête Emploi, INSEE, hereafter the LFS) between 2003
and 2007. This dataset provides all relevant information on labor market success (hourly wage,
employment status) and education. On the other hand, we mostly use the 2002 wave of the
French Housing Survey (Enquête Logement, INSEE, hereafter the HS), which gives information on
perceptions of the quality of the neighborhood (crime, poverty, etc.) and on quality of the public
infrastructure (trash collection, working order of apartment elevators, etc.). Each dataset provides
complementary features for our study that allow us to address fundamental questions of the e�ects
of cultural heterogeneity on the quality of life.4
First, we use the LFS to test our identi�cation strategy. These data are areolar: they are not
drawn directly from a selection of homes, but from a selection of geographical areas (aires) made
up of twenty adjacent homes on average.5 Over the 2003 to 2007 period, more than 10,000 di�erent
areas were sampled. All the households within a randomly selected area were surveyed and, within
each household, all persons aged �fteen or over were interviewed. That way, we can work on real
neighborhoods. Moreover, we know whether the respondent was living in an HLM, if s/he had
been living in her/his current HLM at least for one year or whether s/he had just moved into
the neighborhood. These particular features enable us to compute the level of ethnic or cultural
diversity prevailing within one's HLM neighborhood, to test our identifying assumption and to track
the impact of randomized allocation of households to a given HLM.
We then use the HS to derive our main results, as it contains all the key left-hand side variables
and controls for the study. However this survey su�ers from an important drawback: the samples
are not areolar, meaning that all the individuals living in a given geographical unit are not sys-
tematically surveyed and are randomly drawn instead. This feature implies that we cannot observe
true neighborhoods in our data. It also implies that we have too few observations within each
geographical unit of interest, the îlot .6 It becomes consequently di�cult to compute signi�cant and
relevant measures of diversity in one's neighborhood.
We compensate for this drawback by using the French Population Censuses. Each HS sample is
drawn from the most recent Census and the geographical units of the HS are a subsample of those of
the Census. As the census provides variables such as birth country or nationality at birth, it allows
us to compute representative fractionalization indexes at the block level and then to match them
with the corresponding HS. Here, we compute fractionalization indexes at the block level using the
4Some of the key variables for our study are not public. The French Statistical Institute (INSEE) made theiraccess possible as part of a convention between the INSEE and Sciences Po. We were required to make use of the�sensitive� data within the con�nes of INSEE.
5INSEE has chosen this sampling strategy so as to reduce the traveling expenses of those who administer thesurvey.
6We work at one of the smallest geographical unit, the �îlot�, which is comparable to a block. We will refer to�blocks� instead of �îlots� from now on.
6

1999 Population Census, and match them to the blocks of the 2002 HS.
Both surveys include the �rst names of all the members of the households, along with the
country of origin of the respondent and of the respondents' parents. It is thus possible to use the
�rst name as a proxy for identifying Muslim cultural heritage and overcome the lack of o�cial data
on the religious a�liation of individuals in France. Indeed, as research by Fryer and Levitt (2004)
and Disdier, Head and Mayer (2009) suggests, names given to children are expressions of cultural
identity. This measure is imperfect, though. In some countries, for example, it has been reported
that non-Muslims may give their children Muslim names. Given that French national statistics do
not include questions on religion, and giving a Muslim name to children from a Catholic heritage
in France is surely a rare event, the data on �rst names in the French context is a resource worth
exploiting.7
2.2 Fractionalization indexes
We rely on the ethno-linguistic fractionalization (hereafter ELF) index mostly used in the literature
(e.g. Alesina et al. 2003) to construct our measures of French diversity relying on data from the
1999 Population Census. This traditional measure of ethnic diversity re�ects the probability that
two randomly drawn individuals from the population belong to di�erent groups (previous studies
looked at ethno-linguistic or religious groups). More formally, the basic fractionalization index is
computed as one minus the Her�ndahl index of ethno-linguistic group shares:
ELF j =
i=N∑i=1
sij (1− sij) = 1−i=N∑i=1
s2ij (1)
Where sij is the share of group i (i=1, ..., N) in country (or any other convenient geographic
area) j. If the population under study is fully homogeneous, ELF j equals 0 and it trends to 1 as
the population heterogeneity increases. It is also interesting to note that ELF j can increase for
two reasons: it will increase with the number of ethno-linguistic groups, and it will increase the
more equal the size of the groups.
As mentioned above, the Census data provide information about the country of birth and the
nationality at birth of individuals, allowing us to construct two di�erent measures of diversity. We
focus here on diversity as measured by nationality at birth, computed at the block level.8 The
7There are two main reasons that make this indicator a potential good proxy for the perceived share of Muslimpeople at the block level. First, the transmission of Maghrebian �rst names associated with the Qu'ran is a naturalpractice for religious people. Second, the Maghrebian �rst name captures an additional component of the culturalbackground of the respondent compared to his country of origin or to the nationality at birth. To put it di�erently,an individual with a Maghrebian �rst name would be recorded in the national statistics as French if he/his parentsare born in France or if he is a �rst generation immigrant but got naturalized. Yet his �rst name would sound as adirect indication that he is coming from a di�erent cultural background than the French Christian one. Maghrebian�rst names are a signal of identi�cation with the culture at large and could be as such a wider cultural proxy thanreligious practice. We thus take this indicator as a lower bound for the percentage of Muslims in a neighborhood.
8In the private housing sector, the allocation of individuals is likely to depend on endogenous sorting in whichindividuals make decisions as to where to move based in part on the ethnic composition of the whole neighborhood.Consequently, we compute the ELF for people living in the private sector taking into account all individuals in theneighborhood, including public housing inhabitants, since the choice in the private sector might depend both on
7

distribution of diversity in French blocks is presented in Appendix A (Figure 1 and Table 12).9 Un-
surprisingly, given that immigrants and second generation French are more likely to qualify for HLM
apartments than the rooted French population due to income quali�cations, HLM neighborhoods
are characterized by higher levels of diversity than French neighborhoods as a whole.
2.3 Sample characteristics
Our results rely on the 2002 wave of the HS. Most of the variables we are interested in (those
describing the quality of life within one's building or neighborhood) are given at the household level,
and the dataset contains 32,156 households (corresponding to 78,791 individuals). The data show
that in 2002, 39.6 percent of the French households are renters while 56 percent are owners. In our
sample, 15.77 percent of the households live in an HLM, which represents 39.8 percent of the tenants.
Table 1 describes the main socio-demographic characteristics of our sample, comparing households
living in public and in private housing. Foreigners (or immigrants) represent a larger share in the
HLM population than in the private housing population. And, as expected, HLM neighborhoods
are characterized by a globally poorer socio-economic environment: the unemployment rate in
public housing neighborhoods is on average more than twice as high as in the private housing
neighborhoods, and individuals in HLMs are less educated and hence earn lower incomes. For
instance, almost one third of the HLM adults have no diploma at all, and only 11.7 percent of them
have achieved graduate studies, which is less than half the �gure obtained in the private housing
population.
Even focusing on public housing population, housing conditions faced by native French and
immigrants di�er. On average, French born individuals have a much better opinion about the
quality of their housing than Maghrebians or other Africans.10 Table 2 shows that 13.8 percent of
the French are very satis�ed with their housing conditions, which is true for only 8.42 percent of
the Maghrebians. Conversely, only 9.9 percent of the French report insu�cient housing conditions
versus 18.21 percent of the Maghrebians. However, the last line of Table 2 reveals that the poorer
housing conditions are associated with lower levels of income, which characterizes Maghrebian and
African families. For instance, households that are very happy with their housing conditions earn
on average 13,300 Euros per year, while very unhappy households earn 10,127 Euros a year on
average. From the last column, we observe that the average Maghrebian family earns even less
than that (8,603 Euros).
diversity within the housing unit and also within the block where the housing is located. Results are similar whenwe compute the ELF in private housing on the basis of people living in the private sector only. Meanwhile, in thepublic housing sectors, households are randomly located and hence less subject to this selection issue. We thereforecompute ELF for people living in an HLM on the basis of their neighbors living in the public sector only to maintainthe exogeneity in the diversity indicators.
9On the HLM graph, we see that 6 percent of HLM blocks are perfectly homogeneous. This high frequency is toa large extent explained by the fact that in many blocks, we observe only very few inhabitants, increasing the chanceof getting a null ELF. We keep those blocks in our main analysis, but we will see in the robustness checks sectionthat deleting them does not a�ect the results, and in some speci�cations, strengthens them.
10We observe the same pattern when we look at more objective measures of building quality such as wall qualityand dampness issues.
8

Table 1: Public Housing and Private Housing population characteristics
Public Housing Private Housing p-value
Birth CountryFrance 78.63 88.34 0.000Portugal 1.72 1.23 0.028Spain 1.12 0.78 0.089Italy 0.72 1.10 0.007Other E.U. country 0.71 1.05 0.091Turkey 1.24 0.30 0.000Other European country 0.74 0.75 0.767Maghreb 11.06 4.14 0.000Other African country 2.66 1.06 0.000Cambodia, Vietnam, Laos 0.69 0.41 0.016Other countries 0.72 0.84 0.381NationalityFrench at birth 82.02 92.11 0.000French by acquisition 5.75 3.33 0.000Portuguese 1.24 0.97 0.090Spanish 0.44 0.26 0.004Italian 0.32 0.34 0.865Other E.U. nationality 0.16 0.59 0.002Turkish 1.20 0.20 0.000Other European nationality 0.36 0.29 0.959Maghrebian 6.51 0.99 0.000Other African nationality 1.68 0.38 0.000Cambodian, Vietnamese, Laotian 0.16 0.07 0.004Other nationalities 0.16 0.46 0.016Employment statusEmployed 58.19 56.11 0.090Unemployed 10.82 4.08 0.000Retired 20.07 26.5 0.000Level of education (highest diploma obtained, individuals above 25 years old)No diploma 28.26 14.85 0.000Low education 50.62 48.33 0.009Baccalaureate 9.37 12.44 0.000High education 11.74 24.38 0.000Socioprofessional groupFarmer 0.76 6.17 0.000Craftman, Shopkeeper 2.56 9.06 0.000Executive or other high position 4.87 18.87 0.000Intermediate occupation 15.80 21.42 0.000Employee 31.12 18.10 0.000(Factory) Worker 44.89 26.36 0.000Age (mean) 31.50 39.35 0.000Annual income (mean) 12,846 18,048 0.000
The last column reports the p-value from a t-test for the null hypothesis that the mean of a given variable
is the same for the public housing and private housing populations.
9

Table2:Opiniononhousingconditions,incomeandethnicorigin
inPublicHousing
OpiniononHousingConditions
MeanAnnual
Very
Satisfactory
Average
Insu�cient
Very
Income
satisfactory
insu�cient
(ineuros)
Ethnicorigin
French
born
13.8
44.01
28.54
9.9
3.75
12,758
NaturalizedFrench
10.68
43.51
29.01
13.8
2.99
10,459
Maghrebian
8.42
33.27
34.83
18.21
5.26
8,603
African
7.82
20.77
41.29
25.14
4.99
7,865
Asian
0.00
60.64
11.25
28.11
0.00
12,892
Other
European
10.71
39.58
31.21
13.14
5.35
12,292
MeanAnnualIncome
13,300
12,856
11,842
10,288
10,127
Table3:"Ethnic"characteristics
ofcouplesdecliningHLM
o�ers
Atleast
onerefusal
Atleast
onerefusal
(those
askingforaHLM
placement)
(those
alreadyin
aHLM)
Householdswherethereisacouple
16.61%
25.89%
Householdswherethepartnershavethesameorigin
16.73%
p-value:
25.13%
p-value:
Householdswherethepartnersare
ofdi�erentorigin
16.01%
0.95
30.26%
0.39
Householdswhereboth
partnersare
French
born
17.46%
p-value:
25.31%
p-value:
Householdswhereboth
partnersare
Maghrebiborn
14.91%
0.65
22.42%
0.40
Thereported
p-values
are
from
t-testsforthenullhypothesisthattheaveragerejectionrate
isthesameforhouseholdswherethepartnershave
thesameorigin
andhouseholdswherethepartnersare
ofdi�erentorigin,andalternatively,
forhouseholdswhereboth
partnerswereFrench
at
birth
andhouseholdswhereboth
partnerswereMaghrebianatbirth.
10
3 The exogeneity of diversity within public housings
The main di�culty in estimating the impact of ethnic diversity on the quality of public goods
is that fractionalization presents a high risk of endogeneity, leading to biased results from naïve
regressions. Indeed, individuals generally tend to self segregate: they prefer links with others like
themselves, with whom they share common interests, in particular people of the same ethnicity or
the same social background. This phenomenon implies that if people can choose the area where
they live, they would rather move into neighborhoods where people are similar to themselves.
Thus, if individuals who are not constrained with respect to the location of their home choose
to gather along ethnic lines, then the richest individuals will be able to move into the most ho-
mogeneous neighborhoods (as their choice will be relatively unconstrained). Therefore, the level of
diversity of the neighborhoods is probably endogenous to wealth, and any estimates on the implica-
tions of diversity for wealth (or factors correlated with wealth) will be biased. To be more speci�c,
if the only wealthy families that live in diverse settings are those who have a taste for diversity, the
true e�ect of diversity on social outcomes should be smaller in absolute terms (less negative). In or-
der to address this downward bias issue, one must study individuals who are assigned their place of
residence without consideration of their cultural, social or economic status � that is, exogenously.11
We begin with the assumption that assignment within HLM's in France is largely random in regard
to ethnicity and religion, and that the costs of moving are so high that residential mobility within
the HLM sector is limited. Naturally, there is an endogenous sorting among the population who
are eligible for an HLM assignment since the rents are considerably lower in public housing than in
private housing. But among the population eligible for public housing, households are expected to
be exogenously allocated across the di�erent housing blocks.
This random allocation has been mainly documented in sociology and law so far. The research
conducted by Bernardot (2008) on immigrant housing in France lends support to this assumption
of exogeneity. His work emphasizes the importance in urban planning for housing policy in France,
associated with the theories of Le Corbusier. Le Corbusier insisted that France must avoid the
homogeneous ghettos of urban landscapes elsewhere, and should therefore allocate housing in a
random manner, not permitting family networks to grow within housing establishments. These
ideas were translated into state regulations. Supporting this assumption, Simon's (2003) research
shows that residential mobility within the HLM sector is a practical impossibility. Similarly, the
lawyers Rouquette and Lipietz (1991) show that the rules of allocation of lodging, prohibiting �lo-
calism�, and the high administrative barriers that e�ectively prohibit exchanges of lodgings except
for the changing spatial needs of families, make the allocation of housing largely random with
respect to the ethnic origins of the applicants. In the economics literature, Goux and Maurin
(2006) show that the educational achievement of the children of newcomers in a public housing
project is uncorrelated with that of the current residents. Individuals cannot self-select in public
11Combes, Decreuse, Schmutz and Trannoy (2010 working paper) use customer discrimination theory to show thatowners will tend to discriminate against ethnic minorities when renting their apartment, bringing new evidence ofwhy any causal claim of ethnic diversity on public goods in the private housing market would be biased.
11

housings according to the educational achievement of the neighbors' children. In contrast, the au-
thors �nd a strong self-selection on those educational characteristics in the private housing sector.12
3.1 Identi�cation of the exogeneity of diversity in public housing
We �rst present the basic arguments in favor of the exogeneity assumption. In France, the popula-
tion eligible for public housing is very large: the only requirements are to be legally living in France
(as a French citizen or migrant with a valid residence permit) and to be living under a certain
threshold of income per unit of consumption, which is usually rather high. For instance, in 2009,
this threshold was between 36,748 and 50,999 Euros per year for a four-person family, depending
on the region of residence; the upper �gure is nearly 3,000 Euros higher than the average disposable
income of four-person households in 2007. In addition, rents are considerably lower in public hous-
ing than in private housing, so that the turnover is very low. Consequently, the number of eligible
families is about three times as large as the available space in HLMs, and the waiting periods are
rather long: the 2002 HS reports that over one third of the population asking for a public housing
unit had been waiting for more than one year. As a result, we expect that households usually apply
for housing to several HLM administrators13 in order to increase their chances of assignment to a
unit and rarely decline an HLM o�er when it comes. People therefore have very little control over
the neighborhood they inhabit, giving some initial support to our assumption that the distribution
of households within public housing is close to what would be obtained through a randomized ex-
periment.
Formal tests lend further con�dence that HLM assignment is ethnically random. Our �rst test
consists in addressing the disturbing (for our assumption) fact that 16 to 24 percent14 of households
declined at least one HLM o�er.15 This suggests selection bias. However, if this refusal rate is the
same among ethnically diverse and ethnically homogeneous households, the selection story would
be less worrisome. The idea behind our test is the following: if households decline HLM o�ers be-
cause they have strong preferences for ethnic homogeneity (and therefore decline o�ers because the
neighborhood is too fractionalized), then we would expect that ethnically mixed households (sup-
posedly the more tolerant of ethnic mixing) refuse HLM proposals less systematically than other
households. On the contrary, if the rejection rate is similar for mixed and homogeneous couples,
then the refusal must be motivated by other criteria (size of the house, distance from work, or some
12For an alternative view, see SOS-racisme (2009). This report suggests administrative limits to diversity, but doesnot dispute randomness up to those limits.
1343.6% of households looking for a HLM placement have addressed their demand to the Town Hall, 62.3% of themhave directly contacted a HLM o�ce.
1416% corresponds to the share of households living in the private section but willing to move into an HLM whodeclined an o�er when it came, while 24% corresponds to households already living in an HLM but asking for adi�erent one.
15An additional concern was that 47.9 % of households having turned down an o�er declared that one of the majorreasons for this decision was they found the local environment unpleasant, which could be interpreted as a distastefor diversity, creating endogeneity. The other possible answers were: inconvenient place, rent too expensive, lowquality building, and apartment not corresponding to household needs.
12

other factor not correlated with ethnicity).
The frequencies displayed in the �rst three lines of Table 3 (obtained from the HS data) are
favorable to the idea that homogeneous households do not turn down HLM o�ers more often than
those with a mixed couple. In fact, when we regress �refusal�, the estimated coe�cient on the
�same-origin� dummy is non-signi�cant. Performing a test of equality of means between the rejec-
tion rates of the two groups leads to acceptance of the null hypothesis (equality of rejection rates
between mixed and homogeneous households). In addition, we performed the same tests comparing
homogeneous native French couples and homogeneous Maghrebian couples. Indeed, it could be the
case that households from a minority group prefer to live in a more heterogeneous area (even if the
couple is homogeneous) so as to increase their chance to have neighbors from the same minority
group. Here again, the t-test is in favor of no statistical di�erence between the two groups' refusal
rates. The corresponding frequencies are reported in the last two lines of Table 3 for illustrative
purposes. To sum up, this �rst test shows that the high refusal rates of HLM o�ers is not driven
by distaste for diversity.16
An alternative test of the validity of our identifying assumption focuses on individuals who
moved into an area within the previous year, using the LFS data. We now pay attention to the
correlation between their hourly wages and the level of diversity of the area into which they just
moved. Without prior beliefs over agents' preferences, if individuals have a taste for or against
homogeneity when their choice is not constrained by legal rules, there should be a signi�cant
relationship between the level of ethnic diversity prevailing in their neighborhood and their wages.
Indeed, in the private housing market, the richer the individual, the more able he is to choose
his neighborhood. So if the level of diversity of the area enters his preferences, there should be
a correlation between his revenues and the area's fragmentation. Within public housing as well,
because they are more recent or have a better location, some neighborhoods are more expensive
than others. Therefore, even on the public housing market, some families are more constrained
than others, and one can wonder whether the richest HLM inhabitants have some control over the
diversity of their neighborhood. In a �rst step, we focus on individuals having just moved in a non
HLM home. We compute the fractionalization index of the area in which they move (taking into
account only the individuals having lived there for more than one year), and look at the correlation
between this index and the hourly wage of newly arrived individuals.17 In the private housing
market, there is a very strong negative relationship between income and diversity (the estimated
coe�cient is -0.14 and is signi�cant at the 1% level18).
In a second step, we restrict the sample to individuals having moved into an HLM within the
past year. We use the fractionalization index within the HLM neighborhood, testing again the
16Instead, we could think that an �unpleasant local environment� refers to such things as being too close to a largeroad, or lacking in green spaces.
17The coe�cients correspond to the OLS estimates of diversity among former inhabitants on log hourly earnings,controlling for the department of residence.
18The results are not displayed but are available upon request.
13

assumption that the administrative organs allocate the housing randomly with respect to ethnicity.
The simple OLS regression reveals that there is no signi�cant correlation between the income
of individuals moving into public housing and the diversity of nationalities existing within the
neighborhood. This additional test is thus favorable to the assumption that ethnic diversity within
HLM neighborhoods is exogenous.19
Table 4: Correlation between new inhabitants' birth country and share of the area population bornin the same country
Public Housing Private Housing(1) (2)
New inhabitant born in FranceShare of block population born in France 0.221 0.600***
(0.222) (0.164)New inhabitant born in MaghrebShare of block population born in Maghreb 0.254 0.227***
(0.163) (0.0866)New inhabitant born in Africa (except for Maghreb)Share of block population born in Africa 0.363 0.269*
(0.266) (0.148)New inhabitant born in a Mediterranean countryShare of block population born in a Mediterranean country 0.0571 0.283***
(0.104) (0.0846)New inhabitant born in Eastern EuropeShare of block population born in Eastern Europe 1.011** 0.0957
(0.486) (0.0614)New inhabitant born in a German-speaking countryShare of block population born in a German-speaking country -0.0208 0.129
(0.0372) (0.150)New inhabitant born in AsiaShare of block population born in Asia 0.112 0.262
(0.136) (0.191)Each of the coe�cients is estimated from a separate regression of individual's birth country on the share
of each ethnic group in the block into which he has just settled. The reported coe�cients are estimates for
the share of the individual's own ethnic group. The coe�cient for other ethnic groups shares are available
from authors upon request. Additional controls are department �xed e�ects, wage, and level of education.
Regressions include 10,365 observations in the private housing sector and 895 observations in the public
housing sector. Robust standard errors adjusted for block clustering are in parentheses. *** p<0.01, **
p<0.05, * p<0.1
The third test is also based on LFS data and assesses whether there is a link between the birth
country of individuals moving into a new area and the share of the area's �long term� population
born in the same country. We expect a signi�cant relationship between the two in the private
housing market, where location choice is relatively unconstrained, but not in the public housing
sector. We control for the socio-economic characteristics of individuals (their wage and education
19If we reverse the dependent and the explanatory variables, the signi�cance levels of the correlation coe�cientsremain the same.
14

levels) and include department �xed e�ects. In the private housing sector (Column (2), Table 4),
a signi�cant relationship between one's origin and the share of similar neighbors show up for most
of the regions of origins. In contrast, in the public housing sector (Column (1), Table 4), there is
no statistically signi�cant relationship between the birth country of the individual and the share of
the �long term� population in the area. Self segregation in the public sector seems to be a much
less important concern for our identi�cation strategy than in the private sector.
3.2 Alternative Test of random allocation in public housing: Monte
Carlo simulation
We end this section with a more direct statistical test of randomness which consists in simulating
a random distribution of the HLM population and to compare it to the actual distribution. We
perform this test using the 2003 to 2007 Labor Force Surveys in which the smallest geographic area
observed consists in an exhaustive neighborhood. This particular structure enables us to perform
a comprehensive test of population distribution across neighborhoods.
Our identi�cation strategy is based on random allocation of individuals across the di�erent public
housing within each given department. Since most of the public housing are administrated at the
department level, we test whether for each department, the allocation of housing across the various
HLM neighborhoods is blind to the ethnic origin of the tenant. To do this, we run Monte-Carlo
simulations allocating randomly the HLM population of each department to the available HLM
neighborhoods in the department. In that way, we are able to compute, for each neighborhood, the
various ethnic group shares that we would observe if the allocation was perfectly random across the
blocks within a given city, and to compare them to the shares actually observed in our data. In
what follows, we explain more speci�cally how we proceed.
The basic idea is to pool the HLM population from every neighborhood in a department, and
to reallocate it randomly to the HLMs across all neighborhoods, taking into account the demo-
graphic structure of each neighborhood. In other words, our simulation randomly assigns the HLM
population across the HLM neighborhoods of a department, respecting the actual size of each neigh-
borhood. Consider for instance, an (hypothetical) department with two HLM neighborhoods, one
with ten inhabitants, the other with �ve. In each neighborhood, we are able to compute the actual
share of native French and of Maghrebis. The simulation then randomly chooses one neighborhood
to �ll, and randomly allocates the corresponding number of individuals to this neighborhood. In
this very simple example, �ve out of the �fteen individuals are randomly selected to form the simu-
lated �ve-inhabitants neighborhood, the remaining ten then forming the simulated ten-inhabitants
neighborhood. We �nally compare the real and the simulated distributions of the shares of natives
French and of Maghrebi across the various neighborhoods.
In our data, we make sure to run this test based on neighborhoods in which we observe at least
�ve households. In order to avoid composition e�ects due to existing families, we also restrict our
15

sample to household heads. We �nally restrict our sample to the neighborhoods where we observe
at least �ve percent of Maghrebis to focus on areas where there is at least some diversity. After
simulating the distribution of ethnic group shares as explained above, we compare the actual and
the simulated distributions of native French and Maghrebi shares across neighborhoods: we �rst run
a simple t-test of equality of means, then we use a more demanding test of equality of distributions,
the Kolmogorov-Smirnov test. The corresponding results are displayed in Table 5. The �gures
displayed represent the percentage of departments for which the actual and simulated distributions
of ethnic shares across neighborhoods are similar, i.e. those for which we cannot reject the null
hypothesis at the 10% level. The labels in the �rst column indicate the ethnic group for which we
compare the shares distributions across neighborhoods. The second column shows that there is no
department for which we can reject the null hypothesis that the real and simulated distributions
of the ethnic group shares have equal means. The Kolmogorov-Smirnov test results are displayed
in the third column. According to this test, the actual and simulated distribution of native French
shares across HLM neighborhoods are similar in 98.61 percent of the departments. When we focus
on Maghrebi shares, we �nd that the two distributions are alike in 98.61 percent of departments as
well. All in all, those tests are in line with the idea that the distribution of the households eligible
for an HLM placement within the public housing blocks is close to random regarding ethnicity, and
thus supports our identi�cation assumption.20
In addition, we performe the same test on education. Goux et Maurin (2006) have shown
that the allocation across HLM within a given department is exogeneous along this dimension,
by showing the absence of correlation between the level of education of the existing residents and
that of the new comers. The last line of Table 5 con�rm this result. We focus on the allocation
of households heads across HLM in each department depending on their educational achievement
(lower or higher than primary school). The distribution of the population across HLM along this
characteristic is close to a random allocation.
Table 5: % of departments for which the actual and simulated distributions of Native French andMaghrebi shares across neighborhoods are similar in public housing.
t-tests K.S-testNative French 100% 97.61%Maghrebi 100% 98.90%
Both ethnic groups 100% 97.22%Primary Education 100% 98.18%
20Algan et al. (2011) provides an alternative test of the exogenous allocation of households in the public housingsector. They regress households' ethnic characteristics on �xed e�ects associated with the di�erent public housingswithin each department. The random allocation test consists in performing standard F-test on the null hypothesisthat the �xed e�ects are jointly not statistically di�erent from zero. In the case of endogenous residential sortingin some public housings, the �xed e�ects associated with those blocks should be statistically signi�cantly correlatedwith the household characteristics, and the F-test would be rejected. They �nd that in more than 85 percent of thedepartments the F-test reject the null-hypothesis of a correlation between ethnic characteristics of the householdsand public housing �xed e�ects.
16

4 Results
This section estimates the causal impact of diversity on public goods, by focusing on the public
housing sector where households are exogenously allocated. The regressions presented in this section
control for a large set of individual characteristics, including age, gender, average years of education,
whether the respondent is inactive, employed or unemployed, household size, and respondent's
income level in 2002 Euros. We also control for French citizenship (a dummy variable equal to 1 if
French citizenship and 0 otherwise) and the respondent's country (or region) of birth, distinguishing
between France, European countries, the Maghreb, Sub-Saharan Africa, Asia and all others. We
also include the number of apartments in the building, since the size and the number of occupants
might a�ect the ability of the households to coordinate for improving the commons or to enforce
norms.
An important issue in our regressions is whether the extent of fractionalization is picking up
various dimensions of the environment where people are living, including the extent of inequality
and the unemployment rate (Alesina and La Ferrara, 2002) or the socio-economic background of the
neighborhood (Goux and Maurin, 2006). From the INSEE and Nicole Tabard (2002) we therefore
include a very detailed classi�cation in 27 categories of the socio-economic environment of each area.
These classi�cations provide a weighted indicator of the occupations, the sectors, the education and
the income of each neighborhood. From the Census we also include the average unemployment rate
of the block. All the results are based on OLS estimates, with robust standard errors clustered at
the block level.
4.1 The e�ect of fractionalization on housing conditions
Let us �rst examine the impact of diversity on the general satisfaction about housing conditions.
As shown in the previous section, the degree of diversity in public housing can be considered as
exogenous, and allows us to measure the causal e�ect of diversity. Let j indicate blocks and k
indicate households. For each outcome, we estimate the following equation:
Yjk = αk + βkELFj + γkXk + δkZj + εjk (2)
where Yjk denotes the housing outcome we are interested in as stated by household k in block j,
ELFj is the level of ethnic diversity in the block, Xk is a vector of household characteristics (de-
scribed above) and Zj a vector of socio-economic characteristics of the block. In all the regressions,
we also control for department �xed e�ects, since our identi�cation strategy is based on random
allocation of individuals across the di�erent public housing within each given department.
The main variable of interest in this section is the overall opinion about housing conditions.
From the HS, we use the question: �In general how do you judge the quality of your housing
conditions?� The variable takes on values from 1, for very good, to 5 for very bad.
17

Table 6: Ethnic Diversity, Religious Diversity and Public Goods (public housing)
Ethnic Diversity Religious Diversity(1) (2) (3) (4)
General Opinion on Housing Conditions0.897*** 0.551*** 0.330*** 0.175*(0.091) (0.130) (0.080) (0.090)
Observations 4,379 4,379 5,104 4,379
R-squared 0.082 0.137 0.063 0.134
Index for Neglect of Public Areas1.697*** 1.734*** 0.715*** 0.485**(0.326) (0.412) (0.238) (0.229)
Observations 1,693 1,693 1693 1693
R-squared 0.073 0.187 0.056 0.178
Index for Poor Quality of Housing2.085*** 1.137*** 0.755*** 0.226(0.192) (0.260) (0.168) (0.160)
Observations 3,797 3,797 3,797 3,797
R-squared 0.090 0.168 0.059 0.163
Index for Civil Con�icts0.347*** 0.062 0.134 0.0001(0.131) (0.179) (0.129) (0.130)
Observations 4,388 4,379 4,379 4,379
R-squared 0.017 0.060 0.015 0.060
Socio-economicBackground of area No Yes*** No Yes***Department �xed e�ects No Yes*** No Yes***
Each coe�cient is estimated from a separate regression, according to equation 2. The four dependent
variables considered include the answer to the general opinion question and the three indices that were
derived from principal component analysis as described in section 4.2. Each index is regressed on either
ethnic diversity or religious diversity, controlling for the usual household and neighborhood characteristics
unless otherwise indicated. Robust standard errors adjusted for block clustering are in parentheses. ***
p<0.01, ** p<0.05, * p<0.1
The �rst panel of Table 6 looks at the role of ethnic diversity on opinion about housing conditions
and reports the estimates for the public housing sector with exogenous allocation of individuals.
In the �rst speci�cation (column 1), we only control for individual characteristics and the size
of the building. Column 2 reports the estimates obtained when including controls for the unem-
ployment rate and the socio-economic background of the neighborhood at the block level, as well
as department �xed e�ects. Table 13 in Appendix B reports the full set of estimates for these
regressions.
In both speci�cations, the variable ethnic diversity is statistically signi�cant at the 1 percent
level. According to the most comprehensive speci�cation (Column 2), an increase by one standard
18

deviation in ethnic diversity is associated with an increase by 9.77 percent in the probability of
having a bad opinion of the housing conditions.
The last two columns of Table 6 look at the role of religious diversity on the opinion about
housing conditions. Column 3 reports the estimates in the private sector controlling for individual
characteristics. Column 4 reports the same estimates when controlling for covariates at the block
or department levels. The indicator for religious diversity, as previously justi�ed, is the percentage
of households, within the block, that have at least one individual with a Maghrebian �rst name.
Here we see that our indicator for religious diversity is positively and statistically signi�cantly
correlated with the probability that the respondent has a low opinion about the housing conditions.
With religious diversity, here with the most comprehensive speci�cation (Column 4), an increase
by one standard deviation in religious diversity is associated with an increase by 4 percent in the
probability of having a bad opinion of the housing conditions.
4.2 Decomposing the e�ect of fractionalization: Neglect of Public Areas,
Housing Quality and Civil Con�icts
4.2.1 Identi�cation of the channels
This section looks further at the various dimensions of housing conditions that could be a�ected
by fractionalization. We run an exploratory analysis to extract the main dimensions with which
the various questions reported in the HS correlate the most. We identify those factors by running
a principal component analysis on the whole set of questions related to the quality of public goods
and to social relationships. The full list of questions is reported in Appendix E. The principal
component analysis lets the correlation patterns among the various questions emerge endogenously
from the data, rather than grouping them in an arbitrary way. We select (following the Kaiser
criterion) three main factors with eigenvalues higher than one that emerged from the principal
component analysis of the relevant survey questions.
Table 7 reports those three factors and the rotated matrix of correlations between those factors
and each question. Three main patterns of correlation emerge, to which we refer as �neglect of the
public areas�, �quality of housing� and �civil con�ict�.
Giving names to each of the three factors identi�ed, Table 8 reports descriptive statistics of the
various questions. For each variable, a lower value represents a better outcome (e.g. higher care of
the commons, less gra�ti, better soundproo�ng...).
19

Table 7: Principal component analysis
Factor 1 Factor 2 Factor 3Care of the commons 0.142 0.225 0.053Voluntary degradations of the commons 0.675 0.172 0.091Gra�ti on the walls 0.209 -0.126 0.023Trash in the commons 0.247 0.047 0.085Broken doors in the commons 0.591 0.166 0.123Broken lights in the commons 0.564 0.072 0.031Degradation of mail boxes 0.528 0.130 0.034Broken elevators 0.528 -0.031 -0.041Quality of the building's facade -0.038 0.239 -0.030Problem with heating in the building -0.007 0.336 0.029Quality of soundproo�ng 0.042 0.703 0.004Noise disturbance during the day in the housing 0.060 0.831 0.052Noise disturbance at night in the housing 0.113 0.807 0.105Victim or witness of aggression in the neighborhood 0.098 0.136 0.746Victim or witness of robbery in the neighborhood -0.006 0.028 0.810
Table 8: Descriptive statistics for each outcome (public housing)
Mean (std dev) Values1. Neglect of the Public AreasCare of the commons 1.592 (0.752) 1 to 3Sacking 1.637 (0.777) 1 to 3Gra�ti 0.666 (0.471) 0 - 1Garbage on the �oor 0.487 (0.499) 0 - 1Broken glass 0.353 (0.478) 0 - 1Broken doors 0.330 (0.470) 0 - 1Broken light bulbs 0.243 (0.429) 0 - 1Broken mailboxes 0.399 (0.489) 0 - 1Broken elevators 0.220 (0.414) 0 - 1
2. Quality of HousingCondition of the outside walls 2.432 (0.962) 1 to 5Quality of soundproo�ng 1.980 (0.822) 1 to 3Noisy in daytime 1.594 (0.747) 1 to 3Noisy in nigh time 1.374 (0.626) 1 to 3Cold in the apartment 0.202 (0.401) 0 - 1
3. Civil Con�ictRobberies 0.094 (0.292) 0 - 1Aggressions 0.081 (0.273) 0 - 1
According to the questions, we have between 1,937 and 5,189 observations for public housing households and
between 1543 and 26,967 for private housing households.
20

4.2.2 Estimation of the channels
We run a principal component analysis on each group of questions, and take the �rst principal
components of each, ending up with three indices. We create three summary indices from the three
groups of questions identi�ed in the previous section. The higher the indices, the more unfavorable
are the outcomes. Because the magnitudes of the separate outcomes are often easier to interpret
than those of the principal component analysis, we also report the estimates for each question taken
separately in Appendix D (Table 18). We checked the robustness of the results by looking at al-
ternative summary indices, taking the sum of the questions belonging to each group, or performing
a mean e�ect analysis for each group. The estimates for these alternative indices are reported in
Appendix C, yielding similar results.
We now return to Table 6 which summarizes the results for the three indices21. For each index,
we run separate regressions on ethnic diversity and on religious diversity controlling for the usual
household and neighborhood characteristics unless otherwise indicated, according to equation 2.
The second panel of Table 6 reports the e�ect of ethnic and religious diversity on the synthetic
index Neglect of Public Areas. We report the result in the public housing environment, without
(columns 1 and 3) and then with controls at the local level (columns 2 and 4). The e�ect of ethnic
diversity is always statistically signi�cant at the 1 percent level, and is substantively sizeable. In the
full-speci�cation (column 2), a one standard deviation increase in ethnic diversity is associated with
a rise by 31.1 percentage point of the index Neglect of Public Areas, which represents 17.3 percent
of the total standard deviation of this index. The e�ect of ethnic diversity represents two-thirds of
the e�ect of local unemployment, and is much more signi�cant than any individual characteristic.
Education, though the most statistically signi�cant individual variable, is so at the 5 percent level;
and a one standard deviation increase in education is associated with a rise by 12.7 percentage
points of the Neglect index.
The last two columns of Table 6 report the estimates for the religious diversity index. In the
most general speci�cation (column 4), religious diversity is found to be statistically signi�cant at
the 5 percent level. The e�ect of religious diversity is substantively less important than ethnic
diversity. A one standard deviation increase in religious diversity is associated with a rise by 12
percentage points in the Neglect of Public Areas index, which accounts for 6 percent of the standard
deviation of this index.
The third set of regressions reports the e�ect of fractionalization on the index of Poor Housing
Quality. Columns 1 and 2 show that ethnic diversity is statistically signi�cant at the 1 percent level
for all speci�cations. A one standard deviation increase in ethnic diversity is associated with a rise
by 20.3 percentage points in the index of Housing Quality. It is also worthwhile to stress that ethnic
diversity has a smaller impact on outcomes related to the quality of housing than on the previous
index of the Neglect of Public Areas. In the case with covariates at the local level (column 2), the
21The coe�cient estimates for the control variables are not reported here but are very similar to those reported inTable 13 in Appendix B. The full regression results are available upon request.
21

e�ect of ethnic diversity on Housing Quality represents two-thirds of the e�ect of diversity on the
neglect of public areas. Column 3 shows that religious diversity has a statistically signi�cant e�ect
on the quality of housing when we control for individual characteristics only. But the relationship
loses statistical power when we control for local covariates, in particular for the unemployment rate
at the local level.
The last panel of Table 6 reports the results for our synthetic index of Civil Con�ict, capturing
direct aggression and robberies. Remarkably, it shows that ethnic diversity has a statistically
signi�cant e�ect on civil con�icts in the public housing sector only when we control for individual
characteristics (column 1). But the relationship is no longer signi�cant as soon as we control for
the unemployment rate and/or the socio-economic background of the neighborhood. This �nding is
on line with Fearon and Laitin (1996), who argue that despite inter-ethnic relations being generally
more tense, in-group policing mechanisms typically keep violence o� of the equilibrium path. The
last column con�rms this �nding for religious diversity.
The broad picture drawn in the three previous sets of regressions is largely con�rmed by the
regressions of each separate normalized outcome (as shown in Appendix D, Table 18). Although
diversity has no signi�cant impact on a few outcomes, such as broken glass or broken doors in the
commons, we still have a very strong negative e�ect of diversity on all other negligence or housing
quality outcomes in the public sector.
In sum, fractionalization operates di�erently on the three various dimensions of the housing
environment identi�ed above. We distinguish three main channels. The e�ect of ELF on Neglect of
Public Areas is probably related to the failure in heterogeneous settings to develop norms that would
assign responsibility for the punishment of unruly residents guilty of vandalism. This behavior by
residents would be a natural consequence of the lack of social contacts, or, the lack of closure
in the network, as argued by Coleman (1988).22 The e�ect of ELF on Poor Housing Quality is
more related to the failure to generate collective action for social improvement. This could well be
sustained (though we have no direct evidence to support this) by beliefs in the housing directorate
that in heterogeneous apartments it needs not maintain public goods to high standards because
the likelihood of collective action against it is minimal. In this sense, the resulting poor housing
quality associated with ethnic and religious diversity can be seen as an equilibrium in which the
lack of expectations of collective action would fail to incentivize the directorate to make costly
improvements. The e�ect of the ELF on aggression seems more related to either in-group policing
mechanisms that cross-cut ethnic and religious groups or to the power of the state police in deterring
civil violence in public areas. The valued-added of our experiment is to provide a unique framework
to test the speci�c role of ELF on these various outcomes in the same context. The basic results
are that ELF has a key impact on the norms that punish defectors, and to a lesser extent on free
riders, but with no e�ect on civil con�ict.23 From this, we deduce that on average, higher levels of
22Supporting our intuition, many households living in the public housing sector report having �no relationship atall� with their neighbors.
23This �nding is consistent with the additional question on the quality of the relationship with the neighborhood
22

diversity trigger worse outcomes on public good provision and civic behavior relative to things, but
not to persons.
5 Additional tests
5.1 Measuring the bias with endogenous residential sorting
As shown in section 3, the residential allocation in public housing can be considered as exogenous
relative to ethnic backgrounds. In contrast, the extent of diversity in private housing is partly the
result of an endogenous choice from movers. By comparing the e�ect of diversity in the private
housing sector with the e�ect of diversity in the public one, we can get a sense of the bias associated
with the traditional naïve OLS estimator found in the literature. We expect the results to be
biased downward. Indeed, for this speci�c population, location choice is likely to be at least partly
determined by diversity in the neighborhood.
We regress the di�erent outcomes (general opinion on housing conditions as well as the three
indices identi�ed in section 4.2) on ethnic and religious diversity as in our favorite speci�cation,
but focusing this time on the population living in the private housing sector. When focusing only
on the private housing population, to keep things comparable with the evidence from the public
sector, we exclude owners from the sample, and focus on households living in apartment dwellings.
Table 9 reports the naïve estimators when we focus on the private sector with endogenous al-
location of individuals. Column 1 shows the results for ethnic diversity, controlling for individual
and neighborhood characteristics. Estimates for religious diversity are reported in column 2. The
�rst set of regressions indicates that a one standard deviation increase in ethnic diversity is asso-
ciated with an increase by 8.3 percent in the probability of having a bad opinion of the housing
conditions. This is slightly lower than what is found in the corresponding regression on the public
housing population (9.7 percent). Similarly, the naïve estimator with endogenous sorting is not
statistically signi�cant for religious diversity (column 2). These �rst �ndings suggest that the naïve
estimator tends to downplay the true impact of fractionalization on the overall opinion about hous-
ing conditions.
The estimates reported in the second and third panels are even more striking: column 1 shows
that an increase by one standard deviation in ethnic diversity is associated with a rise by 18.9
percentage point of the index Neglect of Public Areas (which represents 15.8 percent of the total
standard deviation of this index in the private housing area). This is almost twice as low as what
was obtained in the public housing population (31.1 percentage points).24 Similarly, a one standard
deviation increase in ethnic diversity is associated with a rise by 11.3 percentage point of the index
provided by the housing survey. We typically �nd that ELF is positively and signi�cantly correlated with the factof having no interpersonal relationships at all with their neighbors, but it displays no correlation with reports byrespondents as to whether they have good or bad relationships. ELF seems thus to be associated with social anomierather than social con�icts. However, this correlation holds only when we control for individual characteristics.
24When we run the regression on the full private housing sample (including owners and people living in individualhouses), we �nd an e�ect three times lower than in the public housing.
23

for Poor Housing Quality. Here again, the naïve e�ect is twice as small as the e�ect measured in
a setting where diversity is more exogenous. These results reveal the importance of overcoming
endogenous sorting when seeking to identify the e�ects of heterogeneity on public goods. The
relation between religious diversity and the indices for Neglect of Public Areas and Poor Quality of
Housing is no longer statistically signi�cant in the presence of endogenous allocation in the private
sector (column 2), leading to the same conclusion.
Table 9: Ethnic Diversity, Religious Diversity and Public Goods (private housing)
Ethnic Diversity Religious Diversity(1) (2)
General Opinion on Housing Conditions0.591*** 0.138(0.180) (0.122)
Observations 4141 4141
R-squared 0.165 0.162
Index for Neglect of Public Areas1.334** 0.498(0.567) (0.461)
Observations 727 727
R-squared 0.321 0.316
Index for Poor Quality of Housing0.796** -0.023(0.351) (0.255)
Observations 3023 3023
R-squared 0.116 0.114
Index for Civil Con�ict0.643*** 0.038(0.234) (0.174)
Observations 4141 4141
R-squared 0.064 0.062
Socio-economicBackground of area Yes*** Yes***Department �xed e�ects Yes*** Yes***
Each coe�cient is estimated from a separate regression, according to equation 2. To keep things comparable
with the public sector, we exclude owners from the sample, and focus on households living in apartment
dwellings. The three dependent variables considered are the three indices from the principal component
analysis. Each index is regressed on either ethnic diversity or religious diversity, controlling for the usual
household and neighborhood characteristics unless otherwise indicated. Robust standard errors adjusted
for block clustering are in parentheses. *** p<0.01, ** p<0.05, * p<0.1
The last panel of Table 9 reports estimates for our Civil Con�icts index. Contrary to what we
found above for the other indices, the estimate for ethnic diversity in the private sector is signi�cant
24
at the 1 percent level, while it was not signi�cant in the public housing. Column 1 shows that a
one standard deviation increase in ethnic diversity is linked to a rise by 9.1 percentage point of the
index of Civil Con�icts. We have no explanation for this anomalous result, and it merits analysis
in future work on heterogeneity.25
5.2 Fractionalization and ethnic shares
The basic regressions measure ethnic diversity using a standard ELF index, controlling for individual
and local characteristics. Yet, as suggested by Vigdor (2002), it is crucial to control for ethnic group
shares to get a more comprehensive set of covariates for diversity. Column 1 of Table 10 reports
the results controlling for ethnic group shares.26 It turns out that the estimated impact of ELF is
now even stronger than in the previous speci�cations, con�rming the robustness of our result along
this dimension.
Moreover, we run regressions replacing the fractionalization index by ethnic groups shares (col-
umn 2 of Table 10), and by ethnic group shares and their square (column 3 of Table 10),27 controlling
for the usual individual and local characteristics. Only one group (Maghrebian) seems to have a
signi�cantly negative e�ect on opinions on housing conditions: the higher the share of Magrhebis
in an block (relative to the share of French), the more likely individuals are to complain about their
housing conditions. However, this negative e�ect decreases with the share of Maghrebis. From this
result, we infer that our measure of diversity re�ects not only the actual ethnic composition of the
neighborhood, but also that some ethnic groups might have di�erent e�ects on their self-reported
perceptions of the quality of public spaces when they become a majority of the neighborhood pop-
ulation. However, this result does not call into question the e�ect of diversity per se on which we
have already reported (column 1 of Table 10).
5.3 Relevance of self-reported quality of public goods
A �nal concern is related to the subjective nature of the variables used in our database. Perhaps
people are just happier when they are surrounded by people more like themselves, and this is
re�ected in their answer to the quality of housing. We provide here several tests challenging this
alternative explanation. First, we run our main regression including interaction terms between
diversity and the various ethnic groups, to see whether di�erent groups react in di�erent ways to
the level of diversity of their neighborhood. Column 2 of Table 11 shows that there does not seem
to be a di�erent e�ect for the various groups. The coe�cient for diversity remains unchanged (see
column 1 for the baseline speci�cation).
25We have several conjectures on why heterogeneity does not correlate with increasing interpersonal violence, butas readers will see, this is a question requiring future research.
26In the results displayed in Table 10, we aggregated the various nationalities at birth into six di�erent categoriesfor ease of reading. The results were not a�ected when we included the shares for all nationalities used to computeour index instead.
27Share of native French is the omitted category
25

Then we concentrate on actual di�erences between "pure French" households'28 and fully Maghre-
bian households' opinion on housing conditions. In particular, we interact the dummies of being
in a fully native French household or being in a fully Maghrebi household with the ELF: none of
the coe�cients is signi�cant (see Table 11, column 3). This suggests that for any given level of
diversity, there is no signi�cant di�erence in the answer given by pure French and fully Maghrebian
households. In other words, the idea that bad opinions of housing conditions are driven by average
bad feeling due to being surrounded by foreigners can be rejected. Moreover, including those addi-
tional controls only slightly a�ects the magnitude of the ethnic diversity coe�cient, and does not
a�ect its direction or its signi�cance.
Thus, our results are robust to important variations in econometric speci�cation, they hold for
subjective as well as more objective outcomes, and the results for the subjective outcomes re�ect far
more than the fact that people do not like living around foreigners. We also showed that while some
ethnic groups can act as bad apples when they become a majority in a neighborhood, including
this factor does not erase the pure diversity e�ect.
6 Conclusion
This paper exploits French public housing policy as a natural experiment to identify the causal e�ect
and the channels through which diversity a�ects the quality of public goods. We use the exogenous
allocation of households within public housing with respect to ethnic and religious characteristics in
France to overcome the bias from endogenous residential sorting that plagues the previous empirical
literature on fractionalization. The French housing experiment provides in addition a unique micro
level of analysis within housing blocks, allowing a detailed analysis of the channels through which
diversity operates. We �nd that fractionalization has a negative impact on the norms that punish
defectors, leading to higher levels of vandalism in the housing commons. Fractionalization also
undermines collective action for the improvement of the quality of housing. But in our context,
fractionalization has no e�ect on civil con�icts, diversity being associated with social anomie within
the housing blocks rather than violent confrontations among neighbors.
This natural experiment calls for future research on the speci�c role of national institutions in
mitigating or magnifying the e�ect of ethnic and religious diversity on the provision of public goods.
France is a country with a republican tradition that resolutely refuses to reify ethnic identi�cation
as a strategy to prevent the ethni�cation of everyday life. Yet we �nd a signi�cant negative e�ect
of diversity on public goods in this institutional setting, as the association found in the US where
multiculturalist institutions regulate ethnic relations (Putnam 2007) and in cases where public
institutions are weak (Alesina and La Ferrara 2005). This results raises a puzzle on the the general
power of institutional arguments seeking to account for variation in the provision of public goods
28Both children and parents were born French in France
26
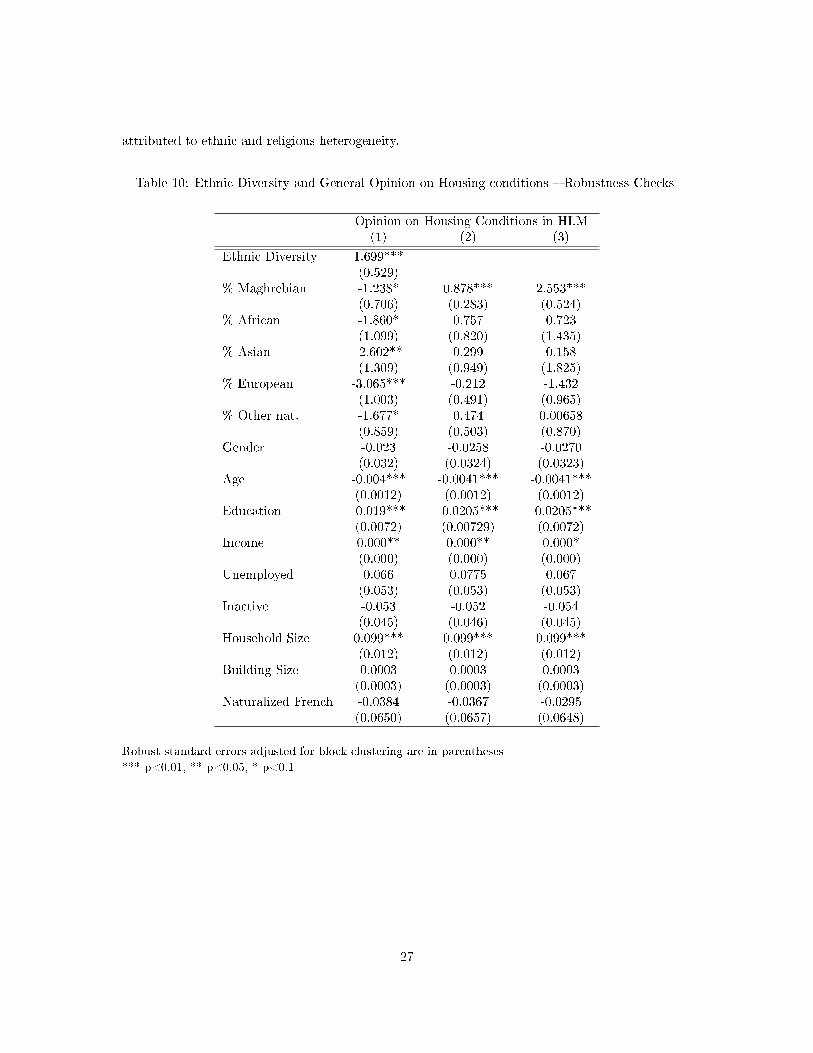
attributed to ethnic and religious heterogeneity.
Table 10: Ethnic Diversity and General Opinion on Housing conditions � Robustness Checks
Opinion on Housing Conditions in HLM(1) (2) (3)
Ethnic Diversity 1.699***(0.529)
% Maghrebian -1.238* 0.878*** 2.553***(0.706) (0.283) (0.524)
% African -1.860* 0.757 0.723(1.099) (0.820) (1.435)
% Asian -2.602** 0.299 0.158(1.309) (0.949) (1.825)
% European -3.065*** -0.212 -1.432(1.003) (0.491) (0.965)
% Other nat. -1.677* 0.474 0.00658(0.859) (0.503) (0.870)
Gender -0.023 -0.0258 -0.0270(0.032) (0.0324) (0.0323)
Age -0.004*** -0.0041*** -0.0041***(0.0012) (0.0012) (0.0012)
Education -0.019*** -0.0205*** -0.0205***(0.0072) (0.00729) (0.0072)
Income 0.000** 0.000** 0.000*(0.000) (0.000) (0.000)
Unemployed 0.066 0.0775 0.067(0.053) (0.053) (0.053)
Inactive -0.053 -0.052 -0.054(0.045) (0.046) (0.045)
Household Size 0.099*** 0.099*** 0.099***(0.012) (0.012) (0.012)
Building Size 0.0003 0.0003 0.0003(0.0003) (0.0003) (0.0003)
Naturalized French -0.0384 -0.0367 -0.0295(0.0650) (0.0657) (0.0648)
Robust standard errors adjusted for block clustering are in parentheses
*** p<0.01, ** p<0.05, * p<0.1
27

Table 10: Continued
Opinion on Housing Conditions(1) (2) (3)
European 0.0670 0.0664 0.0696(0.0902) (0.0912) (0.0905)
Maghrebian -0.101 -0.101 -0.101(0.0685) (0.0686) (0.0684)
African 0.120 0.129 0.126(0.142) (0.142) (0.142)
Asian -0.605* -0.592* -0.592*(0.309) (0.312) (0.309)
Other Nationality 0.638 0.625 0.627(0.632) (0.633) (0.636)
Unemployment rate 1.117*** 1.175*** 1.121***(0.177) (0.176) (0.176)
(% Maghrebi) ² -4.589***(1.219)
(% African) ² -2.167(7.833)
(% Asian) ² -2.450(13.97)
(% European) ² 6.526(4.472)
(% Other Nat) ² 0.940(2.916)
Socio-economicbackground of areas Yes*** Yes*** Yes***Department�xed e�ects Yes*** Yes*** Yes***Constant 2.124*** 2.167*** 2.156***
(0.164) (0.166) (0.167)
Observations 4,379 4,379 4,379R-squared 0.140 0.137 0.141
Robust standard errors adjusted for block clustering are in parentheses
*** p<0.01, ** p<0.05, * p<0.1
28

Table 11: Are results driven by some major ethnic groups disliking being around foreigners ?
Opinion on Housing Conditions(1) (2) (3)
Ethnic Diversity 0.551*** 0.553*** 0.529***(0.130) (0.141) (0.155)
Male -0.0216 -0.0211 -0.0223(0.0328) (0.0329) (0.0329)
Age -0.00410*** -0.00410*** -0.00398***(0.00127) (0.00127) (0.00129)
Education -0.0196*** -0.0196*** -0.0189***(0.00727) (0.00727) (0.00722)
(ln)-Income -0.0554* -0.0571* -0.0504(0.0317) (0.0317) (0.0317)
Unemployed 0.0625 0.0632 0.0605(0.0550) (0.0550) (0.0550)
Inactive -0.0598 -0.0599 -0.0622(0.0474) (0.0476) (0.0473)
Household size 0.0991*** 0.0990*** 0.0892***(0.0125) (0.0126) (0.0150)
Building size 0.000351 0.000357 0.000333(0.000338) (0.000339) (0.000344)
French nationality -0.0433 -0.0338(0.0653) (0.141)
ELF * French nationality -0.0301(0.367)
European origin 0.0506 0.0539(0.0905) (0.203)
ELF * European origin -0.0120(0.548)
Maghrebian origin -0.102 -0.0701(0.0679) (0.188)
Robust standard errors adjusted for block clustering are in parentheses
*** p<0.01, ** p<0.05, * p<0.1
29

Table 11: Continued
Opinion on Housing Conditions(1) (2) (3)
ELF * Maghrebian origin -0.0739(0.404)
African origin 0.121 -0.146(0.142) (0.330)
ELF * African origin 0.682(0.763)
Asian origin -0.617** -0.0993(0.308) (0.804)
ELF * Asian origin -1.235(1.318)
Other origin 0.623 0.933(0.634) (1.197)
ELF * Other origin -1.527(4.544)
Unemployment rate 1.178*** 1.174*** 1.170***(0.177) (0.177) (0.177)
"Pure French" household -0.0251(0.0571)
ELF * "Pure French" household -0.0299(0.170)
Maghrebian household 0.179(0.259)
ELF * Maghrebian household -0.406(0.561)
Department FE Yes*** Yes*** Yes***Socio-Eco Background Yes*** Yes*** Yes***Constant 3.719*** 3.734*** 3.737***
(0.359) (0.361) (0.351)Observations 4,379 4,379 4,379R-squared 0.137 0.138 0.136
Robust standard errors adjusted for block clustering are in parentheses
*** p<0.01, ** p<0.05, * p<0.1
30

Appendix
A. Fractionalization index in French blocks
Table 12: Fractionalization by nationality at birth in French blocks
1999 Census 2002 Housing SurveyWhole France Private Housing HLM Population Whole France HLM Population
Mean 16.65 14.29 27.68 16.11 25.32Median 11.82 10.29 25.18 11.9 23.47Std Dev 15.33 13.36 18.75 14.2 17.94Minimum 0 0 0 0 0Maximum 91.83 91.83 91.3 84.93 80.25N 6,643,287 5,027,235 1,616,052 28,757 4,465
Figure 1: Fractionalization by nationality at birth within French private and public housing blocks,1999 Census
31

B. Full regression results
Table 13: Relationship between Ethnic Diversity and Opinion on Housing conditions
General opinion on Bad Housing ConditionsPublic Housing
(1) (2)
Ethnic Diversity 0.897*** 0.551***(0.0917) (0.130)
Male -0.00897 -0.0216(0.0330) (0.0328)
Age -0.00536*** -0.00410***(0.00125) (0.00127)
Education -0.0274*** -0.0196***(0.00690) (0.00727)
(ln)-Income -0.117*** -0.0554*(0.0315) (0.0317)
Unemployed 0.102* 0.0625(0.0548) (0.0550)
Inactive -0.0146 -0.0598(0.0473) (0.0474)
Household size 0.0921*** 0.0991***(0.0125) (0.0125)
Building size 0.000390 0.000351(0.000347) (0.000338)
French Naturalization -0.0906 -0.0433(0.0654) (0.0653)
European origin 0.0383 0.0506(0.0925) (0.0905)
Maghrebian origin -0.119* -0.102(0.0676) (0.0679)
African origin 0.117 0.121(0.138) (0.142)
Asian origin -0.612** -0.617**(0.272) (0.308)
Other origin 0.561 0.623(0.614) (0.634)
Unemployment rate 1.178***(0.177)
Socio-economicBackgrounds of the area No Yes***DepartmentFixed e�ects No Yes***Constant 3.502*** 3.719***
(0.291) (0.359)
Observations 4379 4379R-squared 0.082 0.137
Robust standard errors adjusted for block clustering are in parentheses
*** p<0.01, ** p<0.05, * p<0.1
32

C. Alternative summary indices - Mean e�ect analysis
As a robustness check, we have also experimented with alternative indices for measuring these threedimensions of housing conditions. We have �rst looked at basic indices de�ned as the sum of theoutcome variables related to each dimension. For each of the three dimensions considered, we thusobtain a variable which increases with the number of adverse outcomes one faces. Table 14 reportsthe results of the regression of these three indices on ethnic and religious diversity for our favoritespeci�cation. Our results are robust to these alternative indices: the e�ect of ethnic diversity isstill strongly signi�cant for the index of Housing Quality, and is even stronger for the index forNeglect of Public Areas. As noticed previously, the reverse is true for civil con�icts. Now turningto religious diversity, column 2 shows that it only has a signi�cant impact on the total amount ofNeglect of the Public Areas, as observed in subsection 4.2.2.
Table 14: Diversity and Public goods: sum of the various outcomes, Public Housing
Ethnic Diversity Religious diversity(1) (2)
1. Neglect of the Public AreasSum of the outcome variables 2.321*** 0.780**
(0.575) (0.322)2. Quality of HousingSum of the outcome variables 1.511*** 0.189
(0.360) (0.217)3. Civil Con�ictSum of the outcome variables 0.029 0.008
(0.059) (0.043)Socio-economicBackground of area Yes*** Yes***Department �xed e�ects Yes*** Yes***
Each coe�cient is estimated from a separate regression, according to equation 2. The three dependent
variables considered are the three indices reported in bold. Each index is regressed on either ethnic diversity
or religious diversity, controlling for the usual household and neighborhood characteristics unless otherwise
indicated. Robust standard errors adjusted for block clustering are in parentheses. *** p<0.01, ** p<0.05,
* p<0.1
To be more thorough, we next perform a mean e�ect analysis. Following Kling, Liebman andKatz (2007), we construct summary indices aggregating information across the various relatedoutcomes for each of the three dimensions studied above. To build the three summary indices, we�rst normalize each outcome using a pseudo-control group de�ned by individuals living in blockscharacterized by a below-median fractionalization index, as in Glennerster, Miguel and Rothenberg(2010). Let Yk be the kth of K related outcomes. Each standardized outcome Y ∗
k is obtainedby subtracting the mean µk and dividing by the standard deviation σk of the outcome variableamong the low diversity pseudo-control group: Y ∗
k = (Yk − µk)/σk. We then average the relatedstandardized outcomes to form the summary index : Y ∗ =
∑k Y
∗k /K.
Accordingly, our summary index for neglect of the commons averages nine standardized measuresof gra�ti, broken mailboxes, broken elevator, low care of the commons, voluntary degradations,garbage on the �oor, ...; the index for poor housing conditions averages �ve standardized measuresof quality of apartment's soundproo�ng, of e�ciency of the heating system, and of the general state
33

of the outside walls; �nally the civil con�ict indicator averages standardized measures of robberyand personal aggression.
Table 15: Components of Summary Indices, Public Housing
Low ELF High ELF- low ELF
Raw Norm Raw Norm(1) (2) (3) (4)
1. Neglect of the Public AreasCare of the commons 1.49 0 0.14 0.19Sacking 1.45 0 0.25 0.36Gra�ti 0.63 0 0.03 0.07Garbage on the �oor 0.42 0 0.08 0.16Broken glass 0.31 0 0.06 0.13Broken doors 0.32 0 0.01 0.01Broken light bulbs 0.18 0 0.07 0.18Broken mailboxes 0.33 0 0.09 0.19Broken elevators 0.14 0 0.1 0.28
2. Quality of HousingCondition of the outside walls 2.42 0 0.01 0.01Quality of soundproo�ng 1.83 0 0.23 0.28Noisy in daytime 1.48 0 0.16 0.22Noisy in night time 1.27 0 0.15 0.27Cold in the apartment 0.14 0 0.08 0.23
3. Civil Con�ictRobberies 0.08 0 0.01 0.05Aggressions 0.06 0 0.02 0.08
Table 15 presents the raw and normalized components of the three broad summary indices. The�rst column displays the mean of each outcome among the low-diversity group. The normalizedoutcomes for this pseudo-control group are displayed in column 2, with mean equal to zero byconstruction. Column 3 reports the di�erence between the mean of each outcome among thehouseholds living in high diversity neighborhoods (a treated group of sorts) and that among the lowdiversity population. The di�erences are all positive but one indicating that the average outcome isgenerally worse in more heterogeneous areas. Column 4 shows the di�erence between the normalizedoutcomes for treatment and control group, and allows for a more comprehensive reading. Forinstance, we know from column 3 that the raw di�erence between care of the commons in lowand high diversity areas is of 0.14. Column 4 now tells us that this di�erence is of 0.19 standarddeviations, relative to the control group standard deviation.
34

Table 16: Diversity and Public goods: mean e�ect estimates, Public Housing
Ethnic Diversity Religious diversity(1) (2)
1. Neglect of the Public AreasMean e�ect estimate 0.545*** 0.180**
(0.130) (0.073)2. Quality of HousingMean e�ect estimate 0.467*** 0.076
(0.107) (0.065)3. Civil Con�ictMean e�ect estimate 0.050 0.011
(0.112) (0.081)Socio-economicBackground of area Yes*** Yes***Department �xed e�ects Yes*** Yes***
Each coe�cient is estimated from a separate regression, according to equation 2. The three dependent
variables considered are the three summary indices indices reported in bold. Each index is regressed on either
ethnic diversity or religious diversity, controlling for the usual household and neighborhood characteristics
unless otherwise indicated. Robust standard errors adjusted for block clustering are in parentheses. ***
p<0.01, ** p<0.05, * p<0.1
Table 16 reports mean e�ect estimates from regressing the summary indices for negligence, qual-ity of housing and civil con�icts on ethnic diversity and other variables, as in speci�cation 2. Thecoe�cient on ethnic diversity is the mean e�ect size. As expected, for the negligence index andthe quality of housing index, mean e�ect estimates of ethnic diversity are strongly positive (column1). Using summary indices also allows us to compare the mean e�ect of diversity on those twonormalized outcomes: lines 1 and 2 of Table 16 tell us that ethnic diversity has a more adverseimpact on the neglect of common areas than on the average quality of housing. This gives us aninsight concerning the mechanisms at play: high levels of ethnic diversity are more likely to generateuncivic behaviors that could be avoided with stronger social norms. By contrast, the mean e�ectestimate in the third line indicates that ethnic diversity plays no role on civil con�icts: in areaswhere diversity is exogenous, there is no signi�cant impact of ethnic diversity.
The broad picture drawn in the three previous sets of regressions is largely con�rmed by theregressions of each separate normalized outcome. The corresponding mean e�ect estimates of ethnicdiversity are presented in table 17. Although diversity has no signi�cant impact on a few outcomes,such as broken glass or broken light bulbs in the commons, we still have a very strong negativee�ect of diversity on every other negligence or housing quality outcome in the public sector. Asnoted earlier, the mean e�ects estimates for negligence outcomes are on average larger than thosefor housing quality. The e�ect measured on broken light bulbs is the strongest, with a more thanone standard deviation di�erence between low and high diversity neighborhoods, while the lowest isobtained for the quality of sound proo�ng, with a di�erence of about one third in terms of standarddeviations. Turning to civil con�icts, the mean e�ect estimates on robberies and direct aggressionsare both insigni�cant in the public housing sector in our favorite speci�cation.
35

Table 17: Ethnic diversity and disaggregated housing outcomes : mean e�ects analysis, PublicHousing
Ethnic diversity(1) (2)
1. Neglect of the Public AreasCare of the commons 0.752*** 0.549***
(0.124) (0.164)Sacking 1.271*** 1.019***
(0.140) (0.183)Gra�ti 0.387** 0.488**
(0.151) (0.216)Garbage on the �oor 0.668*** 0.625***
(0.162) (0.227)Broken glass 0.475*** 0.368
(0.182) (0.238)Broken doors 0.228 0.110
(0.176) (0.241)Broken light bulbs 0.878*** 1.049***
(0.187) (0.248)Broken mailboxes 0.652*** 0.927***
(0.176) (0.239)Broken elevators 0.694*** 0.656**
(0.227) (0.288)2. Quality of HousingCondition of the outside walls 0.629*** 0.414***
(0.109) (0.151)Quality of soundproo�ng 0.963*** 0.393***
(0.099) (0.138)Noisy in daytime 0.935*** 0.613***
(0.110) (0.148)Noisy in night time 1.096*** 0.676***
(0.121) (0.159)Cold in the apartment 0.634*** 0.418**
(0.128) (0.184)3. Civil Con�ictRobberies 0.207** 0.149
(0.103) (0.140)Aggressions 0.231** -0.0489
(0.104) (0.149)Socio eco. backgroundand department. �xed e�ects No Yes
Each entry is the coe�cient estimate on ethnic diversity from a separate regression.
All the regressions include controls for household characteristics.
Robust standard errors adjusted for block clustering are in parentheses. The components of the three summary
indices are the variables listed below each of them. Descriptive statistics for these outcomes are in Table 8.
*** p<0.01, ** p<0.05, * p<0.1
36

D. Regression results on separate outcomes
Table 18: Diversity and Public goods: separate outcomes (public housing)
Ethnic Diversity Religious diversity(1) (2)
1. Neglect of the public areasCare of the common areas 0.397*** 0.144*
(0.118) (0.073)Sacking 0.710*** 0.106
(0.128) (0.076)Gra�ti 0.234** 0.069
(0.104) (0.056)Garbage on the �oor 0.309*** 0.051
(0.112) (0.062)Broken glass 0.169 0.048
(0.109) (0.062)Broken doors 0.052 0.016
(0.113) (0.060)Broken light bulbs 0.411*** 0.024
(0.097) (0.055)Broken mailboxes 0.436*** 0.141**
(0.112) (0.057)Broken elevators 0.228** 0.185***
(0.100) (0.053)2. Quality of HousingCondition of the outside walls 0.393*** -0.075
(0.143) (0.086)Quality of soundproo�ng 0.321*** 0.078
(0.112) (0.068)Noisy in daytime 0.431*** 0.128*
(0.104) (0.066)Noisy in night time 0.373*** 0.136**
(0.088) (0.056)Cold in the apartment 0.148** 0.030
(0.065) (0.034)3. Civil Con�ictRobberies 0.041 0.029
(0.038) (0.026)Aggressions -0.012 -0.020
(0.037) (0.024)Socio-economicBackground of area Yes*** Yes***Department �xed e�ects Yes*** Yes***
Each coe�cient is estimated from a separate regression, according to equation 2. The three dependent
variables considered are the three indices reported in bold. Each index is regressed on either ethnic diversity
or religious diversity, controlling for the usual household and neighborhood characteristics unless otherwise
indicated. Robust standard errors adjusted for block clustering are in parentheses. *** p<0.01, ** p<0.05,
* p<0.1
37

E. Description of the list of questions
This section reports the list of questions, from the Housing Survey, used to construct the three
indices �Neglect of Public Areas�, �Poor Quality of Housing� and �Civil Con�icts�.
Neglect of Public Areas
- In general, how would you qualify the care people take of the commons of your housing?
1=Good, 2=Average, 3=Bad
- To what extent have you faced negligence or voluntary degradations in the commons of your housing
during the last two months?
1=Never, 2=Minor degradations, 3=Major or very frequent degradations
- Have you been witness to gra�ti and degradations on the walls during the last two months?
- Have you been witness to trash and litter in the commons during the last two months?
- Have you been witness to broken windows during the last two months?
- Have you been witness to broken elevators during the last two months?
- Have you been witness to broken doors during the last two months?
- Have you been witness to broken light bulbs during the last two months?
- Have you been witness to degradations of mail boxes?
0=No, 1=Yes
Poor Quality of Housing
- How does the facade of your building look?
1=As new, 2=Good, 3=Average, dirty, 4=Bad, with cracks, 5=Very bad: building threatens to
collapse
- Have you ever had a problem with the heating in your building during the last two months?
0=No, 1=Yes
- What is the condition of the soundproo�ng of your housing?
1=Good, 2=Average, 3=Bad
- How frequently are you disturbed by the noise in your housing during the day?
- How frequently are you disturbed by the noise in your housing during the night?
1=Infrequently or never, 2=Rather frequently, 3=Very frequently
Civil Con�icts
- Have you, or a member of your household, been a victim or a witness to physical aggression in
your neighborhood during the last twelve months?
- Have you, or a member of your household, been a victim or a witness to a robbery in your
neighborhood during the last twelve months?
0=No, 1=Yes
38

References
[1] Alesina A., R. Baqir, W. Easterly, 1999: "Public Goods and Ethnic Divisions," Quar-terly Journal of Economics, Vol. 114(4), pp. 1243-1284
[2] Alesina A., A. Devleeschauwer, W. Easterly, S. Kurlat, R. Wacziarg, 2003: �Fraction-alization�, Journal of Economic Growth, Vol. 8, 155-194
[3] Alesina, A. and E. La Ferrera, 2000: "Participation in Heterogeneous Communities",Quarterly Journal of Economics, Vol. 115(3), pp. 847-904
[4] Alesina, A. and E. La Ferrera, 2002: "Who trusts others?," Journal of Public Eco-nomics, Vol. 85(2): 207-234.
[5] Alesina, A. and E. La Ferrara, 2005: "Ethnic Diversity and Economic Performance",Journal of Economic Literature, Vol 43(3): 762-800
[6] Alesina, A. and E. Zhuravskaya, 2011: �Segregation and the Quality of Governmentin a Cross Section of Countries�, American Economic Review, forthcoming
[7] Algan, Y., Mayer, T. and Thoenig, M., 2011: �The Economic Incentives of CulturalTransmission: Spatial evidence from Naming Patterns Across France�, Sciences PoWorking Paper
[8] Bernardot, M., 2008 : �Loger les immigrés�, Bellecombe-en-Bauges, Rhône-Alpes: Edi-tions du Croquant
[9] Coleman, J., 1988: �Social Capital in the Creation of Human Capital�, The AmericanJournal of Sociology, Vol. 94, supplement �Organizations and Institutions: Sociologicaland Economic Approaches to the Analysis of Social Structure�, pp. S95-S120
[10] Combes, P.P., B. Decreuse, B. Schmutz, A. Trannoy, 2010: �The Neighbor is King:Customer Discrimination in the Housing Market�, working paper
[11] Dancygier, R., 2010 : �Immigration and Con�ict in Europe�, Cambridge UniversityPress
[12] Disdier, A. C., K. Head, T. Mayer, 2009: �Exposure to foreign media and changes incultural traits: evidence from naming patterns in France�, revised version of CEPRdiscussion paper No 5674
[13] Easterly, W., R. Levine, 1997: �Africa's growth tragedy: policies and ethnic divisions�,Quarterly Journal of Economics, Vol. 112(4), pp. 1203-1250
[14] Fearon, J. D. and D. Laitin, 1996: �Explaining interethnic cooperation�, AmericanPolitical Science Review, Vol. 90(4), pp. 715-735
[15] Fryer, R. G., S. D. Levitt, 2004: �The Causes and Consequences of Distinctively BlackNames�, Quarterly Journal of Economics, Vol. 119(3), pp. 767-805
[16] Glennerster R., E. Miguel, A. Rothenberg, 2010: �Working Together: Collective Actionin Diverse Sierra Leone Communities�, Working Paper
[17] Goux, D., E. Maurin, 2006: �Close neighbours matter: neighbourhood e�ects on earlyperformance at school�, CEPR Discussion Paper No 5682
39

[18] Katz, L. F., J. R. Kling, and J. B. Liebman, 2001: �Moving to Opportunity inBoston: Early Results of a Randomized Mobility Experiment,� Quarterly Journalof Economics, CXVI 607� 654
[19] Kling, J. R., J. B. Liebman and L. F. Katz, 2007: �Experimental Analysis of Neigh-borhood E�ects�, Econometrica, Vol. 75, No. 1, pp. 83-119
[20] Miguel, E., 2004: "Tribe or nation?: Nation building and public goods in Kenya versusTanzania" World Politics, Vol 56(3), pp. 327-362
[21] Miguel, E. and M. K. Gugerty, 2005: "Ethnic Diversity, Social Sanctions, and PublicGoods in Kenya", Journal of Public Economics, Vol 89 (11), pp. 2325-2368
[22] Oreopoulos, P., 2003: �The long run consequences in working in a poor neighborhood�,Quarterly Journal of Economics, Vol. 118(4), pp. 1533-1575
[23] Page, S.E., 2007: �The Di�erence: How the Power of Diversity Creates Better Groups,�rms, Schools, and Societies�, Princeton University Press
[24] Posner, D., 2004: �The Political Salience of Cultural Di�erence: Why Chewas andTumbukas are Allies in Zambia and Adversaries in Malawi�, American Political ScienceReview, Vol. 98(4), pp. 529-545
[25] Putnam, R. , 2007: �E Pluribus Unum: Diversity and Community in the twenty-�rstCentury�, Scandinavian Political Studies, Vol 30(2), pp. 137-74.
[26] Rouquette, R., H. Lipietz, 1991: �Droit du Logement Social�, Editions du Moniteur
[27] Simon, P., 2003: �Le logement social en France et la gestion des `populations à risques'�, Hommes et Migrations, No. 1246, pp. 76-91.
[28] SOS-Racisme, 2009: �Le Fichage Ethno-Racial = Un Outil De Discrimination�, rap-port de Samuel Thomas, président de la Fédération Nationale des Maisons des Poteset Vice Président de SOS Racisme réalisé dans le cadre de la � convention relative au�chage territorial ou ethnique pouvant conduire à des pratiques discriminatoires derecrutement dans les entreprises � du 13 novembre 2008.
[29] Tabard, N. 2002 : �Inégalités et disparités entre les quartiers en 1999�, in GéraldineMartin-Houssart, Données sociales, La société française.
[30] Vigdor, J. (2002) : �Interpreting ethnic fragmentation e�ects�, Economic Letters n°75,271-276
40