Embed Size (px)
Citation preview

This is a repository copy of Diversity and carbon storage across the tropical forest biome.
White Rose Research Online URL for this paper:http://eprints.whiterose.ac.uk/114616/
Version: Published Version
Article:
Sullivan, Martin J P, Talbot, Joey, Lewis, Simon L. et al. (112 more authors) (2017) Diversity and carbon storage across the tropical forest biome. Scientific Reports. 39102. pp. 1-12. ISSN 2045-2322
https://doi.org/10.1038/srep39102
[email protected]://eprints.whiterose.ac.uk/
Reuse
This article is distributed under the terms of the Creative Commons Attribution (CC BY) licence. This licence allows you to distribute, remix, tweak, and build upon the work, even commercially, as long as you credit the authors for the original work. More information and the full terms of the licence here: https://creativecommons.org/licenses/
Takedown
If you consider content in White Rose Research Online to be in breach of UK law, please notify us by emailing [email protected] including the URL of the record and the reason for the withdrawal request.

1SCIENTIFIC REPORTS 】 ぴ┺ばぶのねは 】 DOI┺ のね┻のねばふ【srepばぶのねは
www┻nature┻com【scientificreports
Diversity and carbon storage across the tropical forest biomeMartin J. P. Sullivanの,*, Joey Talbotの,*, Simon L. Lewisの,は,*, Oliver L. Phillipsの,*, Lan Qieの, Serge K. Begneの,ば, Jerôme Chaveぱ, Aida Cuni-Sanchezは, Wannes Hubauの, Gabriela Lopez-Gonzalezの, Lera Milesひ, Abel Monteagudo-Mendozaび,ぴ, Bonaventure Sonkéば, Terry Sunderlandふ,ぶ, Hans ter Steegeのね,のの, Lee J. T. Whiteのは,のば,のぱ┸ Koボ Aプum┽Baプoeのひ, Shin-ichiro Aibaのび, Everton Cristo de. Almeidaのぴ, Edmar Almeida de Oliveiraのふ, Patricia Alvarez-Loayzaのぶ, Esteban Álvarez Dávilaはね, Ana Andradeはの, Luiz E. O. C. Aragãoはは, Peter Ashtonはば, Gerardo A. Aymard C.はぱ, Timothy R. Bakerの, Michael Balingaはひ, Lindsay F. Baninはび, Christopher Baralotoはぴ, Jean-Francois Bastinはふ,はぶ, Nicholas Berryばね, Jan Bogaertばの, Damien Bonalばは, Frans Bongersばば, Roel Brienenの, José Luís C. Camargoばぱ, Carlos Cerónばひ, Victor Chama Moscosoぴ, Eric Chezeauxばび, Connie J. Clarkばぴ, Álvaro Cogollo Pachecoばふ, James A. Comiskeyばぶ,ぱび, Fernando Cornejo Valverdeぱね, Eurídice N. Honorio Coronadoぱの, Greta Dargieの, Stuart J. Daviesぱは, Charles De Canniereぱば, Marie Noel Djuikouo K.ぱぱ, Jean-Louis Doucetぱひ, Terry L. Erwinぱび, Javier Silva Espejoぴ, Corneille E. N. Ewangoぱぴ,ぱふ, Sophie Fausetの,ぱぶ, Ted R. Feldpauschはは, Rafael Herreraひね,ひの, Martin Gilpinの, Emanuel Gloorの, Jeプerson S┻ Hallひは, David J. Harrisひば, Terese B. Hartひぱ,ひひ, Kuswata Kartawinataひび,ひぴ, Lip Khoon Khoひふ, Kanehiro Kitayamaひぶ, Susan G. W. Lauranceびね, William F. Lauranceびね, Miguel E. Lealびの, Thomas Lovejoyびは, Jon C. Lovettの, Faustin Mpanya Lukasuびば, Jean-Remy Makanaぱぴ, Yadvinder Malhiびぱ, Leandro Maracahipesびひ, Beatriz S. Marimonのふ, Ben Hur Marimon Juniorのふ, Andrew R. Marshallびび,びぴ, Paulo S. Morandiのふ, John Tshibamba Mukendiびば, Jaques Mukinziぱぴ,びふ, Reuben Nilusびぶ, Percy Núñez Vargasぴ, Nadir C. Pallqui Camachoぴ, Guido Pardoぴね, Marielos Peña-Clarosばば,ぴの, Pascal Pétronelliぴは, Georgia C. Pickavanceの, Axel Dalberg Poulsenぴば, John R. Poulsenばぴ, Richard B. Primackぴぱ, Hari Priyadiぴひ,ぴび, Carlos A. Quesadaはの, Jan Reitsmaぴぴ, Maxime Réjou-Méchainぱ, Zorayda Restrepoぴふ, Ervan Rutishauserぴぶ, Kamariah Abu Salimふね, Rafael P. Salomãoふの, Ismayadi Samsoedinふは, Douglas Sheilふ,ふば, Rodrigo Sierraふぱ, Marcos Silveiraふひ, J. W. Ferry Slikぴぶ, Lisa Steelふび, Hermann Taedoumgば, Sylvester Tanふぴ, John W. Terborghばぴ, Sean C. Thomasふふ, Marisol Toledoぴの, Peter M. Umunayふぶ, Luis Valenzuela Gamarraび, Ima Célia Guimarães Vieiraふの, Vincent A. Vosぴね,ぶね, Ophelia Wangぶの, Simon Willcockぶは,ぶば & Lise Zemaghoば
Tropical forests are global centres of biodiversity and carbon storage. Many tropical countries aspire to protect forest to fulボl biodiversity and climate mitigation policy targets┸ but the conservation strategies needed to achieve these two functions depend critically on the tropical forest tree diversity-carbon storage relationship. Assessing this relationship is challenging due to the scarcity of inventories where carbon stocks in aboveground biomass and species identiボcations have been simultaneously and robustly quantiボed┻ Here┸ we compile a unique pan┽tropical dataset of ばびね plots located in structurally intact old-growth closed-canopy forest, surveyed using standardised methods, allowing a multi-scale evaluation of diversity-carbon relationships in tropical forests. Diversity-carbon relationships among all plots at の ha scale across the tropics are absent┸ and within continents are either weak ゅAsiaょ or absent ゅAmazonia┸ Africaょ┻ A weak positive relationship is detectable within の ha plots┸ indicating that diversity eプects in tropical forests may be scale dependent┻ The absence of clear diversity┽carbon relationships at scales relevant to conservation planning means that carbon-centred conservation strategies will inevitably miss many high diversity ecosystems. As tropical forests can have any combination of tree diversity and carbon stocks both require explicit consideration when optimising policies to manage tropical carbon and biodiversity.
Received┺ のひ July はねのび
Accepted┺ はび October はねのび
Published┺ のぴ January はねのぴ
OPEN
www.nature.com/scientificreports/
2SCIENTIFIC REPORTS 】 ぴ┺ばぶのねは 】 DOI┺ のね┻のねばふ【srepばぶのねは
Biodiversity is threatened by the loss of natural habitats and climate change1–3. Tropical forests are under particular pressure, whilst also being the most diverse biomes on the planet4. By legally protecting areas, tropical countries can safeguard ecosystems with high biodiversity value5, and so address their policy targets to reduce biodiversity loss6. Likewise, carbon losses from the conversion of forest to other land-uses represent major emission sources for many tropical countries7, and so incentives such as the UN REDD+ policy framework have emerged to help safeguard areas with high carbon stocks8. Yet the potential for protection of carbon-rich areas to directly beneit
のSchool of Geography┸ University of Leeds┸ Leeds┸ UK┻ はDepartment of Geography┸ University College London┸ London┸ UK┻ ばPlant Systematic and Ecology Laboratory┸ University of Yaounde I┸ Cameroon┻ ぱUniversité Paul Sabatier CNRS┸ Toulouse┸ France┻ ひUnited Nations Environment Programme World Conservation Monitoring Centre┸ Cambridge┸ UK┻ びJardín Botánico de Missouri┸ Oxapampa┸ Perú┻ ぴUniversidad Nacional de San Antonio Abad del Cusco┸ Cusco┸ Perú┻ ふCIFOR┸ Bogor┸ Indonesia┻ ぶCollege of Marine and Environmental Sciences┸ James Cook University┸ Cairns┸ Australia┻ のねNaturalis Biodiversity Center┸ Leiden┸ Netherlands┻ ののEcology and Biodiversity Group┸ Utrecht University┸ Utrecht┸ Netherlands┻ のはAgence Nationale des Parcs Nationaux┸ Libreville┸ Gabon┻ のばInstitut de Recherche en Ecologie Tropicale┸ Libreville┸ Gabon┻ のぱSchool of Natural Sciences┸ University of Stirling┸ Stirling┸ UK┻ のひMensuration Unit┸ Forestry Commission of Ghana┸ Kumasi┸ Ghana┻ のびGraduate School of Science and Engineering┸ Kagoshima University┸ Japan┻ のぴInstituto de Biodiversidade e Floresta┸ Universidade Federal do Oeste do Pará┸ Santarém┸ Brazil┻ のふUniversidade do Estado de Mato Grosso┸ Nova Xavantina┸ Brazil┻ のぶCenter for Tropical Conservation┸ Duke University┸ Durham┸ NC┸ USA┻ はねRed para la Mitigación y Adaptación al Cambio Climático de la UNAD┸ Bogota┸ Colombia┻ はのInstituto Nacional de Pesquisas da Amazônia┸ Manaus┸ Brazil┻ ははGeography┸ College of Life and Environmental Sciences┸ University of Exeter┸ Exeter┸ UK┻ はばDepartment of Organismic and Evolutionary Biology┸ Harvard University┸ Cambridge┸ MA┸ USA┻ はぱPrograma de Ciencias del Agro y el Mar┸ Herbario Universitario┸ Barinas┸ Venezuela┻ はひCIFOR┸ Conakry┸ Guinea┻ はびCentre for Ecology and Hydrology┸ Penicuik┸ UK┻ はぴInternational Center for Tropical Botany┸ Department of Biological Sciences┸ Florida International University┸ Miami┸ FL┸ USA┻ はふUMR AMAP┸ IRD┸ Montpellier┸ France┻ はぶUPR BSEF┸ CIRAD┸ Montpellier┸ France┻ ばねThe University of Edinburgh┸ School of GeoSciences┸ Edinburgh┸ UK┻ ばのBiodiversity and Landscape Unit┸ Gembloux Agro┽Bio Tech┸ Université de Liège┸ Gembloux┸ Belgium┻ ばはINRA┸ UMR EEF┸ Champenoux┸ France┻ ばばForest Ecology and Forest Management group┸ Wageningen University┸ Wageningen┸ The Netherlands┻ ばぱInstituto Nacional de Pesquisas da Amazônia┸ Projeto Dinâmica Biológica de Fragmentos Florestais┸ Manaus┸ Brazil┻ ばひHerbario Alfredo Paredes┸ Universidad Central del Ecuador┸ Quito┸ Ecuador┻ ばびRougier┽Gabon┸ Libreville┸ Gabon┻ ばぴNicholas School of the Environment┸ Duke University┸ Durham┸ NC┸ USA┻ ばふJardín Botánico Joaquín Antonio Uribe┸ Medellín┸ Colombia┻ ばぶInventory ┃ Monitoring Program┸ National Park Service┸ Fredericksburg┸ VA┸ USA┻ ぱねAndes to Amazon Biodiversity Program┸ Puerto Maldonado┸ Perú┻ ぱのInstituto de Investigaciones de la Amazonia Perúana┸ Iquitos┸ Perú┻ ぱはSmithsonian Tropical Research Institute┸ Washington┸ DC┸ USA┻ ぱばLandscape Ecology and Vegetal Production Systems Unit┸ Universite Libre de Bruxelles┸ Brussels┸ Belgium┻ ぱぱDepartment of Botany ┃ Plant Physiology┸ Faculty of Science┸ University of Buea┸ Buea┸ Cameroon┻ ぱひForest Ressources Management┸ Gembloux Agro┽Bio Tech┸ University of Liege┸ Belgium┻ ぱびSmithsonian Institution┸ Washington┸ DC┸ USA┻ ぱぴWildlife Conservation Society┽DR Congo┸ Kinshasa I┸ Democratic Republic of Congo┻ ぱふCentre de Formation et de Recherche en Conservation Forestiere ゅCEFRECOFょ┸ Democratic Republic of Congo┻ ぱぶInstitute of Biology┸ UNICAMP┸ Campinas┸ Brazil┻ ひねCentro de Ecologia┸ Instituto Venezolano de Investigaciones Cientificas┸ Caracas┸ Venezuela┻ ひのInstitut für Geographie und Regionalforschung┸ Geoökologie┸ University of Vienna┸ Vienna┸ Austria┻ ひはSmithsonian Tropical Research Institute┸ Panamá┸ Republic of Panama┻ ひばRoyal Botanic Garden Edinburgh┸ Edinburgh┸ UK┻ ひぱLukuru Wildlife Research Foundation┸ Kinshasa┸ Gombe┸ Democratic Republic of Congo┻ ひひDivision of Vertebrate Zoology┸ Yale Peabody Museum of Natural History┸ New Haven┸ CT┸ USA┻ ひびHerbarium Bogoriense┸ Indonesian Institute of Sciences┸ Bogor┸ Indonesia┻ ひぴIntegrative Research Center┸ The Field Museum┸ Chicago┸ IL┸ USA┻ ひふTropical Peat Research Institute┸ Biological Research Division┸ Malaysian Palm Oil Board┸ Selangor┸ Malaysia┻ ひぶKyoto University┸ Kyoto┸ Japan┻ びねCentre for Tropical Environmental and Sustainability Sciences and College of Science and Engineering┸ James Cook University┸ Cairns┸ Australia┻ びのWildlife Conservation Society┸ Kampala┸ Uganda┻ びはDepartment of Environmental Science and Policy┸ George Mason University┸ Fairfax┸ VA┸ USA┻ びばFaculté des Sciences Agronomiques┸ Université de Kisangani┸ Kisangani┸ Democratic Republic of Congo┻ びぱSchool of Geography and the Environment┸ University of Oxford┸ Oxford┸ UK┻ びひUniversidade Federal de Goiás┸ Goiânia┸ Brazil┻ びびFlamingo Land Ltd┸ Kirby Misperton┸ UK┻ びぴCIRCLE┸ Environment Department┸ University of York┸ York┸ UK┻ びふSalonga National Park┸ Kinshasa I┸ DR Congo┻ びぶSabah Forestry Department┸ Sabah┸ Malaysia┻ ぴねUniversidad Autónoma del Beni┸ Riberalta┸ Bolivia┻ ぴのInstituto Boliviano de Investigación Forestal┸ Santa Cruz de la Sierra┸ Bolivia┻ ぴはCIRAD┸ UMR Ecologie des Forêts de Guyane┸ Sinamary┸ French Guiana┸ France┻ ぴばNatural History Museum┸ University of Oslo┸ Oslo┸ Norway┻ ぴぱDepartment of Biology┸ Boston University┸ Boston┸ MA┸ USA┻ ぴひCIFOR┸ Bogor┸ Indonesia┻ ぴびSouthern Swedish Forest Research Center┸ Swedish University of Agricultural Sciences┸ Alnarp┸ Sweden┻ ぴぴBureau Waardenburg┸ The Netherlands┻ ぴふFundación Con Vida┸ Medellín┸ Colombia┻ ぴぶCarboforexpert┸ Geneva┸ Switzerland┻ ふねEnvironmental and Life Sciences┸ Faculty of Science┸ Universiti Brunei Darussalam┸ Brunei┸ Darussalam┻ ふのMuseu Paraense Emilio Goeldi┸ Belém┸ Brazil┻ ふはFORDA┸ The Ministry of Forestry and Environment┸ Bogor┸ Indonesia┻ ふばNorwegian University of Life Sciences┸ Aas┸ Norway┻ ふぱGeoIS┸ Quito┸ Ecuador┻ ふひMuseu Universitário┸ Universidade Federal do Acre┸ Brazil┻ ふびWorld Wildlife Fund┸ Washington┸ DC┸ USA┻ ふぴCTFS┽AA Asia Program┸ Harvard University┸ Cambridge┸ MA┸ USA┻ ふふFaculty of Forestry┸ University of Toronto┸ Toronto┸ Canada┻ ふぶYale School of Forestry ┃ Environmental Studies┸ New Haven┸ CT┸ USA┻ ぶねCentro de Investigación y Promoción del Campesinado ┽ Regional Norte Amazónico┸ Riberalta┸ Bolivia┻ ぶのSchool of Earth Sciences and Environmental Sustainability┸ Northern Arizona University┸ Flagstaff AZ┸ USA┻ ぶはBiological Sciences┸ University of Southampton┸ Southampton┸ UK┻ ぶばSchool of Environment┸ Natural Resources and Geography┸ Bangor University┸ Bangor┸ UK┻ *These authors contributed equally to this work┻ Correspondence and requests for materials should be addressed to M┻J┻P┻S┻ ゅemail┺ m┻j┻sullivanlleeds┻ac┻ukょ
www.nature.com/scientificreports/
3SCIENTIFIC REPORTS 】 ぴ┺ばぶのねは 】 DOI┺ のね┻のねばふ【srepばぶのねは
biodiversity, and vice versa, depends critically on the relationship between biomass carbon and tree diversity, at relevant scales. A positive relationship would indicate potential synergies while a negative relationship would indicate diicult trade-ofs between biodiversity and carbon conservation9. In the absence of any relationship, optimal solutions for protected area placement need to carefully and separately consider the distribution of carbon stocks and the distribution of biodiversity10. Understanding these distributions and potential carbon-biodiversity trade-ofs is important, as protecting some forest can divert threats onto other unprotected areas11.
he expected form of diversity-carbon relationships in tropical forests and the strength and scale-dependence of any underlying mechanisms are uncertain. Numerous experimental studies have demonstrated that plant diversity promotes biomass production, with niche partitioning and positive species interactions allowing diverse communities to exploit available resources more eiciently12,13. Diversity can also increase productivity through selection efects, where communities that contain a larger sample of the species pool are more likely to contain high functioning species that contribute strongly to ecosystem productivity14. Positive diversity-productivity relationships have been found in low diversity mid-latitude forests15–17, potentially due to increased canopy pack-ing through complimentary canopy architecture in higher diversity forests18. Yet, it is unclear how signiicant such mechanisms are in diverse tropical forests, as experimental and theoretical work indicates that the posi-tive efect of diversity may saturate at high species richness12,19. Furthermore, additional traits associated with high-productivity species could conceivably lead to a positive diversity-biomass mortality relationship, as highly productive stands tend to be composed of trees with shorter biomass residence times20. Overall, this alongside high-productivity stands consisting of smaller, lighter-wooded trees21, may lead to a negative diversity-biomass carbon storage relationship.
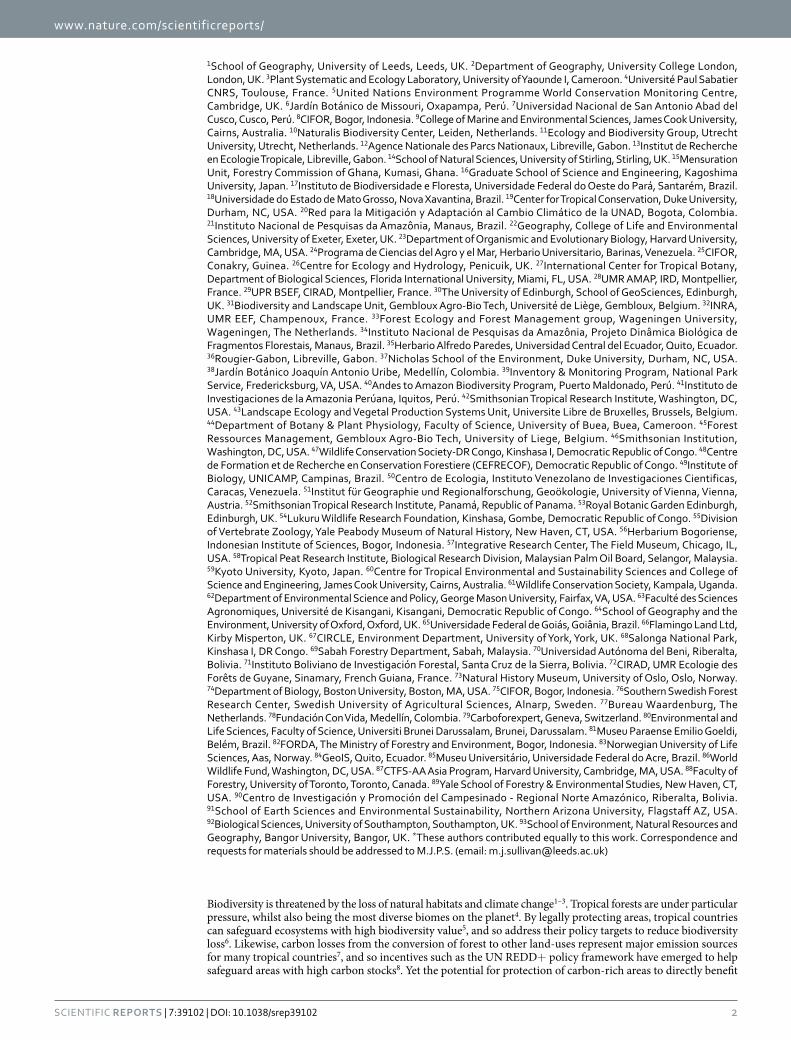
Previous studies investigating the tree diversity-carbon stock relationship in tropical forests have reported a positive relationship at ine spatial scales22,23. However, the form of the relationship at the stand-level (i.e. among 1 ha plots) is less clear (Table 1), as some studies report a continued positive diversity-carbon relationship among sampling locations23–25, while one other did not detect a relationship among 1 ha subplots within 25 larger plots22. hus, while there is some evidence that higher tree diversity promotes higher carbon stocks per unit area in diverse tropical forests22–24, it is unknown whether any positive efect is strong enough for carbon and diversity to co-vary at scales relevant to conservation planning.
Here we analyse a unique dataset of 360 inventory plots across the three major tropical forest blocs in the Americas, Africa, and the Sundaland biogeographic region in Southeast Asia (subsequently referred to as Asia). Importantly, this dataset greatly improves sampling of the two most extensive contiguous areas of tropical forest in the world, centred on the Amazon and Congo Basins (Table 1). Each plot was surveyed by standardised meth-ods and is of uniform size, allowing robust quantiication of co-located aboveground live carbon and tree diversity estimates. We analyse this standardised, multi-continental dataset at three spatial scales. Firstly, we explore forest carbon and diversity patterns within South America, Africa and Asia, in order to characterise among-continent variations in tree alpha diversity, beta diversity, and carbon stocks. Secondly, we assess diversity-carbon relation-ships across each of the continents, initially by looking at the bivariate association of tree diversity metrics and carbon stocks per unit area, and then re-examining the relationships ater controlling for potentially confound-ing environmental variation and residual spatial autocorrelation. Finally, we investigate ine-scale relationships
StudyGeographical
scope
Number of plots Number of sampling locations
Taxonomic level Diversity measures
Minimum identiication
level
Diversity-carbon relationship
1 ha 0.04 ha Total Amazon Congo BorneoWithin stand
Among stands
his study Tropics 360 6536 166 77 52 18Species,
genus and family
Richness, rareied richness, Shannon diversity, Simpson diversity, Fisher’s
alpha and functional diversity
80% stems to genus, 60% to
species+ None
Ref. 22Tropical and
temperate688a 17200a 25 2 1 1 Species Richnessb None given + [None]
Ref. 24 Tropics 59 NA 11 3 2 0 GenusRichness, Shannon diversity, functional
diversity
80% stems to family
NA +
Ref. 23Tropical America
294 1975d 59 47 0 0 SpeciesRichness, rareied
richness and Shannon diversity
None given + + e
Table 1. Pan-tropical and continental studies assessing the diversity-carbon relationship. Sampling locations
are groups of plots in close proximity to each other (individual large plots in ref. 22, TEAM study sites in ref. 24,
“forest sites” in ref. 23, groups of plots within 5 km of each other in this study). he number of sampling locations
in the largest blocs of forest in each continent are given, these are the Amazon basin and surrounding contiguous
forest, the Congo basin and surrounding contiguous forest, and Borneo. + indicates a positive diversity-carbon
relationship, NA indicates the relationship was not studied at the given scale. In this study, ref. 22 and ref. 24
all stems ≥ 10 cm d.b.h. were measured, in ref. 23 the minimum stem diameter measured varied among plots
(either 5 cm or 10 cm). aSample size not stated, so maximum possible number of 1 ha and 0.04 ha subplots given. bStem density was included as a covariate in analysis. cRelationship analysed among 1 ha plots within sampling
locations, not among sampling locations. d0.1 ha not 0.04 ha. eRelationship among sampling locations.

www.nature.com/scientificreports/
4SCIENTIFIC REPORTS 】 ぴ┺ばぶのねは 】 DOI┺ のね┻のねばふ【srepばぶのねは
between tree diversity and carbon within 0.04 ha subsections of 1 ha plots, where environmental diferences that may obscure a positive diversity efect on carbon are accounted for. his approach allows us to (1) examine basic patterns of diversity and carbon across the biome, (2) test if more diverse tropical forests are also in fact more carbon dense, and (3) explore whether relationships between diversity and carbon-storage, ater accounting for the efect of potentially confounding variables, are consistent with tree diversity having a positive efect on carbon in tropical forests. We conduct additional analyses to assess support for the operation of selection efects and niche complementarity at diferent spatial scales. We focus on carbon in aboveground live biomass derived using allometric relationships, and diversity metrics relating to taxon richness. We also repeat analyses using alternative diversity metrics that consider species abundance and functional diversity for which results and inferences are similar (see Supplementary Information).
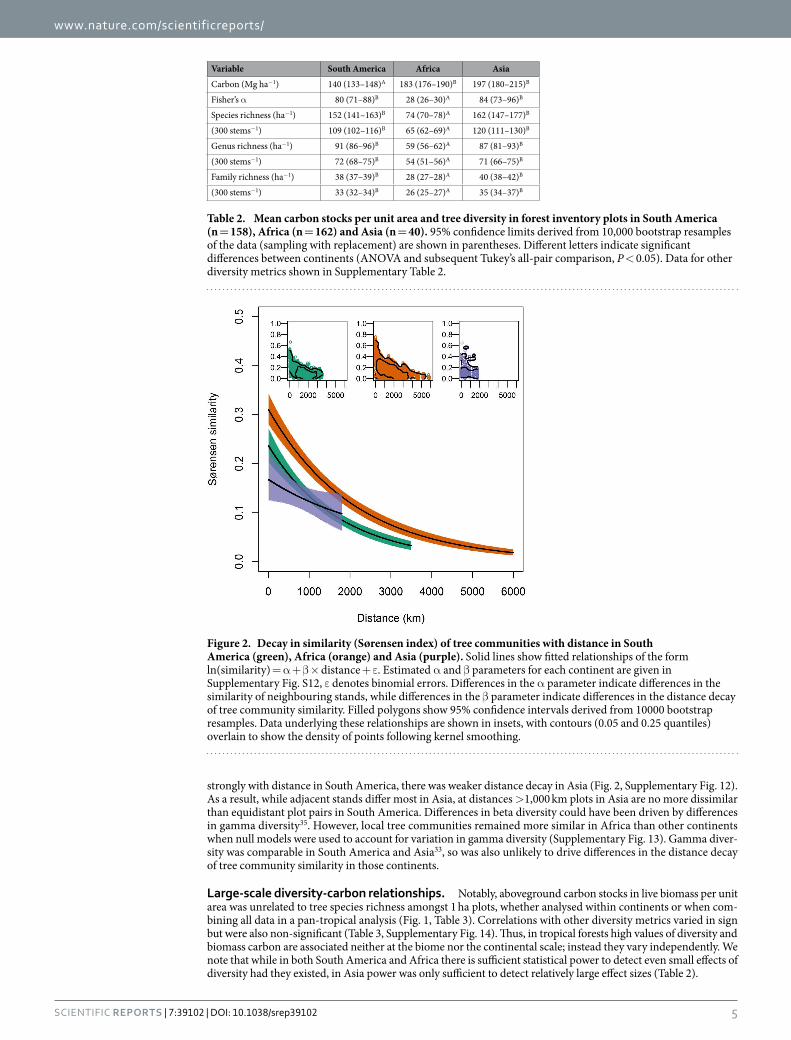
ResultsPantropical forest carbon and diversity. Our standardised methods of inventory reveal great variation in both aboveground live carbon stocks and tree diversity within continents and across the humid tropical forest biome. While it is possible to ind almost any combination of both parameters (Fig. 1), the plots reveal large dif-ferences in carbon and diversity amongst the three continents (Table 2). African tropical forests are characterised by high carbon storage per unit area and consistently low alpha-diversity (even the most species-rich African plot had fewer species than the median species richness recorded in South America and Asia). By contrast, in South American plots carbon storage per unit area was lower than in African forests (Fig. 1). Nevertheless both diversity and carbon vary greatly within South America, as relects previously reported gradients in species richness26 and biomass27,28, with some stands in the Guiana Shield region containing carbon stocks comparable to forests in the paleotropics (Fig. 1). Asian forests difer again, having on average both high carbon storage per unit area and high tree diversity. hese diferences in diversity amongst continents remain when diversity metrics are standardised per 300 stems (Table 2), and when the analysis was repeated only including plots with > 90% of stems identiied to species level (Supplementary Table 3), thus are robust to difering stem numbers (lower in Africa, negative bino-mial GLM χ 2 = 188.6, P < 0.001), and are unafected by our levels of tree identiication (not diferent amongst continents, Kruskal-Wallis test H = 2.1, P = 0.335). his pantropical assessment of forest carbon stocks and diver-sity is consistent with previous reports from individual continents, indicating high biomass in forests in Africa29 and Borneo30,31, high diversity in central and western Amazonia32 and low diversity in Africa33,34. Our analysis demonstrates that forests across the Sundaland region of Southeast Asia are not only amongst the most diverse in the tropics, as noted elsewhere33, but also amongst the most carbon-dense.
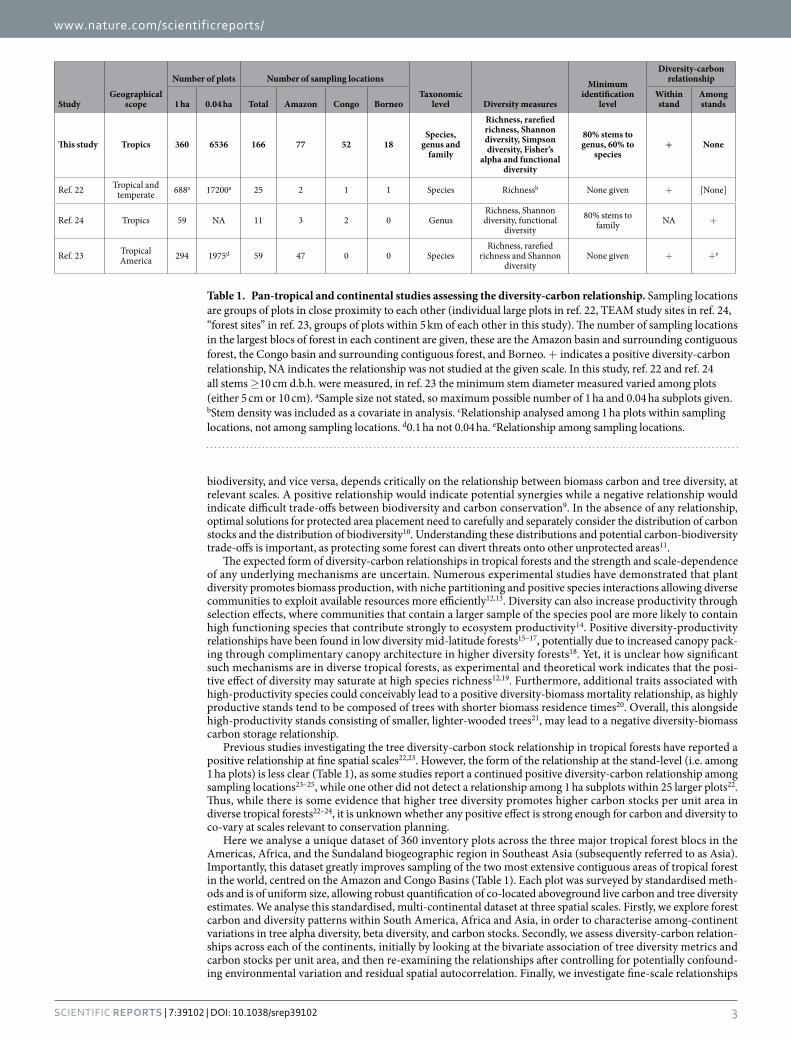
Beta-diversity also showed contrasting patterns amongst continents. Tree communities in neighbouring for-ests were least similar in Asia and most similar in Africa, where diversity rapidly saturates over geographic dis-tance and plots (Fig. 2, Supplementary Fig. 11). However while similarity in species composition decayed most
0 50 100 150 200 250 300
50
100
150
200
250
300
350
Species richness
Carb
on (
Mg.h
a−1)
South America (SA)
Africa (AF)
Asia (AS)
AS
AF
SA
AS
AF
SA
Figure 1. No relationship across the tropical forest biome between carbon stocks per unit area and tree species richness. Green circles = plots in South America (n = 158), orange squares = Africa (n = 162) and purple triangles = Asia (n = 40). Boxplots show variation in species richness and biomass carbon stocks in each continent. Both carbon and species richness difered signiicantly between continents (Table 2), but no signiicant correlation exists between carbon and species richness, neither within each continent (τ ≤ 0.132, P ≥ 0.12), nor across all three (linear regression weighted by sampling density in each continent, β < − 0.001, t = 0.843, P = 0.4, weights = 1.2 for South America, 0.6 for Africa and 1.8 for Asia). Results for other diversity metrics are similar (Supplementary Fig. S13).
www.nature.com/scientificreports/
5SCIENTIFIC REPORTS 】 ぴ┺ばぶのねは 】 DOI┺ のね┻のねばふ【srepばぶのねは
strongly with distance in South America, there was weaker distance decay in Asia (Fig. 2, Supplementary Fig. 12). As a result, while adjacent stands difer most in Asia, at distances > 1,000 km plots in Asia are no more dissimilar than equidistant plot pairs in South America. Diferences in beta diversity could have been driven by diferences in gamma diversity35. However, local tree communities remained more similar in Africa than other continents when null models were used to account for variation in gamma diversity (Supplementary Fig. 13). Gamma diver-sity was comparable in South America and Asia33, so was also unlikely to drive diferences in the distance decay of tree community similarity in those continents.
Large-scale diversity-carbon relationships. Notably, aboveground carbon stocks in live biomass per unit area was unrelated to tree species richness amongst 1 ha plots, whether analysed within continents or when com-bining all data in a pan-tropical analysis (Fig. 1, Table 3). Correlations with other diversity metrics varied in sign but were also non-signiicant (Table 3, Supplementary Fig. 14). hus, in tropical forests high values of diversity and biomass carbon are associated neither at the biome nor the continental scale; instead they vary independently. We note that while in both South America and Africa there is suicient statistical power to detect even small efects of diversity had they existed, in Asia power was only suicient to detect relatively large efect sizes (Table 2).
Variable South America Africa Asia
Carbon (Mg ha−1) 140 (133–148)A 183 (176–190)B 197 (180–215)B
Fisher’s α 80 (71–88)B 28 (26–30)A 84 (73–96)B
Species richness (ha−1) 152 (141–163)B 74 (70–78)A 162 (147–177)B
(300 stems−1) 109 (102–116)B 65 (62–69)A 120 (111–130)B
Genus richness (ha−1) 91 (86–96)B 59 (56–62)A 87 (81–93)B
(300 stems−1) 72 (68–75)B 54 (51–56)A 71 (66–75)B
Family richness (ha−1) 38 (37–39)B 28 (27–28)A 40 (38–42)B
(300 stems−1) 33 (32–34)B 26 (25–27)A 35 (34–37)B
Table 2. Mean carbon stocks per unit area and tree diversity in forest inventory plots in South America (n = 158), Africa (n = 162) and Asia (n = 40). 95% conidence limits derived from 10,000 bootstrap resamples of the data (sampling with replacement) are shown in parentheses. Diferent letters indicate signiicant diferences between continents (ANOVA and subsequent Tukey’s all-pair comparison, P < 0.05). Data for other diversity metrics shown in Supplementary Table 2.
Figure 2. Decay in similarity (Sørensen index) of tree communities with distance in South America (green), Africa (orange) and Asia (purple). Solid lines show itted relationships of the form ln(similarity) = α + β × distance + ε . Estimated α and β parameters for each continent are given in Supplementary Fig. S12, ε denotes binomial errors. Diferences in the α parameter indicate diferences in the similarity of neighbouring stands, while diferences in the β parameter indicate diferences in the distance decay of tree community similarity. Filled polygons show 95% conidence intervals derived from 10000 bootstrap resamples. Data underlying these relationships are shown in insets, with contours (0.05 and 0.25 quantiles) overlain to show the density of points following kernel smoothing.

www.nature.com/scientificreports/
6SCIENTIFIC REPORTS 】 ぴ┺ばぶのねは 】 DOI┺ のね┻のねばふ【srepばぶのねは
Since confounding environmental variables might obscure any underlying efect of tree diversity on carbon stocks, we next applied multiple regression including climate and edaphic variables as covariates to statistically control for environmental variation that might otherwise obscure the efect of diversity. In ordinary least squares multiple regression models, there was a consistent negative relationship between diversity and carbon in South America, and no signiicant relationship in Africa and Asia (Fig. 3b). When the analysis was repeated using simultaneous autoregressive error models to account for spatial autocorrelation, diversity was not supported as a predictor in South America or Africa (Fig. 3c). In Asia, while there were signiicant positive relationships between carbon and both Fisher’s α and species richness (Fig. 3c), environmental variables were more impor-tant predictors of carbon stocks based on their occurrence in low AICC models (Supplementary Table 5) and other diversity metrics were not supported as predictors of carbon stocks (Fig. 3c). hus, overall no consist-ent pan-tropically applicable relationship between diversity and carbon stocks was observed. Instead, carbon stocks per unit area was inluenced by climate and soil (Supplementary Fig. 15, Supplementary Table 5). In South America and Africa annual cumulative water deicit was the strongest environmental predictor of carbon stocks, as indicated by high ∑ AICC weights (≥ 0.98), and in South America a positive efect of soil fertility was also evident (Supplementary Fig. 15, Supplementary Table 5). In Asia, where no plots experienced cumulative water deicit, carbon stocks per unit area increased with mean annual precipitation (∑ AICC weights = 1) and declined with mean annual temperature (∑ AICC weights = 0.65).
Carbon stocks per unit area was also related to structural attributes, increasing with basal area and basal area-weighted mean wood density, but not with stem density (Supplementary Fig. 16). While consistent with pre-vious studies23, this is hardly surprising as both wood density and basal area are constituents of biomass estimates. Critically, these two structural attributes of carbon stocks per unit area were themselves largely unrelated to spe-cies richness (Supplementary Fig. 16), indicating that diversity is not a correlate of the key structural factors that lead to high biomass in some tropical forest stands. Stem size inequality, which has been posited as a mechanism linking diversity and carbon in boreal forests36, was positively related to carbon but unrelated to species richness (Supplementary Fig. 17). Inclusion of mean wood density (a proxy for stem turnover) in multiple regression models did not afect diversity-carbon relationships (Supplementary Table 6), indicating that the lack of a con-sistent diversity-carbon relationship is unlikely to be due to variation in mortality. Finally, we also used structural equation modelling to examine the relationship between diversity and carbon while explicitly modelling the efect of climate and soil on both tree species richness and carbon stocks. In this modelling framework, there were non-signiicant positive relationships between species richness and carbon in Africa and Asia and a signiicant negative relationship in South America (Supplementary Figure 18).
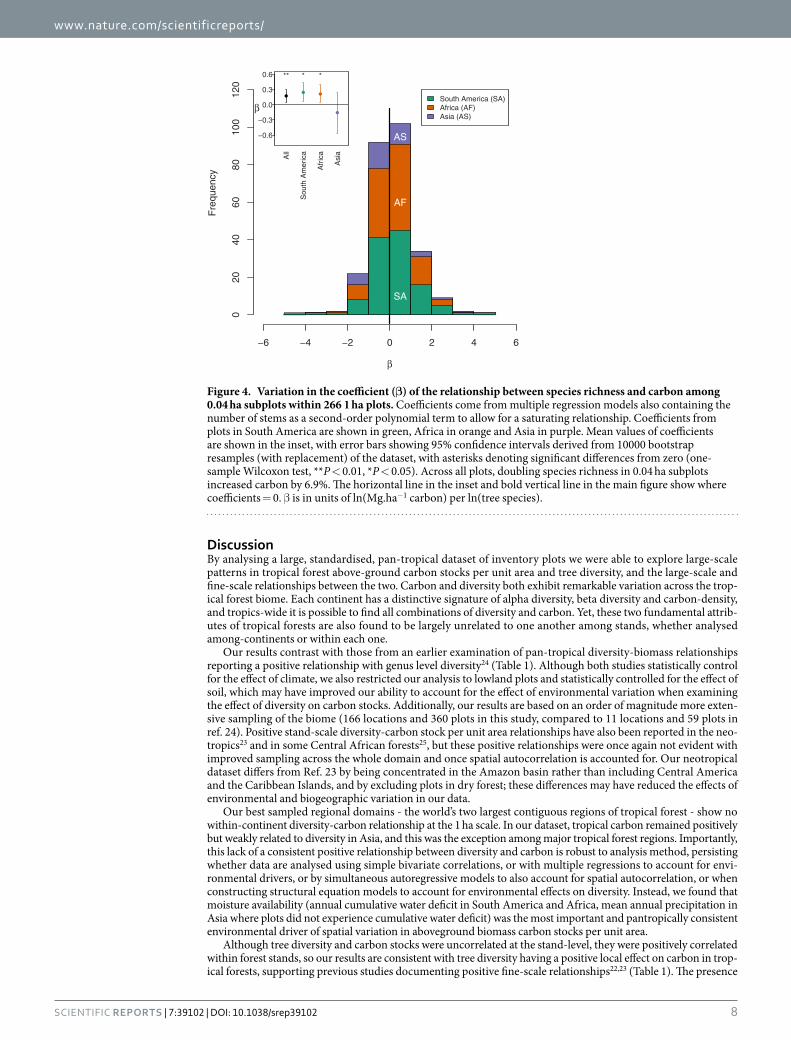
Fine-scale diversity-carbon relationships. Amongst 0.04 ha subplots within each plot most environmen-tal diferences in climate and soil are implicitly accounted for. Here, relationships between species richness and carbon were on average signiicantly positive when considering all 266 × 1 ha plots for which we had subplot-scale data (one-sample Wilcoxon test, P = 0.007), and signiicant for plots within Africa (n = 111 plots, one-sample Wilcoxon test, P = 0.022) and South America alone (n = 118 plots, one-sample Wilcoxon test, P = 0.013, Fig. 4). Within these plots, 148 (55.6%) had a positive richness-carbon relationship and 118 (44.4%) a negative relation-ship (Fig. 4). Overall the richness-carbon relationship was weak but positive (β = 0.096 ± 0.048 SE). his implies that doubling species richness per 0.04 ha would increase carbon stocks by 6.9%, with similar relationships for other diversity metrics (Supplementary Table 7). his is consistent with an independent within-plot study of 25 plots which showed a 7% efect size of diversity on aboveground biomass at the 0.04 ha spatial scale, but no rela-tionship at the 1 ha scale22.
Examining support for niche complementarity and selection eプects┻ here was a statistically signiicant positive relationship between a multivariate metric of functional diversity incorporating wood den-sity and maximum diameter traits and carbon stocks at the 0.04 ha scale (linear mixed efects model, P < 0.001, Supplementary Figure 1), but this relationship was not signiicant in any continent at the 1 ha scale (linear regres-sion models, P ≥ 0.139, Supplementary Figure 1). Carbon stocks increased with the community weighted means of both wood density and maximum diameter traits at both 0.04 ha (linear mixed efects models, P < 0.001, Supplementary Figure 4) and 1 ha scales (linear regression models, P ≤ 0.049, Supplementary Figure 4), indicat-ing that carbon stocks was positively related to the functional dominance of potentially large and dense wooded species. he probability of sampling a species with large maximum size or dense wood increased through the
Diversity metric
South America Africa Asia
τ P-value τ P-value τ P-value
Fisher’s α 0.083 0.12 0.012 0.821 0.115 0.302
Species richness 0.084 (0.092) 0.12 (0.087) 0.014 (0.031) 0.788 (0.573) 0.132 (0.151) 0.230 (0.174)
Genus richness 0.066 (0.059) 0.223 (0.272) − 0.016 (0.01) 0.765 (0.859) − 0.006 (− 0.051) 0.954 (0.652)
Family richness − 0.007 (− 0.042) 0.893 (0.43) − 0.051 (− 0.036) 0.35 (0.519) 0.087 (0.021) 0.434 (0.862)
Detectable efect size τ = 0.14 r = 0.22 τ = 0.14 r = 0.22 τ = 0.28 r = 0.43
Table 3. Correlations (Kendall’s τ) between carbon and tree diversity in South America (n = 158 plots), Africa (n = 162) and Asia (n = 40). Power analysis was used to estimate the minimum efect size (presented as both τ and Pearson’s r) detectable with 80% power. Correlations with taxon richness per 300 stems are shown in parentheses. Correlations with other diversity metrics shown in Supplementary Table 4.

www.nature.com/scientificreports/
7SCIENTIFIC REPORTS 】 ぴ┺ばぶのねは 】 DOI┺ のね┻のねばふ【srepばぶのねは
range of species richness values typical of 0.04 ha subplots, but tended to saturate by the species richness val-ues typical of 1 ha plots, with the exact form of this relationship depending on the threshold used to deine a large or dense wooded species and whether the null model used to sample species randomly selected species from the pool available within a continent or sampled species according to their relative frequency of occurrence (Supplementary Figures 5–10). For example, the expected probability of sampling a tree species with maximum diameter ≥ 70 cm, as assessed using a null model randomly selecting species from the pool of species recorded in plots within each continent, increased from 0.760 to 0.878 over the interquartile range of species richness found in 0.04 ha subplots (i.e. 11 to 18 species), but was 0.999 by the lower quartile of species richness in 1 ha plots (i.e. 72 species). Likewise, there was a positive relationship between the observed occurrence of potentially large tree species and species richness in 0.04 ha subplots (binomial generalised linear mixed efects models, P < 0.001, Supplementary Figure 6), while at 1 ha scale this relationship was no longer evident as all but one 1 ha plot con-tained a potentially large species. Further details and interpretation of these analyses are given in Supplementary Discussion.
Figure 3. Stand-level efect of diversity on carbon stocks per unit area. (A) Location of clusters of forest inventory plots in South America (n = 158 plots), Africa (n = 162 plots) and Asia (n = 40 plots) (some cluster centroids are not visible due to over plotting). (B & C) Diversity metric coeicients in multiple regressions relating carbon to diversity, climate and soil. Results have been presented for (B) non-spatial (OLS) and (C) simultaneous autoregressive error (SAR) models. Bars show model-averaged parameter estimates, with error bars showing standard errors. Asterisks denote variables that were signiicant in the average model (P < 0.05), with the summed AICC weights of models in which a variable appears shown beneath bars (where > 0.75). Taxa/stem denotes richness estimates per 300 stems. SAR models indicate that increasing species richness by 1 SD (from 86 to 151 species.ha−1) increased carbon by 1.5 Mg.ha−1 in South America, 0.2 Mg.ha−1 in Africa and 15.8 Mg.ha−1 in Asia (note only the relationship in Asia was statistically signiicant). Green shading in (A) shows the extent of broadleaved evergreen and fresh water regularly looded forest classes from52. Model coeicients are given in Supplementary Table 5. Maps were created in R version 3.02 (http://www.R-project.org/)53 using base maps from maps package version 2.3–9 (http://CRAN.R-project.org/package = maps)54.
www.nature.com/scientificreports/
8SCIENTIFIC REPORTS 】 ぴ┺ばぶのねは 】 DOI┺ のね┻のねばふ【srepばぶのねは
DiscussionBy analysing a large, standardised, pan-tropical dataset of inventory plots we were able to explore large-scale patterns in tropical forest above-ground carbon stocks per unit area and tree diversity, and the large-scale and ine-scale relationships between the two. Carbon and diversity both exhibit remarkable variation across the trop-ical forest biome. Each continent has a distinctive signature of alpha diversity, beta diversity and carbon-density, and tropics-wide it is possible to ind all combinations of diversity and carbon. Yet, these two fundamental attrib-utes of tropical forests are also found to be largely unrelated to one another among stands, whether analysed among-continents or within each one.
Our results contrast with those from an earlier examination of pan-tropical diversity-biomass relationships reporting a positive relationship with genus level diversity24 (Table 1). Although both studies statistically control for the efect of climate, we also restricted our analysis to lowland plots and statistically controlled for the efect of soil, which may have improved our ability to account for the efect of environmental variation when examining the efect of diversity on carbon stocks. Additionally, our results are based on an order of magnitude more exten-sive sampling of the biome (166 locations and 360 plots in this study, compared to 11 locations and 59 plots in ref. 24). Positive stand-scale diversity-carbon stock per unit area relationships have also been reported in the neo-tropics23 and in some Central African forests25, but these positive relationships were once again not evident with improved sampling across the whole domain and once spatial autocorrelation is accounted for. Our neotropical dataset difers from Ref. 23 by being concentrated in the Amazon basin rather than including Central America and the Caribbean Islands, and by excluding plots in dry forest; these diferences may have reduced the efects of environmental and biogeographic variation in our data.
Our best sampled regional domains - the world’s two largest contiguous regions of tropical forest - show no within-continent diversity-carbon relationship at the 1 ha scale. In our dataset, tropical carbon remained positively but weakly related to diversity in Asia, and this was the exception among major tropical forest regions. Importantly, this lack of a consistent positive relationship between diversity and carbon is robust to analysis method, persisting whether data are analysed using simple bivariate correlations, or with multiple regressions to account for envi-ronmental drivers, or by simultaneous autoregressive models to also account for spatial autocorrelation, or when constructing structural equation models to account for environmental efects on diversity. Instead, we found that moisture availability (annual cumulative water deicit in South America and Africa, mean annual precipitation in Asia where plots did not experience cumulative water deicit) was the most important and pantropically consistent environmental driver of spatial variation in aboveground biomass carbon stocks per unit area.
Although tree diversity and carbon stocks were uncorrelated at the stand-level, they were positively correlated within forest stands, so our results are consistent with tree diversity having a positive local efect on carbon in trop-ical forests, supporting previous studies documenting positive ine-scale relationships22,23 (Table 1). he presence
β
Fre
qu
en
cy
−6 −4 −2 0 2 4 6
020
40
60
80
10
01
20
SA
AF
AS−0.6
−0.3
0.0
0.3
0.6
β
All
So
uth
Am
eri
ca
Afr
ica
Asia
** * *
South America (SA)
Africa (AF)
Asia (AS)
Figure 4. Variation in the coeicient (β) of the relationship between species richness and carbon among 0.04 ha subplots within 266 1 ha plots. Coeicients come from multiple regression models also containing the number of stems as a second-order polynomial term to allow for a saturating relationship. Coeicients from plots in South America are shown in green, Africa in orange and Asia in purple. Mean values of coeicients are shown in the inset, with error bars showing 95% conidence intervals derived from 10000 bootstrap resamples (with replacement) of the dataset, with asterisks denoting signiicant diferences from zero (one-sample Wilcoxon test, **P < 0.01, *P < 0.05). Across all plots, doubling species richness in 0.04 ha subplots increased carbon by 6.9%. he horizontal line in the inset and bold vertical line in the main igure show where coeicients = 0. β is in units of ln(Mg.ha−1 carbon) per ln(tree species).
www.nature.com/scientificreports/
9SCIENTIFIC REPORTS 】 ぴ┺ばぶのねは 】 DOI┺ のね┻のねばふ【srepばぶのねは
of a weakly positive (overall, South America, Africa) relationship at 0.04 ha but not at 1 ha scale (overall, South America, Africa) could indicate that the mechanisms driving the diversity-carbon relationship are scale depend-ent, or could be due to environmental variation acting at larger spatial scales obscuring the mechanistic efects of diversity22. Although our multiple regression models applied at 1 ha scale statistically control for important variation in climate, soil texture and soil chemistry, it is clearly not possible to capture all environmental variation that may inluence carbon stocks, such as local disturbance history, so we cannot rule out the latter explanation. However, we conducted additional analyses (full details in Supplementary Discussion) to examine possible mech-anisms underlying the diversity efects and explore their putative scale-dependency. Carbon stocks increased with the functional dominance of species with high wood density and large maximum diameter at both 0.04 ha and 1 ha scales (Supplementary Figure 4). he efect of functional dominance at 1 ha scale has been found before in tropical forests24,37, and has been interpreted to support the role of selection efects16,24. However, this analysis by itself is a test of the biomass ratio hypothesis37. For selection efects to operate, the probability of sampling a high func-tioning species should also increase with species richness. We found that the probability of sampling species with high maximum diameters or high wood density increases with species richness at diversity levels found in 0.04 ha subplots, but saturates at diversity levels below those of 1 ha plots (Supplementary Figures 5–10), indicating that selection efects, as expected, appear to be scale-dependent. Additionally, the efects of niche complementarity may also saturate, as we found a positive relationship between a multivariate functional diversity metric (incorpo-rating wood density and maximum diameter traits) and carbon only at the 0.04 ha scale (Supplementary Figure 1). he absence of a signiicant relationship between tree functional diversity and carbon stocks per unit area at 1 ha scale is consistent with a previous analysis from three neotropical rainforests37. Although the saturating proba-bility of sampling a high functioning species with increasing species richness and the absence of carbon – func-tional diversity relationships at 1 ha are consistent with both selection efects and niche complementarity being scale-dependent, they are based on correlative analysis of observational data so causal inferences need to be made cautiously. Neither do our analyses test other potentially important ecosystem impacts of diversity, such as on the resistance and resilience of biomass production to climate extremes38. Long-term large-scale experiments that manipulate tree diversity in tropical forests39 may provide additional mechanistic insights into potential positive efects of tree diversity and their potential saturation with scale.
A caveat with this and other studies using allometric equations to estimate above-ground biomass carbon is that allometric equations do not allow variation in tree architecture with forest structure. For example, Banin et al.40 found a weak negative relationship between tree height and stem density, meaning that allometric equa-tions may overestimate carbon stocks in plots where stem density is highest. his could increase the chances of inding a spurious positive relationship between diversity and carbon, as we ind a weak positive relationship between stem density and species richness (Supplementary Figure 16). his potential bias is unlikely to have impacted our results, as we still ind a weak positive diversity-carbon relationship within plots and no relationship among plots when diversity metrics are standardised per n stems (Table 3, Supplementary Table 7). Such poten-tial biases could be evaluated in the future if co-located LiDAR based aboveground biomass carbon estimates and ground-based tree diversity measurements are made at suicient sites. he uncertainty in biomass carbon estimates due to using allometric equations could reduce the chance of inding diversity-carbon relationships by adding noise to the data. Whilst this highlights the need to maximise statistical power with large datasets, we note that the two largest studies investigating diversity-carbon relationships (this study by number of sampling locations across the biome, Ref. 22, by area sampled, see Table 1) converge on a similar result with independent datasets; diversity and carbon are positively related at the 0.04 ha scale but unrelated at the 1 ha scale.
Conservation implications. Despite the absence of a stand-level diversity-carbon relationship, some forest stands certainly do combine high tree diversity and biomass (Fig. 1), indicating that high value carbon and bio-diversity conservation can be simultaneously achieved, but only with conidence if both are considered9,10. We note that conservation strategies will also need to consider biodiversity of taxa other than trees, which may also be unrelated to carbon stocks41, the conservation value of speciic species assemblages3, belowground carbon stores such as in tropical peat swamps42, and spatial variation in opportunity costs43. Methods to select protected areas that consider multiple metrics of conservation value (e.g. aboveground biomass carbon and aspects of bio-diversity) are available10. Our results support the use of such an approach over carbon-dominated prioritisation incentivised under REDD+ 9. Applying this in practice is challenging as it requires knowledge of spatial variation in tree diversity, composition and carbon stocks, highlighting the importance of careful identiications to species level during forest inventories. As tropical forests can have any combination of tree diversity and carbon both will require explicit consideration when optimising policies to manage tropical carbon and biodiversity.
In sum, our large, pan-tropical analysis reveals that at small scales of less than 1 ha tree diversity is weakly pos-itively correlated with aboveground carbon stocks, potentially due to both niche complementarity and sampling efects. Yet our results show that these processes do not translate to patterns at scales that matter practically for conservation: tree diversity and carbon vary independently among sites, both within continents and across the whole tropical forest biome. Despite the general lack of association between diversity and carbon, our analysis demonstrates that forests in Asia are not only amongst the most diverse in the tropics but also amongst the most carbon-dense. hus at a global scale a clear synergy emerges, with forests in Asia being both highly speciose and extremely carbon-dense. Asian forests are under substantial threat, particularly from conversion to oil palm plan-tations and more intensive logging than elsewhere in the tropics. As a triple hotspot for biodiversity, carbon and threat, there is a compelling global case for prioritising their conservation.
MethodsTo permit comparisons among and within continents we utilised 360 forest inventory plots, surveyed using uniform standardised protocols, from three networks, RAINFOR (Amazon Forest Inventory Network; www.
www.nature.com/scientificreports/
1 0SCIENTIFIC REPORTS 】 ぴ┺ばぶのねは 】 DOI┺ のね┻のねばふ【srepばぶのねは
rainfor.org, ref. 44), AfriTRON (African Tropical Rainforest Observatory Network; www.afritron.org, ref. 29) and T-FORCES (Tropical Forests in the Changing Earth System; www.tforces.net). he plots were all within closed-canopy lowland (maximum altitude 1217 m above sea level) humid terra irme forest (mean annual tem-perature, MAT, ≥ 20 °C and mean annual precipitation, MAP, ≥ 1300 mm), all were 1 ha, except four of 0.96 ha, and none exceeded 500 m in maximum dimension. he rationale for restricting the environmental domain sam-pled was to minimise the environmental diferences among plots and thus reduce the confounding efect of envi-ronmental variation on the diversity-carbon relationship; this approach contrasts with previous studies that have sampled along larger elevation (and thus temperature)24 and precipitation23 gradients In each plot at least 80% of stems were identiied to genus and at least 60% to species (mean = 90.3% stems identiied to species; 84% of plots had at least 80% stems identiied to species, 63% had at least 90% of stems identiied to species). All stem diameter measurements follow standard (above buttress) methods (see Supplementary Methods for full protocols). All stems ≥ 10 cm d.b.h. were measured. Sampling was distributed across the world’s three largest tropical humid forest blocs, with 158 plots in South America, 162 in Africa and 40 in Asia (Fig. 3). hese came from 166 discrete localities (South America 80, Africa 67, Asia 19), where a ‘locality’ is deined as clusters of plots with maximum inter-plot distance of 5 km. Plot data were curated in ForestPlots.net45 or using equivalent oline procedures, with each plot following the same quality control and subsequent calculation protocol. Aboveground biomass (AGB) was estimated for each stem using the allometric equation AGB = 0.0673 × (ρ D2H)0.976, from46, where ρ is stem wood density (in g.cm−3) obtained from a world database47,48, D is stem diameter (in cm) at 1.3 m or above buttresses, and H is height (in m), the latter estimated using regional height-diameter Weibull equations49. AGB values were converted to estimates of carbon using the mean carbon fraction for tropical angiosperms, 47.1%, from50. Taxon richness was estimated as the sum of identiied species and morphospecies plus the estimated num-ber of unidentiied taxa based on observed richness per stem ratios (details in Supplementary Methods). Richness per 300 stems was estimated using individual based rarefaction.
Diferences in diversity and carbon among continents were assessed using analysis of variance. To meet model assumptions, carbon stocks per unit area was log-transformed and Fisher’s alpha square-root transformed, while taxon richness was modelled using a negative binomial error distribution to account for overdispersion. We used log-linear generalised linear models with binomial errors to model the relationship between Sørensen index (beta diversity) and geographical distance between plots in each continent, restricting this analysis to plots with > 90% of stems identiied to species level (227 plots). Relationships among 1 ha plots were assessed using [1] bivariate Kendall’s τ correlations and [2] multiple regressions of carbon as a function of diversity, climate (cumulative water deicit, MAT, MAP; 1 km resolution) and soil (total exchangeable bases, C:N ratio, soil texture; 0–30 cm depth). We ran all predictor subsets and averaged models where cumulative AICC weights summed to 0.95. Residual spatial autocorrelation was present, so we repeated the analysis using simultaneous autoregressive error models to explicitly model spatially autocorrelated errors. We also repeated the analysis using structural equation models implemented in the R package lavaan51. Relationships amongst 0.04 ha subplots in the 266 plots where subplot level data were also available were examined using multiple regressions of ln(carbon) against ln(diversity) and ln(stem density) for each plot individually, as well as for all plots using a random coeicients mixed efect model with plot identity as a random efect. Finally, we conducted a series of analyses to assess support for possible mechanisms driving diversity-carbon relationships, which are described in full in the Supplementary Discussion. Briely, we produced separate models of carbon stocks as a function of the community weighted mean (CWM) of wood density, the CWM of maximum stem diameter, the standard deviation of wood density and a functional diversity metric including both these traits. Relationships at 1 ha were modelled using linear regression, rela-tionships at 0.04 ha were modelled using linear mixed efects models with plot identity as a random efect. We related the expected probability of sampling a species with large potential size or high wood density (deined as maximum diameter ≥ 70 cm or wood density ≥ 0.8 g.cm−3 respectively, other thresholds were also examined) to species richness using null models, and also used binomial generalised linear mixed-efects models to relate the occurrence of these species in 0.04 ha subplots to species richness. Signiicance testing is based on two-tailed tests, with α = 0.05 used to determine statistical signiicance. See Supplementary Methods for full details of methods.
Data availability. Data are available from http://dx.doi.org/10.5521/FORESTPLOTS.NET/2016_3.
References1. Dirzo, R. et al. Defaunation in the Anthropocene. Science 345, 401–406, doi: 10.1126/science.1251817 (2014).2. homas, C. D. et al. Extinction risk from climate change. Nature 427, 145–148, doi: http://www.nature.com/nature/journal/v427/
n6970/suppinfo/nature02121_S1.html (2004).3. ter Steege, H. et al. Estimating the global conservation status of more than 15,000 Amazonian tree species. Science Advances 1, doi:
10.1126/sciadv.1500936 (2015).4. Lewis, S. L., Edwards, D. P. & Galbraith, D. Increasing human dominance of tropical forests. Science 349, 827–832, doi: 10.1126/
science.aaa9932 (2015).5. Moilanen, A. et al. Prioritizing multiple-use landscapes for conservation: methods for large multi-species planning problems. Vol. 272 (2005).6. Chape, S., Harrison, J., Spalding, M. & Lysenko, I. Measuring the extent and efectiveness of protected areas as an indicator for
meeting global biodiversity targets. Philosophical Transactions of the Royal Society B: Biological Sciences 360, 443–455, doi: 10.1098/rstb.2004.1592 (2005).
7. Matthews, H. D. et al. National contributions to observed global warming. Environmental Research Letters 9, 014010 (2014).8. United Nations Framework Convention on Climate Change. (ed. Conference of the Parties Twenty-irst session) (2015).9. Gardner, T. A. et al. A framework for integrating biodiversity concerns into national REDD+ programmes. Biol. Conserv. 154,
61–71, doi: 10.1016/j.biocon.2011.11.018 (2012).10. homas, C. D. et al. Reconciling biodiversity and carbon conservation. Ecology Letters 16, 39–47, doi: 10.1111/ele.12054 (2013).11. Ewers, R. M. & Rodrigues, A. S. L. Estimates of reserve efectiveness are confounded by leakage. Trends in Ecology & Evolution 23,
113–116, doi: http://dx.doi.org/10.1016/j.tree.2007.11.008 (2008).12. Cardinale, B. J. et al. Biodiversity loss and its impact on humanity. Nature 486, 59–67, doi: http://www.nature.com/nature/journal/
v486/n7401/abs/nature11148.html#supplementary-information (2012).

www.nature.com/scientificreports/
1 1SCIENTIFIC REPORTS 】 ぴ┺ばぶのねは 】 DOI┺ のね┻のねばふ【srepばぶのねは
13. Tilman, D., Isbell, F. & Cowles, J. M. Biodiversity and Ecosystem Functioning. Annual Review of Ecology, Evolution, and Systematics 45, 471–493, doi: 10.1146/annurev-ecolsys-120213-091917 (2014).
14. Loreau, M. & Hector, A. Partitioning selection and complementarity in biodiversity experiments. Nature 412, 72–76, doi: 10.1038/35083573 (2001).
15. Morin, X., Fahse, L., Scherer-Lorenzen, M. & Bugmann, H. Tree species richness promotes productivity in temperate forests through strong complementarity between species. Ecology Letters 14, 1211–1219, doi: 10.1111/j.1461-0248.2011.01691.x (2011).
16. Ruiz-Benito, P. et al. Diversity increases carbon storage and tree productivity in Spanish forests. Global Ecology and Biogeography 23, 311–322, doi: 10.1111/geb.12126 (2014).
17. Jucker, T., Bouriaud, O., Avacaritei, D. & Coomes, D. A. Stabilizing efects of diversity on aboveground wood production in forest ecosystems: linking patterns and processes. Ecology Letters 17, 1560–1569, doi: 10.1111/ele.12382 (2014).
18. Jucker, T., Bouriaud, O. & Coomes, D. A. Crown plasticity enables trees to optimize canopy packing in mixed-species forests. Functional Ecology 29, 1078–1086, doi: 10.1111/1365-2435.12428 (2015).
19. Liang, J. J., Zhou, M., Tobin, P. C., McGuire, A. D. & Reich, P. B. Biodiversity inluences plant productivity through niche-eiciency. Proc. Natl. Acad. Sci. USA 112, 5738–5743, doi: 10.1073/pnas.1409853112 (2015).
20. Galbraith, D. et al. Residence times of woody biomass in tropical forests. Plant Ecology & Diversity 6, 139–157, doi: 10.1080/17550874.2013.770578 (2013).
21. Keeling, H. C. & Phillips, O. L. he global relationship between forest productivity and biomass. Global Ecology and Biogeography 16, 618–631, doi: 10.1111/j.1466-8238.2007.00314.x (2007).
22. Chisholm, R. A. et al. Scale-dependent relationships between tree species richness and ecosystem function in forests. Journal of Ecology 101, 1214–1224, doi: 10.1111/1365-2745.12132 (2013).
23. Poorter, L. et al. Diversity enhances carbon storage in tropical forests. Global Ecology and Biogeography n/a–n/a, doi: 10.1111/geb.12364 (2015).
24. Cavanaugh, K. C. et al. Carbon storage in tropical forests correlates with taxonomic diversity and functional dominance on a global scale. Global Ecology and Biogeography 23, 563–573, doi: 10.1111/geb.12143 (2014).
25. Day, M., Baldauf, C., Rutishauser, E. & Sunderland, T. Relationships between tree species diversity and above-ground biomass in Central African rainforests: implications for REDD. Environmental Conservation 41, 64–72, doi: doi: 10.1017/S0376892913000295 (2014).
26. Ter Steege, H. et al. A spatial model of tree α -diversity and tree density for the Amazon. Biodiversity & Conservation 12, 2255–2277, doi: 10.1023/a:1024593414624 (2003).
27. Quesada, C. A. et al. Basin-wide variations in Amazon forest structure and function are mediated by both soils and climate. Biogeosciences 9, 2203–2246, doi: 10.5194/bg-9-2203-2012 (2012).
28. Baraloto, C. et al. Disentangling stand and environmental correlates of aboveground biomass in Amazonian forests. Global Change Biology 17, 2677–2688, doi: 10.1111/j.1365-2486.2011.02432.x (2011).
29. Lewis, S. L. et al. Above-ground biomass and structure of 260 African tropical forests. Philosophical Transactions of the Royal Society B: Biological Sciences 368, doi: 10.1098/rstb.2012.0295 (2013).
30. Banin, L. et al. Tropical forest wood production: a cross-continental comparison. Journal of Ecology 102, 1025–1037, doi: 10.1111/1365-2745.12263 (2014).
31. Slik, J. W. F. et al. Environmental correlates of tree biomass, basal area, wood speciic gravity and stem density gradients in Borneo’s tropical forests. Global Ecology and Biogeography 19, 50–60, doi: 10.1111/j.1466-8238.2009.00489.x (2010).
32. Gentry, A. H. Tree species richness of upper Amazonian forests. Proceedings of the National Academy of Sciences 85, 156–159 (1988).33. Slik, J. W. F. et al. An estimate of the number of tropical tree species. Proceedings of the National Academy of Sciences, doi: 10.1073/
pnas.1423147112 (2015).34. Parmentier, I. et al. he odd man out? Might climate explain the lower tree α -diversity of African rain forests relative to Amazonian
rain forests? Journal of Ecology 95, 1058–1071, doi: 10.1111/j.1365-2745.2007.01273.x (2007).35. Krat, N. J. B. et al. Disentangling the Drivers of β Diversity Along Latitudinal and Elevational Gradients. Science 333, 1755–1758,
doi: 10.1126/science.1208584 (2011).36. Zhang, Y. & Chen, H. Y. H. Individual size inequality links forest diversity and above-ground biomass. Journal of Ecology 103,
1245–1252, doi: 10.1111/1365-2745.12425 (2015).37. Finegan, B. et al. Does functional trait diversity predict above-ground biomass and productivity of tropical forests? Testing three
alternative hypotheses. Journal of Ecology 103, 191–201, doi: 10.1111/1365-2745.12346 (2015).38. Isbell, F. et al. Biodiversity increases the resistance of ecosystem productivity to climate extremes. Nature 526, 574–577, doi: 10.1038/
nature15374 (2015).39. Hector, A. et al. he Sabah Biodiversity Experiment: a long-term test of the role of tree diversity in restoring tropical forest structure
and functioning. Philosophical Transactions of the Royal Society of London B: Biological Sciences 366, 3303–3315 (2011).40. Banin, L. et al. What controls tropical forest architecture? Testing environmental, structural and loristic drivers. Global Ecology and
Biogeography 21, 1179–1190, doi: 10.1111/j.1466-8238.2012.00778.x (2012).41. Beaudrot, L. et al. Limited carbon and biodiversity co-beneits for tropical forest mammals and birds. Ecological Applications (2015).42. Draper, F. C. et al. he distribution and amount of carbon in the largest peatland complex in Amazonia. Environmental Research
Letters 9, 124017 (2014).43. Balmford, A., Gaston, K. J., Blyth, S., James, A. & Kapos, V. Global variation in terrestrial conservation costs, conservation beneits,
and unmet conservation needs. Proceedings of the National Academy of Sciences 100, 1046–1050, doi: 10.1073/pnas.0236945100 (2003).
44. Malhi, Y. et al. An international network to monitor the structure, composition and dynamics of Amazonian forests (RAINFOR). Journal of Vegetation Science 13, 439–450, doi: 10.1111/j.1654-1103.2002.tb02068.x (2002).
45. Lopez-Gonzalez, G., Lewis, S. L., Burkitt, M. & Phillips, O. L. ForestPlots.net: a web application and research tool to manage and analyse tropical forest plot data. Journal of Vegetation Science 22, 610–613, doi: 10.1111/j.1654-1103.2011.01312.x (2011).
46. Chave, J. et al. Improved allometric models to estimate the aboveground biomass of tropical trees. Global Change Biology 20, 3177–3190, doi: 10.1111/gcb.12629 (2014).
47. Chave, J. et al. Towards a worldwide wood economics spectrum. Ecology Letters 12, 351–366, doi: 10.1111/j.1461-0248.2009.01285.x (2009).
48. Zanne, A. E. et al. (Dryad Data Repository, 2009).49. Feldpausch, T. R. et al. Tree height integrated into pantropical forest biomass estimates. Biogeosciences 9, 3381–3403 (2012).50. homas, S. C. & Martin, A. R. Carbon Content of Tree Tissues: A Synthesis. Forests 3, 332–352 (2012).51. Rosseel, Y. lavaan: An R Package for Structural Equation Modeling. 2012 48, 36, doi: 10.18637/jss.v048.i02 (2012).52. Bartholomé, E. & Belward, A. S. GLC2000: a new approach to global land cover mapping from Earth observation data. International
Journal of Remote Sensing 26, 1959–1977, doi: 10.1080/01431160412331291297 (2005).53. R: A Language and Environment for Statistical Computing, R Core Team, R Foundation for Statistical Computing, Vienna, Austria
https://www.R-project.org (2016).54. Original S code by Richard A. Becker and Allan R. Wilks. R version by Ray Brownrigg. Enhancements by homas P Minka. maps:
Draw Geographical Maps. R package version 2.3-9 http://CRAN.R-project.org/package= maps (2014).

www.nature.com/scientificreports/
1 2SCIENTIFIC REPORTS 】 ぴ┺ばぶのねは 】 DOI┺ のね┻のねばふ【srepばぶのねは
Acknowledgementshis paper is a product of the RAINFOR, AfriTRON and T-FORCES networks, for which we are hugely indebted to hundreds of institutions, field assistants and local communities across many countries that have hosted ieldwork. he three networks have been supported by a European Research Council (ERC) grant (“T-FORCES” - Tropical Forests in the Changing Earth System), the Gordon and Betty Moore Foundation, the David and Lucile Packard Foundation, the European Union’s Seventh Framework Programme (283080, ‘GEOCARBON’; 282664, ‘AMAZALERT’), and Natural Environment Research Council (NERC) Urgency Grants and NERC Consortium Grants ‘AMAZONICA’ (NE/F005806/1) and ‘TROBIT’ (NE/D005590/1), ‘BIO-RED’ (NE/N012542/1) and a NERC New Investigators Grant, the Royal Society, the Centre for International Forestry (CIFOR) and Gabon’s National Parks Agency (ANPN). Additional data were included from the Tropical Ecology Assessment and Monitoring (TEAM) Network, a collaboration between Conservation International, the Missouri Botanical Garden, the Smithsonian Institution and the Wildlife Conservation Society, and partly funded by these institutions, the Gordon and Betty Moore Foundation, and other donors. J.T. was supported by a NERC PhD Studentship with CASE sponsorship from UNEP-WCMC. R.J.W.B. is funded by a NERC research fellowship (grant ref: NE/I021160/1). S.L.L. was supported by a Royal Society University Research Fellowship, ERC Advanced Grant (T-FORCES) and a Phillip Leverhulme Prize. O.L.P. is supported by an ERC Advanced Grant (T-FORCES) and a Royal Society Wolfson Research Merit Award. L.F.B. was supported by a NERC studentship and RGS-IBG Henrietta Hutton Grant. We thank the National Council for Science and Technology Development of Brazil (CNPq) for support to Project Cerrado/Amazonia Transition (PELD/403725/2012-7), Project Phytogeography of Amazonia/Cerrado Transition (CNPq/PPBio/457602/2012-0) and Productivity Grant to B.S.M and B.H.M-J. Funding for plots in the Udzungwa Mountains (Tanzania) was obtained from the Leverhulme Trust under the Valuing the Arc project. We thank the ANPN (Gabon), WCS-Congo and WCS-DR Congo, Marien Ngouabi University and the University of Kisangani for logistical support in Africa, and the Tropenbos Kalimantan project (ITCI plots) and WWF (KUB plots) for providing data from Asia. his study is contribution number 706 to the Technical Series (TS) of the BDFFP – (INPA-STRI). For assistance with access to datasets we thank Adriana Prieto, Agustín Rudas, Alejandro Araujo-Murakami, Alexander G. Parada Gutierrez, Anand Roopsind, Atila Alves de Oliveira, Claudinei Oliveira dos Santos, C. E. Timothy Paine, David Neill, Eliana Jimenez-Rojas, Freddy Ramirez Arevalo, Hannsjoerg Woell, Iêda Leão do Amaral, Irina Mendoza Polo, Isau Huamantupa-Chuquimaco, Julien Engel, Kathryn Jefery, Luzmila Arroyo, Michael D. Swaine, Nallaret Davila Cardozo, Natalino Silva, Nigel C. A. Pitman, Niro Higuchi, Raquel homas, Renske van Ek, Richard Condit, Rodolfo Vasquez Martinez, Timothy J. Killeen, Walter A. Palacios, Wendeson Castro. We thank Georgina Mace and Jon Lloyd for comments on the manuscript. We thank our deceased colleagues, Samuel Almeida, Kwaku Duah, Alwyn Gentry, and Sandra Patiño, for their invaluable contributions to this work and our wider understanding of tropical forest ecology.
Author ContributionsO.L.P., S.L.L. and Y.M. conceived the RAINFOR, AfriTRON and T-FORCES forest census network programmes. J. Talbot, O.L.P., S.L.L. and L. Miles conceived and designed the study. O.L.P., R.J.W.B., T.R.F., T.R.B., A.M.M. (South America), S.L.L., B.S., L.J.T.W., W.H., A.C.S., S.K.B., T.S. (Africa), L.Q., S.L.L., O.L.P., T.S., L.F.B. and F.S. (Asia) coordinated data collection with the help of most co-authors. G.L.G., S.L.L., O.L.P., T.R.B. and G.C.P. contributed tools to analyse and curate data. J. Talbot, S.L.L., O.L.P., L.Q., S.K.B., J.C., A.C.S., W.H., G.L.G., A.M.M., B.S., T.S., H.tS., L.J.T.W., K.A.B., S.I.A., E.C.A., A.A., L.E.O.C.A., P.A., G.A.A.C., T.R.B., M.B., L.F.B., C.B., J.F.B., N.B., J.B., D.B., F.B., R.B., N.C.P.C., J.L.C.C., C.C., E.C., C.J.C., J.A.C., E.N.H.C., Z.R.C., G.D., S.J.D., E.A.D., C.D.C., M.N.D.K., J.L.D., T.L.E., J.S.E., C.E.N.E., S.F., T.R.F., R.H., L.V.G., M.G., J.H., D.J.H., T.B.H., K.K., K.H.O.L.K., K. Kitayama, S.G.W.L., W.F.L., M.E.L., P.A.L., T.L., J.C.L., F.M.L., J.R.M., Y.M., L.M., B.S.M., B.H.M.J., A.R.M., P.S.M., V.C.M., J.T.M., J.M., R.N., E.A.O., A.C.P., G.P., M.P.C., P.P., G.C.P., A.D.P., J.R.P., R.B.P., H.P., C.A.Q., J.R., M.R.M., E.R., K.A.S., R.P.S., I.S., D.S., R.S., M.S., L.S., H.T., S.T., J.W.T., S.C.T., M.T., P.U., F.C.V., P.N.V., I.C.G.V., V.A.V., O.W., S.W. and L.Z. collected ield data. M.J.P.S. and J. Talbot carried out the data analysis, M.J.P.S., J. Talbot, O.L.P. and S.L.L. wrote the paper. All co-authors commented on or approved the manuscript.
Additional InformationSupplementary information accompanies this paper at http://www.nature.com/srep
Competing inancial interests: he authors declare no competing inancial interests.
How to cite this article: Sullivan, M. J. P. et al. Diversity and carbon storage across the tropical forest biome. Sci. Rep. 7, 39102; doi: 10.1038/srep39102 (2017).
Publisher's note: Springer Nature remains neutral with regard to jurisdictional claims in published maps and institutional ailiations.
his work is licensed under a Creative Commons Attribution 4.0 International License. he images or other third party material in this article are included in the article’s Creative Commons license,
unless indicated otherwise in the credit line; if the material is not included under the Creative Commons license, users will need to obtain permission from the license holder to reproduce the material. To view a copy of this license, visit http://creativecommons.org/licenses/by/4.0/ © he Author(s) 2017