Embed Size (px)
Citation preview
1
Diversification or Focus?
Wealth Effects of Acquisitions & Divestitures
in the Entertainment Industry
by
Kenneth Low
An honors thesis submitted in partial fulfillment
of the requirements for the degree of
Bachelor of Science
Undergraduate College
Leonard N. Stern School of Business
New York University
May 2013
Professor Marti G. Subrahmanyam Professor Kose John
Faculty Adviser Thesis Adviser
2
ABSTRACT
The US entertainment industry is dominated by media conglomerates that have
diversified their media operations through many years of corporate acquisitions.
However, past research indicates that firms which acquire highly-related businesses tend
to outperform firms which acquire poorly-related businesses, thereby suggesting that
firms benefit from focused operations. In addition, M&A trends in the entertainment
industry over the last ten years indicate that firms have moved away from poorly-related
acquisitions that diversify their business to highly-related acquisitions that focus their
operations, further fueling the discussion of the influence of business relatedness on firm
performance.
Should entertainment firms pursue diversification or focus? This thesis attempts to
identify the optimal business development and acquisition strategy for entertainment
firms today by analyzing the influence of business relatedness on wealth effects of
corporate acquisitions and divestitures in the industry. The study finds that, in the
entertainment industry, the market tends to favor highly-related acquisitions over poorly-
related acquisitions and divestitures of poorly-related assets over divestitures of highly-
related assets. Taken together, these findings suggest that the ideal business development
strategy for entertainment firms today is one that pursues operational focus.

3
ACKNOWLEDGEMENTS
I would like to acknowledge Professor Kose John, my thesis advisor, for his extremely
valuable advice and support during the research and writing process of this thesis. I
would also like to acknowledge Professor Sam Craig for his instrumental guidance and
thank him for the wonderful conversations about the entertainment industry. I would also
like to thank Professor Al Lieberman and Professor David Yermack for their advice, and
Gabriella Coiculescu for her guidance with the quantitative elements of the study. The
willingness of these amazing professors and teaching fellows to teach and engage
students was truly inspirational.
Many thanks also to Professor Marti Subrahmanyam and Jessica Rosenzweig for
developing the Senior Honors Program. Special thanks to Jessica for organizing an
amazing trip to Omaha and being a wonderful chaperone. I would also like to thank my
peers in the Honors Program for making it easier to get through those early Friday
morning classes. Last but not least, I would like to thank my family – my parents and my
sister – and my close friends for all their support throughout the years. I attribute much of
my academic success to their encouragement and advice and thank them for inspiring me
to pursue excellence.

4
TABLE OF CONTENTS
1. INTRODUCTION .................................................................................................................... 5
2. THE MEDIA INDUSTRY & ITS CONGLOMERATE NATURE ..................................... 6
2.1. Diversification – modus operandi of the Big Six media conglomerates ............................. 7
2.2. Why do media conglomerates pursue diversification?........................................................ 9
3. M&A ACTIVITY IN THE ENTERTAINMENT INDUSTRY .......................................... 11
3.1. M&A transactions – a key engine of growth in the entertainment industry ..................... 11
3.2. Why do entertainment firms actively pursue acquisitions?............................................... 12
3.3. Business relatedness as an intra-industry theme in entertainment M&A .......................... 12
3.4. Observed shift in entertainment M&A – from diversification to focus ............................ 14
4. HYPOTHESES ....................................................................................................................... 16
5. METHODOLOGY ................................................................................................................. 18
5.1. Replicating Singh & Montgomery‟s study for the entertainment industry ....................... 18
5.2. The data ............................................................................................................................. 19
6. RESEARCH FINDINGS AND DISCUSSION .................................................................... 25
6.1. Abnormal returns analysis for acquisition portfolios ........................................................ 25
6.2. Abnormal returns analysis for divestiture portfolios ......................................................... 27
6.3. Regressions analysis ......................................................................................................... 30
6.4. Summary of key findings and business implications of the study .................................... 32
7. LIMITATIONS OF THE STUDY ........................................................................................ 34
7.1. Limited data universe ........................................................................................................ 34
7.2. Assumptions in research methodology ............................................................................. 34
8. CONCLUSION ...................................................................................................................... 36

5
1. INTRODUCTION
In the last 10 years, the nature of M&A transactions in the entertainment industry has
changed significantly. From 2003-2008, most entertainment companies sought to
diversify their media operations by acquiring media businesses that were unrelated with
their core business. However, from 2009-2013, such acquisitions became rare and most
firms sought out acquisitions within their core business instead. In fact, media
conglomerates like News Corp, Time Warner and CBS have all recently announced plans
to separate their diversified businesses into more focused entities, signifying a move
towards a more focused business approach. Two opposing forces are observed in this
trend – economies of scale and potential synergies push entertainment firms to acquire
less-related businesses in order to diversify their media operations. However, past
research shows that the market favors corporate acquisitions of highly-related businesses
over acquisitions of poorly-related businesses, implying that firms in most industries
benefit from focused operations.
This thesis seeks to answer the question – which is the primary force at play in the
entertainment industry today? Diversification or focus? – by conducting a quantitative
study of the influence of business relatedness on wealth effects of M&A transactions in
the entertainment industry. I propose that, within the entertainment industry, the market
favors highly-related acquisitions over poorly-related acquisitions, thereby suggesting
that entertainment firms should focus their operations on their core business instead of
diversifying into less-related businesses. If the hypothesis is proven true, this thesis
would help explain recent M&A trends in the industry and would provide entertainment
firms with a road-map for future business development and acquisition strategies.

6
2. THE MEDIA INDUSTRY & ITS CONGLOMERATE NATURE
The media industry today is dominated by six entertainment conglomerates. These Big
Six conglomerates – Walt Disney, Comcast, News Corp, Time Warner, Viacom and CBS
– control 90% of American media (Lutz, 2012). Together, they own 70% of the cable
channels in the US. In contrast, the remaining 30% is owned by 3,762 other companies.
In 2010, the Big Six recorded film box office revenues of c.$7.0bn; comparatively, the
next 100 largest studios recorded revenues that were less than half that figure (Lutz,
2012). Figure 1 shows the relative size of the six conglomerates in relation to ten other
major players in the industry – some of which have chosen not to adopt the conglomerate
model and instead operate as pure-plays1.
Figure 1: Summary 2012 financial data of leading media companies (figures in $bn)
FY12 Revenues Assets Market Cap.
42.3 74.9 111.1
62.5 164.9 107.1
33.7 56.7 72.6
28.8 68.3 55.9
13.9 22.3 33.0
14.1 26.5 29.0
4.5 12.9 28.4
78.9 161.5 16.7
2.0 8.3 13.2
2.3 4.1 10.0
1.4 2.6 4.6
6.7 7.2 3.8
LIONSGATE 1.6 2.8 3.2
0.7 1.9 1.7
0.9 1.0 0.8
0.3 1.0 0.7
Source: Yahoo Finance
Note: denotes Big Six media conglomerates, market data as of Apr 19, 2013
1 Pure-plays include: Discovery, Scripps Networks, AMC Networks, Crown Media (cable networks); Lions Gate,
Dreamworks (film studios), The E.W. Scripps Company (publishing)
7
Walt Disney, which controls Walt Disney Studios, the ABC and ESPN television
networks, and the Disney theme parks, amongst other businesses, is the largest
entertainment conglomerate by market capitalization (c.$111bn). Comcast, which
operates cable systems in the US and controls NBC-Universal, is the largest
entertainment conglomerate by assets (c.$165bn) and revenue2 (c.$63bn). Discovery
Communications is not considered an entertainment conglomerate despite its size because
almost all of its operations is concentrated in cable networks. Sony is not considered an
entertainment conglomerate despite its size because most of its assets and revenues are
derived from its consumer products / electronics operations.
2.1. Diversification – modus operandi of the Big Six media conglomerates
The Big Six conglomerates operate under an extremely diversified business model. Each
conglomerate has substantial operations in multiple entertainment sectors. For example,
the largest conglomerate by market capitalization, Walt Disney, operates in 11 of the 14
broad entertainment segments. These include film and TV studios, broadcast and cable
networks, TV and radio broadcast, publishing, online media, video games and theme
parks. Even the smallest of the six conglomerates, CBS, operates in 9 of the 14 broad
segments. Each of the Big Six conglomerates first established itself in a single segment
but has since diversified its operations through acquisitions and organic business
expansion. Figure 2 details the presence of the Big Six conglomerates in each of the 14
broad entertainment sectors. Figure 3 identifies the major entertainment brands and
businesses controlled by the Big Six conglomerates.
2 For FY2012

8
Figure 2: Presence in various entertainment segments – Big Six conglomerates
Original
competency
Film
studios
Cable
systems
Newspapers
Film
studios
Cable
networks
TV
Broadcast
Film studios 4 4 4 4 4 4
TV studios 4 4 4 4 4 4
TV networks 4 4 4 4 4
Cable networks 4 4 4 4 4 2
TV broadcast 4 4 4
Radio 2 1 4
Cable systems 4 2
Newspapers 4
Publishing 2 4 4 3
Online media 2 1 4 4 2 2
e-Commerce 2 1 3
Video games 2 1
Outdoor 2 4
Theme parks 4 4
Source: Knee, Greenwald, and Seave, 2009
Note: 4 indicates a strong presence, no circle indicates no / minimal presence
Figure 3: Controlled media brands and businesses3 - Big Six conglomerates
Conglomerate Controlled media brands and businesses
Source: Latest company filings
3 In June 2012, News Corporation announced plans to spin-off its publishing assets from its filmed entertainment
assets. In March 2013, Time Warner announced similar plans.
9
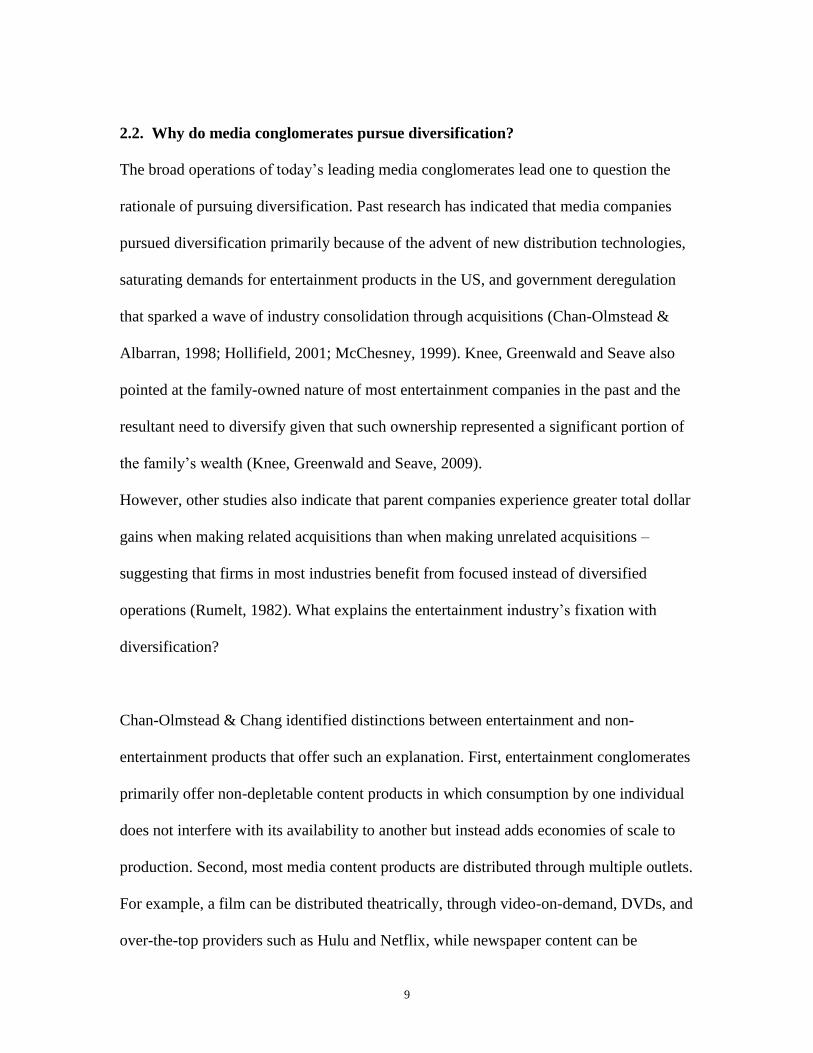
2.2. Why do media conglomerates pursue diversification?
The broad operations of today‟s leading media conglomerates lead one to question the
rationale of pursuing diversification. Past research has indicated that media companies
pursued diversification primarily because of the advent of new distribution technologies,
saturating demands for entertainment products in the US, and government deregulation
that sparked a wave of industry consolidation through acquisitions (Chan-Olmstead &
Albarran, 1998; Hollifield, 2001; McChesney, 1999). Knee, Greenwald and Seave also
pointed at the family-owned nature of most entertainment companies in the past and the
resultant need to diversify given that such ownership represented a significant portion of
the family‟s wealth (Knee, Greenwald and Seave, 2009).
However, other studies also indicate that parent companies experience greater total dollar
gains when making related acquisitions than when making unrelated acquisitions –
suggesting that firms in most industries benefit from focused instead of diversified
operations (Rumelt, 1982). What explains the entertainment industry‟s fixation with
diversification?
Chan-Olmstead & Chang identified distinctions between entertainment and non-
entertainment products that offer such an explanation. First, entertainment conglomerates
primarily offer non-depletable content products in which consumption by one individual
does not interfere with its availability to another but instead adds economies of scale to
production. Second, most media content products are distributed through multiple outlets.
For example, a film can be distributed theatrically, through video-on-demand, DVDs, and
over-the-top providers such as Hulu and Netflix, while newspaper content can be
10
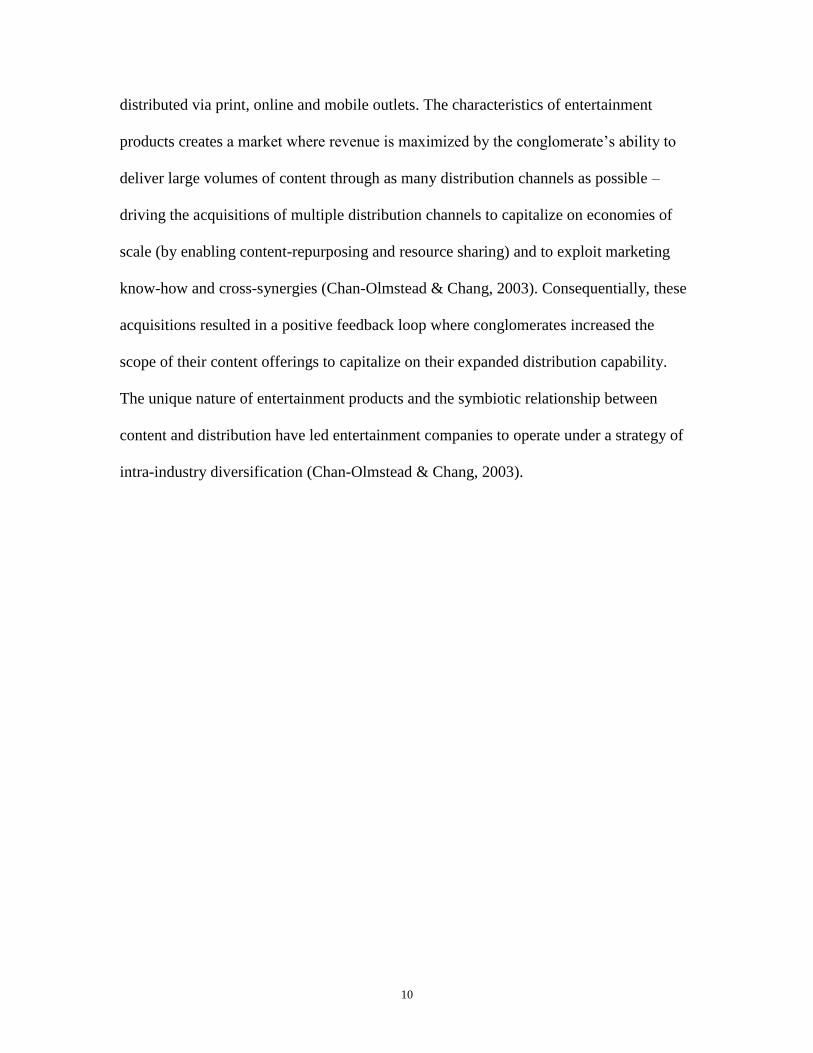
distributed via print, online and mobile outlets. The characteristics of entertainment
products creates a market where revenue is maximized by the conglomerate‟s ability to
deliver large volumes of content through as many distribution channels as possible –
driving the acquisitions of multiple distribution channels to capitalize on economies of
scale (by enabling content-repurposing and resource sharing) and to exploit marketing
know-how and cross-synergies (Chan-Olmstead & Chang, 2003). Consequentially, these
acquisitions resulted in a positive feedback loop where conglomerates increased the
scope of their content offerings to capitalize on their expanded distribution capability.
The unique nature of entertainment products and the symbiotic relationship between
content and distribution have led entertainment companies to operate under a strategy of
intra-industry diversification (Chan-Olmstead & Chang, 2003).
11
3. M&A ACTIVITY IN THE ENTERTAINMENT INDUSTRY
3.1. M&A transactions – a key engine of growth in the entertainment industry
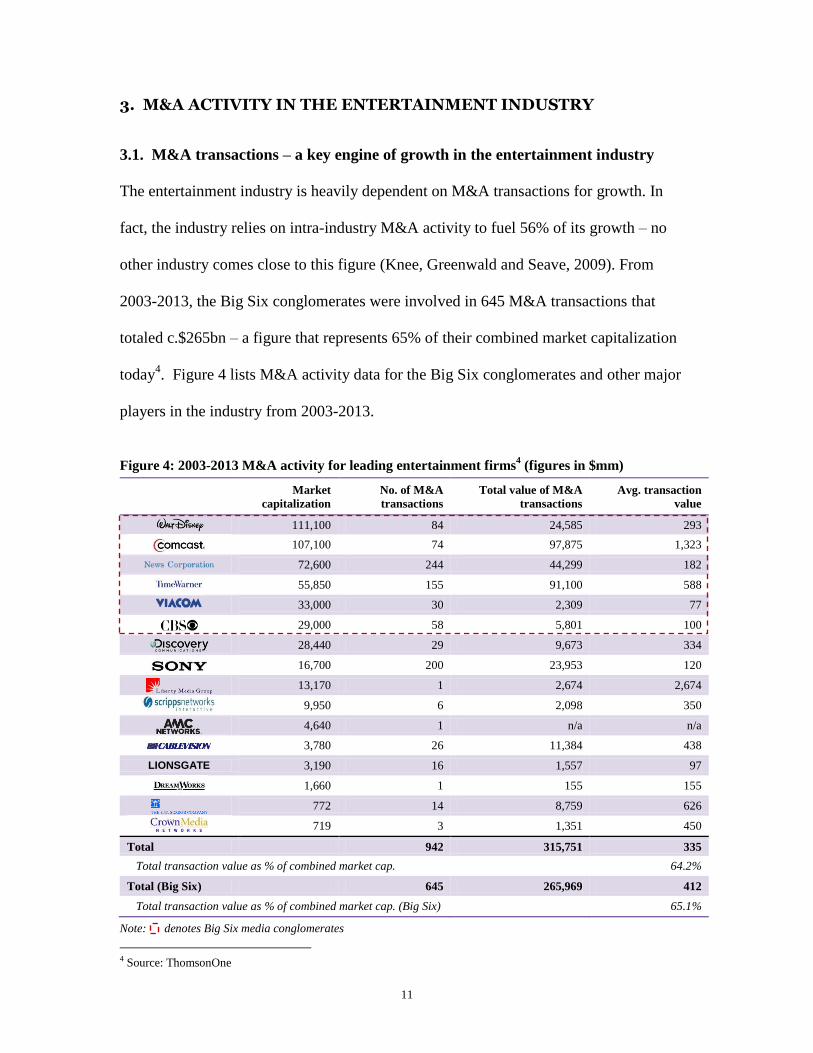
The entertainment industry is heavily dependent on M&A transactions for growth. In
fact, the industry relies on intra-industry M&A activity to fuel 56% of its growth – no
other industry comes close to this figure (Knee, Greenwald and Seave, 2009). From
2003-2013, the Big Six conglomerates were involved in 645 M&A transactions that
totaled c.$265bn – a figure that represents 65% of their combined market capitalization
today4. Figure 4 lists M&A activity data for the Big Six conglomerates and other major
players in the industry from 2003-2013.
Figure 4: 2003-2013 M&A activity for leading entertainment firms
4 (figures in $mm)
Market
capitalization
No. of M&A
transactions
Total value of M&A
transactions
Avg. transaction
value
111,100 84 24,585 293
107,100 74 97,875 1,323
72,600 244 44,299 182
55,850 155 91,100 588
33,000 30 2,309 77
29,000 58 5,801 100
28,440 29 9,673 334
16,700 200 23,953 120
13,170 1 2,674 2,674
9,950 6 2,098 350
4,640 1 n/a n/a
3,780 26 11,384 438
LIONSGATE 3,190 16 1,557 97
1,660 1 155 155
772 14 8,759 626
719 3 1,351 450
Total 942 315,751 335
Total transaction value as % of combined market cap. 64.2%
Total (Big Six) 645 265,969 412
Total transaction value as % of combined market cap. (Big Six) 65.1%
Note: denotes Big Six media conglomerates
4 Source: ThomsonOne
12
3.2. Why do entertainment firms actively pursue acquisitions?
The heavy reliance on M&A activity, instead of organic business expansion, as a source
of growth is particular evident in the entertainment industry because of industry-specific
difficulties such as creating popular content, acquiring subscribers and distribution
networks, and establishing a presence in an already crowded competitive landscape
(Knee, Greenwald and Seave, 2009). In fact, recent research indicates that M&A activity
within the entertainment industry is likely to remain robust in the future. Entertainment
companies have established themselves as front-runners in terms of pursuing deals, joint
ventures and strategic alliances in order to achieve business growth; consequentially,
entertainment M&A activity is projected to continue growing over the next few years
(Pricewaterhouse Coopers).
3.3. Business relatedness as an intra-industry theme in entertainment M&A
There has been significant research regarding the influence of business relatedness in
corporate acquisitions on future firm performance. Rumelt found that firms which
adopted a strategy of diversifying into areas that drew on existing core competencies
outperformed firms which followed a strategy of diversification into unrelated businesses
(Rumelt, 1982). Similarly, Singh & Montgomery found that firms which acquired related
businesses realized greater percentage stock gains on the day of the acquisition
announcement than firms which acquired unrelated businesses (Singh & Montgomery,
1987). These trends are well-explained by the concept of economies of scope.
Economies of scope arise when “a given bundle of resources are used in the joint

13
production of two or more products” and are usually found in acquisitions of related
businesses (Singh & Montgomery, 1987). Past studies point towards the economies of
scope in related acquisitions and the resulting greater efficiency in the utilization of
indivisible shared resources as the primary reason why firms which engage in related
acquisitions outperform firms which engage in unrelated acquisitions (Rumelt, 1982;
Singh & Montgomery, 1987).
Like much of the existing literature, Rumelt, Singh & Montgomery analyzed inter-
industry business relatedness and its effect on firm performance. However, the
entertainment industry, the sole industry of focus in this thesis, lends itself to an intra-
industry study of business relatedness. Given the multiple sectors within the industry, the
conglomerate nature of the major firms, and the large volume of M&A transactions, one
could study the effects of intra-industry business relatedness on firm performance by
analyzing the wealth effects that occur upon the announcement of media M&A
transactions with different degrees of business relatedness. For example, an acquisition of
a cable television network by a cable systems operator would be viewed as a more
highly-related acquisition than an acquisition of a publishing company by the same cable
operator. Similarly, an acquisition of a film studio by an entertainment conglomerate with
most of its operations in film production is arguably a more highly-related acquisition
than if the same conglomerate were to acquire a radio broadcaster.
Past research from Rumelt, Singh, and Montgomery suggests that highly-related
acquisitions benefit entertainment firms more than poorly-related acquisitions –
suggesting that these companies should adopt a strategy of acquiring highly-related
businesses in order to achieve operational focus.
14
3.4. Observed shift in entertainment M&A – from diversification to focus
Thus far, this thesis has explored the various reasons behind an entertainment company‟s
strategic decision to either diversify or focus its operations. Historically, entertainment
companies have engaged in both highly-related acquisitions (thereby achieving
operational focus) and poorly-related intra-industry acquisitions (thereby achieving
operational diversification). However, in the last ten years, there has been a marked shift
in entertainment M&A trends. From 2003-2008, the major entertainment companies
primarily made acquisitions of businesses that were poorly-related to their core business.
However, since 2009, these poorly-related acquisitions have become rare and firms have
primarily made acquisitions of highly-related businesses instead. Figure 5 depicts this
shift in M&A acquisition strategy in the industry.
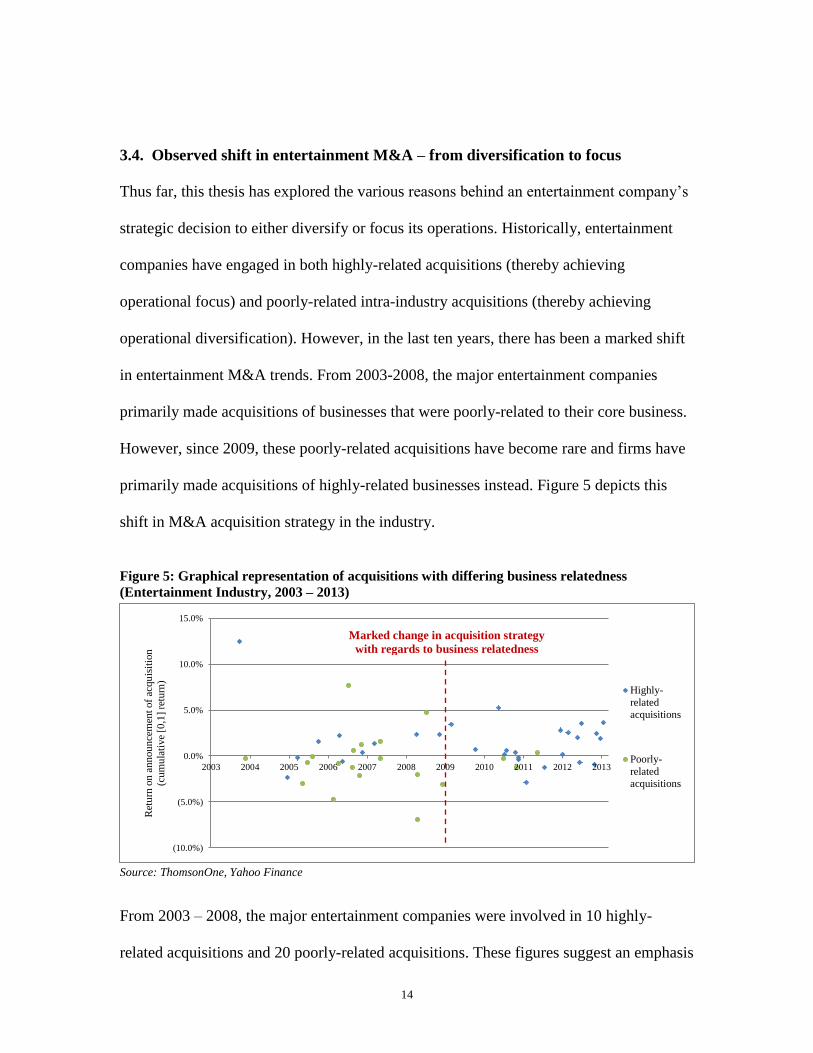
Figure 5: Graphical representation of acquisitions with differing business relatedness
(Entertainment Industry, 2003 – 2013)
Source: ThomsonOne, Yahoo Finance
From 2003 – 2008, the major entertainment companies were involved in 10 highly-
related acquisitions and 20 poorly-related acquisitions. These figures suggest an emphasis
(10.0%)
(5.0%)
0.0%
5.0%
10.0%
15.0%
2003 2004 2005 2006 2007 2008 2009 2010 2011 2012 2013
Ret
urn
on
an
nou
nce
men
t of
acq
uis
itio
n
(cu
mu
lati
ve
[0,1
] re
turn
)
Highly-
relatedacquisitions
Poorly-
relatedacquisitions
Marked change in acquisition strategy
with regards to business relatedness

15
on diversified operations through the acquisitions of less-related businesses. However,
since 2009, the number of highly-related acquisitions has doubled to 20, while the
number of poorly-related acquisitions had fallen significantly to just four. This
pronounced shift in acquisition strategy suggests that entertainment companies have
placed a greater emphasis on achieving operational focus and as a result have moved
away from poorly-related acquisitions which diversify their operations.

16
4. HYPOTHESES
In this study of intra-industry business relatedness and its influence on wealth effects of
entertainment M&A transactions, three hypotheses were formulated.
Hypothesis #1: In the entertainment industry, the market favors acquisitions of highly-
related businesses over those of poorly-related businesses.
Past research indicates that firms with acquisition strategies that pursue operational focus
outperform those with acquisition strategies that pursue operational diversification
(Rumelt, 1982; Singh & Montgomery 1987). This trend is primarily due to the economies
of scope that are present in related businesses. An extension of this argument can be
applied to the various sectors within the entertainment industry. Entertainment firms that
acquire highly-related media businesses should outperform other entertainment firms that
acquire poorly-related media businesses. This outperformance would ostensibly be
captured in the wealth effects of announced acquisitions; and entertainment firms which
make highly-related acquisitions should experience a greater return to their stock upon
the acquisition announcement than firms which make poorly-related acquisitions.
Hypothesis #2: Entertainment companies should adopt an acquisition strategy that
pursues operational focus instead of diversification.
This second hypothesis is an extension of Hypothesis #1. Assuming that maximizing
shareholder value is the primary incentive of entertainment firms, then these companies
ought to pursue operational focus through highly-related corporate acquisitions in order
to benefit from the greater wealth effects. Similarly, companies ought to avoid
diversifying their operations through poorly-related acquisitions given that such
17
transactions result in smaller wealth effects. Earlier, this thesis identified two opposing
business strategies in the entertainment industry – diversification or focus – and asked
which strategy was more beneficial. Testing Hypothesis #2 serves to answer this question
and provides a road-map for business development at entertainment firms.
Hypothesis #3: In the entertainment industry, the market favors divestitures of poorly-
related assets over those of highly-related assets.
The final hypothesis is a corollary of Hypothesis #1 and #2. Firms which divest poorly-
related assets have been found to increase their operational focus (John & Ofek, 1995). If
entertainment companies ought to pursue operational focus through highly-related
acquisitions because of the greater wealth effects, then the opposite relationship should
hold true in divestitures within the industry. Entertainment companies which divest
poorly-related assets (hence, achieving greater operational focus for its core business)
should experience greater wealth effects upon the transaction announcement than
companies which divest highly-related assets.
18
5. METHODOLOGY
The methodology used in this study involves grouping historical entertainment industry
M&A transactions into various portfolios based on the relatedness of the business
acquired / divested with the company‟s existing operations, and computing abnormal
stock returns around the transaction announcement to determine wealth effects.
Subsequently, an analysis of the wealth effects of the various portfolios reveals the
influence of M&A business relatedness on firm performance.
5.1. Replicating Singh & Montgomery’s study for the entertainment industry
Singh & Montgomery studied the effects of acquisition strategies on the firm‟s economic
performance by analyzing abnormal returns on the parent company‟s stock around the
announcement of acquisitions. The data set in their study included 105 acquisitions
across various industries of deal value greater than $100mm from 1975-1980. The
methodology adopted in this study essentially replicates Singh & Montgomery‟s study
with four major modifications. First, only M&A transactions within the entertainment
industry are considered in order to conduct the intra-industry analysis that this study
proposes. Second, in addition to acquisitions, divestitures are also analyzed in an effort to
test the corollary hypothesis regarding divestitures and business relatedness (Hypothesis
#3). Third, the data set is updated to include transactions from 2003-2013 in order to
study the industry‟s recent change in M&A activity. Fourth, a new classification of
business relatedness was devised to suit the needs of this intra-industry study.
19
5.2. The data
Creating the data universe
The data set in this study includes 131 M&A transactions (80 acquisitions, 51
divestitures) of deal value greater than $100mm from 2003-20135. These transactions
involved 14 major companies in the industry, including the Big Six conglomerates6.
16 companies were initially selected to populate the data universe – the Big Six
conglomerates and the next 10 major firms in the entertainment industry (see Figure 1).
From this list of 16 companies, Sony Corporation and Liberty Media were excluded7.
Expanding the data set to include other major entertainment firms apart from the Big Six
provides for a more unbiased sample since a number of these other companies operate as
pure-plays and have not traditionally pursued acquisition strategies that emphasized
operational diversification. The list of 131 transactions encompasses all acquisitions and
divestitures regardless of the acquired / divested stake. The list of transactions for each
company was obtained from ThomsonOne, an industry-leading online M&A database.
Figure 6 lists the 14 entertainment companies included in the data set and the number of
M&A transactions for each company.
5 Transactions from 2013 include those announced prior to March 2013 6 The Big Six conglomerates were involved in 104 of the 131 transactions 7 Sony Corporation is primarily an entertainment / consumer product company and majority of its M&A transactions
related to deals with other consumer product companies – these were deemed irrelevant for the study. Liberty Media is
a highly diversified holding company for investments in entertainment companies. However, information about its
historical M&A transaction activity was not available
20
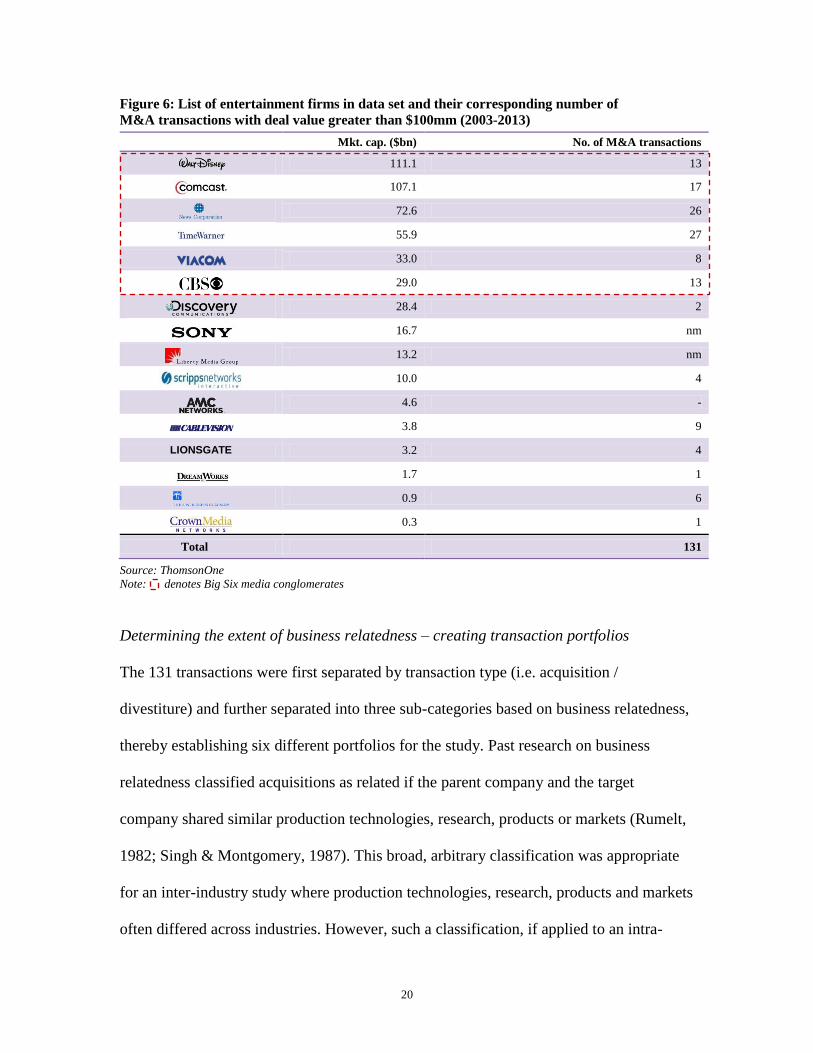
Figure 6: List of entertainment firms in data set and their corresponding number of
M&A transactions with deal value greater than $100mm (2003-2013)
Mkt. cap. ($bn) No. of M&A transactions
111.1 13
107.1 17
72.6 26
55.9 27
33.0 8
29.0 13
28.4 2
16.7 nm
13.2 nm
10.0 4
4.6 -
3.8 9
LIONSGATE 3.2 4
1.7 1
0.9 6
0.3 1
Total 131
Source: ThomsonOne
Note: denotes Big Six media conglomerates
Determining the extent of business relatedness – creating transaction portfolios
The 131 transactions were first separated by transaction type (i.e. acquisition /
divestiture) and further separated into three sub-categories based on business relatedness,
thereby establishing six different portfolios for the study. Past research on business
relatedness classified acquisitions as related if the parent company and the target
company shared similar production technologies, research, products or markets (Rumelt,
1982; Singh & Montgomery, 1987). This broad, arbitrary classification was appropriate
for an inter-industry study where production technologies, research, products and markets
often differed across industries. However, such a classification, if applied to an intra-
21
industry study would ostensibly result in almost all transactions being classified as
related, and hence is inappropriate for this study.
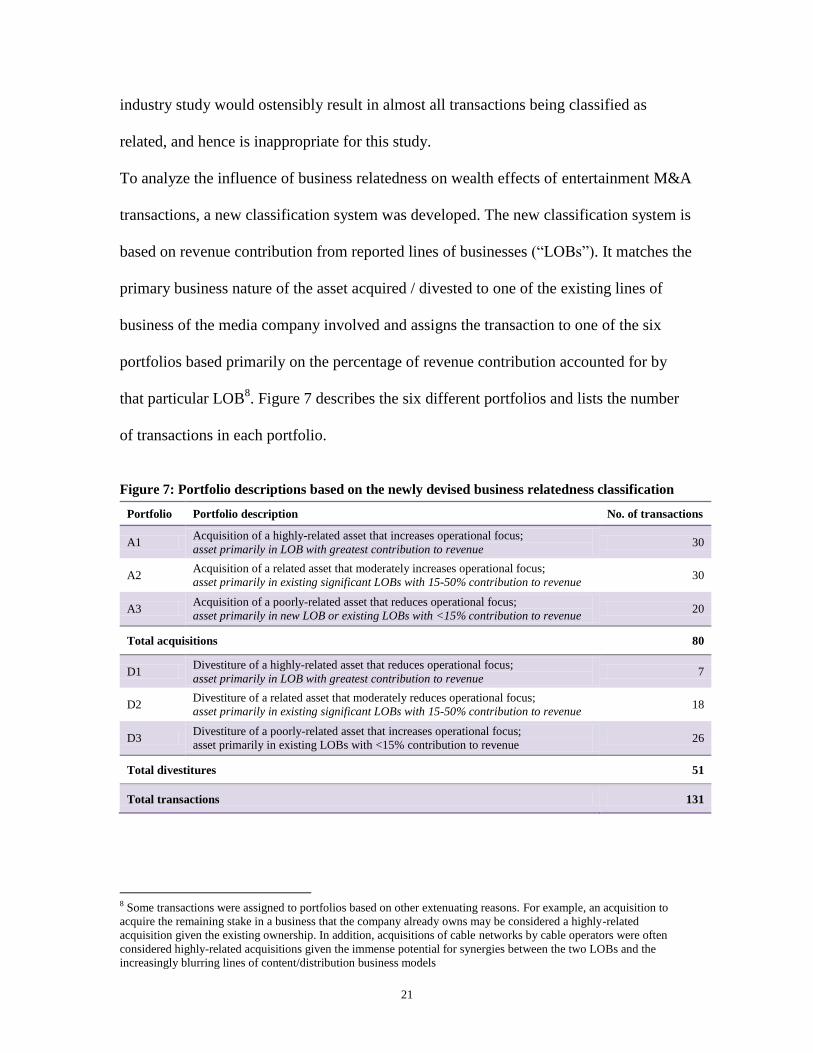
To analyze the influence of business relatedness on wealth effects of entertainment M&A
transactions, a new classification system was developed. The new classification system is
based on revenue contribution from reported lines of businesses (“LOBs”). It matches the
primary business nature of the asset acquired / divested to one of the existing lines of
business of the media company involved and assigns the transaction to one of the six
portfolios based primarily on the percentage of revenue contribution accounted for by
that particular LOB8. Figure 7 describes the six different portfolios and lists the number
of transactions in each portfolio.
Figure 7: Portfolio descriptions based on the newly devised business relatedness classification
Portfolio Portfolio description No. of transactions
A1 Acquisition of a highly-related asset that increases operational focus;
asset primarily in LOB with greatest contribution to revenue 30
A2 Acquisition of a related asset that moderately increases operational focus;
asset primarily in existing significant LOBs with 15-50% contribution to revenue 30
A3 Acquisition of a poorly-related asset that reduces operational focus;
asset primarily in new LOB or existing LOBs with <15% contribution to revenue 20
Total acquisitions 80
D1 Divestiture of a highly-related asset that reduces operational focus;
asset primarily in LOB with greatest contribution to revenue 7
D2 Divestiture of a related asset that moderately reduces operational focus;
asset primarily in existing significant LOBs with 15-50% contribution to revenue 18
D3 Divestiture of a poorly-related asset that increases operational focus;
asset primarily in existing LOBs with <15% contribution to revenue 26
Total divestitures 51
Total transactions 131
8 Some transactions were assigned to portfolios based on other extenuating reasons. For example, an acquisition to
acquire the remaining stake in a business that the company already owns may be considered a highly-related
acquisition given the existing ownership. In addition, acquisitions of cable networks by cable operators were often
considered highly-related acquisitions given the immense potential for synergies between the two LOBs and the
increasingly blurring lines of content/distribution business models

22
LOB revenue contribution was selected as the classification criteria because of three
primary reasons. First, it provides a quantifiable measure of a company‟s existing
operations in the various entertainment segments, thereby providing an accurate
assessment of the relatedness of the acquired / divested asset to the company‟s core
business. Second, the information was readily available in 10K disclosures for all the
companies in the data set. Other operating metrics such as EBITDA or operating income
were considered but these were not disclosed on a segmented basis across all the
companies. Finally, most companies reported LOB segments in a manner that was
detailed enough for the scope of this study. The decision to split both acquisitions and
divestitures into three separate sub-portfolios (instead of two portfolios as was commonly
done in past studies) was made in order to increase the granularity of the results. In
addition, creating a third portfolio allows „borderline‟ transactions to be grouped in the
middle portfolio (i.e. A2 and D2), thereby strengthening the contrast between the results
observed in the extreme portfolios (i.e. A1 vs. A3, D1 vs. D3).
An example of the classification process for a transaction is as follows. On 10 July 2012,
Disney announced its acquisition of A&E Television Networks – a basic cable network.
Disney‟s FY2011 10K (the latest available 10K disclosure prior to this announcement)
indicated that TV Programming & Broadcast, the segment that A&E‟s revenues would be
reported under post-acquisition, contributed 45.8% of Disney‟s revenues that year. Given
that this LOB segment was Disney‟s largest revenue contributor that year, the transaction
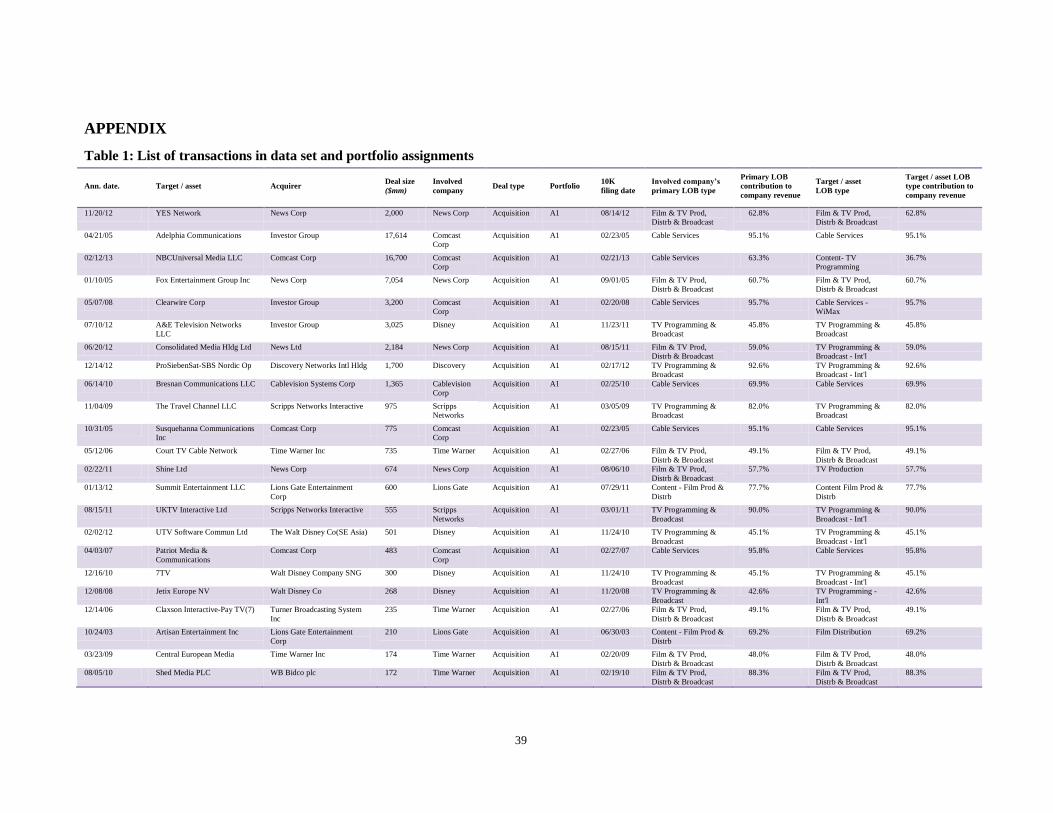
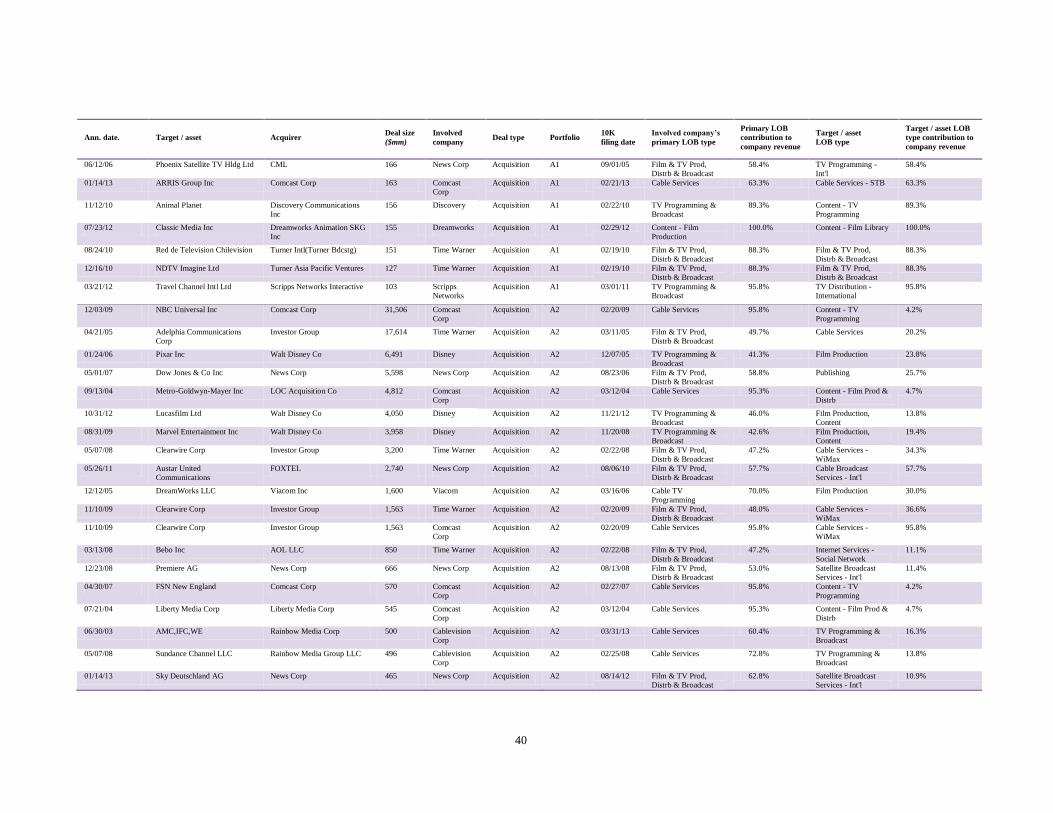
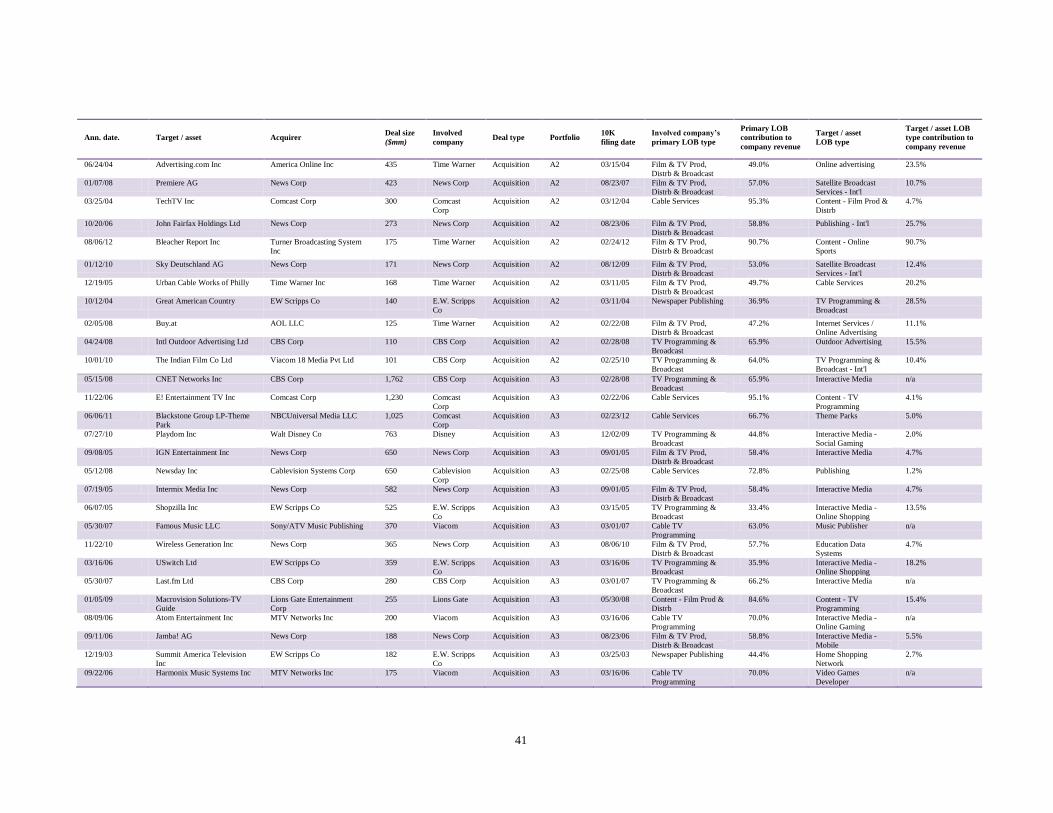
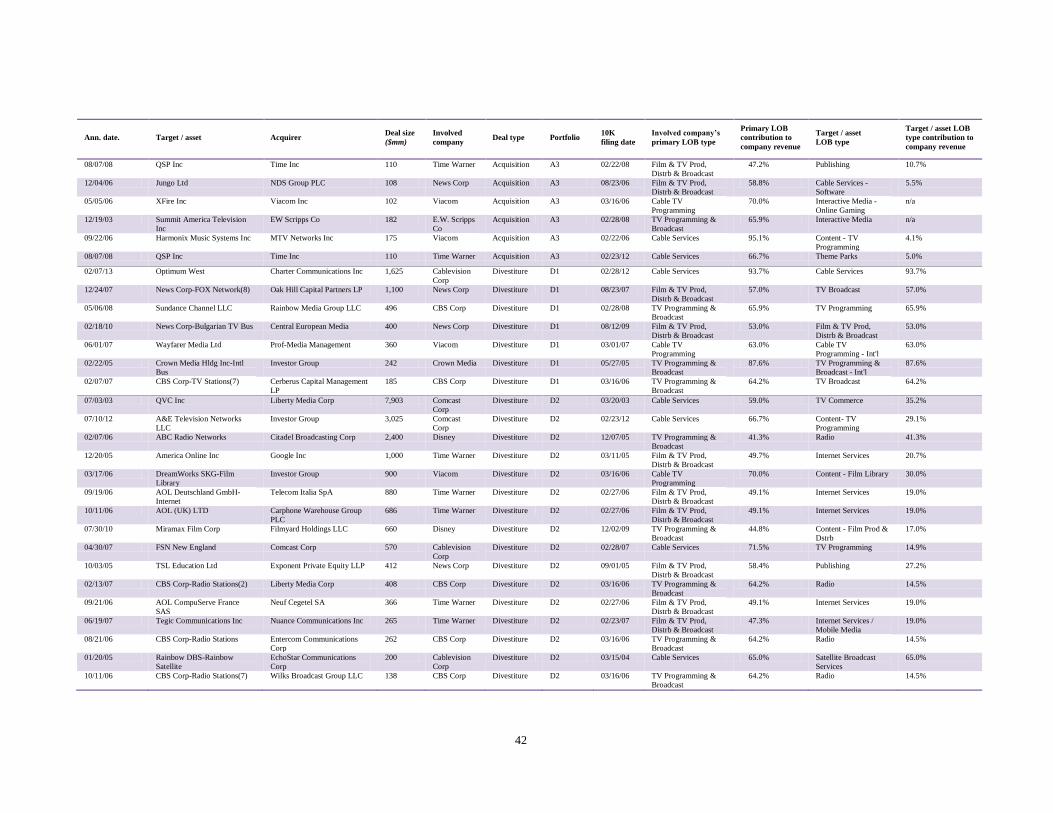
was assigned to portfolio A19. For a full list of the portfolio assignments for each of the
131 transactions, please refer to Table 1 in the Appendix.
9 Portfolio description: acquisition of a highly-related asset that increases operational focus; asset primarily in LOB
with greatest contribution to revenue.

23
Computing abnormal returns for each portfolio
Abnormal stock returns were computed for each transaction around the announcement
date for the trading window [-5, 5]10
. Daily stock returns for each of the 14 companies in
the data set were first obtained from Yahoo Finance and daily abnormal returns were
computed using the following formula:
DARi,t = DRi,t – DRS&P500,t
where:
DARi,t = daily percentage abnormal return for company i on trading day t
DRi,t = daily return for company i on trading day t
DR S&P500,t = daily return for the S&P500 index on trading day t
The [-5,5] trading window was selected to account for possible information leaks about
the transaction in the days prior to the announcement date. The S&P500 index was
selected as the benchmark market index with which the daily stock returns were
compared against to determine abnormal returns that exceeded the market. The daily
abnormal return for each portfolio was then computed by taking the average of the daily
abnormal returns of all the transactions in the portfolio. Daily abnormal returns for each
portfolio were then tested for statistical significance with particular attention paid to the
[-1,1]11
trading window. This window was chosen as the key indicative timeframe
because abnormal returns experienced immediately after the announcement date are
likely to be entirely related to the transaction announcement
10 Implies a trading window of five trading days before and after the announcement date 11 Implies a 3-day trading window of the trading day before the announcement, the announcement date and the trading
day after the announcement

24
Regressions analysis
A regression of cumulative returns from the [0,1]12
trading window was performed to
analyze the influence of three different factors on the abnormal stock returns observed in
the study. The three different factors are business relatedness, acquirer / parent company
size, and the transaction size relative to the acquirer / parent company size.
The regression was performed with the following formula:
Cumulative abnormal return [0,1] = Intercept
+ ß1*(Relatedness index)
+ ß2*(Log. acquirer assets)
+ ß3*(Deal size / acquirer assets)
A simple linear, 3-variable business relatedness index was created for the purpose of this
study. The greater the extent of business relatedness between 1) the acquirer and target
business; or 2) between the parent company and divested assets, the lower the index
score. Highly-related acquisitions and divestitures were assigned a score of 1,
moderately-related transactions were assigned a score of 2, and poorly-related
transactions were assigned a score of 3.
12 Implies a 2-day trading window of the announcement date and the trading day after the announcement
25
6. RESEARCH FINDINGS AND DISCUSSION
6.1. Abnormal returns analysis for acquisition portfolios
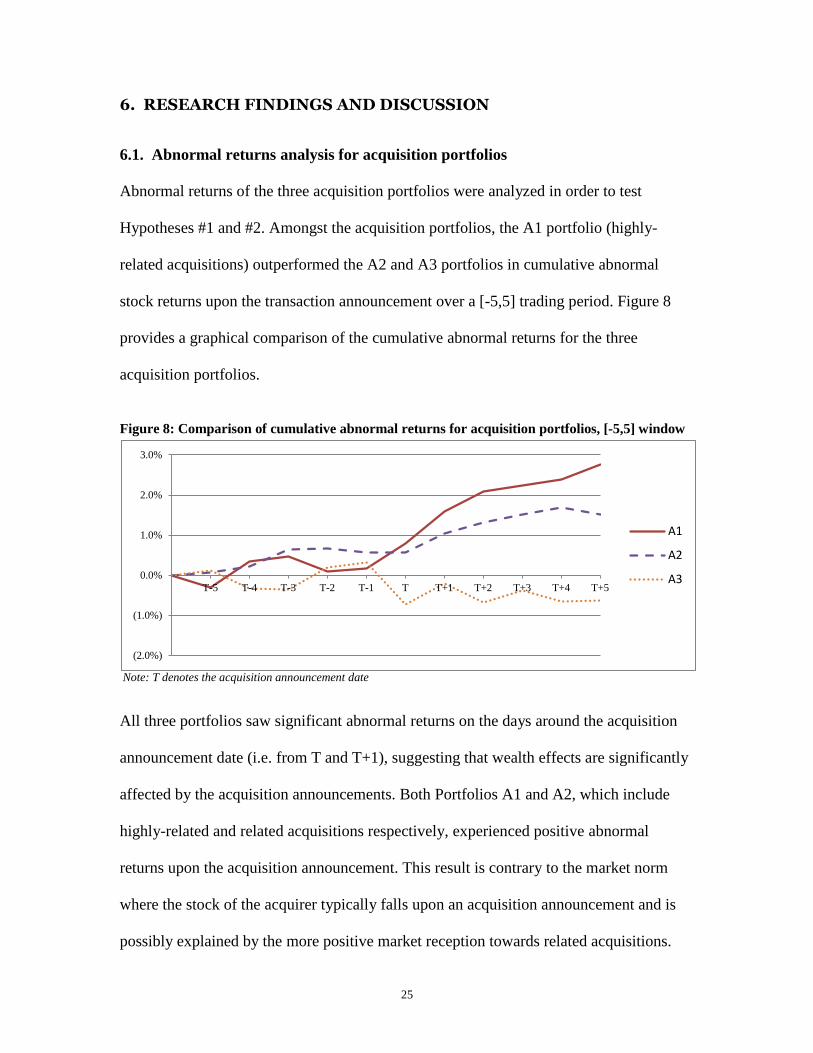
Abnormal returns of the three acquisition portfolios were analyzed in order to test
Hypotheses #1 and #2. Amongst the acquisition portfolios, the A1 portfolio (highly-
related acquisitions) outperformed the A2 and A3 portfolios in cumulative abnormal
stock returns upon the transaction announcement over a [-5,5] trading period. Figure 8
provides a graphical comparison of the cumulative abnormal returns for the three
acquisition portfolios.
Figure 8: Comparison of cumulative abnormal returns for acquisition portfolios, [-5,5] window
Note: T denotes the acquisition announcement date
All three portfolios saw significant abnormal returns on the days around the acquisition
announcement date (i.e. from T and T+1), suggesting that wealth effects are significantly
affected by the acquisition announcements. Both Portfolios A1 and A2, which include
highly-related and related acquisitions respectively, experienced positive abnormal
returns upon the acquisition announcement. This result is contrary to the market norm
where the stock of the acquirer typically falls upon an acquisition announcement and is
possibly explained by the more positive market reception towards related acquisitions.
(2.0%)
(1.0%)
0.0%
1.0%
2.0%
3.0%
T-5 T-4 T-3 T-2 T-1 T T+1 T+2 T+3 T+4 T+5
A1
A2
A3

26
The A3 portfolio, which includes poorly-related acquisitions, experienced negative
abnormal returns upon the acquisition announcement. These findings support Hypothesis
#1 – that in the entertainment industry, the market favors highly-related acquisitions over
poorly-related acquisitions. Extending these findings also provides support for
Hypothesis #2 – that entertainment companies should pursue operational focus instead of
diversification by acquiring highly-related businesses.
To validate these findings, the returns were tested for statistical significance. Special
attention was paid to four categories of abnormal returns – the daily returns of T-1, T and
T+113
and the cumulative returns of T & T+1. These four categories indicate abnormal
returns on the days immediately surrounding the announcement. Figure 9 presents the
statistical significance analysis for the abnormal returns experienced by each acquisition
portfolio for the four returns categories. For a full statistical significance analysis of the
abnormal returns in the [-5,5] trading window, please refer to Table 2 in the Appendix.
Figure 9: Statistical significance analysis for abnormal returns of acquisition portfolios
T-1
T
T+1
T&T+1
A1 PORTFOLIO (highly-related acquisitions that increase operational focus)
Average return 0.06% 0.63% 0.80% 1.43%
t-statistic 0.449 1.943 1.766 2.803
Confidence level 90% 90% 95%
A2 PORTFOLIO (related acquisitions that moderately increase operational focus)
Average return (0.07%) (0.02%) 0.48% 0.46%
t-statistic -0.378 -0.050 2.165 0.963
Confidence level 95%
A3 PORTFOLIO (poorly-related acquisitions that reduce operational focus)
Average return 0.12% (1.04%) 0.51% (0.52%)
t-statistic 0.568 -3.280 0.926 -0.757
Confidence level 95%
Note: Only confidence levels >90% are indicated
13 T indicates the transaction announcement date
Daily returns [0,1] Cumulative returns

27
Figure 9 indicates the average daily / cumulative return for various days and the
corresponding t-statistic and confidence level. The statistical significance analysis
indicates that the abnormal returns experienced by each acquisition portfolio in the days
surrounding the transaction announcement were statistically significant. In each portfolio,
at least one of the four abnormal return categories was statistically significant at a 95%
confidence level.
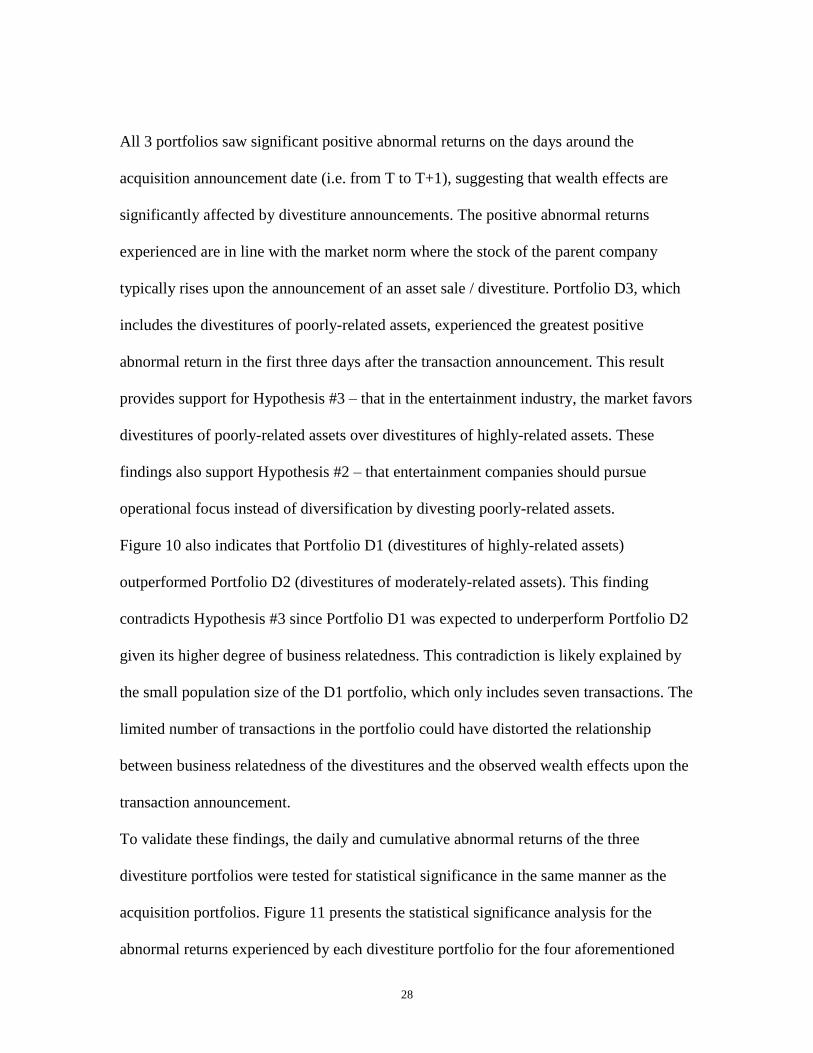
6.2. Abnormal returns analysis for divestiture portfolios
Abnormal returns / wealth effects of the three divestiture portfolios were analyzed in
order to test Hypothesis #3. The D3 portfolio (divestitures of poorly-related assets)
outperformed the D1 and D2 portfolios in cumulative abnormal returns in the first three
days immediately after the announcement of the divestiture. Figure 10 provides a
graphical comparison of the cumulative abnormal returns for the three divestiture
portfolios.
Figure 10: Comparison of cumulative abnormal returns for divestiture portfolios, [-5,5] window
(1.0%)
0.0%
1.0%
2.0%
3.0%
4.0%
T-5 T-4 T-3 T-2 T-1 T T+1 T+2 T+3 T+4 T+5
D1
D2
D3
28
All 3 portfolios saw significant positive abnormal returns on the days around the
acquisition announcement date (i.e. from T to T+1), suggesting that wealth effects are
significantly affected by divestiture announcements. The positive abnormal returns
experienced are in line with the market norm where the stock of the parent company
typically rises upon the announcement of an asset sale / divestiture. Portfolio D3, which
includes the divestitures of poorly-related assets, experienced the greatest positive
abnormal return in the first three days after the transaction announcement. This result
provides support for Hypothesis #3 – that in the entertainment industry, the market favors
divestitures of poorly-related assets over divestitures of highly-related assets. These
findings also support Hypothesis #2 – that entertainment companies should pursue
operational focus instead of diversification by divesting poorly-related assets.
Figure 10 also indicates that Portfolio D1 (divestitures of highly-related assets)
outperformed Portfolio D2 (divestitures of moderately-related assets). This finding
contradicts Hypothesis #3 since Portfolio D1 was expected to underperform Portfolio D2
given its higher degree of business relatedness. This contradiction is likely explained by
the small population size of the D1 portfolio, which only includes seven transactions. The
limited number of transactions in the portfolio could have distorted the relationship
between business relatedness of the divestitures and the observed wealth effects upon the
transaction announcement.
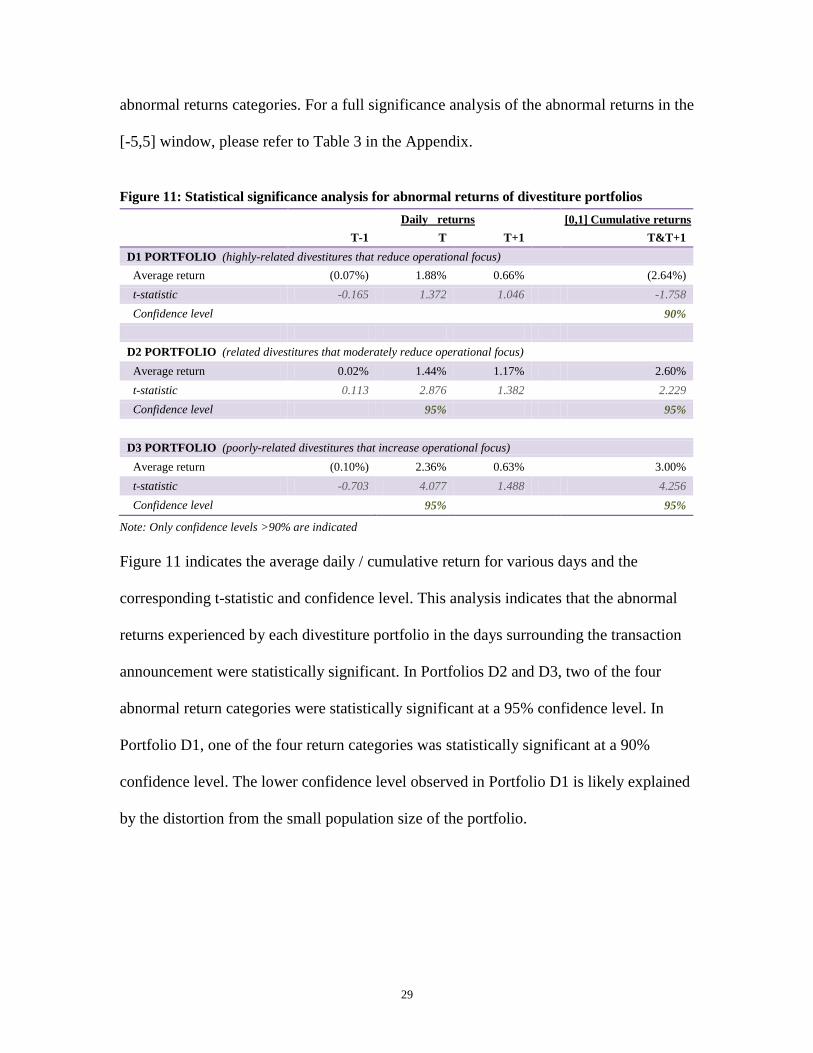
To validate these findings, the daily and cumulative abnormal returns of the three
divestiture portfolios were tested for statistical significance in the same manner as the
acquisition portfolios. Figure 11 presents the statistical significance analysis for the
abnormal returns experienced by each divestiture portfolio for the four aforementioned
29
abnormal returns categories. For a full significance analysis of the abnormal returns in the
[-5,5] window, please refer to Table 3 in the Appendix.
Figure 11: Statistical significance analysis for abnormal returns of divestiture portfolios
T-1
T
T+1
T&T+1
D1 PORTFOLIO (highly-related divestitures that reduce operational focus)
Average return (0.07%) 1.88% 0.66% (2.64%)
t-statistic -0.165 1.372 1.046 -1.758
Confidence level 90%
D2 PORTFOLIO (related divestitures that moderately reduce operational focus)
Average return 0.02% 1.44% 1.17% 2.60%
t-statistic 0.113 2.876 1.382 2.229
Confidence level 95% 95%
D3 PORTFOLIO (poorly-related divestitures that increase operational focus)
Average return (0.10%) 2.36% 0.63% 3.00%
t-statistic -0.703 4.077 1.488 4.256
Confidence level 95% 95%
Note: Only confidence levels >90% are indicated
Figure 11 indicates the average daily / cumulative return for various days and the
corresponding t-statistic and confidence level. This analysis indicates that the abnormal
returns experienced by each divestiture portfolio in the days surrounding the transaction
announcement were statistically significant. In Portfolios D2 and D3, two of the four
abnormal return categories were statistically significant at a 95% confidence level. In
Portfolio D1, one of the four return categories was statistically significant at a 90%
confidence level. The lower confidence level observed in Portfolio D1 is likely explained
by the distortion from the small population size of the portfolio.
Daily returns [0,1] Cumulative returns
30
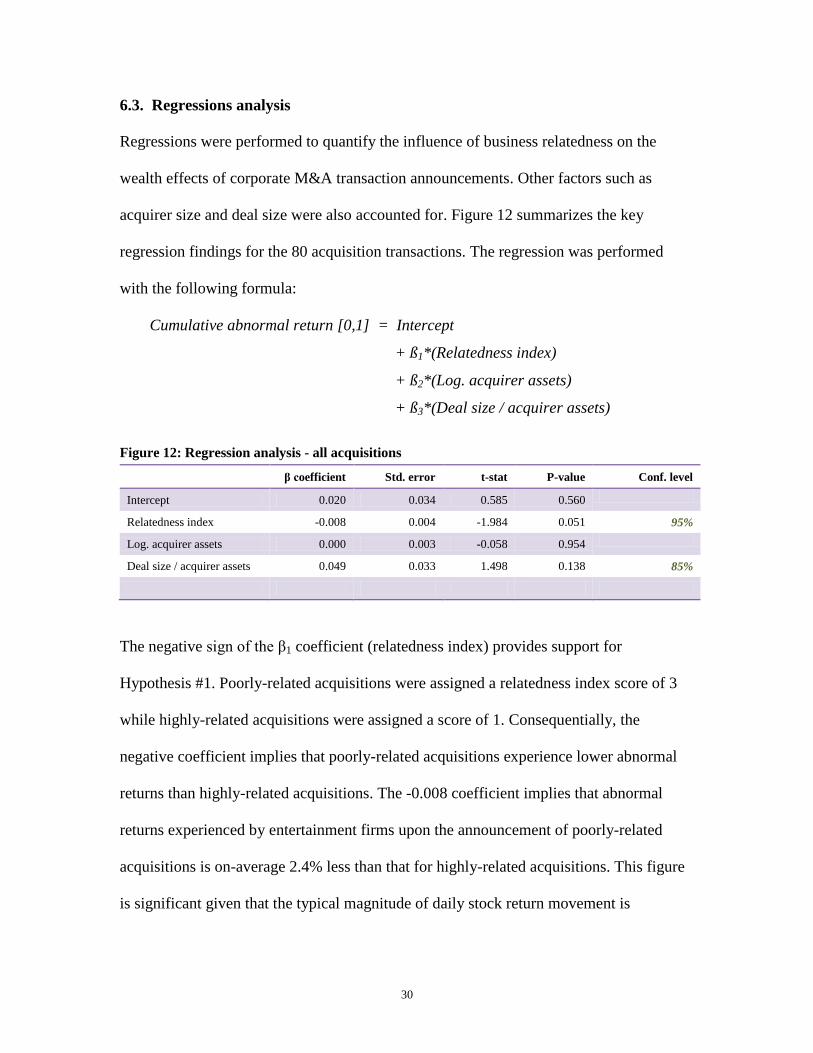
6.3. Regressions analysis
Regressions were performed to quantify the influence of business relatedness on the
wealth effects of corporate M&A transaction announcements. Other factors such as
acquirer size and deal size were also accounted for. Figure 12 summarizes the key
regression findings for the 80 acquisition transactions. The regression was performed
with the following formula:
Cumulative abnormal return [0,1] = Intercept
+ ß1*(Relatedness index)
+ ß2*(Log. acquirer assets)
+ ß3*(Deal size / acquirer assets)
Figure 12: Regression analysis - all acquisitions
β coefficient Std. error t-stat P-value Conf. level
Intercept 0.020 0.034 0.585 0.560
Relatedness index -0.008 0.004 -1.984 0.051 95%
Log. acquirer assets 0.000 0.003 -0.058 0.954
Deal size / acquirer assets 0.049 0.033 1.498 0.138 85%
The negative sign of the β1 coefficient (relatedness index) provides support for
Hypothesis #1. Poorly-related acquisitions were assigned a relatedness index score of 3
while highly-related acquisitions were assigned a score of 1. Consequentially, the
negative coefficient implies that poorly-related acquisitions experience lower abnormal
returns than highly-related acquisitions. The -0.008 coefficient implies that abnormal
returns experienced by entertainment firms upon the announcement of poorly-related
acquisitions is on-average 2.4% less than that for highly-related acquisitions. This figure
is significant given that the typical magnitude of daily stock return movement is
31
approximately 0.3%. This β1 coefficient is also statistically significant at a 95%
confidence level.
Two other factors that may influence abnormal returns were also analyzed in the
regression – acquirer size and deal size. The β2 coefficient (log. of acquirer assets) was
0.000 and was not statistically significant. Hence, a conclusive relationship could not be
drawn between acquirer size and abnormal returns. The β3 coefficient (ratio of deal size /
acquirer assets) was 0.049 and was relatively significant at an 85% confidence level. The
positive coefficient implies that larger transactions (relative to the acquirer‟s size) tend to
result in greater abnormal returns for the parent company than smaller transactions. This
finding is in line with market norms as larger transactions typically attract greater
investor interest and media coverage.
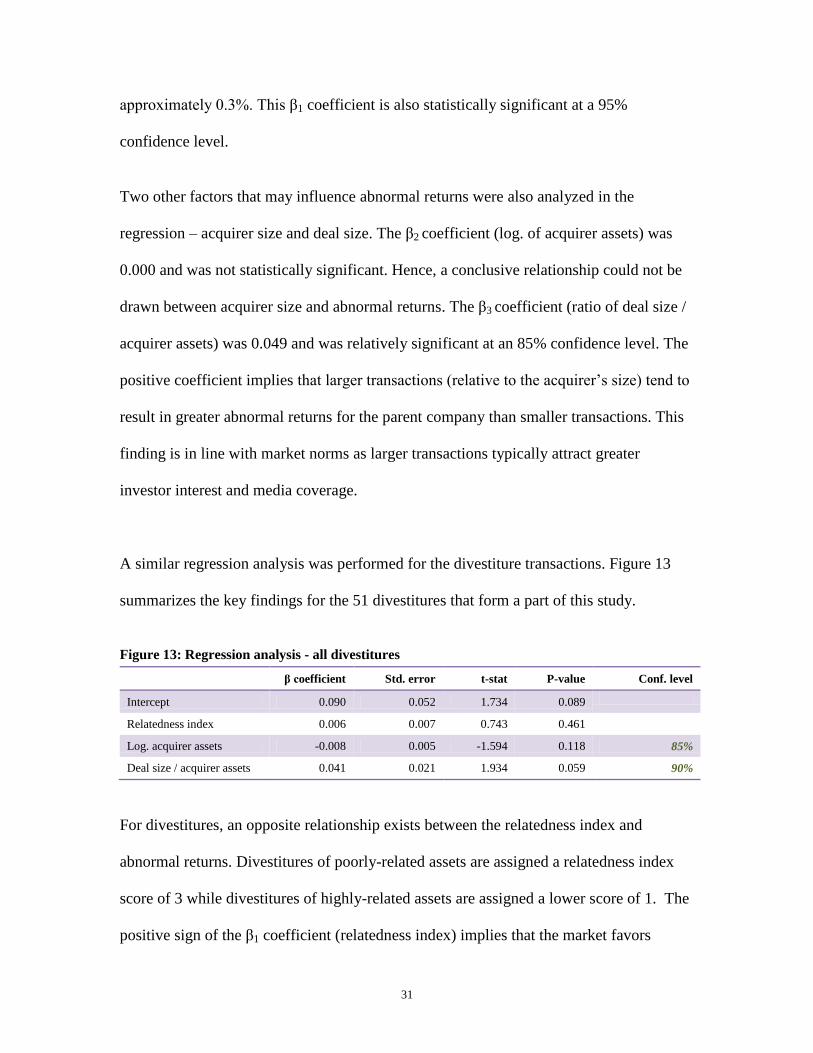
A similar regression analysis was performed for the divestiture transactions. Figure 13
summarizes the key findings for the 51 divestitures that form a part of this study.
Figure 13: Regression analysis - all divestitures
β coefficient Std. error t-stat P-value Conf. level
Intercept 0.090 0.052 1.734 0.089
Relatedness index 0.006 0.007 0.743 0.461
Log. acquirer assets -0.008 0.005 -1.594 0.118 85%
Deal size / acquirer assets 0.041 0.021 1.934 0.059 90%
For divestitures, an opposite relationship exists between the relatedness index and
abnormal returns. Divestitures of poorly-related assets are assigned a relatedness index
score of 3 while divestitures of highly-related assets are assigned a lower score of 1. The
positive sign of the β1 coefficient (relatedness index) implies that the market favors
32
divestitures of poorly-related assets over that of highly-related assets, thereby further
providing support for Hypotheses #2 and #3. However, this finding was not statistically
significant given the small t-statistic of 0.743. The statistical insignificance could have
been due to the small sample size. Only 51 divestitures were analyzed as part of the
regression, of which only seven transactions were divestitures of highly-related assets.
The β2 coefficient (log. of acquirer assets) was -0.008 and was relatively statistically
significant at an 85% confidence level, implying that smaller entertainment companies
outperformed their larger peers when divestitures were announced. This finding is likely
due to the fact that divestitures of the same size would have a greater business impact on
a smaller company than it would have on a larger conglomerate. The β3 coefficient (ratio
of deal size / acquirer assets) was 0.041 and was statistically significant with a 90%
confidence level. These findings were similar to the regression performed on the
acquisitions (β3 coefficient of 0.049, 95% confidence level). Similarly, the positive
coefficient is in line with market norms and implies that larger transactions tend to result
in greater abnormal returns for the parent company than smaller transactions.
6.4. Summary of key findings and business implications of the study
The primary findings of the study, as indicated by the analysis of cumulative abnormal
returns of the various portfolios and the regression analyses, provide strong support for
the three hypotheses. The stronger performance of Portfolio A1 (comprising highly-
related acquisitions) vis-à-vis Portfolios A2 and A3, and the negative coefficient of the
relatedness index in the acquisitions regression analysis provide a strong basis for the
argument that, in the entertainment industry, the market favors highly-related acquisitions

33
over poorly-related acquisitions (Hypothesis #1). The stronger performance of Portfolio
D3 (comprising divestitures of poorly-related assets) vis-à-vis Portfolios D1 and D2 lends
support to the argument that, in the entertainment industry, the market favors divestitures
of poorly-related assets over divestitures of highly-related assets (Hypothesis #3).
Taken together, these findings indicate that entertainment companies experience greater
wealth effects when announcing corporate M&A transactions that focus operations on
their existing core business, thereby suggesting that these companies ought to pursue
operational focus instead of diversification (Hypothesis #2). While there are clear
benefits in operating under the diversified conglomerate model (economies of scale,
capitalizing on the industry‟s unique content-distribution relationship etc.), it appears that
these benefits are outweighed by the advantages of focusing operations on existing core
businesses (economies of scope, reducing the effects of conglomerate discounts etc.).
The results of this study help explain the recent shift in M&A activity in the
entertainment industry by suggesting that entertainment companies are better rewarded
when their operations are focused on their core business, thereby providing these
companies with quantitative and qualitative findings to support future acquisitions of
highly-related businesses and divestitures of poorly-related assets. This analysis of
business development and acquisition strategy also provides a road-map for today‟s
entertainment companies – particularly the Big Six conglomerates, which may see the
need to continue shedding non-core assets in order to achieve greater operational focus.
34
7. LIMITATIONS OF THE STUDY
7.1. Limited data universe
This study analyzed 131 acquisitions and divestitures within the US entertainment
industry made by 14 major players over the last ten years. In addition to the Big Six
conglomerates, eight other firms with different acquisition strategies and operating
models were included in the data set to create a data universe that accurately reflects
M&A strategies within the industry. However, this list of 14 firms and the corresponding
list of their M&A transactions are by no means exhaustive. While 131 transactions is a
sizeable figure for a study of this nature, some of the portfolios only included a handful
of transactions, which may have distorted findings.
7.2. Assumptions in research methodology
In analyzing wealth effects of corporate M&A transaction announcements, this study
relies on the Efficient Markets Hypothesis (“EMH”). The EMH suggests that market
prices fully reflect all available information, thereby allowing abnormal stock returns in
the days immediately after the transaction announcement to act as an accurate proxy for
the market‟s reaction to these transactions. However, details about the transactions could
have leaked before the announcement date, reflecting a weak / semi-strong form of the
EMH. In the statistical significance analysis of cumulative abnormal returns on a [-5,5]
window, there were some significant stock price moments in the days before the
transaction announcement, signifying that information about the transaction could have
leaked to the public. This price action prior to the announcement date distorts the
observed wealth effects. However, given that daily and cumulative returns in the days
35
immediately after the announcement were still statistically significant (see Figure 9 &
11), this distortion is unlikely to have significantly impacted findings.
In addition, the study adopted the oft-used research approach of using the S&P500 index
as the benchmark index in computing daily abnormal returns by subtracting the daily
return of the S&P 500 index from the daily return of the stock. Inherent in this
methodology is the assumption that the beta of the stock is equivalent to 1. While the
accuracy of the study‟s findings would have been enhanced if the individual companies‟
beta were accounted for, the use of this methodology does not appear to have
significantly impacted the findings given the close proximity of the average
entertainment industry beta of 1.2514
to the assumed beta of 1.
14 Source: Damodaran (media industries include cable TV, entertainment, entertainment tech and publishing)

36
8. CONCLUSION – FOCUS > DIVERSIFICATION
The aim of the study was to identify the optimal business development and acquisition
strategy in the entertainment industry today. Concluding that firms experience greater
wealth effects when pursuing transactions that result in greater operational focus provides
a useful road-map for entertainment companies when formulating business development
strategies.
M&A activity in the entertainment industry has proven to be relatively fluid. In the last
few months, News Corp, Time Warner and CBS have all announced spin-offs in order to
increase operational focus and these divestitures have been well-received by the market.
However, strategies pursuing operational diversification were better received in the early
2000s, and another sea change in investor preference could happen in the future. Further,
the continuously changing landscape of the media industry could have a significant
impact on the optimal acquisition strategy for entertainment firms. In the last few years,
new online distribution channels, disruptive technologies, and the race to acquire and
produce content have reshaped the industry and will continue to do so in the near future.
Therefore, it is important to apply the findings of this study in the context of other
industry trends.
37
REFERENCES
CBS Corporation. Annual Report. Delaware: CBS Corporation, 2012. 15 Feb. 2013.
Web. 8 Apr. 2013.
Chan-Olmstead, S., and A. Albarran. “A Framework for the Study of Global Media
Economics.” Ames: Iowa State University Press, 1998. Print.
Chan-Olmstead, S., and Byeng-Hee Chang. “Diversification Strategy of Global Media
Conglomerates.” Journal of Media Economics, 16, 213-233. 2003.
Comcast Corporation. Annual Report. Pennsylvania: Comcast Corporation, 2012. 21
Feb. 2013. Web. 8 Apr. 2013.
Dal, Yong Jin. De-convergence of Global Media Industries. New York: Routledge,
2013. Print.
Damodaran, Aswath. Betas by Sector. New York: New York University, Jan. 2013.
Web. 30 Apr 2013.
Flint, Joe. “Wall Street Analysts Not Worried About Slow Start for CBS.” Los Angeles
Times. 18 Oct 2012. Web. 2 Mar. 2013.
Hollifield, C.A. “Crossing Borders: Media Management Research in a Transnational
Market Environment.” Journal of Media Economics, 14, 133-146. 2001.
John Kose, and Eli Ofek. “Asset Sales and Increase in Focus.” Journal of Financial
Economics, 37, 105-126. 1995.
Knee, Jonathan A., Bruce C. Greenwald, and Ava Seave. The Curse of the Mogul.
New York: Penguin, 2009. Print.
Lo, Andrew W. “Efficient Markets Hypothesis.” The New Palgrave: A Dictionary of
Economics, 2nd
edition. New York: Palgrave McMillan. 2007.
Lutz, Ashley. “These 6 Corporations Control 90% of the Media in America.” The Wire.
Business Insider, 14 Jun. 2012. Web. 3 Apr 2013.
McChesney, R.W. “The New Global Media.” The Nation. 29 Nov. 1999. Web. 5 Apr
2013.
News Corporation. Annual Report. Delaware: News Corporation, 2012. 1 Oct 2012.
Web. 8 Apr. 2013.
38
Pricewaterhouse Coopers. “2013 Deal Insights for the Entertainment, Media and
Communications Industries.” PricewaterhouseCoopers Deal Practice. 22 Apr. 2013.
Web. 22 Apr. 2013.
Rumelt, Richard P. “Diversification Strategy and Profitability.” Strategic Management
Journal, 3, 359-369. 1982.
Singh, Harbir and Cynthia A. Montgomery. “Corporate Acquisition Strategies and
Economic Performance.” Strategic Management Journal, 8, 377-386. 1987.
Time Warner Inc. Annual Report. Delaware: Time Warner Inc, 2012. 22 Feb 2013.
Web. 8 Apr. 2013.
The Walt Disney Company. Annual Report. Delaware: The Walt Disney Company,
2012. 21 Nov. 2012. Web. 8 Apr. 2013.
Viacom Inc. Annual Report. Delaware: Viacom Inc, 2012. 15 Nov. 2012. Web. 8 Apr.
2013.
39
APPENDIX
Table 1: List of transactions in data set and portfolio assignments
Ann. date. Target / asset Acquirer Deal size
($mm)
Involved
company Deal type Portfolio
10K
filing date
Involved company’s
primary LOB type
Primary LOB
contribution to
company revenue
Target / asset
LOB type
Target / asset LOB
type contribution to
company revenue
11/20/12 YES Network News Corp 2,000 News Corp Acquisition A1 08/14/12 Film & TV Prod,
Distrb & Broadcast
62.8% Film & TV Prod,
Distrb & Broadcast
62.8%
04/21/05 Adelphia Communications Investor Group 17,614 Comcast
Corp
Acquisition A1 02/23/05 Cable Services 95.1% Cable Services 95.1%
02/12/13 NBCUniversal Media LLC Comcast Corp 16,700 Comcast
Corp
Acquisition A1 02/21/13 Cable Services 63.3% Content- TV
Programming
36.7%
01/10/05 Fox Entertainment Group Inc News Corp 7,054 News Corp Acquisition A1 09/01/05 Film & TV Prod,
Distrb & Broadcast
60.7% Film & TV Prod,
Distrb & Broadcast
60.7%
05/07/08 Clearwire Corp Investor Group 3,200 Comcast
Corp
Acquisition A1 02/20/08 Cable Services 95.7% Cable Services -
WiMax
95.7%
07/10/12 A&E Television Networks
LLC
Investor Group 3,025 Disney Acquisition A1 11/23/11 TV Programming &
Broadcast
45.8% TV Programming &
Broadcast
45.8%
06/20/12 Consolidated Media Hldg Ltd News Ltd 2,184 News Corp Acquisition A1 08/15/11 Film & TV Prod,
Distrb & Broadcast
59.0% TV Programming &
Broadcast - Int'l
59.0%
12/14/12 ProSiebenSat-SBS Nordic Op Discovery Networks Intl Hldg 1,700 Discovery Acquisition A1 02/17/12 TV Programming &
Broadcast
92.6% TV Programming &
Broadcast - Int'l
92.6%
06/14/10 Bresnan Communications LLC Cablevision Systems Corp 1,365 Cablevision
Corp
Acquisition A1 02/25/10 Cable Services 69.9% Cable Services 69.9%
11/04/09 The Travel Channel LLC Scripps Networks Interactive 975 Scripps
Networks
Acquisition A1 03/05/09 TV Programming &
Broadcast
82.0% TV Programming &
Broadcast
82.0%
10/31/05 Susquehanna Communications
Inc
Comcast Corp 775 Comcast
Corp
Acquisition A1 02/23/05 Cable Services 95.1% Cable Services 95.1%
05/12/06 Court TV Cable Network Time Warner Inc 735 Time Warner Acquisition A1 02/27/06 Film & TV Prod,
Distrb & Broadcast
49.1% Film & TV Prod,
Distrb & Broadcast
49.1%
02/22/11 Shine Ltd News Corp 674 News Corp Acquisition A1 08/06/10 Film & TV Prod,
Distrb & Broadcast
57.7% TV Production 57.7%
01/13/12 Summit Entertainment LLC Lions Gate Entertainment
Corp
600 Lions Gate Acquisition A1 07/29/11 Content - Film Prod &
Distrb
77.7% Content Film Prod &
Distrb
77.7%
08/15/11 UKTV Interactive Ltd Scripps Networks Interactive 555 Scripps
Networks
Acquisition A1 03/01/11 TV Programming &
Broadcast
90.0% TV Programming &
Broadcast - Int'l
90.0%
02/02/12 UTV Software Commun Ltd The Walt Disney Co(SE Asia) 501 Disney Acquisition A1 11/24/10 TV Programming &
Broadcast
45.1% TV Programming &
Broadcast - Int'l
45.1%
04/03/07 Patriot Media &
Communications
Comcast Corp 483 Comcast
Corp
Acquisition A1 02/27/07 Cable Services 95.8% Cable Services 95.8%
12/16/10 7TV Walt Disney Company SNG 300 Disney Acquisition A1 11/24/10 TV Programming &
Broadcast
45.1% TV Programming &
Broadcast - Int'l
45.1%
12/08/08 Jetix Europe NV Walt Disney Co 268 Disney Acquisition A1 11/20/08 TV Programming &
Broadcast
42.6% TV Programming -
Int'l
42.6%
12/14/06 Claxson Interactive-Pay TV(7) Turner Broadcasting System
Inc
235 Time Warner Acquisition A1 02/27/06 Film & TV Prod,
Distrb & Broadcast
49.1% Film & TV Prod,
Distrb & Broadcast
49.1%
10/24/03 Artisan Entertainment Inc Lions Gate Entertainment
Corp
210 Lions Gate Acquisition A1 06/30/03 Content - Film Prod &
Distrb
69.2% Film Distribution 69.2%
03/23/09 Central European Media Time Warner Inc 174 Time Warner Acquisition A1 02/20/09 Film & TV Prod,
Distrb & Broadcast
48.0% Film & TV Prod,
Distrb & Broadcast
48.0%
08/05/10 Shed Media PLC WB Bidco plc 172 Time Warner Acquisition A1 02/19/10 Film & TV Prod,
Distrb & Broadcast
88.3% Film & TV Prod,
Distrb & Broadcast
88.3%
40
Ann. date. Target / asset Acquirer Deal size
($mm)
Involved
company Deal type Portfolio
10K
filing date
Involved company’s
primary LOB type
Primary LOB
contribution to
company revenue
Target / asset
LOB type
Target / asset LOB
type contribution to
company revenue
06/12/06 Phoenix Satellite TV Hldg Ltd CML 166 News Corp Acquisition A1 09/01/05 Film & TV Prod,
Distrb & Broadcast
58.4% TV Programming -
Int'l
58.4%
01/14/13 ARRIS Group Inc Comcast Corp 163 Comcast
Corp
Acquisition A1 02/21/13 Cable Services 63.3% Cable Services - STB 63.3%
11/12/10 Animal Planet Discovery Communications
Inc
156 Discovery Acquisition A1 02/22/10 TV Programming &
Broadcast
89.3% Content - TV
Programming
89.3%
07/23/12 Classic Media Inc Dreamworks Animation SKG
Inc
155 Dreamworks Acquisition A1 02/29/12 Content - Film
Production
100.0% Content - Film Library 100.0%
08/24/10 Red de Television Chilevision Turner Intl(Turner Bdcstg) 151 Time Warner Acquisition A1 02/19/10 Film & TV Prod,
Distrb & Broadcast
88.3% Film & TV Prod,
Distrb & Broadcast
88.3%
12/16/10 NDTV Imagine Ltd Turner Asia Pacific Ventures 127 Time Warner Acquisition A1 02/19/10 Film & TV Prod,
Distrb & Broadcast
88.3% Film & TV Prod,
Distrb & Broadcast
88.3%
03/21/12 Travel Channel Intl Ltd Scripps Networks Interactive 103 Scripps
Networks
Acquisition A1 03/01/11 TV Programming &
Broadcast
95.8% TV Distribution -
International
95.8%
12/03/09 NBC Universal Inc Comcast Corp 31,506 Comcast
Corp
Acquisition A2 02/20/09 Cable Services 95.8% Content - TV
Programming
4.2%
04/21/05 Adelphia Communications
Corp
Investor Group 17,614 Time Warner Acquisition A2 03/11/05 Film & TV Prod,
Distrb & Broadcast
49.7% Cable Services 20.2%
01/24/06 Pixar Inc Walt Disney Co 6,491 Disney Acquisition A2 12/07/05 TV Programming &
Broadcast
41.3% Film Production 23.8%
05/01/07 Dow Jones & Co Inc News Corp 5,598 News Corp Acquisition A2 08/23/06 Film & TV Prod,
Distrb & Broadcast
58.8% Publishing 25.7%
09/13/04 Metro-Goldwyn-Mayer Inc LOC Acquisition Co 4,812 Comcast
Corp
Acquisition A2 03/12/04 Cable Services 95.3% Content - Film Prod &
Distrb
4.7%
10/31/12 Lucasfilm Ltd Walt Disney Co 4,050 Disney Acquisition A2 11/21/12 TV Programming &
Broadcast
46.0% Film Production,
Content
13.8%
08/31/09 Marvel Entertainment Inc Walt Disney Co 3,958 Disney Acquisition A2 11/20/08 TV Programming &
Broadcast
42.6% Film Production,
Content
19.4%
05/07/08 Clearwire Corp Investor Group 3,200 Time Warner Acquisition A2 02/22/08 Film & TV Prod,
Distrb & Broadcast
47.2% Cable Services -
WiMax
34.3%
05/26/11 Austar United
Communications
FOXTEL 2,740 News Corp Acquisition A2 08/06/10 Film & TV Prod,
Distrb & Broadcast
57.7% Cable Broadcast
Services - Int'l
57.7%
12/12/05 DreamWorks LLC Viacom Inc 1,600 Viacom Acquisition A2 03/16/06 Cable TV
Programming
70.0% Film Production 30.0%
11/10/09 Clearwire Corp Investor Group 1,563 Time Warner Acquisition A2 02/20/09 Film & TV Prod,
Distrb & Broadcast
48.0% Cable Services -
WiMax
36.6%
11/10/09 Clearwire Corp Investor Group 1,563 Comcast
Corp
Acquisition A2 02/20/09 Cable Services 95.8% Cable Services -
WiMax
95.8%
03/13/08 Bebo Inc AOL LLC 850 Time Warner Acquisition A2 02/22/08 Film & TV Prod,
Distrb & Broadcast
47.2% Internet Services -
Social Network
11.1%
12/23/08 Premiere AG News Corp 666 News Corp Acquisition A2 08/13/08 Film & TV Prod,
Distrb & Broadcast
53.0% Satellite Broadcast
Services - Int'l
11.4%
04/30/07 FSN New England Comcast Corp 570 Comcast
Corp
Acquisition A2 02/27/07 Cable Services 95.8% Content - TV
Programming
4.2%
07/21/04 Liberty Media Corp Liberty Media Corp 545 Comcast
Corp
Acquisition A2 03/12/04 Cable Services 95.3% Content - Film Prod &
Distrb
4.7%
06/30/03 AMC,IFC,WE Rainbow Media Corp 500 Cablevision
Corp
Acquisition A2 03/31/13 Cable Services 60.4% TV Programming &
Broadcast
16.3%
05/07/08 Sundance Channel LLC Rainbow Media Group LLC 496 Cablevision
Corp
Acquisition A2 02/25/08 Cable Services 72.8% TV Programming &
Broadcast
13.8%
01/14/13 Sky Deutschland AG News Corp 465 News Corp Acquisition A2 08/14/12 Film & TV Prod,
Distrb & Broadcast
62.8% Satellite Broadcast
Services - Int'l
10.9%
41
Ann. date. Target / asset Acquirer Deal size
($mm)
Involved
company Deal type Portfolio
10K
filing date
Involved company’s
primary LOB type
Primary LOB
contribution to
company revenue
Target / asset
LOB type
Target / asset LOB
type contribution to
company revenue
06/24/04 Advertising.com Inc America Online Inc 435 Time Warner Acquisition A2 03/15/04 Film & TV Prod,
Distrb & Broadcast
49.0% Online advertising 23.5%
01/07/08 Premiere AG News Corp 423 News Corp Acquisition A2 08/23/07 Film & TV Prod,
Distrb & Broadcast
57.0% Satellite Broadcast
Services - Int'l
10.7%
03/25/04 TechTV Inc Comcast Corp 300 Comcast
Corp
Acquisition A2 03/12/04 Cable Services 95.3% Content - Film Prod &
Distrb
4.7%
10/20/06 John Fairfax Holdings Ltd News Corp 273 News Corp Acquisition A2 08/23/06 Film & TV Prod,
Distrb & Broadcast
58.8% Publishing - Int'l 25.7%
08/06/12 Bleacher Report Inc Turner Broadcasting System
Inc
175 Time Warner Acquisition A2 02/24/12 Film & TV Prod,
Distrb & Broadcast
90.7% Content - Online
Sports
90.7%
01/12/10 Sky Deutschland AG News Corp 171 News Corp Acquisition A2 08/12/09 Film & TV Prod,
Distrb & Broadcast
53.0% Satellite Broadcast
Services - Int'l
12.4%
12/19/05 Urban Cable Works of Philly Time Warner Inc 168 Time Warner Acquisition A2 03/11/05 Film & TV Prod,
Distrb & Broadcast
49.7% Cable Services 20.2%
10/12/04 Great American Country EW Scripps Co 140 E.W. Scripps
Co
Acquisition A2 03/11/04 Newspaper Publishing 36.9% TV Programming &
Broadcast
28.5%
02/05/08 Buy.at AOL LLC 125 Time Warner Acquisition A2 02/22/08 Film & TV Prod,
Distrb & Broadcast
47.2% Internet Services /
Online Advertising
11.1%
04/24/08 Intl Outdoor Advertising Ltd CBS Corp 110 CBS Corp Acquisition A2 02/28/08 TV Programming &
Broadcast
65.9% Outdoor Advertising 15.5%
10/01/10 The Indian Film Co Ltd Viacom 18 Media Pvt Ltd 101 CBS Corp Acquisition A2 02/25/10 TV Programming &
Broadcast
64.0% TV Programming &
Broadcast - Int'l
10.4%
05/15/08 CNET Networks Inc CBS Corp 1,762 CBS Corp Acquisition A3 02/28/08 TV Programming &
Broadcast
65.9% Interactive Media n/a
11/22/06 E! Entertainment TV Inc Comcast Corp 1,230 Comcast
Corp
Acquisition A3 02/22/06 Cable Services 95.1% Content - TV
Programming
4.1%
06/06/11 Blackstone Group LP-Theme
Park
NBCUniversal Media LLC 1,025 Comcast
Corp
Acquisition A3 02/23/12 Cable Services 66.7% Theme Parks 5.0%
07/27/10 Playdom Inc Walt Disney Co 763 Disney Acquisition A3 12/02/09 TV Programming &
Broadcast
44.8% Interactive Media -
Social Gaming
2.0%
09/08/05 IGN Entertainment Inc News Corp 650 News Corp Acquisition A3 09/01/05 Film & TV Prod,
Distrb & Broadcast
58.4% Interactive Media 4.7%
05/12/08 Newsday Inc Cablevision Systems Corp 650 Cablevision
Corp
Acquisition A3 02/25/08 Cable Services 72.8% Publishing 1.2%
07/19/05 Intermix Media Inc News Corp 582 News Corp Acquisition A3 09/01/05 Film & TV Prod,
Distrb & Broadcast
58.4% Interactive Media 4.7%
06/07/05 Shopzilla Inc EW Scripps Co 525 E.W. Scripps
Co
Acquisition A3 03/15/05 TV Programming &
Broadcast
33.4% Interactive Media -
Online Shopping
13.5%
05/30/07 Famous Music LLC Sony/ATV Music Publishing 370 Viacom Acquisition A3 03/01/07 Cable TV
Programming
63.0% Music Publisher n/a
11/22/10 Wireless Generation Inc News Corp 365 News Corp Acquisition A3 08/06/10 Film & TV Prod,
Distrb & Broadcast
57.7% Education Data
Systems
4.7%
03/16/06 USwitch Ltd EW Scripps Co 359 E.W. Scripps
Co
Acquisition A3 03/16/06 TV Programming &
Broadcast
35.9% Interactive Media -
Online Shopping
18.2%
05/30/07 Last.fm Ltd CBS Corp 280 CBS Corp Acquisition A3 03/01/07 TV Programming &
Broadcast
66.2% Interactive Media n/a
01/05/09 Macrovision Solutions-TV
Guide
Lions Gate Entertainment
Corp
255 Lions Gate Acquisition A3 05/30/08 Content - Film Prod &
Distrb
84.6% Content - TV
Programming
15.4%
08/09/06 Atom Entertainment Inc MTV Networks Inc 200 Viacom Acquisition A3 03/16/06 Cable TV
Programming
70.0% Interactive Media -
Online Gaming
n/a
09/11/06 Jamba! AG News Corp 188 News Corp Acquisition A3 08/23/06 Film & TV Prod,
Distrb & Broadcast
58.8% Interactive Media -
Mobile
5.5%
12/19/03 Summit America Television
Inc
EW Scripps Co 182 E.W. Scripps
Co
Acquisition A3 03/25/03 Newspaper Publishing 44.4% Home Shopping
Network
2.7%
09/22/06 Harmonix Music Systems Inc MTV Networks Inc 175 Viacom Acquisition A3 03/16/06 Cable TV
Programming
70.0% Video Games
Developer
n/a
42
Ann. date. Target / asset Acquirer Deal size
($mm)
Involved
company Deal type Portfolio
10K
filing date
Involved company’s
primary LOB type
Primary LOB
contribution to
company revenue
Target / asset
LOB type
Target / asset LOB
type contribution to
company revenue
08/07/08 QSP Inc Time Inc 110 Time Warner Acquisition A3 02/22/08 Film & TV Prod,
Distrb & Broadcast
47.2% Publishing 10.7%
12/04/06 Jungo Ltd NDS Group PLC 108 News Corp Acquisition A3 08/23/06 Film & TV Prod,
Distrb & Broadcast
58.8% Cable Services -
Software
5.5%
05/05/06 XFire Inc Viacom Inc 102 Viacom Acquisition A3 03/16/06 Cable TV
Programming
70.0% Interactive Media -
Online Gaming
n/a
12/19/03 Summit America Television
Inc
EW Scripps Co 182 E.W. Scripps
Co
Acquisition A3 02/28/08 TV Programming &
Broadcast
65.9% Interactive Media n/a
09/22/06 Harmonix Music Systems Inc MTV Networks Inc 175 Viacom Acquisition A3 02/22/06 Cable Services 95.1% Content - TV
Programming
4.1%
08/07/08 QSP Inc Time Inc 110 Time Warner Acquisition A3 02/23/12 Cable Services 66.7% Theme Parks 5.0%
02/07/13 Optimum West Charter Communications Inc 1,625 Cablevision
Corp
Divestiture D1 02/28/12 Cable Services 93.7% Cable Services 93.7%
12/24/07 News Corp-FOX Network(8) Oak Hill Capital Partners LP 1,100 News Corp Divestiture D1 08/23/07 Film & TV Prod,
Distrb & Broadcast
57.0% TV Broadcast 57.0%
05/06/08 Sundance Channel LLC Rainbow Media Group LLC 496 CBS Corp Divestiture D1 02/28/08 TV Programming &
Broadcast
65.9% TV Programming 65.9%
02/18/10 News Corp-Bulgarian TV Bus Central European Media 400 News Corp Divestiture D1 08/12/09 Film & TV Prod,
Distrb & Broadcast
53.0% Film & TV Prod,
Distrb & Broadcast
53.0%
06/01/07 Wayfarer Media Ltd Prof-Media Management 360 Viacom Divestiture D1 03/01/07 Cable TV
Programming
63.0% Cable TV
Programming - Int'l
63.0%
02/22/05 Crown Media Hldg Inc-Intl
Bus
Investor Group 242 Crown Media Divestiture D1 05/27/05 TV Programming &
Broadcast
87.6% TV Programming &
Broadcast - Int'l
87.6%
02/07/07 CBS Corp-TV Stations(7) Cerberus Capital Management
LP
185 CBS Corp Divestiture D1 03/16/06 TV Programming &
Broadcast
64.2% TV Broadcast 64.2%
07/03/03 QVC Inc Liberty Media Corp 7,903 Comcast
Corp
Divestiture D2 03/20/03 Cable Services 59.0% TV Commerce 35.2%
07/10/12 A&E Television Networks
LLC
Investor Group 3,025 Comcast
Corp
Divestiture D2 02/23/12 Cable Services 66.7% Content- TV
Programming
29.1%
02/07/06 ABC Radio Networks Citadel Broadcasting Corp 2,400 Disney Divestiture D2 12/07/05 TV Programming &
Broadcast
41.3% Radio 41.3%
12/20/05 America Online Inc Google Inc 1,000 Time Warner Divestiture D2 03/11/05 Film & TV Prod,
Distrb & Broadcast
49.7% Internet Services 20.7%
03/17/06 DreamWorks SKG-Film
Library
Investor Group 900 Viacom Divestiture D2 03/16/06 Cable TV
Programming
70.0% Content - Film Library 30.0%
09/19/06 AOL Deutschland GmbH-
Internet
Telecom Italia SpA 880 Time Warner Divestiture D2 02/27/06 Film & TV Prod,
Distrb & Broadcast
49.1% Internet Services 19.0%
10/11/06 AOL (UK) LTD Carphone Warehouse Group
PLC
686 Time Warner Divestiture D2 02/27/06 Film & TV Prod,
Distrb & Broadcast
49.1% Internet Services 19.0%
07/30/10 Miramax Film Corp Filmyard Holdings LLC 660 Disney Divestiture D2 12/02/09 TV Programming &
Broadcast
44.8% Content - Film Prod &
Dstrb
17.0%
04/30/07 FSN New England Comcast Corp 570 Cablevision
Corp
Divestiture D2 02/28/07 Cable Services 71.5% TV Programming 14.9%
10/03/05 TSL Education Ltd Exponent Private Equity LLP 412 News Corp Divestiture D2 09/01/05 Film & TV Prod,
Distrb & Broadcast
58.4% Publishing 27.2%
02/13/07 CBS Corp-Radio Stations(2) Liberty Media Corp 408 CBS Corp Divestiture D2 03/16/06 TV Programming &
Broadcast
64.2% Radio 14.5%
09/21/06 AOL CompuServe France
SAS
Neuf Cegetel SA 366 Time Warner Divestiture D2 02/27/06 Film & TV Prod,
Distrb & Broadcast
49.1% Internet Services 19.0%
06/19/07 Tegic Communications Inc Nuance Communications Inc 265 Time Warner Divestiture D2 02/23/07 Film & TV Prod,
Distrb & Broadcast
47.3% Internet Services /
Mobile Media
19.0%
08/21/06 CBS Corp-Radio Stations Entercom Communications
Corp
262 CBS Corp Divestiture D2 03/16/06 TV Programming &
Broadcast
64.2% Radio 14.5%
01/20/05 Rainbow DBS-Rainbow
Satellite
EchoStar Communications
Corp
200 Cablevision
Corp
Divestiture D2 03/15/04 Cable Services 65.0% Satellite Broadcast
Services
65.0%
10/11/06 CBS Corp-Radio Stations(7) Wilks Broadcast Group LLC 138 CBS Corp Divestiture D2 03/16/06 TV Programming &
Broadcast
64.2% Radio 14.5%
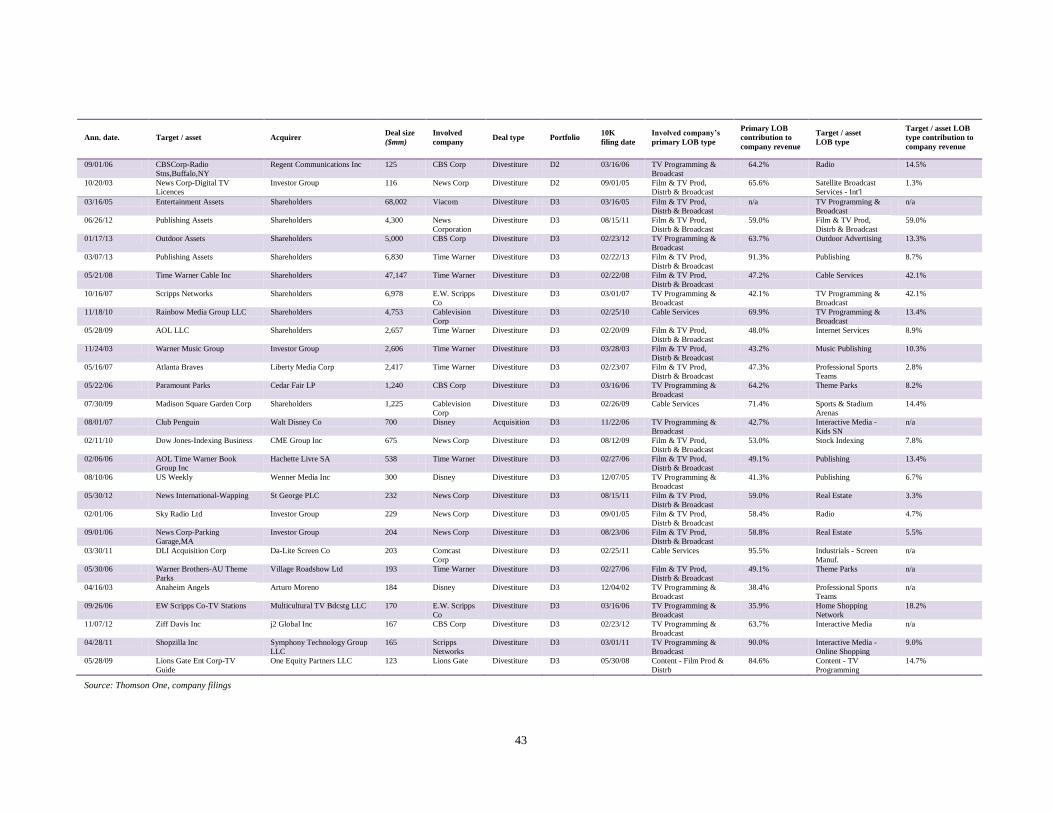
43
Ann. date. Target / asset Acquirer Deal size
($mm)
Involved
company Deal type Portfolio
10K
filing date
Involved company’s
primary LOB type
Primary LOB
contribution to
company revenue
Target / asset
LOB type
Target / asset LOB
type contribution to
company revenue
09/01/06 CBSCorp-Radio
Stns,Buffalo,NY
Regent Communications Inc 125 CBS Corp Divestiture D2 03/16/06 TV Programming &
Broadcast
64.2% Radio 14.5%
10/20/03 News Corp-Digital TV
Licences
Investor Group 116 News Corp Divestiture D2 09/01/05 Film & TV Prod,
Distrb & Broadcast
65.6% Satellite Broadcast
Services - Int'l
1.3%
03/16/05 Entertainment Assets Shareholders 68,002 Viacom Divestiture D3 03/16/05 Film & TV Prod,
Distrb & Broadcast
n/a TV Programming &
Broadcast
n/a
06/26/12 Publishing Assets Shareholders 4,300 News
Corporation
Divestiture D3 08/15/11 Film & TV Prod,
Distrb & Broadcast
59.0% Film & TV Prod,
Distrb & Broadcast
59.0%
01/17/13 Outdoor Assets Shareholders 5,000 CBS Corp Divestiture D3 02/23/12 TV Programming &
Broadcast
63.7% Outdoor Advertising 13.3%
03/07/13 Publishing Assets Shareholders 6,830 Time Warner Divestiture D3 02/22/13 Film & TV Prod,
Distrb & Broadcast
91.3% Publishing 8.7%
05/21/08 Time Warner Cable Inc Shareholders 47,147 Time Warner Divestiture D3 02/22/08 Film & TV Prod,
Distrb & Broadcast
47.2% Cable Services 42.1%
10/16/07 Scripps Networks Shareholders 6,978 E.W. Scripps
Co
Divestiture D3 03/01/07 TV Programming &
Broadcast
42.1% TV Programming &
Broadcast
42.1%
11/18/10 Rainbow Media Group LLC Shareholders 4,753 Cablevision
Corp
Divestiture D3 02/25/10 Cable Services 69.9% TV Programming &
Broadcast
13.4%
05/28/09 AOL LLC Shareholders 2,657 Time Warner Divestiture D3 02/20/09 Film & TV Prod,
Distrb & Broadcast
48.0% Internet Services 8.9%
11/24/03 Warner Music Group Investor Group 2,606 Time Warner Divestiture D3 03/28/03 Film & TV Prod,
Distrb & Broadcast
43.2% Music Publishing 10.3%
05/16/07 Atlanta Braves Liberty Media Corp 2,417 Time Warner Divestiture D3 02/23/07 Film & TV Prod,
Distrb & Broadcast
47.3% Professional Sports
Teams
2.8%
05/22/06 Paramount Parks Cedar Fair LP 1,240 CBS Corp Divestiture D3 03/16/06 TV Programming &
Broadcast
64.2% Theme Parks 8.2%
07/30/09 Madison Square Garden Corp Shareholders 1,225 Cablevision
Corp
Divestiture D3 02/26/09 Cable Services 71.4% Sports & Stadium
Arenas
14.4%
08/01/07 Club Penguin Walt Disney Co 700 Disney Acquisition D3 11/22/06 TV Programming &
Broadcast
42.7% Interactive Media -
Kids SN
n/a
02/11/10 Dow Jones-Indexing Business CME Group Inc 675 News Corp Divestiture D3 08/12/09 Film & TV Prod,
Distrb & Broadcast
53.0% Stock Indexing 7.8%
02/06/06 AOL Time Warner Book
Group Inc
Hachette Livre SA 538 Time Warner Divestiture D3 02/27/06 Film & TV Prod,
Distrb & Broadcast
49.1% Publishing 13.4%
08/10/06 US Weekly Wenner Media Inc 300 Disney Divestiture D3 12/07/05 TV Programming &
Broadcast
41.3% Publishing 6.7%
05/30/12 News International-Wapping St George PLC 232 News Corp Divestiture D3 08/15/11 Film & TV Prod,
Distrb & Broadcast
59.0% Real Estate 3.3%
02/01/06 Sky Radio Ltd Investor Group 229 News Corp Divestiture D3 09/01/05 Film & TV Prod,
Distrb & Broadcast
58.4% Radio 4.7%
09/01/06 News Corp-Parking
Garage,MA
Investor Group 204 News Corp Divestiture D3 08/23/06 Film & TV Prod,
Distrb & Broadcast
58.8% Real Estate 5.5%
03/30/11 DLI Acquisition Corp Da-Lite Screen Co 203 Comcast
Corp
Divestiture D3 02/25/11 Cable Services 95.5% Industrials - Screen
Manuf.
n/a
05/30/06 Warner Brothers-AU Theme
Parks
Village Roadshow Ltd 193 Time Warner Divestiture D3 02/27/06 Film & TV Prod,
Distrb & Broadcast
49.1% Theme Parks n/a
04/16/03 Anaheim Angels Arturo Moreno 184 Disney Divestiture D3 12/04/02 TV Programming &
Broadcast
38.4% Professional Sports
Teams
n/a
09/26/06 EW Scripps Co-TV Stations Multicultural TV Bdcstg LLC 170 E.W. Scripps
Co
Divestiture D3 03/16/06 TV Programming &
Broadcast
35.9% Home Shopping
Network
18.2%
11/07/12 Ziff Davis Inc j2 Global Inc 167 CBS Corp Divestiture D3 02/23/12 TV Programming &
Broadcast
63.7% Interactive Media n/a
04/28/11 Shopzilla Inc Symphony Technology Group
LLC
165 Scripps
Networks
Divestiture D3 03/01/11 TV Programming &
Broadcast
90.0% Interactive Media -
Online Shopping
9.0%
05/28/09 Lions Gate Ent Corp-TV
Guide
One Equity Partners LLC 123 Lions Gate Divestiture D3 05/30/08 Content - Film Prod &
Distrb
84.6% Content - TV
Programming
14.7%
Source: Thomson One, company filings

44
Appendix Table 2: Returns analysis on acquisition portfolios (A1-A3) for [-5,5] trading window
T-5 T-4 T-3 T-2 T-1 T T+1 T+2 T+3 T+4 T+5
A1 PORTFOLIO
Daily average return (0.30%) 0.63% 0.13% (0.36%) 0.06% 0.63% 0.80% 0.49% 0.16% 0.13% 0.39%
Cumulative return (0.30%) 0.33% 0.46% 0.10% 0.17% 0.80% 1.59% 2.09% 2.25% 2.38% 2.77%
t-stat, daily return -1.455 1.707 0.279 -1.112 0.449 1.943 1.766 2.682 0.498 0.402 1.369
Confidence level 90% 90% 90% 95%
A2 PORTFOLIO
Daily average return 0.07% 0.14% 0.42% 0.01% (0.07%) (0.02%) 0.48% 0.29% 0.19% 0.16% (0.18%)
Cumulative return 0.07% 0.22% 0.64% 0.65% 0.58% 0.56% 1.04% 1.33% 1.52% 1.68% 1.50%
t-stat, daily return 0.359 0.520 1.793 0.040 -0.378 -0.050 2.165 0.781 0.792 0.828 -0.616
Confidence level 90% 95%
A3 PORTFOLIO
Daily average return 0.11% (0.44%) (0.02%) 0.53% 0.12% (1.04%) 0.51% (0.46%) 0.29% (0.27%) 0.03%
Cumulative return 0.11% (0.33%) (0.34%) 0.19% 0.31% (0.73%) (0.22%) (0.68%) (0.39%) (0.66%) (0.63%)
t-stat, daily return 0.412 -1.076 -0.061 2.349 0.568 -3.280 0.926 -1.772 1.309 -1.281 0.079
Confidence level 95% 95% 90%
Note: where T indicates transaction announcement date

45
Appendix Table 3: Returns analysis on divestiture portfolios (D1-D3) for [-5,5] trading window
T-5 T-4 T-3 T-2 T-1 T T+1 T+2 T+3 T+4 T+5
D1 PORTFOLIO
Daily average return (0.14%) (0.00%) 0.12% 0.08% (0.07%) 1.88% 0.66% 0.05% (0.29%) 0.11% (0.17%)
Cumulative return (0.14%) (0.14%) (0.02%) 0.06% (0.01%) 1.87% 2.53% 2.58% 2.29% 2.40% 2.23%
t-stat, daily return -0.194 -0.005 0.268 0.288 -0.165 1.372 1.046 0.679 -1.198 0.530 -0.754
Confidence level
D2 PORTFOLIO
Daily average return 0.34% (0.19%) (0.07%) (0.07%) 0.02% 1.44% 1.17% 0.11% 0.26% 0.17% 0.19%
Cumulative return 0.34% 0.15% 0.08% 0.02% 0.04% 1.48% 2.65% 2.75% 3.01% 3.18% 3.37%
t-stat, daily return 1.495 -1.246 -0.375 -0.307 0.113 2.876 1.382 0.181 1.190 0.771 0.694
Confidence level 95%
D3 PORTFOLIO
Daily average return (0.20%) 0.23% 0.20% 0.03% (0.10%) 2.36% 0.63% 0.13% (0.48%) (0.07%) (0.21%)
Cumulative return (0.20%) 0.02% 0.22% 0.25% 0.15% 2.51% 3.14% 3.27% 2.80% 2.73% 2.52%
t-stat, daily return -1.231 1.138 0.769 0.187 -0.703 4.077 1.488 0.479 -0.831 -0.400 -1.012
Confidence level 95%
Note: where T indicates transaction announcement date