Embed Size (px)
Citation preview
Submitted 17 December 2016Accepted 15 April 2017Published 18 May 2017
Corresponding authorDebashish Bhattacharya,[email protected]
Academic editorJames Reimer
Additional Information andDeclarations can be found onpage 14
DOI 10.7717/peerj.3319
Copyright2017 Putnam et al.
Distributed underCreative Commons CC-BY 4.0
OPEN ACCESS
Divergent evolutionary histories of DNAmarkers in a Hawaiian population of thecoral Montipora capitataHollie M. Putnam1,2,*, Diane K. Adams3,*, Ehud Zelzion4, Nicole E. Wagner4,Huan Qiu4, Tali Mass5, Paul G. Falkowski3,6, Ruth D. Gates1 andDebashish Bhattacharya4
1Hawai’i Institute of Marine Biology, Kaneohe, HI, United States of America2Department of Biological Sciences, University of Rhode Island, Kingston, RI, United States of America3Department of Marine and Coastal Sciences, Rutgers University, New Brunswick, NJ,United States of America
4Department of Ecology, Evolution, and Natural Resources, Rutgers University, New Brunswick, NJ,United States of America
5Marine Biology Department, University of Haifa, Haifa, Israel6Department of Earth and Planetary Sciences, Rutgers University, Piscataway, NJ, United States of America*These authors contributed equally to this work.
ABSTRACTWe investigated intra- and inter-colony sequence variation in a population of the dom-inant Hawaiian coral Montipora capitata by analyzing marker gene and genomic data.Ribosomal ITS1 regions showed evidence of a reticulate history among the colonies,suggesting incomplete rDNA repeat homogenization. Analysis of the mitochondrialgenome identified a major (M. capitata) and a minor (M. flabellata) haplotype in singlepolyp-derived sperm bundle DNAwith some colonies containing 2–3 differentmtDNAhaplotypes. In contrast, Pax-C and newly identified single-copy nuclear genes showedeither no sequence differences or minor variations in SNP frequencies segregatingamong the colonies. Our data suggest past mitochondrial introgression inM. capitata,whereas nuclear single-copy loci show limited variation, highlighting the divergentevolutionary histories of these coral DNA markers.
Subjects Ecology, Evolutionary Studies, Marine BiologyKeywords Genomics, Sperm bundle DNA, Coral colonies
INTRODUCTIONCoral reef ecosystems are centers of marine biodiversity that provide a number of ecologicalservices, including food, income from tourism, nutrient cycling and waste removal, andabsorption of wave energy tomitigate erosion (Sheppard et al., 2005). Integral to the successof the coral holobiont is the complex and intimate interplay between the animal cnidarianhost and one or more types of symbiotic dinoflagellate algae, as well as their microbiomescomprised of prokaryotes and viruses (Meyer & Weis, 2012; Bhattacharya et al., 2016;Röthig et al., 2016a). These complex biotic interactions are thought to confer a variety ofproperties, including the ability to tolerate stress and adapt to changing environments(Röthig et al., 2016b). Disturbance of these associations can lead to the death of the coralhost (Haas et al., 2014).
How to cite this article Putnam et al. (2017), Divergent evolutionary histories of DNA markers in a Hawaiian population of the coralMontipora capitata. PeerJ 5:e3319; DOI 10.7717/peerj.3319
The adaptive ability of corals is also encoded in their genomes. In addition to the DNApolymorphisms expected in outbreeding diploids, corals have multiple additional sourcesof genetic variation. These include intra- and inter-species chimerism (Puill-Stephan etal., 2009; Work et al., 2011; Schweinsberg et al., 2014; Rinkevich et al., 2016); in Acroporamillepora, both molecular marker analysis and direct observation demonstrate juvenilefusion during settlement with gregarious larvae forming chimeric colonies (Puill-Stephan etal., 2009). Hybridization between species has been demonstrated between corals in the fieldand in the lab, but has a disputed and potentially rare contribution to genetic diversity.There is also extensive genetic evidence for historic introgression in corals, putativelythrough hybridization, but post-zygotic barriers may limit its contribution to genomicevolution except in marginal habitats (reviewed in Willis et al., 2006). Another source ofvariation is the maintenance of multiple copies of genes either through heteroplasmyof organelles or replication of genes within the genome. Furthermore, genetic variationcan accumulate through mutations in somatic tissues (mosaicism) that differentiatein individual polyps (Van Oppen et al., 2011; Schweinsberg, Tollrian & Lampert, 2016),propagate in the somatic tissue, and may be transferred to subsequent generations ifthe germline is not segregated (Work et al., 2011; Schweinsberg et al., 2014). However, anindependently segregating germline has been suggested in the coral Orbicella faveolata,which could protect gametes from propagating these mutations (Barfield, Aglyamova& Matz, 2016). Finally, genome-wide analyses have demonstrated that horizontal genetransfer (HGT) occurs in corals with ca. 0.2% of the animal gene inventory comprised offoreign genes (Bhattacharya et al., 2016). The primary functions of these genes are to expandexisting stress response pathways such as those involved in DNA repair and protectionagainst reactive species (Bhattacharya et al., 2016). Previous work has also shown thatcorals and sea anemones acquired a pathway via HGT that produces photo-protectivemycosporine amino acids that absorb UVR (Shinzato et al., 2011). These data suggest thatcoral colonies may be characterized as dynamic hubs of genetic variation that allow themto respond to changing environmental conditions (e.g., Schweinsberg, Tollrian & Lampert,2016). This hypothesis remains however to be tested using complete genome data from alocal population.
Here we looked in detail at the nature and sources of genetic variation in the coral hostwithin a restricted set of colonies. Specifically, our goal was to determine the contribution ofcurrent and past chimerism and hybridization using coral sperm samples (from egg/spermbundles) from Kaneohe Bay, O’ahu, Hawai’i. To this end, we compared individual spermbundles from a single polyp and pooled sperm from multiple polyps using traditionalmarker genes, non-coding regions, and novel genomic data. Our results demonstratewidely contrasting outcomes when using standard markers such as ribosomal ITS1 and themitochondrial DNA control region (MTC) in comparison to single-copy genes identifiedin a genome-wide analysis. The MTC data provide evidence for past mitochondrialintrogression, whereas the nuclear data indicate genetic uniformity.
Putnam et al. (2017), PeerJ, DOI 10.7717/peerj.3319 2/18
N51 (Mcap1.col Mcap2.col)
19 (Mcap3.col)
8 (Mcap4.col Mcap5.col)
Moku o Loʻe
Barrier Reef
Oʻahu
Mokoliʻi
~200 µm
A B
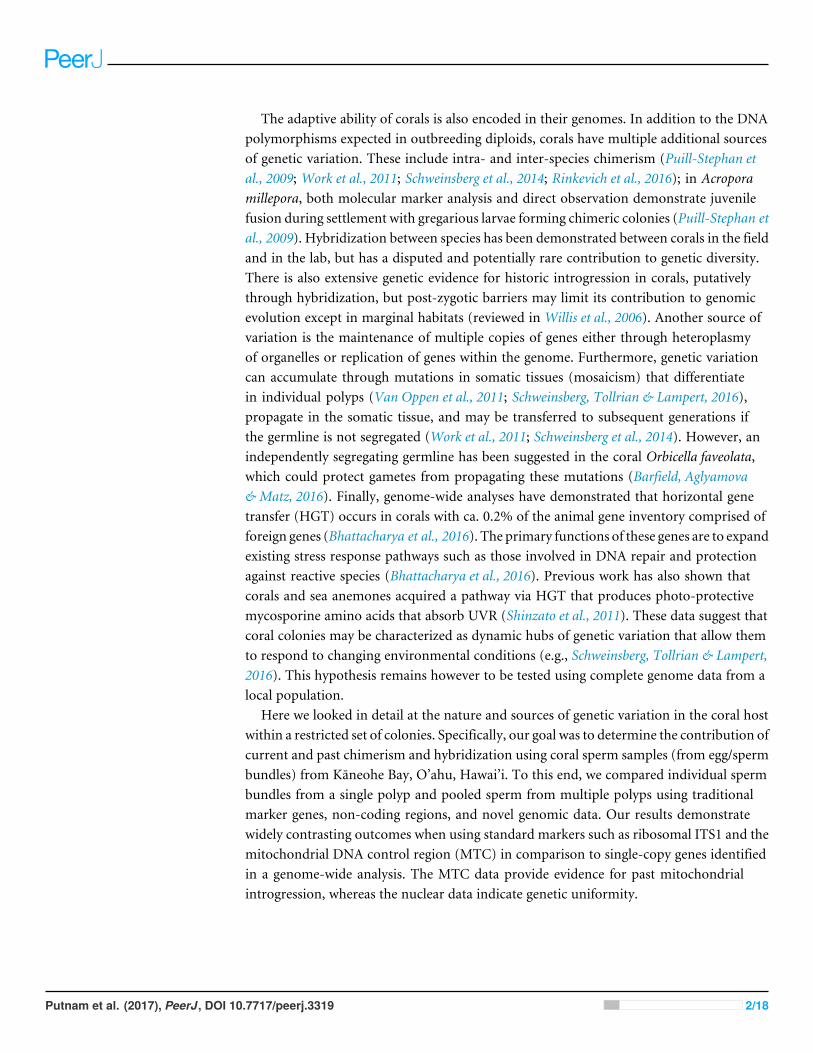
Figure 1 Sampling plan forMontipora capitata in Hawai’i. (A) The location of the three reefs and fivecolonies sampled for this study in Kaneohe Bay, O’ahu. (B) The release of a single bundle ofM. capitataeggs (large cream sphere) and sperm (cloudy pool below eggs) from an individual polyp (scale bar shown).This sperm tissue was isolated from the eggs and used to generate the single sperm bundle and pooled(from multiple polyps) marker gene, genomic, and transcriptomic data.
MATERIALS AND METHODSCoral collection and holdingM. capitata corals were collected on June 2015 (Special Activity Permit 2015–17) fromKaneohe Bay, O’ahu Hawai’i (Fig. 1A) and returned to the Hawai’i Institute of MarineBiology where they were housed in outdoor 1,300 L tanks in shaded conditions withan ambient photoperiod and natural diurnal fluctuations in temperature (Fig. S1). Thesources of tissues used in our study are as follows (see Fig. 1A): Reef 51 (colonies Mcap1and Mcap2), Reef 19 (colony Mcap3), and Reef 8 (colonies Mcap4 and Mcap5).
In the July 2015 spawning period, we collected 10 individual egg sperm bundle replicatesfrom different regions of each of the five colonies as well as a mixture of bundles from eachcolony (Table S1 shows the sample sequencing plan for each molecular marker). Individualegg sperm bundles were collected to allow us to discriminate between variation within apolyp (e.g., somatic mutations, genetic duplications) and within a colony (e.g., chimerism).
Putnam et al. (2017), PeerJ, DOI 10.7717/peerj.3319 3/18
Egg sperm bundles were collected immediately upon release and placed in 1.5 mL sterileRNAse and DNase free microfuge tubes. The bundles were left in individual tubes for 30min to break apart from each other, with the buoyant eggs floating to the surface andthe denser sperm (Fig. 1B) settling to the bottom. The sperm fraction was removed bypipetting to a new tube and was cleaned by a series of three rinse-and-spin steps, withsamples rinsed with 0.2 µm filtered seawater and centrifuged at 13,000 rpm for 3 min. Thesupernatant was removed and the concentrated sperm was stored at−80 ◦C. To generate agene inventory for the downstream transcriptomic analysis, sperm was collected during thesame spawning period (June 2015) from five different field netted adults ofM. capitata onthe fringing reefs on the west side of Moku o Lo’e (Fig. 1A) and used for RNA extraction.
DNA extraction and genomic shotgun library constructionGenomic DNA was extracted from individual sperm bundles using the Zymo Quick-DNAUniversal Kit (Zymo Research, Irvine, CA, USA), with the Biological Fluids and Cellsprotocol, and eluted in 50 µL of 10 mM Tris–HCl (pH 8.5). DNA concentrations weremeasured on a Qubit instrument. A total of 200 ng of genomic DNA from the singlesperm bundle Reef 51 Mcap2.bundle9 was used to construct a library using the IlluminaTruSeq Nano DNA LT Library Prep Kit (Illumina, Inc., San Diego, CA, USA). We chosecolony Mcap2 that had limited variation in the ITS1 and MTC trees (see Results below)to reduce polymorphisms that could complicate genome assembly. The library was run onan Illumina MiSeq Personal Genome Sequencer using the Illumina MiSeq Reagent Kit v3(600 cycles, paired-end).
RNA extraction and RNA-seq library constructionTotal RNA from sperm bundles collected from the five field colonies was extracted byresuspending each sample in 550 µL of Trizol (ThermoFisher Scientific) (Mass et al.,2016). These samples were passed twice through a QiaShredder column (Qiagen, Inc.,Hilden, Germany) and then transferred to a 1.5 mLmicrocentrifuge tube. A total of 450 µLof Trizol was added to bring the volume to 1.0mL. Following a 5-minute room temperatureincubation, 200 µL of chloroform was added and the sample was vigorously shaken for15 s, and then incubated at room temperature for 3 min. The samples were centrifuged for15 min at 4 ◦C and the upper aqueous layer was transferred to a new 1.5 mL tube, and anequal volume of 70% ethanol was added and gently mixed. The samples were transferred toQiagen RNeasy mini columns. From here onwards, the Qiagen RNeasy mini protocol wasfollowed, including the optional on-column DNase treatment. Total RNA was eluted in 55µL of nuclease-free water. Five individual RNA-seq libraries were generated using 200 ngof the total RNA from each sample using the Illumina TruSeq RNA Library PreparationKit v2. The libraries were combined in equimolar concentrations and run on a singleIllumina MiSeq flowcell using the Illumina MiSeq Reagent Kit v3 (150 cycles, paired-end).The genomic and transcriptomic data created for this project are available under NCBIBioProject PRJNA339779.
Putnam et al. (2017), PeerJ, DOI 10.7717/peerj.3319 4/18
Cloning and Sanger sequencingTheMTC region was amplified from sperm DNA using the primers Ms_FP2 (5′-TAG ACAGGG CCA AGG AGA AG-3′) and MON_RP2 (5′GAT AGG GGC TTT TCA TTT GTTTG-3′) (Schweinsberg, Tollrian & Lampert, 2016). The ITS1 region was amplified using theprimers ZITS1 (5′-TAA AAG TCG TAA CAA GGT TTC CGT A-3′) and ZITS2 (5′-CCTCCG CTT ATT GAT ATG CTT AAA T-3
′′
) (Forsman et al., 2009). The PCR was donewith Platinum HiFi Taq (ThermoFisher Scientific, Waltham, MA, USA) for the multiplebundle samples (denature 2 min, 94 ◦C, followed by 35 cycles of 30 s at 94 ◦C, 30 s at 55 ◦C,and 30 s at 68 ◦C, and finished with a 5 min 68 ◦C extension), and with the NEBNextHigh-Fidelity 2X Master Mix (ThermoFisher Scientific, Waltham, MA, USA) for the singlebundle samples (denature 3 min, 95 ◦C, followed by 35 cycles of 10 s at 95 ◦C, 30 s at 55 ◦C,and 30 s at 72 ◦C, and finished with a 5 min 72 ◦C extension). Amplicons were purifiedusing Beckman Coulter AMPure XP beads, and Sanger-sequenced using the same primersas for PCR amplification.
Some of these MTC and ITS1 amplification products were cloned into the vector pCR-Blunt II-TOPO using the Invitrogen Zero Blunt TOPO PCR Cloning Kit (ThermoFisherScientific). Ten colonies from each set were picked, plasmids were purified, and insertswere Sanger-sequenced using the vector-specific primers SP6 and T7. We also amplifieda widely used Pax-C intron using the primers Mont_Pax-FP1 and Mont_Pax-RP1 (VanOppen, Koolmees & Veron, 2004). For this region, we used a 3 min, 98 ◦C denature step,followed by 35 cycles of 98 ◦C 30 s, 55 ◦C 30 s, 72 ◦C 30 s, and finished with a 5 min 72 ◦Cextension, using the NEBNext High-Fidelity 2X Master Mix.
Using sequences of putative single-copy genes identified in the M. capitata RNA-seqassembly PCR primers were designed to yield ca. 200–500 bp genomic DNA amplicons(Table 1; see below), assuming no intron sequences in the regions of interest. Thesesingle-copy genes were amplified using PCR and multiple bundle sperm DNA fromcolonies Mcap1, Mcap2, and Mcap3 with the NEBNext High-Fidelity 2X Master Mix, witha 3 min, 98 ◦C denature step, followed by 35 cycles of 98 ◦C 30 s, 65 ◦C 30 s, 72 ◦C 30 s,and finished with a 5 min 72 ◦C extension. PCR reactions were cleaned using the QiagenQiaQuick PCR Purification Mini Kit; then, one-half of each cleaned amplicon samplewas run on a 0.8% agarose TAE gel, the DNA bands were excised and extracted using theQiagen QiaQuick Gel Extraction Kit and eluted into 30 µL of 10 mM Tris-HCl (pH 8.5).The amplicons were Sanger-sequenced using the same primers as for amplification.
Transcriptomic and genomic data generation and analysisThe RNA-seq run with the combined five sperm libraries yielded 36,250,700 MiSeq rawreads that were adapter and quality-trimmed using the CLC Genomics Workbench (v7.5,Qiagen, Inc., Hilden, Germany). After trimming, 22,681,438 reads (3.2 Gbp of data)remained for assembly and downstream analysis. The trimmed reads were assembled withCLC Genomics Workbench into 73,094 contigs with a N50 = 442 bp. The M. capitatagenomic DNA library was run twice on the MiSeq and yielded a total of 95,971,984 rawreads, of which 70,060,127 were used for assembly, producing 600,706 contigs totaling359,691,707 bp and with a N50 = 720 bp.
Putnam et al. (2017), PeerJ, DOI 10.7717/peerj.3319 5/18
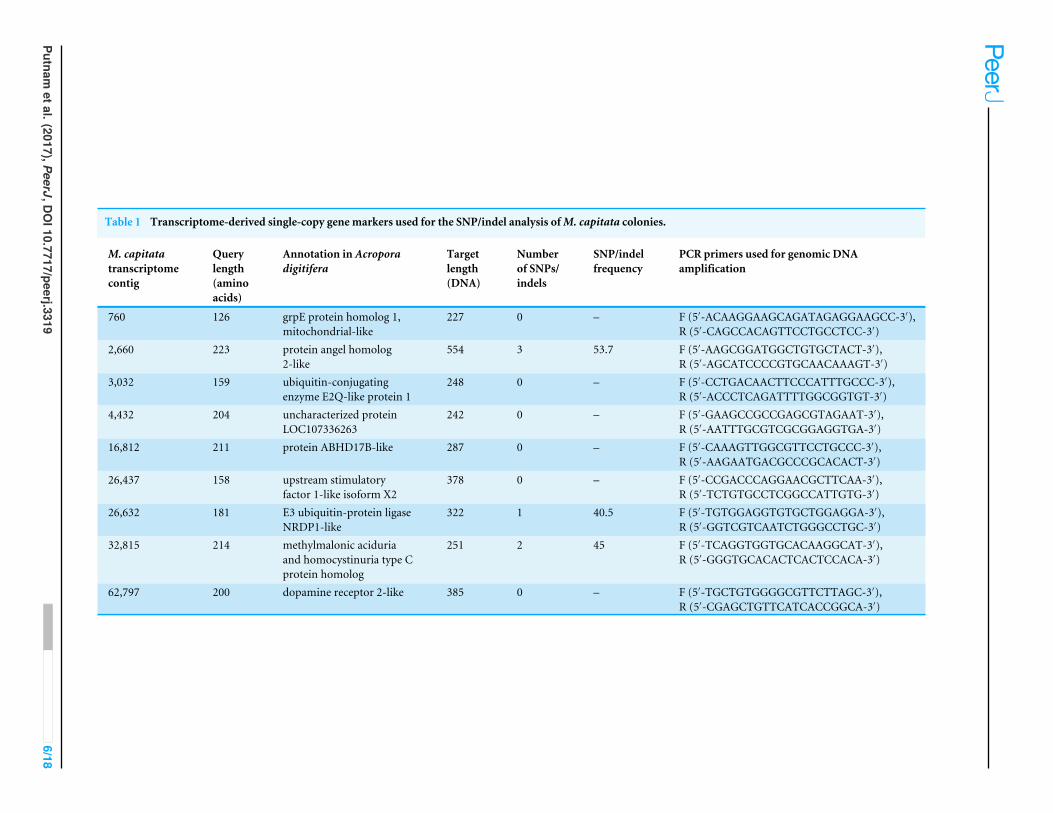
Table 1 Transcriptome-derived single-copy gene markers used for the SNP/indel analysis ofM. capitata colonies.
M. capitatatranscriptomecontig
Querylength(aminoacids)
Annotation in Acroporadigitifera
Targetlength(DNA)
Numberof SNPs/indels
SNP/indelfrequency
PCR primers used for genomic DNAamplification
760 126 grpE protein homolog 1,mitochondrial-like
227 0 – F (5′-ACAAGGAAGCAGATAGAGGAAGCC-3′),R (5′-CAGCCACAGTTCCTGCCTCC-3′)
2,660 223 protein angel homolog2-like
554 3 53.7 F (5′-AAGCGGATGGCTGTGCTACT-3′),R (5′-AGCATCCCCGTGCAACAAAGT-3′)
3,032 159 ubiquitin-conjugatingenzyme E2Q-like protein 1
248 0 – F (5′-CCTGACAACTTCCCATTTGCCC-3′),R (5′-ACCCTCAGATTTTGGCGGTGT-3′)
4,432 204 uncharacterized proteinLOC107336263
242 0 – F (5′-GAAGCCGCCGAGCGTAGAAT-3′),R (5′-AATTTGCGTCGCGGAGGTGA-3′)
16,812 211 protein ABHD17B-like 287 0 – F (5′-CAAAGTTGGCGTTCCTGCCC-3′),R (5′-AAGAATGACGCCCGCACACT-3′)
26,437 158 upstream stimulatoryfactor 1-like isoform X2
378 0 – F (5′-CCGACCCAGGAACGCTTCAA-3′),R (5′-TCTGTGCCTCGGCCATTGTG-3′)
26,632 181 E3 ubiquitin-protein ligaseNRDP1-like
322 1 40.5 F (5′-TGTGGAGGTGTGCTGGAGGA-3′),R (5′-GGTCGTCAATCTGGGCCTGC-3′)
32,815 214 methylmalonic aciduriaand homocystinuria type Cprotein homolog
251 2 45 F (5′-TCAGGTGGTGCACAAGGCAT-3′),R (5′-GGGTGCACACTCACTCCACA-3′)
62,797 200 dopamine receptor 2-like 385 0 – F (5′-TGCTGTGGGGCGTTCTTAGC-3′),R (5′-CGAGCTGTTCATCACCGGCA-3′)
Putnametal.(2017),PeerJ,D
OI10.7717/peerj.3319
6/18
Single-copy gene analysisTo identify single copy genes for the analysis of single nucleotide polymorphisms (SNPs),we constructed orthologous gene families using proteomes from seven anthozoan species(Table S2) with OrthoFinder under the default settings (BLASTP search e-value ≤1e−5;MCL inflation I = 1.5) (Emms & Kelly, 2015). A total of 1,632 gene families were found tobe present in single copy in all studied species. We used genes from the coral Stylophorapistillata as queries to look for single-copy gene homologs in the M. capitata genome andtranscriptome assemblies using TBLASTN (e-value cut-off < 10−10). In the transcriptomedata, we found 489 hits to single-copy genes, but only 9 of them (see Table 1) had>20×average coverage when mapping the M. capitata DNA reads to the transcriptomeassembly (parameters: 90% identity over 50%of the read length). The SNP/indel calling wasdone using the CLC Genomics Workbench. To insure the high quality of the SNPs/indels,the SNP/indel phred score was set to≥20 (i.e., 1% error rate) and the flanking 3 nucleotidesset to≥15 (i.e., ca. 5% error rate). In the genome assembly, we found 463 single-copy genes,but because of its highly fragmented nature, the vast majority of the hits were scatteredamongmore than one genomic contig. Only eight partial single-copy genes (Table S3) werefound to reside on one contig per gene. The RNA-seq reads from the combined 5-colonydata set (see above) were mapped to these eight genomic contigs (parameters: 80% identityover 80% of the read length), which guided the manual gene model construction. Usingthese gene models, we again mapped the genome data to them to identify SNPs/indels inboth coding and non-coding regions with the same parameters used for the transcriptomeanalysis. Therefore, in total we studied SNPs in 17 single-copy genes in M. capitata bymapping genomic reads to assembled transcripts (nine genes) and to assembled genomicdata for an additional 8 genes.
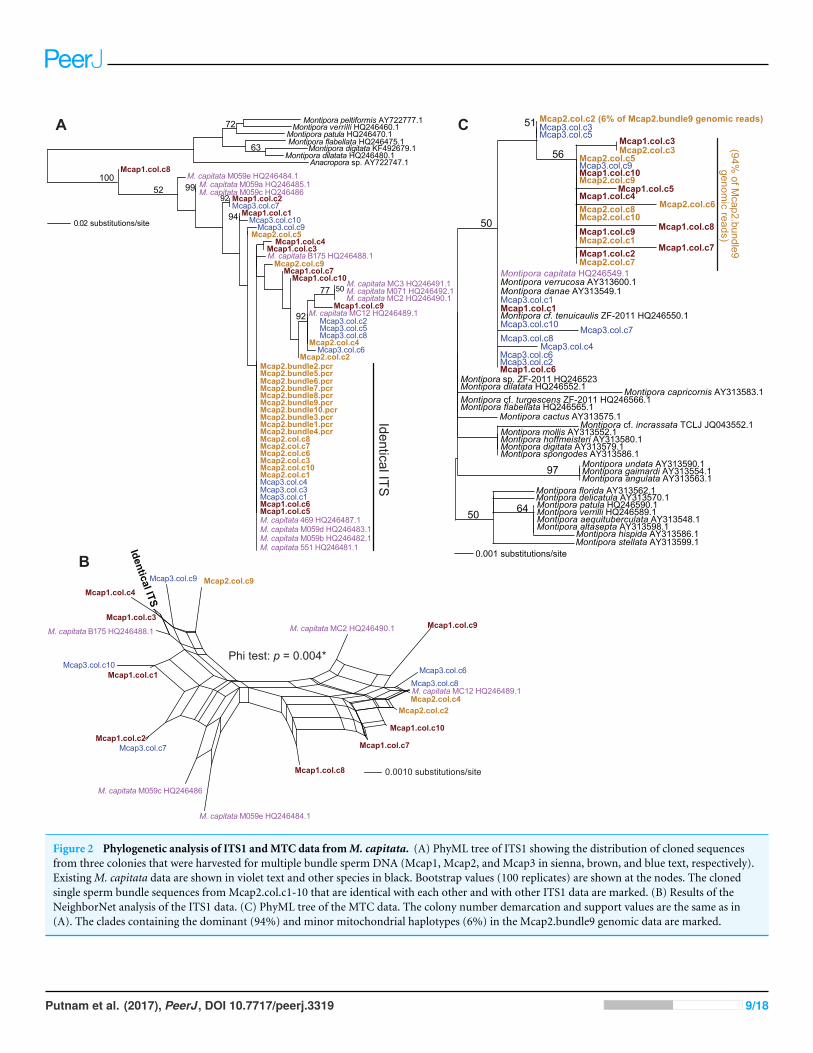
RESULTSPCR analysis of ITS1, MTC, and Pax-CWe tested two specific hypotheses about limited, local populations with the molecularmarker data produced in this study: (1) no differences exist in the host genotype ofmultiple colonies (n= 3 colonies for ITS1 and MTC, and n= 5 colonies for Pax-C),and (2) no differences exist in the host genotype within a colony (n= 10 polyps in threecolonies for ITS1 and MTC; see Table S1 for the sample naming scheme). Our approachwas to isolate sperm DNA from pooled sperm bundles from multiple M. capitata polypsfrom colonies Mcap1, Mcap2 (Reef 51), and Mcap3 (Reef 19), and as egg/sperm bundlesof individual polyps from Mcap2 (e.g., see Fig. 1B), respectively. These DNAs were used astemplates for PCR-amplification of the ribosomal ITS1 region. Sanger sequence analysis ofthe PCR products derived from the pooled sperm bundles showed overlapping peaks onthe chromatograms, therefore we cloned individual PCR products. Ten ITS1 clones fromeach of the three-targeted coral colonies were sequenced (e.g., Mcap1.col.c1-c10 (col =the contribution from a mixture of polyps in each colony)) and the manually aligned 546nt was used to generate a maximum likelihood tree (PhyML; GTR + I model of evolution(alignment available as File S1)). We also added ITS1 data from individual sperm bundle
Putnam et al. (2017), PeerJ, DOI 10.7717/peerj.3319 7/18
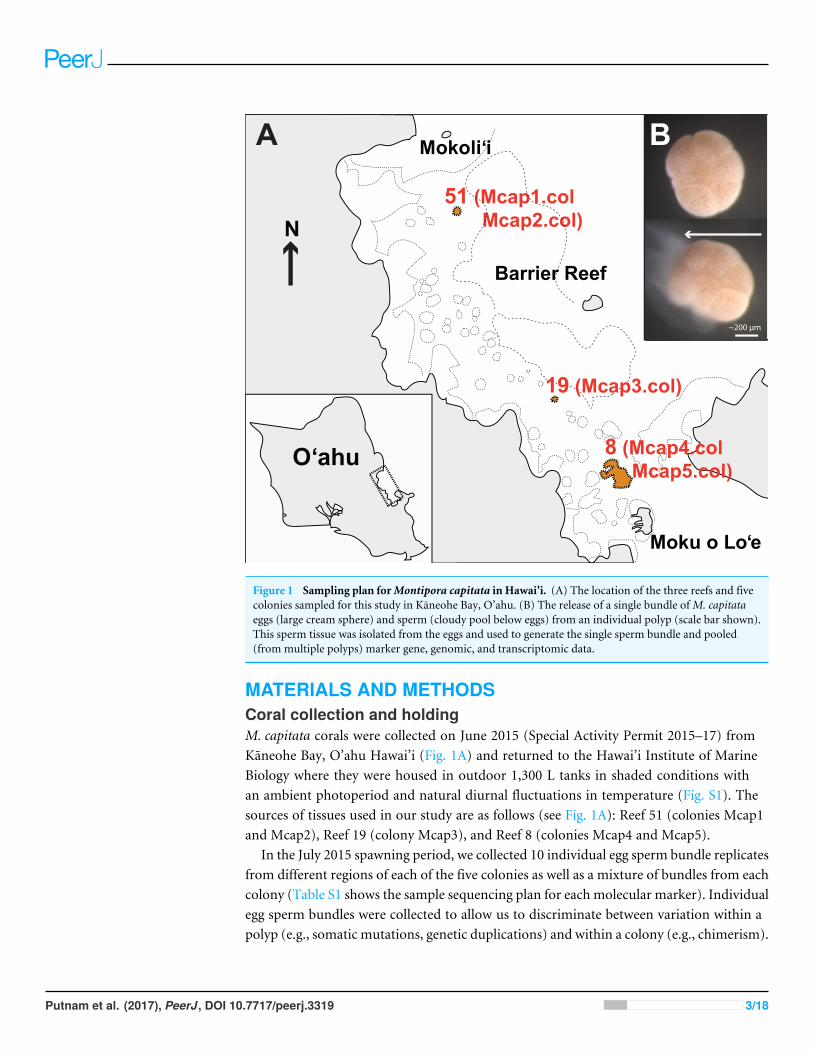
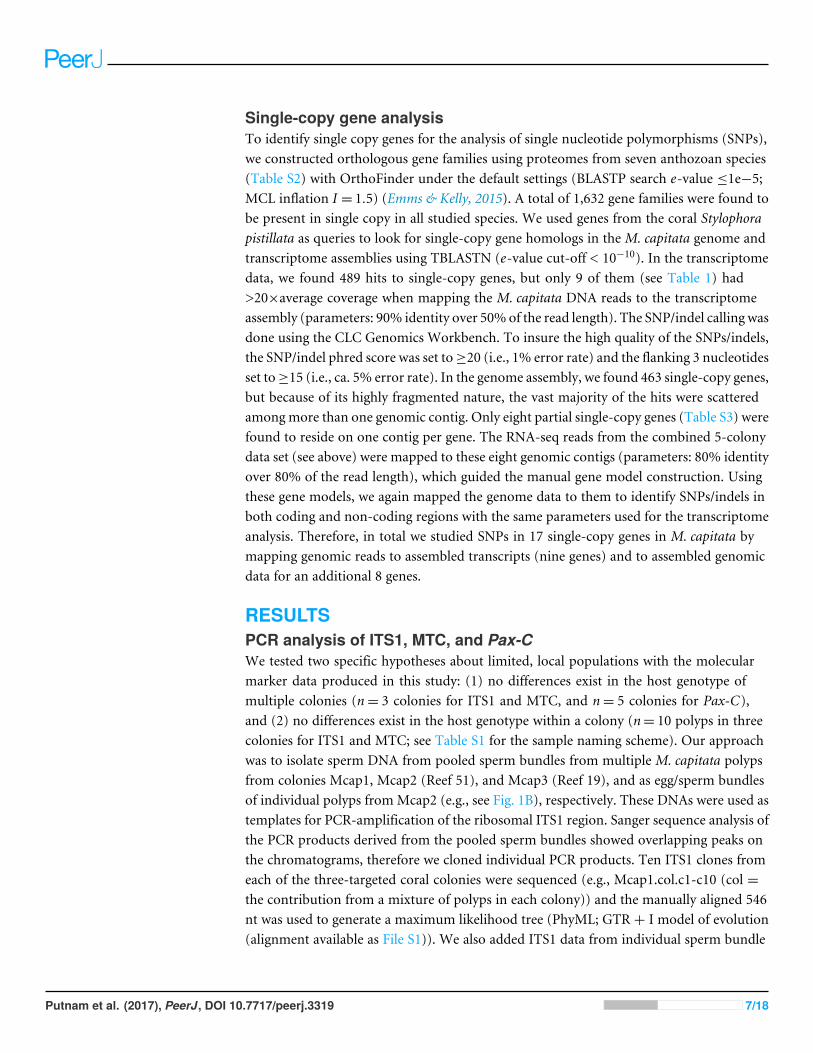
DNAs isolated from different polyps in colony Mcap2 (numbered Mcap2.bundle1-10.pcr(bundle = the contribution from a single polyp in each colony)) (Table S1). Inclusionof NCBI top-hit ITS1 data from different Montipora species (as outgroup) in this treeshows that the M. capitata sequences form a well-supported monophyletic lineage (100%bootstrap) that includes existing data from this species (shown in violet text). The ITS1regions from the different colonies are however intermingled and form 4–5 different clades(albeit many with weak bootstrap support). This topology suggests that individual polypsin the same colony contain distinct ribosomal operons (i.e., with ITS acting as the marker).For example, in Mcap2 (brown text in Fig. 2A), there is a dominant ITS1 form; i.e., all10 single polyp sperm DNAs contain this sequence, whereas from the cloned multiplesperm bundles, 6/10 are also identical with the single polyp data, with the remaining fourencoding distinct sequences. Mcap1 contains ITS1 sequences (shown in sienna text) thatare located in at least 5 different clades, and similar results are found for Mcap3 (shownin blue).
To gain another perspective on the ITS1 data and account for the poor bootstrap supportof many nodes in the ITS1 tree, we used SplitsTree4 (Huson & Bryant, 2006) to generate anetwork with the Net approach using all sites and the GTR + I model of evolution. Here,we excluded the non-M. capitata data, the Mcap2 single bundle data, and combined allidentical or nearly identical (single SNP-bearing) sequences to simplify the analysis. Thisnetwork (Fig. 2B) represents uncertainty in branches that connect nodes as parallel lines andshows that the evolutionary relationships are highly unresolved, consistent with a complexevolutionary history for these rDNA gene families in the different spermDNA samples. ThePhi test in SplitsTree provides significant (p= 0.004) support for recombination amongthese ITS1 regions.
Analysis of the maternally encoded MTC marker (466 nt) (Work et al., 2011) includedmultiple cloned sequences from colonies Mcap1-3 as well as a MTC sequence identified inMcap2.bundle9 shotgun genomic library sequencing (see below). PhyML analysis of thesedata (Fig. 2C) shows that mtDNA has a complex evolutionary history in these corals withseveralMontipora species (e.g.,M. danae,M. verrucosa) forming a monophyletic clade andthe cloned MTCs representing at least 3 M. capitata haplotypes (alignment available asFile S2). NeighborNet analysis provides no evidence for reticulate evolution among thesesequences (Fig. S2, phi test p= 0.8068). The M. flabellata MTC region is distinct from theM. capitata clade. These results suggest that multiple mtDNA haplotypes occur in the threestudiedM. capitata colonies.
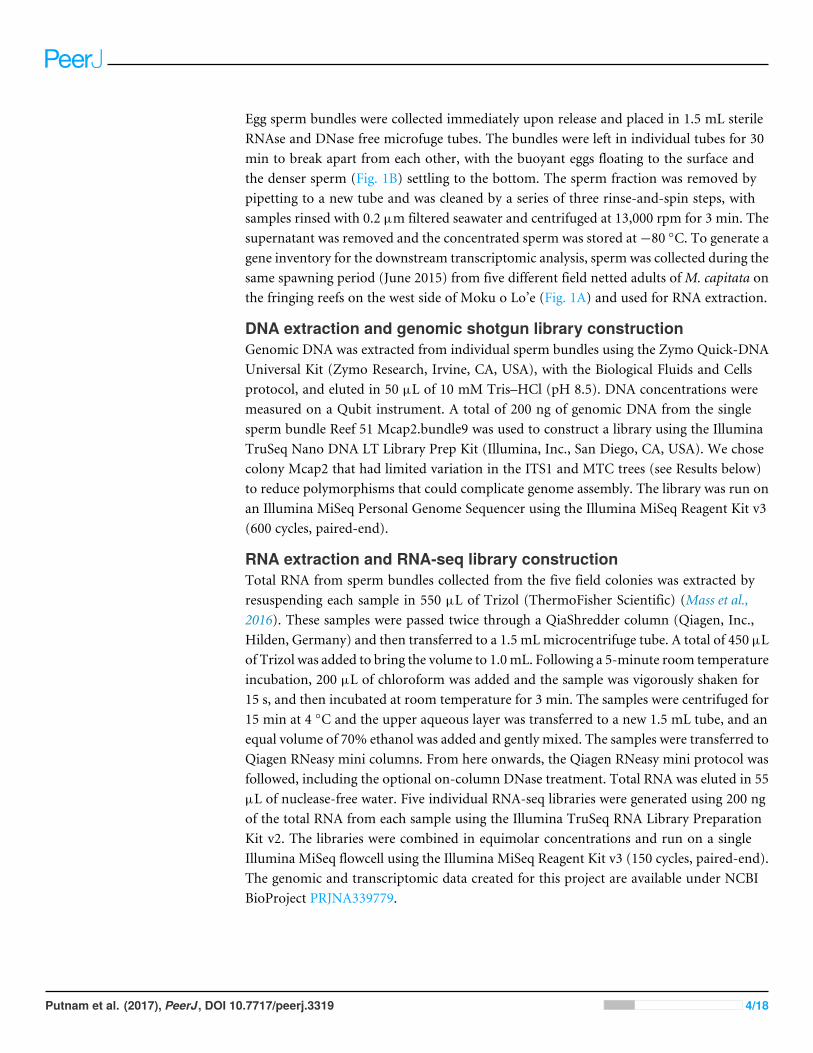
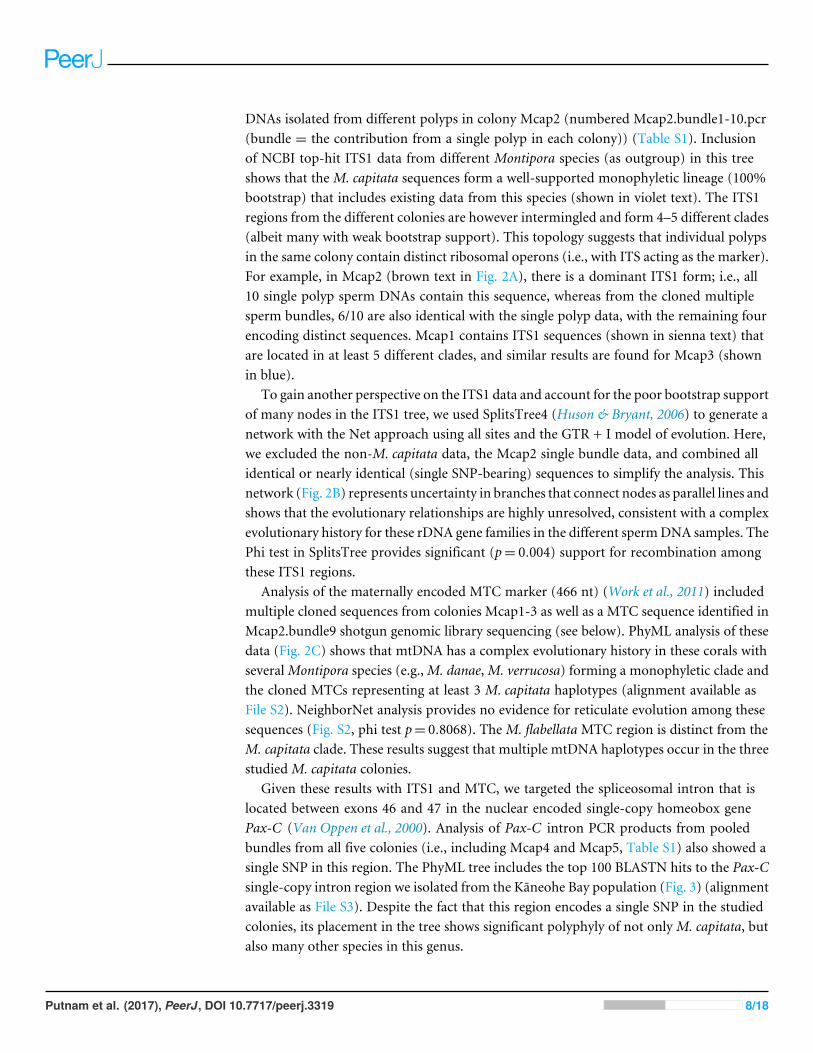
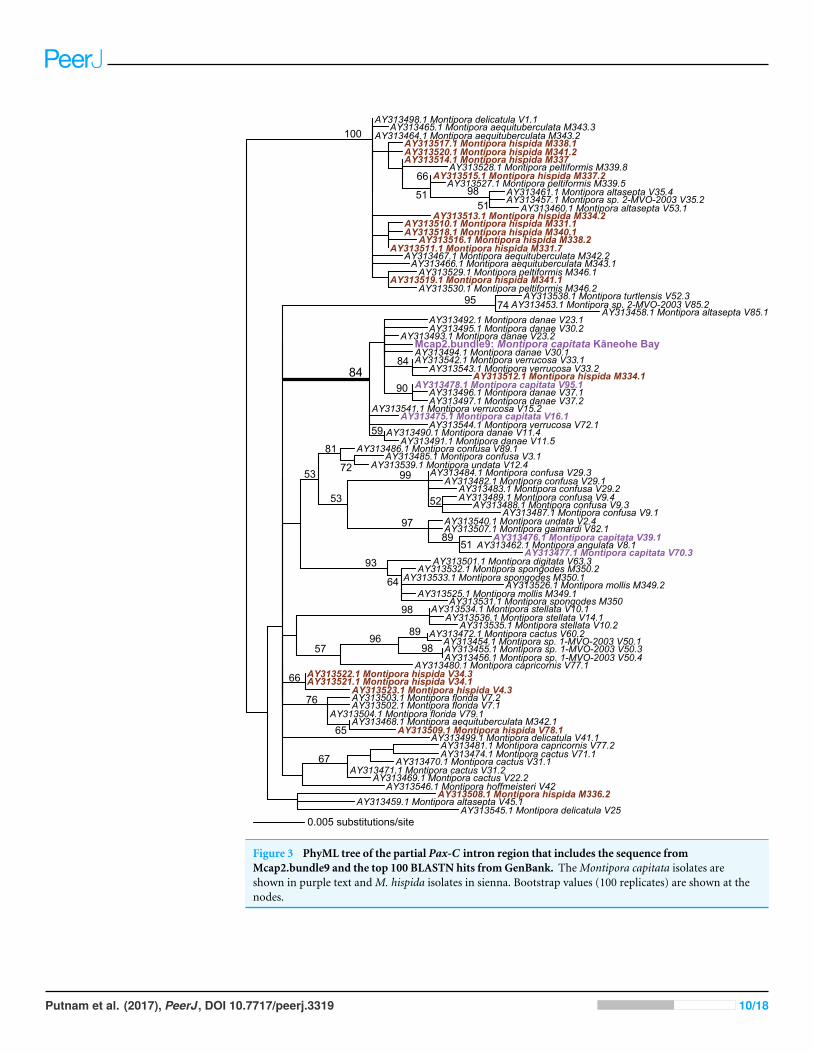
Given these results with ITS1 and MTC, we targeted the spliceosomal intron that islocated between exons 46 and 47 in the nuclear encoded single-copy homeobox genePax-C (Van Oppen et al., 2000). Analysis of Pax-C intron PCR products from pooledbundles from all five colonies (i.e., including Mcap4 and Mcap5, Table S1) also showed asingle SNP in this region. The PhyML tree includes the top 100 BLASTN hits to the Pax-Csingle-copy intron region we isolated from the Kaneohe Bay population (Fig. 3) (alignmentavailable as File S3). Despite the fact that this region encodes a single SNP in the studiedcolonies, its placement in the tree shows significant polyphyly of not only M. capitata, butalso many other species in this genus.
Putnam et al. (2017), PeerJ, DOI 10.7717/peerj.3319 8/18
Montipora stellata AY313599.1Montipora hispida AY313586.1
Montipora altasepta AY313598.1Montipora aequituberculata AY313548.1Montipora verrilli HQ246589.1Montipora patula HQ246590.1Montipora delicatula AY313570.1Montipora florida AY313562.1
64
Montipora angulata AY313563.1Montipora gaimardi AY313554.1Montipora undata AY313590.1
Montipora spongodes AY313586.1Montipora digitata AY313579.1Montipora hoffmeisteri AY313580.1Montipora mollis AY313552.1
Montipora cf. incrassata TCLJ JQ043552.1Montipora cactus AY313575.1
Montipora flabellata HQ246565.1Montipora cf. turgescens ZF-2011 HQ246566.1
Montipora capricornis AY313583.1Montipora dilatata HQ246552.1Montipora sp. ZF-2011 HQ246523
Mcap1.col.c6Mcap3.col.c2Mcap3.col.c6
Mcap3.col.c4Mcap3.col.c8
Mcap3.col.c7Mcap3.col.c10Montipora cf. tenuicaulis ZF-2011 HQ246550.1Mcap1.col.c1Mcap3.col.c1Montipora danae AY313549.1Montipora verrucosa AY313600.1Montipora capitata HQ246549.1
Mcap2.col.c7Mcap1.col.c2 Mcap1.col.c7Mcap2.col.c1Mcap1.col.c9 Mcap1.col.c8Mcap2.col.c10Mcap2.col.c8 Mcap2.col.c6Mcap1.col.c4
Mcap1.col.c5Mcap2.col.c9Mcap1.col.c10Mcap3.col.c9Mcap2.col.c5
Mcap2.col.c3Mcap1.col.c3
Mcap3.col.c5Mcap3.col.c3Mcap2.col.c2 (6% of Mcap2.bundle9 genomic reads)
56
51
50
97
50
0.001 substitutions/siteM. capitata 551 HQ246481.1M. capitata M059b HQ246482.1
M. capitata 469 HQ246487.1M. capitata M059d HQ246483.1
M. capitata B175 HQ246488.1
M. capitata M059c HQ246486M. capitata M059a HQ246485.1
M. capitata M059e HQ246484.1
M. capitata MC12 HQ246489.1
M. capitata MC2 HQ246490.1M. capitata M071 HQ246492.1M. capitata MC3 HQ246491.1
Anacropora sp. AY722747.1Montipora dilatata HQ246480.1
Montipora digitata KF492679.1Montipora flabellata HQ246475.1Montipora patula HQ246470.1
Montipora verrilli HQ246460.1Montipora peltiformis AY722777.1
0.02 substitutions/site
A C
Mcap1.col.c5Mcap1.col.c6Mcap3.col.c1Mcap3.col.c3Mcap3.col.c4Mcap2.col.c1Mcap2.col.c10Mcap2.col.c3Mcap2.col.c6Mcap2.col.c7Mcap2.col.c8
Mcap2.bundle10.pcrMcap2.bundle9.pcrMcap2.bundle8.pcrMcap2.bundle7.pcrMcap2.bundle6.pcrMcap2.bundle5.pcrMcap2.bundle2.pcr
Mcap2.col.c2Mcap3.col.c6
Mcap2.col.c4Mcap3.col.c8Mcap3.col.c5Mcap3.col.c292
Mcap1.col.c9
5077Mcap1.col.c10
Mcap1.col.c7Mcap2.col.c9
Mcap1.col.c3Mcap1.col.c4
Mcap2.bundle4.pcrMcap2.bundle1.pcrMcap2.bundle3.pcr
Mcap2.col.c5Mcap3.col.c9
Mcap3.col.c10Mcap1.col.c194
Mcap3.col.c7Mcap1.col.c292
99
Mcap1.col.c8
52
63
72
100
Identical ITS
B
M. capitata M059e HQ246484.1
M. capitata M059c HQ246486
M. capitata MC12 HQ246489.1
M. capitata MC2 HQ246490.1M. capitata B175 HQ246488.1
Mcap1.col.c2Mcap3.col.c7
Mcap2.col.c2Mcap2.col.c4
Mcap3.col.c8Mcap3.col.c6
Mcap1.col.c9
Mcap1.col.c10
Mcap1.col.c7
Mcap1.col.c8
Mcap2.col.c9Mcap3.col.c9
Mcap3.col.c10Mcap1.col.c1
Mcap1.col.c4
Mcap1.col.c3
Identical ITS
0.0010 substitutions/site
Phi test: p = 0.004*
(94% of M
cap2.bundle9 genom
ic reads)
Figure 2 Phylogenetic analysis of ITS1 andMTC data fromM. capitata. (A) PhyML tree of ITS1 showing the distribution of cloned sequencesfrom three colonies that were harvested for multiple bundle sperm DNA (Mcap1, Mcap2, and Mcap3 in sienna, brown, and blue text, respectively).ExistingM. capitata data are shown in violet text and other species in black. Bootstrap values (100 replicates) are shown at the nodes. The clonedsingle sperm bundle sequences from Mcap2.col.c1-10 that are identical with each other and with other ITS1 data are marked. (B) Results of theNeighborNet analysis of the ITS1 data. (C) PhyML tree of the MTC data. The colony number demarcation and support values are the same as in(A). The clades containing the dominant (94%) and minor mitochondrial haplotypes (6%) in the Mcap2.bundle9 genomic data are marked.
Putnam et al. (2017), PeerJ, DOI 10.7717/peerj.3319 9/18
AY313545.1 Montipora delicatula V25AY313459.1 Montipora altasepta V45.1
AY313508.1 Montipora hispida M336.2 AY313546.1 Montipora hoffmeisteri V42
AY313469.1 Montipora cactus V22.2 AY313471.1 Montipora cactus V31.2
AY313470.1 Montipora cactus V31.1 AY313474.1 Montipora cactus V71.1 AY313481.1 Montipora capricornis V77.2
67
AY313499.1 Montipora delicatula V41.1AY313509.1 Montipora hispida V78.1
AY313468.1 Montipora aequituberculata M342.1 AY313504.1 Montipora florida V79.1
65
AY313502.1 Montipora florida V7.1 AY313503.1 Montipora florida V7.2 AY313523.1 Montipora hispida V4.3
AY313521.1 Montipora hispida V34.1 AY313522.1 Montipora hispida V34.3
76
66AY313480.1 Montipora capricornis V77.1
AY313456.1 Montipora sp. 1-MVO-2003 V50.4 AY313455.1 Montipora sp. 1-MVO-2003 V50.3 AY313454.1 Montipora sp. 1-MVO-2003 V50.1
AY313472.1 Montipora cactus V60.298
8996
AY313535.1 Montipora stellata V10.2 AY313536.1 Montipora stellata V14.1
AY313534.1 Montipora stellata V10.1
57
98AY313531.1 Montipora spongodes M350
AY313525.1 Montipora mollis M349.1 AY313526.1 Montipora mollis M349.2
AY313533.1 Montipora spongodes M350.1 AY313532.1 Montipora spongodes M350.2
AY313501.1 Montipora digitata V63.3
64
AY313477.1 Montipora capitata V70.3 AY313462.1 Montipora angulata V8.1
AY313476.1 Montipora capitata V39.1 AY313507.1 Montipora gaimardi V82.1 89AY313540.1 Montipora undata V2.4
51
AY313487.1 Montipora confusa V9.1 AY313488.1 Montipora confusa V9.3
AY313489.1 Montipora confusa V9.4 AY313483.1 Montipora confusa V29.2
52
AY313482.1 Montipora confusa V29.1 AY313484.1 Montipora confusa V29.3
97
99AY313539.1 Montipora undata V12.4
AY313485.1 Montipora confusa V3.1 AY313486.1 Montipora confusa V89.1
72
53
81
93
53
AY313491.1 Montipora danae V11.5 AY313490.1 Montipora danae V11.4
AY313544.1 Montipora verrucosa V72.159AY313475.1 Montipora capitata V16.1
AY313541.1 Montipora verrucosa V15.2AY313497.1 Montipora danae V37.2 AY313496.1 Montipora danae V37.1
AY313478.1 Montipora capitata V95.1AY313512.1 Montipora hispida M334.1
AY313543.1 Montipora verrucosa V33.2AY313542.1 Montipora verrucosa V33.1AY313494.1 Montipora danae V30.1Mcap2.bundle9: Montipora capitata Kāneohe Bay
84
AY313493.1 Montipora danae V23.2AY313495.1 Montipora danae V30.2
90
AY313492.1 Montipora danae V23.1AY313458.1 Montipora altasepta V85.1
AY313453.1 Montipora sp. 2-MVO-2003 V85.2AY313538.1 Montipora turtlensis V52.3
74
84
95AY313530.1 Montipora peltiformis M346.2
AY313519.1 Montipora hispida M341.1 AY313529.1 Montipora peltiformis M346.1
AY313466.1 Montipora aequituberculata M343.1 AY313467.1 Montipora aequituberculata M342.2
AY313511.1 Montipora hispida M331.7 AY313516.1 Montipora hispida M338.2
AY313518.1 Montipora hispida M340.1 AY313510.1 Montipora hispida M331.1
AY313513.1 Montipora hispida M334.2 AY313460.1 Montipora altasepta V53.1
AY313457.1 Montipora sp. 2-MVO-2003 V35.2 AY313461.1 Montipora altasepta V35.4
51
AY313527.1 Montipora peltiformis M339.5 AY313515.1 Montipora hispida M337.2
9866
AY313528.1 Montipora peltiformis M339.8
51
AY313514.1 Montipora hispida M337 AY313520.1 Montipora hispida M341.2 AY313517.1 Montipora hispida M338.1
AY313464.1 Montipora aequituberculata M343.2 AY313465.1 Montipora aequituberculata M343.3
AY313498.1 Montipora delicatula V1.1 100
0.005 substitutions/site
Figure 3 PhyML tree of the partial Pax-C intron region that includes the sequence fromMcap2.bundle9 and the top 100 BLASTN hits fromGenBank. TheMontipora capitata isolates areshown in purple text andM. hispida isolates in sienna. Bootstrap values (100 replicates) are shown at thenodes.
Putnam et al. (2017), PeerJ, DOI 10.7717/peerj.3319 10/18
Genomic analysis of ITS, MTC, and Pax-CWe analyzed draft genome data (14 Gbp of Illumina sequence with an average read length= 200 bp) from the single sperm bundle DNA isolated from Mcap2.bundle9 (Table S1).The ITS1 PCR fragment from this DNA was Sanger sequenced and provided clean dataalthough some sites showed minor peaks supporting low frequency A–G substitutions.This ITS1 sequence was used to recruit genomic reads (80% identity over 80% of theread length) from the Mcap2.bundle9 data for alignment and SNP calling. This analysisshowed that 19 high quality SNPs/indels were present among the 6,394 reads that mappedto the partial ITS1 region (615 bp). Within these mapped reads, the SNP/indel frequencieswere low, varying from 2.2% to 15.6% at polymorphic sites. These results suggest that therDNA ITS1 region in Mcap2.bundle9 is represented by a nearly homogenous collection ofsequences, with some minor variation among repeat copies.
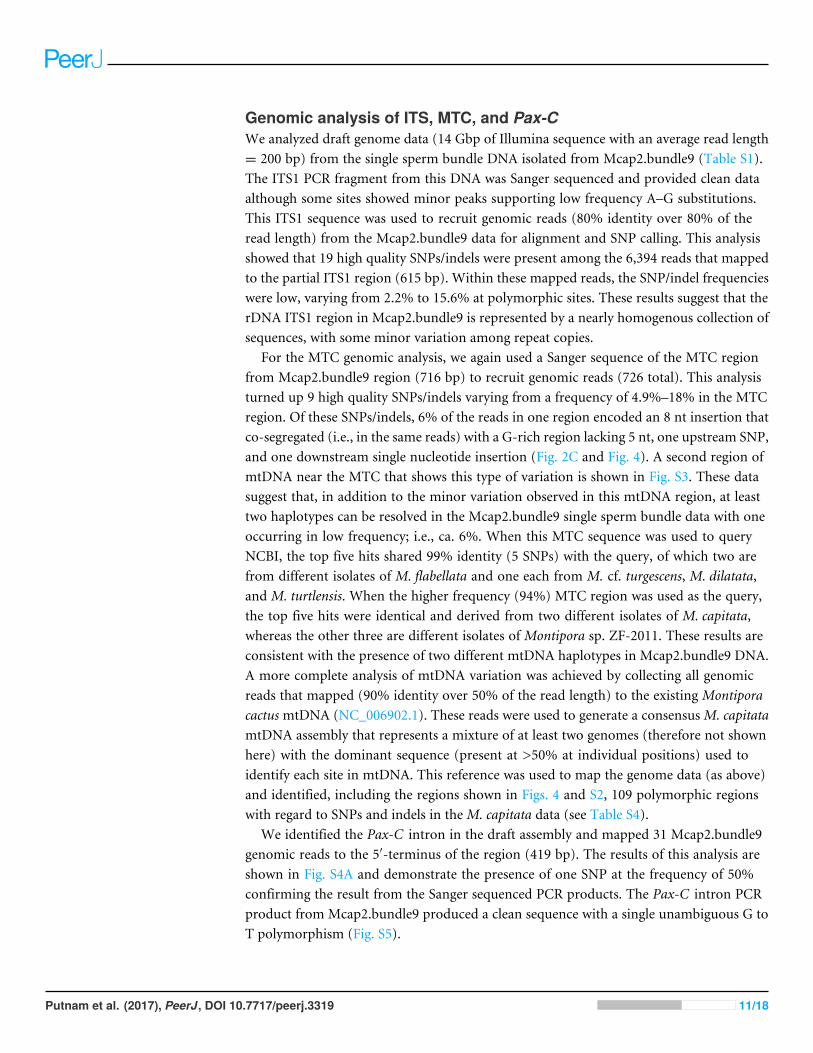
For the MTC genomic analysis, we again used a Sanger sequence of the MTC regionfrom Mcap2.bundle9 region (716 bp) to recruit genomic reads (726 total). This analysisturned up 9 high quality SNPs/indels varying from a frequency of 4.9%–18% in the MTCregion. Of these SNPs/indels, 6% of the reads in one region encoded an 8 nt insertion thatco-segregated (i.e., in the same reads) with a G-rich region lacking 5 nt, one upstream SNP,and one downstream single nucleotide insertion (Fig. 2C and Fig. 4). A second region ofmtDNA near the MTC that shows this type of variation is shown in Fig. S3. These datasuggest that, in addition to the minor variation observed in this mtDNA region, at leasttwo haplotypes can be resolved in the Mcap2.bundle9 single sperm bundle data with oneoccurring in low frequency; i.e., ca. 6%. When this MTC sequence was used to queryNCBI, the top five hits shared 99% identity (5 SNPs) with the query, of which two arefrom different isolates of M. flabellata and one each from M. cf. turgescens, M. dilatata,and M. turtlensis. When the higher frequency (94%) MTC region was used as the query,the top five hits were identical and derived from two different isolates of M. capitata,whereas the other three are different isolates of Montipora sp. ZF-2011. These results areconsistent with the presence of two different mtDNA haplotypes in Mcap2.bundle9 DNA.A more complete analysis of mtDNA variation was achieved by collecting all genomicreads that mapped (90% identity over 50% of the read length) to the existing MontiporacactusmtDNA (NC_006902.1). These reads were used to generate a consensusM. capitatamtDNA assembly that represents a mixture of at least two genomes (therefore not shownhere) with the dominant sequence (present at >50% at individual positions) used toidentify each site in mtDNA. This reference was used to map the genome data (as above)and identified, including the regions shown in Figs. 4 and S2, 109 polymorphic regionswith regard to SNPs and indels in theM. capitata data (see Table S4).
We identified the Pax-C intron in the draft assembly and mapped 31 Mcap2.bundle9genomic reads to the 5′-terminus of the region (419 bp). The results of this analysis areshown in Fig. S4A and demonstrate the presence of one SNP at the frequency of 50%confirming the result from the Sanger sequenced PCR products. The Pax-C intron PCRproduct from Mcap2.bundle9 produced a clean sequence with a single unambiguous G toT polymorphism (Fig. S5).
Putnam et al. (2017), PeerJ, DOI 10.7717/peerj.3319 11/18
T AGA A T T CT CT A AGGA AGA T CT AGAGCAGA CT T CT GG- - - - - - - - GT GAGT A T AGT GAGGCT A T T T AGT T T T T GT GCT T AGAGGT T AGGGGGGGGGGGGT CT T GCGT GCGCCT T T T GGA T GA AGAGGGA CGGT CCT A T CT A T T A A T A T GG - T T
T AGA A T T CT C A AGGGAGA T CT AGAGCAGA CT T CT GGGCT CGT A AGT GAGT A T AGT GAGGCT A T T T AGT T T T T GT GCT T AGAGGT T A - - - - - GGGGGGGT CT T GCGT GCGCCT T T T GGA T GA AGAGGGA CGGT CCT A T CT A T T A A T A T GGT T T
MTC Region. . .
. . .
. . .
. . .
. . .
. . .
. . .
. . .
. . .
. . .
. . .
. . .
. . .
. . .{Mcap2.bundle9 Genomic Reads
T
Figure 4 Mapping of Mcap2.bundle9 genomic data to the MTC region (716 bp).Nine high quality SNPs/indels were found, varying in frequencyfrom 4.9% to 18% in the MTC region. Of these SNPs/indels, 6% of the reads in one region encoded an 8 nt insertion that co-segregated (i.e., in thesame reads) with a 5 nt deletion from a G-rich region, a downstream single nucleotide insertion, and one upstream SNP.
Single-copy gene analysisGiven the conflicting results among the ITS, MTC, and Pax-C data, we searched foradditional single-copy genes in the M. capitata transcriptome data following a stringentprocedure (see Methods) and recovered nine candidate partial gene sequences in thisassembly with a SNP/indel frequency that ranges from 40.5 to 53.7% (Table 1). We thenasked the question whether the low number of SNPS/indels and their frequency would holdif we used PCR to amplify single-copy cDNA regions from multiple bundle sperm cDNAisolated from colony Mcap2, that showed limited variation in the ITS1 and MTC trees(Fig. 2). The SNP numbers and their locations in the genomic mapping of Mcap2.bundle9sequences were compared to positions of uncertainty (i.e., two coincident strong peaks) inthe chromatograms derived from PCR products that encode the same genes (e.g., Fig. S5).These results show that the genomic-based SNP data from Mcap2.bundle9 match exactlythe multiple bundle sperm PCR sequence output from this colony.
To study genetic variation in non-coding regions as well as the coding regions, wesearched for single-copy genes in the M. capitata genome assembly, which were thancombined with the relevant RNA-seq data to manually build an additional eight genemodels (Table S3). We then mapped the genomic reads back to each genome-derived genemodel (e.g., Fig. S4B for the microtubule-associated protein 1A/1B light chain 3C-likesequence (1 SNP) and Fig. S4C for the Myb-like protein X (0 SNPs)) to count the numberof SNPs/indels in the coding and non-coding regions. This analysis showed that the eightgene models had either 0 or 1 SNPs, with the frequency of 1 SNP close to 50% (Table S3).The mapping data suggest that the single sperm bundle DNA encodes SNPs at a frequencyof ca. 50%, as would be expected for meiotic products derived from a diploid parent. Thesedata suggest that all polyps sampled from Mcap2 are derived from a single genotype withno evidence of mosaicism or chimerism. Analysis of Pax-C intron PCR products from allfive colonies (i.e., Mcap1-5) showed no novel SNPs in this region (i.e., see Figs. S4 and S5).
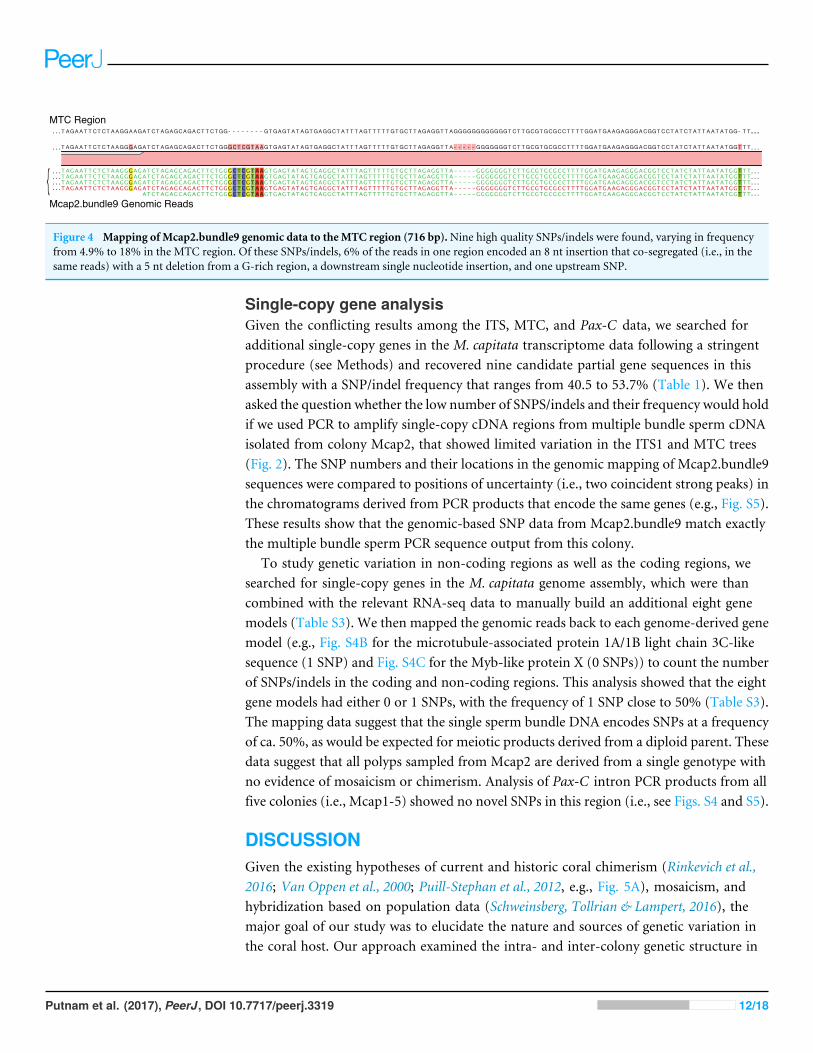
DISCUSSIONGiven the existing hypotheses of current and historic coral chimerism (Rinkevich et al.,2016; Van Oppen et al., 2000; Puill-Stephan et al., 2012, e.g., Fig. 5A), mosaicism, andhybridization based on population data (Schweinsberg, Tollrian & Lampert, 2016), themajor goal of our study was to elucidate the nature and sources of genetic variation inthe coral host. Our approach examined the intra- and inter-colony genetic structure in
Putnam et al. (2017), PeerJ, DOI 10.7717/peerj.3319 12/18
Nuclear background (no chimerism)
ITS: variants exist (incomplete homogenization)
mtDNA: 2 haplotypes (introgression)
SNPs (50%) in Single Copy Genes 94% Mcap
6% Mflaband others2.2%-15.6%
SNP sites
>94% sites identical
A
B
~500µm
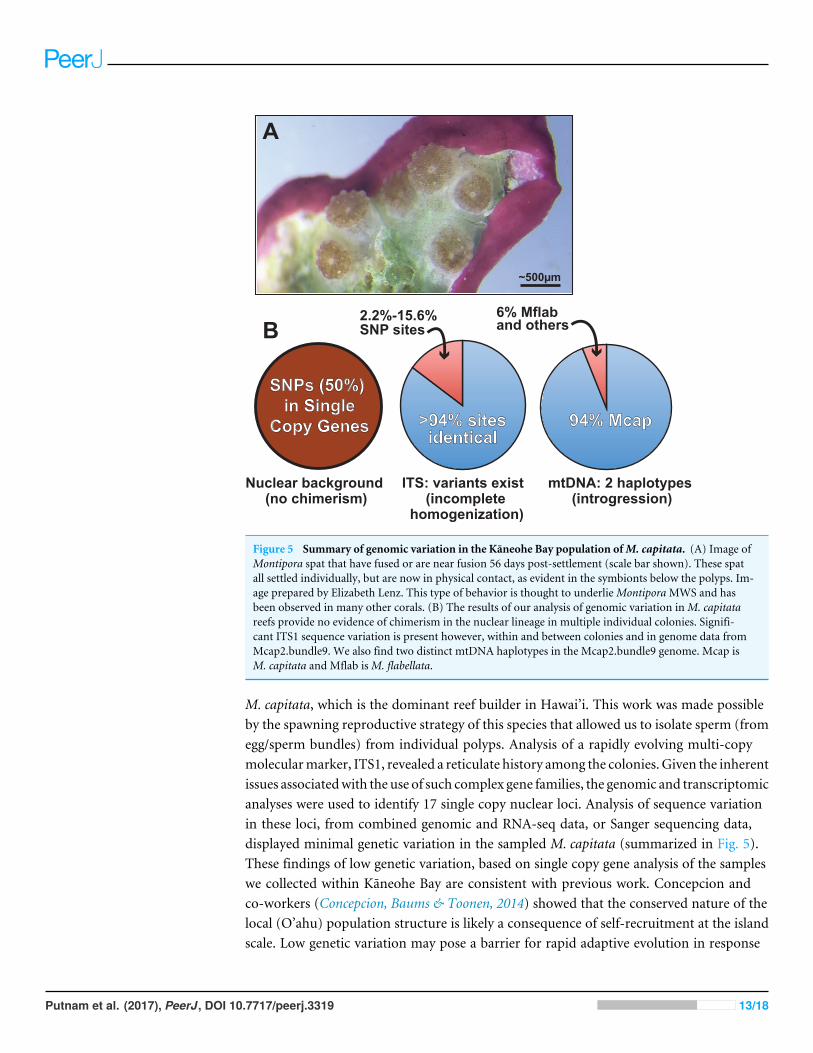
Figure 5 Summary of genomic variation in the Kaneohe Bay population ofM. capitata. (A) Image ofMontipora spat that have fused or are near fusion 56 days post-settlement (scale bar shown). These spatall settled individually, but are now in physical contact, as evident in the symbionts below the polyps. Im-age prepared by Elizabeth Lenz. This type of behavior is thought to underlieMontiporaMWS and hasbeen observed in many other corals. (B) The results of our analysis of genomic variation inM. capitatareefs provide no evidence of chimerism in the nuclear lineage in multiple individual colonies. Signifi-cant ITS1 sequence variation is present however, within and between colonies and in genome data fromMcap2.bundle9. We also find two distinct mtDNA haplotypes in the Mcap2.bundle9 genome. Mcap isM. capitata and Mflab isM. flabellata.
M. capitata, which is the dominant reef builder in Hawai’i. This work was made possibleby the spawning reproductive strategy of this species that allowed us to isolate sperm (fromegg/sperm bundles) from individual polyps. Analysis of a rapidly evolving multi-copymolecularmarker, ITS1, revealed a reticulate history among the colonies. Given the inherentissues associatedwith the use of such complex gene families, the genomic and transcriptomicanalyses were used to identify 17 single copy nuclear loci. Analysis of sequence variationin these loci, from combined genomic and RNA-seq data, or Sanger sequencing data,displayed minimal genetic variation in the sampled M. capitata (summarized in Fig. 5).These findings of low genetic variation, based on single copy gene analysis of the sampleswe collected within Kaneohe Bay are consistent with previous work. Concepcion andco-workers (Concepcion, Baums & Toonen, 2014) showed that the conserved nature of thelocal (O’ahu) population structure is likely a consequence of self-recruitment at the islandscale. Low genetic variation may pose a barrier for rapid adaptive evolution in response
Putnam et al. (2017), PeerJ, DOI 10.7717/peerj.3319 13/18
to climate change. However, the observed low levels of polymorphism could facilitategenome sequencing assemblies, mapping RNA-seq data, methylomics, proteomics, andmicrobiome analyses that enable studies of adaptive responses in local reefs that undergodifferent environmental stresses (Guadayol et al., 2014).
A more broadly sampled population study ofM. capitata in Hawai’i has shown complexgenetic histories of single coral colonies in the form of inter-species chimerism (Worket al., 2011). Our examination of the nature of host genetic variation, albeit based on asmall number of colonies, provides evidence of historic inter-species chimerism only inthe mitochondrial data. These remnants of past chimerism or hybridization may continueto contribute to the genetic toolkit of M. capitata. Here, the mtDNA is represented at lowfrequency (6% in DNA from a single egg sperm bundle) by the lineage of M. flabellata; aspecies known to form inter-species chimeras withM. capitata (Work et al., 2011). Becausethis variation was detectable within a single bundle from an individual polyp and acrossa colony, the mitochondrial complement likely contains significant variation; i.e., isheteroplasmic (Rand, 2001). TheM. flabellata genome has apparently introgressed into theKaneohe Bay M. capitata population although it appears that the nuclear genome regionswe studied are free of M. flabellata DNA. Selection may remove foreign (nuclear) lineagesfrom this M. capitata population (e.g., Montipora White Syndrome) although differentmtDNA haplotypes, if differing only with respect to neutral DNA changes, have beenretained in the heteroplasmic mitochondrial pool (Aanen, Spelbrink & Beekman, 2014;Jacobsen et al., 2016). It is also possible that different mtDNAs derived via introgressionconfer selective advantages (Boratyński et al., 2011) to coral physiology and can becomefixed or maintained over time.
By taking a genome-wide approach, our findings provide unambiguous markersand genomic resources for further functional genomic studies of coral adaptation andacclimatization to ongoing environmental change. These results also lead to a moreinformed view of the role of coral genomics in coral holobiont adaptation in which thenuclear and mitochondrial compartments provide different perspectives.
ACKNOWLEDGEMENTSWe thank the Rutgers School of Environmental and Biological Sciences for supporting theactivities of the Genome Cooperative that generated much of the data used in this research.
ADDITIONAL INFORMATION AND DECLARATIONS
FundingThis work was made possible by grants from the National Science Foundation EF-1416785awarded to P.G.F., T.M. and D.B, OCE-PRF 1323822 to H.M.P., and Hawaii EPSCoREPS-0903833. Funding was also provided by the Paul G. Allen Family Foundation toR.D.G. and by the US-Israel Binational Science Foundation (BSF-2014035) to D.K.A. andT.M. The funders had no role in study design, data collection and analysis, decision topublish, or preparation of the manuscript.
Putnam et al. (2017), PeerJ, DOI 10.7717/peerj.3319 14/18
Grant DisclosuresThe following grant information was disclosed by the authors:National Science Foundation: EF-1416785.US-Israel Binational Science Foundation: BSF-2014035.
Competing InterestsThe authors declare there are no competing interests.
Author Contributions• Hollie M. Putnam conceived and designed the experiments, performed the experiments,analyzed the data, contributed reagents/materials/analysis tools, wrote the paper,prepared figures and/or tables, reviewed drafts of the paper.• Diane K. Adams conceived and designed the experiments, performed the experiments,contributed reagents/materials/analysis tools, reviewed drafts of the paper.• Ehud Zelzion and Huan Qiu analyzed the data, contributed reagents/materials/analysistools, wrote the paper, prepared figures and/or tables, reviewed drafts of the paper.• Nicole E. Wagner performed the experiments, contributed reagents/materials/analysistools.• Tali Mass performed the experiments.• Paul G. Falkowski reviewed drafts of the paper.• Ruth D. Gates reviewed drafts of the paper, logistical support critical for makingcollections.• Debashish Bhattacharya conceived and designed the experiments, analyzed the data,wrote the paper, prepared figures and/or tables, reviewed drafts of the paper.
Field Study PermissionsThe following information was supplied relating to field study approvals (i.e., approvingbody and any reference numbers):
M. capitata corals were collected on June 2015 (Special Activity Permit 2015-17) fromKaneohe Bay, O’ahu, Hawai’i.
DNA DepositionThe following information was supplied regarding the deposition of DNA sequences:
The genomic data created for this project are available under the NCBI BioProjectPRJNA339779.
Data AvailabilityThe following information was supplied regarding data availability:
NCBI BioProject PRJNA339779.
Supplemental InformationSupplemental information for this article can be found online at http://dx.doi.org/10.7717/peerj.3319#supplemental-information.
Putnam et al. (2017), PeerJ, DOI 10.7717/peerj.3319 15/18
REFERENCESAanen DK, Spelbrink JN, BeekmanM. 2014.What cost mitochondria? The maintenance
of functional mitochondrial DNA within and across generations. PhilosophicalTransactions of the Royal Society of London. Series B: Biological Sciences 369:20130438DOI 10.1098/rstb.2013.0438.
Barfield S, Aglyamova GV, Matz MV. 2016. Evolutionary origins of germline segregationin Metazoa: evidence for a germ stem cell lineage in the coral Orbicella faveolata(Cnidaria, Anthozoa). Proceedings of the Royal Society B: Biological Sciences 283:Article 20152128 DOI 10.1098/rspb.2015.2128.
Bhattacharya D, Agrawal S, ArandaM, Baumgarten S, Belcaid M, Drake JL, Erwin D,Foret S, Gates RD, Gruber DF, Kamel B, Lesser MP, Levy O, Liew YJ, MacManes M,Mass T, MedinaM,Mehr S, Meyer E, Price DC, PutnamHM, Qiu H, Shinzato C,Shoguchi E, Stokes AJ, Tambutté S, Tchernov D, Voolstra CR,Wagner N,WalkerCW,Weber AP,Weis V, Zelzion E, Zoccola D, Falkowski PG. 2016. Comparativegenomics explains the evolutionary success of reef-forming corals. Life 5:e13288DOI 10.7554/eLife.13288.
Boratyński Z, Alves PC, Berto S, Koskela E, Mappes T, Melo-Ferreira J. 2011. Introgres-sion of mitochondrial DNA amongMyodes voles: consequences for energetics? BMCEvolutionary Biology 11:355 DOI 10.1186/1471-2148-11-355.
Concepcion FT, Baums IB, Toonen RJ. 2014. Regional population structure ofMontipora capitata across the Hawaiian Archipelago. Bulletin of Marine Science90:257–275 DOI 10.5343/bms.2012.1109.
Emms DM, Kelly S. 2015. OrthoFinder: solving fundamental biases in whole genomecomparisons dramatically improves orthogroup inference accuracy. Genome Biology16: Article 157 DOI 10.1186/s13059-015-0721-2.
Forsman Z, Barshis D, Hunter C, Toonen R. 2009. Shape-shifting corals: molecularmarkers show morphology is evolutionarily plastic in Porites. BMC EvolutionaryBiology 9:45 DOI 10.1186/1471-2148-9-45.
Guadayol Ò, Silbiger NJ, DonahueMJ, Thomas FI. 2014. Patterns in temporal variabil-ity of temperature, oxygen and pH along an environmental gradient in a coral reef.PLOS ONE 9:e85213 DOI 10.1371/journal.pone.0085213.
Haas AF, Smith JE, ThompsonM, Deheyn DD. 2014. Effects of reduced dissolvedoxygen concentrations on physiology and fluorescence of hermatypic corals andbenthic algae. PeerJ 2:e235 DOI 10.7717/peerj.235.
Huson DH, Bryant D. 2006. Application of phylogenetic networks in evolutionarystudies.Molecular Biology and Evolution 23:254–267 DOI 10.1093/molbev/msj030.
JacobsenMW, Da Fonseca RR, Bernatchez L, HansenMM. 2016. Comparative analysisof complete mitochondrial genomes suggests that relaxed purifying selection isdriving high nonsynonymous evolutionary rate of the NADH2 gene in whitefish(Coregonus ssp).Molecular Phylogenetics and Evolution 95:161–170DOI 10.1016/j.ympev.2015.11.008.
Putnam et al. (2017), PeerJ, DOI 10.7717/peerj.3319 16/18
Mass T, PutnamHM, Drake JL, Zelzion E, Gates RD, Bhattacharya D, Falkowski PG.2016. Temporal and spatial expression patterns of biomineralization proteins duringearly development in the stony coral Pocillopora damicornis. Proceedings of the RoyalSociety B: Biological Sciences 283:20160322 DOI 10.1098/rspb.2016.0322.
Meyer E,Weis VM. 2012. Study of cnidarian-algal symbiosis in the ‘‘omics’’ age.Biological Bulletin 223:44–65 DOI 10.1086/BBLv223n1p44.
Puill-Stephan E, Van OppenMJ, Pichavant-Rafini K,Willis BL. 2012.High potentialfor formation and persistence of chimeras following aggregated larval settlement inthe broadcast spawning coral, Acropora millepora. Proceedings of the Royal Society B:Biological Sciences 279:699–708 DOI 10.1098/rspb.2011.1035.
Puill-Stephan E,Willis BL, Van Herwerden L, Van Oppen MJ. 2009. Chimerism in wildadult populations of the broadcast spawning coral Acropora millepora on the GreatBarrier Reef. PLOS ONE 4:e7751 DOI 10.1371/journal.pone.0007751.
Rand DM. 2001. The units of selection of mitochondrial DNA. Annual Review of Ecologyand Systematics 32:415–448 DOI 10.1146/annurev.ecolsys.32.081501.114109.
Rinkevich B, Shaish L, Douek J, Ben-ShlomomR. 2016. Venturing in coral larvalchimerism: a compact functional domain with fostered genotypic diversity. ScientificReports 6:e19493 DOI 10.1038/srep19493.
Röthig T, Costa RM, Simona F, Baumgarten S, Torres AF, Radhakrishnan A, ArandaM, Voolstra CR. 2016a. Distinct bacterial communities associated with the coralmodel Aiptasia in aposymbiotic and symbiotic states with Symbiodinium. Frontiersin Marine Science 3: Article 234 DOI 10.3389/fmars.2016.00234.
Röthig T, OchsenkühnMA, Roik A, Van der Merwe R, Voolstra CR. 2016b. Long-term salinity tolerance is accompanied by major restructuring of the coral bacterialmicrobiome.Molecular Ecology 25:1308–1323 DOI 10.1111/mec.13567.
Schweinsberg M, González Pech RA, Tollrian R, Lampert KP. 2014. Transfer ofintracolonial genetic variability through gametes in Acropora hyacinthus corals. CoralReef 33:77–87 DOI 10.1007/s00338-013-1102-5.
Schweinsberg M, Tollrian R, Lampert KP. 2016. Genetic variation in the massive coralPorites lobata.Marine Biology 163: Article 242 DOI 10.1007/s00227-016-3022-8.
Sheppard C, Dixon DJ, Gourlay M, Sheppard A, Payet R. 2005. Coral mortality increaseswave energy reaching shores protected by reef flats: examples from the Seychelles.Estuarine, Coastal and Shelf Science 64:223–234 DOI 10.1016/j.ecss.2005.02.016.
Shinzato C, Shoguchi E, Kawashima T, HamadaM, Hisata K, TanakaM, Fujie M,Fujiwara M, Koyanagi R, Ikuta T, Fujiyama A, Miller DJ, Satoh N. 2011. Using theAcropora digitifera genome to understand coral responses to environmental change.Nature 476:320–323 DOI 10.1038/nature10249.
Van OppenMJH, Koolmees EM, Veron JEN. 2004. Patterns of evolution in thescleractinian coral genusMontipora (Acroporidae).Marine Biology 144:9–18DOI 10.1007/s00227-003-1188-3.
Van OppenMJ, Souter P, Howells EJ, Heyward A, Berkelmans R. 2011. Novel geneticdiversity through somatic mutations: fuel for adaptation of reef corals? Diversity3:405–423 DOI 10.3390/d3030405.
Putnam et al. (2017), PeerJ, DOI 10.7717/peerj.3319 17/18
Van OppenMJ,Willis BL, Vugt HW,Miller DJ. 2000. Examination of species bound-aries in the Acropora cervicornis group (Scleractinia, Cnidaria) using nuclear DNAsequence analyses.Molecular Ecology 9:1363–1373DOI 10.1046/j.1365-294x.2000.01010.x.
Willis BL, Van OppenMJH, Miller DJ, Vollmer SV, Ayre DJ. 2006. The role of hy-bridization in the evolution of reef corals. Annual Review of Ecology, Evolution, andSystematics 37:489–517 DOI 10.1146/annurev.ecolsys.37.091305.110136.
Work TM, Forsman ZH, Szabó Z, Lewis TD, Aeby GS, Toonen RJ. 2011. Inter-specificcoral chimerism: genetically distinct multicellular structures associated with tissueloss inMontipora capitata. PLOS ONE 6:e22869 DOI 10.1371/journal.pone.0022869.
Putnam et al. (2017), PeerJ, DOI 10.7717/peerj.3319 18/18