Embed Size (px)
Citation preview

DISTRICT SPATIAL PLAN
T H R I S S U R
DEPARTMENT OF TOWN AND COUNTRY PLANNING - GOVERNMENT OF KERALA
January 2011
PREFACE
Planning is a prerequisite for effective development. Development becomes comprehensive when growth
centres are identified considering physical, social and economic variables of an area in an integrated manner.
This indicates that planning of villages and towns are to be complementary. Second Administrative Reforms
Commission (ARC) while interpreting the article 243 ZD of the Constitution of India states as follows. “This, in
other words, means that the development needs of the rural and urban areas should be dealt with in an integrated
manner and, therefore, the district plan, which is a plan for a large area consisting of villages and towns, should
take into account such factors as ‘spatial planning’, sharing of ‘physical and natural resources’, integrated
development of infrastructure’ and ‘environmental conservation’. All these are important, because the
relationship between villages and towns is complementary. One needs the other. Many functions that the towns
perform as seats of industry, trade and business and as providers of various services, including higher education,
specialized health care services, communication etc have an impact on the development and welfare of rural
people. Similarly, the orderly growth of the urban centre is dependent on the kind of organic linkage it establishes
with its rural hinterland”. Therefore a move of harmonizing urban and rural centres of an area can be said as a
move of planned urbanisation of the area.
In this context, it is relevant to mention the 74th Amendment Act of the Constitution of India, which
mandated the District Planning Committee to prepare a draft development plan for the district. As per Article 243
ZD of the Constitution, the District Planning Committee (DPC) shall consolidate Panchayat/Municipality Plans in
the district and prepare draft development plan for the district as a whole. The Constitution also specifies that
while preparing draft development plan due regard shall be given to matters of common interest between
panchayats and municipalities including spatial planning, sharing of water and other physical and natural resources,
the integrated development of infrastructure and environmental conservation. In this respect, the district of
Kollam has conducted an important experiment of preparation of an Integrated District Development Plan (IDDP)
for the district. Through preparation of IDDP, the District Planning Committee of Kollam has become the first ever
DPC in the country to own a District Development Plan as envisaged by the Constitution. This path-breaking
venture has become a model in participatory district planning in a spatial platform. The Plan was released during
the international conference on district planning held at Kollam in August 2009. The Plan is now sanctioned by
Government of Kerala. As per G.O (Rt) 354/04/LSGD dated 01.02.07, the State Government have extended the
project to the remaining districts in the state and the districts of Alappuzha, Thrissur, Idukki, Palakkad and
Wayanad were selected for extending the project in the first phase. However, even in these districts, preparation
of IDDP is yet to be completed.
Preparation of such a plan will surely need decisions and commitment at various levels due to the multiplicity
of agencies involved and the vast spectrum of aspects to be addressed. However, delay in planning shall not
affect development. Hence a step by step approach may be adopted in planning. Therefore, the Department of
Town and Country Planning evolved a sequence of plan preparation at district level, involving District Urbanisation
Report (DUR), District Spatial Plan (DSP) and Integrated District Development Plan (IDDP).
The District Urbanisation Report defines the future spatial structure of a district, which is formulated by
integrating hierarchy and activity pattern of urban and rural settlements and the connectivity between them.
The spatial structure of a district will act as a frame for the orderly development of urban centres and their rural
hinterland subsequently leading to a planned urbanisation.
The District Spatial Plan is a synergistic form of the District Urbanisation Report, since as a plan it is
congruent to a single unified physical design for the district through setting development goals and objectives
and formulating the development concept of the district. DSP will frame the general policies and strategies and
streamline directions of development of the district. The Development Directives of DSP is carved in the spatial
platform through the synthesis of findings of the analysis over the spatial structure based on secondary sources
of data. But it lacks the resource studies as co-ordination of various agencies remain as an uphill task.
The Integrated District Development Plan can be termed as the highest echelon of this series and manifest
all features of the draft district development plan as envisaged in Article 243ZD of the Constitution of India.
Democratisation of planning and translation of sectoral policies into spatial plans are the paramount qualities of
IDDP as against DSP. IDDP comprises of two components; a Perspective Plan for 15-20 years and an Execution Plan
for 5 years.
As said earlier, IDDP for Kollam District is already prepared under the leadership of the District Planning
Committee, Kollam with the involvement of all the Local Governments in the district and Special Technical
Advisory Committee for IDDP. The Department of Town and Country Planning gave technical support for Plan
preparation besides coordinating the entire process in the role of nodal agency.
Now, the Department has prepared District Spatial Plans for the districts of Thrissur and Palakkad and
District Urbanisation Reports for the districts of Thiruvananthapuram, Pathanamthitta, Alappuzha, Kottayam,
Ernakulam, Idukki, Malappuram, Kozhikkode, Wayanad, Kannur and Kasaragod. The District Spatial Plan for Thrissur
is one among the series.
I take this opportunity to appreciate the officials of the Thrissur District Office of the Department, headed
by Smt. P.V. Mary in the preparation of this document. The State Project Cell for LDP-IDDP-SPP played anchor role
in this regard, right from conceptualisation to shaping the end product. The toolkits and customised computer
applications developed by the State Project Cell has enabled the district offices to accomplish the task in a time
bound manner. I also appreciate the consistent efforts of Sri. Jacob Easow, Senior Town Planner,
Smt.Ushakumari.P.R, Town Planner, Sri. Baiju.K, Deputy Town Planner and other officials of the State Project Cell.
I also appreciate the officials of the circle, headed by Sri. G. Mohanan, Senior Town Planner, for their efforts in
finalising the District Spatial Plan for Thrissur District.
This is a step forward on the ladder leading to the draft development plan for the district as laid down in
the Constitution. It is hoped that the district of Thrissur will further extend the District Spatial Plan into Integrated
District Development Plan for the district.
Certainly, the District Spatial Plan for Thrissur District will streamline the directions of development of the
district by way of providing a framework for development as well as future planning of the district.
Thiruvananthapuram Eapen Varughese
11-2-2011 Chief Town Planner
ACKNOWLEDGEMENTS
The “District Spatial Plan for Thrissur” envisages planned sustainable spatial development of the District.
The preparation of the Plan was started in March 2010 as part of preparation of the “State Perspective Plan for
Kerala – Study on Urbanisation in Thrissur District”. Thrissur is one of the district in the state where the project of
preparation of Integrated District Development Plan (IDDP) and Local Development Plans (LDP) has been ex-
tended vide GO (Rt) 354/04/LSGD dated 1/2/07. The data base and initial analysis done for the above study and
that collected for the IDDP have been intensively used for the preparation of this plan.
In this regard I am grateful to the encouraging leadership and motivation given by our Department head
Sri Eapen Varghese, Chief Town Planner to Govt. of Kerala. But for his support and leadership , the plan would
not have came to light within a short period.
I also express my gratitude for the creative and valuable advice given by Sri. G. Mohanan, Senior Town
Planner, Office of the Cheif Town Planner, Thiruvananthapuram in the preparation of the plan.
The report was finalized after a series of discussions, revisions, editing etc. I would like to thank all those
who have participated in these discussions and plan preparation. The carving out of methodology, using appro-
priate planning techniques, data analysis and above all constant and effective monitoring are crucial in the
successful completion of any plan. The success of this plan is also the result of efforts taken by a dedicated team
of officers of the Department. In this connection, I am extremely thankful to Sri. Jacob Easow, Senior Town
Planner, Smt.Ushakumari P.R. Town Planner, Sri.K. Baiju, Deputy Town Planner and other staff of State Project
Cell, CTP Office, Thiruvananthapuram for their support, guidance and valuable assistance for materializing this
plan.
Last but not the least, I also convey my thanks to the officials of District Planning Unit Thrissur, especially to
Sri. T.N. Rajesh, Deputy Town Planner and other staff in IDDP/LDP Project cell, Thrissur, for their sincere and
dedicated service in preparing this plan.
I once again express my gratitude to all those who were associated for successful completion of this plan
and I believe that it will contribute to the orderly development of the District.
Thrissur P.V. Mary
19-1-2011 Town Planner, Thrissur
CONTENTS District Spatial Plan - Thrissur
Department of Town & Country Planning, KeralaDepartment of Town & Country Planning, Kerala
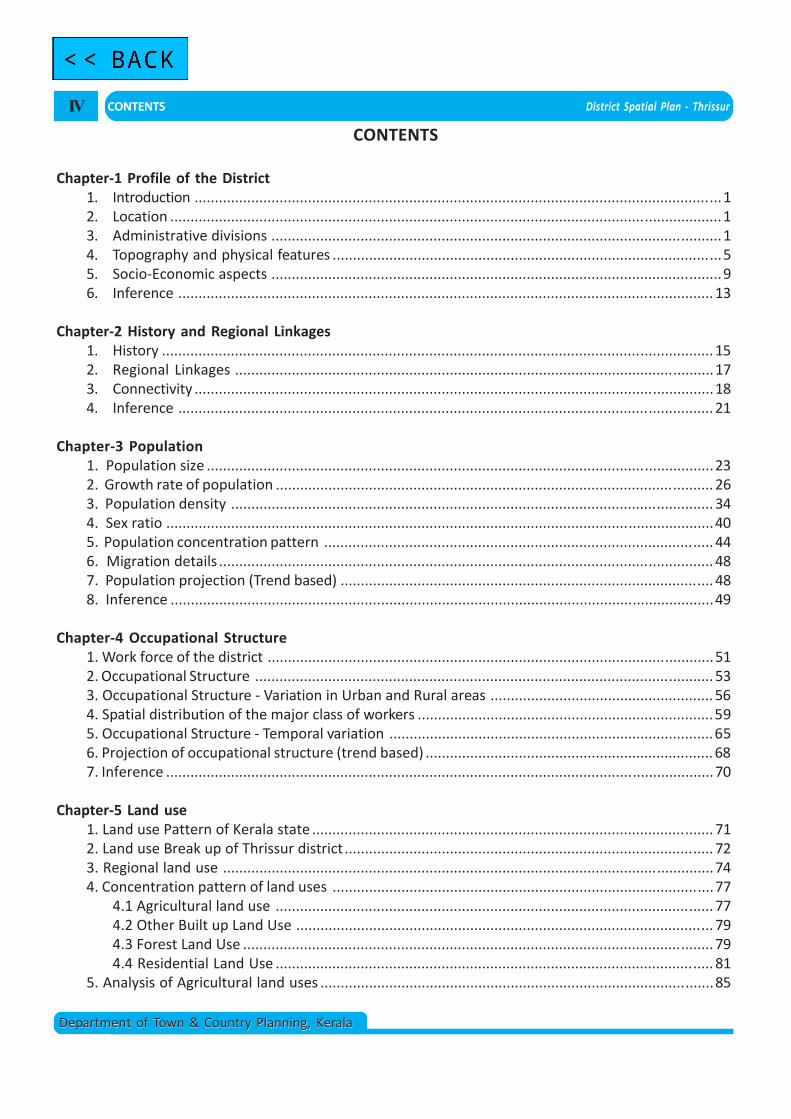
CONTENTS
Chapter-1 Profile of the District1. Introduction ..................................................................................................................................12. Location ........................................................................................................................................13. Administrative divisions ...............................................................................................................14. Topography and physical features ................................................................................................55. Socio-Economic aspects ...............................................................................................................96. Inference .................................................................................................................................... 13
Chapter-2 History and Regional Linkages1. History ........................................................................................................................................ 152. Regional Linkages ......................................................................................................................173. Connectivity ................................................................................................................................184. Inference .................................................................................................................................... 21
Chapter-3 Population1. Population size .............................................................................................................................232. Growth rate of population ............................................................................................................ 263. Population density ....................................................................................................................... 344. Sex ratio .......................................................................................................................................405. Population concentration pattern ................................................................................................ 446. Migration details .......................................................................................................................... 487. Population projection (Trend based) ............................................................................................ 488. Inference ......................................................................................................................................49
Chapter-4 Occupational Structure1. Work force of the district ..............................................................................................................512. Occupational Structure ................................................................................................................. 533. Occupational Structure - Variation in Urban and Rural areas ....................................................... 564. Spatial distribution of the major class of workers .........................................................................595. Occupational Structure - Temporal variation ................................................................................656. Projection of occupational structure (trend based) ....................................................................... 687. Inference .......................................................................................................................................70
Chapter-5 Land use1. Land use Pattern of Kerala state ................................................................................................... 712. Land use Break up of Thrissur district ........................................................................................... 723. Regional land use .........................................................................................................................744. Concentration pattern of land uses ..............................................................................................77
4.1 Agricultural land use ............................................................................................................ 774.2 Other Built up Land Use ....................................................................................................... 794.3 Forest Land Use .................................................................................................................... 794.4 Residential Land Use ............................................................................................................ 81
5. Analysis of Agricultural land uses .................................................................................................85
IV
District Spatial Plan - Thrissur CONTENTS
Department of Town & Country Planning, KeralaDepartment of Town & Country Planning, Kerala
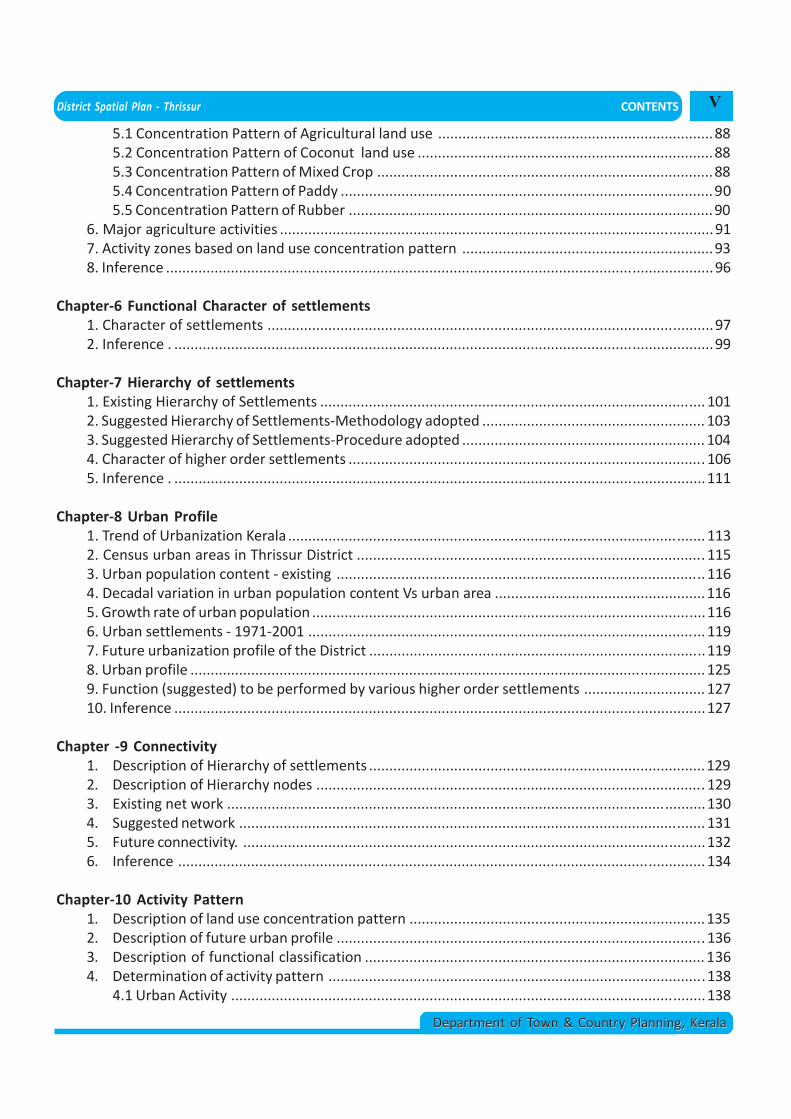
5.1 Concentration Pattern of Agricultural land use ....................................................................885.2 Concentration Pattern of Coconut land use .........................................................................885.3 Concentration Pattern of Mixed Crop ...................................................................................885.4 Concentration Pattern of Paddy ............................................................................................905.5 Concentration Pattern of Rubber ..........................................................................................90
6. Major agriculture activities ...........................................................................................................917. Activity zones based on land use concentration pattern ..............................................................938. Inference .......................................................................................................................................96
Chapter-6 Functional Character of settlements1. Character of settlements ..............................................................................................................972. Inference . .....................................................................................................................................99
Chapter-7 Hierarchy of settlements1. Existing Hierarchy of Settlements ............................................................................................... 1012. Suggested Hierarchy of Settlements-Methodology adopted ....................................................... 1033. Suggested Hierarchy of Settlements-Procedure adopted ............................................................ 1044. Character of higher order settlements ........................................................................................ 1065. Inference . ...................................................................................................................................111
Chapter-8 Urban Profile1. Trend of Urbanization Kerala ....................................................................................................... 1132. Census urban areas in Thrissur District ...................................................................................... 1153. Urban population content - existing ........................................................................................... 1164. Decadal variation in urban population content Vs urban area ....................................................1165. Growth rate of urban population .................................................................................................1166. Urban settlements - 1971-2001 .................................................................................................. 1197. Future urbanization profile of the District ...................................................................................1198. Urban profile ............................................................................................................................... 1259. Function (suggested) to be performed by various higher order settlements .............................. 12710. Inference ...................................................................................................................................127
Chapter -9 Connectivity1. Description of Hierarchy of settlements ...................................................................................1292. Description of Hierarchy nodes ................................................................................................ 1293. Existing net work ......................................................................................................................1304. Suggested network ................................................................................................................... 1315. Future connectivity. ..................................................................................................................1326. Inference .................................................................................................................................. 134
Chapter-10 Activity Pattern1. Description of land use concentration pattern .........................................................................1352. Description of future urban profile ........................................................................................... 1363. Description of functional classification .................................................................................... 1364. Determination of activity pattern .............................................................................................138
4.1 Urban Activity .....................................................................................................................138
V
CONTENTS District Spatial Plan - Thrissur
Department of Town & Country Planning, KeralaDepartment of Town & Country Planning, Kerala
4.2 Primary Activity ................................................................................................................... 1384.3 Secondary Activity .............................................................................................................. 1394.4 Agricultural Activity Non-determinantal to forest ............................................................... 1394.5 Agricultur and Alied activit ................................................................................................. 140
5. Inference .................................................................................................................................. 142
Chapter-11 Spatial Structure1. Spatial structure of the District ................................................................................................... 143
1.1 Hierarchy of settlements .................................................................................................... 1431.2 Activity pattern ................................................................................................................... 1431.3 Connectivity ........................................................................................................................ 1451.4 Spatial structure ................................................................................................................. 148
2. Inference ..................................................................................................................................... 148
Chapter-12 Findings ....................................................................................................................... 151
Chapter-13 Goals and objectives1. Development Goals .................................................................................................................. 1572. Development Objectives .......................................................................................................... 158
Chapter-14 Tentative Development Concept1. Introduction .............................................................................................................................. 1612. Development Concept Formation ............................................................................................. 1613. Tentative Development Concept .............................................................................................. 1654. Development Zones.................................................................................................................. 1675. Hierarchy of Settlements .......................................................................................................... 1706. Transportation network ............................................................................................................ 1707. Function of Settlements ............................................................................................................ 1728. Projection of population ........................................................................................................... 1739. Projection of workforce ............................................................................................................ 18610. Inference .................................................................................................................................. 197
Chapter-15 Development Directives1. Introduction .............................................................................................................................. 1992. General Policies and Stratagies ................................................................................................ 1993. Development Stratagies ........................................................................................................... 1994. Development Directives ............................................................................................................ 201
VI
District Spatial Plan - Thrissur CONTENTS
Department of Town & Country Planning, KeralaDepartment of Town & Country Planning, Kerala
VII
Table 1.1 Taluks and Taluk Head Quarters.............................................................................. 2Table 1.2 Blocks and Block Head Quarters ............................................................................. 4Table 1.3 Thrissur District: Land Utilization Pattern by Category, 2003-05
(Area in Ha) .......................................... 9Table 1.4 Literacy Rate in various districts, 2001.................................................................... 9Table 1.5 WPR of workers - comparison with state................................................................. 10Table 1.6 GSDP in various districts, 2008-09 .......................................................................... 10Table 1.7 NSDP in various districts - 2003-04 ........................................................................ 11Table 1.8 PCI in various districts, 2008-09 ............................................................................. 12Table 3.1 Population – Comparison with the State ................................................................. 23Table 3.2 Population and Growth rate of Population Districts wise ....................................... 26Table 3.3 Growth rate of Population – Comparison with State .............................................. 28Table 3.4 Population & Area Details of Grama Panchayats showing negative growth rate
during 1991-2001..................................................................................................... 32Table 3.5 Interpolated population and corresponding growth rate of Grama Panchayats
showing negative growth rate due to change in area............................................. 32Table 3.6 Grouping of LSGs based on the range of gross population density 2001 36Table 3.7 Projected District Population – Decreasing rate method ....................................... 48Table 3.8 Projected District Population – Apportionment method ......................................... 49Table 3.9 Final Projected Population figures of the District ................................................... 49Table 4.1 Total Workers and Main workers 1981-2001 .......................................................... 53Table 4.2 Four fold classification of workers - 2001, Thrissur District ................................... 54Table 4.3 Workers Classification – Urban and Rural Break up ............................................... 56Table 4.4 Concentration Pattern of Workers ........................................................................... 62Table 4.5 Four fold Classification of workers - 1981 to 2001 ................................................. 65Table 4.6 Four fold classification of urban workers : 1981-2001 ........................................... 66Table 4.7 Four fold classification of rural workers : 1981-2001 .............................................. 67Table 4.8 Value of WPR ........................................................................................................... 68Table 4.9 Number of workers WPR ........................................................................................ 69Table 4.10 Number of workers Projected................................................................................... 70Table 4.11 Projection of workers in urban and rural areas ....................................................... 70Table 5.1 Land use breakup – Kerala State ............................................................................. 71Table 5.2 Land use breakup – Thrissur District ...................................................................... 73Table 5.3 Comparison of Land use break up of Thrissur District and Kerala state ................ 74Table 5.4 Land use break - comparison with Neighbouring Districts ..................................... 74Table 5.5 Break up of Agricultural land use, Thrissur District, 2008 ..................................... 84Table 5.6 Break up of Agricultural land use, Thrissur District, 2008 ..................................... 86Table 5.7 Grouping of land use classifications ...................................................................... 92Table 5.8 Criteria for determination of activity based on Land use ....................................... 95
LIST OF TABLES
CONTENTS District Spatial Plan - Thrissur
Department of Town & Country Planning, KeralaDepartment of Town & Country Planning, Kerala
Table 6.1 Functional character of LSGs ..................................................................................... 99Table 7.1 Suggested hierarchy of settlements .......................................................................... 110Table 8.1 Population (2001) of Kerala at a glance .................................................................... 113Table 8.2 Trends of population growth of Kerala - 1981-2001 .................................................. 113Table 8.3 Trends in urbanization of Kerala - 1981-2001 ........................................................... 114Table 8.4 Census Towns & Out growth in Thrissur District - 2001 ........................................... 115Table 8.5 Thrissur District - variation in urban content 1991-2001 .......................................... 116Table 8.6 Growth rate of urban population – Comparison with state ....................................... 118Table 8.7 Urban settlements in different period of time .......................................................... 119Table 8.8 Future urban profile of the District ........................................................................... 124Table 8.9 Urban profile - Phasing ............................................................................................. 126Table 8.10 Facilities in general to be provided ........................................................................... 126Table 10.1 Classification of settlement ...................................................................................... 137Table 10.2 Urban Activity ............................................................................................................ 138Table 10.3 Primary Activity .......................................................................................................... 139Table 10.4 Agricultural activity non detrimental to forest ......................................................... 140Table 10.5 Agriculture and allied activity ................................................................................... 141Table 11.1 Transportation corridor development based on regional spatial structure .............. 145Table 14.1 Zone wise impact on population growth rate and occupation structure.................. 173Table 14.2 Population growth rate – Projected (Trend Based).................................................... 174Table 14.3 Zone wise population and area (2001)...................................................................... 175Table 14.4 Projected growth rate (Induced) – 2021 of the district.............................................. 176Table 14.5 Zone wise growth rate –Trend based ........................................................................ 177Table 14.6 Zone wise induced growth rate ................................................................................. 179Table 14.7 Zone wise population in 2021 ................................................................................... 180Table 14.8 Zone wise population based on projected induced growth rate................................ 181Table 14.9 Percentage of population in 2001& 2021.................................................................. 181Table 14.10Population Density – Zone wise ................................................................................ 182Table 14.11Projection of WPR –Thrissur District ......................................................................... 186Table 14.12Zone wise WPR - 2001 .............................................................................................. 188Table 14.13The combined average WPR - zone wise .................................................................. 188Table 14.14 Projected WPR - zone wise ...................................................................................... 190Table 14.15Total Workers projected - 2021 ................................................................................. 191Table 14.16Main to Marginal Workers ratio ................................................................................ 191Table 14.17Zone wise main workers - Projected ......................................................................... 192Table 14.18Existing occupational structure - 2001 ...................................................................... 192Table 14.19 Zone wise Area & Population ................................................................................... 193Table 14.20The projected occupational structure ....................................................................... 194Table 14.21Projected no of Workers - 2021 ................................................................................ 194Table 15.1 Future urban profile of the District ........................................................................... 201Table 15.2 Nature of developments suggested in various development zones ......................... 204Table 15.3 Zone wise population in 2021 ................................................................................... 209Table 15.4 Projected number of workers ..................................................................................... 210
VIII
District Spatial Plan - Thrissur CONTENTS
Department of Town & Country Planning, KeralaDepartment of Town & Country Planning, Kerala
LIST OF FIGURES
Fig 1.1 Location of Thrissur 1Fig1.2 Taluks – Thrissur District 2Fig 1.3 Blocks – Thrissur District 3Fig 1.4 Spatial Distribution of LSGs of the District 4Fig 1.5 Physiographic division of the District 5Fig 1.6 Water bodies of Thrissur District 8Fig 1.7 District -wise Sectoral Distribution of GSDP at current prices - 2007-08 11Fig 2.1 Regional connectivity with other district 18Fig 2.2 Transportation Network - Thrissur District 19Fig 2.3 Water Bodies - Thrissur District 20Fig 3.1 Population size - Comparison with surrounding districts 24Fig 3.2 Population – Urban & Rural - Comparison with surrounding districts 24Fig 3.3 Population size of State - Temporal Variation 25Fig 3.4 Population size of Thrissur - Temporal Variation 25Fig 3.5 District wise distribution of population growth rate 1991 - 2001 27Fig 3.6 Population growth rate comparison with State - 2001 census 27Fig 3.7 Population growth rate comparison with surrounding districts 28Fig 3.8 Population growth rate - comparison with State - Temporal variation 29Fig 3.9 Population growth rate 1971-81 Local Self Govt.wise 29Fig 3.10 Population growth rate 1991- Local body wise 30Fig 3.11 Population growth rate 2001- Local body wise 31Fig 3.12 LSGI showing increase of G.R from 1981-2001 31Fig 3.13 LSGs with highest Growth rate of population 32Fig 3.14 LSGs with negative growth rate based on 1991-2001 census of population 33Fig 3.15 District wise distribution of Gross density of population growth rate 34Fig 3.16 Population density - comparison with State (2001) 34Fig 3.17 Population density - comparison with surrounding districts (2001) 35Fig 3.18 Gross Population density 2001- Local body wise 35Fig 3.19 Net Population density 2001- Local body wise 40Fig 3.20 Comparison of sex ratio with State 41Fig 3.21 Comparison of sex ratio 41Fig 3.22 Sex ratio – age group 0 – 6 42Fig 3.23 Age group wise population – Thrissur District 43Fig 3.24 Age Sex Pyramid – Kerala State 43Fig 3.25 Age Sex Pyramid – Thrissur District 44Fig 3.26 Population concentration pattern - 1971 45Fig 3.27 Population concentration pattern - 1981 45Fig 3.28 Population concentration pattern - 1991 46Fig 3.29 Population concentration pattern - 2001 46Fig 3.30 Population concentration pattern based on net population density of 2001 47Fig 4.1 Work Participation of Thrissur District 51Fig 4.2 Work Participation Rate – comparison with surrounding Districts 51Fig 4.3 WPR of Urban Areas – comparison with surrounding Districts 52Fig 4.4 Main & Marginal Workers 52
IX
CONTENTS District Spatial Plan - Thrissur
Department of Town & Country Planning, KeralaDepartment of Town & Country Planning, Kerala
Fig 4.5 Temporal variation of total workers and total main workers 1981-2001 52Fig 4.6 Nine fold classification of workers – 1991 census 53Fig 4.7 Worker Classification – 1991 census 54Fig 4.8 Classification of workers - 2001 census 54Fig 4.9 Occupational structure of the surrounding districts - 2001 55Fig 4.10 Classification of total workers in urban & rural areas of Thrissur District - 2001 56Fig 4.11 Nine fold classification of workers (Estimated) – 2001 census 57Fig 4.12 Worker Classification – 2001 census (Estimated) 57Fig 4.13 Worker Classification – 1991 & 2001 census 57Fig 4.14 LSG wise distribution of workers based on
9 fold classification (estimated) – 2001 census 58Fig 4.15 LSG wise distribution of workers – 2001 census 58Fig 4.16 Concentration index of HH industrial workers in LSGS, Thrissur District - 2001 59Fig 4.17 Concentration index of Agricultural labourers in LSGS - Thrissur 60Fig 4.18 Spatial distribution of the concentration index of Cultivators 61Fig 4.19 Spatial distribution of the concentration index of other workers 61Fig. 4.19a Concentration of workers in Primary sector - LSG wise distribution 63Fig. 4.19b Concentration of workers in Secondary sector - LSG wise distribution 64Fig. 4.19c Concentration of workers in Tertiary sector - LSG wise distribution 64Fig 4.20 Activity Pattern of LSGS evolved based on concentration pattern of workers 65Fig 4.21 Variation in the number of different category of workers in urban area 66Fig 4.22 Variation in the number of different category of workers in rural areas 67Fig 4.23 Changes in the occupational structure in urban areas of the district 67Fig 4.24 Changes in the occupational structure in rural areas of the district 68Fig 4.25 Temporal variation of WPR 69Fig 4.26 Projection of WPR 69Fig 5.1 Land use breakup – Kerala State 72Fig 5.2 Percentage of land use breakup 72Fig 5.3 Land use map – Thrissur District 73Fig 5.4 Comparison of the percentage share of Forest Land use of the state
in surrounding districts 75Fig 5.5 Forest Land use comparison with surrounding districts 75Fig 5.6 Comparison of the percentage share of land marked as Marshy Land
of the state in Thrissur and surrounding district 75Fig 5.7 Percentage share of Marshy Land - Comparison with surrounding districts 75Fig 5.8 Comparison of the percentage share of Residential Land Use in district
of Kerala -Thrissur and Surrounding District 75Fig 5.9 Comparison of Percentage share of Residential land use in Thrissur
& Surrounding Districts 76Fig 5.10 Comparison of the percentage share of Agricultural Land use
of the State - Thrissur & surrounding district 76Fig 5.11 Percentage share of Agriculture land use - Thrissur & Surrounding district 76Fig 5.12 Comparison of Plantation Land use Thrissur & Surrounding district 76Fig 5.13 Comparison of the percentage share of State Res/Agr Mix land use
of the state in Thrissur & Surrounding district 76Fig 5.14 Percentage of Res / Agr mix land use in the district 77Fig. 5.15 The concentration pattern of agricultural land use 77Fig. 5.16 The concentration Index of agricultural land use 78Fig 5.17 Concentration pattern of the Other Built up Land Use 78Fig 5.18 The variation of concentration pattern of Other builtup land use
among LSGS of Thrissur Dist. 79
X
District Spatial Plan - Thrissur CONTENTS
Department of Town & Country Planning, KeralaDepartment of Town & Country Planning, Kerala
Fig 5.19 Concentration pattern of forest land use in LSGs of Thrissur District 80Fig 5.20 Variation of concentration pattern of forest land use amount LSGS 80Fig 5.21 Concentration pattern of Residential land use 81Fig 5.22 Variation of concentration index of Residential land use 81Fig 5.23 Concentration pattern of Res/Agri mixed land use 82Fig 5.24 Concentration pattern of water body 82Fig 5.25 Distribution of concentration - Index of Plantation land use 83Fig 5.26 Distribution of concentration - Index of Kole land use 83Fig 5.27 Concentration pattern of Other land use 84Fig 5.28 Break up of agricultural land use Thrissur Dist. 85Fig 5.29 LSG wise break up of agricultural land use 86Fig 5.30 Break up of agricultural land use in to five classes 87Fig 5.31 Spatial pattern of agricultural land use 87Fig 5.32 Distribution of concentration - Index of Coconut 88Fig 5.33 Distribution of concentration - Index of Mixed Crop 89Fig 5.34 Concentration pattern of Paddy lands 89Fig 5.35 Concentration pattern of Rubber 90Fig 5.36 Concentration Pattern of Agriculture Including Plantation 90Fig 5.37 Concentration Pattern of Plantations 91Fig 5.38 Concentration Pattern of Agriculture Including Plantations 92Fig 5.39a The concentration pattern of Non- Agricultural land use 93Fig 5.39b The concentration pattern of Agricultural land use 93Fig 5.39c The concentration pattern of Forest land use 94Fig 5.39d The concentration pattern of Plantations 94Fig 5.40 Land use concentration pattern of LSGS 95Fig 6.1 Functional classification of settlements 97Fig 7.1 CFI Vs No of settlements 101Fig 7.2 Spatial Distribution of settlements of different hierarchies 102Fig 7.3 Existing 1st and 2nd order settlements of Thrissur Dist. 103Fig 7.4 Projected 2nd order settlements 104Fig 7.5 Service area of 2nd order settlements 105Fig 7.6 Service area (service settlements) of 2nd order settlements (adjusted) 106Fig 7.7 Proposed 3rd order settlements 107Fig 7.8 Service Area 3rd order settlements 107Fig 7.9 Service Area of 3rd order settlements adjusted 108Fig 7.10 Service Area (service settlements) of 3rd order centres 108Fig 7.11 Suggested hierarchy of settlements 109Fig 8.1 Urban area of Thrissur District 114Fig 8.2 Extent of urban area of the District 117Fig 8.3 Total urban population during various decades 117Fig 8.4 Population Growth Rate- Comparison with District 118Fig 8.5 Growth rate of population 2001- Local Govt. wise variation 118Fig 8.6 Urban Centers based on 3 fold Census Criteria 120Fig 8.7 Urban Centers Based on Census Criteria & Grade of LSGs 121Fig 8.8 Urban Centers Based on Census Criteria, Grade of LSGs
& Perspectives in Urban Development 123Fig 8.9 Urban Future urbanization profile – Thrissur District 124Fig: 9.1 Suggested hierarchy of settlements 129Fig 9.2 Suggested hierarchy of nodes 130Fig 9.3 Existing road network 131
XI
CONTENTS District Spatial Plan - Thrissur
Department of Town & Country Planning, KeralaDepartment of Town & Country Planning, Kerala
Fig 9.4 Suggested hierarchies of nodes and settlements along withexisting road network 132
Fig 9.5 Proposed Road Network 133Fig 9.6 Proposed Conceptual Road Network based on hierarchy of settlements 133Fig 10.1 Derivation of Activity pattern 135Fig 10.2 Land use concentration pattern 135Fig 10.3 Future Urban Profile 136Fig 10.4 Functional Classification 137Fig 10.5 Urban Activity Areas 137Fig 10.6 Intensive Agricultural Activity areas or primary Activity areas 139Fig 10.7 Distribution of secondary activity area 140Fig 10.8 Primary activity areas (Agricultural and allied activity)
non detrimental to forest 141Fig 10.9 Agricultural and allied activity area 142Fig 10.10 Activity Pattern of the District 142Fig 11.1 Spatial structure evolution 143Fig 11.2 Suggested hierarchy of settlements 144Fig 11.3 Suggested hierarchy of nodes 145Fig 11.4 Suggested hierarchies of nodes and settlements along with
existing road network 145Fig 11.5 Suggested spatial structure of the District 148Fig 14.1 Environmentally sensitive areas of the District 162Fig 14.2 Spatial structure of the District 163Fig 14.3 Spatial distribution of major crops 164Fig 14.4 Spatial distribution of industries 165Fig 14.5 Spatial structure of the macro region 166Fig 14.6 Tentative Development concept - IDDP Thrissur 167Fig 14.7 Tentative Development concept 168Fig 14.8 The proposed hierarchy of settlements 171Fig 14.9 The proposed Road network 171Fig 14.10 Funtion of settlement 172Fig 14.11 Projected growth rate 179Fig 14.12 Zone wise population Density 185Fig 14.13 Growth rate of Population 2021 - trend based 185Fig 14.14 G.R of population 2021-Accelerated 186Fig 14.15 Work force participation rate (Existing) 187Fig 14.16 Occupational Structure (Existing) 187Fig 14.17 Projected WPR – Trend based 187Fig 14.18 WPR of Districts surrounding to Thrissur 189Fig 14.19 Projection of WPR –Thrissur District 189Fig 14.20 Occupational Structure-2001 (Main Workers) 197Fig 14.21 Occupational Structure-2021 (Main Workers) 197Fig 15.1 Function of settlement – Thrissur District 207Fig 15.2 Suggested hierarchy of settlements 208
XII
District Spatial Plan - Thrissur CONTENTS
Department of Town & Country Planning, KeralaDepartment of Town & Country Planning, Kerala
ANNEXES
Annexe 1 LSGs in Thrissur District.................................... 211Annexe 2 District wise and Sector -wise distribution of Gross state domestic product
during 2008-2009 at constant (1999-2000) prices (Quick Estimate)............... 213Annexe 3 Population Projection Kerala ........................................................................... 214Annexe 4 Concentration index of workers ....................................................................... 216Annexe 4A Activity pattern of workers .............................................................................. 219Annexe 5 LSG Wise concentration indices of various land uses ...................................... 222Annexe 6 LSG Wise major activity (As per land use analysis) ........................................ 226Annexe 7 List of LSGs where major agriculture activities of the district are
concentrated .................................................................................................... 229Annexe 8 LSG Wise land use concentration pattern ....................................................... 232Annexe 9A Composite Functional index (CFI) of settlements ............................................ 235Annexe 9B Hierarchy of settlements ................................................................................... 236Annexe 10 Hierarchy of settlements existing ..................................................................... 238Annexe 11 Centrality ......................................................................................................... 241Annexe 12 Connectivity...................................................................................................... 242Annexe 13 Regional centrality .......................................................................................... 248Annexe 14 Determination of the second order settlements from NE and SW
sub regions.................................... 250Annexe 15 Second order settlements, their service area & service population................... 251Annexe 16 Third order settlements, their service area & service population...................... 254Annexe 17 Number of workers in nine fold category projected (year 2021)..................... 257Annexe 18 List of LSGs in each Activity Zone............................ 262
XIII
District Spatial Plan - Thrissur PROFILE OF THE DISTRICT
Department of Town & Country Planning, KeralaDepartment of Town & Country Planning, Kerala
Chapter-1PROFILE OF THE DISTRICT
ThrissurDistrict
Fig 1.1 Location of Thrissur
1.1 INTRODUCTION
Thrissur, the cultural capital of Kerala has derived
its name from ‘Thrissivaperur’ meaning the abode of
Lord Shiva. The religious, historical and archeological
cultures are specifically remarkable in the District and
hence the development of tourism gets focused well.
District possess excellent network of transportation
system with its good quality road including National
and State highway. Major industrial sectors are
Handloom, Khadi Handloom, Pottery Tiles, Wood based
units, Rubber based units, Coconut oil extraction, Food
processing units, etc.. Major crops like paddy, tapioca,
rubber, ginger, cashew, tea, coconut, arecanut etc.. are
also grown here.
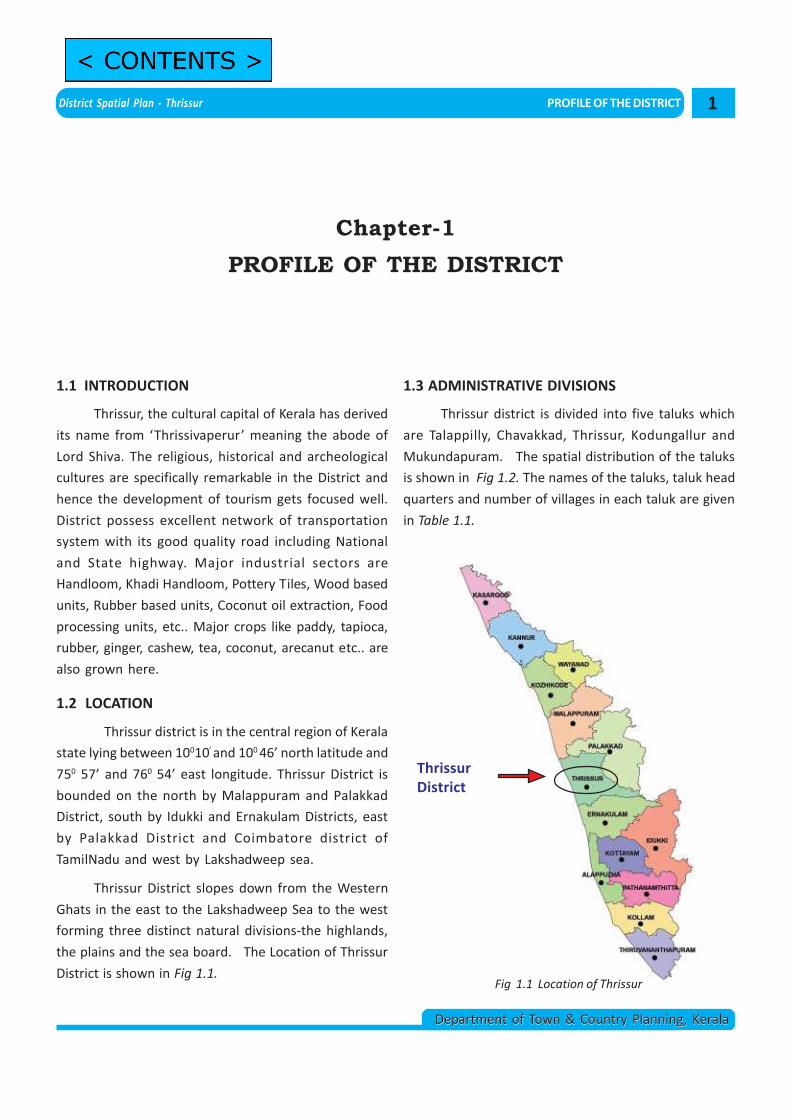
1.2 LOCATION
Thrissur district is in the central region of Kerala
state lying between 10010’ and 100 46’ north latitude and
750 57’ and 760 54’ east longitude. Thrissur District is
bounded on the north by Malappuram and Palakkad
District, south by Idukki and Ernakulam Districts, east
by Palakkad District and Coimbatore district of
TamilNadu and west by Lakshadweep sea.
Thrissur District slopes down from the Western
Ghats in the east to the Lakshadweep Sea to the west
forming three distinct natural divisions-the highlands,
the plains and the sea board. The Location of Thrissur
District is shown in Fig 1.1.
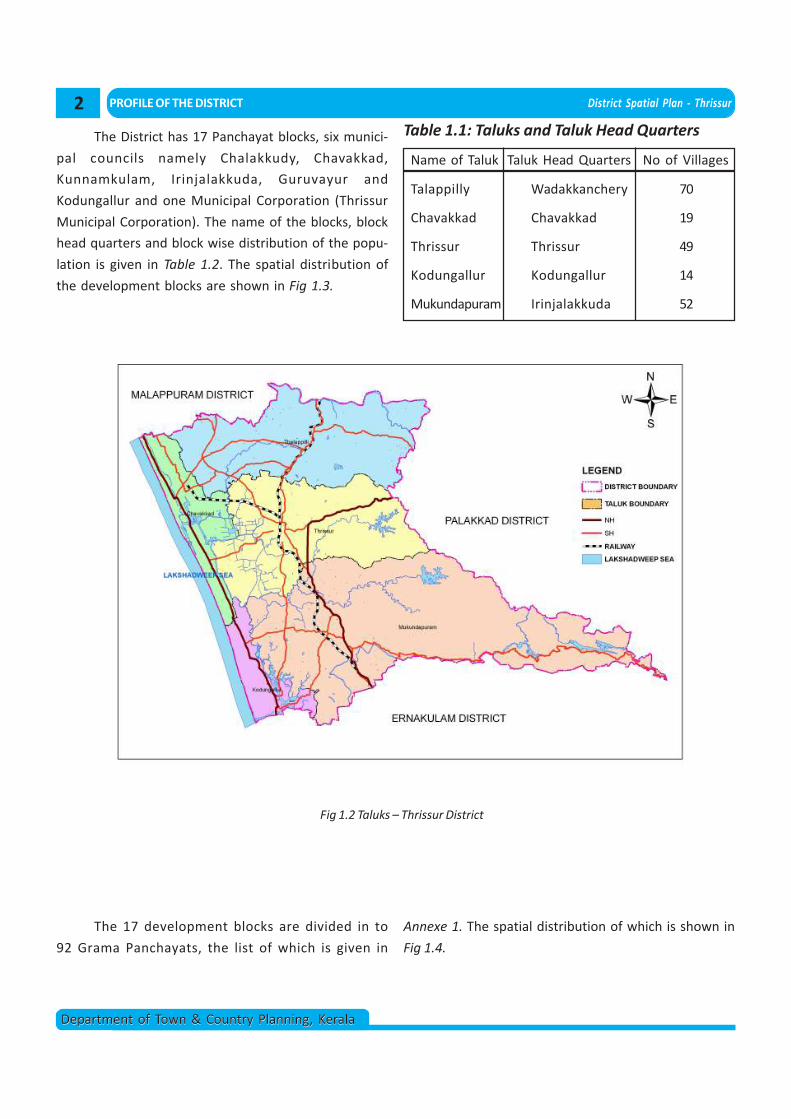
1.3 ADMINISTRATIVE DIVISIONS
Thrissur district is divided into five taluks which
are Talappilly, Chavakkad, Thrissur, Kodungallur and
Mukundapuram. The spatial distribution of the taluks
is shown in Fig 1.2. The names of the taluks, taluk head
quarters and number of villages in each taluk are given
in Table 1.1.
1
PROFILE OF THE DISTRICT District Spatial Plan - Thrissur
Department of Town & Country Planning, KeralaDepartment of Town & Country Planning, Kerala
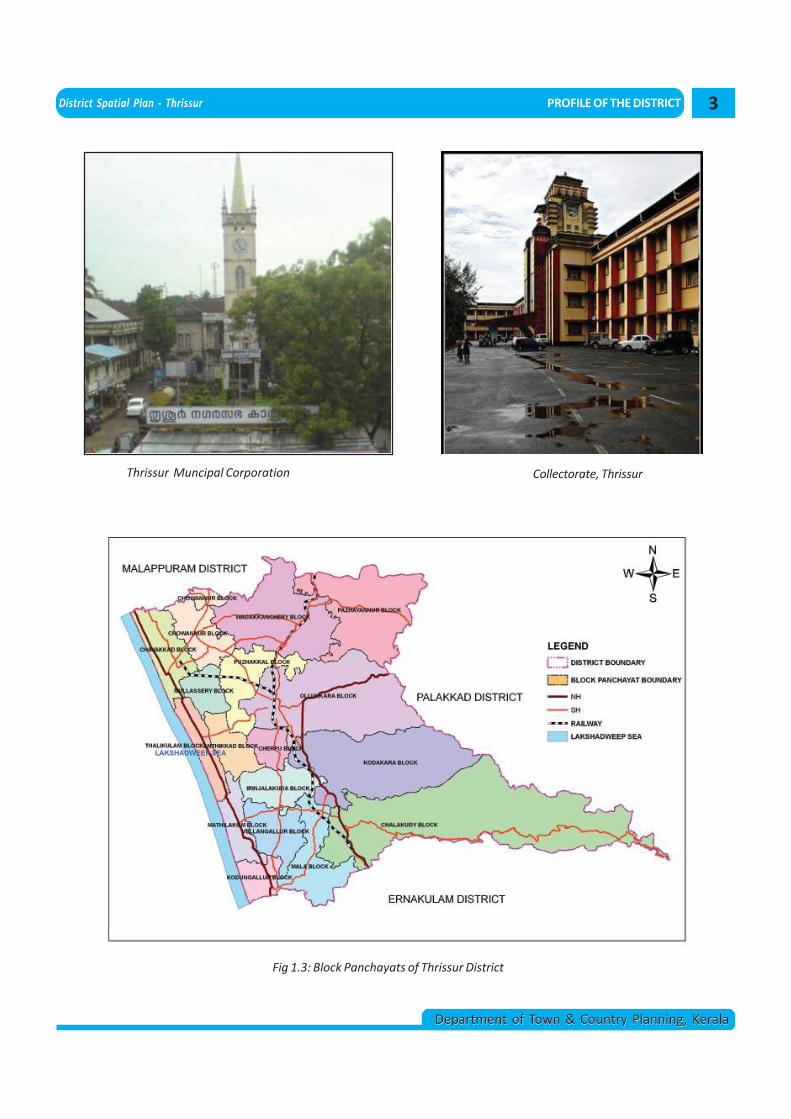
The District has 17 Panchayat blocks, six munici-
pal councils namely Chalakkudy, Chavakkad,
Kunnamkulam, Irinjalakkuda, Guruvayur and
Kodungallur and one Municipal Corporation (Thrissur
Municipal Corporation). The name of the blocks, block
head quarters and block wise distribution of the popu-
lation is given in Table 1.2. The spatial distribution of
the development blocks are shown in Fig 1.3.
Fig 1.2 Taluks – Thrissur District
Table 1.1: Taluks and Taluk Head Quarters
Name of Taluk Taluk Head Quarters No of Villages
Talappilly Wadakkanchery 70
Chavakkad Chavakkad 19
Thrissur Thrissur 49
Kodungallur Kodungallur 14
Mukundapuram Irinjalakkuda 52
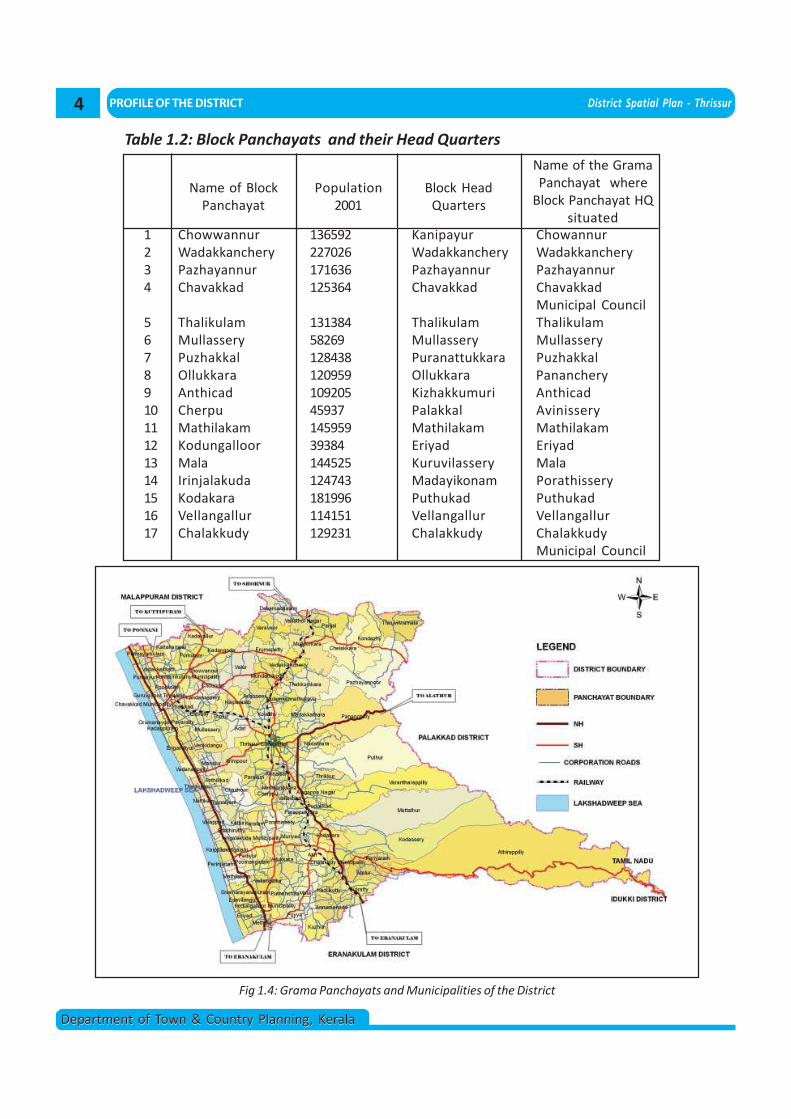
The 17 development blocks are divided in to
92 Grama Panchayats, the list of which is given in
2
Annexe 1. The spatial distribution of which is shown in
Fig 1.4.
District Spatial Plan - Thrissur PROFILE OF THE DISTRICT
Department of Town & Country Planning, KeralaDepartment of Town & Country Planning, Kerala
Thrissur Muncipal Corporation Collectorate, Thrissur
Fig 1.3: Block Panchayats of Thrissur District
3
PROFILE OF THE DISTRICT District Spatial Plan - Thrissur
Department of Town & Country Planning, KeralaDepartment of Town & Country Planning, Kerala
Fig 1.4: Grama Panchayats and Municipalities of the District
Table 1.2: Block Panchayats and their Head Quarters
Sl.No Name of BlockPanchayat
Population2001
Block HeadQuarters
Name of the GramaPanchayat where
Block Panchayat HQsituated
1 Chowwannur 136592 Kanipayur Chowannur2 Wadakkanchery 227026 Wadakkanchery Wadakkanchery3 Pazhayannur 171636 Pazhayannur Pazhayannur4 Chavakkad 125364 Chavakkad Chavakkad
Municipal Council5 Thalikulam 131384 Thalikulam Thalikulam6 Mullassery 58269 Mullassery Mullassery7 Puzhakkal 128438 Puranattukkara Puzhakkal8 Ollukkara 120959 Ollukkara Pananchery9 Anthicad 109205 Kizhakkumuri Anthicad10 Cherpu 45937 Palakkal Avinissery11 Mathilakam 145959 Mathilakam Mathilakam12 Kodungalloor 39384 Eriyad Eriyad13 Mala 144525 Kuruvilassery Mala14 Irinjalakuda 124743 Madayikonam Porathissery15 Kodakara 181996 Puthukad Puthukad16 Vellangallur 114151 Vellangallur Vellangallur17 Chalakkudy 129231 Chalakkudy Chalakkudy
Municipal Council
4
District Spatial Plan - Thrissur PROFILE OF THE DISTRICT
Department of Town & Country Planning, KeralaDepartment of Town & Country Planning, Kerala
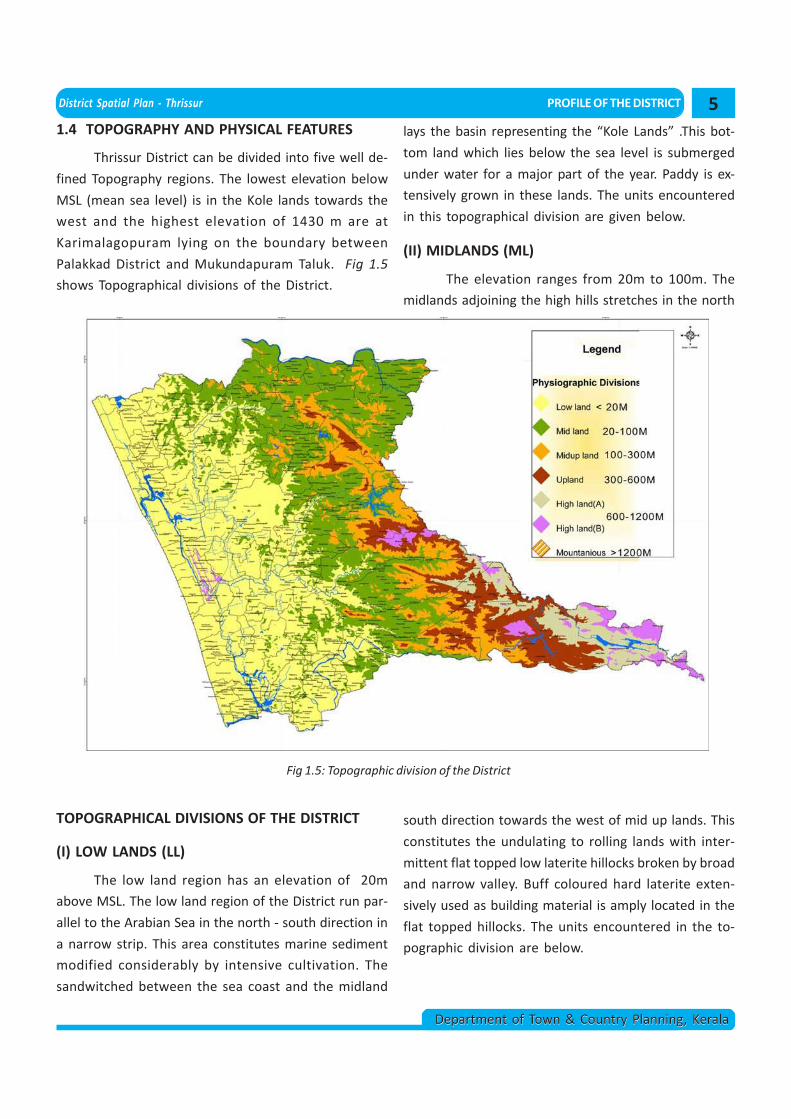
1.4 TOPOGRAPHY AND PHYSICAL FEATURES
Thrissur District can be divided into five well de-
fined Topography regions. The lowest elevation below
MSL (mean sea level) is in the Kole lands towards the
west and the highest elevation of 1430 m are at
Karimalagopuram lying on the boundary between
Palakkad District and Mukundapuram Taluk. Fig 1.5
shows Topographical divisions of the District.
Fig 1.5: Topographic division of the District
TOPOGRAPHICAL DIVISIONS OF THE DISTRICT
(I) LOW LANDS (LL)
The low land region has an elevation of 20m
above MSL. The low land region of the District run par-
allel to the Arabian Sea in the north - south direction in
a narrow strip. This area constitutes marine sediment
modified considerably by intensive cultivation. The
sandwitched between the sea coast and the midland
lays the basin representing the “Kole Lands” .This bot-
tom land which lies below the sea level is submerged
under water for a major part of the year. Paddy is ex-
tensively grown in these lands. The units encountered
in this topographical division are given below.
(II) MIDLANDS (ML)
The elevation ranges from 20m to 100m. The
midlands adjoining the high hills stretches in the north
south direction towards the west of mid up lands. This
constitutes the undulating to rolling lands with inter-
mittent flat topped low laterite hillocks broken by broad
and narrow valley. Buff coloured hard laterite exten-
sively used as building material is amply located in the
flat topped hillocks. The units encountered in the to-
pographic division are below.
5
PROFILE OF THE DISTRICT District Spatial Plan - Thrissur
Department of Town & Country Planning, KeralaDepartment of Town & Country Planning, Kerala
(III) MID UP LANDS (MUL)
The elevation 100 to 300m rolling to hilly terrain
with steep side slopes, isolated rocky patches and in-
termittent narrow valleys. Slope ranges from 10 - 40%.
(IV) UP LANDS (UL)
The elevation is 300 to 600m. Hilly terrain with
high hills and very steep side slopes. Land slope ranges
from 25- 50%.
(V) HIGH LANDS (HL)
The elevation is above 600m for high land. Hill
ranges of the Western Ghats (Sahyadri) with escarp-
ments, summits and rocky cliffs. Areas above 100 m el-
evation are mostly under forest and hence put under
high lands. The high Land running on the east and south
eastern parts covering portions of Mukundapuram and
Thrissur Taluks, constitute a chain of hills as the Machad
Hills, the Paravattani Hills, The Palappilly Hill, the
Kodassery Hills, the Athirappilly Hill etc.
1.4.1 PHYSICAL FEATURES
Physical features of the District namely Natural
Sub-Divisions, Climate, Mountains, Rivers & Lakes and
Backwaters etc. of the District is described here under;
A) NATURAL SUB-DIVISIONS:
Thrissur district falls in the Central Kerala Coast.
Physiographically, the district has five divisions includ-
ing Low Lands, Mid Lands, Mid Up Lands, Up Lands, High
Lands. The highland goes to heights of over 1220 meters
above the mean sea level. The highland goes to North
east part of the district. The low land gently slopes up
to the Backwaters. The sea board lies as a narrow stretch
bordering the sea. Besides, other natural assets in the
region are backwaters locally known as ‘Kayals’ lie par-
allel to the sea coast interconnected by canals, moun-
tains, reserve forest and four rivers (Bharathpuzha,
Kecheri puzha, Karuvannur puzha and Chalakkudy river).
B) CLIMATE :
The district has a tropical humid climate with an
oppressive hot season and plentiful and seasonal rain-
fall. The hot season from March to May is followed by
South West Monsoon from June to September. Octo-
ber and November form the post monsoon or retreat-
ing monsoon season. The rains stop by the end of De-
cember and the rest of the period is generally hot. On
an average there are 124 rainy days in a year.
The average daily maximum temperature in
March & April is about 310 C (830 F) in the coastal re-
gions and 360 C (970 F) in the interior.
The air is highly humid throughout the year, the
relative humidity being generally over 70%. Winds are
generally light to moderate and they strengthen in the
monsoon season.
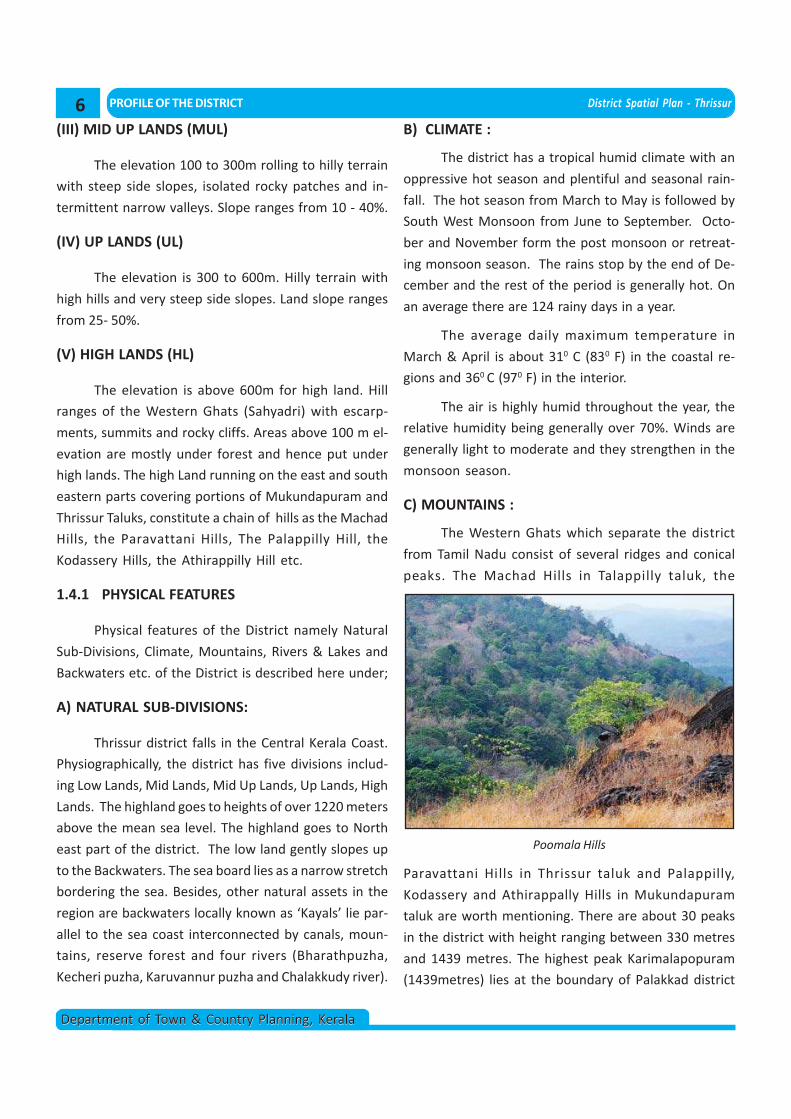
C) MOUNTAINS :
The Western Ghats which separate the district
from Tamil Nadu consist of several ridges and conical
peaks. The Machad Hills in Talappilly taluk, the
Paravattani Hills in Thrissur taluk and Palappilly,
Kodassery and Athirappally Hills in Mukundapuram
taluk are worth mentioning. There are about 30 peaks
in the district with height ranging between 330 metres
and 1439 metres. The highest peak Karimalapopuram
(1439metres) lies at the boundary of Palakkad district
Poomala Hills
6
District Spatial Plan - Thrissur PROFILE OF THE DISTRICT
Department of Town & Country Planning, KeralaDepartment of Town & Country Planning, Kerala
and Mukundapuram taluk of Thrissur district.
D) RIVERS:
The main rivers of the District are Bharathapuzha,
Kecheri puzha, Karuvannur puzha and Chalakudy river.
The Bharathapuzha (209km) originates from
Anaimalai Hills. The 5 tributaries of this river are
Gayathripuzha, Kannadipuzha, Kalpathipuzha,
Cheerankuzhy (Gayathririver) and Thuthupuzha. It flows
as northern boundary of Thrissur for about 40km.
The Kechery River otherwise known as
Wadakkanchery river originates from the Machad hills
flowing westwards and joins the backwaters of
Chettuvai. It has a length of 51 km and Vazhani dam is
constructed on this river basin.
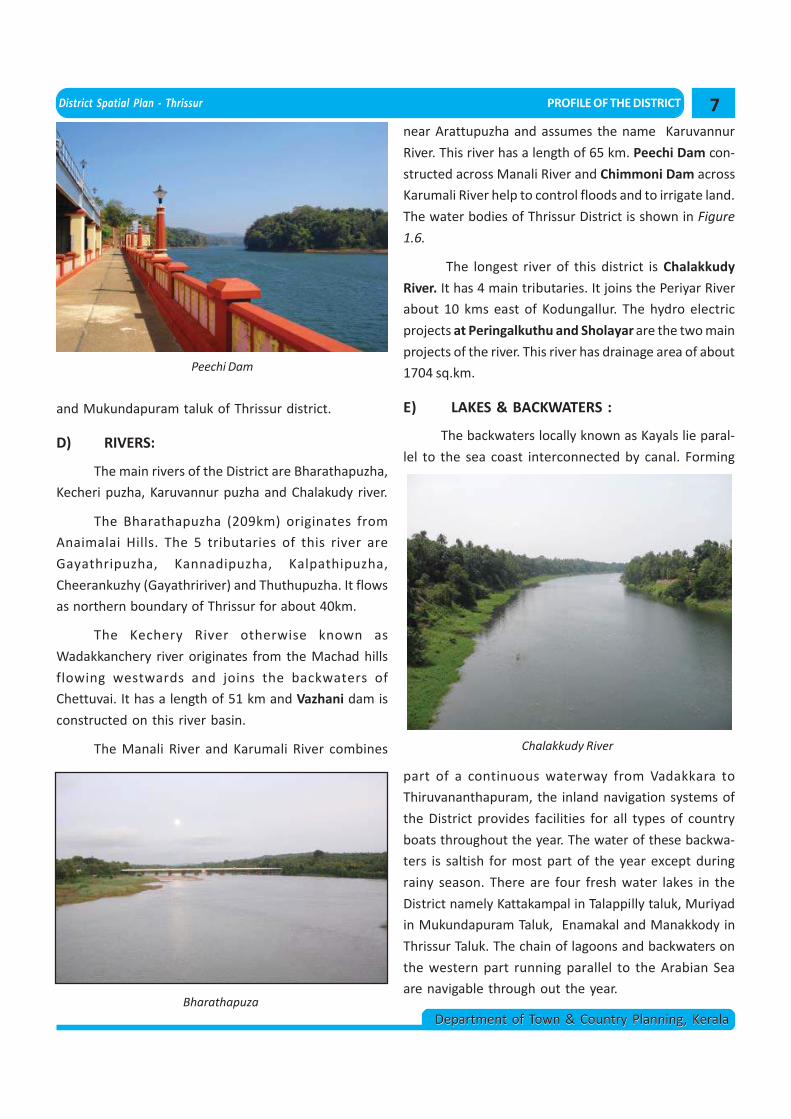
The Manali River and Karumali River combines
Peechi Dam
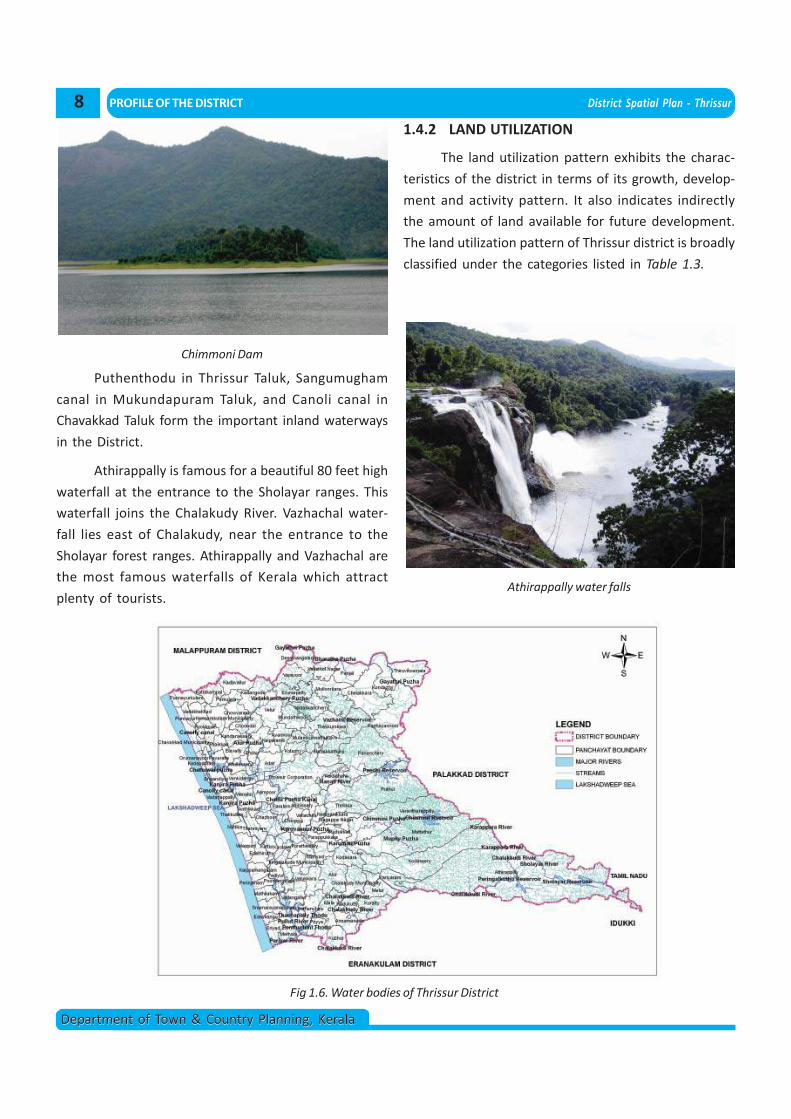
near Arattupuzha and assumes the name Karuvannur
River. This river has a length of 65 km. Peechi Dam con-
structed across Manali River and Chimmoni Dam across
Karumali River help to control floods and to irrigate land.
The water bodies of Thrissur District is shown in Figure
1.6.
The longest river of this district is Chalakkudy
River. It has 4 main tributaries. It joins the Periyar River
about 10 kms east of Kodungallur. The hydro electric
projects at Peringalkuthu and Sholayar are the two main
projects of the river. This river has drainage area of about
1704 sq.km.
E) LAKES & BACKWATERS :
The backwaters locally known as Kayals lie paral-
lel to the sea coast interconnected by canal. Forming
part of a continuous waterway from Vadakkara to
Thiruvananthapuram, the inland navigation systems of
the District provides facilities for all types of country
boats throughout the year. The water of these backwa-
ters is saltish for most part of the year except during
rainy season. There are four fresh water lakes in the
District namely Kattakampal in Talappilly taluk, Muriyad
in Mukundapuram Taluk, Enamakal and Manakkody in
Thrissur Taluk. The chain of lagoons and backwaters on
the western part running parallel to the Arabian Sea
are navigable through out the year.Bharathapuza
Chalakkudy River
7
PROFILE OF THE DISTRICT District Spatial Plan - Thrissur
Department of Town & Country Planning, KeralaDepartment of Town & Country Planning, Kerala
Puthenthodu in Thrissur Taluk, Sangumugham
canal in Mukundapuram Taluk, and Canoli canal in
Chavakkad Taluk form the important inland waterways
in the District.
Athirappally is famous for a beautiful 80 feet high
waterfall at the entrance to the Sholayar ranges. This
waterfall joins the Chalakudy River. Vazhachal water-
fall lies east of Chalakudy, near the entrance to the
Sholayar forest ranges. Athirappally and Vazhachal are
the most famous waterfalls of Kerala which attract
plenty of tourists.Athirappally water falls
Chimmoni Dam
1.4.2 LAND UTILIZATION
The land utilization pattern exhibits the charac-
teristics of the district in terms of its growth, develop-
ment and activity pattern. It also indicates indirectly
the amount of land available for future development.
The land utilization pattern of Thrissur district is broadly
classified under the categories listed in Table 1.3.
Fig 1.6. Water bodies of Thrissur District
8
District Spatial Plan - Thrissur PROFILE OF THE DISTRICT
Department of Town & Country Planning, KeralaDepartment of Town & Country Planning, Kerala
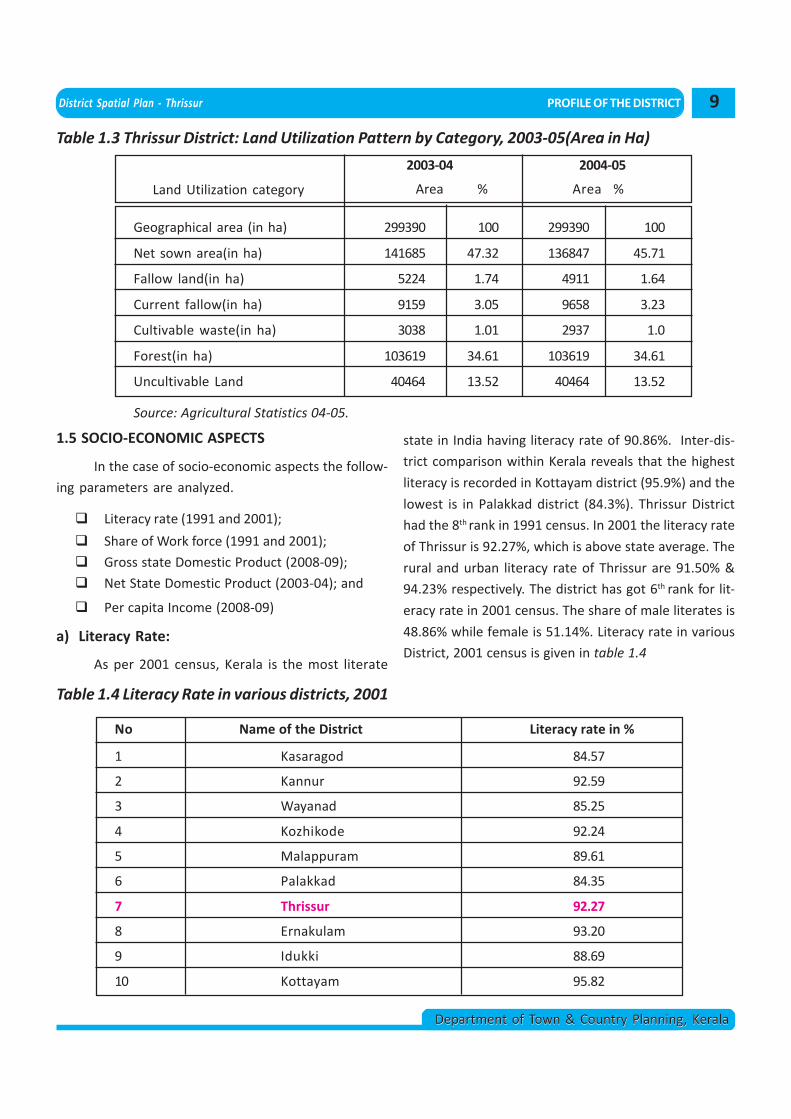
Table 1.3 Thrissur District: Land Utilization Pattern by Category, 2003-05(Area in Ha)
Geographical area (in ha) 299390 100 299390 100
Net sown area(in ha) 141685 47.32 136847 45.71
Fallow land(in ha) 5224 1.74 4911 1.64
Current fallow(in ha) 9159 3.05 9658 3.23
Cultivable waste(in ha) 3038 1.01 2937 1.0
Forest(in ha) 103619 34.61 103619 34.61
Uncultivable Land 40464 13.52 40464 13.52
2003-04 2004-05
Land Utilization category Area % Area %
Source: Agricultural Statistics 04-05.
1.5 SOCIO-ECONOMIC ASPECTS
In the case of socio-economic aspects the follow-
ing parameters are analyzed.
Literacy rate (1991 and 2001);
Share of Work force (1991 and 2001);
Gross state Domestic Product (2008-09);
Net State Domestic Product (2003-04); and
Per capita Income (2008-09)
a) Literacy Rate:
As per 2001 census, Kerala is the most literate
state in India having literacy rate of 90.86%. Inter-dis-
trict comparison within Kerala reveals that the highest
literacy is recorded in Kottayam district (95.9%) and the
lowest is in Palakkad district (84.3%). Thrissur District
had the 8th rank in 1991 census. In 2001 the literacy rate
of Thrissur is 92.27%, which is above state average. The
rural and urban literacy rate of Thrissur are 91.50% &
94.23% respectively. The district has got 6th rank for lit-
eracy rate in 2001 census. The share of male literates is
48.86% while female is 51.14%. Literacy rate in various
District, 2001 census is given in table 1.4
No Name of the District Literacy rate in %
1 Kasaragod 84.57
2 Kannur 92.59
3 Wayanad 85.25
4 Kozhikode 92.24
5 Malappuram 89.61
6 Palakkad 84.35
7 Thrissur 92.27
8 Ernakulam 93.20
9 Idukki 88.69
10 Kottayam 95.82
Table 1.4 Literacy Rate in various districts, 2001
9
PROFILE OF THE DISTRICT District Spatial Plan - Thrissur
Department of Town & Country Planning, KeralaDepartment of Town & Country Planning, Kerala
11 Alappuzha 93.43
12 Pathanamthitta 94.84
13 Kollam 91.18
14 Thiruvananthapuram 89.28
Source : 2001 Census
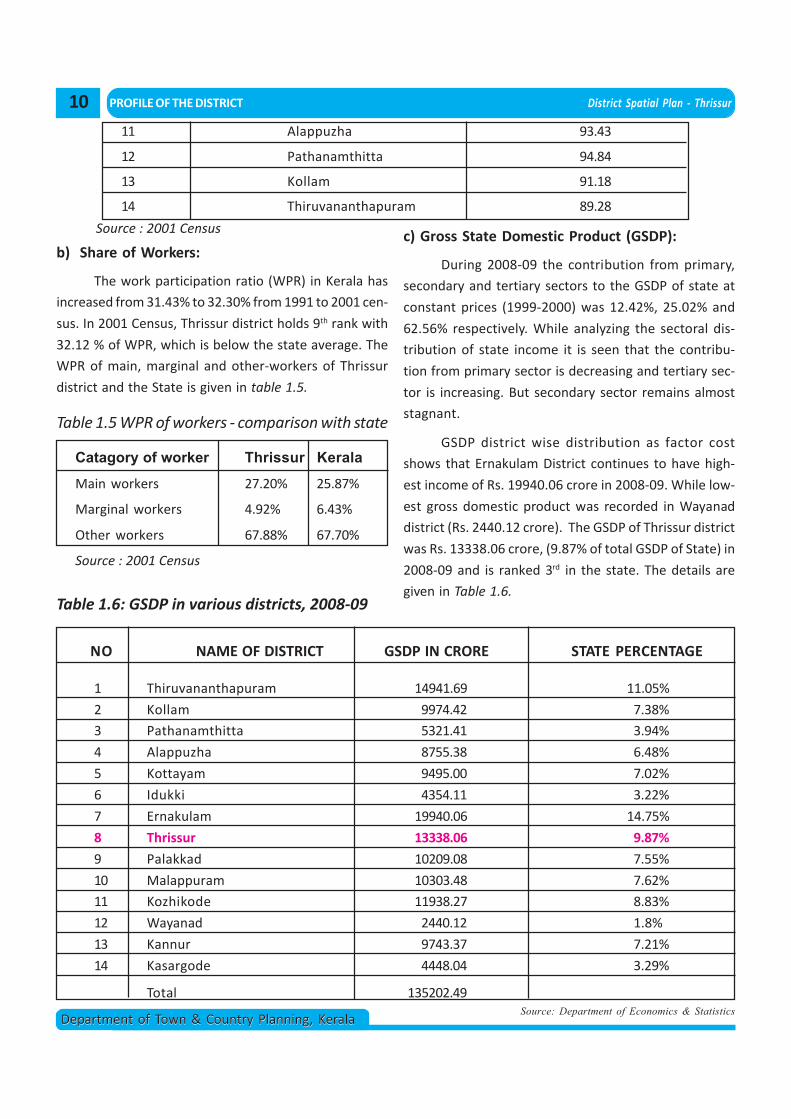
b) Share of Workers:
The work participation ratio (WPR) in Kerala has
increased from 31.43% to 32.30% from 1991 to 2001 cen-
sus. In 2001 Census, Thrissur district holds 9th rank with
32.12 % of WPR, which is below the state average. The
WPR of main, marginal and other-workers of Thrissur
district and the State is given in table 1.5.
Table 1.5 WPR of workers - comparison with state
Catagory of worker Thrissur Kerala
Main workers 27.20% 25.87%
Marginal workers 4.92% 6.43%
Other workers 67.88% 67.70%
Source : 2001 Census
c) Gross State Domestic Product (GSDP):
During 2008-09 the contribution from primary,
secondary and tertiary sectors to the GSDP of state at
constant prices (1999-2000) was 12.42%, 25.02% and
62.56% respectively. While analyzing the sectoral dis-
tribution of state income it is seen that the contribu-
tion from primary sector is decreasing and tertiary sec-
tor is increasing. But secondary sector remains almost
stagnant.
GSDP district wise distribution as factor cost
shows that Ernakulam District continues to have high-
est income of Rs. 19940.06 crore in 2008-09. While low-
est gross domestic product was recorded in Wayanad
district (Rs. 2440.12 crore). The GSDP of Thrissur district
was Rs. 13338.06 crore, (9.87% of total GSDP of State) in
2008-09 and is ranked 3rd in the state. The details are
given in Table 1.6.Table 1.6: GSDP in various districts, 2008-09
NO NAME OF DISTRICT GSDP IN CRORE STATE PERCENTAGE
1 Thiruvananthapuram 14941.69 11.05%
2 Kollam 9974.42 7.38%
3 Pathanamthitta 5321.41 3.94%
4 Alappuzha 8755.38 6.48%
5 Kottayam 9495.00 7.02%
6 Idukki 4354.11 3.22%
7 Ernakulam 19940.06 14.75%
8 Thrissur 13338.06 9.87%
9 Palakkad 10209.08 7.55%
10 Malappuram 10303.48 7.62%
11 Kozhikode 11938.27 8.83%
12 Wayanad 2440.12 1.8%
13 Kannur 9743.37 7.21%
14 Kasargode 4448.04 3.29%
Total 135202.49Source: Department of Economics & Statistics
10
District Spatial Plan - Thrissur PROFILE OF THE DISTRICT
Department of Town & Country Planning, KeralaDepartment of Town & Country Planning, Kerala
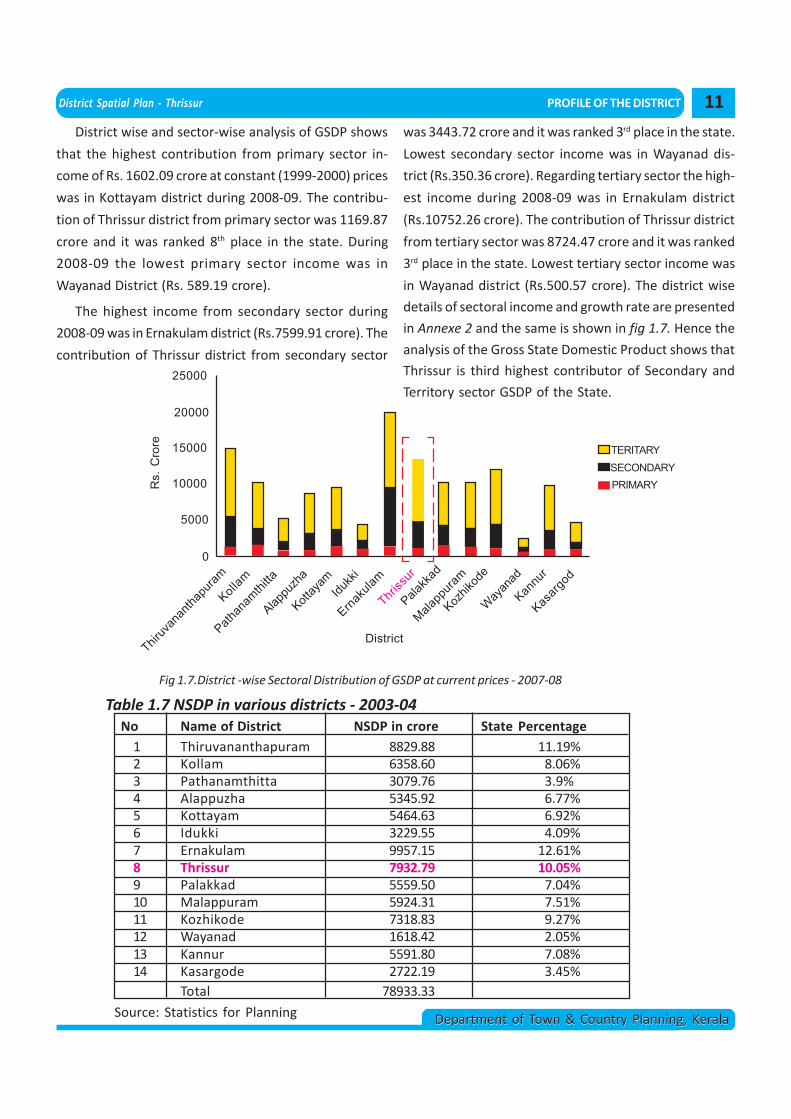
District wise and sector-wise analysis of GSDP shows
that the highest contribution from primary sector in-
come of Rs. 1602.09 crore at constant (1999-2000) prices
was in Kottayam district during 2008-09. The contribu-
tion of Thrissur district from primary sector was 1169.87
crore and it was ranked 8th place in the state. During
2008-09 the lowest primary sector income was in
Wayanad District (Rs. 589.19 crore).
The highest income from secondary sector during
2008-09 was in Ernakulam district (Rs.7599.91 crore). The
contribution of Thrissur district from secondary sector
No Name of District NSDP in crore State Percentage1 Thiruvananthapuram 8829.88 11.19%2 Kollam 6358.60 8.06%3 Pathanamthitta 3079.76 3.9%4 Alappuzha 5345.92 6.77%5 Kottayam 5464.63 6.92%6 Idukki 3229.55 4.09%7 Ernakulam 9957.15 12.61%8 Thrissur 7932.79 10.05%9 Palakkad 5559.50 7.04%10 Malappuram 5924.31 7.51%11 Kozhikode 7318.83 9.27%12 Wayanad 1618.42 2.05%13 Kannur 5591.80 7.08%14 Kasargode 2722.19 3.45%
Total 78933.33
Source: Statistics for Planning
25000
20000
15000
10000
5000
0
Thiruv
anan
thapu
ram
Kollam
Pathan
amthi
tta
Alappu
zha
Kottay
amIdu
kki
Ernaku
lam
Thriss
ur
Palakk
ad
Malapp
uram
Kozhik
ode
Way
anad
Kannu
r
Kasar
god
District
Rs.
Cro
re TERITARYSECONDARYPRIMARY
was 3443.72 crore and it was ranked 3rd place in the state.
Lowest secondary sector income was in Wayanad dis-
trict (Rs.350.36 crore). Regarding tertiary sector the high-
est income during 2008-09 was in Ernakulam district
(Rs.10752.26 crore). The contribution of Thrissur district
from tertiary sector was 8724.47 crore and it was ranked
3rd place in the state. Lowest tertiary sector income was
in Wayanad district (Rs.500.57 crore). The district wise
details of sectoral income and growth rate are presented
in Annexe 2 and the same is shown in fig 1.7. Hence the
analysis of the Gross State Domestic Product shows that
Thrissur is third highest contributor of Secondary and
Territory sector GSDP of the State.
Fig 1.7.District -wise Sectoral Distribution of GSDP at current prices - 2007-08
Table 1.7 NSDP in various districts - 2003-04
11
PROFILE OF THE DISTRICT District Spatial Plan - Thrissur
Department of Town & Country Planning, KeralaDepartment of Town & Country Planning, Kerala
c) Net State Domestic Product (NSDP):
NSDP district wise distribution as factor cost
shows that the Ernakulam district continues to have
highest income at Rs. 9957.15 crore in 2003-04, while
lowest net domestic product was recorded in Wayanad
district (Rs. 1618.42 crore). The NSDP of Thrissur dis-
trict was Rs.7932.79 crore, (10.05 % of total NSDP of
State) in 2003-04 and is ranked 3rd in the state. The dis-
trict wise NSDP is given in Table. 1.7.
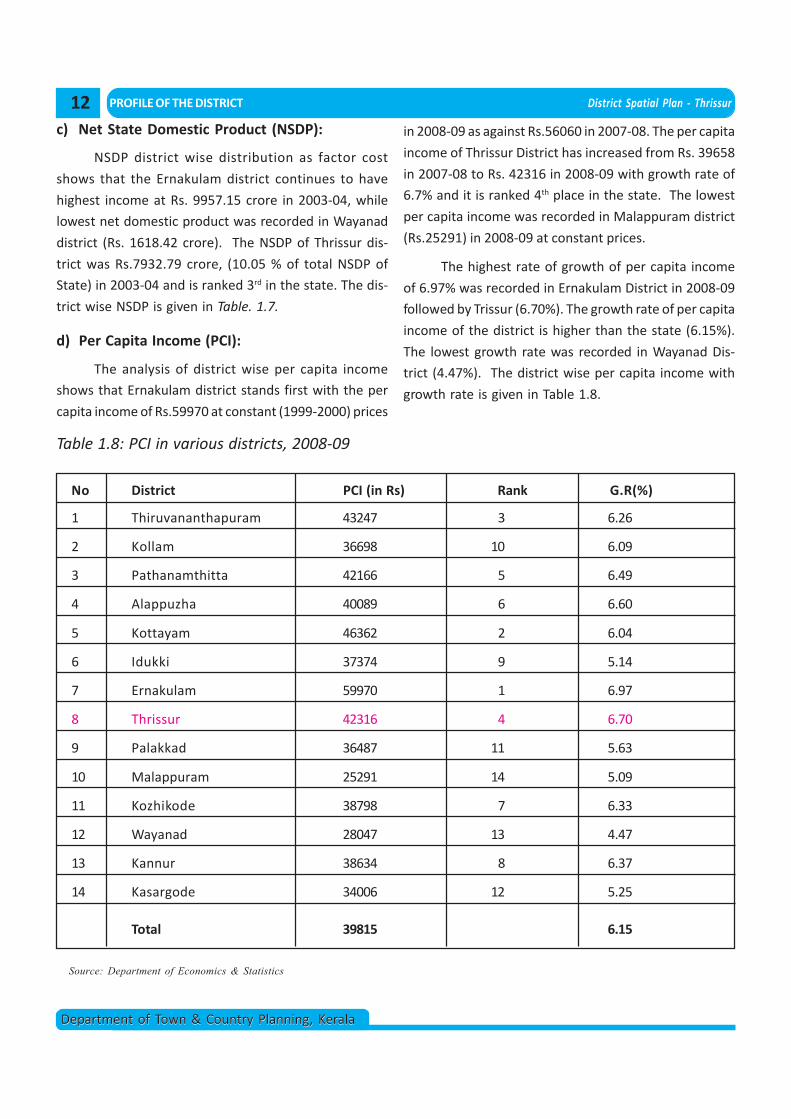
d) Per Capita Income (PCI):
The analysis of district wise per capita income
shows that Ernakulam district stands first with the per
capita income of Rs.59970 at constant (1999-2000) prices
in 2008-09 as against Rs.56060 in 2007-08. The per capita
income of Thrissur District has increased from Rs. 39658
in 2007-08 to Rs. 42316 in 2008-09 with growth rate of
6.7% and it is ranked 4th place in the state. The lowest
per capita income was recorded in Malappuram district
(Rs.25291) in 2008-09 at constant prices.
The highest rate of growth of per capita income
of 6.97% was recorded in Ernakulam District in 2008-09
followed by Trissur (6.70%). The growth rate of per capita
income of the district is higher than the state (6.15%).
The lowest growth rate was recorded in Wayanad Dis-
trict (4.47%). The district wise per capita income with
growth rate is given in Table 1.8.
Table 1.8: PCI in various districts, 2008-09
No District PCI (in Rs) Rank G.R(%)
1 Thiruvananthapuram 43247 3 6.26
2 Kollam 36698 10 6.09
3 Pathanamthitta 42166 5 6.49
4 Alappuzha 40089 6 6.60
5 Kottayam 46362 2 6.04
6 Idukki 37374 9 5.14
7 Ernakulam 59970 1 6.97
8 Thrissur 42316 4 6.70
9 Palakkad 36487 11 5.63
10 Malappuram 25291 14 5.09
11 Kozhikode 38798 7 6.33
12 Wayanad 28047 13 4.47
13 Kannur 38634 8 6.37
14 Kasargode 34006 12 5.25
Total 39815 6.15
Source: Department of Economics & Statistics
12
District Spatial Plan - Thrissur PROFILE OF THE DISTRICT
Department of Town & Country Planning, KeralaDepartment of Town & Country Planning, Kerala
1.6 INFERENCE
Thrissur District has 17 development blocks, six
Municipal Council and one Municipal Corporation.
Thrissur district can be divided into 5 well defined physi-
ographic regions namely (i) Low lands (ii) Mid Lands
(iii) Mid Up Lands (iv) Up Lands (v)High Lands. The dis-
trict has about 33.34% of its geographical area as forest
mainly seen in the eastern part of the district. The Dis-
trict is blessed with mountains and rivers. The literacy
rate of the district is 92.27% and work participation rate
is 32.12%.
The district contribute 9.87% of the total GSDP of
the state and is ranked 3rd in the state. The sectoral
contribution of the district into the state GSDP shows
that the district is the 3rd highest contributer in sec-
ondary and tertiary sector.
13
District Spatial Plan - Thrissur HISTORY AND REGIONAL LINKAGE
Department of Town & Country Planning, KeralaDepartment of Town & Country Planning, Kerala
Chapter – 2HISTORY AND REGIONAL LINKAGES
Thrissur is a central coastal district of Kerala situ-
ated approximately 295 Km north of
Thiruvananthapuram, the state capital. The District
played a very important role in fostering trade rela-
tions between Kerala and outside world in the ancient
and medieval periods. This is an introductory chapter
which include an introduction about Thrissur district,
its historical background and physical setting of the dis-
trict with respect to the nearby important settlements
are described.
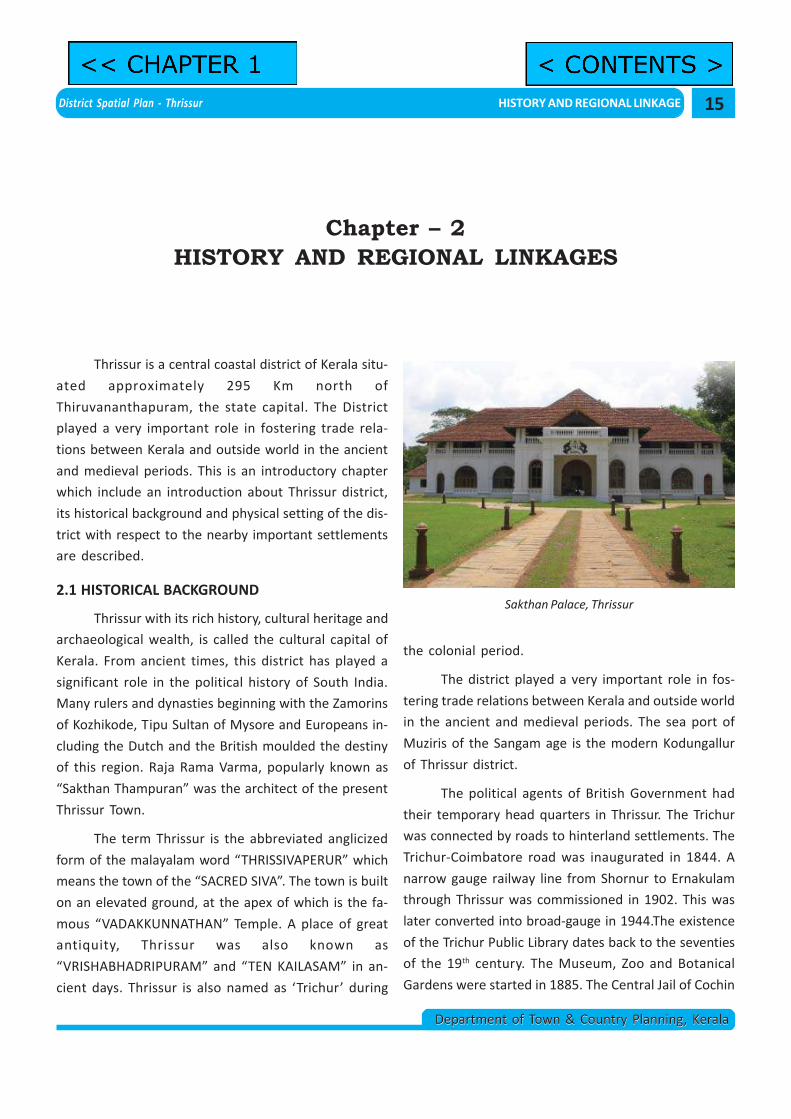
2.1 HISTORICAL BACKGROUND
Thrissur with its rich history, cultural heritage and
archaeological wealth, is called the cultural capital of
Kerala. From ancient times, this district has played a
significant role in the political history of South India.
Many rulers and dynasties beginning with the Zamorins
of Kozhikode, Tipu Sultan of Mysore and Europeans in-
cluding the Dutch and the British moulded the destiny
of this region. Raja Rama Varma, popularly known as
“Sakthan Thampuran” was the architect of the present
Thrissur Town.
The term Thrissur is the abbreviated anglicized
form of the malayalam word “THRISSIVAPERUR” which
means the town of the “SACRED SIVA”. The town is built
on an elevated ground, at the apex of which is the fa-
mous “VADAKKUNNATHAN” Temple. A place of great
antiquity, Thrissur was also known as
“VRISHABHADRIPURAM” and “TEN KAILASAM” in an-
cient days. Thrissur is also named as ‘Trichur’ during
the colonial period.
The district played a very important role in fos-
tering trade relations between Kerala and outside world
in the ancient and medieval periods. The sea port of
Muziris of the Sangam age is the modern Kodungallur
of Thrissur district.
The political agents of British Government had
their temporary head quarters in Thrissur. The Trichur
was connected by roads to hinterland settlements. The
Trichur-Coimbatore road was inaugurated in 1844. A
narrow gauge railway line from Shornur to Ernakulam
through Thrissur was commissioned in 1902. This was
later converted into broad-gauge in 1944.The existence
of the Trichur Public Library dates back to the seventies
of the 19th century. The Museum, Zoo and Botanical
Gardens were started in 1885. The Central Jail of Cochin
Sakthan Palace, Thrissur
15
District Spatial Plan - Thrissur
Department of Town & Country Planning, KeralaDepartment of Town & Country Planning, Kerala
HISTORY AND REGIONAL LINKAGE
State was established in 1914.
The present Trichur district is a part of erstwhile
Cochin state. Cochin state had been divided into
‘Nadus’, these Nadus were subsequently divided into
‘Kovilakathum-vathukkals’ or Taluks. The taluks were
grouped into two divisions- Vadakkemugham and
Thekkemugham. The Cochin area of present Trichur
comes formed part of the Vadakkemugham. With ef-
fect from the 1st July 1949 a new district named Thrissur
was formed with 6 taluks of the erstwhile Cochin State
viz. Thalappilly, Chittoor, Thrissur, Mukundapuram,
Canannore and Cochin-Kanayannur and taluks of erst-
while Travancore areas, namely, Kunnathunad and
Parur.
Melpathoor Narayana Bhattathiri (Narayanee-
yam), Poonthanam (Njanappana), Unnayi Warrier
(Nalacharitham), Kunjikuttan Thampuran known
as Kerala Vyasa, Vallathol Narayana Menon,
C.Achutha Menon, Panditaraja K. Rama Pisharoti
are some prominent personalities belonging to
this district.
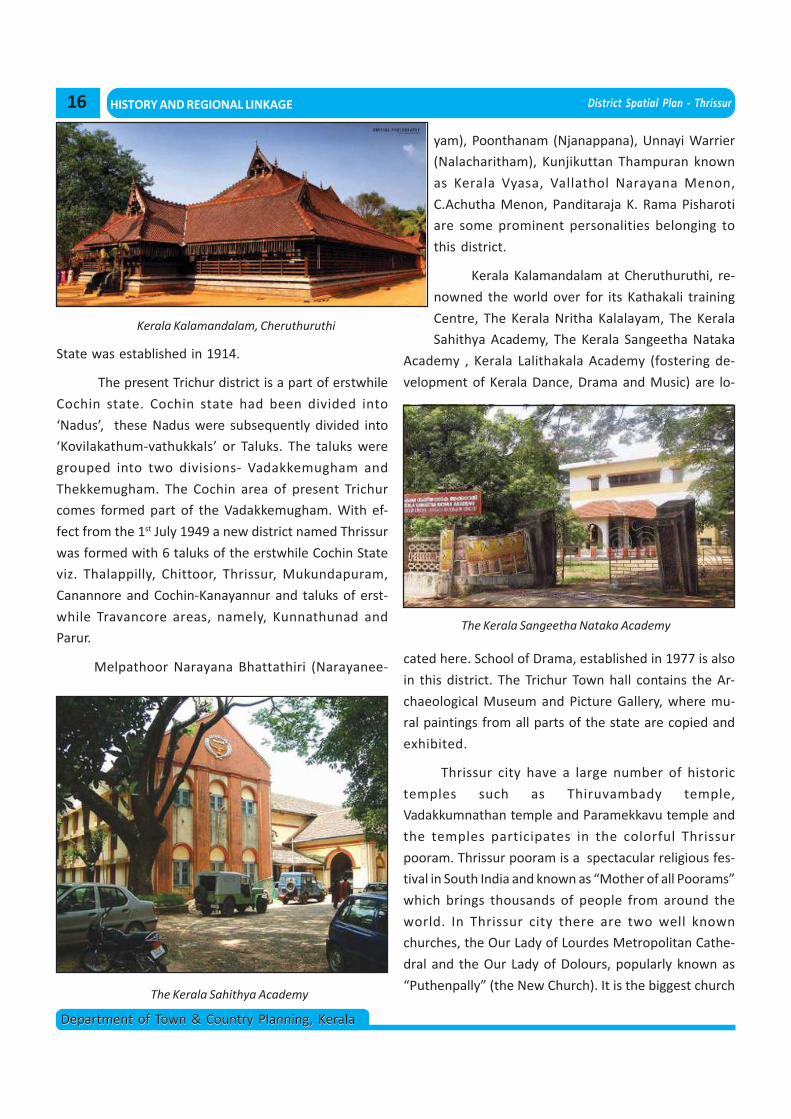
Kerala Kalamandalam at Cheruthuruthi, re-
nowned the world over for its Kathakali training
Centre, The Kerala Nritha Kalalayam, The Kerala
Sahithya Academy, The Kerala Sangeetha Nataka
Academy , Kerala Lalithakala Academy (fostering de-
velopment of Kerala Dance, Drama and Music) are lo-
cated here. School of Drama, established in 1977 is also
in this district. The Trichur Town hall contains the Ar-
chaeological Museum and Picture Gallery, where mu-
ral paintings from all parts of the state are copied and
exhibited.
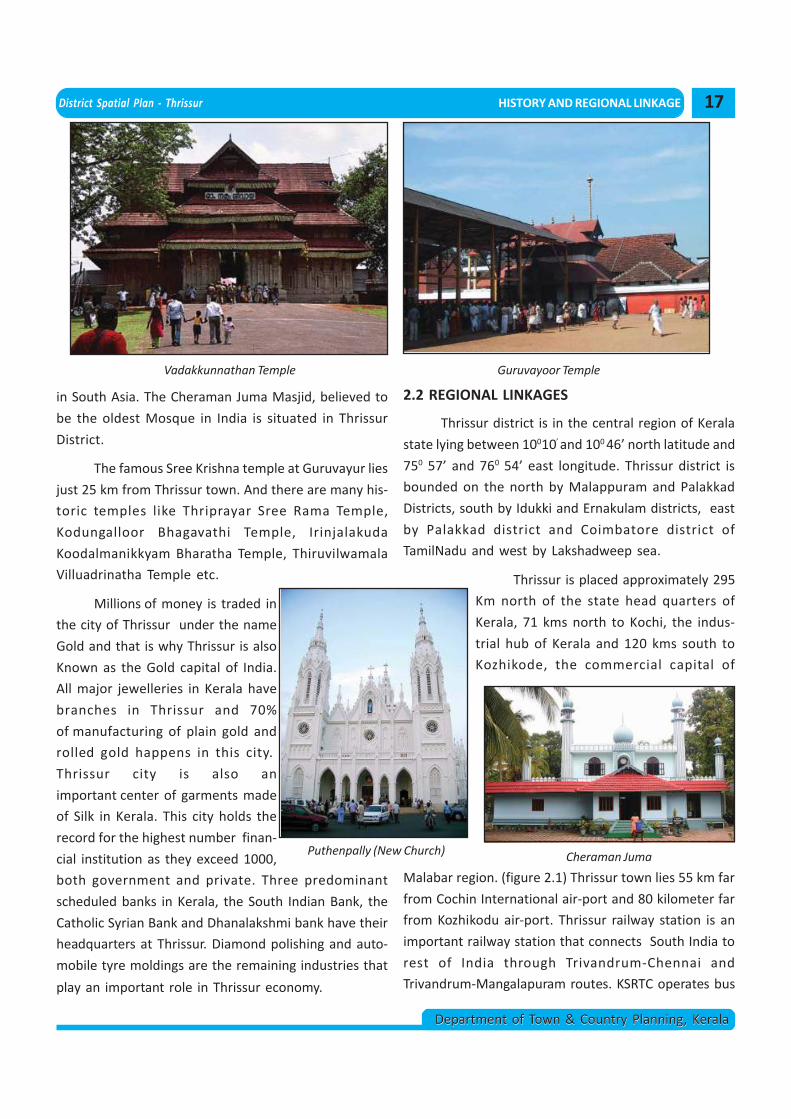
Thrissur city have a large number of historic
temples such as Thiruvambady temple,
Vadakkumnathan temple and Paramekkavu temple and
the temples participates in the colorful Thrissur
pooram. Thrissur pooram is a spectacular religious fes-
tival in South India and known as “Mother of all Poorams”
which brings thousands of people from around the
world. In Thrissur city there are two well known
churches, the Our Lady of Lourdes Metropolitan Cathe-
dral and the Our Lady of Dolours, popularly known as
“Puthenpally” (the New Church). It is the biggest church
Kerala Kalamandalam, Cheruthuruthi
The Kerala Sahithya Academy
The Kerala Sangeetha Nataka Academy
16
District Spatial Plan - Thrissur HISTORY AND REGIONAL LINKAGE
Department of Town & Country Planning, KeralaDepartment of Town & Country Planning, Kerala
in South Asia. The Cheraman Juma Masjid, believed to
be the oldest Mosque in India is situated in Thrissur
District.
The famous Sree Krishna temple at Guruvayur lies
just 25 km from Thrissur town. And there are many his-
toric temples like Thriprayar Sree Rama Temple,
Kodungalloor Bhagavathi Temple, Irinjalakuda
Koodalmanikkyam Bharatha Temple, Thiruvilwamala
Villuadrinatha Temple etc.
Millions of money is traded in
the city of Thrissur under the name
Gold and that is why Thrissur is also
Known as the Gold capital of India.
All major jewelleries in Kerala have
branches in Thrissur and 70%
of manufacturing of plain gold and
rolled gold happens in this city.
Thrissur city is also an
important center of garments made
of Silk in Kerala. This city holds the
record for the highest number finan-
cial institution as they exceed 1000,
both government and private. Three predominant
scheduled banks in Kerala, the South Indian Bank, the
Catholic Syrian Bank and Dhanalakshmi bank have their
headquarters at Thrissur. Diamond polishing and auto-
mobile tyre moldings are the remaining industries that
play an important role in Thrissur economy.
Vadakkunnathan Temple Guruvayoor Temple
2.2 REGIONAL LINKAGES
Thrissur district is in the central region of Kerala
state lying between 10010’ and 100 46’ north latitude and
750 57’ and 760 54’ east longitude. Thrissur district is
bounded on the north by Malappuram and Palakkad
Districts, south by Idukki and Ernakulam districts, east
by Palakkad district and Coimbatore district of
TamilNadu and west by Lakshadweep sea.
Thrissur is placed approximately 295
Km north of the state head quarters of
Kerala, 71 kms north to Kochi, the indus-
trial hub of Kerala and 120 kms south to
Kozhikode, the commercial capital of
Malabar region. (figure 2.1) Thrissur town lies 55 km far
from Cochin International air-port and 80 kilometer far
from Kozhikodu air-port. Thrissur railway station is an
important railway station that connects South India to
rest of India through Trivandrum-Chennai and
Trivandrum-Mangalapuram routes. KSRTC operates bus
Puthenpally (New Church) Cheraman Juma
17
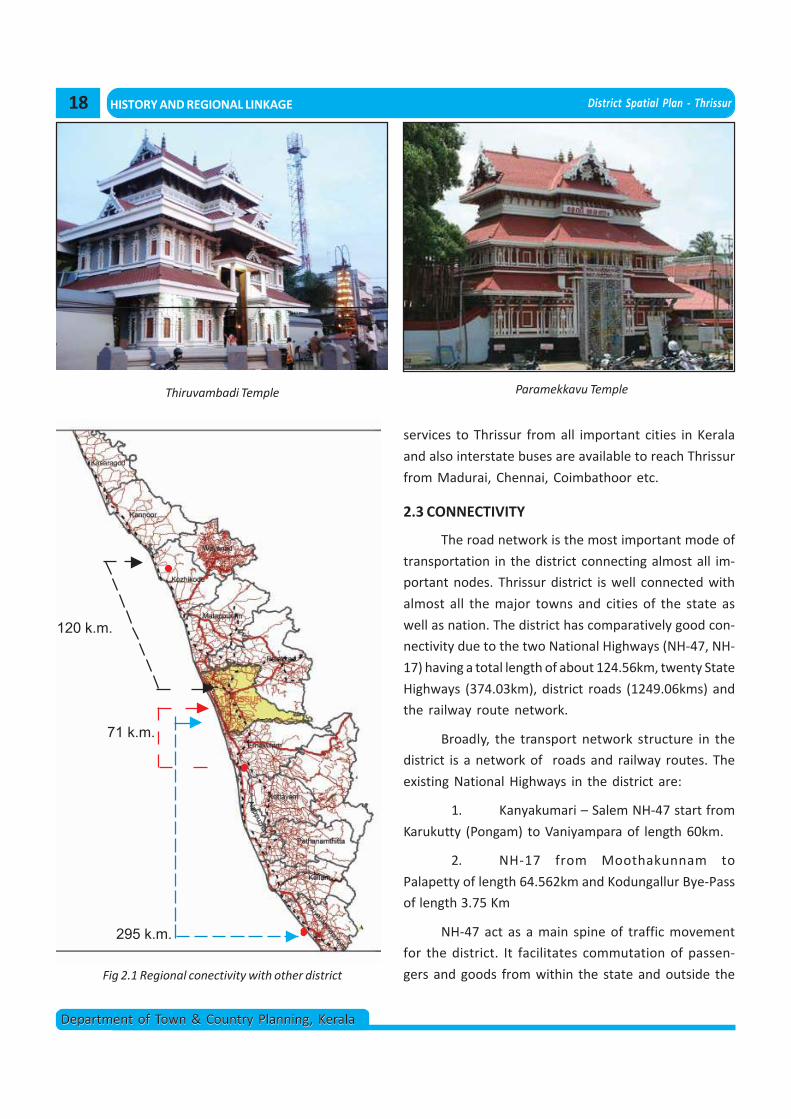
District Spatial Plan - Thrissur
Department of Town & Country Planning, KeralaDepartment of Town & Country Planning, Kerala
HISTORY AND REGIONAL LINKAGE
services to Thrissur from all important cities in Kerala
and also interstate buses are available to reach Thrissur
from Madurai, Chennai, Coimbathoor etc.
2.3 CONNECTIVITY
The road network is the most important mode of
transportation in the district connecting almost all im-
portant nodes. Thrissur district is well connected with
almost all the major towns and cities of the state as
well as nation. The district has comparatively good con-
nectivity due to the two National Highways (NH-47, NH-
17) having a total length of about 124.56km, twenty State
Highways (374.03km), district roads (1249.06kms) and
the railway route network.
Broadly, the transport network structure in the
district is a network of roads and railway routes. The
existing National Highways in the district are:
1. Kanyakumari – Salem NH-47 start from
Karukutty (Pongam) to Vaniyampara of length 60km.
2. NH-17 from Moothakunnam to
Palapetty of length 64.562km and Kodungallur Bye-Pass
of length 3.75 Km
NH-47 act as a main spine of traffic movement
for the district. It facilitates commutation of passen-
gers and goods from within the state and outside the
Paramekkavu TempleThiruvambadi Temple
Fig 2.1 Regional conectivity with other district
71 k.m.
295 k.m.
120 k.m.
18
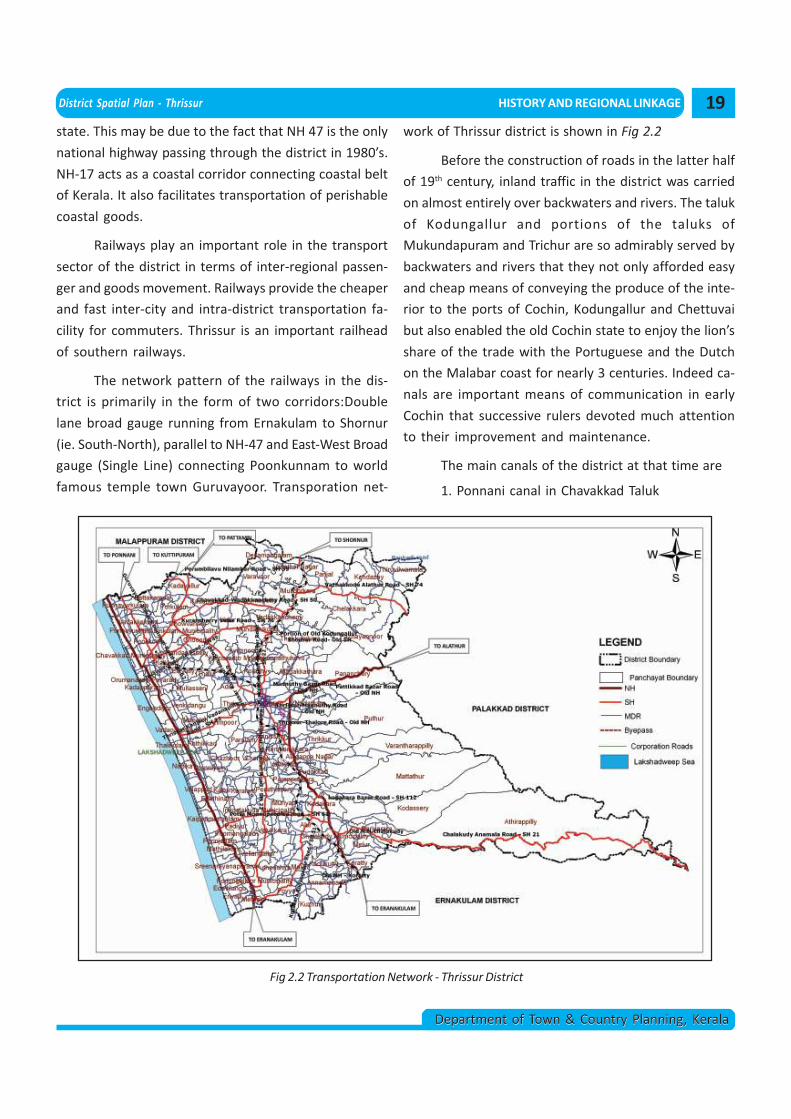
District Spatial Plan - Thrissur HISTORY AND REGIONAL LINKAGE
Department of Town & Country Planning, KeralaDepartment of Town & Country Planning, Kerala
state. This may be due to the fact that NH 47 is the only
national highway passing through the district in 1980’s.
NH-17 acts as a coastal corridor connecting coastal belt
of Kerala. It also facilitates transportation of perishable
coastal goods.
Railways play an important role in the transport
sector of the district in terms of inter-regional passen-
ger and goods movement. Railways provide the cheaper
and fast inter-city and intra-district transportation fa-
cility for commuters. Thrissur is an important railhead
of southern railways.
The network pattern of the railways in the dis-
trict is primarily in the form of two corridors:Double
lane broad gauge running from Ernakulam to Shornur
(ie. South-North), parallel to NH-47 and East-West Broad
gauge (Single Line) connecting Poonkunnam to world
famous temple town Guruvayoor. Transporation net-
Fig 2.2 Transportation Network - Thrissur District
work of Thrissur district is shown in Fig 2.2
Before the construction of roads in the latter half
of 19th century, inland traffic in the district was carried
on almost entirely over backwaters and rivers. The taluk
of Kodungallur and portions of the taluks of
Mukundapuram and Trichur are so admirably served by
backwaters and rivers that they not only afforded easy
and cheap means of conveying the produce of the inte-
rior to the ports of Cochin, Kodungallur and Chettuvai
but also enabled the old Cochin state to enjoy the lion’s
share of the trade with the Portuguese and the Dutch
on the Malabar coast for nearly 3 centuries. Indeed ca-
nals are important means of communication in early
Cochin that successive rulers devoted much attention
to their improvement and maintenance.
The main canals of the district at that time are
1. Ponnani canal in Chavakkad Taluk
19
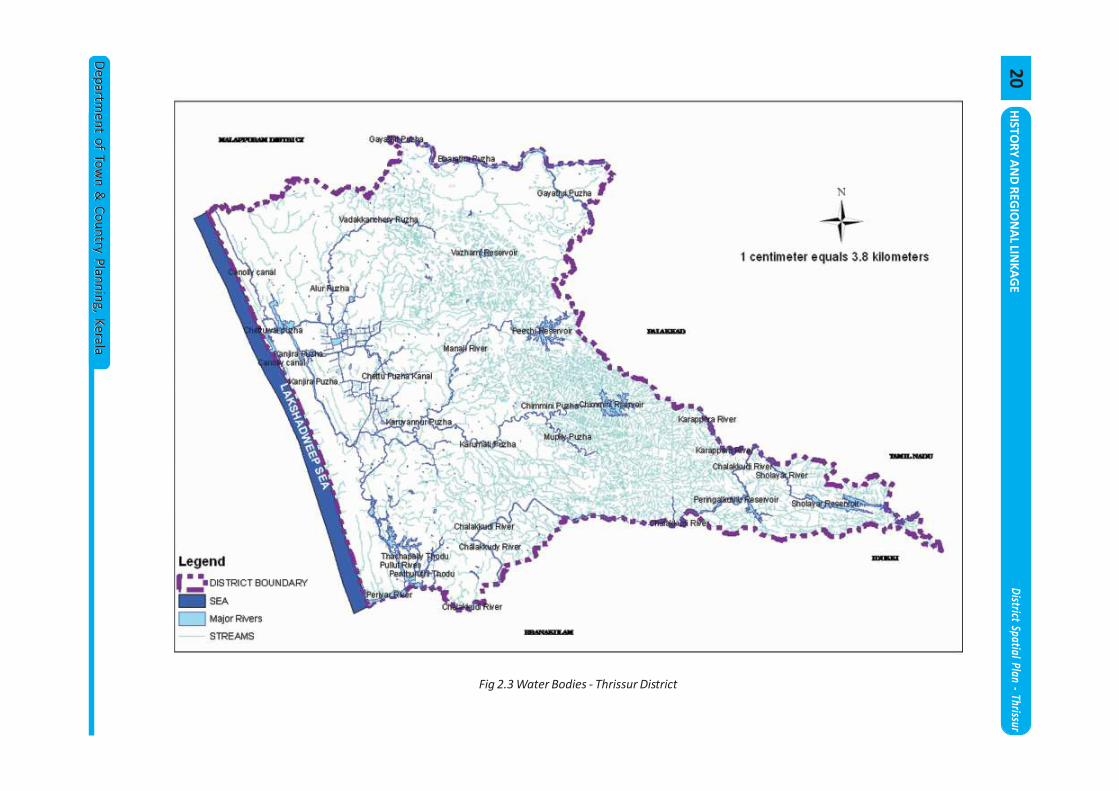
District Spatial Plan - Thrissur
Departm
ent of Town &
Country Planning, KeralaD
epartment of Tow
n & Country Planning, Kerala
HISTO
RY AN
D REG
ION
AL LIN
KAG
E
Fig 2.3 Water Bodies - Thrissur District
20
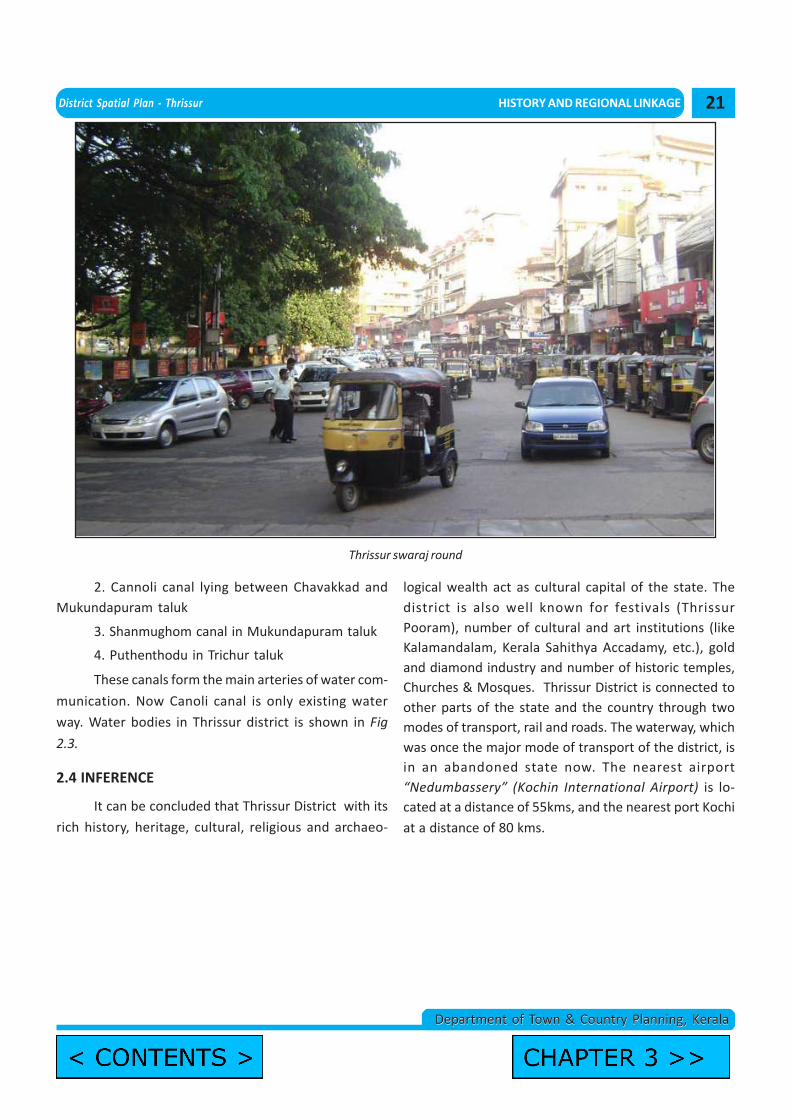
District Spatial Plan - Thrissur HISTORY AND REGIONAL LINKAGE
Department of Town & Country Planning, KeralaDepartment of Town & Country Planning, Kerala
Thrissur swaraj round
2. Cannoli canal lying between Chavakkad andMukundapuram taluk
3. Shanmughom canal in Mukundapuram taluk
4. Puthenthodu in Trichur taluk
These canals form the main arteries of water com-
munication. Now Canoli canal is only existing water
way. Water bodies in Thrissur district is shown in Fig
2.3.
2.4 INFERENCE
It can be concluded that Thrissur District with its
rich history, heritage, cultural, religious and archaeo-
logical wealth act as cultural capital of the state. Thedistrict is also well known for festivals (ThrissurPooram), number of cultural and art institutions (likeKalamandalam, Kerala Sahithya Accadamy, etc.), goldand diamond industry and number of historic temples,Churches & Mosques. Thrissur District is connected toother parts of the state and the country through twomodes of transport, rail and roads. The waterway, whichwas once the major mode of transport of the district, isin an abandoned state now. The nearest airport“Nedumbassery” (Kochin International Airport) is lo-cated at a distance of 55kms, and the nearest port Kochiat a distance of 80 kms.
21
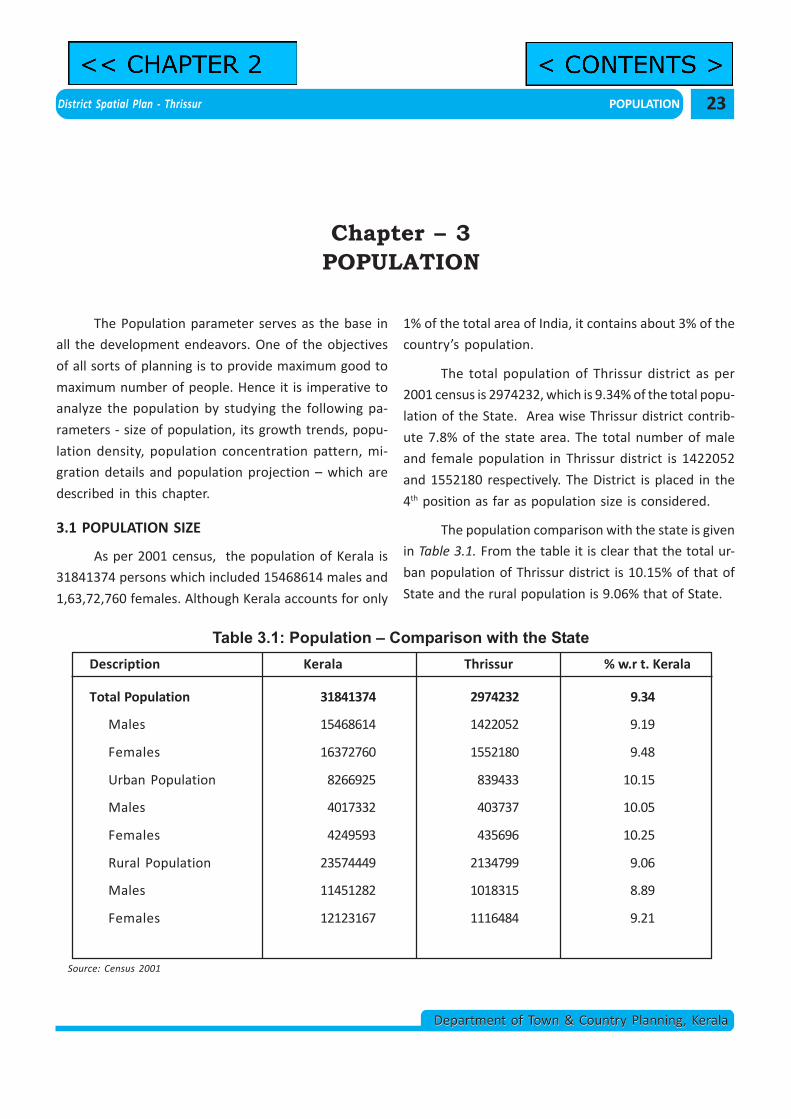
District Spatial Plan - Thrissur POPULATION
Department of Town & Country Planning, KeralaDepartment of Town & Country Planning, Kerala
The Population parameter serves as the base in
all the development endeavors. One of the objectives
of all sorts of planning is to provide maximum good to
maximum number of people. Hence it is imperative to
analyze the population by studying the following pa-
rameters - size of population, its growth trends, popu-
lation density, population concentration pattern, mi-
gration details and population projection – which are
described in this chapter.
3.1 POPULATION SIZE
As per 2001 census, the population of Kerala is
31841374 persons which included 15468614 males and
1,63,72,760 females. Although Kerala accounts for only
Chapter – 3POPULATION
Table 3.1: Population – Comparison with the StateDescription Kerala Thrissur % w.r t. Kerala
Total Population 31841374 2974232 9.34
Males 15468614 1422052 9.19
Females 16372760 1552180 9.48
Urban Population 8266925 839433 10.15
Males 4017332 403737 10.05
Females 4249593 435696 10.25
Rural Population 23574449 2134799 9.06
Males 11451282 1018315 8.89
Females 12123167 1116484 9.21
Source: Census 2001
1% of the total area of India, it contains about 3% of the
country’s population.
The total population of Thrissur district as per
2001 census is 2974232, which is 9.34% of the total popu-
lation of the State. Area wise Thrissur district contrib-
ute 7.8% of the state area. The total number of male
and female population in Thrissur district is 1422052
and 1552180 respectively. The District is placed in the
4th position as far as population size is considered.
The population comparison with the state is given
in Table 3.1. From the table it is clear that the total ur-
ban population of Thrissur district is 10.15% of that of
State and the rural population is 9.06% that of State.
23
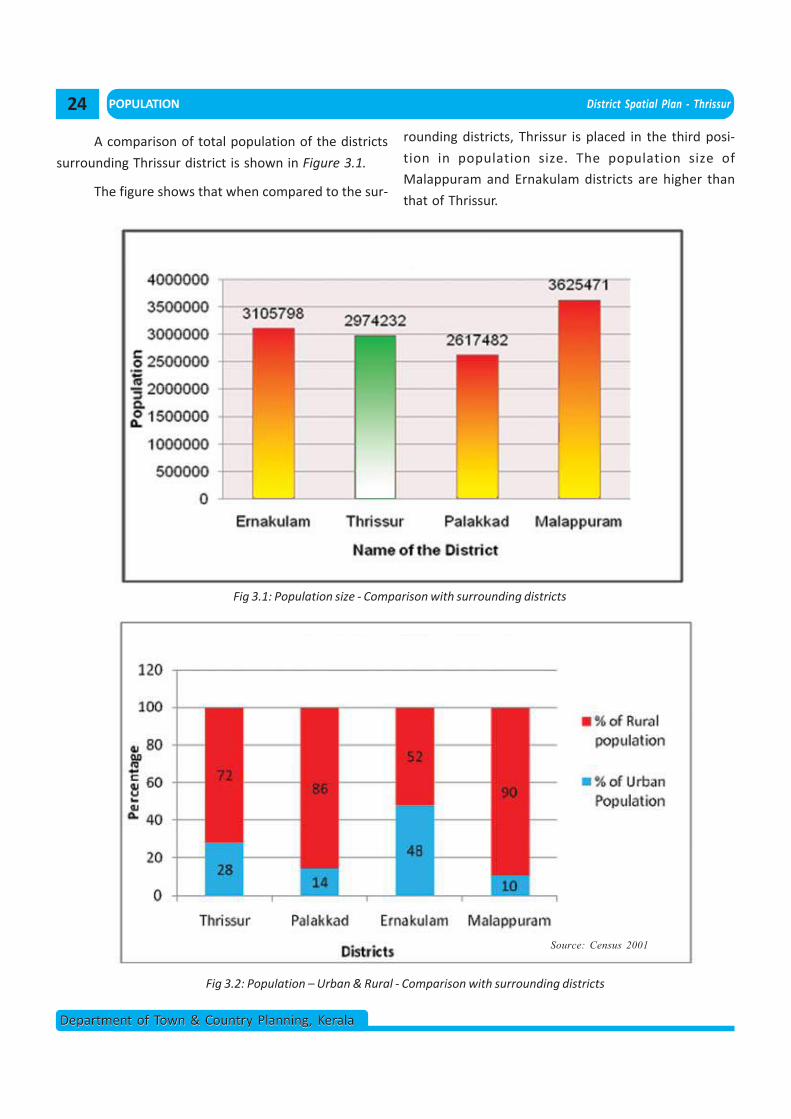
POPULATION District Spatial Plan - Thrissur
Department of Town & Country Planning, KeralaDepartment of Town & Country Planning, Kerala
A comparison of total population of the districts
surrounding Thrissur district is shown in Figure 3.1.
The figure shows that when compared to the sur-
Fig 3.1: Population size - Comparison with surrounding districts
Fig 3.2: Population – Urban & Rural - Comparison with surrounding districts
Source: Census 2001
rounding districts, Thrissur is placed in the third posi-
tion in population size. The population size of
Malappuram and Ernakulam districts are higher than
that of Thrissur.
24
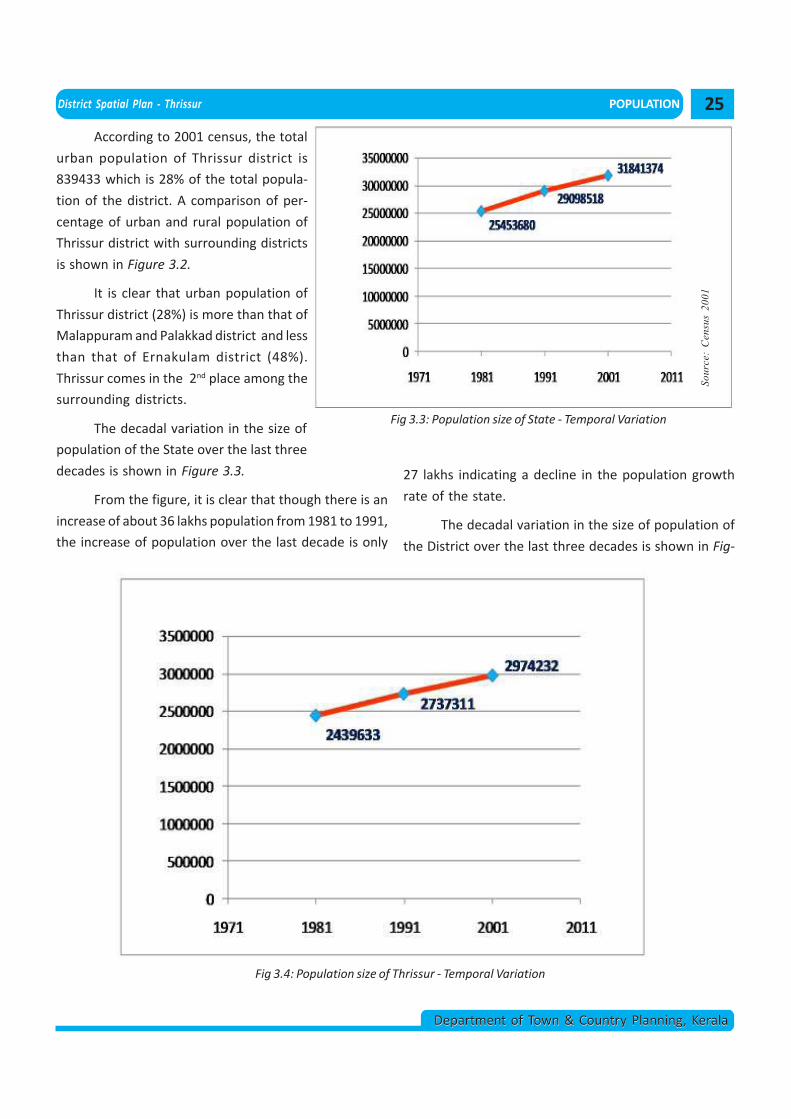
District Spatial Plan - Thrissur POPULATION
Department of Town & Country Planning, KeralaDepartment of Town & Country Planning, Kerala
Fig 3.3: Population size of State - Temporal Variation
27 lakhs indicating a decline in the population growth
rate of the state.
The decadal variation in the size of population of
the District over the last three decades is shown in Fig-
Fig 3.4: Population size of Thrissur - Temporal Variation
25
According to 2001 census, the total
urban population of Thrissur district is
839433 which is 28% of the total popula-
tion of the district. A comparison of per-
centage of urban and rural population of
Thrissur district with surrounding districts
is shown in Figure 3.2.
It is clear that urban population of
Thrissur district (28%) is more than that of
Malappuram and Palakkad district and less
than that of Ernakulam district (48%).
Thrissur comes in the 2nd place among the
surrounding districts.
The decadal variation in the size of
population of the State over the last three
decades is shown in Figure 3.3.
From the figure, it is clear that though there is an
increase of about 36 lakhs population from 1981 to 1991,
the increase of population over the last decade is only
Sour
ce:
Cen
sus
2001
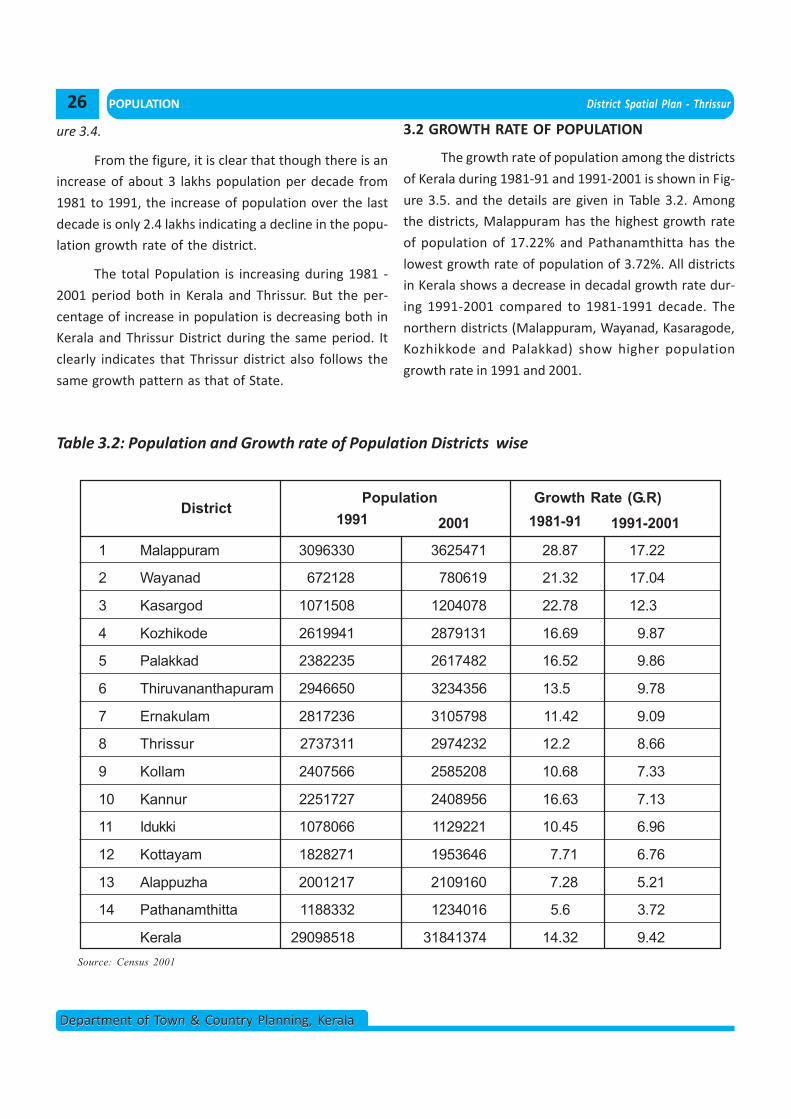
POPULATION District Spatial Plan - Thrissur
Department of Town & Country Planning, KeralaDepartment of Town & Country Planning, Kerala
ure 3.4.
From the figure, it is clear that though there is an
increase of about 3 lakhs population per decade from
1981 to 1991, the increase of population over the last
decade is only 2.4 lakhs indicating a decline in the popu-
lation growth rate of the district.
The total Population is increasing during 1981 -
2001 period both in Kerala and Thrissur. But the per-
centage of increase in population is decreasing both in
Kerala and Thrissur District during the same period. It
clearly indicates that Thrissur district also follows the
same growth pattern as that of State.
1 Malappuram 3096330 3625471 28.87 17.22
2 Wayanad 672128 780619 21.32 17.04
3 Kasargod 1071508 1204078 22.78 12.3
4 Kozhikode 2619941 2879131 16.69 9.87
5 Palakkad 2382235 2617482 16.52 9.86
6 Thiruvananthapuram 2946650 3234356 13.5 9.78
7 Ernakulam 2817236 3105798 11.42 9.09
8 Thrissur 2737311 2974232 12.2 8.66
9 Kollam 2407566 2585208 10.68 7.33
10 Kannur 2251727 2408956 16.63 7.13
11 Idukki 1078066 1129221 10.45 6.96
12 Kottayam 1828271 1953646 7.71 6.76
13 Alappuzha 2001217 2109160 7.28 5.21
14 Pathanamthitta 1188332 1234016 5.6 3.72
Kerala 29098518 31841374 14.32 9.42
No DistrictPopulation
1991 2001
Growth Rate (G.R)1981-91 1991-2001
Table 3.2: Population and Growth rate of Population Districts wise
Source: Census 2001
3.2 GROWTH RATE OF POPULATION
The growth rate of population among the districts
of Kerala during 1981-91 and 1991-2001 is shown in Fig-
ure 3.5. and the details are given in Table 3.2. Among
the districts, Malappuram has the highest growth rate
of population of 17.22% and Pathanamthitta has the
lowest growth rate of population of 3.72%. All districts
in Kerala shows a decrease in decadal growth rate dur-
ing 1991-2001 compared to 1981-1991 decade. The
northern districts (Malappuram, Wayanad, Kasaragode,
Kozhikkode and Palakkad) show higher population
growth rate in 1991 and 2001.
26
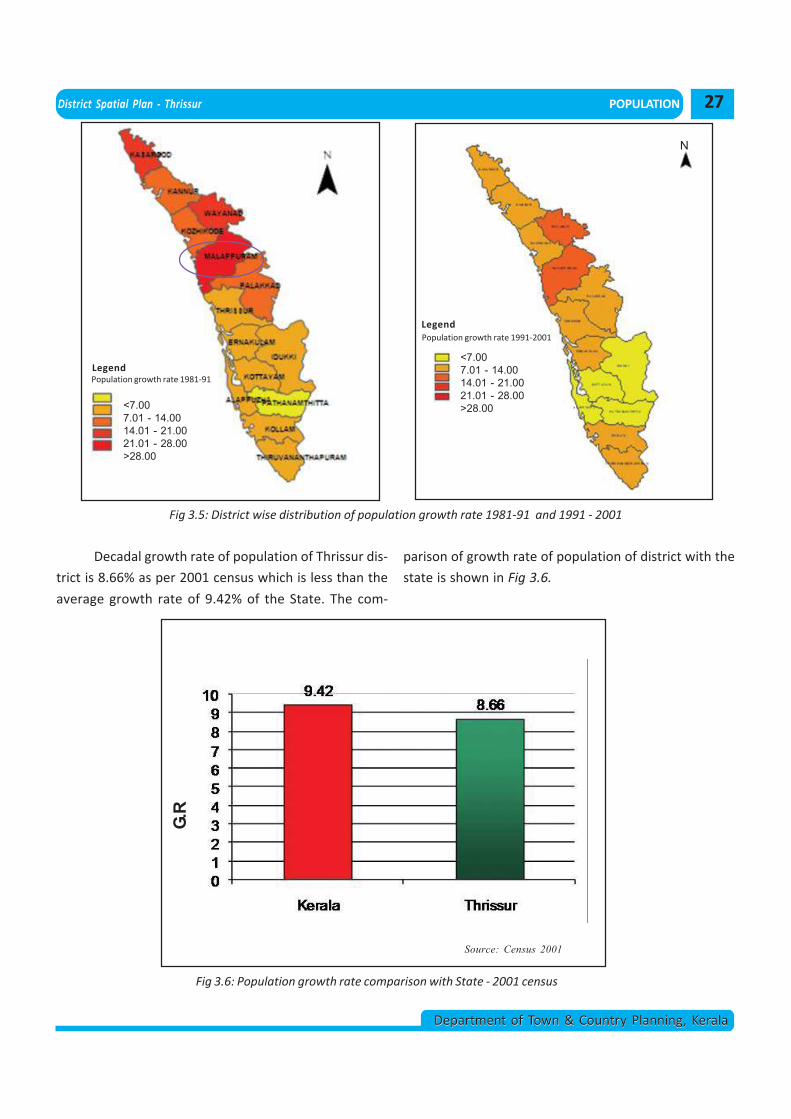
District Spatial Plan - Thrissur POPULATION
Department of Town & Country Planning, KeralaDepartment of Town & Country Planning, Kerala
Fig 3.5: District wise distribution of population growth rate 1981-91 and 1991 - 2001
<7.007.01 - 14.0014.01 - 21.0021.01 - 28.00>28.00
Legend<7.007.01 - 14.0014.01 - 21.0021.01 - 28.00>28.00
Legend
N
Fig 3.6: Population growth rate comparison with State - 2001 census
Decadal growth rate of population of Thrissur dis-
trict is 8.66% as per 2001 census which is less than the
average growth rate of 9.42% of the State. The com-
G.R. 2001 - Comparison with State
G.R
Source: Census 2001
parison of growth rate of population of district with the
state is shown in Fig 3.6.
27
Population growth rate 1981-91Legend
Population growth rate 1991-2001Legend
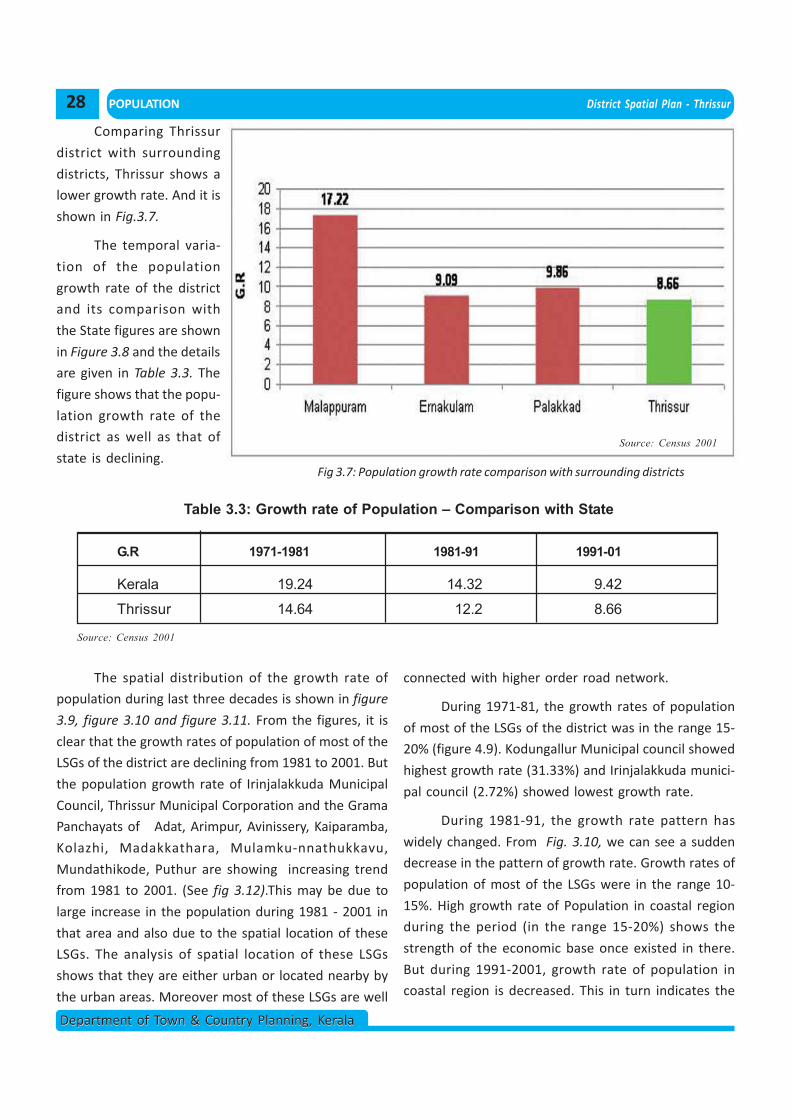
POPULATION District Spatial Plan - Thrissur
Department of Town & Country Planning, KeralaDepartment of Town & Country Planning, Kerala
Table 3.3: Growth rate of Population – Comparison with State
G.R 1971-1981 1981-91 1991-01
Kerala 19.24 14.32 9.42
Thrissur 14.64 12.2 8.66
Source: Census 2001
Fig 3.7: Population growth rate comparison with surrounding districts
Growth Rate of Population - 2001 Census
Source: Census 2001
The spatial distribution of the growth rate of
population during last three decades is shown in figure
3.9, figure 3.10 and figure 3.11. From the figures, it is
clear that the growth rates of population of most of the
LSGs of the district are declining from 1981 to 2001. But
the population growth rate of Irinjalakkuda Municipal
Council, Thrissur Municipal Corporation and the Grama
Panchayats of Adat, Arimpur, Avinissery, Kaiparamba,
Kolazhi, Madakkathara, Mulamku-nnathukkavu,
Mundathikode, Puthur are showing increasing trend
from 1981 to 2001. (See fig 3.12).This may be due to
large increase in the population during 1981 - 2001 in
that area and also due to the spatial location of these
LSGs. The analysis of spatial location of these LSGs
shows that they are either urban or located nearby by
the urban areas. Moreover most of these LSGs are well
connected with higher order road network.
During 1971-81, the growth rates of population
of most of the LSGs of the district was in the range 15-
20% (figure 4.9). Kodungallur Municipal council showed
highest growth rate (31.33%) and Irinjalakkuda munici-
pal council (2.72%) showed lowest growth rate.
During 1981-91, the growth rate pattern has
widely changed. From Fig. 3.10, we can see a sudden
decrease in the pattern of growth rate. Growth rates of
population of most of the LSGs were in the range 10-
15%. High growth rate of Population in coastal region
during the period (in the range 15-20%) shows the
strength of the economic base once existed in there.
But during 1991-2001, growth rate of population in
coastal region is decreased. This in turn indicates the
Comparing Thrissur
district with surrounding
districts, Thrissur shows a
lower growth rate. And it is
shown in Fig.3.7.
The temporal varia-
tion of the population
growth rate of the district
and its comparison with
the State figures are shown
in Figure 3.8 and the details
are given in Table 3.3. The
figure shows that the popu-
lation growth rate of the
district as well as that of
state is declining.
28
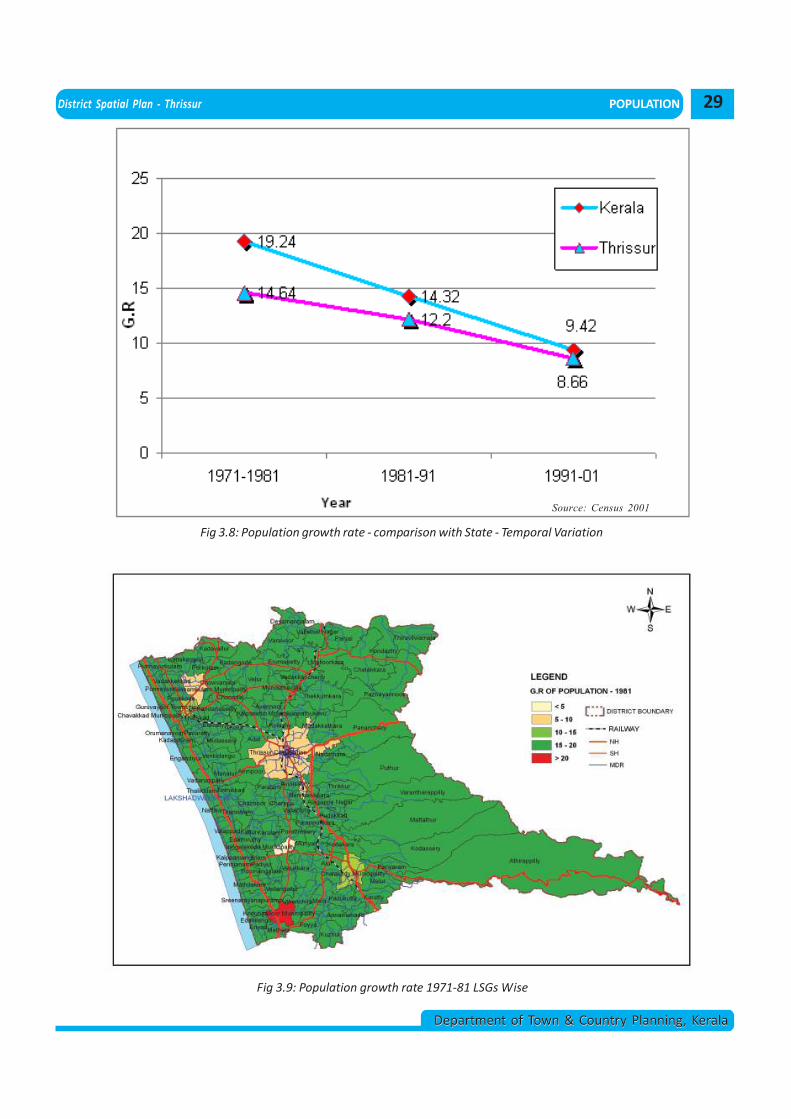
District Spatial Plan - Thrissur POPULATION
Department of Town & Country Planning, KeralaDepartment of Town & Country Planning, Kerala
Fig 3.8: Population growth rate - comparison with State - Temporal Variation
Source: Census 2001
Fig 3.9: Population growth rate 1971-81 LSGs Wise
29
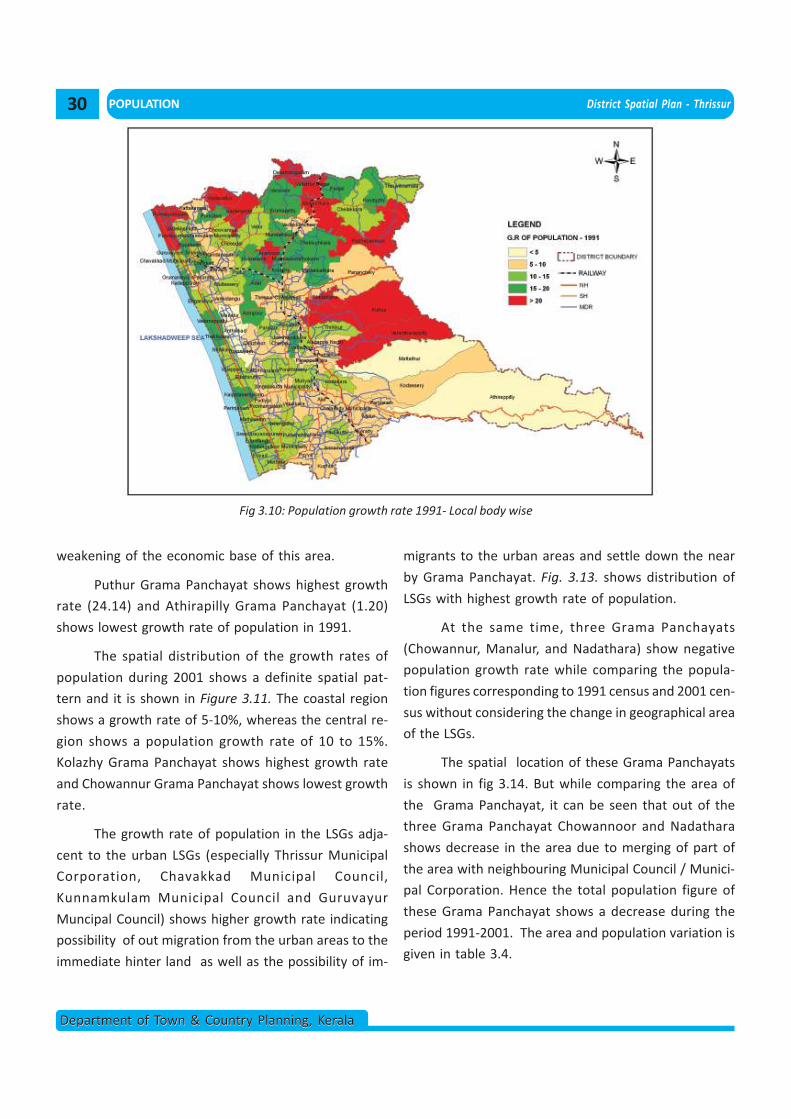
POPULATION District Spatial Plan - Thrissur
Department of Town & Country Planning, KeralaDepartment of Town & Country Planning, Kerala
Fig 3.10: Population growth rate 1991- Local body wise
weakening of the economic base of this area.
Puthur Grama Panchayat shows highest growth
rate (24.14) and Athirapilly Grama Panchayat (1.20)
shows lowest growth rate of population in 1991.
The spatial distribution of the growth rates of
population during 2001 shows a definite spatial pat-
tern and it is shown in Figure 3.11. The coastal region
shows a growth rate of 5-10%, whereas the central re-
gion shows a population growth rate of 10 to 15%.
Kolazhy Grama Panchayat shows highest growth rate
and Chowannur Grama Panchayat shows lowest growth
rate.
The growth rate of population in the LSGs adja-
cent to the urban LSGs (especially Thrissur Municipal
Corporation, Chavakkad Municipal Council,
Kunnamkulam Municipal Council and Guruvayur
Muncipal Council) shows higher growth rate indicating
possibility of out migration from the urban areas to the
immediate hinter land as well as the possibility of im-
migrants to the urban areas and settle down the near
by Grama Panchayat. Fig. 3.13. shows distribution of
LSGs with highest growth rate of population.
At the same time, three Grama Panchayats
(Chowannur, Manalur, and Nadathara) show negative
population growth rate while comparing the popula-
tion figures corresponding to 1991 census and 2001 cen-
sus without considering the change in geographical area
of the LSGs.
The spatial location of these Grama Panchayats
is shown in fig 3.14. But while comparing the area of
the Grama Panchayat, it can be seen that out of the
three Grama Panchayat Chowannoor and Nadathara
shows decrease in the area due to merging of part of
the area with neighbouring Municipal Council / Munici-
pal Corporation. Hence the total population figure of
these Grama Panchayat shows a decrease during the
period 1991-2001. The area and population variation is
given in table 3.4.
30
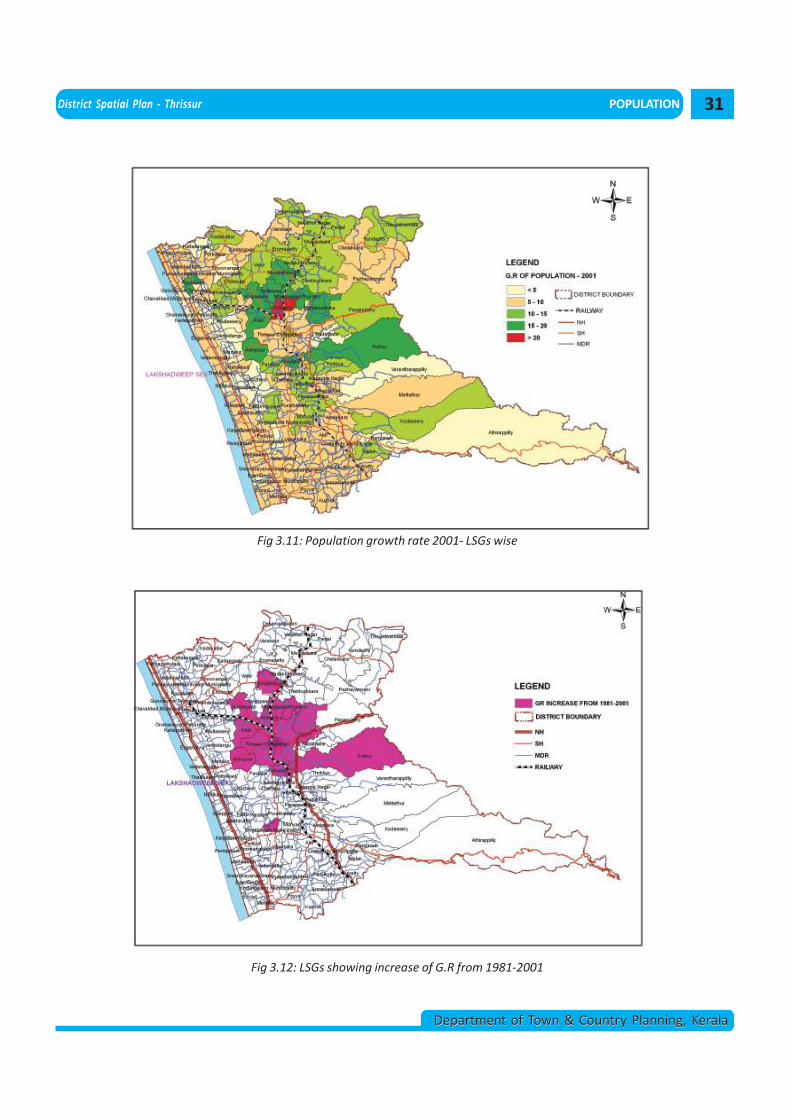
District Spatial Plan - Thrissur POPULATION
Department of Town & Country Planning, KeralaDepartment of Town & Country Planning, Kerala
Fig 3.11: Population growth rate 2001- LSGs wise
Fig 3.12: LSGs showing increase of G.R from 1981-2001
31
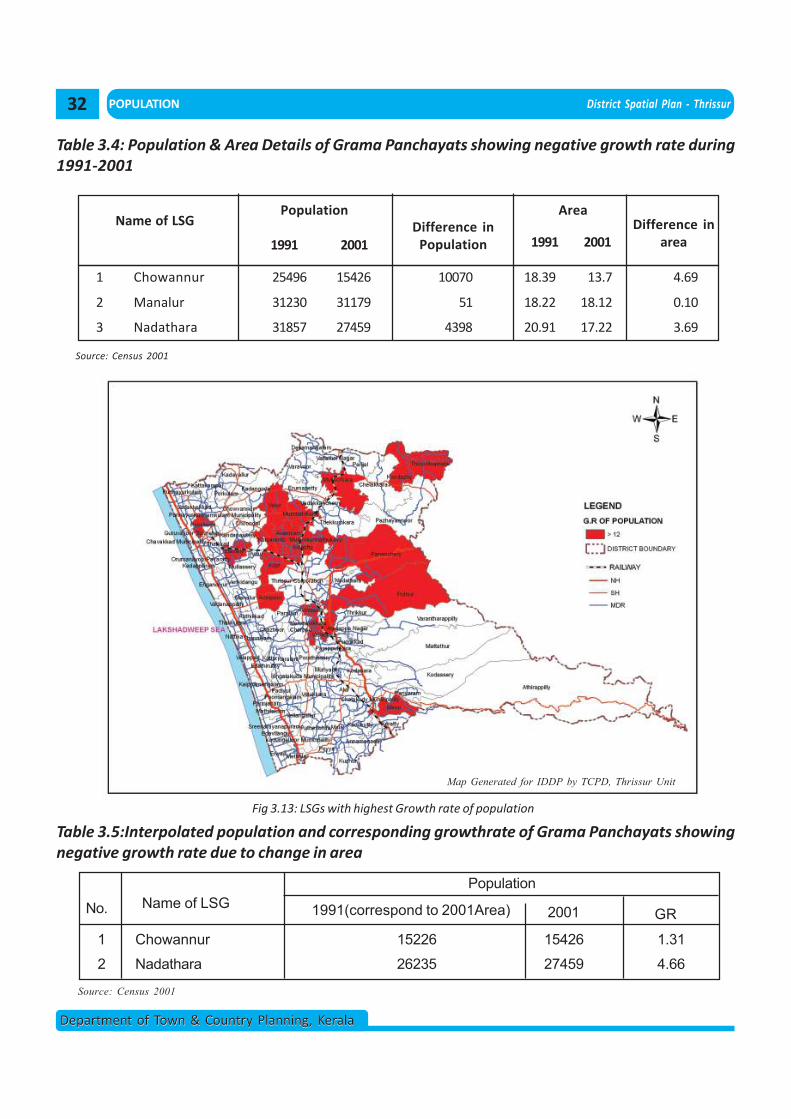
POPULATION District Spatial Plan - Thrissur
Department of Town & Country Planning, KeralaDepartment of Town & Country Planning, Kerala
1 Chowannur 25496 15426 10070 18.39 13.7 4.69
2 Manalur 31230 31179 51 18.22 18.12 0.10
3 Nadathara 31857 27459 4398 20.91 17.22 3.69
Population
1991 2001Difference in
Population
Area
1991 2001Difference in
area
Source: Census 2001
Fig 3.13: LSGs with highest Growth rate of population
Map Generated for IDDP by TCPD, Thrissur Unit
1 Chowannur 15226 15426 1.31
2 Nadathara 26235 27459 4.66
No. Name of LSGPopulation
1991(correspond to 2001Area) 2001 GR
Source: Census 2001
Table 3.5:Interpolated population and corresponding growthrate of Grama Panchayats showingnegative growth rate due to change in area
Table 3.4: Population & Area Details of Grama Panchayats showing negative growth rate during1991-2001
32
Name of LSG
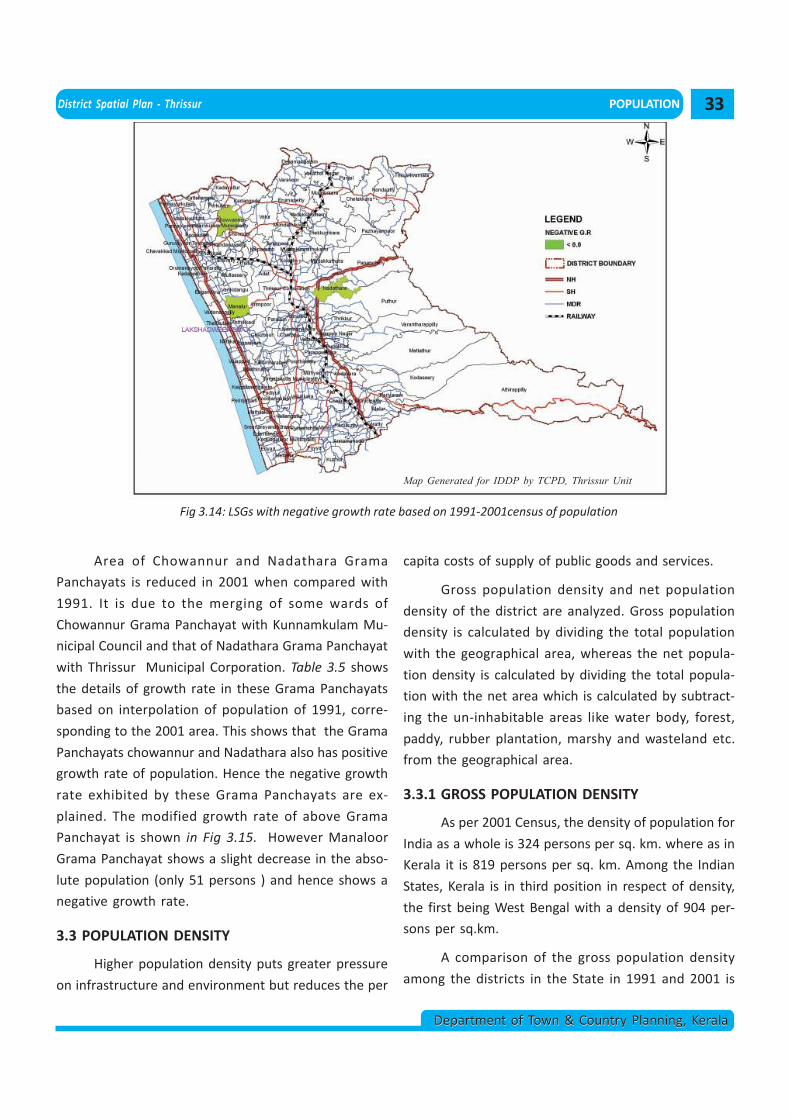
District Spatial Plan - Thrissur POPULATION
Department of Town & Country Planning, KeralaDepartment of Town & Country Planning, Kerala
Fig 3.14: LSGs with negative growth rate based on 1991-2001census of population
Map Generated for IDDP by TCPD, Thrissur Unit
Area of Chowannur and Nadathara Grama
Panchayats is reduced in 2001 when compared with
1991. It is due to the merging of some wards of
Chowannur Grama Panchayat with Kunnamkulam Mu-
nicipal Council and that of Nadathara Grama Panchayat
with Thrissur Municipal Corporation. Table 3.5 shows
the details of growth rate in these Grama Panchayats
based on interpolation of population of 1991, corre-
sponding to the 2001 area. This shows that the Grama
Panchayats chowannur and Nadathara also has positive
growth rate of population. Hence the negative growth
rate exhibited by these Grama Panchayats are ex-
plained. The modified growth rate of above Grama
Panchayat is shown in Fig 3.15. However Manaloor
Grama Panchayat shows a slight decrease in the abso-
lute population (only 51 persons ) and hence shows a
negative growth rate.
3.3 POPULATION DENSITY
Higher population density puts greater pressure
on infrastructure and environment but reduces the per
capita costs of supply of public goods and services.
Gross population density and net population
density of the district are analyzed. Gross population
density is calculated by dividing the total population
with the geographical area, whereas the net popula-
tion density is calculated by dividing the total popula-
tion with the net area which is calculated by subtract-
ing the un-inhabitable areas like water body, forest,
paddy, rubber plantation, marshy and wasteland etc.
from the geographical area.
3.3.1 GROSS POPULATION DENSITY
As per 2001 Census, the density of population for
India as a whole is 324 persons per sq. km. where as in
Kerala it is 819 persons per sq. km. Among the Indian
States, Kerala is in third position in respect of density,
the first being West Bengal with a density of 904 per-
sons per sq.km.
A comparison of the gross population density
among the districts in the State in 1991 and 2001 is
33
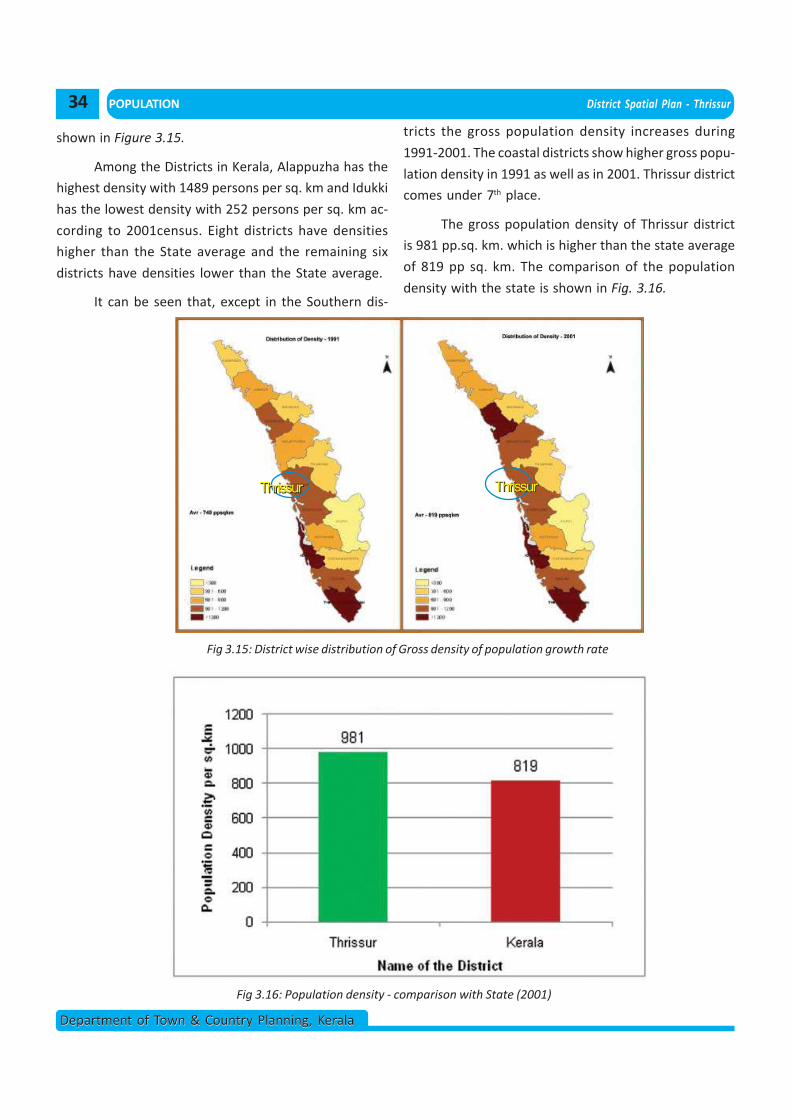
POPULATION District Spatial Plan - Thrissur
Department of Town & Country Planning, KeralaDepartment of Town & Country Planning, Kerala
Fig 3.15: District wise distribution of Gross density of population growth rate
ThrissurThrissurThrissurThrissur
Fig 3.16: Population density - comparison with State (2001)
shown in Figure 3.15.
Among the Districts in Kerala, Alappuzha has the
highest density with 1489 persons per sq. km and Idukki
has the lowest density with 252 persons per sq. km ac-
cording to 2001census. Eight districts have densities
higher than the State average and the remaining six
districts have densities lower than the State average.
It can be seen that, except in the Southern dis-
tricts the gross population density increases during
1991-2001. The coastal districts show higher gross popu-
lation density in 1991 as well as in 2001. Thrissur district
comes under 7th place.
The gross population density of Thrissur district
is 981 pp.sq. km. which is higher than the state average
of 819 pp sq. km. The comparison of the population
density with the state is shown in Fig. 3.16.
34
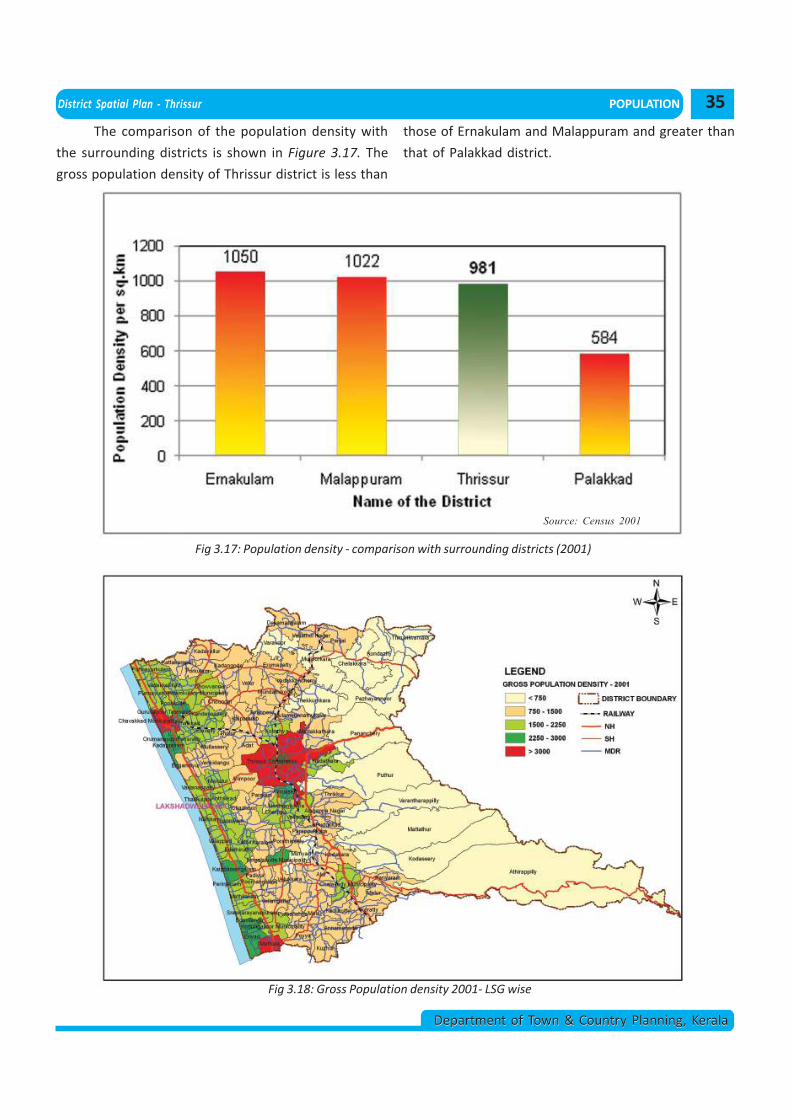
District Spatial Plan - Thrissur POPULATION
Department of Town & Country Planning, KeralaDepartment of Town & Country Planning, Kerala
The comparison of the population density with
the surrounding districts is shown in Figure 3.17. The
gross population density of Thrissur district is less than
Fig 3.17: Population density - comparison with surrounding districts (2001)
Source: Census 2001
those of Ernakulam and Malappuram and greater than
that of Palakkad district.
Fig 3.18: Gross Population density 2001- LSG wise
35
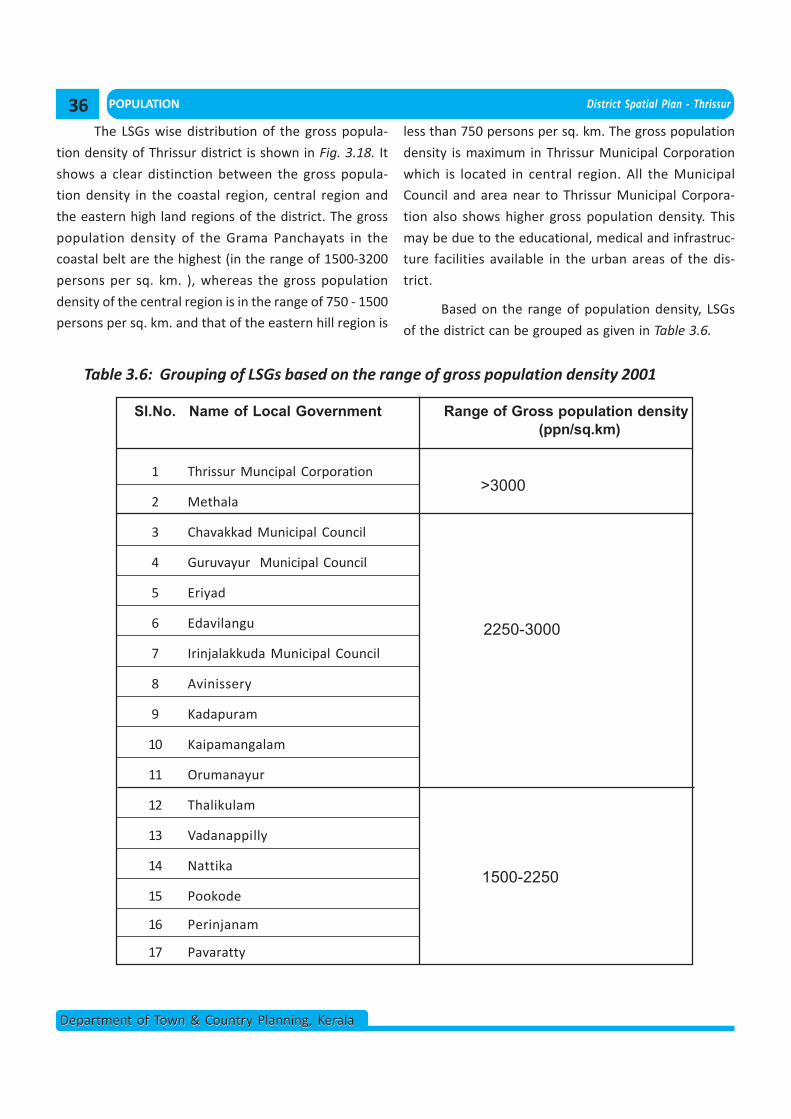
POPULATION District Spatial Plan - Thrissur
Department of Town & Country Planning, KeralaDepartment of Town & Country Planning, Kerala
The LSGs wise distribution of the gross popula-
tion density of Thrissur district is shown in Fig. 3.18. It
shows a clear distinction between the gross popula-
tion density in the coastal region, central region and
the eastern high land regions of the district. The gross
population density of the Grama Panchayats in the
coastal belt are the highest (in the range of 1500-3200
persons per sq. km. ), whereas the gross population
density of the central region is in the range of 750 - 1500
persons per sq. km. and that of the eastern hill region is
less than 750 persons per sq. km. The gross population
density is maximum in Thrissur Municipal Corporation
which is located in central region. All the Municipal
Council and area near to Thrissur Municipal Corpora-
tion also shows higher gross population density. This
may be due to the educational, medical and infrastruc-
ture facilities available in the urban areas of the dis-
trict.
Based on the range of population density, LSGs
of the district can be grouped as given in Table 3.6.
Table 3.6: Grouping of LSGs based on the range of gross population density 2001
1 Thrissur Muncipal Corporation
2 Methala
3 Chavakkad Municipal Council
4 Guruvayur Municipal Council
5 Eriyad
6 Edavilangu
7 Irinjalakkuda Municipal Council
8 Avinissery
9 Kadapuram
10 Kaipamangalam
11 Orumanayur
12 Thalikulam
13 Vadanappilly
14 Nattika
15 Pookode
16 Perinjanam
17 Pavaratty
Sl.No. Name of Local Government Range of Gross population density(ppn/sq.km)
>3000
2250-3000
1500-2250
36
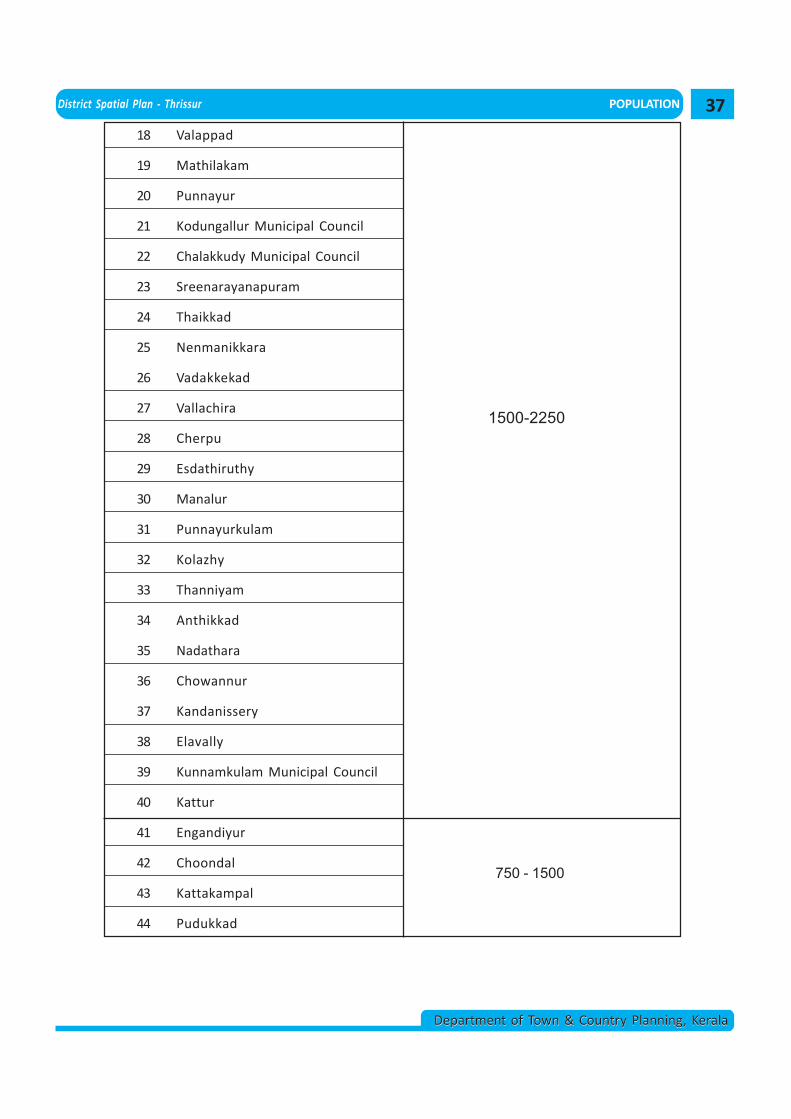
District Spatial Plan - Thrissur POPULATION
Department of Town & Country Planning, KeralaDepartment of Town & Country Planning, Kerala
18 Valappad
19 Mathilakam
20 Punnayur
21 Kodungallur Municipal Council
22 Chalakkudy Municipal Council
23 Sreenarayanapuram
24 Thaikkad
25 Nenmanikkara
26 Vadakkekad
27 Vallachira
28 Cherpu
29 Esdathiruthy
30 Manalur
31 Punnayurkulam
32 Kolazhy
33 Thanniyam
34 Anthikkad
35 Nadathara
36 Chowannur
37 Kandanissery
38 Elavally
39 Kunnamkulam Municipal Council
40 Kattur
41 Engandiyur
42 Choondal
43 Kattakampal
44 Pudukkad
1500-2250
750 - 1500
37
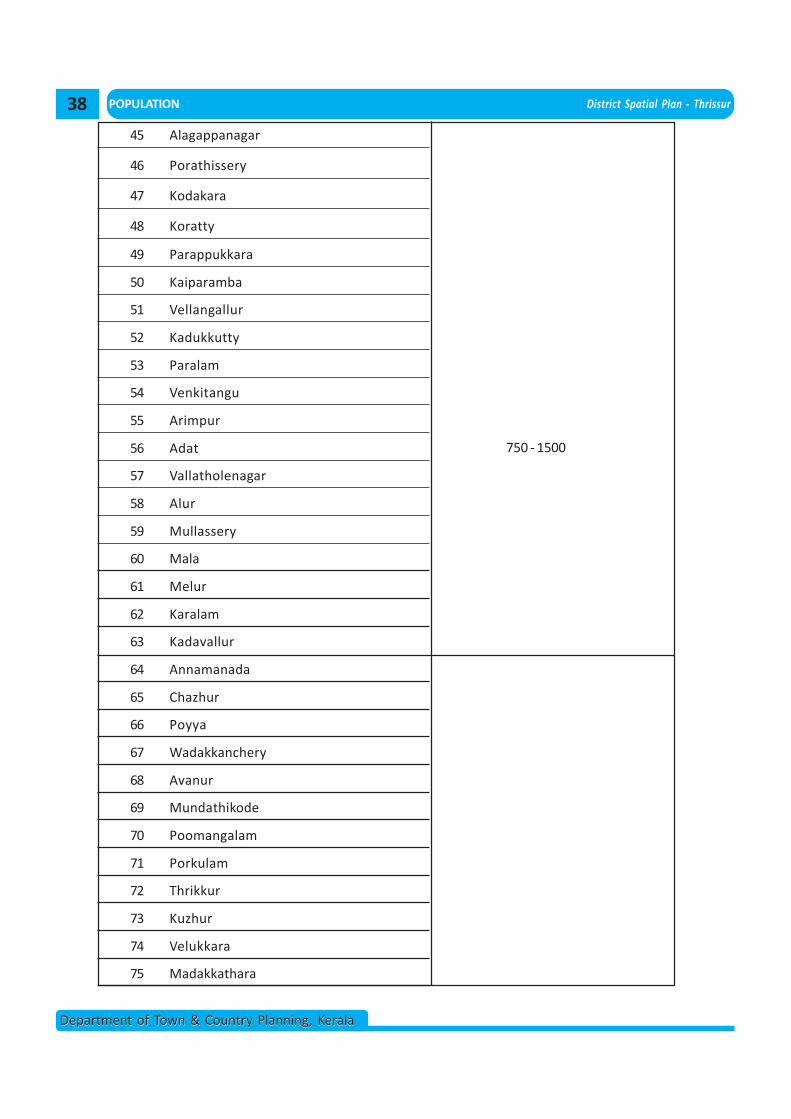
POPULATION District Spatial Plan - Thrissur
Department of Town & Country Planning, KeralaDepartment of Town & Country Planning, Kerala
45 Alagappanagar
46 Porathissery
47 Kodakara
48 Koratty
49 Parappukkara
50 Kaiparamba
51 Vellangallur
52 Kadukkutty
53 Paralam
54 Venkitangu
55 Arimpur
56 Adat
57 Vallatholenagar
58 Alur
59 Mullassery
60 Mala
61 Melur
62 Karalam
63 Kadavallur
64 Annamanada
65 Chazhur
66 Poyya
67 Wadakkanchery
68 Avanur
69 Mundathikode
70 Poomangalam
71 Porkulam
72 Thrikkur
73 Kuzhur
74 Velukkara
75 Madakkathara
750 - 1500
38
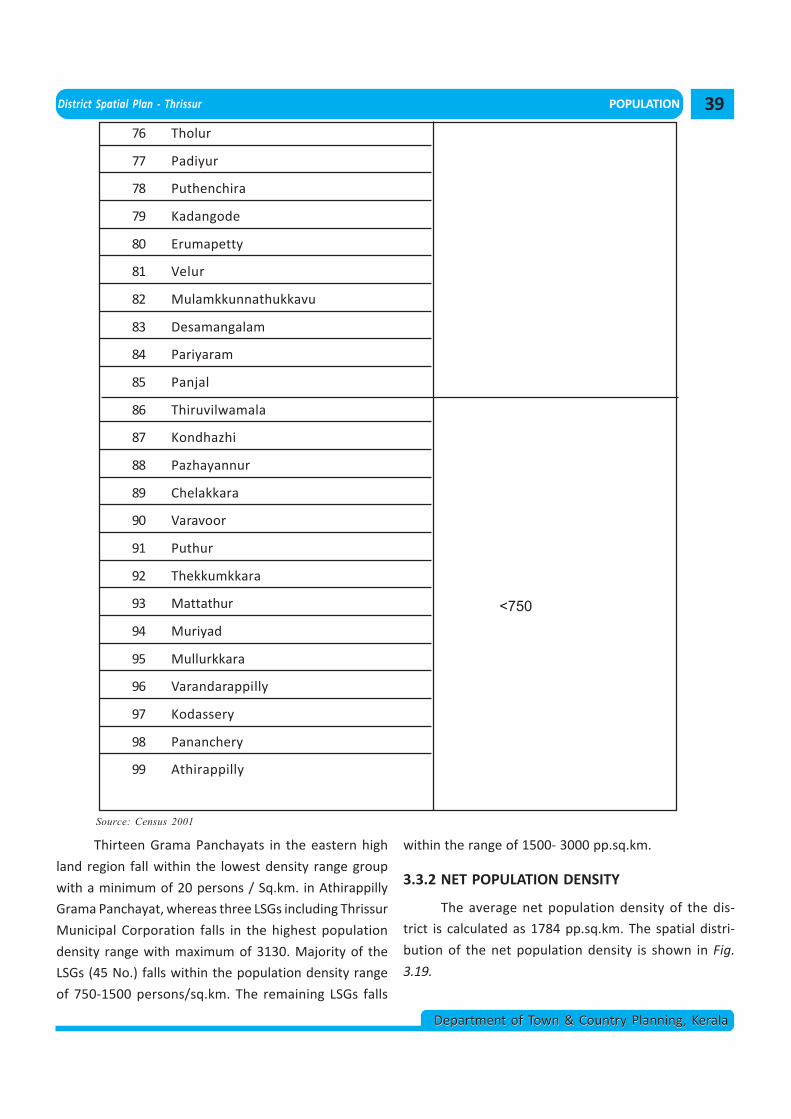
District Spatial Plan - Thrissur POPULATION
Department of Town & Country Planning, KeralaDepartment of Town & Country Planning, Kerala
76 Tholur
77 Padiyur
78 Puthenchira
79 Kadangode
80 Erumapetty
81 Velur
82 Mulamkkunnathukkavu
83 Desamangalam
84 Pariyaram
85 Panjal
86 Thiruvilwamala
87 Kondhazhi
88 Pazhayannur
89 Chelakkara
90 Varavoor
91 Puthur
92 Thekkumkkara
93 Mattathur
94 Muriyad
95 Mullurkkara
96 Varandarappilly
97 Kodassery
98 Pananchery
99 Athirappilly
<750
Source: Census 2001
Thirteen Grama Panchayats in the eastern high
land region fall within the lowest density range group
with a minimum of 20 persons / Sq.km. in Athirappilly
Grama Panchayat, whereas three LSGs including Thrissur
Municipal Corporation falls in the highest population
density range with maximum of 3130. Majority of the
LSGs (45 No.) falls within the population density range
of 750-1500 persons/sq.km. The remaining LSGs falls
within the range of 1500- 3000 pp.sq.km.
3.3.2 NET POPULATION DENSITY
The average net population density of the dis-
trict is calculated as 1784 pp.sq.km. The spatial distri-
bution of the net population density is shown in Fig.
3.19.
39
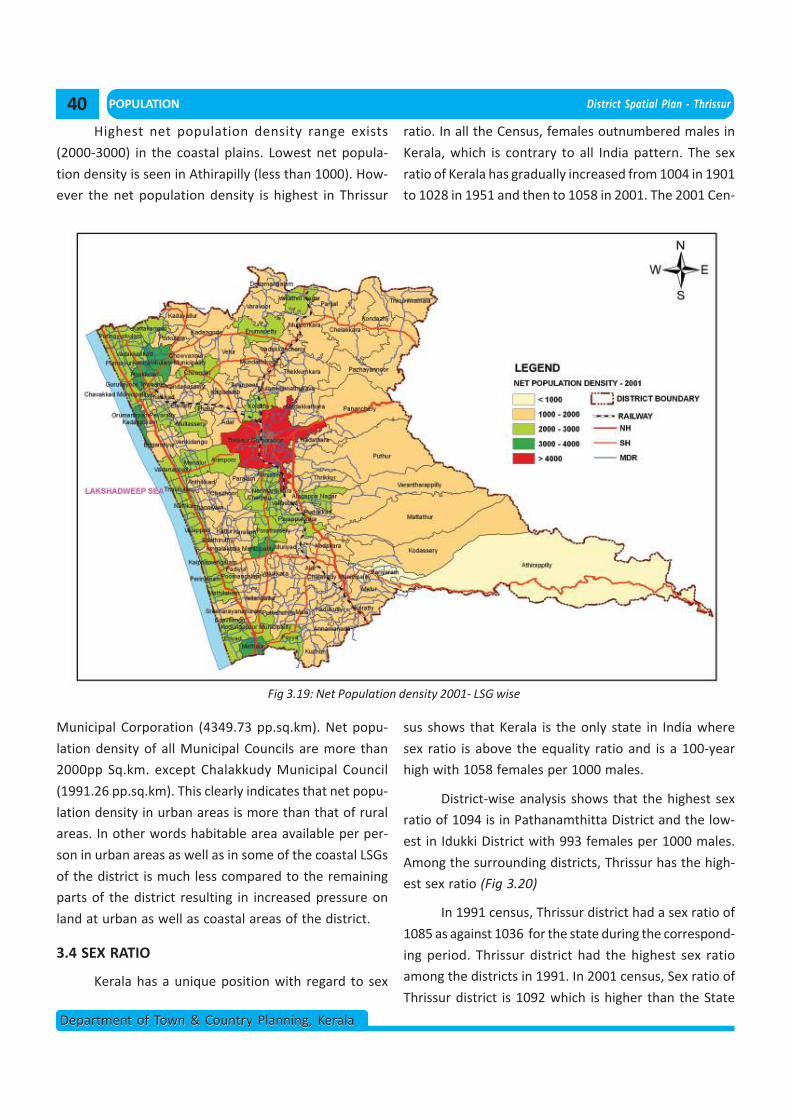
POPULATION District Spatial Plan - Thrissur
Department of Town & Country Planning, KeralaDepartment of Town & Country Planning, Kerala
Highest net population density range exists
(2000-3000) in the coastal plains. Lowest net popula-
tion density is seen in Athirapilly (less than 1000). How-
ever the net population density is highest in Thrissur
Municipal Corporation (4349.73 pp.sq.km). Net popu-
lation density of all Municipal Councils are more than
2000pp Sq.km. except Chalakkudy Municipal Council
(1991.26 pp.sq.km). This clearly indicates that net popu-
lation density in urban areas is more than that of rural
areas. In other words habitable area available per per-
son in urban areas as well as in some of the coastal LSGs
of the district is much less compared to the remaining
parts of the district resulting in increased pressure on
land at urban as well as coastal areas of the district.
3.4 SEX RATIO
Kerala has a unique position with regard to sex
Fig 3.19: Net Population density 2001- LSG wise
ratio. In all the Census, females outnumbered males in
Kerala, which is contrary to all India pattern. The sex
ratio of Kerala has gradually increased from 1004 in 1901
to 1028 in 1951 and then to 1058 in 2001. The 2001 Cen-
sus shows that Kerala is the only state in India where
sex ratio is above the equality ratio and is a 100-year
high with 1058 females per 1000 males.
District-wise analysis shows that the highest sex
ratio of 1094 is in Pathanamthitta District and the low-
est in Idukki District with 993 females per 1000 males.
Among the surrounding districts, Thrissur has the high-
est sex ratio (Fig 3.20)
In 1991 census, Thrissur district had a sex ratio of
1085 as against 1036 for the state during the correspond-
ing period. Thrissur district had the highest sex ratio
among the districts in 1991. In 2001 census, Sex ratio of
Thrissur district is 1092 which is higher than the State
40
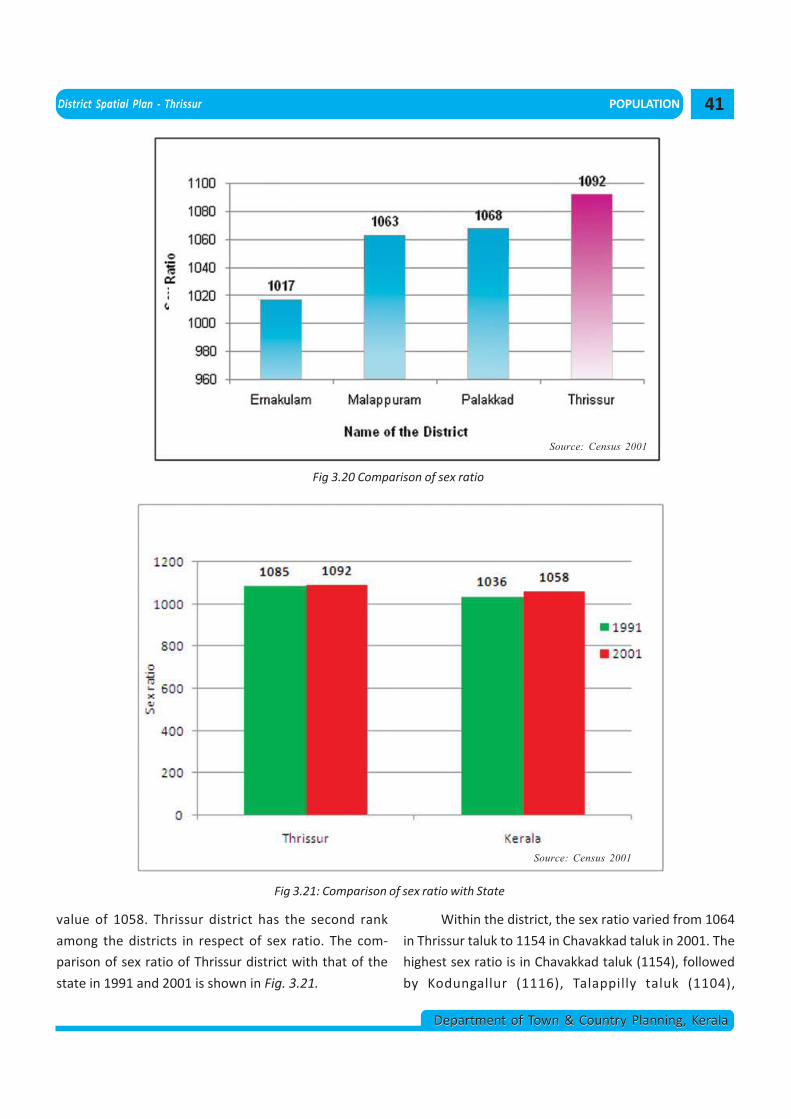
District Spatial Plan - Thrissur POPULATION
Department of Town & Country Planning, KeralaDepartment of Town & Country Planning, Kerala
value of 1058. Thrissur district has the second rank
among the districts in respect of sex ratio. The com-
parison of sex ratio of Thrissur district with that of the
state in 1991 and 2001 is shown in Fig. 3.21.
Fig 3.21: Comparison of sex ratio with State
Source: Census 2001
Fig 3.20 Comparison of sex ratio
Source: Census 2001
Within the district, the sex ratio varied from 1064
in Thrissur taluk to 1154 in Chavakkad taluk in 2001. The
highest sex ratio is in Chavakkad taluk (1154), followed
by Kodungallur (1116), Talappilly taluk (1104),
41
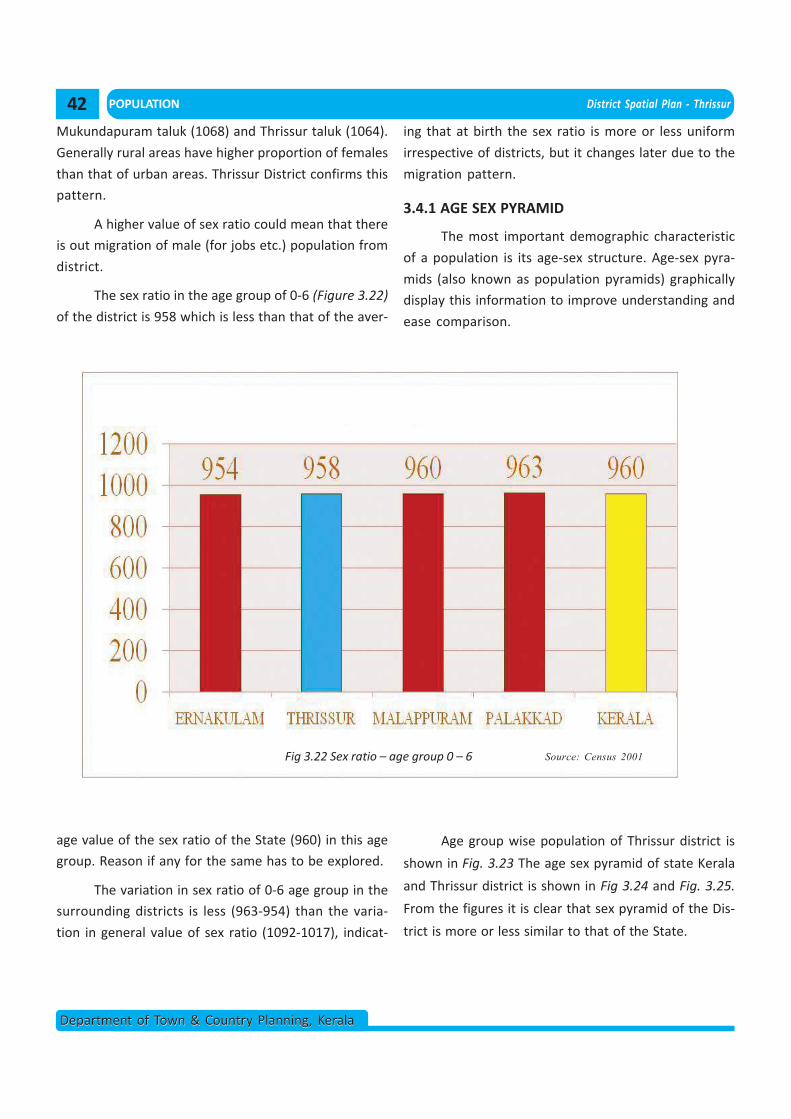
POPULATION District Spatial Plan - Thrissur
Department of Town & Country Planning, KeralaDepartment of Town & Country Planning, Kerala
Mukundapuram taluk (1068) and Thrissur taluk (1064).
Generally rural areas have higher proportion of females
than that of urban areas. Thrissur District confirms this
pattern.
A higher value of sex ratio could mean that there
is out migration of male (for jobs etc.) population from
district.
The sex ratio in the age group of 0-6 (Figure 3.22)
of the district is 958 which is less than that of the aver-
Fig 3.22 Sex ratio – age group 0 – 6 Source: Census 2001
age value of the sex ratio of the State (960) in this age
group. Reason if any for the same has to be explored.
The variation in sex ratio of 0-6 age group in the
surrounding districts is less (963-954) than the varia-
tion in general value of sex ratio (1092-1017), indicat-
ing that at birth the sex ratio is more or less uniform
irrespective of districts, but it changes later due to the
migration pattern.
3.4.1 AGE SEX PYRAMID
The most important demographic characteristic
of a population is its age-sex structure. Age-sex pyra-
mids (also known as population pyramids) graphically
display this information to improve understanding and
ease comparison.
Age group wise population of Thrissur district is
shown in Fig. 3.23 The age sex pyramid of state Kerala
and Thrissur district is shown in Fig 3.24 and Fig. 3.25.
From the figures it is clear that sex pyramid of the Dis-
trict is more or less similar to that of the State.
42
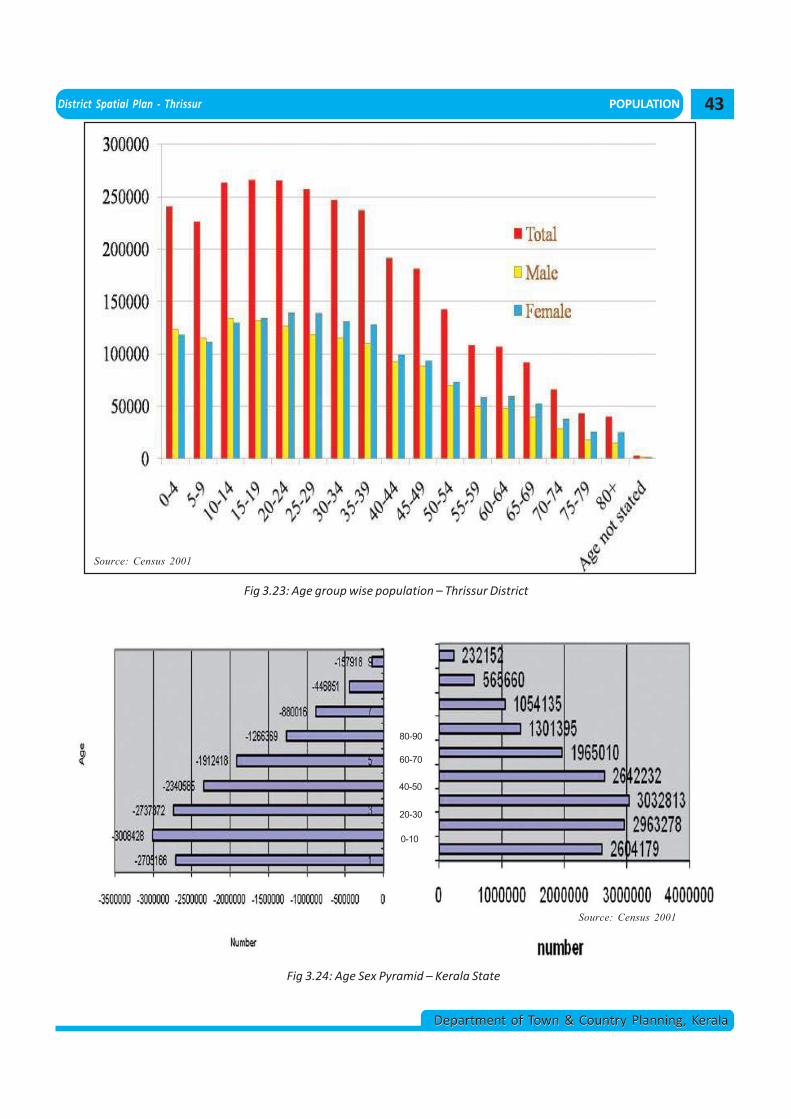
District Spatial Plan - Thrissur POPULATION
Department of Town & Country Planning, KeralaDepartment of Town & Country Planning, Kerala
Fig 3.23: Age group wise population – Thrissur District
Source: Census 2001
Fig 3.24: Age Sex Pyramid – Kerala State
0-10
20-30
40-50
60-70
80-90
Source: Census 2001
43
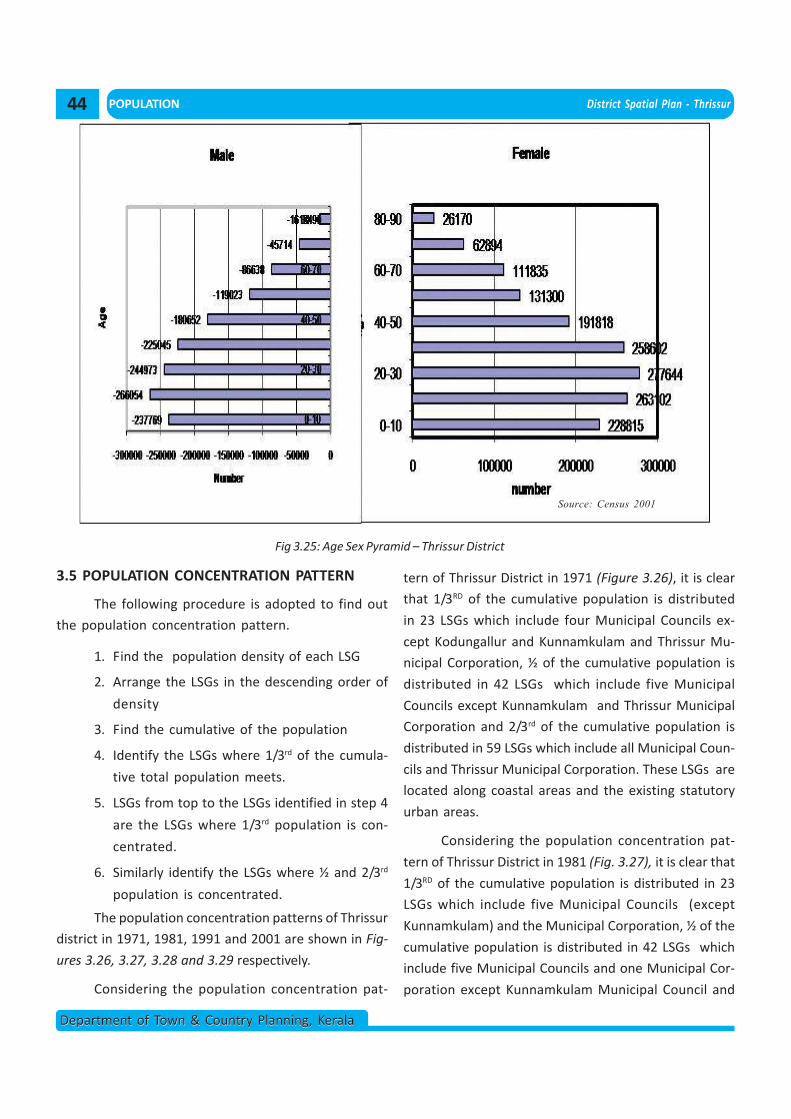
POPULATION District Spatial Plan - Thrissur
Department of Town & Country Planning, KeralaDepartment of Town & Country Planning, Kerala
Fig 3.25: Age Sex Pyramid – Thrissur District
Source: Census 2001
3.5 POPULATION CONCENTRATION PATTERN
The following procedure is adopted to find out
the population concentration pattern.
1. Find the population density of each LSG
2. Arrange the LSGs in the descending order of
density
3. Find the cumulative of the population
4. Identify the LSGs where 1/3rd of the cumula-
tive total population meets.
5. LSGs from top to the LSGs identified in step 4
are the LSGs where 1/3rd population is con-
centrated.
6. Similarly identify the LSGs where ½ and 2/3rd
population is concentrated.
The population concentration patterns of Thrissur
district in 1971, 1981, 1991 and 2001 are shown in Fig-
ures 3.26, 3.27, 3.28 and 3.29 respectively.
Considering the population concentration pat-
tern of Thrissur District in 1971 (Figure 3.26), it is clear
that 1/3RD of the cumulative population is distributed
in 23 LSGs which include four Municipal Councils ex-
cept Kodungallur and Kunnamkulam and Thrissur Mu-
nicipal Corporation, ½ of the cumulative population is
distributed in 42 LSGs which include five Municipal
Councils except Kunnamkulam and Thrissur Municipal
Corporation and 2/3rd of the cumulative population is
distributed in 59 LSGs which include all Municipal Coun-
cils and Thrissur Municipal Corporation. These LSGs are
located along coastal areas and the existing statutory
urban areas.
Considering the population concentration pat-
tern of Thrissur District in 1981 (Fig. 3.27), it is clear that
1/3RD of the cumulative population is distributed in 23
LSGs which include five Municipal Councils (except
Kunnamkulam) and the Municipal Corporation, ½ of the
cumulative population is distributed in 42 LSGs which
include five Municipal Councils and one Municipal Cor-
poration except Kunnamkulam Municipal Council and
44
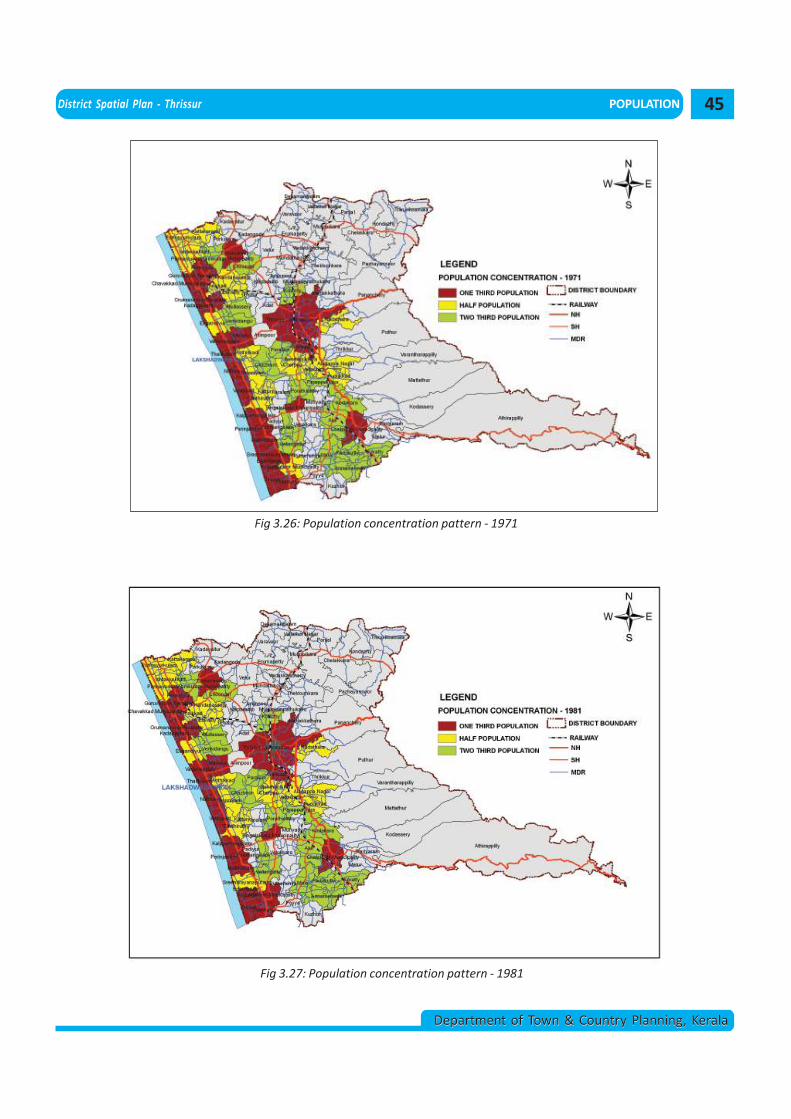
District Spatial Plan - Thrissur POPULATION
Department of Town & Country Planning, KeralaDepartment of Town & Country Planning, Kerala
Fig 3.26: Population concentration pattern - 1971
Fig 3.27: Population concentration pattern - 1981
45
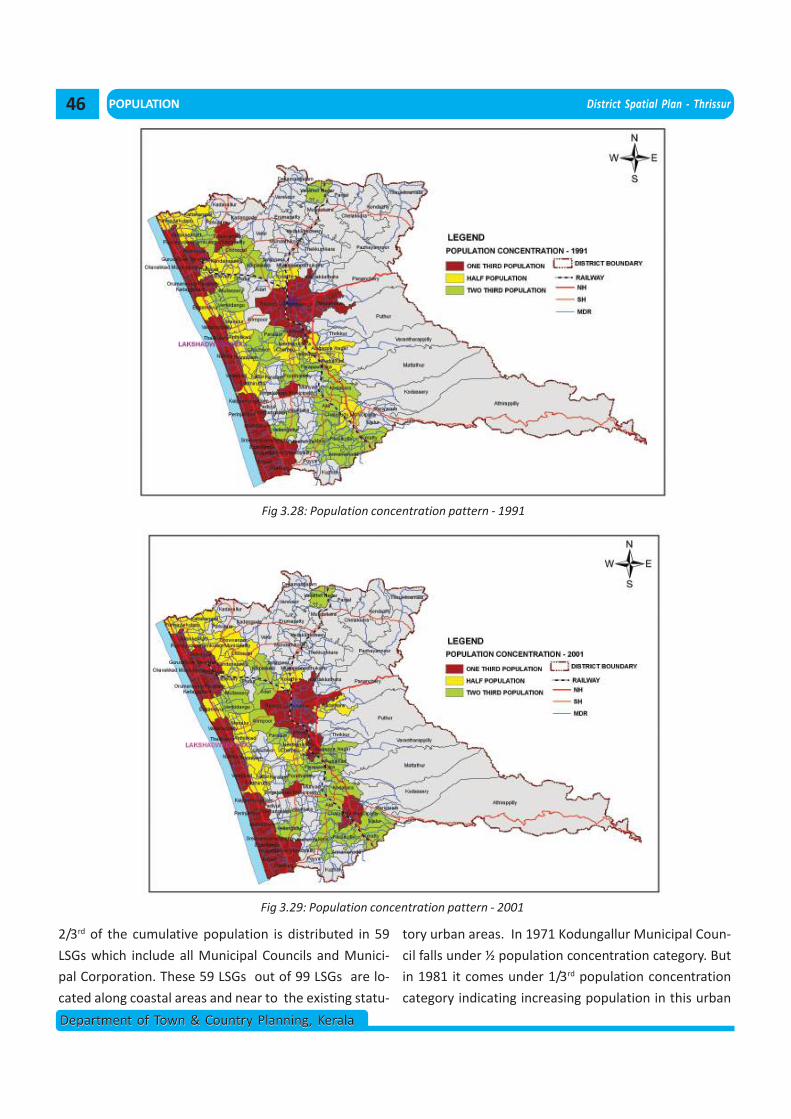
POPULATION District Spatial Plan - Thrissur
Department of Town & Country Planning, KeralaDepartment of Town & Country Planning, Kerala
Fig 3.29: Population concentration pattern - 2001
Fig 3.28: Population concentration pattern - 1991
2/3rd of the cumulative population is distributed in 59
LSGs which include all Municipal Councils and Munici-
pal Corporation. These 59 LSGs out of 99 LSGs are lo-
cated along coastal areas and near to the existing statu-
tory urban areas. In 1971 Kodungallur Municipal Coun-
cil falls under ½ population concentration category. But
in 1981 it comes under 1/3rd population concentration
category indicating increasing population in this urban
46
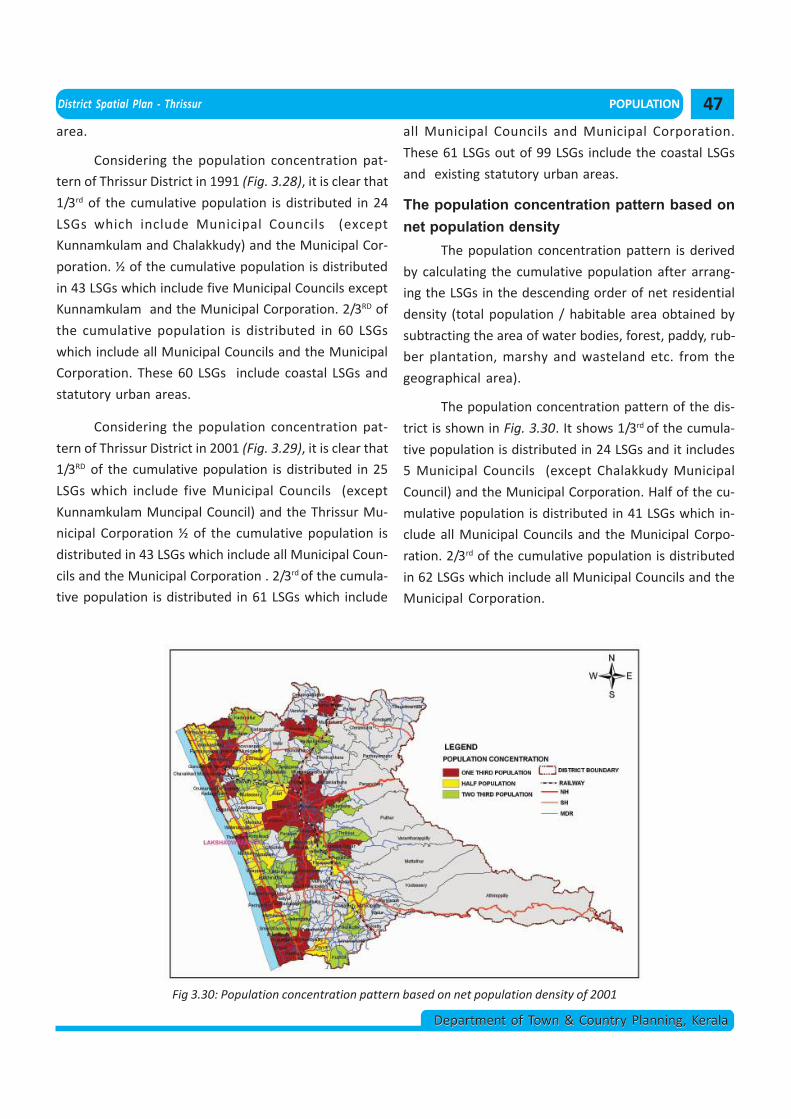
District Spatial Plan - Thrissur POPULATION
Department of Town & Country Planning, KeralaDepartment of Town & Country Planning, Kerala
Fig 3.30: Population concentration pattern based on net population density of 2001
area.
Considering the population concentration pat-
tern of Thrissur District in 1991 (Fig. 3.28), it is clear that
1/3rd of the cumulative population is distributed in 24
LSGs which include Municipal Councils (except
Kunnamkulam and Chalakkudy) and the Municipal Cor-
poration. ½ of the cumulative population is distributed
in 43 LSGs which include five Municipal Councils except
Kunnamkulam and the Municipal Corporation. 2/3RD of
the cumulative population is distributed in 60 LSGs
which include all Municipal Councils and the Municipal
Corporation. These 60 LSGs include coastal LSGs and
statutory urban areas.
Considering the population concentration pat-
tern of Thrissur District in 2001 (Fig. 3.29), it is clear that
1/3RD of the cumulative population is distributed in 25
LSGs which include five Municipal Councils (except
Kunnamkulam Muncipal Council) and the Thrissur Mu-
nicipal Corporation ½ of the cumulative population is
distributed in 43 LSGs which include all Municipal Coun-
cils and the Municipal Corporation . 2/3rd of the cumula-
tive population is distributed in 61 LSGs which include
all Municipal Councils and Municipal Corporation.
These 61 LSGs out of 99 LSGs include the coastal LSGs
and existing statutory urban areas.
The population concentration pattern based onnet population density
The population concentration pattern is derived
by calculating the cumulative population after arrang-
ing the LSGs in the descending order of net residential
density (total population / habitable area obtained by
subtracting the area of water bodies, forest, paddy, rub-
ber plantation, marshy and wasteland etc. from the
geographical area).
The population concentration pattern of the dis-
trict is shown in Fig. 3.30. It shows 1/3rd of the cumula-
tive population is distributed in 24 LSGs and it includes
5 Municipal Councils (except Chalakkudy Municipal
Council) and the Municipal Corporation. Half of the cu-
mulative population is distributed in 41 LSGs which in-
clude all Municipal Councils and the Municipal Corpo-
ration. 2/3rd of the cumulative population is distributed
in 62 LSGs which include all Municipal Councils and the
Municipal Corporation.
47
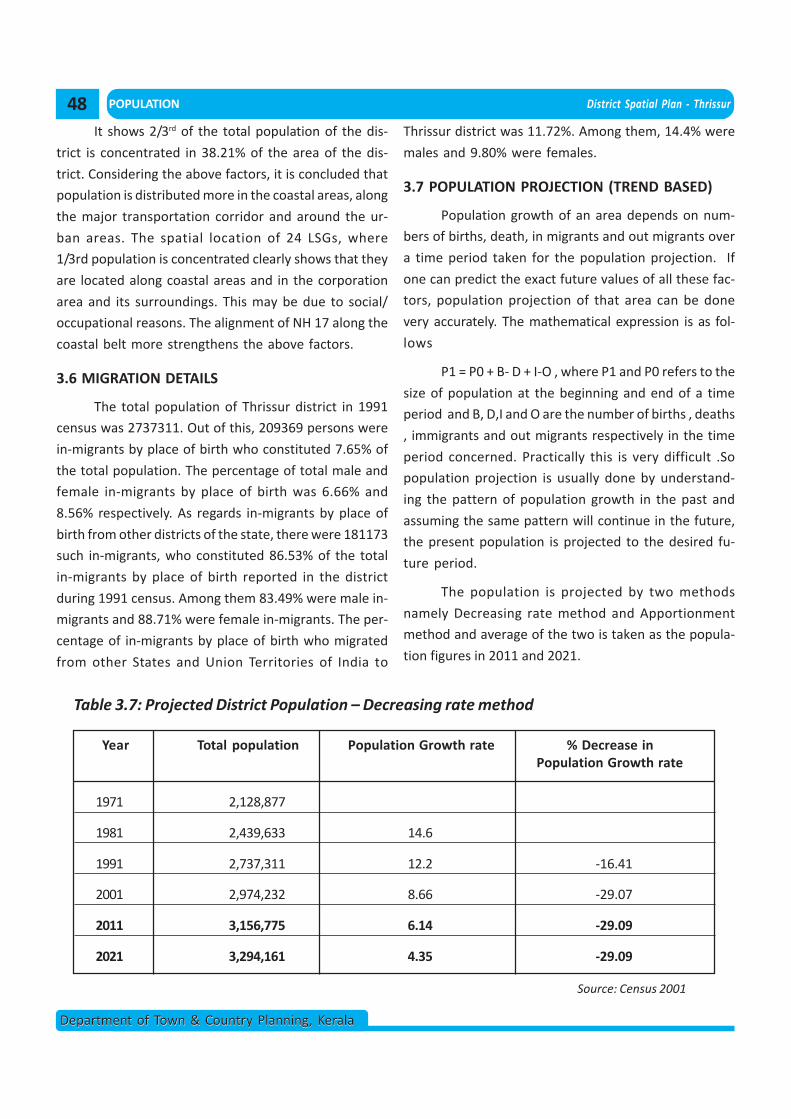
POPULATION District Spatial Plan - Thrissur
Department of Town & Country Planning, KeralaDepartment of Town & Country Planning, Kerala
It shows 2/3rd of the total population of the dis-
trict is concentrated in 38.21% of the area of the dis-
trict. Considering the above factors, it is concluded that
population is distributed more in the coastal areas, along
the major transportation corridor and around the ur-
ban areas. The spatial location of 24 LSGs, where
1/3rd population is concentrated clearly shows that they
are located along coastal areas and in the corporation
area and its surroundings. This may be due to social/
occupational reasons. The alignment of NH 17 along the
coastal belt more strengthens the above factors.
3.6 MIGRATION DETAILS
The total population of Thrissur district in 1991
census was 2737311. Out of this, 209369 persons were
in-migrants by place of birth who constituted 7.65% of
the total population. The percentage of total male and
female in-migrants by place of birth was 6.66% and
8.56% respectively. As regards in-migrants by place of
birth from other districts of the state, there were 181173
such in-migrants, who constituted 86.53% of the total
in-migrants by place of birth reported in the district
during 1991 census. Among them 83.49% were male in-
migrants and 88.71% were female in-migrants. The per-
centage of in-migrants by place of birth who migrated
from other States and Union Territories of India to
Thrissur district was 11.72%. Among them, 14.4% were
males and 9.80% were females.
3.7 POPULATION PROJECTION (TREND BASED)
Population growth of an area depends on num-
bers of births, death, in migrants and out migrants over
a time period taken for the population projection. If
one can predict the exact future values of all these fac-
tors, population projection of that area can be done
very accurately. The mathematical expression is as fol-
lows
P1 = P0 + B- D + I-O , where P1 and P0 refers to the
size of population at the beginning and end of a time
period and B, D,I and O are the number of births , deaths
, immigrants and out migrants respectively in the time
period concerned. Practically this is very difficult .So
population projection is usually done by understand-
ing the pattern of population growth in the past and
assuming the same pattern will continue in the future,
the present population is projected to the desired fu-
ture period.
The population is projected by two methods
namely Decreasing rate method and Apportionment
method and average of the two is taken as the popula-
tion figures in 2011 and 2021.
Table 3.7: Projected District Population – Decreasing rate method
Year Total population Population Growth rate % Decrease inPopulation Growth rate
1971 2,128,877
1981 2,439,633 14.6
1991 2,737,311 12.2 -16.41
2001 2,974,232 8.66 -29.07
2011 3,156,775 6.14 -29.09
2021 3,294,161 4.35 -29.09
Source: Census 2001
48
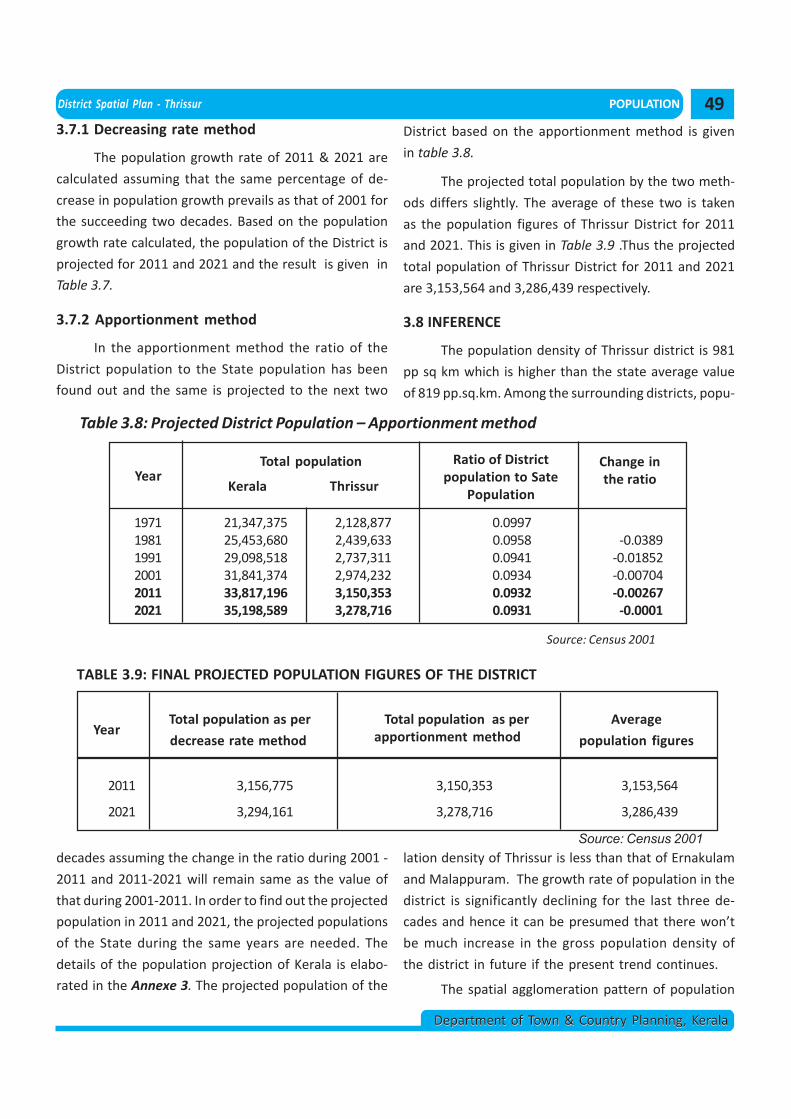
District Spatial Plan - Thrissur POPULATION
Department of Town & Country Planning, KeralaDepartment of Town & Country Planning, Kerala
1971 21,347,375 2,128,877 0.0997 1981 25,453,680 2,439,633 0.0958 -0.03891991 29,098,518 2,737,311 0.0941 -0.018522001 31,841,374 2,974,232 0.0934 -0.007042011 33,817,196 3,150,353 0.0932 -0.002672021 35,198,589 3,278,716 0.0931 -0.0001
YearTotal population
Kerala Thrissur
Ratio of Districtpopulation to Sate
Population
Change inthe ratio
Table 3.8: Projected District Population – Apportionment method
Source: Census 2001
3.7.1 Decreasing rate method
The population growth rate of 2011 & 2021 are
calculated assuming that the same percentage of de-
crease in population growth prevails as that of 2001 for
the succeeding two decades. Based on the population
growth rate calculated, the population of the District is
projected for 2011 and 2021 and the result is given in
Table 3.7.
3.7.2 Apportionment method
In the apportionment method the ratio of the
District population to the State population has been
found out and the same is projected to the next two
decades assuming the change in the ratio during 2001 -
2011 and 2011-2021 will remain same as the value of
that during 2001-2011. In order to find out the projected
population in 2011 and 2021, the projected populations
of the State during the same years are needed. The
details of the population projection of Kerala is elabo-
rated in the Annexe 3. The projected population of the
YearTotal population as per
decrease rate method
Total population as perapportionment method
Average
population figures
2011 3,156,775 3,150,353 3,153,564
2021 3,294,161 3,278,716 3,286,439
TABLE 3.9: FINAL PROJECTED POPULATION FIGURES OF THE DISTRICT
Source: Census 2001
District based on the apportionment method is given
in table 3.8.
The projected total population by the two meth-
ods differs slightly. The average of these two is taken
as the population figures of Thrissur District for 2011
and 2021. This is given in Table 3.9 .Thus the projected
total population of Thrissur District for 2011 and 2021
are 3,153,564 and 3,286,439 respectively.
3.8 INFERENCE
The population density of Thrissur district is 981
pp sq km which is higher than the state average value
of 819 pp.sq.km. Among the surrounding districts, popu-
lation density of Thrissur is less than that of Ernakulam
and Malappuram. The growth rate of population in the
district is significantly declining for the last three de-
cades and hence it can be presumed that there won’t
be much increase in the gross population density of
the district in future if the present trend continues.
The spatial agglomeration pattern of population
49
District Spatial Plan - Thrissur
Department of Town & Country Planning, KeralaDepartment of Town & Country Planning, Kerala
POPULATION
clearly shows that the transportation corridors espe-
cially the national highways passing through the dis-
trict plays a crucial role in formulating the spatial con-
centration pattern of population. Other determinants
are social and physical character of coastal areas near-
ness to existing urban areas etc.
Three distinct zones can be earmarked based on
the distribution of the gross population density. The
eastern high land region of the district shows the least
gross population density value of less than 750 popula-
tion/sq km. The LSGs in the mid land region is having a
gross population density range of 750-1500 population/
sq km. The highest population density is seen in the
coastal belt of the district which falls in the range 1500-
3200 population / sq km. Based on the trend it is pro-
jected that the population of the District will be in-
creased by 1.79 lakhs and 1.33 lakhs in the succeeding
decades, 2001-11 and 2011-2021 respectively.
50
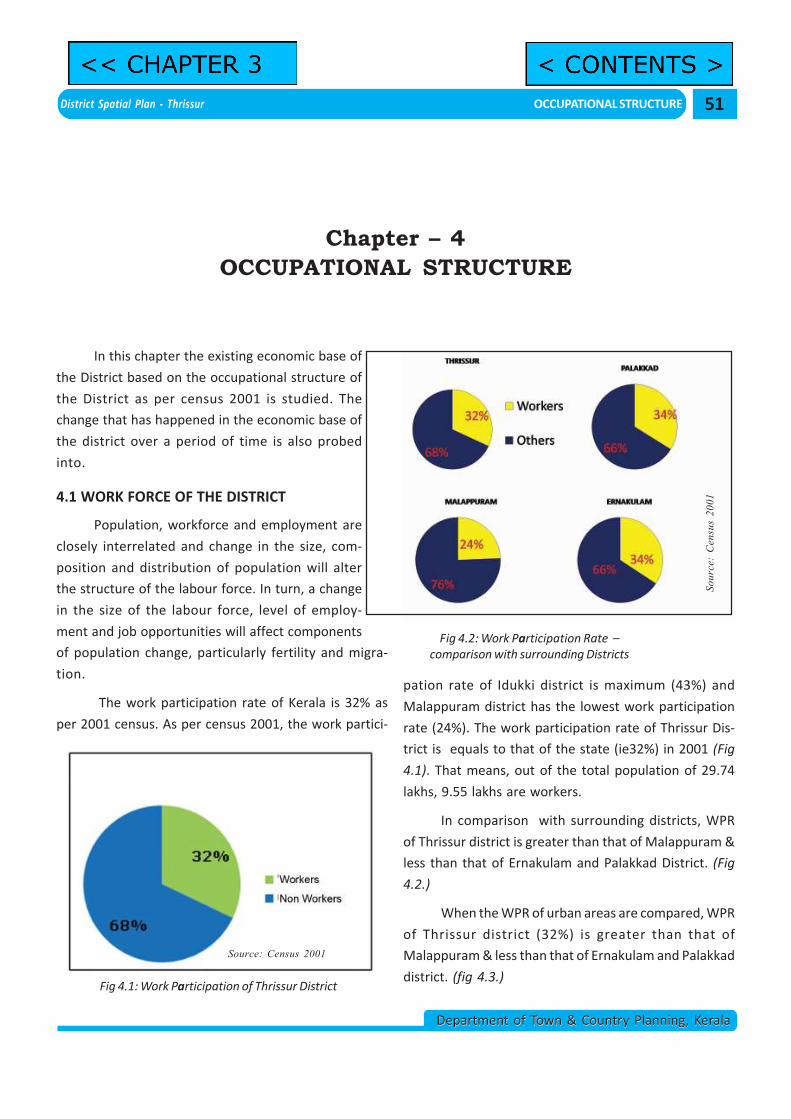
District Spatial Plan - Thrissur OCCUPATIONAL STRUCTURE
Department of Town & Country Planning, KeralaDepartment of Town & Country Planning, Kerala
In this chapter the existing economic base of
the District based on the occupational structure of
the District as per census 2001 is studied. The
change that has happened in the economic base of
the district over a period of time is also probed
into.
4.1 WORK FORCE OF THE DISTRICT
Population, workforce and employment are
closely interrelated and change in the size, com-
position and distribution of population will alter
the structure of the labour force. In turn, a change
in the size of the labour force, level of employ-
ment and job opportunities will affect components
of population change, particularly fertility and migra-
tion.
The work participation rate of Kerala is 32% as
per 2001 census. As per census 2001, the work partici-
Chapter – 4OCCUPATIONAL STRUCTURE
Fig 4.1: Work Participation of Thrissur District
Source: Census 2001
Fig 4.2: Work Participation Rate –comparison with surrounding Districts
Sour
ce:
Cen
sus
2001
pation rate of Idukki district is maximum (43%) and
Malappuram district has the lowest work participation
rate (24%). The work participation rate of Thrissur Dis-
trict is equals to that of the state (ie32%) in 2001 (Fig
4.1). That means, out of the total population of 29.74
lakhs, 9.55 lakhs are workers.
In comparison with surrounding districts, WPR
of Thrissur district is greater than that of Malappuram &
less than that of Ernakulam and Palakkad District. (Fig
4.2.)
When the WPR of urban areas are compared, WPR
of Thrissur district (32%) is greater than that of
Malappuram & less than that of Ernakulam and Palakkad
district. (fig 4.3.)
51
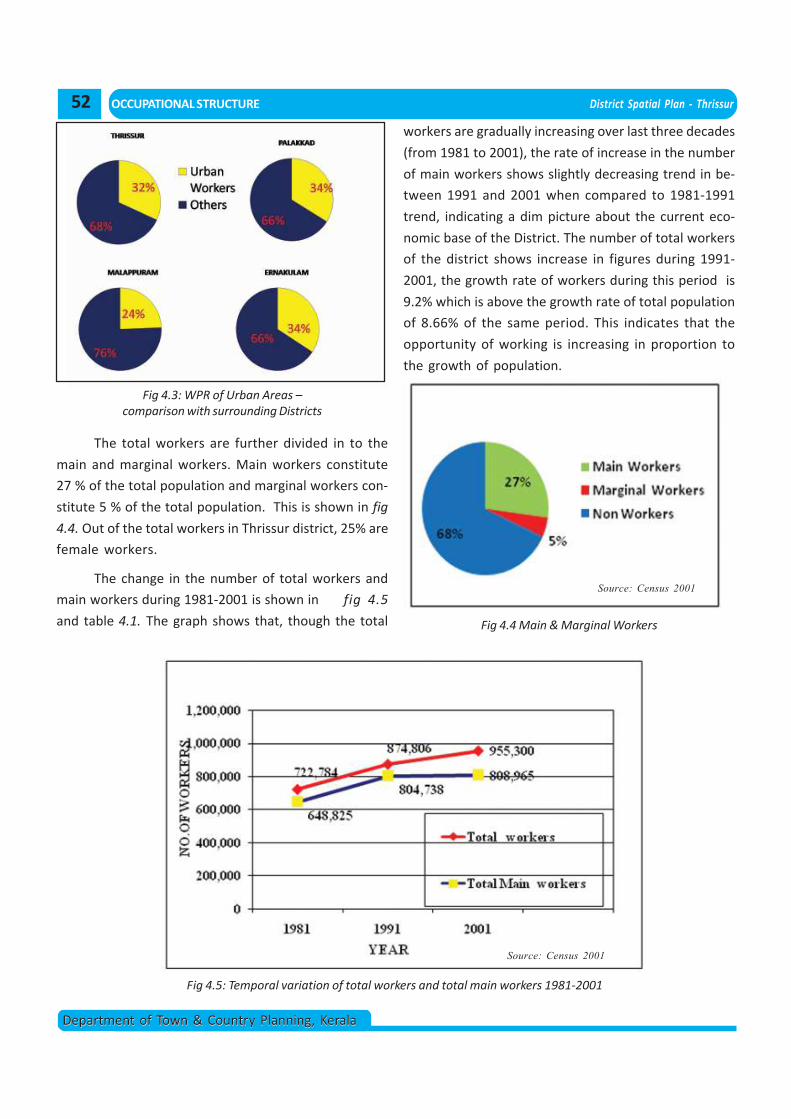
OCCUPATIONAL STRUCTURE District Spatial Plan - Thrissur
Department of Town & Country Planning, KeralaDepartment of Town & Country Planning, Kerala
Fig 4.3: WPR of Urban Areas –comparison with surrounding Districts
The total workers are further divided in to the
main and marginal workers. Main workers constitute
27 % of the total population and marginal workers con-
stitute 5 % of the total population. This is shown in fig
4.4. Out of the total workers in Thrissur district, 25% are
female workers.
The change in the number of total workers and
main workers during 1981-2001 is shown in fig 4.5
and table 4.1. The graph shows that, though the total
Source: Census 2001
Fig 4.4 Main & Marginal Workers
workers are gradually increasing over last three decades
(from 1981 to 2001), the rate of increase in the number
of main workers shows slightly decreasing trend in be-
tween 1991 and 2001 when compared to 1981-1991
trend, indicating a dim picture about the current eco-
nomic base of the District. The number of total workers
of the district shows increase in figures during 1991-
2001, the growth rate of workers during this period is
9.2% which is above the growth rate of total population
of 8.66% of the same period. This indicates that the
opportunity of working is increasing in proportion to
the growth of population.
Fig 4.5: Temporal variation of total workers and total main workers 1981-2001
Source: Census 2001
52
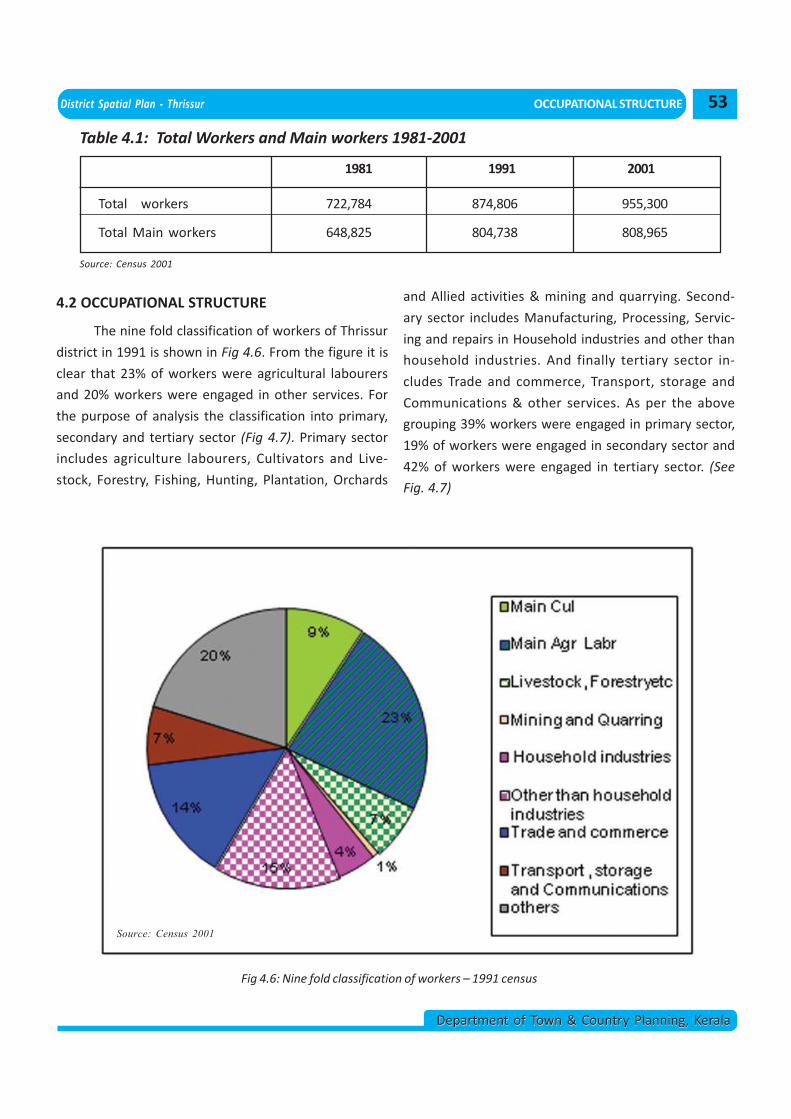
District Spatial Plan - Thrissur OCCUPATIONAL STRUCTURE
Department of Town & Country Planning, KeralaDepartment of Town & Country Planning, Kerala
Table 4.1: Total Workers and Main workers 1981-2001
1981 1991 2001
Total workers 722,784 874,806 955,300
Total Main workers 648,825 804,738 808,965
Source: Census 2001
4.2 OCCUPATIONAL STRUCTURE
The nine fold classification of workers of Thrissur
district in 1991 is shown in Fig 4.6. From the figure it is
clear that 23% of workers were agricultural labourers
and 20% workers were engaged in other services. For
the purpose of analysis the classification into primary,
secondary and tertiary sector (Fig 4.7). Primary sector
includes agriculture labourers, Cultivators and Live-
stock, Forestry, Fishing, Hunting, Plantation, Orchards
Fig 4.6: Nine fold classification of workers – 1991 census
Source: Census 2001
and Allied activities & mining and quarrying. Second-
ary sector includes Manufacturing, Processing, Servic-
ing and repairs in Household industries and other than
household industries. And finally tertiary sector in-
cludes Trade and commerce, Transport, storage and
Communications & other services. As per the above
grouping 39% workers were engaged in primary sector,
19% of workers were engaged in secondary sector and
42% of workers were engaged in tertiary sector. (See
Fig. 4.7)
53
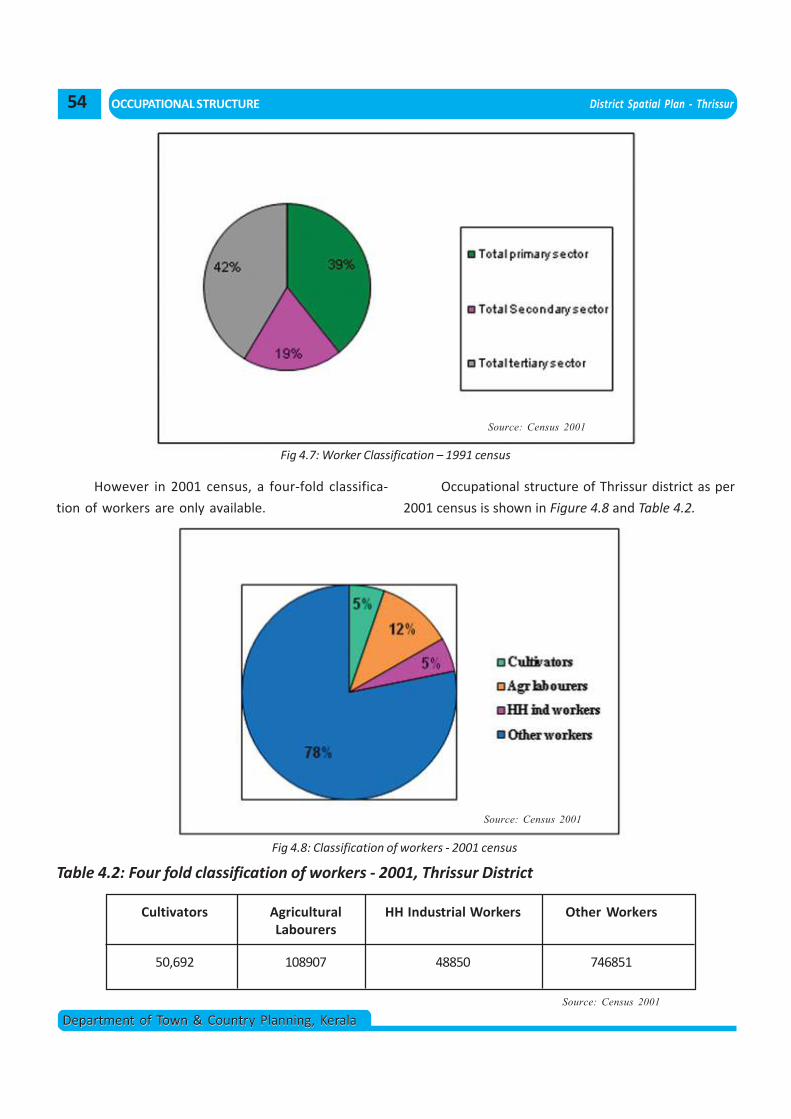
OCCUPATIONAL STRUCTURE District Spatial Plan - Thrissur
Department of Town & Country Planning, KeralaDepartment of Town & Country Planning, Kerala
Fig 4.7: Worker Classification – 1991 census
Source: Census 2001
Table 4.2: Four fold classification of workers - 2001, Thrissur District
Cultivators Agricultural HH Industrial Workers Other WorkersLabourers
50,692 108907 48850 746851
Source: Census 2001
Fig 4.8: Classification of workers - 2001 census
Source: Census 2001
However in 2001 census, a four-fold classifica-
tion of workers are only available.
Occupational structure of Thrissur district as per
2001 census is shown in Figure 4.8 and Table 4.2.
54
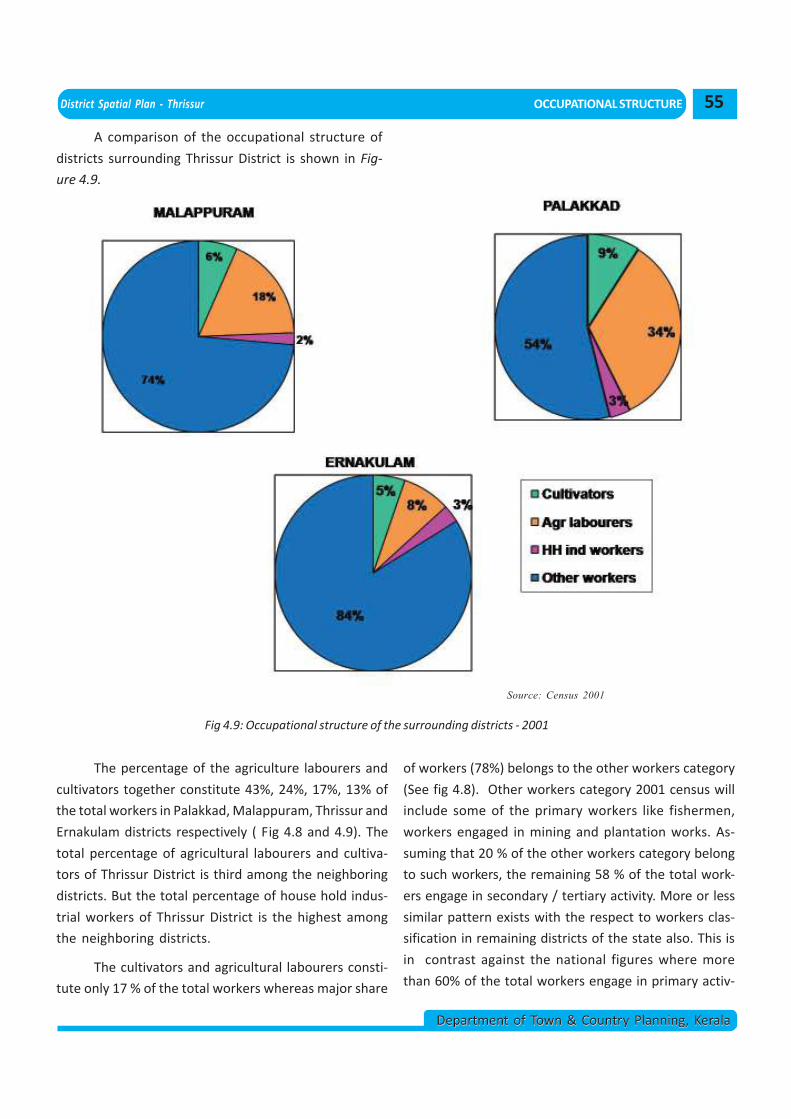
District Spatial Plan - Thrissur OCCUPATIONAL STRUCTURE
Department of Town & Country Planning, KeralaDepartment of Town & Country Planning, Kerala
A comparison of the occupational structure of
districts surrounding Thrissur District is shown in Fig-
ure 4.9.
Fig 4.9: Occupational structure of the surrounding districts - 2001
Source: Census 2001
The percentage of the agriculture labourers and
cultivators together constitute 43%, 24%, 17%, 13% of
the total workers in Palakkad, Malappuram, Thrissur and
Ernakulam districts respectively ( Fig 4.8 and 4.9). The
total percentage of agricultural labourers and cultiva-
tors of Thrissur District is third among the neighboring
districts. But the total percentage of house hold indus-
trial workers of Thrissur District is the highest among
the neighboring districts.
The cultivators and agricultural labourers consti-
tute only 17 % of the total workers whereas major share
of workers (78%) belongs to the other workers category
(See fig 4.8). Other workers category 2001 census will
include some of the primary workers like fishermen,
workers engaged in mining and plantation works. As-
suming that 20 % of the other workers category belong
to such workers, the remaining 58 % of the total work-
ers engage in secondary / tertiary activity. More or less
similar pattern exists with the respect to workers clas-
sification in remaining districts of the state also. This is
in contrast against the national figures where more
than 60% of the total workers engage in primary activ-
55
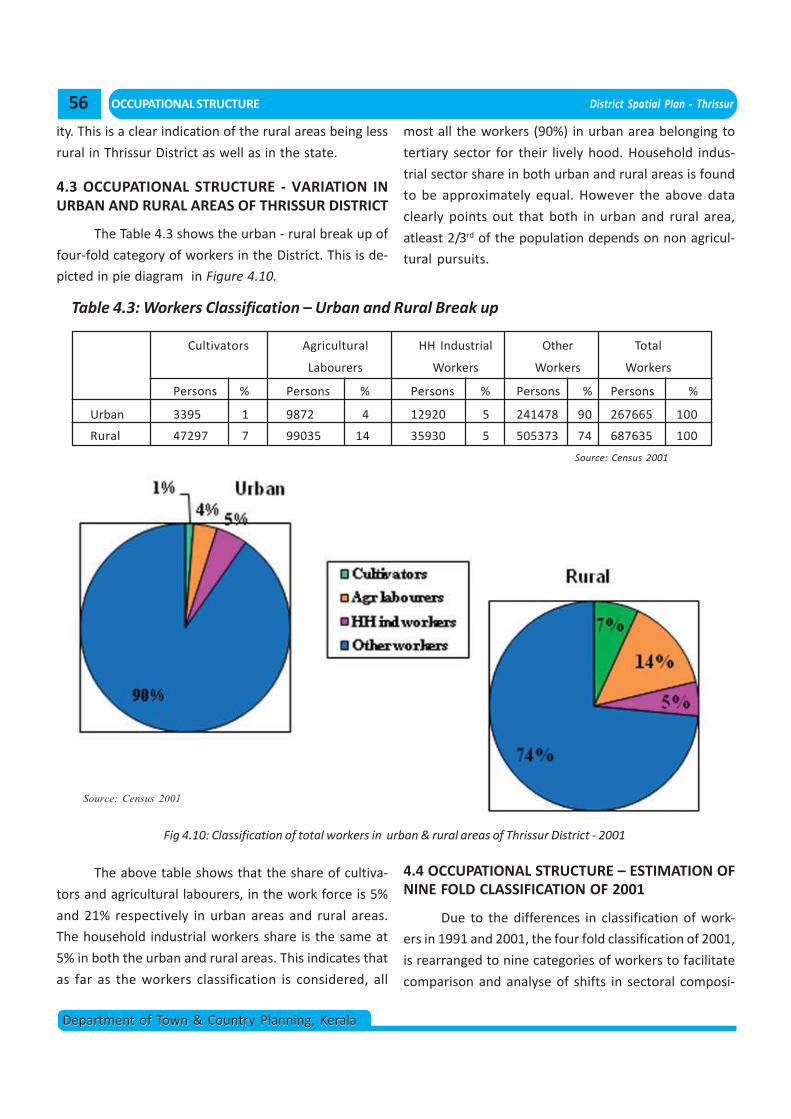
OCCUPATIONAL STRUCTURE District Spatial Plan - Thrissur
Department of Town & Country Planning, KeralaDepartment of Town & Country Planning, Kerala
ity. This is a clear indication of the rural areas being less
rural in Thrissur District as well as in the state.
4.3 OCCUPATIONAL STRUCTURE - VARIATION INURBAN AND RURAL AREAS OF THRISSUR DISTRICT
The Table 4.3 shows the urban - rural break up of
four-fold category of workers in the District. This is de-
picted in pie diagram in Figure 4.10.
Cultivators Agricultural HH Industrial Other Total
Labourers Workers Workers Workers
Persons % Persons % Persons % Persons % Persons %
Urban 3395 1 9872 4 12920 5 241478 90 267665 100
Rural 47297 7 99035 14 35930 5 505373 74 687635 100
Table 4.3: Workers Classification – Urban and Rural Break up
Source: Census 2001
Fig 4.10: Classification of total workers in urban & rural areas of Thrissur District - 2001
Source: Census 2001
The above table shows that the share of cultiva-
tors and agricultural labourers, in the work force is 5%
and 21% respectively in urban areas and rural areas.
The household industrial workers share is the same at
5% in both the urban and rural areas. This indicates that
as far as the workers classification is considered, all
most all the workers (90%) in urban area belonging to
tertiary sector for their lively hood. Household indus-
trial sector share in both urban and rural areas is found
to be approximately equal. However the above data
clearly points out that both in urban and rural area,
atleast 2/3rd of the population depends on non agricul-
tural pursuits.
4.4 OCCUPATIONAL STRUCTURE – ESTIMATION OFNINE FOLD CLASSIFICATION OF 2001
Due to the differences in classification of work-
ers in 1991 and 2001, the four fold classification of 2001,
is rearranged to nine categories of workers to facilitate
comparison and analyse of shifts in sectoral composi-
56
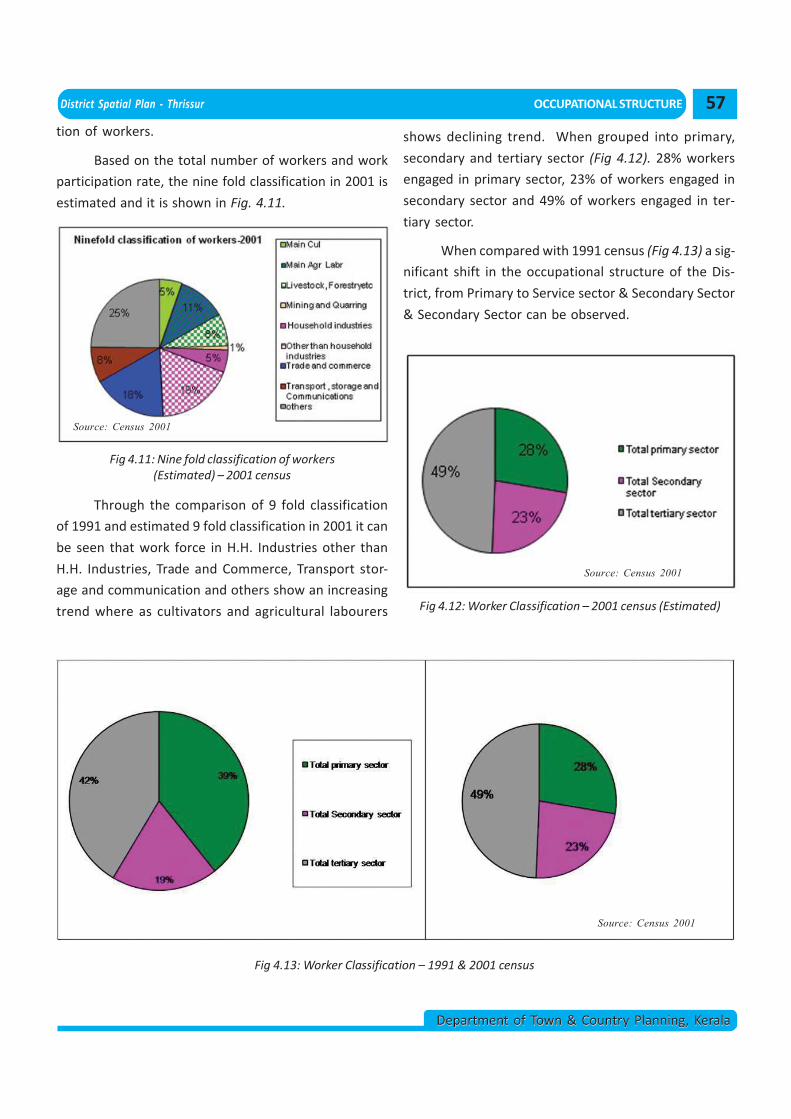
District Spatial Plan - Thrissur OCCUPATIONAL STRUCTURE
Department of Town & Country Planning, KeralaDepartment of Town & Country Planning, Kerala
tion of workers.
Based on the total number of workers and work
participation rate, the nine fold classification in 2001 is
estimated and it is shown in Fig. 4.11.
Fig 4.11: Nine fold classification of workers(Estimated) – 2001 census
Source: Census 2001
Through the comparison of 9 fold classification
of 1991 and estimated 9 fold classification in 2001 it can
be seen that work force in H.H. Industries other than
H.H. Industries, Trade and Commerce, Transport stor-
age and communication and others show an increasing
trend where as cultivators and agricultural labourers Fig 4.12: Worker Classification – 2001 census (Estimated)
Source: Census 2001
Fig 4.13: Worker Classification – 1991 & 2001 census
Source: Census 2001
shows declining trend. When grouped into primary,
secondary and tertiary sector (Fig 4.12). 28% workers
engaged in primary sector, 23% of workers engaged in
secondary sector and 49% of workers engaged in ter-
tiary sector.
When compared with 1991 census (Fig 4.13) a sig-
nificant shift in the occupational structure of the Dis-
trict, from Primary to Service sector & Secondary Sector
& Secondary Sector can be observed.
57
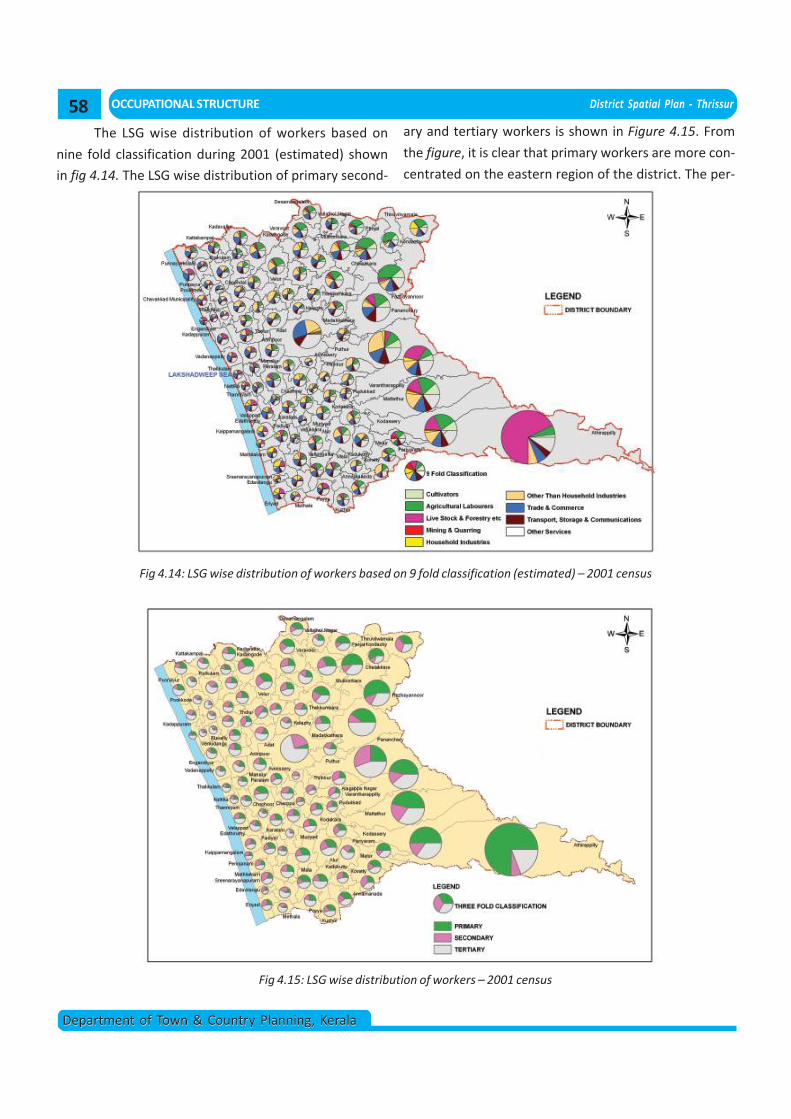
OCCUPATIONAL STRUCTURE District Spatial Plan - Thrissur
Department of Town & Country Planning, KeralaDepartment of Town & Country Planning, Kerala
The LSG wise distribution of workers based on
nine fold classification during 2001 (estimated) shown
in fig 4.14. The LSG wise distribution of primary second-
Fig 4.14: LSG wise distribution of workers based on 9 fold classification (estimated) – 2001 census
Fig 4.15: LSG wise distribution of workers – 2001 census
ary and tertiary workers is shown in Figure 4.15. From
the figure, it is clear that primary workers are more con-
centrated on the eastern region of the district. The per-
58
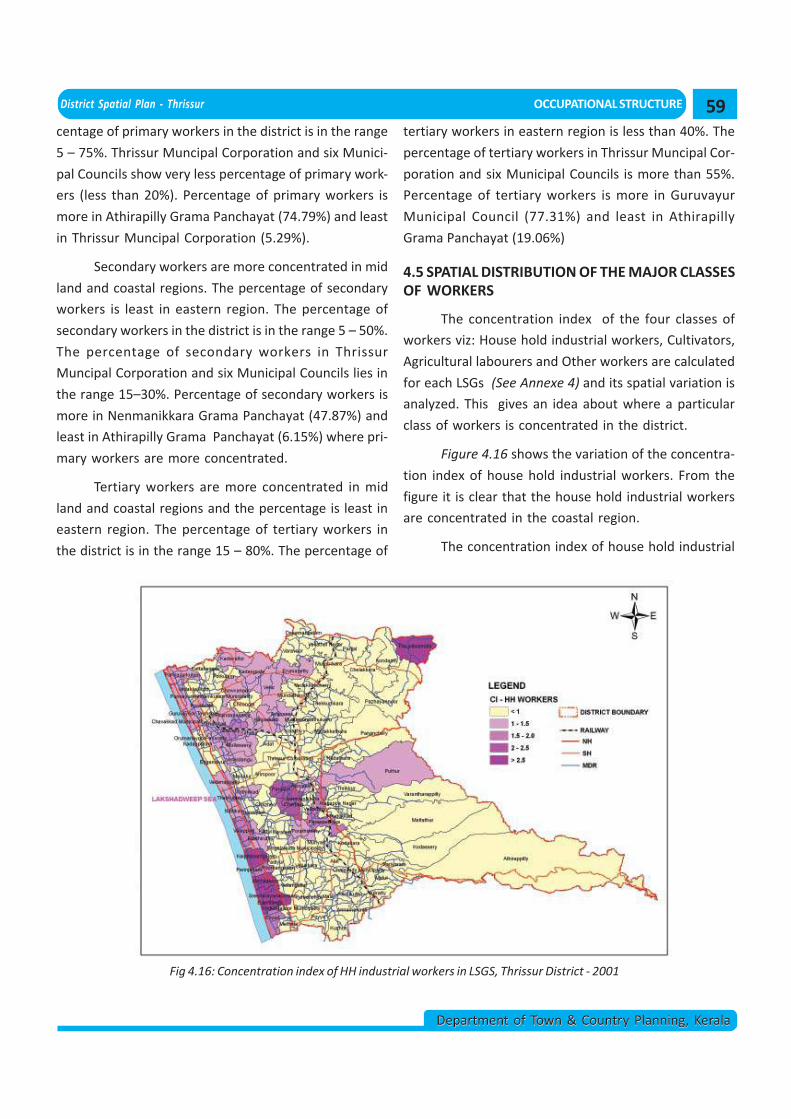
District Spatial Plan - Thrissur OCCUPATIONAL STRUCTURE
Department of Town & Country Planning, KeralaDepartment of Town & Country Planning, Kerala
centage of primary workers in the district is in the range
5 – 75%. Thrissur Muncipal Corporation and six Munici-
pal Councils show very less percentage of primary work-
ers (less than 20%). Percentage of primary workers is
more in Athirapilly Grama Panchayat (74.79%) and least
in Thrissur Muncipal Corporation (5.29%).
Secondary workers are more concentrated in mid
land and coastal regions. The percentage of secondary
workers is least in eastern region. The percentage of
secondary workers in the district is in the range 5 – 50%.
The percentage of secondary workers in Thrissur
Muncipal Corporation and six Municipal Councils lies in
the range 15–30%. Percentage of secondary workers is
more in Nenmanikkara Grama Panchayat (47.87%) and
least in Athirapilly Grama Panchayat (6.15%) where pri-
mary workers are more concentrated.
Tertiary workers are more concentrated in mid
land and coastal regions and the percentage is least in
eastern region. The percentage of tertiary workers in
the district is in the range 15 – 80%. The percentage of
tertiary workers in eastern region is less than 40%. The
percentage of tertiary workers in Thrissur Muncipal Cor-
poration and six Municipal Councils is more than 55%.
Percentage of tertiary workers is more in Guruvayur
Municipal Council (77.31%) and least in Athirapilly
Grama Panchayat (19.06%)
4.5 SPATIAL DISTRIBUTION OF THE MAJOR CLASSESOF WORKERS
The concentration index of the four classes of
workers viz: House hold industrial workers, Cultivators,
Agricultural labourers and Other workers are calculated
for each LSGs (See Annexe 4) and its spatial variation is
analyzed. This gives an idea about where a particular
class of workers is concentrated in the district.
Figure 4.16 shows the variation of the concentra-
tion index of house hold industrial workers. From the
figure it is clear that the house hold industrial workers
are concentrated in the coastal region.
The concentration index of house hold industrial
Fig 4.16: Concentration index of HH industrial workers in LSGS, Thrissur District - 2001
59
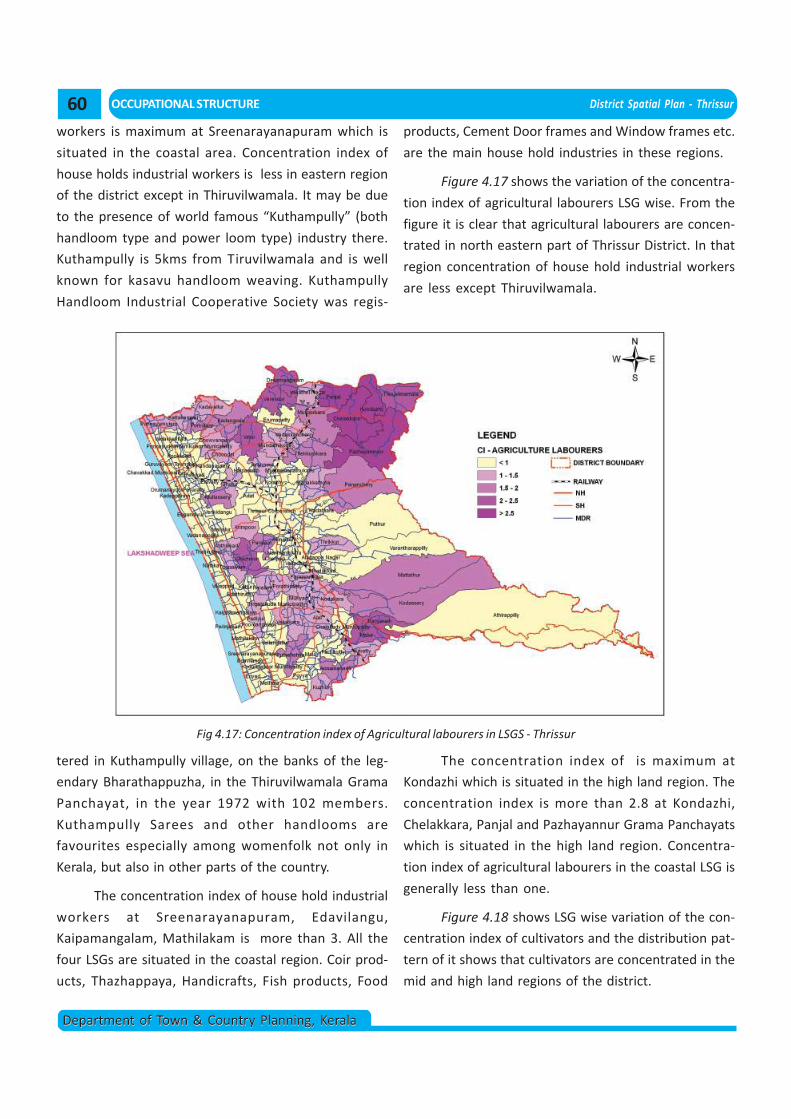
OCCUPATIONAL STRUCTURE District Spatial Plan - Thrissur
Department of Town & Country Planning, KeralaDepartment of Town & Country Planning, Kerala
workers is maximum at Sreenarayanapuram which is
situated in the coastal area. Concentration index of
house holds industrial workers is less in eastern region
of the district except in Thiruvilwamala. It may be due
to the presence of world famous “Kuthampully” (both
handloom type and power loom type) industry there.
Kuthampully is 5kms from Tiruvilwamala and is well
known for kasavu handloom weaving. Kuthampully
Handloom Industrial Cooperative Society was regis-
Fig 4.17: Concentration index of Agricultural labourers in LSGS - Thrissur
tered in Kuthampully village, on the banks of the leg-
endary Bharathappuzha, in the Thiruvilwamala Grama
Panchayat, in the year 1972 with 102 members.
Kuthampully Sarees and other handlooms are
favourites especially among womenfolk not only in
Kerala, but also in other parts of the country.
The concentration index of house hold industrial
workers at Sreenarayanapuram, Edavilangu,
Kaipamangalam, Mathilakam is more than 3. All the
four LSGs are situated in the coastal region. Coir prod-
ucts, Thazhappaya, Handicrafts, Fish products, Food
products, Cement Door frames and Window frames etc.
are the main house hold industries in these regions.
Figure 4.17 shows the variation of the concentra-
tion index of agricultural labourers LSG wise. From the
figure it is clear that agricultural labourers are concen-
trated in north eastern part of Thrissur District. In that
region concentration of house hold industrial workers
are less except Thiruvilwamala.
The concentration index of is maximum at
Kondazhi which is situated in the high land region. The
concentration index is more than 2.8 at Kondazhi,
Chelakkara, Panjal and Pazhayannur Grama Panchayats
which is situated in the high land region. Concentra-
tion index of agricultural labourers in the coastal LSG is
generally less than one.
Figure 4.18 shows LSG wise variation of the con-
centration index of cultivators and the distribution pat-
tern of it shows that cultivators are concentrated in the
mid and high land regions of the district.
60
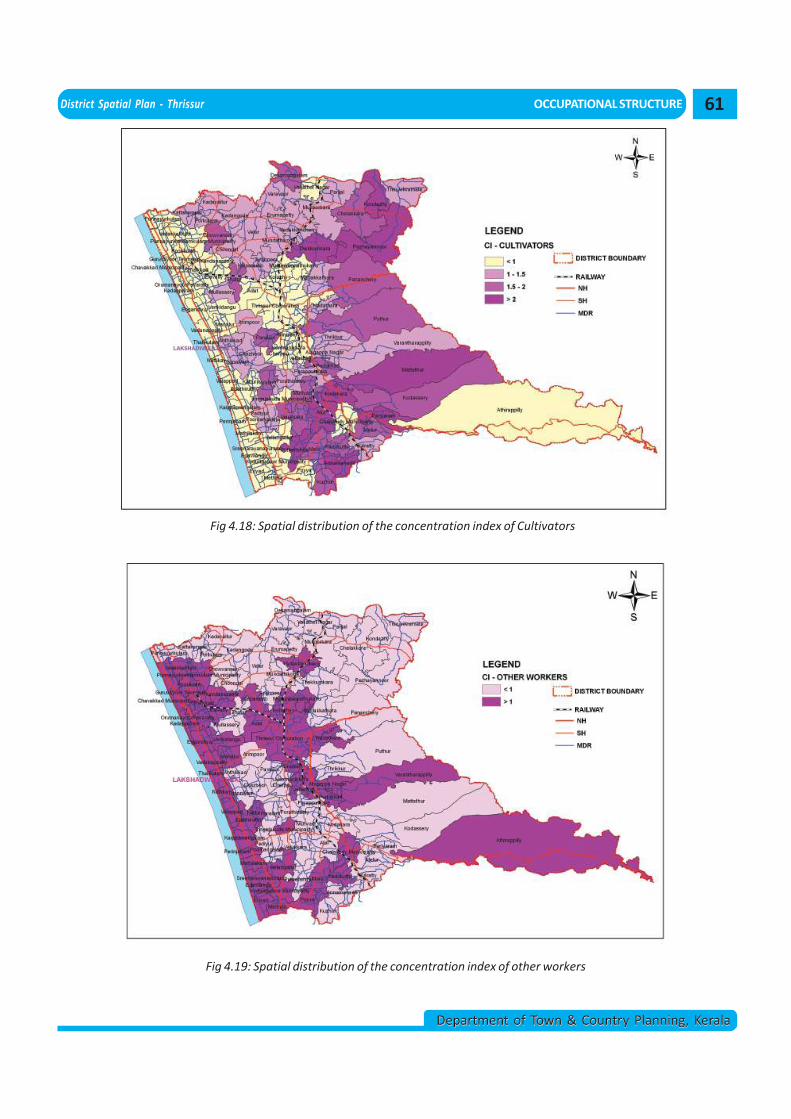
District Spatial Plan - Thrissur OCCUPATIONAL STRUCTURE
Department of Town & Country Planning, KeralaDepartment of Town & Country Planning, Kerala
Fig 4.18: Spatial distribution of the concentration index of Cultivators
Fig 4.19: Spatial distribution of the concentration index of other workers
61
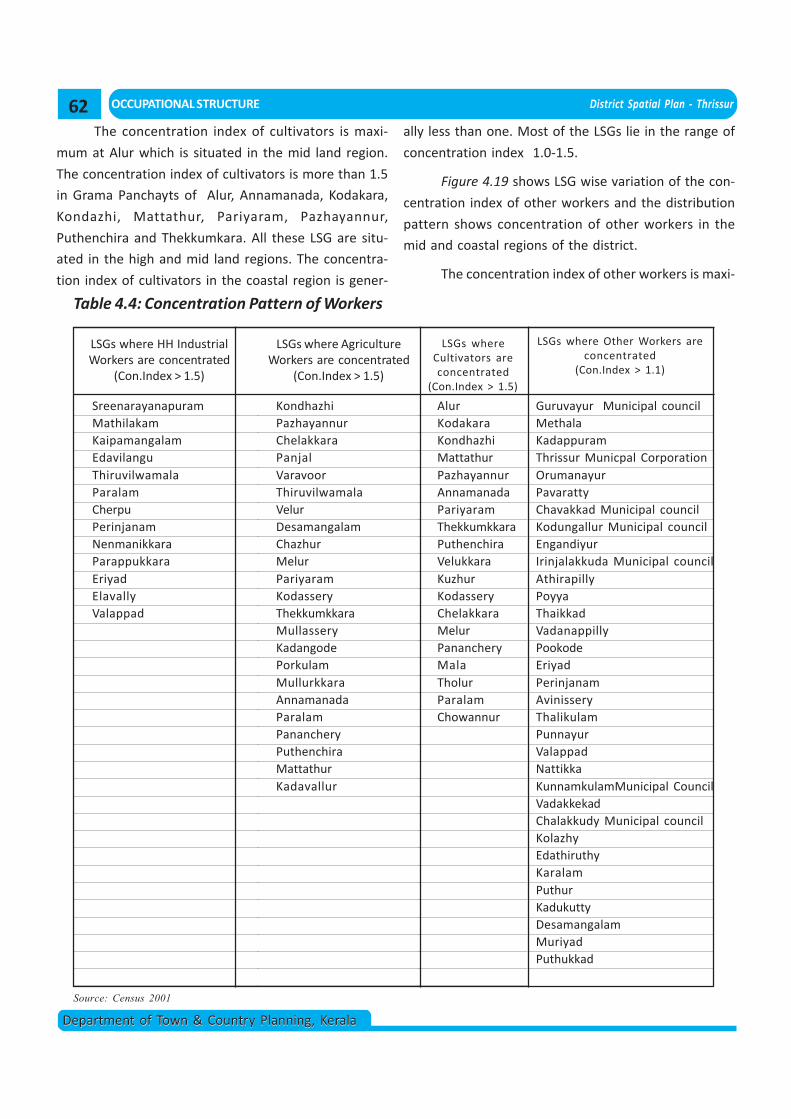
OCCUPATIONAL STRUCTURE District Spatial Plan - Thrissur
Department of Town & Country Planning, KeralaDepartment of Town & Country Planning, Kerala
The concentration index of cultivators is maxi-
mum at Alur which is situated in the mid land region.
The concentration index of cultivators is more than 1.5
in Grama Panchayts of Alur, Annamanada, Kodakara,
Kondazhi, Mattathur, Pariyaram, Pazhayannur,
Puthenchira and Thekkumkara. All these LSG are situ-
ated in the high and mid land regions. The concentra-
tion index of cultivators in the coastal region is gener-
ally less than one. Most of the LSGs lie in the range of
concentration index 1.0-1.5.
Figure 4.19 shows LSG wise variation of the con-
centration index of other workers and the distribution
pattern shows concentration of other workers in the
mid and coastal regions of the district.
The concentration index of other workers is maxi-
Table 4.4: Concentration Pattern of Workers
LSGs where HH IndustrialWorkers are concentrated
(Con.Index > 1.5)
LSGs where AgricultureWorkers are concentrated
(Con.Index > 1.5)
LSGs whereCultivators areconcentrated
(Con.Index > 1.5)
LSGs where Other Workers areconcentrated
(Con.Index > 1.1)
SreenarayanapuramMathilakamKaipamangalamEdavilanguThiruvilwamalaParalamCherpuPerinjanamNenmanikkaraParappukkaraEriyadElavallyValappad
KondhazhiPazhayannurChelakkaraPanjalVaravoorThiruvilwamalaVelurDesamangalamChazhurMelurPariyaramKodasseryThekkumkkaraMullasseryKadangodePorkulamMullurkkaraAnnamanadaParalamPanancheryPuthenchiraMattathurKadavallur
AlurKodakaraKondhazhiMattathurPazhayannurAnnamanadaPariyaramThekkumkkaraPuthenchiraVelukkaraKuzhurKodasseryChelakkaraMelurPanancheryMalaTholurParalamChowannur
Guruvayur Municipal councilMethalaKadappuramThrissur Municpal CorporationOrumanayurPavarattyChavakkad Municipal councilKodungallur Municipal councilEngandiyurIrinjalakkuda Municipal councilAthirapillyPoyyaThaikkadVadanappillyPookodeEriyadPerinjanamAvinisseryThalikulamPunnayurValappadNattikkaKunnamkulamMunicipal CouncilVadakkekadChalakkudy Municipal councilKolazhyEdathiruthyKaralamPuthurKadukuttyDesamangalamMuriyadPuthukkad
Source: Census 2001
62
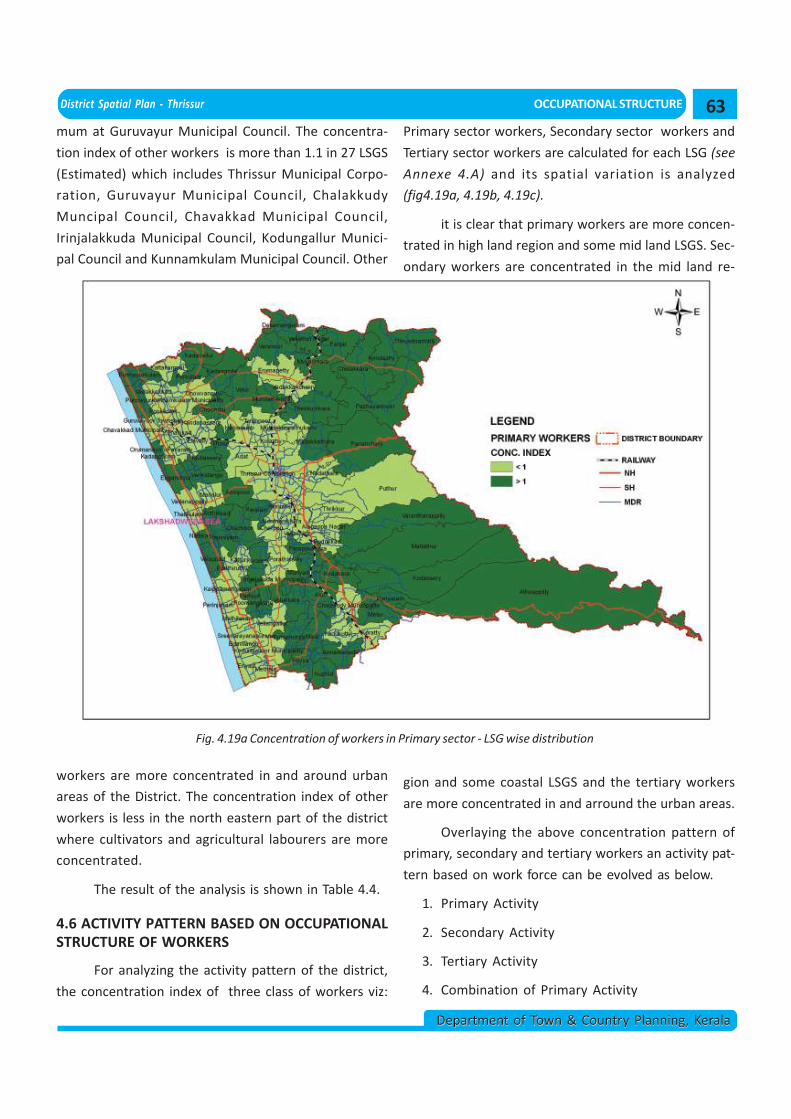
District Spatial Plan - Thrissur OCCUPATIONAL STRUCTURE
Department of Town & Country Planning, KeralaDepartment of Town & Country Planning, Kerala
mum at Guruvayur Municipal Council. The concentra-
tion index of other workers is more than 1.1 in 27 LSGS
(Estimated) which includes Thrissur Municipal Corpo-
ration, Guruvayur Municipal Council, Chalakkudy
Muncipal Council, Chavakkad Municipal Council,
Irinjalakkuda Municipal Council, Kodungallur Munici-
pal Council and Kunnamkulam Municipal Council. Other
Fig. 4.19a Concentration of workers in Primary sector - LSG wise distribution
workers are more concentrated in and around urban
areas of the District. The concentration index of other
workers is less in the north eastern part of the district
where cultivators and agricultural labourers are more
concentrated.
The result of the analysis is shown in Table 4.4.
4.6 ACTIVITY PATTERN BASED ON OCCUPATIONALSTRUCTURE OF WORKERS
For analyzing the activity pattern of the district,
the concentration index of three class of workers viz:
Primary sector workers, Secondary sector workers and
Tertiary sector workers are calculated for each LSG (see
Annexe 4.A) and its spatial variation is analyzed
(fig4.19a, 4.19b, 4.19c).
it is clear that primary workers are more concen-
trated in high land region and some mid land LSGS. Sec-
ondary workers are concentrated in the mid land re-
gion and some coastal LSGS and the tertiary workers
are more concentrated in and arround the urban areas.
Overlaying the above concentration pattern of
primary, secondary and tertiary workers an activity pat-
tern based on work force can be evolved as below.
1. Primary Activity
2. Secondary Activity
3. Tertiary Activity
4. Combination of Primary Activity
63
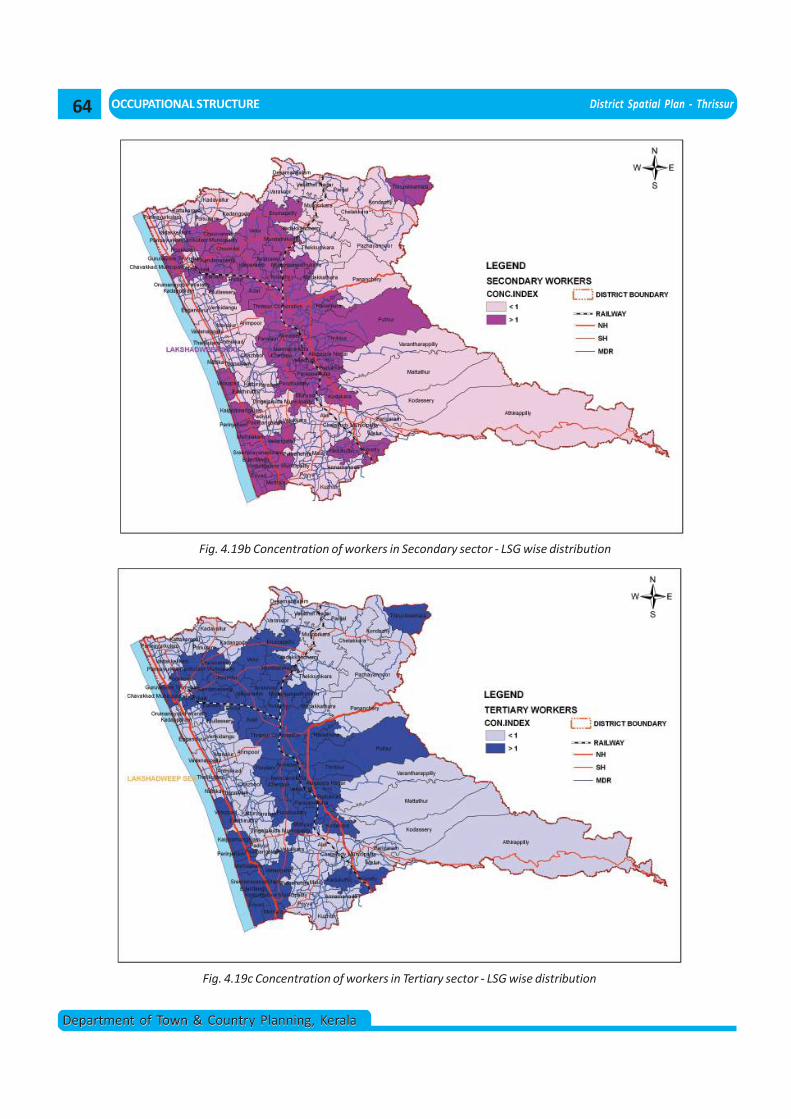
OCCUPATIONAL STRUCTURE District Spatial Plan - Thrissur
Department of Town & Country Planning, KeralaDepartment of Town & Country Planning, Kerala
Fig. 4.19b Concentration of workers in Secondary sector - LSG wise distribution
Fig. 4.19c Concentration of workers in Tertiary sector - LSG wise distribution
64
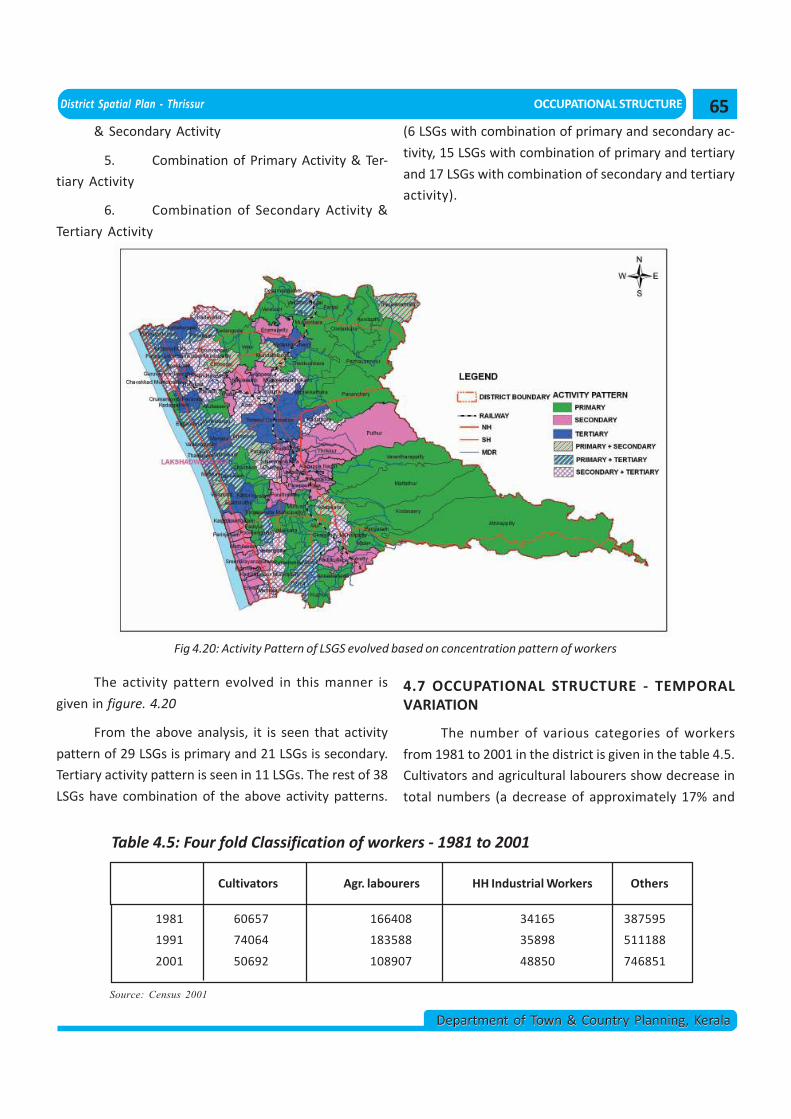
District Spatial Plan - Thrissur OCCUPATIONAL STRUCTURE
Department of Town & Country Planning, KeralaDepartment of Town & Country Planning, Kerala
Fig 4.20: Activity Pattern of LSGS evolved based on concentration pattern of workers
Table 4.5: Four fold Classification of workers - 1981 to 2001
Cultivators Agr. labourers HH Industrial Workers Others
1981 60657 166408 34165 387595
1991 74064 183588 35898 511188
2001 50692 108907 48850 746851
Source: Census 2001
& Secondary Activity
5. Combination of Primary Activity & Ter-
tiary Activity
6. Combination of Secondary Activity &
Tertiary Activity
The activity pattern evolved in this manner is
given in figure. 4.20
From the above analysis, it is seen that activity
pattern of 29 LSGs is primary and 21 LSGs is secondary.
Tertiary activity pattern is seen in 11 LSGs. The rest of 38
LSGs have combination of the above activity patterns.
(6 LSGs with combination of primary and secondary ac-
tivity, 15 LSGs with combination of primary and tertiary
and 17 LSGs with combination of secondary and tertiary
activity).
4.7 OCCUPATIONAL STRUCTURE - TEMPORALVARIATION
The number of various categories of workers
from 1981 to 2001 in the district is given in the table 4.5.
Cultivators and agricultural labourers show decrease in
total numbers (a decrease of approximately 17% and
65
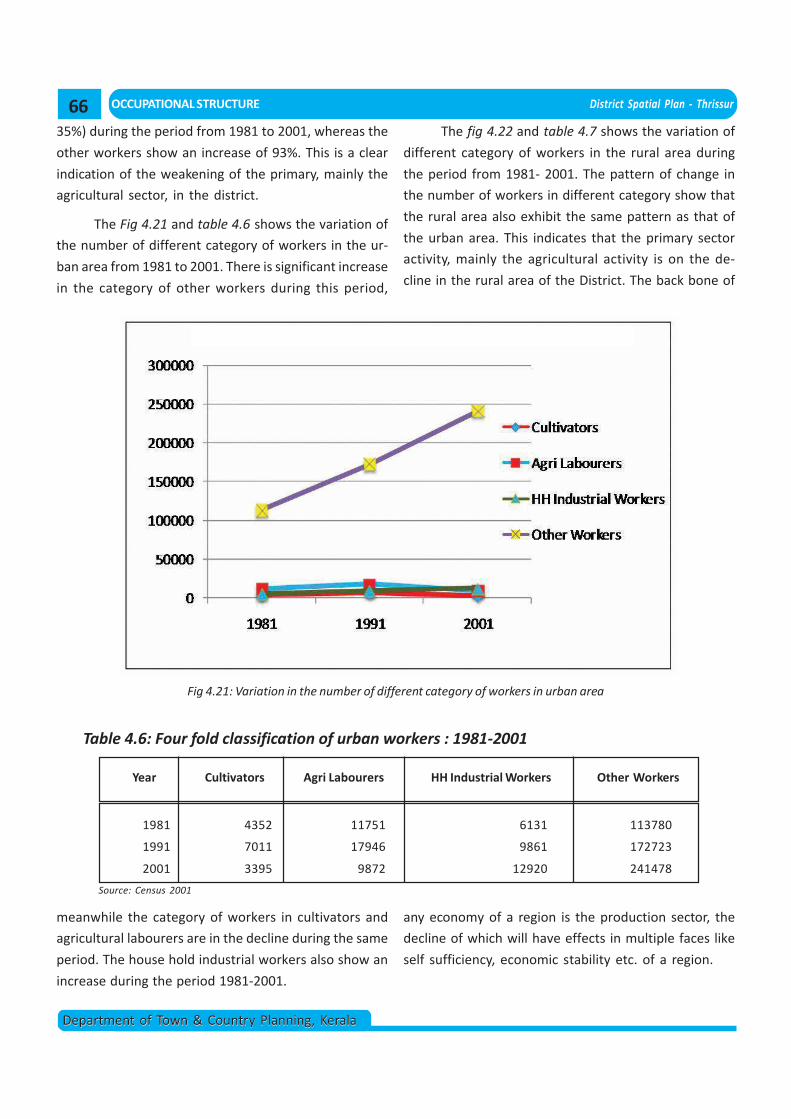
OCCUPATIONAL STRUCTURE District Spatial Plan - Thrissur
Department of Town & Country Planning, KeralaDepartment of Town & Country Planning, Kerala
Fig 4.21: Variation in the number of different category of workers in urban area
Table 4.6: Four fold classification of urban workers : 1981-2001
Year Cultivators Agri Labourers HH Industrial Workers Other Workers
1981 4352 11751 6131 113780
1991 7011 17946 9861 172723
2001 3395 9872 12920 241478
Source: Census 2001
35%) during the period from 1981 to 2001, whereas the
other workers show an increase of 93%. This is a clear
indication of the weakening of the primary, mainly the
agricultural sector, in the district.
The Fig 4.21 and table 4.6 shows the variation of
the number of different category of workers in the ur-
ban area from 1981 to 2001. There is significant increase
in the category of other workers during this period,
meanwhile the category of workers in cultivators and
agricultural labourers are in the decline during the same
period. The house hold industrial workers also show an
increase during the period 1981-2001.
The fig 4.22 and table 4.7 shows the variation of
different category of workers in the rural area during
the period from 1981- 2001. The pattern of change in
the number of workers in different category show that
the rural area also exhibit the same pattern as that of
the urban area. This indicates that the primary sector
activity, mainly the agricultural activity is on the de-
cline in the rural area of the District. The back bone of
any economy of a region is the production sector, the
decline of which will have effects in multiple faces like
self sufficiency, economic stability etc. of a region.
66
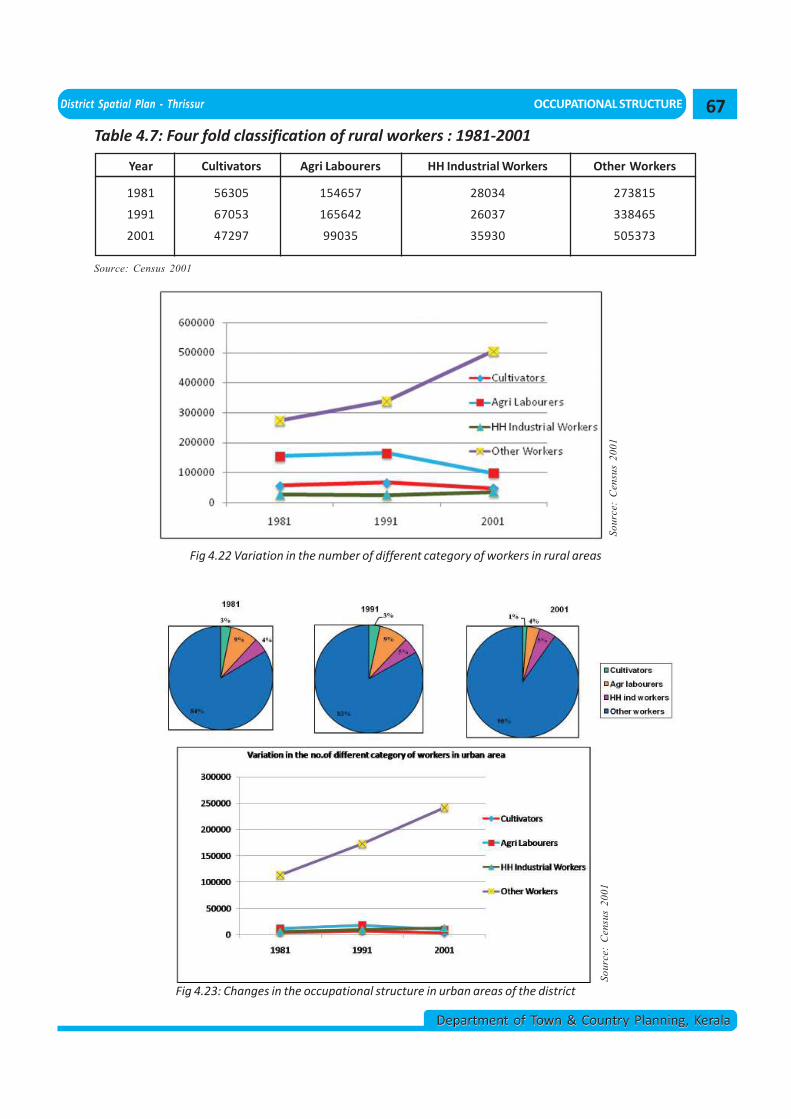
District Spatial Plan - Thrissur OCCUPATIONAL STRUCTURE
Department of Town & Country Planning, KeralaDepartment of Town & Country Planning, Kerala
Table 4.7: Four fold classification of rural workers : 1981-2001
Year Cultivators Agri Labourers HH Industrial Workers Other Workers
1981 56305 154657 28034 273815
1991 67053 165642 26037 338465
2001 47297 99035 35930 505373
Source: Census 2001
Fig 4.22 Variation in the number of different category of workers in rural areas
Sour
ce:
Cen
sus
2001
Fig 4.23: Changes in the occupational structure in urban areas of the district
Sour
ce:
Cen
sus
2001
67
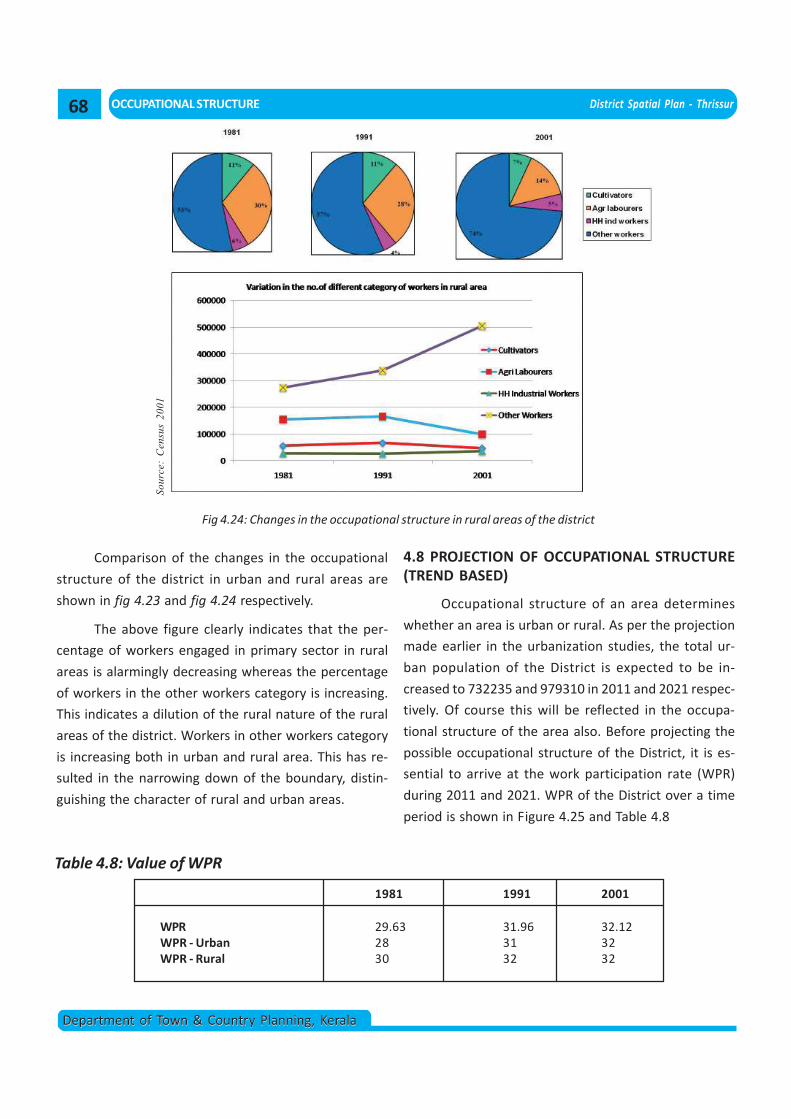
OCCUPATIONAL STRUCTURE District Spatial Plan - Thrissur
Department of Town & Country Planning, KeralaDepartment of Town & Country Planning, Kerala
Fig 4.24: Changes in the occupational structure in rural areas of the district
Sour
ce:
Cen
sus
2001
Comparison of the changes in the occupational
structure of the district in urban and rural areas are
shown in fig 4.23 and fig 4.24 respectively.
The above figure clearly indicates that the per-
centage of workers engaged in primary sector in rural
areas is alarmingly decreasing whereas the percentage
of workers in the other workers category is increasing.
This indicates a dilution of the rural nature of the rural
areas of the district. Workers in other workers category
is increasing both in urban and rural area. This has re-
sulted in the narrowing down of the boundary, distin-
guishing the character of rural and urban areas.
4.8 PROJECTION OF OCCUPATIONAL STRUCTURE(TREND BASED)
Occupational structure of an area determines
whether an area is urban or rural. As per the projection
made earlier in the urbanization studies, the total ur-
ban population of the District is expected to be in-
creased to 732235 and 979310 in 2011 and 2021 respec-
tively. Of course this will be reflected in the occupa-
tional structure of the area also. Before projecting the
possible occupational structure of the District, it is es-
sential to arrive at the work participation rate (WPR)
during 2011 and 2021. WPR of the District over a time
period is shown in Figure 4.25 and Table 4.8
Table 4.8: Value of WPR
68
1981 1991 2001
WPR 29.63 31.96 32.12WPR - Urban 28 31 32WPR - Rural 30 32 32
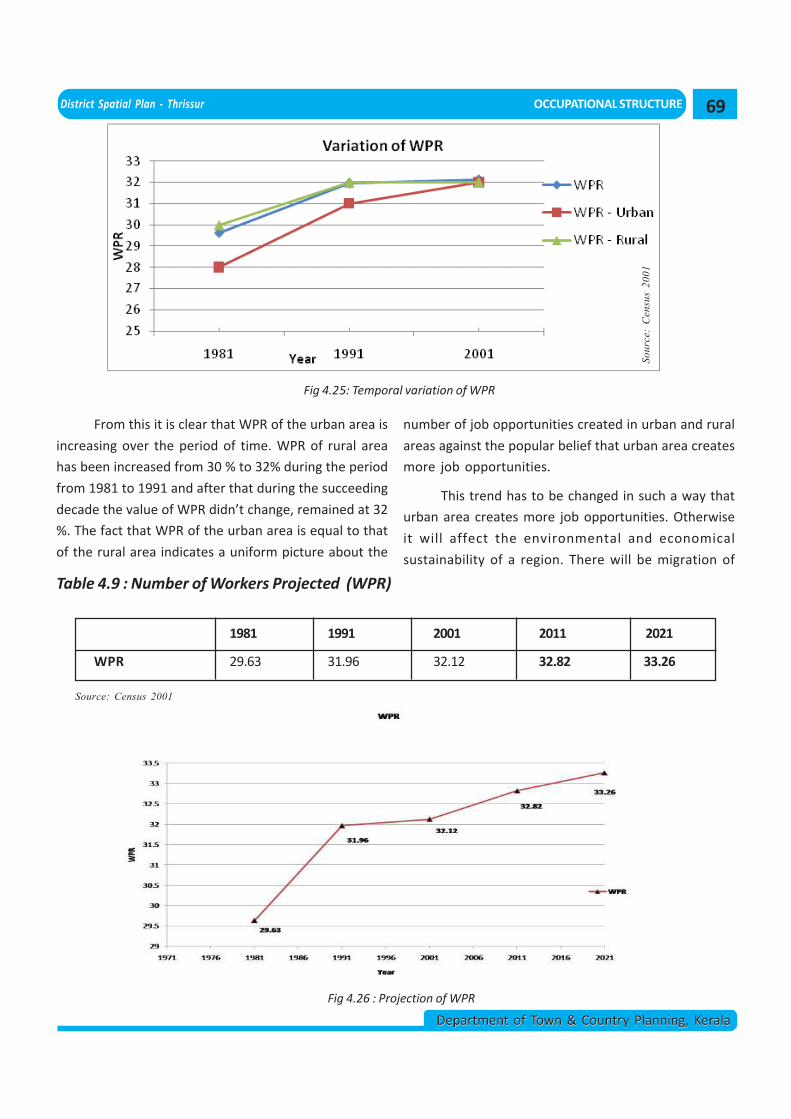
District Spatial Plan - Thrissur OCCUPATIONAL STRUCTURE
Department of Town & Country Planning, KeralaDepartment of Town & Country Planning, Kerala
Fig 4.25: Temporal variation of WPR
Sour
ce:
Cen
sus
2001
From this it is clear that WPR of the urban area is
increasing over the period of time. WPR of rural area
has been increased from 30 % to 32% during the period
from 1981 to 1991 and after that during the succeeding
decade the value of WPR didn’t change, remained at 32
%. The fact that WPR of the urban area is equal to that
of the rural area indicates a uniform picture about the
number of job opportunities created in urban and rural
areas against the popular belief that urban area creates
more job opportunities.
This trend has to be changed in such a way that
urban area creates more job opportunities. Otherwise
it will affect the environmental and economical
sustainability of a region. There will be migration of
Table 4.9 : Number of Workers Projected (WPR)
1981 1991 2001 2011 2021
WPR 29.63 31.96 32.12 32.82 33.26
Source: Census 2001
Fig 4.26 : Projection of WPR
69
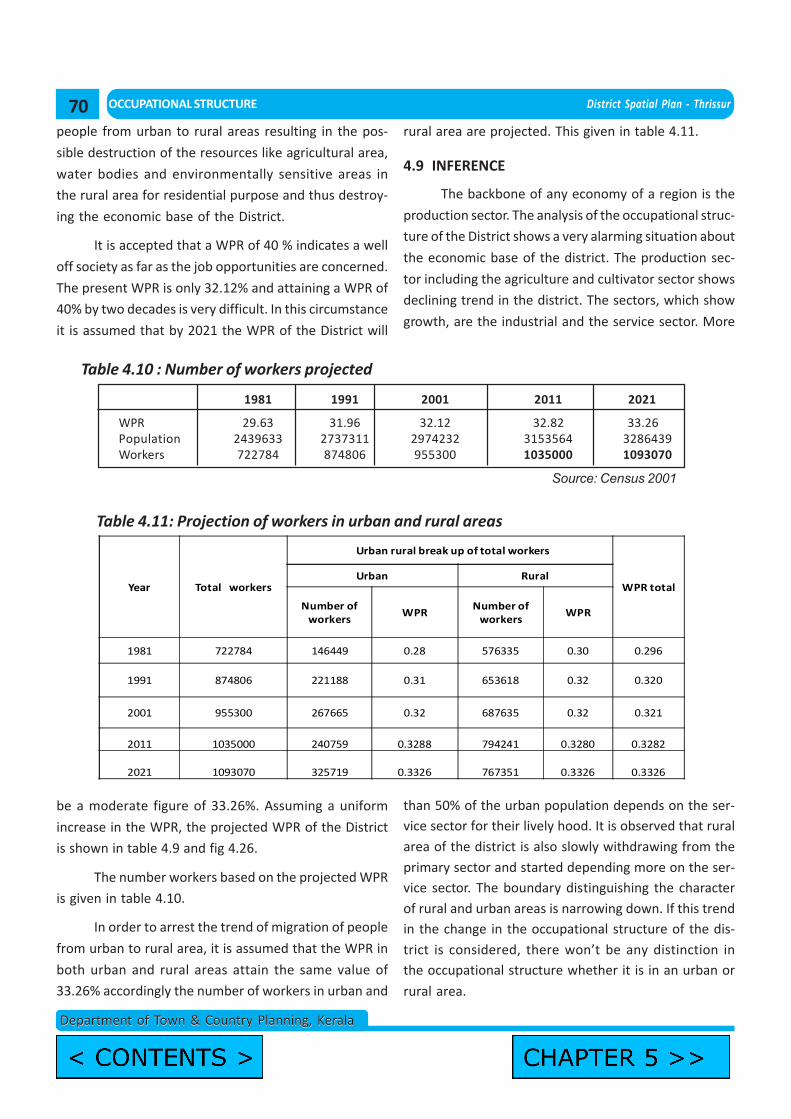
OCCUPATIONAL STRUCTURE District Spatial Plan - Thrissur
Department of Town & Country Planning, KeralaDepartment of Town & Country Planning, Kerala
people from urban to rural areas resulting in the pos-
sible destruction of the resources like agricultural area,
water bodies and environmentally sensitive areas in
the rural area for residential purpose and thus destroy-
ing the economic base of the District.
It is accepted that a WPR of 40 % indicates a well
off society as far as the job opportunities are concerned.
The present WPR is only 32.12% and attaining a WPR of
40% by two decades is very difficult. In this circumstance
it is assumed that by 2021 the WPR of the District will
Table 4.10 : Number of workers projected
1981 1991 2001 2011 2021
WPR 29.63 31.96 32.12 32.82 33.26Population 2439633 2737311 2974232 3153564 3286439Workers 722784 874806 955300 1035000 1093070
Source: Census 2001
Table 4.11: Projection of workers in urban and rural areas
be a moderate figure of 33.26%. Assuming a uniform
increase in the WPR, the projected WPR of the District
is shown in table 4.9 and fig 4.26.
The number workers based on the projected WPR
is given in table 4.10.
In order to arrest the trend of migration of people
from urban to rural area, it is assumed that the WPR in
both urban and rural areas attain the same value of
33.26% accordingly the number of workers in urban and
rural area are projected. This given in table 4.11.
4.9 INFERENCE
The backbone of any economy of a region is the
production sector. The analysis of the occupational struc-
ture of the District shows a very alarming situation about
the economic base of the district. The production sec-
tor including the agriculture and cultivator sector shows
declining trend in the district. The sectors, which show
growth, are the industrial and the service sector. More
than 50% of the urban population depends on the ser-vice sector for their lively hood. It is observed that ruralarea of the district is also slowly withdrawing from theprimary sector and started depending more on the ser-vice sector. The boundary distinguishing the characterof rural and urban areas is narrowing down. If this trendin the change in the occupational structure of the dis-trict is considered, there won’t be any distinction inthe occupational structure whether it is in an urban or
rural area.
Year Total workers
Urban rural break up of total workers
WPR totalUrban Rural
Number of workers
WPRNumber of
workersWPR
1981 722784 146449 0.28 576335 0.30 0.296
1991 874806 221188 0.31 653618 0.32 0.320
2001 955300 267665 0.32 687635 0.32 0.321
2011 1035000 240759 0.3288 794241 0.3280 0.3282
2021 1093070 325719 0.3326 767351 0.3326 0.3326
70
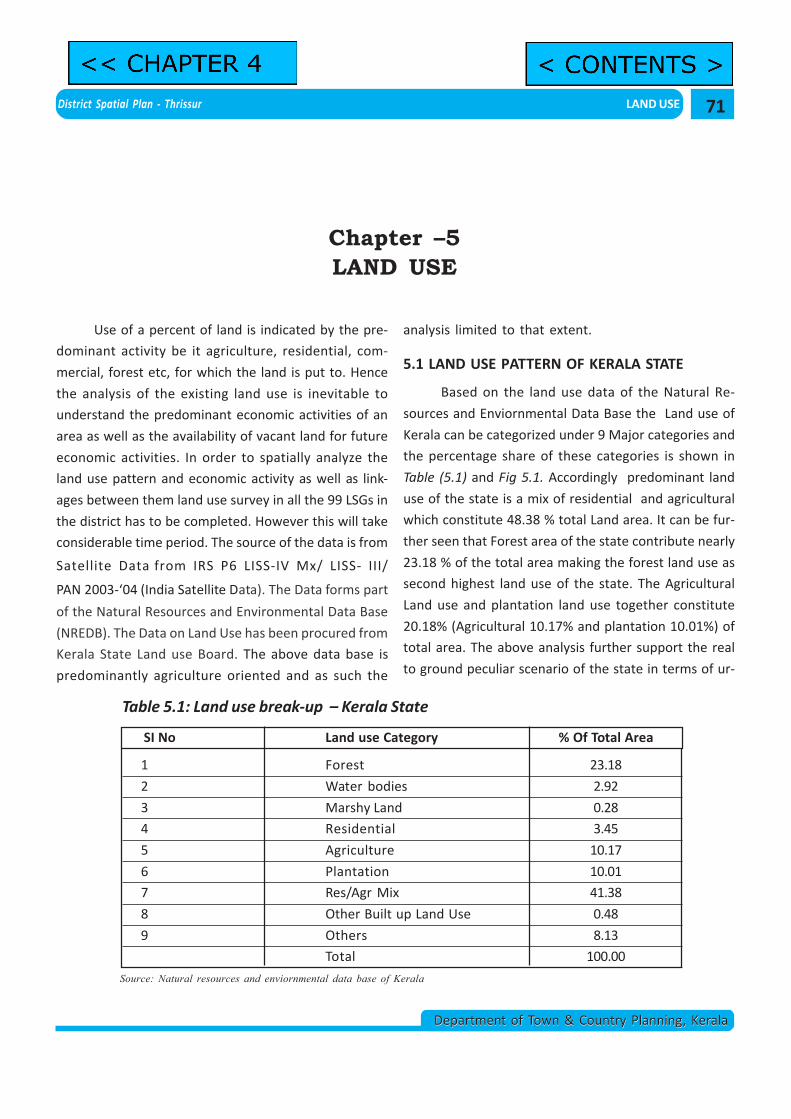
District Spatial Plan - Thrissur LAND USE
Department of Town & Country Planning, KeralaDepartment of Town & Country Planning, Kerala
Use of a percent of land is indicated by the pre-
dominant activity be it agriculture, residential, com-
mercial, forest etc, for which the land is put to. Hence
the analysis of the existing land use is inevitable to
understand the predominant economic activities of an
area as well as the availability of vacant land for future
economic activities. In order to spatially analyze the
land use pattern and economic activity as well as link-
ages between them land use survey in all the 99 LSGs in
the district has to be completed. However this will take
considerable time period. The source of the data is from
Satellite Data from IRS P6 LISS-IV Mx/ LISS- III/
PAN 2003-‘04 (India Satellite Data). The Data forms part
of the Natural Resources and Environmental Data Base
(NREDB). The Data on Land Use has been procured from
Kerala State Land use Board. The above data base is
predominantly agriculture oriented and as such the
Chapter –5LAND USE
analysis limited to that extent.
5.1 LAND USE PATTERN OF KERALA STATE
Based on the land use data of the Natural Re-
sources and Enviornmental Data Base the Land use of
Kerala can be categorized under 9 Major categories and
the percentage share of these categories is shown in
Table (5.1) and Fig 5.1. Accordingly predominant land
use of the state is a mix of residential and agricultural
which constitute 48.38 % total Land area. It can be fur-
ther seen that Forest area of the state contribute nearly
23.18 % of the total area making the forest land use as
second highest land use of the state. The Agricultural
Land use and plantation land use together constitute
20.18% (Agricultural 10.17% and plantation 10.01%) of
total area. The above analysis further support the real
to ground peculiar scenario of the state in terms of ur-
Table 5.1: Land use break-up – Kerala State
SI No Land use Category % Of Total Area
1 Forest 23.18
2 Water bodies 2.92
3 Marshy Land 0.28
4 Residential 3.45
5 Agriculture 10.17
6 Plantation 10.01
7 Res/Agr Mix 41.38
8 Other Built up Land Use 0.48
9 Others 8.13
Total 100.00
Source: Natural resources and enviornmental data base of Kerala
71
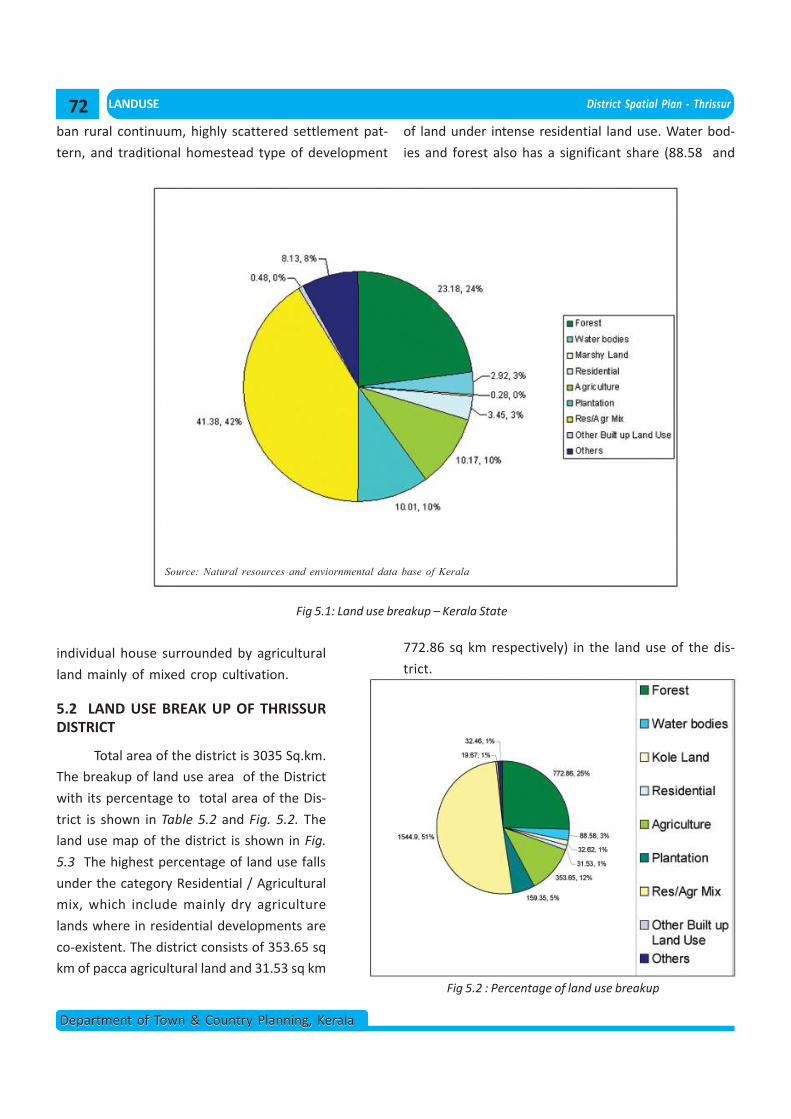
LANDUSE District Spatial Plan - Thrissur
Department of Town & Country Planning, KeralaDepartment of Town & Country Planning, Kerala
ban rural continuum, highly scattered settlement pat-
tern, and traditional homestead type of development
23.18%
8.13%
10.01%
10.17%
41.38x
Source: Natural resources and enviornmental data base of Kerala
Fig 5.1: Land use breakup – Kerala State
individual house surrounded by agricultural
land mainly of mixed crop cultivation.
5.2 LAND USE BREAK UP OF THRISSURDISTRICT
Total area of the district is 3035 Sq.km.
The breakup of land use area of the District
with its percentage to total area of the Dis-
trict is shown in Table 5.2 and Fig. 5.2. The
land use map of the district is shown in Fig.
5.3 The highest percentage of land use falls
under the category Residential / Agricultural
mix, which include mainly dry agriculture
lands where in residential developments are
co-existent. The district consists of 353.65 sq
km of pacca agricultural land and 31.53 sq kmFig 5.2 : Percentage of land use breakup
of land under intense residential land use. Water bod-
ies and forest also has a significant share (88.58 and
772.86 sq km respectively) in the land use of the dis-
trict.
72
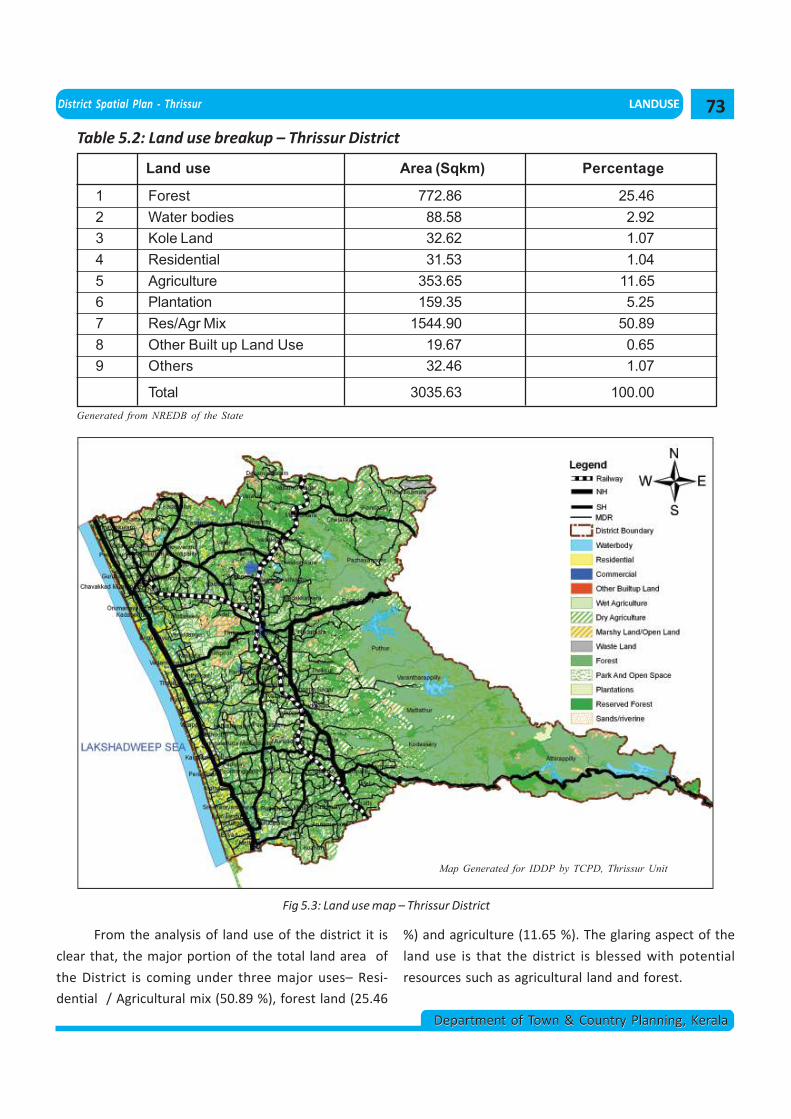
District Spatial Plan - Thrissur LANDUSE
Department of Town & Country Planning, KeralaDepartment of Town & Country Planning, Kerala
Table 5.2: Land use breakup – Thrissur District
SI No. Land use Area (Sqkm) Percentage
1 Forest 772.86 25.462 Water bodies 88.58 2.923 Kole Land 32.62 1.074 Residential 31.53 1.045 Agriculture 353.65 11.656 Plantation 159.35 5.257 Res/Agr Mix 1544.90 50.898 Other Built up Land Use 19.67 0.659 Others 32.46 1.07
Total 3035.63 100.00Generated from NREDB of the State
Fig 5.3: Land use map – Thrissur District
From the analysis of land use of the district it is
clear that, the major portion of the total land area of
the District is coming under three major uses– Resi-
dential / Agricultural mix (50.89 %), forest land (25.46
Map Generated for IDDP by TCPD, Thrissur Unit
%) and agriculture (11.65 %). The glaring aspect of the
land use is that the district is blessed with potential
resources such as agricultural land and forest.
73
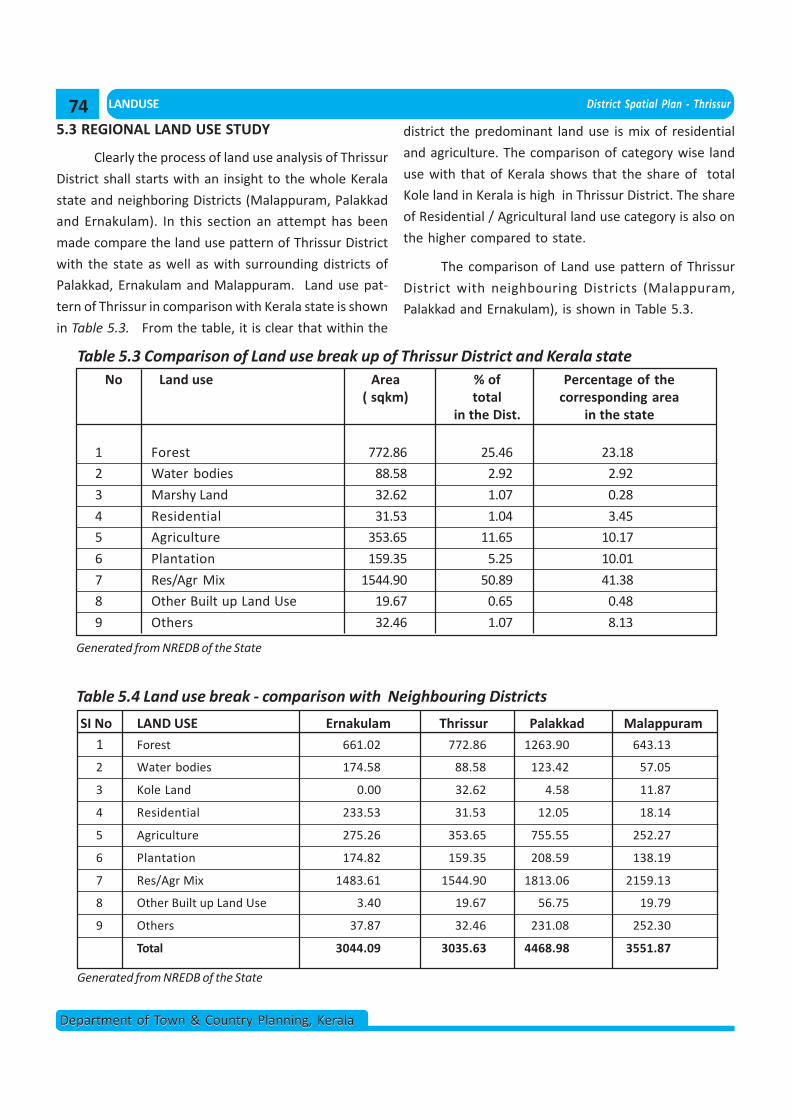
LANDUSE District Spatial Plan - Thrissur
Department of Town & Country Planning, KeralaDepartment of Town & Country Planning, Kerala
5.3 REGIONAL LAND USE STUDY
Clearly the process of land use analysis of Thrissur
District shall starts with an insight to the whole Kerala
state and neighboring Districts (Malappuram, Palakkad
and Ernakulam). In this section an attempt has been
made compare the land use pattern of Thrissur District
with the state as well as with surrounding districts of
Palakkad, Ernakulam and Malappuram. Land use pat-
tern of Thrissur in comparison with Kerala state is shown
in Table 5.3. From the table, it is clear that within the
SI No Land use Area % of Percentage of the( sqkm) total corresponding area
in the Dist. in the state
1 Forest 772.86 25.46 23.18
2 Water bodies 88.58 2.92 2.92
3 Marshy Land 32.62 1.07 0.28
4 Residential 31.53 1.04 3.45
5 Agriculture 353.65 11.65 10.17
6 Plantation 159.35 5.25 10.01
7 Res/Agr Mix 1544.90 50.89 41.38
8 Other Built up Land Use 19.67 0.65 0.48
9 Others 32.46 1.07 8.13
Table 5.4 Land use break - comparison with Neighbouring Districts
Generated from NREDB of the State
SI No LAND USE Ernakulam Thrissur Palakkad Malappuram
1 Forest 661.02 772.86 1263.90 643.13
2 Water bodies 174.58 88.58 123.42 57.05
3 Kole Land 0.00 32.62 4.58 11.87
4 Residential 233.53 31.53 12.05 18.14
5 Agriculture 275.26 353.65 755.55 252.27
6 Plantation 174.82 159.35 208.59 138.19
7 Res/Agr Mix 1483.61 1544.90 1813.06 2159.13
8 Other Built up Land Use 3.40 19.67 56.75 19.79
9 Others 37.87 32.46 231.08 252.30
Total 3044.09 3035.63 4468.98 3551.87
Generated from NREDB of the State
Table 5.3 Comparison of Land use break up of Thrissur District and Kerala state
district the predominant land use is mix of residential
and agriculture. The comparison of category wise land
use with that of Kerala shows that the share of total
Kole land in Kerala is high in Thrissur District. The share
of Residential / Agricultural land use category is also on
the higher compared to state.
The comparison of Land use pattern of Thrissur
District with neighbouring Districts (Malappuram,
Palakkad and Ernakulam), is shown in Table 5.3.
74
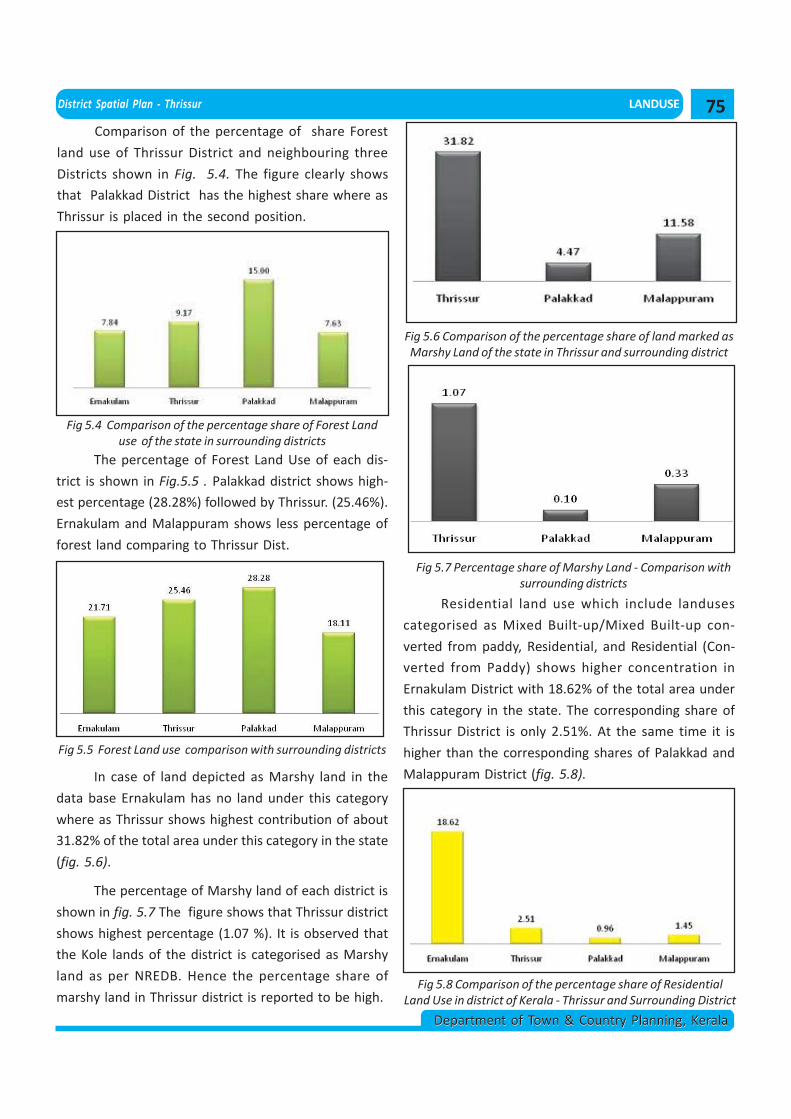
District Spatial Plan - Thrissur LANDUSE
Department of Town & Country Planning, KeralaDepartment of Town & Country Planning, Kerala
Comparison of the percentage of share Forest
land use of Thrissur District and neighbouring three
Districts shown in Fig. 5.4. The figure clearly shows
that Palakkad District has the highest share where as
Thrissur is placed in the second position.
Fig 5.4 Comparison of the percentage share of Forest Landuse of the state in surrounding districts
Fig 5.5 Forest Land use comparison with surrounding districts
The percentage of Forest Land Use of each dis-
trict is shown in Fig.5.5 . Palakkad district shows high-
est percentage (28.28%) followed by Thrissur. (25.46%).
Ernakulam and Malappuram shows less percentage of
forest land comparing to Thrissur Dist.
In case of land depicted as Marshy land in the
data base Ernakulam has no land under this category
where as Thrissur shows highest contribution of about
31.82% of the total area under this category in the state
(fig. 5.6).
The percentage of Marshy land of each district is
shown in fig. 5.7 The figure shows that Thrissur district
shows highest percentage (1.07 %). It is observed that
the Kole lands of the district is categorised as Marshy
land as per NREDB. Hence the percentage share of
marshy land in Thrissur district is reported to be high.
Fig 5.6 Comparison of the percentage share of land marked asMarshy Land of the state in Thrissur and surrounding district
Fig 5.7 Percentage share of Marshy Land - Comparison withsurrounding districts
Residential land use which include landuses
categorised as Mixed Built-up/Mixed Built-up con-
verted from paddy, Residential, and Residential (Con-
verted from Paddy) shows higher concentration in
Ernakulam District with 18.62% of the total area under
this category in the state. The corresponding share of
Thrissur District is only 2.51%. At the same time it is
higher than the corresponding shares of Palakkad and
Malappuram District (fig. 5.8).
Fig 5.8 Comparison of the percentage share of ResidentialLand Use in district of Kerala - Thrissur and Surrounding District
75
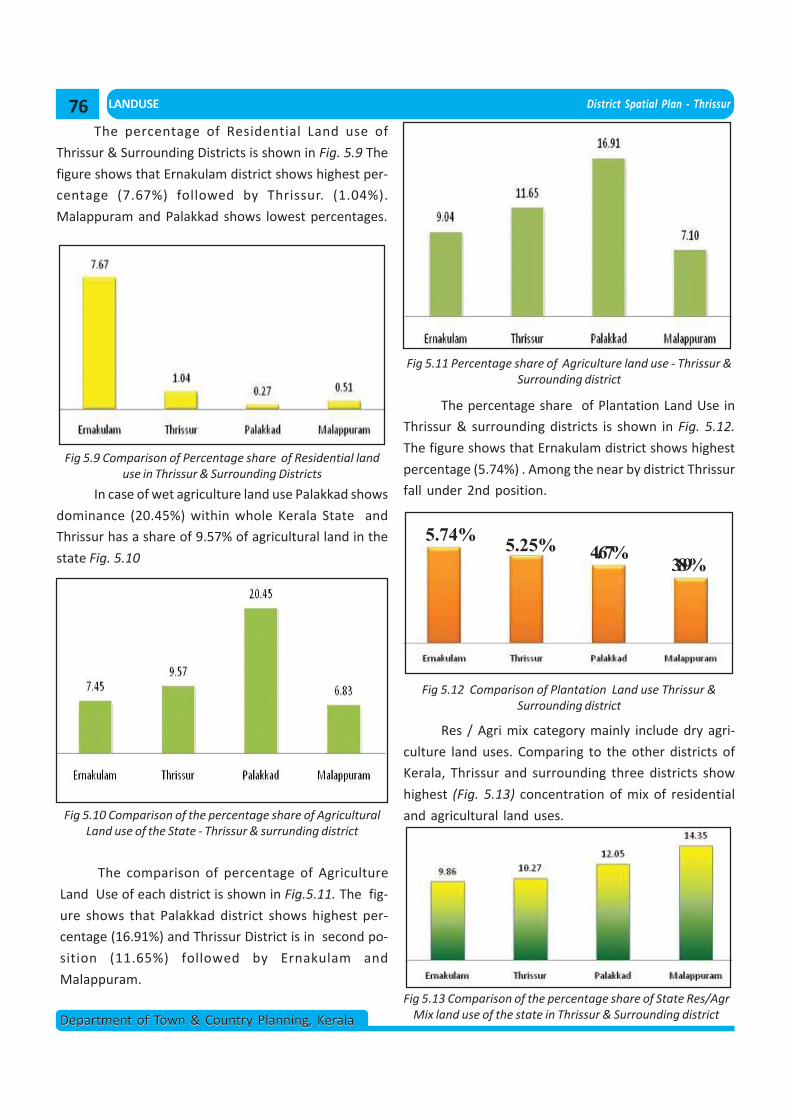
LANDUSE District Spatial Plan - Thrissur
Department of Town & Country Planning, KeralaDepartment of Town & Country Planning, Kerala
Fig 5.9 Comparison of Percentage share of Residential landuse in Thrissur & Surrounding Districts
The percentage of Residential Land use of
Thrissur & Surrounding Districts is shown in Fig. 5.9 The
figure shows that Ernakulam district shows highest per-
centage (7.67%) followed by Thrissur. (1.04%).
Malappuram and Palakkad shows lowest percentages.
In case of wet agriculture land use Palakkad shows
dominance (20.45%) within whole Kerala State and
Thrissur has a share of 9.57% of agricultural land in the
state Fig. 5.10
The comparison of percentage of Agriculture
Land Use of each district is shown in Fig.5.11. The fig-
ure shows that Palakkad district shows highest per-
centage (16.91%) and Thrissur District is in second po-
sition (11.65%) followed by Ernakulam and
Malappuram.
Fig 5.11 Percentage share of Agriculture land use - Thrissur &Surrounding district
Fig 5.10 Comparison of the percentage share of AgriculturalLand use of the State - Thrissur & surrunding district
Res / Agri mix category mainly include dry agri-
culture land uses. Comparing to the other districts of
Kerala, Thrissur and surrounding three districts show
highest (Fig. 5.13) concentration of mix of residential
and agricultural land uses.
Fig 5.13 Comparison of the percentage share of State Res/AgrMix land use of the state in Thrissur & Surrounding district
The percentage share of Plantation Land Use in
Thrissur & surrounding districts is shown in Fig. 5.12.
The figure shows that Ernakulam district shows highest
percentage (5.74%) . Among the near by district Thrissur
fall under 2nd position.
Fig 5.12 Comparison of Plantation Land use Thrissur &Surrounding district
5.74% 5.25% 4.67%3.89%
76
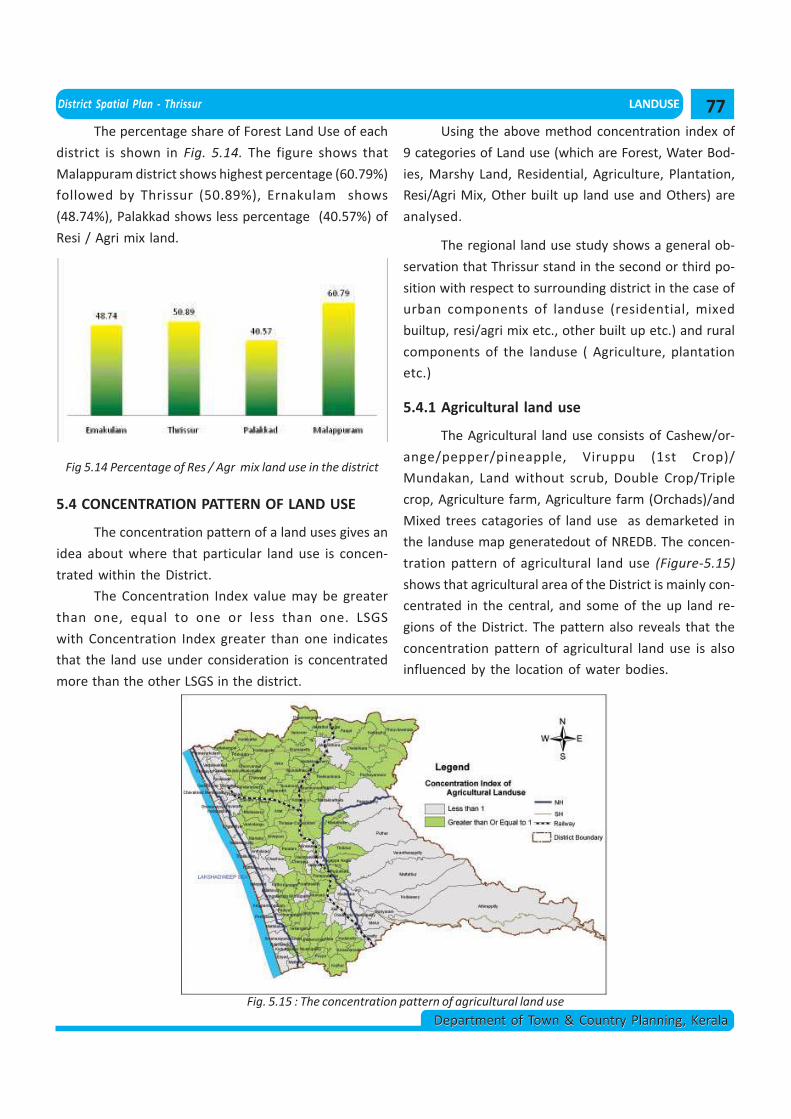
District Spatial Plan - Thrissur LANDUSE
Department of Town & Country Planning, KeralaDepartment of Town & Country Planning, Kerala
The percentage share of Forest Land Use of each
district is shown in Fig. 5.14. The figure shows that
Malappuram district shows highest percentage (60.79%)
followed by Thrissur (50.89%), Ernakulam shows
(48.74%), Palakkad shows less percentage (40.57%) of
Resi / Agri mix land.
Fig 5.14 Percentage of Res / Agr mix land use in the district
5.4 CONCENTRATION PATTERN OF LAND USE
The concentration pattern of a land uses gives an
idea about where that particular land use is concen-
trated within the District.
The Concentration Index value may be greater
than one, equal to one or less than one. LSGS
with Concentration Index greater than one indicates
that the land use under consideration is concentrated
more than the other LSGS in the district.
Using the above method concentration index of
9 categories of Land use (which are Forest, Water Bod-
ies, Marshy Land, Residential, Agriculture, Plantation,
Resi/Agri Mix, Other built up land use and Others) are
analysed.
The regional land use study shows a general ob-
servation that Thrissur stand in the second or third po-
sition with respect to surrounding district in the case of
urban components of landuse (residential, mixed
builtup, resi/agri mix etc., other built up etc.) and rural
components of the landuse ( Agriculture, plantation
etc.)
5.4.1 Agricultural land use
The Agricultural land use consists of Cashew/or-
ange/pepper/pineapple, Viruppu (1st Crop)/
Mundakan, Land without scrub, Double Crop/Triple
crop, Agriculture farm, Agriculture farm (Orchads)/and
Mixed trees catagories of land use as demarketed in
the landuse map generatedout of NREDB. The concen-
tration pattern of agricultural land use (Figure-5.15)
shows that agricultural area of the District is mainly con-
centrated in the central, and some of the up land re-
gions of the District. The pattern also reveals that the
concentration pattern of agricultural land use is also
influenced by the location of water bodies.
Fig. 5.15 : The concentration pattern of agricultural land use
77
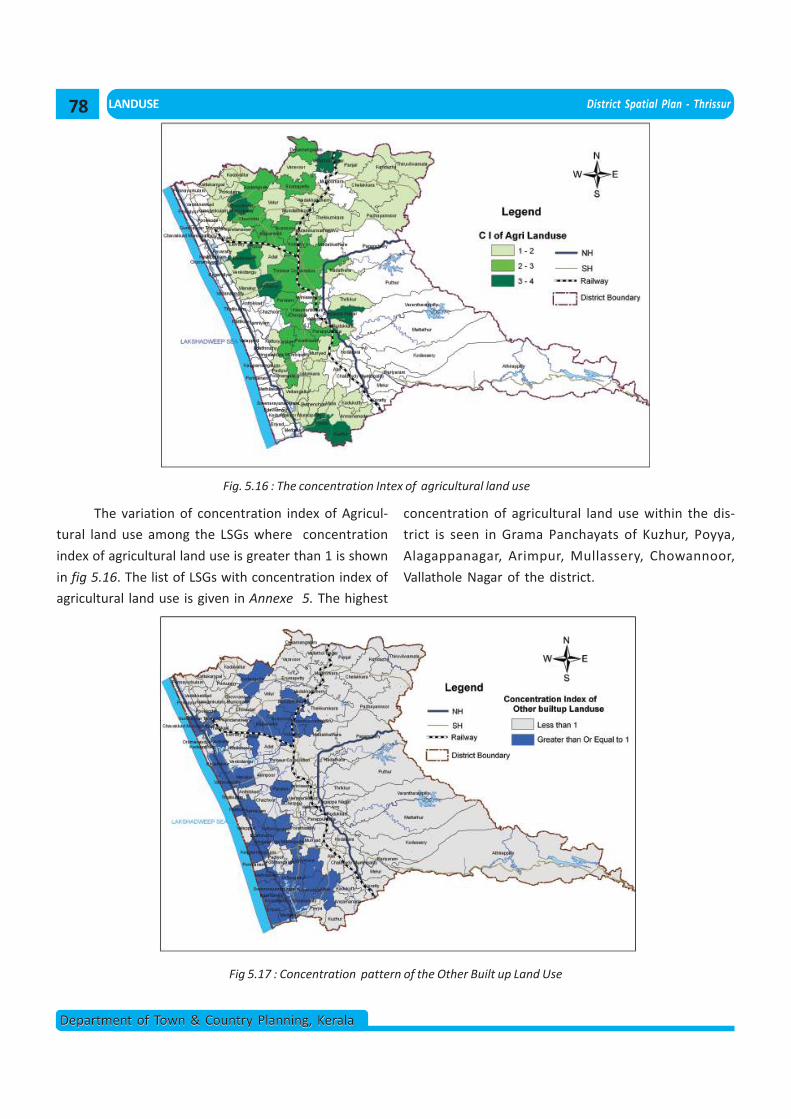
LANDUSE District Spatial Plan - Thrissur
Department of Town & Country Planning, KeralaDepartment of Town & Country Planning, Kerala
Fig. 5.16 : The concentration Intex of agricultural land use
The variation of concentration index of Agricul-
tural land use among the LSGs where concentration
index of agricultural land use is greater than 1 is shown
in fig 5.16. The list of LSGs with concentration index of
agricultural land use is given in Annexe 5. The highest
concentration of agricultural land use within the dis-
trict is seen in Grama Panchayats of Kuzhur, Poyya,
Alagappanagar, Arimpur, Mullassery, Chowannoor,
Vallathole Nagar of the district.
Fig 5.17 : Concentration pattern of the Other Built up Land Use
78
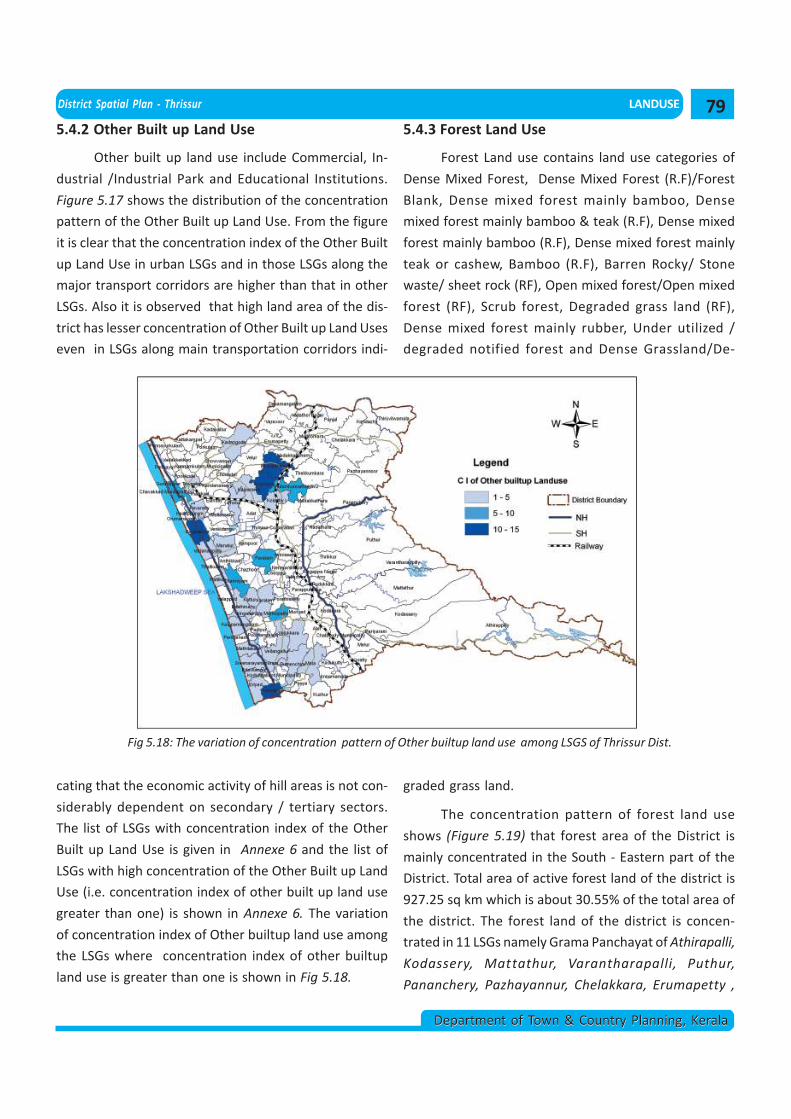
District Spatial Plan - Thrissur LANDUSE
Department of Town & Country Planning, KeralaDepartment of Town & Country Planning, Kerala
5.4.2 Other Built up Land Use
Other built up land use include Commercial, In-
dustrial /Industrial Park and Educational Institutions.
Figure 5.17 shows the distribution of the concentration
pattern of the Other Built up Land Use. From the figure
it is clear that the concentration index of the Other Built
up Land Use in urban LSGs and in those LSGs along the
major transport corridors are higher than that in other
LSGs. Also it is observed that high land area of the dis-
trict has lesser concentration of Other Built up Land Uses
even in LSGs along main transportation corridors indi-
cating that the economic activity of hill areas is not con-
siderably dependent on secondary / tertiary sectors.
The list of LSGs with concentration index of the Other
Built up Land Use is given in Annexe 6 and the list of
LSGs with high concentration of the Other Built up Land
Use (i.e. concentration index of other built up land use
greater than one) is shown in Annexe 6. The variation
of concentration index of Other builtup land use among
the LSGs where concentration index of other builtup
land use is greater than one is shown in Fig 5.18.
Fig 5.18: The variation of concentration pattern of Other builtup land use among LSGS of Thrissur Dist.
5.4.3 Forest Land Use
Forest Land use contains land use categories of
Dense Mixed Forest, Dense Mixed Forest (R.F)/Forest
Blank, Dense mixed forest mainly bamboo, Dense
mixed forest mainly bamboo & teak (R.F), Dense mixed
forest mainly bamboo (R.F), Dense mixed forest mainly
teak or cashew, Bamboo (R.F), Barren Rocky/ Stone
waste/ sheet rock (RF), Open mixed forest/Open mixed
forest (RF), Scrub forest, Degraded grass land (RF),
Dense mixed forest mainly rubber, Under utilized /
degraded notified forest and Dense Grassland/De-
graded grass land.
The concentration pattern of forest land use
shows (Figure 5.19) that forest area of the District is
mainly concentrated in the South - Eastern part of the
District. Total area of active forest land of the district is
927.25 sq km which is about 30.55% of the total area of
the district. The forest land of the district is concen-
trated in 11 LSGs namely Grama Panchayat of Athirapalli,
Kodassery, Mattathur, Varantharapalli, Puthur,
Pananchery, Pazhayannur, Chelakkara, Erumapetty ,
79
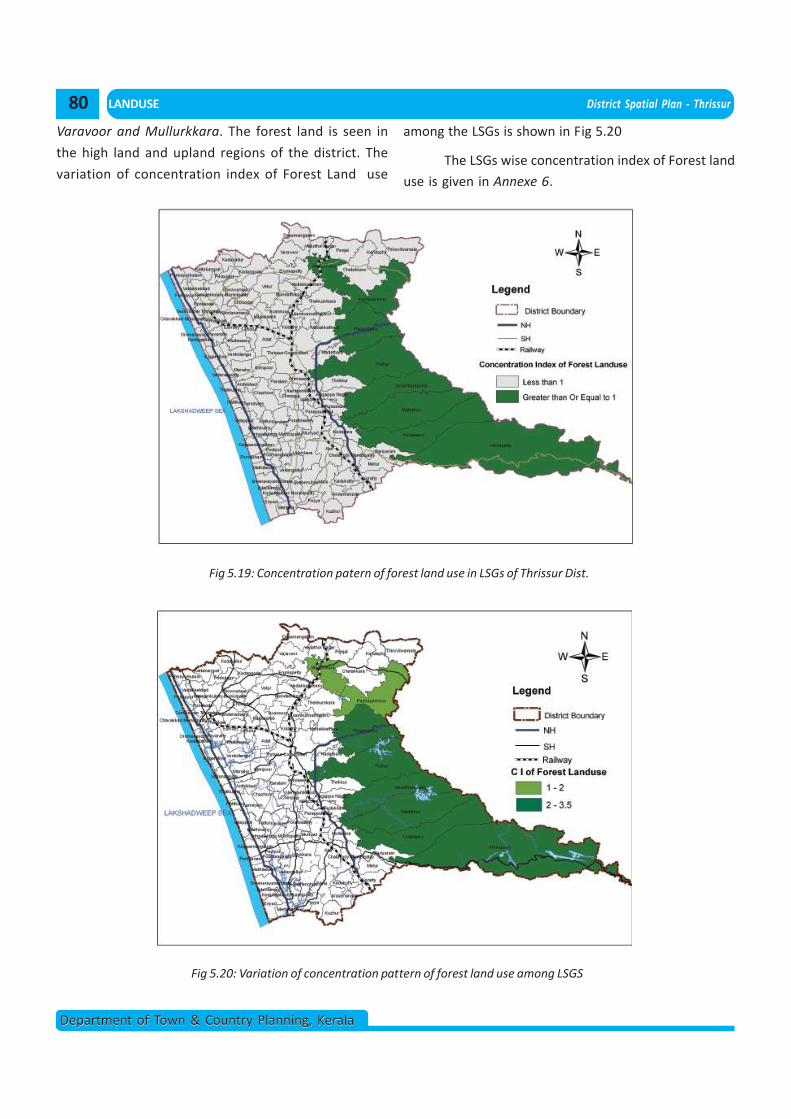
LANDUSE District Spatial Plan - Thrissur
Department of Town & Country Planning, KeralaDepartment of Town & Country Planning, Kerala
Varavoor and Mullurkkara. The forest land is seen in
the high land and upland regions of the district. The
variation of concentration index of Forest Land use
Fig 5.19: Concentration patern of forest land use in LSGs of Thrissur Dist.
among the LSGs is shown in Fig 5.20
The LSGs wise concentration index of Forest land
use is given in Annexe 6.
Fig 5.20: Variation of concentration pattern of forest land use among LSGS
80
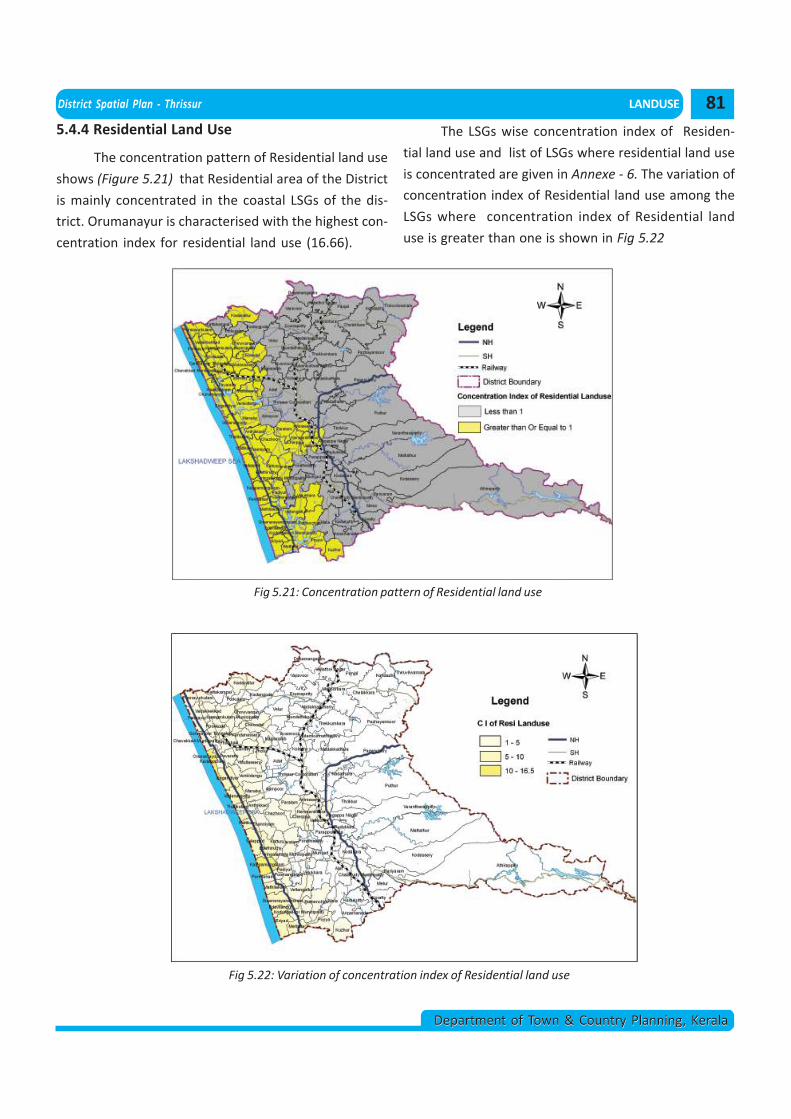
District Spatial Plan - Thrissur LANDUSE
Department of Town & Country Planning, KeralaDepartment of Town & Country Planning, Kerala
Fig 5.22: Variation of concentration index of Residential land use
Fig 5.21: Concentration pattern of Residential land use
5.4.4 Residential Land Use
The concentration pattern of Residential land use
shows (Figure 5.21) that Residential area of the District
is mainly concentrated in the coastal LSGs of the dis-
trict. Orumanayur is characterised with the highest con-
centration index for residential land use (16.66).
The LSGs wise concentration index of Residen-
tial land use and list of LSGs where residential land use
is concentrated are given in Annexe - 6. The variation of
concentration index of Residential land use among the
LSGs where concentration index of Residential land
use is greater than one is shown in Fig 5.22
81
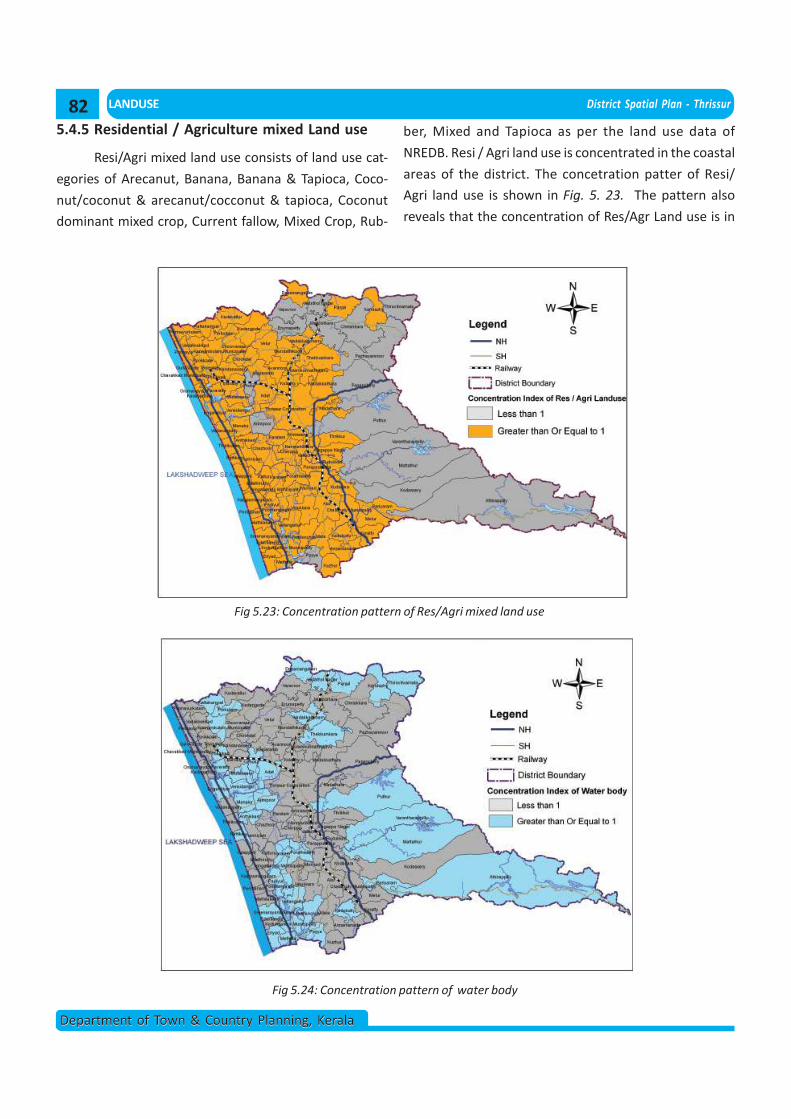
LANDUSE District Spatial Plan - Thrissur
Department of Town & Country Planning, KeralaDepartment of Town & Country Planning, Kerala
5.4.5 Residential / Agriculture mixed Land use
Resi/Agri mixed land use consists of land use cat-
egories of Arecanut, Banana, Banana & Tapioca, Coco-
nut/coconut & arecanut/cocconut & tapioca, Coconut
dominant mixed crop, Current fallow, Mixed Crop, Rub-
Fig 5.23: Concentration pattern of Res/Agri mixed land use
ber, Mixed and Tapioca as per the land use data of
NREDB. Resi / Agri land use is concentrated in the coastal
areas of the district. The concetration patter of Resi/
Agri land use is shown in Fig. 5. 23. The pattern also
reveals that the concentration of Res/Agr Land use is in
Fig 5.24: Concentration pattern of water body
82
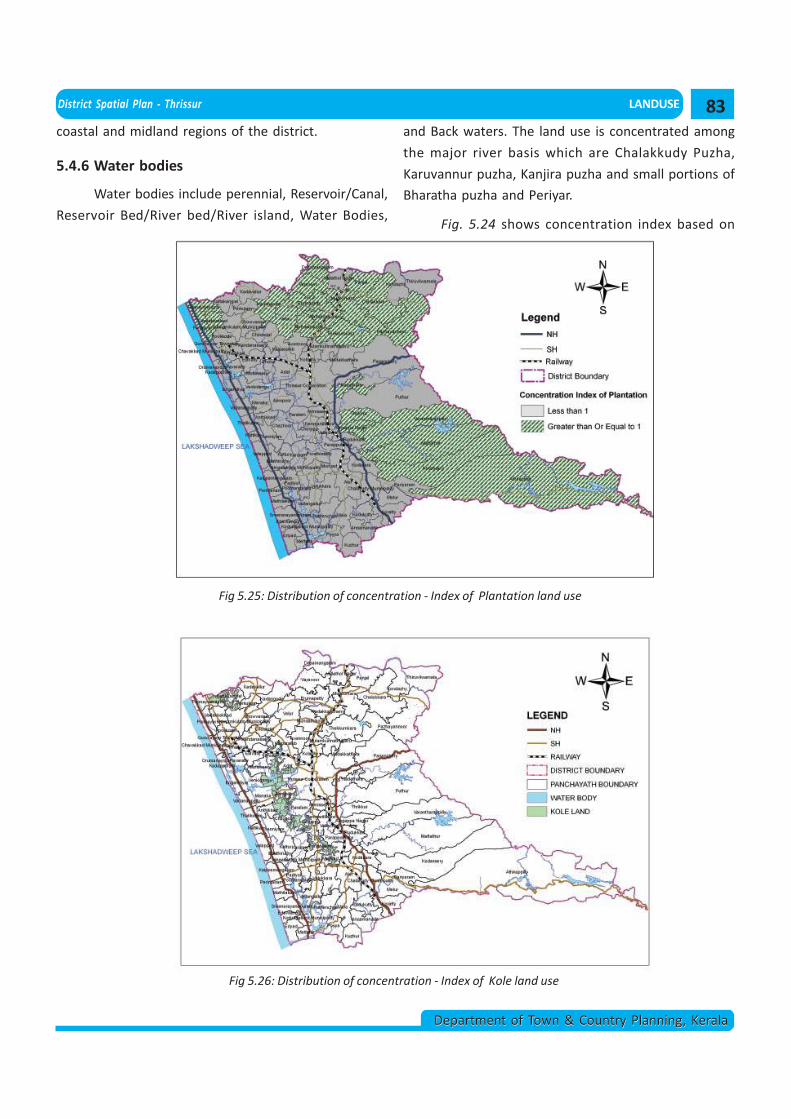
District Spatial Plan - Thrissur LANDUSE
Department of Town & Country Planning, KeralaDepartment of Town & Country Planning, Kerala
coastal and midland regions of the district.
5.4.6 Water bodies
Water bodies include perennial, Reservoir/Canal,
Reservoir Bed/River bed/River island, Water Bodies,
and Back waters. The land use is concentrated among
the major river basis which are Chalakkudy Puzha,
Karuvannur puzha, Kanjira puzha and small portions of
Bharatha puzha and Periyar.
Fig. 5.24 shows concentration index based on
Fig 5.25: Distribution of concentration - Index of Plantation land use
Fig 5.26: Distribution of concentration - Index of Kole land use
83
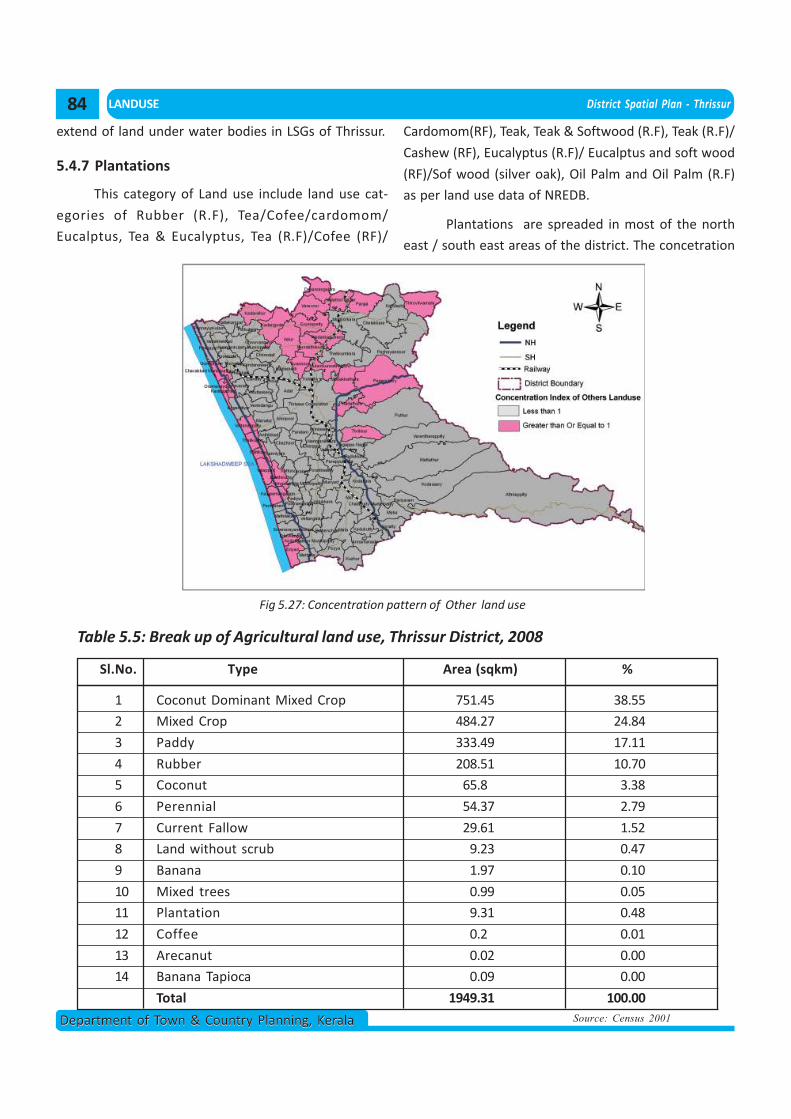
LANDUSE District Spatial Plan - Thrissur
Department of Town & Country Planning, KeralaDepartment of Town & Country Planning, Kerala
extend of land under water bodies in LSGs of Thrissur.
5.4.7 Plantations
This category of Land use include land use cat-
egories of Rubber (R.F), Tea/Cofee/cardomom/
Eucalptus, Tea & Eucalyptus, Tea (R.F)/Cofee (RF)/
Fig 5.27: Concentration pattern of Other land use
Cardomom(RF), Teak, Teak & Softwood (R.F), Teak (R.F)/
Cashew (RF), Eucalyptus (R.F)/ Eucalptus and soft wood
(RF)/Sof wood (silver oak), Oil Palm and Oil Palm (R.F)
as per land use data of NREDB.
Plantations are spreaded in most of the north
east / south east areas of the district. The concetration
Table 5.5: Break up of Agricultural land use, Thrissur District, 2008
1 Coconut Dominant Mixed Crop 751.45 38.55
2 Mixed Crop 484.27 24.84
3 Paddy 333.49 17.11
4 Rubber 208.51 10.70
5 Coconut 65.8 3.38
6 Perennial 54.37 2.79
7 Current Fallow 29.61 1.52
8 Land without scrub 9.23 0.47
9 Banana 1.97 0.10
10 Mixed trees 0.99 0.05
11 Plantation 9.31 0.48
12 Coffee 0.2 0.01
13 Arecanut 0.02 0.00
14 Banana Tapioca 0.09 0.00
Total 1949.31 100.00
Sl.No. Type Area (sqkm) %
Source: Census 2001
84
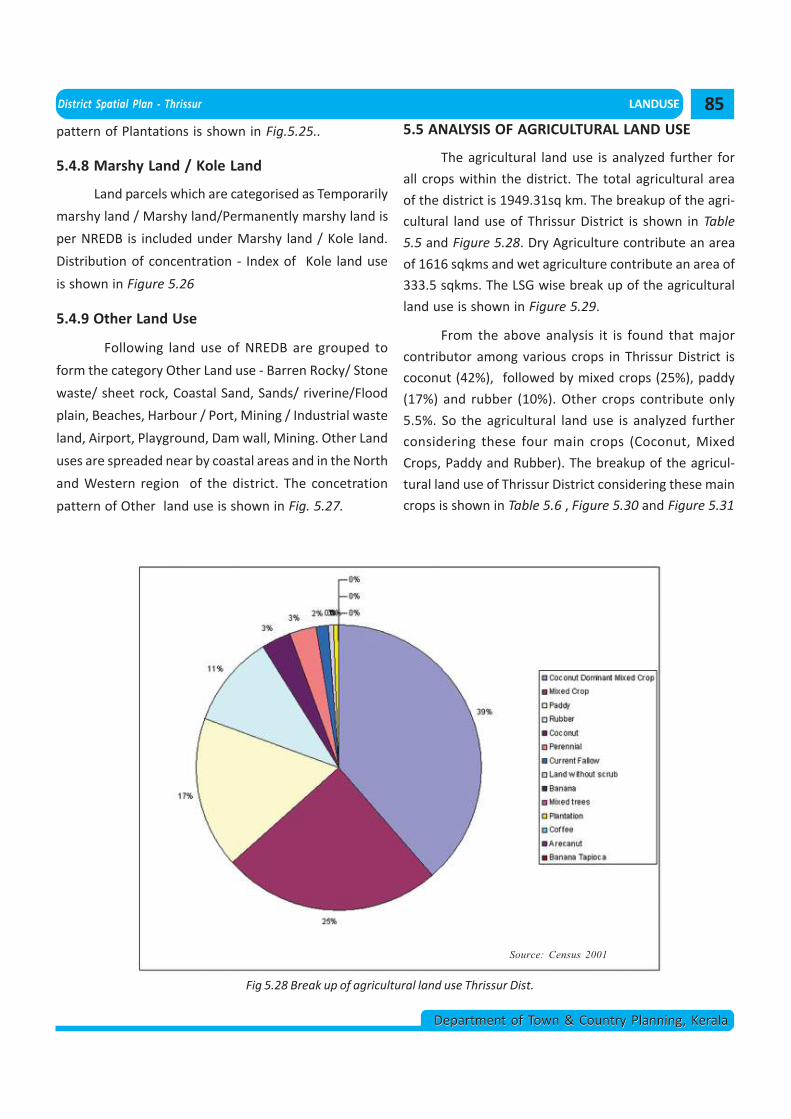
District Spatial Plan - Thrissur LANDUSE
Department of Town & Country Planning, KeralaDepartment of Town & Country Planning, Kerala
pattern of Plantations is shown in Fig.5.25..
5.4.8 Marshy Land / Kole Land
Land parcels which are categorised as Temporarily
marshy land / Marshy land/Permanently marshy land is
per NREDB is included under Marshy land / Kole land.
Distribution of concentration - Index of Kole land use
is shown in Figure 5.26
5.4.9 Other Land Use
Following land use of NREDB are grouped to
form the category Other Land use - Barren Rocky/ Stone
waste/ sheet rock, Coastal Sand, Sands/ riverine/Flood
plain, Beaches, Harbour / Port, Mining / Industrial waste
land, Airport, Playground, Dam wall, Mining. Other Land
uses are spreaded near by coastal areas and in the North
and Western region of the district. The concetration
pattern of Other land use is shown in Fig. 5.27.
Source: Census 2001
Fig 5.28 Break up of agricultural land use Thrissur Dist.
5.5 ANALYSIS OF AGRICULTURAL LAND USE
The agricultural land use is analyzed further for
all crops within the district. The total agricultural area
of the district is 1949.31sq km. The breakup of the agri-
cultural land use of Thrissur District is shown in Table
5.5 and Figure 5.28. Dry Agriculture contribute an area
of 1616 sqkms and wet agriculture contribute an area of
333.5 sqkms. The LSG wise break up of the agricultural
land use is shown in Figure 5.29.
From the above analysis it is found that major
contributor among various crops in Thrissur District is
coconut (42%), followed by mixed crops (25%), paddy
(17%) and rubber (10%). Other crops contribute only
5.5%. So the agricultural land use is analyzed further
considering these four main crops (Coconut, Mixed
Crops, Paddy and Rubber). The breakup of the agricul-
tural land use of Thrissur District considering these main
crops is shown in Table 5.6 , Figure 5.30 and Figure 5.31
85
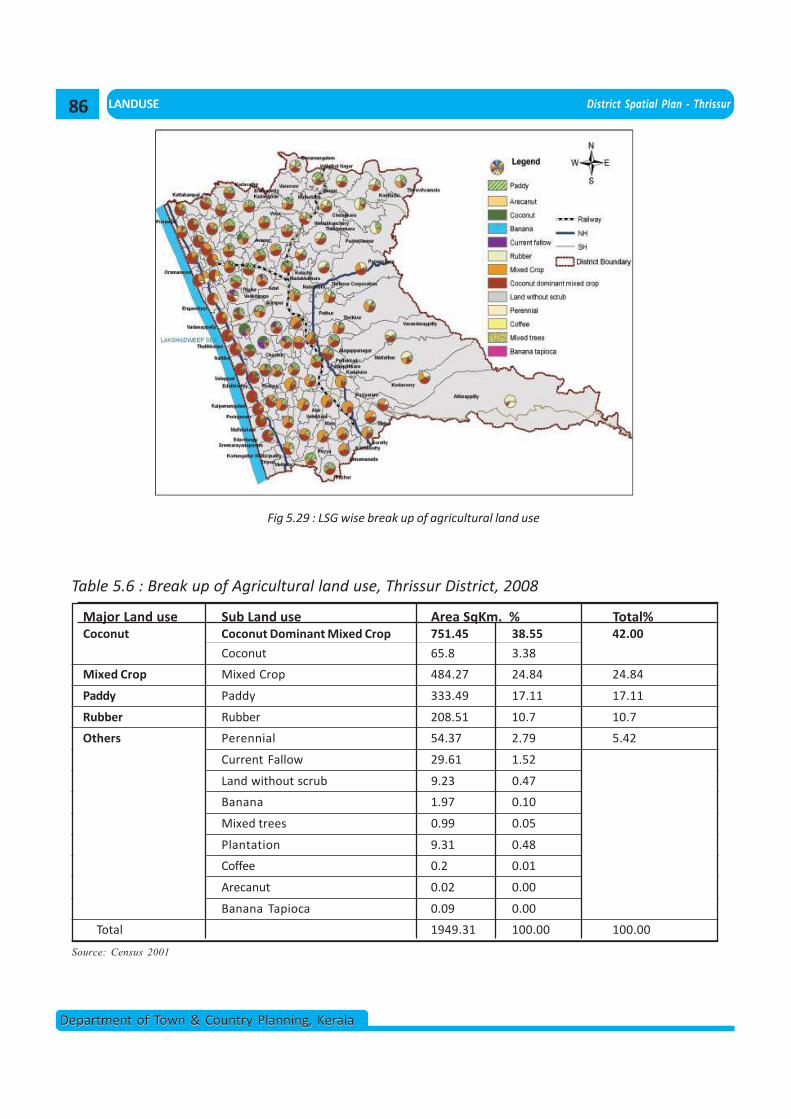
LANDUSE District Spatial Plan - Thrissur
Department of Town & Country Planning, KeralaDepartment of Town & Country Planning, Kerala
Fig 5.29 : LSG wise break up of agricultural land use
Table 5.6 : Break up of Agricultural land use, Thrissur District, 2008
Major Land use Sub Land use Area SqKm. % Total% Coconut Coconut Dominant Mixed Crop 751.45 38.55 42.00
Coconut 65.8 3.38
Mixed Crop Mixed Crop 484.27 24.84 24.84
Paddy Paddy 333.49 17.11 17.11
Rubber Rubber 208.51 10.7 10.7
Others Perennial 54.37 2.79 5.42
Current Fallow 29.61 1.52
Land without scrub 9.23 0.47
Banana 1.97 0.10
Mixed trees 0.99 0.05
Plantation 9.31 0.48
Coffee 0.2 0.01
Arecanut 0.02 0.00
Banana Tapioca 0.09 0.00
Total 1949.31 100.00 100.00
Source: Census 2001
86
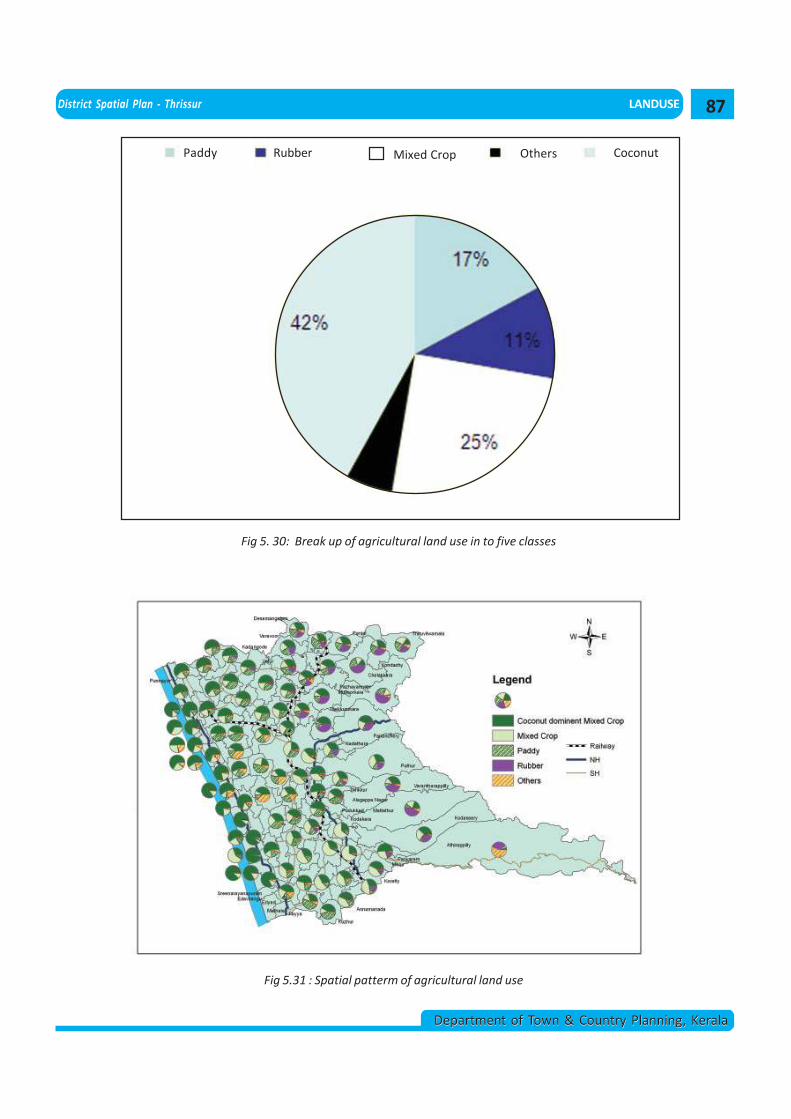
District Spatial Plan - Thrissur LANDUSE
Department of Town & Country Planning, KeralaDepartment of Town & Country Planning, Kerala
5%
Fig 5. 30: Break up of agricultural land use in to five classes
Fig 5.31 : Spatial patterm of agricultural land use
Paddy Rubber Mixed Crop Others Coconut
87
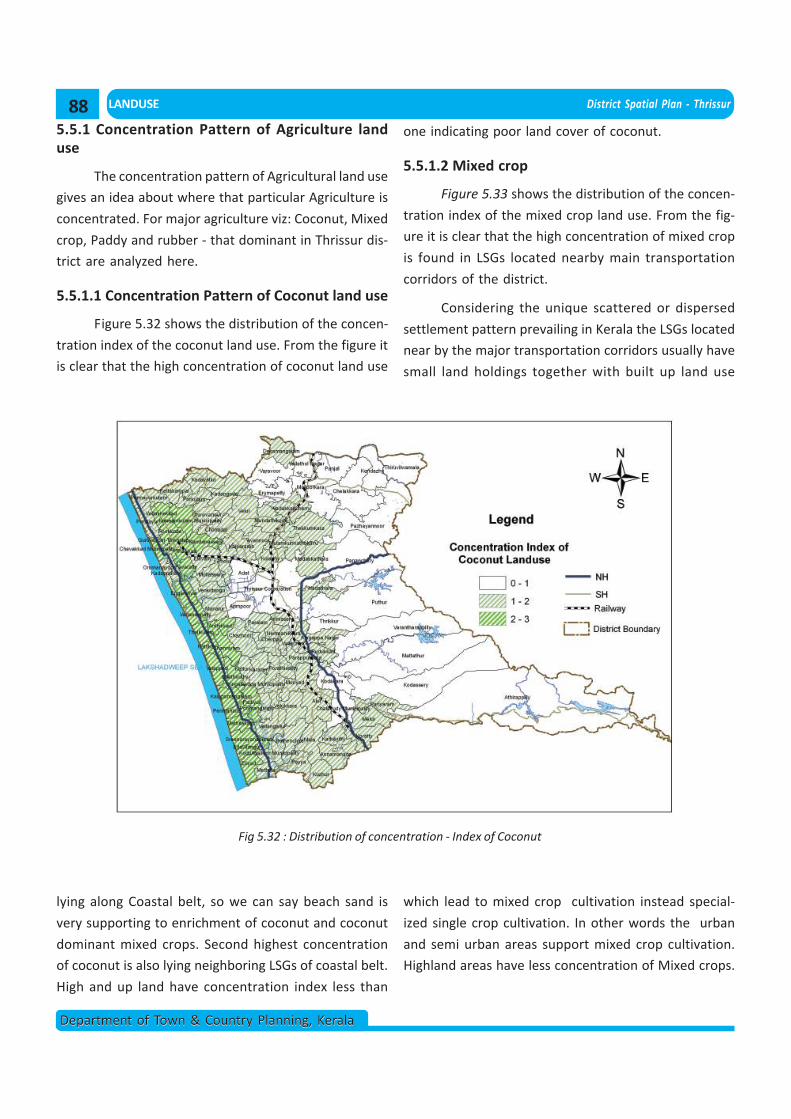
LANDUSE District Spatial Plan - Thrissur
Department of Town & Country Planning, KeralaDepartment of Town & Country Planning, Kerala
5.5.1 Concentration Pattern of Agriculture landuse
The concentration pattern of Agricultural land use
gives an idea about where that particular Agriculture is
concentrated. For major agriculture viz: Coconut, Mixed
crop, Paddy and rubber - that dominant in Thrissur dis-
trict are analyzed here.
5.5.1.1 Concentration Pattern of Coconut land use
Figure 5.32 shows the distribution of the concen-
tration index of the coconut land use. From the figure it
is clear that the high concentration of coconut land use
Fig 5.32 : Distribution of concentration - Index of Coconut
lying along Coastal belt, so we can say beach sand is
very supporting to enrichment of coconut and coconut
dominant mixed crops. Second highest concentration
of coconut is also lying neighboring LSGs of coastal belt.
High and up land have concentration index less than
one indicating poor land cover of coconut.
5.5.1.2 Mixed crop
Figure 5.33 shows the distribution of the concen-
tration index of the mixed crop land use. From the fig-
ure it is clear that the high concentration of mixed crop
is found in LSGs located nearby main transportation
corridors of the district.
Considering the unique scattered or dispersed
settlement pattern prevailing in Kerala the LSGs located
near by the major transportation corridors usually have
small land holdings together with built up land use
which lead to mixed crop cultivation instead special-
ized single crop cultivation. In other words the urban
and semi urban areas support mixed crop cultivation.
Highland areas have less concentration of Mixed crops.
88
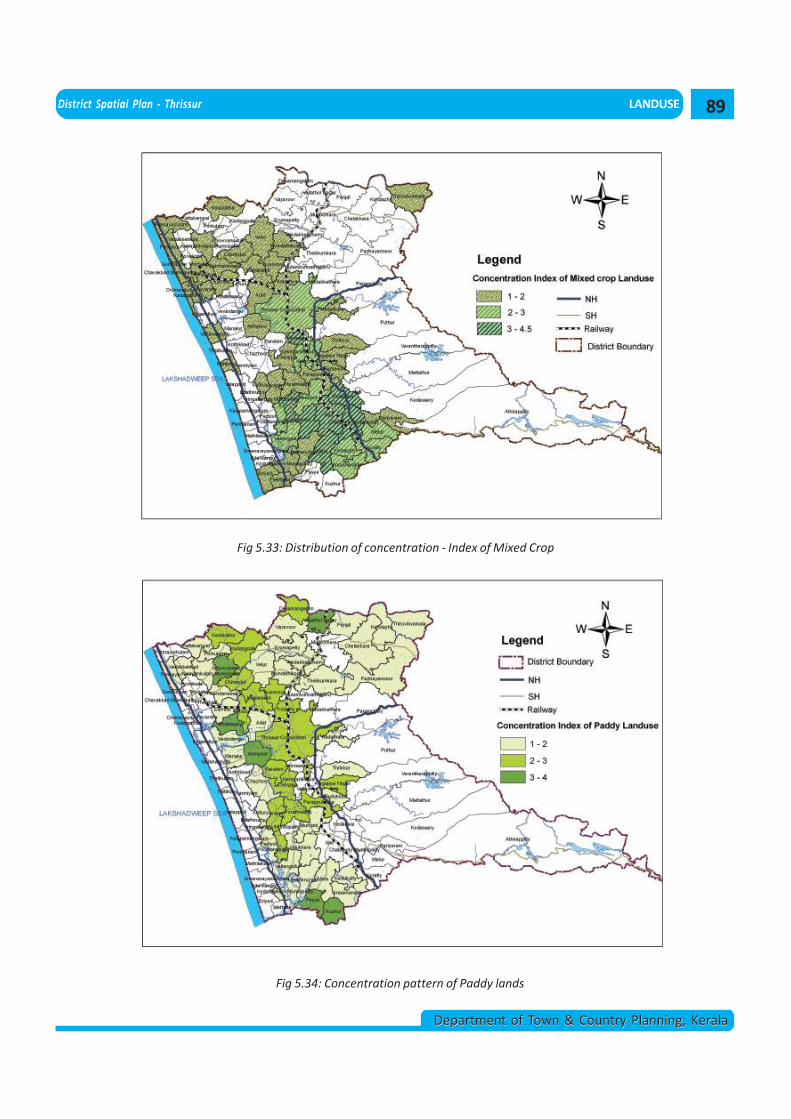
District Spatial Plan - Thrissur LANDUSE
Department of Town & Country Planning, KeralaDepartment of Town & Country Planning, Kerala
Fig 5.33: Distribution of concentration - Index of Mixed Crop
Fig 5.34: Concentration pattern of Paddy lands
89
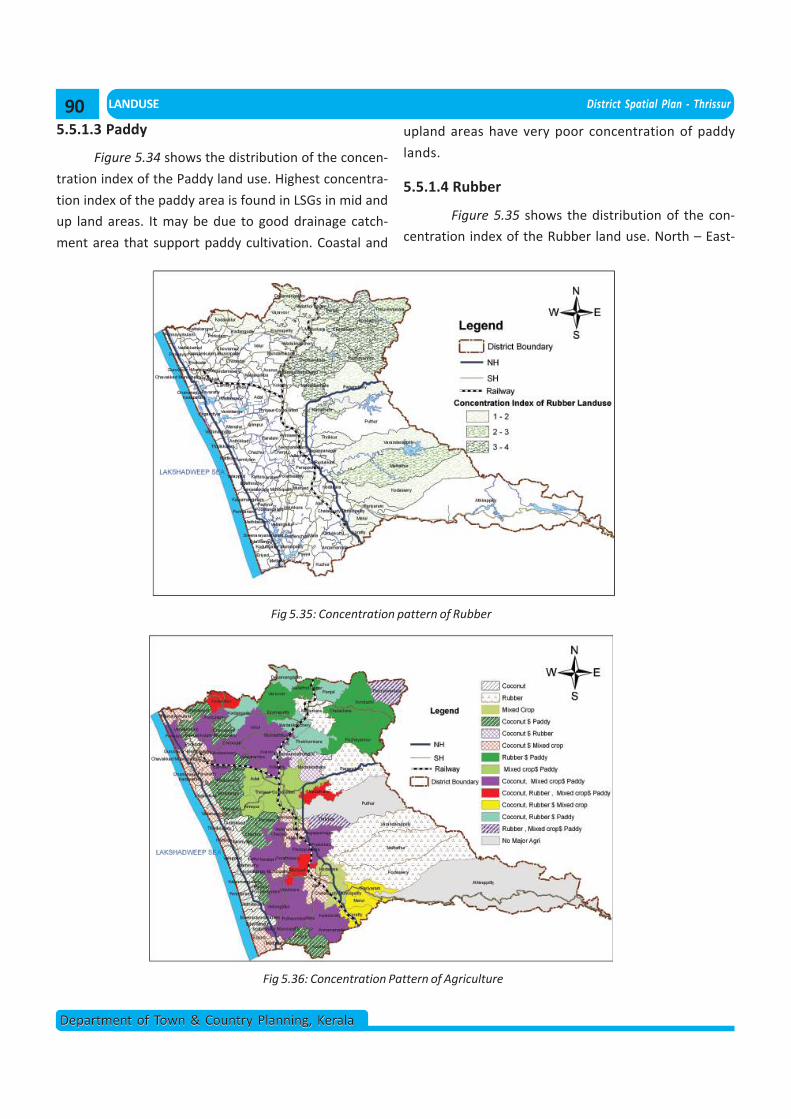
LANDUSE District Spatial Plan - Thrissur
Department of Town & Country Planning, KeralaDepartment of Town & Country Planning, Kerala
5.5.1.3 Paddy
Figure 5.34 shows the distribution of the concen-
tration index of the Paddy land use. Highest concentra-
tion index of the paddy area is found in LSGs in mid and
up land areas. It may be due to good drainage catch-
ment area that support paddy cultivation. Coastal and
upland areas have very poor concentration of paddy
lands.
5.5.1.4 Rubber
Figure 5.35 shows the distribution of the con-
centration index of the Rubber land use. North – East-
Fig 5.35: Concentration pattern of Rubber
Fig 5.36: Concentration Pattern of Agriculture
90
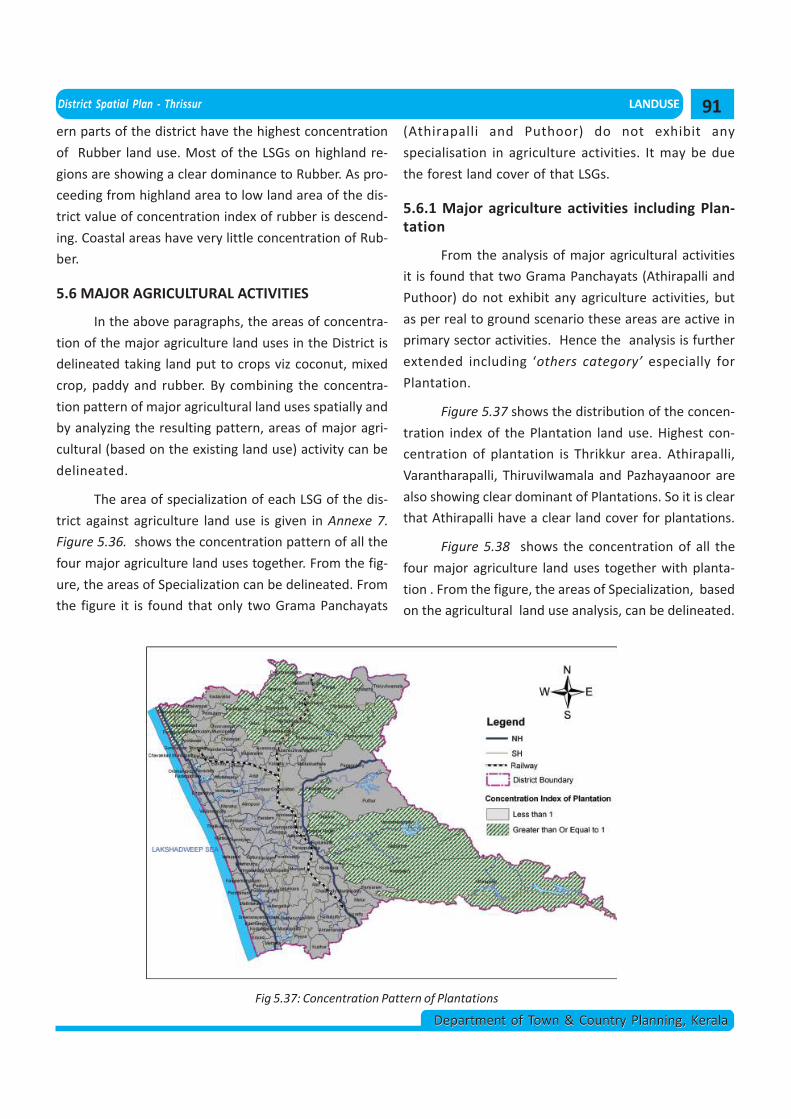
District Spatial Plan - Thrissur LANDUSE
Department of Town & Country Planning, KeralaDepartment of Town & Country Planning, Kerala
ern parts of the district have the highest concentration
of Rubber land use. Most of the LSGs on highland re-
gions are showing a clear dominance to Rubber. As pro-
ceeding from highland area to low land area of the dis-
trict value of concentration index of rubber is descend-
ing. Coastal areas have very little concentration of Rub-
ber.
5.6 MAJOR AGRICULTURAL ACTIVITIES
In the above paragraphs, the areas of concentra-
tion of the major agriculture land uses in the District is
delineated taking land put to crops viz coconut, mixed
crop, paddy and rubber. By combining the concentra-
tion pattern of major agricultural land uses spatially and
by analyzing the resulting pattern, areas of major agri-
cultural (based on the existing land use) activity can be
delineated.
The area of specialization of each LSG of the dis-
trict against agriculture land use is given in Annexe 7.
Figure 5.36. shows the concentration pattern of all the
four major agriculture land uses together. From the fig-
ure, the areas of Specialization can be delineated. From
the figure it is found that only two Grama Panchayats
(Athirapalli and Puthoor) do not exhibit any
specialisation in agriculture activities. It may be due
the forest land cover of that LSGs.
5.6.1 Major agriculture activities including Plan-tation
From the analysis of major agricultural activities
it is found that two Grama Panchayats (Athirapalli and
Puthoor) do not exhibit any agriculture activities, but
as per real to ground scenario these areas are active in
primary sector activities. Hence the analysis is further
extended including ‘others category’ especially for
Plantation.
Figure 5.37 shows the distribution of the concen-
tration index of the Plantation land use. Highest con-
centration of plantation is Thrikkur area. Athirapalli,
Varantharapalli, Thiruvilwamala and Pazhayaanoor are
also showing clear dominant of Plantations. So it is clear
that Athirapalli have a clear land cover for plantations.
Figure 5.38 shows the concentration of all the
four major agriculture land uses together with planta-
tion . From the figure, the areas of Specialization, based
on the agricultural land use analysis, can be delineated.
Fig 5.37: Concentration Pattern of Plantations
91
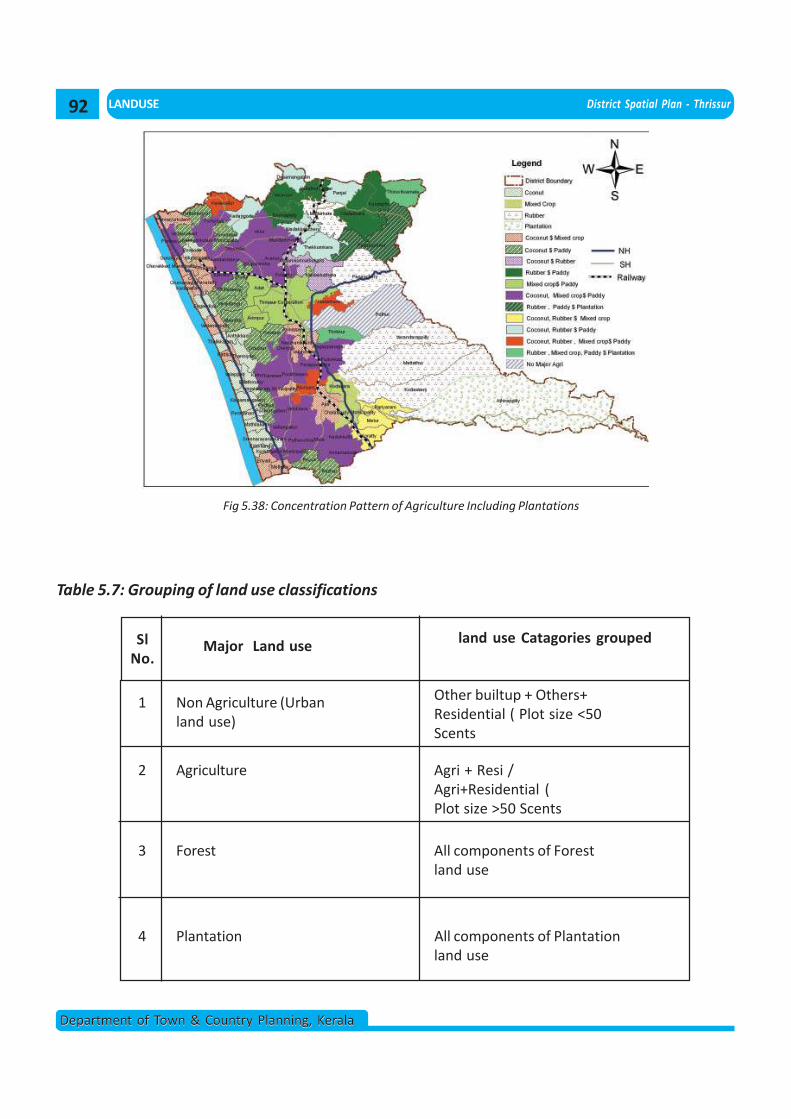
LANDUSE District Spatial Plan - Thrissur
Department of Town & Country Planning, KeralaDepartment of Town & Country Planning, Kerala
Fig 5.38: Concentration Pattern of Agriculture Including Plantations
land use Catagories groupedMajor Land use
Non Agriculture (Urbanland use)
Other builtup + Others+Residential ( Plot size <50Scents
Agriculture Agri + Resi /Agri+Residential (Plot size >50 Scents
Forest All components of Forestland use
Plantation All components of Plantationland use
Table 5.7: Grouping of land use classifications
SlNo.
1
2
3
4
92
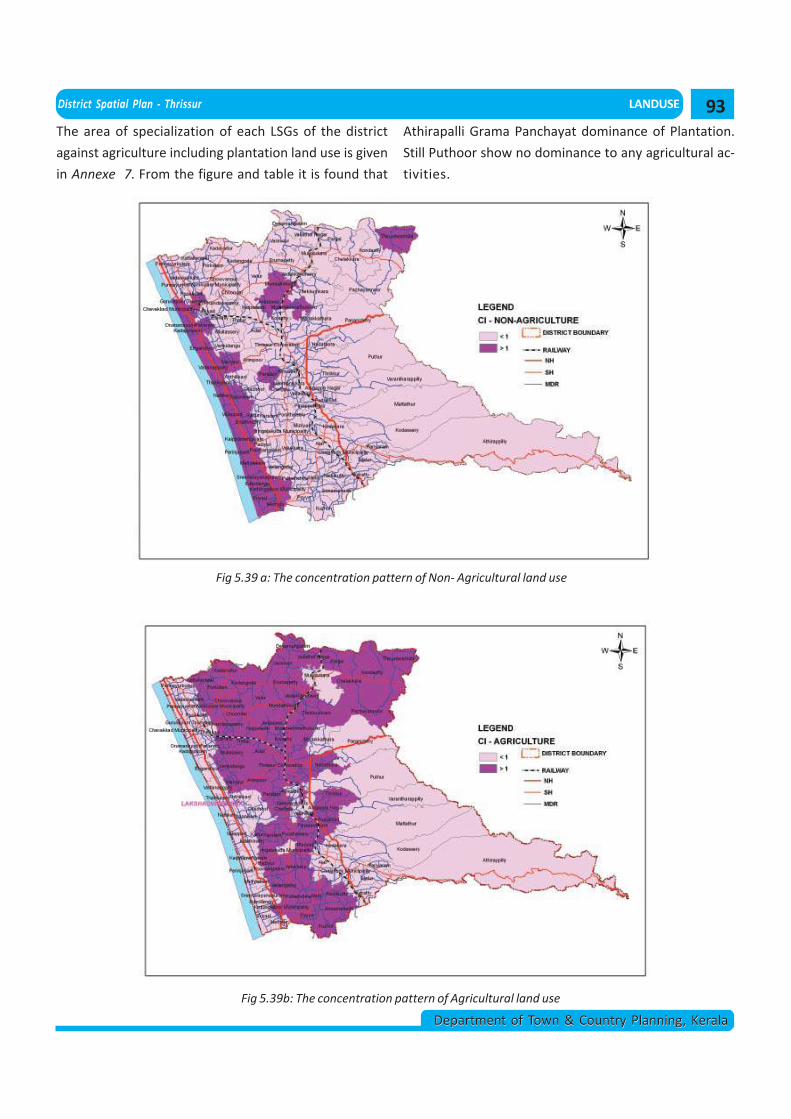
District Spatial Plan - Thrissur LANDUSE
Department of Town & Country Planning, KeralaDepartment of Town & Country Planning, Kerala
The area of specialization of each LSGs of the district
against agriculture including plantation land use is given
in Annexe 7. From the figure and table it is found that
Athirapalli Grama Panchayat dominance of Plantation.
Still Puthoor show no dominance to any agricultural ac-
tivities.
Fig 5.39 a: The concentration pattern of Non- Agricultural land use
Fig 5.39b: The concentration pattern of Agricultural land use
93
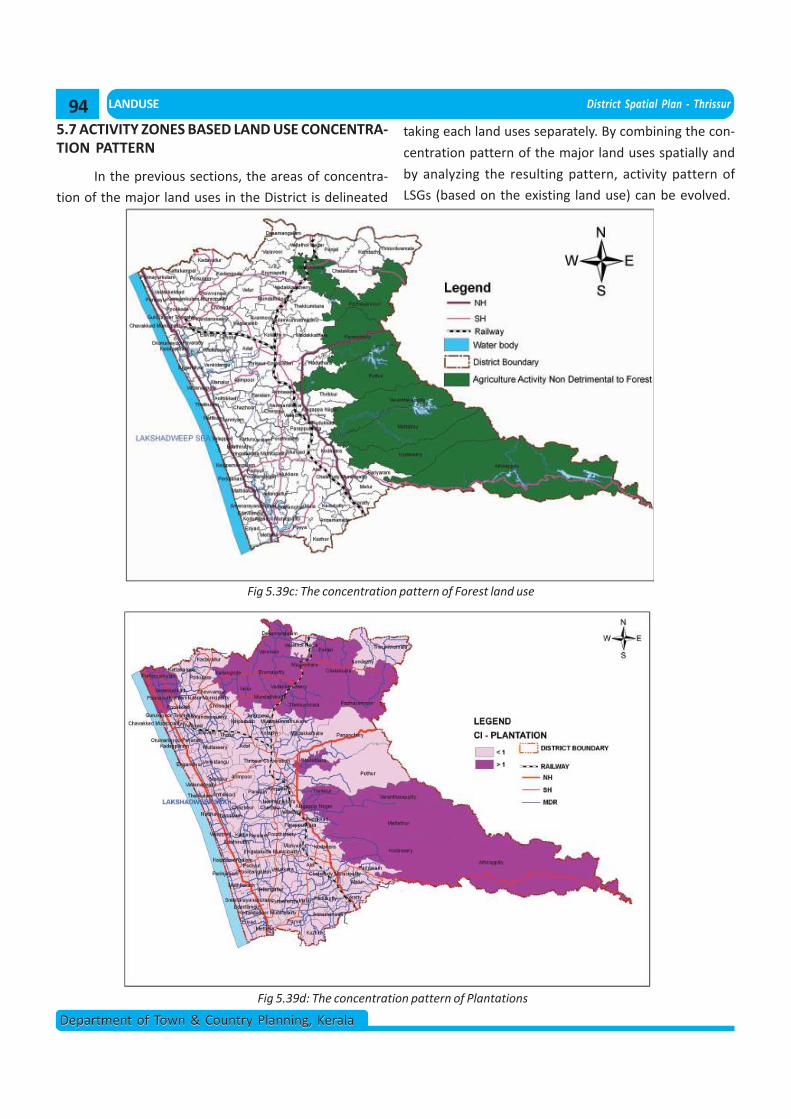
LANDUSE District Spatial Plan - Thrissur
Department of Town & Country Planning, KeralaDepartment of Town & Country Planning, Kerala
5.7 ACTIVITY ZONES BASED LAND USE CONCENTRA-TION PATTERN
In the previous sections, the areas of concentra-
tion of the major land uses in the District is delineated
Fig 5.39c: The concentration pattern of Forest land use
taking each land uses separately. By combining the con-
centration pattern of the major land uses spatially and
by analyzing the resulting pattern, activity pattern of
LSGs (based on the existing land use) can be evolved.
Fig 5.39d: The concentration pattern of Plantations
94
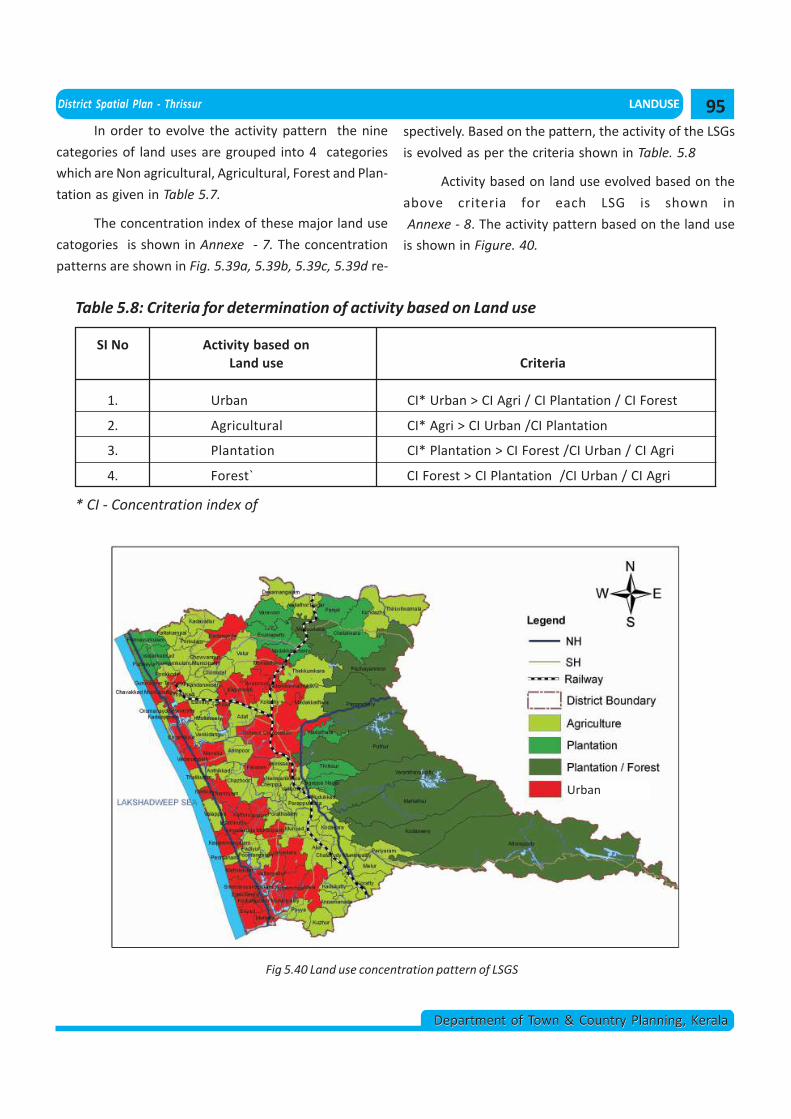
District Spatial Plan - Thrissur LANDUSE
Department of Town & Country Planning, KeralaDepartment of Town & Country Planning, Kerala
In order to evolve the activity pattern the nine
categories of land uses are grouped into 4 categories
which are Non agricultural, Agricultural, Forest and Plan-
tation as given in Table 5.7.
The concentration index of these major land use
catogories is shown in Annexe - 7. The concentration
patterns are shown in Fig. 5.39a, 5.39b, 5.39c, 5.39d re-
spectively. Based on the pattern, the activity of the LSGs
is evolved as per the criteria shown in Table. 5.8
Activity based on land use evolved based on the
above criteria for each LSG is shown in
Annexe - 8. The activity pattern based on the land use
is shown in Figure. 40.
SI No Activity based onLand use Criteria
1. Urban CI* Urban > CI Agri / CI Plantation / CI Forest
2. Agricultural CI* Agri > CI Urban /CI Plantation
3. Plantation CI* Plantation > CI Forest /CI Urban / CI Agri
4. Forest` CI Forest > CI Plantation /CI Urban / CI Agri
Table 5.8: Criteria for determination of activity based on Land use
* CI - Concentration index of
Fig 5.40 Land use concentration pattern of LSGS
Urban
95
LANDUSE District Spatial Plan - Thrissur
Department of Town & Country Planning, KeralaDepartment of Town & Country Planning, Kerala
The analysis of land use concentration pattern
shows that most of the plantation / forest activities are
concentrated on the highland region of the district. The
urban activity is found to be mainly concentrated in
coastal regions and along the major transportation cor-
ridors. The agricultural activities are predominantly con-
centrated in the midland region of the district.
5.8 INFERENCE
From the above details we can conclude that the
whole District can be divided into four Activity zones
namely Agricultural, Non-Agricultural/Urban, Planta-
tion, Plantation/Forest. The analysis of land use con-
centration pattern shows that most of the plantation /
forest activities are concentrated on the highland re-
gion of the district. The urban activity is found to be
mainly concentrated in coastal regions and along the
major transportation corridors. The agricultural activi-
ties are predominantly concentrated in the midland
region of the district.
96
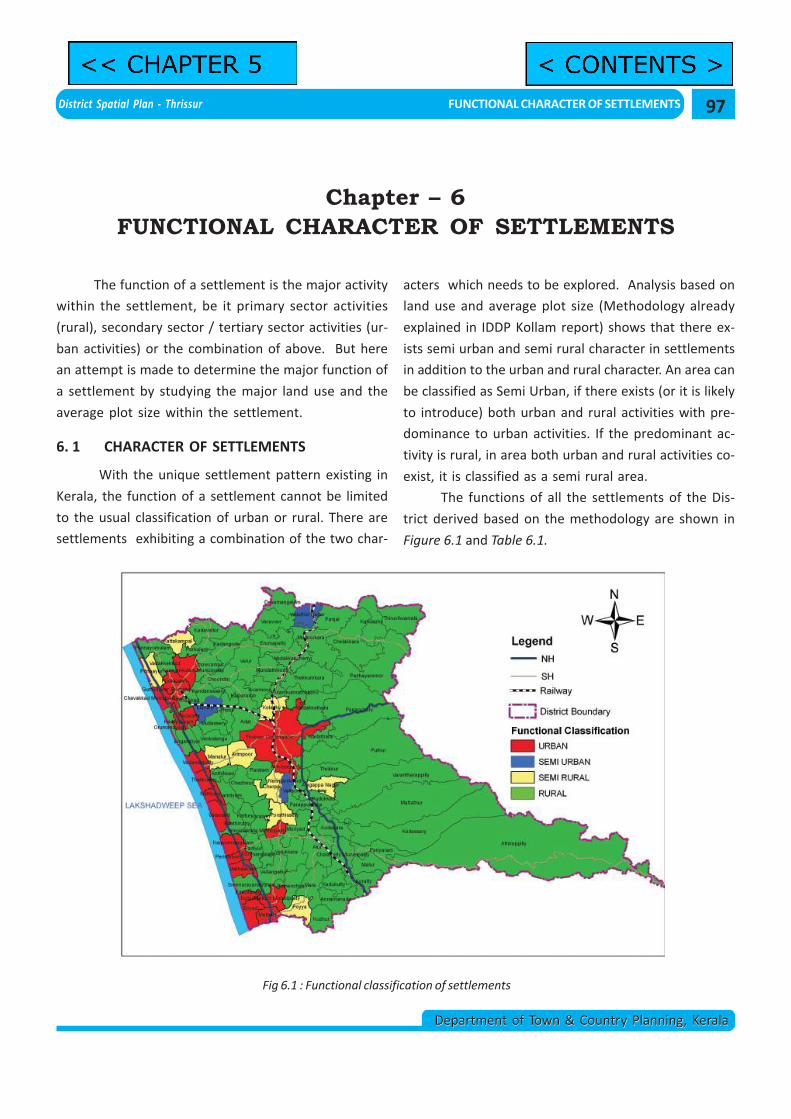
District Spatial Plan - Thrissur FUNCTIONAL CHARACTER OF SETTLEMENTS
Department of Town & Country Planning, KeralaDepartment of Town & Country Planning, Kerala
The function of a settlement is the major activity
within the settlement, be it primary sector activities
(rural), secondary sector / tertiary sector activities (ur-
ban activities) or the combination of above. But here
an attempt is made to determine the major function of
a settlement by studying the major land use and the
average plot size within the settlement.
6. 1 CHARACTER OF SETTLEMENTS
With the unique settlement pattern existing in
Kerala, the function of a settlement cannot be limited
to the usual classification of urban or rural. There are
settlements exhibiting a combination of the two char-
Chapter – 6FUNCTIONAL CHARACTER OF SETTLEMENTS
Fig 6.1 : Functional classification of settlements
acters which needs to be explored. Analysis based on
land use and average plot size (Methodology already
explained in IDDP Kollam report) shows that there ex-
ists semi urban and semi rural character in settlements
in addition to the urban and rural character. An area can
be classified as Semi Urban, if there exists (or it is likely
to introduce) both urban and rural activities with pre-
dominance to urban activities. If the predominant ac-
tivity is rural, in area both urban and rural activities co-
exist, it is classified as a semi rural area.
The functions of all the settlements of the Dis-
trict derived based on the methodology are shown in
Figure 6.1 and Table 6.1.
97
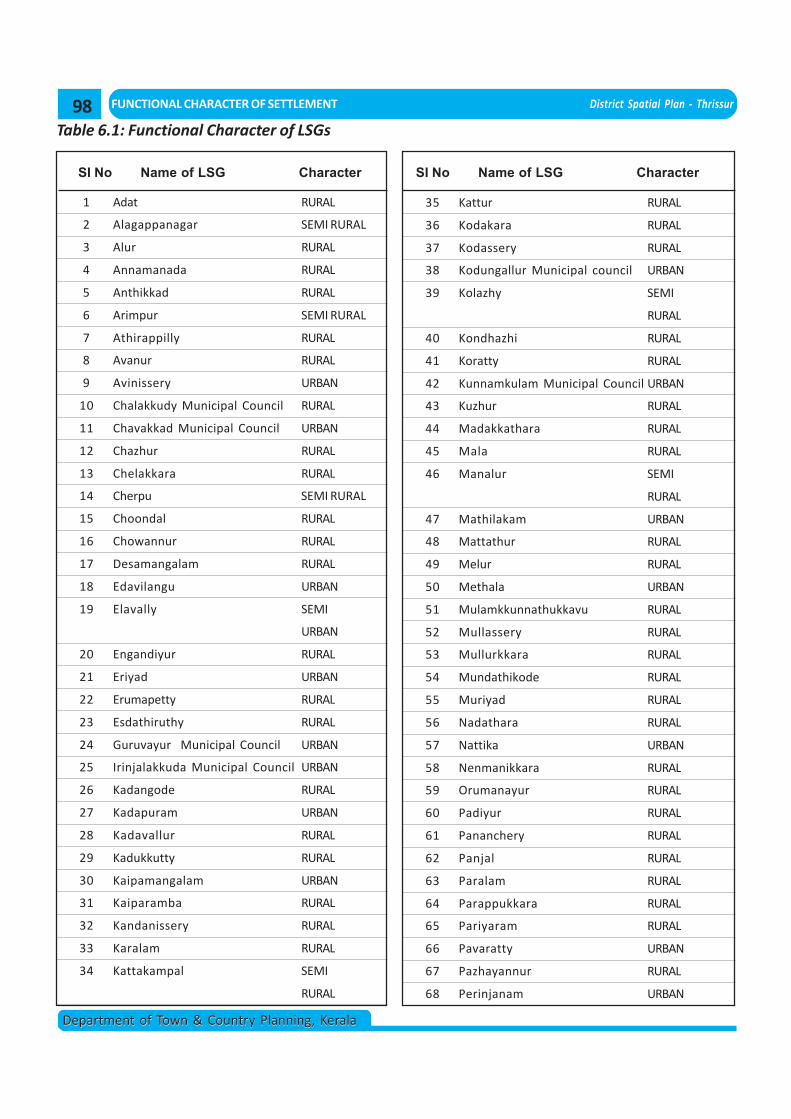
FUNCTIONAL CHARACTER OF SETTLEMENT District Spatial Plan - Thrissur
Department of Town & Country Planning, KeralaDepartment of Town & Country Planning, Kerala
Table 6.1: Functional Character of LSGs
1 Adat RURAL
2 Alagappanagar SEMI RURAL
3 Alur RURAL
4 Annamanada RURAL
5 Anthikkad RURAL
6 Arimpur SEMI RURAL
7 Athirappilly RURAL
8 Avanur RURAL
9 Avinissery URBAN
10 Chalakkudy Municipal Council RURAL
11 Chavakkad Municipal Council URBAN
12 Chazhur RURAL
13 Chelakkara RURAL
14 Cherpu SEMI RURAL
15 Choondal RURAL
16 Chowannur RURAL
17 Desamangalam RURAL
18 Edavilangu URBAN
19 Elavally SEMI
URBAN
20 Engandiyur RURAL
21 Eriyad URBAN
22 Erumapetty RURAL
23 Esdathiruthy RURAL
24 Guruvayur Municipal Council URBAN
25 Irinjalakkuda Municipal Council URBAN
26 Kadangode RURAL
27 Kadapuram URBAN
28 Kadavallur RURAL
29 Kadukkutty RURAL
30 Kaipamangalam URBAN
31 Kaiparamba RURAL
32 Kandanissery RURAL
33 Karalam RURAL
34 Kattakampal SEMI
RURAL
35 Kattur RURAL
36 Kodakara RURAL
37 Kodassery RURAL
38 Kodungallur Municipal council URBAN
39 Kolazhy SEMI
RURAL
40 Kondhazhi RURAL
41 Koratty RURAL
42 Kunnamkulam Municipal Council URBAN
43 Kuzhur RURAL
44 Madakkathara RURAL
45 Mala RURAL
46 Manalur SEMI
RURAL
47 Mathilakam URBAN
48 Mattathur RURAL
49 Melur RURAL
50 Methala URBAN
51 Mulamkkunnathukkavu RURAL
52 Mullassery RURAL
53 Mullurkkara RURAL
54 Mundathikode RURAL
55 Muriyad RURAL
56 Nadathara RURAL
57 Nattika URBAN
58 Nenmanikkara RURAL
59 Orumanayur RURAL
60 Padiyur RURAL
61 Pananchery RURAL
62 Panjal RURAL
63 Paralam RURAL
64 Parappukkara RURAL
65 Pariyaram RURAL
66 Pavaratty URBAN
67 Pazhayannur RURAL
68 Perinjanam URBAN
SI No Name of LSG Character SI No Name of LSG Character
98
District Spatial Plan - Thrissur FUNCTIONAL CHARACTER OF SETTLEMENT
Department of Town & Country Planning, KeralaDepartment of Town & Country Planning, Kerala
69 Pookode URBAN
70 Poomangalam RURAL
71 Porathissery SEMI
RURAL
72 Porkulam RURAL
73 Poyya SEMI
RURAL
74 Pudukkad RURAL
75 Punnayur SEMI
RURAL
76 Punnayurkulam RURAL
77 Puthenchira RURAL
78 Puthur RURAL
79 Sreenarayanapuram RURAL
80 Thaikkad RURAL
81 Thalikulam URBAN
82 Thanniyam RURAL
83 Thekkumkkara RURAL
84 Thiruvilwamala RURAL
85 Tholur RURAL
86 Thrikkur RURAL
87 Thrissur Municipal Corporation URBAN
88 Vadakkekad RURAL
89 Vadanappilly URBAN
90 Valappad URBAN
91 Vallachira SEMI URBAN
92 Vallatholenagar SEMI URBAN
93 Varandarappilly RURAL
94 Varavoor RURAL
95 Vellangallur RURAL
96 Velukkara RURAL
97 Velur RURAL
98 Venkitangu RURAL
99 Wadakkanchery RURAL
6. 2. INFERENCE
The spatial distribution of the settlements based
on its character shows a clear demarcation in the pat-
tern of the settlements in four categories. Thrissur
Municipal Corporation and Municipal Councils except
Chalakkudy shows the urban character. Some of coastal
LSGs also show urban character. Semi urban character is
exhibited by LSGs that have urban influence like
Vallathole Nagar (located near to Shornur Municipality
in Palakkad District) , Elavally and Vallachira. Most of
the LSGs in the midland and high land region of the
District exhibit rural character. Semi rural character is
seen in those LSGs which are in a transition zone be-
tween LSGs of urban and rural character.
99
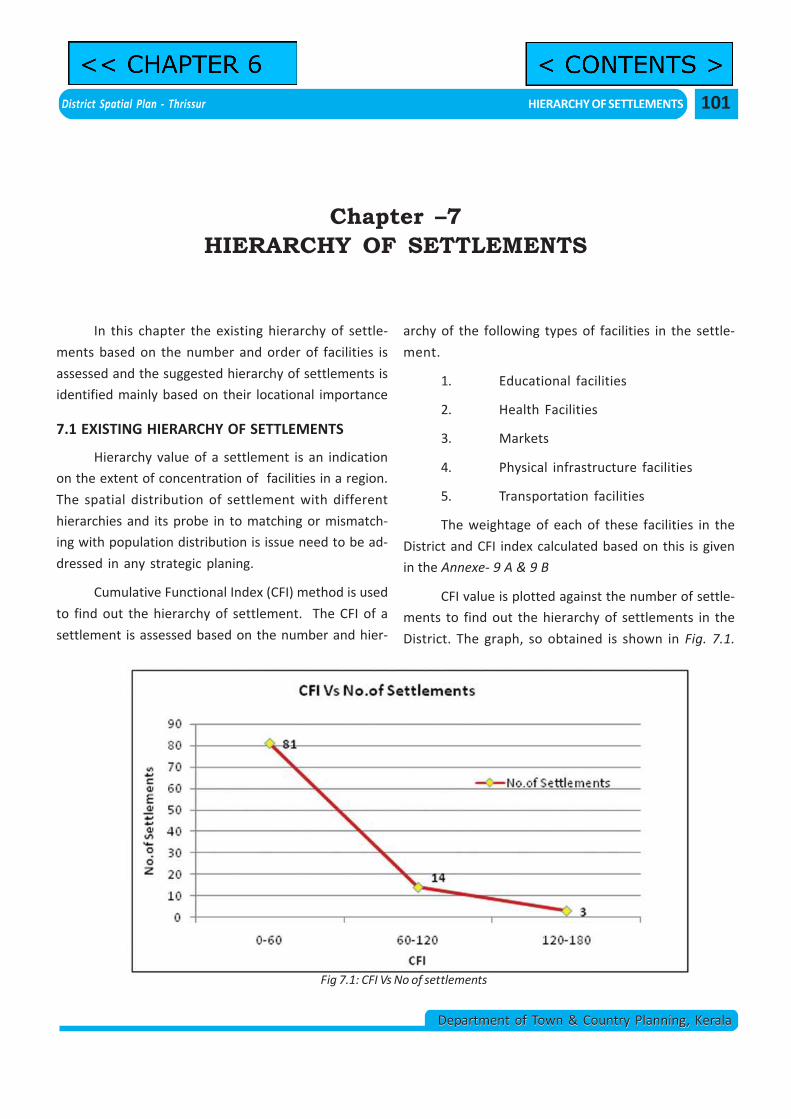
District Spatial Plan - Thrissur HIERARCHY OF SETTLEMENTS
Department of Town & Country Planning, KeralaDepartment of Town & Country Planning, Kerala
In this chapter the existing hierarchy of settle-
ments based on the number and order of facilities is
assessed and the suggested hierarchy of settlements is
identified mainly based on their locational importance
7.1 EXISTING HIERARCHY OF SETTLEMENTS
Hierarchy value of a settlement is an indication
on the extent of concentration of facilities in a region.
The spatial distribution of settlement with different
hierarchies and its probe in to matching or mismatch-
ing with population distribution is issue need to be ad-
dressed in any strategic planing.
Cumulative Functional Index (CFI) method is used
to find out the hierarchy of settlement. The CFI of a
settlement is assessed based on the number and hier-
Chapter –7HIERARCHY OF SETTLEMENTS
archy of the following types of facilities in the settle-
ment.
1. Educational facilities
2. Health Facilities
3. Markets
4. Physical infrastructure facilities
5. Transportation facilities
The weightage of each of these facilities in the
District and CFI index calculated based on this is given
in the Annexe- 9 A & 9 B
CFI value is plotted against the number of settle-
ments to find out the hierarchy of settlements in the
District. The graph, so obtained is shown in Fig. 7.1.
Fig 7.1: CFI Vs No of settlements
101
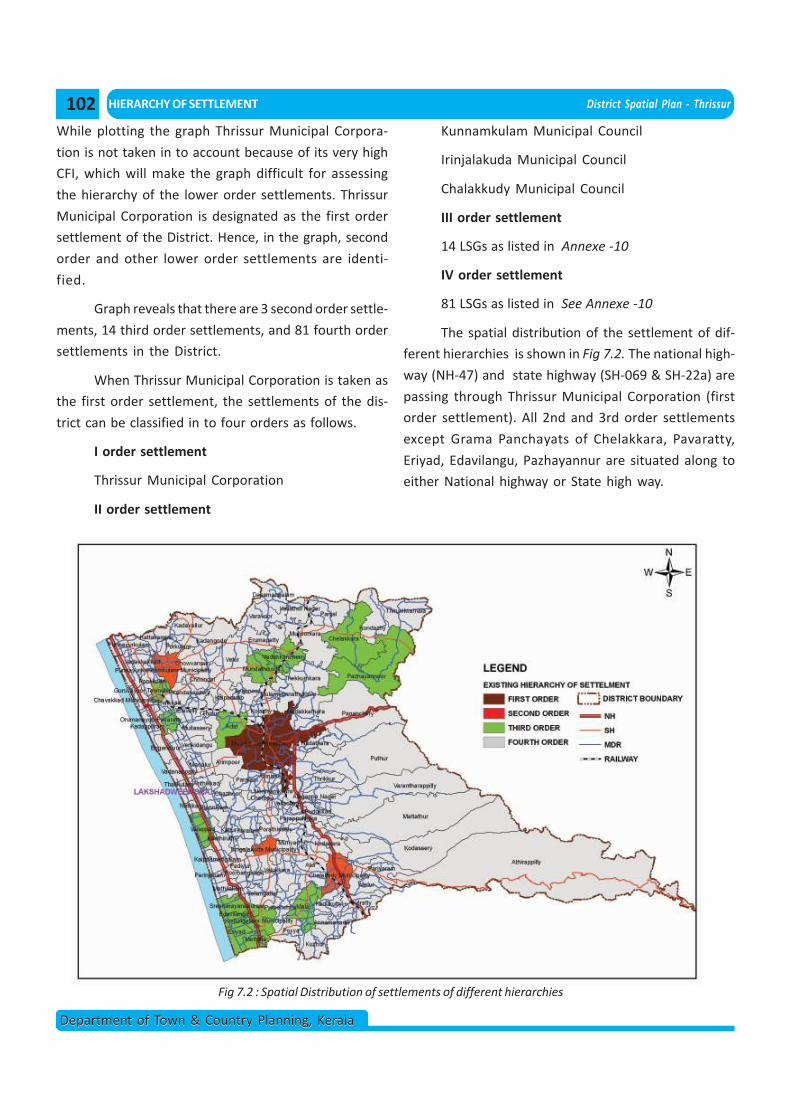
HIERARCHY OF SETTLEMENT District Spatial Plan - Thrissur
Department of Town & Country Planning, KeralaDepartment of Town & Country Planning, Kerala
While plotting the graph Thrissur Municipal Corpora-
tion is not taken in to account because of its very high
CFI, which will make the graph difficult for assessing
the hierarchy of the lower order settlements. Thrissur
Municipal Corporation is designated as the first order
settlement of the District. Hence, in the graph, second
order and other lower order settlements are identi-
fied.
Graph reveals that there are 3 second order settle-
ments, 14 third order settlements, and 81 fourth order
settlements in the District.
When Thrissur Municipal Corporation is taken as
the first order settlement, the settlements of the dis-
trict can be classified in to four orders as follows.
I order settlement
Thrissur Municipal Corporation
II order settlement
Kunnamkulam Municipal Council
Irinjalakuda Municipal Council
Chalakkudy Municipal Council
III order settlement
14 LSGs as listed in Annexe -10
IV order settlement
81 LSGs as listed in See Annexe -10
The spatial distribution of the settlement of dif-
ferent hierarchies is shown in Fig 7.2. The national high-
way (NH-47) and state highway (SH-069 & SH-22a) are
passing through Thrissur Municipal Corporation (first
order settlement). All 2nd and 3rd order settlements
except Grama Panchayats of Chelakkara, Pavaratty,
Eriyad, Edavilangu, Pazhayannur are situated along to
either National highway or State high way.
Fig 7.2 : Spatial Distribution of settlements of different hierarchies
102
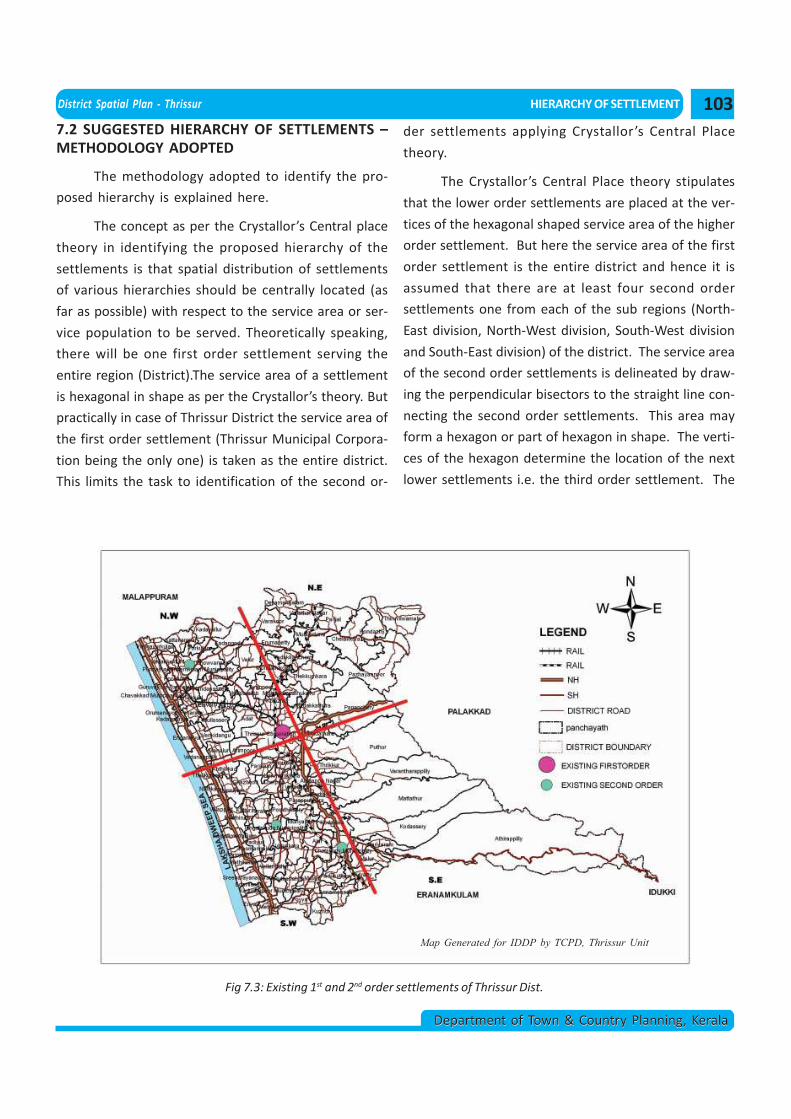
District Spatial Plan - Thrissur HIERARCHY OF SETTLEMENT
Department of Town & Country Planning, KeralaDepartment of Town & Country Planning, Kerala
7.2 SUGGESTED HIERARCHY OF SETTLEMENTS –METHODOLOGY ADOPTED
The methodology adopted to identify the pro-
posed hierarchy is explained here.
The concept as per the Crystallor’s Central place
theory in identifying the proposed hierarchy of the
settlements is that spatial distribution of settlements
of various hierarchies should be centrally located (as
far as possible) with respect to the service area or ser-
vice population to be served. Theoretically speaking,
there will be one first order settlement serving the
entire region (District).The service area of a settlement
is hexagonal in shape as per the Crystallor’s theory. But
practically in case of Thrissur District the service area of
the first order settlement (Thrissur Municipal Corpora-
tion being the only one) is taken as the entire district.
This limits the task to identification of the second or-
der settlements applying Crystallor’s Central Place
theory.
The Crystallor’s Central Place theory stipulates
that the lower order settlements are placed at the ver-
tices of the hexagonal shaped service area of the higher
order settlement. But here the service area of the first
order settlement is the entire district and hence it is
assumed that there are at least four second order
settlements one from each of the sub regions (North-
East division, North-West division, South-West division
and South-East division) of the district. The service area
of the second order settlements is delineated by draw-
ing the perpendicular bisectors to the straight line con-
necting the second order settlements. This area may
form a hexagon or part of hexagon in shape. The verti-
ces of the hexagon determine the location of the next
lower settlements i.e. the third order settlement. The
Fig 7.3: Existing 1st and 2nd order settlements of Thrissur Dist.
Map Generated for IDDP by TCPD, Thrissur Unit
103
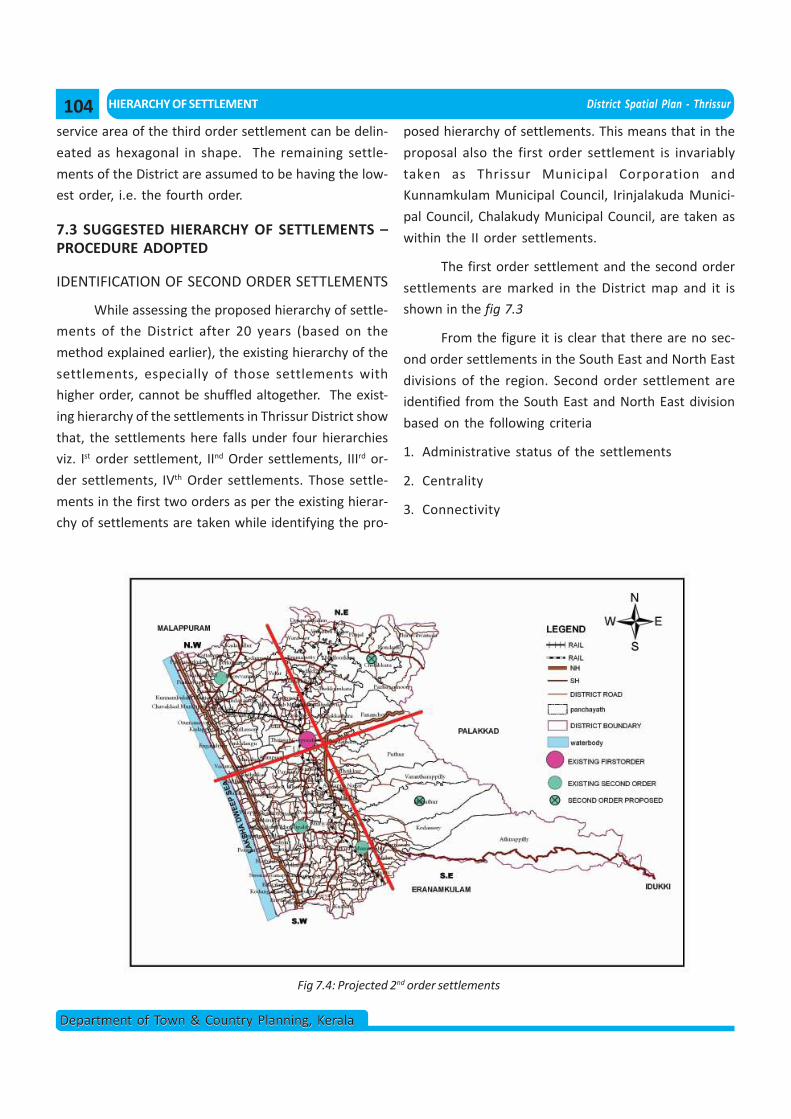
HIERARCHY OF SETTLEMENT District Spatial Plan - Thrissur
Department of Town & Country Planning, KeralaDepartment of Town & Country Planning, Kerala
service area of the third order settlement can be delin-
eated as hexagonal in shape. The remaining settle-
ments of the District are assumed to be having the low-
est order, i.e. the fourth order.
7.3 SUGGESTED HIERARCHY OF SETTLEMENTS –PROCEDURE ADOPTED
IDENTIFICATION OF SECOND ORDER SETTLEMENTS
While assessing the proposed hierarchy of settle-
ments of the District after 20 years (based on the
method explained earlier), the existing hierarchy of the
settlements, especially of those settlements with
higher order, cannot be shuffled altogether. The exist-
ing hierarchy of the settlements in Thrissur District show
that, the settlements here falls under four hierarchies
viz. Ist order settlement, IInd Order settlements, IIIrd or-
der settlements, IVth Order settlements. Those settle-
ments in the first two orders as per the existing hierar-
chy of settlements are taken while identifying the pro-
posed hierarchy of settlements. This means that in the
proposal also the first order settlement is invariably
taken as Thrissur Municipal Corporation and
Kunnamkulam Municipal Council, Irinjalakuda Munici-
pal Council, Chalakudy Municipal Council, are taken as
within the II order settlements.
The first order settlement and the second order
settlements are marked in the District map and it is
shown in the fig 7.3
From the figure it is clear that there are no sec-
ond order settlements in the South East and North East
divisions of the region. Second order settlement are
identified from the South East and North East division
based on the following criteria
1. Administrative status of the settlements
2. Centrality
3. Connectivity
Fig 7.4: Projected 2nd order settlements
104
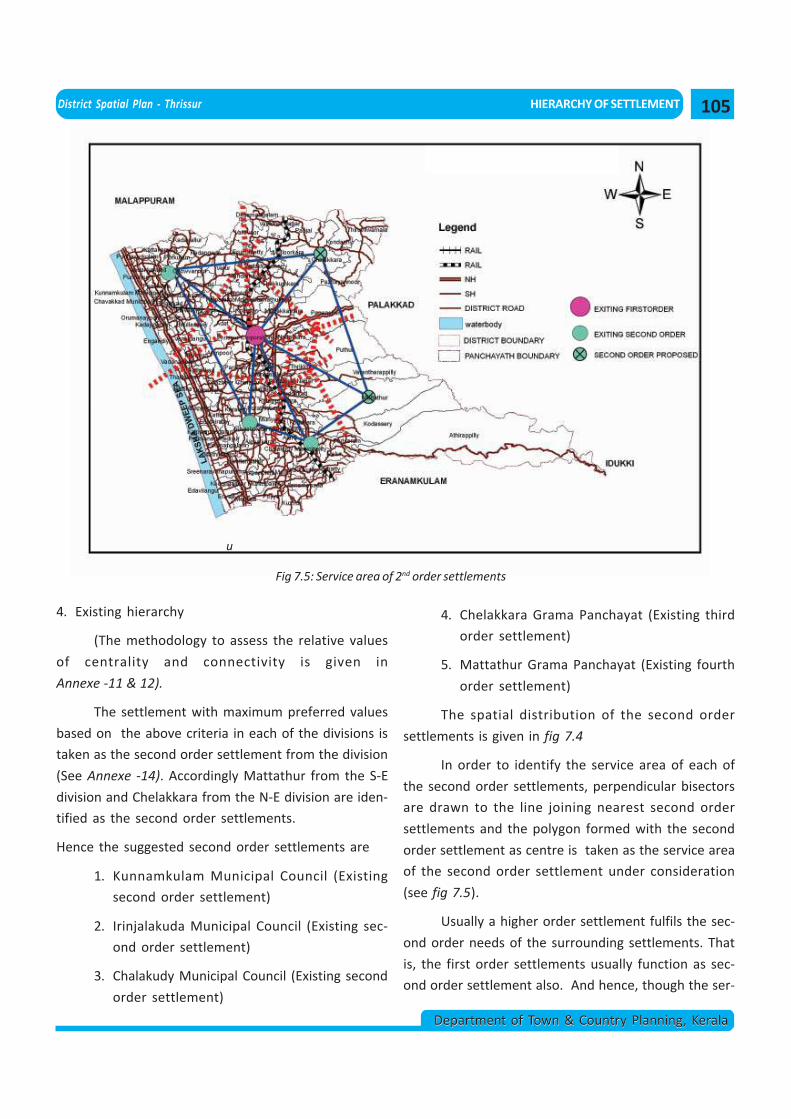
District Spatial Plan - Thrissur HIERARCHY OF SETTLEMENT
Department of Town & Country Planning, KeralaDepartment of Town & Country Planning, Kerala
4. Existing hierarchy
(The methodology to assess the relative values
of centrality and connectivity is given in
Annexe -11 & 12).
The settlement with maximum preferred values
based on the above criteria in each of the divisions is
taken as the second order settlement from the division
(See Annexe -14). Accordingly Mattathur from the S-E
division and Chelakkara from the N-E division are iden-
tified as the second order settlements.
Hence the suggested second order settlements are
1. Kunnamkulam Municipal Council (Existing
second order settlement)
2. Irinjalakuda Municipal Council (Existing sec-
ond order settlement)
3. Chalakudy Municipal Council (Existing second
order settlement)
Fig 7.5: Service area of 2nd order settlements
4. Chelakkara Grama Panchayat (Existing third
order settlement)
5. Mattathur Grama Panchayat (Existing fourth
order settlement)
The spatial distribution of the second order
settlements is given in fig 7.4
In order to identify the service area of each of
the second order settlements, perpendicular bisectors
are drawn to the line joining nearest second order
settlements and the polygon formed with the second
order settlement as centre is taken as the service area
of the second order settlement under consideration
(see fig 7.5).
Usually a higher order settlement fulfils the sec-
ond order needs of the surrounding settlements. That
is, the first order settlements usually function as sec-
ond order settlement also. And hence, though the ser-
u
105
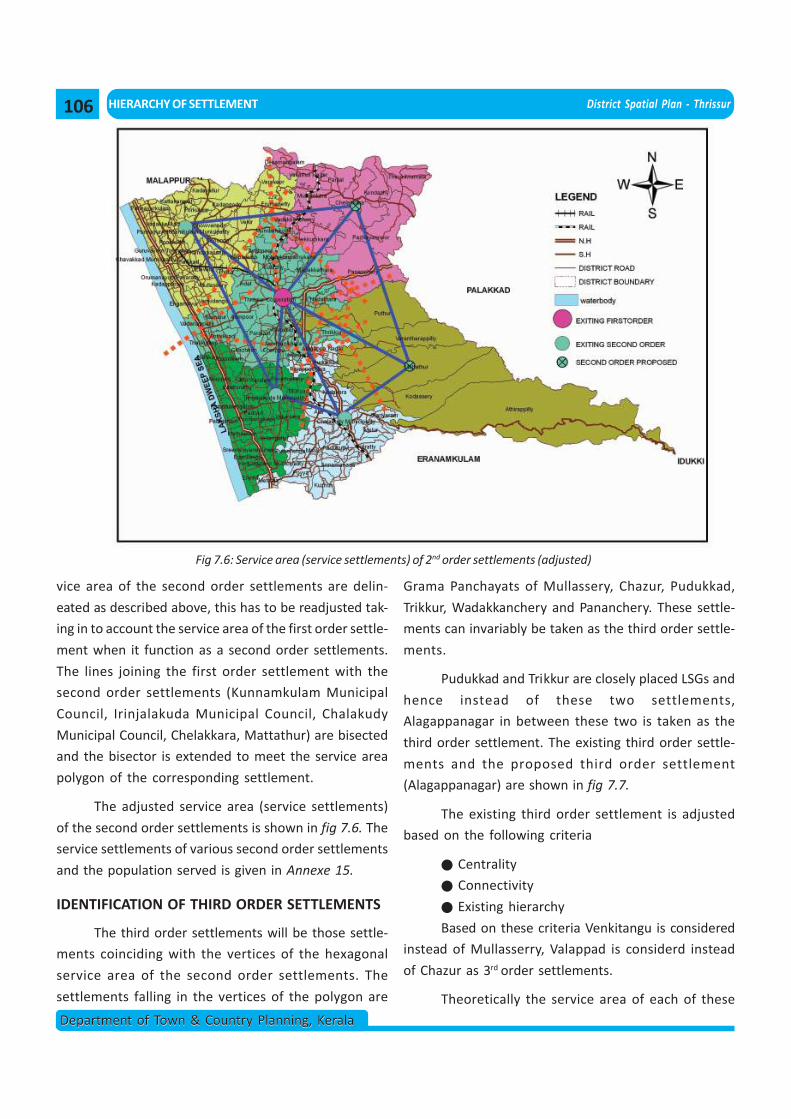
HIERARCHY OF SETTLEMENT District Spatial Plan - Thrissur
Department of Town & Country Planning, KeralaDepartment of Town & Country Planning, Kerala
Fig 7.6: Service area (service settlements) of 2nd order settlements (adjusted)
vice area of the second order settlements are delin-
eated as described above, this has to be readjusted tak-
ing in to account the service area of the first order settle-
ment when it function as a second order settlements.
The lines joining the first order settlement with the
second order settlements (Kunnamkulam Municipal
Council, Irinjalakuda Municipal Council, Chalakudy
Municipal Council, Chelakkara, Mattathur) are bisected
and the bisector is extended to meet the service area
polygon of the corresponding settlement.
The adjusted service area (service settlements)
of the second order settlements is shown in fig 7.6. The
service settlements of various second order settlements
and the population served is given in Annexe 15.
IDENTIFICATION OF THIRD ORDER SETTLEMENTS
The third order settlements will be those settle-
ments coinciding with the vertices of the hexagonal
service area of the second order settlements. The
settlements falling in the vertices of the polygon are
Grama Panchayats of Mullassery, Chazur, Pudukkad,
Trikkur, Wadakkanchery and Pananchery. These settle-
ments can invariably be taken as the third order settle-
ments.
Pudukkad and Trikkur are closely placed LSGs and
hence instead of these two settlements,
Alagappanagar in between these two is taken as the
third order settlement. The existing third order settle-
ments and the proposed third order settlement
(Alagappanagar) are shown in fig 7.7.
The existing third order settlement is adjusted
based on the following criteria
Centrality
Connectivity
Existing hierarchy
Based on these criteria Venkitangu is considered
instead of Mullasserry, Valappad is considerd instead
of Chazur as 3rd order settlements.
Theoretically the service area of each of these
106
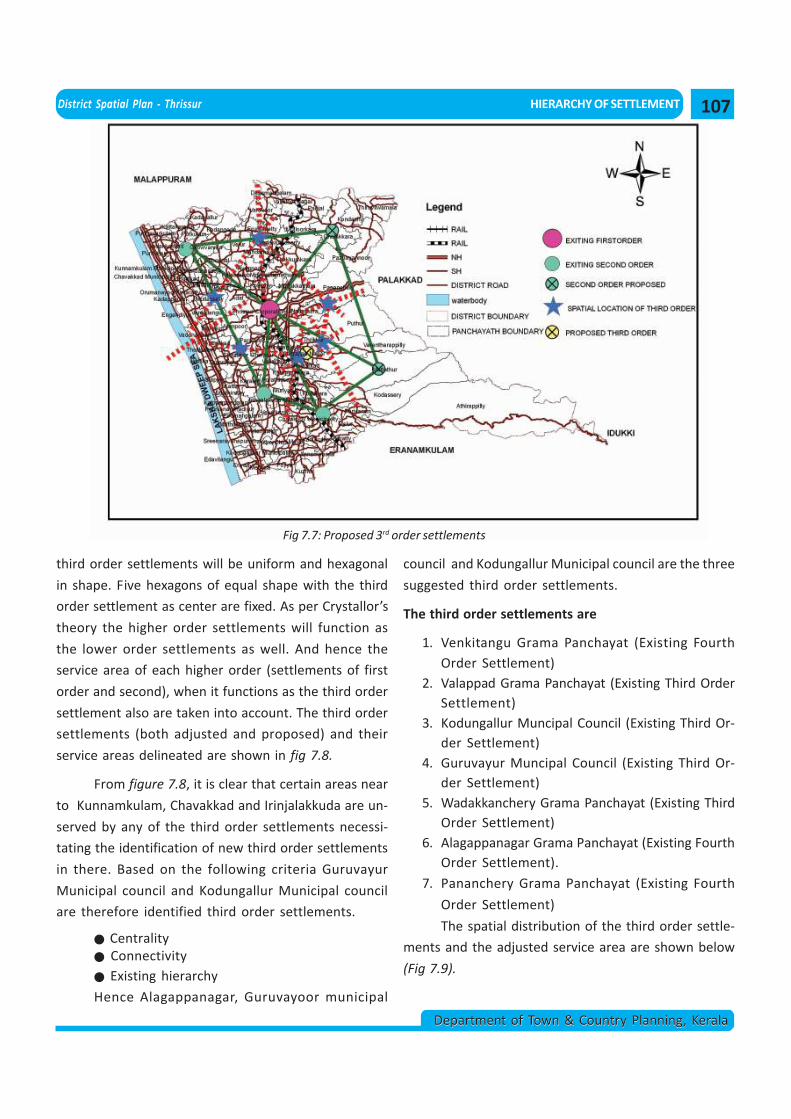
District Spatial Plan - Thrissur HIERARCHY OF SETTLEMENT
Department of Town & Country Planning, KeralaDepartment of Town & Country Planning, Kerala
Fig 7.7: Proposed 3rd order settlements
third order settlements will be uniform and hexagonal
in shape. Five hexagons of equal shape with the third
order settlement as center are fixed. As per Crystallor’s
theory the higher order settlements will function as
the lower order settlements as well. And hence the
service area of each higher order (settlements of first
order and second), when it functions as the third order
settlement also are taken into account. The third order
settlements (both adjusted and proposed) and their
service areas delineated are shown in fig 7.8.
From figure 7.8, it is clear that certain areas near
to Kunnamkulam, Chavakkad and Irinjalakkuda are un-
served by any of the third order settlements necessi-
tating the identification of new third order settlements
in there. Based on the following criteria Guruvayur
Municipal council and Kodungallur Municipal council
are therefore identified third order settlements.
Centrality Connectivity Existing hierarchy
Hence Alagappanagar, Guruvayoor municipal
council and Kodungallur Municipal council are the three
suggested third order settlements.
The third order settlements are
1. Venkitangu Grama Panchayat (Existing FourthOrder Settlement)
2. Valappad Grama Panchayat (Existing Third OrderSettlement)
3. Kodungallur Muncipal Council (Existing Third Or-der Settlement)
4. Guruvayur Muncipal Council (Existing Third Or-der Settlement)
5. Wadakkanchery Grama Panchayat (Existing ThirdOrder Settlement)
6. Alagappanagar Grama Panchayat (Existing FourthOrder Settlement).
7. Pananchery Grama Panchayat (Existing Fourth
Order Settlement)
The spatial distribution of the third order settle-
ments and the adjusted service area are shown below
(Fig 7.9).
107
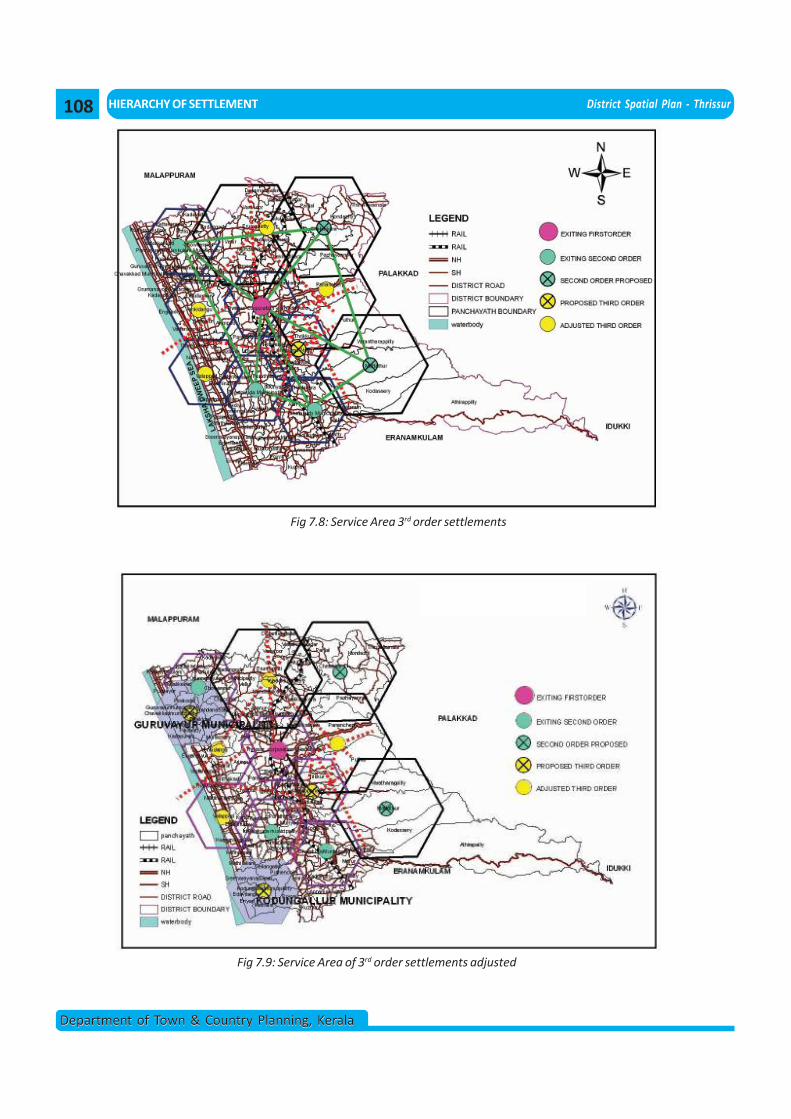
HIERARCHY OF SETTLEMENT District Spatial Plan - Thrissur
Department of Town & Country Planning, KeralaDepartment of Town & Country Planning, Kerala
Fig 7.9: Service Area of 3rd order settlements adjusted
Fig 7.8: Service Area 3rd order settlements
108
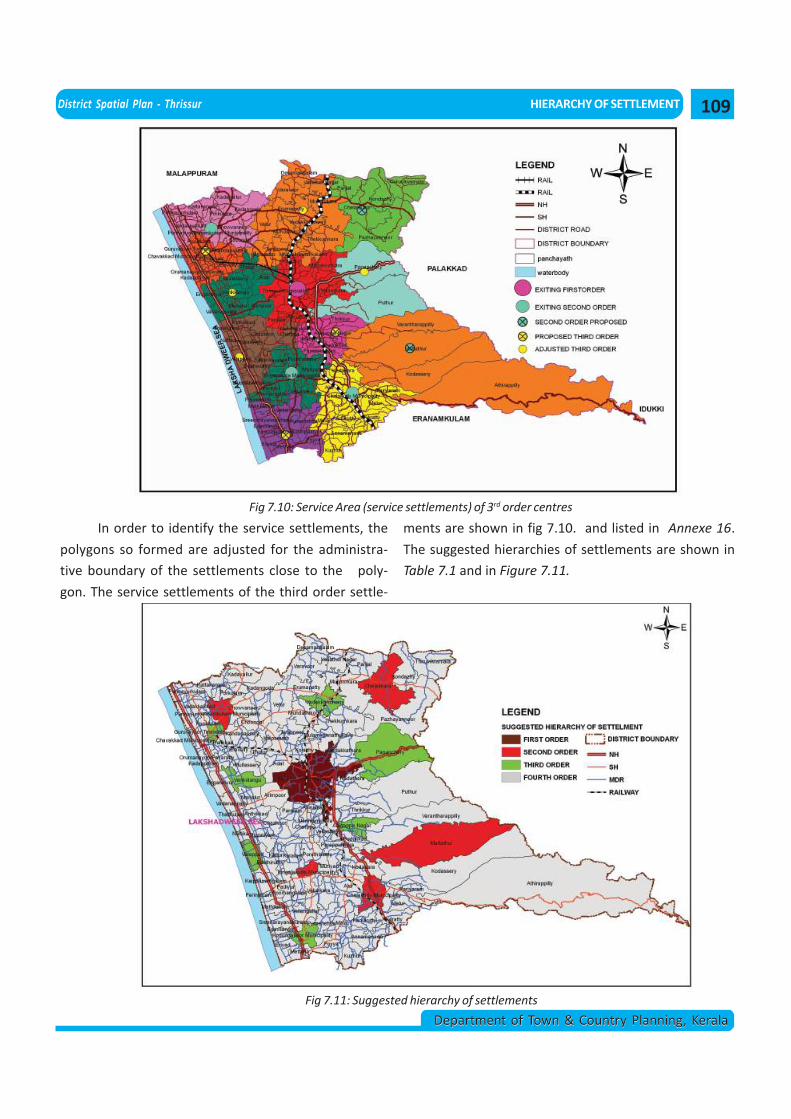
District Spatial Plan - Thrissur HIERARCHY OF SETTLEMENT
Department of Town & Country Planning, KeralaDepartment of Town & Country Planning, Kerala
In order to identify the service settlements, the
polygons so formed are adjusted for the administra-
tive boundary of the settlements close to the poly-
gon. The service settlements of the third order settle-
Fig 7.10: Service Area (service settlements) of 3rd order centres
ments are shown in fig 7.10. and listed in Annexe 16.
The suggested hierarchies of settlements are shown in
Table 7.1 and in Figure 7.11.
Fig 7.11: Suggested hierarchy of settlements
109
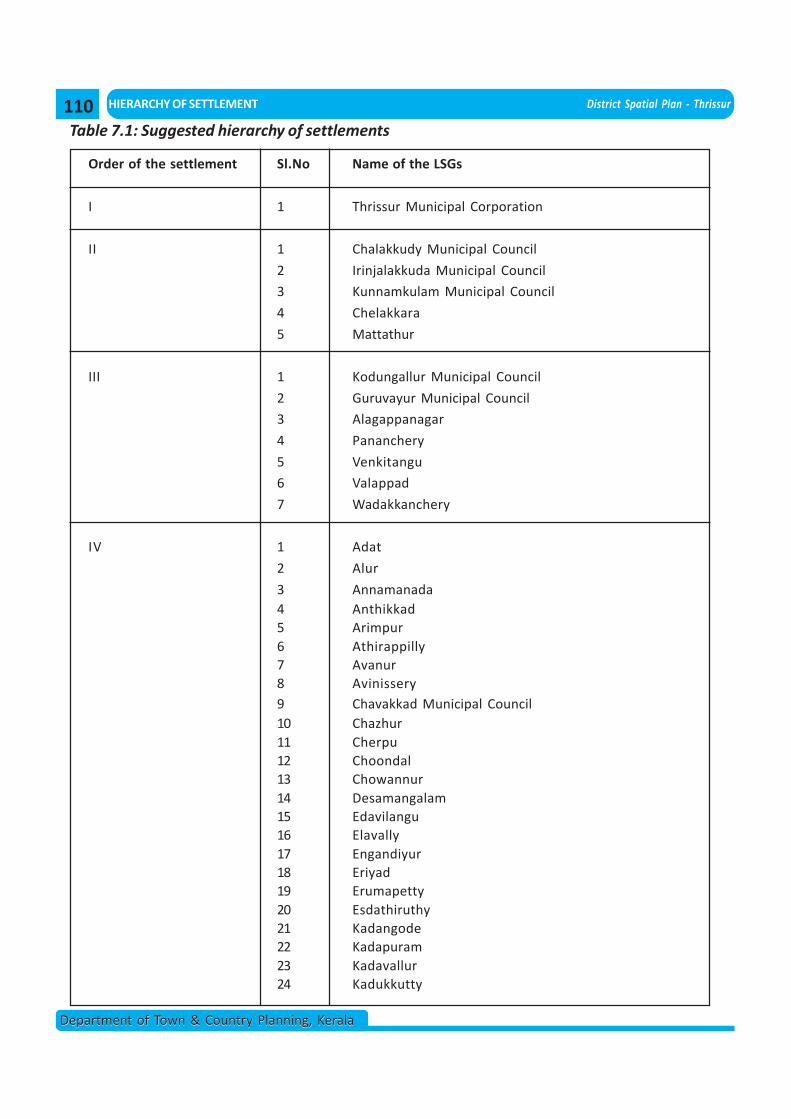
HIERARCHY OF SETTLEMENT District Spatial Plan - Thrissur
Department of Town & Country Planning, KeralaDepartment of Town & Country Planning, Kerala
Table 7.1: Suggested hierarchy of settlements
Order of the settlement Sl.No Name of the LSGs
I 1 Thrissur Municipal Corporation
II 1 Chalakkudy Municipal Council
2 Irinjalakkuda Municipal Council
3 Kunnamkulam Municipal Council
4 Chelakkara
5 Mattathur
III 1 Kodungallur Municipal Council
2 Guruvayur Municipal Council
3 Alagappanagar
4 Pananchery
5 Venkitangu
6 Valappad
7 Wadakkanchery
IV 1 Adat
2 Alur
3 Annamanada4 Anthikkad5 Arimpur6 Athirappilly7 Avanur8 Avinissery9 Chavakkad Municipal Council10 Chazhur11 Cherpu12 Choondal13 Chowannur14 Desamangalam15 Edavilangu16 Elavally17 Engandiyur18 Eriyad19 Erumapetty20 Esdathiruthy21 Kadangode22 Kadapuram23 Kadavallur24 Kadukkutty
110
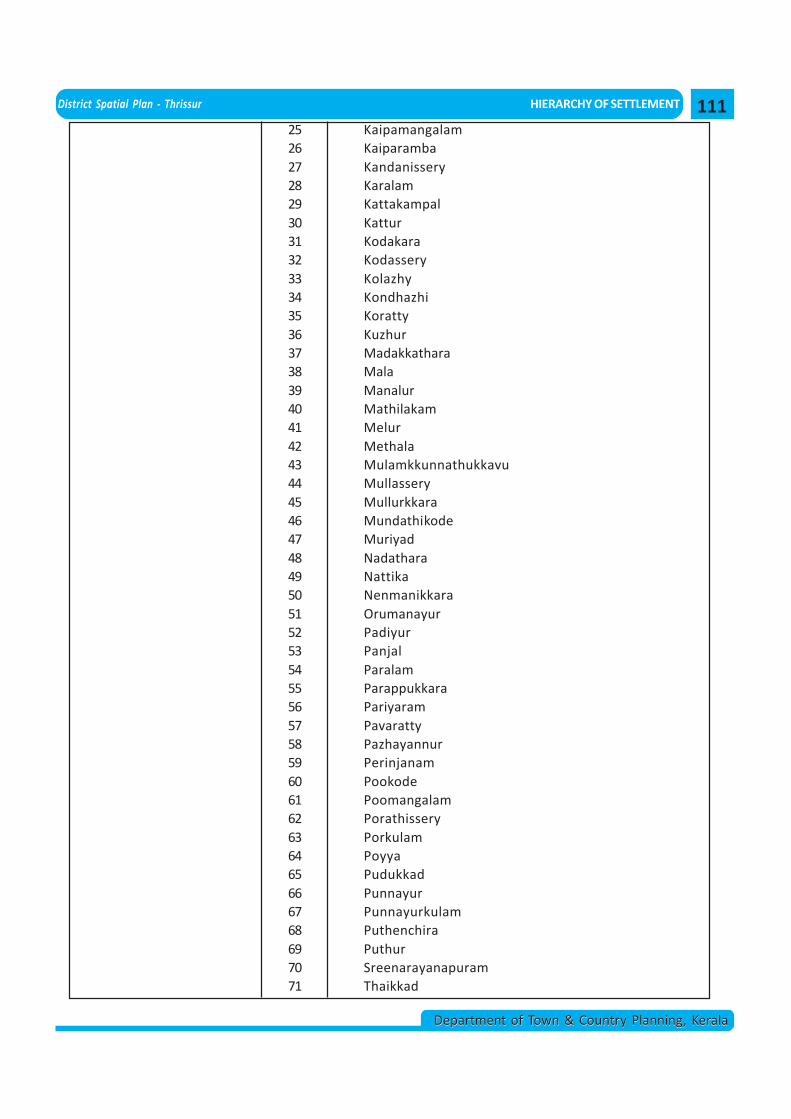
District Spatial Plan - Thrissur HIERARCHY OF SETTLEMENT
Department of Town & Country Planning, KeralaDepartment of Town & Country Planning, Kerala
25 Kaipamangalam26 Kaiparamba27 Kandanissery28 Karalam29 Kattakampal30 Kattur31 Kodakara32 Kodassery33 Kolazhy34 Kondhazhi35 Koratty36 Kuzhur37 Madakkathara38 Mala39 Manalur40 Mathilakam41 Melur42 Methala43 Mulamkkunnathukkavu44 Mullassery45 Mullurkkara46 Mundathikode47 Muriyad48 Nadathara49 Nattika50 Nenmanikkara51 Orumanayur52 Padiyur53 Panjal54 Paralam55 Parappukkara56 Pariyaram57 Pavaratty58 Pazhayannur59 Perinjanam60 Pookode61 Poomangalam62 Porathissery63 Porkulam64 Poyya65 Pudukkad66 Punnayur67 Punnayurkulam68 Puthenchira69 Puthur70 Sreenarayanapuram71 Thaikkad
111
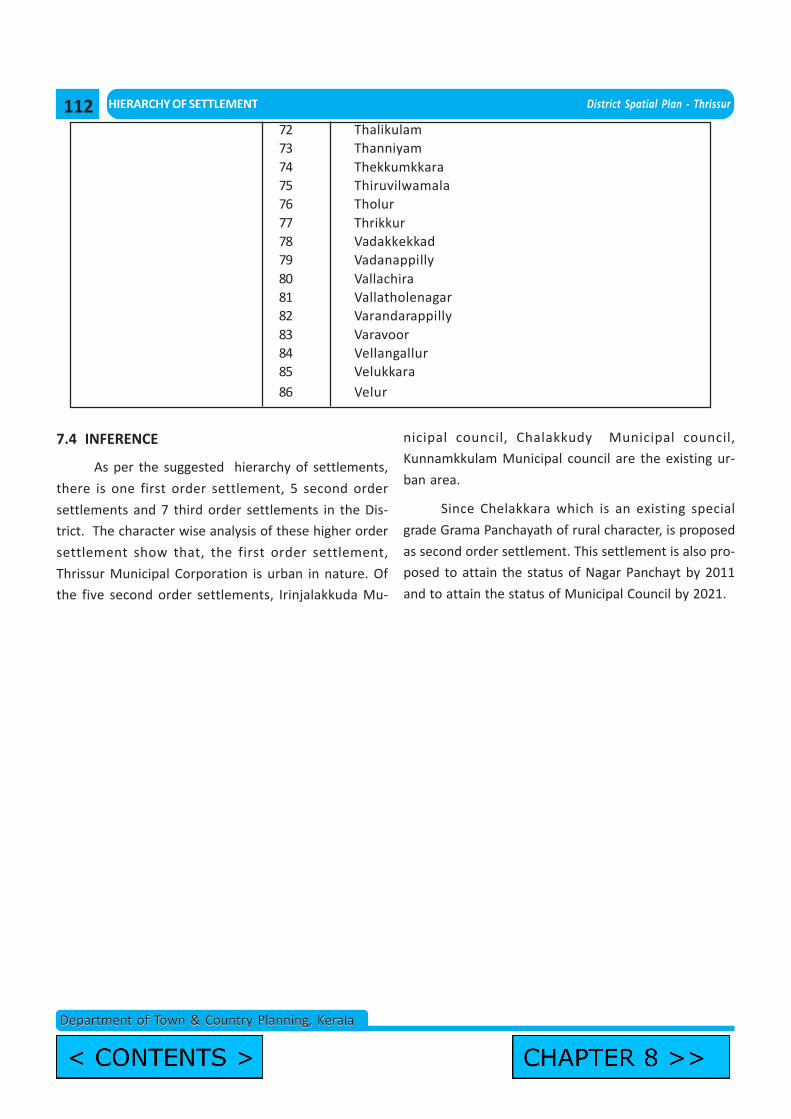
HIERARCHY OF SETTLEMENT District Spatial Plan - Thrissur
Department of Town & Country Planning, KeralaDepartment of Town & Country Planning, Kerala
72 Thalikulam73 Thanniyam74 Thekkumkkara75 Thiruvilwamala76 Tholur77 Thrikkur78 Vadakkekkad79 Vadanappilly80 Vallachira81 Vallatholenagar82 Varandarappilly83 Varavoor84 Vellangallur85 Velukkara86 Velur
7.4 INFERENCE
As per the suggested hierarchy of settlements,
there is one first order settlement, 5 second order
settlements and 7 third order settlements in the Dis-
trict. The character wise analysis of these higher order
settlement show that, the first order settlement,
Thrissur Municipal Corporation is urban in nature. Of
the five second order settlements, Irinjalakkuda Mu-
nicipal council, Chalakkudy Municipal council,
Kunnamkkulam Municipal council are the existing ur-
ban area.
Since Chelakkara which is an existing special
grade Grama Panchayath of rural character, is proposed
as second order settlement. This settlement is also pro-
posed to attain the status of Nagar Panchayt by 2011
and to attain the status of Municipal Council by 2021.
112
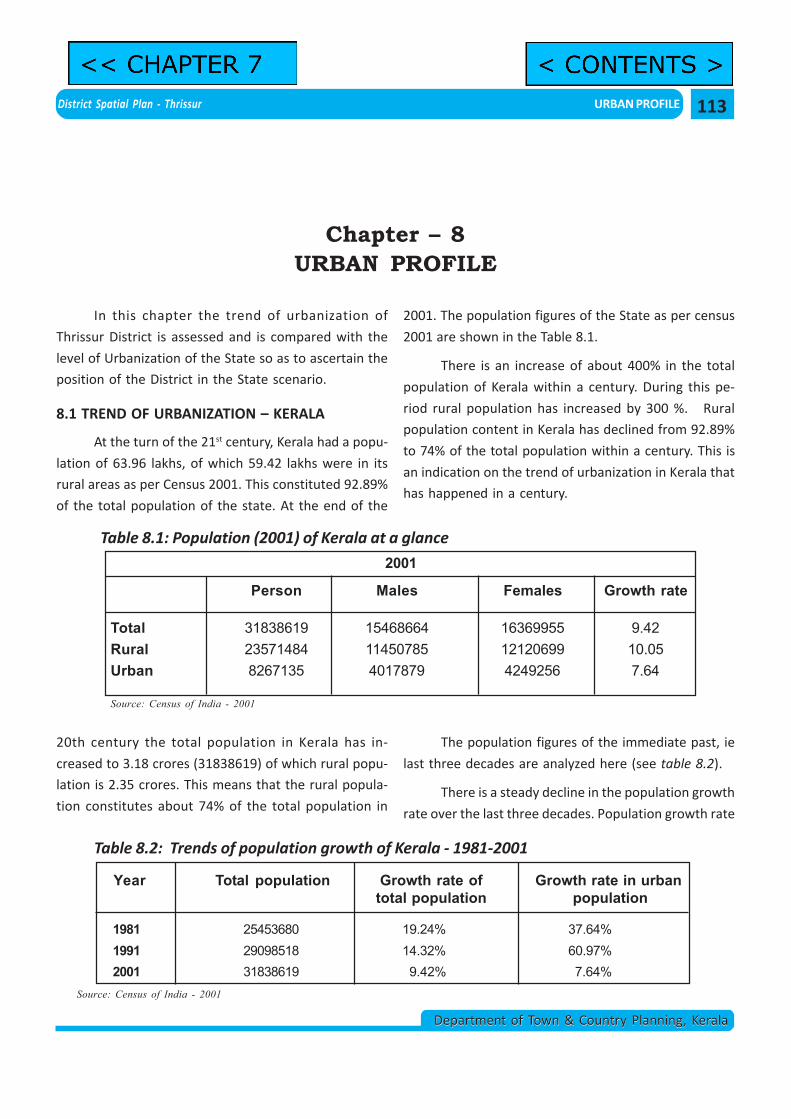
District Spatial Plan - Thrissur URBAN PROFILE
Department of Town & Country Planning, KeralaDepartment of Town & Country Planning, Kerala
In this chapter the trend of urbanization of
Thrissur District is assessed and is compared with the
level of Urbanization of the State so as to ascertain the
position of the District in the State scenario.
8.1 TREND OF URBANIZATION – KERALA
At the turn of the 21st century, Kerala had a popu-
lation of 63.96 lakhs, of which 59.42 lakhs were in its
rural areas as per Census 2001. This constituted 92.89%
of the total population of the state. At the end of the
Table 8.1: Population (2001) of Kerala at a glance
Person Males Females Growth rate
Total 31838619 15468664 16369955 9.42Rural 23571484 11450785 12120699 10.05Urban 8267135 4017879 4249256 7.64
2001
Source: Census of India - 2001
Chapter – 8URBAN PROFILE
20th century the total population in Kerala has in-
creased to 3.18 crores (31838619) of which rural popu-
lation is 2.35 crores. This means that the rural popula-
tion constitutes about 74% of the total population in
Table 8.2: Trends of population growth of Kerala - 1981-2001
1981 25453680 19.24% 37.64%1991 29098518 14.32% 60.97%2001 31838619 9.42% 7.64%
Year Total population Growth rate of Growth rate in urbantotal population population
Source: Census of India - 2001
2001. The population figures of the State as per census
2001 are shown in the Table 8.1.
There is an increase of about 400% in the total
population of Kerala within a century. During this pe-
riod rural population has increased by 300 %. Rural
population content in Kerala has declined from 92.89%
to 74% of the total population within a century. This is
an indication on the trend of urbanization in Kerala that
has happened in a century.
The population figures of the immediate past, ie
last three decades are analyzed here (see table 8.2).
There is a steady decline in the population growth
rate over the last three decades. Population growth rate
113
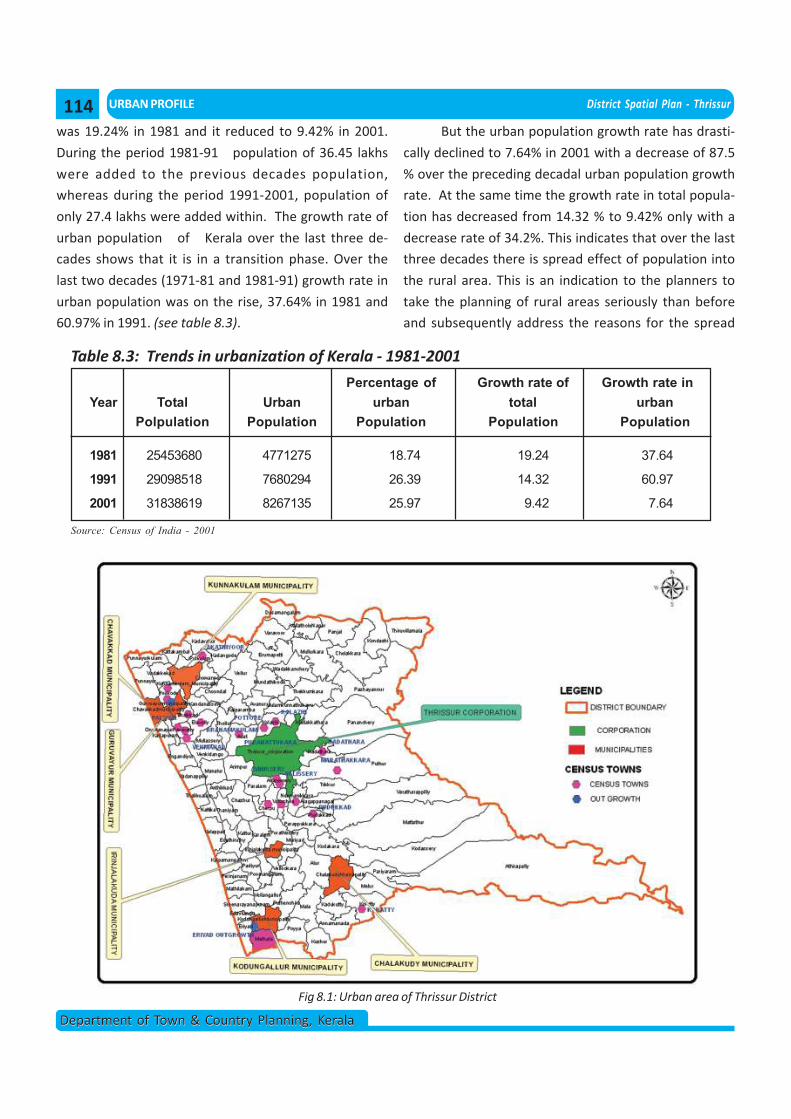
URBAN PROFILE District Spatial Plan - Thrissur
Department of Town & Country Planning, KeralaDepartment of Town & Country Planning, Kerala
was 19.24% in 1981 and it reduced to 9.42% in 2001.
During the period 1981-91 population of 36.45 lakhs
were added to the previous decades population,
whereas during the period 1991-2001, population of
only 27.4 lakhs were added within. The growth rate of
urban population of Kerala over the last three de-
cades shows that it is in a transition phase. Over the
last two decades (1971-81 and 1981-91) growth rate in
urban population was on the rise, 37.64% in 1981 and
60.97% in 1991. (see table 8.3).
Table 8.3: Trends in urbanization of Kerala - 1981-2001
Percentage of Growth rate of Growth rate inYear Total Urban urban total urban
Polpulation Population Population Population Population
1981 25453680 4771275 18.74 19.24 37.64
1991 29098518 7680294 26.39 14.32 60.97
2001 31838619 8267135 25.97 9.42 7.64
Source: Census of India - 2001
But the urban population growth rate has drasti-
cally declined to 7.64% in 2001 with a decrease of 87.5
% over the preceding decadal urban population growth
rate. At the same time the growth rate in total popula-
tion has decreased from 14.32 % to 9.42% only with a
decrease rate of 34.2%. This indicates that over the last
three decades there is spread effect of population into
the rural area. This is an indication to the planners to
take the planning of rural areas seriously than before
and subsequently address the reasons for the spread
Fig 8.1: Urban area of Thrissur District
114
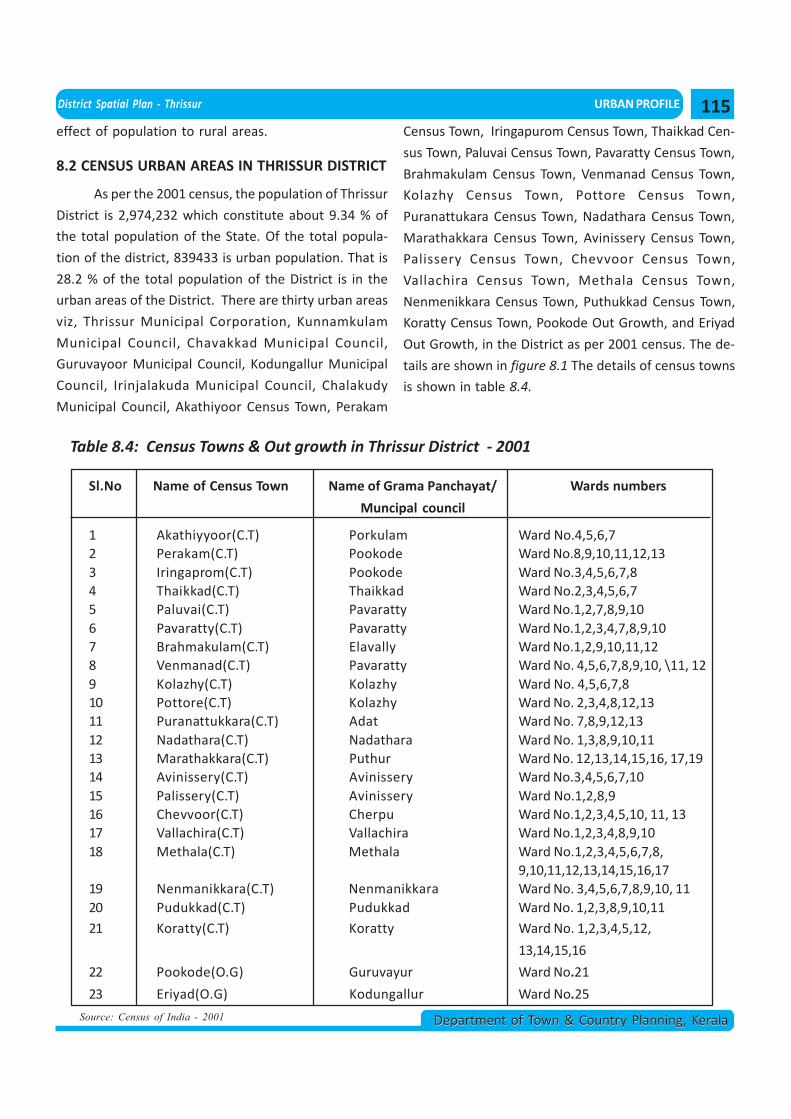
District Spatial Plan - Thrissur URBAN PROFILE
Department of Town & Country Planning, KeralaDepartment of Town & Country Planning, Kerala
Table 8.4: Census Towns & Out growth in Thrissur District - 2001
Sl.No Name of Census Town Name of Grama Panchayat/ Wards numbers
Muncipal council
1 Akathiyyoor(C.T) Porkulam Ward No.4,5,6,72 Perakam(C.T) Pookode Ward No.8,9,10,11,12,133 Iringaprom(C.T) Pookode Ward No.3,4,5,6,7,84 Thaikkad(C.T) Thaikkad Ward No.2,3,4,5,6,75 Paluvai(C.T) Pavaratty Ward No.1,2,7,8,9,106 Pavaratty(C.T) Pavaratty Ward No.1,2,3,4,7,8,9,107 Brahmakulam(C.T) Elavally Ward No.1,2,9,10,11,128 Venmanad(C.T) Pavaratty Ward No. 4,5,6,7,8,9,10, \11, 129 Kolazhy(C.T) Kolazhy Ward No. 4,5,6,7,810 Pottore(C.T) Kolazhy Ward No. 2,3,4,8,12,1311 Puranattukkara(C.T) Adat Ward No. 7,8,9,12,1312 Nadathara(C.T) Nadathara Ward No. 1,3,8,9,10,1113 Marathakkara(C.T) Puthur Ward No. 12,13,14,15,16, 17,1914 Avinissery(C.T) Avinissery Ward No.3,4,5,6,7,1015 Palissery(C.T) Avinissery Ward No.1,2,8,916 Chevvoor(C.T) Cherpu Ward No.1,2,3,4,5,10, 11, 1317 Vallachira(C.T) Vallachira Ward No.1,2,3,4,8,9,1018 Methala(C.T) Methala Ward No.1,2,3,4,5,6,7,8,
9,10,11,12,13,14,15,16,1719 Nenmanikkara(C.T) Nenmanikkara Ward No. 3,4,5,6,7,8,9,10, 1120 Pudukkad(C.T) Pudukkad Ward No. 1,2,3,8,9,10,1121 Koratty(C.T) Koratty Ward No. 1,2,3,4,5,12,
13,14,15,16
22 Pookode(O.G) Guruvayur Ward No.21
23 Eriyad(O.G) Kodungallur Ward No.25
effect of population to rural areas.
8.2 CENSUS URBAN AREAS IN THRISSUR DISTRICT
As per the 2001 census, the population of Thrissur
District is 2,974,232 which constitute about 9.34 % of
the total population of the State. Of the total popula-
tion of the district, 839433 is urban population. That is
28.2 % of the total population of the District is in the
urban areas of the District. There are thirty urban areas
viz, Thrissur Municipal Corporation, Kunnamkulam
Municipal Council, Chavakkad Municipal Council,
Guruvayoor Municipal Council, Kodungallur Municipal
Council, Irinjalakuda Municipal Council, Chalakudy
Municipal Council, Akathiyoor Census Town, Perakam
Census Town, Iringapurom Census Town, Thaikkad Cen-
sus Town, Paluvai Census Town, Pavaratty Census Town,
Brahmakulam Census Town, Venmanad Census Town,
Kolazhy Census Town, Pottore Census Town,
Puranattukara Census Town, Nadathara Census Town,
Marathakkara Census Town, Avinissery Census Town,
Palissery Census Town, Chevvoor Census Town,
Vallachira Census Town, Methala Census Town,
Nenmenikkara Census Town, Puthukkad Census Town,
Koratty Census Town, Pookode Out Growth, and Eriyad
Out Growth, in the District as per 2001 census. The de-
tails are shown in figure 8.1 The details of census towns
is shown in table 8.4.
Source: Census of India - 2001
115
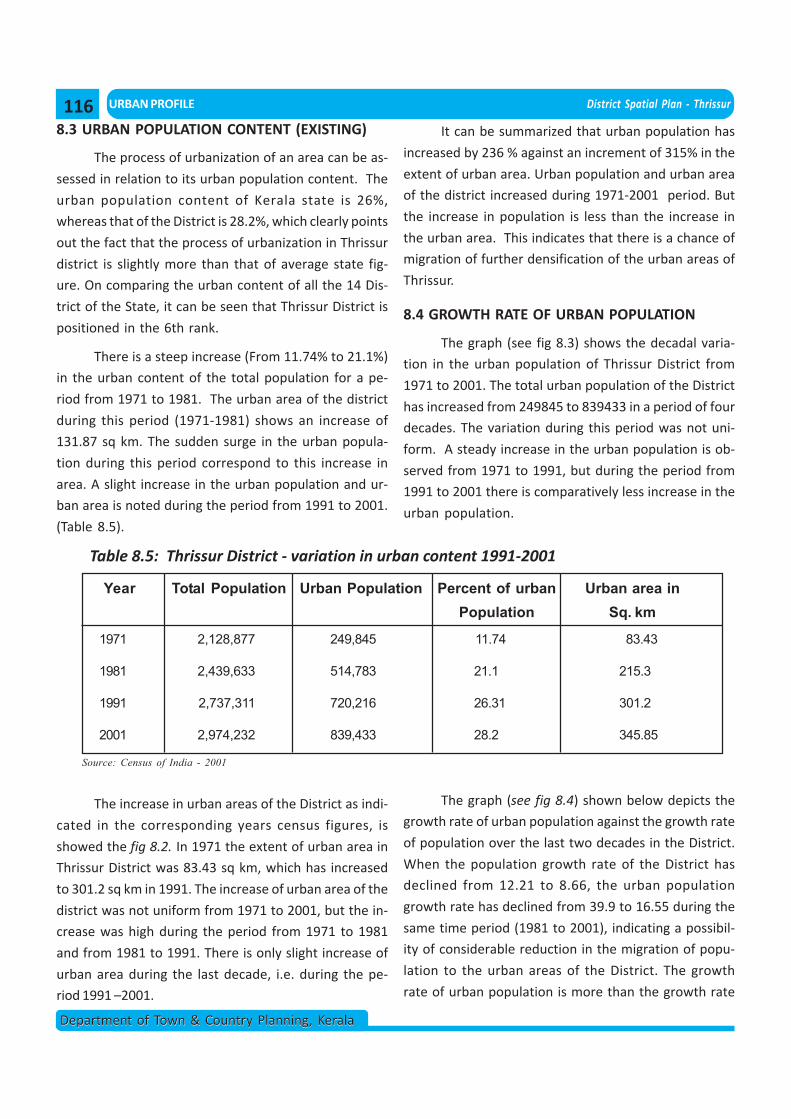
URBAN PROFILE District Spatial Plan - Thrissur
Department of Town & Country Planning, KeralaDepartment of Town & Country Planning, Kerala
8.3 URBAN POPULATION CONTENT (EXISTING)
The process of urbanization of an area can be as-
sessed in relation to its urban population content. The
urban population content of Kerala state is 26%,
whereas that of the District is 28.2%, which clearly points
out the fact that the process of urbanization in Thrissur
district is slightly more than that of average state fig-
ure. On comparing the urban content of all the 14 Dis-
trict of the State, it can be seen that Thrissur District is
positioned in the 6th rank.
There is a steep increase (From 11.74% to 21.1%)
in the urban content of the total population for a pe-
riod from 1971 to 1981. The urban area of the district
during this period (1971-1981) shows an increase of
131.87 sq km. The sudden surge in the urban popula-
tion during this period correspond to this increase in
area. A slight increase in the urban population and ur-
ban area is noted during the period from 1991 to 2001.
(Table 8.5).
The increase in urban areas of the District as indi-
cated in the corresponding years census figures, is
showed the fig 8.2. In 1971 the extent of urban area in
Thrissur District was 83.43 sq km, which has increased
to 301.2 sq km in 1991. The increase of urban area of the
district was not uniform from 1971 to 2001, but the in-
crease was high during the period from 1971 to 1981
and from 1981 to 1991. There is only slight increase of
urban area during the last decade, i.e. during the pe-
riod 1991 –2001.
Table 8.5: Thrissur District - variation in urban content 1991-2001
Year Total Population Urban Population Percent of urban Urban area inPopulation Sq. km
1971 2,128,877 249,845 11.74 83.43
1981 2,439,633 514,783 21.1 215.3
1991 2,737,311 720,216 26.31 301.2
2001 2,974,232 839,433 28.2 345.85
Source: Census of India - 2001
It can be summarized that urban population has
increased by 236 % against an increment of 315% in the
extent of urban area. Urban population and urban area
of the district increased during 1971-2001 period. But
the increase in population is less than the increase in
the urban area. This indicates that there is a chance of
migration of further densification of the urban areas of
Thrissur.
8.4 GROWTH RATE OF URBAN POPULATION
The graph (see fig 8.3) shows the decadal varia-
tion in the urban population of Thrissur District from
1971 to 2001. The total urban population of the District
has increased from 249845 to 839433 in a period of four
decades. The variation during this period was not uni-
form. A steady increase in the urban population is ob-
served from 1971 to 1991, but during the period from
1991 to 2001 there is comparatively less increase in the
urban population.
The graph (see fig 8.4) shown below depicts the
growth rate of urban population against the growth rate
of population over the last two decades in the District.
When the population growth rate of the District has
declined from 12.21 to 8.66, the urban population
growth rate has declined from 39.9 to 16.55 during the
same time period (1981 to 2001), indicating a possibil-
ity of considerable reduction in the migration of popu-
lation to the urban areas of the District. The growth
rate of urban population is more than the growth rate
116
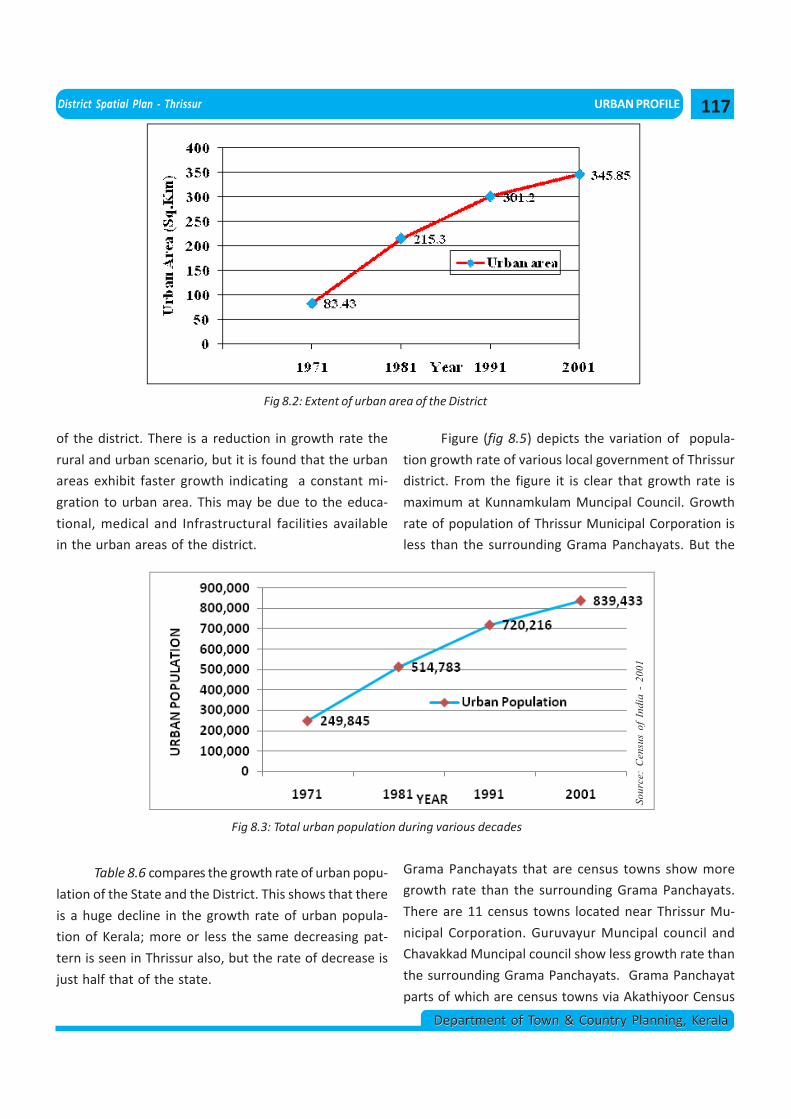
District Spatial Plan - Thrissur URBAN PROFILE
Department of Town & Country Planning, KeralaDepartment of Town & Country Planning, Kerala
Fig 8.2: Extent of urban area of the District
of the district. There is a reduction in growth rate the
rural and urban scenario, but it is found that the urban
areas exhibit faster growth indicating a constant mi-
gration to urban area. This may be due to the educa-
tional, medical and Infrastructural facilities available
in the urban areas of the district.
Fig 8.3: Total urban population during various decades
Sour
ce:
Cen
sus
of I
ndia
- 2
001
Table 8.6 compares the growth rate of urban popu-
lation of the State and the District. This shows that there
is a huge decline in the growth rate of urban popula-
tion of Kerala; more or less the same decreasing pat-
tern is seen in Thrissur also, but the rate of decrease is
just half that of the state.
Figure (fig 8.5) depicts the variation of popula-
tion growth rate of various local government of Thrissur
district. From the figure it is clear that growth rate is
maximum at Kunnamkulam Muncipal Council. Growth
rate of population of Thrissur Municipal Corporation is
less than the surrounding Grama Panchayats. But the
Grama Panchayats that are census towns show more
growth rate than the surrounding Grama Panchayats.
There are 11 census towns located near Thrissur Mu-
nicipal Corporation. Guruvayur Muncipal council and
Chavakkad Muncipal council show less growth rate than
the surrounding Grama Panchayats. Grama Panchayat
parts of which are census towns via Akathiyoor Census
117
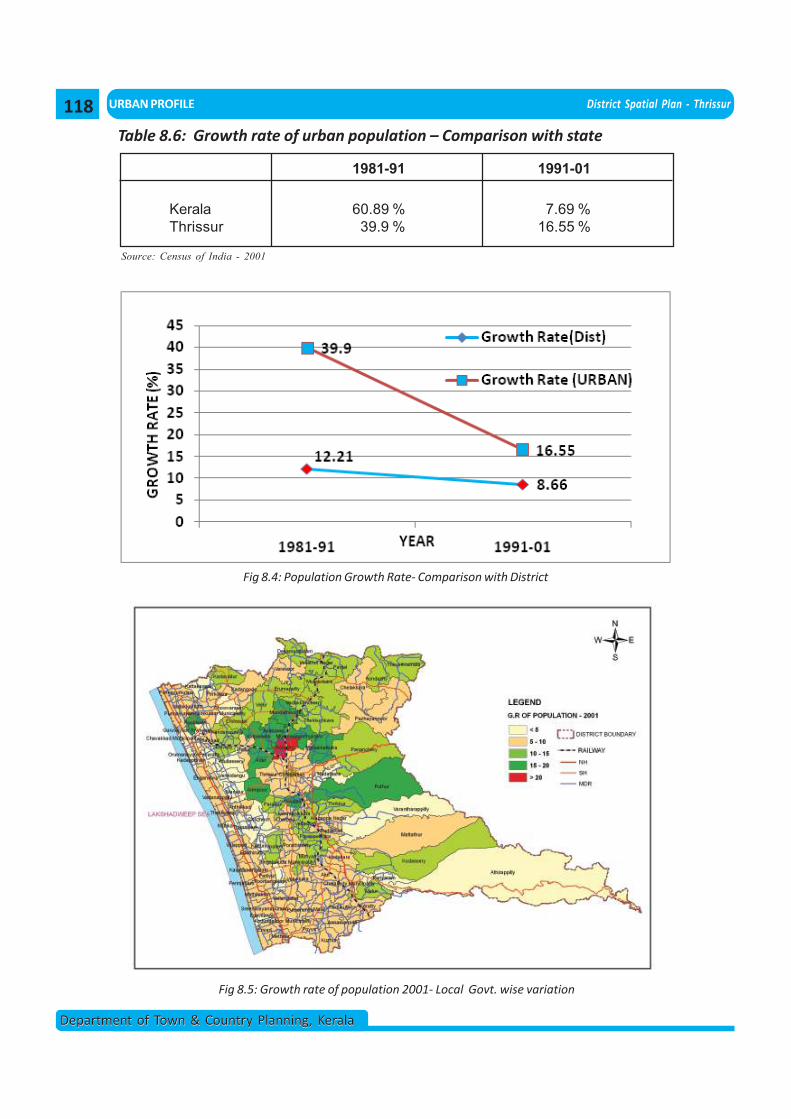
URBAN PROFILE District Spatial Plan - Thrissur
Department of Town & Country Planning, KeralaDepartment of Town & Country Planning, Kerala
Table 8.6: Growth rate of urban population – Comparison with state
1981-91 1991-01
Kerala 60.89 % 7.69 %Thrissur 39.9 % 16.55 %
Source: Census of India - 2001
Fig 8.5: Growth rate of population 2001- Local Govt. wise variation
Fig 8.4: Population Growth Rate- Comparison with District
118
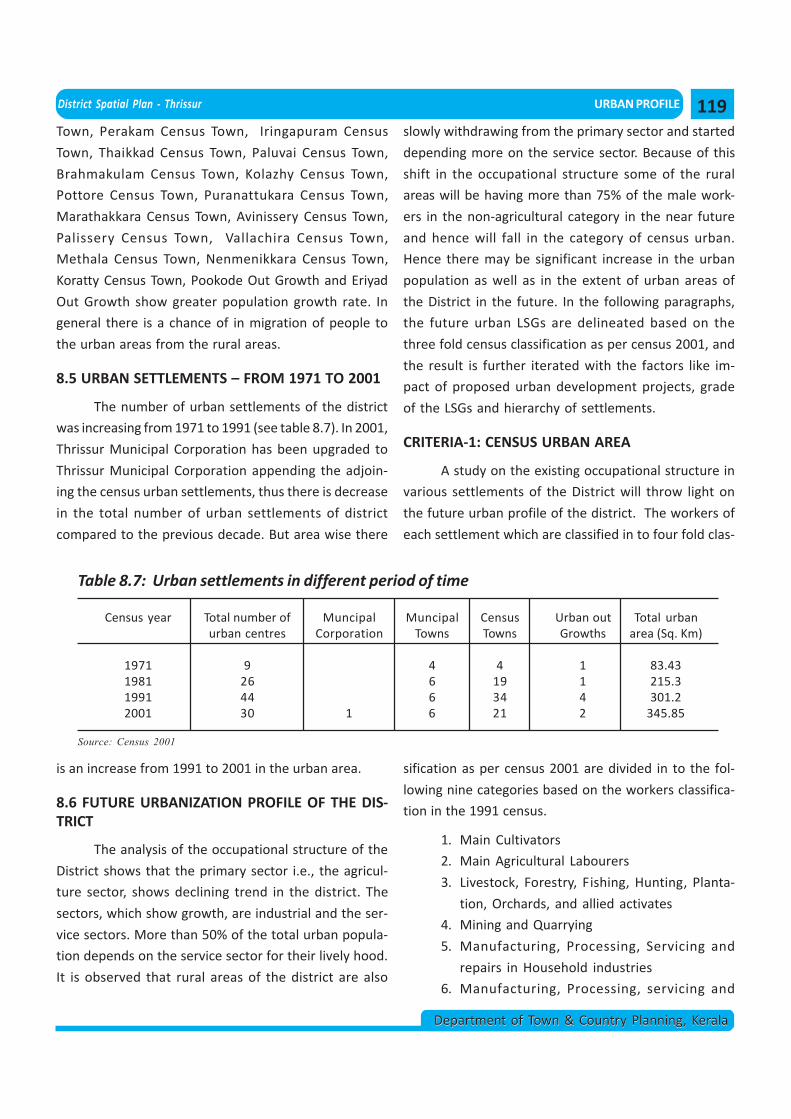
District Spatial Plan - Thrissur URBAN PROFILE
Department of Town & Country Planning, KeralaDepartment of Town & Country Planning, Kerala
Town, Perakam Census Town, Iringapuram Census
Town, Thaikkad Census Town, Paluvai Census Town,
Brahmakulam Census Town, Kolazhy Census Town,
Pottore Census Town, Puranattukara Census Town,
Marathakkara Census Town, Avinissery Census Town,
Palissery Census Town, Vallachira Census Town,
Methala Census Town, Nenmenikkara Census Town,
Koratty Census Town, Pookode Out Growth and Eriyad
Out Growth show greater population growth rate. In
general there is a chance of in migration of people to
the urban areas from the rural areas.
8.5 URBAN SETTLEMENTS – FROM 1971 TO 2001
The number of urban settlements of the district
was increasing from 1971 to 1991 (see table 8.7). In 2001,
Thrissur Municipal Corporation has been upgraded to
Thrissur Municipal Corporation appending the adjoin-
ing the census urban settlements, thus there is decrease
in the total number of urban settlements of district
compared to the previous decade. But area wise there
is an increase from 1991 to 2001 in the urban area.
8.6 FUTURE URBANIZATION PROFILE OF THE DIS-TRICT
The analysis of the occupational structure of the
District shows that the primary sector i.e., the agricul-
ture sector, shows declining trend in the district. The
sectors, which show growth, are industrial and the ser-
vice sectors. More than 50% of the total urban popula-
tion depends on the service sector for their lively hood.
It is observed that rural areas of the district are also
slowly withdrawing from the primary sector and started
depending more on the service sector. Because of this
shift in the occupational structure some of the rural
areas will be having more than 75% of the male work-
ers in the non-agricultural category in the near future
and hence will fall in the category of census urban.
Hence there may be significant increase in the urban
population as well as in the extent of urban areas of
the District in the future. In the following paragraphs,
the future urban LSGs are delineated based on the
three fold census classification as per census 2001, and
the result is further iterated with the factors like im-
pact of proposed urban development projects, grade
of the LSGs and hierarchy of settlements.
CRITERIA-1: CENSUS URBAN AREA
A study on the existing occupational structure in
various settlements of the District will throw light on
the future urban profile of the district. The workers of
each settlement which are classified in to four fold clas-
sification as per census 2001 are divided in to the fol-
lowing nine categories based on the workers classifica-
tion in the 1991 census.
1. Main Cultivators
2. Main Agricultural Labourers
3. Livestock, Forestry, Fishing, Hunting, Planta-
tion, Orchards, and allied activates
4. Mining and Quarrying
5. Manufacturing, Processing, Servicing and
repairs in Household industries
6. Manufacturing, Processing, servicing and
Table 8.7: Urban settlements in different period of time
Census year Total number of Muncipal Muncipal Census Urban out Total urbanurban centres Corporation Towns Towns Growths area (Sq. Km)
1971 9 4 4 1 83.431981 26 6 19 1 215.31991 44 6 34 4 301.22001 30 1 6 21 2 345.85
Source: Census 2001
119
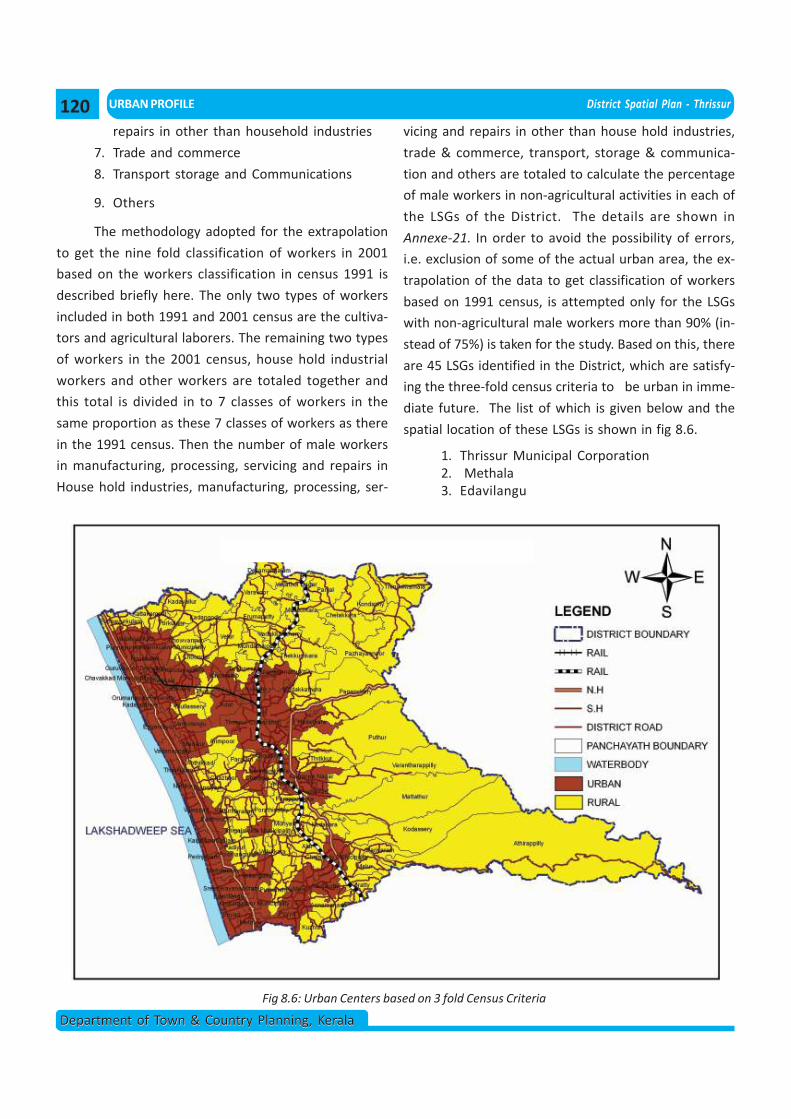
URBAN PROFILE District Spatial Plan - Thrissur
Department of Town & Country Planning, KeralaDepartment of Town & Country Planning, Kerala
repairs in other than household industries
7. Trade and commerce
8. Transport storage and Communications
9. Others
The methodology adopted for the extrapolation
to get the nine fold classification of workers in 2001
based on the workers classification in census 1991 is
described briefly here. The only two types of workers
included in both 1991 and 2001 census are the cultiva-
tors and agricultural laborers. The remaining two types
of workers in the 2001 census, house hold industrial
workers and other workers are totaled together and
this total is divided in to 7 classes of workers in the
same proportion as these 7 classes of workers as there
in the 1991 census. Then the number of male workers
in manufacturing, processing, servicing and repairs in
House hold industries, manufacturing, processing, ser-
vicing and repairs in other than house hold industries,
trade & commerce, transport, storage & communica-
tion and others are totaled to calculate the percentage
of male workers in non-agricultural activities in each of
the LSGs of the District. The details are shown in
Annexe-21. In order to avoid the possibility of errors,
i.e. exclusion of some of the actual urban area, the ex-
trapolation of the data to get classification of workers
based on 1991 census, is attempted only for the LSGs
with non-agricultural male workers more than 90% (in-
stead of 75%) is taken for the study. Based on this, there
are 45 LSGs identified in the District, which are satisfy-
ing the three-fold census criteria to be urban in imme-
diate future. The list of which is given below and the
spatial location of these LSGs is shown in fig 8.6.
1. Thrissur Municipal Corporation2. Methala3. Edavilangu
Fig 8.6: Urban Centers based on 3 fold Census Criteria
120
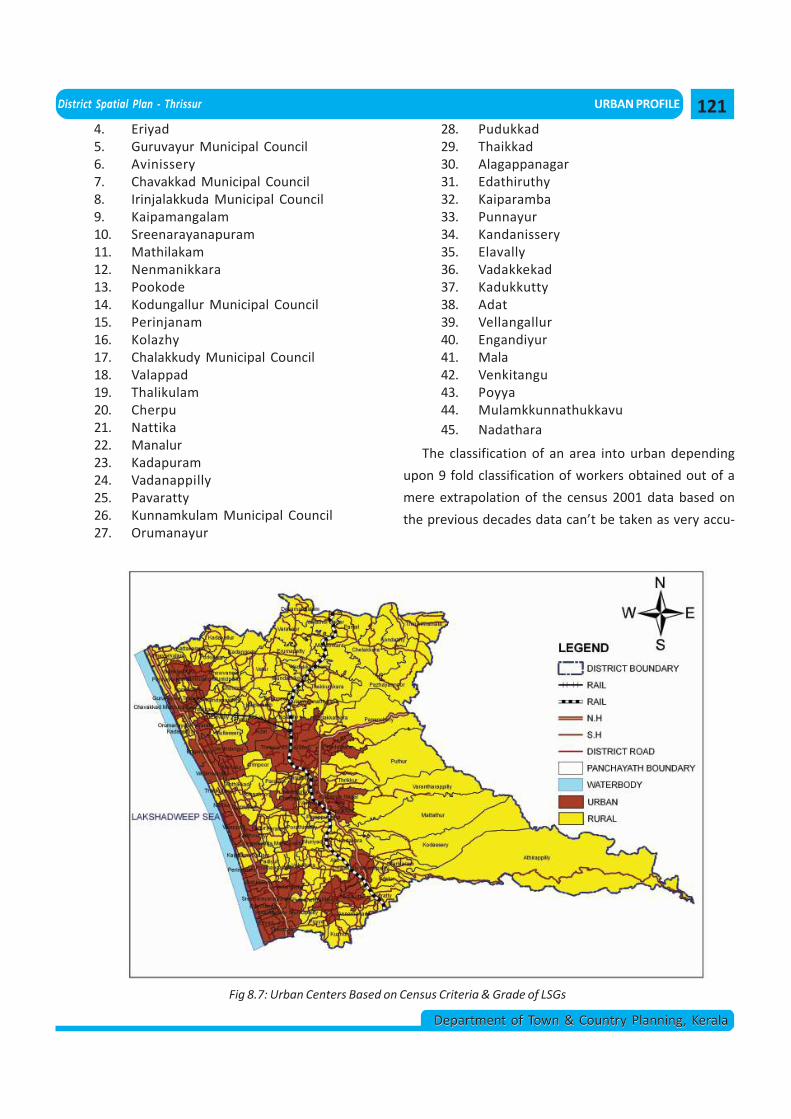
District Spatial Plan - Thrissur URBAN PROFILE
Department of Town & Country Planning, KeralaDepartment of Town & Country Planning, Kerala
4. Eriyad5. Guruvayur Municipal Council6. Avinissery7. Chavakkad Municipal Council8. Irinjalakkuda Municipal Council9. Kaipamangalam10. Sreenarayanapuram11. Mathilakam12. Nenmanikkara13. Pookode14. Kodungallur Municipal Council15. Perinjanam16. Kolazhy17. Chalakkudy Municipal Council18. Valappad19. Thalikulam20. Cherpu21. Nattika22. Manalur23. Kadapuram24. Vadanappilly25. Pavaratty26. Kunnamkulam Municipal Council27. Orumanayur
28. Pudukkad29. Thaikkad30. Alagappanagar31. Edathiruthy32. Kaiparamba33. Punnayur34. Kandanissery35. Elavally36. Vadakkekad37. Kadukkutty38. Adat39. Vellangallur40. Engandiyur41. Mala42. Venkitangu43. Poyya44. Mulamkkunnathukkavu45. Nadathara
The classification of an area into urban depending
upon 9 fold classification of workers obtained out of a
mere extrapolation of the census 2001 data based on
the previous decades data can’t be taken as very accu-
Fig 8.7: Urban Centers Based on Census Criteria & Grade of LSGs
121
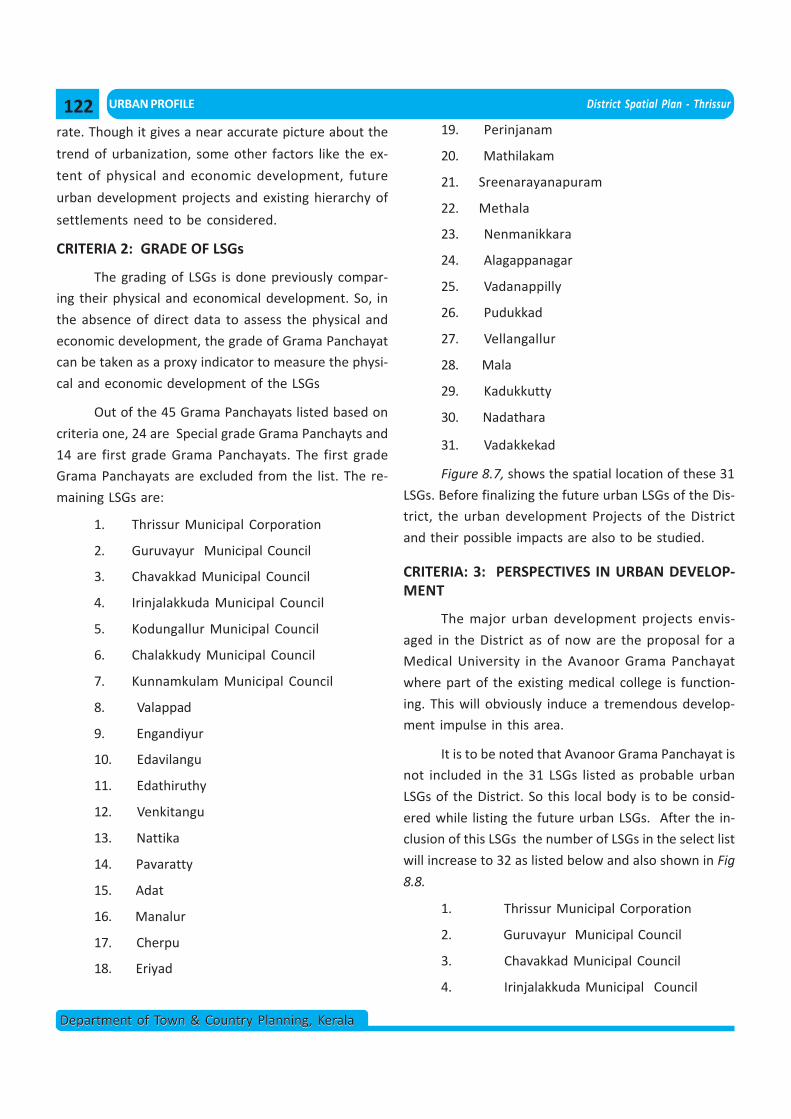
URBAN PROFILE District Spatial Plan - Thrissur
Department of Town & Country Planning, KeralaDepartment of Town & Country Planning, Kerala
rate. Though it gives a near accurate picture about the
trend of urbanization, some other factors like the ex-
tent of physical and economic development, future
urban development projects and existing hierarchy of
settlements need to be considered.
CRITERIA 2: GRADE OF LSGs
The grading of LSGs is done previously compar-
ing their physical and economical development. So, in
the absence of direct data to assess the physical and
economic development, the grade of Grama Panchayat
can be taken as a proxy indicator to measure the physi-
cal and economic development of the LSGs
Out of the 45 Grama Panchayats listed based on
criteria one, 24 are Special grade Grama Panchayts and
14 are first grade Grama Panchayats. The first grade
Grama Panchayats are excluded from the list. The re-
maining LSGs are:
1. Thrissur Municipal Corporation
2. Guruvayur Municipal Council
3. Chavakkad Municipal Council
4. Irinjalakkuda Municipal Council
5. Kodungallur Municipal Council
6. Chalakkudy Municipal Council
7. Kunnamkulam Municipal Council
8. Valappad
9. Engandiyur
10. Edavilangu
11. Edathiruthy
12. Venkitangu
13. Nattika
14. Pavaratty
15. Adat
16. Manalur
17. Cherpu
18. Eriyad
19. Perinjanam
20. Mathilakam
21. Sreenarayanapuram
22. Methala
23. Nenmanikkara
24. Alagappanagar
25. Vadanappilly
26. Pudukkad
27. Vellangallur
28. Mala
29. Kadukkutty
30. Nadathara
31. Vadakkekad
Figure 8.7, shows the spatial location of these 31
LSGs. Before finalizing the future urban LSGs of the Dis-
trict, the urban development Projects of the District
and their possible impacts are also to be studied.
CRITERIA: 3: PERSPECTIVES IN URBAN DEVELOP-MENT
The major urban development projects envis-
aged in the District as of now are the proposal for a
Medical University in the Avanoor Grama Panchayat
where part of the existing medical college is function-
ing. This will obviously induce a tremendous develop-
ment impulse in this area.
It is to be noted that Avanoor Grama Panchayat is
not included in the 31 LSGs listed as probable urban
LSGs of the District. So this local body is to be consid-
ered while listing the future urban LSGs. After the in-
clusion of this LSGs the number of LSGs in the select list
will increase to 32 as listed below and also shown in Fig
8.8.
1. Thrissur Municipal Corporation
2. Guruvayur Municipal Council
3. Chavakkad Municipal Council
4. Irinjalakkuda Municipal Council
122
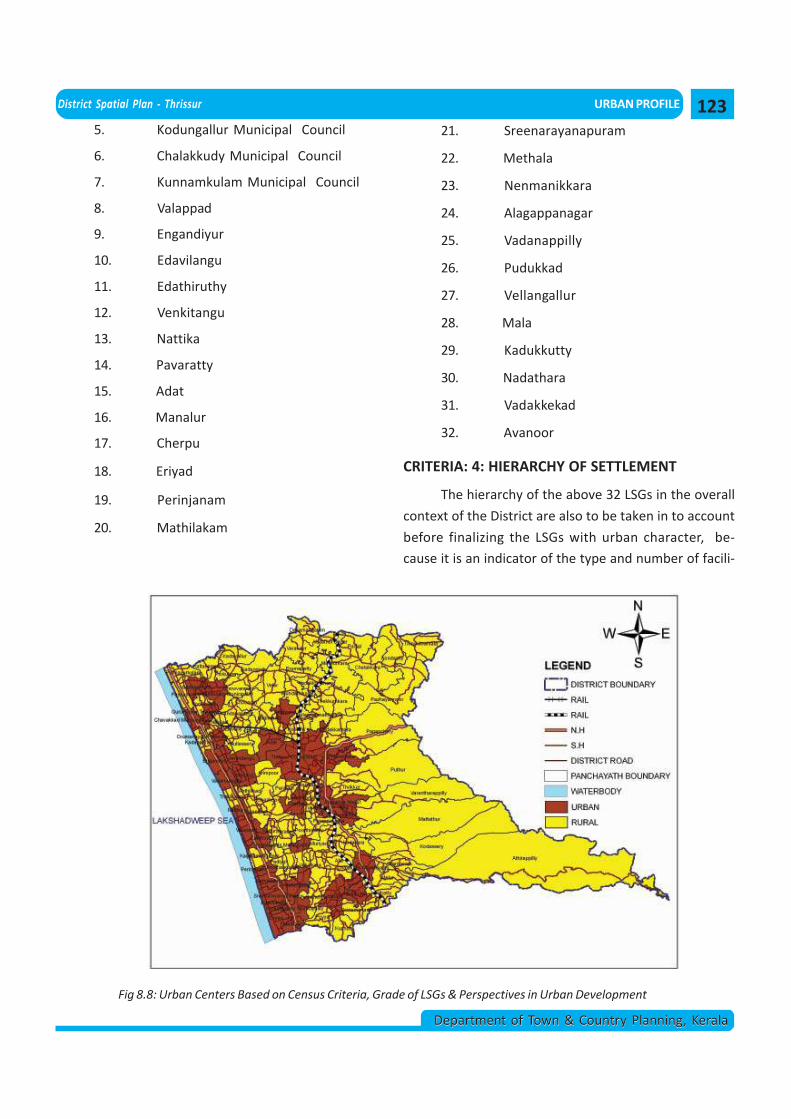
District Spatial Plan - Thrissur URBAN PROFILE
Department of Town & Country Planning, KeralaDepartment of Town & Country Planning, Kerala
5. Kodungallur Municipal Council
6. Chalakkudy Municipal Council
7. Kunnamkulam Municipal Council
8. Valappad
9. Engandiyur
10. Edavilangu
11. Edathiruthy
12. Venkitangu
13. Nattika
14. Pavaratty
15. Adat
16. Manalur
17. Cherpu
18. Eriyad
19. Perinjanam
20. Mathilakam
21. Sreenarayanapuram
22. Methala
23. Nenmanikkara
24. Alagappanagar
25. Vadanappilly
26. Pudukkad
27. Vellangallur
28. Mala
29. Kadukkutty
30. Nadathara
31. Vadakkekad
32. Avanoor
CRITERIA: 4: HIERARCHY OF SETTLEMENT
The hierarchy of the above 32 LSGs in the overall
context of the District are also to be taken in to account
before finalizing the LSGs with urban character, be-
cause it is an indicator of the type and number of facili-
Fig 8.8: Urban Centers Based on Census Criteria, Grade of LSGs & Perspectives in Urban Development
123
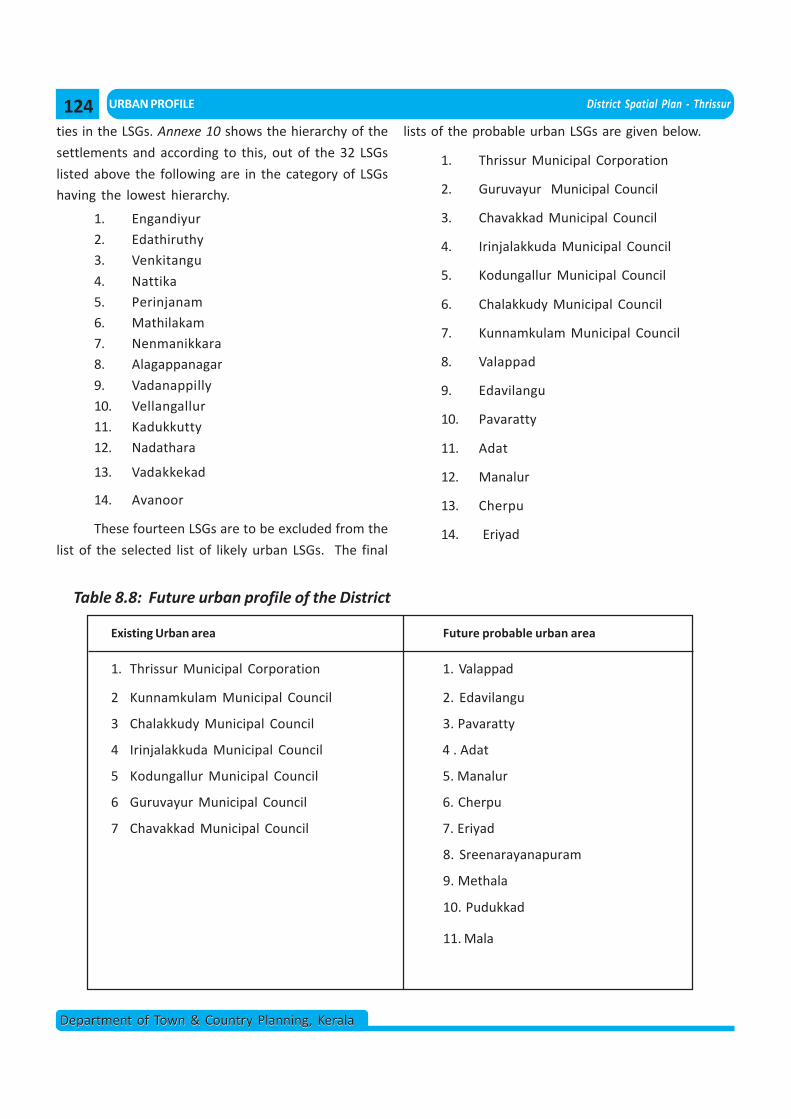
URBAN PROFILE District Spatial Plan - Thrissur
Department of Town & Country Planning, KeralaDepartment of Town & Country Planning, Kerala
ties in the LSGs. Annexe 10 shows the hierarchy of the
settlements and according to this, out of the 32 LSGs
listed above the following are in the category of LSGs
having the lowest hierarchy.
1. Engandiyur2. Edathiruthy3. Venkitangu
4. Nattika5. Perinjanam6. Mathilakam7. Nenmanikkara8. Alagappanagar
9. Vadanappilly10. Vellangallur11. Kadukkutty12. Nadathara
13. Vadakkekad
14. Avanoor
These fourteen LSGs are to be excluded from the
list of the selected list of likely urban LSGs. The final
lists of the probable urban LSGs are given below.
1. Thrissur Municipal Corporation
2. Guruvayur Municipal Council
3. Chavakkad Municipal Council
4. Irinjalakkuda Municipal Council
5. Kodungallur Municipal Council
6. Chalakkudy Municipal Council
7. Kunnamkulam Municipal Council
8. Valappad
9. Edavilangu
10. Pavaratty
11. Adat
12. Manalur
13. Cherpu
14. Eriyad
Table 8.8: Future urban profile of the District
Existing Urban area Future probable urban area
1. Thrissur Municipal Corporation 1. Valappad
2 Kunnamkulam Municipal Council 2. Edavilangu
3 Chalakkudy Municipal Council 3. Pavaratty
4 Irinjalakkuda Municipal Council 4 . Adat
5 Kodungallur Municipal Council 5. Manalur
6 Guruvayur Municipal Council 6. Cherpu
7 Chavakkad Municipal Council 7. Eriyad
8. Sreenarayanapuram
9. Methala
10. Pudukkad
11. Mala
124
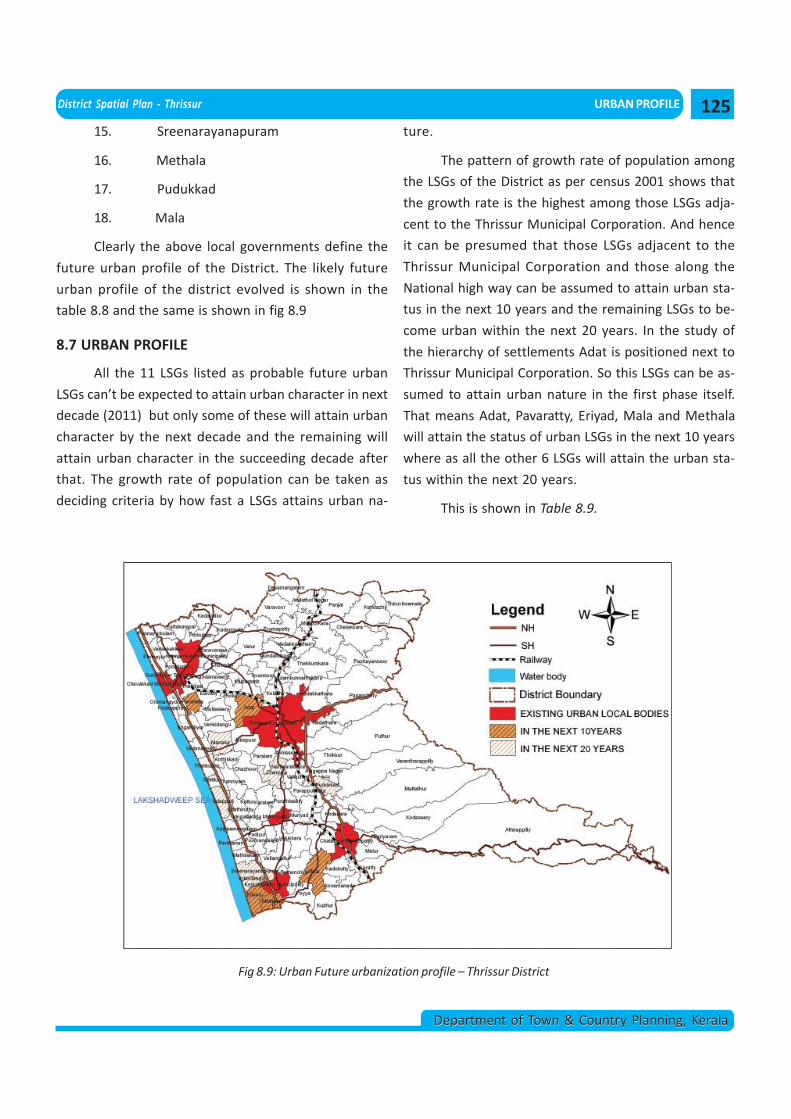
District Spatial Plan - Thrissur URBAN PROFILE
Department of Town & Country Planning, KeralaDepartment of Town & Country Planning, Kerala
Fig 8.9: Urban Future urbanization profile – Thrissur District
15. Sreenarayanapuram
16. Methala
17. Pudukkad
18. Mala
Clearly the above local governments define the
future urban profile of the District. The likely future
urban profile of the district evolved is shown in the
table 8.8 and the same is shown in fig 8.9
8.7 URBAN PROFILE
All the 11 LSGs listed as probable future urban
LSGs can’t be expected to attain urban character in next
decade (2011) but only some of these will attain urban
character by the next decade and the remaining will
attain urban character in the succeeding decade after
that. The growth rate of population can be taken as
deciding criteria by how fast a LSGs attains urban na-
ture.
The pattern of growth rate of population among
the LSGs of the District as per census 2001 shows that
the growth rate is the highest among those LSGs adja-
cent to the Thrissur Municipal Corporation. And hence
it can be presumed that those LSGs adjacent to the
Thrissur Municipal Corporation and those along the
National high way can be assumed to attain urban sta-
tus in the next 10 years and the remaining LSGs to be-
come urban within the next 20 years. In the study of
the hierarchy of settlements Adat is positioned next to
Thrissur Municipal Corporation. So this LSGs can be as-
sumed to attain urban nature in the first phase itself.
That means Adat, Pavaratty, Eriyad, Mala and Methala
will attain the status of urban LSGs in the next 10 years
where as all the other 6 LSGs will attain the urban sta-
tus within the next 20 years.
This is shown in Table 8.9.
125
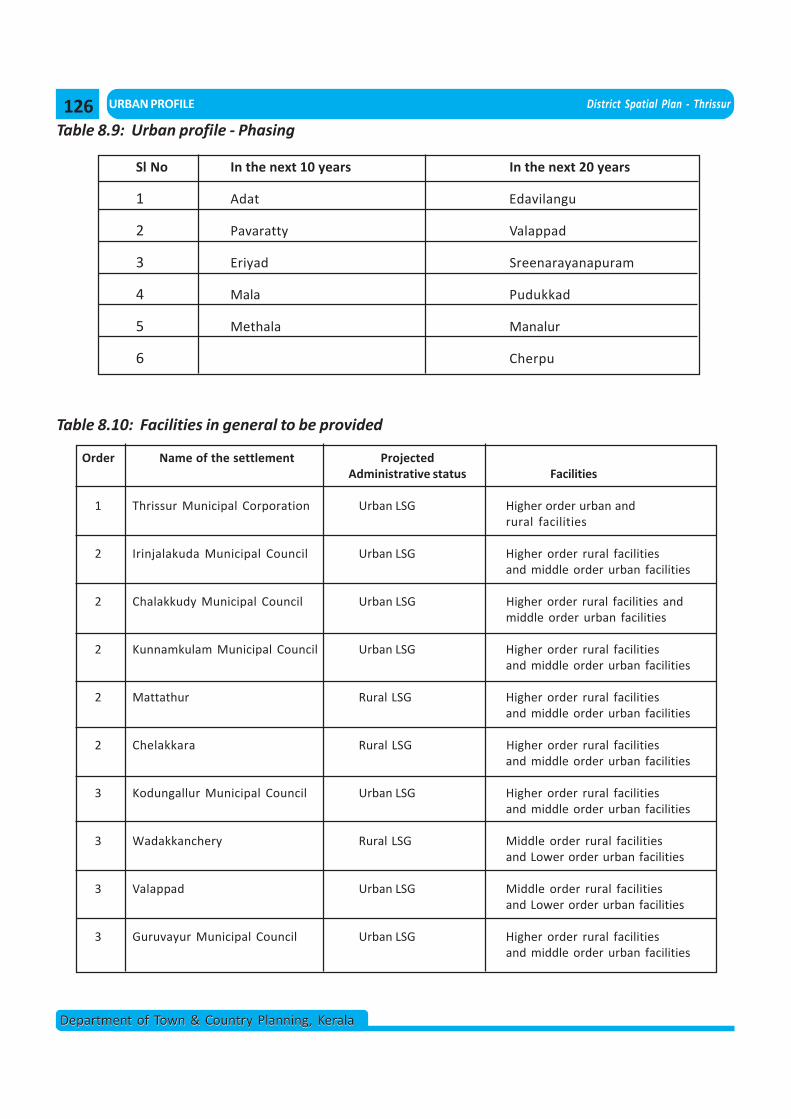
URBAN PROFILE District Spatial Plan - Thrissur
Department of Town & Country Planning, KeralaDepartment of Town & Country Planning, Kerala
Order Name of the settlement ProjectedAdministrative status Facilities
1 Thrissur Municipal Corporation Urban LSG Higher order urban andrural facilities
2 Irinjalakuda Municipal Council Urban LSG Higher order rural facilitiesand middle order urban facilities
2 Chalakkudy Municipal Council Urban LSG Higher order rural facilities andmiddle order urban facilities
2 Kunnamkulam Municipal Council Urban LSG Higher order rural facilitiesand middle order urban facilities
2 Mattathur Rural LSG Higher order rural facilitiesand middle order urban facilities
2 Chelakkara Rural LSG Higher order rural facilitiesand middle order urban facilities
3 Kodungallur Municipal Council Urban LSG Higher order rural facilitiesand middle order urban facilities
3 Wadakkanchery Rural LSG Middle order rural facilitiesand Lower order urban facilities
3 Valappad Urban LSG Middle order rural facilitiesand Lower order urban facilities
3 Guruvayur Municipal Council Urban LSG Higher order rural facilitiesand middle order urban facilities
Table 8.10: Facilities in general to be provided
Table 8.9: Urban profile - Phasing
Sl No In the next 10 years In the next 20 years
1 Adat Edavilangu
2 Pavaratty Valappad
3 Eriyad Sreenarayanapuram
4 Mala Pudukkad
5 Methala Manalur
6 Cherpu
126
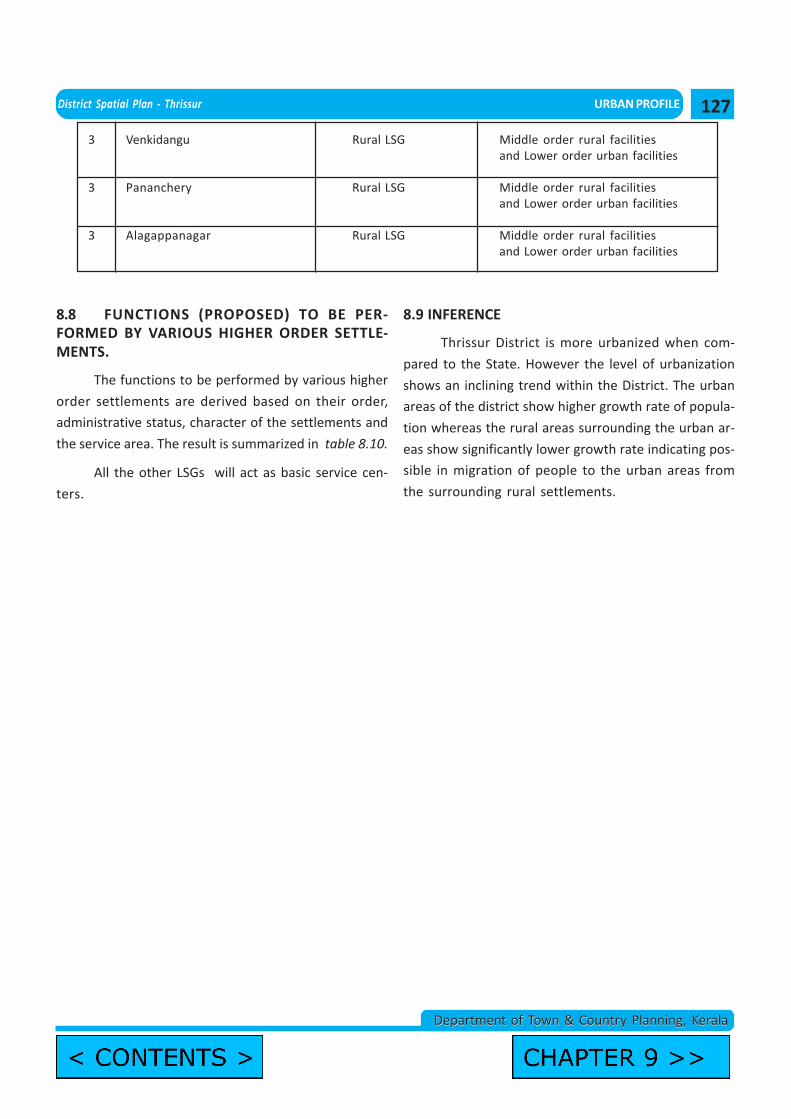
District Spatial Plan - Thrissur URBAN PROFILE
Department of Town & Country Planning, KeralaDepartment of Town & Country Planning, Kerala
8.8 FUNCTIONS (PROPOSED) TO BE PER-FORMED BY VARIOUS HIGHER ORDER SETTLE-MENTS.
The functions to be performed by various higher
order settlements are derived based on their order,
administrative status, character of the settlements and
the service area. The result is summarized in table 8.10.
All the other LSGs will act as basic service cen-
ters.
8.9 INFERENCE
Thrissur District is more urbanized when com-
pared to the State. However the level of urbanization
shows an inclining trend within the District. The urban
areas of the district show higher growth rate of popula-
tion whereas the rural areas surrounding the urban ar-
eas show significantly lower growth rate indicating pos-
sible in migration of people to the urban areas from
the surrounding rural settlements.
3 Venkidangu Rural LSG Middle order rural facilitiesand Lower order urban facilities
3 Pananchery Rural LSG Middle order rural facilitiesand Lower order urban facilities
3 Alagappanagar Rural LSG Middle order rural facilitiesand Lower order urban facilities
127
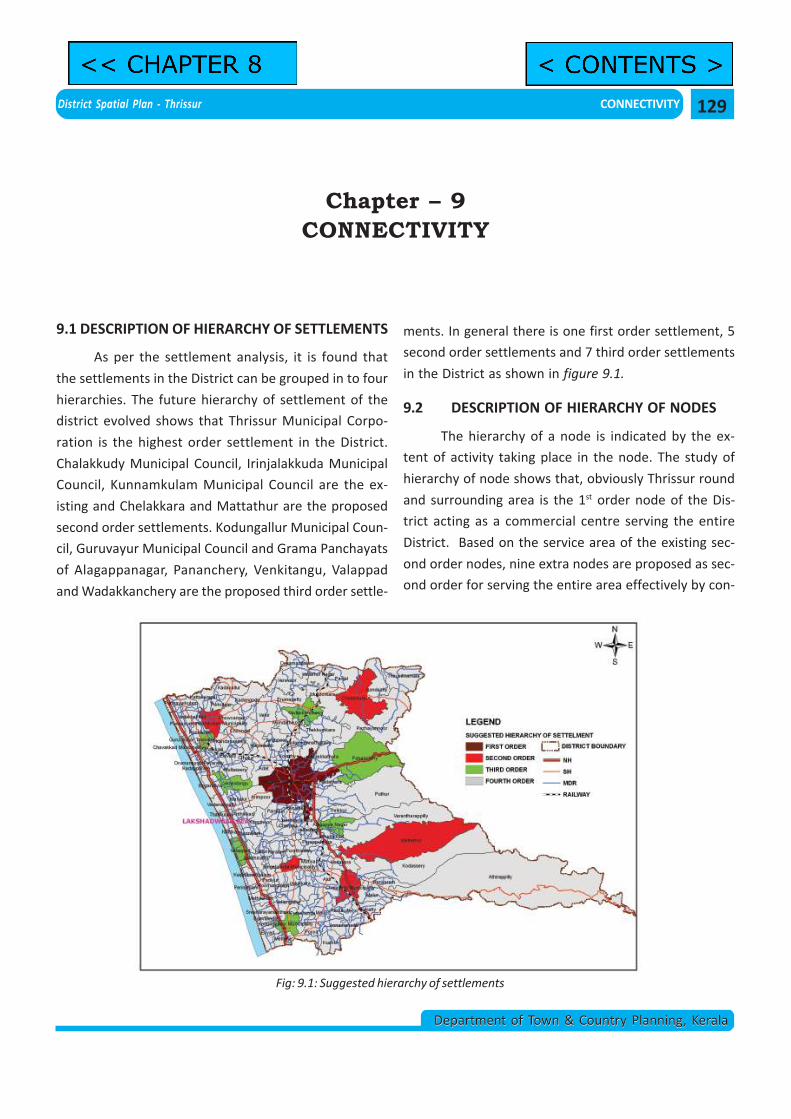
District Spatial Plan - Thrissur CONNECTIVITY
Department of Town & Country Planning, KeralaDepartment of Town & Country Planning, Kerala
9.1 DESCRIPTION OF HIERARCHY OF SETTLEMENTS
As per the settlement analysis, it is found that
the settlements in the District can be grouped in to four
hierarchies. The future hierarchy of settlement of the
district evolved shows that Thrissur Municipal Corpo-
ration is the highest order settlement in the District.
Chalakkudy Municipal Council, Irinjalakkuda Municipal
Council, Kunnamkulam Municipal Council are the ex-
isting and Chelakkara and Mattathur are the proposed
second order settlements. Kodungallur Municipal Coun-
cil, Guruvayur Municipal Council and Grama Panchayats
of Alagappanagar, Pananchery, Venkitangu, Valappad
and Wadakkanchery are the proposed third order settle-
Fig: 9.1: Suggested hierarchy of settlements
Chapter – 9CONNECTIVITY
ments. In general there is one first order settlement, 5
second order settlements and 7 third order settlements
in the District as shown in figure 9.1.
9.2 DESCRIPTION OF HIERARCHY OF NODES
The hierarchy of a node is indicated by the ex-
tent of activity taking place in the node. The study of
hierarchy of node shows that, obviously Thrissur round
and surrounding area is the 1st order node of the Dis-
trict acting as a commercial centre serving the entire
District. Based on the service area of the existing sec-
ond order nodes, nine extra nodes are proposed as sec-
ond order for serving the entire area effectively by con-
129
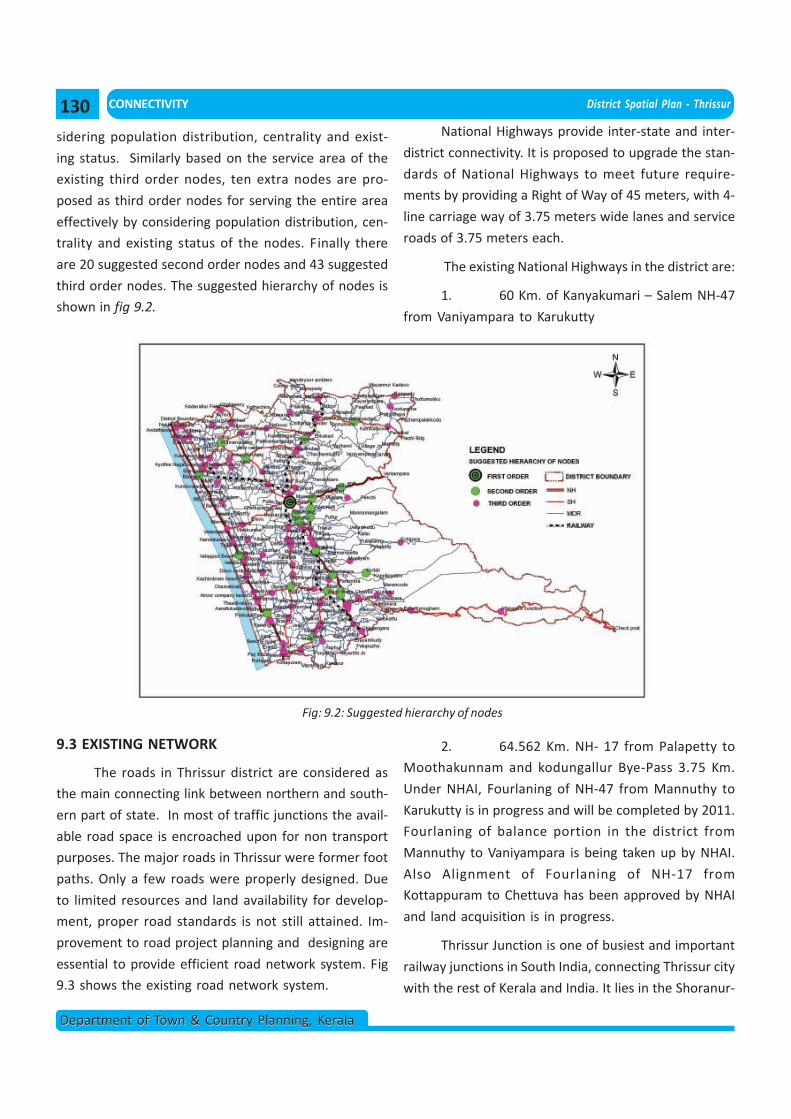
CONNECTIVITY District Spatial Plan - Thrissur
Department of Town & Country Planning, KeralaDepartment of Town & Country Planning, Kerala
sidering population distribution, centrality and exist-
ing status. Similarly based on the service area of the
existing third order nodes, ten extra nodes are pro-
posed as third order nodes for serving the entire area
effectively by considering population distribution, cen-
trality and existing status of the nodes. Finally there
are 20 suggested second order nodes and 43 suggested
third order nodes. The suggested hierarchy of nodes is
shown in fig 9.2.
Fig: 9.2: Suggested hierarchy of nodes
9.3 EXISTING NETWORK
The roads in Thrissur district are considered as
the main connecting link between northern and south-
ern part of state. In most of traffic junctions the avail-
able road space is encroached upon for non transport
purposes. The major roads in Thrissur were former foot
paths. Only a few roads were properly designed. Due
to limited resources and land availability for develop-
ment, proper road standards is not still attained. Im-
provement to road project planning and designing are
essential to provide efficient road network system. Fig
9.3 shows the existing road network system.
National Highways provide inter-state and inter-
district connectivity. It is proposed to upgrade the stan-
dards of National Highways to meet future require-
ments by providing a Right of Way of 45 meters, with 4-
line carriage way of 3.75 meters wide lanes and service
roads of 3.75 meters each.
The existing National Highways in the district are:
1. 60 Km. of Kanyakumari – Salem NH-47
from Vaniyampara to Karukutty
2. 64.562 Km. NH- 17 from Palapetty to
Moothakunnam and kodungallur Bye-Pass 3.75 Km.
Under NHAI, Fourlaning of NH-47 from Mannuthy to
Karukutty is in progress and will be completed by 2011.
Fourlaning of balance portion in the district from
Mannuthy to Vaniyampara is being taken up by NHAI.
Also Alignment of Fourlaning of NH-17 from
Kottappuram to Chettuva has been approved by NHAI
and land acquisition is in progress.
Thrissur Junction is one of busiest and important
railway junctions in South India, connecting Thrissur city
with the rest of Kerala and India. It lies in the Shoranur-
130
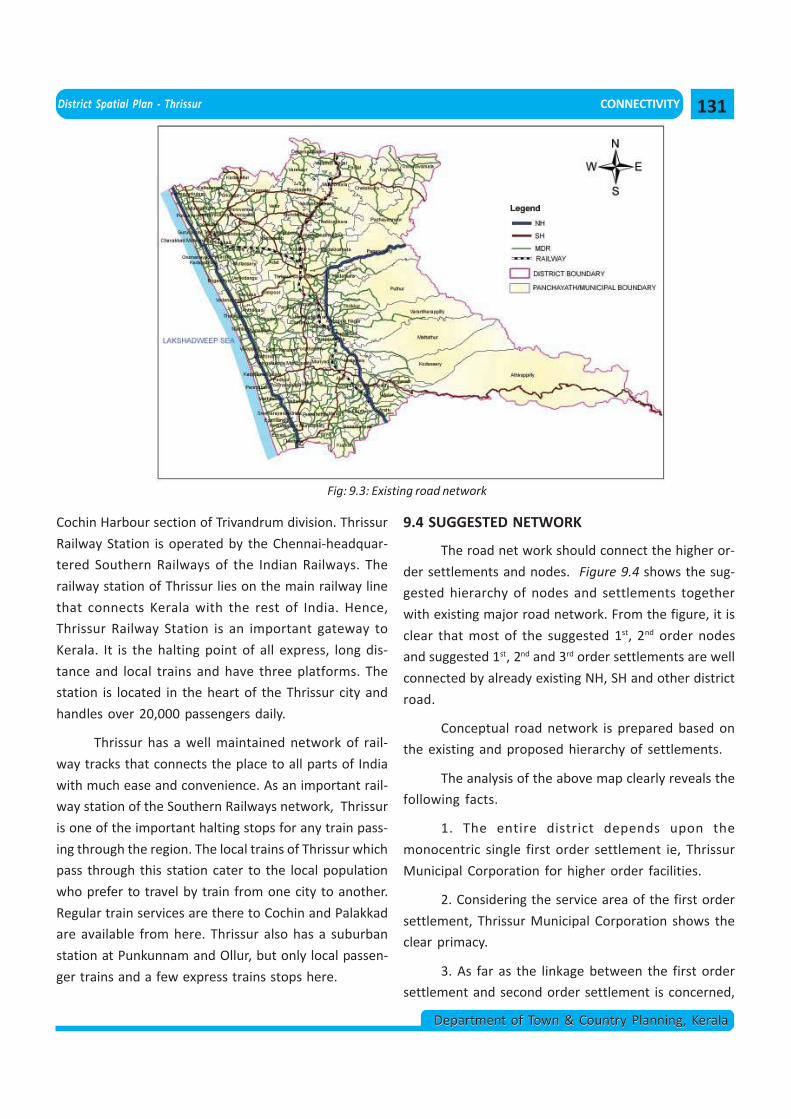
District Spatial Plan - Thrissur CONNECTIVITY
Department of Town & Country Planning, KeralaDepartment of Town & Country Planning, Kerala
Cochin Harbour section of Trivandrum division. Thrissur
Railway Station is operated by the Chennai-headquar-
tered Southern Railways of the Indian Railways. The
railway station of Thrissur lies on the main railway line
that connects Kerala with the rest of India. Hence,
Thrissur Railway Station is an important gateway to
Kerala. It is the halting point of all express, long dis-
tance and local trains and have three platforms. The
station is located in the heart of the Thrissur city and
handles over 20,000 passengers daily.
Thrissur has a well maintained network of rail-
way tracks that connects the place to all parts of India
with much ease and convenience. As an important rail-
way station of the Southern Railways network, Thrissur
is one of the important halting stops for any train pass-
ing through the region. The local trains of Thrissur which
pass through this station cater to the local population
who prefer to travel by train from one city to another.
Regular train services are there to Cochin and Palakkad
are available from here. Thrissur also has a suburban
station at Punkunnam and Ollur, but only local passen-
ger trains and a few express trains stops here.
9.4 SUGGESTED NETWORK
The road net work should connect the higher or-
der settlements and nodes. Figure 9.4 shows the sug-
gested hierarchy of nodes and settlements together
with existing major road network. From the figure, it is
clear that most of the suggested 1st, 2nd order nodes
and suggested 1st, 2nd and 3rd order settlements are well
connected by already existing NH, SH and other district
road.
Conceptual road network is prepared based on
the existing and proposed hierarchy of settlements.
The analysis of the above map clearly reveals the
following facts.
1. The entire district depends upon the
monocentric single first order settlement ie, Thrissur
Municipal Corporation for higher order facilities.
2. Considering the service area of the first order
settlement, Thrissur Municipal Corporation shows the
clear primacy.
3. As far as the linkage between the first order
settlement and second order settlement is concerned,
Fig: 9.3: Existing road network
131
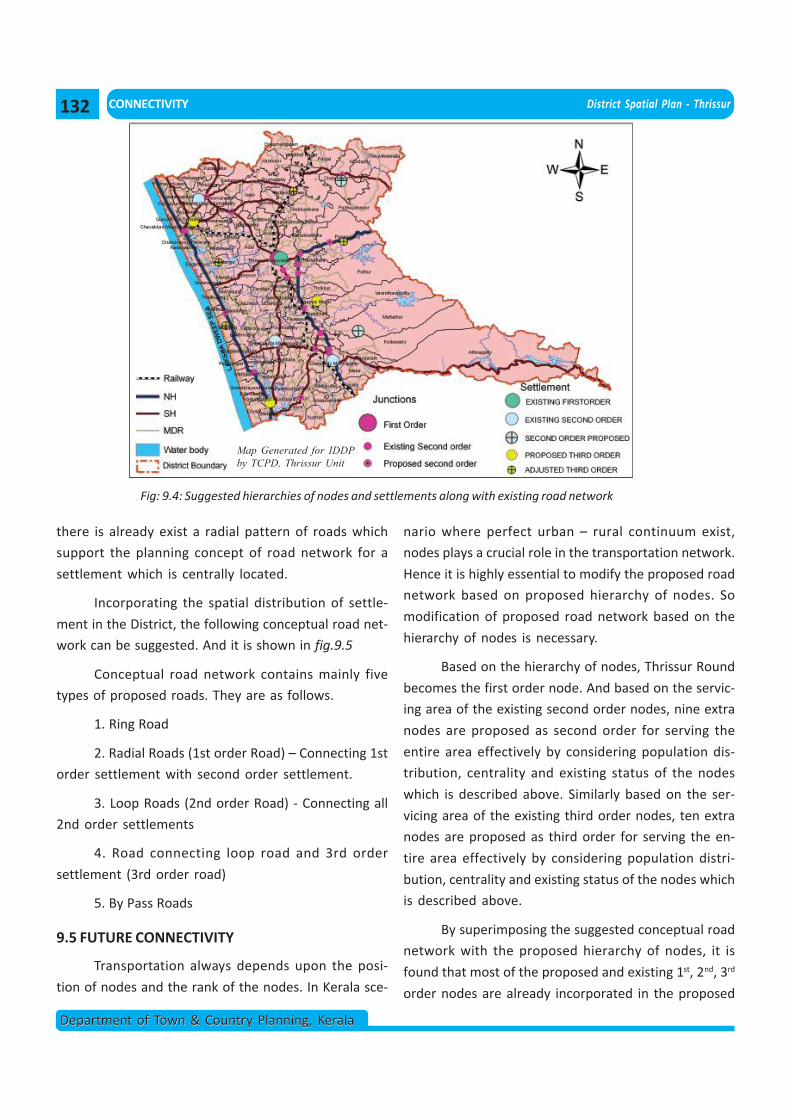
CONNECTIVITY District Spatial Plan - Thrissur
Department of Town & Country Planning, KeralaDepartment of Town & Country Planning, Kerala
Fig: 9.4: Suggested hierarchies of nodes and settlements along with existing road network
there is already exist a radial pattern of roads which
support the planning concept of road network for a
settlement which is centrally located.
Incorporating the spatial distribution of settle-
ment in the District, the following conceptual road net-
work can be suggested. And it is shown in fig.9.5
Conceptual road network contains mainly five
types of proposed roads. They are as follows.
1. Ring Road
2. Radial Roads (1st order Road) – Connecting 1st
order settlement with second order settlement.
3. Loop Roads (2nd order Road) - Connecting all
2nd order settlements
4. Road connecting loop road and 3rd order
settlement (3rd order road)
5. By Pass Roads
9.5 FUTURE CONNECTIVITY
Transportation always depends upon the posi-
tion of nodes and the rank of the nodes. In Kerala sce-
nario where perfect urban – rural continuum exist,
nodes plays a crucial role in the transportation network.
Hence it is highly essential to modify the proposed road
network based on proposed hierarchy of nodes. So
modification of proposed road network based on the
hierarchy of nodes is necessary.
Based on the hierarchy of nodes, Thrissur Round
becomes the first order node. And based on the servic-
ing area of the existing second order nodes, nine extra
nodes are proposed as second order for serving the
entire area effectively by considering population dis-
tribution, centrality and existing status of the nodes
which is described above. Similarly based on the ser-
vicing area of the existing third order nodes, ten extra
nodes are proposed as third order for serving the en-
tire area effectively by considering population distri-
bution, centrality and existing status of the nodes which
is described above.
By superimposing the suggested conceptual road
network with the proposed hierarchy of nodes, it is
found that most of the proposed and existing 1st, 2nd, 3rd
order nodes are already incorporated in the proposed
Map Generated for IDDPby TCPD, Thrissur Unit
132
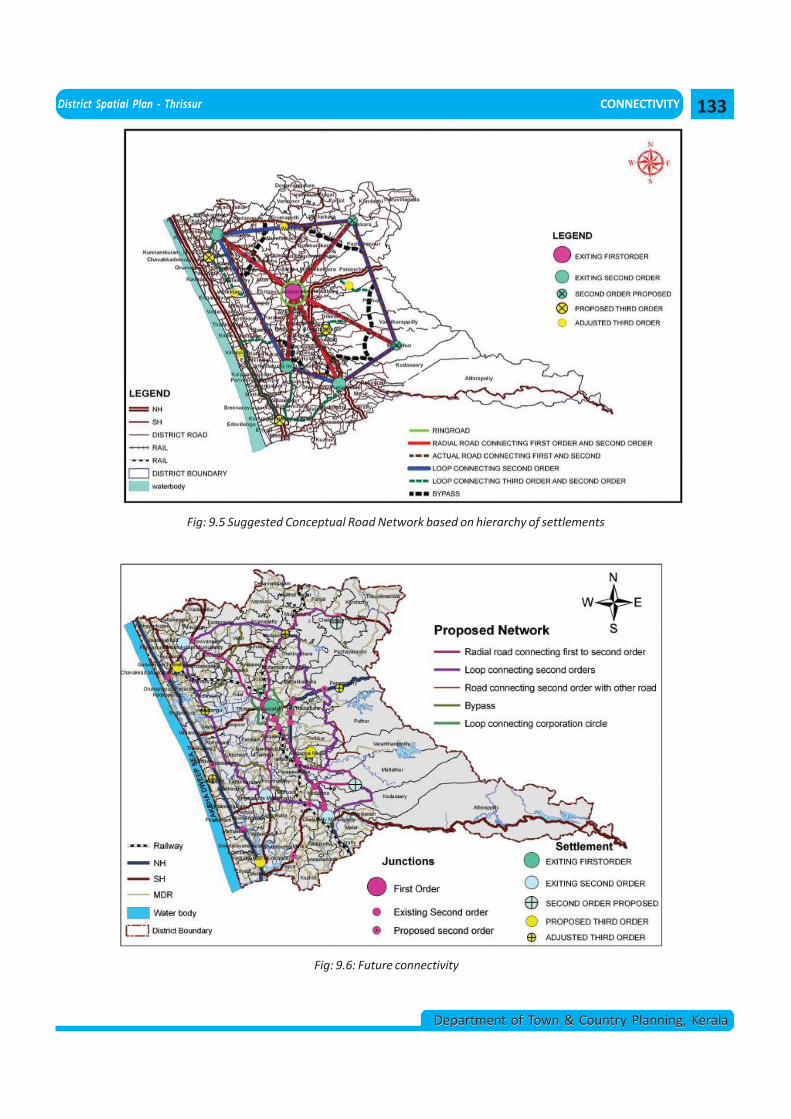
District Spatial Plan - Thrissur CONNECTIVITY
Department of Town & Country Planning, KeralaDepartment of Town & Country Planning, Kerala
Fig: 9.5 Suggested Conceptual Road Network based on hierarchy of settlements
Fig: 9.6: Future connectivity
133
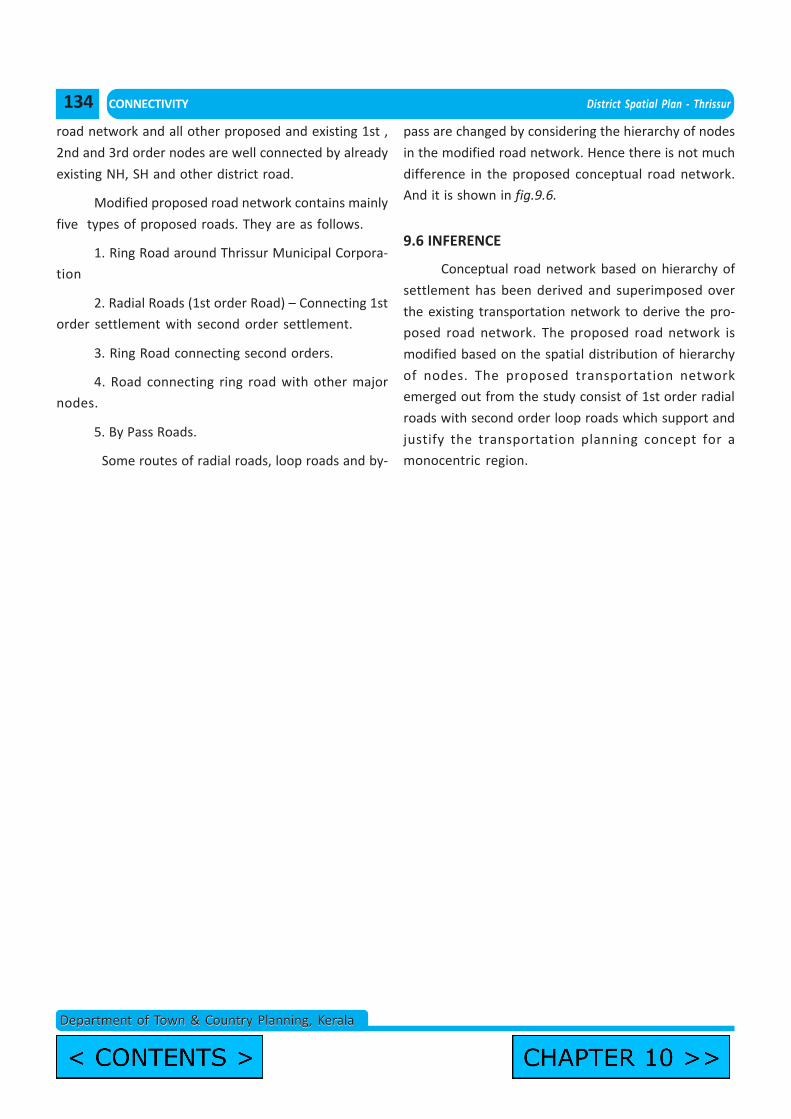
CONNECTIVITY District Spatial Plan - Thrissur
Department of Town & Country Planning, KeralaDepartment of Town & Country Planning, Kerala
road network and all other proposed and existing 1st ,
2nd and 3rd order nodes are well connected by already
existing NH, SH and other district road.
Modified proposed road network contains mainly
five types of proposed roads. They are as follows.
1. Ring Road around Thrissur Municipal Corpora-
tion
2. Radial Roads (1st order Road) – Connecting 1st
order settlement with second order settlement.
3. Ring Road connecting second orders.
4. Road connecting ring road with other major
nodes.
5. By Pass Roads.
Some routes of radial roads, loop roads and by-
pass are changed by considering the hierarchy of nodes
in the modified road network. Hence there is not much
difference in the proposed conceptual road network.
And it is shown in fig.9.6.
9.6 INFERENCE
Conceptual road network based on hierarchy of
settlement has been derived and superimposed over
the existing transportation network to derive the pro-
posed road network. The proposed road network is
modified based on the spatial distribution of hierarchy
of nodes. The proposed transportation network
emerged out from the study consist of 1st order radial
roads with second order loop roads which support and
justify the transportation planning concept for a
monocentric region.
134
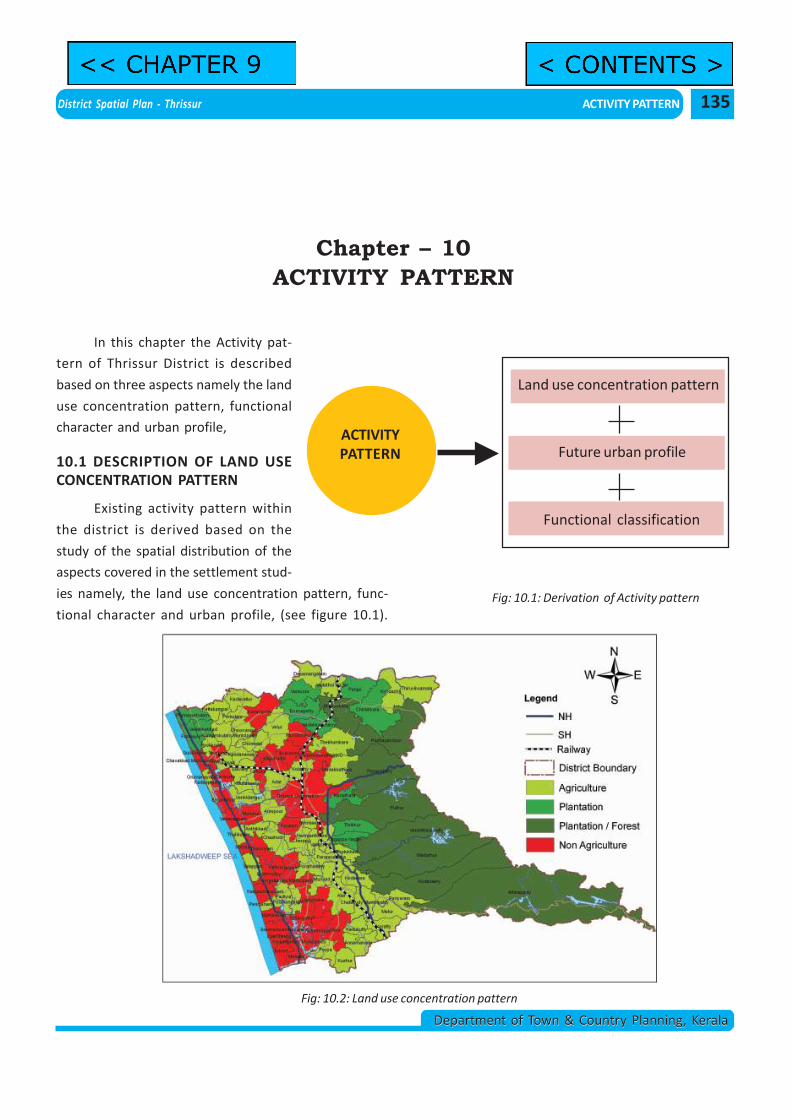
District Spatial Plan - Thrissur ACTIVITY PATTERN
Department of Town & Country Planning, KeralaDepartment of Town & Country Planning, Kerala
Chapter – 10ACTIVITY PATTERN
Fig: 10.1: Derivation of Activity pattern
In this chapter the Activity pat-
tern of Thrissur District is described
based on three aspects namely the land
use concentration pattern, functional
character and urban profile,
10.1 DESCRIPTION OF LAND USECONCENTRATION PATTERN
Existing activity pattern within
the district is derived based on the
study of the spatial distribution of the
aspects covered in the settlement stud-
ies namely, the land use concentration pattern, func-
tional character and urban profile, (see figure 10.1).
Fig: 10.2: Land use concentration pattern
Map Generated for IDDP by TCPD, Thrissur Unit
ACTIVITYPATTERN
Land use concentration pattern
Future urban profile
Functional classification
135
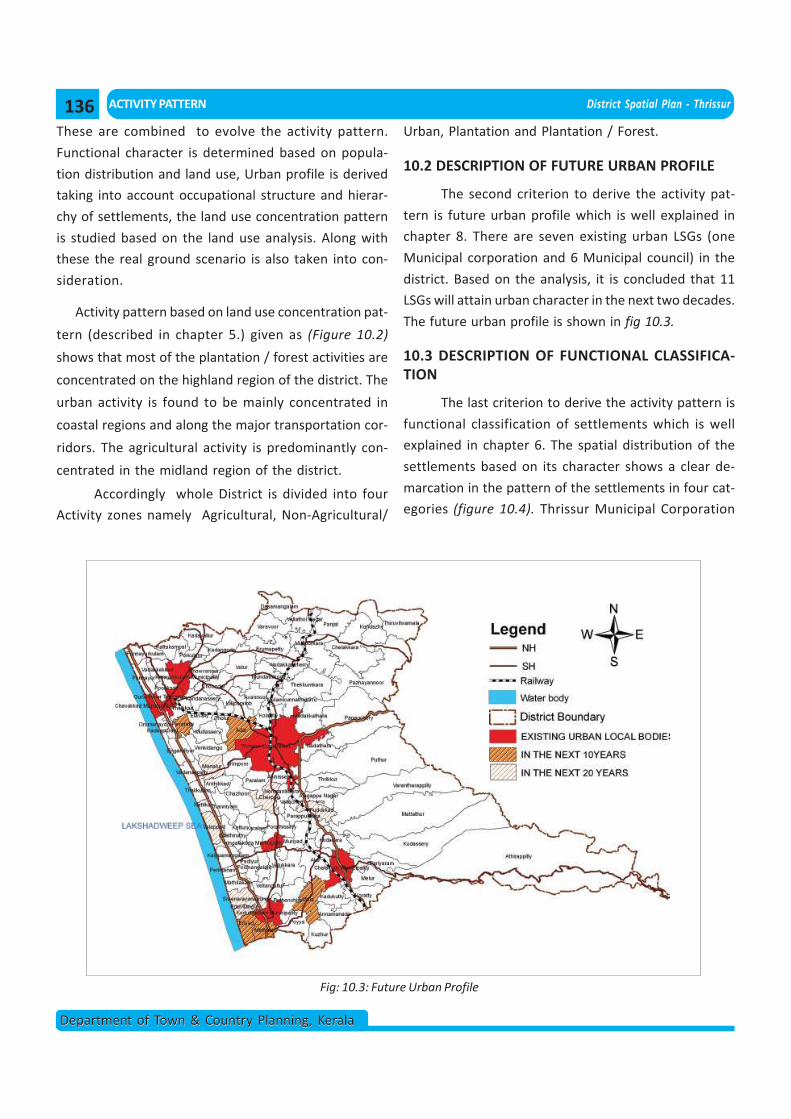
ACTIVITY PATTERN District Spatial Plan - Thrissur
Department of Town & Country Planning, KeralaDepartment of Town & Country Planning, Kerala
These are combined to evolve the activity pattern.
Functional character is determined based on popula-
tion distribution and land use, Urban profile is derived
taking into account occupational structure and hierar-
chy of settlements, the land use concentration pattern
is studied based on the land use analysis. Along with
these the real ground scenario is also taken into con-
sideration.
Activity pattern based on land use concentration pat-
tern (described in chapter 5.) given as (Figure 10.2)
shows that most of the plantation / forest activities are
concentrated on the highland region of the district. The
urban activity is found to be mainly concentrated in
coastal regions and along the major transportation cor-
ridors. The agricultural activity is predominantly con-
centrated in the midland region of the district.
Accordingly whole District is divided into four
Activity zones namely Agricultural, Non-Agricultural/
Fig: 10.3: Future Urban Profile
Urban, Plantation and Plantation / Forest.
10.2 DESCRIPTION OF FUTURE URBAN PROFILE
The second criterion to derive the activity pat-
tern is future urban profile which is well explained in
chapter 8. There are seven existing urban LSGs (one
Municipal corporation and 6 Municipal council) in the
district. Based on the analysis, it is concluded that 11
LSGs will attain urban character in the next two decades.
The future urban profile is shown in fig 10.3.
10.3 DESCRIPTION OF FUNCTIONAL CLASSIFICA-TION
The last criterion to derive the activity pattern is
functional classification of settlements which is well
explained in chapter 6. The spatial distribution of the
settlements based on its character shows a clear de-
marcation in the pattern of the settlements in four cat-
egories (figure 10.4). Thrissur Municipal Corporation
136
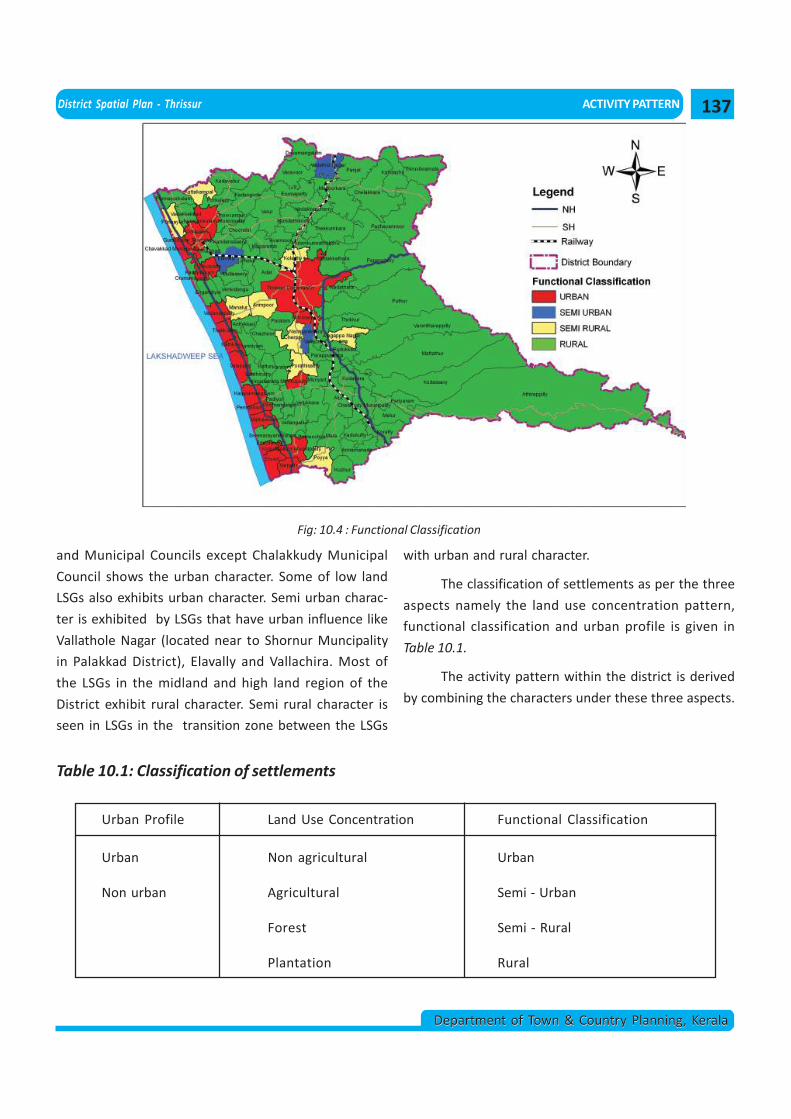
District Spatial Plan - Thrissur ACTIVITY PATTERN
Department of Town & Country Planning, KeralaDepartment of Town & Country Planning, Kerala
and Municipal Councils except Chalakkudy Municipal
Council shows the urban character. Some of low land
LSGs also exhibits urban character. Semi urban charac-
ter is exhibited by LSGs that have urban influence like
Vallathole Nagar (located near to Shornur Muncipality
in Palakkad District), Elavally and Vallachira. Most of
the LSGs in the midland and high land region of the
District exhibit rural character. Semi rural character is
seen in LSGs in the transition zone between the LSGs
Fig: 10.4 : Functional Classification
Table 10.1: Classification of settlements
Urban Profile Land Use Concentration Functional Classification
Urban Non agricultural Urban
Non urban Agricultural Semi - Urban
Forest Semi - Rural
Plantation Rural
with urban and rural character.
The classification of settlements as per the three
aspects namely the land use concentration pattern,
functional classification and urban profile is given in
Table 10.1.
The activity pattern within the district is derived
by combining the characters under these three aspects.
137
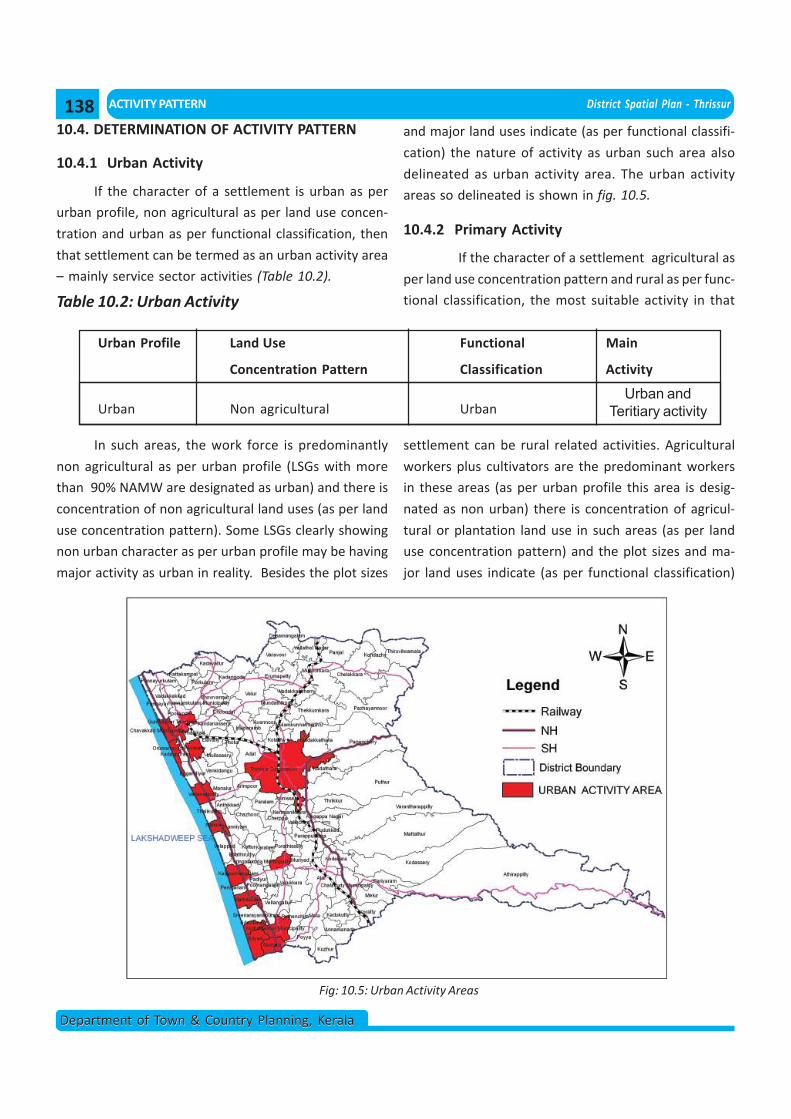
ACTIVITY PATTERN District Spatial Plan - Thrissur
Department of Town & Country Planning, KeralaDepartment of Town & Country Planning, Kerala
10.4. DETERMINATION OF ACTIVITY PATTERN
10.4.1 Urban Activity
If the character of a settlement is urban as per
urban profile, non agricultural as per land use concen-
tration and urban as per functional classification, then
that settlement can be termed as an urban activity area
– mainly service sector activities (Table 10.2).
Table 10.2: Urban Activity
Urban Profile Land Use Functional Main
Concentration Pattern Classification Activity
Urban Non agricultural UrbanUrban and
Teritiary activity
In such areas, the work force is predominantly
non agricultural as per urban profile (LSGs with more
than 90% NAMW are designated as urban) and there is
concentration of non agricultural land uses (as per land
use concentration pattern). Some LSGs clearly showing
non urban character as per urban profile may be having
major activity as urban in reality. Besides the plot sizes
Fig: 10.5: Urban Activity Areas
and major land uses indicate (as per functional classifi-
cation) the nature of activity as urban such area also
delineated as urban activity area. The urban activity
areas so delineated is shown in fig. 10.5.
10.4.2 Primary Activity
If the character of a settlement agricultural as
per land use concentration pattern and rural as per func-
tional classification, the most suitable activity in that
settlement can be rural related activities. Agricultural
workers plus cultivators are the predominant workers
in these areas (as per urban profile this area is desig-
nated as non urban) there is concentration of agricul-
tural or plantation land use in such areas (as per land
use concentration pattern) and the plot sizes and ma-
jor land uses indicate (as per functional classification)
138
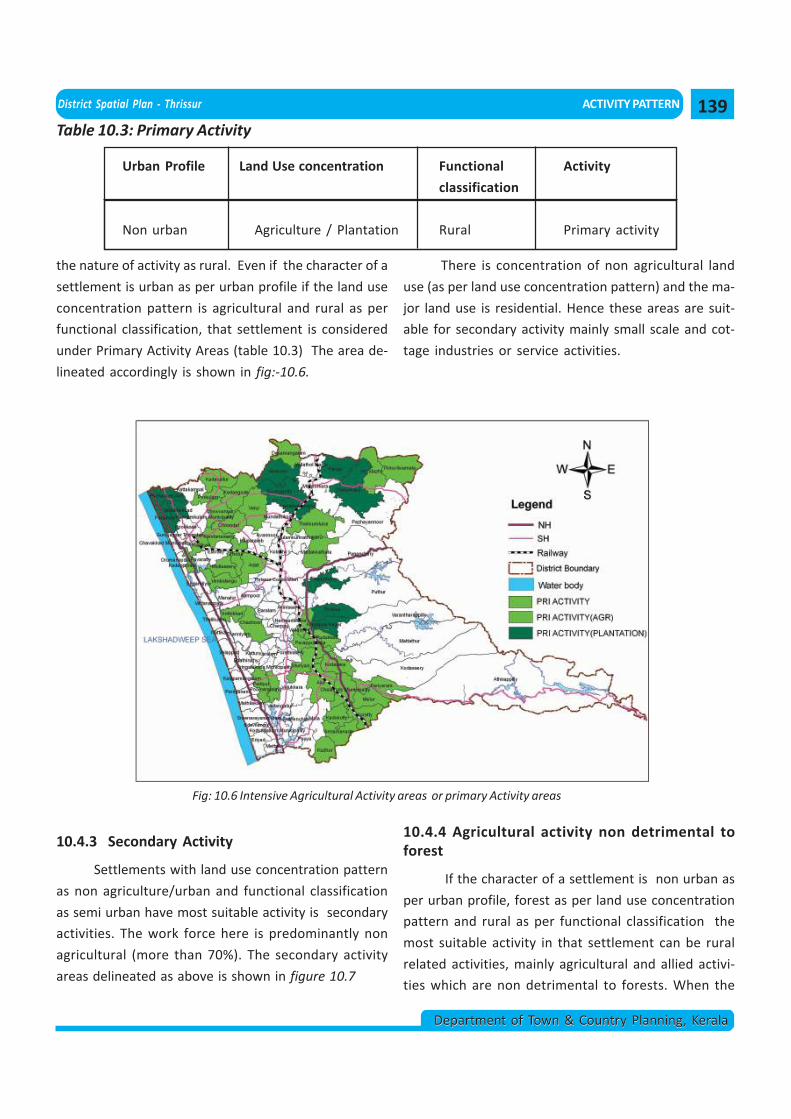
District Spatial Plan - Thrissur ACTIVITY PATTERN
Department of Town & Country Planning, KeralaDepartment of Town & Country Planning, Kerala
Table 10.3: Primary Activity
Urban Profile Land Use concentration Functional Activity
classification
Non urban Agriculture / Plantation Rural Primary activity
the nature of activity as rural. Even if the character of a
settlement is urban as per urban profile if the land use
concentration pattern is agricultural and rural as per
functional classification, that settlement is considered
under Primary Activity Areas (table 10.3) The area de-
lineated accordingly is shown in fig:-10.6.
Fig: 10.6 Intensive Agricultural Activity areas or primary Activity areas
10.4.3 Secondary Activity
Settlements with land use concentration pattern
as non agriculture/urban and functional classification
as semi urban have most suitable activity is secondary
activities. The work force here is predominantly non
agricultural (more than 70%). The secondary activity
areas delineated as above is shown in figure 10.7
There is concentration of non agricultural land
use (as per land use concentration pattern) and the ma-
jor land use is residential. Hence these areas are suit-
able for secondary activity mainly small scale and cot-
tage industries or service activities.
10.4.4 Agricultural activity non detrimental toforest
If the character of a settlement is non urban as
per urban profile, forest as per land use concentration
pattern and rural as per functional classification the
most suitable activity in that settlement can be rural
related activities, mainly agricultural and allied activi-
ties which are non detrimental to forests. When the
139
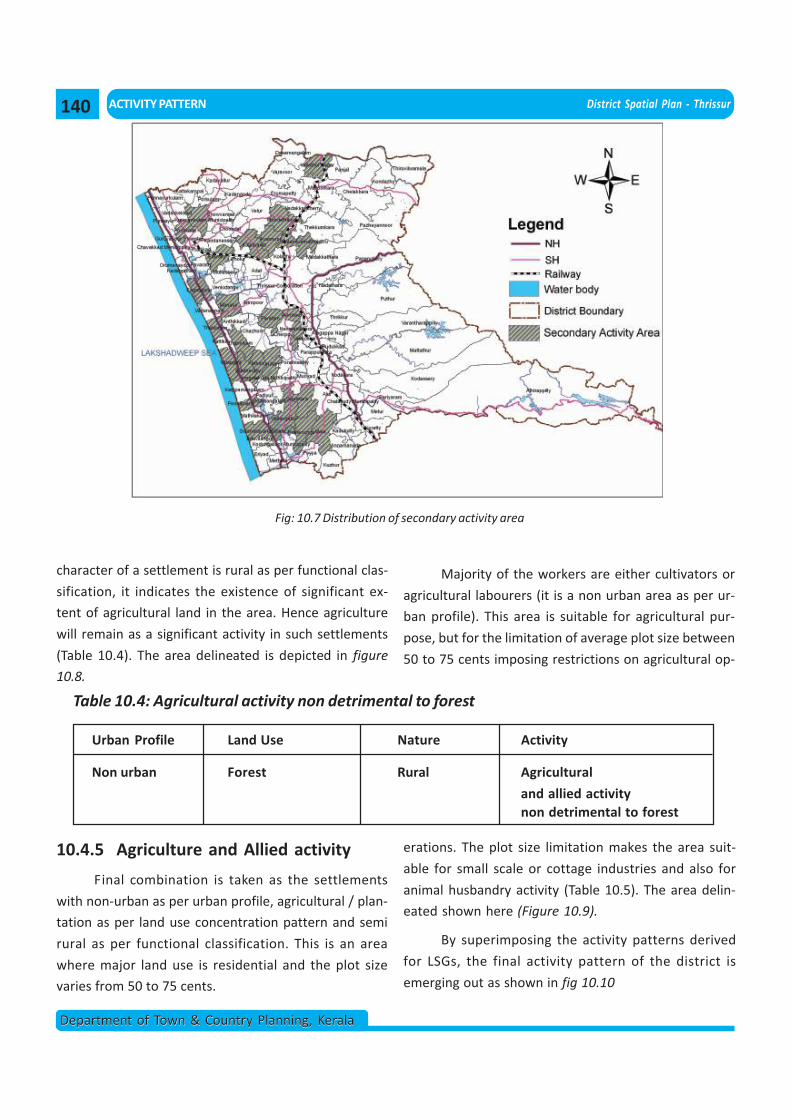
ACTIVITY PATTERN District Spatial Plan - Thrissur
Department of Town & Country Planning, KeralaDepartment of Town & Country Planning, Kerala
Fig: 10.7 Distribution of secondary activity area
character of a settlement is rural as per functional clas-
sification, it indicates the existence of significant ex-
tent of agricultural land in the area. Hence agriculture
will remain as a significant activity in such settlements
(Table 10.4). The area delineated is depicted in figure
10.8.
Table 10.4: Agricultural activity non detrimental to forest
Urban Profile Land Use Nature Activity
Non urban Forest Rural Agricultural
and allied activitynon detrimental to forest
10.4.5 Agriculture and Allied activity
Final combination is taken as the settlements
with non-urban as per urban profile, agricultural / plan-
tation as per land use concentration pattern and semi
rural as per functional classification. This is an area
where major land use is residential and the plot size
varies from 50 to 75 cents.
Majority of the workers are either cultivators or
agricultural labourers (it is a non urban area as per ur-
ban profile). This area is suitable for agricultural pur-
pose, but for the limitation of average plot size between
50 to 75 cents imposing restrictions on agricultural op-
erations. The plot size limitation makes the area suit-
able for small scale or cottage industries and also for
animal husbandry activity (Table 10.5). The area delin-
eated shown here (Figure 10.9).
By superimposing the activity patterns derived
for LSGs, the final activity pattern of the district is
emerging out as shown in fig 10.10
140
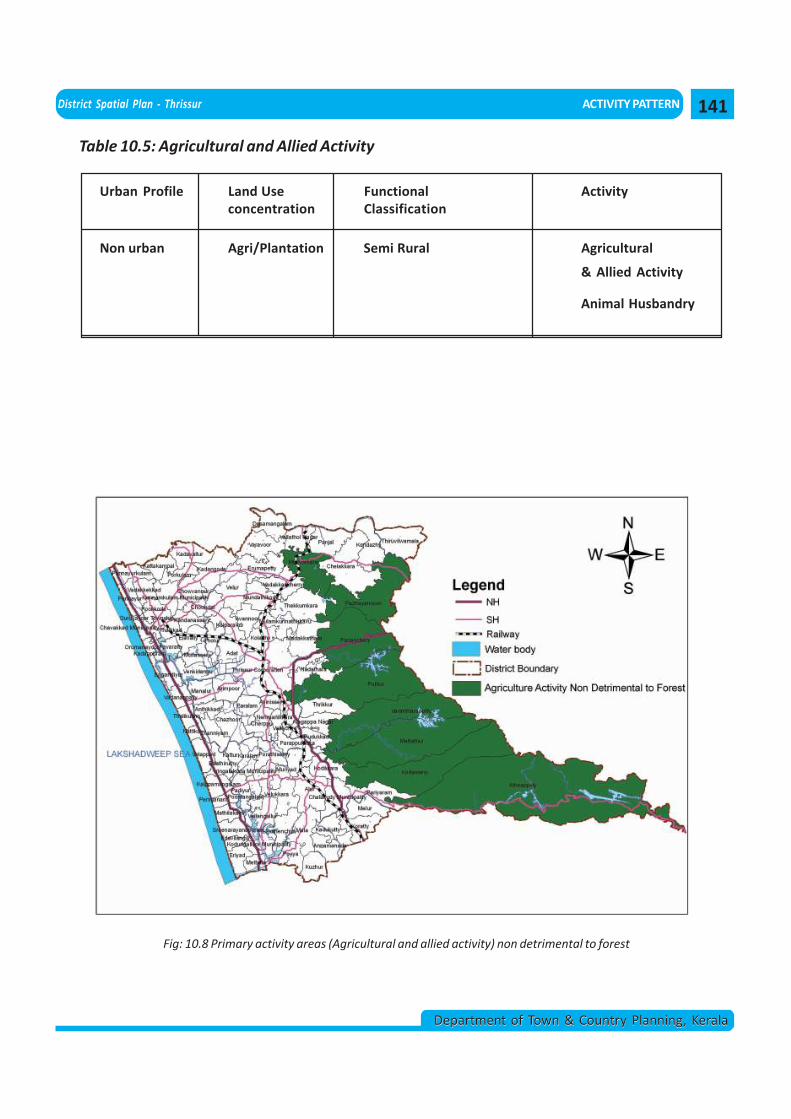
District Spatial Plan - Thrissur ACTIVITY PATTERN
Department of Town & Country Planning, KeralaDepartment of Town & Country Planning, Kerala
Table 10.5: Agricultural and Allied Activity
Urban Profile Land Use Functional Activityconcentration Classification
Non urban Agri/Plantation Semi Rural Agricultural
& Allied Activity
Animal Husbandry
Fig: 10.8 Primary activity areas (Agricultural and allied activity) non detrimental to forest
141
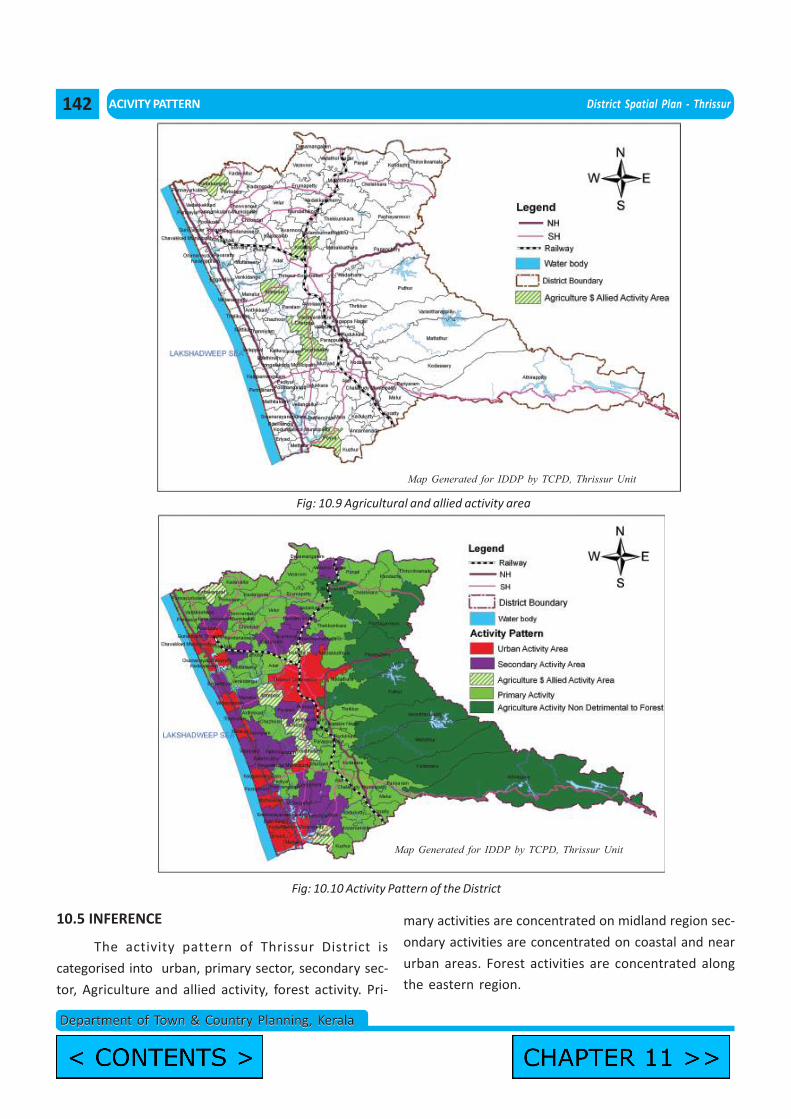
ACIVITY PATTERN District Spatial Plan - Thrissur
Department of Town & Country Planning, KeralaDepartment of Town & Country Planning, Kerala
Fig: 10.10 Activity Pattern of the District
Map Generated for IDDP by TCPD, Thrissur Unit
10.5 INFERENCE
The activity pattern of Thrissur District is
categorised into urban, primary sector, secondary sec-
tor, Agriculture and allied activity, forest activity. Pri-
mary activities are concentrated on midland region sec-
ondary activities are concentrated on coastal and near
urban areas. Forest activities are concentrated along
the eastern region.
Fig: 10.9 Agricultural and allied activity area
Map Generated for IDDP by TCPD, Thrissur Unit
142
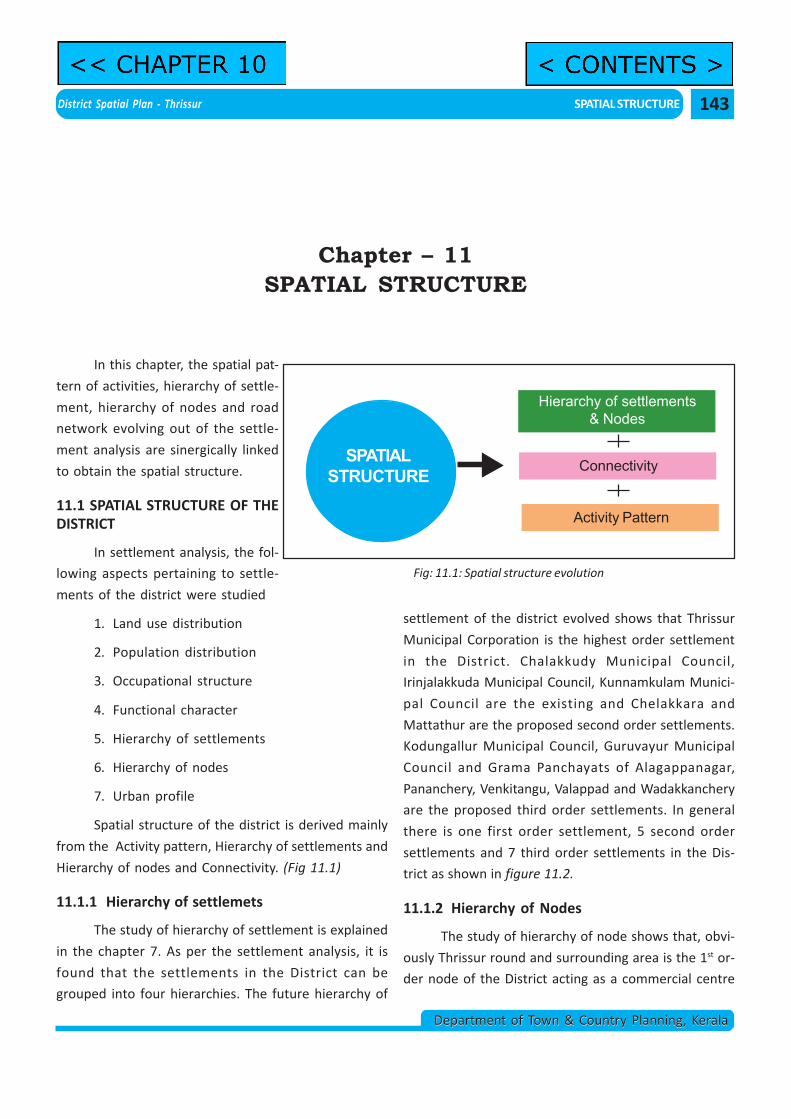
District Spatial Plan - Thrissur SPATIAL STRUCTURE
Department of Town & Country Planning, KeralaDepartment of Town & Country Planning, Kerala
Chapter – 11SPATIAL STRUCTURE
Fig: 11.1: Spatial structure evolution
Hierarchy of settlements& Nodes
Connectivity
Activity Pattern
SPATIALSTRUCTURE
In this chapter, the spatial pat-
tern of activities, hierarchy of settle-
ment, hierarchy of nodes and road
network evolving out of the settle-
ment analysis are sinergically linked
to obtain the spatial structure.
11.1 SPATIAL STRUCTURE OF THEDISTRICT
In settlement analysis, the fol-
lowing aspects pertaining to settle-
ments of the district were studied
1. Land use distribution
2. Population distribution
3. Occupational structure
4. Functional character
5. Hierarchy of settlements
6. Hierarchy of nodes
7. Urban profile
Spatial structure of the district is derived mainly
from the Activity pattern, Hierarchy of settlements and
Hierarchy of nodes and Connectivity. (Fig 11.1)
11.1.1 Hierarchy of settlemets
The study of hierarchy of settlement is explained
in the chapter 7. As per the settlement analysis, it is
found that the settlements in the District can be
grouped into four hierarchies. The future hierarchy of
settlement of the district evolved shows that Thrissur
Municipal Corporation is the highest order settlement
in the District. Chalakkudy Municipal Council,
Irinjalakkuda Municipal Council, Kunnamkulam Munici-
pal Council are the existing and Chelakkara and
Mattathur are the proposed second order settlements.
Kodungallur Municipal Council, Guruvayur Municipal
Council and Grama Panchayats of Alagappanagar,
Pananchery, Venkitangu, Valappad and Wadakkanchery
are the proposed third order settlements. In general
there is one first order settlement, 5 second order
settlements and 7 third order settlements in the Dis-
trict as shown in figure 11.2.
11.1.2 Hierarchy of Nodes
The study of hierarchy of node shows that, obvi-
ously Thrissur round and surrounding area is the 1st or-
der node of the District acting as a commercial centre
143
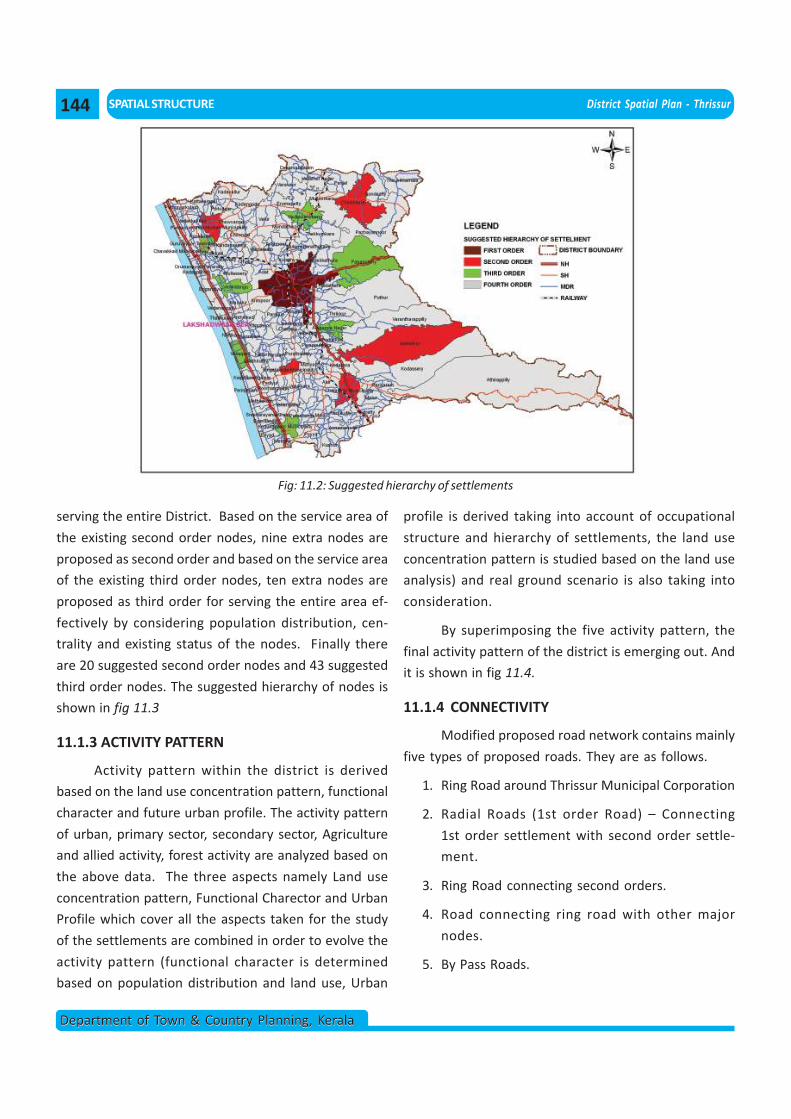
SPATIAL STRUCTURE District Spatial Plan - Thrissur
Department of Town & Country Planning, KeralaDepartment of Town & Country Planning, Kerala
Fig: 11.2: Suggested hierarchy of settlements
serving the entire District. Based on the service area of
the existing second order nodes, nine extra nodes are
proposed as second order and based on the service area
of the existing third order nodes, ten extra nodes are
proposed as third order for serving the entire area ef-
fectively by considering population distribution, cen-
trality and existing status of the nodes. Finally there
are 20 suggested second order nodes and 43 suggested
third order nodes. The suggested hierarchy of nodes is
shown in fig 11.3
11.1.3 ACTIVITY PATTERN
Activity pattern within the district is derived
based on the land use concentration pattern, functional
character and future urban profile. The activity pattern
of urban, primary sector, secondary sector, Agriculture
and allied activity, forest activity are analyzed based on
the above data. The three aspects namely Land use
concentration pattern, Functional Charector and Urban
Profile which cover all the aspects taken for the study
of the settlements are combined in order to evolve the
activity pattern (functional character is determined
based on population distribution and land use, Urban
profile is derived taking into account of occupational
structure and hierarchy of settlements, the land use
concentration pattern is studied based on the land use
analysis) and real ground scenario is also taking into
consideration.
By superimposing the five activity pattern, the
final activity pattern of the district is emerging out. And
it is shown in fig 11.4.
11.1.4 CONNECTIVITY
Modified proposed road network contains mainly
five types of proposed roads. They are as follows.
1. Ring Road around Thrissur Municipal Corporation
2. Radial Roads (1st order Road) – Connecting
1st order settlement with second order settle-
ment.
3. Ring Road connecting second orders.
4. Road connecting ring road with other major
nodes.
5. By Pass Roads.
144
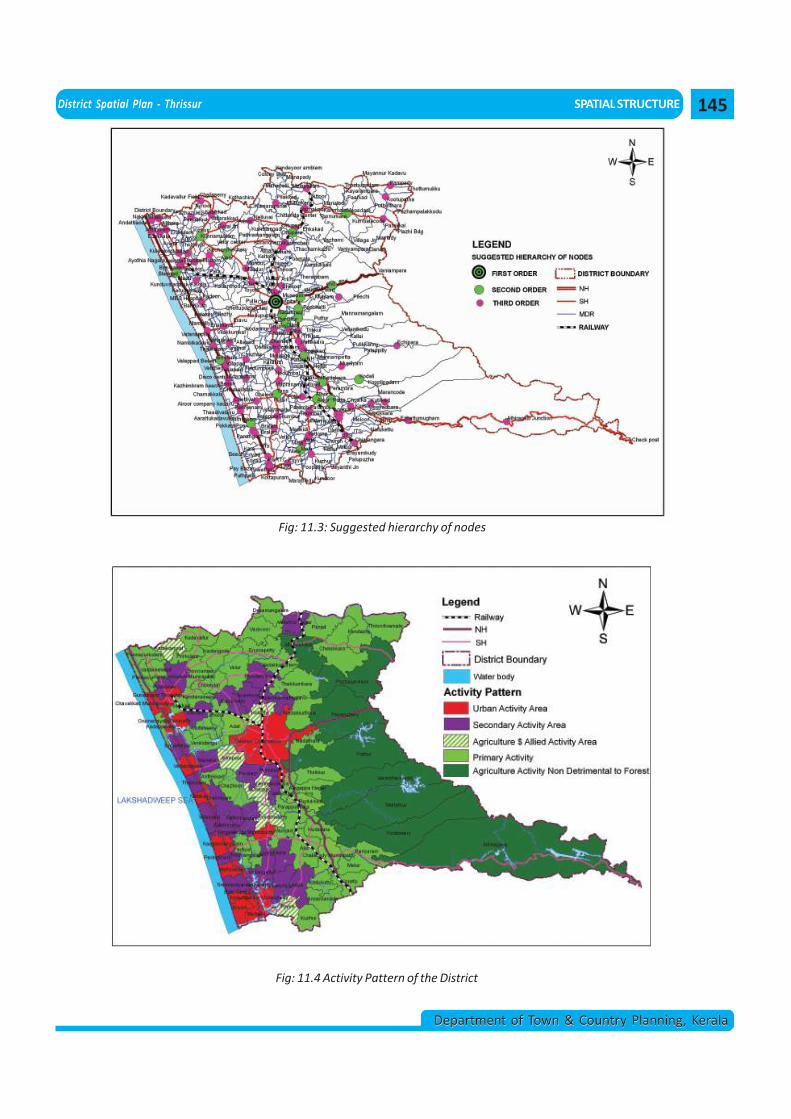
District Spatial Plan - Thrissur SPATIAL STRUCTURE
Department of Town & Country Planning, KeralaDepartment of Town & Country Planning, Kerala
Fig: 11.3: Suggested hierarchy of nodes
Fig: 11.4 Activity Pattern of the District
145
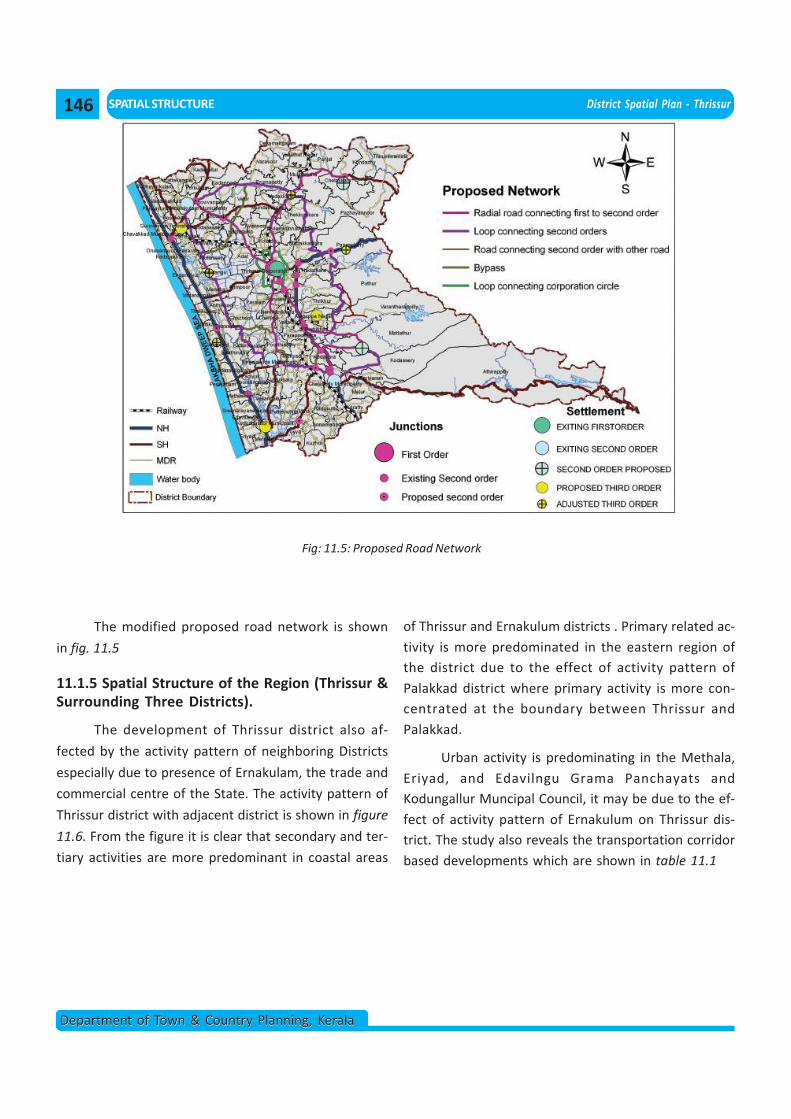
SPATIAL STRUCTURE District Spatial Plan - Thrissur
Department of Town & Country Planning, KeralaDepartment of Town & Country Planning, Kerala
The modified proposed road network is shown
in fig. 11.5
11.1.5 Spatial Structure of the Region (Thrissur &Surrounding Three Districts).
The development of Thrissur district also af-
fected by the activity pattern of neighboring Districts
especially due to presence of Ernakulam, the trade and
commercial centre of the State. The activity pattern of
Thrissur district with adjacent district is shown in figure
11.6. From the figure it is clear that secondary and ter-
tiary activities are more predominant in coastal areas
of Thrissur and Ernakulum districts . Primary related ac-tivity is more predominated in the eastern region ofthe district due to the effect of activity pattern ofPalakkad district where primary activity is more con-centrated at the boundary between Thrissur andPalakkad.
Urban activity is predominating in the Methala,Eriyad, and Edavilngu Grama Panchayats andKodungallur Muncipal Council, it may be due to the ef-fect of activity pattern of Ernakulum on Thrissur dis-trict. The study also reveals the transportation corridorbased developments which are shown in table 11.1
Fig: 11.5: Proposed Road Network
146
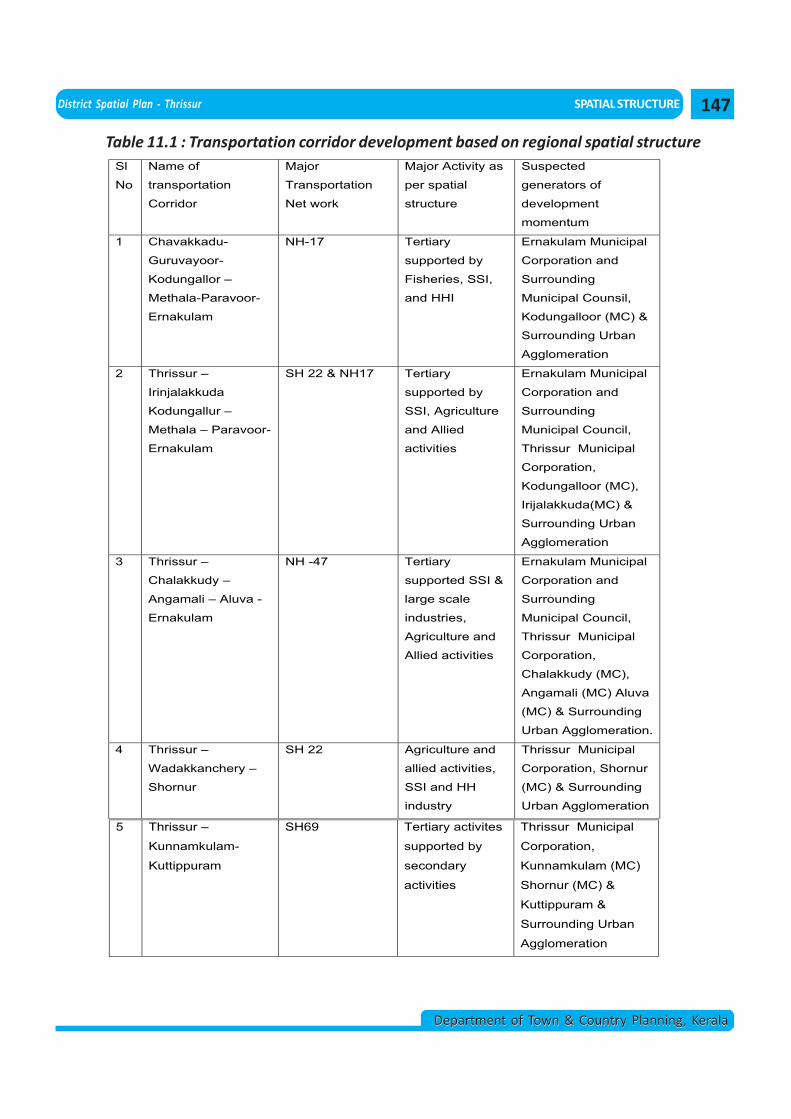
District Spatial Plan - Thrissur SPATIAL STRUCTURE
Department of Town & Country Planning, KeralaDepartment of Town & Country Planning, Kerala
Sl
No
Name of
transportation
Corridor
Major
Transportation
Net work
Major Activity as
per spatial
structure
Suspected
generators of
development
momentum
1 Chavakkadu-
Guruvayoor-
Kodungallor –
Methala-Paravoor-
Ernakulam
NH-17 Tertiary
supported by
Fisheries, SSI,
and HHI
Ernakulam Municipal
Corporation and
Surrounding
Municipal Counsil,
Kodungalloor (MC) &
Surrounding Urban
Agglomeration
2 Thrissur –
Irinjalakkuda
Kodungallur –
Methala – Paravoor-
Ernakulam
SH 22 & NH17 Tertiary
supported by
SSI, Agriculture
and Allied
activities
Ernakulam Municipal
Corporation and
Surrounding
Municipal Council,
Thrissur Municipal
Corporation,
Kodungalloor (MC),
Irijalakkuda(MC) &
Surrounding Urban
Agglomeration
3 Thrissur –
Chalakkudy –
Angamali – Aluva -
Ernakulam
NH -47 Tertiary
supported SSI &
large scale
industries,
Agriculture and
Allied activities
Ernakulam Municipal
Corporation and
Surrounding
Municipal Council,
Thrissur Municipal
Corporation,
Chalakkudy (MC),
Angamali (MC) Aluva
(MC) & Surrounding
Urban Agglomeration.
4 Thrissur –
Wadakkanchery –
Shornur
SH 22 Agriculture and
allied activities,
SSI and HH
industry
Thrissur Municipal
Corporation, Shornur
(MC) & Surrounding
Urban Agglomeration
5 Thrissur –
Kunnamkulam-
Kuttippuram
SH69 Tertiary activites
supported by
secondary
activities
Thrissur Municipal
Corporation,
Kunnamkulam (MC)
Shornur (MC) &
Kuttippuram &
Surrounding Urban
Agglomeration
Table 11.1 : Transportation corridor development based on regional spatial structure
147
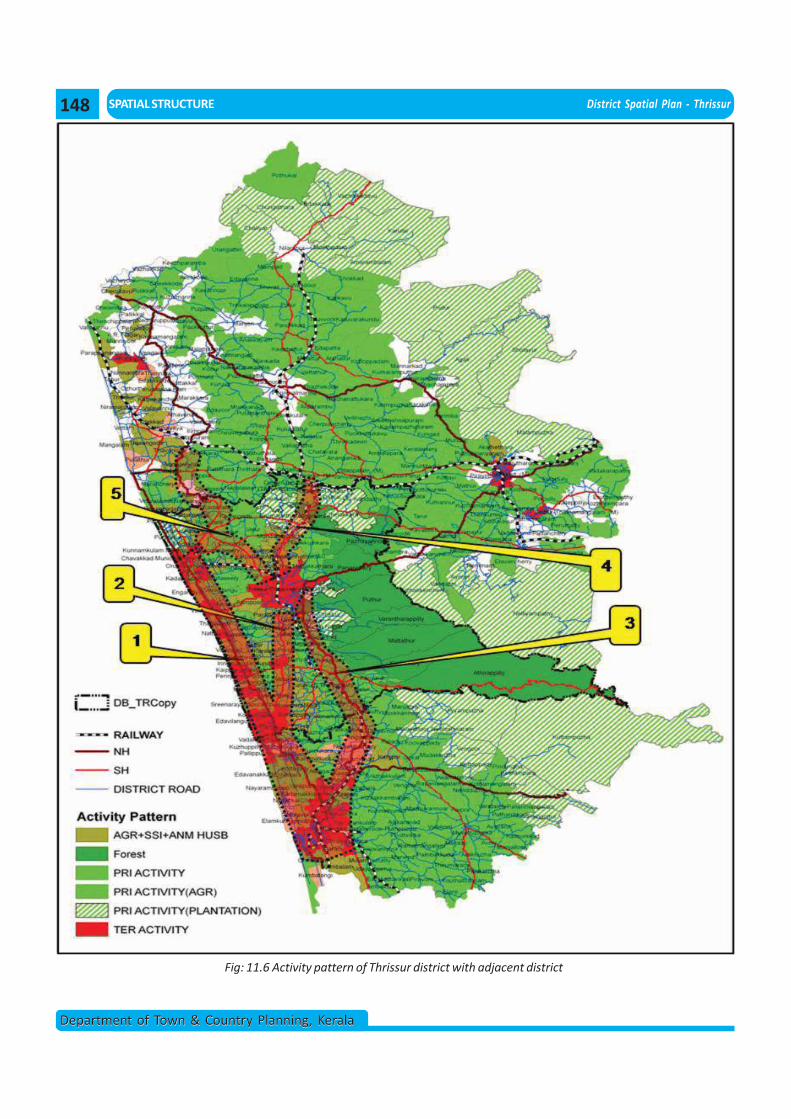
SPATIAL STRUCTURE District Spatial Plan - Thrissur
Department of Town & Country Planning, KeralaDepartment of Town & Country Planning, Kerala
Fig: 11.6 Activity pattern of Thrissur district with adjacent district
148
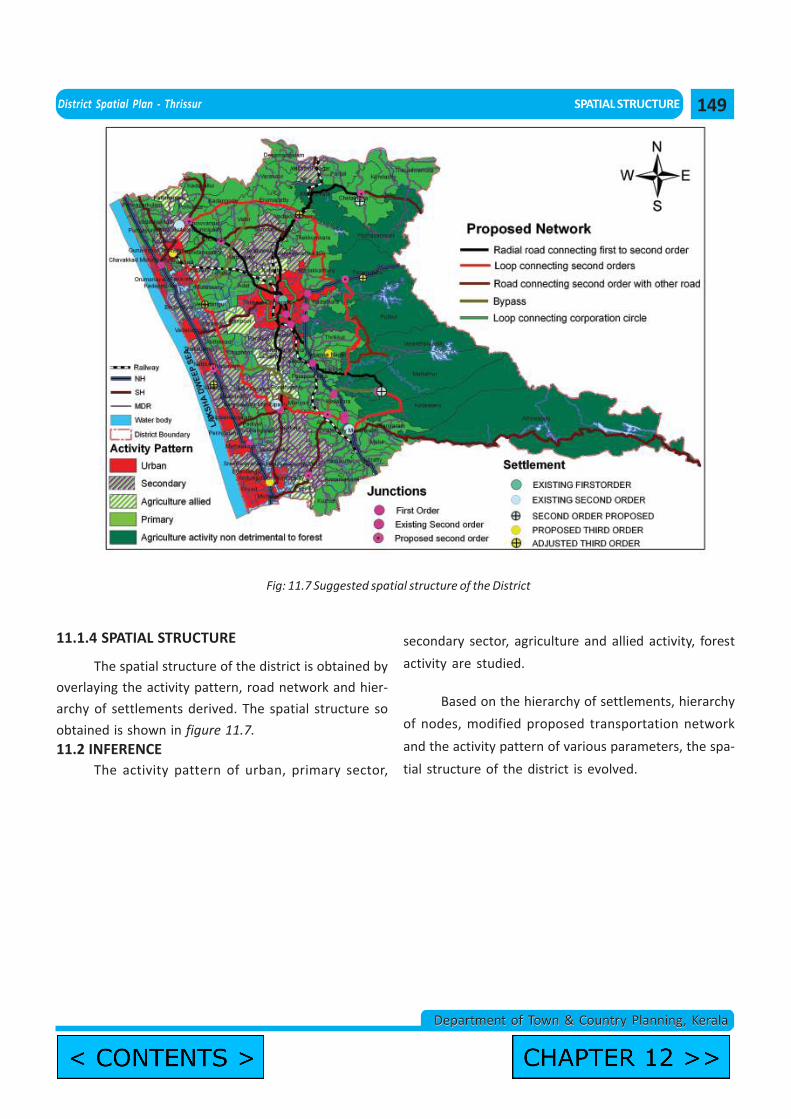
District Spatial Plan - Thrissur SPATIAL STRUCTURE
Department of Town & Country Planning, KeralaDepartment of Town & Country Planning, Kerala
Fig: 11.7 Suggested spatial structure of the District
11.1.4 SPATIAL STRUCTURE
The spatial structure of the district is obtained by
overlaying the activity pattern, road network and hier-
archy of settlements derived. The spatial structure so
obtained is shown in figure 11.7.11.2 INFERENCE
The activity pattern of urban, primary sector,
secondary sector, agriculture and allied activity, forest
activity are studied.
Based on the hierarchy of settlements, hierarchy
of nodes, modified proposed transportation network
and the activity pattern of various parameters, the spa-
tial structure of the district is evolved.
149
District Spatial Plan - Thrissur FINDINGS
Department of Town & Country Planning, KeralaDepartment of Town & Country Planning, Kerala
Findings emerged out of spatial and sectoral
analyses are summarised to enable the envisioning pro-
cess. Major findings of analyses of general planning
parameters, various sectoral studies as well as the re-
source base of the district are listed below.
12.1. GENERAL
1. Thrissur District with its rich history, heritage and
cultural, religious and archaeological wealth, acts
as the cultural capital of the state. The district is
also well known for festivals (Thrissur Pooram),
many cultural and art institutions (like Kerala
Kalamandalam, Kerala Sahithya Academy etc.)
and historic temples, churches & mosques.
2. Thrissur District is connected to other parts of the
state and the country through two modes of
transport, rail and roads. The waterway, which
was once was a major mode of transport of the
district, is in an abandoned state now. The near-
est airport “Nedumbassery” (Kochi International
Airport) is situated at a distance of 55 kms and
the nearest sea port of Kochi is situated at a dis-
tance of 80 kms from Thrissur City.
3. Thrissur district has about 15 higher level educa-
tional institutions and 8 multi speciality hospi-
tals as on date and acts as an educational and
health hub which caters not only the District but
also a wider influence region.
Chapter – 12FINDINGS
4. Physiographic profile of the district shows 5 well
defined physiographic regions namely (i) Low
lands (ii) Mid Lands (iii) Mid up Lands (iv) Up Lands
and (v) High Lands. The district has about 33.34%
of its geographical area as forest, mainly seen in
the eastern part of the district. The district is
blessed with resourceful hill areas in the Eastern
part of the district which separate the district from
Tamil Nadu State. These hills are part of highly
resourceful Western Ghats.
5. The district is blessed with 4 major rivers
(Bharatha puzha, Kechery puzha Karuvannur
puzha and Chalakudy puzha) with a number of
tributaries and drainage channels. Vazhani Dam
across Kechery river, Peechi Dam across Manali
river and Chimminy Dam across Karumali river
are the reservoirs of the district.
12.2. POPULATION:
1. Thrissur district is comparatively denser than the
state with 9.34 % of the total population of the
state. The district have only 7.8% of the geo-
graphical area of the state. In other words the
population density of Thrissur District (981 per-
sons/sq km) is higher than that of the state (819
persons /sq km) indicating pressure on land.
2. Even though the district shows a population
growth rate less than that of state, the rate of the
decrease in growth rate of the district (-0.41 dur-
151
FINDINGS District Spatial Plan - Thrissur
Department of Town & Country Planning, KeralaDepartment of Town & Country Planning, Kerala
ing the period 1981-01) is less than that of the
state (-0.51 during the period 1981-01) showing
that the district is blessed with fabric that can
sustainably attract the population. An increase
of only 1.79 lakhs and 1.33 lakhs respectively are
expected in the succeeding decades of 2001-‘11
and 2011 –‘21.
3 The population concentration pattern of Thrissur
district shows a definite spatial pattern in which
highest concentration is seen in LSGs situated in
the periphery of existing urban areas, coastal ar-
eas and LSGs situated near to coastal areas. East-
ern high land region of the district shows least
concentration of population.
4. LSG wise gross population density of the district
shows a spatial pattern in which the urban LSGs
and LSGs surroundings them as well as LSGs in
the coastal region, shows highest gross popula-
tion density ranging from 1500 persons per/sq.km
to 3200 persons/sq.km. The LSGs located in the
mid land region shows a gross population den-
sity variation of 750-1500 persons per/sq km and
LSGs in high land regions shows least gross popu-
lation density.
5. Among the LSGs of the District, population growth
rate is the highest in those LSGs situated in the
periphery of existing urban areas. It can be pre-
sumed that immigrants to the urban centre of
the district prefer to settle in the periphery of
urban areas rather than within. This may lead to
undesirable spread of urban area and conversion
of agricultural land in rural areas for residential
and other non agricultural purposes, thus affect-
ing the economic base of rural areas.
12.3. WORK PARTICIPATION RATE AND OCCUPA-TIONAL PATTERN
1. Work participation rate of the district (32%) equals
that of the state. At the same time it is well be-
low the desirable WPR of a developed economy.
This indicates idling of certain portion of poten-
tial work force of the district.
2. The analysis of the occupational structure of the
district points to a disturbing situation about the
economic base of the district. The number of
workers in primary sector of production namely
cultivators and agricultural labourers show de-
clining trend. The occupational structure of the
district shows that (Refer Chapter 4) more than
75% of the total workers engage in non agricul-
tural pursuits. Even in rural areas of the district,
more than 50% of workers belong to non primary
sectors, mainly service or tertiary sector. Num-
ber of workers in service sectors is on the in-
crease. Number of industrial workers shows a
slight increase. It is observed that rural areas of
the district are slowly withdrawing from the pri-
mary sector and depends more on service sector
and on industrial sector to a certain extent.
3. A shift (mainly towards service sector and sec-
ondary sector) in the occupational structure of
the district (even in rural areas) resulting in the
possible destruction of the rural character of ru-
ral areas is taking place. There is dilution in the
rural nature of the rural areas of the district as far
as the occupational structure is considered. At
the same time industrial activity in the urban ar-
eas is also on the decrease and the share of other
workers category in the work force is increasing.
This has resulted in narrowing down of the bound-
ary distinguishing the character of rural and ur-
ban areas in terms occupational structure.
4. The growth rate of total workers during the last
decade 1991-2001(9. 20 %) is slightly greater than
the growth rate of total population indicating that
work opportunities are increasing in proportion
to the increase in population. However, the rate
of increase in number of main workers shows a
decreasing trend, indicating disturbing picture
about employment generation which has reflec-
152
District Spatial Plan - Thrissur FINDINGS
Department of Town & Country Planning, KeralaDepartment of Town & Country Planning, Kerala
tion in resource utilization and in turn in the eco-
nomic base and may lead to reduced local eco-
nomic growth.
5. Among the total workers only 17% of workers
constitute agriculture labourers and cultivators
which indicate less intensive agriculture activity
in the District.
6. Among the total workers, 5% are house hold in-
dustrial workers. This is the highest among the
neighbouring districts. This indicates the strength
of the district in house hold industrial sector. The
spatial pattern of concentration of house hold
industrial workers shows a clear concentration
in coastal LSGs and in Thiruvillwamala Grama
Panchayat as well.
7. Nearly 25% of land use is agricultural. From the
point of view of economic as well as environ-
mental stability of the District, the agricultural
land should be put to optimal use.
8. Based on concentration pattern of workers, LSGs
of the district exhibit one of the following six
activity patterns i.e. primary, secondary, tertiary,
combination of primary and secondary, combi-
nation of secondary and tertiary and combina-
tion of primary and tertiary (Refer Chapter 4, Fig
4.17) .
12.4. LAND USE:
1. When compared to near by districts Thrissur
shows no major prominence with respect to ru-
ral land uses or urban land uses. In other words,
the district still has potential for rural activities
where as it ranks 6th with respect to urban con-
tent among the districts in the state.
2. The land use analysis shows concentration of for-
est land use in LSGs located in eastern highland
region of the district indicating rich natural re-
sources and environmental sensitiveness of the
area.
3. “Kole lands” in the district demand special at-
tention due to rich potential for paddy produc-
tivity as well as ecological and environmental
sensitivity.
4. Nearly 25% of the total area of the district is un-
der agricultural land use. Most of the agricultural
areas are concentrated in the mid land and high
land regions of the district. Also the general char-
acter of settlements shows that most of them
are rural in nature, indicating that there is scope
for developing the agriculture sector as one of
the economic base of the District.
5. Coconut cultivation contributes 42% of the agri-
culture land use followed by mixed crop
(17.11%), paddy (17.11%) and rubber (10.7%).
12.5. ECONOMIC BASE OF THE DISTRICT:
1. Thrissur district, contributing 9.87 % of the GDP
of the state, is ranked third in the state. As per
Economic Review-2009, during the period 2008-
09 (at constant price of 1999-2000), 62.58 % of the
GDP of the district is contributed by tertiary sec-
tor and is ranked third in the state. Whereas the
contributions of secondary and primary sectors
are 25.02% and 12.42% respectively and is ranked
third and eight respectively in the state.
2. The sector wise contribution of district GDP over
a period shows a diminishing trend in primary
sector, stagnant trend in secondary sector and in-
creasing trend in tertiary sector.
3. Thrissur district, with per capita income of Rs
42316/- ranks fourth among districts of the state
and shows second highest growth rate in this re-
gard.
4. The spatial distribution of settlements based on
functional character shows a clear demarcation
character of settlements in four categories.
Thrissur Municipal Corporation and Municipal
Councils except Chalakkudy and some of the LSGs
153
FINDINGS District Spatial Plan - Thrissur
Department of Town & Country Planning, KeralaDepartment of Town & Country Planning, Kerala
located in the low land region of the district
characterised by high population concentration
exhibits urban character. Semi urban character is
exhibited by LSGs that have urban influence like
Grama Panchayats of Vallathole Nagar (situated
near to Shornur Municipality in Palakkad District),
Elavally and Vallachira. Most of the LSGs in the
midland and high land region of the District ex-
hibit rural character. Semi rural character is seen
in a few LSGs placed as a transition zone between
the LSGs with urban and rural character. The func-
tional character of settlements gives an idea
about the likely economic base of each LSGs.
5. Existing hierarchy of settlements based on facili-
ties and the proposed hierarchy of settlements
evolved from the analysis show that Thrissur
Municipal Corporation is the single first order
settlement. Besides, there are 5 second order
settlements and 7 third order settlements in the
District to have equitable distribution of facili-
ties that each settlement in a specific hierarchy
should cater.
6. High population density of the district in general
and in the coastal areas in particular combined
with the presence of fragile ecosystems compris-
ing ‘kole’ lands, water bodies, forest and paddy
lands impose limitation on high level of industri-
alization of such areas of the district.
7. Even though there exists Urban-Rural continuum,
the activity pattern evolved based on the land
use concentration pattern, future urban profile
and functional classification shows that there is
a clear demarcation of areas of concentration of
urban activity, agricultural activity, agriculture and
allied activity and agriculture activity non detri-
mental to forests in the district, making it pos-
sible to assign definite development character
to each region.
8. The district is blessed with potential resources
such as tourism potential spots, minerals, lengthy
coastal stretch with potential for fishing, num-
ber of religious centres with archaeological & his-
toric importance, presence of world famous pil-
grim centre ‘Guruvayoor’, four major river basins
and connected drainage network covering entire
district.
9. Activity pattern of the district evolved shows ex-
istence of following zones: Urban activity, Agri-
cultural activity non detrimental to forests, In-
tense agricultural activity, Secondary activity and
Agricultural allied activity.
10.Sectoral analysis of sectors related to major re-
sources such as Agriculture, Industries, Forest,
Animal Husbandry, Fisheries, Mining, Tourism
etc. shows that the district is having areas of con-
centration of the above activities.
11.The analysis of environmental sector shows that
major ecological and environmental sensitive
areas of the district are the reserve forest areas
in the eastern high land region and the ‘kole lands’
in between low land and mid land regions of the
district.
12.Four distinctive agriculture development pat-
terns viz. the coastal and low land regions where
homestead cultivation predominantly of coco-
nut, arecanut, nutmug, jackfruit etc can be pro-
moted, mixed cultivation area in the low –mid
land area where paddy cultivation (kole land &
pokkali area) has to be sustained and nut mug,
plantain, vegetable and fodder cultivation etc can
be promoted, intense crop cultivation area in the
mid land where rubber to be sustained and pine-
apple, pepper, plantain, vegetable and paddy cul-
tivation to a certain extent etc. can be promoted
and finally resource base area where forest re-
sources are to be conserved. Here, intense affor-
estation has to be promoted while existing plan-
tations, rubber and pepper cultivation are to be
sustained.
154
District Spatial Plan - Thrissur FINDINGS
Department of Town & Country Planning, KeralaDepartment of Town & Country Planning, Kerala
13.The analysis of industrial sector shows the con-
centration of industrial activity (large, medium,
small scale) in the south-west, south-east and
north-west regions of the district spatially located
along the major transportation corridors such as
NH-47, NH-17, SH connecting Thrissur Municipal
Corporation with urban activity areas of the dis-
trict such as Kunnamkulam- Chavakadu-
Guruvayur and Irinjalakuda-Kodungallur-
Methala. The concentration of house hold indus-
tries and hand loom industries are found along
the coastal areas and in Thiruvillwamala Grama
Panchayat as well. The district also has potential
for clay based industries, diamond & gold based
industries, agro based industries, handloom in-
dustries, wood industries and book making in-
dustries etc.
14.Mining activities especially of clay, granite and
black sand has got immense potential within the
district; the potential areas are lower part of the
mid land areas and lower part of the up land ar-
eas in the southern part of the district
15.Coastal belt is suitable for marine fishing. Areas
surrounding the inland water bodies in north-
west and south-west regions of the district are
found suitable for developing inland fishing on a
commercial basis.
16.Thrissur district has got potential to develop the
tourism spots in connection with eco tourism,
adventure tourism, religious tourism and heri-
tage tourism.
The tourism potential areas include Thrissur Mu-
nicipal Corporation, Guruvayoor Municipal Coun-
cil, Kodungalloor Municipal Council, Irinjalakuda
Municipal Council, Athirappaly Grama Panchayat,
Mattathoor Grama Panchayat, Puthur Grama
Panchayat, Vallathol Nagar Grama Panchayat,
Varandarappilly Grama Panchayat etc.
17.Forest area within the district has got economic
potential. Also it is one of the main environmen-
tally sensitive areas of the district.
155
District Spatial Plan - Thrissur GOALS AND OBJECTIVES
Department of Town & Country Planning, KeralaDepartment of Town & Country Planning, Kerala
Chapter – 13GOALS AND OBJECTIVES
In this chapter, the development goals evolved
for District Spatial Plan and the development objec-
tives set to achieve the goals based on the findings of
analysis are discussed. The development goals
emerged reflects the thrust areas where planning in-
tervention is required and the objectives clearly spell
out how the goals can be achieved in a real to ground
scenario.
13.1. DEVELOPMENT GOALS
The findings derived from the sector wise stud-
ies and settlement studies evolve following facts:
The Thrissur – Kochi corridor exhibits spatial con-
centration of secondary as well as tertiary activities and
is developing into a vibrant region of development
which acts as a major generator of economic momen-
tum. Analysis reveal that Thrissur district has potential
for rural activities whereas it ranks 6th with respect to
urban content among the districts in the state indicat-
ing the strength of the district in the case of urban ac-
tivities as well. At the same time primary sector too has
a considerable role in the district’s economy with nearly
25% of the total area of the district under agricultural
land use. Most of the agricultural areas are concentrated
in the mid land and high land regions of the district.
Also the general character of settlements shows that
most of them are rural in nature, indicating that there
is scope for developing the agriculture sector as one of
the economic bases of the District.
Work participation rate of the district (32%) equals
that of the state. At the same time it is well below the
desirable WPR of a developed economy. This indicates
idling of certain portion of potential work force of the
district. The situation needs change through genera-
tion of more employment opportunities for the people
of Thrissur. Diversification of economic activity to the
secondary and tertiary activity to create better job op-
portunities with due regard to ways and measures to
increasing productivity, value addition, optimum utili-
zation of resource and scientific intervention in primary
sector may therefore be resorted to promote local eco-
nomic growth.
Even though there exists Urban-Rural continuum,
the activity pattern evolved based on the land use con-
centration pattern, future urban profile and functional
classification shows that there is a clear demarcation of
areas of concentration of urban activity, agricultural
activity, agriculture and allied activity and agriculture
activity non detrimental to forests in the district, mak-
ing it possible to assign definite development charac-
ter to each region. This has to be viewed as a potential
for the overall development of the district.
The district is blessed with potential resources
such as tourism potential spots, minerals, lengthy
coastal stretch with potential for fishing, number of
religious centres with archaeological & historic impor-
tance, presence of world famous pilgrim centre
‘Guruvayoor’, four major river basins and connected
drainage network covering entire district. The analysis
of the secondary sector reveals the potential for clay
based industries, diamond & gold based industries, agro
based industries, handloom industries, book making
industries and wood based industries with in the dis-
trict. Co-ordination and inter linkage between few key
157
GOALS AND OBJECTIVES District Spatial Plan - Thrissur
Department of Town & Country Planning, KeralaDepartment of Town & Country Planning, Kerala
thrust areas is essential to have a sustained develop-
ment.
Thrissur district having many higher level educa-
tional institutions and health facilities caters not only
the District but a wider influence region. Thrissur
Municpal Corporation acts as the first order settlement
in the district serving the entire district. Further there
are some centers of economic development to cater
second order functions in the other parts of the district
as well. Provision of equitable distribution of facilities
(physical & social) in a planned manner and planned
connectivity to ensure speed & safe commutation for
the entire population of the district is a concern.
The analysis of environmental sector shows the
need for protection of major ecological and environ-
mental sensitive areas of the district namely the re-
serve forest areas in the eastern high land region and
the ‘kole lands’ in between low land and mid land re-
gions of the district. The coastal belt of the district is
also another area of environmental concern.
Another aspect of concern is that Thrissur Dis-
trict with its rich history, heritage and cultural, religious
and archaeological wealth, acts as the cultural capital
of the state and this status need to be sustained through
concerted efforts.
THUS THE MAJOR DEVELOPMENT GOALS FOR THEDISTRICT SPATIAL PLAN ARE,
To Develop Thrissur district as an eco-friendly
and economically vibrant region in the state
To utilize resources for economic
development with social justice in a
sustainable manner.
To Enhance and ensure local economic growth
and to create better opportunities to the
people.
To attain a certain level of self-sufficiency in
production (primary and secondary) sectors.
To attain balanced development through
equitable spatial distribution of facilities.
To conserve cultural and heritage fabrics of
the district so as to sustain the status of
cultural capital of the State.
To attain Ecological conservation and
environmental protection.
13.2. DEVELOPMENT OBJECTIVES
In order to achieve the development goals set
above, development objectives have to be set through
synthesis of the findings evolved from the sectoral and
settlement analysis and general planning parameters.
Developing Thrissur district as an eco-friendly and
economically vibrant region in the state is one of the
development goal of District Spatial Plan Thrissur.
Thrissur district contributes 9.87 % of the GDP of the
state and is ranked third in the state in this respect. As
per Economic Review-2009, during the period 2008-09
(at constant price of 1999-2000), 62.58 % of the GDP of
the district is contributed by tertiary sector and is ranked
third in the state. Whereas the contribution of second-
ary sector is also comparatively high with 25.02% and is
ranked third in the state. Thrissur district, with per capita
income of Rs 42316/- ranks fourth among districts of the
state and shows second highest growth rate in this re-
gard. All the above points to the potential of the dis-
trict in developing into a vibrant region of economic
development in the state. As stated earlier, the Thrissur
– Kochi corridor exhibits spatial concentration of sec-
ondary as well as tertiary activities and is developing
into a vibrant region of development which acts as a
major generator of economic momentum. Measures
for providing impetus to development of this region
are required.
The analysis of the occupational structure of the
district points to a disturbing situation about the eco-
nomic base of the district. The number of workers in
158
District Spatial Plan - Thrissur GOALS AND OBJECTIVES
Department of Town & Country Planning, KeralaDepartment of Town & Country Planning, Kerala
primary sector of production namely cultivators and
agricultural labourers show declining trend. Among the
total workers only 17% of workers constitute agricul-
ture laborers and cultivators, indicating decline in agri-
culture activity and in turn the rural nature of the Dis-
trict. The occupational structure of the district shows
that more than 75% of the total workers engage in non
agricultural pursuits. Even in rural areas of the district,
more than 50% of workers belong to non primary sec-
tors, mainly service or tertiary sector. Number of work-
ers in service sector is on the increase. Number of in-
dustrial workers shows a slight increase. It is observed
that rural areas of the district are slowly withdrawing
from primary sector and depends more on service sec-
tor and on industrial sector to a certain extent. Thus a
shift (mainly towards service sector and slightly to sec-
ondary sector) in the occupational structure of the dis-
trict (even in rural areas) resulting in the possible de-
struction of the rural character of rural areas is taking
place. There is dilution in the rural nature of the rural
areas of the district as far as the occupational structure
is considered. At the same time industrial activity in
the urban areas is also on the decrease and the share of
other workers category in the work force is increasing.
This has resulted in narrowing down of the boundary
distinguishing the character of rural and urban areas in
terms occupational structure. Besides, the rate of in-
crease in number of main workers shows a decreasing
trend within the district indicating disturbing picture
about employment generation, resource utilization and
economic base which in turn point to low economic
growth.
Comparing industrial and commercial land uses, it
is seen that land under commercial use is higher,
indicating domination of tertiary sector over secondary
sector. Also, in 2008-2009, 62.58 % of NSDP of the district
is from tertiary sector compared to 25.02% from the
secondary sector, supporting the same. Another
important aspect to be noted that 25 % of total area of
the district is still under agricultural use. This indicates
that agricultural development is still having a potential
in the district.
The population growth rate pattern among LSGs of
the District shows that growth rate is highest in those
LSGs adjacent to Thrissur Municipal Corporation and
other Municipal Councils. It can be presumed that
migrants to the district prefer to live in the periphery
of urban areas rather than within. If this tendency is
continued, it will result in the undesirable spread of
urban areas and conversion of agricultural land in rural
areas for residential and other nonagricultural purposes
resulting in the destruction of the economic base of
rural areas. Thrissur District shows even more level of
urbanization when compared to the State average. And
also, the level of urbanization shows an increasing
trend within the District pointing out the fact that
significant change in the urban profile of the district.
In brief, there is need to ensure appropriate forward
and backward linkages i. between urban areas of the
district and its rural hinter lands and ii. between
primary, secondary and tertiary sectors of production
so as revitalize the urban as well as rural areas of the
district to enhance socio-economic growth. This
necessitates planned intervention, such that selective
concentration of urban and rural economic activities is
made possible in the district in designated spatial
regions.
The analysis clearly bring out the fact that the district
is blessed with its rich cultural resources, heritage value,
art institutions, religious monuments etc… which in fact
played a crucial role in the evolution of the district as
‘cultural capital’ of the state. The analysis also shows
that In addition to its traditional status of cultural
capital; at present Thrissur District also act as an
educational and health hub. But the serious efforts
towards effective and sustainable utilization of the
above mentioned cultural and heritage resources are
not emerged out from the analysis. Hence any planning
attempt should address the conservation and effective
utilization of these cultural and heritage fabric of the
district. In this context, one should think of how these
159
GOALS AND OBJECTIVES District Spatial Plan - Thrissur
Department of Town & Country Planning, KeralaDepartment of Town & Country Planning, Kerala
cultural and heritage fabric can be effectively utilized
to enhance the tourism potential of the district. Thrissur
district has got potential to develop the tourism spots
in connection with eco tourism, adventure tourism,
religious tourism and heritage tourism.
The district is endowed with abundant natural
resources also. Mining activities especially of clay and
granite and black sand has got immense potential within
the district; the potential areas are lower part of the
mid land areas and lower part of the up land areas in
the southern part of the district. Coastal belt is suitable
for marine fishing. Areas surrounding the inland water
bodies in north-west and south-west regions of the
district are found suitable for developing inland fishing
on a commercial basis. Forest area within the district
has got economic potential. Also it is one of the main
environmentally sensitive areas of the district.
From the study of existing hierarchy of settlements,
it is seen that there is uneven distribution of higher
order settlements. The existing pattern of higher order
settlements do not follow the population distribution
creating a distorted spatial structure. This necessitates
reorganizing of the spatial structure of the district so as
to arrive at a planned settlement hierarchy to attain
equitable distribution of facilities and balanced
development.
Although the district has fairly good network of
roads, the existing connectivity pattern is not sufficient
to distribute smoothly the movements of people,
goods and services. The future requirements in this
connection shall also be taken into account. Therefore
it is essential to develop a proper road network based
on spatial structure of the district.
The analysis of environmental sector shows the
concentration ecological and environmental sensitive
areas of the district mainly in two areas; the reserve
forest area in the eastern high land region and the ‘kole
lands’ in between low land and mid land regions of the
district. Even though the ecological conservation of
forests is showing positive trend, considering the
pressures for revitalization of forest economy and
tourism there has to be definite conservation
perspectives for this area. Obviously, the already
disturbed ‘kole land’ areas, watershed based drainage
channels, etc... also needs to be conserved and
whatever pollution generated in the urban centers
needs to be brought down. The coastal stretch of the
district is another area of environmental concern.
MAJOR DEVELOPMENT OBJECTIVES
1. To take all possible measures for providing
impetus to development of the Thrissur- Kochi
corridor as a generator of economic momentum.
2. To selectively concentrate urban and rural
economic activities and diversify the economic
base mainly through strengthening production
sectors
3. To attain a certain level of self-sufficiency in
production (primary and secondary) sectors and
deliberate planning intervention in service
sector so that service sector enhances the
production sectors.
4. To develop the key sectors of development of
the district so that the integration of these
sectors can ensure and trigger the socio-
economic development of the district.
5. To conserve the existing cultural and heritage
fabrics of the district in a planned manner and to
utilize them effectively and sustainably for
developing tourism sector.
6. To achieve equitable spatial distribution of
facilities through a network of regional/sub
regional and service centers which are linked to
the service region through rational
transportation network
7. To conserve the ecologically sensitive areas and
to minimize environmental pollution so as to
ensure sustainable development.
160
District Spatial Plan - Thrissur TENTATIVE DEVELOPMENT CONCEPT
Department of Town & Country Planning, KeralaDepartment of Town & Country Planning, Kerala
Chapter – 14TENTATIVE DEVELOPMENT CONCEPT
14.1 INTRODUCTION
Once the goals and objectives of the District Spa-
tial Plan are set, the ways and means to achieve them
have to be explored. Formulation of Tentative devel-
opment concept of the district by synthesis of the find-
ings of the spatial analysis and sectoral analysis, in the
orbit of the goals and objectives, over the district plat-
form that will provide the required development frame
work for integrated development of the district is there-
fore attempted in this chapter.
This chapter discusses the Tentative develop-
ment concept derived for District Spatial Plan Thrissur.
We have the spatial structure of the district evolved
from the hierarchy of settlements, connectivity and
activity pattern. The environmental aspects of the dis-
trict are also studied. Even though sectoral analysis of
some of the sectors are yet to be completed, we have
results of sectoral analysis of following sectors namely
Agriculture, Industries and Tourism which have physi-
cal manifestation on land. The resource pattern of the
district evolved through spatial analysis of these sec-
tors is also available. The development concept is de-
rived by incorporating these with the spatial structure
of the district and that of the macro region.
As per the settlement analysis, it is found that
the settlements in the District can be grouped in to four
hierarchies. The future hierarchy of settlement of the
district evolved shows that Thrissur Municipal Corpo-
ration is the highest order settlement in the District.
Chalakkudy Municipal Council, Irinjalakkuda Municipal
Council, Kunnamkulam Municipal Council are the ex-
isting and Chelakkara and Mattathur Grama Panchayats
are the proposed second order settlements.
Kodungallur Municipal Council, Guruvayur Municipal
Council and Grama Panchayats of Alagappanagar,
Pananchery, Venkitangu, Valappad and Wadakkanchery
are proposed as third order settlements. In general
there is one first order settlement, 5 second order
settlements and 7 third order settlements in the Dis-
trict. The first order settlement is supposed to provide
higher order facilities in Education, Health and in other
sectors to the entire district population and is
conceptualised as the regional centre of the district.
The second order settlements are supposed to provide
second order facilities of various development sectors
to the surrounding area and are hence envisaged as the
sub regional centers. A district level road network with
roads of three hierarchies viz major roads, sub major
roads and minor roads is suggested, such that it con-
nects all the higher order settlements each other. The
details of formation of development concept of Thrissur
district is described hereunder:
14.2 DEVELOPMENT CONCEPT FORMATION
Analysis of various parameters pertaining to the
development of the district and findings emerged out
from them clearly show that the district has
underutilized or un-utilized potential in primary as well
as in secondary sector. The district shows a flourishing
tertiary sector without having proper backward and for-
ward linkages with primary and secondary sectors. More
over the district is bestowed with natural resources,
tourism potential spots, cultural richness etc. At the
same time there are areas/regions of environmental
concern. The resource base of the district as well as
161
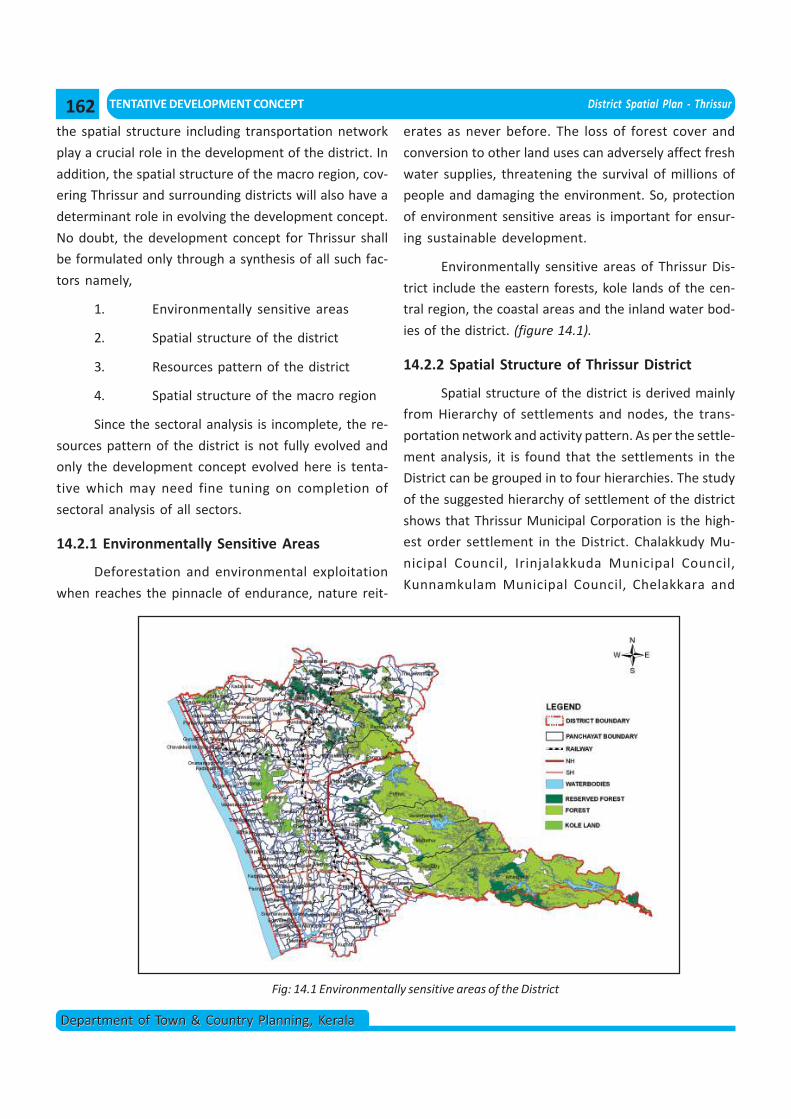
TENTATIVE DEVELOPMENT CONCEPT District Spatial Plan - Thrissur
Department of Town & Country Planning, KeralaDepartment of Town & Country Planning, Kerala
the spatial structure including transportation network
play a crucial role in the development of the district. In
addition, the spatial structure of the macro region, cov-
ering Thrissur and surrounding districts will also have a
determinant role in evolving the development concept.
No doubt, the development concept for Thrissur shall
be formulated only through a synthesis of all such fac-
tors namely,
1. Environmentally sensitive areas
2. Spatial structure of the district
3. Resources pattern of the district
4. Spatial structure of the macro region
Since the sectoral analysis is incomplete, the re-
sources pattern of the district is not fully evolved and
only the development concept evolved here is tenta-
tive which may need fine tuning on completion of
sectoral analysis of all sectors.
14.2.1 Environmentally Sensitive Areas
Deforestation and environmental exploitation
when reaches the pinnacle of endurance, nature reit-
erates as never before. The loss of forest cover and
conversion to other land uses can adversely affect fresh
water supplies, threatening the survival of millions of
people and damaging the environment. So, protection
of environment sensitive areas is important for ensur-
ing sustainable development.
Environmentally sensitive areas of Thrissur Dis-
trict include the eastern forests, kole lands of the cen-
tral region, the coastal areas and the inland water bod-
ies of the district. (figure 14.1).
14.2.2 Spatial Structure of Thrissur District
Spatial structure of the district is derived mainly
from Hierarchy of settlements and nodes, the trans-
portation network and activity pattern. As per the settle-
ment analysis, it is found that the settlements in the
District can be grouped in to four hierarchies. The study
of the suggested hierarchy of settlement of the district
shows that Thrissur Municipal Corporation is the high-
est order settlement in the District. Chalakkudy Mu-
nicipal Council, Irinjalakkuda Municipal Council,
Kunnamkulam Municipal Council, Chelakkara and
Fig: 14.1 Environmentally sensitive areas of the District
162
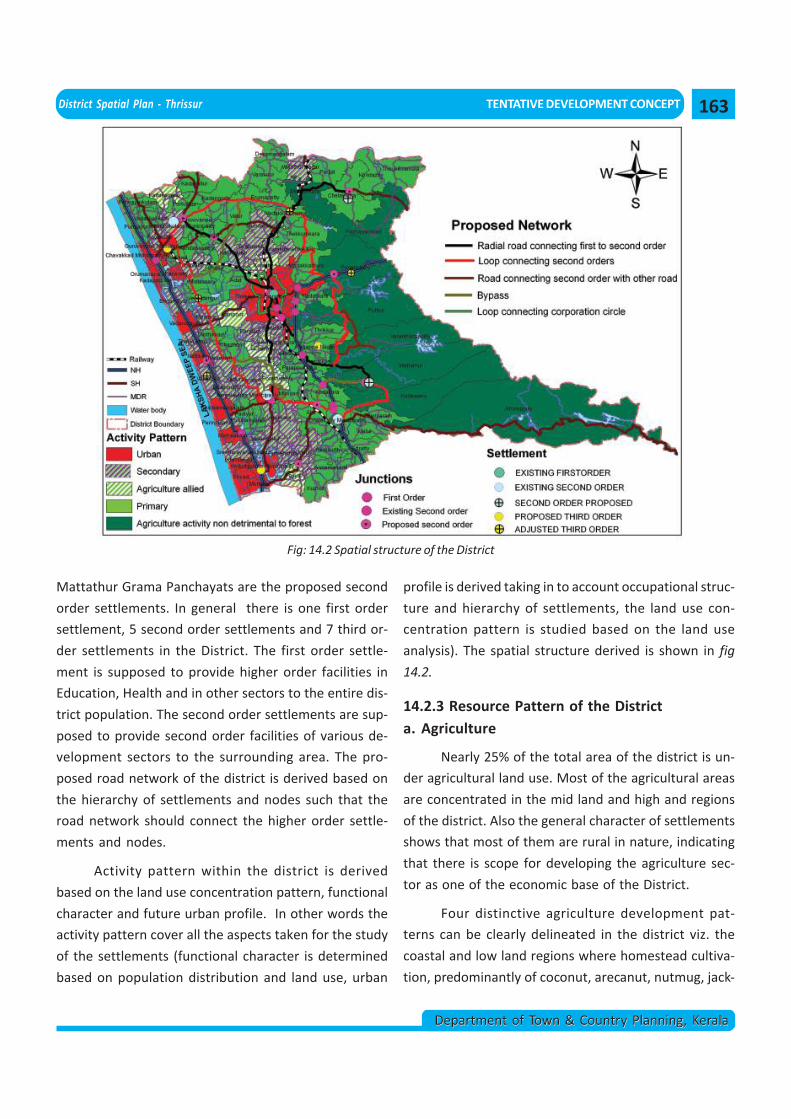
District Spatial Plan - Thrissur TENTATIVE DEVELOPMENT CONCEPT
Department of Town & Country Planning, KeralaDepartment of Town & Country Planning, Kerala
Mattathur Grama Panchayats are the proposed second
order settlements. In general there is one first order
settlement, 5 second order settlements and 7 third or-
der settlements in the District. The first order settle-
ment is supposed to provide higher order facilities in
Education, Health and in other sectors to the entire dis-
trict population. The second order settlements are sup-
posed to provide second order facilities of various de-
velopment sectors to the surrounding area. The pro-
posed road network of the district is derived based on
the hierarchy of settlements and nodes such that the
road network should connect the higher order settle-
ments and nodes.
Activity pattern within the district is derived
based on the land use concentration pattern, functional
character and future urban profile. In other words the
activity pattern cover all the aspects taken for the study
of the settlements (functional character is determined
based on population distribution and land use, urban
Fig: 14.2 Spatial structure of the District
profile is derived taking in to account occupational struc-
ture and hierarchy of settlements, the land use con-
centration pattern is studied based on the land use
analysis). The spatial structure derived is shown in fig
14.2.
14.2.3 Resource Pattern of the Districta. Agriculture
Nearly 25% of the total area of the district is un-
der agricultural land use. Most of the agricultural areas
are concentrated in the mid land and high and regions
of the district. Also the general character of settlements
shows that most of them are rural in nature, indicating
that there is scope for developing the agriculture sec-
tor as one of the economic base of the District.
Four distinctive agriculture development pat-
terns can be clearly delineated in the district viz. the
coastal and low land regions where homestead cultiva-
tion, predominantly of coconut, arecanut, nutmug, jack-
163
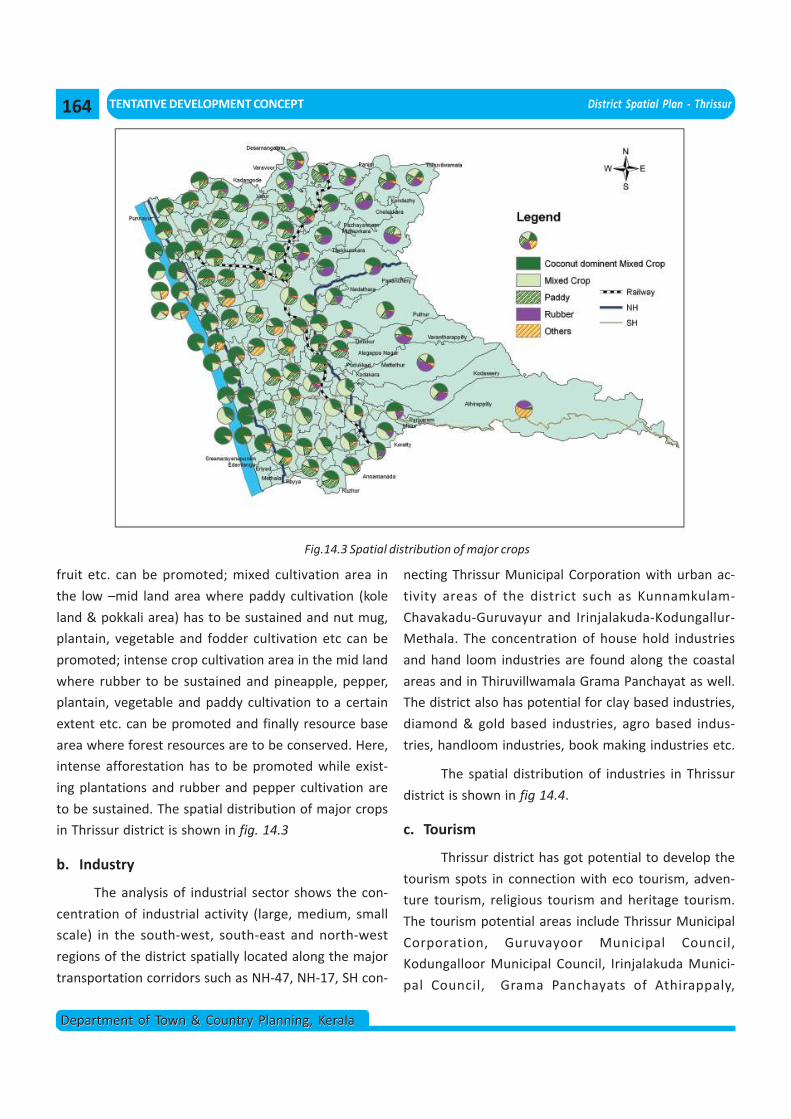
TENTATIVE DEVELOPMENT CONCEPT District Spatial Plan - Thrissur
Department of Town & Country Planning, KeralaDepartment of Town & Country Planning, Kerala
fruit etc. can be promoted; mixed cultivation area in
the low –mid land area where paddy cultivation (kole
land & pokkali area) has to be sustained and nut mug,
plantain, vegetable and fodder cultivation etc can be
promoted; intense crop cultivation area in the mid land
where rubber to be sustained and pineapple, pepper,
plantain, vegetable and paddy cultivation to a certain
extent etc. can be promoted and finally resource base
area where forest resources are to be conserved. Here,
intense afforestation has to be promoted while exist-
ing plantations and rubber and pepper cultivation are
to be sustained. The spatial distribution of major crops
in Thrissur district is shown in fig. 14.3
b. Industry
The analysis of industrial sector shows the con-
centration of industrial activity (large, medium, small
scale) in the south-west, south-east and north-west
regions of the district spatially located along the major
transportation corridors such as NH-47, NH-17, SH con-
Fig.14.3 Spatial distribution of major crops
necting Thrissur Municipal Corporation with urban ac-
tivity areas of the district such as Kunnamkulam-
Chavakadu-Guruvayur and Irinjalakuda-Kodungallur-
Methala. The concentration of house hold industries
and hand loom industries are found along the coastal
areas and in Thiruvillwamala Grama Panchayat as well.
The district also has potential for clay based industries,
diamond & gold based industries, agro based indus-
tries, handloom industries, book making industries etc.
The spatial distribution of industries in Thrissur
district is shown in fig 14.4.
c. Tourism
Thrissur district has got potential to develop the
tourism spots in connection with eco tourism, adven-
ture tourism, religious tourism and heritage tourism.
The tourism potential areas include Thrissur Municipal
Corporation, Guruvayoor Municipal Council,
Kodungalloor Municipal Council, Irinjalakuda Munici-
pal Council, Grama Panchayats of Athirappaly,
164
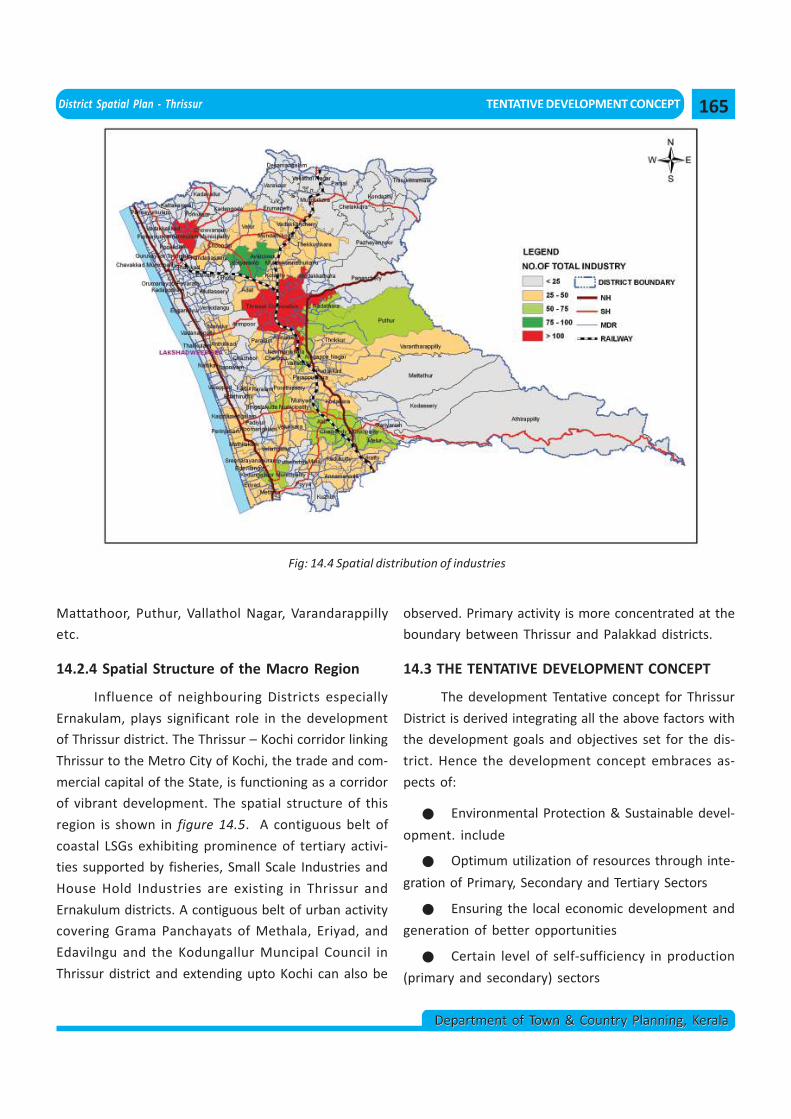
District Spatial Plan - Thrissur TENTATIVE DEVELOPMENT CONCEPT
Department of Town & Country Planning, KeralaDepartment of Town & Country Planning, Kerala
Fig: 14.4 Spatial distribution of industries
Mattathoor, Puthur, Vallathol Nagar, Varandarappilly
etc.
14.2.4 Spatial Structure of the Macro Region
Influence of neighbouring Districts especially
Ernakulam, plays significant role in the development
of Thrissur district. The Thrissur – Kochi corridor linking
Thrissur to the Metro City of Kochi, the trade and com-
mercial capital of the State, is functioning as a corridor
of vibrant development. The spatial structure of this
region is shown in figure 14.5. A contiguous belt of
coastal LSGs exhibiting prominence of tertiary activi-
ties supported by fisheries, Small Scale Industries and
House Hold Industries are existing in Thrissur and
Ernakulum districts. A contiguous belt of urban activity
covering Grama Panchayats of Methala, Eriyad, and
Edavilngu and the Kodungallur Muncipal Council in
Thrissur district and extending upto Kochi can also be
observed. Primary activity is more concentrated at the
boundary between Thrissur and Palakkad districts.
14.3 THE TENTATIVE DEVELOPMENT CONCEPT
The development Tentative concept for Thrissur
District is derived integrating all the above factors with
the development goals and objectives set for the dis-
trict. Hence the development concept embraces as-
pects of:
Environmental Protection & Sustainable devel-
opment. include
Optimum utilization of resources through inte-
gration of Primary, Secondary and Tertiary Sectors
Ensuring the local economic development and
generation of better opportunities
Certain level of self-sufficiency in production
(primary and secondary) sectors
165
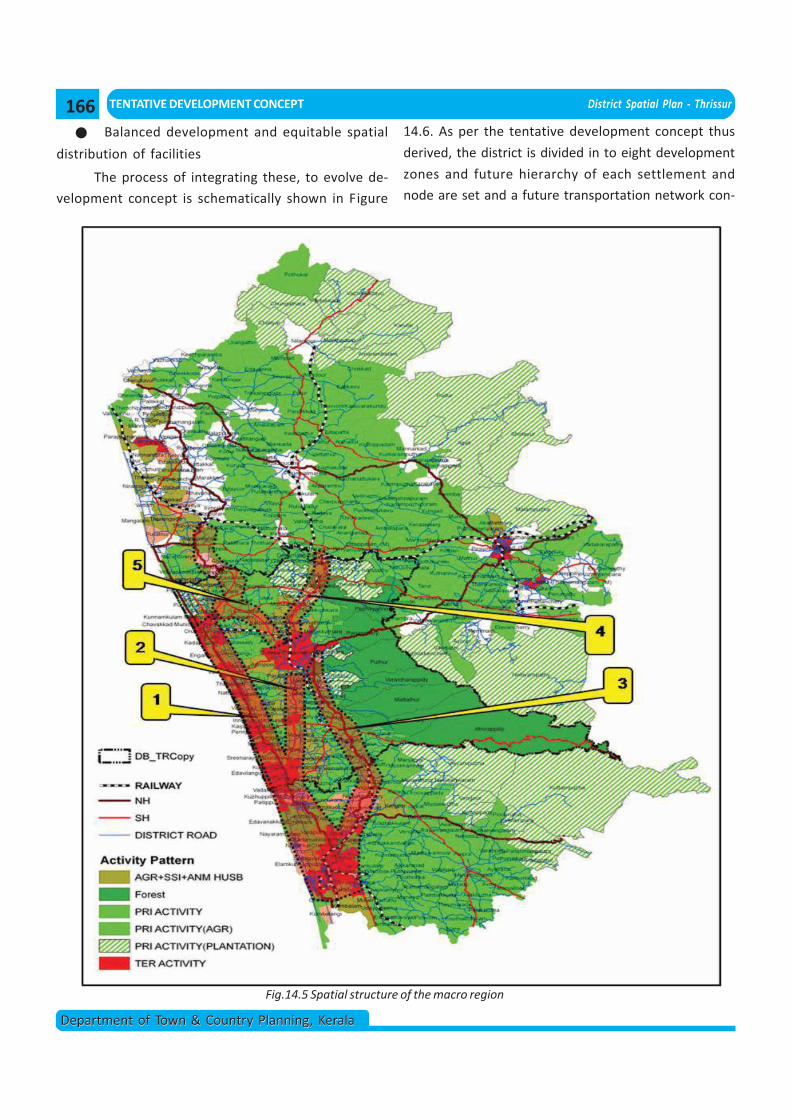
TENTATIVE DEVELOPMENT CONCEPT District Spatial Plan - Thrissur
Department of Town & Country Planning, KeralaDepartment of Town & Country Planning, Kerala
Balanced development and equitable spatial
distribution of facilities
The process of integrating these, to evolve de-
velopment concept is schematically shown in Figure
Fig.14.5 Spatial structure of the macro region
14.6. As per the tentative development concept thus
derived, the district is divided in to eight development
zones and future hierarchy of each settlement and
node are set and a future transportation network con-
166
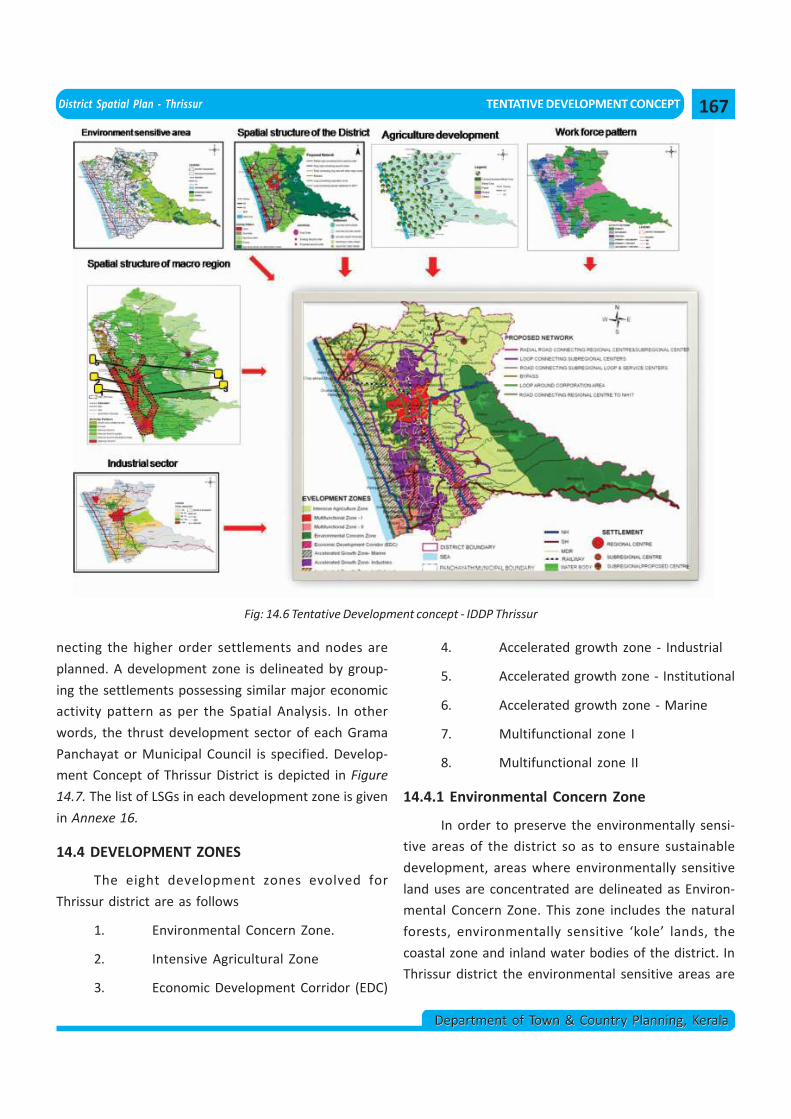
District Spatial Plan - Thrissur TENTATIVE DEVELOPMENT CONCEPT
Department of Town & Country Planning, KeralaDepartment of Town & Country Planning, Kerala
necting the higher order settlements and nodes are
planned. A development zone is delineated by group-
ing the settlements possessing similar major economic
activity pattern as per the Spatial Analysis. In other
words, the thrust development sector of each Grama
Panchayat or Municipal Council is specified. Develop-
ment Concept of Thrissur District is depicted in Figure
14.7. The list of LSGs in each development zone is given
in Annexe 16.
14.4 DEVELOPMENT ZONES
The eight development zones evolved for
Thrissur district are as follows
1. Environmental Concern Zone.
2. Intensive Agricultural Zone
3. Economic Development Corridor (EDC)
Fig: 14.6 Tentative Development concept - IDDP Thrissur
4. Accelerated growth zone - Industrial
5. Accelerated growth zone - Institutional
6. Accelerated growth zone - Marine
7. Multifunctional zone I
8. Multifunctional zone II
14.4.1 Environmental Concern Zone
In order to preserve the environmentally sensi-
tive areas of the district so as to ensure sustainable
development, areas where environmentally sensitive
land uses are concentrated are delineated as Environ-
mental Concern Zone. This zone includes the natural
forests, environmentally sensitive ‘kole’ lands, the
coastal zone and inland water bodies of the district. In
Thrissur district the environmental sensitive areas are
167
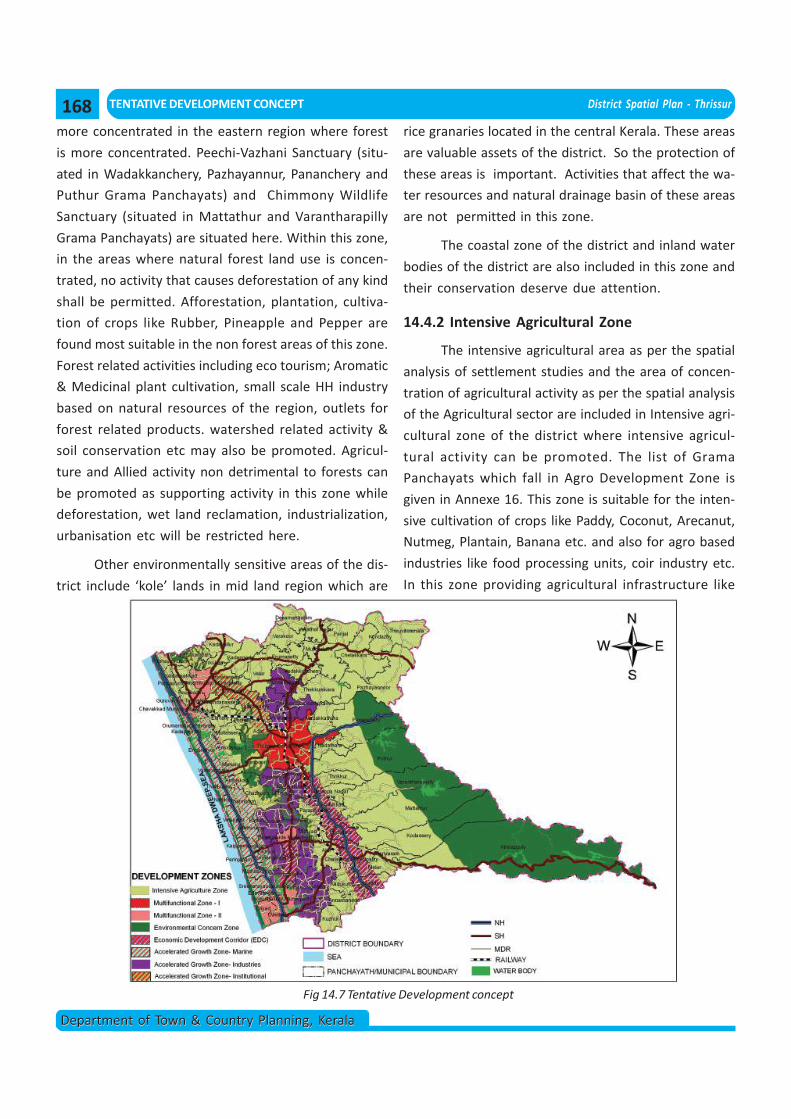
TENTATIVE DEVELOPMENT CONCEPT District Spatial Plan - Thrissur
Department of Town & Country Planning, KeralaDepartment of Town & Country Planning, Kerala
Fig 14.7 Tentative Development concept
more concentrated in the eastern region where forest
is more concentrated. Peechi-Vazhani Sanctuary (situ-
ated in Wadakkanchery, Pazhayannur, Pananchery and
Puthur Grama Panchayats) and Chimmony Wildlife
Sanctuary (situated in Mattathur and Varantharapilly
Grama Panchayats) are situated here. Within this zone,
in the areas where natural forest land use is concen-
trated, no activity that causes deforestation of any kind
shall be permitted. Afforestation, plantation, cultiva-
tion of crops like Rubber, Pineapple and Pepper are
found most suitable in the non forest areas of this zone.
Forest related activities including eco tourism; Aromatic
& Medicinal plant cultivation, small scale HH industry
based on natural resources of the region, outlets for
forest related products. watershed related activity &
soil conservation etc may also be promoted. Agricul-
ture and Allied activity non detrimental to forests can
be promoted as supporting activity in this zone while
deforestation, wet land reclamation, industrialization,
urbanisation etc will be restricted here.
Other environmentally sensitive areas of the dis-
trict include ‘kole’ lands in mid land region which are
rice granaries located in the central Kerala. These areas
are valuable assets of the district. So the protection of
these areas is important. Activities that affect the wa-
ter resources and natural drainage basin of these areas
are not permitted in this zone.
The coastal zone of the district and inland water
bodies of the district are also included in this zone and
their conservation deserve due attention.
14.4.2 Intensive Agricultural Zone
The intensive agricultural area as per the spatial
analysis of settlement studies and the area of concen-
tration of agricultural activity as per the spatial analysis
of the Agricultural sector are included in Intensive agri-
cultural zone of the district where intensive agricul-
tural activity can be promoted. The list of Grama
Panchayats which fall in Agro Development Zone is
given in Annexe 16. This zone is suitable for the inten-
sive cultivation of crops like Paddy, Coconut, Arecanut,
Nutmeg, Plantain, Banana etc. and also for agro based
industries like food processing units, coir industry etc.
In this zone providing agricultural infrastructure like
168
District Spatial Plan - Thrissur TENTATIVE DEVELOPMENT CONCEPT
Department of Town & Country Planning, KeralaDepartment of Town & Country Planning, Kerala
wholesale markets, seed centers, warehousing facili-
ties etc for supporting the agriculture activities shall be
given priority. This zone is also suitable for promoting
animal husbandry related activities.
Thus Agriculture, small scale industries to pro-
mote value addition of produces of agriculture and ani-
mal husbandry may be promoted as major activity in
this zone. Animal husbandry, SSI & HH industries may
be promoted as supporting activity in this zone where
as conversion of agriculture land and urbanisation will
be restricted.
14.4.3 Economic Development Corridor (EDC).
The areas where tertiary activities and second-
ary activities (especially industrial activity to trigger eco-
nomic development) are more concentrated or can be
concentrated due to locational advantages are zoned
as the Economic Development Corridor (EDC). Two de-
velopment corridors, namely the Thrissur - Ernakulam
(NH-47) corridor and Thrissur – Irinjalakuda -
Kodungalloor – Paravoor - Ernakulam (SH-22 & NH-17)
corridor are gaining importance in this regard. This zone
is also influenced by Ernakulam, the commercial and
industrial hub of the state. Industrial activities, espe-
cially large scale production industries, are being at-
tracted to this region. This Zone has profound implica-
tion in terms of good transportation linkages with sea
port, airport, nearest urban centre etc. This zone has
got wide influence region in terms of employment gen-
erated, raw resources utilised and products marketed.
This zone has to play a key role to trigger the economic
growth and generating employment opportunities. This
zone is suitable for large/ medium scale industries, in-
dustrial parks, Special Economic Zones (SEZ’s), IT & Info
Parks, Quality Education and Health care institutions
etc. Care shall be taken to restrict polluting industries.
Agriculture and allied activity and agro based indus-
tries may be allowed as supporting activities.
14.4.4 Accelerated growth zone - Industrial
The mid land areas of the district, extending north
south, along either sides of Irinjalakuda – Thrissur –
Shornur corridor where the activity pattern is ‘second-
ary’ is delineated as Accelerated growth zone -Indus-
trial. In this Zone special types of developmental ac-
tivities, in line with the existing activities, which are
found very much suitable for those particular places,
are intended. This zone should enhance the small scale
and house hold industrial activities which support value
addition of agriculture, fisheries and marine products.
This zone can also accommodate supporting industries
which enhance the industrial activity in the Economic
Development Corridor.
14.4.5 Accelerated growth zone - Institutional
The region along SH-69, (the transportation cor-
ridor that connects Thrissur Municipal Corporation and
Kunnamkulam Municipal Council) is zoned as Acceler-
ated growth zone –Institutional. Activities of the Grama
Panchayats in the region will definitely have influence
of the urban centers of Thrissur Municipal Corporation
and Kunnamkulam Municipal Council. Social infrastruc-
ture facilities including hospitals, health institutions
and educational facilities are already in existence in
the region and there is scope for future institutional
developments here. The zone is located near to the
Intensive Agricultural zone, so agro based industries
can be promoted, to a certain extent in this zone.
14.4.6 Accelerated growth zone - Marine
The zone where fisheries and tertiary activities
are more concentrated are designated as Accelerated
growth zone - Marine. This zone is located in the coastal
region of Thrissur district. The LSGs along NH-17 are in-
cluded in this zone. From the activity analysis, it is found
that nature of most of the LSGs fall under the category
of urban or secondary activities. Hence this zone can be
promoted for service sector activities and industrial
sector which enhance the fisheries and allied activi-
ties. We can promote Fish markets, fish preservation
and production units, export and import of marine prod-
ucts, ice plants, Aquaculture Farms, Ornamental fish
169
TENTATIVE DEVELOPMENT CONCEPT District Spatial Plan - Thrissur
Department of Town & Country Planning, KeralaDepartment of Town & Country Planning, Kerala
trading units, fish seed farms Fish Farmers clubs, value
added marine product outlet units, development of fish
harbour & Boat building Yards, production and mainte-
nance units of Machineries. This zone is also influenced
by Ernakulam, the commercial and industrial hub of the
state. The zone has immense potential with HH indus-
trial activities in connection with allied activities and
also tourism potential.
14.4.7 Multifunctional zone I
This zone includes the jurisdictional area of
Thrissur Municipal Corporation. In this zone all urban
activities including higher order educational and health
care facilities and a transportation network copping up
with the requirements etc are to be made available.
This zone will act as a service centre for the entire dis-
trict. Suitable projects and programmes are to be imple-
mented to exploit the urban potential of this zone.
Thrissur Municipal Corporation which is the only
first order settlement is the heart of the district due to
its multifunctional character (seat of specialized and
regional level facilities, status as administrative head
quarters, trade and commercial centre of the district
and Art & Cultural Centre) and also its spatial location
within the district. Thrissur Municipal Corporation is
located almost in the geographic centre of the District
and reflects the character of activities of the whole dis-
trict. Also Thrissur Municipal Corporation has good in-
ter district and intra district connectivity both by road
and railway. This zone plays a crucial role both in ser-
vice sector and other sectors and also plays a crucial
role in creating good link between all sectors in an effi-
cient way.
Thrissur Municipal Corporation has rich in tour-
ism, heritage, cultural, religious and archaeological
wealth and acts as cultural centre of District as well as
the state. Thrissur Municipal Corporation has also good
role in industrial sector also. Gold and diamond indus-
try, textile industry, real estate, banking, brick and tile
industry, furniture making, automobile industry and HH
industries etc are existing. This zone has intense po-
tential in infrastructure facilities like super specialty
hospitals, five star hotels, Health institutions, IT parks,
educational facilities etc. This zone is surrounded by
intensive agriculture zone. So agro and allied indus-
tries like processing units, value addition units etc in
this connection also has potential.
Thus, Thrissur Municipal Corporation, the pro-
posed regional centre of Thrissur District, will develop
as a regional centre in the state next only to Cochin.
The development of the zone should be in such a way
that it should minimize the degradation of nature and
other pollution related activities.
14.4.8 Multifunctional zone II
This zone is the multifunctional zone of second
order activities which also serve various sectors effec-
tively. In this zone, all types of 2nd order urban activi-
ties, 2nd order educational and health care facilities
and enabling transportation facilities etc. are to be pro-
vided. This zone will act as a service centre for the hinter
lands and this zone is very much suitable for industries
utilizing agricultural produces of hinter land. The
Guruvayur – Chavakkad - Kunnamkulam region as well
as Kodungallur -Irnjalakkuda -Eriyad Methala region
come under this zone. All the LSGs in this zone are lo-
cated along major coastal transportation corridors of
NH-17/SH 69/ SH 22.
14.5 HIERARCHY OF SETTLEMENTS
The proposed hierarchy of settlements required
for a balanced distribution of facilities to all the Local
Governments in the district consists of Regional Cen-
tre, Sub regional centers and Service centers. The pro-
posed hierarchy of settlements is shown in Figure 14.8.
14.6 TRANSPORTATION NETWORK
Conceptual road network is prepared based on
the existing and proposed hierarchy of settlements.
The entire district depends upon the monocentric
single first order settlement ie, Thrissur Municipal Cor-
170
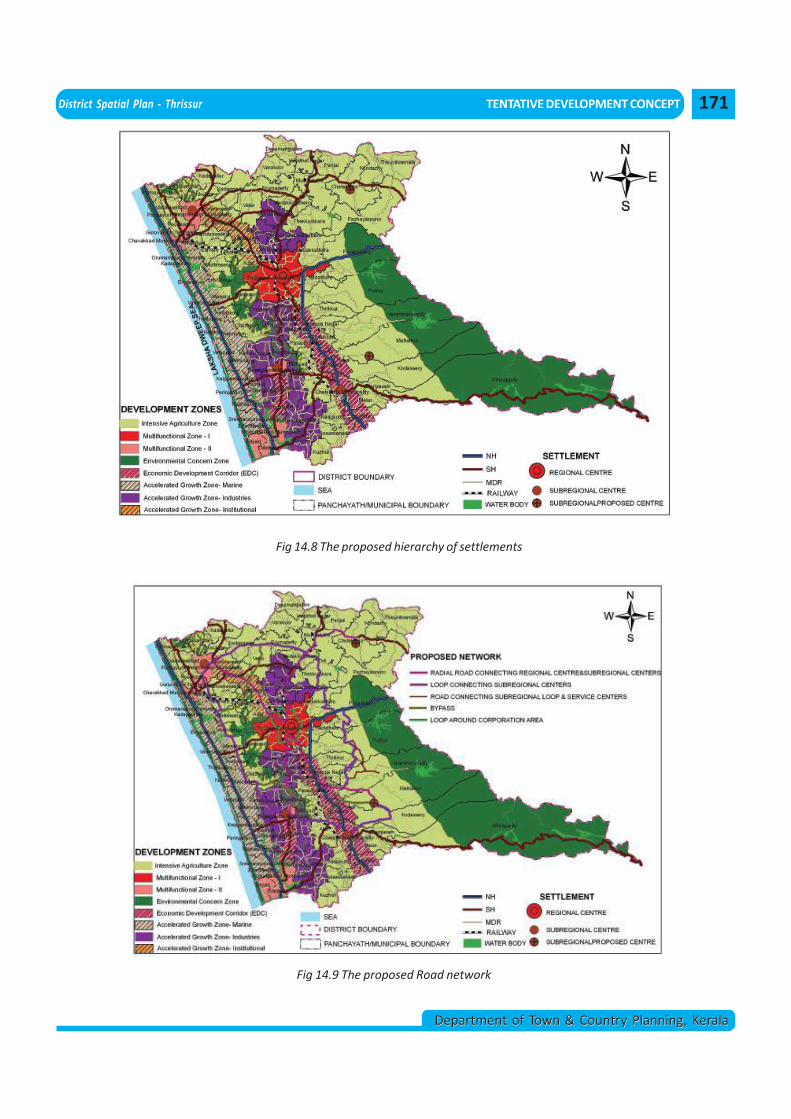
District Spatial Plan - Thrissur TENTATIVE DEVELOPMENT CONCEPT
Department of Town & Country Planning, KeralaDepartment of Town & Country Planning, Kerala
Fig 14.8 The proposed hierarchy of settlements
Fig 14.9 The proposed Road network
171
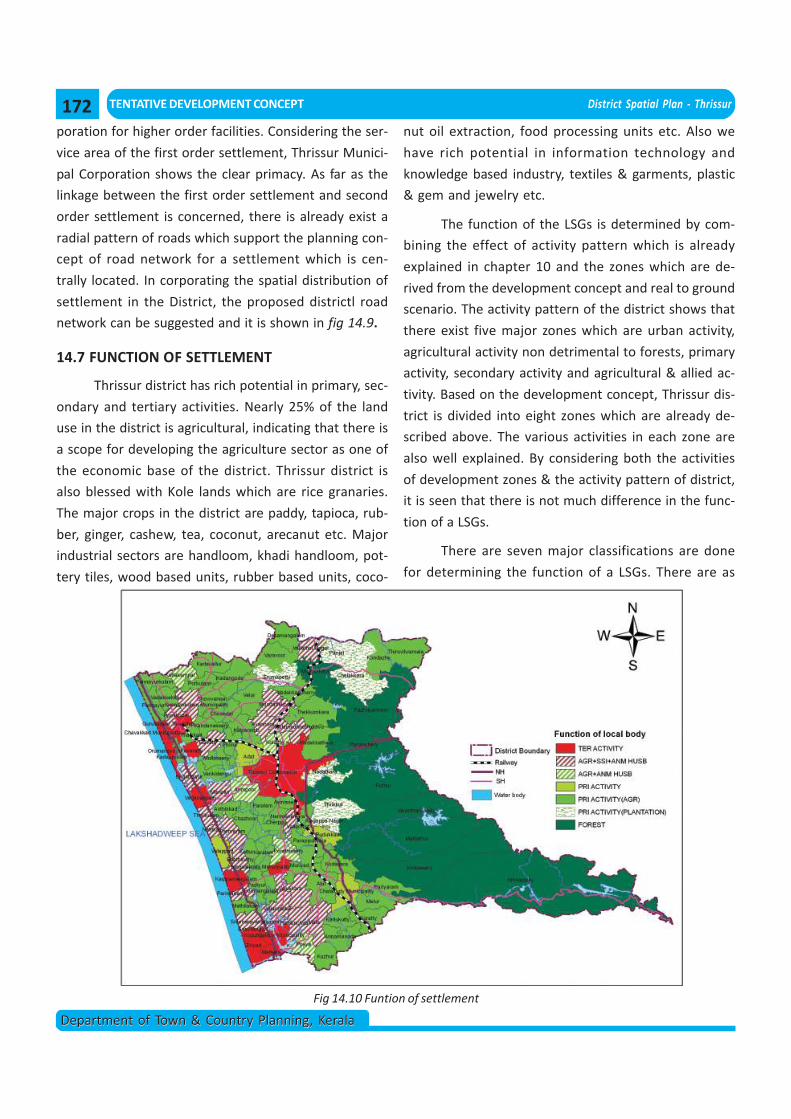
TENTATIVE DEVELOPMENT CONCEPT District Spatial Plan - Thrissur
Department of Town & Country Planning, KeralaDepartment of Town & Country Planning, Kerala
poration for higher order facilities. Considering the ser-
vice area of the first order settlement, Thrissur Munici-
pal Corporation shows the clear primacy. As far as the
linkage between the first order settlement and second
order settlement is concerned, there is already exist a
radial pattern of roads which support the planning con-
cept of road network for a settlement which is cen-
trally located. In corporating the spatial distribution of
settlement in the District, the proposed districtl road
network can be suggested and it is shown in fig 14.9.
14.7 FUNCTION OF SETTLEMENT
Thrissur district has rich potential in primary, sec-
ondary and tertiary activities. Nearly 25% of the land
use in the district is agricultural, indicating that there is
a scope for developing the agriculture sector as one of
the economic base of the district. Thrissur district is
also blessed with Kole lands which are rice granaries.
The major crops in the district are paddy, tapioca, rub-
ber, ginger, cashew, tea, coconut, arecanut etc. Major
industrial sectors are handloom, khadi handloom, pot-
tery tiles, wood based units, rubber based units, coco-
nut oil extraction, food processing units etc. Also we
have rich potential in information technology and
knowledge based industry, textiles & garments, plastic
& gem and jewelry etc.
The function of the LSGs is determined by com-
bining the effect of activity pattern which is already
explained in chapter 10 and the zones which are de-
rived from the development concept and real to ground
scenario. The activity pattern of the district shows that
there exist five major zones which are urban activity,
agricultural activity non detrimental to forests, primary
activity, secondary activity and agricultural & allied ac-
tivity. Based on the development concept, Thrissur dis-
trict is divided into eight zones which are already de-
scribed above. The various activities in each zone are
also well explained. By considering both the activities
of development zones & the activity pattern of district,
it is seen that there is not much difference in the func-
tion of a LSGs.
There are seven major classifications are done
for determining the function of a LSGs. There are as
Fig 14.10 Funtion of settlement
172
District Spatial Plan - Thrissur TENTATIVE DEVELOPMENT CONCEPT
Department of Town & Country Planning, KeralaDepartment of Town & Country Planning, Kerala
follows
1. Tertiary activity which is similar to urban activity
area
2. Primary activity
3. Primary activity – Agricultural
4. Primary activity – Plantation
5. Agricultural activity non detrimental to forests
6. Agricultural activity + Animal Husbandry activity
which is similar to agricultural & allied activity
7. Agricultural activity + Animal Husbandry activity
+ Small scale industrial activity which is similar to
secondary activity area.
The major functions of each LSGs in the district is
shown in figure 14.10.
14.8 PROJECTION OF POPULATION
Population growth of an area depends on num-
bers of births, death, in migrants and out migrants over
a time period taken for the population projection. If
one can predict the exact future values of all these fac-
tors, population projection of that area can be done
very accurately.
Thrissur district shows an increasing trend in the
population figures during the period 1981-2001. But at
the same time the growth rate of population is decreas-
ing during 1981-2001. The spatial development plan of
Thrissur district envisage the planned sustainable de-
velopment of Thrissur district with optimum utilization
of resources, planned diversification of economic ac-
tivities to trigger the local economic growth, genera-
tion of better opportunities, balanced development,
equitable spatial distribution of facilities and thus to
improve the quality of life. The development goal also
envisage to develop the district as an eco-friendly and
economically vibrant region in the state. Obliviously
the programs and projects developed and imple-
mented based on this planning concept will attract more
population to the district in terms of creation of new
and better paid employment opportunities, access to
facilities and so forth. Hence the main intention of the
spatial development plan of Thrissur district is regen-
erate the declining trend of the growth rate of popula-
tion through the maximum optimal utilization of re-
sources available in the district and developing the pro-
duction sector along with other sectors such as animal
husbandry, industrial and tourism etc as one of major
the economic bases of the district. At the same time
this will not interfere with the protection of natural
resources and environmental sensitive areas. Mani-
festly, optimum utilization of the resources in the Dis-
trict will have reflection in the future occupational struc-
ture and future population of the District.
From the development concept, Thrissur district
is divided into eight development zones. They are as
follows
1. Environmental Concern Zone.
2. Intensive Agricultural Zone
3. Economic Development Corridor (EDC)
4. Accelerated growth zone - Industrial
5. Accelerated growth zone - Institutional
6. Accelerated growth zone - Marine
7. Multifunctional zone I
8. Multifunctional zone II
Each development zone has its own develop-
ment potential and this has to be taken into account in
ascertaining the future occupational structure, popula-
tion and its distribution within the district. Another fac-
tor to be considered in the projection of occupational
structure and population distribution is the projected
urban scenario of the District. The urban population
content of Thrissur District will increase to 29.8% by
2021 from the value of 18.13% in 2001. It is projected
that 11 rural LSGs, will attain urban status by the end of
the plan period. The population in the district is to be
so redistributed (to the possible extent) that it has more
concentration in multifunctional zones, accelerated
growth zone and economic development corridor, less
concentration in intensive agricultural zone and lest in
environmental concern zone.
The nature of the each development zone and
173
TENTATIVE DEVELOPMENT CONCEPT District Spatial Plan - Thrissur
Department of Town & Country Planning, KeralaDepartment of Town & Country Planning, Kerala
how they make impressions on the occupational struc-
ture and population growth rate is discussed hereun-
der.
Environmental concern zone includes the natu-
ral forests, environmentally sensitive ‘kole’ lands, the
coastal zone and inland water bodies of the district. In
Thrissur district the environmental sensitive areas are
more concentrated in the eastern region where forest
is more concentrated. Any activity that causes defores-
tation shall not be permitted in this area. Agriculture
and allied activity non detrimental to forests can be
promoted as supporting activity in this zone while de-
forestation, wet land reclamation, industrialization,
urbanisation etc will be restricted here. Hence an en-
hanced growth in population and work force is not ex-
pected in this zone. Only natural growth in population
and slight increase in agricultural work force can be
expected.
Intensive agricultural zone is suitable for the in-
tensive cultivation of crops like Paddy, Coconut,
Arecanut, Nutmeg, Plantain, Banana etc. and also for
agro based industries like food processing units, coir
industry etc. In this zone providing agricultural infra-
structure like wholesale markets, seed centers, ware-
housing facilities etc for supporting the agriculture ac-
tivities shall be given priority. This zone is also suitable
for promoting animal husbandry related activities,
servise sector activities which support primary sector
key activities envisaged in this zone and industrial ac-
tivities (mainly small scale) which enhance the value
addition of the production from this zone. This will bring
more cultivators and agricultural laborers into this zone.
Consequently there will be increase in growth rate of
population in this zone along with increase in agricul-
tural workers. The increase in the workforce will mainly
be in primary sector- i.e. agriculture sector. However
the growth of the population in this zone is limited to
the extent that the attraction of further population to
this zone is enhanced only after satisfying the demands
of the present population and its natural growth in this
zone. Hence a population growth rate slightly higher
than the natural growth rate can be envisaged in this
zone.
Economic development corridor has profound
implication in terms of good transportation linkages
with sea port, airport, nearest urban centre etc. This
zone has got wide influence region in terms of employ-
ment generated, raw resources utilized and products
marketed. For that reasons we can expect floating
population for a period of time. Also it is located near
the intensive agricultural zone and accelerated growth
zone and also it is well connected to multifunction
zones. More over this zone is mainly to provide infra-
structure and other facilities so as to generate devel-
opment impulses to the scale and as such is not sup-
posed to create high density residential population. It
is perceived that the major chunk of floating popula-
tion in this zone may likely to settle in the hinterland as
well as nearby urban centers within and outside the
district. So we can expect a slight enhancement in the
population. Also an increase in service sector workers
and industrial workers.
Accelerated growth zone (Industrial) should en-
hance the small scale and house hold industrial activi-
ties which support value addition of agriculture, fish-
eries and marine products. This zone can also accom-
modate supporting industries which enhance the in-
dustrial activity in the Economic Development Corri-
dor. Secondary workers are more concentrated in that
area, so we can expect high enhanced growth rate of
population.
Accelerated growth zone (Institutional) should
enhance the social infrastructure facilities including
hospitals, health institutions and educational facilities.
The zone is located near to the Intensive Agricultural
zone, so agro based industries can be promoted, to a
certain extent in this zone. Here also we can expect a
slight enhanced growth. Also service sectoral workers
are more concentrated in that area.
Accelerated growth zone (Marine) zone is located
174
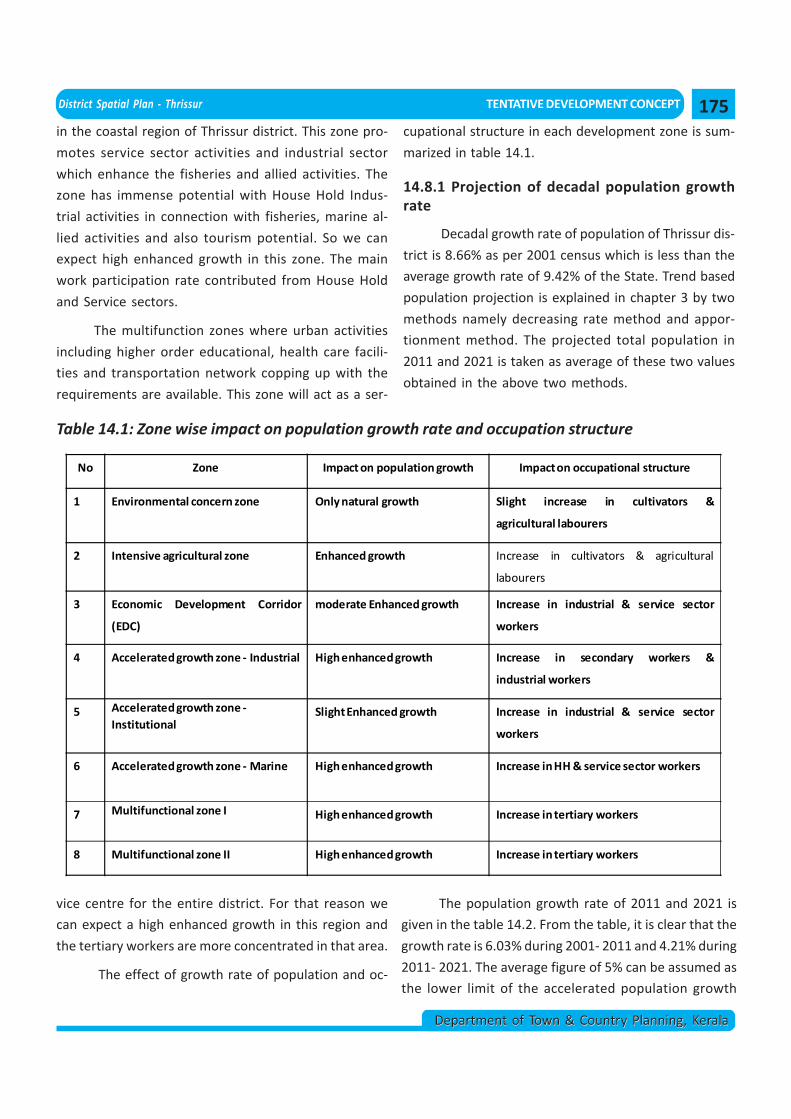
District Spatial Plan - Thrissur TENTATIVE DEVELOPMENT CONCEPT
Department of Town & Country Planning, KeralaDepartment of Town & Country Planning, Kerala
in the coastal region of Thrissur district. This zone pro-
motes service sector activities and industrial sector
which enhance the fisheries and allied activities. The
zone has immense potential with House Hold Indus-
trial activities in connection with fisheries, marine al-
lied activities and also tourism potential. So we can
expect high enhanced growth in this zone. The main
work participation rate contributed from House Hold
and Service sectors.
The multifunction zones where urban activities
including higher order educational, health care facili-
ties and transportation network copping up with the
requirements are available. This zone will act as a ser-
vice centre for the entire district. For that reason we
can expect a high enhanced growth in this region and
the tertiary workers are more concentrated in that area.
The effect of growth rate of population and oc-
Table 14.1: Zone wise impact on population growth rate and occupation structure
cupational structure in each development zone is sum-
marized in table 14.1.
14.8.1 Projection of decadal population growthrate
Decadal growth rate of population of Thrissur dis-
trict is 8.66% as per 2001 census which is less than the
average growth rate of 9.42% of the State. Trend based
population projection is explained in chapter 3 by two
methods namely decreasing rate method and appor-
tionment method. The projected total population in
2011 and 2021 is taken as average of these two values
obtained in the above two methods.
The population growth rate of 2011 and 2021 is
given in the table 14.2. From the table, it is clear that the
growth rate is 6.03% during 2001- 2011 and 4.21% during
2011- 2021. The average figure of 5% can be assumed as
the lower limit of the accelerated population growth
No Zone Impact on population growth Impact on occupational structure
1 Environmental concern zone Only natural growth Slight increase in cultivators &
agricultural labourers
2 Intensive agricultural zone Enhanced growth Increase in cultivators & agricultural
labourers
3 Economic Development Corridor
(EDC)
moderate Enhanced growth Increase in industrial & service sector
workers
4 Acceleratedgrowth zone - Industrial Highenhancedgrowth Increase in secondary workers &
industrial workers
5 Accelerated growth zone -Institutional
SlightEnhanced growth Increase in industrial & service sector
workers
6 Acceleratedgrowth zone - Marine Highenhancedgrowth Increase inHH & service sector workers
7 Multifunctional zone I Highenhancedgrowth Increase intertiary workers
8 Multifunctional zone II Highenhancedgrowth Increase intertiary workers
175
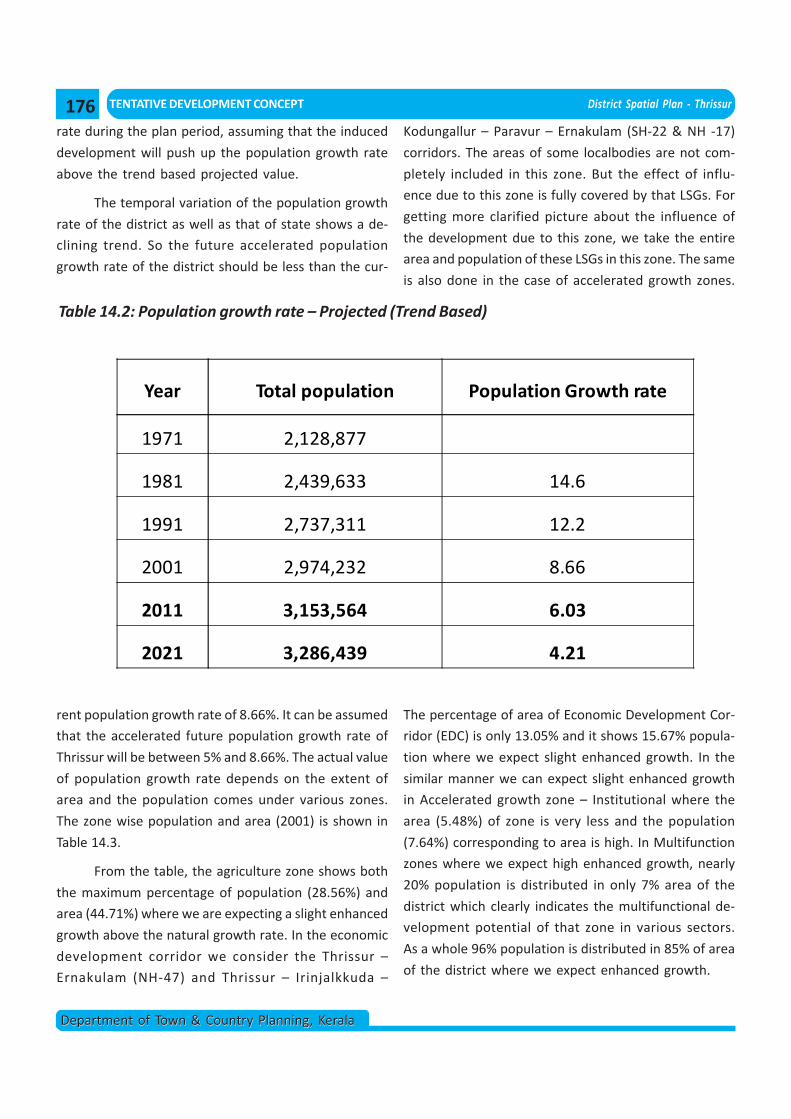
TENTATIVE DEVELOPMENT CONCEPT District Spatial Plan - Thrissur
Department of Town & Country Planning, KeralaDepartment of Town & Country Planning, Kerala
rate during the plan period, assuming that the induced
development will push up the population growth rate
above the trend based projected value.
The temporal variation of the population growth
rate of the district as well as that of state shows a de-
clining trend. So the future accelerated population
growth rate of the district should be less than the cur-
Table 14.2: Population growth rate – Projected (Trend Based)
rent population growth rate of 8.66%. It can be assumed
that the accelerated future population growth rate of
Thrissur will be between 5% and 8.66%. The actual value
of population growth rate depends on the extent of
area and the population comes under various zones.
The zone wise population and area (2001) is shown in
Table 14.3.
From the table, the agriculture zone shows both
the maximum percentage of population (28.56%) and
area (44.71%) where we are expecting a slight enhanced
growth above the natural growth rate. In the economic
development corridor we consider the Thrissur –
Ernakulam (NH-47) and Thrissur – Irinjalkkuda –
Kodungallur – Paravur – Ernakulam (SH-22 & NH -17)
corridors. The areas of some localbodies are not com-
pletely included in this zone. But the effect of influ-
ence due to this zone is fully covered by that LSGs. For
getting more clarified picture about the influence of
the development due to this zone, we take the entire
area and population of these LSGs in this zone. The same
is also done in the case of accelerated growth zones.
The percentage of area of Economic Development Cor-
ridor (EDC) is only 13.05% and it shows 15.67% popula-
tion where we expect slight enhanced growth. In the
similar manner we can expect slight enhanced growth
in Accelerated growth zone – Institutional where the
area (5.48%) of zone is very less and the population
(7.64%) corresponding to area is high. In Multifunction
zones where we expect high enhanced growth, nearly
20% population is distributed in only 7% area of the
district which clearly indicates the multifunctional de-
velopment potential of that zone in various sectors.
As a whole 96% population is distributed in 85% of area
of the district where we expect enhanced growth.
Year Total population Population Growth rate
1971 2,128,877
1981 2,439,633 14.6
1991 2,737,311 12.2
2001 2,974,232 8.66
2011 3,153,564 6.03
2021 3,286,439 4.21
176
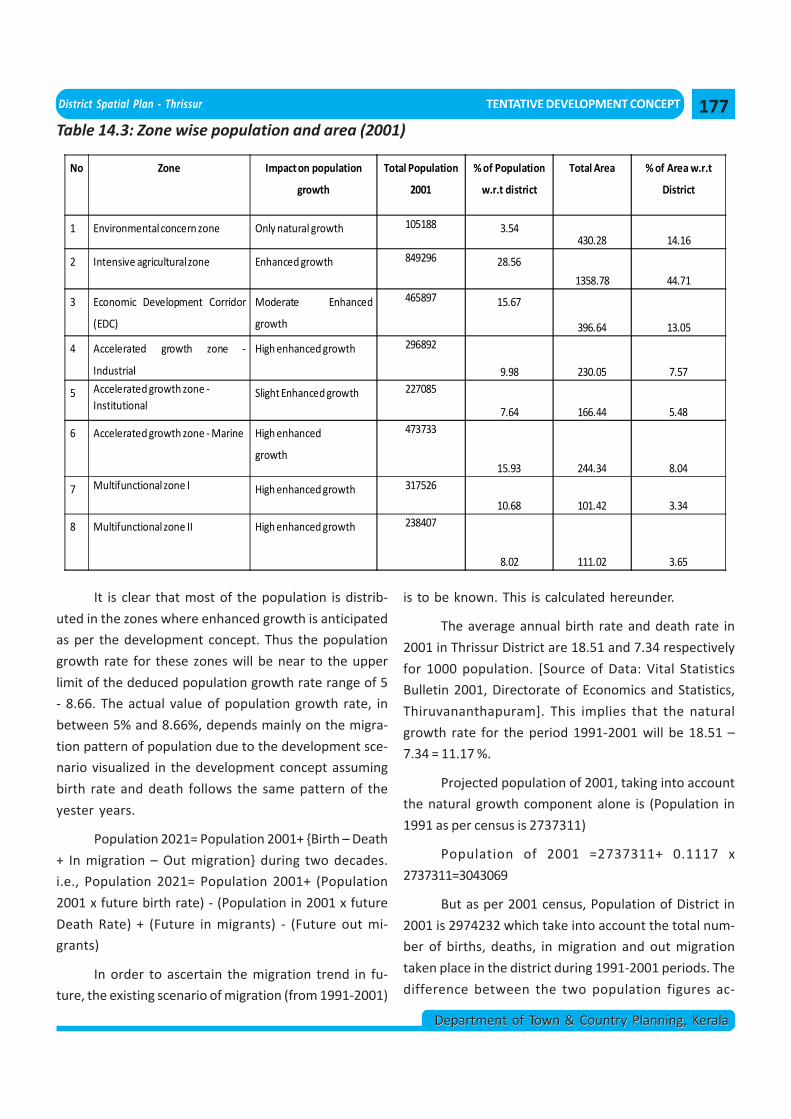
District Spatial Plan - Thrissur TENTATIVE DEVELOPMENT CONCEPT
Department of Town & Country Planning, KeralaDepartment of Town & Country Planning, Kerala
Table 14.3: Zone wise population and area (2001)
It is clear that most of the population is distrib-
uted in the zones where enhanced growth is anticipated
as per the development concept. Thus the population
growth rate for these zones will be near to the upper
limit of the deduced population growth rate range of 5
- 8.66. The actual value of population growth rate, in
between 5% and 8.66%, depends mainly on the migra-
tion pattern of population due to the development sce-
nario visualized in the development concept assuming
birth rate and death follows the same pattern of the
yester years.
Population 2021= Population 2001+ {Birth – Death
+ In migration – Out migration} during two decades.
i.e., Population 2021= Population 2001+ (Population
2001 x future birth rate) - (Population in 2001 x future
Death Rate) + (Future in migrants) - (Future out mi-
grants)
In order to ascertain the migration trend in fu-
ture, the existing scenario of migration (from 1991-2001)
is to be known. This is calculated hereunder.
The average annual birth rate and death rate in
2001 in Thrissur District are 18.51 and 7.34 respectively
for 1000 population. [Source of Data: Vital Statistics
Bulletin 2001, Directorate of Economics and Statistics,
Thiruvananthapuram]. This implies that the natural
growth rate for the period 1991-2001 will be 18.51 –
7.34 = 11.17 %.
Projected population of 2001, taking into account
the natural growth component alone is (Population in
1991 as per census is 2737311)
Population of 2001 =2737311+ 0.1117 x
2737311=3043069
But as per 2001 census, Population of District in
2001 is 2974232 which take into account the total num-
ber of births, deaths, in migration and out migration
taken place in the district during 1991-2001 periods. The
difference between the two population figures ac-
No Zone Impact on population
growth
Total Population
2001
% of Population
w.r.t district
Total Area % of Area w.r.t
District
1 Environmental concern zone Only natural growth 105188 3.54430.28 14.16
2 Intensive agriculturalzone Enhanced growth 849296 28.56
1358.78 44.71
3 Economic Development Corridor
(EDC)
Moderate Enhanced
growth
465897 15.67
396.64 13.05
4 Accelerated growth zone -
Industrial
High enhanced growth 296892
9.98 230.05 7.57
5 Accelerated growth zone -Institutional
Slight Enhanced growth 227085
7.64 166.44 5.48
6 Accelerated growth zone - Marine High enhanced
growth
473733
15.93 244.34 8.04
7 Multifunctional zone I High enhanced growth 317526
10.68 101.42 3.34
8 Multifunctional zone II High enhanced growth 238407
8.02 111.02 3.65
177
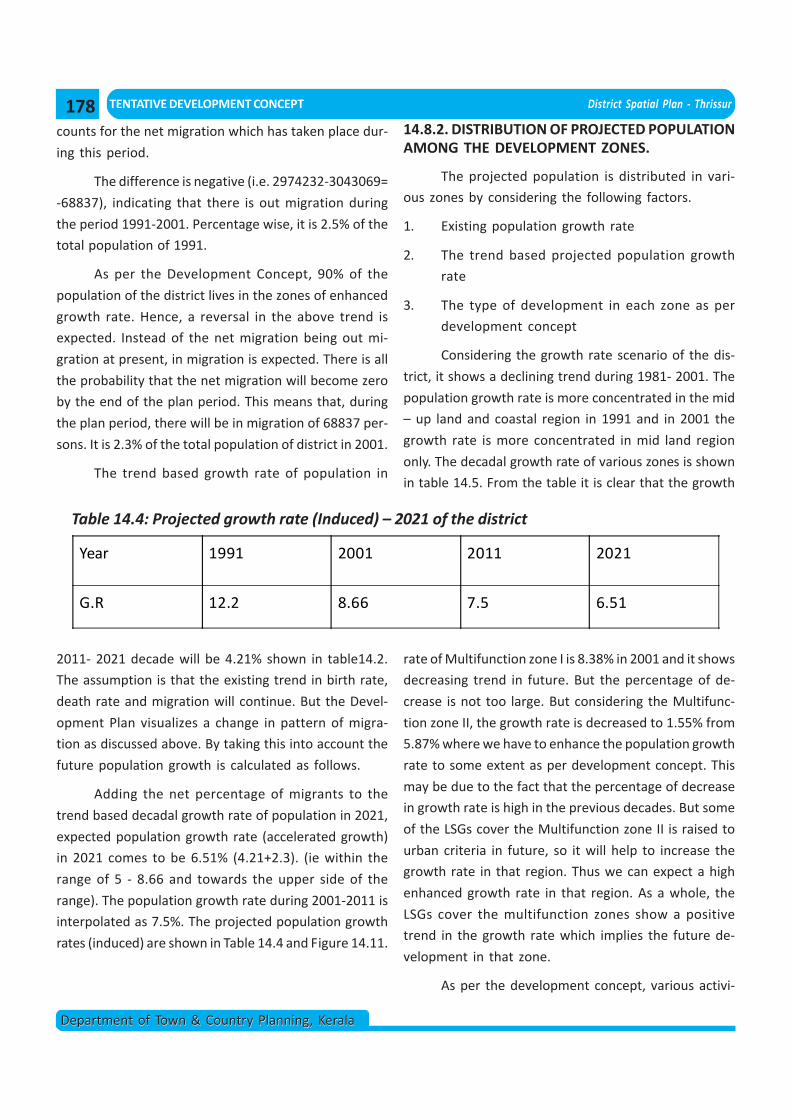
TENTATIVE DEVELOPMENT CONCEPT District Spatial Plan - Thrissur
Department of Town & Country Planning, KeralaDepartment of Town & Country Planning, Kerala
counts for the net migration which has taken place dur-
ing this period.
The difference is negative (i.e. 2974232-3043069=
-68837), indicating that there is out migration during
the period 1991-2001. Percentage wise, it is 2.5% of the
total population of 1991.
As per the Development Concept, 90% of the
population of the district lives in the zones of enhanced
growth rate. Hence, a reversal in the above trend is
expected. Instead of the net migration being out mi-
gration at present, in migration is expected. There is all
the probability that the net migration will become zero
by the end of the plan period. This means that, during
the plan period, there will be in migration of 68837 per-
sons. It is 2.3% of the total population of district in 2001.
The trend based growth rate of population in
2011- 2021 decade will be 4.21% shown in table14.2.
The assumption is that the existing trend in birth rate,
death rate and migration will continue. But the Devel-
opment Plan visualizes a change in pattern of migra-
tion as discussed above. By taking this into account the
future population growth is calculated as follows.
Adding the net percentage of migrants to the
trend based decadal growth rate of population in 2021,
expected population growth rate (accelerated growth)
in 2021 comes to be 6.51% (4.21+2.3). (ie within the
range of 5 - 8.66 and towards the upper side of the
range). The population growth rate during 2001-2011 is
interpolated as 7.5%. The projected population growth
rates (induced) are shown in Table 14.4 and Figure 14.11.
14.8.2. DISTRIBUTION OF PROJECTED POPULATIONAMONG THE DEVELOPMENT ZONES.
The projected population is distributed in vari-
ous zones by considering the following factors.
1. Existing population growth rate
2. The trend based projected population growth
rate
3. The type of development in each zone as per
development concept
Considering the growth rate scenario of the dis-
trict, it shows a declining trend during 1981- 2001. The
population growth rate is more concentrated in the mid
– up land and coastal region in 1991 and in 2001 the
growth rate is more concentrated in mid land region
only. The decadal growth rate of various zones is shown
in table 14.5. From the table it is clear that the growth
Table 14.4: Projected growth rate (Induced) – 2021 of the district
rate of Multifunction zone I is 8.38% in 2001 and it shows
decreasing trend in future. But the percentage of de-
crease is not too large. But considering the Multifunc-
tion zone II, the growth rate is decreased to 1.55% from
5.87% where we have to enhance the population growth
rate to some extent as per development concept. This
may be due to the fact that the percentage of decrease
in growth rate is high in the previous decades. But some
of the LSGs cover the Multifunction zone II is raised to
urban criteria in future, so it will help to increase the
growth rate in that region. Thus we can expect a high
enhanced growth rate in that region. As a whole, the
LSGs cover the multifunction zones show a positive
trend in the growth rate which implies the future de-
velopment in that zone.
As per the development concept, various activi-
Year 1991 2001 2011 2021
G.R 12.2 8.66 7.5 6.51
178
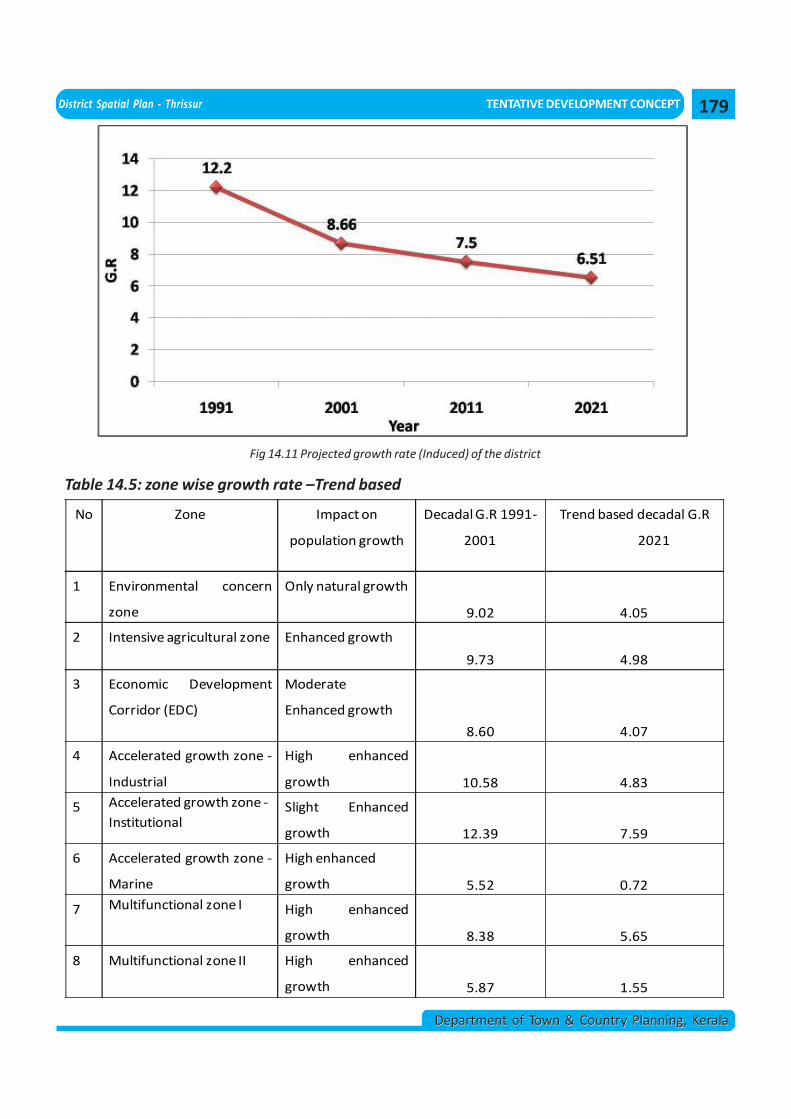
District Spatial Plan - Thrissur TENTATIVE DEVELOPMENT CONCEPT
Department of Town & Country Planning, KeralaDepartment of Town & Country Planning, Kerala
Fig 14.11 Projected growth rate (Induced) of the district
Table 14.5: zone wise growth rate –Trend based
No Zone Impact on
population growth
Decadal G.R 1991-
2001
Trend based decadal G.R
2021
1 Environmental concern
zone
Only natural growth
9.02 4.05
2 Intensive agricultural zone Enhanced growth
9.73 4.98
3 Economic Development
Corridor (EDC)
Moderate
Enhanced growth
8.60 4.07
4 Accelerated growth zone -
Industrial
High enhanced
growth 10.58 4.83
5 Accelerated growth zone -Institutional
Slight Enhanced
growth 12.39 7.59
6 Accelerated growth zone -
Marine
High enhanced
growth 5.52 0.72
7 Multifunctional zone I High enhanced
growth 8.38 5.65
8 Multifunctional zone II High enhanced
growth 5.87 1.55
179
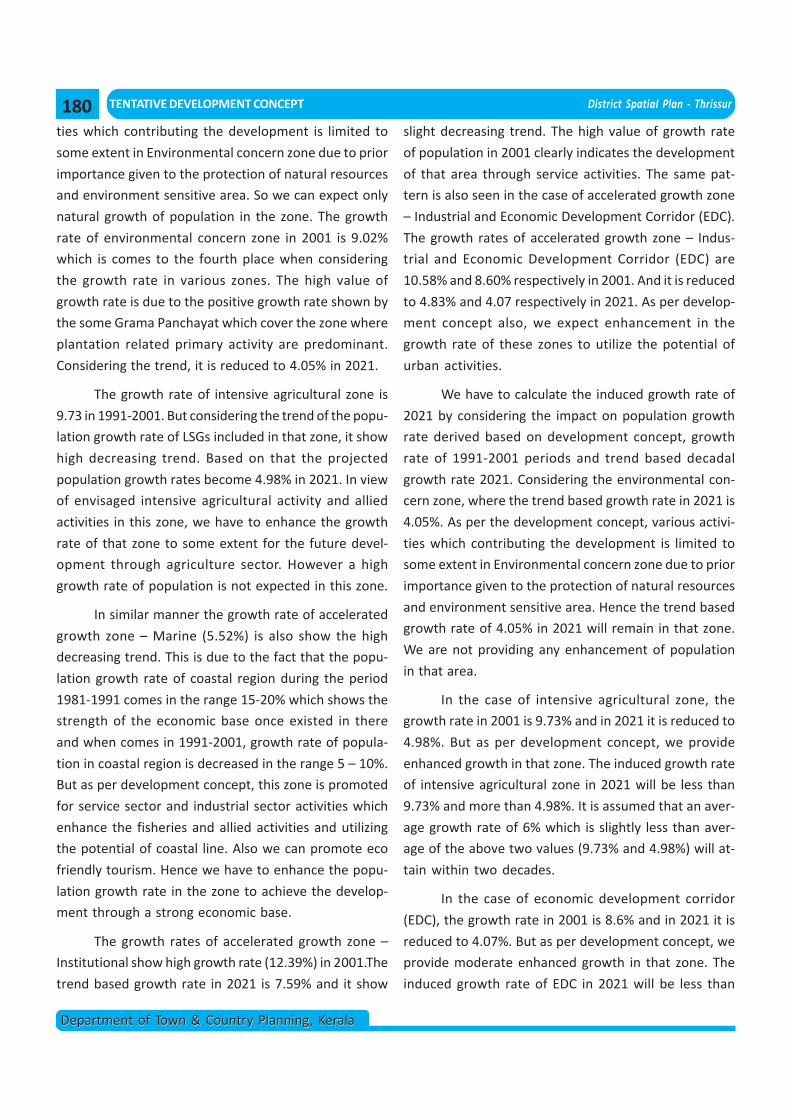
TENTATIVE DEVELOPMENT CONCEPT District Spatial Plan - Thrissur
Department of Town & Country Planning, KeralaDepartment of Town & Country Planning, Kerala
ties which contributing the development is limited to
some extent in Environmental concern zone due to prior
importance given to the protection of natural resources
and environment sensitive area. So we can expect only
natural growth of population in the zone. The growth
rate of environmental concern zone in 2001 is 9.02%
which is comes to the fourth place when considering
the growth rate in various zones. The high value of
growth rate is due to the positive growth rate shown by
the some Grama Panchayat which cover the zone where
plantation related primary activity are predominant.
Considering the trend, it is reduced to 4.05% in 2021.
The growth rate of intensive agricultural zone is
9.73 in 1991-2001. But considering the trend of the popu-
lation growth rate of LSGs included in that zone, it show
high decreasing trend. Based on that the projected
population growth rates become 4.98% in 2021. In view
of envisaged intensive agricultural activity and allied
activities in this zone, we have to enhance the growth
rate of that zone to some extent for the future devel-
opment through agriculture sector. However a high
growth rate of population is not expected in this zone.
In similar manner the growth rate of accelerated
growth zone – Marine (5.52%) is also show the high
decreasing trend. This is due to the fact that the popu-
lation growth rate of coastal region during the period
1981-1991 comes in the range 15-20% which shows the
strength of the economic base once existed in there
and when comes in 1991-2001, growth rate of popula-
tion in coastal region is decreased in the range 5 – 10%.
But as per development concept, this zone is promoted
for service sector and industrial sector activities which
enhance the fisheries and allied activities and utilizing
the potential of coastal line. Also we can promote eco
friendly tourism. Hence we have to enhance the popu-
lation growth rate in the zone to achieve the develop-
ment through a strong economic base.
The growth rates of accelerated growth zone –
Institutional show high growth rate (12.39%) in 2001.The
trend based growth rate in 2021 is 7.59% and it show
slight decreasing trend. The high value of growth rate
of population in 2001 clearly indicates the development
of that area through service activities. The same pat-
tern is also seen in the case of accelerated growth zone
– Industrial and Economic Development Corridor (EDC).
The growth rates of accelerated growth zone – Indus-
trial and Economic Development Corridor (EDC) are
10.58% and 8.60% respectively in 2001. And it is reduced
to 4.83% and 4.07 respectively in 2021. As per develop-
ment concept also, we expect enhancement in the
growth rate of these zones to utilize the potential of
urban activities.
We have to calculate the induced growth rate of
2021 by considering the impact on population growth
rate derived based on development concept, growth
rate of 1991-2001 periods and trend based decadal
growth rate 2021. Considering the environmental con-
cern zone, where the trend based growth rate in 2021 is
4.05%. As per the development concept, various activi-
ties which contributing the development is limited to
some extent in Environmental concern zone due to prior
importance given to the protection of natural resources
and environment sensitive area. Hence the trend based
growth rate of 4.05% in 2021 will remain in that zone.
We are not providing any enhancement of population
in that area.
In the case of intensive agricultural zone, the
growth rate in 2001 is 9.73% and in 2021 it is reduced to
4.98%. But as per development concept, we provide
enhanced growth in that zone. The induced growth rate
of intensive agricultural zone in 2021 will be less than
9.73% and more than 4.98%. It is assumed that an aver-
age growth rate of 6% which is slightly less than aver-
age of the above two values (9.73% and 4.98%) will at-
tain within two decades.
In the case of economic development corridor
(EDC), the growth rate in 2001 is 8.6% and in 2021 it is
reduced to 4.07%. But as per development concept, we
provide moderate enhanced growth in that zone. The
induced growth rate of EDC in 2021 will be less than
180
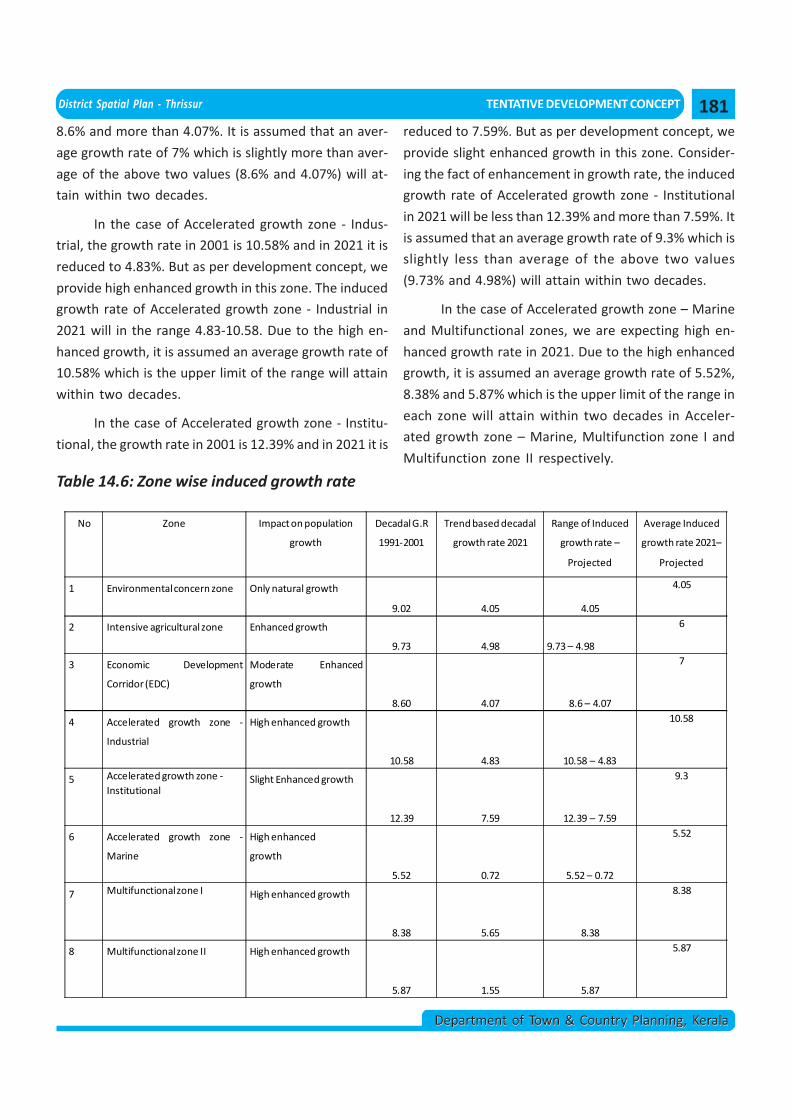
District Spatial Plan - Thrissur TENTATIVE DEVELOPMENT CONCEPT
Department of Town & Country Planning, KeralaDepartment of Town & Country Planning, Kerala
8.6% and more than 4.07%. It is assumed that an aver-
age growth rate of 7% which is slightly more than aver-
age of the above two values (8.6% and 4.07%) will at-
tain within two decades.
In the case of Accelerated growth zone - Indus-
trial, the growth rate in 2001 is 10.58% and in 2021 it is
reduced to 4.83%. But as per development concept, we
provide high enhanced growth in this zone. The induced
growth rate of Accelerated growth zone - Industrial in
2021 will in the range 4.83-10.58. Due to the high en-
hanced growth, it is assumed an average growth rate of
10.58% which is the upper limit of the range will attain
within two decades.
In the case of Accelerated growth zone - Institu-
tional, the growth rate in 2001 is 12.39% and in 2021 it is
reduced to 7.59%. But as per development concept, we
provide slight enhanced growth in this zone. Consider-
ing the fact of enhancement in growth rate, the induced
growth rate of Accelerated growth zone - Institutional
in 2021 will be less than 12.39% and more than 7.59%. It
is assumed that an average growth rate of 9.3% which is
slightly less than average of the above two values
(9.73% and 4.98%) will attain within two decades.
In the case of Accelerated growth zone – Marine
and Multifunctional zones, we are expecting high en-
hanced growth rate in 2021. Due to the high enhanced
growth, it is assumed an average growth rate of 5.52%,
8.38% and 5.87% which is the upper limit of the range in
each zone will attain within two decades in Acceler-
ated growth zone – Marine, Multifunction zone I and
Multifunction zone II respectively.
Table 14.6: Zone wise induced growth rate
No Zone Impact on population
growth
Decadal G.R
1991-2001
Trend based decadal
growth rate 2021
Range of Induced
growth rate –
Projected
Average Induced
growth rate 2021–
Projected
1 Environmentalconcern zone Only natural growth
9.02 4.05 4.05
4.05
2 Intensive agricultural zone Enhanced growth
9.73 4.98 9.73 – 4.98
6
3 Economic Development
Corridor (EDC)
Moderate Enhanced
growth
8.60 4.07 8.6 – 4.07
7
4 Accelerated growth zone -
Industrial
High enhanced growth
10.58 4.83 10.58 – 4.83
10.58
5 Accelerated growth zone -Institutional
Slight Enhanced growth
12.39 7.59 12.39 – 7.59
9.3
6 Accelerated growth zone -
Marine
High enhanced
growth
5.52 0.72 5.52 – 0.72
5.52
7 Multifunctional zone I High enhanced growth
8.38 5.65 8.38
8.38
8 Multifunctionalzone II High enhanced growth
5.87 1.55 5.87
5.87
181
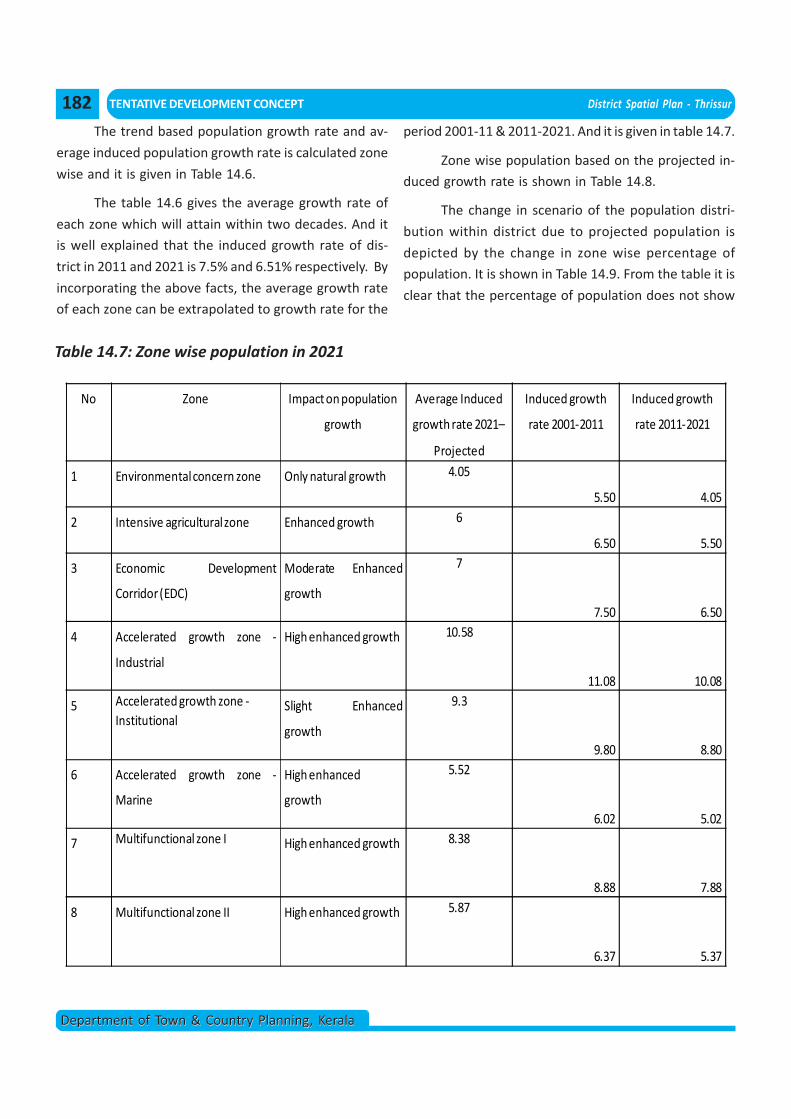
TENTATIVE DEVELOPMENT CONCEPT District Spatial Plan - Thrissur
Department of Town & Country Planning, KeralaDepartment of Town & Country Planning, Kerala
The trend based population growth rate and av-
erage induced population growth rate is calculated zone
wise and it is given in Table 14.6.
The table 14.6 gives the average growth rate of
each zone which will attain within two decades. And it
is well explained that the induced growth rate of dis-
trict in 2011 and 2021 is 7.5% and 6.51% respectively. By
incorporating the above facts, the average growth rate
of each zone can be extrapolated to growth rate for the
period 2001-11 & 2011-2021. And it is given in table 14.7.
Zone wise population based on the projected in-
duced growth rate is shown in Table 14.8.
The change in scenario of the population distri-
bution within district due to projected population is
depicted by the change in zone wise percentage of
population. It is shown in Table 14.9. From the table it is
clear that the percentage of population does not show
Table 14.7: Zone wise population in 2021
No Zone Impact on population
growth
Average Induced
growth rate 2021–
Projected
Induced growth
rate 2001-2011
Induced growth
rate 2011-2021
1 Environmentalconcern zone Only natural growth 4.05
5.50 4.05
2 Intensive agriculturalzone Enhanced growth 6
6.50 5.50
3 Economic Development
Corridor(EDC)
Moderate Enhanced
growth
7
7.50 6.50
4 Accelerated growth zone -
Industrial
High enhanced growth 10.58
11.08 10.08
5 Accelerated growth zone -Institutional
Slight Enhanced
growth
9.3
9.80 8.80
6 Accelerated growth zone -
Marine
High enhanced
growth
5.52
6.02 5.02
7 Multifunctional zone I High enhanced growth 8.38
8.88 7.88
8 Multifunctional zone II High enhanced growth 5.87
6.37 5.37
182
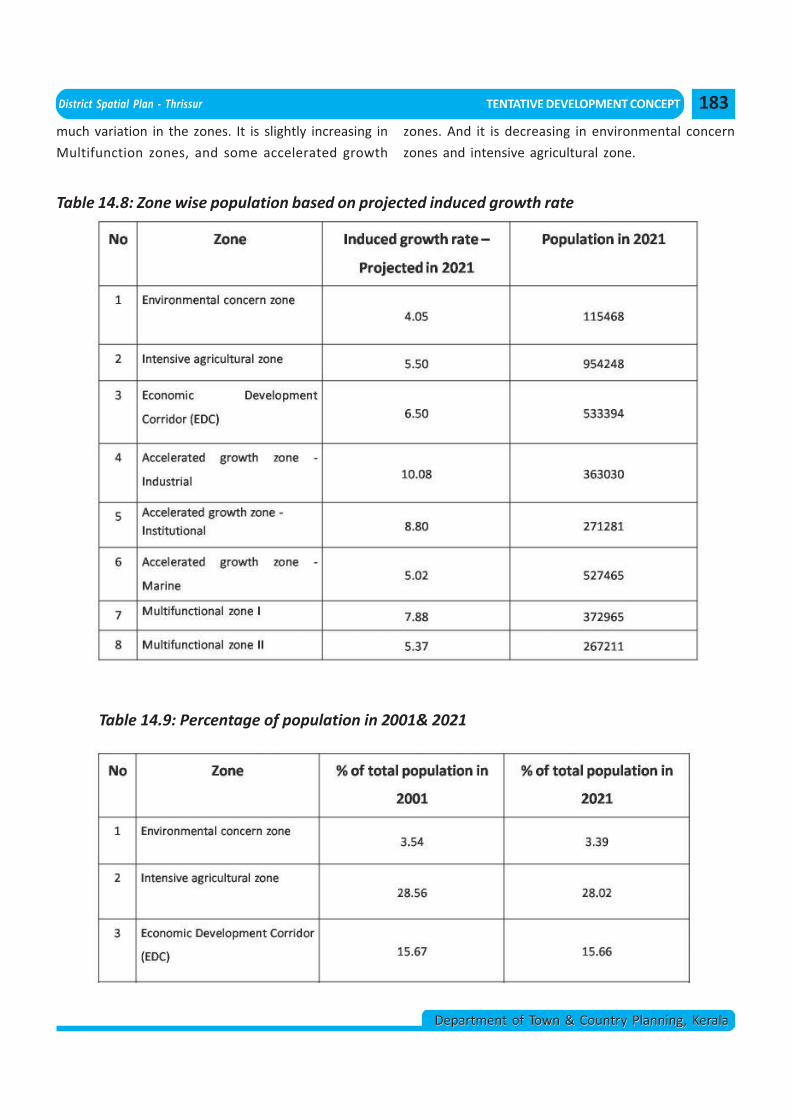
District Spatial Plan - Thrissur TENTATIVE DEVELOPMENT CONCEPT
Department of Town & Country Planning, KeralaDepartment of Town & Country Planning, Kerala
Table 14.8: Zone wise population based on projected induced growth rate
Table 14.9: Percentage of population in 2001& 2021
much variation in the zones. It is slightly increasing in
Multifunction zones, and some accelerated growth
zones. And it is decreasing in environmental concern
zones and intensive agricultural zone.
183
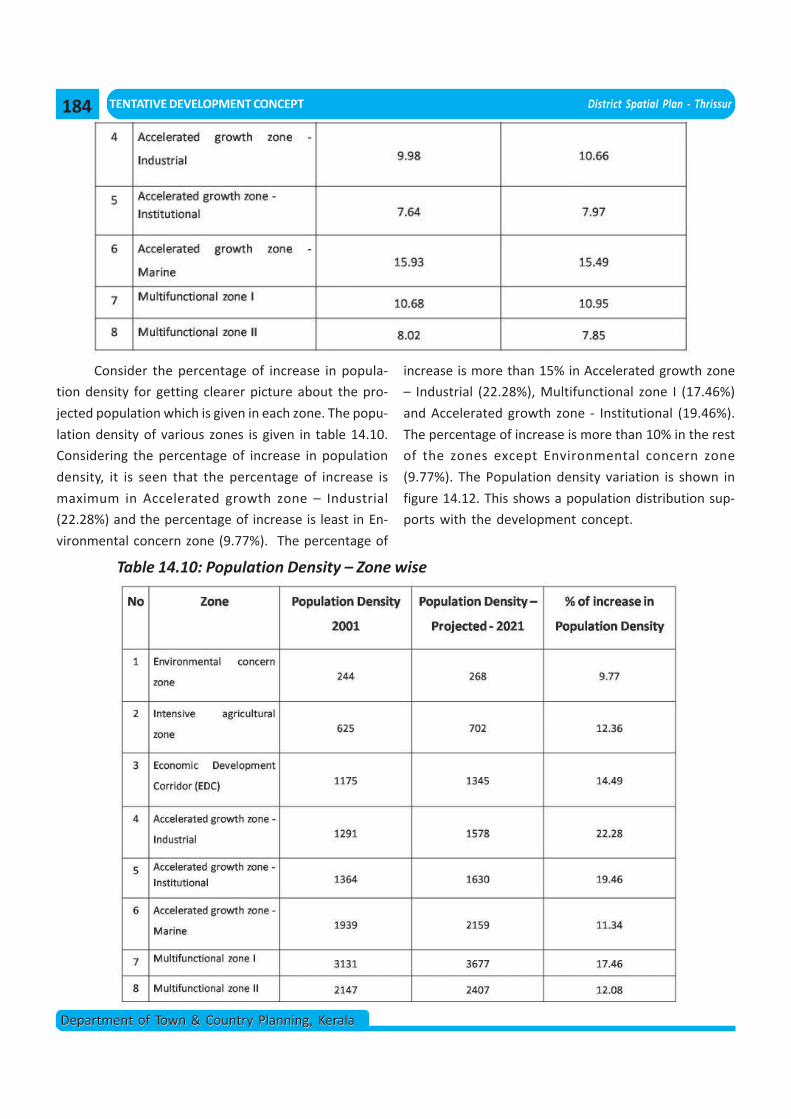
TENTATIVE DEVELOPMENT CONCEPT District Spatial Plan - Thrissur
Department of Town & Country Planning, KeralaDepartment of Town & Country Planning, Kerala
Consider the percentage of increase in popula-
tion density for getting clearer picture about the pro-
jected population which is given in each zone. The popu-
lation density of various zones is given in table 14.10.
Considering the percentage of increase in population
density, it is seen that the percentage of increase is
maximum in Accelerated growth zone – Industrial
(22.28%) and the percentage of increase is least in En-
vironmental concern zone (9.77%). The percentage of
increase is more than 15% in Accelerated growth zone
– Industrial (22.28%), Multifunctional zone I (17.46%)
and Accelerated growth zone - Institutional (19.46%).
The percentage of increase is more than 10% in the rest
of the zones except Environmental concern zone
(9.77%). The Population density variation is shown in
figure 14.12. This shows a population distribution sup-
ports with the development concept.
Table 14.10: Population Density – Zone wise
184
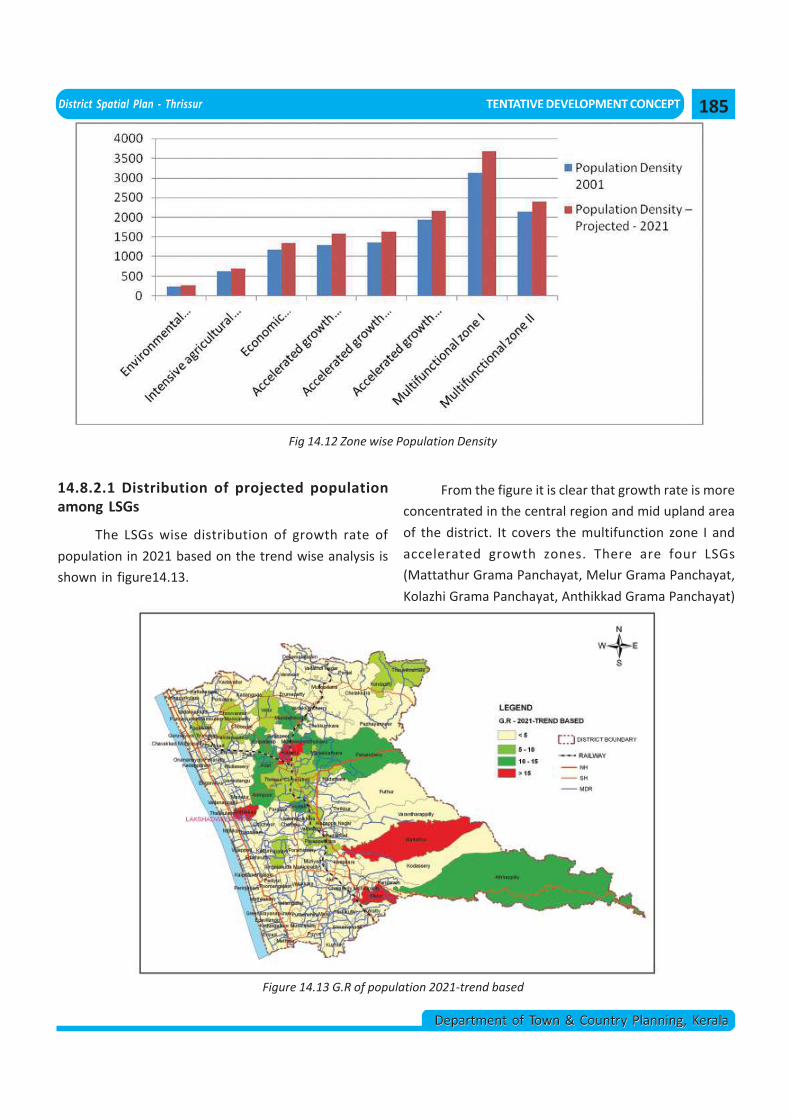
District Spatial Plan - Thrissur TENTATIVE DEVELOPMENT CONCEPT
Department of Town & Country Planning, KeralaDepartment of Town & Country Planning, Kerala
Fig 14.12 Zone wise Population Density
14.8.2.1 Distribution of projected populationamong LSGs
The LSGs wise distribution of growth rate of
population in 2021 based on the trend wise analysis is
shown in figure14.13.
Figure 14.13 G.R of population 2021-trend based
From the figure it is clear that growth rate is more
concentrated in the central region and mid upland area
of the district. It covers the multifunction zone I and
accelerated growth zones. There are four LSGs
(Mattathur Grama Panchayat, Melur Grama Panchayat,
Kolazhi Grama Panchayat, Anthikkad Grama Panchayat)
185
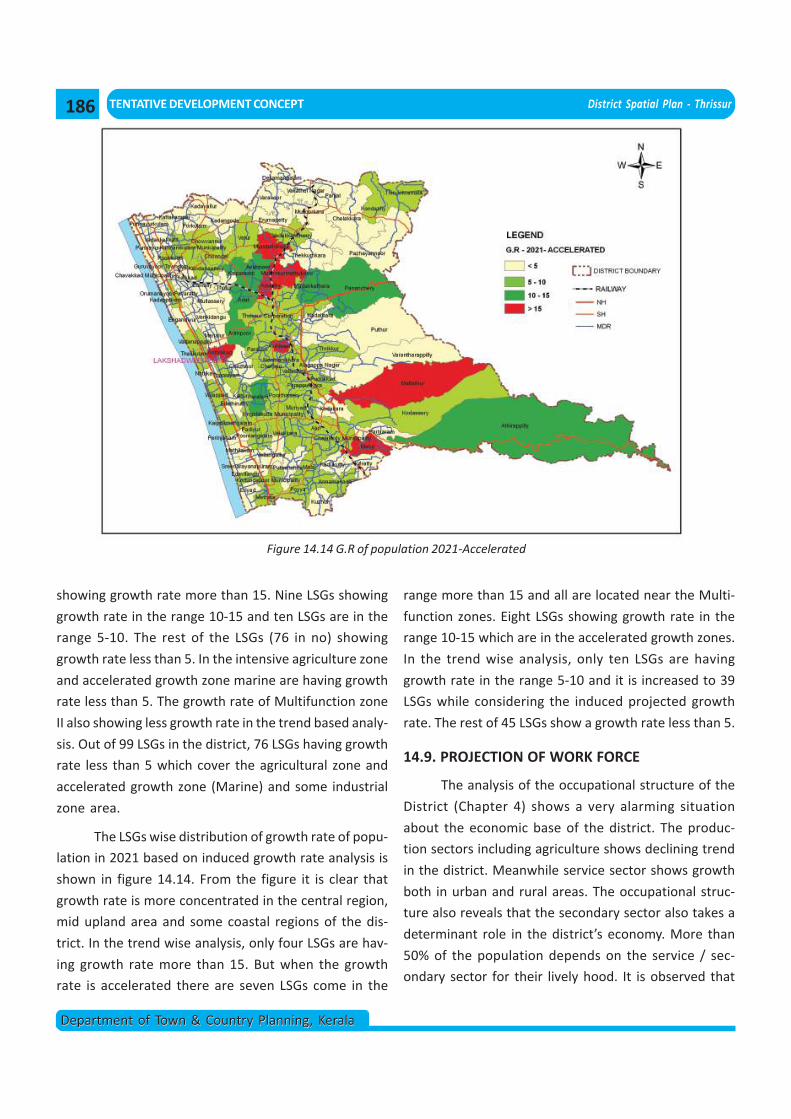
TENTATIVE DEVELOPMENT CONCEPT District Spatial Plan - Thrissur
Department of Town & Country Planning, KeralaDepartment of Town & Country Planning, Kerala
showing growth rate more than 15. Nine LSGs showing
growth rate in the range 10-15 and ten LSGs are in the
range 5-10. The rest of the LSGs (76 in no) showing
growth rate less than 5. In the intensive agriculture zone
and accelerated growth zone marine are having growth
rate less than 5. The growth rate of Multifunction zone
II also showing less growth rate in the trend based analy-
sis. Out of 99 LSGs in the district, 76 LSGs having growth
rate less than 5 which cover the agricultural zone and
accelerated growth zone (Marine) and some industrial
zone area.
The LSGs wise distribution of growth rate of popu-
lation in 2021 based on induced growth rate analysis is
shown in figure 14.14. From the figure it is clear that
growth rate is more concentrated in the central region,
mid upland area and some coastal regions of the dis-
trict. In the trend wise analysis, only four LSGs are hav-
ing growth rate more than 15. But when the growth
rate is accelerated there are seven LSGs come in the
range more than 15 and all are located near the Multi-
function zones. Eight LSGs showing growth rate in the
range 10-15 which are in the accelerated growth zones.
In the trend wise analysis, only ten LSGs are having
growth rate in the range 5-10 and it is increased to 39
LSGs while considering the induced projected growth
rate. The rest of 45 LSGs show a growth rate less than 5.
14.9. PROJECTION OF WORK FORCE
The analysis of the occupational structure of the
District (Chapter 4) shows a very alarming situation
about the economic base of the district. The produc-
tion sectors including agriculture shows declining trend
in the district. Meanwhile service sector shows growth
both in urban and rural areas. The occupational struc-
ture also reveals that the secondary sector also takes a
determinant role in the district’s economy. More than
50% of the population depends on the service / sec-
ondary sector for their lively hood. It is observed that
Figure 14.14 G.R of population 2021-Accelerated
186
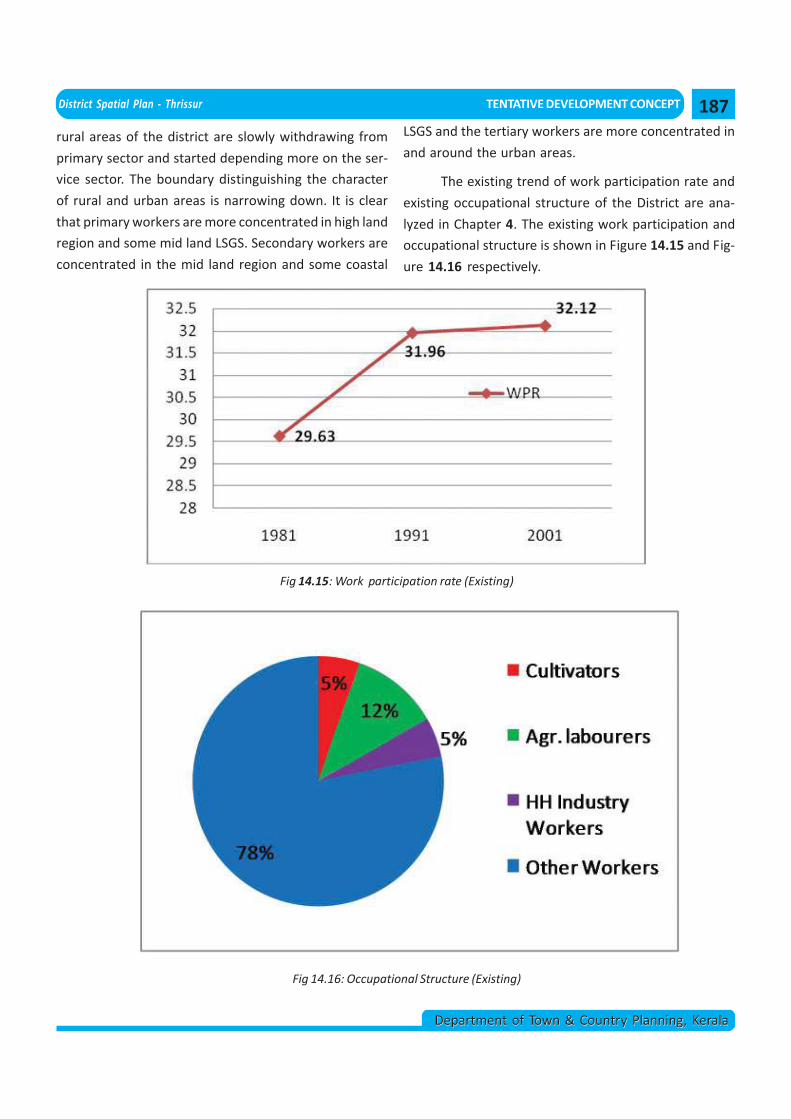
District Spatial Plan - Thrissur TENTATIVE DEVELOPMENT CONCEPT
Department of Town & Country Planning, KeralaDepartment of Town & Country Planning, Kerala
rural areas of the district are slowly withdrawing from
primary sector and started depending more on the ser-
vice sector. The boundary distinguishing the character
of rural and urban areas is narrowing down. It is clear
that primary workers are more concentrated in high land
region and some mid land LSGS. Secondary workers are
concentrated in the mid land region and some coastal
LSGS and the tertiary workers are more concentrated in
and around the urban areas.
The existing trend of work participation rate and
existing occupational structure of the District are ana-
lyzed in Chapter 4. The existing work participation and
occupational structure is shown in Figure 14.15 and Fig-
ure 14.16 respectively.
Fig 14.15: Work participation rate (Existing)
Fig 14.16: Occupational Structure (Existing)
187
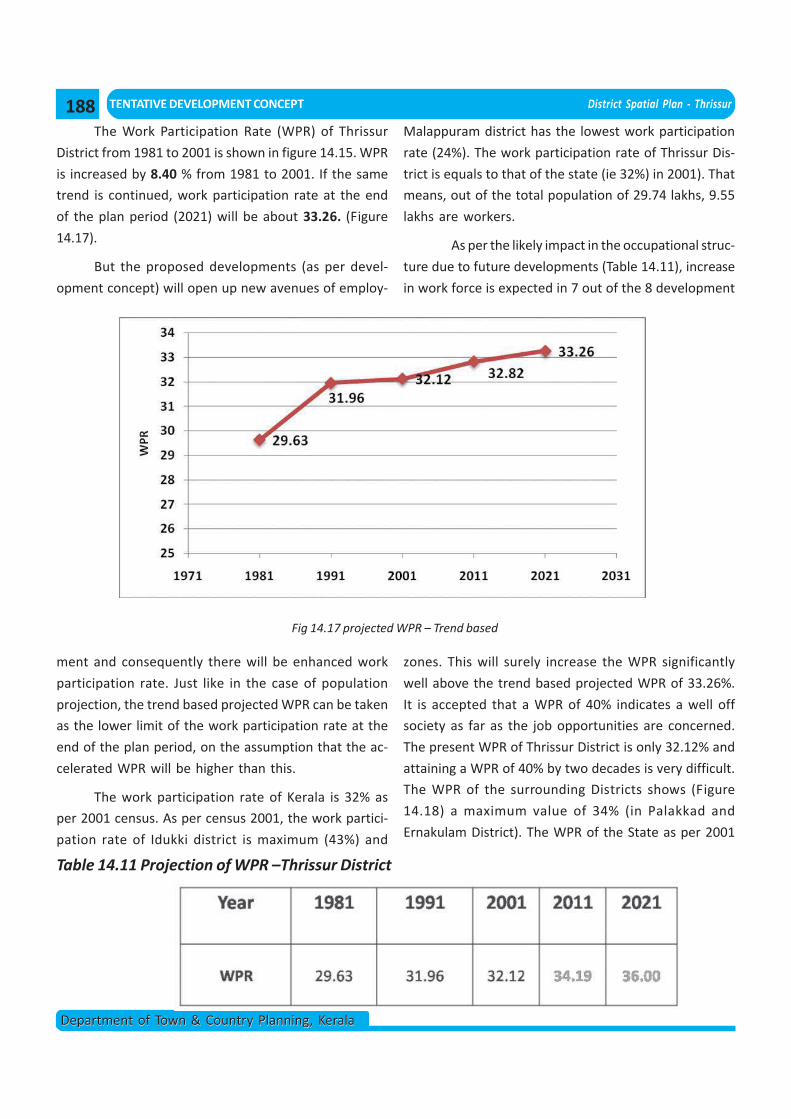
TENTATIVE DEVELOPMENT CONCEPT District Spatial Plan - Thrissur
Department of Town & Country Planning, KeralaDepartment of Town & Country Planning, Kerala
The Work Participation Rate (WPR) of Thrissur
District from 1981 to 2001 is shown in figure 14.15. WPR
is increased by 8.40 % from 1981 to 2001. If the same
trend is continued, work participation rate at the end
of the plan period (2021) will be about 33.26. (Figure
14.17).
But the proposed developments (as per devel-
opment concept) will open up new avenues of employ-
ment and consequently there will be enhanced work
participation rate. Just like in the case of population
projection, the trend based projected WPR can be taken
as the lower limit of the work participation rate at the
end of the plan period, on the assumption that the ac-
celerated WPR will be higher than this.
The work participation rate of Kerala is 32% as
per 2001 census. As per census 2001, the work partici-
pation rate of Idukki district is maximum (43%) and
Malappuram district has the lowest work participation
rate (24%). The work participation rate of Thrissur Dis-
trict is equals to that of the state (ie 32%) in 2001). That
means, out of the total population of 29.74 lakhs, 9.55
lakhs are workers.
As per the likely impact in the occupational struc-
ture due to future developments (Table 14.11), increase
in work force is expected in 7 out of the 8 development
zones. This will surely increase the WPR significantly
well above the trend based projected WPR of 33.26%.
It is accepted that a WPR of 40% indicates a well off
society as far as the job opportunities are concerned.
The present WPR of Thrissur District is only 32.12% and
attaining a WPR of 40% by two decades is very difficult.
The WPR of the surrounding Districts shows (Figure
14.18) a maximum value of 34% (in Palakkad and
Ernakulam District). The WPR of the State as per 2001
Fig 14.17 projected WPR – Trend based
Table 14.11 Projection of WPR –Thrissur District
188
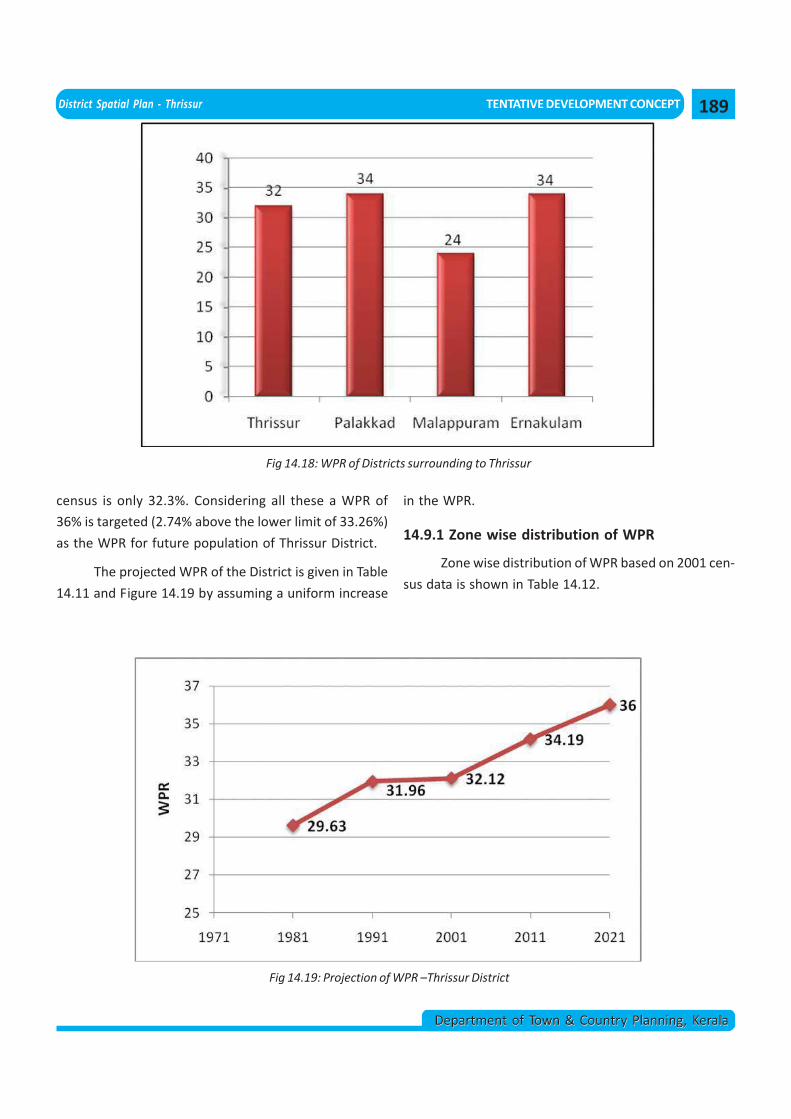
District Spatial Plan - Thrissur TENTATIVE DEVELOPMENT CONCEPT
Department of Town & Country Planning, KeralaDepartment of Town & Country Planning, Kerala
Fig 14.18: WPR of Districts surrounding to Thrissur
census is only 32.3%. Considering all these a WPR of
36% is targeted (2.74% above the lower limit of 33.26%)
as the WPR for future population of Thrissur District.
The projected WPR of the District is given in Table
14.11 and Figure 14.19 by assuming a uniform increase
in the WPR.
14.9.1 Zone wise distribution of WPR
Zone wise distribution of WPR based on 2001 cen-
sus data is shown in Table 14.12.
Fig 14.19: Projection of WPR –Thrissur District
189
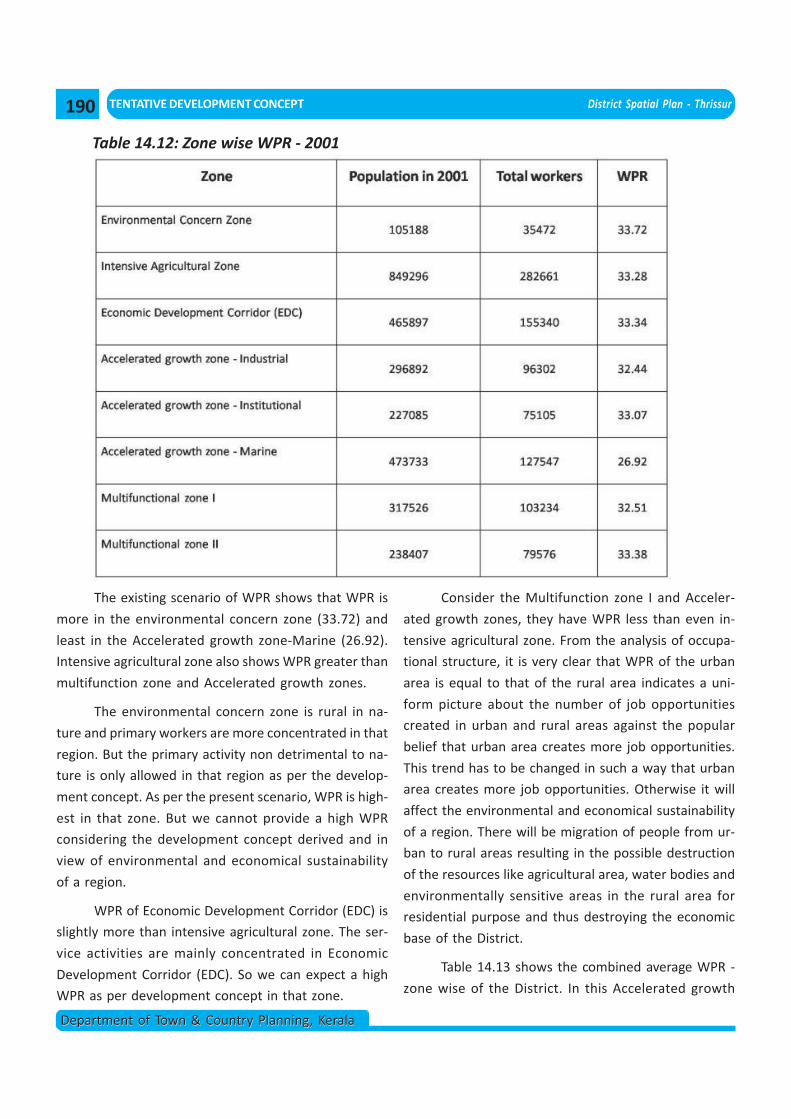
TENTATIVE DEVELOPMENT CONCEPT District Spatial Plan - Thrissur
Department of Town & Country Planning, KeralaDepartment of Town & Country Planning, Kerala
Table 14.12: Zone wise WPR - 2001
The existing scenario of WPR shows that WPR is
more in the environmental concern zone (33.72) and
least in the Accelerated growth zone-Marine (26.92).
Intensive agricultural zone also shows WPR greater than
multifunction zone and Accelerated growth zones.
The environmental concern zone is rural in na-
ture and primary workers are more concentrated in that
region. But the primary activity non detrimental to na-
ture is only allowed in that region as per the develop-
ment concept. As per the present scenario, WPR is high-
est in that zone. But we cannot provide a high WPR
considering the development concept derived and in
view of environmental and economical sustainability
of a region.
WPR of Economic Development Corridor (EDC) is
slightly more than intensive agricultural zone. The ser-
vice activities are mainly concentrated in Economic
Development Corridor (EDC). So we can expect a high
WPR as per development concept in that zone.
Consider the Multifunction zone I and Acceler-
ated growth zones, they have WPR less than even in-
tensive agricultural zone. From the analysis of occupa-
tional structure, it is very clear that WPR of the urban
area is equal to that of the rural area indicates a uni-
form picture about the number of job opportunities
created in urban and rural areas against the popular
belief that urban area creates more job opportunities.
This trend has to be changed in such a way that urban
area creates more job opportunities. Otherwise it will
affect the environmental and economical sustainability
of a region. There will be migration of people from ur-
ban to rural areas resulting in the possible destruction
of the resources like agricultural area, water bodies and
environmentally sensitive areas in the rural area for
residential purpose and thus destroying the economic
base of the District.
Table 14.13 shows the combined average WPR -
zone wise of the District. In this Accelerated growth
190
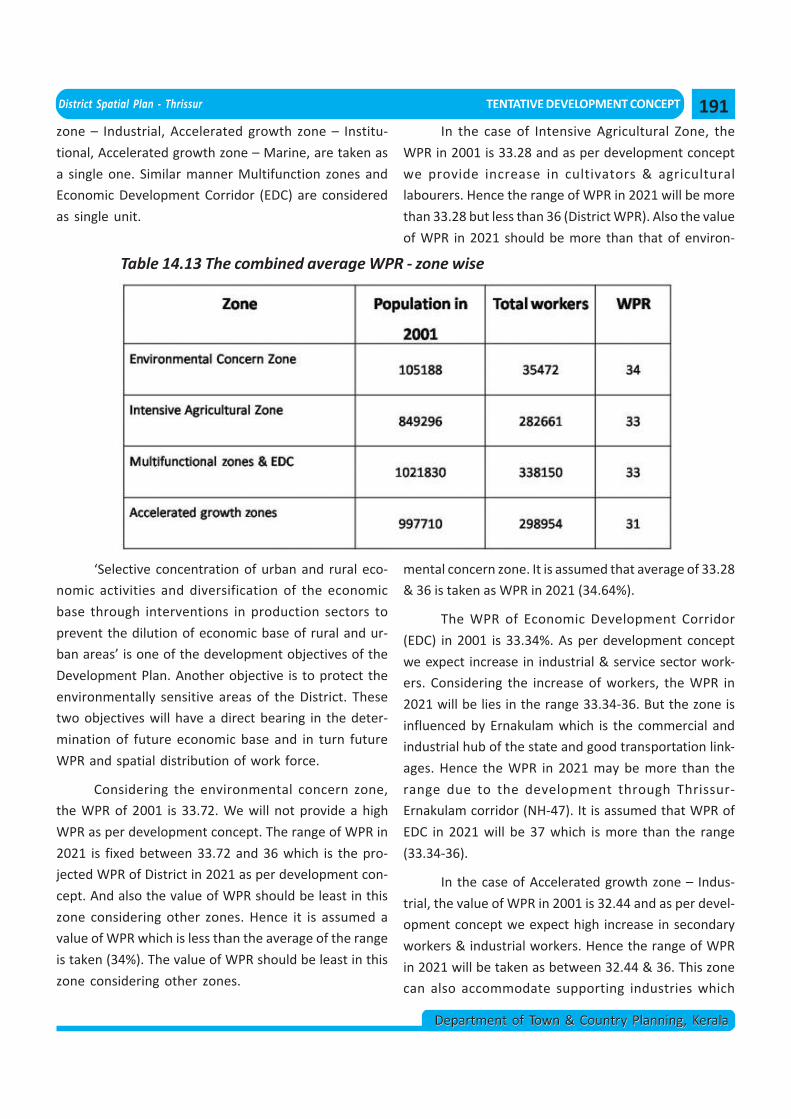
District Spatial Plan - Thrissur TENTATIVE DEVELOPMENT CONCEPT
Department of Town & Country Planning, KeralaDepartment of Town & Country Planning, Kerala
zone – Industrial, Accelerated growth zone – Institu-
tional, Accelerated growth zone – Marine, are taken as
a single one. Similar manner Multifunction zones and
Economic Development Corridor (EDC) are considered
as single unit.
Table 14.13 The combined average WPR - zone wise
‘Selective concentration of urban and rural eco-
nomic activities and diversification of the economic
base through interventions in production sectors to
prevent the dilution of economic base of rural and ur-
ban areas’ is one of the development objectives of the
Development Plan. Another objective is to protect the
environmentally sensitive areas of the District. These
two objectives will have a direct bearing in the deter-
mination of future economic base and in turn future
WPR and spatial distribution of work force.
Considering the environmental concern zone,
the WPR of 2001 is 33.72. We will not provide a high
WPR as per development concept. The range of WPR in
2021 is fixed between 33.72 and 36 which is the pro-
jected WPR of District in 2021 as per development con-
cept. And also the value of WPR should be least in this
zone considering other zones. Hence it is assumed a
value of WPR which is less than the average of the range
is taken (34%). The value of WPR should be least in this
zone considering other zones.
In the case of Intensive Agricultural Zone, the
WPR in 2001 is 33.28 and as per development concept
we provide increase in cultivators & agricultural
labourers. Hence the range of WPR in 2021 will be more
than 33.28 but less than 36 (District WPR). Also the value
of WPR in 2021 should be more than that of environ-
mental concern zone. It is assumed that average of 33.28
& 36 is taken as WPR in 2021 (34.64%).
The WPR of Economic Development Corridor
(EDC) in 2001 is 33.34%. As per development concept
we expect increase in industrial & service sector work-
ers. Considering the increase of workers, the WPR in
2021 will be lies in the range 33.34-36. But the zone is
influenced by Ernakulam which is the commercial and
industrial hub of the state and good transportation link-
ages. Hence the WPR in 2021 may be more than the
range due to the development through Thrissur-
Ernakulam corridor (NH-47). It is assumed that WPR of
EDC in 2021 will be 37 which is more than the range
(33.34-36).
In the case of Accelerated growth zone – Indus-
trial, the value of WPR in 2001 is 32.44 and as per devel-
opment concept we expect high increase in secondary
workers & industrial workers. Hence the range of WPR
in 2021 will be taken as between 32.44 & 36. This zone
can also accommodate supporting industries which
191
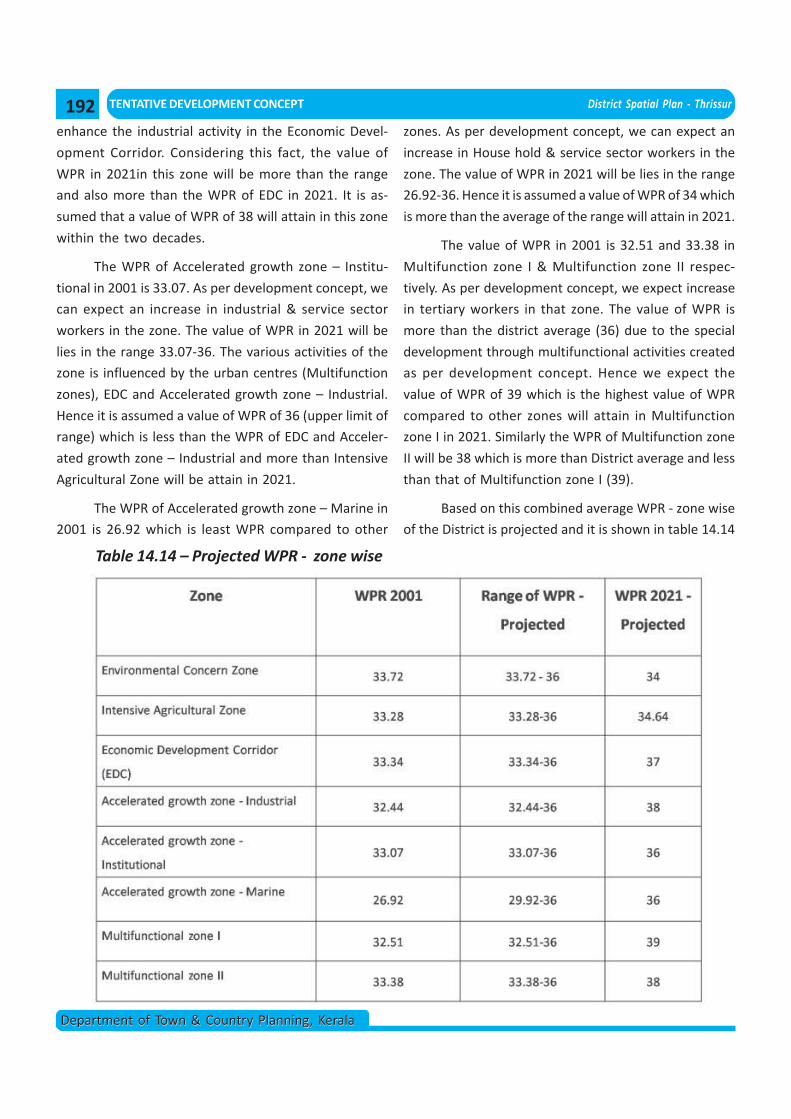
TENTATIVE DEVELOPMENT CONCEPT District Spatial Plan - Thrissur
Department of Town & Country Planning, KeralaDepartment of Town & Country Planning, Kerala
enhance the industrial activity in the Economic Devel-
opment Corridor. Considering this fact, the value of
WPR in 2021in this zone will be more than the range
and also more than the WPR of EDC in 2021. It is as-
sumed that a value of WPR of 38 will attain in this zone
within the two decades.
The WPR of Accelerated growth zone – Institu-
tional in 2001 is 33.07. As per development concept, we
can expect an increase in industrial & service sector
workers in the zone. The value of WPR in 2021 will be
lies in the range 33.07-36. The various activities of the
zone is influenced by the urban centres (Multifunction
zones), EDC and Accelerated growth zone – Industrial.
Hence it is assumed a value of WPR of 36 (upper limit of
range) which is less than the WPR of EDC and Acceler-
ated growth zone – Industrial and more than Intensive
Agricultural Zone will be attain in 2021.
The WPR of Accelerated growth zone – Marine in
2001 is 26.92 which is least WPR compared to other
zones. As per development concept, we can expect an
increase in House hold & service sector workers in the
zone. The value of WPR in 2021 will be lies in the range
26.92-36. Hence it is assumed a value of WPR of 34 which
is more than the average of the range will attain in 2021.
The value of WPR in 2001 is 32.51 and 33.38 in
Multifunction zone I & Multifunction zone II respec-
tively. As per development concept, we expect increase
in tertiary workers in that zone. The value of WPR is
more than the district average (36) due to the special
development through multifunctional activities created
as per development concept. Hence we expect the
value of WPR of 39 which is the highest value of WPR
compared to other zones will attain in Multifunction
zone I in 2021. Similarly the WPR of Multifunction zone
II will be 38 which is more than District average and less
than that of Multifunction zone I (39).
Based on this combined average WPR - zone wise
of the District is projected and it is shown in table 14.14
Table 14.14 – Projected WPR - zone wise
192
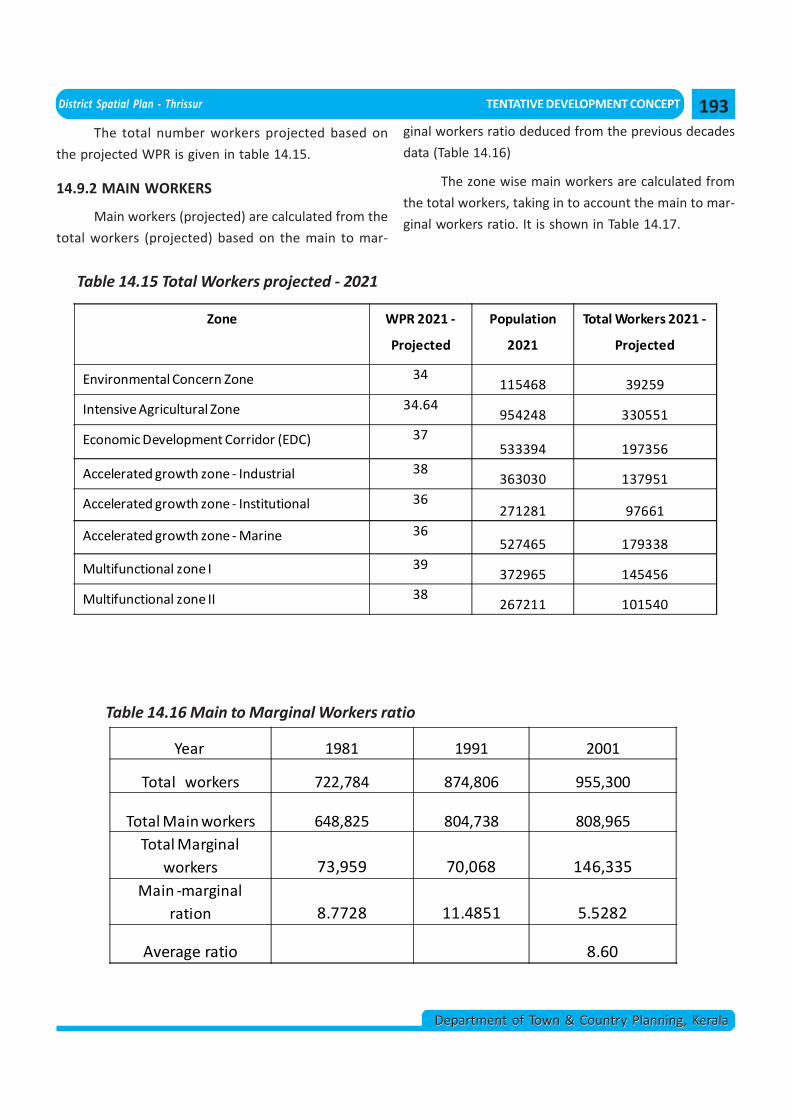
District Spatial Plan - Thrissur TENTATIVE DEVELOPMENT CONCEPT
Department of Town & Country Planning, KeralaDepartment of Town & Country Planning, Kerala
The total number workers projected based on
the projected WPR is given in table 14.15.
14.9.2 MAIN WORKERS
Main workers (projected) are calculated from the
total workers (projected) based on the main to mar-
Table 14.15 Total Workers projected - 2021
ginal workers ratio deduced from the previous decades
data (Table 14.16)
The zone wise main workers are calculated from
the total workers, taking in to account the main to mar-
ginal workers ratio. It is shown in Table 14.17.
Table 14.16 Main to Marginal Workers ratio
Zone WPR 2021 ‐
Projected
Population
2021
Total Workers 2021 ‐
Projected
Environmental Concern Zone 34115468 39259
Intensive Agricultural Zone 34.64954248 330551
Economic Development Corridor (EDC) 37533394 197356
Accelerated growth zone - Industrial 38363030 137951
Accelerated growth zone - Institutional 36271281 97661
Accelerated growth zone - Marine 36527465 179338
Multifunctional zone I 39372965 145456
Multifunctional zone II 38267211 101540
Year 1981 1991 2001
Total workers 722,784 874,806 955,300
Total Main workers 648,825 804,738 808,965Total Marginal
workers 73,959 70,068 146,335Main -marginal
ration 8.7728 11.4851 5.5282
Average ratio 8.60
193
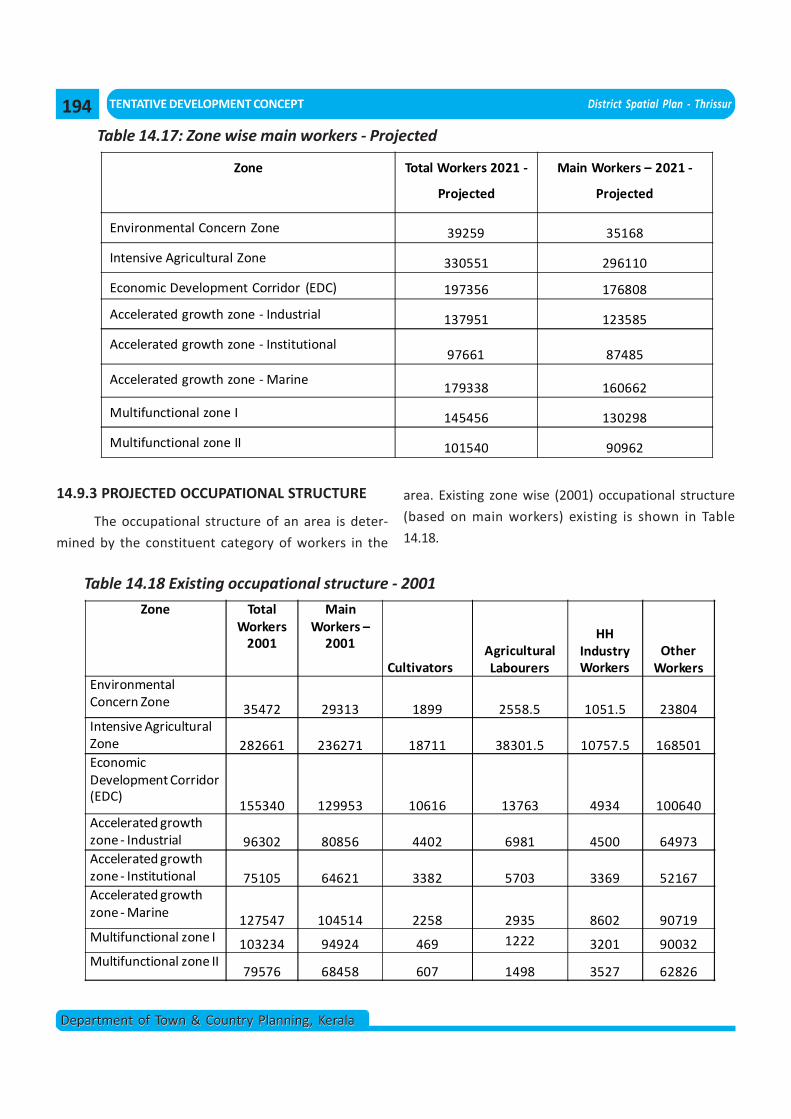
TENTATIVE DEVELOPMENT CONCEPT District Spatial Plan - Thrissur
Department of Town & Country Planning, KeralaDepartment of Town & Country Planning, Kerala
Table 14.17: Zone wise main workers - Projected
14.9.3 PROJECTED OCCUPATIONAL STRUCTURE
The occupational structure of an area is deter-
mined by the constituent category of workers in the
area. Existing zone wise (2001) occupational structure
(based on main workers) existing is shown in Table
14.18.
Table 14.18 Existing occupational structure - 2001
Zone Total Workers 2021 ‐
Projected
Main Workers – 2021 ‐
Projected
Environmental Concern Zone 39259 35168
Intensive Agricultural Zone 330551 296110
Economic Development Corridor (EDC) 197356 176808
Accelerated growth zone - Industrial 137951 123585
Accelerated growth zone - Institutional97661 87485
Accelerated growth zone - Marine179338 160662
Multifunctional zone I 145456 130298
Multifunctional zone II 101540 90962
Zone Total Workers
2001
Main Workers –
2001
CultivatorsAgricultural Labourers
HH Industry Workers
Other Workers
Environmental Concern Zone 35472 29313 1899 2558.5 1051.5 23804Intensive Agricultural Zone 282661 236271 18711 38301.5 10757.5 168501Economic Development Corridor (EDC)
155340 129953 10616 13763 4934 100640Accelerated growth zone - Industrial 96302 80856 4402 6981 4500 64973Accelerated growth zone - Institutional 75105 64621 3382 5703 3369 52167Accelerated growth zone - Marine 127547 104514 2258 2935 8602 90719Multifunctional zone I 103234 94924 469 1222 3201 90032Multifunctional zone II
79576 68458 607 1498 3527 62826
194
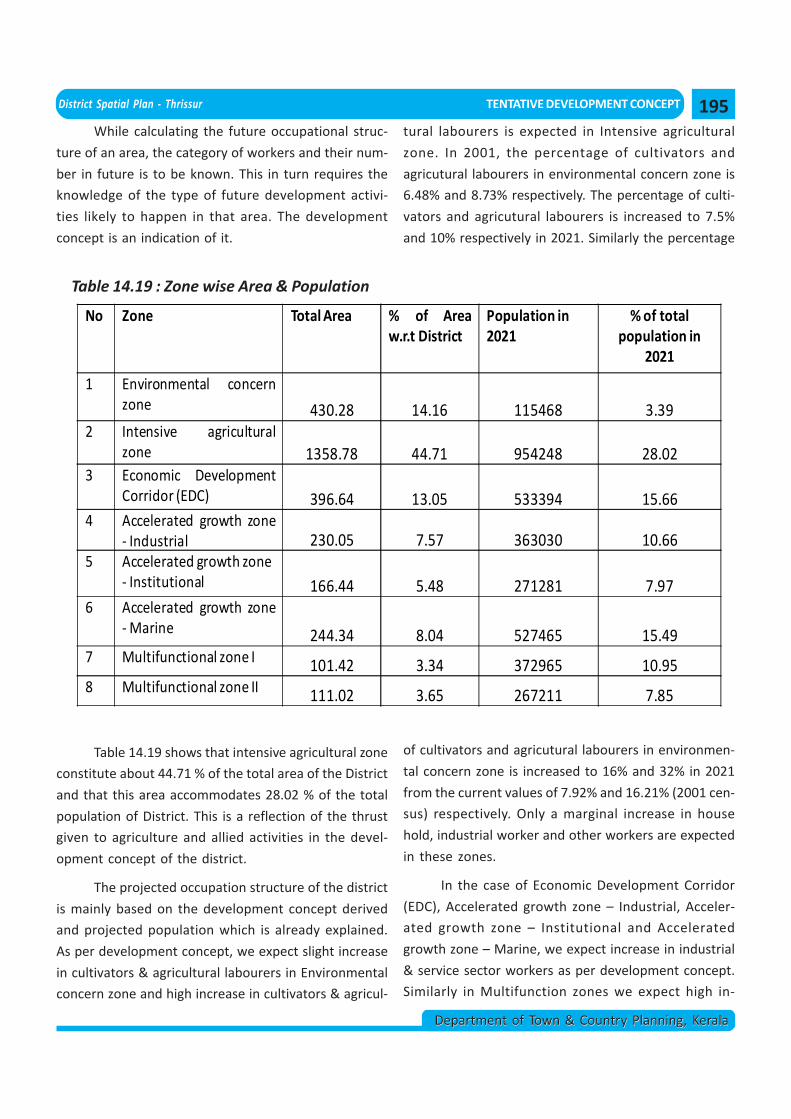
District Spatial Plan - Thrissur TENTATIVE DEVELOPMENT CONCEPT
Department of Town & Country Planning, KeralaDepartment of Town & Country Planning, Kerala
While calculating the future occupational struc-
ture of an area, the category of workers and their num-
ber in future is to be known. This in turn requires the
knowledge of the type of future development activi-
ties likely to happen in that area. The development
concept is an indication of it.
Table 14.19 : Zone wise Area & Population
Table 14.19 shows that intensive agricultural zone
constitute about 44.71 % of the total area of the District
and that this area accommodates 28.02 % of the total
population of District. This is a reflection of the thrust
given to agriculture and allied activities in the devel-
opment concept of the district.
The projected occupation structure of the district
is mainly based on the development concept derived
and projected population which is already explained.
As per development concept, we expect slight increase
in cultivators & agricultural labourers in Environmental
concern zone and high increase in cultivators & agricul-
tural labourers is expected in Intensive agricultural
zone. In 2001, the percentage of cultivators and
agricutural labourers in environmental concern zone is
6.48% and 8.73% respectively. The percentage of culti-
vators and agricutural labourers is increased to 7.5%
and 10% respectively in 2021. Similarly the percentage
of cultivators and agricutural labourers in environmen-
tal concern zone is increased to 16% and 32% in 2021
from the current values of 7.92% and 16.21% (2001 cen-
sus) respectively. Only a marginal increase in house
hold, industrial worker and other workers are expected
in these zones.
In the case of Economic Development Corridor
(EDC), Accelerated growth zone – Industrial, Acceler-
ated growth zone – Institutional and Accelerated
growth zone – Marine, we expect increase in industrial
& service sector workers as per development concept.
Similarly in Multifunction zones we expect high in-
No Zone Total Area % of Areaw.r.t District
Population in 2021
% of total population in
2021
1 Environmental concernzone 430.28 14.16 115468 3.39
2 Intensive agriculturalzone 1358.78 44.71 954248 28.02
3 Economic DevelopmentCorridor (EDC) 396.64 13.05 533394 15.66
4 Accelerated growth zone- Industrial 230.05 7.57 363030 10.66
5 Accelerated growth zone - Institutional 166.44 5.48 271281 7.97
6 Accelerated growth zone- Marine 244.34 8.04 527465 15.49
7 Multifunctional zone I 101.42 3.34 372965 10.958 Multifunctional zone II 111.02 3.65 267211 7.85
195
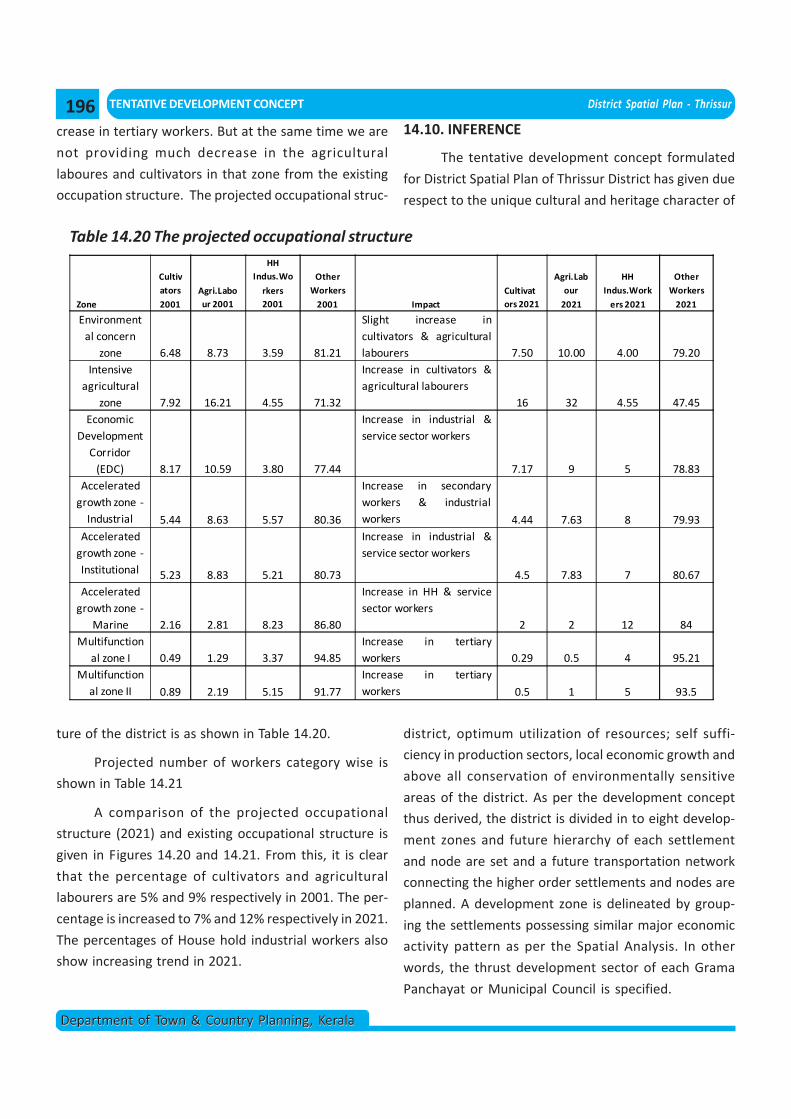
TENTATIVE DEVELOPMENT CONCEPT District Spatial Plan - Thrissur
Department of Town & Country Planning, KeralaDepartment of Town & Country Planning, Kerala
crease in tertiary workers. But at the same time we are
not providing much decrease in the agricultural
laboures and cultivators in that zone from the existing
occupation structure. The projected occupational struc-
Table 14.20 The projected occupational structure
ture of the district is as shown in Table 14.20.
Projected number of workers category wise is
shown in Table 14.21
A comparison of the projected occupational
structure (2021) and existing occupational structure is
given in Figures 14.20 and 14.21. From this, it is clear
that the percentage of cultivators and agricultural
labourers are 5% and 9% respectively in 2001. The per-
centage is increased to 7% and 12% respectively in 2021.
The percentages of House hold industrial workers also
show increasing trend in 2021.
Zone
Cultivators
2001Agri.Labour 2001
HH Indus.Wo
rkers 2001
Other Workers
2001 ImpactCultivators 2021
Agri.Labour
2021
HH Indus.Work
ers 2021
Other Workers
2021
Environmental concern
zone 6.48 8.73 3.59 81.21
Slight increase incultivators & agriculturallabourers 7.50 10.00 4.00 79.20
Intensive agricultural
zone 7.92 16.21 4.55 71.32
Increase in cultivators &agricultural labourers
16 32 4.55 47.45Economic
Development Corridor
(EDC) 8.17 10.59 3.80 77.44
Increase in industrial &service sector workers
7.17 9 5 78.83Accelerated
growth zone -Industrial 5.44 8.63 5.57 80.36
Increase in secondaryworkers & industrialworkers 4.44 7.63 8 79.93
Accelerated growth zone -Institutional 5.23 8.83 5.21 80.73
Increase in industrial &service sector workers
4.5 7.83 7 80.67Accelerated
growth zone -Marine 2.16 2.81 8.23 86.80
Increase in HH & servicesector workers
2 2 12 84Multifunction
al zone I 0.49 1.29 3.37 94.85Increase in tertiaryworkers 0.29 0.5 4 95.21
Multifunctional zone II 0.89 2.19 5.15 91.77
Increase in tertiaryworkers 0.5 1 5 93.5
14.10. INFERENCE
The tentative development concept formulated
for District Spatial Plan of Thrissur District has given due
respect to the unique cultural and heritage character of
district, optimum utilization of resources; self suffi-
ciency in production sectors, local economic growth and
above all conservation of environmentally sensitive
areas of the district. As per the development concept
thus derived, the district is divided in to eight develop-
ment zones and future hierarchy of each settlement
and node are set and a future transportation network
connecting the higher order settlements and nodes are
planned. A development zone is delineated by group-
ing the settlements possessing similar major economic
activity pattern as per the Spatial Analysis. In other
words, the thrust development sector of each Grama
Panchayat or Municipal Council is specified.
196
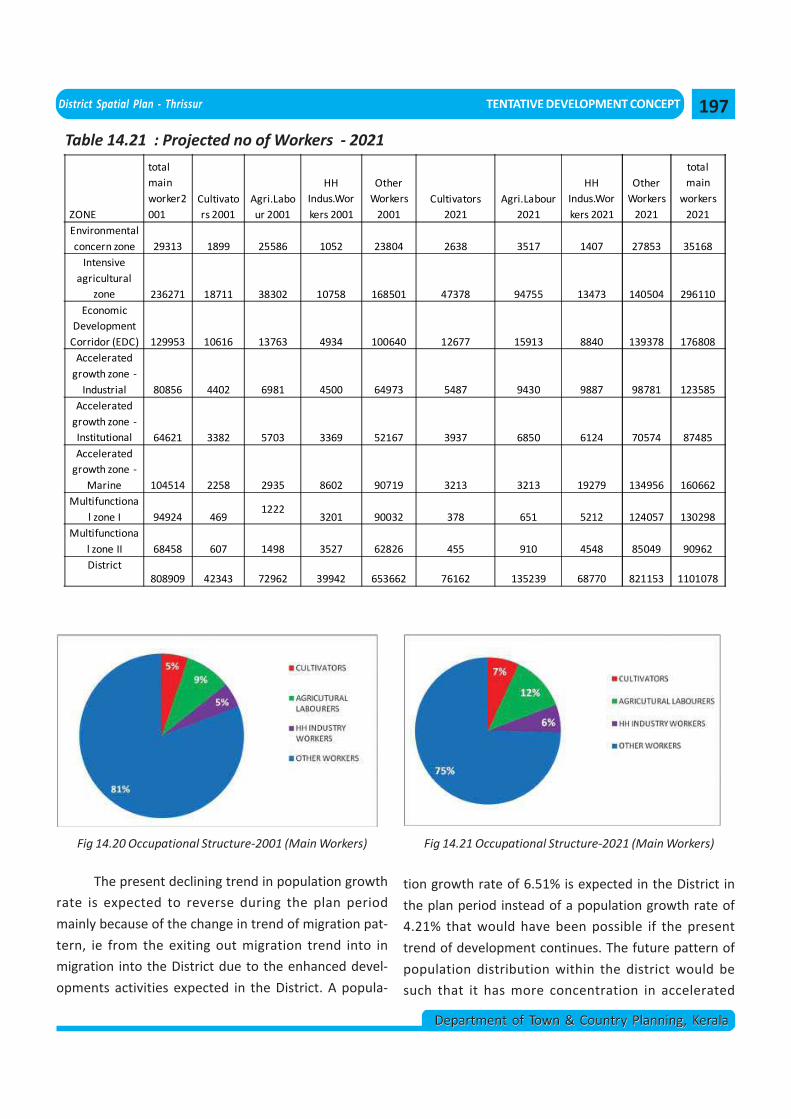
District Spatial Plan - Thrissur TENTATIVE DEVELOPMENT CONCEPT
Department of Town & Country Planning, KeralaDepartment of Town & Country Planning, Kerala
Fig 14.20 Occupational Structure-2001 (Main Workers) Fig 14.21 Occupational Structure-2021 (Main Workers)
Table 14.21 : Projected no of Workers - 2021
The present declining trend in population growth
rate is expected to reverse during the plan period
mainly because of the change in trend of migration pat-
tern, ie from the exiting out migration trend into in
migration into the District due to the enhanced devel-
opments activities expected in the District. A popula-
ZONE
total main worker2001
Cultivators 2001
Agri.Labour 2001
HH Indus.Workers 2001
Other Workers
2001Cultivators
2021Agri.Labour
2021
HH Indus.Workers 2021
Other Workers
2021
total main
workers 2021
Environmental concern zone 29313 1899 25586 1052 23804 2638 3517 1407 27853 35168
Intensive agricultural
zone 236271 18711 38302 10758 168501 47378 94755 13473 140504 296110Economic
Development Corridor (EDC) 129953 10616 13763 4934 100640 12677 15913 8840 139378 176808
Accelerated growth zone -
Industrial 80856 4402 6981 4500 64973 5487 9430 9887 98781 123585Accelerated
growth zone -Institutional 64621 3382 5703 3369 52167 3937 6850 6124 70574 87485Accelerated
growth zone -Marine 104514 2258 2935 8602 90719 3213 3213 19279 134956 160662
Multifunctional zone I 94924 469
12223201 90032 378 651 5212 124057 130298
Multifunctional zone II 68458 607 1498 3527 62826 455 910 4548 85049 90962District
808909 42343 72962 39942 653662 76162 135239 68770 821153 1101078
tion growth rate of 6.51% is expected in the District in
the plan period instead of a population growth rate of
4.21% that would have been possible if the present
trend of development continues. The future pattern of
population distribution within the district would be
such that it has more concentration in accelerated
197
TENTATIVE DEVELOPMENT CONCEPT District Spatial Plan - Thrissur
Department of Town & Country Planning, KeralaDepartment of Town & Country Planning, Kerala
growth zones and multifunctional zones, less concen-
tration in intensive agricultural zone and even lesser in
Environmental concern zones. This is in conformity with
the development concept.
The work participation rate in Thrissur District is
expected to increase from 32.12% in 2001 to 36 % in
2021. The development proposals in agriculture sector
are a major component in increasing the work partici-
pation rate.
The boost in agricultural activities is expected to
arrest the dilution in the economic base of the District
in its rural areas.
198
District Spatial Plan - Thrissur DEVELOPMENT DIRECTIVES
Department of Town & Country Planning, KeralaDepartment of Town & Country Planning, Kerala
Chapter – 15DEVELOPMENT DIRECTIVES
15.1. INTRODUCTION
Based on the issues, problems and potentials
evolved from the study of settlements and within the
frame work of the goals and objectives, the key sec-
tors, where planning interventions are required are
identified. We have the spatial structure of the district
which is evolved from the hierarchy of settlements,
connectivity and activity pattern. The environmental
aspects of the district are also studied. Based on the
above, and incorporating the spirit of the development
goals, development concept has been formulated. Sub-
sequently development zones were delineated, trans-
ferring the development concept into ground. Now,
based on the tentative development concept, devel-
opment policies have to be framed. This chapter at-
tempt to develop the General Policies and Strategies
for integrated and concept based planned development
of the District. The desirable directions of future de-
velopment of the district, evolved in the District Spa-
tial Plan are also summed up in this chapter.
The development concept derived for the dis-
trict aim at
Environmental protection and sustainable
development
Optimum utilisation of resources
Integration of primary, secondary and tertiary
sectors
Ensuring local economic development and
generation of better opportunities
Balanced development and equitable
distribution of facilities
Attain certain level of self sufficiency in
production sectors
15.2 GENERAL POLICIES AND STRATEGIES
Within the framework of Goals, Objectives and
the Development Concept the general District Devel-
opment Policy can be stated as
“To make the district a thriving economic
growth hub of the state by enhancing economy through
optimum utilization of resources while conserving its
environmentally sensitive areas where equitable dis-
tribution of facilities enable people to live a better qual-
ity life.”
15.3. DEVELOPMENT STRATEGIES – 2021
Future development strategies for the district
have been formulated based on findings of analysis,
development concept and the development policy. In
view of the development policy the strategies are
grouped as follows:
1. Environmental Protection & Sustainable De-
velopment Strategies.
2. Strategies to enhance the economic growth
through optimum utilization of resources
3. Social welfare strategies/ Strategies for pro-
vision of equitable distribution of facilities
15.3.1 Environmental Protection & SustainableDevelopment Strategies
To attain long-term sustainability of natural re-
sources, the land utilization pattern must be designed
to ensure that the natural basis of living is sustained in
the long run, i.e. the use of land should correspond to
its natural potential. Environmental damage, already
occurred shall be mitigated and damaging develop-
ments shall be avoided in future.
199
DEVELOPMENT DIRECTIVES District Spatial Plan - Thrissur
Department of Town & Country Planning, KeralaDepartment of Town & Country Planning, Kerala
Surveillance of natural eco systems and unique
bio diversity in the western gaht reserve forest
area of the district.
Conservation of unique “kole land” areas which
act as food granaries within the district
Protecting flora, fauna, water and soil through
traditional methods.
Enhance the non conventional energy sources
like solar energy, tidal energy and wind energy.
Eco friendly, sustainable and judicial utilization
of natural resources and environmental wealth
of the district for local economic growth
through eco tourism, value added products,
extraction of resources within the carrying
capacity limits and so forth.
Prevention of reclamation/conversion of kole
land / paddy lands
Conservation of water bodies and natural
drainage networks.
Enhance the ground water recharging and
rainwater harvesting to improve the ground
water table and thus to solve water scarcity
problems of the district to the extent possible.
Abatement of water, air and noise pollution.
Developing efficient and sustainable solid
waste management system
15.3.2 Strategies to enhance the economic growththrough optimum utilization of resources
♦ Develop agricultural sector as one of the economic
bases of the District as most of the agricultural areas
of the district are concentrated in the intensive
agriculture zone of the district and general
character of most of the settlements are rural. This
can be achieved through:
Developing sustainable agriculture which
involves three aspects: an economically viable
agricultural production system, the
maintenance or enhancement of the natural
resource base and eco-systems affected by
agricultural activities, and the provision of
natural amenities, including landscapes.
Conversion of fallow land and waste land into
agricultural land
Restrict diversion of prime agricultural lands
for other purposes
Adoption of modernization techniques to
improve production of goods and thus to attain
certain level of self sufficiency in food crops.
Develop agro based industries and food
processing units in the Intensive Agricultural
Zone and increase the income of the district.
Create an administrative framework which can
promote integration.
Co-ordination of various agencies such as
environment, irrigation, agriculture and soil
and water conservation etc.
♦♦♦♦♦ Develop animal husbandry sector complemen-tary to agricultural sector through
Augmenting the production potentialities of
livestock and poultry and thus increasing the
production of milk, egg and meat.
Providing necessary and timely modern
veterinary assistance and health cover to the
livestock and poultry.
Improve infrastructure facilities; implement
schemes for the development of livestock and
poultry products for self sufficiency.
Restoration and protection of grazing lands
♦ Develop tourism as a major sector of economy
through various measures such asImprove infrastructure facilities and
connectivity network
Make proper waste management plants/
systems in tourist centers.
Provide Guided Tours.
Build better co-ordination between line
departments and agencies for time bound
implementation of tourism projects.
Start tourism study centre.
200
District Spatial Plan - Thrissur DEVELOPMENT DIRECTIVES
Department of Town & Country Planning, KeralaDepartment of Town & Country Planning, Kerala
Protect beach area from natural threats.
Harness the direct and multiplier effects of
tourism for employment generation, economic
development and providing impetus to rural
tourism.
Focus on domestic tourism as a major driver of
tourism growth;
Acknowledge the critical role of private sector
with government working as a pro-active
facilitator and catalyst.
Create and develop integrated tourism circuits
based on India’s unique civilization, heritage
and culture in partnership with States, private
sector and other agencies
♦ Develop fisheries sector to enhance local
economic growth through various measures
such as
Promote fish markets, fish preservation and
production units, export and import of marine
products, ice plants, aquaculture farms,
ornamental fish trading units, fish seed farms,
fish farmers clubs, value added marine
product outlet units, development of fish
harbour & boat building yards, production and
maintenance units of machineries in the
‘accelerated growth zone – marine’ of the
district.
Increase salt water fishing harvest
Training in inland fish farming, maintenance
of fishing equipment, and in fishing skills.
Improve equipment availability to fishermen
♦ Developing Thrissur-Kochi corridor as anEconomic Development Corridor throughvarious measures such as
Promoting industries, industrial parks, Special
Economic Zones (SEZ’s), IT & Info Parks, Quality
Education and Health care institutions etc
Enhance the small scale and house hold
industrial activities which support value
addition of agriculture, fisheries and marine
products.
Provision of trained manpower in par with the
anticipated demand due to industrial growth
Need to preserve the environment and ensure
the efficient use of available resources in a
prominent way.
15.3.3. Social welfare strategies/ Strategies forprovision of equitable distribution of facilities
Safeguard the individual rights of every person
in view of the principle that every human being
has the right to live and enjoy the basic
necessities of life
Planning and preparedness to prevent or
mitigate the effects of problems encountered
by vulnerable populations.
Develop, at different levels, the appropriate
specific social policies and strategies
To monitor the economic, socio-cultural,
political and technological interests of the
population, paying special attention to the
needs and rights of minorities.
Developing indicators and quality standards in
order to measure and evaluate the impact of
social welfare/social security programmes and
implementing programmes to fill the gaps
identified
Providing a hierarchial system of settlements/
nodes supported with a network of transport
corridors so as to ensure equitable distribution
of facilities in the district
15.4 DEVELOPMENT DIRECTIVES
The district spatial plan for Thrissur aim at planned
sustainable and integrated spatial development of the
district. In connection with the preparation of the Plan
201
DEVELOPMENT DIRECTIVES District Spatial Plan - Thrissur
Department of Town & Country Planning, KeralaDepartment of Town & Country Planning, Kerala
detailed studies of the profile and regional setting of
the district, trend and level of urbanization in the dis-
trict, economic base and regional connectivity of the
district etc were conducted leading to evolution of func-
tional character and hierarchy of settlements of the dis-
trict. Further the activity pattern of each Local Govern-
ment is evolved by integrating urban profile (urban/
non urban), functional character (Urban/Semi Urban/
Semi Rural/Rural) and land use concentration pattern
(Urban/Agricultural/Plantation /forest) of Local Govern-
ments in the district. The spatial structure of the dis-
trict is evolved by integrating the activity pattern, re-
gional connectivity and hierarchy of settlements. The
development goals and objectives of the district were
derived based on findings of various studies. The ten-
tative development concept of the district is formu-
lated by synthesis of findings of studies in the orbit of
goals and objectives over the district platform. The de-
velopment concept so derived will provide the required
frame work for integrated development of the district.
Broad development policy for the district and the strat-
egies to achieve them were also framed. The develop-
ment directions of Thrissur district evolved in the Dis-
trict Spatial Plan for the district are consolidated here-
under:
15.4.1 Future Urban Profile
Following local governments are expected to
define the future urban profile of the District.
1. Thrissur Municipal Corporation
2. Guruvayur Municipal Council
3. Chavakkad Municipal Council
4. Irinjalakkuda Municipal Council
5. Kodungallur Municipal Council
6. Chalakkudy Municipal Council
7. Kunnamkulam Municipal Council
8. Valappad
9. Edavilangu
10. Pavaratty
11. Adat
12. Manalur
13. Cherpu
14. Eriyad
15. Sreenarayanapuram
16. Methala
17. Puukkad
18. Mala
The likely future urban profile of the district
evolved is shown in the table 15.1
LSGs adjacent to Thrissur Municipal Corporation
and those along the National High way can be assumed
to attain urban status in the next 10 years and the re-
maining LSGs to become urban within the next 20 years.
Five LSGs (Adat Grama Panchayat, Pavaratty Grama
Panchayat, Eriyad Grama Panchayat, Mala Grama
Panchayat, Methala Grama Panchayat) will attain ur-
ban status in 2011 and six LSGs (Edavilangu Grama
Panchayat, Valappad Grama Panchayat,
Sreenarayanapuram Grama Panchayat, Pudukkad
Grama Panchayat, Manalur Grama Panchayat, Cherpu
Grama Panchayat) will attain urban status in 2021.
The future urban profile of Thrissur District show-
ing the existing urban local governments and the LSGs
that will attain urban status by 2011 and by 2021 is rep-
resented in Fig 8.9 of Chapter 8.
15.4.2 Development zones and functions of settle-ments
a. Development zones
The tentative development concept formulated
for Thrissur District has given due respect to the unique
cultural and heritage character of the district, optimum
utilization of resources, self sufficiency in production
202
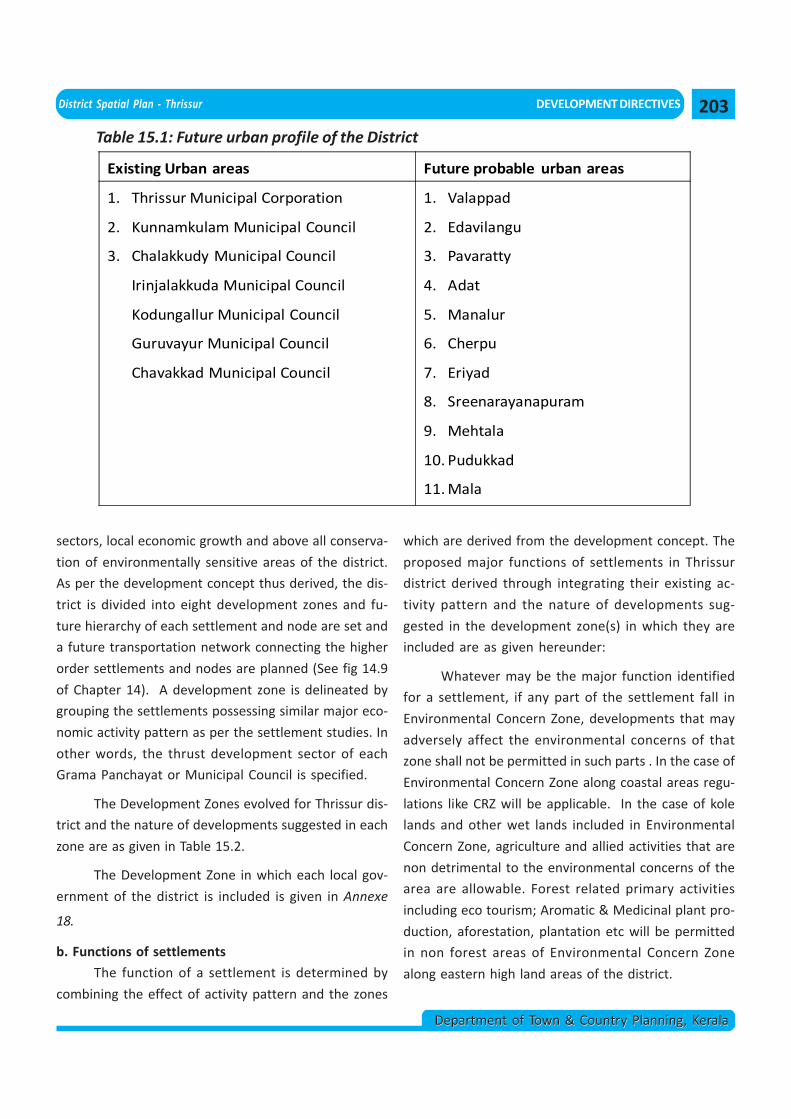
District Spatial Plan - Thrissur DEVELOPMENT DIRECTIVES
Department of Town & Country Planning, KeralaDepartment of Town & Country Planning, Kerala
Table 15.1: Future urban profile of the District
sectors, local economic growth and above all conserva-
tion of environmentally sensitive areas of the district.
As per the development concept thus derived, the dis-
trict is divided into eight development zones and fu-
ture hierarchy of each settlement and node are set and
a future transportation network connecting the higher
order settlements and nodes are planned (See fig 14.9
of Chapter 14). A development zone is delineated by
grouping the settlements possessing similar major eco-
nomic activity pattern as per the settlement studies. In
other words, the thrust development sector of each
Grama Panchayat or Municipal Council is specified.
The Development Zones evolved for Thrissur dis-
trict and the nature of developments suggested in each
zone are as given in Table 15.2.
The Development Zone in which each local gov-
ernment of the district is included is given in Annexe
18.
b. Functions of settlements
The function of a settlement is determined by
combining the effect of activity pattern and the zones
which are derived from the development concept. The
proposed major functions of settlements in Thrissur
district derived through integrating their existing ac-
tivity pattern and the nature of developments sug-
gested in the development zone(s) in which they are
included are as given hereunder:
Whatever may be the major function identified
for a settlement, if any part of the settlement fall in
Environmental Concern Zone, developments that may
adversely affect the environmental concerns of that
zone shall not be permitted in such parts . In the case of
Environmental Concern Zone along coastal areas regu-
lations like CRZ will be applicable. In the case of kole
lands and other wet lands included in Environmental
Concern Zone, agriculture and allied activities that are
non detrimental to the environmental concerns of the
area are allowable. Forest related primary activities
including eco tourism; Aromatic & Medicinal plant pro-
duction, aforestation, plantation etc will be permitted
in non forest areas of Environmental Concern Zone
along eastern high land areas of the district.
Existing Urban areas Future probable urban areas
1. Thrissur Municipal Corporation
2. Kunnamkulam Municipal Council
3. Chalakkudy Municipal Council
Irinjalakkuda Municipal Council
Kodungallur Municipal Council
Guruvayur Municipal Council
Chavakkad Municipal Council
1. Valappad
2. Edavilangu
3. Pavaratty
4. Adat
5. Manalur
6. Cherpu
7. Eriyad
8. Sreenarayanapuram
9. Mehtala
10. Pudukkad
11. Mala
203
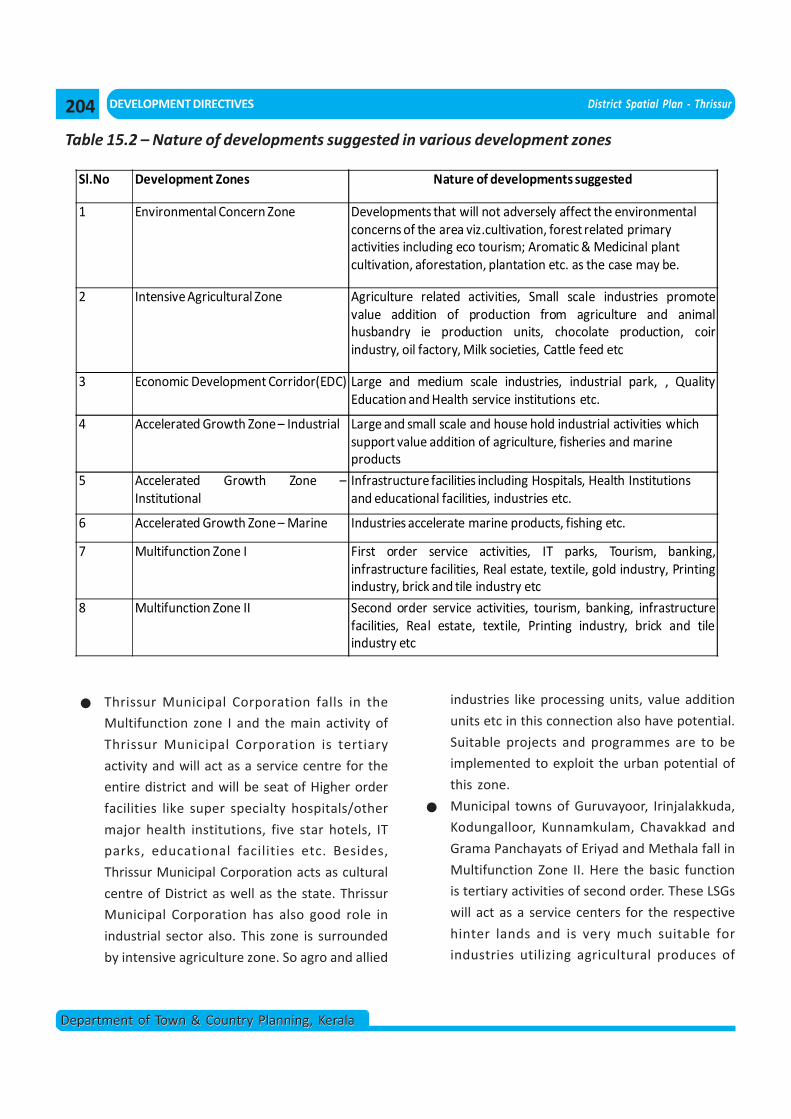
DEVELOPMENT DIRECTIVES District Spatial Plan - Thrissur
Department of Town & Country Planning, KeralaDepartment of Town & Country Planning, Kerala
Table 15.2 – Nature of developments suggested in various development zones
Thrissur Municipal Corporation falls in the
Multifunction zone I and the main activity of
Thrissur Municipal Corporation is tertiary
activity and will act as a service centre for the
entire district and will be seat of Higher order
facilities like super specialty hospitals/other
major health institutions, five star hotels, IT
parks, educational facilities etc. Besides,
Thrissur Municipal Corporation acts as cultural
centre of District as well as the state. Thrissur
Municipal Corporation has also good role in
industrial sector also. This zone is surrounded
by intensive agriculture zone. So agro and allied
industries like processing units, value addition
units etc in this connection also have potential.
Suitable projects and programmes are to be
implemented to exploit the urban potential of
this zone.
Municipal towns of Guruvayoor, Irinjalakkuda,
Kodungalloor, Kunnamkulam, Chavakkad and
Grama Panchayats of Eriyad and Methala fall in
Multifunction Zone II. Here the basic function
is tertiary activities of second order. These LSGs
will act as a service centers for the respective
hinter lands and is very much suitable for
industries utilizing agricultural produces of
Sl.No Development Zones Nature of developments suggested
1 Environmental Concern Zone Developments that will not adversely affect the environmental concerns of the area viz.cultivation, forest related primary activities including eco tourism; Aromatic & Medicinal plant cultivation, aforestation, plantation etc. as the case may be.
2 Intensive Agricultural Zone Agriculture related activities, Small scale industries promotevalue addition of production from agriculture and animalhusbandry ie production units, chocolate production, coirindustry, oil factory, Milk societies, Cattle feed etc
3 Economic Development Corridor(EDC) Large and medium scale industries, industrial park, , QualityEducation and Health service institutions etc.
4 Accelerated Growth Zone – Industrial Large and small scale and house hold industrial activities which support value addition of agriculture, fisheries and marine products
5 Accelerated Growth Zone –Institutional
Infrastructure facilities including Hospitals, Health Institutions and educational facilities, industries etc.
6 Accelerated Growth Zone – Marine Industries accelerate marine products, fishing etc.
7 Multifunction Zone I First order service activities, IT parks, Tourism, banking,infrastructure facilities, Real estate, textile, gold industry, Printingindustry, brick and tile industry etc
8 Multifunction Zone II Second order service activities, tourism, banking, infrastructurefacilities, Real estate, textile, Printing industry, brick and tileindustry etc
204
District Spatial Plan - Thrissur DEVELOPMENT DIRECTIVES
Department of Town & Country Planning, KeralaDepartment of Town & Country Planning, Kerala
hinter land. Second order Service activities,
Tourism, banking, infrastructure facilities, Real
estate, textile Industry, Printing industry, brick
and tile industry etc will be promoted here.
Grama Panchayats of Kadavallur, Chelakkara,
Desamangalam, Elavally, Erumapetty,
Kadangode, Kandanassery, Kondazhy, Kuzhur,
Madakkathara ,Mulloorkara, Nadathara, Panjal,
Pariyaram, Pazhayannoor, Pookkode,
Thekkumkara, Thiruvilwamala,
Vadakkancherry, Vadakkekkad, Vallathol Nagar,
Varavoor and Velur fall fully in Intensive
Agriculture Zone. These Grama Panchayats will
specialize in primary agriculture and allied
activities. Tertiary service sector activities
including eco tourism, farm tourism etc which
are in conformity in the zone can also be
promoted.
Portions of Grama Panchayats of Arimpur,
Athirapilly, Chazur, Kattakampal, Kodassery,
Pananchery, Porkulam, Punnayur,
Punnayurkulam, Puthur, Tholur,
Varantharappilly that fall in Intensive
Agriculture Zone are in Environmental Concern
Zone. Agriculture and allied activities that are
non detrimental to the environmental
concerns of the area are allowable here.
Grama Panchayats of Avanur, Avinissery,
Karalam, Mala, Mulamkunnathukavu,
Mundathokode, Paralam, Poomangalam,
Poyya, Vallachira fall, fully in Accelerated
Growth Zone – Industries. Grama Panchayats
of Kodakara and Nenmanikkara fall, fully in
Economic Development Corridor (EDC). Some
areas of Puthenchira and Vellangallur grama
panchayats fall in EDC and the remaining
portion of these grama panchayats fall in
Accelerated Growth Zone – Industries. These
Grama Panchayats may specialise in micro,
small, medium and large industries to trigger
the development impulses with priority to
value addition of primary production
(agriculture, marine etc…) and local resources.
Non polluting service sector industries like IT
can also be promoted. Tertiary/service sector
activities to support secondary sector activities
are also promoted. Large and medium scale
industries, industrial park, IT & Info Parks,
Quality Education and Health service
institutions etc are suggested in LSGs along
Economic Development Corridor (EDC).
Kaiparamba Grama Panchayat is in the
Accelerated Growth Zone – Institutional. The
Grama Panchayat will specialize in service
sector institutions like health, education,
research and training along the transportation
corridors and primary agriculture activity in
hinter land area.
Grama Panchayats of Orumanayoor & Pavaratty
fall, fully in Accelerated Growth Zone Marine.
These Grama Panchayats will specialize in
production, value addition and marketing of
marine produces and all allied activities. Also
portions of Grama Panchayats of Edathuruthy,
Edavilangu, Engadiur, Kadappuram,
Kaippamangalam, Mathilakom, Nattia,
Perinjanam, Sreenarayanapuram, Thalikulam,
Vadanappally and Valappad that are not in
Environmental Concern Zone are in Accelerated
Growth Zone Marine. In such areas, Marine
Activities viz. production, value addition and
marketing of marine produces, allied tertiary
sector developments (trade & commerce) are
proposed. Agricultural activities will be
continued in potential agricultural areas.
Grama Panchayats of Kattur & Padiyur fall partly
in Accelerated Growth Zone Marine & partly in
Accelerated Growth Zone - Industrial and
hence the proposed function of these LSGs is
Secondary Activity with supporting Tertiary
Activities. Accelerated industrial
development, mainly focusing on marine
205
DEVELOPMENT DIRECTIVES District Spatial Plan - Thrissur
Department of Town & Country Planning, KeralaDepartment of Town & Country Planning, Kerala
produces with supporting developments in
trade and commerce are suggested in these
LSGs.
Kolazhy Grama Panchayat falls in Accelerated
Growth Zone - Institutional & Accelerated
Growth Zone - Industrial. The proposed
function of the Grama Panchayat is secondary
activity with supporting tertiary activity. We can
promote secondary sector industrial activity
together with supporting tertiary service sector
activities like industrial training institutions etc.
Grama Panchayats of Choondal & Chowannur
fall in Accelerated Growth Zone Institutional &
Intensive agriculture zone and hence the
proposed major function of these LSGs is
Secondary Activity with supporting primary
Activities. These Grama Panchayats will
specialize in service sector institutions like
health, education, research and training along
the transportation corridors and primary
agriculture activity in hinter land area
production, value addition and marketing of
marine produces and all allied activities.
Portion of Porathissery Grama Panchayat that
falls in Accelerated Growth Zone - Industries is
in Environmental Concern Zone. Similarly
Portion of Velukkara Grama Panchayat that falls
in Economic Development Corridor and
Accelerated Growth Zone - Industries is in
Environmental Concern Zone. The proposed
functions of the Grama Panchayats are
secondary activity, but in areas that fall in
Environmental Concern Zone, any
developments that may adversely affect the
environment shall not be permitted.
The activity pattern of Grama Panchayats of
Muriyad and Cherppu is primary activity
(Agriculture). At the same time, Muriyad Grama
Panchayat is included in Intensive agricultural
zone, Economic Development Corridor (EDC),
Accelerated growth zone-industrial and
Environmental Concern Zone. Similarly
Cherppu Grama Panchayat falls in Intensive
Agriculture Zone, Accelerated Growth Zone-
Industrial and Environmental Concern Zone.
Therefore function of these two grama
panchayats derived is primary activity with
support to secondary activity.
Grama Panchayats of Alagappa Nagar, Alur,
Annamanada, Kadukutty, Koratty, Melur,
Parappukkara, Pudukkad and Thrikkur are along
Economic Development Corridor (EDC).
However, considerable portions of these LSGs
are in the Intensive agriculture zone. So the
main function of these LSGs is primary activity.
Secondary activities which support the
agriculture related activities will be promoted
here. Promotion of large and medium scale
industries, industrial park, IT & Info Parks,
Quality Education and Health service
institutions etc are suggested along Economic
Development Corridor (EDC).
Grama Panchayats of Manalur, Mullassery,
Thaikkad, Thanniyam Anthikkad and
Venkitanghu fall in Intensive agriculture zone
& Accelerated Growth Zone- Marine. The basic
function of these Grama Panchayats is primary
along with secondary. The agriculture related
activities along with Industrial activities
support Marine activities viz. production, value
addition and marketing of marine produces and
agriculture activities can be promoted here.
Portions of Anthikkad and Venkitanghu Grama
Panchayats fall in Environmental Concern Zone
also. The basic function of these Grama
Panchayats is primary along with secondary.
The agriculture related activities along with
Industrial activities support Marine activities
viz. production, value addition and marketing
of marine produces and agriculture activities
can be promoted here.
206
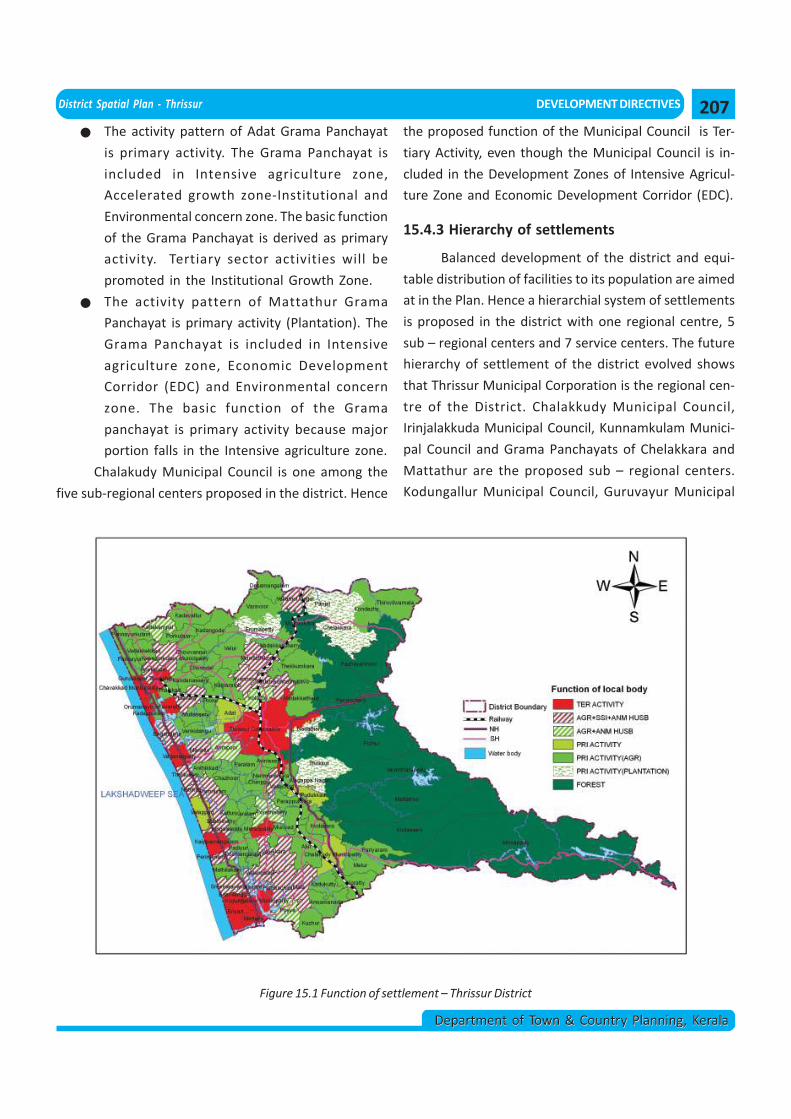
District Spatial Plan - Thrissur DEVELOPMENT DIRECTIVES
Department of Town & Country Planning, KeralaDepartment of Town & Country Planning, Kerala
Figure 15.1 Function of settlement – Thrissur District
The activity pattern of Adat Grama Panchayat
is primary activity. The Grama Panchayat is
included in Intensive agriculture zone,
Accelerated growth zone-Institutional and
Environmental concern zone. The basic function
of the Grama Panchayat is derived as primary
activity. Tertiary sector activities will be
promoted in the Institutional Growth Zone.
The activity pattern of Mattathur Grama
Panchayat is primary activity (Plantation). The
Grama Panchayat is included in Intensive
agriculture zone, Economic Development
Corridor (EDC) and Environmental concern
zone. The basic function of the Grama
panchayat is primary activity because major
portion falls in the Intensive agriculture zone.
Chalakudy Municipal Council is one among the
five sub-regional centers proposed in the district. Hence
the proposed function of the Municipal Council is Ter-
tiary Activity, even though the Municipal Council is in-
cluded in the Development Zones of Intensive Agricul-
ture Zone and Economic Development Corridor (EDC).
15.4.3 Hierarchy of settlements
Balanced development of the district and equi-
table distribution of facilities to its population are aimed
at in the Plan. Hence a hierarchial system of settlements
is proposed in the district with one regional centre, 5
sub – regional centers and 7 service centers. The future
hierarchy of settlement of the district evolved shows
that Thrissur Municipal Corporation is the regional cen-
tre of the District. Chalakkudy Municipal Council,
Irinjalakkuda Municipal Council, Kunnamkulam Munici-
pal Council and Grama Panchayats of Chelakkara and
Mattathur are the proposed sub – regional centers.
Kodungallur Municipal Council, Guruvayur Municipal
207
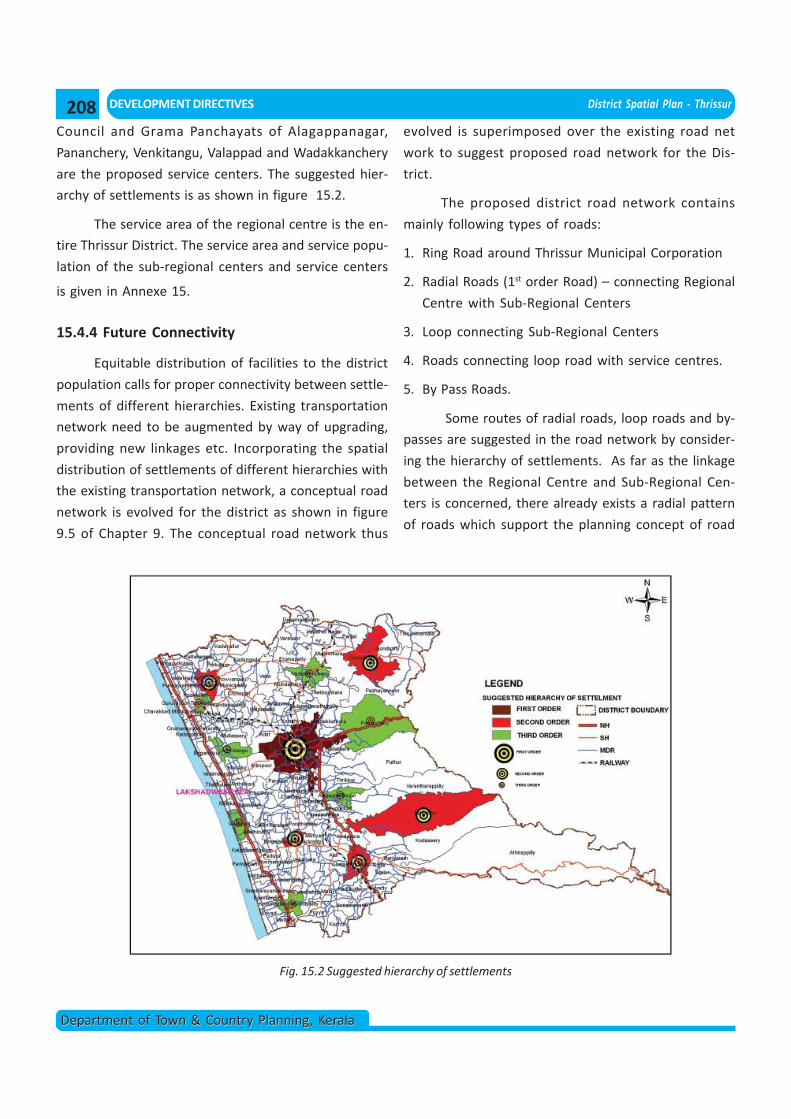
DEVELOPMENT DIRECTIVES District Spatial Plan - Thrissur
Department of Town & Country Planning, KeralaDepartment of Town & Country Planning, Kerala
Fig. 15.2 Suggested hierarchy of settlements
Council and Grama Panchayats of Alagappanagar,
Pananchery, Venkitangu, Valappad and Wadakkanchery
are the proposed service centers. The suggested hier-
archy of settlements is as shown in figure 15.2.
The service area of the regional centre is the en-
tire Thrissur District. The service area and service popu-
lation of the sub-regional centers and service centers
is given in Annexe 15.
15.4.4 Future Connectivity
Equitable distribution of facilities to the district
population calls for proper connectivity between settle-
ments of different hierarchies. Existing transportation
network need to be augmented by way of upgrading,
providing new linkages etc. Incorporating the spatial
distribution of settlements of different hierarchies with
the existing transportation network, a conceptual road
network is evolved for the district as shown in figure
9.5 of Chapter 9. The conceptual road network thus
evolved is superimposed over the existing road net
work to suggest proposed road network for the Dis-
trict.
The proposed district road network contains
mainly following types of roads:
1. Ring Road around Thrissur Municipal Corporation
2. Radial Roads (1st order Road) – connecting Regional
Centre with Sub-Regional Centers
3. Loop connecting Sub-Regional Centers
4. Roads connecting loop road with service centres.
5. By Pass Roads.
Some routes of radial roads, loop roads and by-
passes are suggested in the road network by consider-
ing the hierarchy of settlements. As far as the linkage
between the Regional Centre and Sub-Regional Cen-
ters is concerned, there already exists a radial pattern
of roads which support the planning concept of road
208
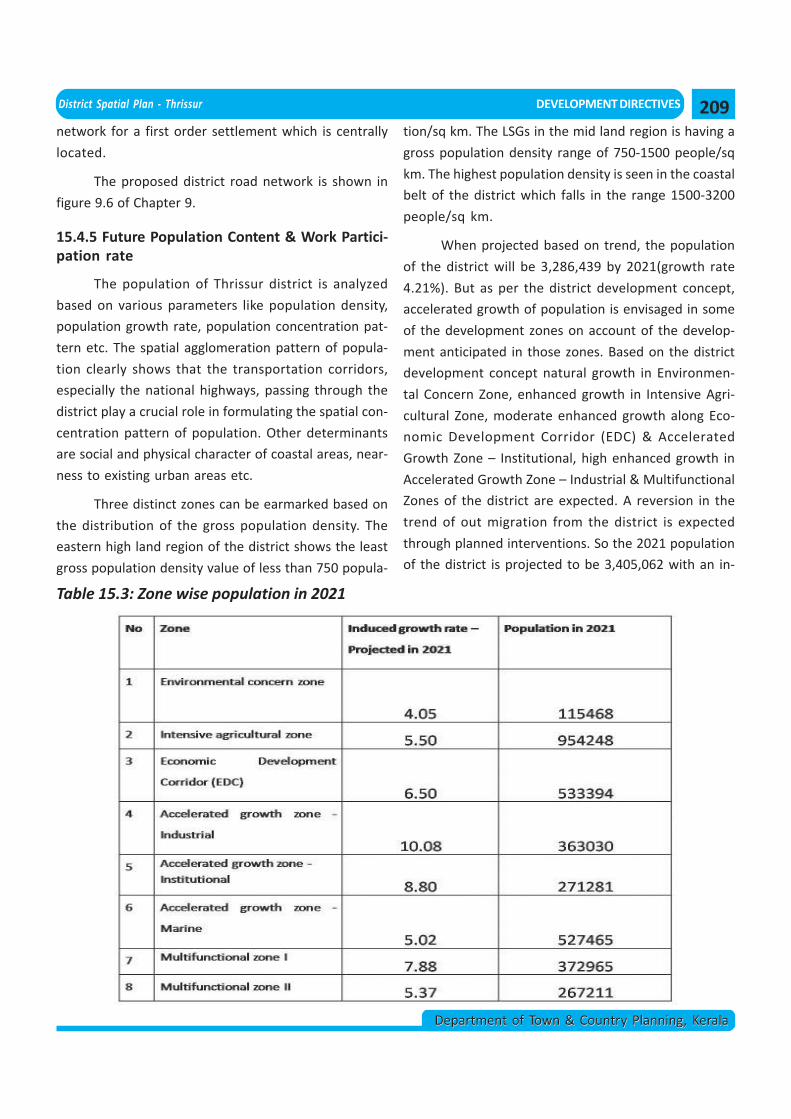
District Spatial Plan - Thrissur DEVELOPMENT DIRECTIVES
Department of Town & Country Planning, KeralaDepartment of Town & Country Planning, Kerala
network for a first order settlement which is centrally
located.
The proposed district road network is shown in
figure 9.6 of Chapter 9.
15.4.5 Future Population Content & Work Partici-pation rate
The population of Thrissur district is analyzed
based on various parameters like population density,
population growth rate, population concentration pat-
tern etc. The spatial agglomeration pattern of popula-
tion clearly shows that the transportation corridors,
especially the national highways, passing through the
district play a crucial role in formulating the spatial con-
centration pattern of population. Other determinants
are social and physical character of coastal areas, near-
ness to existing urban areas etc.
Three distinct zones can be earmarked based on
the distribution of the gross population density. The
eastern high land region of the district shows the least
gross population density value of less than 750 popula-
tion/sq km. The LSGs in the mid land region is having a
gross population density range of 750-1500 people/sq
km. The highest population density is seen in the coastal
belt of the district which falls in the range 1500-3200
people/sq km.
When projected based on trend, the population
of the district will be 3,286,439 by 2021(growth rate
4.21%). But as per the district development concept,
accelerated growth of population is envisaged in some
of the development zones on account of the develop-
ment anticipated in those zones. Based on the district
development concept natural growth in Environmen-
tal Concern Zone, enhanced growth in Intensive Agri-
cultural Zone, moderate enhanced growth along Eco-
nomic Development Corridor (EDC) & Accelerated
Growth Zone – Institutional, high enhanced growth in
Accelerated Growth Zone – Industrial & Multifunctional
Zones of the district are expected. A reversion in the
trend of out migration from the district is expected
through planned interventions. So the 2021 population
of the district is projected to be 3,405,062 with an in-
Table 15.3: Zone wise population in 2021
209
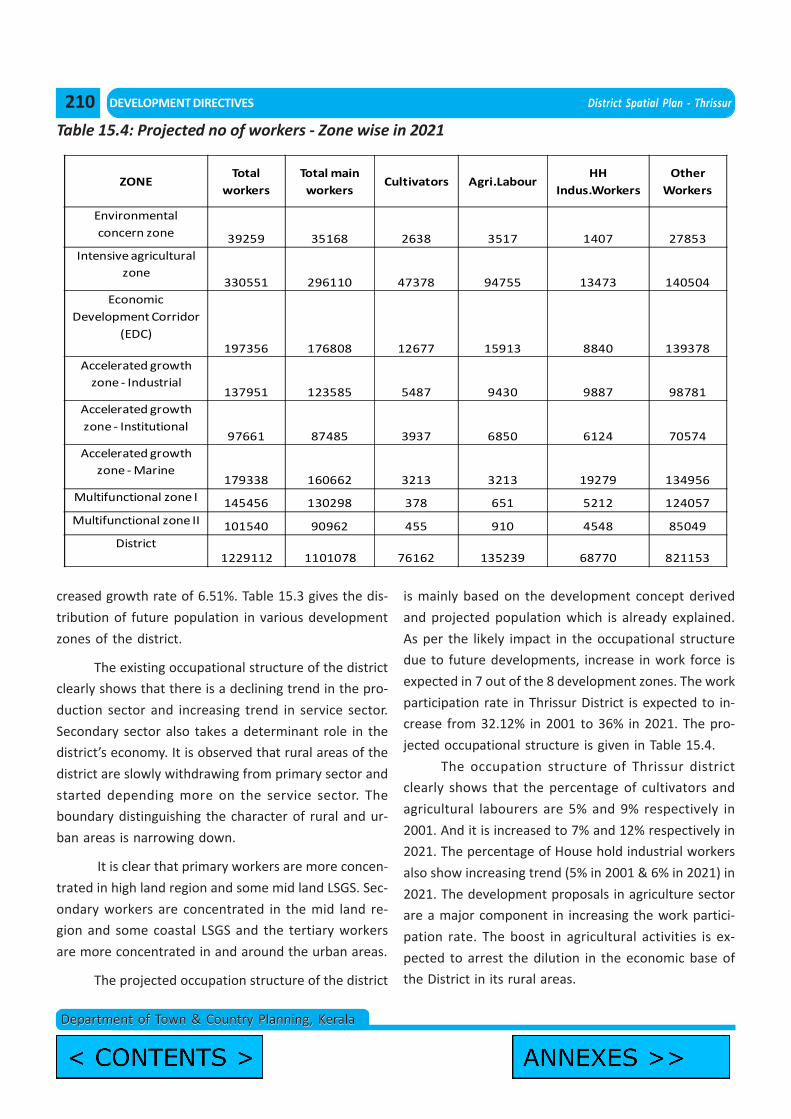
DEVELOPMENT DIRECTIVES District Spatial Plan - Thrissur
Department of Town & Country Planning, KeralaDepartment of Town & Country Planning, Kerala
creased growth rate of 6.51%. Table 15.3 gives the dis-
tribution of future population in various development
zones of the district.
The existing occupational structure of the district
clearly shows that there is a declining trend in the pro-
duction sector and increasing trend in service sector.
Secondary sector also takes a determinant role in the
district’s economy. It is observed that rural areas of the
district are slowly withdrawing from primary sector and
started depending more on the service sector. The
boundary distinguishing the character of rural and ur-
ban areas is narrowing down.
It is clear that primary workers are more concen-
trated in high land region and some mid land LSGS. Sec-
ondary workers are concentrated in the mid land re-
gion and some coastal LSGS and the tertiary workers
are more concentrated in and around the urban areas.
The projected occupation structure of the district
is mainly based on the development concept derived
and projected population which is already explained.
As per the likely impact in the occupational structure
due to future developments, increase in work force is
expected in 7 out of the 8 development zones. The work
participation rate in Thrissur District is expected to in-
crease from 32.12% in 2001 to 36% in 2021. The pro-
jected occupational structure is given in Table 15.4.
The occupation structure of Thrissur district
clearly shows that the percentage of cultivators and
agricultural labourers are 5% and 9% respectively in
2001. And it is increased to 7% and 12% respectively in
2021. The percentage of House hold industrial workers
also show increasing trend (5% in 2001 & 6% in 2021) in
2021. The development proposals in agriculture sector
are a major component in increasing the work partici-
pation rate. The boost in agricultural activities is ex-
pected to arrest the dilution in the economic base of
the District in its rural areas.
Table 15.4: Projected no of workers - Zone wise in 2021
ZONETotal
workers Total main workers
Cultivators Agri.Labour HH
Indus.WorkersOther
Workers
Environmental concern zone 39259 35168 2638 3517 1407 27853
Intensive agricultural zone
330551 296110 47378 94755 13473 140504Economic
Development Corridor (EDC)
197356 176808 12677 15913 8840 139378Accelerated growth
zone - Industrial137951 123585 5487 9430 9887 98781
Accelerated growth zone - Institutional
97661 87485 3937 6850 6124 70574Accelerated growth
zone - Marine179338 160662 3213 3213 19279 134956
Multifunctional zone I 145456 130298 378 651 5212 124057Multifunctional zone II 101540 90962 455 910 4548 85049
District1229112 1101078 76162 135239 68770 821153
210
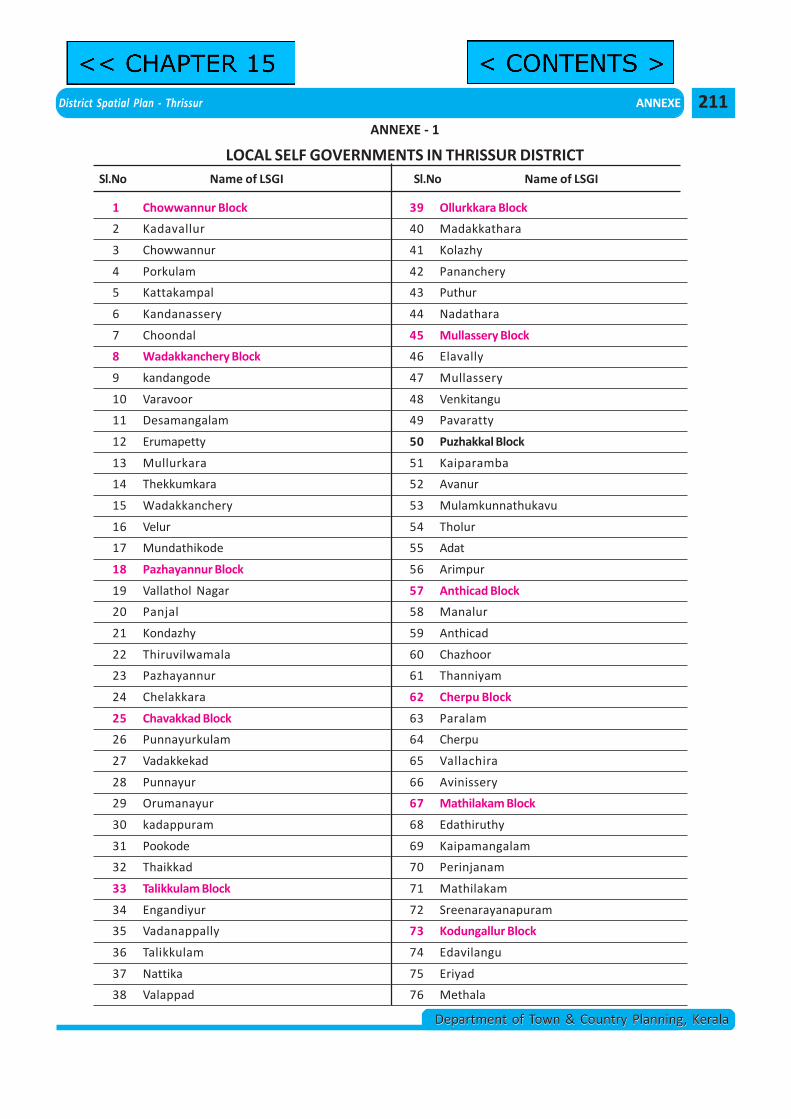
District Spatial Plan - Thrissur ANNEXE
Department of Town & Country Planning, KeralaDepartment of Town & Country Planning, Kerala
Sl.No Name of LSGI Sl.No Name of LSGI
1 Chowwannur Block
2 Kadavallur
3 Chowwannur
4 Porkulam
5 Kattakampal
6 Kandanassery
7 Choondal
8 Wadakkanchery Block
9 kandangode
10 Varavoor
11 Desamangalam
12 Erumapetty
13 Mullurkara
14 Thekkumkara
15 Wadakkanchery
16 Velur
17 Mundathikode
18 Pazhayannur Block
19 Vallathol Nagar
20 Panjal
21 Kondazhy
22 Thiruvilwamala
23 Pazhayannur
24 Chelakkara
25 Chavakkad Block
26 Punnayurkulam
27 Vadakkekad
28 Punnayur
29 Orumanayur
30 kadappuram
31 Pookode
32 Thaikkad
33 Talikkulam Block
34 Engandiyur
35 Vadanappally
36 Talikkulam
37 Nattika
38 Valappad
39 Ollurkkara Block
40 Madakkathara
41 Kolazhy
42 Pananchery
43 Puthur
44 Nadathara
45 Mullassery Block
46 Elavally
47 Mullassery
48 Venkitangu
49 Pavaratty
50 Puzhakkal Block
51 Kaiparamba
52 Avanur
53 Mulamkunnathukavu
54 Tholur
55 Adat
56 Arimpur
57 Anthicad Block
58 Manalur
59 Anthicad
60 Chazhoor
61 Thanniyam
62 Cherpu Block
63 Paralam
64 Cherpu
65 Vallachira
66 Avinissery
67 Mathilakam Block
68 Edathiruthy
69 Kaipamangalam
70 Perinjanam
71 Mathilakam
72 Sreenarayanapuram
73 Kodungallur Block
74 Edavilangu
75 Eriyad
76 Methala
ANNEXE - 1
LOCAL SELF GOVERNMENTS IN THRISSUR DISTRICT
211
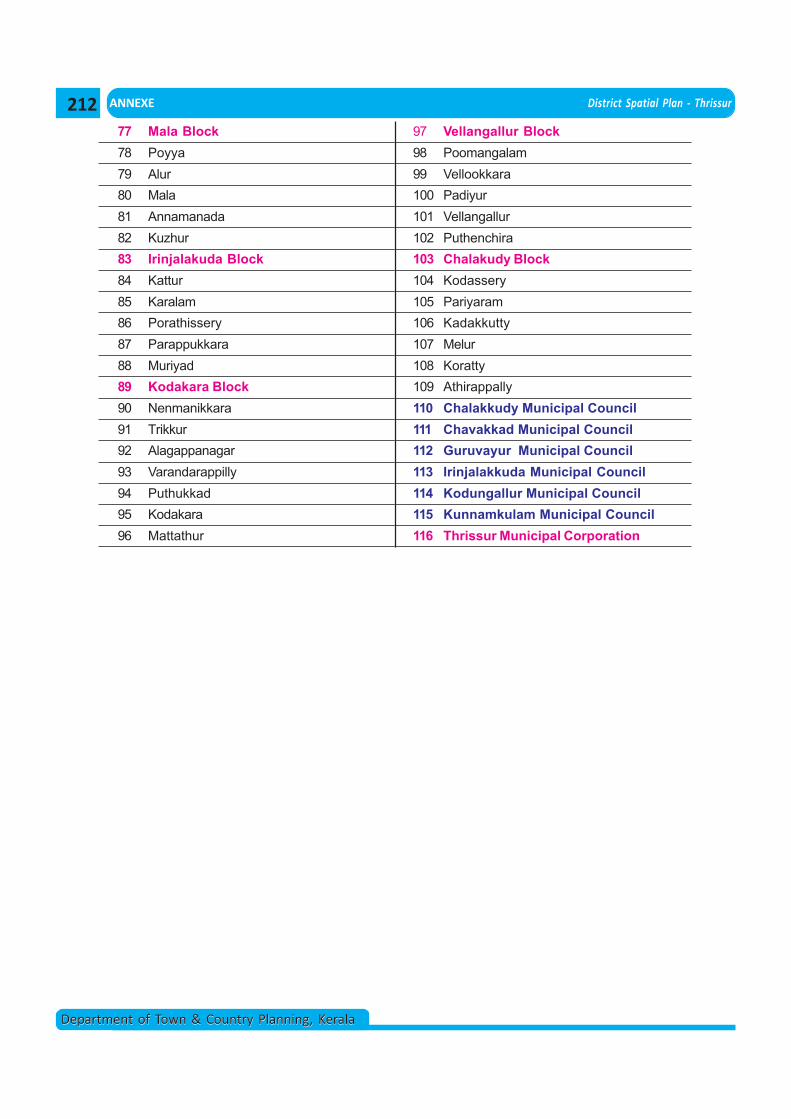
ANNEXE District Spatial Plan - Thrissur
Department of Town & Country Planning, KeralaDepartment of Town & Country Planning, Kerala
77 Mala Block78 Poyya79 Alur80 Mala81 Annamanada82 Kuzhur83 Irinjalakuda Block84 Kattur85 Karalam86 Porathissery87 Parappukkara88 Muriyad89 Kodakara Block90 Nenmanikkara91 Trikkur92 Alagappanagar93 Varandarappilly94 Puthukkad95 Kodakara96 Mattathur
97 Vellangallur Block98 Poomangalam99 Vellookkara100 Padiyur101 Vellangallur102 Puthenchira103 Chalakudy Block104 Kodassery105 Pariyaram106 Kadakkutty107 Melur108 Koratty109 Athirappally110 Chalakkudy Municipal Council111 Chavakkad Municipal Council112 Guruvayur Municipal Council113 Irinjalakkuda Municipal Council114 Kodungallur Municipal Council115 Kunnamkulam Municipal Council116 Thrissur Municipal Corporation
212
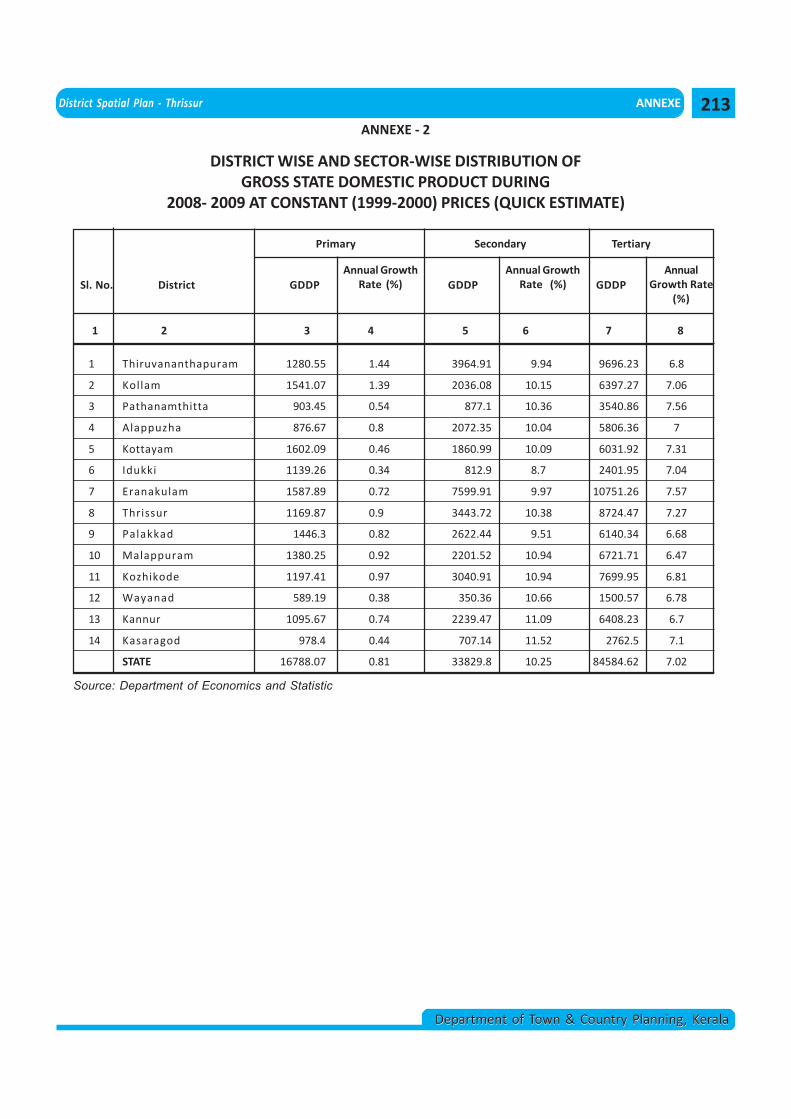
District Spatial Plan - Thrissur ANNEXE
Department of Town & Country Planning, KeralaDepartment of Town & Country Planning, Kerala
DISTRICT WISE AND SECTOR-WISE DISTRIBUTION OFGROSS STATE DOMESTIC PRODUCT DURING
2008- 2009 AT CONSTANT (1999-2000) PRICES (QUICK ESTIMATE)
1 2 3 4 5 6 7 8
1 Thiruvananthapuram 1280.55 1.44 3964.91 9.94 9696.23 6.8
2 Kollam 1541.07 1.39 2036.08 10.15 6397.27 7.06
3 Pathanamthitta 903.45 0.54 877.1 10.36 3540.86 7.56
4 Alappuzha 876.67 0.8 2072.35 10.04 5806.36 7
5 Kottayam 1602.09 0.46 1860.99 10.09 6031.92 7.31
6 Idukki 1139.26 0.34 812.9 8.7 2401.95 7.04
7 Eranakulam 1587.89 0.72 7599.91 9.97 10751.26 7.57
8 Thrissur 1169.87 0.9 3443.72 10.38 8724.47 7.27
9 Palakkad 1446.3 0.82 2622.44 9.51 6140.34 6.68
10 Malappuram 1380.25 0.92 2201.52 10.94 6721.71 6.47
11 Kozhikode 1197.41 0.97 3040.91 10.94 7699.95 6.81
12 Wayanad 589.19 0.38 350.36 10.66 1500.57 6.78
13 Kannur 1095.67 0.74 2239.47 11.09 6408.23 6.7
14 Kasaragod 978.4 0.44 707.14 11.52 2762.5 7.1
STATE 16788.07 0.81 33829.8 10.25 84584.62 7.02
Primary Secondary Tertiary
Sl. No. District GDDPAnnual Growth
Rate (%) GDDPAnnual Growth
Rate (%) GDDPAnnual
Growth Rate(%)
Source: Department of Economics and Statistic
ANNEXE - 2
213
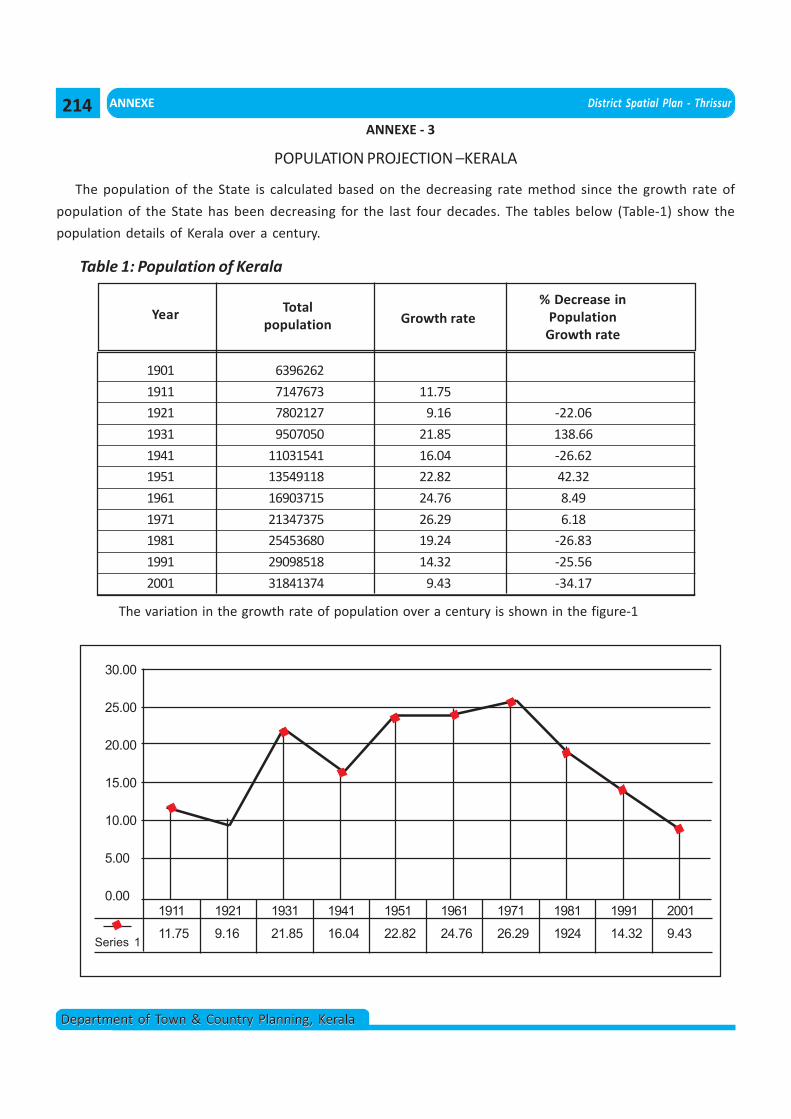
ANNEXE District Spatial Plan - Thrissur
Department of Town & Country Planning, KeralaDepartment of Town & Country Planning, Kerala
POPULATION PROJECTION –KERALA
The population of the State is calculated based on the decreasing rate method since the growth rate of
population of the State has been decreasing for the last four decades. The tables below (Table-1) show the
population details of Kerala over a century.
Table 1: Population of Kerala
1901 6396262
1911 7147673 11.75
1921 7802127 9.16 -22.06
1931 9507050 21.85 138.66
1941 11031541 16.04 -26.62
1951 13549118 22.82 42.32
1961 16903715 24.76 8.49
1971 21347375 26.29 6.18
1981 25453680 19.24 -26.83
1991 29098518 14.32 -25.56
2001 31841374 9.43 -34.17
Year Totalpopulation Growth rate
% Decrease inPopulation
Growth rate
30.00
25.00
20.00
15.00
10.00
5.00
0.001911 1921 1931 1941 1951 1961 1971 1981 1991 2001
The variation in the growth rate of population over a century is shown in the figure-1
Series 111.75 9.16 21.85 16.04 22.82 24.76 26.29 1924 14.32 9.43
ANNEXE - 3
214
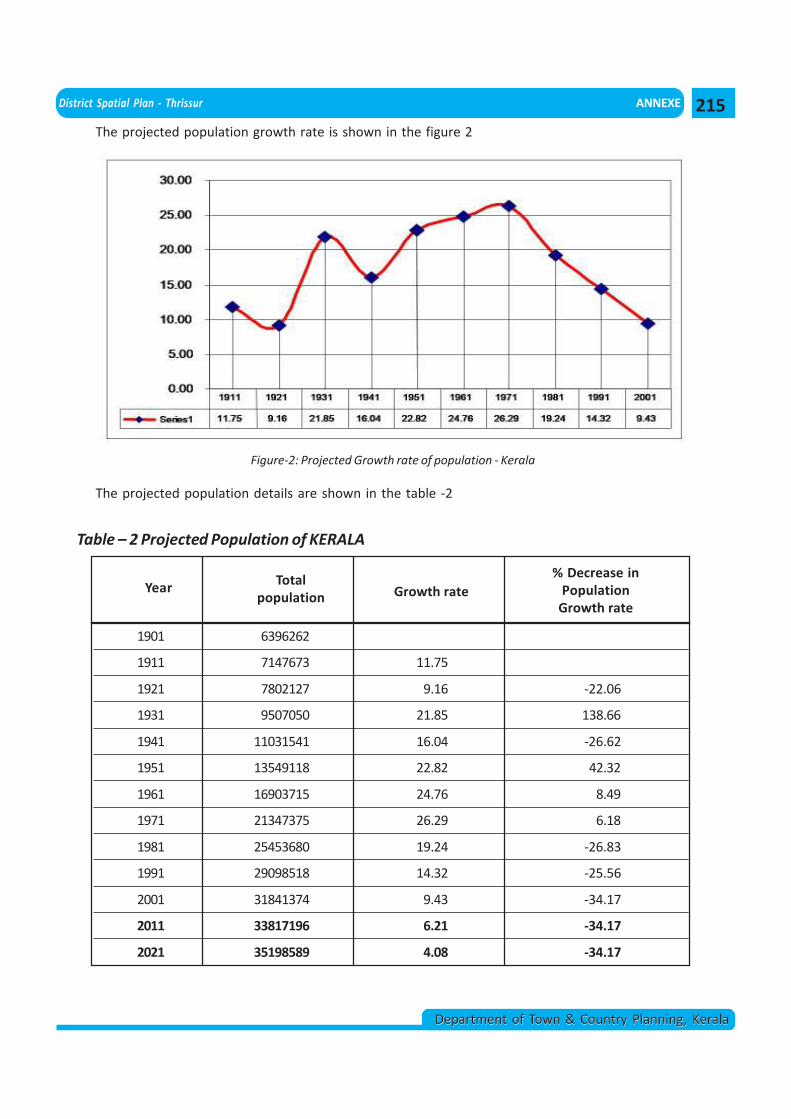
District Spatial Plan - Thrissur ANNEXE
Department of Town & Country Planning, KeralaDepartment of Town & Country Planning, Kerala
The projected population growth rate is shown in the figure 2
Figure-2: Projected Growth rate of population - Kerala
The projected population details are shown in the table -2
Table – 2 Projected Population of KERALA
Year Totalpopulation Growth rate
% Decrease inPopulation
Growth rate
1901 6396262
1911 7147673 11.75
1921 7802127 9.16 -22.06
1931 9507050 21.85 138.66
1941 11031541 16.04 -26.62
1951 13549118 22.82 42.32
1961 16903715 24.76 8.49
1971 21347375 26.29 6.18
1981 25453680 19.24 -26.83
1991 29098518 14.32 -25.56
2001 31841374 9.43 -34.17
2011 33817196 6.21 -34.17
2021 35198589 4.08 -34.17
215
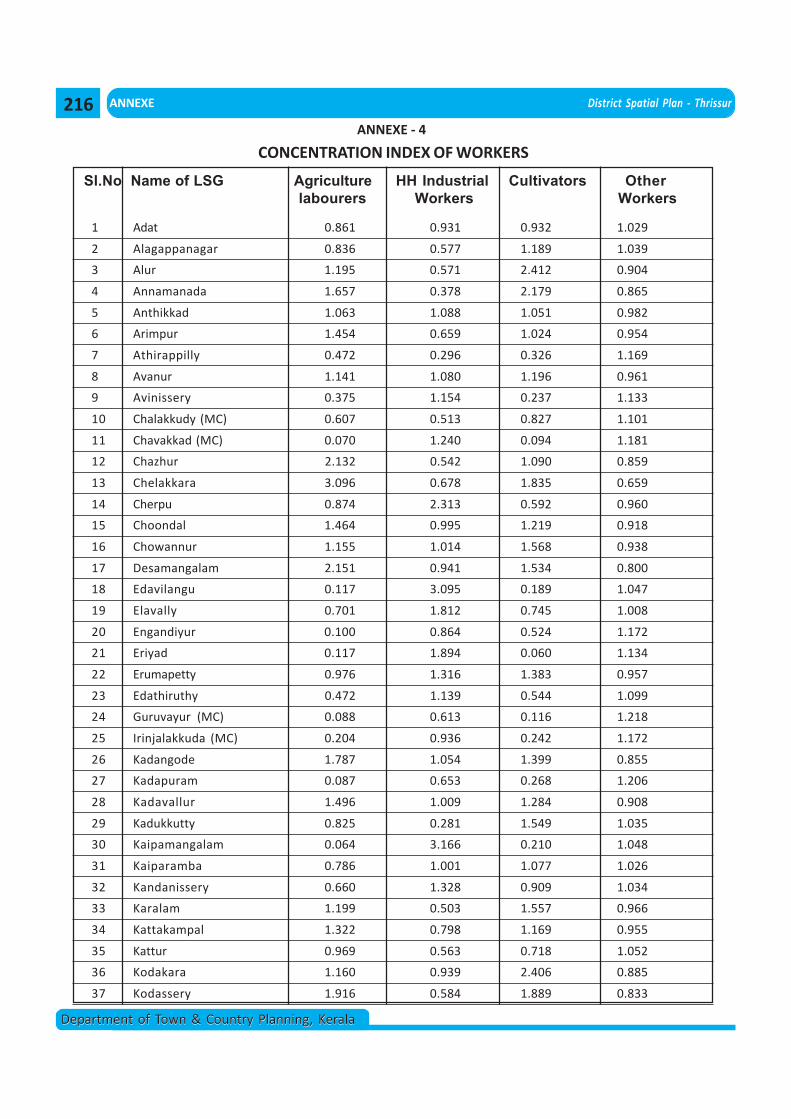
ANNEXE District Spatial Plan - Thrissur
Department of Town & Country Planning, KeralaDepartment of Town & Country Planning, Kerala
CONCENTRATION INDEX OF WORKERS
Sl.No Name of LSG Agriculture HH Industrial Cultivators Otherlabourers Workers Workers
1 Adat 0.861 0.931 0.932 1.029
2 Alagappanagar 0.836 0.577 1.189 1.039
3 Alur 1.195 0.571 2.412 0.904
4 Annamanada 1.657 0.378 2.179 0.865
5 Anthikkad 1.063 1.088 1.051 0.982
6 Arimpur 1.454 0.659 1.024 0.954
7 Athirappilly 0.472 0.296 0.326 1.169
8 Avanur 1.141 1.080 1.196 0.961
9 Avinissery 0.375 1.154 0.237 1.133
10 Chalakkudy (MC) 0.607 0.513 0.827 1.101
11 Chavakkad (MC) 0.070 1.240 0.094 1.181
12 Chazhur 2.132 0.542 1.090 0.859
13 Chelakkara 3.096 0.678 1.835 0.659
14 Cherpu 0.874 2.313 0.592 0.960
15 Choondal 1.464 0.995 1.219 0.918
16 Chowannur 1.155 1.014 1.568 0.938
17 Desamangalam 2.151 0.941 1.534 0.800
18 Edavilangu 0.117 3.095 0.189 1.047
19 Elavally 0.701 1.812 0.745 1.008
20 Engandiyur 0.100 0.864 0.524 1.172
21 Eriyad 0.117 1.894 0.060 1.134
22 Erumapetty 0.976 1.316 1.383 0.957
23 Edathiruthy 0.472 1.139 0.544 1.099
24 Guruvayur (MC) 0.088 0.613 0.116 1.218
25 Irinjalakkuda (MC) 0.204 0.936 0.242 1.172
26 Kadangode 1.787 1.054 1.399 0.855
27 Kadapuram 0.087 0.653 0.268 1.206
28 Kadavallur 1.496 1.009 1.284 0.908
29 Kadukkutty 0.825 0.281 1.549 1.035
30 Kaipamangalam 0.064 3.166 0.210 1.048
31 Kaiparamba 0.786 1.001 1.077 1.026
32 Kandanissery 0.660 1.328 0.909 1.034
33 Karalam 1.199 0.503 1.557 0.966
34 Kattakampal 1.322 0.798 1.169 0.955
35 Kattur 0.969 0.563 0.718 1.052
36 Kodakara 1.160 0.939 2.406 0.885
37 Kodassery 1.916 0.584 1.889 0.833
ANNEXE - 4
216
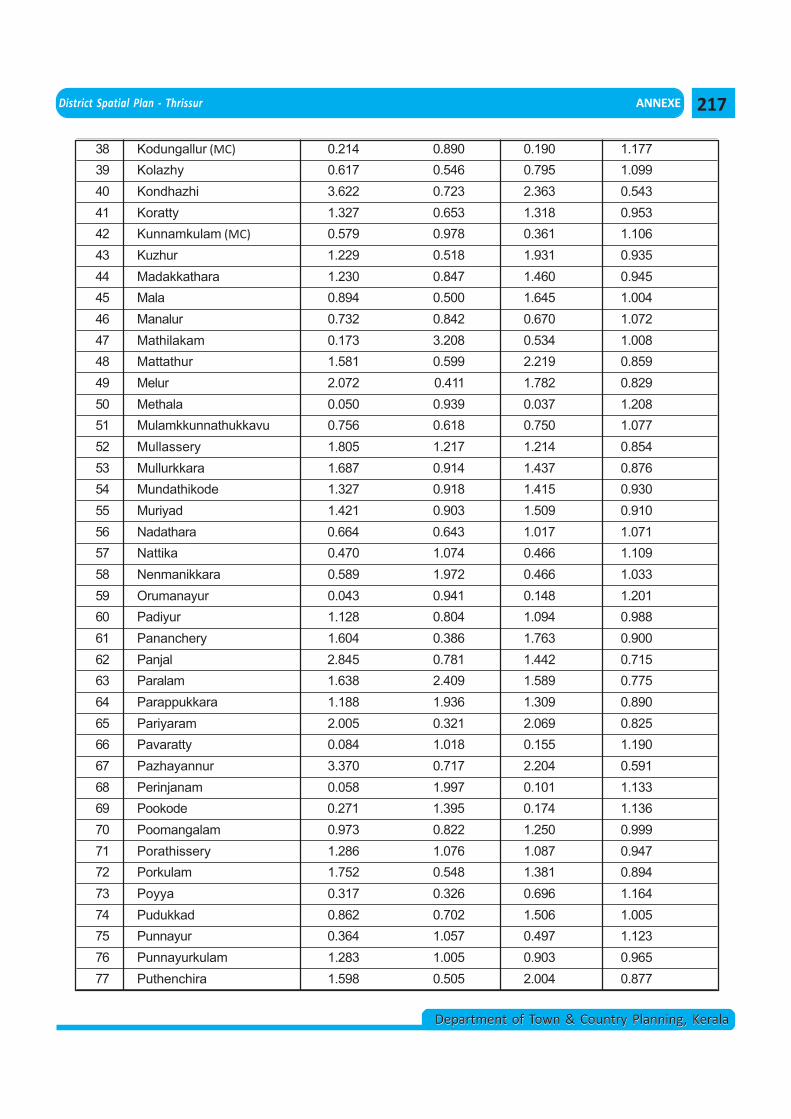
District Spatial Plan - Thrissur ANNEXE
Department of Town & Country Planning, KeralaDepartment of Town & Country Planning, Kerala
38 Kodungallur (MC) 0.214 0.890 0.190 1.17739 Kolazhy 0.617 0.546 0.795 1.09940 Kondhazhi 3.622 0.723 2.363 0.54341 Koratty 1.327 0.653 1.318 0.95342 Kunnamkulam (MC) 0.579 0.978 0.361 1.10643 Kuzhur 1.229 0.518 1.931 0.93544 Madakkathara 1.230 0.847 1.460 0.94545 Mala 0.894 0.500 1.645 1.00446 Manalur 0.732 0.842 0.670 1.07247 Mathilakam 0.173 3.208 0.534 1.00848 Mattathur 1.581 0.599 2.219 0.85949 Melur 2.072 0.411 1.782 0.82950 Methala 0.050 0.939 0.037 1.20851 Mulamkkunnathukkavu 0.756 0.618 0.750 1.07752 Mullassery 1.805 1.217 1.214 0.85453 Mullurkkara 1.687 0.914 1.437 0.87654 Mundathikode 1.327 0.918 1.415 0.93055 Muriyad 1.421 0.903 1.509 0.91056 Nadathara 0.664 0.643 1.017 1.07157 Nattika 0.470 1.074 0.466 1.10958 Nenmanikkara 0.589 1.972 0.466 1.03359 Orumanayur 0.043 0.941 0.148 1.20160 Padiyur 1.128 0.804 1.094 0.98861 Pananchery 1.604 0.386 1.763 0.90062 Panjal 2.845 0.781 1.442 0.71563 Paralam 1.638 2.409 1.589 0.77564 Parappukkara 1.188 1.936 1.309 0.89065 Pariyaram 2.005 0.321 2.069 0.82566 Pavaratty 0.084 1.018 0.155 1.19067 Pazhayannur 3.370 0.717 2.204 0.59168 Perinjanam 0.058 1.997 0.101 1.13369 Pookode 0.271 1.395 0.174 1.13670 Poomangalam 0.973 0.822 1.250 0.99971 Porathissery 1.286 1.076 1.087 0.94772 Porkulam 1.752 0.548 1.381 0.89473 Poyya 0.317 0.326 0.696 1.16474 Pudukkad 0.862 0.702 1.506 1.00575 Punnayur 0.364 1.057 0.497 1.12376 Punnayurkulam 1.283 1.005 0.903 0.96577 Puthenchira 1.598 0.505 2.004 0.877
217
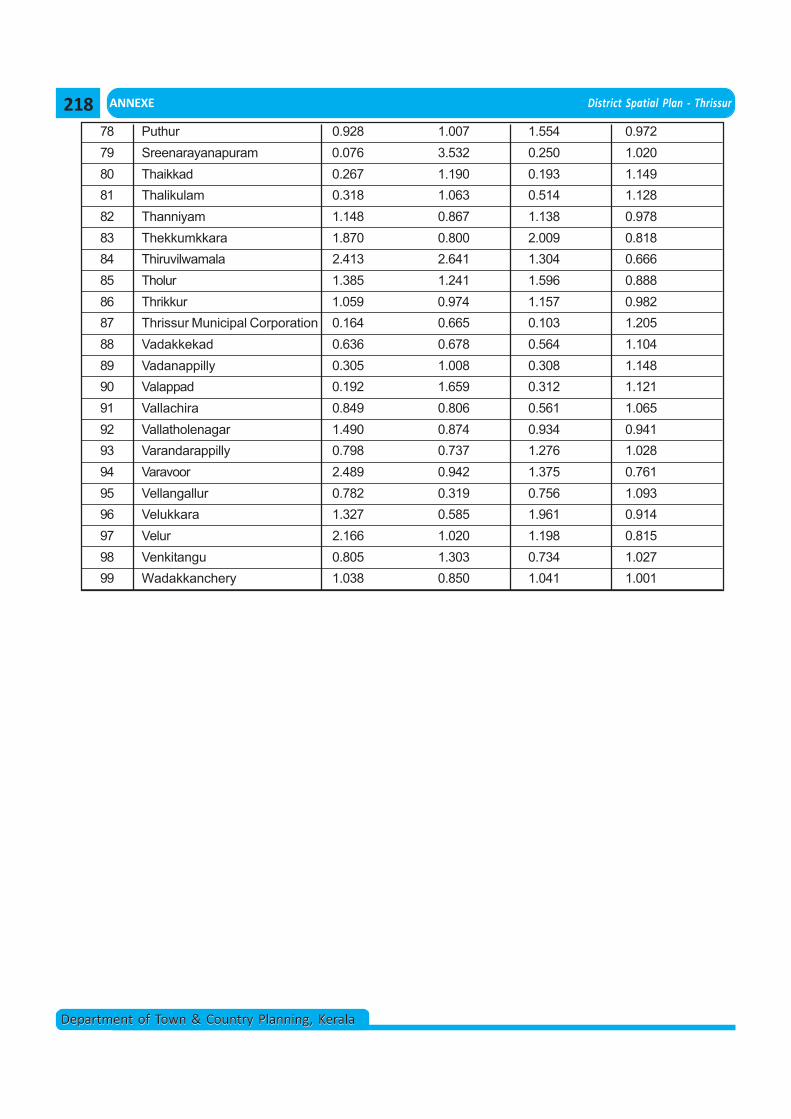
ANNEXE District Spatial Plan - Thrissur
Department of Town & Country Planning, KeralaDepartment of Town & Country Planning, Kerala
78 Puthur 0.928 1.007 1.554 0.97279 Sreenarayanapuram 0.076 3.532 0.250 1.02080 Thaikkad 0.267 1.190 0.193 1.14981 Thalikulam 0.318 1.063 0.514 1.12882 Thanniyam 1.148 0.867 1.138 0.97883 Thekkumkkara 1.870 0.800 2.009 0.81884 Thiruvilwamala 2.413 2.641 1.304 0.66685 Tholur 1.385 1.241 1.596 0.88886 Thrikkur 1.059 0.974 1.157 0.98287 Thrissur Municipal Corporation 0.164 0.665 0.103 1.20588 Vadakkekad 0.636 0.678 0.564 1.10489 Vadanappilly 0.305 1.008 0.308 1.14890 Valappad 0.192 1.659 0.312 1.12191 Vallachira 0.849 0.806 0.561 1.06592 Vallatholenagar 1.490 0.874 0.934 0.94193 Varandarappilly 0.798 0.737 1.276 1.02894 Varavoor 2.489 0.942 1.375 0.76195 Vellangallur 0.782 0.319 0.756 1.09396 Velukkara 1.327 0.585 1.961 0.91497 Velur 2.166 1.020 1.198 0.81598 Venkitangu 0.805 1.303 0.734 1.02799 Wadakkanchery 1.038 0.850 1.041 1.001
218
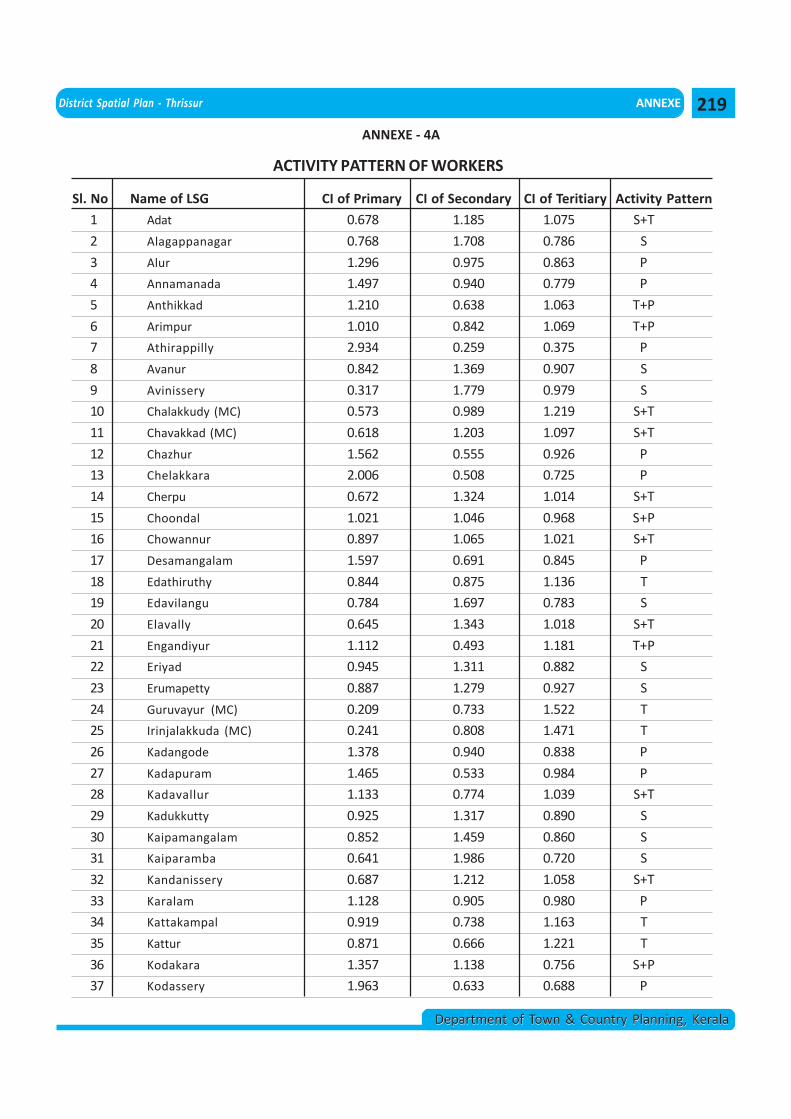
District Spatial Plan - Thrissur ANNEXE
Department of Town & Country Planning, KeralaDepartment of Town & Country Planning, Kerala
ACTIVITY PATTERN OF WORKERS
Sl. No Name of LSG CI of Primary CI of Secondary CI of Teritiary Activity Pattern
1 Adat 0.678 1.185 1.075 S+T
2 Alagappanagar 0.768 1.708 0.786 S
3 Alur 1.296 0.975 0.863 P
4 Annamanada 1.497 0.940 0.779 P
5 Anthikkad 1.210 0.638 1.063 T+P
6 Arimpur 1.010 0.842 1.069 T+P
7 Athirappilly 2.934 0.259 0.375 P
8 Avanur 0.842 1.369 0.907 S
9 Avinissery 0.317 1.779 0.979 S
10 Chalakkudy (MC) 0.573 0.989 1.219 S+T
11 Chavakkad (MC) 0.618 1.203 1.097 S+T
12 Chazhur 1.562 0.555 0.926 P
13 Chelakkara 2.006 0.508 0.725 P
14 Cherpu 0.672 1.324 1.014 S+T
15 Choondal 1.021 1.046 0.968 S+P
16 Chowannur 0.897 1.065 1.021 S+T
17 Desamangalam 1.597 0.691 0.845 P
18 Edathiruthy 0.844 0.875 1.136 T
19 Edavilangu 0.784 1.697 0.783 S
20 Elavally 0.645 1.343 1.018 S+T
21 Engandiyur 1.112 0.493 1.181 T+P
22 Eriyad 0.945 1.311 0.882 S
23 Erumapetty 0.887 1.279 0.927 S
24 Guruvayur (MC) 0.209 0.733 1.522 T
25 Irinjalakkuda (MC) 0.241 0.808 1.471 T
26 Kadangode 1.378 0.940 0.838 P
27 Kadapuram 1.465 0.533 0.984 P
28 Kadavallur 1.133 0.774 1.039 S+T
29 Kadukkutty 0.925 1.317 0.890 S
30 Kaipamangalam 0.852 1.459 0.860 S
31 Kaiparamba 0.641 1.986 0.720 S
32 Kandanissery 0.687 1.212 1.058 S+T
33 Karalam 1.128 0.905 0.980 P
34 Kattakampal 0.919 0.738 1.163 T
35 Kattur 0.871 0.666 1.221 T
36 Kodakara 1.357 1.138 0.756 S+P
37 Kodassery 1.963 0.633 0.688 P
ANNEXE - 4A
219
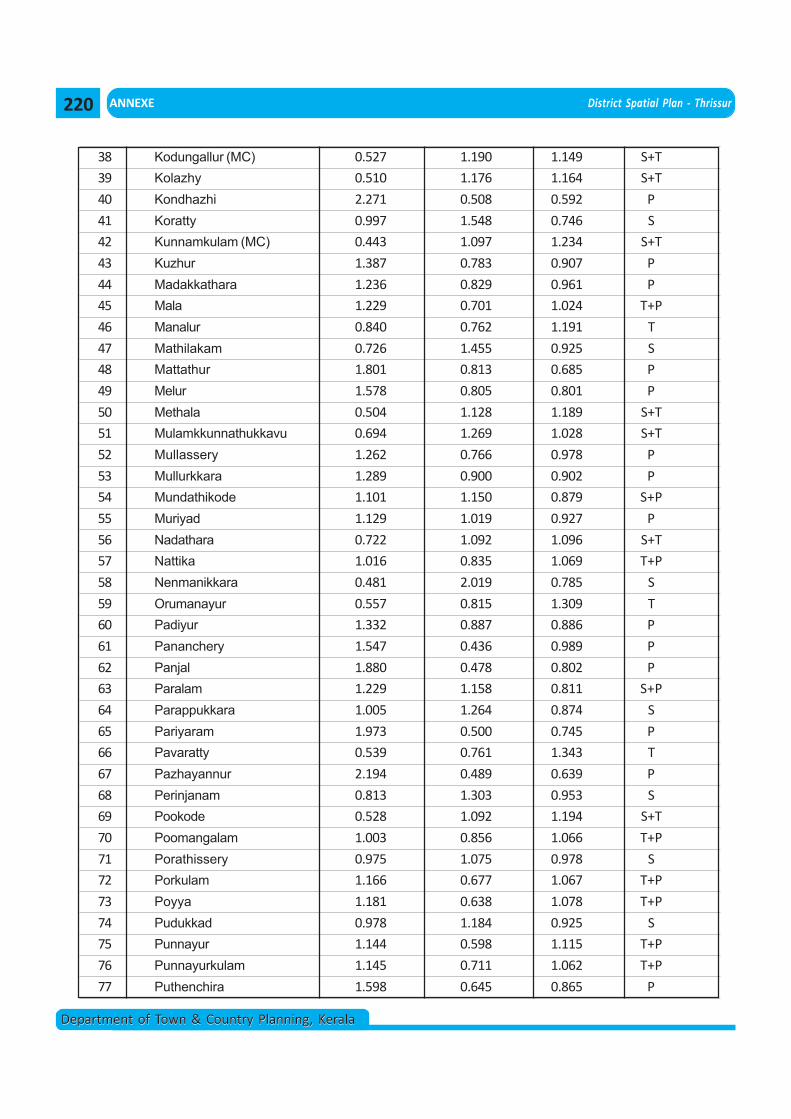
ANNEXE District Spatial Plan - Thrissur
Department of Town & Country Planning, KeralaDepartment of Town & Country Planning, Kerala
38 Kodungallur (MC) 0.527 1.190 1.149 S+T
39 Kolazhy 0.510 1.176 1.164 S+T
40 Kondhazhi 2.271 0.508 0.592 P
41 Koratty 0.997 1.548 0.746 S
42 Kunnamkulam (MC) 0.443 1.097 1.234 S+T
43 Kuzhur 1.387 0.783 0.907 P
44 Madakkathara 1.236 0.829 0.961 P
45 Mala 1.229 0.701 1.024 T+P
46 Manalur 0.840 0.762 1.191 T
47 Mathilakam 0.726 1.455 0.925 S
48 Mattathur 1.801 0.813 0.685 P
49 Melur 1.578 0.805 0.801 P
50 Methala 0.504 1.128 1.189 S+T
51 Mulamkkunnathukkavu 0.694 1.269 1.028 S+T
52 Mullassery 1.262 0.766 0.978 P
53 Mullurkkara 1.289 0.900 0.902 P
54 Mundathikode 1.101 1.150 0.879 S+P
55 Muriyad 1.129 1.019 0.927 P
56 Nadathara 0.722 1.092 1.096 S+T
57 Nattika 1.016 0.835 1.069 T+P
58 Nenmanikkara 0.481 2.019 0.785 S
59 Orumanayur 0.557 0.815 1.309 T
60 Padiyur 1.332 0.887 0.886 P
61 Pananchery 1.547 0.436 0.989 P
62 Panjal 1.880 0.478 0.802 P
63 Paralam 1.229 1.158 0.811 S+P
64 Parappukkara 1.005 1.264 0.874 S
65 Pariyaram 1.973 0.500 0.745 P
66 Pavaratty 0.539 0.761 1.343 T
67 Pazhayannur 2.194 0.489 0.639 P
68 Perinjanam 0.813 1.303 0.953 S
69 Pookode 0.528 1.092 1.194 S+T
70 Poomangalam 1.003 0.856 1.066 T+P
71 Porathissery 0.975 1.075 0.978 S
72 Porkulam 1.166 0.677 1.067 T+P
73 Poyya 1.181 0.638 1.078 T+P
74 Pudukkad 0.978 1.184 0.925 S
75 Punnayur 1.144 0.598 1.115 T+P
76 Punnayurkulam 1.145 0.711 1.062 T+P
77 Puthenchira 1.598 0.645 0.865 P
220
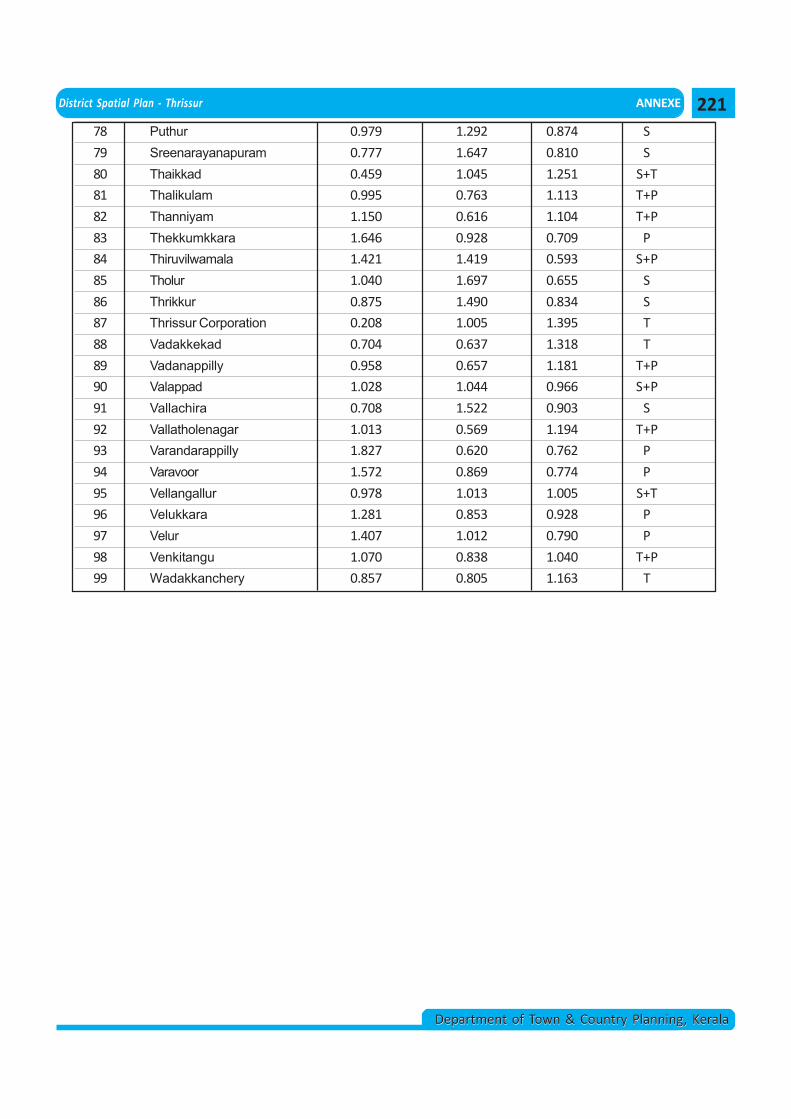
District Spatial Plan - Thrissur ANNEXE
Department of Town & Country Planning, KeralaDepartment of Town & Country Planning, Kerala
78 Puthur 0.979 1.292 0.874 S
79 Sreenarayanapuram 0.777 1.647 0.810 S
80 Thaikkad 0.459 1.045 1.251 S+T
81 Thalikulam 0.995 0.763 1.113 T+P
82 Thanniyam 1.150 0.616 1.104 T+P
83 Thekkumkkara 1.646 0.928 0.709 P
84 Thiruvilwamala 1.421 1.419 0.593 S+P
85 Tholur 1.040 1.697 0.655 S
86 Thrikkur 0.875 1.490 0.834 S
87 Thrissur Corporation 0.208 1.005 1.395 T
88 Vadakkekad 0.704 0.637 1.318 T
89 Vadanappilly 0.958 0.657 1.181 T+P
90 Valappad 1.028 1.044 0.966 S+P
91 Vallachira 0.708 1.522 0.903 S
92 Vallatholenagar 1.013 0.569 1.194 T+P
93 Varandarappilly 1.827 0.620 0.762 P
94 Varavoor 1.572 0.869 0.774 P
95 Vellangallur 0.978 1.013 1.005 S+T
96 Velukkara 1.281 0.853 0.928 P
97 Velur 1.407 1.012 0.790 P
98 Venkitangu 1.070 0.838 1.040 T+P
99 Wadakkanchery 0.857 0.805 1.163 T
221
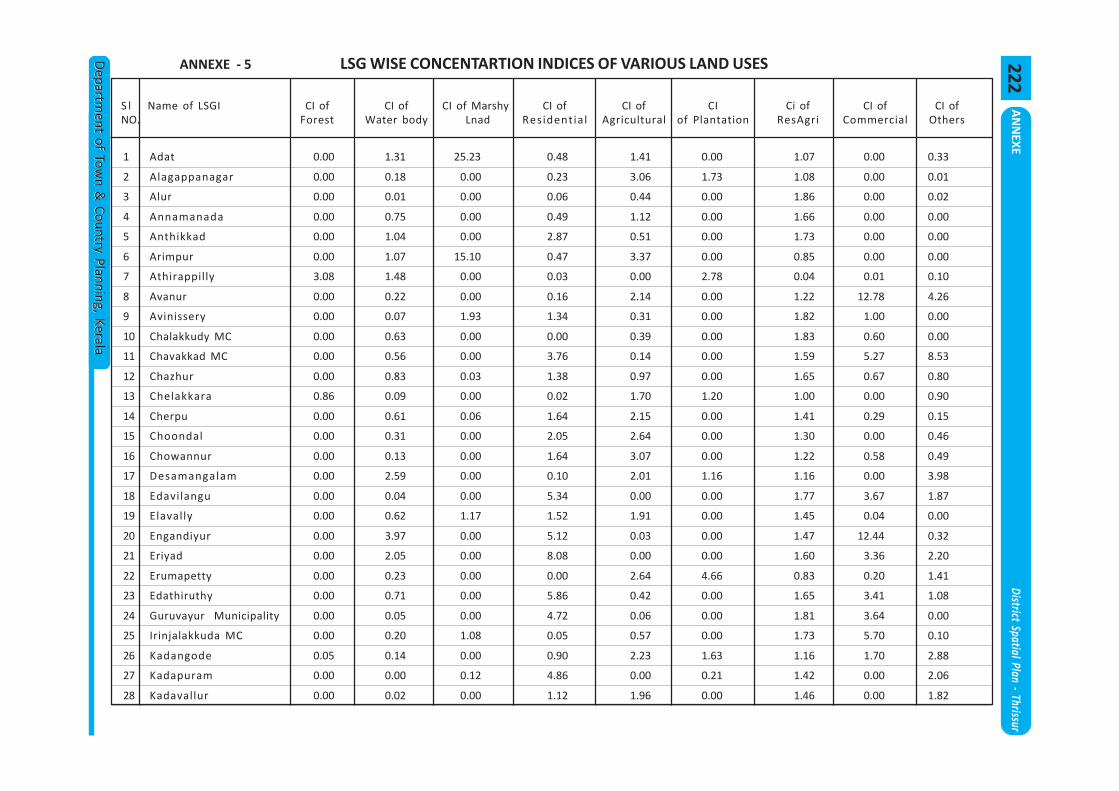
AN
NEXE
District Spatial Plan - Thrissur
Departm
ent of Town &
Country Planning, KeralaD
epartment of Tow
n & Country Planning, Kerala
1 Adat 0.00 1.31 25.23 0.48 1.41 0.00 1.07 0.00 0.33
2 Alagappanagar 0.00 0.18 0.00 0.23 3.06 1.73 1.08 0.00 0.01
3 Alur 0.00 0.01 0.00 0.06 0.44 0.00 1.86 0.00 0.02
4 Annamanada 0.00 0.75 0.00 0.49 1.12 0.00 1.66 0.00 0.00
5 Anthikkad 0.00 1.04 0.00 2.87 0.51 0.00 1.73 0.00 0.00
6 Arimpur 0.00 1.07 15.10 0.47 3.37 0.00 0.85 0.00 0.00
7 Athirappilly 3.08 1.48 0.00 0.03 0.00 2.78 0.04 0.01 0.10
8 Avanur 0.00 0.22 0.00 0.16 2.14 0.00 1.22 12.78 4.26
9 Avinissery 0.00 0.07 1.93 1.34 0.31 0.00 1.82 1.00 0.00
10 Chalakkudy MC 0.00 0.63 0.00 0.00 0.39 0.00 1.83 0.60 0.00
11 Chavakkad MC 0.00 0.56 0.00 3.76 0.14 0.00 1.59 5.27 8.53
12 Chazhur 0.00 0.83 0.03 1.38 0.97 0.00 1.65 0.67 0.80
13 Chelakkara 0.86 0.09 0.00 0.02 1.70 1.20 1.00 0.00 0.90
14 Cherpu 0.00 0.61 0.06 1.64 2.15 0.00 1.41 0.29 0.15
15 Choondal 0.00 0.31 0.00 2.05 2.64 0.00 1.30 0.00 0.46
16 Chowannur 0.00 0.13 0.00 1.64 3.07 0.00 1.22 0.58 0.49
17 Desamangalam 0.00 2.59 0.00 0.10 2.01 1.16 1.16 0.00 3.98
18 Edavilangu 0.00 0.04 0.00 5.34 0.00 0.00 1.77 3.67 1.87
19 Elavally 0.00 0.62 1.17 1.52 1.91 0.00 1.45 0.04 0.00
20 Engandiyur 0.00 3.97 0.00 5.12 0.03 0.00 1.47 12.44 0.32
21 Eriyad 0.00 2.05 0.00 8.08 0.00 0.00 1.60 3.36 2.20
22 Erumapetty 0.00 0.23 0.00 0.00 2.64 4.66 0.83 0.20 1.41
23 Edathiruthy 0.00 0.71 0.00 5.86 0.42 0.00 1.65 3.41 1.08
24 Guruvayur Municipality 0.00 0.05 0.00 4.72 0.06 0.00 1.81 3.64 0.00
25 Irinjalakkuda MC 0.00 0.20 1.08 0.05 0.57 0.00 1.73 5.70 0.10
26 Kadangode 0.05 0.14 0.00 0.90 2.23 1.63 1.16 1.70 2.88
27 Kadapuram 0.00 0.00 0.12 4.86 0.00 0.21 1.42 0.00 2.06
28 Kadavallur 0.00 0.02 0.00 1.12 1.96 0.00 1.46 0.00 1.82
S l Name of LSGI CI of CI of CI of Marshy CI of CI of CI Ci of CI of CI ofNO. Forest Water body Lnad Residential Agricultural of Plantation ResAgri Commercial Others
LSG WISE CONCENTARTION INDICES OF VARIOUS LAND USESANNEXE - 5 222
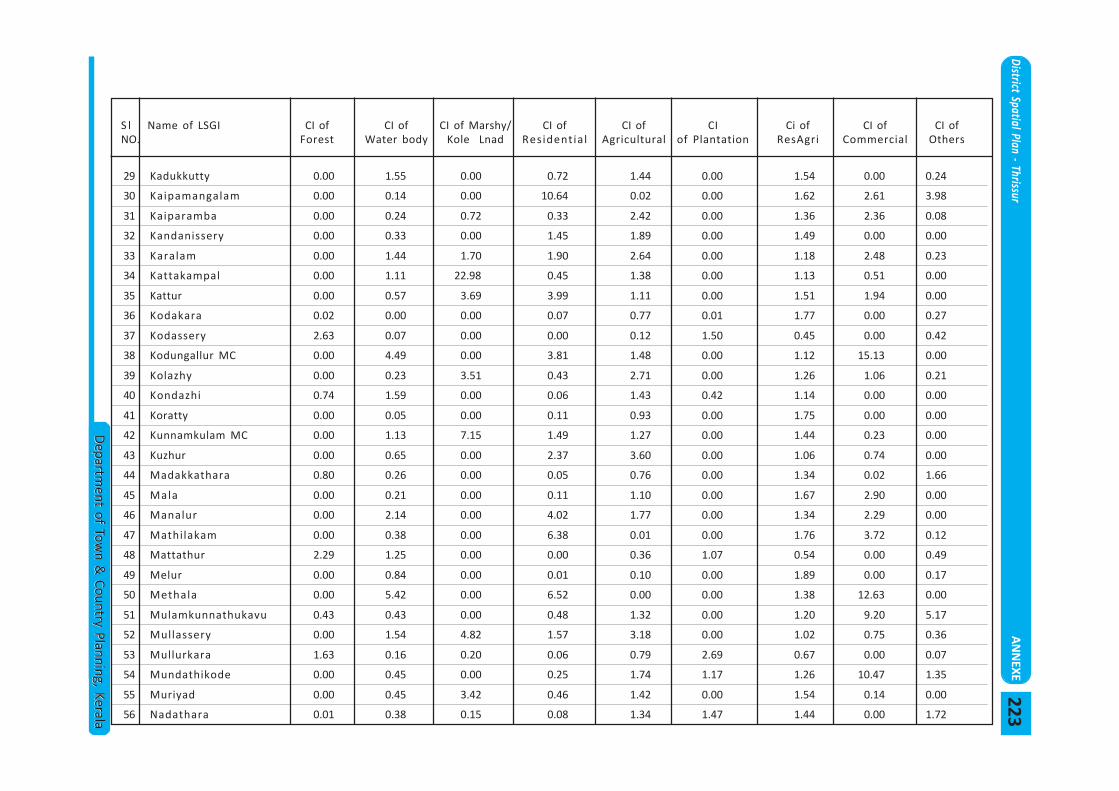
District Spatial Plan - ThrissurA
NN
EXE
Departm
ent of Town &
Country Planning, KeralaD
epartment of Tow
n & Country Planning, Kerala
S l Name of LSGI CI of CI of CI of Marshy/ CI of CI of CI Ci of CI of CI ofNO. Forest Water body Kole Lnad Residential Agricultural of Plantation ResAgri Commercial Others
29 Kadukkutty 0.00 1.55 0.00 0.72 1.44 0.00 1.54 0.00 0.24
30 Kaipamangalam 0.00 0.14 0.00 10.64 0.02 0.00 1.62 2.61 3.98
31 Kaiparamba 0.00 0.24 0.72 0.33 2.42 0.00 1.36 2.36 0.08
32 Kandanissery 0.00 0.33 0.00 1.45 1.89 0.00 1.49 0.00 0.00
33 Karalam 0.00 1.44 1.70 1.90 2.64 0.00 1.18 2.48 0.23
34 Kattakampal 0.00 1.11 22.98 0.45 1.38 0.00 1.13 0.51 0.00
35 Kattur 0.00 0.57 3.69 3.99 1.11 0.00 1.51 1.94 0.00
36 Kodakara 0.02 0.00 0.00 0.07 0.77 0.01 1.77 0.00 0.27
37 Kodassery 2.63 0.07 0.00 0.00 0.12 1.50 0.45 0.00 0.42
38 Kodungallur MC 0.00 4.49 0.00 3.81 1.48 0.00 1.12 15.13 0.00
39 Kolazhy 0.00 0.23 3.51 0.43 2.71 0.00 1.26 1.06 0.21
40 Kondazhi 0.74 1.59 0.00 0.06 1.43 0.42 1.14 0.00 0.00
41 Koratty 0.00 0.05 0.00 0.11 0.93 0.00 1.75 0.00 0.00
42 Kunnamkulam MC 0.00 1.13 7.15 1.49 1.27 0.00 1.44 0.23 0.00
43 Kuzhur 0.00 0.65 0.00 2.37 3.60 0.00 1.06 0.74 0.00
44 Madakkathara 0.80 0.26 0.00 0.05 0.76 0.00 1.34 0.02 1.66
45 Mala 0.00 0.21 0.00 0.11 1.10 0.00 1.67 2.90 0.00
46 Manalur 0.00 2.14 0.00 4.02 1.77 0.00 1.34 2.29 0.00
47 Mathilakam 0.00 0.38 0.00 6.38 0.01 0.00 1.76 3.72 0.12
48 Mattathur 2.29 1.25 0.00 0.00 0.36 1.07 0.54 0.00 0.49
49 Melur 0.00 0.84 0.00 0.01 0.10 0.00 1.89 0.00 0.17
50 Methala 0.00 5.42 0.00 6.52 0.00 0.00 1.38 12.63 0.00
51 Mulamkunnathukavu 0.43 0.43 0.00 0.48 1.32 0.00 1.20 9.20 5.17
52 Mullassery 0.00 1.54 4.82 1.57 3.18 0.00 1.02 0.75 0.36
53 Mullurkara 1.63 0.16 0.20 0.06 0.79 2.69 0.67 0.00 0.07
54 Mundathikode 0.00 0.45 0.00 0.25 1.74 1.17 1.26 10.47 1.35
55 Muriyad 0.00 0.45 3.42 0.46 1.42 0.00 1.54 0.14 0.00
56 Nadathara 0.01 0.38 0.15 0.08 1.34 1.47 1.44 0.00 1.72
223
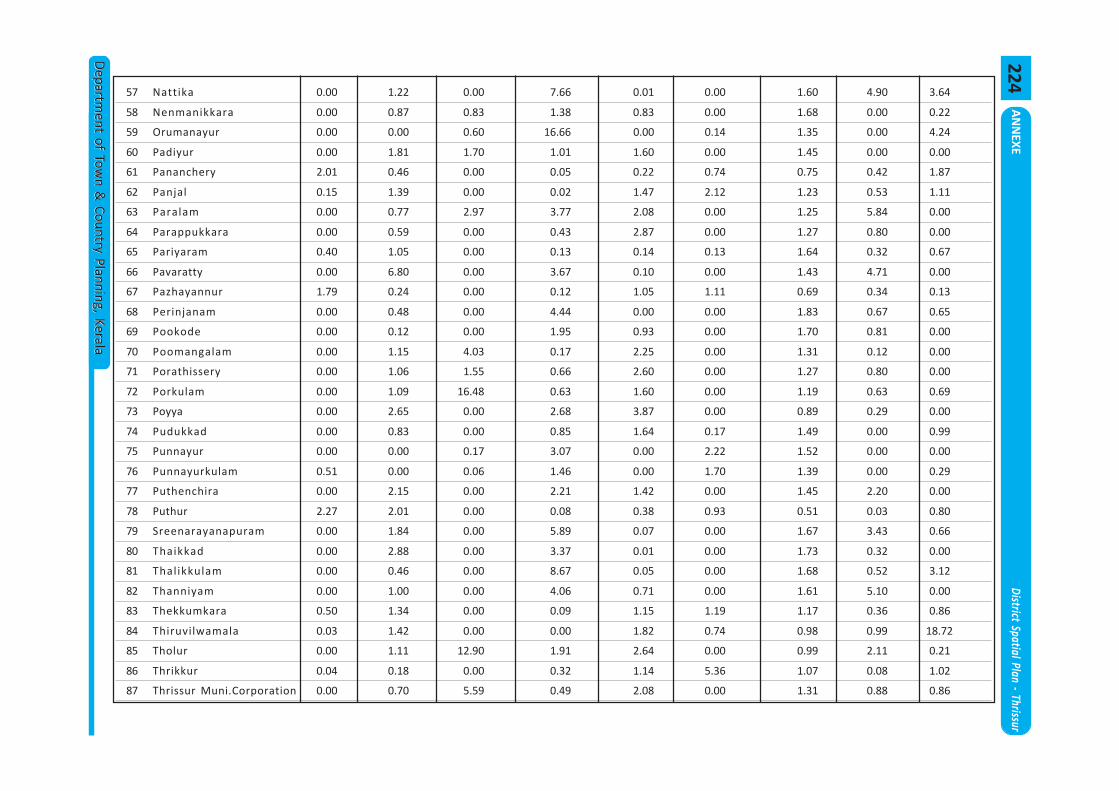
AN
NEXE
District Spatial Plan - Thrissur
Departm
ent of Town &
Country Planning, KeralaD
epartment of Tow
n & Country Planning, Kerala
57 Nattika 0.00 1.22 0.00 7.66 0.01 0.00 1.60 4.90 3.64
58 Nenmanikkara 0.00 0.87 0.83 1.38 0.83 0.00 1.68 0.00 0.22
59 Orumanayur 0.00 0.00 0.60 16.66 0.00 0.14 1.35 0.00 4.24
60 Padiyur 0.00 1.81 1.70 1.01 1.60 0.00 1.45 0.00 0.00
61 Pananchery 2.01 0.46 0.00 0.05 0.22 0.74 0.75 0.42 1.87
62 Panjal 0.15 1.39 0.00 0.02 1.47 2.12 1.23 0.53 1.11
63 Paralam 0.00 0.77 2.97 3.77 2.08 0.00 1.25 5.84 0.00
64 Parappukkara 0.00 0.59 0.00 0.43 2.87 0.00 1.27 0.80 0.00
65 Pariyaram 0.40 1.05 0.00 0.13 0.14 0.13 1.64 0.32 0.67
66 Pavaratty 0.00 6.80 0.00 3.67 0.10 0.00 1.43 4.71 0.00
67 Pazhayannur 1.79 0.24 0.00 0.12 1.05 1.11 0.69 0.34 0.13
68 Perinjanam 0.00 0.48 0.00 4.44 0.00 0.00 1.83 0.67 0.65
69 Pookode 0.00 0.12 0.00 1.95 0.93 0.00 1.70 0.81 0.00
70 Poomangalam 0.00 1.15 4.03 0.17 2.25 0.00 1.31 0.12 0.00
71 Porathissery 0.00 1.06 1.55 0.66 2.60 0.00 1.27 0.80 0.00
72 Porkulam 0.00 1.09 16.48 0.63 1.60 0.00 1.19 0.63 0.69
73 Poyya 0.00 2.65 0.00 2.68 3.87 0.00 0.89 0.29 0.00
74 Pudukkad 0.00 0.83 0.00 0.85 1.64 0.17 1.49 0.00 0.99
75 Punnayur 0.00 0.00 0.17 3.07 0.00 2.22 1.52 0.00 0.00
76 Punnayurkulam 0.51 0.00 0.06 1.46 0.00 1.70 1.39 0.00 0.29
77 Puthenchira 0.00 2.15 0.00 2.21 1.42 0.00 1.45 2.20 0.00
78 Puthur 2.27 2.01 0.00 0.08 0.38 0.93 0.51 0.03 0.80
79 Sreenarayanapuram 0.00 1.84 0.00 5.89 0.07 0.00 1.67 3.43 0.66
80 Thaikkad 0.00 2.88 0.00 3.37 0.01 0.00 1.73 0.32 0.00
81 Thalikkulam 0.00 0.46 0.00 8.67 0.05 0.00 1.68 0.52 3.12
82 Thanniyam 0.00 1.00 0.00 4.06 0.71 0.00 1.61 5.10 0.00
83 Thekkumkara 0.50 1.34 0.00 0.09 1.15 1.19 1.17 0.36 0.86
84 Thiruvilwamala 0.03 1.42 0.00 0.00 1.82 0.74 0.98 0.99 18.72
85 Tholur 0.00 1.11 12.90 1.91 2.64 0.00 0.99 2.11 0.21
86 Thrikkur 0.04 0.18 0.00 0.32 1.14 5.36 1.07 0.08 1.02
87 Thrissur Muni.Corporation 0.00 0.70 5.59 0.49 2.08 0.00 1.31 0.88 0.86
224
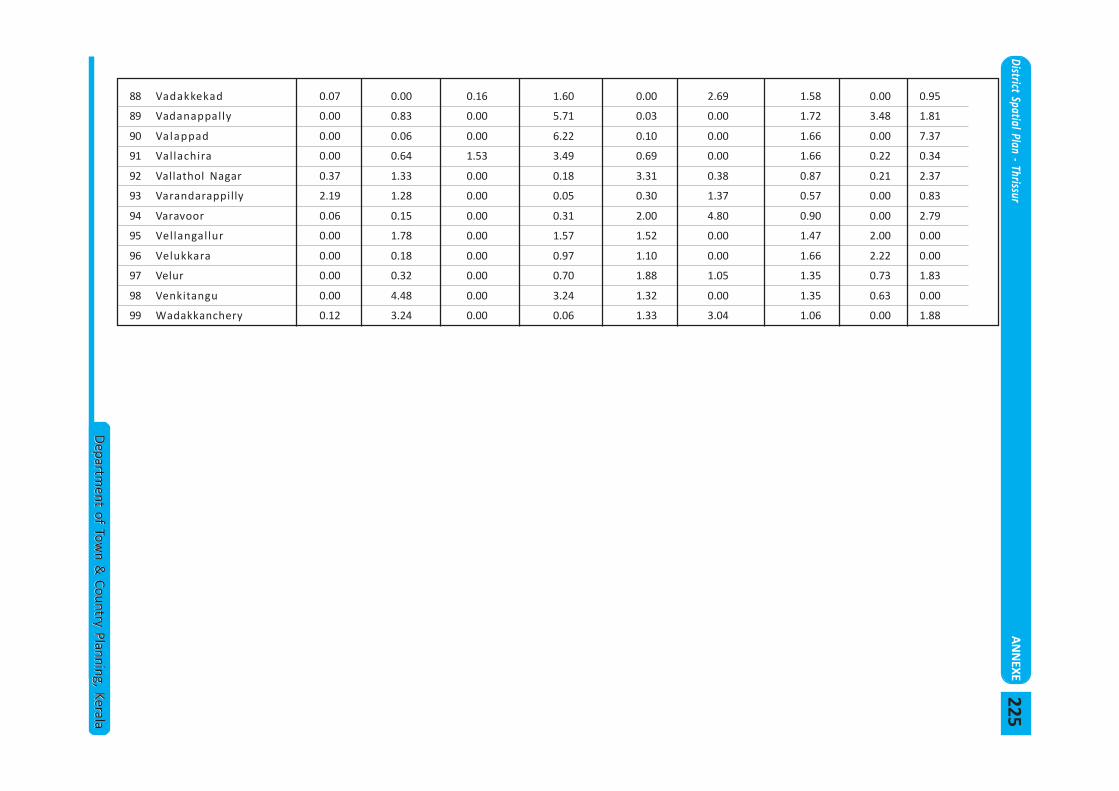
District Spatial Plan - ThrissurA
NN
EXE
Departm
ent of Town &
Country Planning, KeralaD
epartment of Tow
n & Country Planning, Kerala
88 Vadakkekad 0.07 0.00 0.16 1.60 0.00 2.69 1.58 0.00 0.95
89 Vadanappally 0.00 0.83 0.00 5.71 0.03 0.00 1.72 3.48 1.81
90 Valappad 0.00 0.06 0.00 6.22 0.10 0.00 1.66 0.00 7.37
91 Vallachira 0.00 0.64 1.53 3.49 0.69 0.00 1.66 0.22 0.34
92 Vallathol Nagar 0.37 1.33 0.00 0.18 3.31 0.38 0.87 0.21 2.37
93 Varandarappilly 2.19 1.28 0.00 0.05 0.30 1.37 0.57 0.00 0.83
94 Varavoor 0.06 0.15 0.00 0.31 2.00 4.80 0.90 0.00 2.79
95 Vellangallur 0.00 1.78 0.00 1.57 1.52 0.00 1.47 2.00 0.00
96 Velukkara 0.00 0.18 0.00 0.97 1.10 0.00 1.66 2.22 0.00
97 Velur 0.00 0.32 0.00 0.70 1.88 1.05 1.35 0.73 1.83
98 Venkitangu 0.00 4.48 0.00 3.24 1.32 0.00 1.35 0.63 0.00
99 Wadakkanchery 0.12 3.24 0.00 0.06 1.33 3.04 1.06 0.00 1.88
225
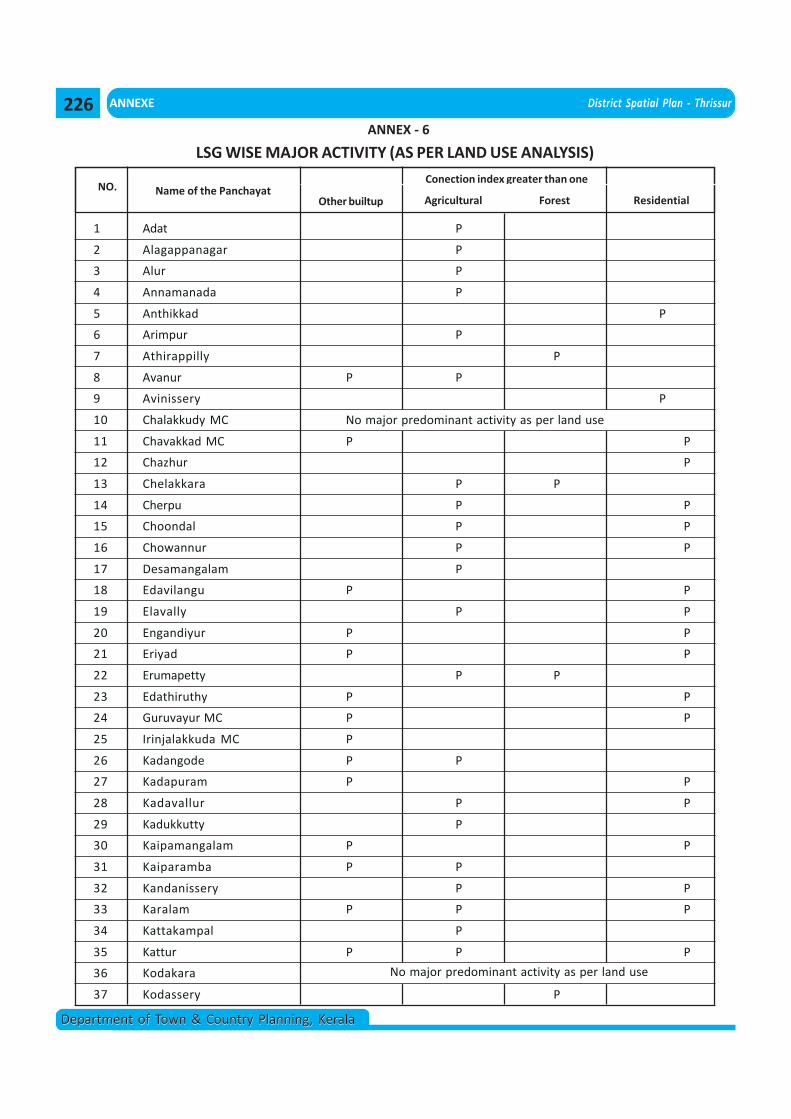
ANNEXE District Spatial Plan - Thrissur
Department of Town & Country Planning, KeralaDepartment of Town & Country Planning, Kerala
LSG WISE MAJOR ACTIVITY (AS PER LAND USE ANALYSIS)
Sl. NO. Name of the PanchayatConection index greater than one
Other builtup Agricultural Forest Residential
1 Adat P
2 Alagappanagar P
3 Alur P
4 Annamanada P
5 Anthikkad P
6 Arimpur P
7 Athirappilly P
8 Avanur P P
9 Avinissery P
10 Chalakkudy MC No major predominant activity as per land use
11 Chavakkad MC P P
12 Chazhur P
13 Chelakkara P P
14 Cherpu P P
15 Choondal P P
16 Chowannur P P
17 Desamangalam P
18 Edavilangu P P
19 Elavally P P
20 Engandiyur P P
21 Eriyad P P
22 Erumapetty P P
23 Edathiruthy P P
24 Guruvayur MC P P
25 Irinjalakkuda MC P
26 Kadangode P P
27 Kadapuram P P
28 Kadavallur P P
29 Kadukkutty P
30 Kaipamangalam P P
31 Kaiparamba P P
32 Kandanissery P P
33 Karalam P P P
34 Kattakampal P
35 Kattur P P P
36 Kodakara
37 Kodassery P
No major predominant activity as per land use
ANNEX - 6
226
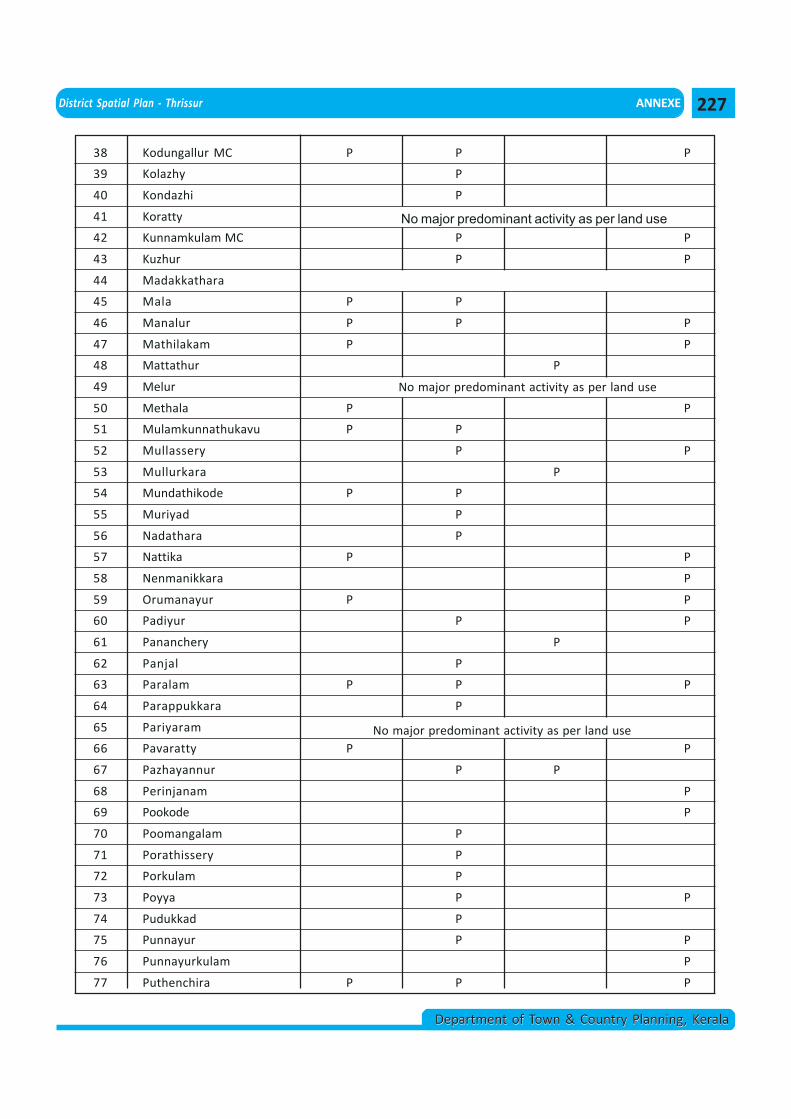
District Spatial Plan - Thrissur ANNEXE
Department of Town & Country Planning, KeralaDepartment of Town & Country Planning, Kerala
38 Kodungallur MC P P P
39 Kolazhy P
40 Kondazhi P
41 Koratty
42 Kunnamkulam MC P P
43 Kuzhur P P
44 Madakkathara
45 Mala P P
46 Manalur P P P
47 Mathilakam P P
48 Mattathur P
49 Melur
50 Methala P P
51 Mulamkunnathukavu P P
52 Mullassery P P
53 Mullurkara P
54 Mundathikode P P
55 Muriyad P
56 Nadathara P
57 Nattika P P
58 Nenmanikkara P
59 Orumanayur P P
60 Padiyur P P
61 Pananchery P
62 Panjal P
63 Paralam P P P
64 Parappukkara P
65 Pariyaram
66 Pavaratty P P
67 Pazhayannur P P
68 Perinjanam P
69 Pookode P
70 Poomangalam P
71 Porathissery P
72 Porkulam P
73 Poyya P P
74 Pudukkad P
75 Punnayur P P
76 Punnayurkulam P
77 Puthenchira P P P
No major predominant activity as per land use
No major predominant activity as per land use
No major predominant activity as per land use
227
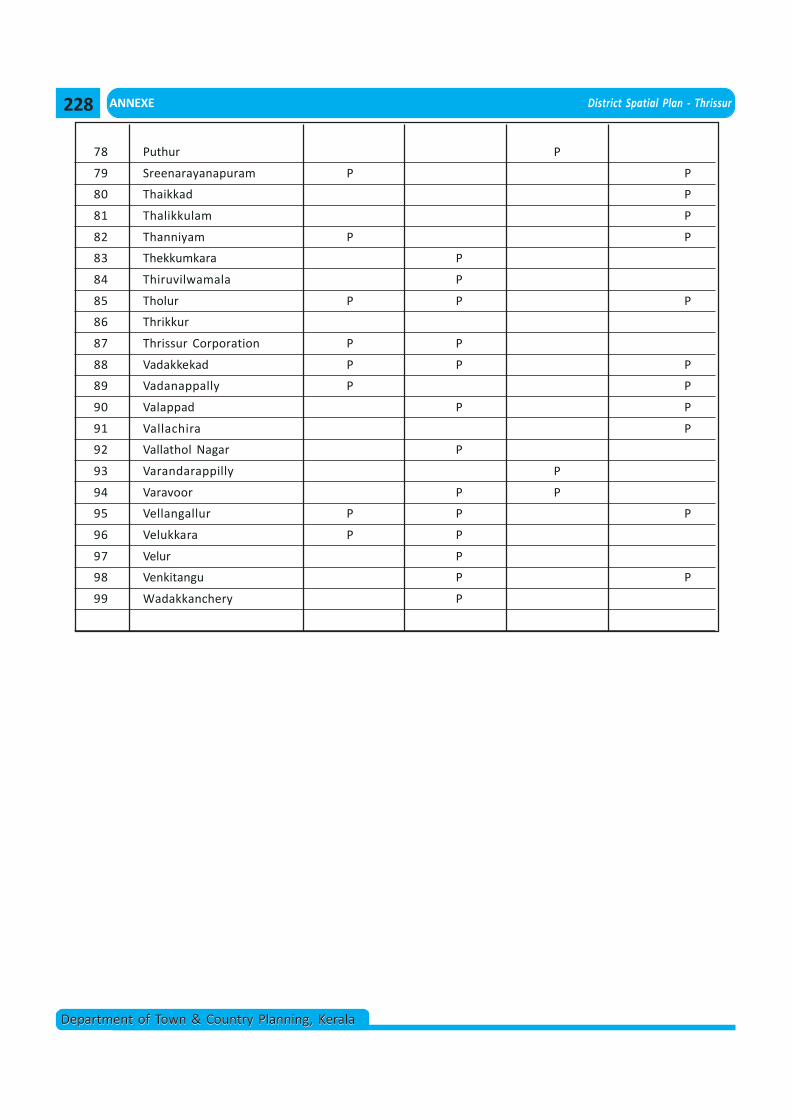
ANNEXE District Spatial Plan - Thrissur
Department of Town & Country Planning, KeralaDepartment of Town & Country Planning, Kerala
78 Puthur P
79 Sreenarayanapuram P P
80 Thaikkad P
81 Thalikkulam P
82 Thanniyam P P
83 Thekkumkara P
84 Thiruvilwamala P
85 Tholur P P P
86 Thrikkur
87 Thrissur Corporation P P
88 Vadakkekad P P P
89 Vadanappally P P
90 Valappad P P
91 Vallachira P
92 Vallathol Nagar P
93 Varandarappilly P
94 Varavoor P P
95 Vellangallur P P P
96 Velukkara P P
97 Velur P
98 Venkitangu P P
99 Wadakkanchery P
228
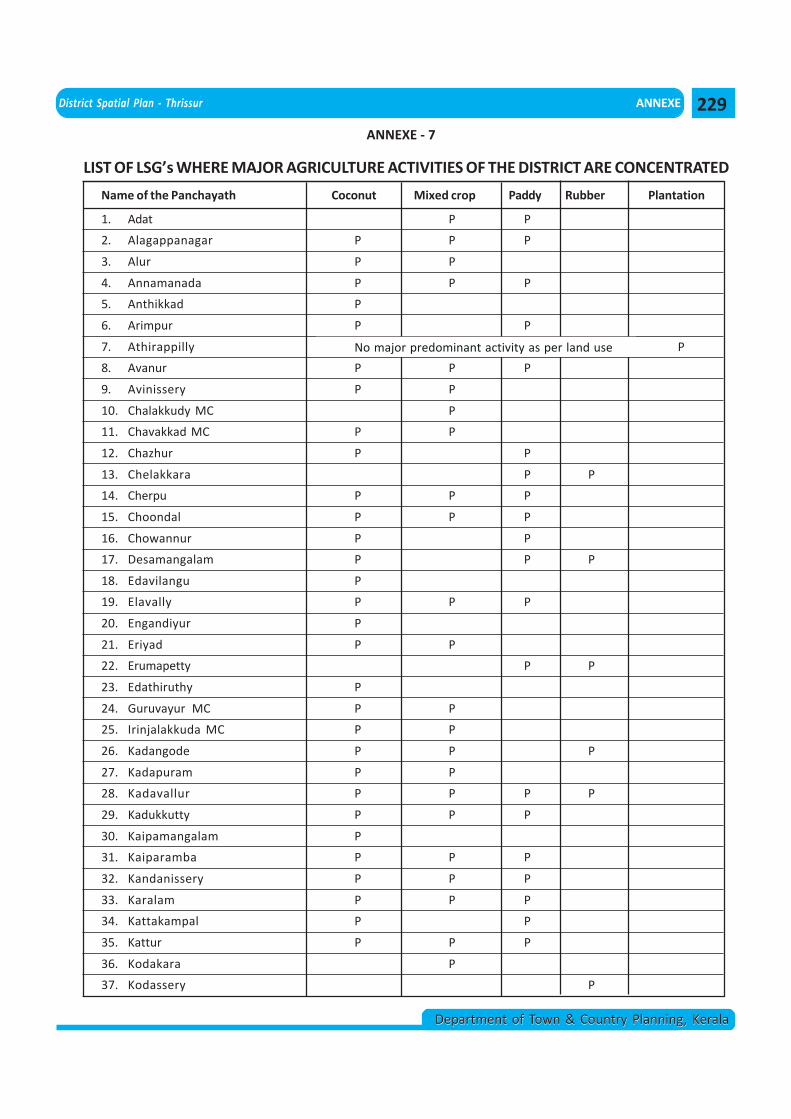
District Spatial Plan - Thrissur ANNEXE
Department of Town & Country Planning, KeralaDepartment of Town & Country Planning, Kerala
LIST OF LSG’s WHERE MAJOR AGRICULTURE ACTIVITIES OF THE DISTRICT ARE CONCENTRATED
Name of the Panchayath Coconut Mixed crop Paddy Rubber Plantation
1. Adat P P
2. Alagappanagar P P P
3. Alur P P
4. Annamanada P P P
5. Anthikkad P
6. Arimpur P P
7. Athirappilly P
8. Avanur P P P
9. Avinissery P P
10. Chalakkudy MC P
11. Chavakkad MC P P
12. Chazhur P P
13. Chelakkara P P
14. Cherpu P P P
15. Choondal P P P
16. Chowannur P P
17. Desamangalam P P P
18. Edavilangu P
19. Elavally P P P
20. Engandiyur P
21. Eriyad P P
22. Erumapetty P P
23. Edathiruthy P
24. Guruvayur MC P P
25. Irinjalakkuda MC P P
26. Kadangode P P P
27. Kadapuram P P
28. Kadavallur P P P P
29. Kadukkutty P P P
30. Kaipamangalam P
31. Kaiparamba P P P
32. Kandanissery P P P
33. Karalam P P P
34. Kattakampal P P
35. Kattur P P P
36. Kodakara P
37. Kodassery P
No major predominant activity as per land use
ANNEXE - 7
229
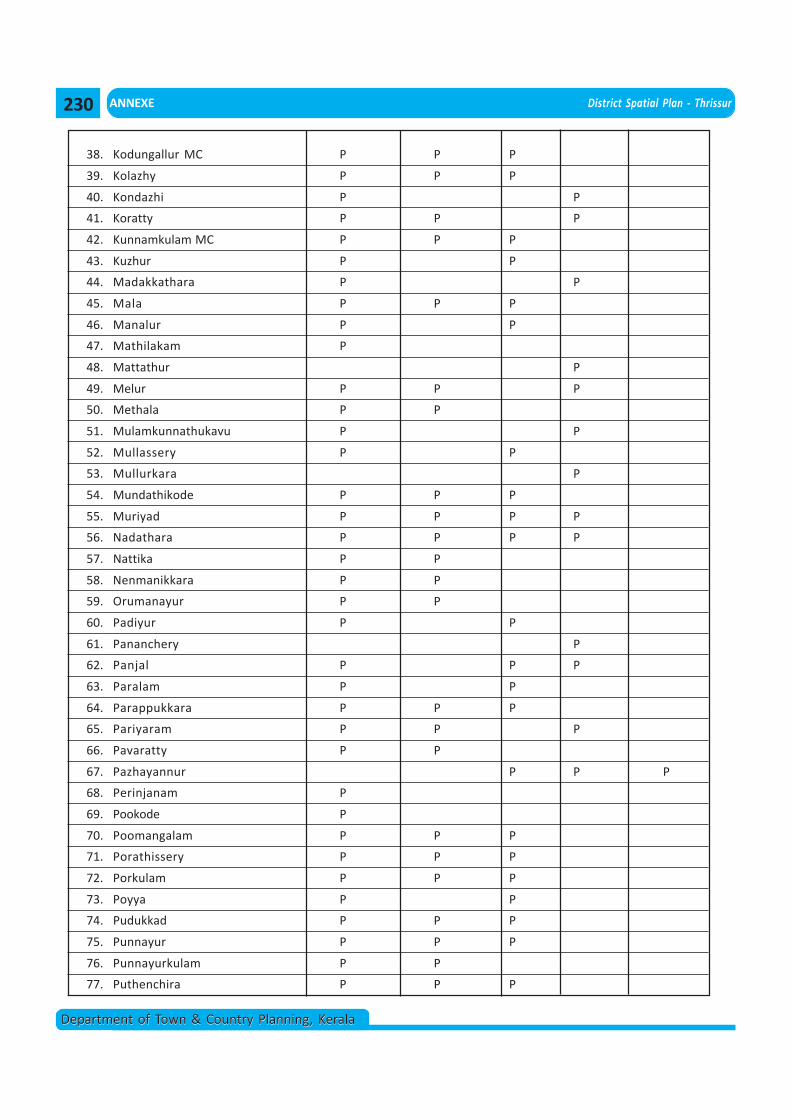
ANNEXE District Spatial Plan - Thrissur
Department of Town & Country Planning, KeralaDepartment of Town & Country Planning, Kerala
38. Kodungallur MC P P P
39. Kolazhy P P P
40. Kondazhi P P
41. Koratty P P P
42. Kunnamkulam MC P P P
43. Kuzhur P P
44. Madakkathara P P
45. Mala P P P
46. Manalur P P
47. Mathilakam P
48. Mattathur P
49. Melur P P P
50. Methala P P
51. Mulamkunnathukavu P P
52. Mullassery P P
53. Mullurkara P
54. Mundathikode P P P
55. Muriyad P P P P
56. Nadathara P P P P
57. Nattika P P
58. Nenmanikkara P P
59. Orumanayur P P
60. Padiyur P P
61. Pananchery P
62. Panjal P P P
63. Paralam P P
64. Parappukkara P P P
65. Pariyaram P P P
66. Pavaratty P P
67. Pazhayannur P P P
68. Perinjanam P
69. Pookode P
70. Poomangalam P P P
71. Porathissery P P P
72. Porkulam P P P
73. Poyya P P
74. Pudukkad P P P
75. Punnayur P P P
76. Punnayurkulam P P
77. Puthenchira P P P
230
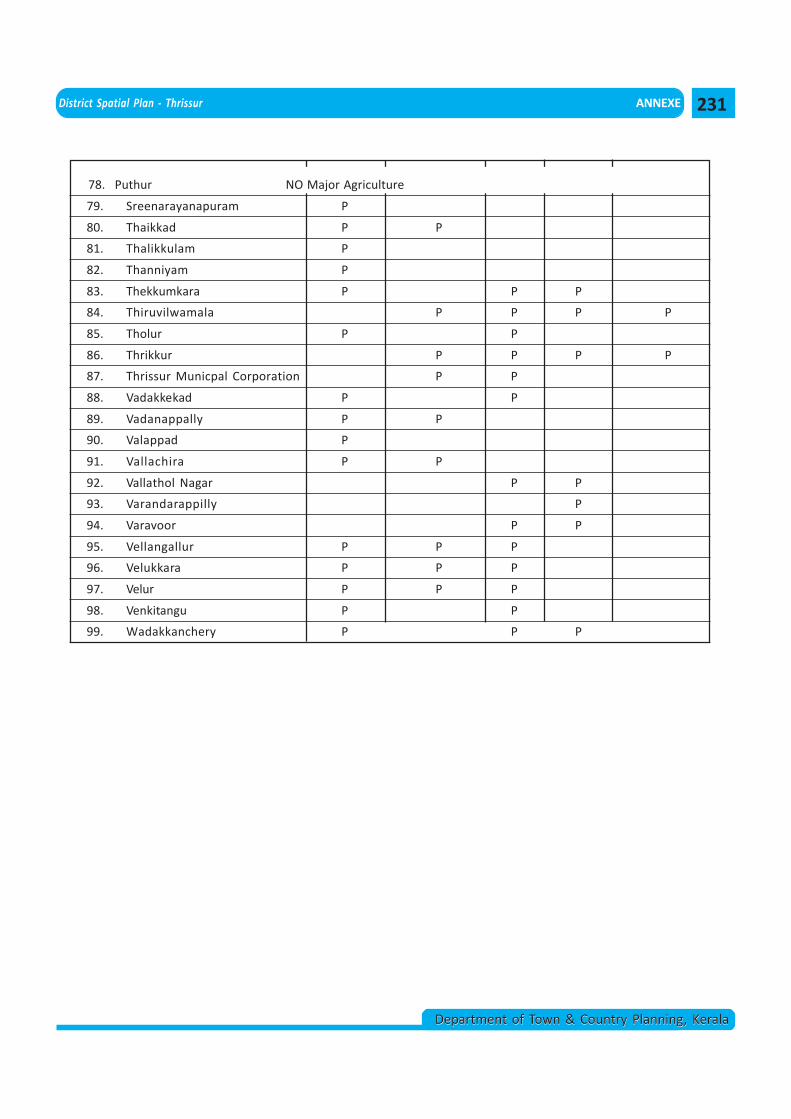
District Spatial Plan - Thrissur ANNEXE
Department of Town & Country Planning, KeralaDepartment of Town & Country Planning, Kerala
Land Use
78. Puthur NO Major Agriculture
79. Sreenarayanapuram P
80. Thaikkad P P
81. Thalikkulam P
82. Thanniyam P
83. Thekkumkara P P P
84. Thiruvilwamala P P P P
85. Tholur P P
86. Thrikkur P P P P
87. Thrissur Municpal Corporation P P
88. Vadakkekad P P
89. Vadanappally P P
90. Valappad P
91. Vallachira P P
92. Vallathol Nagar P P
93. Varandarappilly P
94. Varavoor P P
95. Vellangallur P P P
96. Velukkara P P P
97. Velur P P P
98. Venkitangu P P
99. Wadakkanchery P P P
231
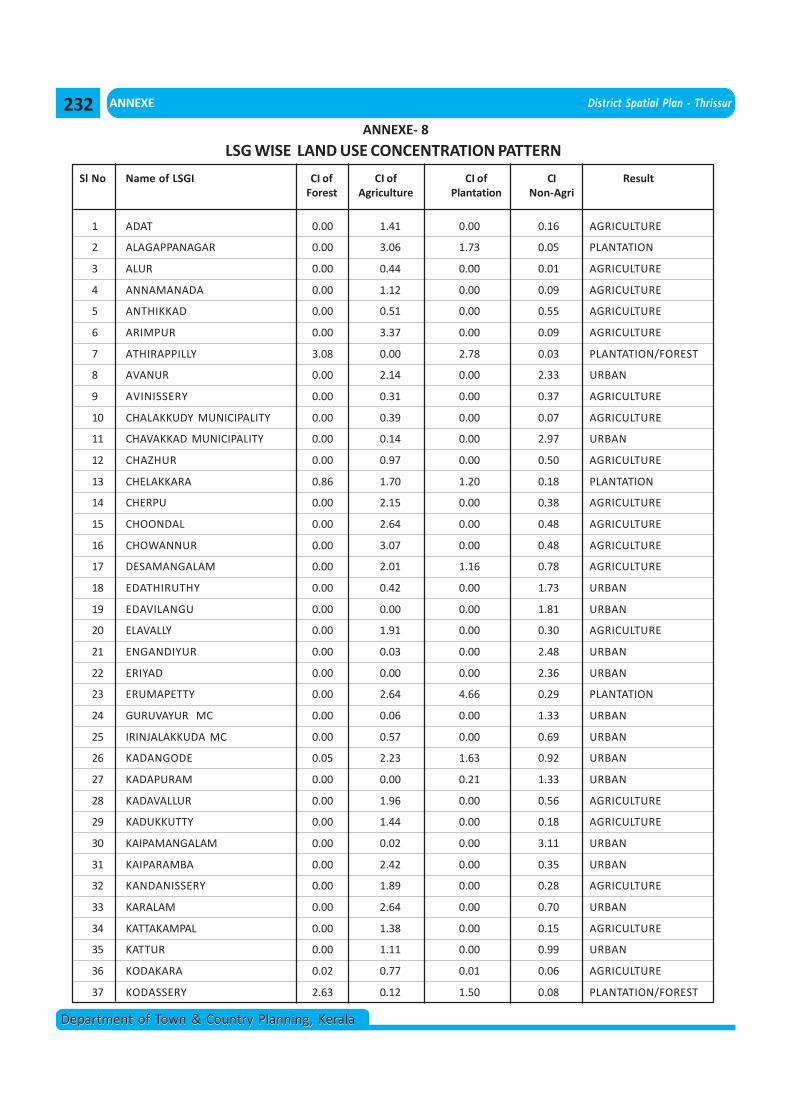
ANNEXE District Spatial Plan - Thrissur
Department of Town & Country Planning, KeralaDepartment of Town & Country Planning, Kerala
LSG WISE LAND USE CONCENTRATION PATTERN
Sl No Name of LSGI CI of CI of CI of CI ResultForest Agriculture Plantation Non-Agri
1 ADAT 0.00 1.41 0.00 0.16 AGRICULTURE
2 ALAGAPPANAGAR 0.00 3.06 1.73 0.05 PLANTATION
3 ALUR 0.00 0.44 0.00 0.01 AGRICULTURE
4 ANNAMANADA 0.00 1.12 0.00 0.09 AGRICULTURE
5 ANTHIKKAD 0.00 0.51 0.00 0.55 AGRICULTURE
6 ARIMPUR 0.00 3.37 0.00 0.09 AGRICULTURE
7 ATHIRAPPILLY 3.08 0.00 2.78 0.03 PLANTATION/FOREST
8 AVANUR 0.00 2.14 0.00 2.33 URBAN
9 AVINISSERY 0.00 0.31 0.00 0.37 AGRICULTURE
10 CHALAKKUDY MUNICIPALITY 0.00 0.39 0.00 0.07 AGRICULTURE
11 CHAVAKKAD MUNICIPALITY 0.00 0.14 0.00 2.97 URBAN
12 CHAZHUR 0.00 0.97 0.00 0.50 AGRICULTURE
13 CHELAKKARA 0.86 1.70 1.20 0.18 PLANTATION
14 CHERPU 0.00 2.15 0.00 0.38 AGRICULTURE
15 CHOONDAL 0.00 2.64 0.00 0.48 AGRICULTURE
16 CHOWANNUR 0.00 3.07 0.00 0.48 AGRICULTURE
17 DESAMANGALAM 0.00 2.01 1.16 0.78 AGRICULTURE
18 EDATHIRUTHY 0.00 0.42 0.00 1.73 URBAN
19 EDAVILANGU 0.00 0.00 0.00 1.81 URBAN
20 ELAVALLY 0.00 1.91 0.00 0.30 AGRICULTURE
21 ENGANDIYUR 0.00 0.03 0.00 2.48 URBAN
22 ERIYAD 0.00 0.00 0.00 2.36 URBAN
23 ERUMAPETTY 0.00 2.64 4.66 0.29 PLANTATION
24 GURUVAYUR MC 0.00 0.06 0.00 1.33 URBAN
25 IRINJALAKKUDA MC 0.00 0.57 0.00 0.69 URBAN
26 KADANGODE 0.05 2.23 1.63 0.92 URBAN
27 KADAPURAM 0.00 0.00 0.21 1.33 URBAN
28 KADAVALLUR 0.00 1.96 0.00 0.56 AGRICULTURE
29 KADUKKUTTY 0.00 1.44 0.00 0.18 AGRICULTURE
30 KAIPAMANGALAM 0.00 0.02 0.00 3.11 URBAN
31 KAIPARAMBA 0.00 2.42 0.00 0.35 URBAN
32 KANDANISSERY 0.00 1.89 0.00 0.28 AGRICULTURE
33 KARALAM 0.00 2.64 0.00 0.70 URBAN
34 KATTAKAMPAL 0.00 1.38 0.00 0.15 AGRICULTURE
35 KATTUR 0.00 1.11 0.00 0.99 URBAN
36 KODAKARA 0.02 0.77 0.01 0.06 AGRICULTURE
37 KODASSERY 2.63 0.12 1.50 0.08 PLANTATION/FOREST
ANNEXE- 8
232
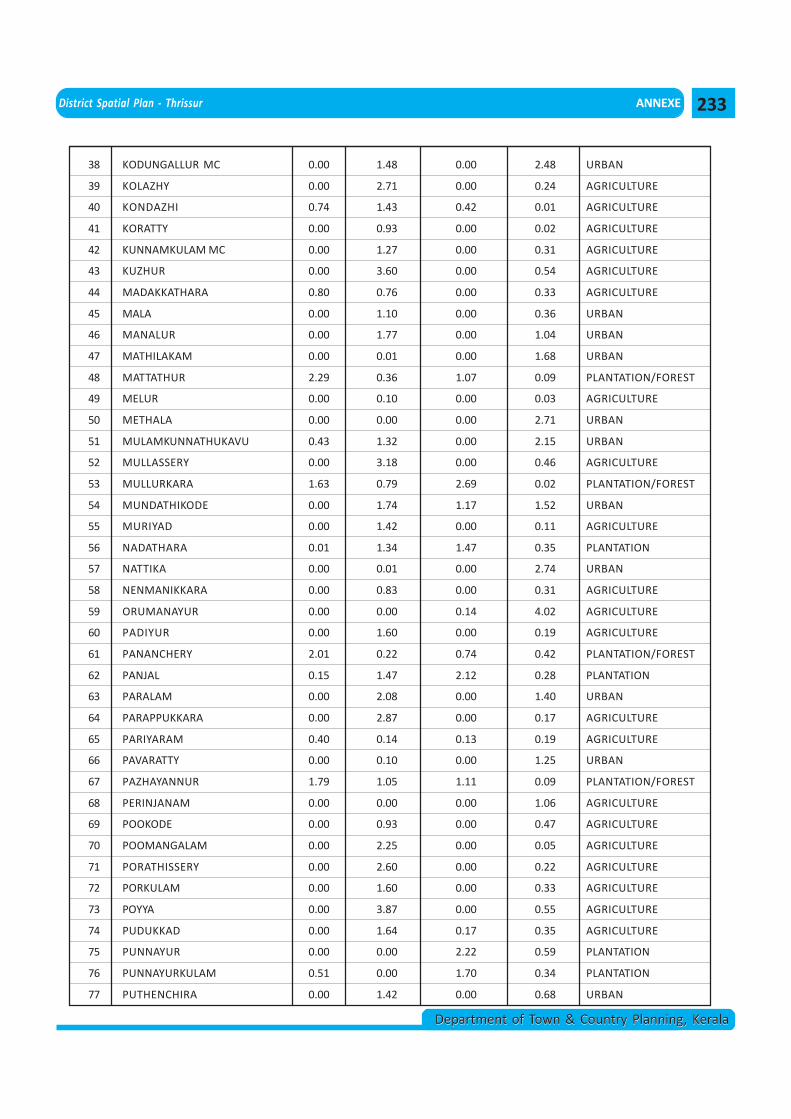
District Spatial Plan - Thrissur ANNEXE
Department of Town & Country Planning, KeralaDepartment of Town & Country Planning, Kerala
38 KODUNGALLUR MC 0.00 1.48 0.00 2.48 URBAN
39 KOLAZHY 0.00 2.71 0.00 0.24 AGRICULTURE
40 KONDAZHI 0.74 1.43 0.42 0.01 AGRICULTURE
41 KORATTY 0.00 0.93 0.00 0.02 AGRICULTURE
42 KUNNAMKULAM MC 0.00 1.27 0.00 0.31 AGRICULTURE
43 KUZHUR 0.00 3.60 0.00 0.54 AGRICULTURE
44 MADAKKATHARA 0.80 0.76 0.00 0.33 AGRICULTURE
45 MALA 0.00 1.10 0.00 0.36 URBAN
46 MANALUR 0.00 1.77 0.00 1.04 URBAN
47 MATHILAKAM 0.00 0.01 0.00 1.68 URBAN
48 MATTATHUR 2.29 0.36 1.07 0.09 PLANTATION/FOREST
49 MELUR 0.00 0.10 0.00 0.03 AGRICULTURE
50 METHALA 0.00 0.00 0.00 2.71 URBAN
51 MULAMKUNNATHUKAVU 0.43 1.32 0.00 2.15 URBAN
52 MULLASSERY 0.00 3.18 0.00 0.46 AGRICULTURE
53 MULLURKARA 1.63 0.79 2.69 0.02 PLANTATION/FOREST
54 MUNDATHIKODE 0.00 1.74 1.17 1.52 URBAN
55 MURIYAD 0.00 1.42 0.00 0.11 AGRICULTURE
56 NADATHARA 0.01 1.34 1.47 0.35 PLANTATION
57 NATTIKA 0.00 0.01 0.00 2.74 URBAN
58 NENMANIKKARA 0.00 0.83 0.00 0.31 AGRICULTURE
59 ORUMANAYUR 0.00 0.00 0.14 4.02 AGRICULTURE
60 PADIYUR 0.00 1.60 0.00 0.19 AGRICULTURE
61 PANANCHERY 2.01 0.22 0.74 0.42 PLANTATION/FOREST
62 PANJAL 0.15 1.47 2.12 0.28 PLANTATION
63 PARALAM 0.00 2.08 0.00 1.40 URBAN
64 PARAPPUKKARA 0.00 2.87 0.00 0.17 AGRICULTURE
65 PARIYARAM 0.40 0.14 0.13 0.19 AGRICULTURE
66 PAVARATTY 0.00 0.10 0.00 1.25 URBAN
67 PAZHAYANNUR 1.79 1.05 1.11 0.09 PLANTATION/FOREST
68 PERINJANAM 0.00 0.00 0.00 1.06 AGRICULTURE
69 POOKODE 0.00 0.93 0.00 0.47 AGRICULTURE
70 POOMANGALAM 0.00 2.25 0.00 0.05 AGRICULTURE
71 PORATHISSERY 0.00 2.60 0.00 0.22 AGRICULTURE
72 PORKULAM 0.00 1.60 0.00 0.33 AGRICULTURE
73 POYYA 0.00 3.87 0.00 0.55 AGRICULTURE
74 PUDUKKAD 0.00 1.64 0.17 0.35 AGRICULTURE
75 PUNNAYUR 0.00 0.00 2.22 0.59 PLANTATION
76 PUNNAYURKULAM 0.51 0.00 1.70 0.34 PLANTATION
77 PUTHENCHIRA 0.00 1.42 0.00 0.68 URBAN
233
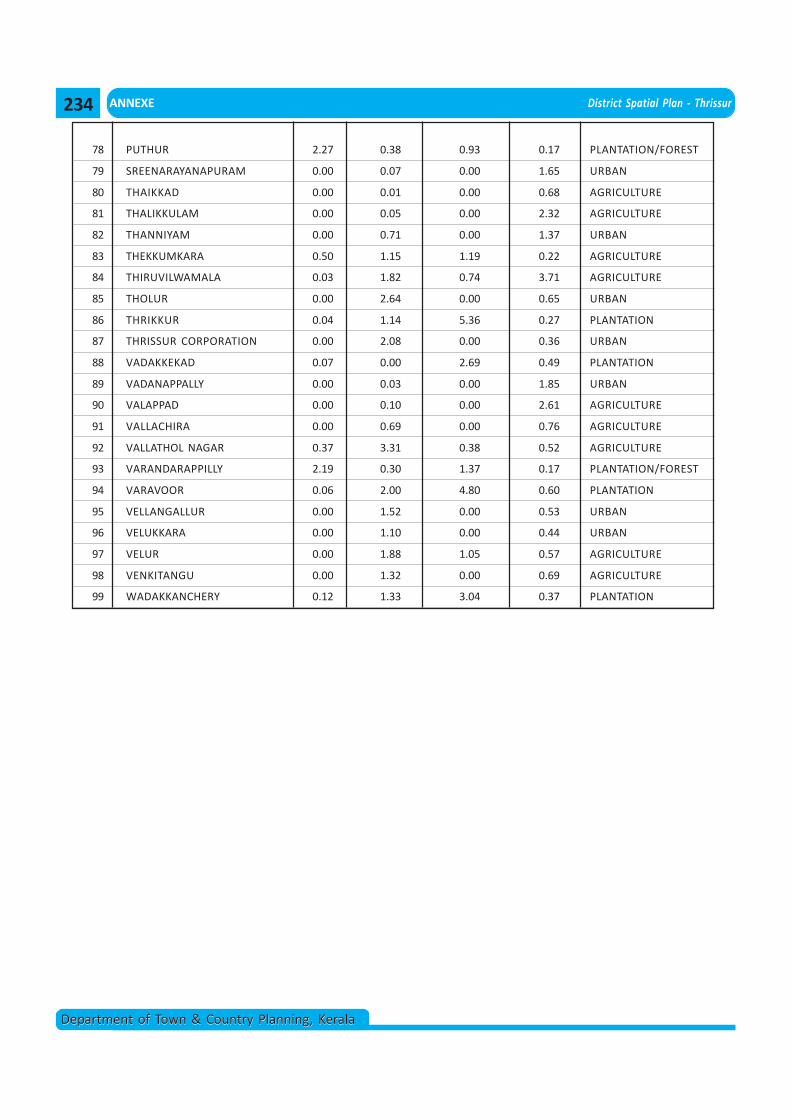
ANNEXE District Spatial Plan - Thrissur
Department of Town & Country Planning, KeralaDepartment of Town & Country Planning, Kerala
78 PUTHUR 2.27 0.38 0.93 0.17 PLANTATION/FOREST
79 SREENARAYANAPURAM 0.00 0.07 0.00 1.65 URBAN
80 THAIKKAD 0.00 0.01 0.00 0.68 AGRICULTURE
81 THALIKKULAM 0.00 0.05 0.00 2.32 AGRICULTURE
82 THANNIYAM 0.00 0.71 0.00 1.37 URBAN
83 THEKKUMKARA 0.50 1.15 1.19 0.22 AGRICULTURE
84 THIRUVILWAMALA 0.03 1.82 0.74 3.71 AGRICULTURE
85 THOLUR 0.00 2.64 0.00 0.65 URBAN
86 THRIKKUR 0.04 1.14 5.36 0.27 PLANTATION
87 THRISSUR CORPORATION 0.00 2.08 0.00 0.36 URBAN
88 VADAKKEKAD 0.07 0.00 2.69 0.49 PLANTATION
89 VADANAPPALLY 0.00 0.03 0.00 1.85 URBAN
90 VALAPPAD 0.00 0.10 0.00 2.61 AGRICULTURE
91 VALLACHIRA 0.00 0.69 0.00 0.76 AGRICULTURE
92 VALLATHOL NAGAR 0.37 3.31 0.38 0.52 AGRICULTURE
93 VARANDARAPPILLY 2.19 0.30 1.37 0.17 PLANTATION/FOREST
94 VARAVOOR 0.06 2.00 4.80 0.60 PLANTATION
95 VELLANGALLUR 0.00 1.52 0.00 0.53 URBAN
96 VELUKKARA 0.00 1.10 0.00 0.44 URBAN
97 VELUR 0.00 1.88 1.05 0.57 AGRICULTURE
98 VENKITANGU 0.00 1.32 0.00 0.69 AGRICULTURE
99 WADAKKANCHERY 0.12 1.33 3.04 0.37 PLANTATION
234
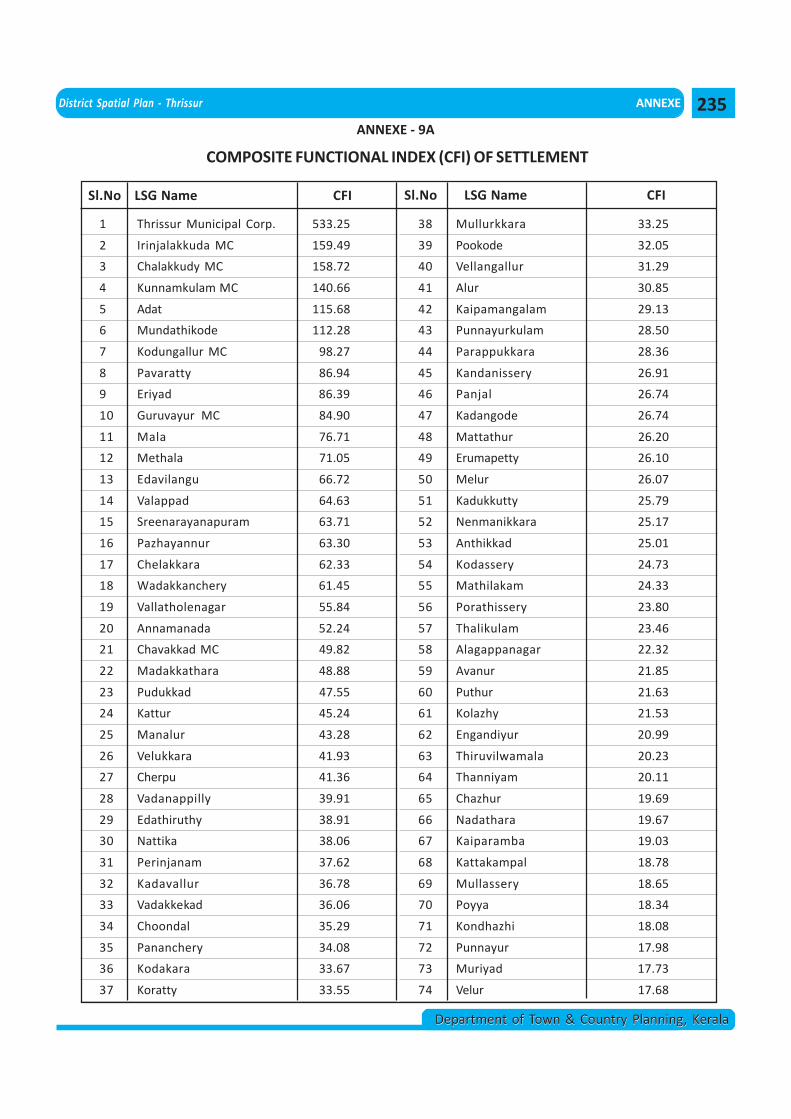
District Spatial Plan - Thrissur ANNEXE
Department of Town & Country Planning, KeralaDepartment of Town & Country Planning, Kerala
1 Thrissur Municipal Corp. 533.25
2 Irinjalakkuda MC 159.49
3 Chalakkudy MC 158.72
4 Kunnamkulam MC 140.66
5 Adat 115.68
6 Mundathikode 112.28
7 Kodungallur MC 98.27
8 Pavaratty 86.94
9 Eriyad 86.39
10 Guruvayur MC 84.90
11 Mala 76.71
12 Methala 71.05
13 Edavilangu 66.72
14 Valappad 64.63
15 Sreenarayanapuram 63.71
16 Pazhayannur 63.30
17 Chelakkara 62.33
18 Wadakkanchery 61.45
19 Vallatholenagar 55.84
20 Annamanada 52.24
21 Chavakkad MC 49.82
22 Madakkathara 48.88
23 Pudukkad 47.55
24 Kattur 45.24
25 Manalur 43.28
26 Velukkara 41.93
27 Cherpu 41.36
28 Vadanappilly 39.91
29 Edathiruthy 38.91
30 Nattika 38.06
31 Perinjanam 37.62
32 Kadavallur 36.78
33 Vadakkekad 36.06
34 Choondal 35.29
35 Pananchery 34.08
36 Kodakara 33.67
37 Koratty 33.55
COMPOSITE FUNCTIONAL INDEX (CFI) OF SETTLEMENT
Sl.No LSG Name CFI
38 Mullurkkara 33.25
39 Pookode 32.05
40 Vellangallur 31.29
41 Alur 30.85
42 Kaipamangalam 29.13
43 Punnayurkulam 28.50
44 Parappukkara 28.36
45 Kandanissery 26.91
46 Panjal 26.74
47 Kadangode 26.74
48 Mattathur 26.20
49 Erumapetty 26.10
50 Melur 26.07
51 Kadukkutty 25.79
52 Nenmanikkara 25.17
53 Anthikkad 25.01
54 Kodassery 24.73
55 Mathilakam 24.33
56 Porathissery 23.80
57 Thalikulam 23.46
58 Alagappanagar 22.32
59 Avanur 21.85
60 Puthur 21.63
61 Kolazhy 21.53
62 Engandiyur 20.99
63 Thiruvilwamala 20.23
64 Thanniyam 20.11
65 Chazhur 19.69
66 Nadathara 19.67
67 Kaiparamba 19.03
68 Kattakampal 18.78
69 Mullassery 18.65
70 Poyya 18.34
71 Kondhazhi 18.08
72 Punnayur 17.98
73 Muriyad 17.73
74 Velur 17.68
Sl.No LSG Name CFI
ANNEXE - 9A
235
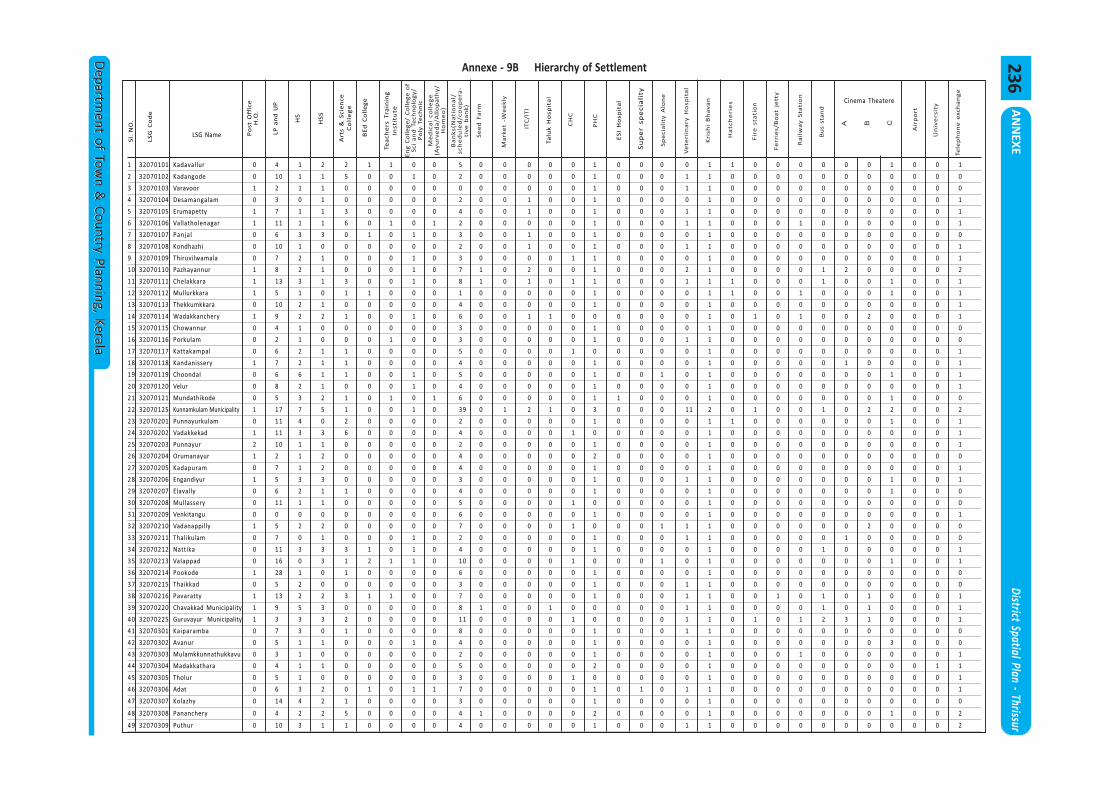
AN
NEXE
District Spatial Plan - Thrissur
Departm
ent of Town &
Country Planning, KeralaD
epartment of Tow
n & Country Planning, Kerala
1 32070101 Kadavallur 0 4 1 2 2 1 1 0 0 5 0 0 0 0 0 1 0 0 0 0 1 1 0 0 0 0 0 0 1 0 0 1
2 32070102 Kadangode 0 10 1 1 5 0 0 1 0 2 0 0 0 0 0 1 0 0 0 1 1 0 0 0 0 0 0 0 0 0 0 0
3 32070103 Varavoor 1 2 1 1 0 0 0 0 0 0 0 0 0 0 0 1 0 0 0 1 1 0 0 0 0 0 0 0 0 0 0 0
4 32070104 Desamangalam 0 3 0 1 0 0 0 0 0 2 0 0 1 0 0 1 0 0 0 0 1 0 0 0 0 0 0 0 0 0 0 1
5 32070105 Erumapetty 1 7 1 1 3 0 0 0 0 4 0 0 1 0 0 1 0 0 0 1 1 0 0 0 0 0 0 0 0 0 0 1
6 32070106 Vallatholenagar 1 11 1 1 6 0 1 0 1 2 0 0 0 0 0 1 0 0 0 1 1 0 0 0 1 0 0 0 0 0 0 1
7 32070107 Panjal 0 6 3 3 0 1 0 1 0 3 0 0 1 0 0 1 0 0 0 0 1 0 0 0 0 0 0 0 0 0 0 0
8 32070108 Kondhazhi 0 10 1 0 0 0 0 0 0 2 0 0 1 0 0 1 0 0 0 1 1 0 0 0 0 0 0 0 0 0 0 1
9 32070109 Thiruvilwamala 0 7 2 1 0 0 0 1 0 3 0 0 0 0 1 1 0 0 0 0 1 0 0 0 0 0 0 0 0 0 0 1
10 32070110 Pazhayannur 1 8 2 1 0 0 0 1 0 7 1 0 2 0 0 1 0 0 0 2 1 0 0 0 0 1 2 0 0 0 0 2
11 32070111 Chelakkara 1 13 3 1 3 0 0 1 0 8 1 0 1 0 1 1 0 0 0 1 1 1 0 0 0 1 0 0 1 0 0 1
12 32070112 Mullurkkara 1 5 1 0 1 1 0 0 0 1 0 0 0 0 0 1 0 0 0 0 1 1 0 0 1 0 0 0 1 0 0 1
13 32070113 Thekkumkkara 0 10 2 1 0 0 0 0 0 4 0 0 0 0 0 1 0 0 0 0 1 0 0 0 0 0 0 0 0 0 0 1
14 32070114 Wadakkanchery 1 9 2 2 1 0 0 1 0 6 0 0 1 1 0 0 0 0 0 0 1 0 1 0 1 0 0 2 0 0 0 1
15 32070115 Chowannur 0 4 1 0 0 0 0 0 0 3 0 0 0 0 0 1 0 0 0 0 1 0 0 0 0 0 0 0 0 0 0 0
16 32070116 Porkulam 0 2 1 0 0 0 1 0 0 3 0 0 0 0 0 1 0 0 0 1 1 0 0 0 0 0 0 0 0 0 0 0
17 32070117 Kattakampal 0 6 2 1 1 0 0 0 0 5 0 0 0 0 1 0 0 0 0 0 1 0 0 0 0 0 0 0 0 0 0 1
18 32070118 Kandanissery 1 7 2 1 1 0 0 0 0 4 0 0 0 0 0 1 0 0 0 0 1 0 0 0 0 0 1 0 0 0 0 1
19 32070119 Choondal 0 6 6 1 1 0 0 1 0 5 0 0 0 0 0 1 0 0 1 0 1 0 0 0 0 0 0 0 1 0 0 1
20 32070120 Velur 0 8 2 1 0 0 0 1 0 4 0 0 0 0 0 1 0 0 0 0 1 0 0 0 0 0 0 0 0 0 0 1
21 32070121 Mundathikode 0 5 3 2 1 0 1 0 1 6 0 0 0 0 0 1 1 0 0 0 1 0 0 0 0 0 0 0 1 0 0 0
22 32070125 Kunnamkulam Municipality 1 17 7 5 1 0 0 1 0 39 0 1 2 1 0 3 0 0 0 11 2 0 1 0 0 1 0 2 2 0 0 2
23 32070201 Punnayurkulam 0 11 4 0 2 0 0 0 0 2 0 0 0 0 0 1 0 0 0 0 1 1 0 0 0 0 0 0 1 0 0 1
24 32070202 Vadakkekad 1 11 3 3 6 0 0 0 0 4 0 0 0 0 1 0 0 0 0 0 1 0 0 0 0 0 0 0 0 0 0 1
25 32070203 Punnayur 2 10 1 1 0 0 0 0 0 2 0 0 0 0 0 1 0 0 0 0 1 0 0 0 0 0 0 0 0 0 0 1
26 32070204 Orumanayur 1 2 1 2 0 0 0 0 0 4 0 0 0 0 0 2 0 0 0 0 1 0 0 0 0 0 0 0 0 0 0 0
27 32070205 Kadapuram 0 7 1 2 0 0 0 0 0 4 0 0 0 0 0 1 0 0 0 0 1 0 0 0 0 0 0 0 0 0 0 1
28 32070206 Engandiyur 1 5 3 3 0 0 0 0 0 3 0 0 0 0 0 1 0 0 0 1 1 0 0 0 0 0 0 0 1 0 0 1
29 32070207 Elavally 0 6 2 1 1 0 0 0 0 4 0 0 0 0 0 1 0 0 0 0 1 0 0 0 0 0 0 0 1 0 0 0
30 32070208 Mullassery 0 11 1 1 0 0 0 0 0 5 0 0 0 0 1 0 0 0 0 0 1 0 0 0 0 0 0 0 0 0 0 0
31 32070209 Venkitangu 0 0 0 0 0 0 0 0 0 6 0 0 0 0 0 1 0 0 0 0 1 0 0 0 0 0 0 0 0 0 0 1
32 32070210 Vadanappilly 1 5 2 2 0 0 0 0 0 7 0 0 0 0 1 0 0 0 1 1 1 0 0 0 0 0 0 2 0 0 0 0
33 32070211 Thalikulam 0 7 0 1 0 0 0 1 0 2 0 0 0 0 0 1 0 0 0 1 1 0 0 0 0 0 1 0 0 0 0 0
34 32070212 Nattika 0 11 3 3 3 1 0 1 0 4 0 0 0 0 0 1 0 0 0 0 1 0 0 0 0 1 0 0 0 0 0 1
35 32070213 Valappad 0 16 0 3 1 2 1 1 0 10 0 0 0 0 1 0 0 0 1 0 1 0 0 0 0 0 0 0 1 0 0 1
36 32070214 Pookode 1 28 1 0 1 0 0 0 0 6 0 0 0 0 0 1 0 0 0 0 1 0 0 0 0 0 0 0 0 0 0 0
37 32070215 Thaikkad 0 5 2 0 0 0 0 0 0 3 0 0 0 0 0 1 0 0 0 1 1 0 0 0 0 0 0 0 0 0 0 0
38 32070216 Pavaratty 1 13 2 2 3 1 1 0 0 7 0 0 0 0 0 1 0 0 0 1 1 0 0 1 0 1 0 1 0 0 0 1
39 32070220 Chavakkad Municipality 1 9 5 3 0 0 0 0 0 8 1 0 0 1 0 0 0 0 0 1 1 0 0 0 0 1 0 1 0 0 0 1
40 32070225 Guruvayur Municipality 1 3 3 3 2 0 0 0 0 11 0 0 0 0 1 0 0 0 0 1 1 0 1 0 1 2 3 1 0 0 0 1
41 32070301 Kaiparamba 0 7 3 0 1 0 0 0 0 8 0 0 0 0 0 1 0 0 0 1 1 0 0 0 0 0 0 0 0 0 0 0
42 32070302 Avanur 0 5 1 1 0 0 0 1 0 4 0 0 0 0 0 1 0 0 0 0 1 0 0 0 0 0 0 0 3 0 0 0
43 32070303 Mulamkkunnathukkavu 0 3 1 0 0 0 0 0 0 2 0 0 0 0 0 1 0 0 0 0 1 0 0 0 1 0 0 0 0 0 0 1
44 32070304 Madakkathara 0 4 1 1 0 0 0 0 0 5 0 0 0 0 0 2 0 0 0 0 1 0 0 0 0 0 0 0 0 0 1 1
45 32070305 Tholur 0 5 1 0 0 0 0 0 0 3 0 0 0 0 1 0 0 0 0 0 1 0 0 0 0 0 0 0 0 0 0 1
46 32070306 Adat 0 6 3 2 0 1 0 1 1 7 0 0 0 0 0 1 0 1 0 1 1 0 0 0 0 0 0 0 0 0 0 1
47 32070307 Kolazhy 0 14 4 2 1 0 0 0 0 3 0 0 0 0 0 1 0 0 0 0 1 0 0 0 0 0 0 0 0 0 0 0
48 32070308 Pananchery 0 4 2 2 5 0 0 0 0 4 1 0 0 0 0 2 0 0 0 0 1 0 0 0 0 0 0 0 1 0 0 2
49 32070309 Puthur 0 10 3 1 1 0 0 0 0 4 0 0 0 0 0 1 0 0 0 1 1 0 0 0 0 0 0 0 0 0 0 2
Sl.
NO
.
LS
G C
od
e
LSG Name Po
st
Off
ice
H.O
.
LP
an
d U
P
HS
HS
S
Art
s &
Scie
nce
Co
lle
ge
BE
d C
oll
eg
e
Te
ac
he
rs T
rain
ing
Ins
tit
ute
En
g C
oll
eg
e/ C
oll
eg
e o
fS
ci
an
d T
ech
no
log
y/
Po
ly T
ech
nic
Me
dic
al
co
lle
ge
(Ay
urv
ed
a/A
llo
pa
thy
/H
om
eo
)
Ba
nk
s(N
ati
on
al/
sc
he
du
led
/c
oo
pe
ra
-ti
ve
ba
nk
)
Se
ed
Fa
rm
Ma
rke
t -W
ee
kly
ITC
/IT
I
Ta
luk
Ho
sp
ita
l
CH
C
PH
C
ES
I H
osp
ita
l
Su
pe
r sp
ec
iali
ty
Sp
ec
iali
ty A
lon
e
Ve
terii
na
ry
Ho
sp
ita
l
Kri
sh
i B
ha
va
n
Ha
tc
he
rie
s
Fir
e s
tati
on
Fe
rrie
s/B
oa
t je
tty
Ra
ilw
ay
Sta
tio
n
Bu
s s
tan
d
Cinema Theatere
A B C
Air
po
rt
Un
ive
rsit
y
Te
lep
ho
ne
exc
ha
ng
e
Annexe - 9B Hierarchy of Settlement
236
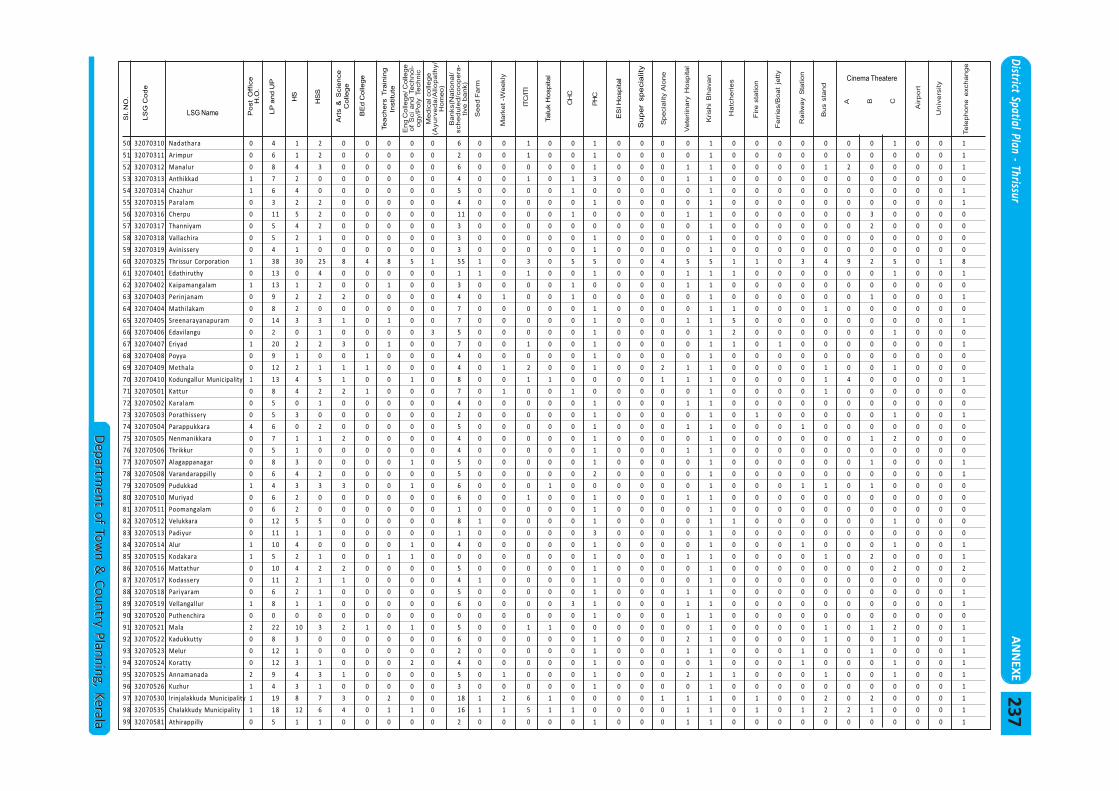
District Spatial Plan - ThrissurA
NN
EXE
Departm
ent of Town &
Country Planning, KeralaD
epartment of Tow
n & Country Planning, Kerala
50 32070310 Nadathara 0 4 1 2 0 0 0 0 0 6 0 0 1 0 0 1 0 0 0 0 1 0 0 0 0 0 0 0 1 0 0 1
51 32070311 Arimpur 0 6 1 2 0 0 0 0 0 2 0 0 1 0 0 1 0 0 0 0 1 0 0 0 0 0 0 0 0 0 0 1
52 32070312 Manalur 0 8 4 3 0 0 0 0 0 6 0 0 0 0 0 1 0 0 0 1 1 0 0 0 0 1 2 0 0 0 0 1
53 32070313 Anthikkad 1 7 2 0 0 0 0 0 0 4 0 0 1 0 1 3 0 0 0 1 1 0 0 0 0 0 0 0 0 0 0 0
54 32070314 Chazhur 1 6 4 0 0 0 0 0 0 5 0 0 0 0 1 0 0 0 0 0 1 0 0 0 0 0 0 0 0 0 0 1
55 32070315 Paralam 0 3 2 2 0 0 0 0 0 4 0 0 0 0 0 1 0 0 0 0 1 0 0 0 0 0 0 0 0 0 0 1
56 32070316 Cherpu 0 11 5 2 0 0 0 0 0 11 0 0 0 0 1 0 0 0 0 1 1 0 0 0 0 0 0 3 0 0 0 0
57 32070317 Thanniyam 0 5 4 2 0 0 0 0 0 3 0 0 0 0 0 0 0 0 0 0 1 0 0 0 0 0 0 2 0 0 0 0
58 32070318 Vallachira 0 5 2 1 0 0 0 0 0 3 0 0 0 0 0 1 0 0 0 0 1 0 0 0 0 0 0 0 0 0 0 0
59 32070319 Avinissery 0 4 1 0 0 0 0 0 0 3 0 0 0 0 0 1 0 0 0 0 1 0 0 0 0 0 0 0 0 0 0 0
60 32070325 Thrissur Corporation 1 38 30 25 8 4 8 5 1 55 1 0 3 0 5 5 0 0 4 5 5 1 1 0 3 4 9 2 5 0 1 8
61 32070401 Edathiruthy 0 13 0 4 0 0 0 0 0 1 1 0 1 0 0 1 0 0 0 1 1 1 0 0 0 0 0 0 1 0 0 1
62 32070402 Kaipamangalam 1 13 1 2 0 0 1 0 0 3 0 0 0 0 1 0 0 0 0 1 1 0 0 0 0 0 0 0 0 0 0 0
63 32070403 Perinjanam 0 9 2 2 2 0 0 0 0 4 0 1 0 0 1 0 0 0 0 0 1 0 0 0 0 0 0 1 0 0 0 1
64 32070404 Mathilakam 0 8 2 0 0 0 0 0 0 7 0 0 0 0 0 1 0 0 0 0 1 1 0 0 0 1 0 0 0 0 0 0
65 32070405 Sreenarayanapuram 0 14 3 3 1 0 1 0 0 7 0 0 0 0 0 1 0 0 0 1 1 5 0 0 0 0 0 0 0 0 0 1
66 32070406 Edavilangu 0 2 0 1 0 0 0 0 3 5 0 0 0 0 0 1 0 0 0 0 1 2 0 0 0 0 0 0 1 0 0 0
67 32070407 Eriyad 1 20 2 2 3 0 1 0 0 7 0 0 1 0 0 1 0 0 0 0 1 1 0 1 0 0 0 0 0 0 0 1
68 32070408 Poyya 0 9 1 0 0 1 0 0 0 4 0 0 0 0 0 1 0 0 0 0 1 0 0 0 0 0 0 0 0 0 0 0
69 32070409 Methala 0 12 2 1 1 1 0 0 0 4 0 1 2 0 0 1 0 0 2 1 1 0 0 0 0 1 0 0 1 0 0 0
70 32070410 Kodungallur Municipality 1 13 4 5 1 0 0 1 0 8 0 0 1 1 0 0 0 0 1 1 1 0 0 0 0 1 4 0 0 0 0 1
71 32070501 Kattur 0 8 4 2 2 1 0 0 0 7 0 1 0 0 1 0 0 0 0 0 1 0 0 0 0 1 0 0 0 0 0 0
72 32070502 Karalam 0 5 0 1 0 0 0 0 0 4 0 0 0 0 0 1 0 0 0 1 1 0 0 0 0 0 0 0 0 0 0 0
73 32070503 Porathissery 0 5 3 0 0 0 0 0 0 2 0 0 0 0 0 1 0 0 0 0 1 0 1 0 0 0 0 0 1 0 0 1
74 32070504 Parappukkara 4 6 0 2 0 0 0 0 0 5 0 0 0 0 0 1 0 0 0 1 1 0 0 0 1 0 0 0 0 0 0 0
75 32070505 Nenmanikkara 0 7 1 1 2 0 0 0 0 4 0 0 0 0 0 1 0 0 0 0 1 0 0 0 0 0 0 1 2 0 0 0
76 32070506 Thrikkur 0 5 1 0 0 0 0 0 0 4 0 0 0 0 0 1 0 0 0 1 1 0 0 0 0 0 0 0 0 0 0 0
77 32070507 Alagappanagar 0 8 3 0 0 0 0 1 0 5 0 0 0 0 0 1 0 0 0 0 1 0 0 0 0 0 0 1 0 0 0 1
78 32070508 Varandarappilly 0 6 4 2 0 0 0 0 0 5 0 0 0 0 0 2 0 0 0 0 1 0 0 0 0 0 0 0 0 0 0 1
79 32070509 Pudukkad 1 4 3 3 3 0 0 1 0 6 0 0 0 1 0 0 0 0 0 0 1 0 0 0 1 1 0 1 0 0 0 0
80 32070510 Muriyad 0 6 2 0 0 0 0 0 0 6 0 0 1 0 0 1 0 0 0 1 1 0 0 0 0 0 0 0 0 0 0 0
81 32070511 Poomangalam 0 6 2 0 0 0 0 0 0 1 0 0 0 0 0 1 0 0 0 0 1 0 0 0 0 0 0 0 0 0 0 0
82 32070512 Velukkara 0 12 5 5 0 0 0 0 0 8 1 0 0 0 0 1 0 0 0 0 1 1 0 0 0 0 0 0 1 0 0 0
83 32070513 Padiyur 0 11 1 1 0 0 0 0 0 1 0 0 0 0 0 3 0 0 0 0 1 0 0 0 0 0 0 0 0 0 0 0
84 32070514 Alur 1 10 4 0 0 0 0 1 0 4 0 0 0 0 0 1 0 0 0 0 1 0 0 0 1 0 0 0 1 0 0 1
85 32070515 Kodakara 1 5 2 1 0 0 1 1 0 0 0 0 0 0 0 1 0 0 0 1 1 0 0 0 0 1 0 2 0 0 0 1
86 32070516 Mattathur 0 10 4 2 2 0 0 0 0 5 0 0 0 0 0 1 0 0 0 0 1 0 0 0 0 0 0 0 2 0 0 2
87 32070517 Kodassery 0 11 2 1 1 0 0 0 0 4 1 0 0 0 0 1 0 0 0 0 1 0 0 0 0 0 0 0 0 0 0 0
88 32070518 Pariyaram 0 6 2 1 0 0 0 0 0 5 0 0 0 0 0 1 0 0 0 1 1 0 0 0 0 0 0 0 0 0 0 1
89 32070519 Vellangallur 1 8 1 1 0 0 0 0 0 6 0 0 0 0 3 1 0 0 0 1 1 0 0 0 0 0 0 0 0 0 0 1
90 32070520 Puthenchira 0 0 0 0 0 0 0 0 0 0 0 0 0 0 0 1 0 0 0 1 1 0 0 0 0 0 0 0 0 0 0 0
91 32070521 Mala 2 22 10 3 2 1 0 1 0 5 0 0 1 1 0 0 0 0 0 0 1 0 0 0 0 1 0 1 2 0 0 1
92 32070522 Kadukkutty 0 8 3 0 0 0 0 0 0 6 0 0 0 0 0 1 0 0 0 2 1 0 0 0 0 1 0 0 1 0 0 1
93 32070523 Melur 0 12 1 0 0 0 0 0 0 2 0 0 0 0 0 1 0 0 0 1 1 0 0 0 1 0 0 1 0 0 0 1
94 32070524 Koratty 0 12 3 1 0 0 0 2 0 4 0 0 0 0 0 1 0 0 0 0 1 0 0 0 1 0 0 0 1 0 0 1
95 32070525 Annamanada 2 9 4 3 1 0 0 0 0 5 0 1 0 0 0 1 0 0 0 2 1 1 0 0 0 1 0 0 1 0 0 1
96 32070526 Kuzhur 1 4 3 1 0 0 0 0 0 3 0 0 0 0 0 1 0 0 0 0 1 0 0 0 0 0 0 0 0 0 0 1
97 32070530 Irinjalakkuda Municipality 1 19 8 7 3 0 2 0 0 18 1 2 6 1 0 0 0 0 1 1 1 0 1 0 0 2 0 2 0 0 0 1
98 32070535 Chalakkudy Municipality 1 18 12 6 4 0 1 1 0 16 1 1 5 1 1 0 0 0 0 1 1 0 1 0 1 2 2 1 0 0 0 1
99 32070581 Athirappilly 0 5 1 1 0 0 0 0 0 2 0 0 0 0 0 1 0 0 0 1 1 0 0 0 0 0 0 0 0 0 0 1
Sl. N
O.
LS
G C
od
e
LSG Name Po
st
Off
ice
H.O
.
LP
and U
P
HS
HS
S
Art
s &
S
cie
nce
College
BE
d C
ollege
Te
ach
ers
T
rain
ing
Institu
te
Eng C
ollege/ C
ollege
of
Sci
and T
echnol-
ogy/P
oly
Tech
nic
Me
dic
al co
lle
ge
(Ayu
rve
da
/Allo
pa
thy/
Hom
eo)
Banks(N
ational/
sch
ed
ule
d/c
oo
pe
ra-
tive
ba
nk)
Seed F
arm
Mark
et -W
eekly
ITC
/ITI
Ta
luk H
osp
ita
l
CH
C
PH
C
ES
I H
ospital
Su
pe
r sp
ecia
lity
Sp
ecia
lity
Alo
ne
Vete
riin
ary
Ho
spital
Kri
sh
i B
ha
va
n
Ha
tch
eri
es
Fire s
tation
Ferr
ies/B
oat
jetty
Ra
ilw
ay S
tatio
n
Bus s
tand
Cinema Theatere
A B C
Air
po
rt
Un
ive
rsity
Te
lep
ho
ne
e
xch
an
ge
237
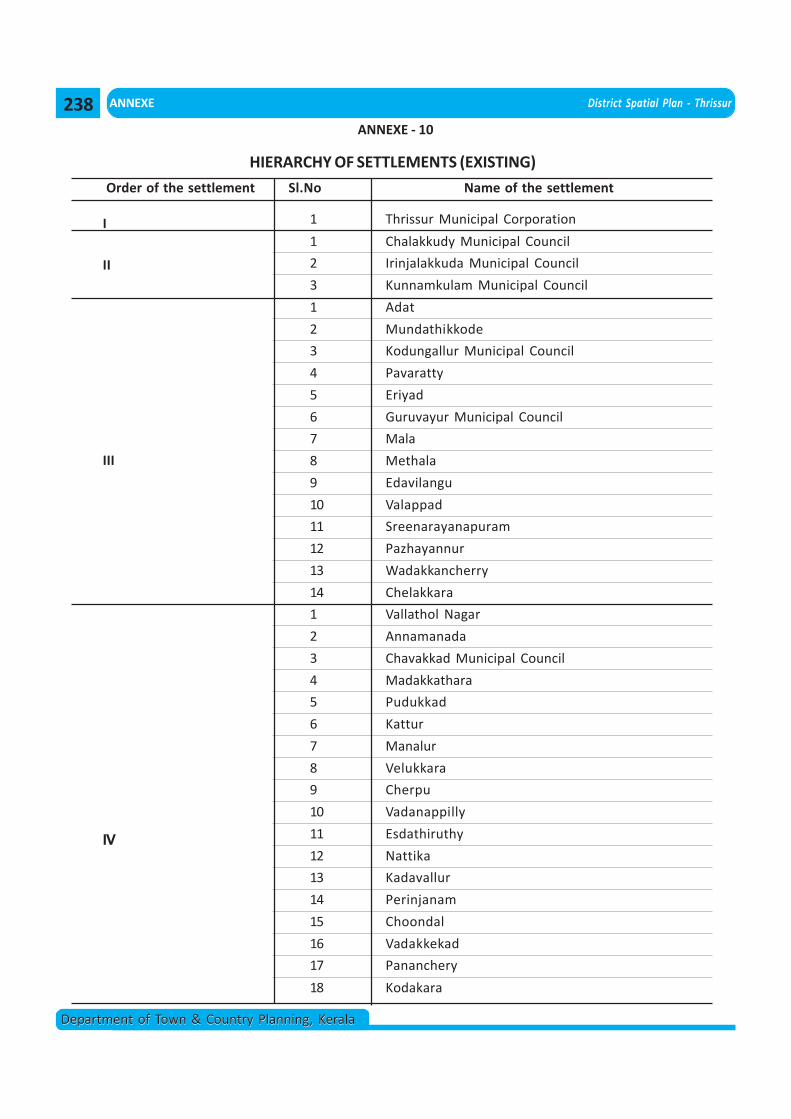
ANNEXE District Spatial Plan - Thrissur
Department of Town & Country Planning, KeralaDepartment of Town & Country Planning, Kerala
HIERARCHY OF SETTLEMENTS (EXISTING)
Order of the settlement Sl.No Name of the settlement
1 Thrissur Municipal Corporation
1 Chalakkudy Municipal Council
2 Irinjalakkuda Municipal Council
3 Kunnamkulam Municipal Council
1 Adat
2 Mundathikkode
3 Kodungallur Municipal Council
4 Pavaratty
5 Eriyad
6 Guruvayur Municipal Council
7 Mala
8 Methala
9 Edavilangu
10 Valappad
11 Sreenarayanapuram
12 Pazhayannur
13 Wadakkancherry
14 Chelakkara
1 Vallathol Nagar
2 Annamanada
3 Chavakkad Municipal Council
4 Madakkathara
5 Pudukkad
6 Kattur
7 Manalur
8 Velukkara
9 Cherpu
10 Vadanappilly
11 Esdathiruthy
12 Nattika
13 Kadavallur
14 Perinjanam
15 Choondal
16 Vadakkekad
17 Pananchery
18 Kodakara
I
II
III
IV
ANNEXE - 10
238
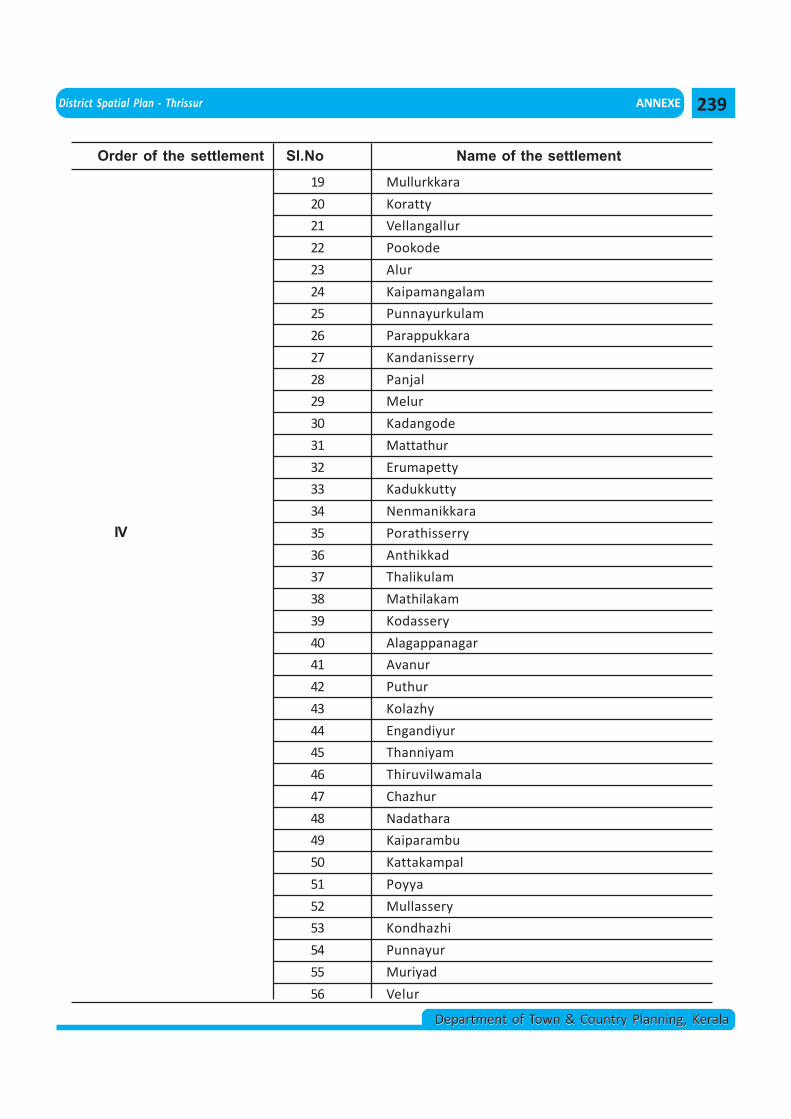
District Spatial Plan - Thrissur ANNEXE
Department of Town & Country Planning, KeralaDepartment of Town & Country Planning, Kerala
19 Mullurkkara
20 Koratty
21 Vellangallur
22 Pookode
23 Alur
24 Kaipamangalam
25 Punnayurkulam
26 Parappukkara
27 Kandanisserry
28 Panjal
29 Melur
30 Kadangode
31 Mattathur
32 Erumapetty
33 Kadukkutty
34 Nenmanikkara
35 Porathisserry
36 Anthikkad
37 Thalikulam
38 Mathilakam
39 Kodassery
40 Alagappanagar
41 Avanur
42 Puthur
43 Kolazhy
44 Engandiyur
45 Thanniyam
46 Thiruvilwamala
47 Chazhur
48 Nadathara
49 Kaiparambu
50 Kattakampal
51 Poyya
52 Mullassery
53 Kondhazhi
54 Punnayur
55 Muriyad
56 Velur
Order of the settlement Sl.No Name of the settlement
IV
239
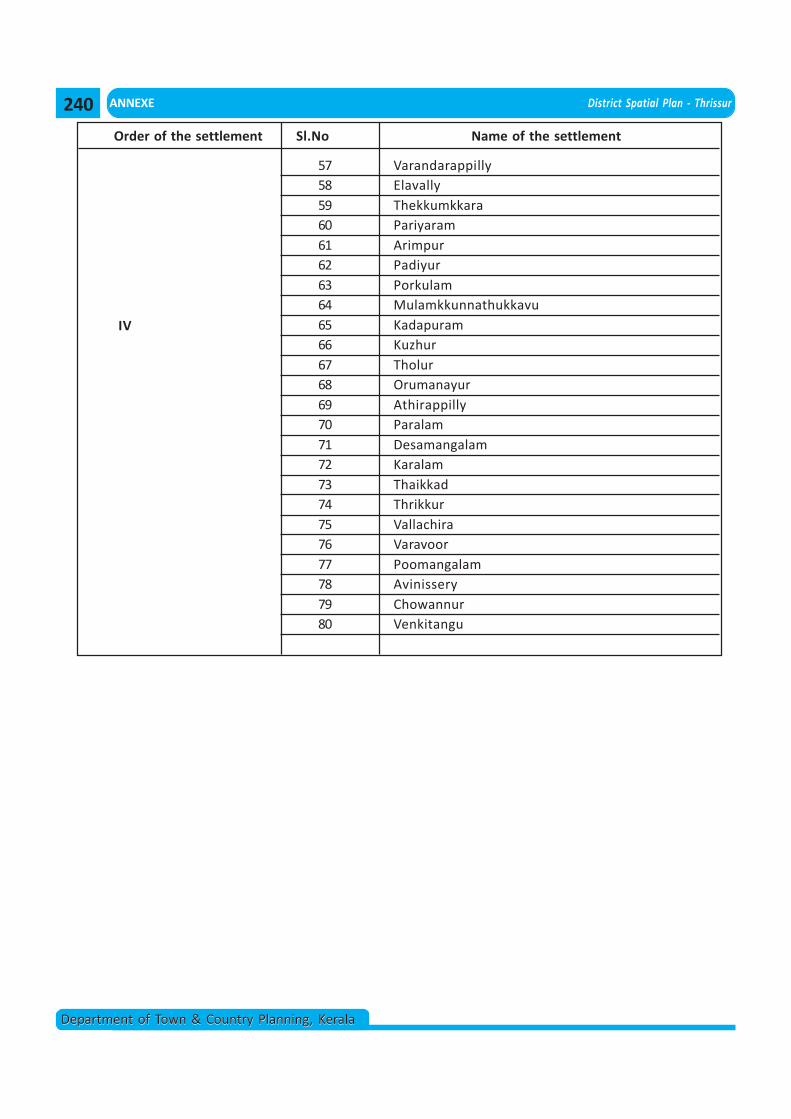
ANNEXE District Spatial Plan - Thrissur
Department of Town & Country Planning, KeralaDepartment of Town & Country Planning, Kerala
57 Varandarappilly58 Elavally59 Thekkumkkara60 Pariyaram61 Arimpur62 Padiyur63 Porkulam64 Mulamkkunnathukkavu65 Kadapuram66 Kuzhur67 Tholur68 Orumanayur69 Athirappilly70 Paralam71 Desamangalam72 Karalam73 Thaikkad74 Thrikkur75 Vallachira76 Varavoor77 Poomangalam78 Avinissery79 Chowannur80 Venkitangu
Order of the settlement Sl.No Name of the settlement
IV
240
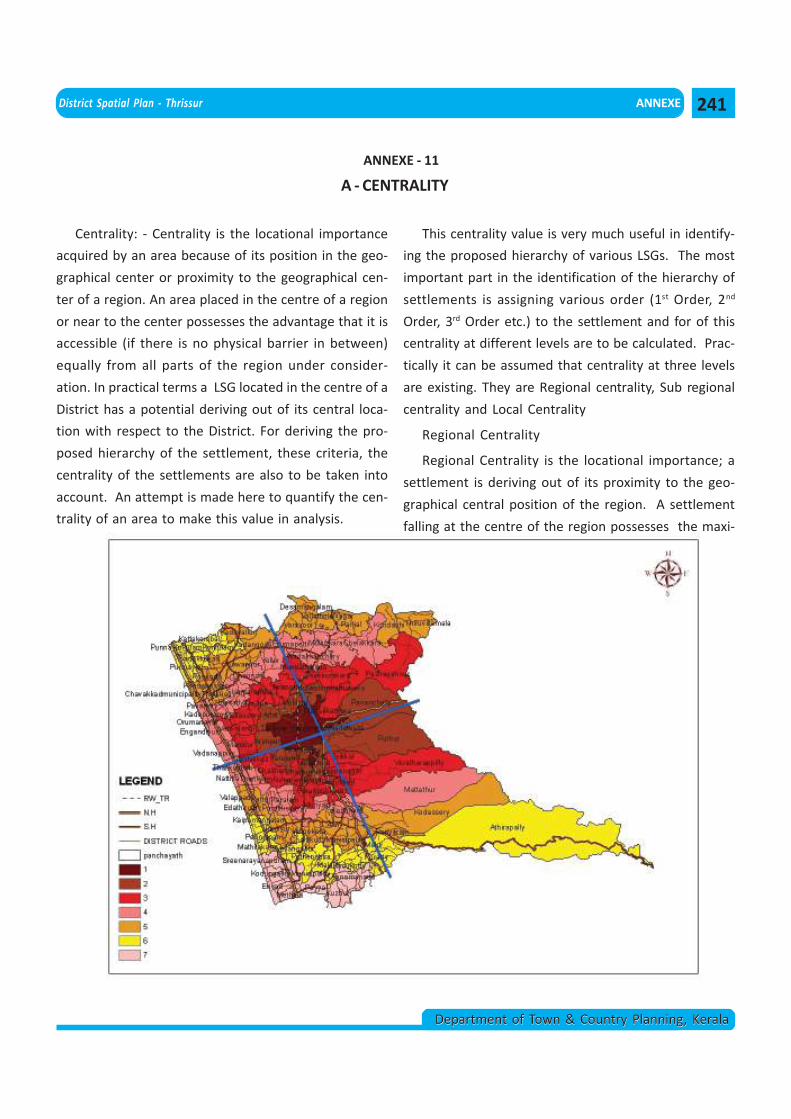
District Spatial Plan - Thrissur ANNEXE
Department of Town & Country Planning, KeralaDepartment of Town & Country Planning, Kerala
Centrality: - Centrality is the locational importance
acquired by an area because of its position in the geo-
graphical center or proximity to the geographical cen-
ter of a region. An area placed in the centre of a region
or near to the center possesses the advantage that it is
accessible (if there is no physical barrier in between)
equally from all parts of the region under consider-
ation. In practical terms a LSG located in the centre of a
District has a potential deriving out of its central loca-
tion with respect to the District. For deriving the pro-
posed hierarchy of the settlement, these criteria, the
centrality of the settlements are also to be taken into
account. An attempt is made here to quantify the cen-
trality of an area to make this value in analysis.
This centrality value is very much useful in identify-
ing the proposed hierarchy of various LSGs. The most
important part in the identification of the hierarchy of
settlements is assigning various order (1st Order, 2nd
Order, 3rd Order etc.) to the settlement and for of this
centrality at different levels are to be calculated. Prac-
tically it can be assumed that centrality at three levels
are existing. They are Regional centrality, Sub regional
centrality and Local Centrality
Regional Centrality
Regional Centrality is the locational importance; a
settlement is deriving out of its proximity to the geo-
graphical central position of the region. A settlement
falling at the centre of the region possesses the maxi-
A - CENTRALITY
ANNEXE - 11
241
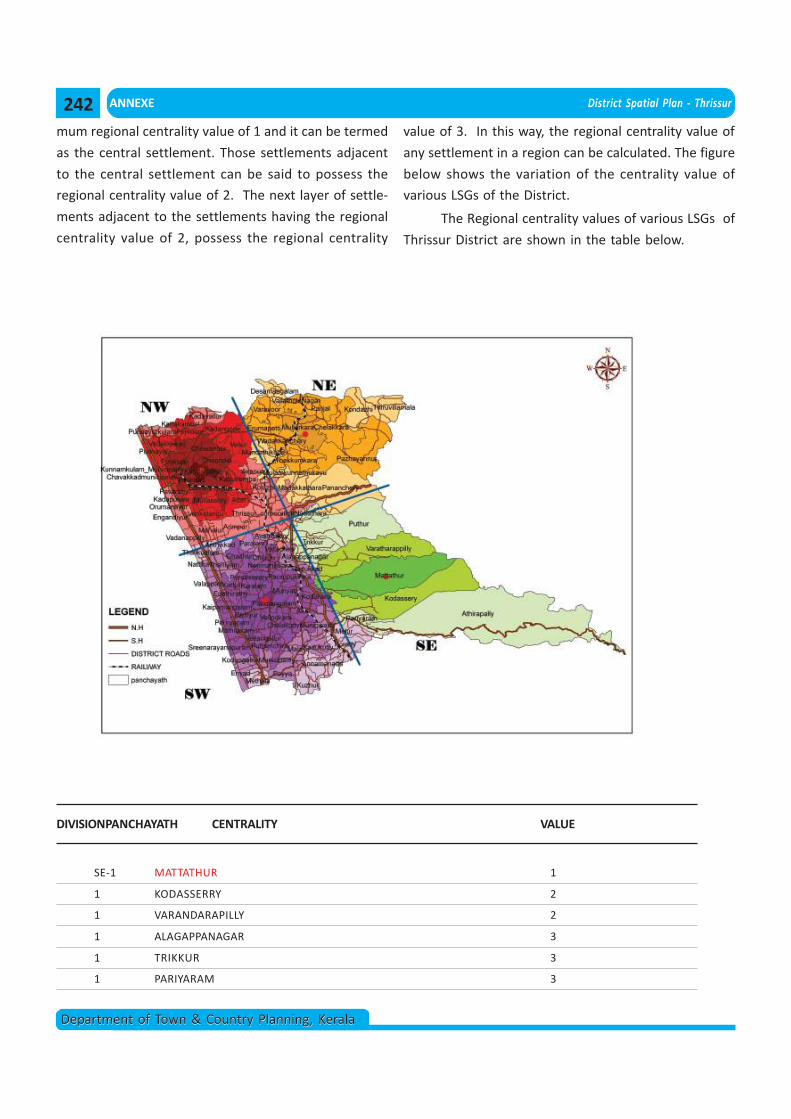
ANNEXE District Spatial Plan - Thrissur
Department of Town & Country Planning, KeralaDepartment of Town & Country Planning, Kerala
DIVISIONPANCHAYATH CENTRALITY VALUE
SE-1 MATTATHUR 1
1 KODASSERRY 2
1 VARANDARAPILLY 2
1 ALAGAPPANAGAR 3
1 TRIKKUR 3
1 PARIYARAM 3
mum regional centrality value of 1 and it can be termed
as the central settlement. Those settlements adjacent
to the central settlement can be said to possess the
regional centrality value of 2. The next layer of settle-
ments adjacent to the settlements having the regional
centrality value of 2, possess the regional centrality
value of 3. In this way, the regional centrality value of
any settlement in a region can be calculated. The figure
below shows the variation of the centrality value of
various LSGs of the District.
The Regional centrality values of various LSGs of
Thrissur District are shown in the table below.
242
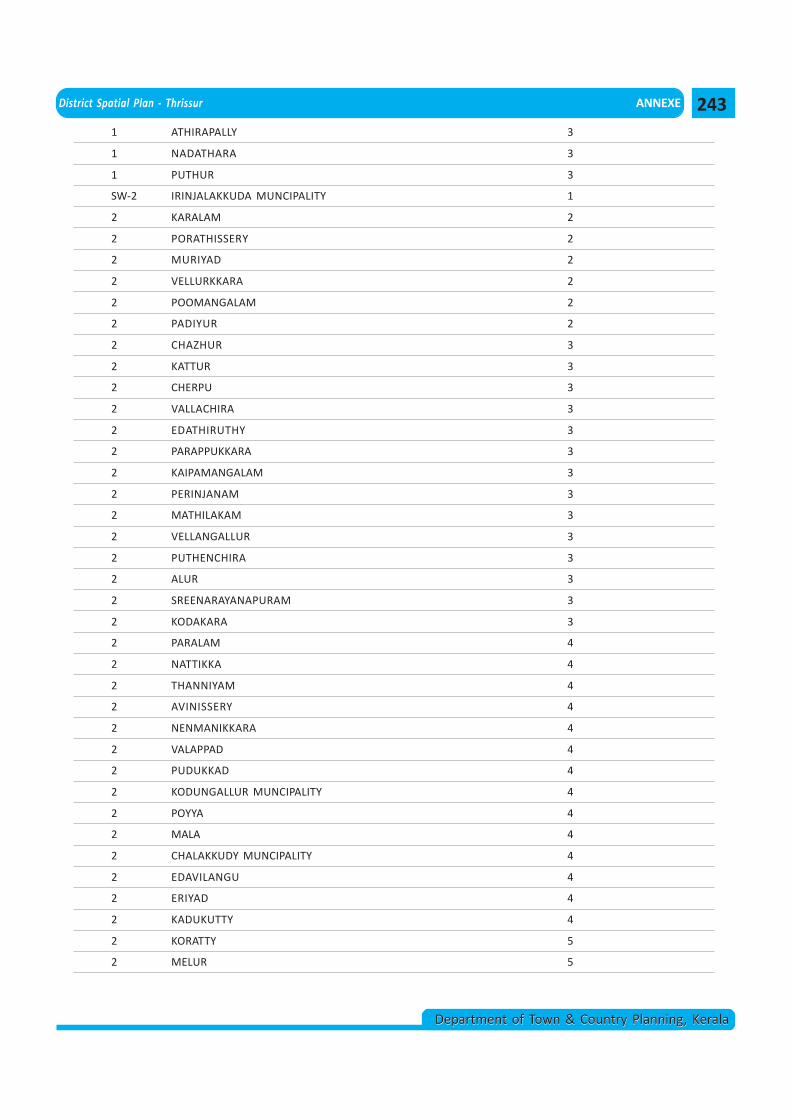
District Spatial Plan - Thrissur ANNEXE
Department of Town & Country Planning, KeralaDepartment of Town & Country Planning, Kerala
1 ATHIRAPALLY 3
1 NADATHARA 3
1 PUTHUR 3
SW-2 IRINJALAKKUDA MUNCIPALITY 1
2 KARALAM 2
2 PORATHISSERY 2
2 MURIYAD 2
2 VELLURKKARA 2
2 POOMANGALAM 2
2 PADIYUR 2
2 CHAZHUR 3
2 KATTUR 3
2 CHERPU 3
2 VALLACHIRA 3
2 EDATHIRUTHY 3
2 PARAPPUKKARA 3
2 KAIPAMANGALAM 3
2 PERINJANAM 3
2 MATHILAKAM 3
2 VELLANGALLUR 3
2 PUTHENCHIRA 3
2 ALUR 3
2 SREENARAYANAPURAM 3
2 KODAKARA 3
2 PARALAM 4
2 NATTIKKA 4
2 THANNIYAM 4
2 AVINISSERY 4
2 NENMANIKKARA 4
2 VALAPPAD 4
2 PUDUKKAD 4
2 KODUNGALLUR MUNCIPALITY 4
2 POYYA 4
2 MALA 4
2 CHALAKKUDY MUNCIPALITY 4
2 EDAVILANGU 4
2 ERIYAD 4
2 KADUKUTTY 4
2 KORATTY 5
2 MELUR 5
243
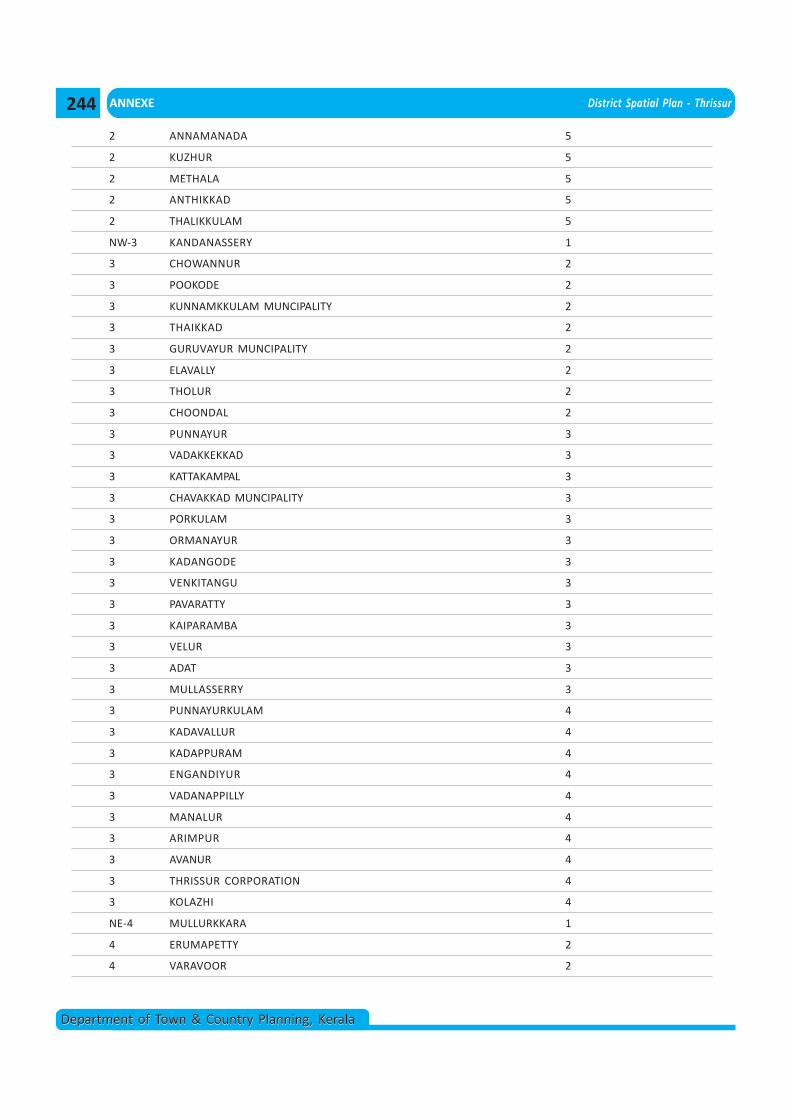
ANNEXE District Spatial Plan - Thrissur
Department of Town & Country Planning, KeralaDepartment of Town & Country Planning, Kerala
2 ANNAMANADA 5
2 KUZHUR 5
2 METHALA 5
2 ANTHIKKAD 5
2 THALIKKULAM 5
NW-3 KANDANASSERY 1
3 CHOWANNUR 2
3 POOKODE 2
3 KUNNAMKKULAM MUNCIPALITY 2
3 THAIKKAD 2
3 GURUVAYUR MUNCIPALITY 2
3 ELAVALLY 2
3 THOLUR 2
3 CHOONDAL 2
3 PUNNAYUR 3
3 VADAKKEKKAD 3
3 KATTAKAMPAL 3
3 CHAVAKKAD MUNCIPALITY 3
3 PORKULAM 3
3 ORMANAYUR 3
3 KADANGODE 3
3 VENKITANGU 3
3 PAVARATTY 3
3 KAIPARAMBA 3
3 VELUR 3
3 ADAT 3
3 MULLASSERRY 3
3 PUNNAYURKULAM 4
3 KADAVALLUR 4
3 KADAPPURAM 4
3 ENGANDIYUR 4
3 VADANAPPILLY 4
3 MANALUR 4
3 ARIMPUR 4
3 AVANUR 4
3 THRISSUR CORPORATION 4
3 KOLAZHI 4
NE-4 MULLURKKARA 1
4 ERUMAPETTY 2
4 VARAVOOR 2
244
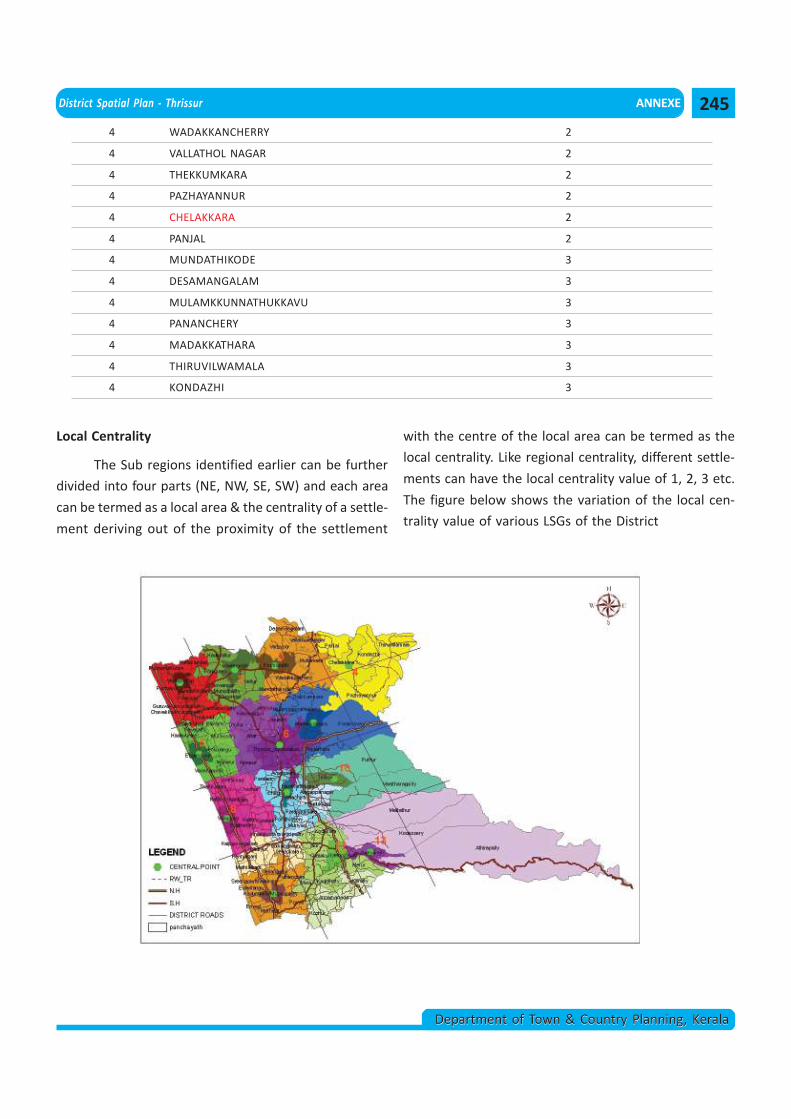
District Spatial Plan - Thrissur ANNEXE
Department of Town & Country Planning, KeralaDepartment of Town & Country Planning, Kerala
4 WADAKKANCHERRY 2
4 VALLATHOL NAGAR 2
4 THEKKUMKARA 2
4 PAZHAYANNUR 2
4 CHELAKKARA 2
4 PANJAL 2
4 MUNDATHIKODE 3
4 DESAMANGALAM 3
4 MULAMKKUNNATHUKKAVU 3
4 PANANCHERY 3
4 MADAKKATHARA 3
4 THIRUVILWAMALA 3
4 KONDAZHI 3
Local Centrality
The Sub regions identified earlier can be further
divided into four parts (NE, NW, SE, SW) and each area
can be termed as a local area & the centrality of a settle-
ment deriving out of the proximity of the settlement
with the centre of the local area can be termed as the
local centrality. Like regional centrality, different settle-
ments can have the local centrality value of 1, 2, 3 etc.
The figure below shows the variation of the local cen-
trality value of various LSGs of the District
245
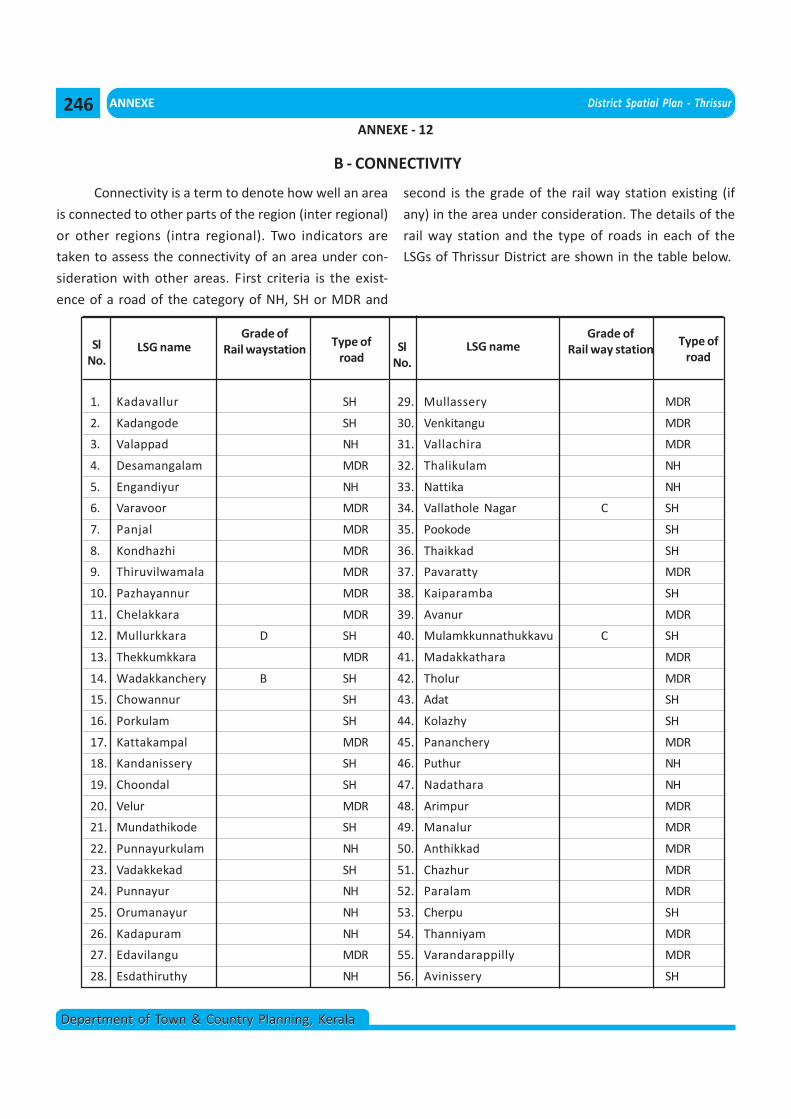
ANNEXE District Spatial Plan - Thrissur
Department of Town & Country Planning, KeralaDepartment of Town & Country Planning, Kerala
Connectivity is a term to denote how well an area
is connected to other parts of the region (inter regional)
or other regions (intra regional). Two indicators are
taken to assess the connectivity of an area under con-
sideration with other areas. First criteria is the exist-
ence of a road of the category of NH, SH or MDR and
LSG nameGrade of
Rail waystationType of
road
1. Kadavallur SH
2. Kadangode SH
3. Valappad NH
4. Desamangalam MDR
5. Engandiyur NH
6. Varavoor MDR
7. Panjal MDR
8. Kondhazhi MDR
9. Thiruvilwamala MDR
10. Pazhayannur MDR
11. Chelakkara MDR
12. Mullurkkara D SH
13. Thekkumkkara MDR
14. Wadakkanchery B SH
15. Chowannur SH
16. Porkulam SH
17. Kattakampal MDR
18. Kandanissery SH
19. Choondal SH
20. Velur MDR
21. Mundathikode SH
22. Punnayurkulam NH
23. Vadakkekad SH
24. Punnayur NH
25. Orumanayur NH
26. Kadapuram NH
27. Edavilangu MDR
28. Esdathiruthy NH
29. Mullassery MDR
30. Venkitangu MDR
31. Vallachira MDR
32. Thalikulam NH
33. Nattika NH
34. Vallathole Nagar C SH
35. Pookode SH
36. Thaikkad SH
37. Pavaratty MDR
38. Kaiparamba SH
39. Avanur MDR
40. Mulamkkunnathukkavu C SH
41. Madakkathara MDR
42. Tholur MDR
43. Adat SH
44. Kolazhy SH
45. Pananchery MDR
46. Puthur NH
47. Nadathara NH
48. Arimpur MDR
49. Manalur MDR
50. Anthikkad MDR
51. Chazhur MDR
52. Paralam MDR
53. Cherpu SH
54. Thanniyam MDR
55. Varandarappilly MDR
56. Avinissery SH
LSG nameGrade of
Rail way stationType of
roadSl
No.Sl
No.
second is the grade of the rail way station existing (if
any) in the area under consideration. The details of the
rail way station and the type of roads in each of the
LSGs of Thrissur District are shown in the table below.
B - CONNECTIVITY
ANNEXE - 12
246
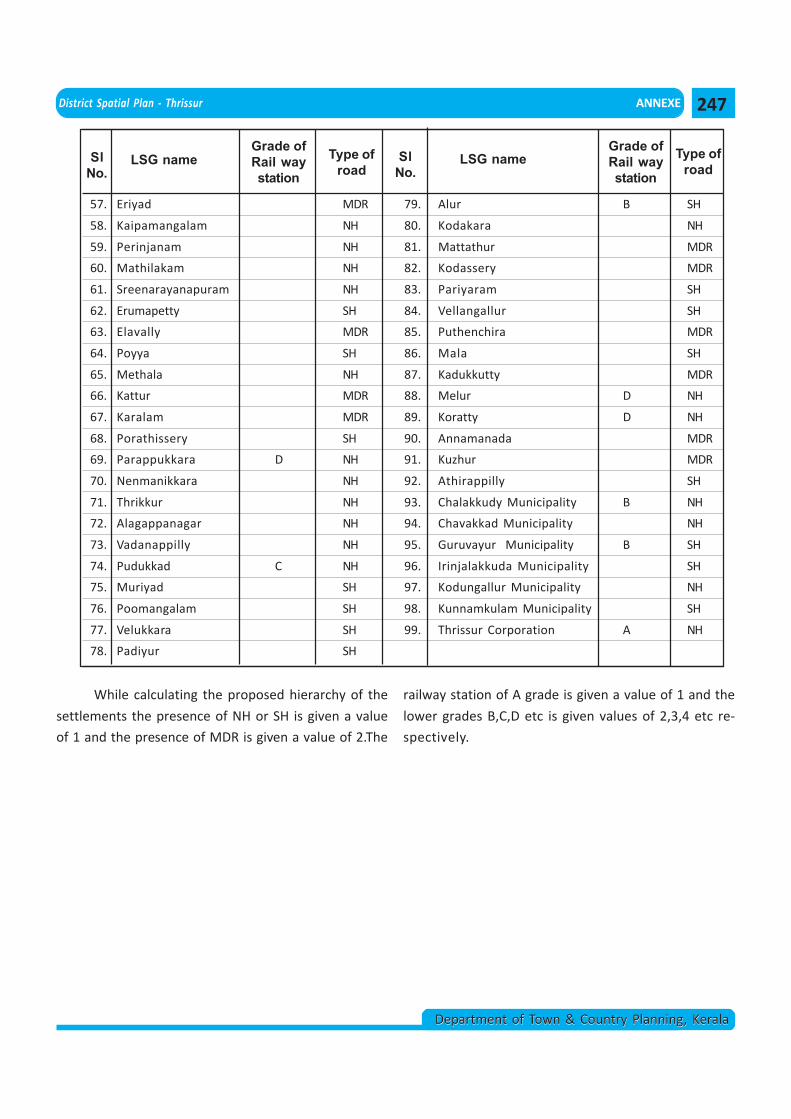
District Spatial Plan - Thrissur ANNEXE
Department of Town & Country Planning, KeralaDepartment of Town & Country Planning, Kerala
57. Eriyad MDR
58. Kaipamangalam NH
59. Perinjanam NH
60. Mathilakam NH
61. Sreenarayanapuram NH
62. Erumapetty SH
63. Elavally MDR
64. Poyya SH
65. Methala NH
66. Kattur MDR
67. Karalam MDR
68. Porathissery SH
69. Parappukkara D NH
70. Nenmanikkara NH
71. Thrikkur NH
72. Alagappanagar NH
73. Vadanappilly NH
74. Pudukkad C NH
75. Muriyad SH
76. Poomangalam SH
77. Velukkara SH
78. Padiyur SH
79. Alur B SH
80. Kodakara NH
81. Mattathur MDR
82. Kodassery MDR
83. Pariyaram SH
84. Vellangallur SH
85. Puthenchira MDR
86. Mala SH
87. Kadukkutty MDR
88. Melur D NH
89. Koratty D NH
90. Annamanada MDR
91. Kuzhur MDR
92. Athirappilly SH
93. Chalakkudy Municipality B NH
94. Chavakkad Municipality NH
95. Guruvayur Municipality B SH
96. Irinjalakkuda Municipality SH
97. Kodungallur Municipality NH
98. Kunnamkulam Municipality SH
99. Thrissur Corporation A NH
LSG nameGrade ofRail waystation
Type ofroad
LSG nameGrade ofRail waystation
Type ofroad
SlNo.
SlNo.
While calculating the proposed hierarchy of the
settlements the presence of NH or SH is given a value
of 1 and the presence of MDR is given a value of 2.The
railway station of A grade is given a value of 1 and the
lower grades B,C,D etc is given values of 2,3,4 etc re-
spectively.
247
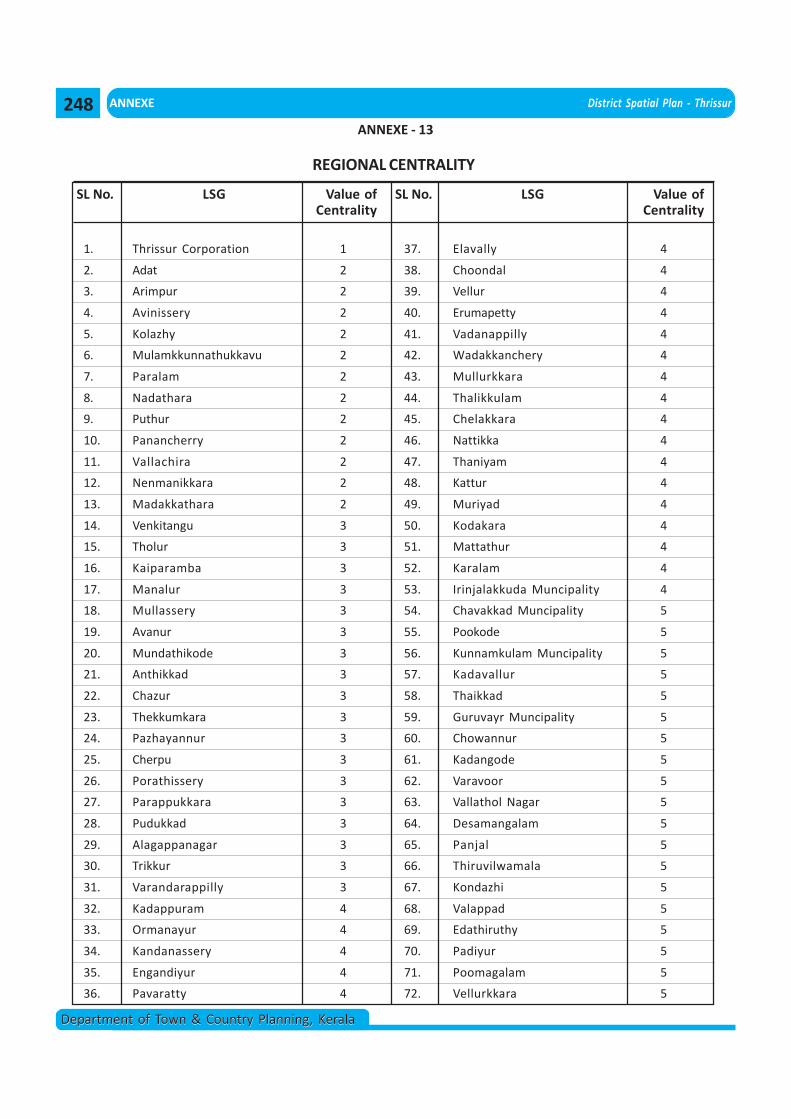
ANNEXE District Spatial Plan - Thrissur
Department of Town & Country Planning, KeralaDepartment of Town & Country Planning, Kerala
REGIONAL CENTRALITY
SL No. LSG Value ofCentrality
1. Thrissur Corporation 1
2. Adat 2
3. Arimpur 2
4. Avinissery 2
5. Kolazhy 2
6. Mulamkkunnathukkavu 2
7. Paralam 2
8. Nadathara 2
9. Puthur 2
10. Panancherry 2
11. Vallachira 2
12. Nenmanikkara 2
13. Madakkathara 2
14. Venkitangu 3
15. Tholur 3
16. Kaiparamba 3
17. Manalur 3
18. Mullassery 3
19. Avanur 3
20. Mundathikode 3
21. Anthikkad 3
22. Chazur 3
23. Thekkumkara 3
24. Pazhayannur 3
25. Cherpu 3
26. Porathissery 3
27. Parappukkara 3
28. Pudukkad 3
29. Alagappanagar 3
30. Trikkur 3
31. Varandarappilly 3
32. Kadappuram 4
33. Ormanayur 4
34. Kandanassery 4
35. Engandiyur 4
36. Pavaratty 4
37. Elavally 4
38. Choondal 4
39. Vellur 4
40. Erumapetty 4
41. Vadanappilly 4
42. Wadakkanchery 4
43. Mullurkkara 4
44. Thalikkulam 4
45. Chelakkara 4
46. Nattikka 4
47. Thaniyam 4
48. Kattur 4
49. Muriyad 4
50. Kodakara 4
51. Mattathur 4
52. Karalam 4
53. Irinjalakkuda Muncipality 4
54. Chavakkad Muncipality 5
55. Pookode 5
56. Kunnamkulam Muncipality 5
57. Kadavallur 5
58. Thaikkad 5
59. Guruvayr Muncipality 5
60. Chowannur 5
61. Kadangode 5
62. Varavoor 5
63. Vallathol Nagar 5
64. Desamangalam 5
65. Panjal 5
66. Thiruvilwamala 5
67. Kondazhi 5
68. Valappad 5
69. Edathiruthy 5
70. Padiyur 5
71. Poomagalam 5
72. Vellurkkara 5
SL No. LSG Value ofCentrality
ANNEXE - 13
248
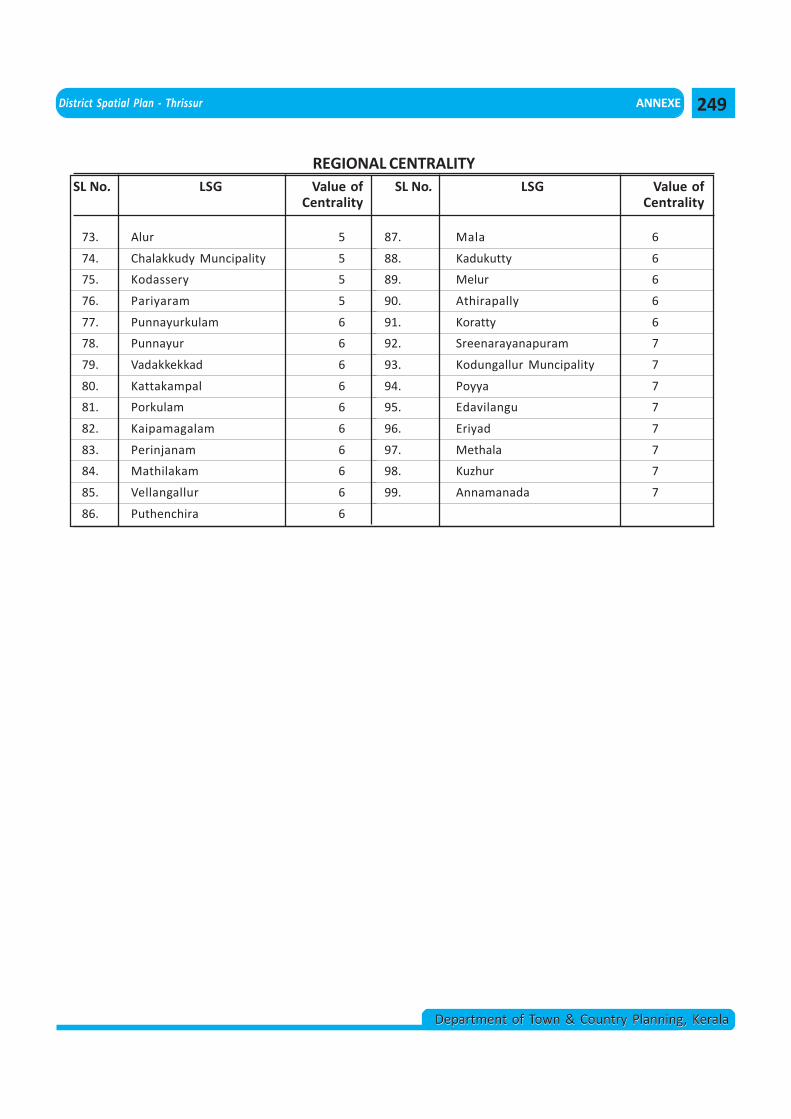
District Spatial Plan - Thrissur ANNEXE
Department of Town & Country Planning, KeralaDepartment of Town & Country Planning, Kerala
73. Alur 5
74. Chalakkudy Muncipality 5
75. Kodassery 5
76. Pariyaram 5
77. Punnayurkulam 6
78. Punnayur 6
79. Vadakkekkad 6
80. Kattakampal 6
81. Porkulam 6
82. Kaipamagalam 6
83. Perinjanam 6
84. Mathilakam 6
85. Vellangallur 6
86. Puthenchira 6
87. Mala 6
88. Kadukutty 6
89. Melur 6
90. Athirapally 6
91. Koratty 6
92. Sreenarayanapuram 7
93. Kodungallur Muncipality 7
94. Poyya 7
95. Edavilangu 7
96. Eriyad 7
97. Methala 7
98. Kuzhur 7
99. Annamanada 7
REGIONAL CENTRALITYSL No. LSG Value of
CentralitySL No. LSG Value of
Centrality
249
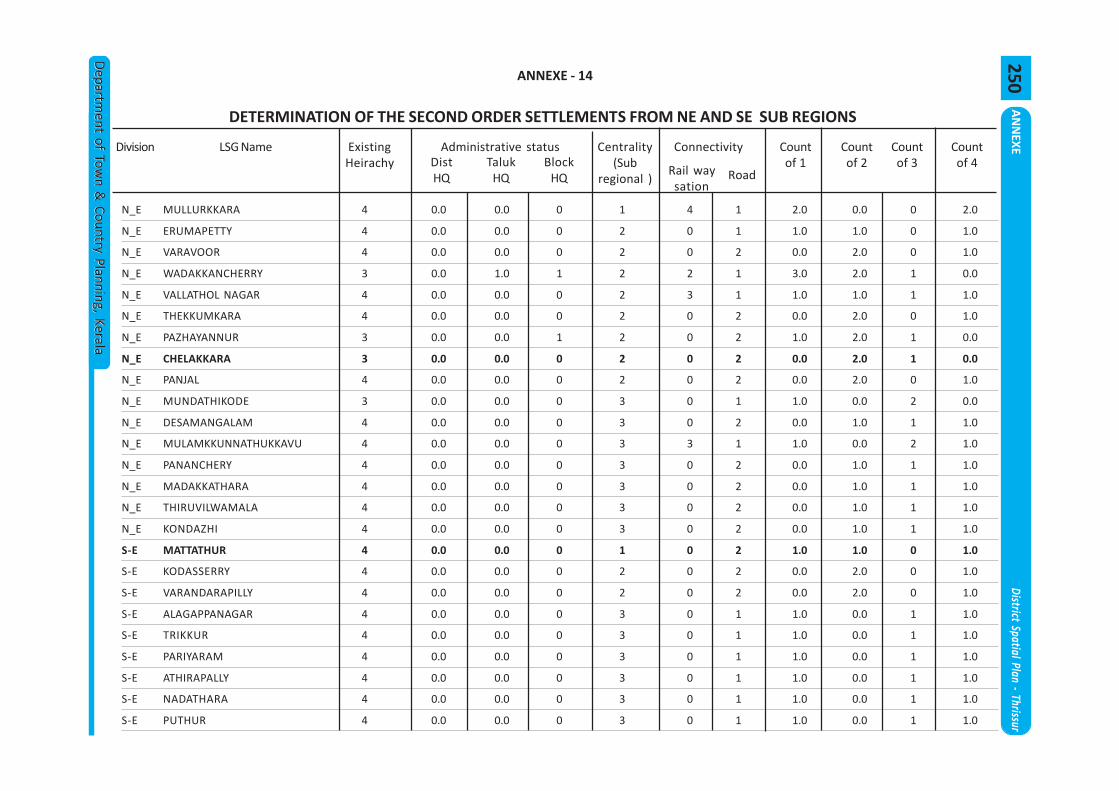
AN
NEXE
District Spatial Plan - Thrissur
Departm
ent of Town &
Country Planning, KeralaD
epartment of Tow
n & Country Planning, Kerala
DETERMINATION OF THE SECOND ORDER SETTLEMENTS FROM NE AND SE SUB REGIONS
N_E MULLURKKARA 4 0.0 0.0 0 1 4 1 2.0 0.0 0 2.0
N_E ERUMAPETTY 4 0.0 0.0 0 2 0 1 1.0 1.0 0 1.0
N_E VARAVOOR 4 0.0 0.0 0 2 0 2 0.0 2.0 0 1.0
N_E WADAKKANCHERRY 3 0.0 1.0 1 2 2 1 3.0 2.0 1 0.0
N_E VALLATHOL NAGAR 4 0.0 0.0 0 2 3 1 1.0 1.0 1 1.0
N_E THEKKUMKARA 4 0.0 0.0 0 2 0 2 0.0 2.0 0 1.0
N_E PAZHAYANNUR 3 0.0 0.0 1 2 0 2 1.0 2.0 1 0.0
N_E CHELAKKARA 3 0.0 0.0 0 2 0 2 0.0 2.0 1 0.0
N_E PANJAL 4 0.0 0.0 0 2 0 2 0.0 2.0 0 1.0
N_E MUNDATHIKODE 3 0.0 0.0 0 3 0 1 1.0 0.0 2 0.0
N_E DESAMANGALAM 4 0.0 0.0 0 3 0 2 0.0 1.0 1 1.0
N_E MULAMKKUNNATHUKKAVU 4 0.0 0.0 0 3 3 1 1.0 0.0 2 1.0
N_E PANANCHERY 4 0.0 0.0 0 3 0 2 0.0 1.0 1 1.0
N_E MADAKKATHARA 4 0.0 0.0 0 3 0 2 0.0 1.0 1 1.0
N_E THIRUVILWAMALA 4 0.0 0.0 0 3 0 2 0.0 1.0 1 1.0
N_E KONDAZHI 4 0.0 0.0 0 3 0 2 0.0 1.0 1 1.0
S-E MATTATHUR 4 0.0 0.0 0 1 0 2 1.0 1.0 0 1.0
S-E KODASSERRY 4 0.0 0.0 0 2 0 2 0.0 2.0 0 1.0
S-E VARANDARAPILLY 4 0.0 0.0 0 2 0 2 0.0 2.0 0 1.0
S-E ALAGAPPANAGAR 4 0.0 0.0 0 3 0 1 1.0 0.0 1 1.0
S-E TRIKKUR 4 0.0 0.0 0 3 0 1 1.0 0.0 1 1.0
S-E PARIYARAM 4 0.0 0.0 0 3 0 1 1.0 0.0 1 1.0
S-E ATHIRAPALLY 4 0.0 0.0 0 3 0 1 1.0 0.0 1 1.0
S-E NADATHARA 4 0.0 0.0 0 3 0 1 1.0 0.0 1 1.0
S-E PUTHUR 4 0.0 0.0 0 3 0 1 1.0 0.0 1 1.0
Division LSG Name ExistingHeirachy
Administrative statusDistHQ
TalukHQ
BlockHQ
Centrality(Sub
regional )
Connectivity
Rail waysation
Road
Countof 1
Countof 2
Countof 3
Countof 4
ANNEXE - 14
250
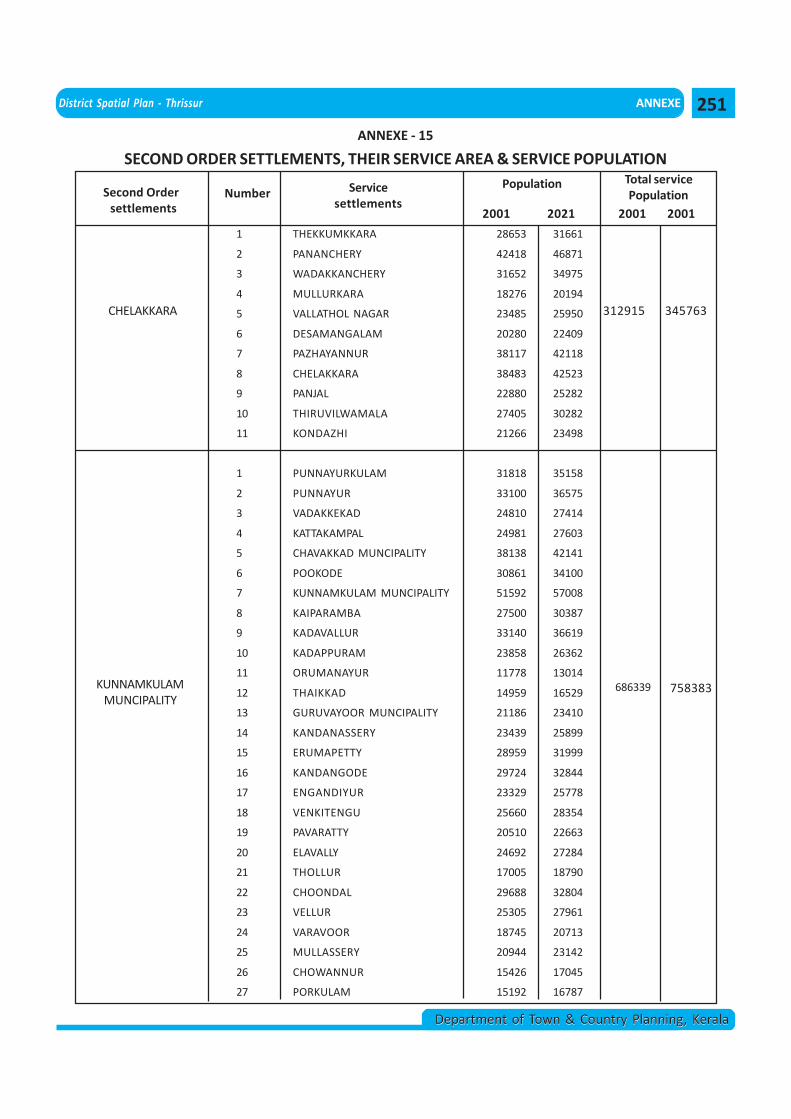
District Spatial Plan - Thrissur ANNEXE
Department of Town & Country Planning, KeralaDepartment of Town & Country Planning, Kerala
SECOND ORDER SETTLEMENTS, THEIR SERVICE AREA & SERVICE POPULATION
Second Order settlements
Number Servicesettlements
Population Total servicePopulation
CHELAKKARA
2001 2021 2001 2001
1 THEKKUMKKARA 28653 31661
2 PANANCHERY 42418 46871
3 WADAKKANCHERY 31652 34975
4 MULLURKARA 18276 20194
5 VALLATHOL NAGAR 23485 25950
6 DESAMANGALAM 20280 22409
7 PAZHAYANNUR 38117 42118
8 CHELAKKARA 38483 42523
9 PANJAL 22880 25282
10 THIRUVILWAMALA 27405 30282
11 KONDAZHI 21266 23498
1 PUNNAYURKULAM 31818 35158
2 PUNNAYUR 33100 36575
3 VADAKKEKAD 24810 27414
4 KATTAKAMPAL 24981 27603
5 CHAVAKKAD MUNCIPALITY 38138 42141
6 POOKODE 30861 34100
7 KUNNAMKULAM MUNCIPALITY 51592 57008
8 KAIPARAMBA 27500 30387
9 KADAVALLUR 33140 36619
10 KADAPPURAM 23858 26362
11 ORUMANAYUR 11778 13014
12 THAIKKAD 14959 16529
13 GURUVAYOOR MUNCIPALITY 21186 23410
14 KANDANASSERY 23439 25899
15 ERUMAPETTY 28959 31999
16 KANDANGODE 29724 32844
17 ENGANDIYUR 23329 25778
18 VENKITENGU 25660 28354
19 PAVARATTY 20510 22663
20 ELAVALLY 24692 27284
21 THOLLUR 17005 18790
22 CHOONDAL 29688 32804
23 VELLUR 25305 27961
24 VARAVOOR 18745 20713
25 MULLASSERY 20944 23142
26 CHOWANNUR 15426 17045
27 PORKULAM 15192 16787
312915 345763
KUNNAMKULAMMUNCIPALITY
686339 758383
ANNEXE - 15
251
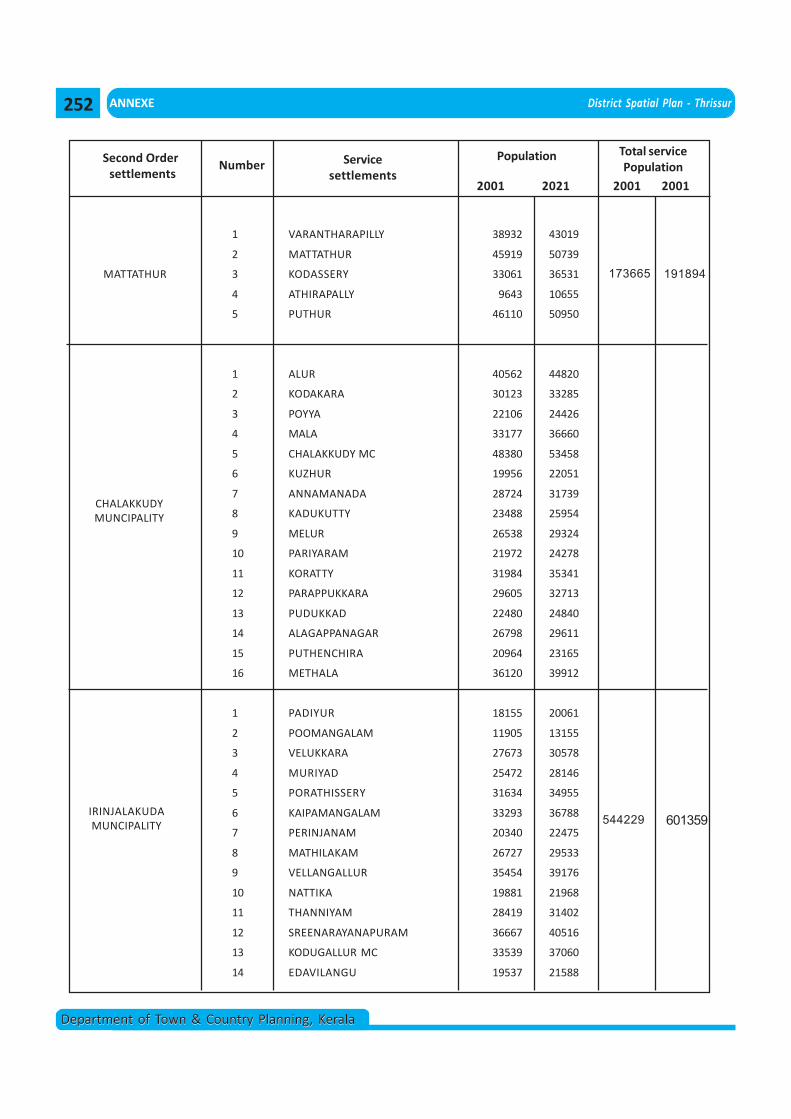
ANNEXE District Spatial Plan - Thrissur
Department of Town & Country Planning, KeralaDepartment of Town & Country Planning, Kerala
1 VARANTHARAPILLY 38932 43019
2 MATTATHUR 45919 50739
3 KODASSERY 33061 36531
4 ATHIRAPALLY 9643 10655
5 PUTHUR 46110 50950
1 ALUR 40562 44820
2 KODAKARA 30123 33285
3 POYYA 22106 24426
4 MALA 33177 36660
5 CHALAKKUDY MC 48380 53458
6 KUZHUR 19956 22051
7 ANNAMANADA 28724 31739
8 KADUKUTTY 23488 25954
9 MELUR 26538 29324
10 PARIYARAM 21972 24278
11 KORATTY 31984 35341
12 PARAPPUKKARA 29605 32713
13 PUDUKKAD 22480 24840
14 ALAGAPPANAGAR 26798 29611
15 PUTHENCHIRA 20964 23165
16 METHALA 36120 39912
1 PADIYUR 18155 20061
2 POOMANGALAM 11905 13155
3 VELUKKARA 27673 30578
4 MURIYAD 25472 28146
5 PORATHISSERY 31634 34955
6 KAIPAMANGALAM 33293 36788
7 PERINJANAM 20340 22475
8 MATHILAKAM 26727 29533
9 VELLANGALLUR 35454 39176
10 NATTIKA 19881 21968
11 THANNIYAM 28419 31402
12 SREENARAYANAPURAM 36667 40516
13 KODUGALLUR MC 33539 37060
14 EDAVILANGU 19537 21588
Second Order settlements
Number Servicesettlements
Population Total servicePopulation
2001 2021 2001 2001
MATTATHUR
CHALAKKUDYMUNCIPALITY
173665 191894
IRINJALAKUDAMUNCIPALITY 544229 601359
252
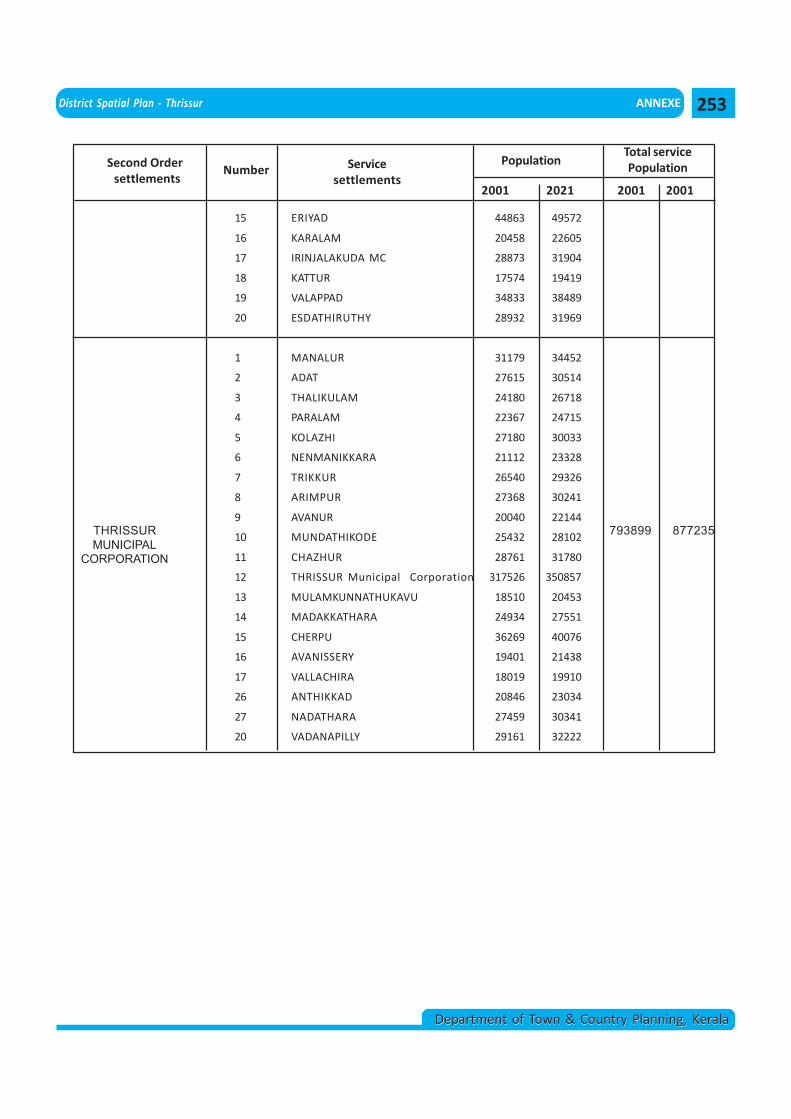
District Spatial Plan - Thrissur ANNEXE
Department of Town & Country Planning, KeralaDepartment of Town & Country Planning, Kerala
15 ERIYAD 44863 49572
16 KARALAM 20458 22605
17 IRINJALAKUDA MC 28873 31904
18 KATTUR 17574 19419
19 VALAPPAD 34833 38489
20 ESDATHIRUTHY 28932 31969
1 MANALUR 31179 34452
2 ADAT 27615 30514
3 THALIKULAM 24180 26718
4 PARALAM 22367 24715
5 KOLAZHI 27180 30033
6 NENMANIKKARA 21112 23328
7 TRIKKUR 26540 29326
8 ARIMPUR 27368 30241
9 AVANUR 20040 22144
10 MUNDATHIKODE 25432 28102
11 CHAZHUR 28761 31780
12 THRISSUR Municipal Corporation 317526 350857
13 MULAMKUNNATHUKAVU 18510 20453
14 MADAKKATHARA 24934 27551
15 CHERPU 36269 40076
16 AVANISSERY 19401 21438
17 VALLACHIRA 18019 19910
26 ANTHIKKAD 20846 23034
27 NADATHARA 27459 30341
20 VADANAPILLY 29161 32222
THRISSURMUNICIPAL
CORPORATION
793899
Second Order settlements
Number Servicesettlements
PopulationTotal servicePopulation
2001 2021 2001 2001
877235
253
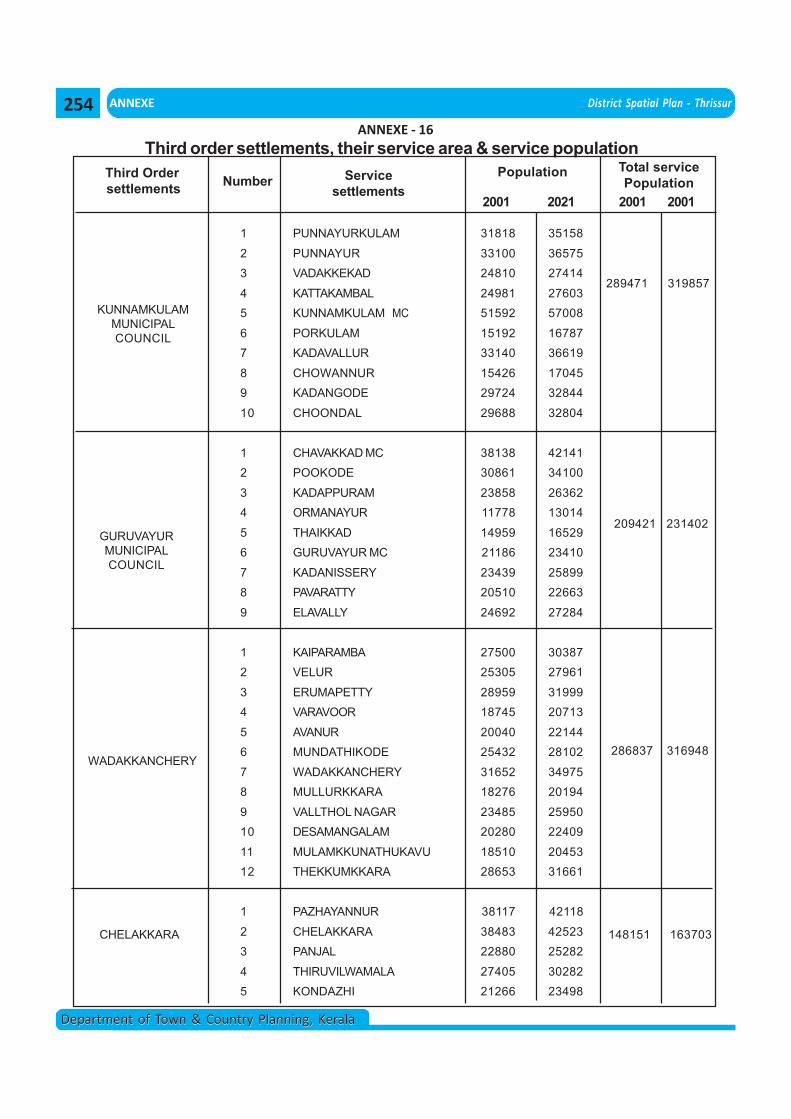
ANNEXE District Spatial Plan - Thrissur
Department of Town & Country Planning, KeralaDepartment of Town & Country Planning, Kerala
Third order settlements, their service area & service populationThird Order settlements Number Service
settlementsPopulation Total service
Population
KUNNAMKULAMMUNICIPALCOUNCIL
2001 2021 2001 2001
1 PUNNAYURKULAM 31818 35158
2 PUNNAYUR 33100 365753 VADAKKEKAD 24810 27414
4 KATTAKAMBAL 24981 276035 KUNNAMKULAM MC 51592 57008
6 PORKULAM 15192 167877 KADAVALLUR 33140 36619
8 CHOWANNUR 15426 170459 KADANGODE 29724 32844
10 CHOONDAL 29688 32804
1 CHAVAKKAD MC 38138 421412 POOKODE 30861 34100
3 KADAPPURAM 23858 263624 ORMANAYUR 11778 13014
5 THAIKKAD 14959 165296 GURUVAYUR MC 21186 23410
7 KADANISSERY 23439 258998 PAVARATTY 20510 22663
9 ELAVALLY 24692 27284
1 KAIPARAMBA 27500 303872 VELUR 25305 27961
3 ERUMAPETTY 28959 319994 VARAVOOR 18745 20713
5 AVANUR 20040 221446 MUNDATHIKODE 25432 28102
7 WADAKKANCHERY 31652 349758 MULLURKKARA 18276 20194
9 VALLTHOL NAGAR 23485 2595010 DESAMANGALAM 20280 22409
11 MULAMKKUNATHUKAVU 18510 2045312 THEKKUMKKARA 28653 31661
1 PAZHAYANNUR 38117 42118
2 CHELAKKARA 38483 425233 PANJAL 22880 25282
4 THIRUVILWAMALA 27405 302825 KONDAZHI 21266 23498
GURUVAYURMUNICIPALCOUNCIL
289471 319857
209421 231402
WADAKKANCHERY286837 316948
CHELAKKARA 148151 163703
ANNEXE - 16
254
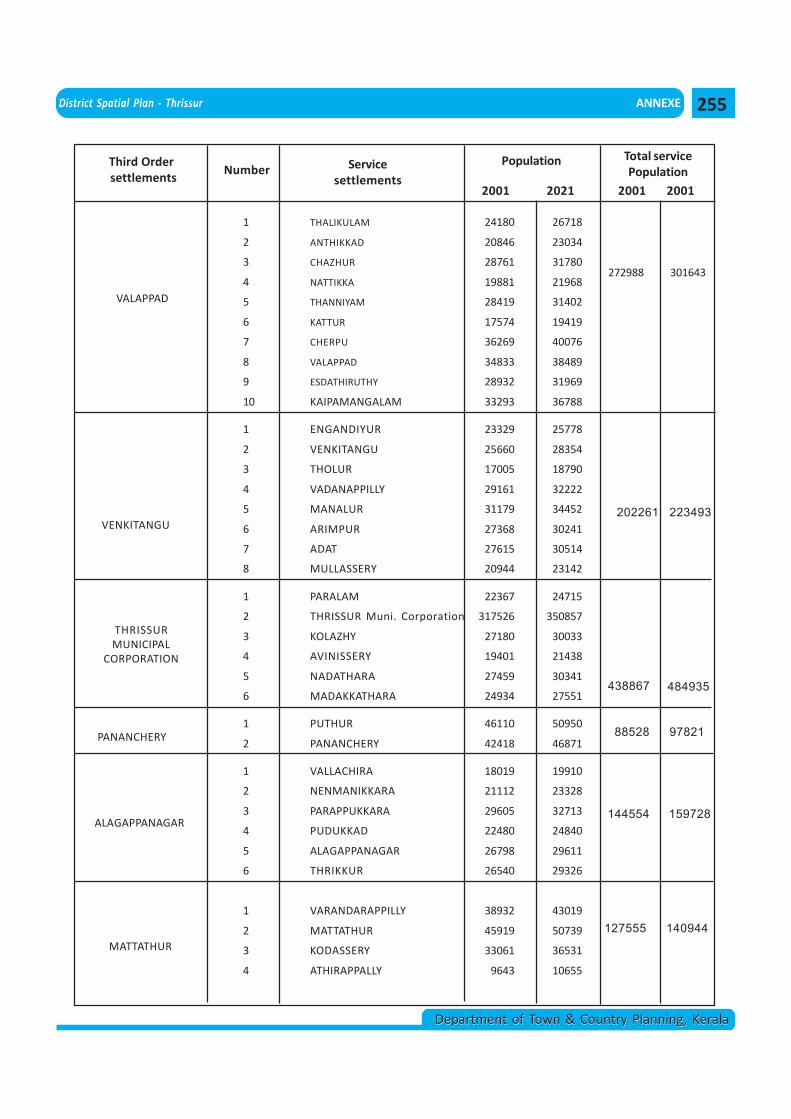
District Spatial Plan - Thrissur ANNEXE
Department of Town & Country Planning, KeralaDepartment of Town & Country Planning, Kerala
1 THALIKULAM 24180 26718
2 ANTHIKKAD 20846 23034
3 CHAZHUR 28761 31780
4 NATTIKKA 19881 21968
5 THANNIYAM 28419 31402
6 KATTUR 17574 19419
7 CHERPU 36269 40076
8 VALAPPAD 34833 38489
9 ESDATHIRUTHY 28932 31969
10 KAIPAMANGALAM 33293 36788
1 ENGANDIYUR 23329 25778
2 VENKITANGU 25660 28354
3 THOLUR 17005 18790
4 VADANAPPILLY 29161 32222
5 MANALUR 31179 34452
6 ARIMPUR 27368 30241
7 ADAT 27615 30514
8 MULLASSERY 20944 23142
1 PARALAM 22367 24715
2 THRISSUR Muni. Corporation 317526 350857
3 KOLAZHY 27180 30033
4 AVINISSERY 19401 21438
5 NADATHARA 27459 30341
6 MADAKKATHARA 24934 27551
1 PUTHUR 46110 50950
2 PANANCHERY 42418 46871
1 VALLACHIRA 18019 19910
2 NENMANIKKARA 21112 23328
3 PARAPPUKKARA 29605 32713
4 PUDUKKAD 22480 24840
5 ALAGAPPANAGAR 26798 29611
6 THRIKKUR 26540 29326
1 VARANDARAPPILLY 38932 43019
2 MATTATHUR 45919 50739
3 KODASSERY 33061 36531
4 ATHIRAPPALLY 9643 10655
Third Order settlements
Number Servicesettlements
Population Total servicePopulation
VALAPPAD
2001 2021 2001 2001
VENKITANGU
272988 301643
202261 223493
THRISSURMUNICIPAL
CORPORATION
PANANCHERY
144554 159728
438867 484935
88528 97821
ALAGAPPANAGAR
127555 140944MATTATHUR
255
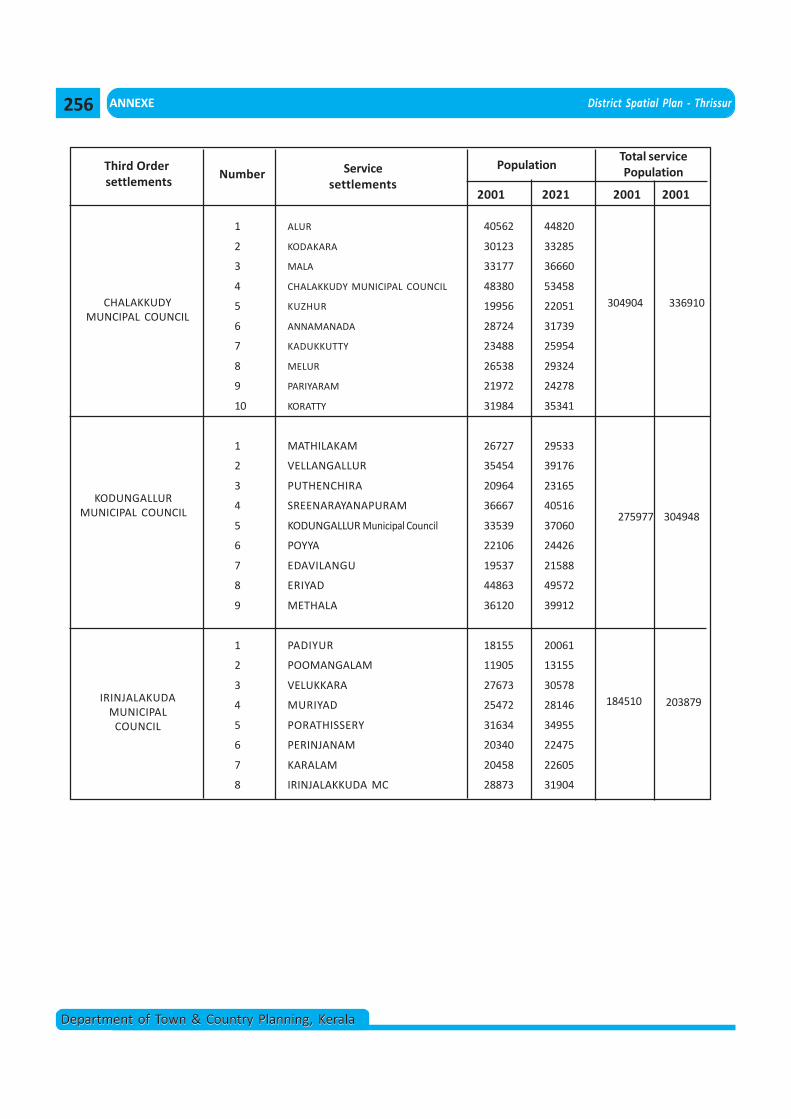
ANNEXE District Spatial Plan - Thrissur
Department of Town & Country Planning, KeralaDepartment of Town & Country Planning, Kerala
1 ALUR 40562 44820
2 KODAKARA 30123 33285
3 MALA 33177 36660
4 CHALAKKUDY MUNICIPAL COUNCIL 48380 53458
5 KUZHUR 19956 22051
6 ANNAMANADA 28724 31739
7 KADUKKUTTY 23488 25954
8 MELUR 26538 29324
9 PARIYARAM 21972 24278
10 KORATTY 31984 35341
1 MATHILAKAM 26727 29533
2 VELLANGALLUR 35454 39176
3 PUTHENCHIRA 20964 23165
4 SREENARAYANAPURAM 36667 40516
5 KODUNGALLUR Municipal Council 33539 37060
6 POYYA 22106 24426
7 EDAVILANGU 19537 21588
8 ERIYAD 44863 49572
9 METHALA 36120 39912
1 PADIYUR 18155 20061
2 POOMANGALAM 11905 13155
3 VELUKKARA 27673 30578
4 MURIYAD 25472 28146
5 PORATHISSERY 31634 34955
6 PERINJANAM 20340 22475
7 KARALAM 20458 22605
8 IRINJALAKKUDA MC 28873 31904
Third Order settlements
Number Servicesettlements
PopulationTotal servicePopulation
CHALAKKUDYMUNCIPAL COUNCIL
2001 2021 2001 2001
KODUNGALLURMUNICIPAL COUNCIL
304904 336910
275977 304948
IRINJALAKUDAMUNICIPAL
COUNCIL
184510 203879
256
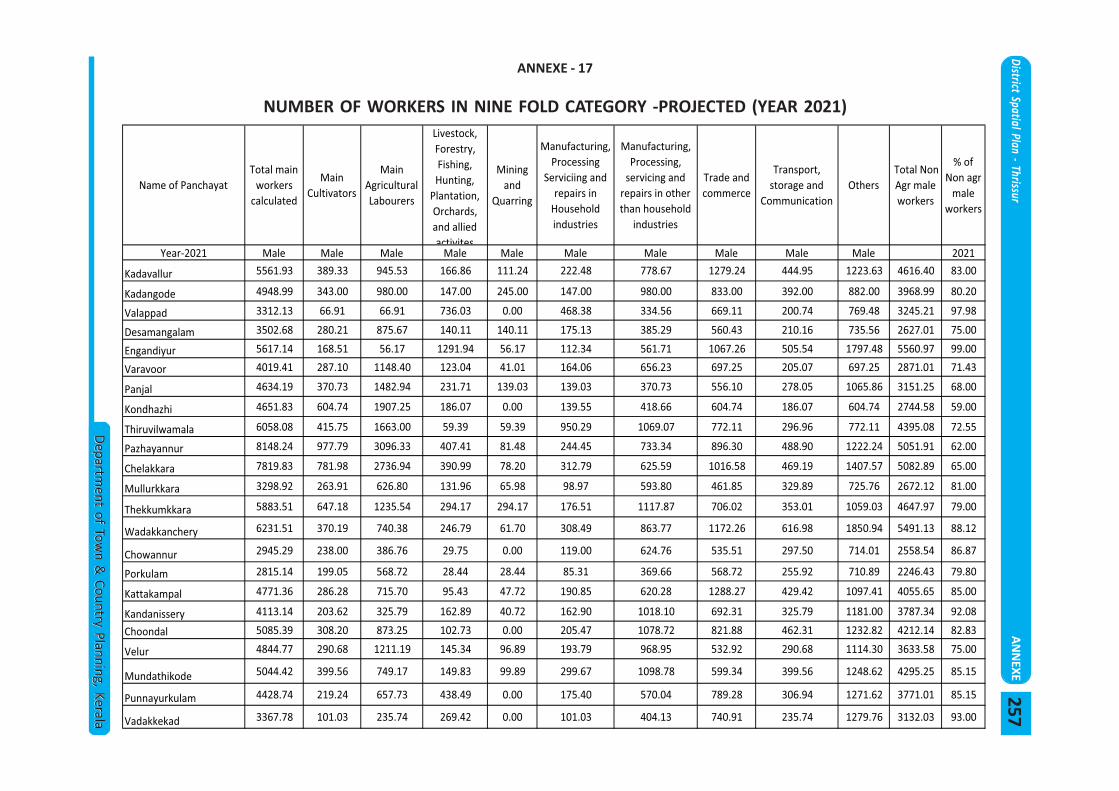
District Spatial Plan - ThrissurA
NN
EXE
Departm
ent of Town &
Country Planning, KeralaD
epartment of Tow
n & Country Planning, Kerala
Name of Panchayat
Total main
workers
calculated
Main
Cultivators
Main
Agricultural
Labourers
Livestock,
Forestry,
Fishing,
Hunting,
Plantation,
Orchards,
and allied
activites
Mining
and
Quarring
Manufacturing,
Processing
Serviciing and
repairs in
Household
industries
Manufacturing,
Processing,
servicing and
repairs in other
than household
industries
Trade and
commerce
Transport,
storage and
Communication
Others
Total Non
Agr male
workers
% of
Non agr
male
workers
Year 2021 Male Male Male Male Male Male Male Male Male Male 2021
Kadavallur 5561.93 389.33 945.53 166.86 111.24 222.48 778.67 1279.24 444.95 1223.63 4616.40 83.00
Kadangode 4948.99 343.00 980.00 147.00 245.00 147.00 980.00 833.00 392.00 882.00 3968.99 80.20
Valappad 3312.13 66.91 66.91 736.03 0.00 468.38 334.56 669.11 200.74 769.48 3245.21 97.98
Desamangalam 3502.68 280.21 875.67 140.11 140.11 175.13 385.29 560.43 210.16 735.56 2627.01 75.00
Engandiyur 5617.14 168.51 56.17 1291.94 56.17 112.34 561.71 1067.26 505.54 1797.48 5560.97 99.00
Varavoor 4019.41 287.10 1148.40 123.04 41.01 164.06 656.23 697.25 205.07 697.25 2871.01 71.43
Panjal 4634.19 370.73 1482.94 231.71 139.03 139.03 370.73 556.10 278.05 1065.86 3151.25 68.00
Kondhazhi 4651.83 604.74 1907.25 186.07 0.00 139.55 418.66 604.74 186.07 604.74 2744.58 59.00
Thiruvilwamala 6058.08 415.75 1663.00 59.39 59.39 950.29 1069.07 772.11 296.96 772.11 4395.08 72.55
Pazhayannur 8148.24 977.79 3096.33 407.41 81.48 244.45 733.34 896.30 488.90 1222.24 5051.91 62.00
Chelakkara 7819.83 781.98 2736.94 390.99 78.20 312.79 625.59 1016.58 469.19 1407.57 5082.89 65.00
Mullurkkara 3298.92 263.91 626.80 131.96 65.98 98.97 593.80 461.85 329.89 725.76 2672.12 81.00
Thekkumkkara 5883.51 647.18 1235.54 294.17 294.17 176.51 1117.87 706.02 353.01 1059.03 4647.97 79.00
Wadakkanchery 6231.51 370.19 740.38 246.79 61.70 308.49 863.77 1172.26 616.98 1850.94 5491.13 88.12
Chowannur 2945.29 238.00 386.76 29.75 0.00 119.00 624.76 535.51 297.50 714.01 2558.54 86.87
Porkulam 2815.14 199.05 568.72 28.44 28.44 85.31 369.66 568.72 255.92 710.89 2246.43 79.80
Kattakampal 4771.36 286.28 715.70 95.43 47.72 190.85 620.28 1288.27 429.42 1097.41 4055.65 85.00
Kandanissery 4113.14 203.62 325.79 162.89 40.72 162.90 1018.10 692.31 325.79 1181.00 3787.34 92.08
Choondal 5085.39 308.20 873.25 102.73 0.00 205.47 1078.72 821.88 462.31 1232.82 4212.14 82.83
Velur 4844.77 290.68 1211.19 145.34 96.89 193.79 968.95 532.92 290.68 1114.30 3633.58 75.00
Mundathikode 5044.42 399.56 749.17 149.83 99.89 299.67 1098.78 599.34 399.56 1248.62 4295.25 85.15
Punnayurkulam 4428.74 219.24 657.73 438.49 0.00 175.40 570.04 789.28 306.94 1271.62 3771.01 85.15
Vadakkekad 3367.78 101.03 235.74 269.42 0.00 101.03 404.13 740.91 235.74 1279.76 3132.03 93.00
NUMBER OF WORKERS IN NINE FOLD CATEGORY -PROJECTED (YEAR 2021)
ANNEXE - 17
257
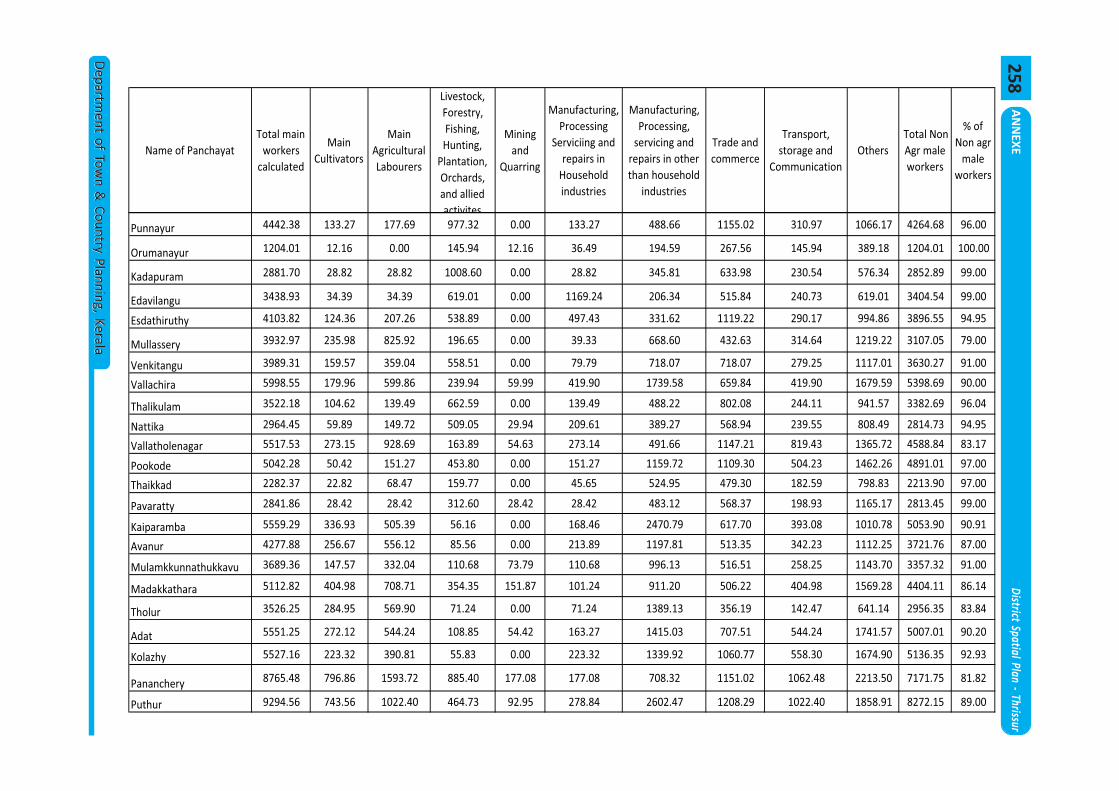
AN
NEXE
District Spatial Plan - Thrissur
Departm
ent of Town &
Country Planning, KeralaD
epartment of Tow
n & Country Planning, Kerala
Name of Panchayat
Total main
workers
calculated
Main
Cultivators
Main
Agricultural
Labourers
Livestock,
Forestry,
Fishing,
Hunting,
Plantation,
Orchards,
and allied
activites
Mining
and
Quarring
Manufacturing,
Processing
Serviciing and
repairs in
Household
industries
Manufacturing,
Processing,
servicing and
repairs in other
than household
industries
Trade and
commerce
Transport,
storage and
Communication
Others
Total Non
Agr male
workers
% of
Non agr
male
workers
Punnayur 4442.38 133.27 177.69 977.32 0.00 133.27 488.66 1155.02 310.97 1066.17 4264.68 96.00
Orumanayur 1204.01 12.16 0.00 145.94 12.16 36.49 194.59 267.56 145.94 389.18 1204.01 100.00
Kadapuram 2881.70 28.82 28.82 1008.60 0.00 28.82 345.81 633.98 230.54 576.34 2852.89 99.00
Edavilangu 3438.93 34.39 34.39 619.01 0.00 1169.24 206.34 515.84 240.73 619.01 3404.54 99.00
Esdathiruthy 4103.82 124.36 207.26 538.89 0.00 497.43 331.62 1119.22 290.17 994.86 3896.55 94.95
Mullassery 3932.97 235.98 825.92 196.65 0.00 39.33 668.60 432.63 314.64 1219.22 3107.05 79.00
Venkitangu 3989.31 159.57 359.04 558.51 0.00 79.79 718.07 718.07 279.25 1117.01 3630.27 91.00
Vallachira 5998.55 179.96 599.86 239.94 59.99 419.90 1739.58 659.84 419.90 1679.59 5398.69 90.00
Thalikulam 3522.18 104.62 139.49 662.59 0.00 139.49 488.22 802.08 244.11 941.57 3382.69 96.04
Nattika 2964.45 59.89 149.72 509.05 29.94 209.61 389.27 568.94 239.55 808.49 2814.73 94.95
Vallatholenagar 5517.53 273.15 928.69 163.89 54.63 273.14 491.66 1147.21 819.43 1365.72 4588.84 83.17
Pookode 5042.28 50.42 151.27 453.80 0.00 151.27 1159.72 1109.30 504.23 1462.26 4891.01 97.00
Thaikkad 2282.37 22.82 68.47 159.77 0.00 45.65 524.95 479.30 182.59 798.83 2213.90 97.00
Pavaratty 2841.86 28.42 28.42 312.60 28.42 28.42 483.12 568.37 198.93 1165.17 2813.45 99.00
Kaiparamba 5559.29 336.93 505.39 56.16 0.00 168.46 2470.79 617.70 393.08 1010.78 5053.90 90.91
Avanur 4277.88 256.67 556.12 85.56 0.00 213.89 1197.81 513.35 342.23 1112.25 3721.76 87.00
Mulamkkunnathukkavu 3689.36 147.57 332.04 110.68 73.79 110.68 996.13 516.51 258.25 1143.70 3357.32 91.00
Madakkathara 5112.82 404.98 708.71 354.35 151.87 101.24 911.20 506.22 404.98 1569.28 4404.11 86.14
Tholur 3526.25 284.95 569.90 71.24 0.00 71.24 1389.13 356.19 142.47 641.14 2956.35 83.84
Adat 5551.25 272.12 544.24 108.85 54.42 163.27 1415.03 707.51 544.24 1741.57 5007.01 90.20
Kolazhy 5527.16 223.32 390.81 55.83 0.00 223.32 1339.92 1060.77 558.30 1674.90 5136.35 92.93
Pananchery 8765.48 796.86 1593.72 885.40 177.08 177.08 708.32 1151.02 1062.48 2213.50 7171.75 81.82
Puthur 9294.56 743.56 1022.40 464.73 92.95 278.84 2602.47 1208.29 1022.40 1858.91 8272.15 89.00
258
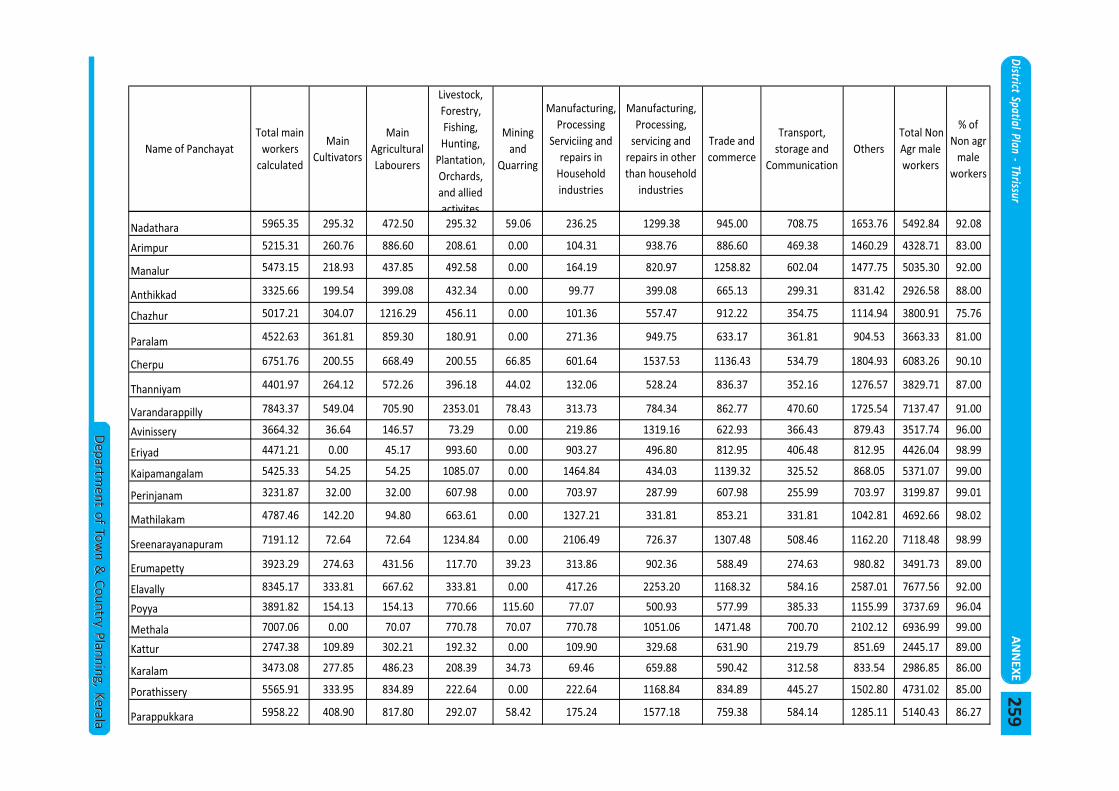
District Spatial Plan - ThrissurA
NN
EXE
Departm
ent of Town &
Country Planning, KeralaD
epartment of Tow
n & Country Planning, Kerala
Name of Panchayat
Total main
workers
calculated
Main
Cultivators
Main
Agricultural
Labourers
Livestock,
Forestry,
Fishing,
Hunting,
Plantation,
Orchards,
and allied
activites
Mining
and
Quarring
Manufacturing,
Processing
Serviciing and
repairs in
Household
industries
Manufacturing,
Processing,
servicing and
repairs in other
than household
industries
Trade and
commerce
Transport,
storage and
Communication
Others
Total Non
Agr male
workers
% of
Non agr
male
workers
Nadathara 5965.35 295.32 472.50 295.32 59.06 236.25 1299.38 945.00 708.75 1653.76 5492.84 92.08
Arimpur 5215.31 260.76 886.60 208.61 0.00 104.31 938.76 886.60 469.38 1460.29 4328.71 83.00
Manalur 5473.15 218.93 437.85 492.58 0.00 164.19 820.97 1258.82 602.04 1477.75 5035.30 92.00
Anthikkad 3325.66 199.54 399.08 432.34 0.00 99.77 399.08 665.13 299.31 831.42 2926.58 88.00
Chazhur 5017.21 304.07 1216.29 456.11 0.00 101.36 557.47 912.22 354.75 1114.94 3800.91 75.76
Paralam 4522.63 361.81 859.30 180.91 0.00 271.36 949.75 633.17 361.81 904.53 3663.33 81.00
Cherpu 6751.76 200.55 668.49 200.55 66.85 601.64 1537.53 1136.43 534.79 1804.93 6083.26 90.10
Thanniyam 4401.97 264.12 572.26 396.18 44.02 132.06 528.24 836.37 352.16 1276.57 3829.71 87.00
Varandarappilly 7843.37 549.04 705.90 2353.01 78.43 313.73 784.34 862.77 470.60 1725.54 7137.47 91.00
Avinissery 3664.32 36.64 146.57 73.29 0.00 219.86 1319.16 622.93 366.43 879.43 3517.74 96.00
Eriyad 4471.21 0.00 45.17 993.60 0.00 903.27 496.80 812.95 406.48 812.95 4426.04 98.99
Kaipamangalam 5425.33 54.25 54.25 1085.07 0.00 1464.84 434.03 1139.32 325.52 868.05 5371.07 99.00
Perinjanam 3231.87 32.00 32.00 607.98 0.00 703.97 287.99 607.98 255.99 703.97 3199.87 99.01
Mathilakam 4787.46 142.20 94.80 663.61 0.00 1327.21 331.81 853.21 331.81 1042.81 4692.66 98.02
Sreenarayanapuram 7191.12 72.64 72.64 1234.84 0.00 2106.49 726.37 1307.48 508.46 1162.20 7118.48 98.99
Erumapetty 3923.29 274.63 431.56 117.70 39.23 313.86 902.36 588.49 274.63 980.82 3491.73 89.00
Elavally 8345.17 333.81 667.62 333.81 0.00 417.26 2253.20 1168.32 584.16 2587.01 7677.56 92.00
Poyya 3891.82 154.13 154.13 770.66 115.60 77.07 500.93 577.99 385.33 1155.99 3737.69 96.04
Methala 7007.06 0.00 70.07 770.78 70.07 770.78 1051.06 1471.48 700.70 2102.12 6936.99 99.00
Kattur 2747.38 109.89 302.21 192.32 0.00 109.90 329.68 631.90 219.79 851.69 2445.17 89.00
Karalam 3473.08 277.85 486.23 208.39 34.73 69.46 659.88 590.42 312.58 833.54 2986.85 86.00
Porathissery 5565.91 333.95 834.89 222.64 0.00 222.64 1168.84 834.89 445.27 1502.80 4731.02 85.00
Parappukkara 5958.22 408.90 817.80 292.07 58.42 175.24 1577.18 759.38 584.14 1285.11 5140.43 86.27
259
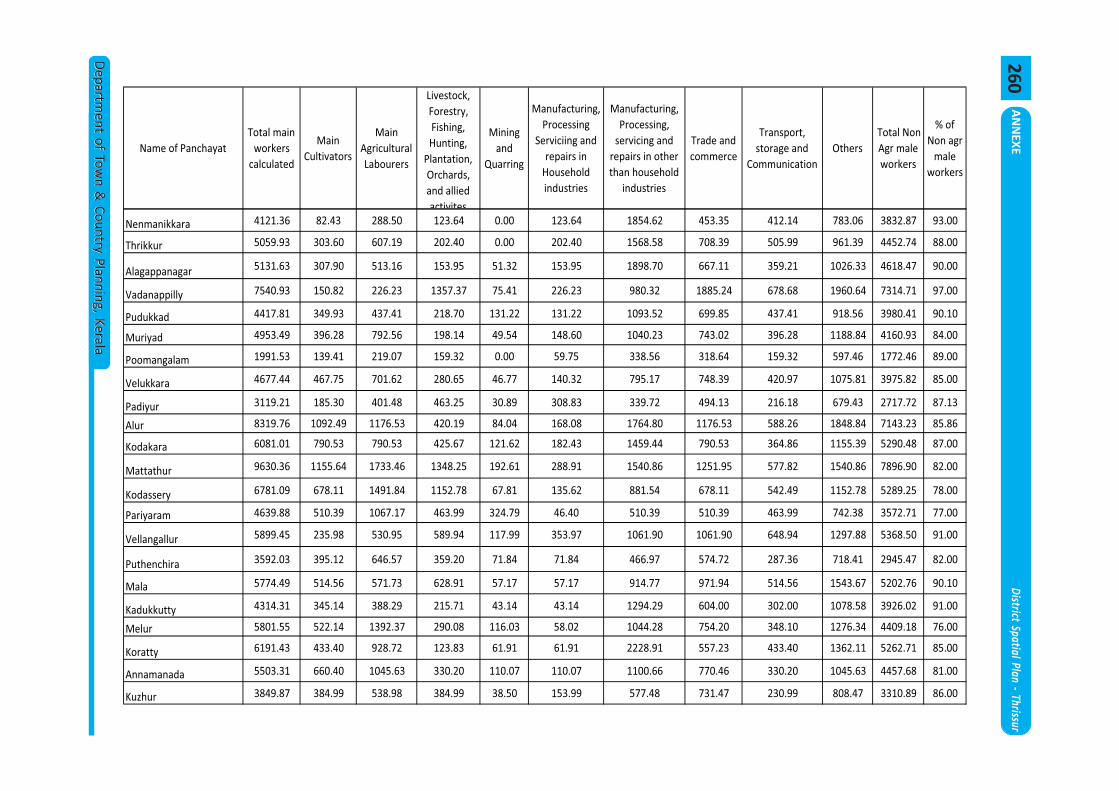
AN
NEXE
District Spatial Plan - Thrissur
Departm
ent of Town &
Country Planning, KeralaD
epartment of Tow
n & Country Planning, Kerala
Name of Panchayat
Total main
workers
calculated
Main
Cultivators
Main
Agricultural
Labourers
Livestock,
Forestry,
Fishing,
Hunting,
Plantation,
Orchards,
and allied
activites
Mining
and
Quarring
Manufacturing,
Processing
Serviciing and
repairs in
Household
industries
Manufacturing,
Processing,
servicing and
repairs in other
than household
industries
Trade and
commerce
Transport,
storage and
Communication
Others
Total Non
Agr male
workers
% of
Non agr
male
workers
Nenmanikkara 4121.36 82.43 288.50 123.64 0.00 123.64 1854.62 453.35 412.14 783.06 3832.87 93.00
Thrikkur 5059.93 303.60 607.19 202.40 0.00 202.40 1568.58 708.39 505.99 961.39 4452.74 88.00
Alagappanagar 5131.63 307.90 513.16 153.95 51.32 153.95 1898.70 667.11 359.21 1026.33 4618.47 90.00
Vadanappilly 7540.93 150.82 226.23 1357.37 75.41 226.23 980.32 1885.24 678.68 1960.64 7314.71 97.00
Pudukkad 4417.81 349.93 437.41 218.70 131.22 131.22 1093.52 699.85 437.41 918.56 3980.41 90.10
Muriyad 4953.49 396.28 792.56 198.14 49.54 148.60 1040.23 743.02 396.28 1188.84 4160.93 84.00
Poomangalam 1991.53 139.41 219.07 159.32 0.00 59.75 338.56 318.64 159.32 597.46 1772.46 89.00
Velukkara 4677.44 467.75 701.62 280.65 46.77 140.32 795.17 748.39 420.97 1075.81 3975.82 85.00
Padiyur 3119.21 185.30 401.48 463.25 30.89 308.83 339.72 494.13 216.18 679.43 2717.72 87.13
Alur 8319.76 1092.49 1176.53 420.19 84.04 168.08 1764.80 1176.53 588.26 1848.84 7143.23 85.86
Kodakara 6081.01 790.53 790.53 425.67 121.62 182.43 1459.44 790.53 364.86 1155.39 5290.48 87.00
Mattathur 9630.36 1155.64 1733.46 1348.25 192.61 288.91 1540.86 1251.95 577.82 1540.86 7896.90 82.00
Kodassery 6781.09 678.11 1491.84 1152.78 67.81 135.62 881.54 678.11 542.49 1152.78 5289.25 78.00
Pariyaram 4639.88 510.39 1067.17 463.99 324.79 46.40 510.39 510.39 463.99 742.38 3572.71 77.00
Vellangallur 5899.45 235.98 530.95 589.94 117.99 353.97 1061.90 1061.90 648.94 1297.88 5368.50 91.00
Puthenchira 3592.03 395.12 646.57 359.20 71.84 71.84 466.97 574.72 287.36 718.41 2945.47 82.00
Mala 5774.49 514.56 571.73 628.91 57.17 57.17 914.77 971.94 514.56 1543.67 5202.76 90.10
Kadukkutty 4314.31 345.14 388.29 215.71 43.14 43.14 1294.29 604.00 302.00 1078.58 3926.02 91.00
Melur 5801.55 522.14 1392.37 290.08 116.03 58.02 1044.28 754.20 348.10 1276.34 4409.18 76.00
Koratty 6191.43 433.40 928.72 123.83 61.91 61.91 2228.91 557.23 433.40 1362.11 5262.71 85.00
Annamanada 5503.31 660.40 1045.63 330.20 110.07 110.07 1100.66 770.46 330.20 1045.63 4457.68 81.00
Kuzhur 3849.87 384.99 538.98 384.99 38.50 153.99 577.48 731.47 230.99 808.47 3310.89 86.00
260
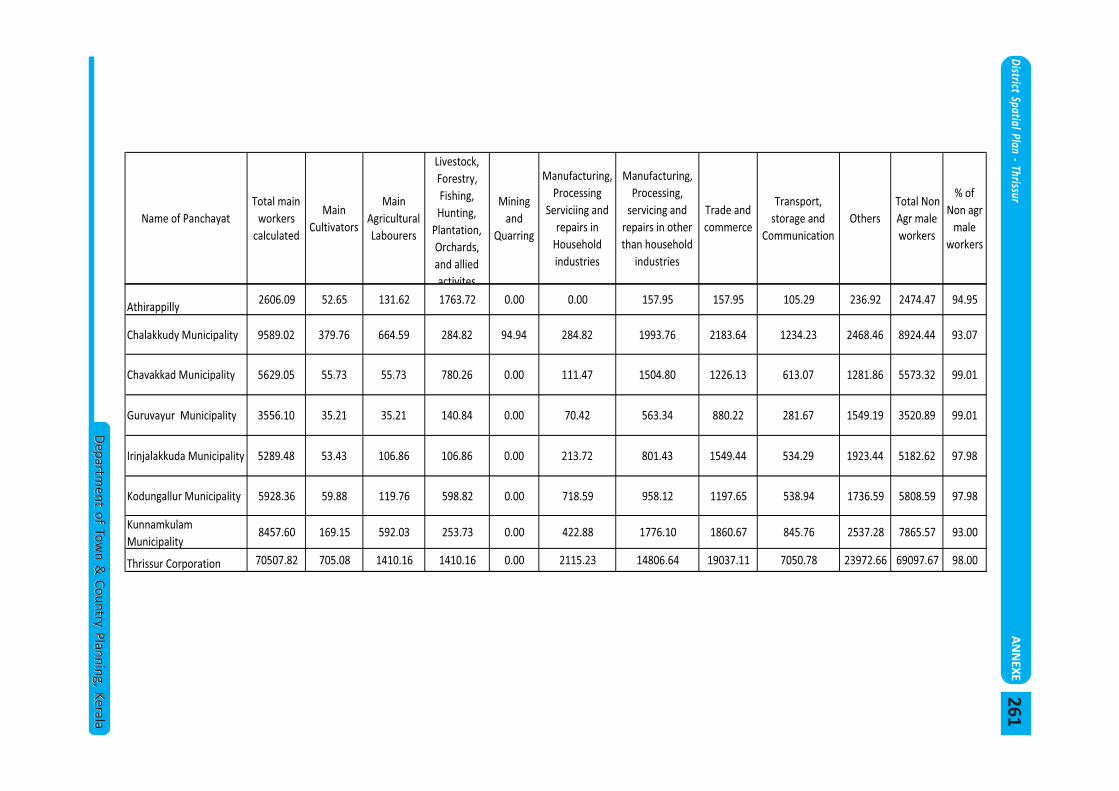
District Spatial Plan - ThrissurA
NN
EXE
Departm
ent of Town &
Country Planning, KeralaD
epartment of Tow
n & Country Planning, Kerala
Name of Panchayat
Total main
workers
calculated
Main
Cultivators
Main
Agricultural
Labourers
Livestock,
Forestry,
Fishing,
Hunting,
Plantation,
Orchards,
and allied
activites
Mining
and
Quarring
Manufacturing,
Processing
Serviciing and
repairs in
Household
industries
Manufacturing,
Processing,
servicing and
repairs in other
than household
industries
Trade and
commerce
Transport,
storage and
Communication
Others
Total Non
Agr male
workers
% of
Non agr
male
workers
Athirappilly2606.09 52.65 131.62 1763.72 0.00 0.00 157.95 157.95 105.29 236.92 2474.47 94.95
Chalakkudy Municipality 9589.02 379.76 664.59 284.82 94.94 284.82 1993.76 2183.64 1234.23 2468.46 8924.44 93.07
Chavakkad Municipality 5629.05 55.73 55.73 780.26 0.00 111.47 1504.80 1226.13 613.07 1281.86 5573.32 99.01
Guruvayur Municipality 3556.10 35.21 35.21 140.84 0.00 70.42 563.34 880.22 281.67 1549.19 3520.89 99.01
Irinjalakkuda Municipality 5289.48 53.43 106.86 106.86 0.00 213.72 801.43 1549.44 534.29 1923.44 5182.62 97.98
Kodungallur Municipality 5928.36 59.88 119.76 598.82 0.00 718.59 958.12 1197.65 538.94 1736.59 5808.59 97.98
Kunnamkulam
Municipality8457.60 169.15 592.03 253.73 0.00 422.88 1776.10 1860.67 845.76 2537.28 7865.57 93.00
Thrissur Corporation 70507.82 705.08 1410.16 1410.16 0.00 2115.23 14806.64 19037.11 7050.78 23972.66 69097.67 98.00
261
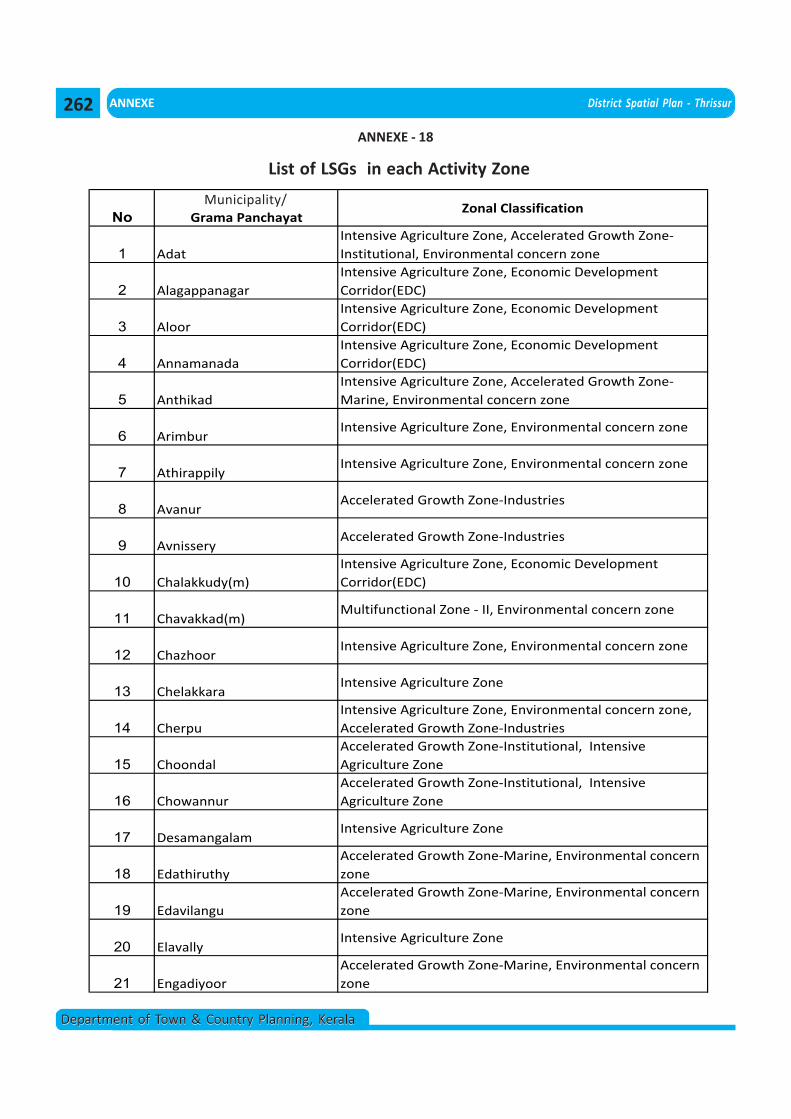
ANNEXE District Spatial Plan - Thrissur
Department of Town & Country Planning, KeralaDepartment of Town & Country Planning, Kerala
List of LSGs in each Activity Zone
No Grama PanchayatZonal Classification
1 Adat
Intensive Agriculture Zone, Accelerated Growth Zone
Institutional, Environmental concern zone
2 Alagappanagar
Intensive Agriculture Zone, Economic Development
Corridor(EDC)
3 Aloor
Intensive Agriculture Zone, Economic Development
Corridor(EDC)
4 Annamanada
Intensive Agriculture Zone, Economic Development
Corridor(EDC)
5 Anthikad
Intensive Agriculture Zone, Accelerated Growth Zone
Marine, Environmental concern zone
6 ArimburIntensive Agriculture Zone, Environmental concern zone
7 AthirappilyIntensive Agriculture Zone, Environmental concern zone
8 AvanurAccelerated Growth Zone Industries
9 AvnisseryAccelerated Growth Zone Industries
10 Chalakkudy(m)
Intensive Agriculture Zone, Economic Development
Corridor(EDC)
11 Chavakkad(m)Multifunctional Zone II, Environmental concern zone
12 ChazhoorIntensive Agriculture Zone, Environmental concern zone
13 ChelakkaraIntensive Agriculture Zone
14 Cherpu
Intensive Agriculture Zone, Environmental concern zone,
Accelerated Growth Zone Industries
15 Choondal
Accelerated Growth Zone Institutional, Intensive
Agriculture Zone
16 Chowannur
Accelerated Growth Zone Institutional, Intensive
Agriculture Zone
17 DesamangalamIntensive Agriculture Zone
18 Edathiruthy
Accelerated Growth Zone Marine, Environmental concern
zone
19 Edavilangu
Accelerated Growth Zone Marine, Environmental concern
zone
20 ElavallyIntensive Agriculture Zone
21 Engadiyoor
Accelerated Growth Zone Marine, Environmental concern
zone
ANNEXE - 18
Municipality/
262
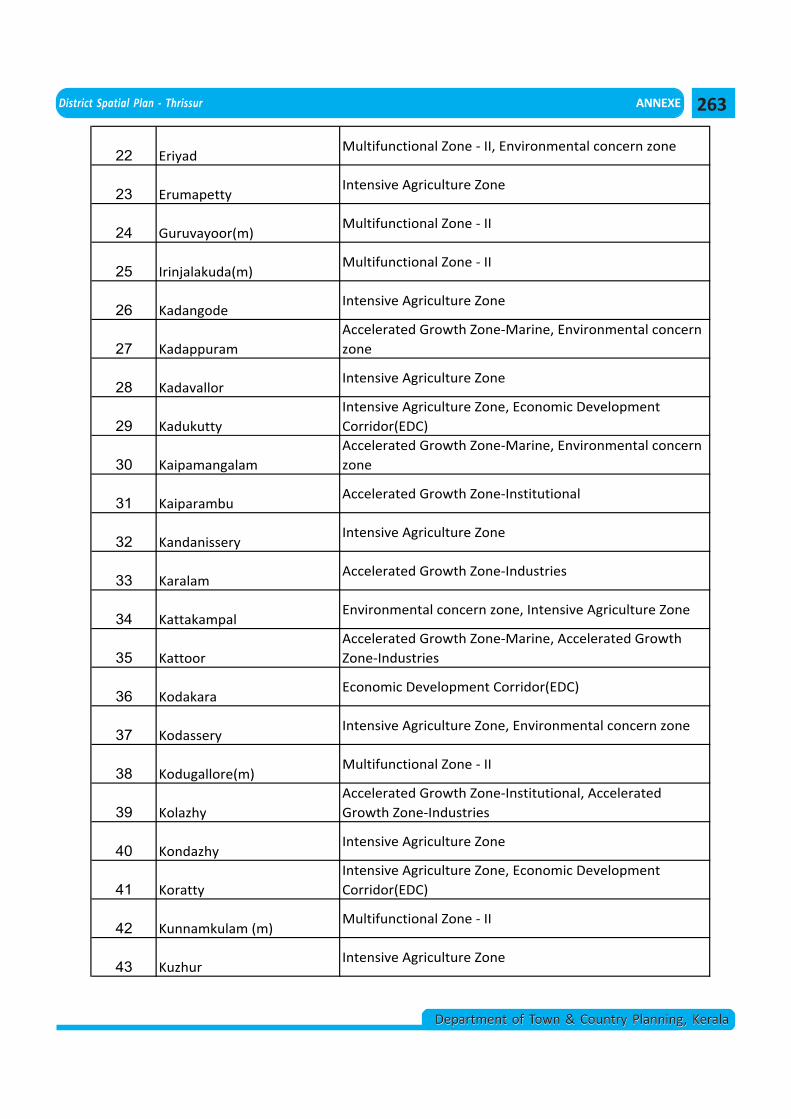
District Spatial Plan - Thrissur ANNEXE
Department of Town & Country Planning, KeralaDepartment of Town & Country Planning, Kerala
22 EriyadMultifunctional Zone II, Environmental concern zone
23 ErumapettyIntensive Agriculture Zone
24 Guruvayoor(m)Multifunctional Zone II
25 Irinjalakuda(m)Multifunctional Zone II
26 KadangodeIntensive Agriculture Zone
27 Kadappuram
Accelerated Growth Zone Marine, Environmental concern
zone
28 KadavallorIntensive Agriculture Zone
29 Kadukutty
Intensive Agriculture Zone, Economic Development
Corridor(EDC)
30 Kaipamangalam
Accelerated Growth Zone Marine, Environmental concern
zone
31 KaiparambuAccelerated Growth Zone Institutional
32 KandanisseryIntensive Agriculture Zone
33 KaralamAccelerated Growth Zone Industries
34 KattakampalEnvironmental concern zone, Intensive Agriculture Zone
35 Kattoor
Accelerated Growth Zone Marine, Accelerated Growth
Zone Industries
36 KodakaraEconomic Development Corridor(EDC)
37 KodasseryIntensive Agriculture Zone, Environmental concern zone
38 Kodugallore(m)Multifunctional Zone II
39 Kolazhy
Accelerated Growth Zone Institutional, Accelerated
Growth Zone Industries
40 KondazhyIntensive Agriculture Zone
41 Koratty
Intensive Agriculture Zone, Economic Development
Corridor(EDC)
42 Kunnamkulam (m)Multifunctional Zone II
43 KuzhurIntensive Agriculture Zone
263
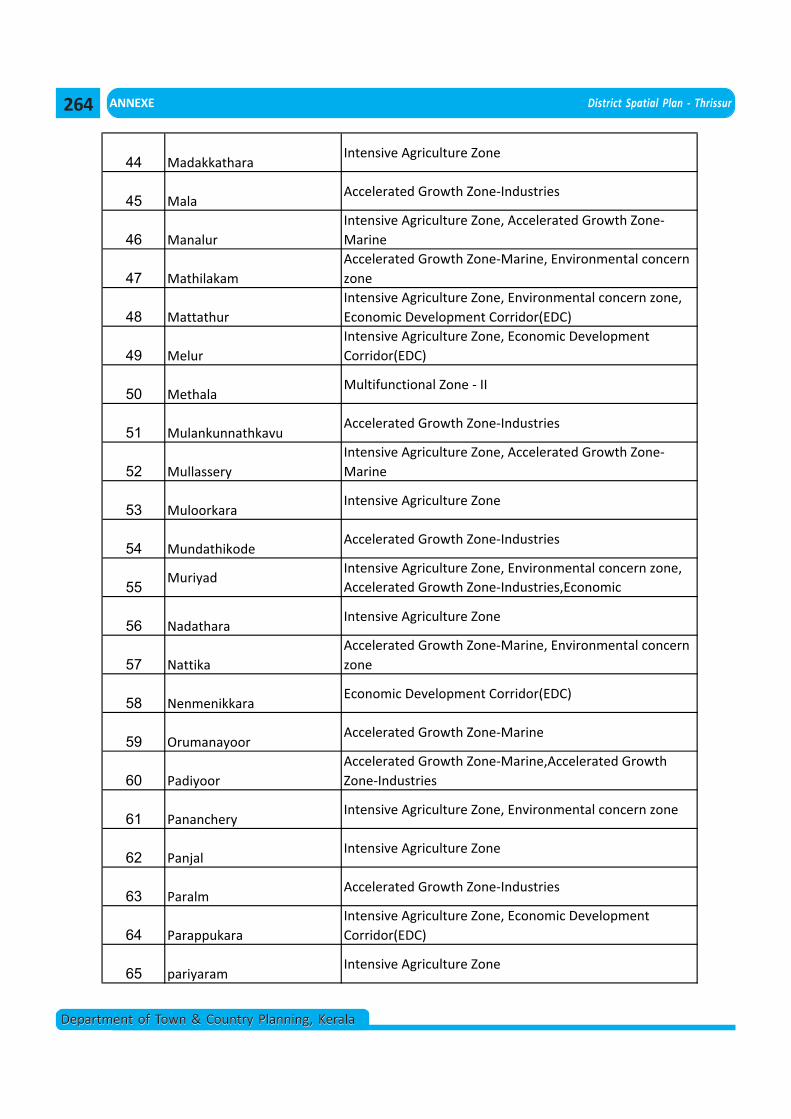
ANNEXE District Spatial Plan - Thrissur
Department of Town & Country Planning, KeralaDepartment of Town & Country Planning, Kerala
44 MadakkatharaIntensive Agriculture Zone
45 MalaAccelerated Growth Zone Industries
46 Manalur
Intensive Agriculture Zone, Accelerated Growth Zone
Marine
47 Mathilakam
Accelerated Growth Zone Marine, Environmental concern
zone
48 Mattathur
Intensive Agriculture Zone, Environmental concern zone,
Economic Development Corridor(EDC)
49 Melur
Intensive Agriculture Zone, Economic Development
Corridor(EDC)
50 MethalaMultifunctional Zone II
51 MulankunnathkavuAccelerated Growth Zone Industries
52 Mullassery
Intensive Agriculture Zone, Accelerated Growth Zone
Marine
53 MuloorkaraIntensive Agriculture Zone
54 MundathikodeAccelerated Growth Zone Industries
55Muriyad
Intensive Agriculture Zone, Environmental concern zone,
Accelerated Growth Zone Industries,Economic
56 NadatharaIntensive Agriculture Zone
57 Nattika
Accelerated Growth Zone Marine, Environmental concern
zone
58 NenmenikkaraEconomic Development Corridor(EDC)
59 OrumanayoorAccelerated Growth Zone Marine
60 Padiyoor
Accelerated Growth Zone Marine,Accelerated Growth
Zone Industries
61 PanancheryIntensive Agriculture Zone, Environmental concern zone
62 PanjalIntensive Agriculture Zone
63 ParalmAccelerated Growth Zone Industries
64 Parappukara
Intensive Agriculture Zone, Economic Development
Corridor(EDC)
65 pariyaramIntensive Agriculture Zone
264
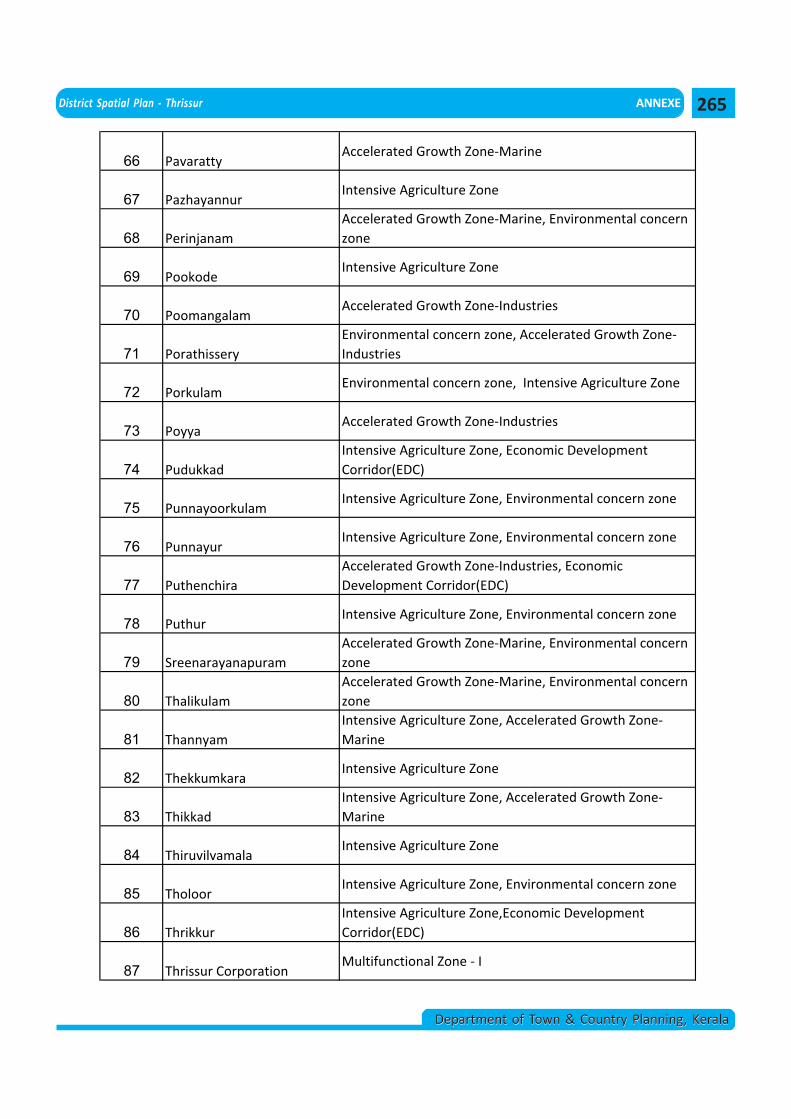
District Spatial Plan - Thrissur ANNEXE
Department of Town & Country Planning, KeralaDepartment of Town & Country Planning, Kerala
66 PavarattyAccelerated Growth Zone Marine
67 PazhayannurIntensive Agriculture Zone
68 Perinjanam
Accelerated Growth Zone Marine, Environmental concern
zone
69 PookodeIntensive Agriculture Zone
70 PoomangalamAccelerated Growth Zone Industries
71 Porathissery
Environmental concern zone, Accelerated Growth Zone
Industries
72 PorkulamEnvironmental concern zone, Intensive Agriculture Zone
73 PoyyaAccelerated Growth Zone Industries
74 Pudukkad
Intensive Agriculture Zone, Economic Development
Corridor(EDC)
75 PunnayoorkulamIntensive Agriculture Zone, Environmental concern zone
76 PunnayurIntensive Agriculture Zone, Environmental concern zone
77 Puthenchira
Accelerated Growth Zone Industries, Economic
Development Corridor(EDC)
78 PuthurIntensive Agriculture Zone, Environmental concern zone
79 Sreenarayanapuram
Accelerated Growth Zone Marine, Environmental concern
zone
80 Thalikulam
Accelerated Growth Zone Marine, Environmental concern
zone
81 Thannyam
Intensive Agriculture Zone, Accelerated Growth Zone
Marine
82 ThekkumkaraIntensive Agriculture Zone
83 Thikkad
Intensive Agriculture Zone, Accelerated Growth Zone
Marine
84 ThiruvilvamalaIntensive Agriculture Zone
85 TholoorIntensive Agriculture Zone, Environmental concern zone
86 Thrikkur
Intensive Agriculture Zone,Economic Development
Corridor(EDC)
87 Thrissur CorporationMultifunctional Zone I
265
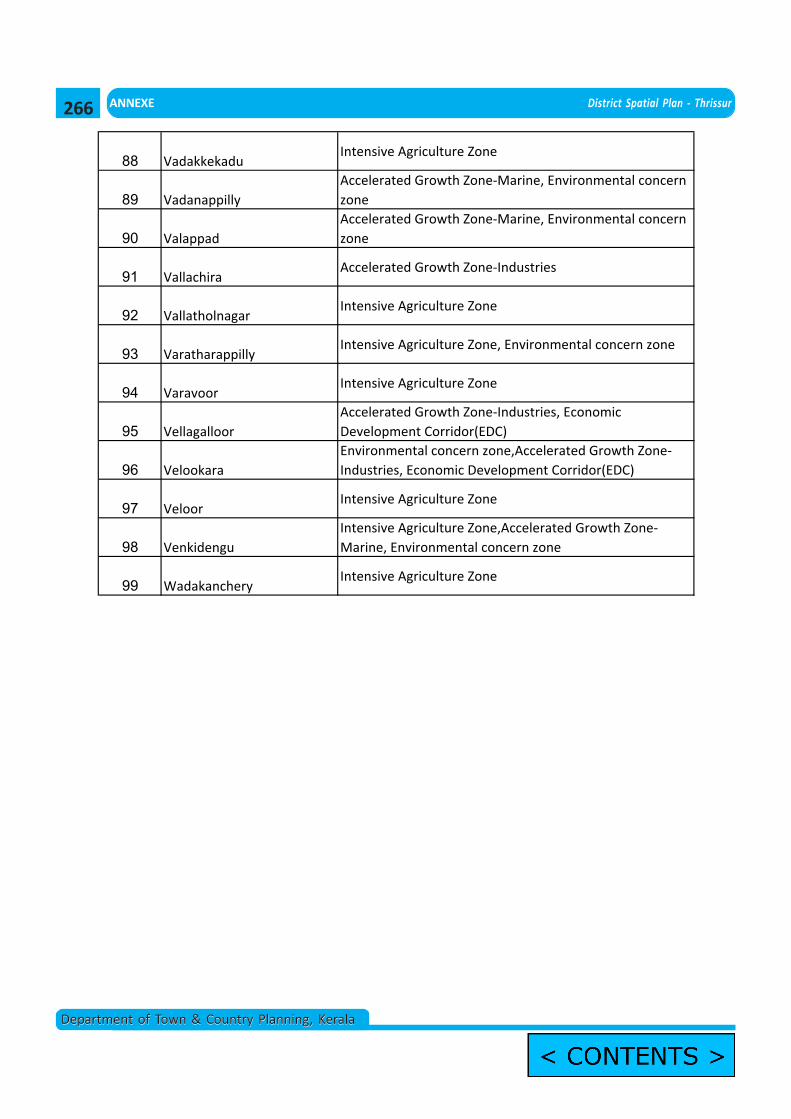
ANNEXE District Spatial Plan - Thrissur
Department of Town & Country Planning, KeralaDepartment of Town & Country Planning, Kerala
88 VadakkekaduIntensive Agriculture Zone
89 Vadanappilly
Accelerated Growth Zone Marine, Environmental concern
zone
90 Valappad
Accelerated Growth Zone Marine, Environmental concern
zone
91 VallachiraAccelerated Growth Zone Industries
92 VallatholnagarIntensive Agriculture Zone
93 VaratharappillyIntensive Agriculture Zone, Environmental concern zone
94 VaravoorIntensive Agriculture Zone
95 Vellagalloor
Accelerated Growth Zone Industries, Economic
Development Corridor(EDC)
96 Velookara
Environmental concern zone,Accelerated Growth Zone
Industries, Economic Development Corridor(EDC)
97 VeloorIntensive Agriculture Zone
98 Venkidengu
Intensive Agriculture Zone,Accelerated Growth Zone
Marine, Environmental concern zone
99 WadakancheryIntensive Agriculture Zone
266