Embed Size (px)
Citation preview
District of Columbia’s Managed
Care Quarterly Performance
Report (January 2015 – June 2015)
December 2015
Washington DC
Department of Health Care Finance

Presentation Outline
2
Goals and Purpose of Managed Care Performance Review
The Financial Condition of The District’s Health Plans
The Administrative Performance Of The Health Plans
MCO Medical Spending And Member Utilization Patterns
Care Coordination: Goals and Outcomes
Summary of Key Findings
Implementation of MCO Pay for Performance Plan

Managed Care Represents DHCF’s
Largest Provider Expenditure
DHCF’s managed care program is the largest single expenditure in the agency’s budget
consisting of the Medicaid and Alliance publicly-funded health insurance programs.
Monthly, more than 188,000 Medicaid beneficiaries and just over 15,000 Alliance
members are assigned to one of the four following Managed Care Organizations (MCO)
AmeriHealth Caritas DC (AmeriHealth)
MedStar Family Choice (MedStar)
Trusted Health Plan (Trusted)
Health Services for Children With Special Needs (HSCSN)
Three of these health plans -- AmeriHealth, MedStar, and Trusted -- offer comprehensive
benefits and operate under full risk-based contracts with the District
The District spent more than $984.3 million on MCO services in FY2015. A little more $828.8
million of this amount funded the full risk-based contracts signed by AmeriHealth, MedStar,
and Trusted. These plans are the focus of this report
3

DHCF Implements A Performance
Review Of Its Managed Care Program
The contracts for these three plans were awarded in 2013 as the first step
initiated by DHCF to reform a troubled program.
Prior to this award, DHCF’s managed care program was hampered by
ambiguous contract language, financially unstable providers, and de-
minimus reporting requirements that made it difficult to assess the
performance of the plans
Accordingly, to coincide with the new five-year MCO contracts, DHCF
initiated a comprehensive review process in FY2014 to assess and
evaluate the performance of its health plans
4

Goals Of The Performance Review
There are three primary goals of this performance review:
1. Evaluate the degree to which DHCF’s three risk-based health plans
successfully ensure beneficiary access to an adequate network of
providers while managing the appropriate utilization of health care
services
2. Provide objective data on the performance of the health plans across
a number of domains to inform decision making about possible policy
changes for the managed care program
3. Facilitate an annual report card evaluation of each MCO to help guide
decisions regarding contract renewals for the health plans
5

Focus Of The Performance Review
This report mostly focuses on the period covering the first two quarters of 2015.
The following questions are addressed for each MCO.
What was the financial condition of MCOs during the first six months of
2015? Were annual health plan revenues sufficient to cover claims and
operating cost?
Did the MCOs successfully execute the administrative responsibilities
required of a managed care plan – timely claims processing, robust
member encounter systems, and appropriate use of claims denial
procedures?
Did the MCOs successfully meet the 85% threshold requirement for medical
spending while otherwise containing cost? What service levels were
achieved for primary care visits as well as mental health penetration rates
for children and adults?
6

Focus Of The Performance Review (continued)
What was the rate at which Medicaid beneficiaries used the
emergency room for low acuity or non-emergency health problems?
What proportion of these visits should the health plans have been
reasonably expected to prevent?
What proportion of inpatient hospital admissions for Medicaid
beneficiaries over the 12-month period were potentially avoidable?
What proportion of these potentially avoidable admissions should the
health plans have been reasonably expected to prevent.
Were the level of hospital readmissions a problem for the health
plans’ members? If so, what proportion of those readmissions should
the MCOs have been expected to prevent?
7

Presentation Outline
8
Goals and Purpose of Managed Care Performance Review
The Financial Condition of The District’s Health Plans
The Administrative Performance Of The Health Plans
MCO Medical Spending And Member Utilization Patterns
Care Coordination: Goals and Outcomes
Summary of Key Findings
Implementation of MCO Pay for Performance Plan

Summary Of Key Findings
This report summarizes the 6-month performance of the District’s Medicaid managed care
plans in five areas -- financial condition, administrative performance, beneficiary service
utilization, health plan medical spending, and the coordination of members’ care.
Financial Conditions
The strong financial performance observed for both Trusted and AmeriHealth in 2015 has
been sustained over the first six months of 2015. Meanwhile, MedStar, which incurred
significant losses in 2014, reported an operating profit for the first two quarters of 2015 of $3
million – 3 percent. Moreover, all three plans report sufficient liquidity to cover expenses for a
significant number of days without having to use long-term assets.
The health plans also had ample monthly reserves to pay claims that have been incurred but
were not submitted for payment during the 6-month period. However, Trusted’s cash reserves
are inflated by an unusually high denial of inpatient claims that was associated with the
execution of new edit criteria. This development bears close monitoring in the future.
9
Summary Of Key Findings (continued)
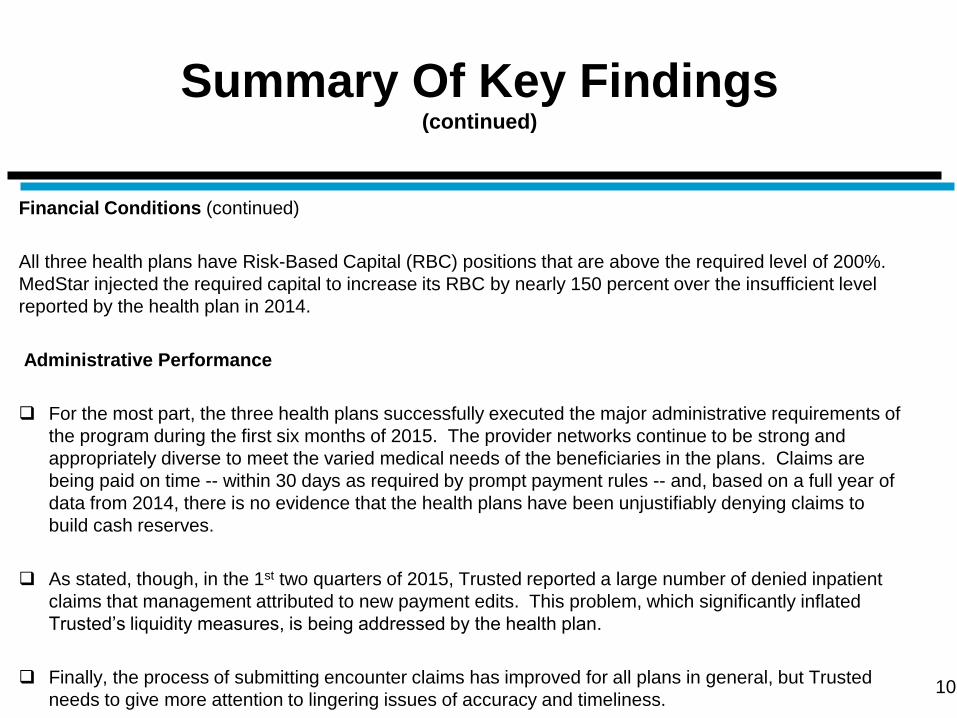
Financial Conditions (continued)
All three health plans have Risk-Based Capital (RBC) positions that are above the required level of 200%.
MedStar injected the required capital to increase its RBC by nearly 150 percent over the insufficient level
reported by the health plan in 2014.
Administrative Performance
For the most part, the three health plans successfully executed the major administrative requirements of
the program during the first six months of 2015. The provider networks continue to be strong and
appropriately diverse to meet the varied medical needs of the beneficiaries in the plans. Claims are
being paid on time -- within 30 days as required by prompt payment rules -- and, based on a full year of
data from 2014, there is no evidence that the health plans have been unjustifiably denying claims to
build cash reserves.
As stated, though, in the 1st two quarters of 2015, Trusted reported a large number of denied inpatient
claims that management attributed to new payment edits. This problem, which significantly inflated
Trusted’s liquidity measures, is being addressed by the health plan.
Finally, the process of submitting encounter claims has improved for all plans in general, but Trusted
needs to give more attention to lingering issues of accuracy and timeliness.
10

Summary Of Key Findings (continued)
Medical Expenses
The three health plans met the required spending level for medical expenses of 85
percent. While MedStar continues to have the highest cost beneficiaries on a per-
member-per-month basis, there was no growth in their membership’s medical
expenses from last year. At the same time, MedStar’s spending on children dropped
sharply from 2014.
By comparison, AmeriHealth and Trusted are experiencing lower costs from last
year for their adult Medicaid populations but the medical expenses for children have
risen significantly. Moreover, the observed drop in inpatient cost for Trusted is likely
an artifact of new system edits and is not likely to be sustained.
Despite success in containing medical spending over previous year’s level, the
beneficiaries’ cost for MedStar, and to a lesser degree Trusted, are still not aligned
with overall member risk levels. Unaddressed, this will create future net income
challenges.
11

Summary Of Key Findings (continued)
Medical Expenses (continued)
Alliance beneficiaries are becoming increasingly more expensive to cover
with both AmeriHealth and MedStar witnessing double digit growth rates.
Trusted shows a decline in expenses for this group but again, this is
undoubtedly related to the high denial of inpatient hospital claims.
The physician visit rates for adults and children in 2014 were generally
positive and this pattern reemerged in 2015. In both quarters, nearly 8 of 10
children on Medicaid visited a physician with AmeriHealth having the
highest visit rate. For adults, the visit rate was lower at 65 percent but
steady for all plans except Trusted. Notably, Trusted’s adult physician visit
rate – historically a problem – worsened and DHCF’s managed care division
has been directed to initiate a review and recommend any needed
corrective actions by January 31, 2016.
12

Summary Of Key Findings (continued)
Care Coordination
The care coordination challenges that plagued the District’s three full-risk health
plans in 2014 have not abated in the first two quarters of 2015. Namely, their
members’ use of the emergency room for routine care, the repeated occurrences of
potentially avoidable hospital admissions, and the problem of hospital readmissions
remain stubborn challenges.
As has been shown, these problems come with a cost. Current estimates suggest
the health plans are spending an additional $36 million more per year due to this
problem with the highest cost -- $18 million -- generated by hospital readmissions.
To encourage better performance against these core measures, DHCF will initiate a
pay-for-performance program beginning January 1, 2016. This program will require
the health plans to show measurable improvement against benchmarks for these
indicators or face the loss of up to 2 percent of their capitated payment.
13

Presentation Outline
14
Goals and Purpose of Managed Care Performance Review
The Financial Condition of The District’s Health Plans
The Administrative Performance Of The Health Plans
MCO Medical Spending And Member Utilization Patterns
Care Coordination: Goals and Outcomes
Summary of Key Findings
Implementation of MCO Pay for Performance Plan

There Are Several Key Metrics That
Speak To The Financial Health Of
Managed Care Plans
DHCF focuses on four key metrics when evaluating the financial stability of health plans:
Medical loss ratio (MLR) – represents the portion of total revenue used by the MCOs to
fund medical expenses, including expenses for cost containment
Administrative loss ratio (ALR) – represents the portion of total revenue used by the MCOs
to fund both claims processing and general administrative expenses
Operating Margin (OM) – also referred to as profit margin and is defined as the sum of
MLR and ALR subtracted from 100%. A positive OM indicates a financial gain while a
negative indicates a loss. Mercer’s benchmark of the operating margin needed to sustain a
strong financial position is approximately 2-4% annually over a 3-5 year time horizon
Risk-based Capital (RBC) – represents a measure of the financial solvency of managed
care plans and reflects the proportion of the required minimum capital that is maintained
by a managed care plan as of the annual filing
15

Generally, Observed Differences In Health Plan
Operating Margins Can Be Traced
To A Few Key Factors
Assuming adequacy in the base capitated payment rate, there are typically three important
factors that impact whether a health plan will experience positive operating margins:
Risk-adjusted payment rates. With DHCF’s payment model, health plans whose
beneficiaries evince greater medical risk in the form of disease prevalence, receive higher
risk scores and greater payments. MCOs with lower risk members receive reduced rates.
Thus, plans that properly align membership risk and utilization can gain a considerable
advantage over others that do not
Provider contract rates. Plans that negotiate contract rates that are adequate to build a
solid network but lower than their competitors can realize significant higher surpluses
Patient utilization management. Relative differences across plans in the degree to which
their members unnecessarily access high end care as an alternative to less expensive
treatment will drive variations in operating margins
16
Some Strategies Can Increase Operating Margins
But Are Not Reflective Of A Properly
Operated Health Plan
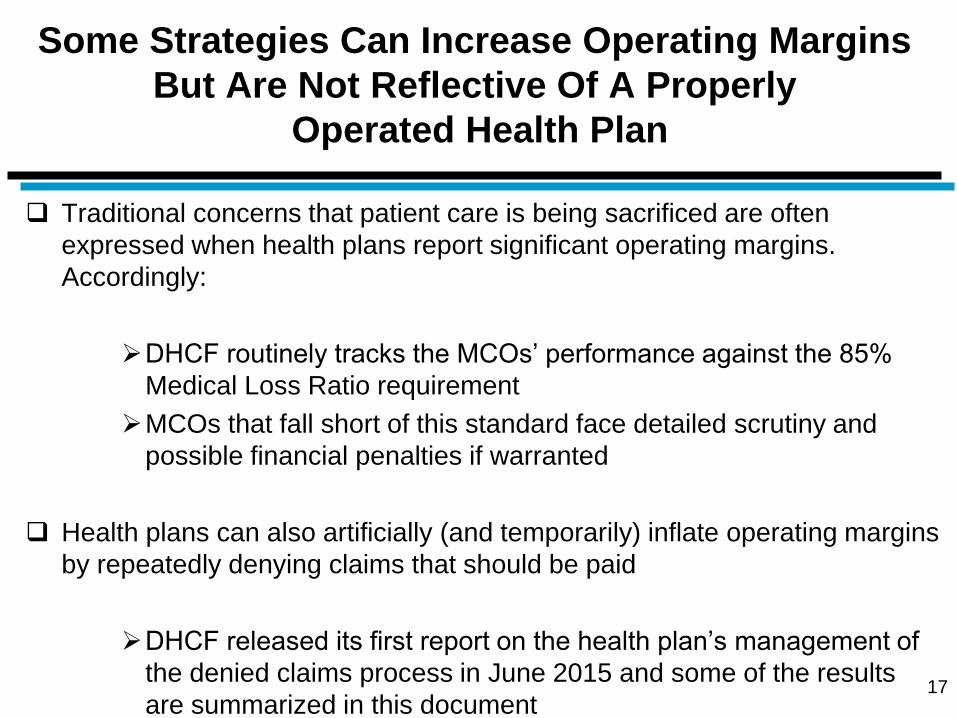
Traditional concerns that patient care is being sacrificed are often
expressed when health plans report significant operating margins.
Accordingly:
DHCF routinely tracks the MCOs’ performance against the 85%
Medical Loss Ratio requirement
MCOs that fall short of this standard face detailed scrutiny and
possible financial penalties if warranted
Health plans can also artificially (and temporarily) inflate operating margins
by repeatedly denying claims that should be paid
DHCF released its first report on the health plan’s management of
the denied claims process in June 2015 and some of the results
are summarized in this document
17

For Medicaid Membership, MedStar Has Experienced A 28
Percent Growth Rate Since The Beginning
Of The Five-Year Contract Period
MCO
Medicaid
July 2013
Enrollment
Medicaid
June 2015
Enrollment
Net
Change
AmeriHealth 91,585 97,065 5,480 (+5.9)
MedStar 32,536 41,817
9,281 (+28.5)
Trusted 26,204 27,443 1,239 (+4.7)
Source: Department of Health Care Finance Medicaid Management Information System (MMIS) 18

When Alliance Members Are Included, The
Numbers Do Not Significantly Change
MCO
Medicaid &
Alliance
July 2013
Enrollment
Medicaid &
Alliance
June 2015
Enrollment
Net
Change
AmeriHealth 98,019 103,980 5,961 (+6.0)
MedStar 35,911 45,334 9,423 (+26.2)
Trusted 28,803 30,245 1,442 (+5.0)
Source: Department of Health Care Finance Medicaid Management Information System (MMIS)
19

The Revenue For All Three Health Plans Was
Sufficient To Cover Both Claims And Administrative
Cost During The First Six Months Of 2015
Revenue* Claims** Administrative
Cost*** = Net Gain
(Loss)
MCO
Revenue
Claims
Administrative Cost
Net Gain
(Loss)
AmeriHealth $226.0M $191.5M $19.0M $15.5M
MedStar $102.7M $93.3M $6.3M $3.0M
Trusted $62.8M $53.5M $6.8M $2.5M
Notes: *MCO revenue does not include investment income, HIPF payments, and DC Exchange/Premium tax revenue.
**Total claims include incurred but not reported amounts for YTD as of June 30 2015, net of reinsurance recoveries.
***Administrative expenses include all claims adjustment expenses as reported in quarterly DISB filings, excluding cost containment
expenses, HIPF payments and DC Exchange/Premium taxes.
Source: MCO Quarterly Statement filed by the health plans with the Department of Insurance, Securities, and Banking (DISB)
MCO Revenue and Expense Data for January 2015 to June 2015
20

Estimated Risk-Based Capital Measures
Provide A Reliable Indicator Of
MCO Solvency
The MCO’s Risk-based Capital (RBC) levels can be seen as a proxy for whether a
health plan has the assets to pay claims
MCOs conduct this complicated calculation annually for each health plan using end-
of-year financial data (as well as some information that is not publically disclosed)
which is provided to the Department of Insurance, Securities and Banking (DISB) for
review
Health plans with RBC levels that fall below 200% face greater scrutiny from DISB
and DHCF (as described on the next slide) to ensure that they raise their capital level
above 200% RBC
This report compares the annual RBC measures reported by the plans in their official
2014 financial statement filed with DISB to a more recent 6-month proxy measure for
2015 calculated by Mercer Consulting
21

Regulators Track Insurers Risk-Based
Capital Levels And Have Guidelines For
Taking Action
22
Based on the level of reported risk, the National Association of Insurance Commissioners indicates that a
number of actions (described below) are available if warranted:
1. No action - Total Adjusted Capital of 200% or more of Authorized Control Level.
2. Company Action Level - Total Adjusted Capital of 150% to 200% of Authorized Control Level.
Insurer must prepare a report to the regulator outlining a comprehensive financial plan that identifies
the conditions that contributed to the company’s financial condition and a corrective action plan.
3. Regulatory Action Level - Total Adjusted Capital of 100 to 150% of Authorized Control Level.
Company is required to file an action plan and the Insurance Commissioner issues appropriate
corrective orders to address the company’s financial problems
4. Authorized Control Level - Total Adjusted Capital 70 to 100% of the Authorized Control Level
triggers an action in which the regulator takes control of the insurer even though the insurer may
technically be solvent.
5. Mandatory Control Level - Total Adjusted Capital of less than 70% triggers a Mandatory Control
Level that requires the regulator to take steps to place the insurer under control. Most companies
that trigger this action level are technically insolvent (liabilities exceed assets).

Currently All Three Health Plans Report Risk Base Capital
Levels That Exceed The Required Threshold
23
Required
Standard 200%
Regulatory
Action
Triggered 150%
Estimated 2015 Quarterly Risk-Based Capital For Managed Care Plans
Compared To 2014 Annual Level
333%
310%
288%
139%
218% 208%
2014 Annual RBC
2015 Estimated
Quarterly RBC
Source: Reported figures are from the MCO’s annual 2014 and quarterly 2015 financial statements filed with DISB.

MCOs Must Maintain Adequate
Reserves To Pay “Pipeline” Claims
It is paramount in managed care that MCOs maintain a reserve to pay for services that have
been provided but not yet reimbursed
This claims liability represents an accrued expense or short-term liability for the MCOs each
month and health plans that fail to build a sufficient reserve may not be able to pay claims
when they eventually clear the billing pipeline
Typically, MCOs are expected to retain a reserve equal to between one to two months’ worth
of claims, depending on how quickly claims are processed.
In this report, DHCF reports the reserves MCO’s have available to satisfy incurred but not
reported claims. This analysis is based on calculations provided by Mercer using data on the
monthly claim’s experience for each plan to calculate the reserves on hand
We also provide an analysis of the number of days the health plans can operate without
accessing long-term assets. This is described as a Defensive Interval Ratio which is, in
essence, a liquidity measure -- the degree to which the MCOs can survive on liquid assets
without having to make use of either investments from the market or by selling long term
assets.
24

25
All Three Health Plans Have Sufficient Cash
Reserves On Hand To Pay Estimated Incurred But
Not Reported Claims
*Note: The figure for Trusted is inflated as the company implemented certain changes in claim submission protocols in
mid-March 2015 which significantly increased initial claim denials from providers. As of June 30, 2015 the IBNR
related to these claims was approximately $9.5 million.
Source: IBNR is based on amount reported on the MCO’s quarterly filings.
Estimated Number Of Months Reserves Compared To Average Monthly
Incurred Claims For The Period Covering January 2015 to June 2015
*2.6
1.7 1.4

26
Though AmeriHealth Experienced A Decline In Its
Defensive Interval Ratio – Which Compares MCO
Assets To Company Liabilities – The Overall Levels
Remain Favorable For All Three Health Plans
Days In A Year That MCOs Can Operate On Existing Cash Without Having To Access Long-Term
Assets For The Period Covering January 2015 to June 2015
89
(-4%)
95
93
Defense Interval Ratio
Percent Change In
Ratio From
CY2014 ( )
(+6%) *(+35%)
Note: Mercer calculated the Defensive Interval Ratio as cash and equivalents divided by daily operating expenses for the
period from January to June 2015 measured in days. *The figure for Trusted is inflated as the company implemented
certain changes in claim submission protocols in mid-March 2015 which significantly increased initial claim denials
thereby increasing the company’s reported cash and equivalents from providers. As of June 30, 2015 the IBNR
related to these claims was approximately $9.5 million.

Presentation Outline
27
Goals and Purpose of Managed Care Performance Review
The Financial Condition of The District’s Health Plans
The Administrative Performance Of The Health Plans
MCO Medical Spending And Member Utilization Patterns
Care Coordination: Goals and Outcomes
Summary of Key Findings
Implementation of MCO Pay for Performance Plan

There Are Several Administrative
Requirements Which Are Critical To The
Successful Operation Of MCOs
As a part of its core mission, MCOs must accomplish the following:
1. Build an adequate network of providers and pay health care claims to
service providers on time and through an electronic claims process
with documentation to facilitate reconciliation of payments
2. Create an accurate electronic record of all patient health care
encounters and transmit the files containing this information to DHCF
with a minimal error rate
3. Establish a system of care management and care coordination to
identify health plan members with special or chronic health care issues
and ensure that these beneficiaries receive access to appropriate
care, while managing the delivery of health care services for all
members
28

Contractual Requirements Exist To
Ensure Adequate Health Care Provider
Networks The five-year MCO contracts contain specific provisions to ensure Medicaid and Alliance members have
reasonable access to care. The health plans must have:
1 primary care physician for every 1,500 members
1 primary care physician with pediatric training for children through age 20 for every 1,000 members
1 dentist for every 750 children in their networks
Additionally plan networks must include:
At least 2 hospitals that specialize in pediatric care
Department of Behavioral Health core service agencies
Laboratories within 30 minutes travel time from the member’s residence
For pharmacies, each plan must have:
2 pharmacies within 2 miles of the member’s residence
1 24-hour, seven (7) day per week pharmacy
1 pharmacy that provides home delivery service within 4 hours
1 mail order pharmacy
29

All Three Health Plans Continue To
Operate With Sufficient Networks
Ensuring Patient Access To Care
Health Plan
Primary
Care
Doctors
Required In
Network
(1:1500)
Primary
Care
Doctors In
The MCO
Network
Primary Care
Doctors With
Pediatric
Specialty
Required In
Network
(1:1000)
Doctors
With
Pediatric
Specialty In
Network
Dentist For
Children
Required In
Network
(1:750)
Dentist
For
Children
In Network
DC
AmeriHealth
69
548
53
863
65
524
MedStar FP 30 644 14 405 19 496
Trusted 20 496 10 174 13 462
Source: This information is self-reported and attested by the MCOs as of June 30, 2015 and verified by Department of Health
Care Finance and the Enrollment Broker through a sampling of providers. 30
The Number of Providers In The MCO Networks Compared to Contract
Requirements as of June 2015
31
Timely Payment Of Health Care Claims Is Core
Requirement For The District’s Managed Care
Plans
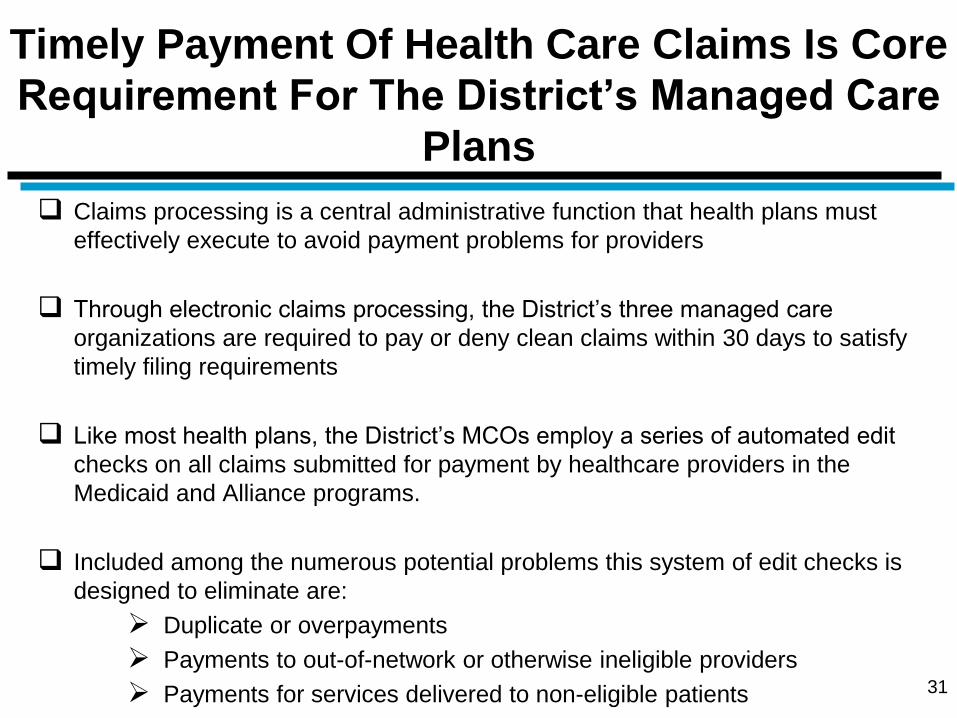
Claims processing is a central administrative function that health plans must
effectively execute to avoid payment problems for providers
Through electronic claims processing, the District’s three managed care
organizations are required to pay or deny clean claims within 30 days to satisfy
timely filing requirements
Like most health plans, the District’s MCOs employ a series of automated edit
checks on all claims submitted for payment by healthcare providers in the
Medicaid and Alliance programs.
Included among the numerous potential problems this system of edit checks is
designed to eliminate are:
Duplicate or overpayments
Payments to out-of-network or otherwise ineligible providers
Payments for services delivered to non-eligible patients

32
Over The First Six Months Of 2015, The Three Health Plans
Continue To Pay Claims In Compliance With The District’s
Timely Payment Requirement
99% *94%
Total Claims Adjudicated 410,153
MedStar AmeriHealth
99%
Trusted
247,295
Timely
Payment
Compliance
Level of 90%
Note: This number does not reflect a large number of inpatient claims that Trusted denied under a new system of edits. These claims will be paid during the
course of 2015.
Source: Data reported by MCOs on the Department of Health Care Finance’s Claims Payment Report,
MCO Claims Paid Within 30 Days Based On The District’s Timely
Payment Requirement, January 2015 to June 2015
275,098

33
The Issue of Claims Denial -- Which Focuses On
Whether The Managed Care Companies Are Acting
In Good Faith -- Must Also Be Evaluated
Because the District’s 30-day timely payment requirement does not apply
to claims that are initially denied, some providers express concerns that
managed care plans are unjustifiably denying a high rate of claims as a
cash management strategy
Such a practice would obviously violate the tenets of good faith claims
processing, create significant revenue issues for some of the providers in
the health plans’ networks, and potentially cause access to care issues for
beneficiaries in the Medicaid and Alliance programs
Therefore, DHCF addresses this issue by reporting on the incidence of
denied claims in the managed care program and the reasons for the
denials. Additionally, outcomes for claims that were initially denied but
subsequently approved and repaid are also examined
Less Than Two Of Every Ten Claims Submitted
For Payment To The District’s MCOs Are
Denied
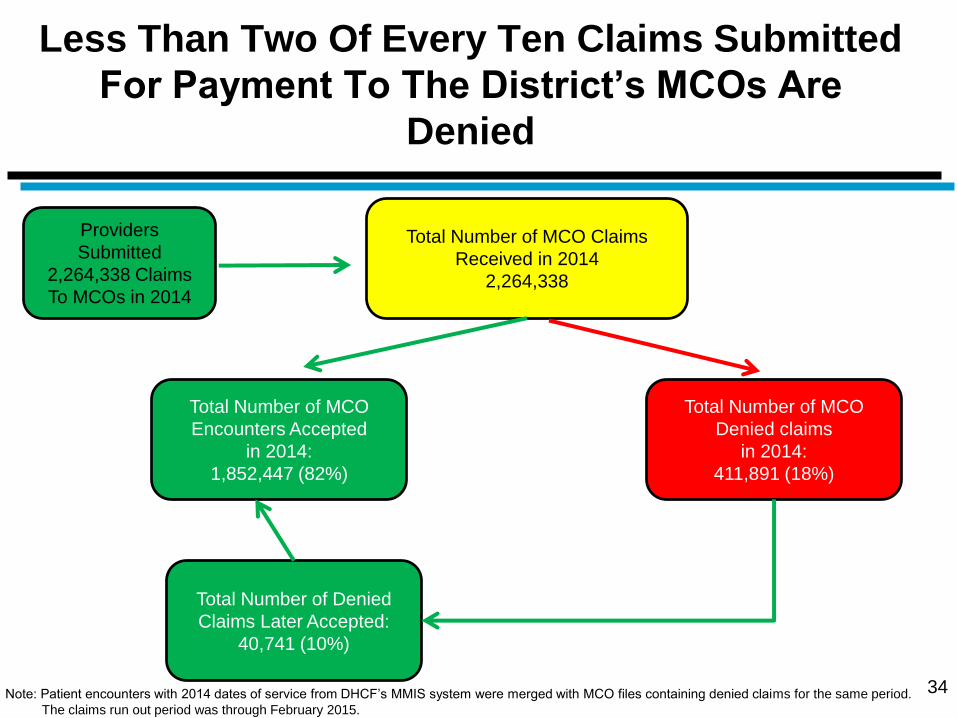
Total Number of MCO
Encounters Accepted
in 2014:
1,852,447 (82%)
Total Number of Denied
Claims Later Accepted:
40,741 (10%)
34
Total Number of MCO Claims
Received in 2014
2,264,338
Total Number of MCO
Denied claims
in 2014:
411,891 (18%)
Providers
Submitted
2,264,338 Claims
To MCOs in 2014
Note: Patient encounters with 2014 dates of service from DHCF’s MMIS system were merged with MCO files containing denied claims for the same period.
The claims run out period was through February 2015.

35
MedStar’s Claims Denial Rate Is Significantly Above
The Districtwide Average For The Three Health
Plans
31%
18%
Total Claims Adjudicated 1,281,455
MedStar AmeriHealth
11%
Trusted
665,232
Average
Claims
Denial Rate
18%
Source: DHCF’s MMIS and MCO claims denial files.
Claims Denial Rates For Each Full-Risk Health Plan, 2014
317,651

MCOs Deny Claims For Many Reasons But The
Most Frequent Relates To Service Coverage
36
Denial
Reason
Total Claims
Percent of
Total Claims
Denied
Service coverage
issue 74,471 21%
Duplicate Claim* 42,187 12%
Provider network
issue 31,366 9%
Untimely filing issue 28,031 8%
Denied - LabCorp
responsibility 23,054 6%
Exceeded allowable
units issue 20,810 6%
Member eligibility
issue 20,433 6%
Other reasons 120,311 32%
Note: *Approximately 13% of duplicate claims were submitted more than once.
Source: DHCF’s MMIS and MCO claims denied files.
82% 18%
Paid Denied
Claims Paid
N = 2,264,338
MCO Claims Denial Rate, 2014

The Rate Of Denied Claims Are Highest For Two
Of The Smallest Provider Groups Calling Into
Question A MCO Cash Management Motive
37
Provider Type Number of Total
Claims
Claims Denied as a
Proportion of Total
Private Clinic 36,420 53%
Mental Health Clinic 24,248 33%
Nurse Practitioner 37,533 23%
DME 20,085 23%
Physician 939,089 22%
Hospital 269,784 22%
FQHC 103,530 11%
Pharmacy 262,014 11%
Denied Claims By Provider Type, 2014
Note: *Approximately 13% of duplicate claims were submitted more than once.
Source: DHCF’s MMIS and MCO’s denied claims files, 2014

Only Ten Percent of Claims Initially Denied
Were Later Paid
38
Claims
Denied 18%
Claims
Paid
82%
MCO Claims Denial Rate, 2014
N = 2,264,338 N = 411,891
10%
90%
Was Denied Claim
Later Paid
No
Yes
Note: Patient encounters with 2014 dates of service from DHCF’s MMIS system were merged with MCO files containing denied claims for the same period.
The claims run out period was February 2015.
39
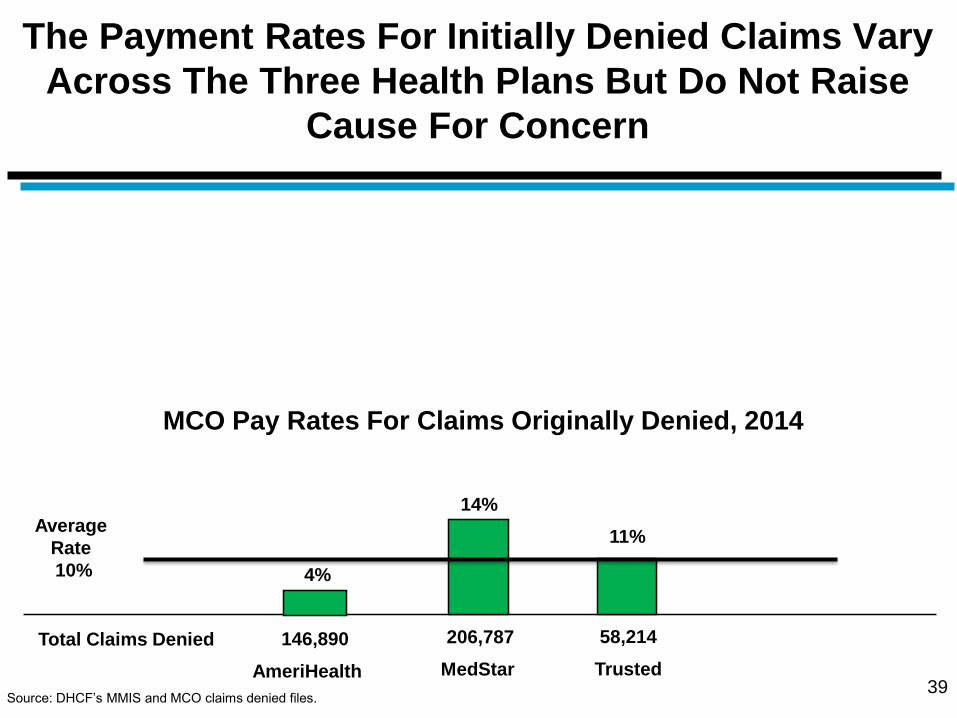
The Payment Rates For Initially Denied Claims Vary
Across The Three Health Plans But Do Not Raise
Cause For Concern
14%
11%
Total Claims Denied 146,890
MedStar AmeriHealth
4%
Trusted
206,787
Average
Rate
10%
Source: DHCF’s MMIS and MCO claims denied files.
MCO Pay Rates For Claims Originally Denied, 2014
58,214

Though Not Required, MCOs Still Paid
Nearly Eight of Ten Claims That Were
Initial Denied Within 30 Days
40
No 21% Yes
Was Denied Claim Paid Within 30 Days Of Initial Denial
N = 40,741
Note: Patient encounters with 2014 dates of service from DHCF’s MMIS system were merged with MCO files containing denied claims for the same period.
The claims run out period was February 2015.
79%

For Some Provider Types, However, The Average
Time That Elapsed Before Claims That Were Paid
After Initially Being Denied Was High
41
Provider type
Average Number Of Days From Initial
Denial To Acceptance
Dentist 15
Hospital 21
Nursing Facility 26
Physician 36
Mental Health Clinic 40
Lab 42
DME 55
Pharmacy 58
FQHC 66
Note: Patient encounters with 2014 dates of service from DHCF MMIS system were merged with MCO files containing denied claims for the same period.
The claims run out period was February 2015.

The Health Plans Have Successfully Constructed
Encounter Data Files But Trusted Must Improve The
Accuracy Of Its Submissions
MCO
Average
Monthly
Enrollment
Total
Encounters
Total
Encounters
Per
Enrollee
Accuracy
Rate For
Encounter
Transfers
AmeriHealth 109,983 251,940 2.2 91%
MedStar 46,419
99,703 2.1 97%
Trusted 31,689
139,611 4.4 80%
Source: Department of Health Care Finance Medicaid Management Information System as of June 2015
42
Number of Recorded Encounters And Accuracy Transfer Rate, January 2015 to June 2015

Presentation Outline
43
Goals and Purpose of Managed Care Performance Review
The Financial Condition of The District’s Health Plans
The Administrative Performance Of The Health Plans
MCO Medical Spending And Member Utilization Patterns
Care Coordination: Goals and Outcomes
Summary of Key Findings
Implementation of MCO Pay for Performance Plan
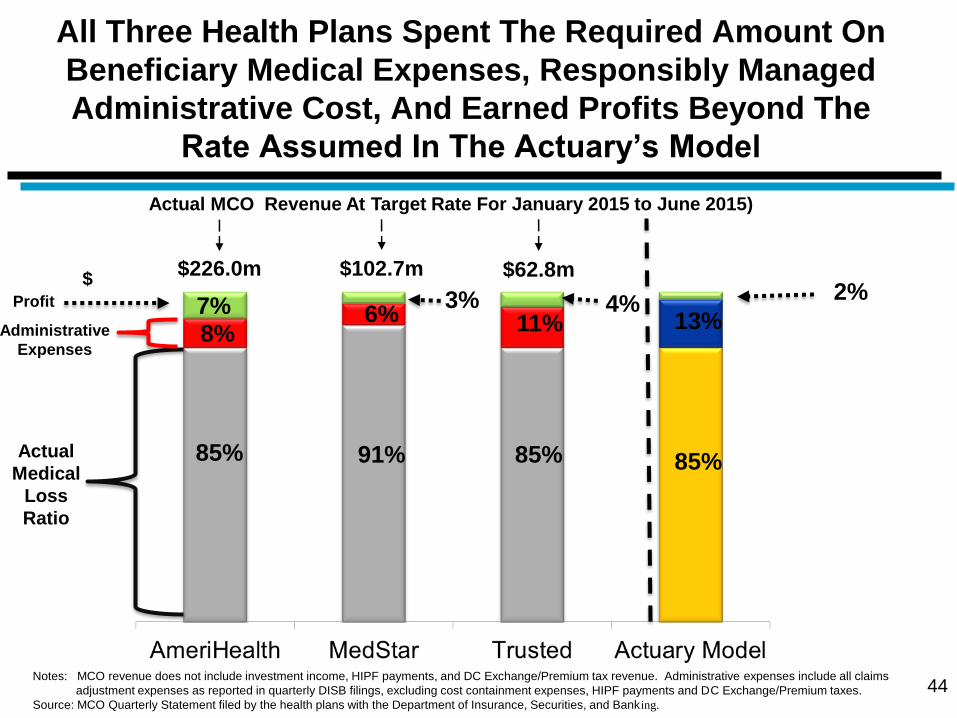
All Three Health Plans Spent The Required Amount On
Beneficiary Medical Expenses, Responsibly Managed
Administrative Cost, And Earned Profits Beyond The
Rate Assumed In The Actuary’s Model
44
Actual MCO Revenue At Target Rate For January 2015 to June 2015)
$
Actual
Medical
Loss
Ratio
85% 91% 85%
8% 6% 11% Administrative
Expenses
$62.8m $102.7m $226.0m
Notes: MCO revenue does not include investment income, HIPF payments, and DC Exchange/Premium tax revenue. Administrative expenses include all claims
adjustment expenses as reported in quarterly DISB filings, excluding cost containment expenses, HIPF payments and DC Exchange/Premium taxes.
Source: MCO Quarterly Statement filed by the health plans with the Department of Insurance, Securities, and Banking.
85%
13% Profit
7% 3% 4%
2%

There Is Significant Across Plan Variation In The Medicaid
Per-Member, Per-Month Medical Expenses But The Claims
Cost For Adults Either Declined Or Showed
No Growth For The Plans
45
$346.11
$402.38
$199.69 $212.44
200.70
Medicaid Adult And Children Medical Expenses Per-Member, Per-Month, January 1, 2015 to June 30,
2015
Notes: Expenses incurred from January 1, 2015 to June 30, 2014 and paid as of August 31, 2015. The expenses do not reflect adjustments to account for INBR claims.
Children defined as person up to age 21 in this analysis. *A large volume of claims denied by Trusted using new procedures have likely impacted this number.
Source: Enrollment and expense data are based on self-reported MCO Quarterly Financial Data submitted directly to DHCF.
Percent Change In
YTD From June
2014 ( ) (-5%) (0%) *(-12%) (+12%) (-12%) (+7%)

There Is Also Wide Across Plan Variation In Alliance Adult
Per-Member, Per-Month Medical Expenses And Two Plans --
AmeriHealth and MedStar -- Witnessed Double Digit Cost
Growth Over The Same Time Period
46
$180.00
$269.22
Alliance Adult Medical Expenses Per-Member, Per-Month, January 1, 2015 to June 30, 2015
Notes: Expenses incurred from January 1, 2015 to June 30, 2015 and paid as of August 31, 2015. The expenses do not reflect adjustments to account for INBR claims.
Children defined as person up to age 21 in this analysis. *A large volume of claims denied by Trusted using new procedures have likely impacted this number.
Source: Enrollment and expense data are based on self-reported MCO Quarterly Financial Data submitted directly to DHCF.
Percent Change In
YTD From June
2014 ( ) (+11) (+20) *(-14%)

For Adults On Medicaid And Compared To The Same Time
Period Last Year, All Three Health Plans Show A Decline In
Per-Member, Per-Month Expenses For Key Medical Services
Not Including Mental Health Care
47
AmeriHealth MedStar Trusted
-8% -5%
*-19%
-29%
+2%
*-41%
-6%
-22%
+1%
+31%
+10%
+32%
Percent Change in Expenses June 2015 Year-to-Date Compared To June 2014 Year-to-Date
Note: *The expenses do not reflect adjustments to account for INBR and thus understates Trusted’s true inpatient cost due to a high number of denied encounter.
Source: Enrollment and expense data are based on self-reported MCO Quarterly Financial Data submitted directly to DHCF.
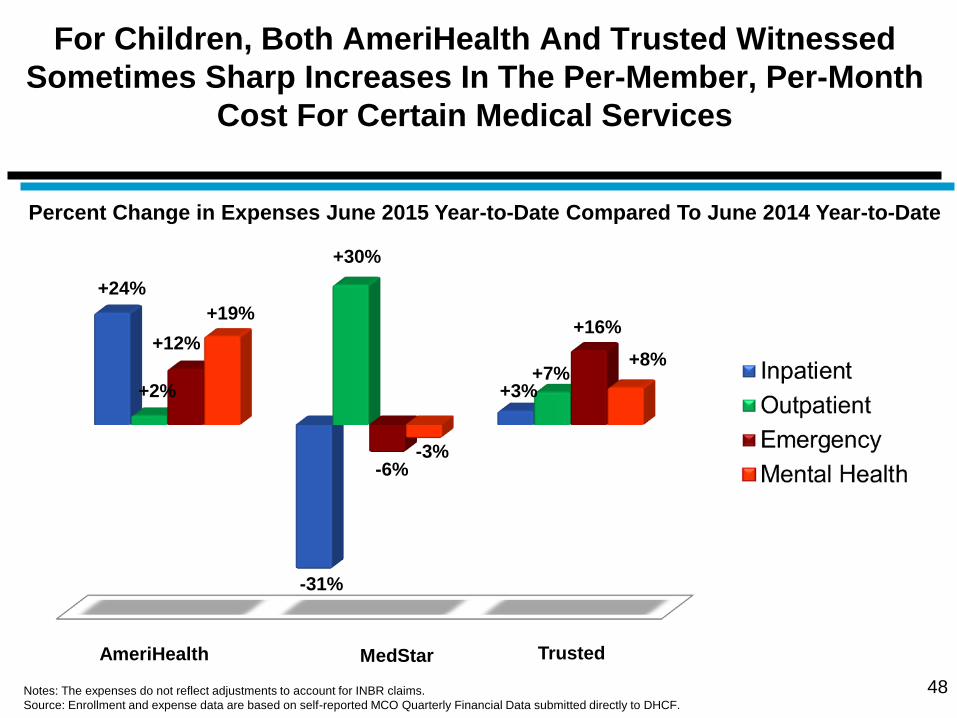
For Children, Both AmeriHealth And Trusted Witnessed
Sometimes Sharp Increases In The Per-Member, Per-Month
Cost For Certain Medical Services
48
AmeriHealth MedStar Trusted
+24%
-31%
+3%
+12%
+30%
+7% +2%
-6%
+16% +19%
-3%
+8%
Percent Change in Expenses June 2015 Year-to-Date Compared To June 2014 Year-to-Date
Notes: The expenses do not reflect adjustments to account for INBR claims.
Source: Enrollment and expense data are based on self-reported MCO Quarterly Financial Data submitted directly to DHCF.

MedStar Has Continuing Challenges In Its Efforts
To Align Beneficiary Medical Costs With Their
Assigned Risk Scores
49
Ranking On Beneficiary Risk Scores As Of May 1, 2015
Low Medium High
Ran
kin
g O
n M
ed
ical
Co
st
Low
Medium
High
AmeriHealth - Adults
MedStar - Adults
*Trusted - Adults AmeriHealth - Children
MedStar - Children
Trusted - Children
Notes: Expenses incurred from July 1, 2013 to June 30, 2014 and paid as of August 31, 2014. The expenses do not reflect adjustments to account for INBR claims.
Children defined as person up to age 21 in this analysis. Health plans’ risk scores are derived from pharmacy data. *A large volume of claims denied by Trusted
using new procedures have likely impacted Trusted ranking a as low-cost plan for adults on Medicaid .
Source: Enrollment and expense data are based on self-reported MCO Quarterly Financial Data submitted directly to DHCF.

Headed By AmeriHealth, The Physician Visit Rate For
Children Exceeded 70 Percent For All Three Plans
During The First Half Of 2015
50
Medicaid Quarterly Physician Care Visit Rates For Children Who Were Enrolled In Managed Care,
January 2015 to June 2015
Note: In each quarter, only members who were enrolled with the health plan for three months continuously during the period and had 12 months of continuous Medicaid participation
from that quarter are included in this analysis.. .
Source Encounter data submitted by MCOs to DHCF.

The Physician Visit Rate For Children With An Added
Well-Child Component Is Uneven Across The Three
Plans, Beneath 60 Percent For MedStar, And Declining
For Trusted
51
Medicaid Quarterly Physician Care and Well Child Visit Rates For Children Who Were Enrolled
In Managed Care, January 2015 to June 2015
Note: In each quarter, only members who were enrolled with the health plan for three months continuously during the period and had 12 months of continuous Medicaid participation
from that quarter are included in this analysis.. .
Source Encounter data submitted by MCOs to DHCF.

Trusted’s Medicaid Physician Visit Rate For Adults
Continues To Decline And Is Significantly Below Levels
Achieved By AmeriHealth And MedStar
52
Medicaid Quarterly Physician Care Visit Rates For Adults Who Were Enrolled In Managed Care,
January 2015 to June 2015
Note: In each quarter, only members who were enrolled with the health plan for three months continuously during the period and had 12 months of continuous Medicaid participation
from that quarter are included in this analysis.. .
Source Encounter data submitted by MCOs to DHCF.

Halfway Through The Calendar Year The MCO Penetration
Rate For Medicaid-Funded Mental Health Rehabilitation
Services Is The Same For Both Children And Adults
53
5%
Percent of MCO Members Receiving Mental Health Rehabilitation Services
Through The Health Plans January 2015 to June 2015
5% 5%
Note: The data presented above are based on MCO capitated payments from the period of January 2015 through June 2015.
Source: Encounter data submitted by MCOs to DHCF.

When Utilization For Any Mental Health Treatment Is
Accounted For, The MCO Total Mental Health Penetration
Rate Increases Overall And For Both Adults And
Children On Medicaid
54
8.1%
Percent of MCO Members Receiving Mental Health Rehabilitation Services
Through The Health Plans January 2015 to June 2015
6%
8.7%
Note: The data presented above are based on MCO capitated payments from the period of January 2015 through June 2015.
Source: Encounter data submitted by MCOs to DHCF.
7.7%

Once A Full Year Of Data Is Available for 2015, It Can Be Determined If
The Upward Trajectory Observed In The Medicaid Mental Health
Utilization Rate For Children Since The District Selected Three New
Health Plans In July 2013 Is Continuing
55 Note: Source: Encounter data submitted by MCOs to DHCF.
District Selects Three New Health Plans
And Establishes Contract Performance
Requirements

Since The 1st Quarter Of The Managed Care Contract
(October to December 2013), MCO Spending On Medicaid-
Funded Mental Health Services For Both Children And
Adults Has Increased Sharply For All Plans Except Trusted
56
$18.41
Adult Per-Member
Per-Month
Spending
$13.86
$17.17 $15.76
$22.51
$11.42
$14.25
$7.64
The Per-Member Per-Month MCO Expenses For Behavioral Health Services,
January 2015 to June 2015
Notes: The expenses do not reflect adjustments to account for INBR claims. Children defined as person up to age 21 in this analysis.
Source: Enrollment and expense data are based on self-reported MCO Quarterly Financial Data submitted directly to DHCF.
Children Per-
Member
Per-Month
Spending
MCO
Spending
For Adults In
1st Qtr. of
Contract
MCO
Spending
For Children
In 1st Qtr. of
Contract

Presentation Outline
57
Goals and Purpose of Managed Care Performance Review
The Financial Condition of The District’s Health Plans
The Administrative Performance Of The Health Plans
MCO Medical Spending And Member Utilization Patterns
Care Coordination: Goals and Outcomes
Summary of Key Findings
Implementation of MCO Pay for Performance Plan

DHCF Relies Upon Several Metrics To
Quantitatively Assess The Efforts By The Health
Plans To Coordinate Beneficiary Care
Achieving high value in health care for Medicaid and Alliance beneficiaries is a preeminent
goal of DHCF’s managed care program
The District’s three managed care plans are expected to increase their members’ health care
and improve outcomes per dollar spent through aggressive care coordination and health care
management
With more than one year’s worth of data, DHCF can now more closely examine the following
performance indicators for each of the District’s three health plans:
Emergency room utilization for non-emergency conditions
Potentially preventable hospitalizations – admissions which could have been avoided with
access to quality primary and preventative care
Hospital readmissions for problems related to the diagnosis which prompted a previous
and recent – within 30 days -- hospitalization
58

The Beneficiaries For All Three MCOs Use The
Emergency Room For Low Acuity Diagnosis At A High
Rate And Nearly Three in 10 Of These Visits Are
Avoidable
59
27%
73%
71% **Low Acuity
Non-Emergency
(LANE) Visits
29%
Was LANE Visit Avoidable?
Yes 25%
75% No
Other
Emergency
Visits
27%
73%
71,504
AmeriHealth MedStar Trusted
28,702 22,474
Emergency Room Utilization For Members By Level Of Acuity, January 2015 to June 2015
*Total emergency department visits consists of all visits to the emergency room regardless of diagnosis which did not result in an inpatient admission. **Low acuity non-emergency (Lane)
visits are emergency room visits that could have been avoided based on a list of diagnosis applied to outpatient data. Practicing ED physicians and Mercer clinical staff reviewed each
LANE code and assigned a target utilization percentage of visits that a highly efficient managed care plan could prevent.
.
Source: Encounter data submitted by MCOs to DHCF.
*Total Emergency
Room Visits
39%
61%
34%
66%
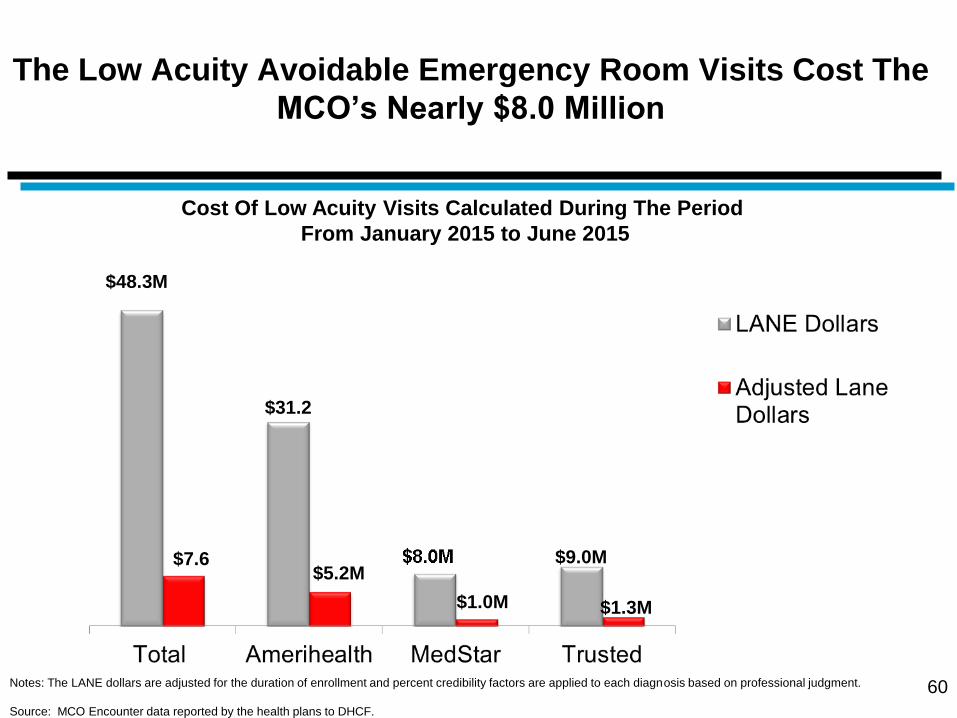
The Low Acuity Avoidable Emergency Room Visits Cost The
MCO’s Nearly $8.0 Million
60
$48.3M
$31.2
$7.6 $5.2M
$1.0M
Cost Of Low Acuity Visits Calculated During The Period
From January 2015 to June 2015
Notes: The LANE dollars are adjusted for the duration of enrollment and percent credibility factors are applied to each diagnosis based on professional judgment.
Source: MCO Encounter data reported by the health plans to DHCF.
$9.0M
$1.3M

61
Nearly Seven Percent Of Inpatient Hospital
Admissions Were Potentially Avoidable -- With
MedStar Having The Highest Level -- Costing MCOs
An Additional $10 Million
Note: Results are based on prevention quality indicators developed by the Agency for Healthcare Research and Quality (AHRQ) that can be used with hospital discharge data to identify
potentially preventable admissions for adults.
Source: MCO Encounter data provided by MCOs to DHCF.
Potentially Avoidable Inpatient Admissions (PPA) And The Associated Cost For The Period
January 2015 Through June 2015
6.2 5.2
8.2 Managed Care Plan Cost Of PPA Adjusted Avoidable
Admits Per 1000
AmeriHealth $4,803,496 5.26
MedStar $3,999,526 8.2
Trusted $1,916,151 6.6
Total $10,619,173 6.2
Adjusted Potentially Avoidable Admissions
As A Percent Of Inpatients Admits

62
The Problem of Hospital Readmissions -- Most
Acute For Trusted -- Add More Than $18 Million To
MCO Beneficiaries’ Medical Cost
Note: All-cause 30-day hospital readmissions are "hospitalizations that occur, for any reason, within 30 days of discharge from an index admission." An index admission is defined as
any inpatient stay that might produce an avoidable readmission” (Mathematica, 2011). Index admissions are derived from the set of unique hospital stays, and are determined by
excluding specific categories of admissions from the set of unique hospital visits such as transfer cases and deaths. Readmission rates are computed as the ratio of admissions that
occur within the specified readmission time period to the number of index admissions.
Hospital Readmissions Within 30 Days And Associated Cost For The Period
From July 2013 Through March, 2014
$16,312
Managed Care Plan
Ratio Of Hospital
Readmissions To
Index Hospital
Admissions
Total Cost Of
Readmissions
AmeriHealth 1 to 12.6 $9,543,434
MedStar 1 to 11.1 $6,255,786
Trusted 1 to 9.9 $2,313,035
Total 1 to 11.3 $18,112,256
The Average Cost Per Readmissions For Each Health
Plan
$19,940
$16,428
$11,820

Presentation Outline
63
Goals and Purpose of Managed Care Performance Review
The Financial Condition of The District’s Health Plans
The Administrative Performance Of The Health Plans
MCO Medical Spending And Member Utilization Patterns
Care Coordination: Goals and Outcomes
Summary of Key Findings
Implementation of MCO Pay for Performance Plan

DHCF To Launch Pay-For-Performance Program As
An Incentive For MCOs To Address Care
Coordination Problems
Beginning in January 2016, DHCF’s three full-risk MCOs will
be required to meet performance goals in order to receive their
full capitated payment rate
These performance goals will require the MCOs to reduce the
incidence of the following three patient outcomes:
1) Potentially preventable admissions (PPA),
2) Low acuity non-emergent (LANE) visits, and
3) 30-day hospital readmissions for all-causes
64

Program Structure Is Based On
Cash Withhold
The program will be funded through a two-percent (2%) withhold of
each MCO’s actuarially sound capitation payments for the
corresponding period
The 2% withhold is the profit margin for each MCO that is factored
into the base per-member, per-month payment rate. For the period
of January 2016 through September 2016, the withhold results in
approximately 1.5% of each MCOs’ capitation rates
The baseline period used for the program is July 1, 2014 through
June 30, 2015 and the MCOs may be eligible to receive a portion, or
all of the withheld capitation payments based on performance
against the three outcome measures
65

Weighting And Scoring System For
Pay-For-Performance
A scoring system will be used to determine the distribution of payment incentives
for the MCOs:
LANE and PPAs will be weighted at 33% of the capitation withhold. The MCOs
have an opportunity to earn back the full 33% based on performance as follows:
5% reduction in LANE Emergency Department (ED) utilization and PPAs
from the baseline will result in the MCO earning 100% of the 33%
withhold attributed to each of these measures
3.5% reduction in LANE ED utilization and PPAs from the baseline will
result in the MCO earning 75% of the of the 33% withhold attributed to
these measures
2% reduction in LANE ED utilization and PPAs from the baseline will
result in the MCO earning 50% of the 33% withhold attributed to these
measures
If reduction in LANE utilization and PPAs are less than 2% from the
baseline, the MCOs does not earn any portion of the 33% withhold
attributed to the relevant measure
66

Weighting And Scoring System For
Pay-For-Performance (continued)
The scoring system is the same for the third measure -- All-Cause
Hospital Readmissions -- but this outcome is weighted at 34% of the
capitation withhold.
The MCOs can earn back 50%, 75% or 100% of the 34% withhold
attributed to the measure by demonstrating reductions at 2%, 3.5% and
5% respectively.
DHCF will rely on claims data to measure the MCOs performance in this
system. Since a run-out period must be allowed to ensure a more
complete picture of claims activity, payments will likely occur 4 to 6
months after the measurement period closes.
67